Washington, D.C. 20549
Name and address of agent for service: John M. Perlowski, Chief Executive Officer, BlackRock Funds, 55 East 52nd Street, New York, NY 10055
| |
| Fund Summary as of January 31, 2014 | BlackRock Emerging Markets Long/Short Equity Fund |
| | |
Investment Objective
BlackRock Emerging Markets Long/Short Equity Fund’s (the “Fund”) investment objective is to seek total return over the long term.
Portfolio Management Commentary
How did the Fund perform?
| • | | For the six-month period ended January 31, 2014, the Fund underperformed its benchmark, the BofA Merrill Lynch 3-Month US Treasury Bill Index. |
What factors influenced performance?
| • | | As part of its investment strategy, the Fund uses derivatives, including total return swaps, to achieve exposure to a market or to manage market and/or equity risks. Through its use of total return swaps, the Fund’s performance is attributable to effective stock selection based on bottom-up security analysis coupled with a long-short approach to controlling the Fund’s exposure to trends in emerging markets. |
| • | | Stock selection had a negative impact on returns during the period, particularly in China. The largest detractors were the Fund’s short positions on stocks that had appreciated significantly and became expensive when measured against the company’s assets and/or earnings. Most notably, a short position in Korean shipbuilder Hyundai Mipo Dockyard hurt results. The fundamentals for this company have been weak due to global overcapacity in shipbuilding. Nevertheless, the stock price surged higher during the period. |
| • | | The Fund’s long net market positioning was a small contributor to performance for the period. (The net market position is the difference between the Fund’s total long positions and total short positions.) Specifically, the Fund held nearly 30% net long exposure in September and October 2013 when the market moved up more than 11%. The Fund’s net long exposure averaged 24% from November 2013 to January 2014, during which the market declined nearly 10%. The Fund used net market exposure as a risk management tool to protect against market volatility by bringing the net exposure down to 15% by January 31, 2014, which is 5% below the Fund’s target level of 20%. |
| • | | The Fund succeeded in mitigating many of the risks inherent in emerging market investing. Throughout this volatile period, the Fund maintained its portfolio volatility at a level that was 40% or lower than that of the emerging equity market. |
Describe recent portfolio activity.
| • | | Throughout this period, the investment advisor continued to rely largely upon measures of consistency in fundamentals to drive decisions in taking key long and short positions but also took into account material price movements or changing information while seeking to capitalize upon these trends. Despite some episodic payoffs, positions driven by companies’ prices relative to their assets and earnings struggled during the period. The Fund reduced exposure to those companies and increased exposure to companies that have improving fundamentals and a positive earnings outlook. |
| • | | The Fund’s cash exposure had no material impact on performance as the Fund expresses long and short positions via the use of derivatives. The Fund was fully invested throughout the period. |
Describe portfolio positioning at period end.
| • | | As of period end, the Fund held a reduced net market exposure driven mainly by market sentiment and the recent decline in global initial public offerings and acquisition announcements. In addition to fundamental stock selection, the Fund sought to capitalize on stock selection within baskets of stocks relating to bigger picture, macro themes. This is particularly important given the divergence in performance across emerging market countries that materialized in 2013. While selecting specific stocks continues to be the Fund’s central investment theme, the importance of macro sensitivities and other factors has expanded and provides a wide range of opportunity for exploring investment themes. The Fund also maintained an allocation to “emerging markets in developed markets” in order to capitalize on the segmentation bias among emerging market investors. |
The views expressed reflect the opinions of BlackRock as of the date of this report and are subject to change based on changes in market, economic or other conditions. These views are not intended to be a forecast of future events and are no guarantee of future results.
| 4 | BLACKROCK FUNDS | JANUARY 31, 2014 |
| |
| | BlackRock Emerging Markets Long/Short Equity Fund |
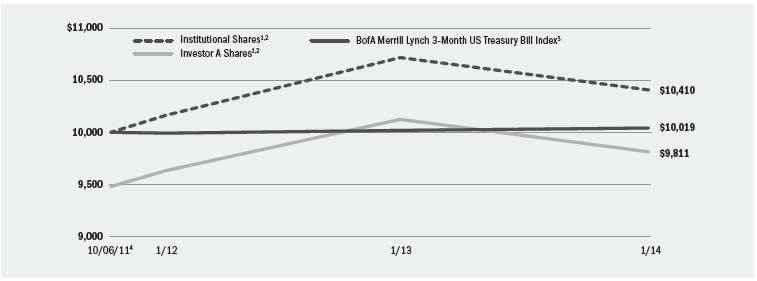
Total Return Based on a $10,000 Investment
| 1 | | Assuming maximum sales charges, if any, transaction costs and other operating expenses, including investment advisory fees. Institutional Shares do not have a sales charge. |
| 2 | | Under normal conditions, the Fund invests at least 80% of its total assets in global equity instruments and related derivative instruments issued by, or tied economically to, companies in emerging markets. |
| 3 | | An unmanaged index that tracks 3-month US Treasury securities. |
| 4 | | Commencement of operations. |
Performance Summary for the Period Ended January 31, 2014
| | | | | | Average Annual Total Returns5 | |
| | | | | | 1 Year | | Since Inception6 | |
| | | | | 6-Month
Total Returns | | w/o sales
charge | | w/sales
charge | | w/o sales
charge | | w/sales
charge |
Institutional | | | | | (3.46 | )% | | | (2.92 | )% | | | N/A | | | | 1.75 | % | | | N/A | |
Investor A | | | | | (3.55 | ) | | | (3.10 | ) | | | (8.18 | )% | | | 1.51 | | | | (0.82 | )% |
Investor C | | | | | (3.90 | ) | | | (3.90 | ) | | | (4.86 | ) | | | 0.71 | | | | 0.71 | |
BofA Merrill Lynch 3-Month US Treasury Bill Index | | | | | 0.03 | | | | 0.08 | | | | N/A | | | | 0.08 | | | | N/A | |
| 5 | | Assuming maximum sales charges, if any. Average annual total returns with and without sales charges reflect reductions for distribution and service fees. See “About Fund Performance” on page 8 for a detailed description of share classes, including any related sales charges and fees. |
| 6 | | The Fund commenced operations on October 6, 2011. |
| | N/A — Not applicable as share class and index do not have a sales charge. |
| | Past performance is not indicative of future results. |
Expense Example
| | Actual | | Hypothetical8 |
| | | Beginning
Account Value
August 1, 2013 | | Ending
Account Value
January 31, 2014 | | Expenses Paid
During the Period7 | | Beginning
Account Value
August 1, 2013 | | Ending
Account Value
January 31, 2014 | | Expenses Paid
During the Period7 | | Annualized
Expense Ratio |
| Institutional | | $ | 1,000.00 | | | $ | 966.30 | | | $ | 8.67 | | | $ | 1,000.00 | | | $ | 1,016.38 | | | $ | 8.89 | | | | 1.75 | % |
| Investor A | | $ | 1,000.00 | | | $ | 965.40 | | | $ | 9.56 | | | $ | 1,000.00 | | | $ | 1,015.48 | | | $ | 9.80 | | | | 1.93 | % |
| Investor C | | $ | 1,000.00 | | | $ | 961.00 | | | $ | 13.30 | | | $ | 1,000.00 | | | $ | 1,011.64 | | | $ | 13.64 | | | | 2.69 | % |
| 7 | | For each class of the Fund, expenses are equal to the annualized net expense ratio for the class, multiplied by the average account value over the period, multiplied by 184/365 (to reflect the one-half year period shown). |
| 8 | | Hypothetical 5% annual return before expenses is calculated by pro rating the number of days in the most recent fiscal half year divided by 365. |
See “Disclosure of Expenses” on page 8 for further information on how expenses were calculated.
| BLACKROCK FUNDS | JANUARY 31, 2014 | 5 |
| |
| Fund Summary as of January 31, 2014 | BlackRock Global Long/Short Equity Fund |
| | |
Investment Objective
BlackRock Global Long/Short Equity Fund’s (the “Fund”) investment objective is to seek total return over the long term.
Portfolio Management Commentary
How did the Fund perform?
| • | | For the six-month period ended January 31, 2014, the Fund outperformed its benchmark, the BofA Merrill Lynch 3-Month US Treasury Bill Index. |
What factors influenced performance?
| • | | As part of its investment strategy, the Fund uses derivatives, including total return swaps, to achieve exposure to a market or to manage market and/or equity risks. Through its use of total return swaps, the Fund’s performance is attributable to effective stock selection based on bottom-up security analysis coupled with a long-short approach to controlling the Fund’s exposure to trends in global equity markets. |
| • | | The largest positive return contributions came from country and industry positioning, while relative stock selection and the Fund’s net long positions also added value. With respect to country positioning, a long position in Spanish stocks had a positive impact as the country exited recession in late 2013 and unemployment started to fall from high levels. This boosted the country’s stocks and long positions in names such as clothing retailer Inditex SA and banks Bankinter SA and Banco Bilbao Vizcaya Argentaria SA performed particularly well. From an industry perspective, the Fund benefited from long positions in aerospace & defense including Raytheon Co. and Northrop Grumman Corp., which rallied on a resolution to the US government shutdown and a deal to raise the debt ceiling. Within internet software & services, long positions in IAC/InterActiveCorp, VeriSign, Inc. and Facebook, Inc. were notable contributors. |
| • | | Relative stock selection in US, UK and French names had a positive impact on results. In particular, a short position in UK supermarket Tesco proved beneficial as the stock declined after the company reported that it had, along with the other big-4 supermarkets, lost further market share to discount retailers Aldi and Lidl. In addition, the Fund benefited from positions that were predicated on the anticipated impact of reduced global liquidity, particularly in US names. The Fund’s overall net long exposure also provided a small lift to performance as equity markets rallied toward the end of 2013. |
| • | | Detracting from performance was a net short position in Japan as a weakening yen supported the country’s exporters and drove stock prices higher. The Fund reduced this short exposure at the end of 2013 as the yen weakened further. Also having a negative impact was a long position in Norwegian stocks, which broadly declined after the country posted disappointing economic data. Norwegian telecom firm Telenor ASA was a particularly poor performer for the period. From an individual stock perspective, the largest detractor was the Fund’s long position in direct selling company Nu Skin Enterprises, Inc. (US). The stock sold off in January 2014 after the Chinese government announced it would open an investigation into the operations of the company. The company derives approximately 25% of revenues from Chinese consumers. |
Describe recent portfolio activity.
| • | | The Fund maintained an overall net long market position for much of the six-month period. (The net market position is the difference between the Fund’s total long positions and total short positions.) However, the Fund reduced its total long positions in the latter part of the period as equities began to look increasingly expensive relative to other asset classes and investor enthusiasm began to show signs of weakening. In January 2014, the Fund moved to a net short market position. |
| • | | The Fund began the period with a net long position in the UK with a focus on stocks with high exposure to the domestic economy. However, after a strong rally, economic indicators weakened in the fourth quarter of 2013 and the Fund moved to a net short position in UK stocks. After maintaining short positions in Australia and Canada for much of 2013, the Fund moved to large long positions in these countries given expectations that both economies will benefit from weakness in their local currencies spurring export growth. Also during the period, the Fund moved from short to long positions in both the energy and materials sectors. |
| • | | The Fund’s cash exposure had no material impact on performance as the Fund expresses long and short positions via the use of derivatives. The Fund was fully invested throughout the period. |
Describe portfolio positioning at period end.
| • | | As of period end, the Fund’s overall net market exposure was short at approximately (1.4)% of net assets, reflecting a cautious view on stock price valuations and market sentiment. However, the Fund continued to be positioned to benefit from global growth with long exposure to high-growth, cyclical industries including internet software & services and media, and short exposure to defensive, non-cyclical segments such as utilities, food producers and food retailers. In contrast, the Fund was positioned for a slowdown in emerging economies, with short positions in exporters that have high exposure to emerging markets such as Nestle and Unilever. The Fund’s negative view on core European countries such as the UK, Switzerland and France has been mainly driven by this positioning. The Fund remained long in peripheral European countries including Italy and Spain due to attractive valuations relative to core European countries and the continuation of inflows from foreign investors. The Fund also remained long in Sweden given the central bank’s determination to stimulate the economy and increase inflation with loose monetary policy. |
The views expressed reflect the opinions of BlackRock as of the date of this report and are subject to change based on changes in market, economic or other conditions. These views are not intended to be a forecast of future events and are no guarantee of future results.
| 6 | BLACKROCK FUNDS | JANUARY 31, 2014 |
| |
| | BlackRock Global Long/Short Equity Fund |
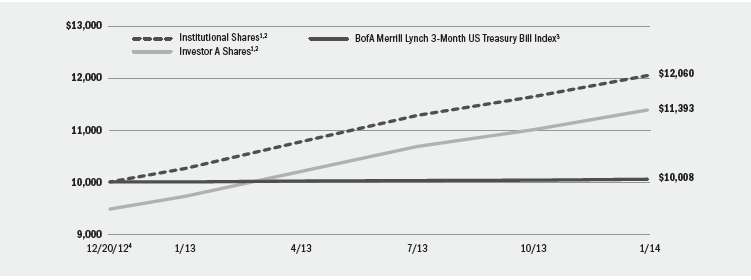
Total Return Based on a $10,000 Investment
| 1 | | Assuming maximum sales charges, if any, transaction costs and other operating expenses, including investment advisory fees. Institutional Shares do not have a sales charge. |
| 2 | | Under normal conditions, the Fund invests at least 80% of its total assets in equity instruments and related derivative instruments issued by, or tied economically to, companies located in developed markets. |
| 3 | | An unmanaged index that tracks 3-month US Treasury securities. |
| 4 | | Commencement of operations. |
Performance Summary for the Period Ended January 31, 2014
| | | | | | Average Annual Total Returns5 | |
| | | | | | 1 Year | | Since Inception6 | |
| | | | | 6-Month
Total Returns | | w/o sales
charge | | w/sales
charge | | w/o sales
charge | | w/sales
charge |
Institutional | | | | | 6.82 | % | | | 17.55 | % | | | N/A | | | | 18.29 | % | | | N/A | |
Investor A | | | | | 6.60 | | | | 17.20 | | | | 11.05 | % | | | 17.98 | | | | 12.41 | % |
Investor C | | | | | 6.22 | | | | 16.38 | | | | 15.38 | | | | 17.13 | | | | 17.13 | |
BofA Merrill Lynch 3-Month US Treasury Bill Index | | | | | 0.03 | | | | 0.08 | | | | N/A | | | | 0.07 | | | | N/A | |
| 5 | | Assuming maximum sales charges, if any. Average annual total returns with and without sales charges reflect reductions for distribution and service fees. See “About Fund Performance” on page 8 for a detailed description of share classes, including any related sales charges and fees. |
| 6 | | The Fund commenced operations on December 20, 2012. |
| | N/A — Not applicable as share class and index do not have a sales charge. |
| | Past performance is not indicative of future results. |
Expense Example
| | Actual | | Hypothetical8 | | |
| | | Beginning
Account Value
August 1, 2013 | | Ending
Account Value
January 31, 2014 | | Expenses Paid
During the Period7 | | Beginning
Account Value
August 1, 2013 | | Ending
Account Value
January 31, 2014 | | Expenses Paid
During the Period7 | | Annualized
Expense Ratio |
| Institutional | | $ | 1,000.00 | | | $ | 1,068.20 | | | $ | 8.86 | | | $ | 1,000.00 | | | $ | 1,016.64 | | | $ | 8.64 | | | | 1.70 | % |
| Investor A | | $ | 1,000.00 | | | $ | 1,066.20 | | | $ | 10.05 | | | $ | 1,000.00 | | | $ | 1,015.48 | | | $ | 9.80 | | | | 1.93 | % |
| Investor C | | $ | 1,000.00 | | | $ | 1,062.20 | | | $ | 13.88 | | | $ | 1,000.00 | | | $ | 1,011.75 | | | $ | 13.54 | | | | 2.67 | % |
| 7 | | For each class of the Fund, expenses are equal to the annualized net expense ratio for the class, multiplied by the average account value over the period, multiplied by 184/365 (to reflect the one-half year period shown). |
| 8 | | Hypothetical 5% annual return before expenses is calculated by pro rating the number of days in the most recent fiscal half year divided by 365. |
See “Disclosure of Expenses” on page 8 for further information on how expenses were calculated.
| BLACKROCK FUNDS | JANUARY 31, 2014 | 7 |
| • | | Institutional Shares are not subject to any sales charge. These shares bear no ongoing distribution or service fees and are available only to certain eligible investors. |
| • | | Investor A Shares are subject to a maximum initial sales charge (front-end load) of 5.25% and a service fee of 0.25% per year (but no distribution fee). Certain redemptions of these shares may be subject to a contingent deferred sales charge (“CDSC”) where no initial sales charge was paid at the time of purchase. |
| • | | Investor C Shares are subject to a 1.00% CDSC if redeemed within one year of purchase. In addition, these shares are subject to a distribution fee of 0.75% per year and a service fee of 0.25% per year. |
Refer to www.blackrock.com/funds to obtain performance data current to the most recent month end. Performance information reflects past performance and does not guarantee future results. Current performance may be lower or higher than the performance data quoted. Performance results do not reflect the deduction of taxes that a shareholder would pay on fund distributions or the redemption of fund shares. Figures shown in each of the performance tables on the previous pages assume reinvestment of all dividends and distributions, if any, at net asset value (“NAV”) on the ex-dividend dates. Investment return and principal value of shares will fluctuate so that shares, when redeemed, may be worth more or less than their original cost. Dividends paid to each class of shares will vary because of the different levels of service, distribution and transfer agency fees applicable to each class, which are deducted from the income available to be paid to shareholders.
BlackRock Advisors, LLC (the “Manager”), the Funds’ investment advisor, waived and/or reimbursed a portion of each Fund’s expenses. Without such waiver and/or reimbursement, each Fund’s performance would have been lower. The Manager is under no obligation to waive or reimburse or to continue waiving or reimbursing its fees after the applicable termination date. See Note 4 of the Notes to Financial Statements for additional information on waivers and reimbursements.
Shareholders of each Fund may incur the following charges: (a) transactional expenses, such as sales charges; and (b) operating expenses, including investment advisory fees, service and distribution fees, including 12b-1 fees, and other Fund expenses. The expense examples shown on the previous pages (which are based on a hypothetical investment of $1,000 invested on August 1, 2013 and held through January 31, 2014) are intended to assist shareholders both in calculating expenses based on an investment in each Fund and in comparing these expenses with similar costs of investing in other mutual funds.
The expense examples provide information about actual account values and actual expenses. In order to estimate the expenses a shareholder paid during the period covered by this report, shareholders can divide their account value by $1,000 and then multiply the result by the number corresponding to their Fund and share class under the heading entitled “Expenses Paid During the Period.”
The expense examples also provide information about hypothetical account values and hypothetical expenses based on each Fund’s actual expense ratio and an assumed rate of return of 5% per year before expenses. In order to assist shareholders in comparing the ongoing expenses of investing in these Funds and other funds, compare the 5% hypothetical examples with the 5% hypothetical examples that appear in other funds’ shareholder reports.
The expenses shown in the expense examples are intended to highlight shareholders’ ongoing costs only and do not reflect any transactional expenses, such as sales charges, if any. Therefore, the hypothetical examples are useful in comparing ongoing expenses only, and will not help shareholders determine the relative total expenses of owning different funds. If these transactional expenses were included, shareholder expenses would have been higher.
| 8 | BLACKROCK FUNDS | JANUARY 31, 2014 |
| |
| Derivative Financial Instruments | |
The Funds may invest in various derivative financial instruments, including financial futures contracts, foreign currency exchange contracts and swaps, as specified in Note 3 of the Notes to Financial Statements, which may constitute forms of economic leverage. Such derivative financial instruments are used to obtain exposure to a security, index and/or market without owning or taking physical custody of securities or to hedge market and/or equity risks. Derivative financial instruments involve risks, including the imperfect correlation between the value of a derivative financial instrument and the underlying asset, possible default of the counterparty to the transaction or illiquidity of the derivative financial instrument. The Funds’ ability to use a derivative financial instrument successfully depends on the investment advisor’s ability to predict pertinent market movements accurately, which cannot be assured. The use of derivative financial instruments may result in losses greater than if they had not been used, may require a Fund to sell or purchase portfolio investments at inopportune times or for distressed values, may limit the amount of appreciation a Fund can realize on an investment, may result in lower dividends paid to shareholders and/or may cause a Fund to hold an investment that it might otherwise sell. The Funds’ investments in these instruments are discussed in detail in the Notes to Financial Statements.
Portfolio Information as of January 31, 2014
BlackRock Emerging Markets Long/Short Equity Fund
| | | | Percent of Total Investments1 | |
| Geographic Allocation | | | | Long | | Short | | Total |
Taiwan | | | | | 10 | % | | | 8 | % | | | 18 | % |
China | | | | | 10 | | | | 5 | | | | 15 | |
Republic of Korea | | | | | 8 | | | | 7 | | | | 15 | |
Brazil | | | | | 4 | | | | 4 | | | | 8 | |
Russia | | | | | 4 | | | | 4 | | | | 8 | |
Hong Kong | | | | | 3 | | | | 6 | | | | 9 | |
South Africa | | | | | 3 | | | | 4 | | | | 7 | |
Mexico | | | | | 3 | | | | 3 | | | | 6 | |
Malaysia | | | | | 2 | | | | 1 | | | | 3 | |
Turkey | | | | | 2 | | | | 1 | | | | 3 | |
Thailand | | | | | 2 | | | | 0 | | | | 2 | |
Poland | | | | | 1 | | | | 1 | | | | 2 | |
Philippines | | | | | 1 | | | | 0 | | | | 1 | |
Chile | | | | | 1 | | | | 0 | | | | 1 | |
United Kingdom | | | | | 1 | | | | 0 | | | | 1 | |
Other2 | | | | | 0 | | | | 1 | | | | 1 | |
Total | | | | | 55 | % | | | 45 | % | | | 100 | % |
BlackRock Global Long/Short Equity Fund
| | | | Percent of Total Investments1 | |
| Geographic Allocation | | | | Long | | Short | | Total |
United States | | | | | 21 | % | | | 24 | % | | | 45 | % |
Japan | | | | | 4 | | | | 4 | | | | 8 | |
United Kingdom | | | | | 2 | | | | 5 | | | | 7 | |
Netherlands | | | | | 3 | | | | 2 | | | | 5 | |
Switzerland | | | | | — | | | | 4 | | | | 4 | |
Norway | | | | | 4 | | | | — | | | | 4 | |
France | | | | | — | | | | 4 | | | | 4 | |
China | | | | | 4 | | | | — | | | | 4 | |
Germany | | | | | 1 | | | | 2 | | | | 3 | |
Canada | | | | | 3 | | | | — | | | | 3 | |
Sweden | | | | | 1 | | | | 2 | | | | 3 | |
Australia | | | | | 2 | | | | — | | | | 2 | |
Hong Kong | | | | | 2 | | | | — | | | | 2 | |
Ireland | | | | | — | | | | 2 | | | | 2 | |
Other2 | | | | | 3 | | | | 1 | | | | 4 | |
Total | | | | | 50 | % | | | 50 | % | | | 100 | % |
| 1 | | Total investments include the gross notional values of long and short positions of the underlying derivative contracts utilized by the Fund and exclude short-term securities. |
| 2 | | Includes holdings within countries representing 1% or less of long-term investments. Please refer to the Schedules of Investments for such countries. |
| | | |
| BLACKROCK FUNDS | JANUARY 31, 2014 | 9 |
| |
| Schedule of Investments January 31, 2014 (Unaudited) | BlackRock Emerging Markets Long/Short Equity Fund
(Percentages shown are based on Net Assets) |
Short-Term Securities
| | | | Shares | | Value |
BlackRock Liquidity Funds, TempFund, Institutional Class, 0.03% (a)(b) | | | | | | 601,727,131 | | $ | 601,727,131 | |
Total Short-Term Securities
(Cost — $601,727,131*) — 100.2% | | | | | | | | | 601,727,131 | |
Liabilities in Excess of Other Assets — (0.2)% | | | | | | | | | (1,403,979 | ) |
Net Assets — 100.0% | | | | | | | | $ | 600,323,152 | |
Notes to Schedule of Investments
| * | | | | Cost for federal income tax purposes. |
| (a) | | | | Investments in issuers considered to be an affiliate of the Fund during the six months ended January 31, 2014, for purposes of Section 2(a)(3) of the Investment Company Act of 1940, as amended, were as follows: |
Affiliate
| | | | Shares Held at
July 31, 2013 | | Net
Activity | | Shares Held at
January 31, 2014 | | Income |
BlackRock Liquidity Funds, TempFund, Institutional Class | | | | | 622,257,520 | | | | (20,530,389 | ) | | | 601,727,131 | | | $ | 124,445 | |
| (b) | | | | Represents the current yield as of report date. |
| • | | | | Total return swaps outstanding as of January 31, 2014 were as follows:1 |
Reference Entity
| | | | Counterparty | | Expiration Dates | | Notional
Amount | | Unrealized
Appreciation | | Net Value of
Reference
Entities |
Equity Securities Long/Short: | | | | Goldman Sachs & Co. | | 2/06/14 – 8/03/15 | | $ | 38,076,863 | | | $ | 4,231,006 | 2 | | $ | 42,012,097 | |
| | | | Morgan Stanley & Co, Inc. | | 10/09/14 – 7/11/16 | | $ | 35,629,221 | | | | 7,684,319 | 3 | | | 41,369,851 | |
| | | | UBS AG | | 2/28/14 – 5/02/18 | | $ | 41,822,339 | | | | 1,692,285 | 4 | | | 43,812,781 | |
Total | | | | | | | | | | | | $ | 13,607,610 | | | $ | 127,194,729 | |
| 1 | | The Fund receives or pays the total return on the long and short positions underlying the total return swap and pays or receives a specific LIBOR or Federal Funds floating rate, which is denominated in various foreign currencies based on the currencies of the securities underlying the total return swap. |
| 2 | | Amount includes $295,772 of dividends and financing fee due to/from the Fund and/or the counterparty. |
| 3 | | Amount includes $1,943,689 of dividends and financing fee due to/from the Fund and/or the counterparty. |
| 4 | | Amount includes $(298,157) of dividends and financing fee due to/from the Fund and/or the counterparty. |
Portfolio Abbreviations
To simplify the listings of portfolio holdings in the Schedules of Investments, the names and descriptions of many of the securities have been abbreviated according to the following list: | ADR
AUD
CAD
CHF
EUR
GDR
JPY
NOK
SEK
SGD
USD | American Depositary Receipts
Australian Dollar
Canadian Dollar
Swiss Franc
Euro
Global Depositary Receipts
Japanese Yen
Norwegian Krone
Swedish Krona
Singapore Dollar
US Dollar |
See Notes to Financial Statements.
| 10 | BLACKROCK FUNDS | JANUARY 31, 2014
|
| |
| Schedule of Investments (continued) | BlackRock Emerging Markets Long/Short Equity Fund |
The following table represents the individual long and short positions and related values of equity securities underlying the total return swap with Goldman Sachs & Co. as of January 31, 2014, expiration dates 2/06/14 — 8/03/15:
| | | | | Shares | | Value |
Reference Entity — Long |
Brazil | | | | | | | | | | |
AES Tiete SA, Preference Shares | | | | | 114,100 | | | $ | 892,658 | |
Bradespar SA, Preference Shares | | | | | 198,500 | | | | 1,834,269 | |
Braskem SA, Preference A Shares | | | | | 31,900 | | | | 245,603 | |
Cia Brasileira de Distribuicao Grupo Pao de Acucar — ADR | | | | | 89,408 | | | | 3,421,644 | |
Cia Brasileira de Distribuicao Grupo Pao de Acucar, Preference Shares | | | | | 94,700 | | | | 3,665,173 | |
Cia Energetica de Minas Gerais, Preference Shares | | | | | 7,248 | | | | 41,838 | |
Cia Energetica de Sao Paulo, Preference B Shares | | | | | 1,600 | | | | 15,296 | |
Cia Paranaense de Energia — ADR | | | | | 65,107 | | | | 746,126 | |
Cia Paranaense de Energia, Preference B Shares | | | | | 10,282 | | | | 118,574 | |
Estacio Participacoes SA | | | | | 14,400 | | | | 111,644 | |
Even Construtora e Incorporadora SA | | | | | 381,000 | | | | 1,130,409 | |
Randon Participacoes SA, Preference Shares | | | | | 36,300 | | | | 140,191 | |
Vale SA, Preference Shares — ADR | | | | | 346,927 | | | | 4,260,264 | |
Vale SA, Preference A Shares | | | | | 326,900 | | | | 4,063,814 | |
Valid Solucoes e Servicos de Seguranca em Meios de Pagamento e Identificacao SA | | | | | 77,200 | | | | 962,901 | |
| | | | | | | | | 21,650,404 | |
Chile | | | | | | | | | | |
Enersis SA — ADR | | | | | 234,848 | | | | 3,116,433 | |
China | | | | | | | | | | |
Agricultural Bank of China Ltd., Class H | | | | | 873,000 | | | | 381,106 | |
Bank of China Ltd., Class H | | | | | 3,846,000 | | | | 1,623,320 | |
BBMG Corp., Class H | | | | | 808,000 | | | | 631,880 | |
China Citic Bank Corp. Ltd., Class H | | | | | 134,000 | | | | 64,276 | |
China Communications Construction Corp. Ltd., Class H | | | | | 7,153,000 | | | | 5,205,408 | |
China Merchants Bank Co. Ltd., Class H | | | | | 31,111 | | | | 54,799 | |
China Oilfield Services Ltd., Class H | | | | | 758,000 | | | | 2,032,825 | |
China Railway Construction Corp., Class H | | | | | 2,218,000 | | | | 1,850,394 | |
China Railway Group Ltd., Class H | | | | | 759,000 | | | | 337,396 | |
Coolpad Group Ltd. | | | | | 1,292,000 | | | | 695,859 | |
Dongfeng Motor Group Co. Ltd., Class H | | | | | 2,764,000 | | | | 4,069,762 | |
Fosun International Ltd. | | | | | 320,000 | | | | 344,050 | |
Greentown China Holdings Ltd. | | | | | 565,500 | | | | 805,884 | |
Guangzhou Pharmaceutical Co. Ltd. | | | | | 178,000 | | | | 577,675 | |
Guangzhou R&F Properties Co. Ltd., Class H | | | | | 1,085,200 | | | | 1,445,388 | |
Industrial and Commercial Bank of China Ltd., Class H | | | | | 179,000 | | | | 110,364 | |
Jiangsu Expressway Co. Ltd., Class H | | | | | 1,984,000 | | | | 2,490,857 | |
Kingsoft Corp. Ltd. | | | | | 791,000 | | | | 2,581,104 | |
Lonking Holdings Ltd. | | | | | 4,745,000 | | | | 952,298 | |
Shanghai Industrial Holdings Ltd. | | | | | 255,000 | | | | 849,717 | |
Sinopharm Group Co., Class H | | | | | 194,800 | | | | 549,362 | |
Tencent Holdings Ltd. | | | | | 134,500 | | | | 9,429,778 | |
Tingyi Cayman Islands Holding Corp. | | | | | 828,000 | | | | 2,142,239 | |
Zhejiang Expressway Co. Ltd., Class H | | | | | 1,322,000 | | | | 1,179,913 | |
| | | | | | | | | 40,405,654 | |
Hong Kong | | | | | | | | | | |
Anxin-China Holdings Ltd. | | | | | 372,000 | | | | 94,255 | |
Belle International Holdings Ltd. | | | | | 1,045,000 | | | | 1,131,553 | |
China Lumena New Materials Corp. | | | | | 1,822,000 | | | | 323,259 | |
China Power International Development Ltd. | | | | | 1,298,000 | | | | 436,626 | |
China Resources Cement Holdings Ltd. | | | | | 482,000 | | | | 328,945 | |
Geely Automobile Holdings Ltd. | | | | | 19,850,000 | | | | 8,111,864 | |
GOME Electrical Appliances Holding Ltd. | | | | | 24,043,000 | | | | 4,167,170 | |
Guangdong Investment Ltd. | | | | | 142,000 | | | | 130,987 | |
Haier Electronics Group Co. Ltd. | | | | | 226,000 | | | | 655,596 | |
Huabao International Holdings Ltd. | | | | | 945,000 | | | | 478,503 | |
| | | | | | | | | | | |
| | | | | Shares | | Value |
Reference Entity — Long |
Hong Kong (concluded) | | | | | | | | | | |
Kingboard Chemical Holdings Ltd. | | | | | 36,000 | | | $ | 80,456 | |
KWG Property Holding Ltd. | | | | | 801,000 | | | | 417,463 | |
Lee & Man Paper Manufacturing Ltd. | | | | | 280,000 | | | | 187,484 | |
REXLot Holdings Ltd. | | | | | 10,250,000 | | | | 1,599,506 | |
Shenzhen Investment Ltd. | | | | | 1,278,000 | | | | 455,900 | |
| | | | | | | | | 18,599,567 | |
Indonesia | | | | | | | | | | |
Telekomunikasi Indonesia Persero Tbk PT | | | | | 1,951,500 | | | | 361,878 | |
Telekomunikasi Indonesia Persero Tbk PT — ADR | | | | | 18,553 | | | | 672,917 | |
| | | | | | | | | 1,034,795 | |
Malaysia | | | | | | | | | | |
Axiata Group Bhd | | | | | 797,200 | | | | 1,562,931 | |
British American Tobacco Malaysia Bhd | | | | | 116,400 | | | | 2,114,783 | |
DiGi.Com Bhd | | | | | 249,200 | | | | 349,622 | |
Lafarge Malayan Cement Bhd | | | | | 77 | | | | 196 | |
MISC Bhd | | | | | 468,800 | | | | 840,849 | |
PPB Group Bhd | | | | | 122,200 | | | | 563,345 | |
Sapurakencana Petroleum Bhd | | | | | 714,500 | | | | 936,118 | |
Telekom Malaysia Bhd | | | | | 87,900 | | | | 144,699 | |
Tenaga Nasional Bhd | | | | | 1,948,600 | | | | 6,869,688 | |
| | | | | | | | | 13,382,231 | |
Mexico | | | | | | | | | | |
Alfa SAB de CV, Series A | | | | | 328,600 | | | | 926,291 | |
Arca Continental SAB de CV | | | | | 196,000 | | | | 1,076,139 | |
Fomento Economico Mexicano SAB de CV | | | | | 129,400 | | | | 1,172,476 | |
Fomento Economico Mexicano SAB de CV — ADR | | | | | 64,586 | | | | 5,828,241 | |
Gruma SAB de CV, Class B | | | | | 43,900 | | | | 356,938 | |
Grupo Aeroportuario del Pacifico SAB de CV, Class B | | | | | 359,600 | | | | 1,950,455 | |
Grupo Aeroportuario del Pacifico SAB de CV — ADR | | | | | 10,682 | | | | 578,857 | |
Grupo Aeroportuario del Sureste SAB de CV, Class B | | | | | 74,800 | | | | 843,695 | |
Grupo Carso SAB de CV, Series A-1 | | | | | 67,500 | | | | 352,540 | |
Grupo Lala SAB de CV | | | | | 35,900 | | | | 76,503 | |
Infraestructura Energetica Nova SAB de CV | | | | | 168,600 | | | | 725,885 | |
Kimberly-Clark de Mexico SAB de CV | | | | | 1,706,183 | | | | 4,350,295 | |
| | | | | | | | | 18,238,315 | |
Peru | | | | | | | | | | |
Compania de Minas Buenaventura SA — ADR | | | | | 79,036 | | | | 980,046 | |
Philippines | | | | | | | | | | |
Manila Electric Co. | | | | | 29,700 | | | | 169,393 | |
Philippine Long Distance Telephone Co. | | | | | 4,745 | | | | 283,530 | |
Philippine Long Distance Telephone Co. — ADR | | | | | 33,524 | | | | 1,997,360 | |
Universal Robina Corp. | | | | | 160,490 | | | | 417,746 | |
| | | | | | | | | 2,868,029 | |
Poland | | | | | | | | | | |
Cyfrowy Polsat SA | | | | | 93,709 | | | | 585,783 | |
PGE SA | | | | | 441,080 | | | | 2,304,806 | |
Tauron Polska Energia SA | | | | | 32,399 | | | | 43,898 | |
Telekomunikacja Polska SA | | | | | 962,106 | | | | 3,204,985 | |
| | | | | | | | | 6,139,472 | |
Republic of Korea | | | | | | | | | | |
Amorepacific Corp. | | | | | 2,506 | | | | 2,355,527 | |
Amorepacific Group | | | | | 3,091 | | | | 1,356,784 | |
CJ CGV Co. Ltd. | | | | | 1,830 | | | | 82,200 | |
Daewoo Shipbuilding & Marine Engineering Co. Ltd. | | | | | 96,240 | | | | 3,062,686 | |
Doosan Corp. | | | | | 3,538 | | | | 449,164 | |
e-LITECOM Co. Ltd. | | | | | 3,436 | | | | 54,048 | |
Hanjin Kal Corp. | | | | | 1 | | | | 22 | |
Hanwha Corp. | | | | | 238,740 | | | | 8,034,040 | |
Hotel Shilla Co. Ltd. | | | | | 7,692 | | | | 552,408 | |
Hyosung Corp. | | | | | 29,327 | | | | 1,831,891 | |
Hyundai Engineering & Construction Co. Ltd. | | | | | 27,276 | | | | 1,474,328 | |
See Notes to Financial Statements.
| BLACKROCK FUNDS | JANUARY 31, 2014 | 11
|
| |
| Schedule of Investments (continued) | BlackRock Emerging Markets Long/Short Equity Fund |
| | | | | Shares | | Value |
Reference Entity — Long |
Republic of Korea (concluded) | | | | | | | | | | |
Hyundai Mobis | | | | | 5,022 | | | $ | 1,438,343 | |
Jahwa Electronics Co. Ltd. | | | | | 11,730 | | | | 209,735 | |
KCC Corp. | | | | | 5,755 | | | | 2,620,994 | |
Korea Aerospace Industries Ltd. | | | | | 167,810 | | | | 4,961,729 | |
Korea Petrochemical Ind Co. Ltd. | | | | | 1,481 | | | | 103,234 | |
Korea Zinc Co. Ltd. | | | | | 1,436 | | | | 457,192 | |
Korean Air Lines Co. Ltd. | | | | | 9 | | | | 287 | |
Korean Reinsurance Co. | | | | | 8,037 | | | | 84,458 | |
KT Skylife Co. Ltd. | | | | | 16,370 | | | | 423,508 | |
KT&G Corp. | | | | | 3,649 | | | | 258,074 | |
LG Fashion Corp. | | | | | 6,140 | | | | 167,150 | |
LG Hausys Ltd. | | | | | 909 | | | | 132,048 | |
Lotte Chemical Corp. | | | | | 1,920 | | | | 371,884 | |
Lotte Chilsung Beverage Co. Ltd. | | | | | 130 | | | | 196,758 | |
Lotte Food Co. Ltd. | | | | | 253 | | | | 184,583 | |
Lumens Co. Ltd. | | | | | 39,790 | | | | 408,542 | |
Maeil Dairy Industry Co. Ltd. | | | | | 11,776 | | | | 466,791 | |
Mirae Asset Securities Co. Ltd. | | | | | 11,290 | | | | 374,111 | |
Partron Co. Ltd. | | | | | 14,778 | | | | 184,438 | |
Poongsan Corp. | | | | | 3,720 | | | | 90,333 | |
S-1 Corp. | | | | | 3,871 | | | | 280,832 | |
Samsung Electronics Co. Ltd. | | | | | 1,738 | | | | 2,058,154 | |
SFA Engineering Corp. | | | | | 7,854 | | | | 330,523 | |
SK C&C Co. Ltd. | | | | | 918 | | | | 106,082 | |
SK Chemicals Co. Ltd. | | | | | 7,840 | | | | 425,699 | |
SK Networks Co. Ltd. | | | | | 175,460 | | | | 1,373,269 | |
Sungwoo Hitech Co. Ltd. | | | | | 4,814 | | | | 68,854 | |
| | | | | | | | | 37,030,703 | |
Russia | | | | | | | | | | |
Aeroflot - Russian Airlines OJSC | | | | | 109,000 | | | | 257,594 | |
Gazprom OAO | | | | | 1,385,220 | | | | 5,743,265 | |
Lukoil OAO | | | | | 25,539 | | | | 1,446,402 | |
Lukoil OAO — ADR | | | | | 26,698 | | | | 1,515,746 | |
Surgutneftegas OAO | | | | | 566,000 | | | | 434,846 | |
Surgutneftegas OAO, ADR | | | | | 210,149 | | | | 1,613,730 | |
Surgutneftegas OAO, Preference Shares | | | | | 11,780,300 | | | | 8,510,335 | |
Tatneft | | | | | 48,350 | | | | 269,355 | |
| | | | | | | | | 19,791,273 | |
South Africa | | | | | | | | | | |
Coronation Fund Managers Ltd. | | | | | 53,606 | | | | 385,071 | |
FirstRand Ltd. | | | | | 769,479 | | | | 2,163,798 | |
Imperial Holdings Ltd. | | | | | 77,421 | | | | 1,290,835 | |
Liberty Holdings Ltd. | | | | | 76,893 | | | | 792,439 | |
Life Healthcare Group Holdings Ltd. | | | | | 188,211 | | | | 601,881 | |
Reunert Ltd. | | | | | 55,720 | | | | 320,284 | |
Sanlam Ltd. | | | | | 99,990 | | | | 430,150 | |
Sasol Ltd. | | | | | 18,329 | | | | 881,913 | |
The Spar Group Ltd. | | | | | 162,888 | | | | 1,758,992 | |
Steinhoff International Holdings Ltd. | | | | | 159,535 | | | | 658,996 | |
Vodacom Group Ltd. | | | | | 853,092 | | | | 9,032,196 | |
Woolworths Holdings Ltd. | | | | | 272,088 | | | | 1,486,986 | |
| | | | | | | | | 19,803,541 | |
Taiwan | | | | | | | | | | |
Asustek Computer, Inc. | | | | | 154,000 | | | | 1,412,884 | |
Champion Microelectronic Corp. | | | | | 45,000 | | | | 123,268 | |
Cheng Uei Precision Industry Co. Ltd. | | | | | 1,058,000 | | | | 2,243,534 | |
Chimei Materials Technology Corp. | | | | | 2,930,000 | | | | 3,858,946 | |
Compeq Manufacturing Co. Ltd. | | | | | 5,996,000 | | | | 3,333,519 | |
Everlight Electronics Co. Ltd. | | | | | 569,000 | | | | 1,352,580 | |
Far Eastern Department Stores Co. Ltd. | | | | | 1,579,420 | | | | 1,435,972 | |
Far Eastern New Century Corp. | | | | | 659,228 | | | | 679,774 | |
Grape King Bio Ltd. | | | | | 140,000 | | | | 608,473 | |
Hon Hai Precision Industry Co. Ltd. | | | | | 49,000 | | | | 136,886 | |
| | | | | | | | | | | |
| | | | | Shares | | Value |
Reference Entity — Long |
Taiwan (concluded) | | | | | | | | | | |
Inotera Memories, Inc. | | | | | 2,795,000 | | | $ | 2,148,279 | |
King Slide Works Co. Ltd. | | | | | 155,000 | | | | 1,693,256 | |
Merry Electronics Co. Ltd. | | | | | 1,034,000 | | | | 5,941,432 | |
Motech Industries, Inc. | | | | | 661,000 | | | | 1,166,250 | |
Nan Ya Plastics Corp. | | | | | 564,000 | | | | 1,229,113 | |
Pou Chen Corp. | | | | | 4,691,000 | | | | 6,484,562 | |
Realtek Semiconductor Corp. | | | | | 315,000 | | | | 856,597 | |
Taiflex Scientific Co. Ltd. | | | | | 1,082,000 | | | | 1,998,902 | |
Taiwan Cement Corp. | | | | | 3,945,000 | | | | 5,758,967 | |
Taiwan Semiconductor Manufacturing Co. Ltd. | | | | | 1,338,000 | | | | 4,607,339 | |
Teco Electric and Machinery Co. Ltd. | | | | | 135,000 | | | | 146,626 | |
Vanguard International Semiconductor Corp. | | | | | 360,000 | | | | 393,925 | |
Wistron NeWeb Corp. | | | | | 1,933,000 | | | | 4,935,840 | |
| | | | | | | | | 52,546,924 | |
Thailand | | | | | | | | | | |
BEC World PCL | | | | | 1,265,200 | | | | 1,791,823 | |
PTT Global Chemical PCL | | | | | 3,277,500 | | | | 7,074,277 | |
| | | | | | | | | 8,866,100 | |
Turkey | | | | | | | | | | |
BIM Birlesik Magazalar AS | | | | | 45,777 | | | | 783,086 | |
Enka Insaat ve Sanayi AS | | | | | 1,016,704 | | | | 2,900,263 | |
Eregli Demir ve Celik Fabrikalari TAS | | | | | 1,806,489 | | | | 2,171,653 | |
Tofas Turk Otomobil Fabrikasi | | | | | 10,178 | | | | 47,875 | |
| | | | | | | | | 5,902,877 | |
United Kingdom | | | | | | | | | | |
British American Tobacco PLC | | | | | 114,390 | | | | 5,486,720 | |
Old Mutual PLC | | | | | 88,659 | | | | 251,908 | |
| | | | | | | | | 5,738,628 | |
Total Reference Entity — Long | | | | | | | | | 276,094,992 | |
|
Reference Entity — Short |
Argentina | | | | | | | | | | |
MercadoLibre, Inc. | | | | | (3,302 | ) | | | (318,610 | ) |
Brazil | | | | | | | | | | |
Aliansce Shopping Centers SA | | | | | (18,000 | ) | | | (122,175 | ) |
Anhanguera Educacional Participacoes SA | | | | | (461,500 | ) | | | (2,428,696 | ) |
BR Properties SA | | | | | (130,100 | ) | | | (912,169 | ) |
BRF SA — ADR | | | | | (5,507 | ) | | | (97,364 | ) |
Centrais Eletricas Brasileiras SA, Preference B Shares | | | | | (34,700 | ) | | | (135,162 | ) |
Cia Hering | | | | | (14,400 | ) | | | (159,917 | ) |
EcoRodovias Infraestrutura e Logistica SA | | | | | (146,800 | ) | | | (748,219 | ) |
Equatorial Energia SA | | | | | (15,000 | ) | | | (138,299 | ) |
Gol Linhas Aereas Inteligentes SA — ADR | | | | | (2,506 | ) | | | (9,849 | ) |
Marcopolo SA, Preference Shares | | | | | (108,600 | ) | | | (233,108 | ) |
Telefonica Brasil SA — ADR | | | | | (227,066 | ) | | | (4,314,254 | ) |
| | | | | | | | | (9,299,212 | ) |
Chile | | | | | | | | | | |
Sociedad Quimica y Minera de Chile SA — ADR | | | | | (38,346 | ) | | | (955,199 | ) |
China | | | | | | | | | | |
Aluminum Corp. of China Ltd. — ADR | | | | | (12,349 | ) | | | (109,412 | ) |
China Coal Energy Co. Ltd. | | | | | (2,507,000 | ) | | | (1,254,506 | ) |
China COSCO Holdings Co. Ltd., Class H | | | | | (2,639,500 | ) | | | (1,105,435 | ) |
China Longyuan Power Group Corp., Class H | | | | | (7,447,000 | ) | | | (8,968,407 | ) |
China Shipping Development Co. Ltd., Class H | | | | | (456,000 | ) | | | (272,979 | ) |
ENN Energy Holdings Ltd. | | | | | (516,000 | ) | | | (3,338,593 | ) |
Li Ning Co. Ltd. | | | | | (1,792,000 | ) | | | (1,432,584 | ) |
Shui On Land Ltd. | | | | | (5,799,000 | ) | | | (1,832,992 | ) |
SOHO China Ltd. | | | | | (1,380,500 | ) | | | (1,095,131 | ) |
Sun Art Retail Group Ltd. | | | | | (96,000 | ) | | | (125,690 | ) |
See Notes to Financial Statements.
| 12 | BLACKROCK FUNDS | JANUARY 31, 2014
|
| |
| Schedule of Investments (continued) | BlackRock Emerging Markets Long/Short Equity Fund |
| | | | | Shares | | Value |
Reference Entity — Short |
China (concluded) | | | | | | | | | | |
Tsingtao Brewery Co. Ltd., Class H | | | | | (432,000 | ) | | $ | (3,168,575 | ) |
Uni-President China Holdings Ltd. | | | | | (2,497,000 | ) | | | (2,258,862 | ) |
Weichai Power Co. Ltd., Class H | | | | | (10,000 | ) | | | (38,000 | ) |
| | | | | | | | | (25,001,166 | ) |
Hong Kong | | | | | | | | | | |
Beijing Enterprises Holdings Ltd. | | | | | (831,000 | ) | | | (7,020,737 | ) |
Brilliance China Automotive Holdings Ltd. | | | | | (1,184,000 | ) | | | (1,804,640 | ) |
China Everbright International Ltd. | | | | | (195,000 | ) | | | (256,635 | ) |
China Mengniu Dairy Co. Ltd. | | | | | (2,894,000 | ) | | | (13,255,625 | ) |
China Resources Enterprise Ltd. | | | | | (992,000 | ) | | | (2,944,664 | ) |
China Singyes Solar Technologies Holdings Ltd. | | | | | (57,000 | ) | | | (64,705 | ) |
China State Construction International Holdings Ltd. | | | | | (2,556,000 | ) | | | (4,632,884 | ) |
Digital China Holdings Ltd. | | | | | (516,000 | ) | | | (505,233 | ) |
GCL-Poly Energy Holdings Ltd. | | | | | (573,000 | ) | | | (194,085 | ) |
Kunlun Energy Co. Ltd. | | | | | (1,064,000 | ) | | | (1,756,428 | ) |
| | | | | | | | | (32,435,636 | ) |
Indonesia | | | | | | | | | | |
Charoen Pokphand Indonesia Tbk PT | | | | | (1,518,500 | ) | | | (512,236 | ) |
Indofood Sukses Makmur Tbk PT | | | | | (160,000 | ) | | | (91,465 | ) |
Semen Indonesia Persero Tbk PT | | | | | (372,700 | ) | | | (432,994 | ) |
Unilever Indonesia Tbk PT | | | | | (632,200 | ) | | | (1,485,798 | ) |
XL Axiata Tbk PT | | | | | (787,400 | ) | | | (313,384 | ) |
| | | | | | | | | (2,835,877 | ) |
Malaysia | | | | | | | | | | |
Maxis Bhd | | | | | (217,700 | ) | | | (452,776 | ) |
Petronas Dagangan BHD | | | | | (11,400 | ) | | | (104,404 | ) |
| | | | | | | | | (557,180 | ) |
Mexico | | | | | | | | | | |
Alpek SA de CV | | | | | (81,300 | ) | | | (161,944 | ) |
America Movil SAB de CV, Series L | | | | | (3,513,900 | ) | | | (3,751,944 | ) |
America Movil SAB de CV — ADR, Series L | | | | | (273,456 | ) | | | (5,813,675 | ) |
Cemex SAB de CV — ADR | | | | | (114,385 | ) | | | (1,414,942 | ) |
Empresas ICA SAB de CV | | | | | (695,999 | ) | | | (1,344,224 | ) |
Mexichem SAB de CV | | | | | (3,819,620 | ) | | | (13,263,283 | ) |
Minera Frisco SAB de CV, Series A-1 | | | | | (230,500 | ) | | | (363,312 | ) |
| | | | | | | | | (26,113,324 | ) |
Philippines | | | | | | | | | | |
Aboitiz Equity Ventures, Inc. | | | | | (560,000 | ) | | | (640,628 | ) |
Energy Development Corp. | | | | | (1,239,900 | ) | | | (143,606 | ) |
| | | | | | | | | (784,234 | ) |
Poland | | | | | | | | | | |
Jastrzebska Spolka Weglowa SA | | | | | (35,580 | ) | | | (520,370 | ) |
Polski Koncern Naftowy Orlen SA | | | | | (91,393 | ) | | | (1,121,898 | ) |
| | | | | | | | | (1,642,268 | ) |
Republic of Korea | | | | | | | | | | |
Cheil Industries, Inc. | | | | | (1,709 | ) | | | (118,828 | ) |
CJ CheilJedang Corp. | | | | | (9,370 | ) | | | (2,307,245 | ) |
CJ Korea Express Co. Ltd. | | | | | (9,456 | ) | | | (936,863 | ) |
CrucialTec Co. Ltd. | | | | | (15,765 | ) | | | (160,429 | ) |
Daewoo Engineering & Construction Co. Ltd. | | | | | (547,740 | ) | | | (3,467,798 | ) |
GS Engineering & Construction Corp. | | | | | (2 | ) | | | (62 | ) |
Hyundai Heavy Industries Co. Ltd. | | | | | (18,842 | ) | | | (3,894,286 | ) |
Hyundai Mipo Dockyard | | | | | (89,091 | ) | | | (14,292,291 | ) |
Nexen Tire Corp. | | | | | (19,010 | ) | | | (260,279 | ) |
OCI Co. Ltd. | | | | | (9,709 | ) | | | (1,701,604 | ) |
Orion Corp. | | | | | (644 | ) | | | (523,750 | ) |
S-Oil Corp. | | | | | (1,291 | ) | | | (81,984 | ) |
Samsung Electro-Mechanics Co. Ltd. | | | | | (16,509 | ) | | | (1,018,917 | ) |
Samsung Engineering Co. Ltd. | | | | | (100,704 | ) | | | (6,709,670 | ) |
Samsung Fine Chemicals Co. Ltd. | | | | | (28,421 | ) | | | (1,072,907 | ) |
| | | | | | | | | | | |
| | | | | Shares | | Value |
Reference Entity — Short |
Republic of Korea (concluded) | | | | | | | | | | |
Samsung SDI Co. Ltd. | | | | | (500 | ) | | $ | (66,341 | ) |
WeMade Entertainment Co. Ltd. | | | | | (1,286 | ) | | | (50,299 | ) |
| | | | | | | | | (36,663,553 | ) |
Russia | | | | | | | | | | |
AK Transneft OAO, Preference Shares | | | | | (444 | ) | | | (1,013,194 | ) |
Novolipetsk Steel OJSC — GDR | | | | | (206,817 | ) | | | (2,973,100 | ) |
RusHydro JSC | | | | | (4,503,000 | ) | | | (71,093 | ) |
Uralkali OJSC — GDR | | | | | (13,281 | ) | | | (321,955 | ) |
| | | | | | | | | (4,379,342 | ) |
South Africa | | | | | | | | | | |
Anglo American Platinum Ltd. | | | | | (23,743 | ) | | | (948,327 | ) |
Discovery Holdings Ltd. | | | | | (385,280 | ) | | | (2,605,721 | ) |
Exxaro Resources Ltd. | | | | | (365,726 | ) | | | (4,937,117 | ) |
The Foschini Group Ltd. | | | | | (79,802 | ) | | | (668,484 | ) |
Impala Platinum Holdings Ltd. | | | | | (311,832 | ) | | | (3,257,625 | ) |
Massmart Holdings Ltd. | | | | | (509,967 | ) | | | (5,560,661 | ) |
Northam Platinum Ltd. | | | | | (352,944 | ) | | | (1,322,204 | ) |
Pick n Pay Stores Ltd. | | | | | (601,869 | ) | | | (2,463,919 | ) |
Remgro Ltd. | | | | | (1,137,626 | ) | | | (19,029,149 | ) |
Sappi Ltd. | | | | | (514,132 | ) | | | (1,591,191 | ) |
| | | | | | | | | (42,384,398 | ) |
Spain | | | | | | | | | | |
Abertis Infraestructuras SA | | | | | (22,374 | ) | | | (499,279 | ) |
Taiwan | | | | | | | | | | |
Asia Cement Corp. | | | | | (311,000 | ) | | | (381,441 | ) |
Cheng Shin Rubber Industry Co. Ltd. | | | | | (1,205,000 | ) | | | (3,055,165 | ) |
China Airlines Ltd. | | | | | (2,099,888 | ) | | | (738,653 | ) |
China Petrochemical Development Corp. | | | | | (6,371,425 | ) | | | (2,811,043 | ) |
Chipbond Technology Corp. | | | | | (1,445,000 | ) | | | (2,203,001 | ) |
Compal Electronics, Inc. | | | | | (718,000 | ) | | | (533,762 | ) |
Evergreen Marine Corp. Taiwan Ltd. | | | | | (5,457,000 | ) | | | (3,200,756 | ) |
FLEXium Interconnect, Inc. | | | | | (191,000 | ) | | | (574,750 | ) |
Formosa Petrochemical Corp. | | | | | (1,216,000 | ) | | | (3,066,178 | ) |
Foxconn Technology Co. Ltd. | | | | | (1,758,000 | ) | | | (3,949,180 | ) |
Giant Manufacturing Co. Ltd. | | | | | (189,000 | ) | | | (1,193,478 | ) |
Hotai Motor Co. Ltd. | | | | | (447,000 | ) | | | (5,425,664 | ) |
HTC Corp. | | | | | (3,349,000 | ) | | | (15,018,007 | ) |
Hua Nan Financial Holdings Co. Ltd. | | | | | (181,000 | ) | | | (101,954 | ) |
LCY Chemical Corp. | | | | | (107,000 | ) | | | (135,800 | ) |
Lotus Pharmaceutical Co. Ltd. | | | | | (46,000 | ) | | | (137,713 | ) |
Nan Kang Rubber Tire Co. Ltd. | | | | | (49,112 | ) | | | (59,517 | ) |
Phison Electronics Corp. | | | | | (54,000 | ) | | | (337,868 | ) |
Radium Life Tech Co. Ltd. | | | | | (306,000 | ) | | | (233,368 | ) |
Standard Foods Corp. | | | | | (371,000 | ) | | | (1,089,909 | ) |
Taiwan Glass Industry Corp. | | | | | (69,000 | ) | | | (67,455 | ) |
Ton Yi Industrial Corp. | | | | | (175,000 | ) | | | (172,629 | ) |
TTY Biopharm Co. Ltd. | | | | | (282,000 | ) | | | (834,412 | ) |
U-Ming Marine Transport Corp. | | | | | (111,000 | ) | | | (184,174 | ) |
Winbond Electronics Corp. | | | | | (1,724,000 | ) | | | (415,535 | ) |
Wintek Corp. | | | | | (1,761,000 | ) | | | (585,770 | ) |
| | | | | | | | | (46,507,182 | ) |
Thailand | | | | | | | | | | |
Bangkok Dusit Medical Services PCL | | | | | (104,800 | ) | | | (374,626 | ) |
Indorama Ventures PCL, Class F | | | | | (329,200 | ) | | | (206,435 | ) |
| | | | | | | | | (581,061 | ) |
Turkey | | | | | | | | | | |
Anadolu Efes Biracilik Ve Malt Sanayii AS | | | | | (123,533 | ) | | | (1,252,290 | ) |
Coca-Cola Icecek AS | | | | | (63,791 | ) | | | (1,335,792 | ) |
Turkcell Iletisim Hizmetleri AS — ADR | | | | | (43,156 | ) | | | (537,292 | ) |
| | | | | | | | | (3,125,374 | ) |
Total Reference Entity — Short | | | | | | | | | (234,082,895 | ) |
Net Value of Reference Entity — Goldman Sachs & Co. | $ | 42,012,097 | |
See Notes to Financial Statements.
| BLACKROCK FUNDS | JANUARY 31, 2014 | 13
|
| |
| Schedule of Investments (continued) | BlackRock Emerging Markets Long/Short Equity Fund |
The following table represents the individual long and short positions and related values of equity securities underlying the total return swap with Morgan Stanley & Co., Inc. as of January 31, 2014, expiration dates 10/09/14 — 7/11/16:
| | | | | Shares | | Value |
Reference Entity — Long |
Brazil | | | | | | | | | | |
AMBEV SA | | | | | 8,500 | | | $ | 56,673 | |
Bradespar SA, Preference Shares | | | | | 27,400 | | | | 253,194 | |
Braskem SA, Preference A Shares | | | | | 42,600 | | | | 327,984 | |
Cia Brasileira de Distribuicao Grupo Pao de Acucar — ADR | | | | | 35,302 | | | | 1,351,008 | |
Cia Brasileira de Distribuicao Grupo Pao de Acucar, Preference Shares | | | | | 37,800 | | | | 1,462,973 | |
Cia Paranaense de Energia — ADR | | | | | 16,144 | | | | 185,010 | |
Cia Paranaense de Energia, Preference B Shares | | | | | 2,800 | | | | 32,290 | |
Even Construtora e Incorporadora SA | | | | | 47,000 | | | | 139,447 | |
Klabin SA, Preference Shares | | | | | 287,400 | | | | 1,469,602 | |
Petroleo Brasileiro SA, Preference Shares | | | | | 134,000 | | | | 816,244 | |
Randon Participacoes SA, Preference Shares | | | | | 76,300 | | | | 294,671 | |
Vale SA, Preference Shares — ADR | | | | | 20,150 | | | | 247,442 | |
Vale SA, Preference A Shares | | | | | 26,600 | | | | 330,674 | |
| | | | | | | | | 6,967,212 | |
Chile | | | | | | | | | | |
AES Gener SA | | | | | 1,412,455 | | | | 699,031 | |
Enersis SA | | | | | 2,317,617 | | | | 612,431 | |
| | | | | | | | | 1,311,462 | |
China | | | | | | | | | | |
Anhui Conch Cement Co. Ltd., Class H | | | | | 247,500 | | | | 954,688 | |
Bank of China Ltd., Class H | | | | | 7,282,000 | | | | 3,073,587 | |
BBMG Corp., Class H | | | | | 270,000 | | | | 211,148 | |
China Citic Bank Corp. Ltd., Class H | | | | | 2,212,000 | | | | 1,061,030 | |
China Communications Construction Co. Ltd., Class H | | | | | 3,825,000 | | | | 2,783,544 | |
China Construction Bank Corp., Class H | | | | | 1,640,000 | | | | 1,136,103 | |
China Galaxy Securities Co. Ltd., Class H | | | | | 141,000 | | | | 101,573 | |
China Merchants Bank Co. Ltd., Class H | | | | | 382,137 | | | | 673,102 | |
China Oilfield Services Ltd., Class H | | | | | 1,210,000 | | | | 3,245,012 | |
China Petroleum & Chemical Corp., Class H | | | | | 1,282,000 | | | | 1,012,643 | |
China Railway Construction Corp., Class H | | | | | 3,596,500 | | | | 3,000,424 | |
China Railway Group Ltd., Class H | | | | | 2,013,000 | | | | 894,832 | |
Dongfeng Motor Group Co. Ltd., Class H | | | | | 54,000 | | | | 79,511 | |
Fosun International Ltd. | | | | | 773,000 | | | | 831,095 | |
GOME Electrical Appliances Holding Ltd. | | | | | 19,635,000 | | | | 3,403,169 | |
Great Wall Motor Co. Ltd., Class H | | | | | 34,500 | | | | 162,363 | |
Greentown China Holdings Ltd. | | | | | 1,046,000 | | | | 1,490,635 | |
Guangzhou Baiyunshan Pharmaceutical Holdings Co. Ltd. | | | | | 198,000 | | | | 642,582 | |
Guangzhou R&F Properties Co. Ltd., Class H | | | | | 2,240,000 | | | | 2,983,476 | |
Industrial & Commercial Bank of China Ltd., Class H | | | | | 28,000 | | | | 17,264 | |
Jiangsu Expressway Co. Ltd., Class H | | | | | 444,000 | | | | 557,430 | |
Kingboard Chemical Holdings Ltd. | | | | | 120,500 | | | | 269,303 | |
Kingsoft Corp. Ltd. | | | | | 189,000 | | | | 616,724 | |
Lonking Holdings Ltd. | | | | | 2,211,000 | | | | 443,737 | |
Shanghai Industrial Holdings Ltd. | | | | | 173,000 | | | | 576,475 | |
Tencent Holdings Ltd. | | | | | 5,500 | | | | 385,604 | |
Tingyi Cayman Islands Holding Corp. | | | | | 222,000 | | | | 574,368 | |
Zhejiang Expressway Co. Ltd., Class H | | | | | 1,398,000 | | | | 1,247,744 | |
| | | | | | | | | 32,429,166 | |
Hong Kong | | | | | | | | | | |
COSCO Pacific Ltd. | | | | | 560,000 | | | | 716,546 | |
Geely Automobile Holdings Ltd. | | | | | 745,000 | | | | 304,450 | |
Guangdong Investment Ltd. | | | | | 70,000 | | | | 64,571 | |
Haier Electronics Group Co. Ltd. | | | | | 81,000 | | | | 234,970 | |
Huabao International Holdings Ltd. | | | | | 1,662,000 | | | | 841,557 | |
KWG Property Holding Ltd. | | | | | 531,000 | | | | 276,746 | |
| | | | | | | | | | | |
| | | | | Shares | | Value |
Reference Entity — Long |
Hong Kong (concluded) | | | | | | | | | | |
Lee & Man Paper Manufacturing Ltd. | | | | | 206,000 | | | $ | 137,935 | |
REXLot Holdings Ltd. | | | | | 9,875,000 | | | | 1,540,987 | |
Shenzhen Investment Ltd. | | | | | 2,540,000 | | | | 906,093 | |
| | | | | | | | | 5,023,855 | |
Malaysia | | | | | | | | | | |
Axiata Group Bhd | | | | | 628,700 | | | | 1,232,582 | |
British American Tobacco Malaysia Bhd | | | | | 57,300 | | | | 1,041,040 | |
IJM Corp. Bhd | | | | | 37,100 | | | | 65,656 | |
MISC Bhd | | | | | 212,200 | | | | 380,606 | |
Sapurakencana Petroleum Bhd | | | | | 139,900 | | | | 183,293 | |
Tenaga Nasional Bhd | | | | | 946,600 | | | | 3,337,189 | |
| | | | | | | | | 6,240,366 | |
Mexico | | | | | | | | | | |
Alfa SAB de CV, Series A | | | | | 148,100 | | | | 417,480 | |
Arca Continental SAB de CV | | | | | 276,200 | | | | 1,516,477 | |
Fomento Economico Mexicano SAB de CV | | | | | 85,200 | | | | 771,986 | |
Gruma SAB de CV, Class B | | | | | 87,000 | | | | 707,371 | |
Grupo Aeroportuario del Pacifico SAB de CV — ADR | | | | | 2,621 | | | | 142,032 | |
Grupo Aeroportuario del Pacifico SAB de CV, Class B | | | | | 245,200 | | | | 1,329,954 | |
Grupo Aeroportuario del Sureste SAB de CV, Class B | | | | | 119,300 | | | | 1,345,626 | |
Infraestructura Energetica Nova SAB de CV | | | | | 195,800 | | | | 842,991 | |
Kimberly-Clark de Mexico SAB de CV, Class A | | | | | 128,800 | | | | 328,404 | |
Promotora y Operadora de Infraestructura SAB de CV | | | | | 40,200 | | | | 488,839 | |
| | | | | | | | | 7,891,160 | |
Philippines | | | | | | | | | | |
Manila Electric Co. | | | | | 31,390 | | | | 179,032 | |
Philippine Long Distance Telephone Co. | | | | | 54,865 | | | | 3,278,369 | |
Philippine Long Distance Telephone Co. — ADR | | | | | 57,267 | | | | 3,411,968 | |
Universal Robina Corp. | | | | | 213,240 | | | | 555,051 | |
| | | | | | | | | 7,424,420 | |
Poland | | | | | | | | | | |
PGE SA | | | | | 220,741 | | | | 1,153,453 | |
Republic of Korea | | | | | | | | | | |
Amorepacific Group | | | | | 2,157 | | | | 946,808 | |
e-LITECOM Co. Ltd. | | | | | 11,610 | | | | 182,625 | |
E-Mart Co. Ltd. | | | | | 1,970 | | | | 474,837 | |
Hana Financial Group, Inc. | | | | | 2 | | | | 76 | |
Hanjin Kal Corp. | | | | | 9 | | | | 196 | |
Hanwha Corp. | | | | | 9,430 | | | | 317,337 | |
Hyosung Corp. | | | | | 14,730 | | | | 920,100 | |
Hyundai Engineering & Construction Co. Ltd. | | | | | 36,377 | | | | 1,966,257 | |
Hyundai Mobis | | | | | 1,193 | | | | 341,685 | |
Hyundai Steel Co. | | | | | 8,545 | | | | 601,840 | |
i-SENS, Inc. | | | | | 1,533 | | | | 62,820 | |
Jahwa Electronics Co. Ltd. | | | | | 23,350 | | | | 417,503 | |
Kangwon Land, Inc. | | | | | 3,020 | | | | 94,917 | |
KCC Corp. | | | | | 924 | | | | 420,816 | |
Korea Petrochemical Ind Co. Ltd. | | | | | 8,023 | | | | 559,251 | |
KT Skylife Co. Ltd. | | | | | 67,340 | | | | 1,742,153 | |
LG Hausys Ltd. | | | | | 683 | | | | 99,218 | |
LiHOM-CUCHEN Co. Ltd. | | | | | 16,290 | | | | 99,902 | |
Lotte Chemical Corp. | | | | | 6,159 | | | | 1,192,933 | |
Lotte Chilsung Beverage Co. Ltd. | | | | | 228 | | | | 345,083 | |
Lumens Co. Ltd. | | | | | 14,327 | | | | 147,102 | |
Macrogen, Inc. | | | | | 8 | | | | 229 | |
Maeil Dairy Industry Co. Ltd. | | | | | 7,585 | | | | 300,663 | |
Mirae Asset Securities Co. Ltd. | | | | | 7,070 | | | | 234,275 | |
NongShim Co. Ltd. | | | | | 1,431 | | | | 362,258 | |
S-1 Corp. | | | | | 1,975 | | | | 143,282 | |
See Notes to Financial Statements.
| 14 | BLACKROCK FUNDS | JANUARY 31, 2014
|
| |
| Schedule of Investments (continued) | BlackRock Emerging Markets Long/Short Equity Fund |
| | | | | Shares | | Value |
Reference Entity — Long |
Republic of Korea (concluded) | | | | | | | | | | |
Samsung Electronics Co. Ltd. | | | | | 2,647 | | | $ | 3,134,600 | |
SEOWONINTECH Co. Ltd. | | | | | 13,291 | | | | 169,995 | |
SFA Engineering Corp. | | | | | 16,002 | | | | 673,419 | |
SK Chemicals Co. Ltd. | | | | | 5,612 | | | | 304,722 | |
SK Networks Co. Ltd. | | | | | 291,690 | | | | 2,282,964 | |
| | | | | | | | | 18,539,866 | |
Russia | | | | | | | | | | |
Aeroflot — Russian Airlines OJSC | | | | | 222,300 | | | | 525,350 | |
Lukoil OAO | | | | | 36,172 | | | | 2,048,603 | |
Lukoil OAO — ADR | | | | | 7,375 | | | | 418,706 | |
Surgutneftegas OAO | | | | | 4,132,476 | | | | 3,659,171 | |
Surgutneftegas OAO, Preference Shares | | | | | 3,969,500 | | | | 2,867,650 | |
| | | | | | | | | 9,519,480 | |
South Africa | | | | | | | | | | |
Clicks Group Ltd. | | | | | 18,910 | | | | 97,050 | |
Coronation Fund Managers Ltd. | | | | | 31,886 | | | | 229,048 | |
FirstRand Ltd. | | | | | 584,477 | | | | 1,643,567 | |
Imperial Holdings Ltd. | | | | | 87,940 | | | | 1,466,217 | |
Liberty Holdings Ltd. | | | | | 11,438 | | | | 117,877 | |
MMI Holdings Ltd. | | | | | 163,409 | | | | 347,193 | |
Reunert Ltd. | | | | | 40,920 | | | | 235,212 | |
The Spar Group Ltd. | | | | | 36,479 | | | | 393,929 | |
Steinhoff International Holdings Ltd. | | | | | 98,780 | | | | 408,034 | |
Vodacom Group Ltd. | | | | | 169,170 | | | | 1,791,104 | |
| | | | | | | | | 6,729,231 | |
Spain | | | | | | | | | | |
Cemex Latam Holdings SA | | | | | 22,821 | | | | 152,825 | |
Taiwan | | | | | | | | | | |
Asustek Computer, Inc. | | | | | 193,000 | | | | 1,770,692 | |
Chimei Materials Technology Corp. | | | | | 867,000 | | | | 1,141,879 | |
Compeq Manufacturing Co. Ltd. | | | | | 648,000 | | | | 360,260 | |
Far Eastern Department Stores Ltd. | | | | | 1,390,600 | | | | 1,264,301 | |
Hon Hai Precision Industry Co. Ltd. | | | | | 209,000 | | | | 583,860 | |
Inotera Memories, Inc. | | | | | 950,000 | | | | 730,184 | |
King Slide Works Co. Ltd. | | | | | 102,000 | | | | 1,114,272 | |
Merry Electronics Co. Ltd. | | | | | 178,000 | | | | 1,022,800 | |
Motech Industries, Inc. | | | | | 678,000 | | | | 1,196,245 | |
Nan Ya Plastics Corp. | | | | | 702,000 | | | | 1,529,854 | |
Pou Chen Corp. | | | | | 1,785,000 | | | | 2,467,479 | |
Radiant Opto-Electronics Corp. | | | | | 262,000 | | | | 1,137,129 | |
Realtek Semiconductor Corp. | | | | | 965,150 | | | | 2,624,587 | |
Synnex Technology International Corp. | | | | | 85,000 | | | | 144,117 | |
Taiwan Cement Corp. | | | | | 2,320,000 | | | | 3,386,769 | |
Taiwan Semiconductor Manufacturing Co. Ltd. — ADR | | | | | 21,121 | | | | 357,367 | |
Taiwan Semiconductor Manufacturing Co. Ltd. | | | | | 76,000 | | | | 261,702 | |
Tong Hsing Electronic Industries Ltd. | | | | | 47,000 | | | | 240,875 | |
Vanguard International Semiconductor Corp. | | | | | 56,000 | | | | 61,277 | |
Wistron NeWeb Corp. | | | | | 83,000 | | | | 211,937 | |
Yungtay Engineering Co. Ltd. | | | | | 146,000 | | | | 399,625 | |
| | | | | | | | | 22,007,211 | |
Thailand | | | | | | | | | | |
BEC World PCL, Foreign Registered Shares | | | | | 1,116,600 | | | | 1,581,371 | |
PTT Global Chemical PCL, Foreign Registered Shares | | | | | 38,600 | | | | 83,316 | |
| | | | | | | | | 1,664,687 | |
Turkey | | | | | | | | | | |
Enka Insaat ve Sanayi AS | | | | | 925,554 | | | | 2,640,247 | |
Kardemir Karabuk Demir Celik Sanayi ve Ticaret AS, Class D | | | | | 1,085,876 | | | | 466,820 | |
Pegasus Hava Tasimaciligi AS | | | | | 65,246 | | | | 752,878 | |
| | | | | | | | | 3,859,945 | |
| | | | | | | | | | | |
| | | | | Shares | | Value |
Reference Entity — Long |
United Kingdom | | | | | | | | | | |
Old Mutual PLC | | | | | 622,016 | | | $ | 1,767,340 | |
United States | | | | | | | | | | |
The AES Corp. | | | | | 89,671 | | | | 1,260,774 | |
Total Reference Entity — Long | | | | | | | | | 133,942,453 | |
|
Reference Entity — Short |
Argentina | | | | | | | | | | |
MercadoLibre, Inc. | | | | | (3,349 | ) | | | (323,145 | ) |
Brazil | | | | | | | | | | |
Aliansce Shopping Centers SA | | | | | (109,600 | ) | | | (743,913 | ) |
ALL—America Latina Logistica SA | | | | | (769,800 | ) | | | (2,108,517 | ) |
AMBEV SA — ADR | | | | | (55,900 | ) | | | (365,586 | ) |
Anhanguera Educacional Participacoes SA | | | | | (1,521,337 | ) | | | (8,006,207 | ) |
BR Malls Participacoes SA | | | | | (151,100 | ) | | | (951,712 | ) |
BRF SA | | | | | (333,800 | ) | | | (5,980,944 | ) |
BRF SA — ADR | | | | | (420,425 | ) | | | (7,433,114 | ) |
Centrais Eletricas Brasileiras SA, Preferred B Shares | | | | | (54,900 | ) | | | (213,844 | ) |
Cia Hering | | | | | (212,500 | ) | | | (2,359,888 | ) |
EcoRodovias Infraestrutura e Logistica SA | | | | | (309,700 | ) | | | (1,578,498 | ) |
Equatorial Energia SA | | | | | (166,252 | ) | | | (1,532,832 | ) |
Mills Estruturas e Servicos de Engenharia SA | | | | | (7,300 | ) | | | (84,669 | ) |
Natura Cosmeticos SA | | | | | (25,600 | ) | | | (416,580 | ) |
Telefonica Brasil SA, Preferred Shares | | | | | (18,500 | ) | | | (351,640 | ) |
Tim Participacoes SA | | | | | (166,300 | ) | | | (871,038 | ) |
| | | | | | | | | (32,998,982 | ) |
Chile | | | | | | | | | | |
Empresa Nacional de Electricidad SA — ADR | | | | | (6,752 | ) | | | (260,492 | ) |
China | | | | | | | | | | |
China COSCO Holdings Co. Ltd., Class H | | | | | (1,367,000 | ) | | | (572,506 | ) |
China Longyuan Power Group Corp., Class H | | | | | (1,927,000 | ) | | | (2,320,682 | ) |
China Shipping Development Co. Ltd., Class H | | | | | (1,826,000 | ) | | | (1,093,112 | ) |
ENN Energy Holdings Ltd. | | | | | (44,000 | ) | | | (284,686 | ) |
Li Ning Co. Ltd. | | | | | (319,500 | ) | | | (255,419 | ) |
Shandong Weigao Group Medical Polymer Co. Ltd., Class H | | | | | (32,000 | ) | | | (37,719 | ) |
SOHO China Ltd. | | | | | (344,500 | ) | | | (273,287 | ) |
Sun Art Retail Group Ltd. | | | | | (51,500 | ) | | | (67,428 | ) |
Tsingtao Brewery Co. Ltd., Class H | | | | | (12,000 | ) | | | (88,016 | ) |
Zhongsheng Group Holdings Ltd. | | | | | (83,000 | ) | | | (122,423 | ) |
| | | | | | | | | (5,115,278 | ) |
Hong Kong | | | | | | | | | | |
Beijing Enterprises Holdings Ltd. | | | | | (14,500 | ) | | | (122,504 | ) |
Brilliance China Automotive Holdings Ltd. | | | | | (18,000 | ) | | | (27,435 | ) |
China Everbright International Ltd. | | | | | (106,000 | ) | | | (139,504 | ) |
China Mengniu Dairy Co. Ltd. | | | | | (28,000 | ) | | | (128,251 | ) |
China Resources Enterprise Ltd. | | | | | (32,000 | ) | | | (94,989 | ) |
China State Construction International Holdings Ltd. | | | | | (186,000 | ) | | | (337,135 | ) |
Digital China Holdings Ltd. | | | | | (184,000 | ) | | | (180,161 | ) |
GCL-Poly Energy Holdings Ltd. | | | | | (3,889,000 | ) | | | (1,317,270 | ) |
Kunlun Energy Co. Ltd. | | | | | (58,000 | ) | | | (95,745 | ) |
Sinopec Kantons Holdings Ltd. | | | | | (290,000 | ) | | | (338,400 | ) |
| | | | | | | | | (2,781,394 | ) |
See Notes to Financial Statements.
| BLACKROCK FUNDS | JANUARY 31, 2014 | 15
|
| |
| Schedule of Investments (continued) | BlackRock Emerging Markets Long/Short Equity Fund |
| | | | | Shares | | Value |
Reference Entity — Short |
Mexico | | | | | | | | | | |
Alpek SA de CV | | | | | (153,484 | ) | | $ | (305,729 | ) |
America Movil SAB de CV, Series L | | | | | (1,559,000 | ) | | | (1,664,612 | ) |
America Movil SAB de CV — ADR, Series L | | | | | (1,990 | ) | | | (42,307 | ) |
Cemex SAB de CV | | | | | (375,900 | ) | | | (464,605 | ) |
Cemex SAB de CV — ADR | | | | | (120,738 | ) | | | (1,493,529 | ) |
Minera Frisco SAB de CV, Series A-1 | | | | | (198,800 | ) | | | (313,347 | ) |
| | | | | | | | | (4,284,129 | ) |
Poland | | | | | | | | | | |
Polski Koncern Naftowy Orlen SA | | | | | (428,226 | ) | | | (5,256,702 | ) |
Polskie Gornictwo Naftowe i Gazownictwo SA | | | | | (158,280 | ) | | | (232,464 | ) |
| | | | | | | | | (5,489,166 | ) |
Republic of Korea | | | | | | | | | | |
Cheil Industries, Inc. | | | | | (3,790 | ) | | | (263,521 | ) |
Daewoo Engineering & Construction Co. Ltd. | | | | | (154,890 | ) | | | (980,624 | ) |
GS Engineering & Construction Corp. | | | | | (3 | ) | | | (93 | ) |
Hyundai Heavy Industries Co. Ltd. | | | | | (108 | ) | | | (22,321 | ) |
Hyundai Mipo Dockyard | | | | | (24,310 | ) | | | (3,899,896 | ) |
Kolon Industries, Inc. | | | | | (6 | ) | | | (281 | ) |
S-Oil Corp. | | | | | (265 | ) | | | (16,828 | ) |
Samsung Electro-Mechanics Co. Ltd. | | | | | (4,435 | ) | | | (273,723 | ) |
Samsung Engineering Co. Ltd. | | | | | (29,921 | ) | | | (1,993,566 | ) |
Samsung Fire & Marine Insurance Co. Ltd. | | | | | (722 | ) | | | (166,664 | ) |
Samsung Heavy Industries Co. Ltd. | | | | | (57,360 | ) | | | (1,779,802 | ) |
Samsung SDI Co. Ltd. | | | | | (28,421 | ) | | | (3,770,952 | ) |
WeMade Entertainment Co. Ltd. | | | | | (2,537 | ) | | | (99,230 | ) |
| | | | | | | | | (13,267,501 | ) |
Russia | | | | | | | | | | |
Federal Grid Co. Unified Energy System JSC | | | | | (266,300,000 | ) | | | (640,127 | ) |
Magnit OJSC | | | | | (2,030 | ) | | | (483,999 | ) |
Magnit OJSC — GDR | | | | | (11,984 | ) | | | (630,906 | ) |
MMC Norilsk Nickel OJSC — ADR | | | | | (1,453 | ) | | | (22,075 | ) |
NovaTek OAO — GDR | | | | | (10,035 | ) | | | (1,224,885 | ) |
Novolipetsk Steel OJSC — GDR | | | | | (106,843 | ) | | | (1,535,923 | ) |
| | | | | | | | | (4,537,915 | ) |
South Africa | | | | | | | | | | |
Discovery Holdings Ltd. | | | | | (23,248 | ) | | | (157,230 | ) |
Exxaro Resources Ltd. | | | | | (79,321 | ) | | | (1,070,794 | ) |
Impala Platinum Holdings Ltd. | | | | | (153,875 | ) | | | (1,607,491 | ) |
Massmart Holdings Ltd. | | | | | (231,904 | ) | | | (2,528,672 | ) |
Nampak Ltd. | | | | | (63,770 | ) | | | (199,906 | ) |
Remgro Ltd. | | | | | (100,700 | ) | | | (1,684,416 | ) |
| | | | | | | | | (7,248,509 | ) |
| | | | | | | | | | | |
| | | | | Shares | | Value |
Reference Entity — Short |
Taiwan | | | | | | | | | | |
Asia Cement Corp. | | | | | (307,000 | ) | | $ | (376,535 | ) |
Chang Hwa Commercial Bank | | | | | (239,000 | ) | | | (141,334 | ) |
Cheng Shin Rubber Industry Co. Ltd. | | | | | (75,000 | ) | | | (190,155 | ) |
Chin-Poon Industrial Co. Ltd. | | | | | (75,000 | ) | | | (124,008 | ) |
China Petrochemical Development Corp. | | | | | (1,021,000 | ) | | | (450,460 | ) |
China Steel Corp. | | | | | (710,000 | ) | | | (609,899 | ) |
Compal Electronics, Inc. | | | | | (1,939,000 | ) | | | (1,441,454 | ) |
Formosa Petrochemical Corp. | | | | | (424,000 | ) | | | (1,069,128 | ) |
Foxconn Technology Co. Ltd. | | | | | (65,150 | ) | | | (146,353 | ) |
Hotai Motor Co. Ltd. | | | | | (67,000 | ) | | | (813,243 | ) |
Innolux Corp. | | | | | (919,000 | ) | | | (318,691 | ) |
MStar Semiconductor, Inc. | | | | | (383,000 | ) | | | (4,196,914 | ) |
Nan Kang Rubber Tire Co. Ltd. | | | | | (933 | ) | | | (1,131 | ) |
Powertech Technology, Inc. | | | | | (75,000 | ) | | | (103,494 | ) |
Standard Foods Corp. | | | | | (41,000 | ) | | | (120,448 | ) |
Transcend Information, Inc. | | | | | (130,000 | ) | | | (387,699 | ) |
TTY Biopharm Co. Ltd. | | | | | (57,000 | ) | | | (168,658 | ) |
Wintek Corp. | | | | | (3,000 | ) | | | (998 | ) |
| | | | | | | | | (10,660,602 | ) |
Thailand | | | | | | | | | | |
Siam Commercial Bank PCL | | | | | (32,400 | ) | | | (146,247 | ) |
Turkey | | | | | | | | | | |
Akbank TAS | | | | | (33,480 | ) | | | (85,649 | ) |
Arcelik AS | | | | | (716,731 | ) | | | (3,541,159 | ) |
Tupras Turkiye Petrol Rafinerileri AS | | | | | (7,928 | ) | | | (130,680 | ) |
Turk Telekomunikasyon AS | | | | | (30,823 | ) | | | (76,632 | ) |
Turkcell Iletisim Hizmetleri AS — ADR | | | | | (115,890 | ) | | | (1,442,830 | ) |
Turkiye Garanti Bankasi AS | | | | | (68,853 | ) | | | (182,292 | ) |
| | | | | | | | | (5,459,242 | ) |
Total Reference Entity — Short | | | | | | | | | (92,572,602 | ) |
Net Value of Reference Entity — Morgan Stanley & Co., Inc. | $ | 41,369,851 | |
See Notes to Financial Statements.
| 16 | BLACKROCK FUNDS | JANUARY 31, 2014
|
| |
| Schedule of Investments (continued) | BlackRock Emerging Markets Long/Short Equity Fund |
The following table represents the individual long and short positions and related values of equity securities underlying the total return swap with UBS AG as of January 31, 2014, expiration dates 2/28/14 — 5/02/18:
| | | | | Shares | | Value |
Reference Entity — Long |
Brazil | | | | | | | | | | |
AES Tiete SA, Preference Shares | | | | | 32,200 | | | $ | 251,916 | |
Bradespar SA, Preference Shares | | | | | 250,800 | | | | 2,317,555 | |
Braskem SA — ADR | | | | | 24,549 | | | | 371,917 | |
Braskem SA, Preference A Shares | | | | | 23,400 | | | | 180,160 | |
Cia Brasileira de Distribuicao Grupo Pao de Acucar — ADR | | | | | 60,124 | | | | 2,300,945 | |
Cia Brasileira de Distribuicao Grupo Pao de Acucar, Preference Shares | | | | | 34,300 | | | | 1,327,513 | |
Cia Energetica de Minas Gerais, Preference Shares | | | | | 23,818 | | | | 137,485 | |
Cia Energetica de Sao Paulo, Preference ‘B’ Shares | | | | | 66,700 | | | | 637,633 | |
Cia Paranaense de Energia — ADR | | | | | 28,387 | | | | 325,315 | |
Cia Paranaense de Energia, Preference B Shares | | | | | 34,300 | | | | 395,553 | |
Cyrela Brazil Realty SA | | | | | 122,400 | | | | 724,281 | |
Klabin SA, Preference Shares | | | | | 124,700 | | | | 637,646 | |
Petroleo Brasileiro SA, Preference Shares | | | | | 371,200 | | | | 2,261,117 | |
Transmissora Alianca de Energia Eletrica SA | | | | | 31,800 | | | | 233,501 | |
Vale SA, Preference Shares — ADR | | | | | 334,421 | | | | 4,106,690 | |
Vale SA, Preference A Shares | | | | | 471,000 | | | | 5,855,175 | |
Valid Solucoes e Servicos de Seguranca em Meios de Pagamento e Identificacao SA | | | | | 24,800 | | | | 309,326 | |
Via Varejo SA | | | | | 49,300 | | | | 471,907 | |
| | | | | | | | | 22,845,635 | |
Chile | | | | | | | | | | |
Companhia Cervecerias Unidas SA | | | | | 179,141 | | | | 1,908,328 | |
Enersis SA | | | | | 5,980,089 | | | | 1,580,242 | |
Enersis SA — ADR | | | | | 24,052 | | | | 319,170 | |
| | | | | | | | | 3,807,740 | |
China | | | | | | | | | | |
Agricultural Bank of China Ltd., Class H | | | | | 855,000 | | | | 373,249 | |
Airtac International Group | | | | | 8,000 | | | | 72,175 | |
Anhui Conch Cement Co. Ltd., Class H | | | | | 258,000 | | | | 995,190 | |
Bank of China Ltd., Class H | | | | | 7,624,000 | | | | 3,217,938 | |
BBMG Corp., Class H | | | | | 1,112,000 | | | | 869,617 | |
China Citic Bank Corp. Ltd., Class H | | | | | 495,000 | | | | 237,437 | |
China Communications Construction Co. Ltd., Class H | | | | | 1,666,000 | | | | 1,212,388 | |
China Construction Bank Corp., Class H | | | | | 896,000 | | | | 620,700 | |
China Lesso Group Holdings Ltd. | | | | | 218,000 | | | | 134,656 | |
China Merchants Bank Co. Ltd., Class H | | | | | 84,528 | | | | 148,889 | |
China Oilfield Services Ltd., Class H | | | | | 2,044,000 | | | | 5,481,656 | |
China Petroleum & Chemical Corp. — ADR | | | | | 16,581 | | | | 1,307,080 | |
China Petroleum & Chemical Corp., Class H | | | | | 1,840,000 | | | | 1,453,404 | |
China Railway Construction Corp., Class H | | | | | 2,156,000 | | | | 1,798,669 | |
China Railway Group Ltd., Class H | | | | | 3,047,000 | | | | 1,354,472 | |
China Shanshui Cement Group Ltd. | | | | | 4,037,000 | | | | 1,325,463 | |
Coolpad Group Ltd. | | | | | 1,184,000 | | | | 637,691 | |
Dongfeng Motor Group Co. Ltd., Class H | | | | | 574,000 | | | | 845,168 | |
Fosun International Ltd. | | | | | 393,500 | | | | 423,074 | |
GOME Electrical Appliances Holding Ltd. | | | | | 18,610,000 | | | | 3,225,514 | |
Greentown China Holdings Ltd. | | | | | 847,000 | | | | 1,207,044 | |
Guangzhou Baiyunshan Pharmaceutical Holdings Co. Ltd. | | | | | 228,000 | | | | 739,943 | |
Guangzhou R&F Properties Co. Ltd., Class H | | | | | 1,106,800 | | | | 1,474,157 | |
Kingboard Chemical Holdings Ltd. | | | | | 81,000 | | | | 181,025 | |
Kingsoft Corp. Ltd. | | | | | 677,000 | | | | 2,209,111 | |
Lenovo Group Ltd. | | | | | 306,000 | | | | 394,647 | |
Lonking Holdings Ltd. | | | | | 647,000 | | | | 129,850 | |
Ping An Insurance Group Co. of China Ltd., Class H | | | | | 260,000 | | | | 2,101,276 | |
Shanghai Industrial Holdings Ltd. | | | | | 206,000 | | | | 686,438 | |
Sinopharm Group Co. Ltd., Class H | | | | | 59,200 | | | | 166,952 | |
| | | | | | | | | | | |
| | | | | Shares | | Value |
Reference Entity — Long |
China (concluded) | | | | | | | | | | |
Tencent Holdings Ltd. | | | | | 247,900 | | | $ | 17,380,238 | |
Tingyi Cayman Islands Holding Corp. | | | | | 154,000 | | | | 398,436 | |
Zhejiang Expressway Co. Ltd., Class H | | | | | 562,000 | | | | 501,597 | |
| | | | | | | | | 53,305,144 | |
Hong Kong | | | | | | | | | | |
China Lumena New Materials Corp. | | | | | 1,486,000 | | | | 263,646 | |
China Resources Cement Holdings Ltd. | | | | | 584,000 | | | | 398,555 | |
COSCO Pacific Ltd. | | | | | 666,000 | | | | 852,178 | |
Geely Automobile Holdings Ltd. | | | | | 3,515,000 | | | | 1,436,433 | |
Guangdong Investment Ltd. | | | | | 72,000 | | | | 66,416 | |
Haier Electronics Group Co. Ltd. | | | | | 39,000 | | | | 113,134 | |
KWG Property Holding Ltd. | | | | | 1,170,000 | | | | 609,778 | |
Nine Dragons Paper Holdings Ltd. | | | | | 74,000 | | | | 63,203 | |
REXLot Holdings Ltd. | | | | | 15,375,000 | | | | 2,399,259 | |
Shenzhen International Holdings Ltd. | | | | | 3,255,000 | | | | 422,667 | |
Shenzhen Investment Ltd. | | | | | 3,644,000 | | | | 1,299,922 | |
| | | | | | | | | 7,925,191 | |
Malaysia | | | | | | | | | | |
Axiata Group Bhd | | | | | 283,100 | | | | 555,025 | |
Berjaya Sports Toto Bhd | | | | | 73 | | | | 88 | |
MISC Bhd | | | | | 147,300 | | | | 264,200 | |
Tenaga Nasional Bhd | | | | | 2,106,800 | | | | 7,427,414 | |
| | | | | | | | | 8,246,727 | |
Mexico | | | | | | | | | | |
Arca Continental SAB de CV | | | | | 311,900 | | | | 1,712,488 | |
Fomento Economico Mexicano SAB de CV — ADR | | | | | 8,534 | | | | 770,108 | |
Grupo Aeroportuario del Pacifico SAB de CV | | | | | 2,289 | | | | 124,041 | |
Grupo Aeroportuario del Pacifico SAB de CV, Series B | | | | | 117,900 | | | | 639,485 | |
Grupo Aeroportuario del Sureste SAB de CV, Series B | | | | | 11,000 | | | | 124,073 | |
Grupo Carso SAB de CV, Series A-1 | | | | | 35,800 | | | | 186,977 | |
Grupo Lala SAB de CV | | | | | 133,000 | | | | 283,423 | |
Infraestructura Energetica Nova SAB de CV | | | | | 111,900 | | | | 481,771 | |
Kimberly-Clark de Mexico SAB de CV, Class A | | | | | 341,884 | | | | 871,710 | |
Promotora y Operadora de Infraestructura SAB de CV | | | | | 89,600 | | | | 1,089,550 | |
| | | | | | | | | 6,283,626 | |
Peru | | | | | | | | | | |
Compania de Minas Buenaventura SA — ADR | | | | | 77,102 | | | | 956,065 | |
Philippines | | | | | | | | | | |
Manila Electric Co. | | | | | 58,980 | | | | 336,390 | |
Philippine Long Distance Telephone Co. | | | | | 27,740 | | | | 1,657,559 | |
Philippine Long Distance Telephone Co. — ADR | | | | | 9,771 | | | | 582,156 | |
Universal Robina Corp. | | | | | 368,020 | | | | 957,935 | |
| | | | | | | | | 3,534,040 | |
Poland | | | | | | | | | | |
PGE SA | | | | | 95,086 | | | | 496,859 | |
Telekomunikacja Polska SA | | | | | 469,077 | | | | 1,562,598 | |
| | | | | | | | | 2,059,457 | |
Republic of Korea | | | | | | | | | | |
Amorepacific Group | | | | | 2,336 | | | | 1,025,380 | |
Coway Co. Ltd. | | | | | 4,025 | | | | 260,832 | |
Daewoo Shipbuilding & Marine Engineering Co. Ltd. | | | | | 53,130 | | | | 1,690,778 | |
Dongbu Insurance Co. Ltd. | | | | | 16,598 | | | | 826,476 | |
Doosan Corp. | | | | | 4,999 | | | | 634,644 | |
Green Cross Corp. | | | | | 771 | | | | 94,124 | |
Hanjin Heavy Industries & Construction Co. Ltd. | | | | | 21,120 | | | | 262,166 | |
Hanjin Kal Corp. | | | | | 1 | | | | 22 | |
Hanwha Corp. | | | | | 82,450 | | | | 2,774,594 | |
See Notes to Financial Statements.
| BLACKROCK FUNDS | JANUARY 31, 2014 | 17
|
| |
| Schedule of Investments (continued) | BlackRock Emerging Markets Long/Short Equity Fund |
| | | | | Shares | | Value |
Reference Entity — Long |
Republic of Korea (concluded) | | | | | | | | | | |
Hyosung Corp. | | | | | 114,973 | | | $ | 7,181,711 | |
Hyundai Engineering & Construction Co. Ltd. | | | | | 69,517 | | | | 3,757,547 | |
Hyundai Mobis | | | | | 14,244 | | | | 4,079,600 | |
i-SENS, Inc. | | | | | 2,327 | | | | 95,356 | |
Jahwa Electronics Co. Ltd. | | | | | 22,430 | | | | 401,053 | |
KCC Corp. | | | | | 3,399 | | | | 1,548,003 | |
Korea Aerospace Industries Ltd. | | | | | 109,920 | | | | 3,250,064 | |
Korea Electric Power Corp. | | | | | 6,970 | | | | 227,277 | |
Korea Petrochemical Ind Co. Ltd. | | | | | 5,224 | | | | 364,144 | |
Korea Zinc Co. Ltd. | | | | | 7,159 | | | | 2,279,275 | |
KT Skylife Co. Ltd. | | | | | 57,920 | | | | 1,498,448 | |
LG Hausys Ltd. | | | | | 964 | | | | 140,038 | |
Lotte Chilsung Beverage Co. Ltd. | | | | | 166 | | | | 251,245 | |
Lotte Food Co. Ltd. | | | | | 330 | | | | 240,761 | |
Maeil Dairy Industry Co. Ltd. | | | | | 1,459 | | | | 57,834 | |
Mirae Asset Securities Co. Ltd. | | | | | 12,500 | | | | 414,206 | |
Partron Co. Ltd. | | | | | 23,719 | | | | 296,026 | |
Poongsan Corp. | | | | | 12,150 | | | | 295,038 | |
S-1 Corp. | | | | | 2,186 | | | | 158,589 | |
Samsung Electronics Co. Ltd. | | | | | 2,331 | | | | 2,760,390 | |
SEOWONINTECH Co. Ltd. | | | | | 31,028 | | | | 396,855 | |
SK C&C Co. Ltd. | | | | | 946 | | | | 109,318 | |
SK Chemicals Co. Ltd. | | | | | 9,480 | | | | 514,748 | |
Sungwoo Hitech Co. Ltd. | | | | | 34,476 | | | | 493,106 | |
| | | | | | | | | 38,379,648 | |
Russia | | | | | | | | | | |
Aeroflot — Russian Airlines OJSC | | | | | 94,200 | | | | 222,618 | |
Lukoil OAO | | | | | 57,203 | | | | 3,239,694 | |
Lukoil OAO — ADR | | | | | 97,002 | | | | 5,507,169 | |
Severstal OAO | | | | | 7,160 | | | | 57,840 | |
Surgutneftegas OAO | | | | | 1,607,000 | | | | 1,234,625 | |
Surgutneftegas OAO — ADR | | | | | 130,404 | | | | 1,001,370 | |
Surgutneftegas OAO, Preference Shares | | | | | 12,669,654 | | | | 9,152,823 | |
| | | | | | | | | 20,416,139 | |
South Africa | | | | | | | | | �� | |
Clicks Group Ltd. | | | | | 32,448 | | | | 166,530 | |
FirstRand Ltd. | | | | | 527,597 | | | | 1,483,619 | |
Imperial Holdings Ltd. | | | | | 188,690 | | | | 3,146,015 | |
Liberty Holdings Ltd. | | | | | 12,553 | | | | 129,368 | |
Life Healthcare Group Holdings Ltd. | | | | | 14,048 | | | | 44,924 | |
MMI Holdings Ltd. | | | | | 259,013 | | | | 550,321 | |
Reunert Ltd. | | | | | 11,049 | | | | 63,511 | |
The Spar Group Ltd. | | | | | 93,709 | | | | 1,011,943 | |
Steinhoff International Holdings Ltd. | | | | | 102,353 | | | | 422,793 | |
Vodacom Group Ltd. | | | | | 192,617 | | | | 2,039,351 | |
Woolworths Holdings Ltd. | | | | | 528,820 | | | | 2,890,049 | |
| | | | | | | | | 11,948,424 | |
Taiwan | | | | | | | | | | |
AU Optronics Corp. | | | | | 286,000 | | | | 83,116 | |
Chimei Materials Technology Corp. | | | | | 2,325,000 | | | | 3,062,133 | |
Compeq Manufacturing Co. Ltd. | | | | | 9,608,000 | | | | 5,341,636 | |
Everlight Electronics Co. Ltd. | | | | | 684,000 | | | | 1,625,949 | |
Far Eastern Department Stores Ltd. | | | | | 640 | | | | 582 | |
Far Eastern New Century Corp. | | | | | 1,638,200 | | | | 1,689,257 | |
Hon Hai Precision Industry Co. Ltd. | | | | | 958,000 | | | | 2,676,256 | |
Hon Hai Precision Industry Co. Ltd.—GDR | | | | | 52,194 | | | | 281,848 | |
Inotera Memories, Inc. | | | | | 6,310,000 | | | | 4,849,960 | |
Inventec Co. Ltd. | | | | | 3,483,000 | | | | 3,213,433 | |
Mega Financial Holding Co. Ltd. | | | | | 329 | | | | 266 | |
Merry Electronics Co. Ltd. | | | | | 69,000 | | | | 396,479 | |
Motech Industries, Inc. | | | | | 790,000 | | | | 1,393,854 | |
Nan Ya Plastics Corp. | | | | | 1,153,000 | | | | 2,512,708 | |
Pou Chen Corp. | | | | | 2,152,000 | | | | 2,974,798 | |
| | | | | | | | | | | |
| | | | | Shares | | Value |
Reference Entity — Long |
Taiwan (concluded) | | | | | | | | | | |
Taiflex Scientific Co. Ltd. | | | | | 276,000 | | | $ | 509,886 | |
Taiwan Cement Corp. | | | | | 3,266,000 | | | | 4,767,753 | |
Taiwan Semiconductor Manufacturing Co. Ltd. — ADR | | | | | 506,019 | | | | 8,561,841 | |
Vanguard International Semiconductor Corp. | | | | | 502,000 | | | | 549,306 | |
| | | | | | | | | 44,491,061 | |
Thailand | | | | | | | | | | |
BEC World PCL | | | | | 659,700 | | | | 934,292 | |
PTT Global Chemical PCL, Foreign Registered Shares | | | | | 2,055,800 | | | | 4,437,315 | |
Siam Cement PCL, Foreign Registered Shares | | | | | 227,500 | | | | 2,773,699 | |
| | | | | | | | | 8,145,306 | |
Turkey | | | | | | | | | | |
BIM Birlesik Magazalar AS | | | | | 2,784 | | | | 47,624 | |
Enka Insaat ve Sanayi AS | | | | | 1,917,761 | | | | 5,470,629 | |
Eregli Demir ve Celik Fabrikalari TAS | | | | | 686,998 | | | | 825,868 | |
Kardemir Karabuk Demir Celik Sanayi ve Ticaret, Class D | | | | | 2,689,725 | | | | 1,156,319 | |
TAV Havalimanlari Holding AS | | | | | 110,612 | | | | 832,131 | |
Tofas Turk Otomobil Fabrikasi A/S | | | | | 10,908 | | | | 51,309 | |
Turk Hava Yollari | | | | | 617,804 | | | | 1,847,002 | |
| | | | | | | | | 10,230,882 | |
United Kingdom | | | | | | | | | | |
British American Tobacco PLC | | | | | 90,948 | | | | 4,362,323 | |
Old Mutual PLC | | | | | 247,856 | | | | 704,236 | |
| | | | | | | | | 5,066,559 | |
Total Reference Entity — Long | | | | | | | | | 247,641,644 | |
|
Reference Entity — Short |
Argentina | | | | | | | | | | |
MercadoLibre, Inc. | | | | | (38,859 | ) | | | (3,749,505 | ) |
Brazil | | | | | | | | | | |
BRF SA — ADR | | | | | (77,635 | ) | | | (1,372,587 | ) |
Gol Linhas Aereas Inteligentes SA — ADR | | | | | (435,338 | ) | | | (1,710,878 | ) |
Telefonica Brasil SA — ADR | | | | | (120,793 | ) | | | (2,295,067 | ) |
| | | | | | | | | (5,378,532 | ) |
Chile | | | | | | | | | | |
Empresa Nacional de Electricidad SA — ADR | | | | | (52,161 | ) | | | (2,012,372 | ) |
Sociedad Quimica y Minera de Chile SA — ADR | | | | | (64,955 | ) | | | (1,618,029 | ) |
| | | | | | | | | (3,630,401 | ) |
China | | | | | | | | | | |
Aluminum Corp. of China Ltd., Class H | | | | | (1,018,000 | ) | | | (362,165 | ) |
China COSCO Holdings Co. Ltd., Class H | | | | | (12,395,500 | ) | | | (5,191,295 | ) |
China Longyuan Power Group Corp., Class H | | | | | (3,454,000 | ) | | | (4,159,645 | ) |
China Medical System Holdings Ltd. | | | | | (500,000 | ) | | | (571,297 | ) |
China Shipping Development Co. Ltd., Class H | | | | | (1,784,000 | ) | | | (1,067,969 | ) |
CNOOC Ltd. | | | | | (571,000 | ) | | | (886,942 | ) |
CNOOC Ltd. — ADR | | | | | (10,622 | ) | | | (1,636,107 | ) |
Dongfang Electric Corp. Ltd., Class H | | | | | (166,400 | ) | | | (230,085 | ) |
ENN Energy Holdings Ltd. | | | | | (186,000 | ) | | | (1,203,446 | ) |
Golden Eagle Retail Group Ltd. | | | | | (46,000 | ) | | | (62,815 | ) |
Li Ning Co. Ltd. | | | | | (4,385,500 | ) | | | (3,505,914 | ) |
PetroChina Co. Ltd. | | | | | (200,000 | ) | | | (192,801 | ) |
Semiconductor Manufacturing International Corp. | | | | | (2,906,000 | ) | | | (294,501 | ) |
Shandong Weigao Group Medical Polymer Co. Ltd., Class H | | | | | (1,608,000 | ) | | | (1,895,369 | ) |
Shui On Land Ltd. | | | | | (19,000 | ) | | | (6,006 | ) |
Sinopec Shanghai Petrochemical Co. Ltd., Class H | | | | | (1,000 | ) | | | (284 | ) |
SOHO China Ltd. | | | | | (826,500 | ) | | | (655,651 | ) |
Sun Art Retail Group Ltd. | | | | | (805,000 | ) | | | (1,053,963 | ) |
See Notes to Financial Statements.
| 18 | BLACKROCK FUNDS | JANUARY 31, 2014
|
| |
| Schedule of Investments (continued) | BlackRock Emerging Markets Long/Short Equity Fund |
| | | | | Shares | | Value |
Reference Entity — Short |
China (concluded) | | | | | | | | | | |
Tsingtao Brewery Co. Ltd., Class H | | | | | (584,000 | ) | | $ | (4,283,445 | ) |
Uni-President China Holdings Ltd. | | | | | (781,000 | ) | | | (706,516 | ) |
Weichai Power Co. Ltd., Class H | | | | | (102,800 | ) | | | (390,635 | ) |
Zijin Mining Group Co. Ltd., Class H | | | | | (1,420,000 | ) | | | (301,633 | ) |
| | | | | | | | | (28,658,484 | ) |
Hong Kong | | | | | | | | | | |
Beijing Enterprises Holdings Ltd. | | | | | (183,000 | ) | | | (1,546,083 | ) |
Beijing Enterprises Water Group Ltd. | | | | | (252,000 | ) | | | (142,296 | ) |
Brilliance China Automotive Holdings Ltd. | | | | | (68,000 | ) | | | (103,645 | ) |
China Everbright International Ltd. | | | | | (350,000 | ) | | | (460,627 | ) |
China Gas Holdings Ltd. | | | | | (92,000 | ) | | | (128,895 | ) |
China Mengniu Dairy Co. Ltd. | | | | | (693,000 | ) | | | (3,174,205 | ) |
China Resources Enterprise Ltd. | | | | | (338,000 | ) | | | (1,003,323 | ) |
China State Construction International Holdings Ltd. | | | | | (1,382,000 | ) | | | (2,504,947 | ) |
Digital China Holdings Ltd. | | | | | (186,000 | ) | | | (182,119 | ) |
GCL-Poly Energy Holdings Ltd. | | | | | (54,147,000 | ) | | | (18,340,502 | ) |
Kunlun Energy Co. Ltd. | | | | | (2,004,000 | ) | | | (3,308,159 | ) |
Sinopec Kantons Holdings Ltd. | | | | | (210,000 | ) | | | (245,048 | ) |
| | | | | | | | | (31,139,849 | ) |
Indonesia | | | | | | | | | | |
XL Axiata Tbk PT | | | | | (11,000 | ) | | | (4,378 | ) |
Malaysia | | | | | | | | | | |
Maxis Bhd | | | | | (4,436,300 | ) | | | (9,226,694 | ) |
Petronas Dagangan BHD | | | | | (154,000 | ) | | | (1,410,370 | ) |
| | | | | | | | | (10,637,064 | ) |
Mexico | | | | | | | | | | |
America Movil SAB de CV — ADR, Series L | | | | | (149,138 | ) | | | (3,170,674 | ) |
Cemex SAB de CV — ADR | | | | | (84,072 | ) | | | (1,039,971 | ) |
Industrias CH SAB de CV, Series B | | | | | (127,300 | ) | | | (763,571 | ) |
Minera Frisco SAB de CV, Series A-1 | | | | | (626,700 | ) | | | (987,800 | ) |
| | | | | | | | | (5,962,016 | ) |
Poland | | | | | | | | | | |
Polski Koncern Naftowy Orlen SA | | | | | (23,156 | ) | | | (284,252 | ) |
Republic of Korea | | | | | | | | | | |
Cheil Industries, Inc. | | | | | (4,657 | ) | | | (323,804 | ) |
CJ CheilJedang Corp. | | | | | (1,201 | ) | | | (295,731 | ) |
CJ Korea Express Co. Ltd. | | | | | (6,240 | ) | | | (618,234 | ) |
Daewoo Engineering & Construction Co. Ltd. | | | | | (280,490 | ) | | | (1,775,811 | ) |
Doosan Heavy Industries & Construction Co. Ltd. | | | | | (39,879 | ) | | | (1,352,602 | ) |
Hite Jinro Co. Ltd. | | | | | (12,020 | ) | | | (239,297 | ) |
Hyundai Mipo Dockyard | | | | | (1,938 | ) | | | (310,901 | ) |
Interflex Co. Ltd. | | | | | (4,509 | ) | | | (85,825 | ) |
LG Household & Health Care Ltd. | | | | | (1,275 | ) | | | (564,541 | ) |
Lock & Lock Co. Ltd. | | | | | (37,380 | ) | | | (766,974 | ) |
Nexen Tire Corp. | | | | | (12,860 | ) | | | (176,075 | ) |
OCI Co. Ltd. | | | | | (36,568 | ) | | | (6,408,925 | ) |
Orion Corp/Republic of Korea | | | | | (1,561 | ) | | | (1,269,524 | ) |
S-Oil Corp. | | | | | (39,347 | ) | | | (2,498,694 | ) |
Samsung Electro-Mechanics Co. Ltd. | | | | | (32,550 | ) | | | (2,008,950 | ) |
Samsung Engineering Co. Ltd. | | | | | (81,449 | ) | | | (5,426,755 | ) |
Samsung Fine Chemicals Co. Ltd. | | | | | (4 | ) | | | (151 | ) |
Samsung Heavy Industries Co. Ltd. | | | | | (25,620 | ) | | | (794,953 | ) |
Samsung SDI Co. Ltd. | | | | | (18,399 | ) | | | (2,441,214 | ) |
WeMade Entertainment Co. Ltd. | | | | | (721 | ) | | | (28,200 | ) |
| | | | | | | | | (27,387,161 | ) |
Russia | | | | | | | | | | |
Magnit OJSC — GDR | | | | | (293,413 | ) | | | (15,446,937 | ) |
MMC Norilsk Nickel OJSC — ADR | | | | | (142,909 | ) | | | (2,171,212 | ) |
NovaTek OAO — GDR | | | | | (51,822 | ) | | | (6,325,460 | ) |
| | | | | | | | | | | |
| | | | | Shares | | Value |
Reference Entity — Short |
Russia (concluded) | | | | | | | | | | |
Novolipetsk Steel OJSC — GDR | | | | | (249,619 | ) | | $ | (3,588,400 | ) |
RusHydro JSC | | | | | (3,000 | ) | | | (47 | ) |
Uralkali OJSC — GDR | | | | | (229,634 | ) | | | (5,566,746 | ) |
VTB Bank OJSC — GDR | | | | | (746,087 | ) | | | (1,890,778 | ) |
| | | | | | | | | (34,989,580 | ) |
South Africa | | | | | | | | | | |
Anglo American Platinum Ltd. | | | | | (11,769 | ) | | | (470,069 | ) |
Assore Ltd. | | | | | (5,015 | ) | | | (181,202 | ) |
Exxaro Resources Ltd. | | | | | (1,476 | ) | | | (19,925 | ) |
The Foschini Group Ltd. | | | | | (113,688 | ) | | | (952,340 | ) |
Kumba Iron Ore Ltd. | | | | | (2,041 | ) | | | (82,958 | ) |
Northam Platinum Ltd. | | | | | (2,610 | ) | | | (9,778 | ) |
| | | | | | | | | (1,716,272 | ) |
Taiwan | | | | | | | | | | |
Acer, Inc. | | | | | (6,132,000 | ) | | | (3,621,709 | ) |
Chicony Electronics Co. Ltd. | | | | | (33,000 | ) | | | (84,226 | ) |
China Motor Corp. | | | | | (550,000 | ) | | | (510,005 | ) |
China Petrochemical Development Corp. | | | | | (2,415,700 | ) | | | (1,065,796 | ) |
China Steel Corp. | | | | | (682,000 | ) | | | (585,846 | ) |
Chipbond Technology Corp. | | | | | (25,000 | ) | | | (38,114 | ) |
Compal Electronics, Inc. | | | | | (198,000 | ) | | | (147,193 | ) |
Evergreen Marine Corp. Taiwan Ltd. | | | | | (1,368,000 | ) | | | (802,388 | ) |
First Financial Holding Co. Ltd. | | | | | (205 | ) | | | (123 | ) |
Foxconn Technology Co. Ltd. | | | | | (2,241,700 | ) | | | (5,035,767 | ) |
G Tech Optoelectronics Corp. | | | | | (843,000 | ) | | | (1,066,316 | ) |
Hotai Motor Co. Ltd. | | | | | (325,000 | ) | | | (3,944,834 | ) |
HTC Corp. | | | | | (737,000 | ) | | | (3,304,948 | ) |
Hua Nan Financial Holdings Co. Ltd. | | | | | (9,450 | ) | | | (5,323 | ) |
Innolux Corp. | | | | | (1,597,000 | ) | | | (553,808 | ) |
Makalot Industrial Co. Ltd. | | | | | (107,000 | ) | | | (523,612 | ) |
MStar Semiconductor, Inc. | | | | | (419,000 | ) | | | (4,591,402 | ) |
Nan Kang Rubber Tire Co. Ltd. | | | | | (433,936 | ) | | | (525,867 | ) |
Radium Life Tech Co. Ltd. | | | | | (367,000 | ) | | | (279,889 | ) |
Standard Foods Corp. | | | | | (24,000 | ) | | | (70,506 | ) |
Taiwan Glass Industry Corp. | | | | | (235,000 | ) | | | (229,739 | ) |
Ton Yi Industrial Corp. | | | | | (1,202,000 | ) | | | (1,185,713 | ) |
Tripod Technology Corp. | | | | | (171,000 | ) | | | (310,234 | ) |
TTY Biopharm Co. Ltd. | | | | | (57,000 | ) | | | (168,658 | ) |
Win Semiconductors Corp. | | | | | (166,000 | ) | | | (146,846 | ) |
Winbond Electronics Corp. | | | | | (2,157,000 | ) | | | (519,900 | ) |
Wintek Corp. | | | | | (11,613,000 | ) | | | (3,862,888 | ) |
Wistron Corp. | | | | | (280,000 | ) | | | (230,919 | ) |
Yang Ming Marine Transport Corp. | | | | | (416,000 | ) | | | (180,780 | ) |
Yulon Motor Co. Ltd. | | | | | (1,231,000 | ) | | | (2,111,110 | ) |
| | | | | | | | | (35,704,459 | ) |
Thailand | | | | | | | | | | |
Banpu PCL | | | | | (2,354,800 | ) | | | (1,890,403 | ) |
Krung Thai Bank PCL | | | | | (138,625 | ) | | | (70,131 | ) |
Minor International PCL | | | | | (2,344,600 | ) | | | (1,477,361 | ) |
Thai Oil PCL | | | | | (1,189,500 | ) | | | (1,900,822 | ) |
| | | | | | | | | (5,338,717 | ) |
Turkey | | | | | | | | | | |
Anadolu Efes Biracilik Ve Malt Sanayii AS | | | | | (4,967 | ) | | | (50,352 | ) |
Arcelik AS | | | | | (63,633 | ) | | | (314,392 | ) |
Turkcell Iletisim Hizmetleri AS | | | | | (1,500,509 | ) | | | (7,412,009 | ) |
Turkcell Iletisim Hizmetleri AS — ADR | | | | | (118,188 | ) | | | (1,471,440 | ) |
| | | | | | | | | (9,248,193 | ) |
Total Reference Entity — Short | | | | | | | | | (203,828,863 | ) |
Net Value of Reference Entity — UBS AG | | | | | | | | $ | 43,812,781 | |
See Notes to Financial Statements.
| BLACKROCK FUNDS | JANUARY 31, 2014 | 19
|
| |
| Schedule of Investments (concluded) | BlackRock Emerging Markets Long/Short Equity Fund |
| • | | | | Fair Value Measurements – Various inputs are used in determining the fair value of investments and derivative financial instruments. These inputs to valuation techniques are categorized into a disclosure hierarchy consisting of three broad levels for financial statement purposes as follows:
|
| | | | | |
| | • | | | | Level 1 – unadjusted price quotations in active markets/exchanges for identical assets or liabilities that the Fund has the ability to access |
| | | | | | |
| | • | | | | Level 2 – other observable inputs (including, but not limited to, quoted prices for similar assets or liabilities in markets that are active, quoted prices for identical or similar assets or liabilities in markets that are not active, inputs other than quoted prices that are observable for the assets or liabilities (such as interest rates, yield curves, volatilities, prepayment speeds, loss severities, credit risks and default rates) or other market-corroborated inputs) |
| | | | | | |
| | • | | | | Level 3 – unobservable inputs based on the best information available in the circumstances, to the extent observable inputs are not available (including the Fund’s own assumptions used in determining the fair value of investments and derivative financial instruments.) |
| | | | | | |
| | | | | The hierarchy gives the highest priority to unadjusted quoted prices in active markets for identical assets or liabilities (Level 1 measurements) and the lowest priority to unobservable inputs (Level 3 measurements). Accordingly, the degree of judgment exercised in determining fair value is greatest for instruments categorized in Level 3. The inputs used to measure fair value may fall into different levels of the fair value hierarchy. In such cases, for disclosure purposes, the fair value hierarchy classification is determined based on the lowest level input that is significant to the fair value measurement in its entirety. |
| | | | | |
| | | | | Changes in valuation techniques may result in transfers into or out of an assigned level within the disclosure hierarchy. In accordance with the Fund’s policy, transfers between different levels of the fair value disclosure hierarchy are deemed to have occurred as of the beginning of the reporting period. The categorization of a value determined for investments and derivative financial instruments is based on the pricing transparency of the investment and derivative financial instruments and is not necessarily an indication of the risks associated with investing in those securities. For information about the Fund’s policy regarding valuation of investments and derivative financial instruments please refer to Note 2 of the Notes to Financial Statements. |
| | | | | |
| | | | | The following table summarizes the Fund’s investments and derivative financial instruments categorized in the disclosure hierarchy as of January 31, 2014: |
| | | | | | Level 1 | | Level 2 | | Level 3 | | Total |
| | Assets:
| | | | | | | | | | | | | | | | | | |
| | Investments:
| | | | | | | | | | | | | | | | | | |
| | Short-Term Securities | | | | $ | 601,727,131 | | | | — | | | | — | | | $ | 601,727,131 | |
| | | | | | | | | | | | | | | | | | | | |
| | | | | | Level 1 | | Level 2 | | Level 3 | | Total |
| | Derivative Financial Instruments1
| | | | | | | | | | | | | | | | | | |
| | Assets:
| | | | | | | | | | | | | | | | | | |
| | Equity contracts | | | | | — | | | $ | 13,607,610 | | | | — | | | $ | 13,607,610 | |
| | 1 | | Derivative financial instruments are swaps, which are valued at the unrealized appreciation/depreciation on the instrument. |
| | The carrying amount for certain of the Fund’s liabilities approximates fair value for financial statement purposes. As of January 31, 2014, cash received as collateral for swaps of $12,368,084 is categorized as Level 2 within the disclosure hierarchy. |
| | |
| | There were no transfers between levels during the six months ended January 31, 2014. |
See Notes to Financial Statements.
| 20 | BLACKROCK FUNDS | JANUARY 31, 2014
|
| |
| Schedule of Investments January 31, 2014 (Unaudited) | BlackRock Global Long/Short Equity Fund
(Percentages shown are based on Net Assets) |
Short-Term Securities
| | | | Shares | | Value |
BlackRock Liquidity Funds, TempFund, Institutional Class, 0.03% (a)(b) | | | | | 624,983,585 | | | $ | 624,983,585 | |
Total Short-Term Securities
(Cost — $624,983,585*) — 93.9% | | | | | | | | | 624,983,585 | |
Other Assets Less Liabilities — 6.1% | | | | | | | | | 40,740,422 | |
Net Assets — 100.0% | | | | | | | | $ | 665,724,007 | |
Notes to Schedule of Investments
| * | | | | Cost for federal income tax purposes. |
| (a) | | | | Investments in issuers considered to be an affiliate of the Fund during the six months ended January 31, 2014, for purposes of Section 2(a)(3) of the Investment Company Act of 1940, as amended, were as follows: |
Affiliate
| | | | Shares Held at
July 31, 2013 | | Net
Activity | | Shares Held at
January 31, 2014 | | Income |
BlackRock Liquidity Funds, TempFund, Institutional Class | | | | | 79,612,430 | | | | 545,371,155 | | | | 624,983,585 | | | $ | 52,497 | |
| (b) | | | | Represents the current yield as of report date. |
| • | | | | Total return swaps outstanding as of January 31, 2014 were as follows:1 |
Reference Entity
| | | | Counterparty | | Expiration
Date(s) | | Notional
Amount | | Unrealized
Appreciation | | Net Value of
Reference
Entities |
Equity Securities Long/Short: | | | | Bank of America N.A. | | 1/21/15 | | $ | 1,700,020 | | | $ | 2,452,044 | 2 | | $ | 3,961,277 | |
| | | | Deutsche Bank AG | | 2/17/14 – 1/07/16 | | $ | (13,727,830 | ) | | | 6,271,369 | 3 | | | (10,003,617 | ) |
| | | | Goldman Sachs & Co. | | 2/18/14 – 8/04/15 | | $ | (1,542,659 | ) | | | 4,680,951 | 4 | | | 4,001,232 | |
| | | | UBS AG | | 3/15/17 | | $ | (10,300,340 | ) | | | 3,496,993 | 5 | | | (7,177,729 | ) |
Total | | | | | | | | | | | | $ | 16,901,357 | | | $ | (9,218,837 | ) |
| 1 | | The Fund receives or pays the total return on the long and short positions underlying the total return swap and pays or receives a specific LIBOR or Federal Funds floating rate, which is denominated in various foreign currencies based on the currencies of the securities underlying the total return swap. |
| 2 | | Amount includes $190,787 of dividends and financing fee due to/from the Fund and/or the counterparty. |
| 3 | | Amount includes $2,547,156 of dividends and financing fee due to/from the Fund and/or the counterparty. |
| 4 | | Amount includes $(862,940) of dividends and financing fee due to/from the Fund and/or the counterparty. |
| 5 | | Amount includes $374,382 of dividends and financing fee due to/from the Fund and/or the counterparty. |
| • | | | | Financial futures contracts outstanding as of January 31, 2014 were as follows: |
Contracts
Purchased | | Issue | | Exchange | | Expiration | | Notional
Value | | Unrealized
Depreciation |
90 | | Nikkei 225 Index | | Chicago Mercantile | | March 2014 | | $13,081,139 | | $ | (468,134 | ) |
322 | | Euro Stoxx 50 Index | | Eurex Mercantile | | March 2014 | | $13,106,608 | | | (209,161 | ) |
122 | | FTSE 100 Index | | Euronext LIFFE | | March 2014 | | $12,952,886 | | | (226,835 | ) |
148 | | S&P 500 E-Mini Index | | Chicago Mercantile | | March 2014 | | $13,146,840 | | | (158,553 | ) |
Total
| | | | | | | | | | $ | (1,062,683 | ) |
| • | | | | Foreign currency exchange contracts outstanding as of January 31, 2014 were as follows: |
| Currency Purchased | | Currency
Sold | | Counterparty | | Settlement
Date | | Unrealized
Appreciation
(Depreciation) |
CHF | | 14,338 | | | USD | | | 15,812 | | | State Street Bank and Trust Co. | | 2/03/14 | | $ | 2 | |
EUR | | 1,311 | | | USD | | | 1,768 | | | State Street Bank and Trust Co. | | 2/03/14 | | | — | |
JPY | | 34,610,195 | | | USD | | | 338,354 | | | State Street Bank and Trust Co. | | 2/03/14 | | | 397 | |
SGD | | 429 | | | USD | | | 336 | | | State Street Bank and Trust Co. | | 2/03/14 | | | — | |
USD | | 258,841 | | | AUD | | | 294,673 | | | BNP Paribas S.A. | | 2/03/14 | | | 958 | |
USD | | 457,293 | | | CAD | | | 510,605 | | | BNP Paribas S.A. | | 2/03/14 | | | (1,162 | ) |
USD | | 813,944 | | | NOK | | | 5,089,674 | | | BNP Paribas S.A. | | 2/03/14 | | | 3,157 | |
USD | | 381,139 | | | SEK | | | 2,484,646 | | | BNP Paribas S.A. | | 2/03/14 | | | 1,885 | |
USD | | 7,971 | | | SGD | | | 10,166 | | | BNP Paribas S.A. | | 2/03/14 | | | 8 | |
USD | | 7,754 | | | CAD | | | 8,629 | | | State Street Bank and Trust Co. | | 2/04/14 | | | 7 | |
Total | | | | | | | | | | | | | | | $ | 5,252 | |
See Notes to Financial Statements.
| BLACKROCK FUNDS | JANUARY 31, 2014 | 21
|
| |
| Schedule of Investments (continued) | BlackRock Global Long/Short Equity Fund |
The following table represents the individual long and short positions and related values of the basket of equity securities underlying the total return swap with Bank of America N.A. as of January 31, 2014, expiration date 1/21/15:
| | | | | Shares | | Value |
Reference Entity — Long |
China | | | | | | | | | | |
SINA Corp. | | | | | 11,968 | | | $ | 780,194 | |
Sohu.com, Inc. | | | | | 3,886 | | | | 282,823 | |
| | | | | | | | | 1,063,017 | |
Cyprus | | | | | | | | | | |
Ocean Rig UDW, Inc. | | | | | 6,345 | | | | 108,753 | |
Israel | | | | | | | | | | |
Caesarstone Sdot-Yam Ltd. | | | | | 5,399 | | | | 244,683 | |
Check Point Software Technologies Ltd. | | | | | 18,682 | | | | 1,222,363 | |
SodaStream International Ltd. | | | | | 16,223 | | | | 593,113 | |
| | | | | | | | | 2,060,159 | |
Netherlands | | | | | | | | | | |
Constellium NV, Class A | | | | | 25,545 | | | | 661,871 | |
LyondellBasell Industries NV, Class A | | | | | 128,212 | | | | 10,097,977 | |
NXP Semiconductor NV | | | | | 102,689 | | | | 4,965,013 | |
| | | | | | | | | 15,724,861 | |
Singapore | | | | | | | | | | |
Flextronics International Ltd. | | | | | 31,862 | | | | 259,676 | |
United States | | | | | | | | | | |
AbbVie, Inc. | | | | | 4,043 | | | | 199,037 | |
Advanced Energy Industries, Inc. | | | | | 1,048 | | | | 28,610 | |
AGCO Corp. | | | | | 12,495 | | | | 666,358 | |
Air Lease Corp. | | | | | 43,638 | | | | 1,373,724 | |
Align Technology, Inc. | | | | | 6,776 | | | | 402,630 | |
Ambarella, Inc. | | | | | 3,071 | | | | 98,364 | |
Amdocs Ltd. | | | | | 6,127 | | | | 265,054 | |
Amerco, Inc. | | | | | 24 | | | | 5,346 | |
AmerisourceBergen Corp. | | | | | 2,010 | | | | 135,112 | |
Amgen, Inc. | | | | | 332 | | | | 39,491 | |
Amsurg Corp. | | | | | 4,394 | | | | 183,450 | |
Artisan Partners Asset Management, Inc. | | | | | 1,217 | | | | 77,182 | |
Aspen Technology, Inc. | | | | | 19,202 | | | | 875,035 | |
Assurant, Inc. | | | | | 23,819 | | | | 1,556,572 | |
Bally Technologies, Inc. | | | | | 4,256 | | | | 312,050 | |
Bankrate, Inc. | | | | | 5,313 | | | | 88,143 | |
Baxter International, Inc. | | | | | 120,552 | | | | 8,233,702 | |
Benchmark Electronics, Inc. | | | | | 1,385 | | | | 31,481 | |
Bill Barrett Corp. | | | | | 1,067 | | | | 29,887 | |
Blucora, Inc. | | | | | 56,694 | | | | 1,451,933 | |
Bonanza Creek Energy, Inc. | | | | | 1,238 | | | | 50,399 | |
Bristow Group, Inc. | | | | | 8,370 | | | | 600,882 | |
Broadridge Financial Solutions, Inc. | | | | | 6,111 | | | | 221,768 | |
Cabot Oil & Gas Corp. | | | | | 64,549 | | | | 2,580,669 | |
CalAmp Corp. | | | | | 14,926 | | | | 440,019 | |
Capital One Financial Corp. | | | | | 8,012 | | | | 565,727 | |
Cardinal Health, Inc. | | | | | 4,880 | | | | 331,938 | |
Carrizo Oil & Gas, Inc. | | | | | 1,182 | | | | 48,580 | |
Celgene Corp. | | | | | 10,416 | | | | 1,582,503 | |
Cheniere Energy, Inc. | | | | | 8,432 | | | | 370,502 | |
Chipotle Mexican Grill, Inc. | | | | | 546 | | | | 301,370 | |
Ciena Corp. | | | | | 2,652 | | | | 61,871 | |
Cimarex Energy Co. | | | | | 2,493 | | | | 244,264 | |
Cisco Systems, Inc. | | | | | 288,170 | | | | 6,313,805 | |
Citigroup, Inc. | | | | | 172,256 | | | | 8,170,102 | |
Citrix Systems, Inc. | | | | | 2,283 | | | | 123,442 | |
CNO Financial Group, Inc. | | | | | 14,975 | | | | 253,677 | |
Constant Contact, Inc. | | | | | 488 | | | | 13,181 | |
The Container Store Group, Inc. | | | | | 1,275 | | | | 46,856 | |
CONVERSANT, Inc. | | | | | 2,727 | | | | 58,631 | |
Cvent, Inc. | | | | | 24 | | | | 917 | |
| | | | | | | | | | | |
| | | | | Shares | | Value |
Reference Entity — Long |
United States (continued) | | | | | | | | | | |
Devon Energy Corp. | | | | | 10,141 | | | $ | 600,550 | |
Diamondback Energy, Inc. | | | | | 510 | | | | 26,510 | |
DIRECTV | | | | | 37,375 | | | | 2,594,946 | |
Discovery Communications, Inc. | | | | | 1,603 | | | | 118,173 | |
Domino’s Pizza, Inc. | | | | | 17,966 | | | | 1,268,579 | |
Dril-Quip, Inc. | | | | | 746 | | | | 75,018 | |
EchoStar Corp., Class A | | | | | 3,146 | | | | 147,956 | |
Electronics for Imaging, Inc. | | | | | 1,254 | | | | 53,132 | |
Endurance International Group Holdings, Inc. | | | | | 921 | | | | 10,573 | |
EnerSys, Inc. | | | | | 704 | | | | 47,914 | |
EOG Resources, Inc. | | | | | 719 | | | | 118,808 | |
EQT Corp. | | | | | 40,790 | | | | 3,785,720 | |
Exelis, Inc. | | | | | 542 | | | | 10,618 | |
Facebook, Inc. | | | | | 29,177 | | | | 1,825,605 | |
Finisar Corp. | | | | | 25,899 | | | | 614,065 | |
Freescale Semiconductor Ltd. | | | | | 2,026 | | | | 36,731 | |
GameStop Corp., Class A | | | | | 13,642 | | | | 478,425 | |
Globe Specialty Metals, Inc. | | | | | 3,913 | | | | 68,399 | |
Gogo, Inc. | | | | | 17,228 | | | | 351,279 | |
IAC/InterActiveCorp | | | | | 13,127 | | | | 919,415 | |
II-VI, Inc. | | | | | 1,655 | | | | 25,272 | |
Ingram Micro, Inc., Class A | | | | | 1,597 | | | | 39,957 | |
Kaiser Aluminum Corp. | | | | | 646 | | | | 45,097 | |
Kodiak Oil & Gas Corp. | | | | | 2,702 | | | | 28,668 | |
LinnCo LLC | | | | | 58,238 | | | | 1,874,681 | |
Manhattan Associates, Inc. | | | | | 32,200 | | | | 1,085,784 | |
Marathon Petroleum Corp. | | | | | 19,254 | | | | 1,676,061 | |
Matador Resources Co. | | | | | 5,444 | | | | 105,831 | |
Maxim Integrated Products, Inc. | | | | | 20,538 | | | | 621,480 | |
MedAssets, Inc. | | | | | 636 | | | | 14,017 | |
Methode Electronics, Inc. | | | | | 876 | | | | 29,486 | |
Microsemi Corp. | | | | | 638 | | | | 14,955 | |
Movado Group, Inc. | | | | | 352 | | | | 13,288 | |
Myriad Genetics, Inc. | | | | | 1,769 | | | | 48,878 | |
The NASDAQ OMX Group, Inc. | | | | | 25,603 | | | | 976,755 | |
Newfield Exploration Co. | | | | | 15,768 | | | | 390,573 | |
NewMarket Corp. | | | | | 125 | | | | 41,858 | |
Northrop Grumman Corp. | | | | | 33,166 | | | | 3,832,331 | |
Nu Skin Enterprises, Inc., Class A | | | | | 26,876 | | | | 2,288,491 | |
Oasis Petroleum, Inc. | | | | | 7,411 | | | | 309,854 | |
OpenTable, Inc. | | | | | 433 | | | | 32,596 | |
Packaging Corp. of America | | | | | 1,050 | | | | 67,830 | |
Parker Drilling Co. | | | | | 4,139 | | | | 30,794 | |
PBF Energy, Inc. | | | | | 559 | | | | 14,495 | |
PDC Energy, Inc. | | | | | 3,548 | | | | 176,903 | |
Plains GP Holdings LP, Class A | | | | | 18,401 | | | | 467,753 | |
Polaris Industries, Inc. | | | | | 721 | | | | 90,269 | |
Polycom, Inc. | | | | | 5,680 | | | | 67,762 | |
Power Integrations, Inc. | | | | | 1,999 | | | | 118,401 | |
Progress Software Corp. | | | | | 2,535 | | | | 61,271 | |
QUALCOMM, Inc. | | | | | 121,223 | | | | 8,997,171 | |
Questcor Pharmaceuticals, Inc. | | | | | 1,334 | | | | 89,391 | |
Quintiles Transnational Holdings, Inc. | | | | | 1,929 | | | | 91,878 | |
Raytheon Co. | | | | | 32,680 | | | | 3,106,888 | |
Regal Entertainment Group, Class A | | | | | 74,775 | | | | 1,458,113 | |
Relypsa, Inc. | | | | | 688 | | | | 22,745 | |
RF Micro Devices, Inc. | | | | | 2,617 | | | | 13,949 | |
Royal Gold, Inc. | | | | | 1,528 | | | | 85,476 | |
RTI International Metals, Inc. | | | | | 3,513 | | | | 109,325 | |
SemGroup Corp., Class A | | | | | 3,242 | | | | 200,226 | |
Skyworks Solutions, Inc. | | | | | 39,073 | | | | 1,181,958 | |
SM Energy Co. | | | | | 20,002 | | | | 1,655,366 | |
Steel Dynamics, Inc. | | | | | 15,302 | | | | 252,483 | |
Stillwater Mining Co. | | | | | 16,345 | | | | 204,966 | |
Synaptics, Inc. | | | | | 9,689 | | | | 565,450 | |
Targa Resources Corp. | | | | | 815 | | | | 73,586 | |
See Notes to Financial Statements.
| 22 | BLACKROCK FUNDS | JANUARY 31, 2014
|
| |
| Schedule of Investments (continued) | BlackRock Global Long/Short Equity Fund |
| | | | | Shares | | Value |
Reference Entity — Long |
United States (concluded) | | | | | | | | | | |
Team Health Holdings, Inc. | | | | | 3,131 | | | $ | 135,134 | |
Tesoro Corp. | | | | | 9,075 | | | | 467,544 | |
Tessera Technologies, Inc. | | | | | 10,328 | | | | 205,011 | |
Third Point Reinsurance Ltd. | | | | | 2,592 | | | | 41,394 | |
Thoratec Corp. | | | | | 2,359 | | | | 82,424 | |
TIBCO Software, Inc. | | | | | 1,335 | | | | 28,422 | |
Tidewater, Inc. | | | | | 287 | | | | 14,881 | |
TripAdvisor, Inc. | | | | | 4,319 | | | | 333,384 | |
Ubiquiti Networks, Inc. | | | | | 60,036 | | | | 2,473,483 | |
United Therapeutics Corp. | | | | | 2,305 | | | | 236,539 | |
US Silica Holdings, Inc. | | | | | 2,117 | | | | 62,706 | |
USANA Health Sciences, Inc. | | | | | 389 | | | | 23,289 | |
Valero Energy Corp. | | | | | 39,755 | | | | 2,031,481 | |
Valmont Industries, Inc. | | | | | 1,711 | | | | 250,456 | |
VCA Antech, Inc. | | | | | 4,690 | | | | 149,799 | |
VeriSign, Inc. | | | | | 20,426 | | | | 1,200,028 | |
Viacom, Inc., Class B | | | | | 35,614 | | | | 2,923,909 | |
Vince Holding Corp. | | | | | 1,260 | | | | 29,434 | |
Vishay Intertechnology, Inc. | | | | | 2,188 | | | | 29,713 | |
Waddell & Reed Financial, Inc., Class A | | | | | 890 | | | | 57,690 | |
Walter Investment Management Corp. | | | | | 2,023 | | | | 62,389 | |
Web.com Group, Inc. | | | | | 8,704 | | | | 294,195 | |
WhiteWave Foods Co., Class A | | | | | 1,258 | | | | 30,456 | |
Whiting Petroleum Corp. | | | | | 13,574 | | | | 792,450 | |
Worthington Industries, Inc. | | | | | 3,515 | | | | 142,498 | |
| | | | | | | | | 96,385,751 | |
Total Reference Entity — Long | | | | | | | | | 115,602,217 | |
|
Reference Entity — Short |
Netherlands | | | | | | | | | | |
Chicago Bridge & Iron Co. NV | | | | | (40,126 | ) | | | (3,009,049 | ) |
Switzerland | | | | | | | | | | |
Tyco International Ltd. | | | | | (13,812 | ) | | | (559,248 | ) |
United States | | | | | | | | | | |
Abercrombie & Fitch Co., Class A | | | | | (15,733 | ) | | | (556,634 | ) |
ABIOMED, Inc. | | | | | (4,572 | ) | | | (125,684 | ) |
Acadia Realty Trust | | | | | (9,871 | ) | | | (251,217 | ) |
Acuity Brands, Inc. | | | | | (20,479 | ) | | | (2,601,652 | ) |
The Advisory Board Co. | | | | | (12 | ) | | | (760 | ) |
Alexander & Baldwin, Inc. | | | | | (361 | ) | | | (14,119 | ) |
Allegheny Technologies, Inc. | | | | | (132,116 | ) | | | (4,153,727 | ) |
Allegiant Travel Co. | | | | | (862 | ) | | | (78,502 | ) |
Alnylam Pharmaceuticals, Inc. | | | | | (13,644 | ) | | | (1,141,457 | ) |
Alpha Natural Resources, Inc. | | | | | (12,742 | ) | | | (72,375 | ) |
American Capital Agency Corp. | | | | | (99,864 | ) | | | (2,092,151 | ) |
American Realty Capital Properties, Inc. | | | | | (114,712 | ) | | | (1,587,614 | ) |
Annaly Capital Management, Inc. | | | | | (10,125 | ) | | | (109,046 | ) |
Apartment Investment & Management Co. | | | | | (3,386 | ) | | | (94,706 | ) |
Apollo Education Group, Inc. | | | | | (732 | ) | | | (23,636 | ) |
Applied Materials, Inc. | | | | | (125,294 | ) | | | (2,107,445 | ) |
Arch Capital Group Ltd. | | | | | (860 | ) | | | (46,277 | ) |
Avalonbay Communities, Inc. | | | | | (2,180 | ) | | | (269,230 | ) |
Avon Products, Inc. | | | | | (11,585 | ) | | | (172,501 | ) |
B&G Foods, Inc. | | | | | (9,491 | ) | | | (311,020 | ) |
BancorpSouth, Inc. | | | | | (16,112 | ) | | | (379,760 | ) |
Bank of Hawaii Corp. | | | | | (9,335 | ) | | | (530,041 | ) |
Beacon Roofing Supply, Inc. | | | | | (2,043 | ) | | | (77,205 | ) |
Beam, Inc. | | | | | (42 | ) | | | (3,499 | ) |
Bemis Co., Inc. | | | | | (36,119 | ) | | | (1,390,943 | ) |
BioMarin Pharmaceutical, Inc. | | | | | (26,241 | ) | | | (1,807,480 | ) |
Brixmor Property Group, Inc. | | | | | (829 | ) | | | (17,144 | ) |
Brookdale Senior Living, Inc. | | | | | (1,470 | ) | | | (40,366 | ) |
Cabela’s, Inc. | | | | | (15,854 | ) | | | (1,059,998 | ) |
| | | | | | | | | | | |
| | | | | Shares | | Value |
Reference Entity — Short |
United States (continued) | | | | | | | | | | |
Campbell Soup Co. | | | | | (37,615 | ) | | $ | (1,550,114 | ) |
CarMax, Inc. | | | | | (15,250 | ) | | | (687,928 | ) |
Cepheid, Inc. | | | | | (2,254 | ) | | | (119,146 | ) |
Chemtura Corp. | | | | | (19,015 | ) | | | (476,896 | ) |
Chico’s FAS, Inc. | | | | | (928 | ) | | | (15,405 | ) |
Clean Harbors, Inc. | | | | | (404 | ) | | | (22,656 | ) |
Copart, Inc. | | | | | (497 | ) | | | (17,037 | ) |
CoreLogic, Inc. | | | | | (5,757 | ) | | | (183,360 | ) |
The Corporate Executive Board Co. | | | | | (1,299 | ) | | | (94,957 | ) |
Corporate Office Properties Trust | | | | | (7,794 | ) | | | (193,681 | ) |
Coty, Inc., Class A | | | | | (3,541 | ) | | | (47,768 | ) |
CubeSmart | | | | | (40,916 | ) | | | (674,296 | ) |
Cypress Semiconductor Corp. | | | | | (8,820 | ) | | | (88,553 | ) |
Darden Restaurants, Inc. | | | | | (4,911 | ) | | | (242,800 | ) |
DDR Corp. | | | | | (12,188 | ) | | | (190,986 | ) |
DeVry, Inc. | | | | | (880 | ) | | | (31,803 | ) |
Dominion Resources, Inc. | | | | | (20,614 | ) | | | (1,399,897 | ) |
Douglas Emmett, Inc. | | | | | (2,133 | ) | | | (54,242 | ) |
Dynegy, Inc. | | | | | (3,627 | ) | | | (73,846 | ) |
Eagle Materials, Inc. | | | | | (1,419 | ) | | | (111,746 | ) |
Eaton Vance Corp. | | | | | (17,710 | ) | | | (674,220 | ) |
Elizabeth Arden, Inc. | | | | | (1,736 | ) | | | (47,080 | ) |
Equity Residential | | | | | (17,372 | ) | | | (962,061 | ) |
EXCO Resources, Inc. | | | | | (4,005 | ) | | | (20,546 | ) |
Extra Space Storage, Inc. | | | | | (559 | ) | | | (25,524 | ) |
Family Dollar Stores, Inc. | | | | | (1,095 | ) | | | (67,693 | ) |
Federal Realty Investment Trust | | | | | (1,589 | ) | | | (173,201 | ) |
Fifth & Pacific Cos., Inc. | | | | | (9,530 | ) | | | (273,511 | ) |
First Horizon National Corp. | | | | | (17,767 | ) | | | (208,940 | ) |
Five Below, Inc. | | | | | (1,640 | ) | | | (60,106 | ) |
Flotek Industries, Inc. | | | | | (4,389 | ) | | | (94,407 | ) |
Forest City Enterprises, Inc., Class A | | | | | (52,482 | ) | | | (954,648 | ) |
Fusion-io, Inc. | | | | | (6,551 | ) | | | (72,061 | ) |
General Growth Properties, Inc. | | | | | (3,041 | ) | | | (61,246 | ) |
Genesco, Inc. | | | | | (3,937 | ) | | | (276,456 | ) |
Granite Construction, Inc. | | | | | (11,190 | ) | | | (372,515 | ) |
Guidewire Software, Inc. | | | | | (1,897 | ) | | | (89,557 | ) |
Hancock Holding Co. | | | | | (15,599 | ) | | | (539,725 | ) |
Health Care REIT, Inc. | | | | | (2,592 | ) | | | (150,129 | ) |
Healthcare Realty Trust, Inc. | | | | | (2,028 | ) | | | (46,482 | ) |
Hill-Rom Holdings, Inc. | | | | | (56,346 | ) | | | (2,043,669 | ) |
Hillenbrand, Inc. | | | | | (911 | ) | | | (24,661 | ) |
HMS Holdings Corp. | | | | | (10,332 | ) | | | (237,946 | ) |
HNI Corp. | | | | | (520 | ) | | | (17,841 | ) |
Hudson City Bancorp, Inc. | | | | | (169,050 | ) | | | (1,528,212 | ) |
Ingredion, Inc. | | | | | (6,603 | ) | | | (411,367 | ) |
Integra LifeSciences Holdings Corp. | | | | | (8,781 | ) | | | (407,965 | ) |
Ironwood Pharmaceuticals, Inc. | | | | | (12,071 | ) | | | (167,425 | ) |
Joy Global, Inc. | | | | | (47,657 | ) | | | (2,515,813 | ) |
KB Home | | | | | (5,349 | ) | | | (103,450 | ) |
Kellogg Co. | | | | | (54,199 | ) | | | (3,142,458 | ) |
Kennametal, Inc. | | | | | (4,612 | ) | | | (199,884 | ) |
Kilroy Realty Corp. | | | | | (9,288 | ) | | | (490,406 | ) |
KYTHERA Biopharmaceuticals, Inc. | | | | | (533 | ) | | | (24,518 | ) |
L Brands, Inc. | | | | | (34,756 | ) | | | (1,819,824 | ) |
Level 3 Communications, Inc. | | | | | (85,928 | ) | | | (2,758,289 | ) |
Louisiana-Pacific Corp. | | | | | (1,981 | ) | | | (34,727 | ) |
LSI Corp. | | | | | (156 | ) | | | (1,721 | ) |
The Macerich Co. | | | | | (2,937 | ) | | | (166,234 | ) |
Manitowoc Co., Inc. | | | | | (5,139 | ) | | | (146,205 | ) |
Marsh & McLennan Cos., Inc. | | | | | (58,636 | ) | | | (2,680,252 | ) |
Mattress Firm Holding Corp. | | | | | (4,457 | ) | | | (181,400 | ) |
McDermott International, Inc. | | | | | (49,478 | ) | | | (412,647 | ) |
McGraw Hill Financial, Inc. | | | | | (5,715 | ) | | | (434,569 | ) |
MGM Resorts International | | | | | (88,723 | ) | | | (2,161,292 | ) |
Mobile Mini, Inc. | | | | | (14,316 | ) | | | (553,600 | ) |
See Notes to Financial Statements.
| BLACKROCK FUNDS | JANUARY 31, 2014 | 23
|
| |
| Schedule of Investments (continued) | BlackRock Global Long/Short Equity Fund |
| | | | | Shares | | Value |
Reference Entity — Short |
United States (concluded) | | | | | | | | | | |
Monro Muffler Brake, Inc. | | | | | (2,747 | ) | | $ | (152,486 | ) |
National Fuel Gas Co. | | | | | (5,178 | ) | | | (390,214 | ) |
Navistar International Corp. | | | | | (36,979 | ) | | | (1,139,693 | ) |
NetSuite, Inc. | | | | | (4,251 | ) | | | (447,120 | ) |
The New York Times Co. | | | | | (1,073 | ) | | | (15,172 | ) |
Nordstrom, Inc. | | | | | (1,181 | ) | | | (67,848 | ) |
NorthStar Realty Finance Corp. | | | | | (121,359 | ) | | | (1,770,628 | ) |
Omega Healthcare Investors, Inc. | | | | | (1,179 | ) | | | (37,657 | ) |
Omnicom Group, Inc. | | | | | (74 | ) | | | (5,371 | ) |
ONEOK, Inc. | | | | | (93,874 | ) | | | (6,429,430 | ) |
Parkway Properties, Inc. | | | | | (21,422 | ) | | | (380,026 | ) |
Pebblebrook Hotel Trust | | | | | (21,855 | ) | | | (658,491 | ) |
Pennsylvania Real Estate Investment Trust | | | | | (1,928 | ) | | | (35,957 | ) |
PG&E Corp. | | | | | (20,864 | ) | | | (879,418 | ) |
Pitney Bowes, Inc. | | | | | (5,605 | ) | | | (141,134 | ) |
Plum Creek Timber Co., Inc. | | | | | (2,550 | ) | | | (109,829 | ) |
Pool Corp. | | | | | (1,546 | ) | | | (83,762 | ) |
Post Holdings, Inc. | | | | | (1,063 | ) | | | (56,902 | ) |
Public Storage | | | | | (2,128 | ) | | | (335,352 | ) |
PVH Corp. | | | | | (34,158 | ) | | | (4,128,677 | ) |
Questar Corp. | | | | | (4,571 | ) | | | (106,596 | ) |
Riverbed Technology, Inc. | | | | | (10,281 | ) | | | (202,741 | ) |
Rockwell Collins, Inc. | | | | | (64,684 | ) | | | (4,887,523 | ) |
Sally Beauty Holdings, Inc. | | | | | (4,830 | ) | | | (137,075 | ) |
Scientific Games Corp. | | | | | (7,911 | ) | | | (111,387 | ) |
Sempra Energy | | | | | (39,251 | ) | | | (3,638,960 | ) |
ServiceNow, Inc. | | | | | (30,903 | ) | | | (1,960,177 | ) |
The Sherwin-Williams Co. | | | | | (8,846 | ) | | | (1,621,118 | ) |
Silgan Holdings, Inc. | | | | | (658 | ) | | | (30,156 | ) |
Simon Property Group, Inc. | | | | | (4,242 | ) | | | (656,831 | ) |
SolarCity Corp. | | | | | (17,874 | ) | | | (1,324,285 | ) |
The Southern Co. | | | | | (3,186 | ) | | | (131,391 | ) |
Sprint Corp. | | | | | (247,421 | ) | | | (2,046,172 | ) |
Sprouts Farmers Market, Inc. | | | | | (4,388 | ) | | | (156,827 | ) |
SPX Corp. | | | | | (8,082 | ) | | | (804,725 | ) |
Starwood Property Trust, Inc. | | | | | (64,805 | ) | | | (1,957,111 | ) |
SunEdison, Inc. | | | | | (6,806 | ) | | | (94,671 | ) |
Synageva BioPharma Corp. | | | | | (434 | ) | | | (39,312 | ) |
Sysco Corp. | | | | | (61,536 | ) | | | (2,158,683 | ) |
Tanger Factory Outlet Centers | | | | | (4,219 | ) | | | (140,830 | ) |
Target Corp. | | | | | (14,307 | ) | | | (810,348 | ) |
Taubman Centers, Inc. | | | | | (13,949 | ) | | | (906,964 | ) |
TCF Financial Corp. | | | | | (16,996 | ) | | | (273,636 | ) |
Tempur Sealy International, Inc. | | | | | (39,600 | ) | | | (1,951,884 | ) |
TESARO, Inc. | | | | | (378 | ) | | | (11,911 | ) |
Textron, Inc. | | | | | (64,173 | ) | | | (2,278,142 | ) |
Two Harbors Investment Corp. | | | | | (2,660 | ) | | | (26,148 | ) |
UDR, Inc. | | | | | (15,179 | ) | | | (369,457 | ) |
Ulta Salon Cosmetics & Fragrance, Inc. | | | | | (347 | ) | | | (29,741 | ) |
United Continental Holdings, Inc. | | | | | (8,512 | ) | | | (390,190 | ) |
UTi Worldwide, Inc. | | | | | (7,306 | ) | | | (114,412 | ) |
Veeco Instruments, Inc. | | | | | (6,036 | ) | | | (229,428 | ) |
Visteon Corp. | | | | | (1,765 | ) | | | (142,983 | ) |
Vornado Realty Trust | | | | | (21,882 | ) | | | (2,009,424 | ) |
Vulcan Materials Co. | | | | | (2,704 | ) | | | (166,918 | ) |
Washington Real Estate Investment Trust | | | | | (848 | ) | | | (19,758 | ) |
Webster Financial Corp. | | | | | (10,620 | ) | | | (322,211 | ) |
Weyerhaeuser Co. | | | | | (57,464 | ) | | | (1,717,024 | ) |
Williams-Sonoma, Inc. | | | | | (7,349 | ) | | | (400,668 | ) |
Wright Medical Group, Inc. | | | | | (15,942 | ) | | | (484,796 | ) |
Wynn Resorts Ltd. | | | | | (3,239 | ) | | | (704,223 | ) |
Zynga, Inc., Class A | | | | | (2,466 | ) | | | (10,850 | ) |
| | | | | | | | | (108,072,643 | ) |
Total Reference Entity — Short | | | | | | | | | (111,640,940 | ) |
Net Value of Reference Entity — Bank of America N.A. | $ | 3,961,277 | |
The following table represents the individual long and short positions and related values of the basket of equity securities underlying the total return swap with Deutsche Bank AG as of January 31, 2014, expiration dates 2/17/14 — 1/07/16:
| | | | | Shares | | Value |
Reference Entity — Long |
Australia | | | | | | | | | | |
Amcor Ltd. | | | | | 148,866 | | | $ | 1,396,409 | |
Aristocrat Leisure Ltd. | | | | | 126,606 | | | | 504,204 | |
Arrium Ltd. | | | | | 80,782 | | | | 109,825 | |
Atlas Iron Ltd. | | | | | 25,030 | | | | 21,952 | |
BlueScope Steel Ltd. | | | | | 46,719 | | | | 220,702 | |
Caltex Australia Ltd. | | | | | 18,891 | | | | 319,869 | |
carsales.com Ltd. | | | | | 43,474 | | | | 343,058 | |
Crown Resorts Ltd. | | | | | 38,283 | | | | 558,732 | |
CSL Ltd. | | | | | 18,916 | | | | 1,164,316 | |
DuluxGroup Ltd. | | | | | 19,853 | | | | 92,997 | |
Fortescue Metals Group Ltd. | | | | | 761,240 | | | | 3,530,975 | |
Goodman Group | | | | | 86,319 | | | | 352,704 | |
IOOF Holdings Ltd. | | | | | 6,388 | | | | 49,229 | |
Oil Search Ltd. | | | | | 29,659 | | | | 208,375 | |
Platinum Asset Management Ltd. | | | | | 40,360 | | | | 240,118 | |
Primary Health Care Ltd. | | | | | 216,247 | | | | 939,351 | |
REA Group Ltd. | | | | | 7,582 | | | | 269,466 | |
Regis Resources Ltd. | | | | | 22,429 | | | | 51,918 | |
| | | | | | | | | 10,374,200 | |
Austria | | | | | | | | | | |
Voestalpine AG | | | | | 8,861 | | | | 396,599 | |
Belgium | | | | | | | | | | |
bpost SA | | | | | 43,171 | | | | 841,347 | |
Canada | | | | | | | | | | |
Africa Oil Corp. | | | | | 15,446 | | | | 112,696 | |
Aimia, Inc. | | | | | 1,380 | | | | 23,939 | |
Air Canada, Class B | | | | | 13,868 | | | | 97,247 | |
Alamos Gold, Inc. | | | | | 2,491 | | | | 22,858 | |
Atco Ltd., Class I | | | | | 499 | | | | 22,339 | |
Barrick Gold Corp. | | | | | 59,862 | | | | 1,153,435 | |
Baytex Energy Corp. | | | | | 7,896 | | | | 288,262 | |
Calfrac Well Services Ltd. | | | | | 3,386 | | | | 90,658 | |
Canadian Natural Resources Ltd. | | | | | 45,113 | | | | 1,479,261 | |
CCL Industries, Inc., Class B | | | | | 3,790 | | | | 273,425 | |
Constellation Software, Inc. | | | | | 289 | | | | 62,102 | |
Dominion Diamond Corp. | | | | | 14,878 | | | | 216,674 | |
Franco-Nevada Corp. | | | | | 13,925 | | | | 675,777 | |
Gibson Energy, Inc. | | | | | 13,913 | | | | 338,284 | |
Goldcorp, Inc. | | | | | 12,829 | | | | 320,106 | |
Gran Tierra Energy, Inc. | | | | | 8,684 | | | | 65,573 | |
Inter Pipeline Ltd. | | | | | 1,074 | | | | 26,711 | |
Linamar Corp. | | | | | 1,699 | | | | 65,260 | |
Magna International, Inc. | | | | | 30,062 | | | | 2,553,414 | |
MEG Energy Corp. | | | | | 6,252 | | | | 173,288 | |
Methanex Corp. | | | | | 16,250 | | | | 971,863 | |
Onex Corp. | | | | | 3,159 | | | | 162,807 | |
Open Text Corp. | | | | | 14,793 | | | | 1,465,819 | |
Pan American Silver Corp. | | | | | 4,816 | | | | 60,624 | |
Parkland Fuel Corp. | | | | | 5,129 | | | | 82,801 | |
Peyto Exploration & Development Corp. | | | | | 14,400 | | | | 422,012 | |
Power Corp. of Canada | | | | | 17,916 | | | | 486,607 | |
Quebecor, Inc., Class B | | | | | 26,586 | | | | 566,213 | |
Raging River Exploration, Inc. | | | | | 13,303 | | | | 83,013 | |
Rogers Communications, Inc., Class B | | | | | 9,916 | | | | 417,118 | |
Secure Energy Services, Inc. | | | | | 4,942 | | | | 71,972 | |
Silver Wheaton Corp. | | | | | 37,324 | | | | 810,656 | |
Stantec, Inc. | | | | | 2,328 | | | | 141,676 | |
Sun Life Financial, Inc. | | | | | 9,349 | | | | 308,318 | |
Suncor Energy, Inc. | | | | | 13,131 | | | | 431,392 | |
Teck Resources Ltd., Class B | | | | | 12,049 | | | | 289,933 | |
See Notes to Financial Statements.
| 24 | BLACKROCK FUNDS | JANUARY 31, 2014
|
| |
| Schedule of Investments (continued) | BlackRock Global Long/Short Equity Fund |
| | | | | Shares | | Value |
Reference Entity — Long |
Canada (concluded) | | | | | | | | | | |
TELUS Corp. | | | | | 16,679 | | | $ | 582,998 | |
Thomson Reuters Corp. | | | | | 14,852 | | | | 535,806 | |
Tourmaline Oil Corp. | | | | | 9,328 | | | | 394,393 | |
Vermilion Energy, Inc. | | | | | 10,180 | | | | 560,483 | |
West Fraser Timber Co. Ltd. | | | | | 2,314 | | | | 118,822 | |
Westjet Airlines Ltd. | | | | | 4,430 | | | | 100,036 | |
Whitecap Resources, Inc. | | | | | 6,229 | | | | 66,051 | |
| | | | | | | | | 17,192,722 | |
China | | | | | | | | | | |
AAC Technologies Holdings, Inc. | | | | | 4,500 | | | | 19,280 | |
Anta Sports Products Ltd. | | | | | 58,000 | | | | 84,689 | |
BBMG Corp., Class H | | | | | 35,000 | | | | 27,371 | |
China Communications Construction Co. Ltd., Class H | | | | | 15,000 | | | | 10,916 | |
China Communications Services Corp. Ltd., Class H | | | | | 42,000 | | | | 22,641 | |
China Longyuan Power Group Corp., Class H | | | | | 14,000 | | | | 16,860 | |
China Oilfield Services Ltd., Class H | | | | | 8,000 | | | | 21,455 | |
China Pacific Insurance Group Co. Ltd., Class H | | | | | 58,800 | | | | 213,520 | |
China Petroleum & Chemical Corp., Class H | | | | | 3,714,000 | | | | 2,933,664 | |
China Railway Construction Corp. | | | | | 282,000 | | | | 235,262 | |
China Telecom Corp. Ltd., Class H | | | | | 1,006,000 | | | | 462,207 | |
CNOOC Ltd. | | | | | 1,395,000 | | | | 2,166,872 | |
Country Garden Holdings Co. Ltd. | | | | | 457,000 | | | | 248,534 | |
CSR Corp. Ltd., Class H | | | | | 65,000 | | | | 47,282 | |
Datang International Power Generation Co. Ltd., Class H | | | | | 616,000 | | | | 245,042 | |
Great Wall Motor Co. Ltd., Class H | | | | | 7,500 | | | | 35,296 | |
Greentown China Holdings Ltd. | | | | | 63,500 | | | | 90,493 | |
Guangzhou Baiyunshan Pharmaceutical Holdings Co. Ltd. | | | | | 10,000 | | | | 32,454 | |
Guangzhou R&F Properties Co. Ltd., Class H | | | | | 87,200 | | | | 116,142 | |
Hilong Holding Ltd. | | | | | 56,000 | | | | 42,708 | |
Huaneng Power International, Inc., Class H | | | | | 58,000 | | | | 54,152 | |
Jiangsu Expressway Co. Ltd., Class H | | | | | 20,000 | | | | 25,109 | |
Jiangxi Copper Co. Ltd., Class H | | | | | 159,000 | | | | 286,185 | |
Kingsoft Corp. Ltd. | | | | | 8,000 | | | | 26,105 | |
People’s Insurance Co. Group of China Ltd., Class H | | | | | 32,000 | | | | 13,851 | |
PetroChina Co. Ltd., Class H | | | | | 358,000 | | | | 345,114 | |
PICC Property & Casualty Co. Ltd., Class H | | | | | 38,000 | | | | 51,333 | |
Shunfeng Photovoltaic International Ltd. | | | | | 18,000 | | | | 14,171 | |
Sihuan Pharmaceutical Holdings Group Ltd. | | | | | 168,000 | | | | 179,897 | |
Sinopec Engineering Group Co. Ltd. | | | | | 98,500 | | | | 127,017 | |
Sinopec Shanghai Petrochemical Co. Ltd., Class H | | | | | 948,000 | | | | 269,671 | |
Sunac China Holdings Ltd. | | | | | 25,000 | | | | 15,012 | |
Tencent Holdings Ltd. | | | | | 145,700 | | | | 10,215,009 | |
Tingyi Cayman Islands Holding Corp. | | | | | 18,000 | | | | 46,570 | |
Want Want China Holdings Ltd. | | | | | 53,000 | | | | 71,635 | |
| | | | | | | | | 18,813,519 | |
Colombia | | | | | | | | | | |
Pacific Rubiales Energy Corp. | | | | | 47,967 | | | | 729,142 | |
Denmark | | | | | | | | | | |
Coloplast A/S, Class B | | | | | 840 | | | | 63,101 | |
D/S Norden A/S | | | | | 4,934 | | | | 230,549 | |
Genmab A/S | | | | | 2,685 | | | | 106,904 | |
GN Store Nord A/S | | | | | 5,037 | | | | 119,620 | |
H Lundbeck A/S | | | | | 713 | | | | 17,680 | |
Pandora A/S | | | | | 8,147 | | | | 467,423 | |
Vestas Wind Systems A/S | | | | | 29,724 | | | | 983,763 | |
| | | | | | | | | 1,989,040 | |
Finland | | | | | | | | | | |
Kesko OYJ, Class B | | | | | 2,591 | | | | 95,486 | |
Neste Oil OYJ | | | | | 235,084 | | | | 4,196,338 | |
| | | | | | | | | 4,291,824 | |
| | | | | | | | | | | |
| | | | | Shares | | Value |
Reference Entity — Long |
France | | | | | | | | | | |
Metropole Television SA | | | | | 15,429 | | | $ | 334,714 | |
Technicolor SA, Registered Shares | | | | | 18,682 | | | | 92,531 | |
| | | | | | | | | 427,245 | |
Germany | | | | | | | | | | |
Deutsche Telekom AG, Registered Shares | | | | | 63,078 | | | | 1,019,917 | |
Deutz AG | | | | | 1,889 | | | | 18,746 | |
Dialog Semiconductor PLC | | | | | 13,093 | | | | 253,941 | |
Drillisch AG | | | | | 792 | | | | 24,292 | |
Freenet AG | | | | | 61,661 | | | | 1,880,043 | |
Infineon Technologies AG | | | | | 2,360 | | | | 24,249 | |
Morphosys AG | | | | | 2,158 | | | | 188,677 | |
Nordex SE | | | | | 24,018 | | | | 318,316 | |
ProSiebenSat.1 Media AG, Registered Shares | | | | | 30,029 | | | | 1,345,199 | |
Telefonica Deutschland Holding AG | | | | | 66,047 | | | | 526,185 | |
TUI AG | | | | | 21,747 | | | | 370,151 | |
United Internet AG, Registered Shares | | | | | 34,144 | | | | 1,491,282 | |
Wincor Nixdorf AG | | | | | 910 | | | | 64,644 | |
Wirecard AG | | | | | 1,047 | | | | 45,761 | |
| | | | | | | | | 7,571,403 | |
Hong Kong | | | | | | | | | | |
China Overseas Land & Investment Ltd. | | | | | 124,000 | | | | 332,859 | |
China Resources Land Ltd. | | | | | 30,000 | | | | 70,464 | |
China Resources Power Holdings Co. Ltd. | | | | | 22,000 | | | | 52,305 | |
China Unicom Hong Kong Ltd. | | | | | 314,000 | | | | 409,426 | |
COSCO Pacific Ltd. | | | | | 26,000 | | | | 33,268 | |
Galaxy Entertainment Group Ltd. | | | | | 565,000 | | | | 5,522,639 | |
Geely Automobile Holdings Ltd. | | | | | 740,000 | | | | 302,407 | |
Haier Electronics Group Co. Ltd. | | | | | 59,000 | | | | 171,151 | |
HKT Trust/HKT Ltd. | | | | | 18,000 | | | | 17,230 | |
Huabao International Holdings Ltd. | | | | | 79,000 | | | | 40,002 | |
Jardine Strategic Holdings Ltd. | | | | | 1,000 | | | | 32,457 | |
Kerry Properties Ltd. | | | | | 5,500 | | | | 17,640 | |
Kunlun Energy Co. Ltd. | | | | | 92,000 | | | | 151,872 | |
MGM China Holdings Ltd. | | | | | 40,800 | | | | 159,912 | |
New World Development Co. Ltd. | | | | | 74,000 | | | | 92,542 | |
Poly Property Group Co. Ltd. | | | | | 41,000 | | | | 19,488 | |
Sands China Ltd. | | | | | 734,800 | | | | 5,642,714 | |
Sino Biopharmaceutical Ltd. | | | | | 192,000 | | | | 162,315 | |
Techtronic Industries Co. | | | | | 36,000 | | | | 92,471 | |
Truly International Holdings | | | | | 296,000 | | | | 162,638 | |
Wharf Holdings Ltd. | | | | | 6,000 | | | | 40,845 | |
Wynn Macau Ltd. | | | | | 140,000 | | | | 594,612 | |
Xinyi Glass Holdings Ltd. | | | | | 564,000 | | | | 456,957 | |
| | | | | | | | | 14,578,214 | |
Ireland | | | | | | | | | | |
DCC PLC | | | | | 6,839 | | | | 310,859 | |
Kentz Corp. Ltd. | | | | | 18,787 | | | | 203,216 | |
| | | | | | | | | 514,075 | |
Israel | | | | | | | | | | |
Bank Leumi Le-Israel BM | | | | | 5,415 | | | | 20,570 | |
Gazit-Globe Ltd. | | | | | 1,054 | | | | 13,067 | |
Paz Oil Co. Ltd. | | | | | 247 | | | | 36,630 | |
Teva Pharmaceutical Industries Ltd. | | | | | 6,546 | | | | 291,761 | |
| | | | | | | | | 362,028 | |
Italy | | | | | | | | | | |
Banca Generali SpA | | | | | 13,222 | | | | 404,075 | |
Brembo SpA | | | | | 2,372 | | | | 61,375 | |
Exor SpA | | | | | 5,586 | | | | 218,443 | |
Mediolanum SpA | | | | | 16,475 | | | | 141,547 | |
Salvatore Ferragamo SpA | | | | | 2,422 | | | | 74,846 | |
Unipol Gruppo Finanziario SpA | | | | | 21,751 | | | | 124,097 | |
| | | | | | | | | 1,024,383 | |
See Notes to Financial Statements.
| BLACKROCK FUNDS | JANUARY 31, 2014 | 25
|
| |
| Schedule of Investments (continued) | BlackRock Global Long/Short Equity Fund |
| | | | | Shares | | Value |
Reference Entity — Long |
Japan | | | | | | | | | | |
Amada Co. Ltd. | | | | | 24,000 | | | $ | 194,179 | |
Asahi Group Holdings Ltd. | | | | | 38,100 | | | | 1,036,096 | |
Autobacs Seven Co. Ltd. | | | | | 1,600 | | | | 25,832 | |
Citizen Holdings Co. Ltd. | | | | | 25,200 | | | | 196,243 | |
Credit Saison Co. Ltd. | | | | | 8,800 | | | | 215,135 | |
The Dai-ichi Life Insurance Co. Ltd. | | | | | 4,900 | | | | 74,768 | |
Daifuku Co. Ltd. | | | | | 6,500 | | | | 76,943 | |
Daikin Industries Ltd. | | | | | 6,900 | | | | 395,782 | |
Disco Corp. | | | | | 1,300 | | | | 90,568 | |
Dowa Holdings Co Ltd. | | | | | 92,000 | | | | 828,345 | |
Enplas Corp. | | | | | 1,100 | | | | 73,251 | |
F@N Communications, Inc. | | | | | 11,800 | | | | 472,801 | |
Fuji Heavy Industries Ltd. | | | | | 21,300 | | | | 580,670 | |
FUJIFILM Holdings Corp. | | | | | 2,500 | | | | 72,855 | |
Fujikura Ltd. | | | | | 33,000 | | | | 153,027 | |
Fujitsu General Ltd. | | | | | 11,000 | | | | 130,878 | |
GMO internet, Inc. | | | | | 17,400 | | | | 212,215 | |
Hakuhodo DY Holdings, Inc. | | | | | 2,500 | | | | 20,194 | |
Hikari Tsushin, Inc. | | | | | 1,500 | | | | 124,814 | |
Hitachi Kokusai Electric, Inc. | | | | | 11,000 | | | | 144,501 | |
Hitachi Metals Ltd. | | | | | 6,000 | | | | 94,520 | |
Horiba Ltd. | | | | | 1,300 | | | | 47,063 | |
Jafco Co. Ltd. | | | | | 400 | | | | 21,442 | |
Kaken Pharmaceutical Co. Ltd. | | | | | 2,000 | | | | 32,037 | |
Kanamoto Co. Ltd. | | | | | 6,100 | | | | 157,591 | |
Kaneka Corp. | | | | | 4,000 | | | | 24,738 | |
KDDI Corp. | | | | | 43,400 | | | | 2,389,698 | |
Kinden Corp. | | | | | 3,000 | | | | 29,257 | |
Konica Minolta Holdings, Inc. | | | | | 500 | | | | 5,344 | |
M3, Inc. | | | | | 7 | | | | 20,527 | |
Maeda Road Construction Co. Ltd. | | | | | 7,000 | | | | 114,333 | |
Maruichi Steel Tube Ltd. | | | | | 1,500 | | | | 39,016 | |
Mitsubishi Materials Corp. | | | | | 271,000 | | | | 909,762 | |
Mitsui Mining & Smelting Co. Ltd. | | | | | 74,000 | | | | 197,054 | |
Monex Group, Inc. | | | | | 21,100 | | | | 88,779 | |
Nachi-Fujikoshi Corp. | | | | | 4,000 | | | | 25,255 | |
Nexon Co. Ltd. | | | | | 37,100 | | | | 320,568 | |
Nippo Corp. | | | | | 4,000 | | | | 62,294 | |
Nippon Meat Packers, Inc. | | | | | 12,000 | | | | 204,341 | |
Nippon Telegraph & Telephone Corp. | | | | | 41,000 | | | | 2,194,406 | |
Nisshin Steel Holdings Co. Ltd. | | | | | 1,500 | | | | 15,915 | |
Nomura Holdings, Inc. | | | | | 404,000 | | | | 2,806,992 | |
NTT Data Corp. | | | | | 2,800 | | | | 98,723 | |
Nuflare Technology, Inc. | | | | | 900 | | | | 93,911 | |
Obic Co Ltd. | | | | | 6,100 | | | | 188,318 | |
Okasan Securities Group, Inc. | | | | | 4,000 | | | | 37,031 | |
Omron Corp. | | | | | 1,700 | | | | 67,214 | |
Oriental Land Co Ltd. | | | | | 16,200 | | | | 2,458,420 | |
OSG Corp. | | | | | 7,100 | | | | 131,432 | |
Otsuka Corp. | | | | | 400 | | | | 47,445 | |
Resorttrust, Inc. | | | | | 16,100 | | | | 276,359 | |
Ricoh Co Ltd. | | | | | 104,500 | | | | 1,098,117 | |
Senshu Ikeda Holdings, Inc. | | | | | 6,800 | | | | 30,323 | |
Shinko Electric Industries Co Ltd. | | | | | 2,200 | | | | 17,226 | |
Ship Healthcare Holdings, Inc. | | | | | 400 | | | | 15,281 | |
Showa Shell Sekiyu KK | | | | | 52,000 | | | | 494,857 | |
Sojitz Corp. | | | | | 36,700 | | | | 62,916 | |
Sumitomo Metal Mining Co. Ltd. | | | | | 2,000 | | | | 25,877 | |
Sumitomo Osaka Cement Co. Ltd. | | | | | 84,000 | | | | 314,072 | |
Sumitomo Real Estate Sales Co. Ltd. | | | | | 900 | | | | 27,829 | |
Tadano Ltd. | | | | | 30,000 | | | | 421,430 | |
Taiheiyo Cement Corp. | | | | | 34,000 | | | | 125,721 | |
Takara Bio, Inc. | | | | | 900 | | | | 18,472 | |
Tokai Tokyo Financial Holdings, Inc. | | | | | 18,800 | | | | 164,145 | |
Tokyo Electron Ltd. | | | | | 4,200 | | | | 218,971 | |
Tokyo Seimitsu Co. Ltd. | | | | | 500 | | | | 9,739 | |
| | | | | | | | | | | |
| | | | | Shares | | Value |
Reference Entity — Long |
Japan (concluded) | | | | | | | | | | |
Tosoh Corp. | | | | | 24,000 | | | $ | 102,332 | |
TS Tech Co Ltd. | | | | | 2,000 | | | | 73,756 | |
United Arrows Ltd. | | | | | 2,500 | | | | 80,337 | |
Zeon Corp. | | | | | 28,000 | | | | 271,545 | |
| | | | | | | | | 21,891,828 | |
Macau | | | | | | | | | | |
Macau Legend Development Ltd. | | | | | 67,000 | | | | 63,810 | |
Netherlands | | | | | | | | | | |
SBM Offshore NV | | | | | 1,004 | | | | 19,375 | |
New Zealand | | | | | | | | | | |
Chorus Ltd. | | | | | 19,254 | | | | 21,774 | |
Norway | | | | | | | | | | |
BW LPG Ltd. | | | | | 22,359 | | | | 248,435 | |
DNO International ASA | | | | | 341,001 | | | | 1,113,057 | |
Gjensidige Forsikring ASA | | | | | 7,493 | | | | 144,019 | |
Norsk Hydro ASA | | | | | 423,870 | | | | 1,928,370 | |
Opera Software ASA | | | | | 34,893 | | | | 477,055 | |
REC Silicon ASA | | | | | 163,283 | | | | 71,408 | |
Statoil ASA | | | | | 101,542 | | | | 2,406,612 | |
Storebrand ASA | | | | | 253,171 | | | | 1,512,347 | |
Subsea 7 SA | | | | | 132,179 | | | | 2,269,854 | |
Telenor ASA | | | | | 390,321 | | | | 8,120,133 | |
| | | | | | | | | 18,291,290 | |
Portugal | | | | | | | | | | |
CTT-Correios de Portugal SA | | | | | 6,488 | | | | 59,590 | |
Singapore | | | | | | | | | | |
CapitaMall Trust | | | | | 291,000 | | | | 424,684 | |
ComfortDelGro Corp. Ltd. | | | | | 106,000 | | | | 160,197 | |
Ezion Holdings Ltd. | | | | | 529,000 | | | | 930,962 | |
IGG, Inc. | | | | | 75,000 | | | | 88,568 | |
| | | | | | | | �� | 1,604,411 | |
Spain | | | | | | | | | | |
Amadeus IT Holding SA, Class A | | | | | 44,276 | | | | 1,751,467 | |
Atresmedia Corp. de Medios de Comunicaion SA | | | | | 2,109 | | | | 39,604 | |
Bankinter SA | | | | | 169,727 | | | | 1,267,401 | |
Gamesa Corp. Tecnologica SA | | | | | 81,699 | | | | 895,728 | |
Mediaset Espana Comunicacion SA | | | | | 12,799 | | | | 157,626 | |
Repsol SA | | | | | 39,896 | | | | 932,444 | |
Tecnicas Reunidas SA | | | | | 690 | | | | 36,260 | |
| | | | | | | | | 5,080,530 | |
Sweden | | | | | | | | | | |
Intrum Justitia AB | | | | | 50,351 | | | | 1,421,824 | |
Lundin Petroleum AB | | | | | 11,086 | | | | 191,744 | |
Skandinaviska Enskilda Banken AB, Class A | | | | | 259,728 | | | | 3,346,512 | |
Trelleborg AB, B Shares | | | | | 100,197 | | | | 1,997,286 | |
| | | | | | | | | 6,957,366 | |
Switzerland | | | | | | | | | | |
Georg Fischer AG, Registered Shares | | | | | 109 | | | | 74,664 | |
United Kingdom | | | | | | | | | | |
Afren PLC | | | | | 36,492 | | | | 89,155 | |
AMEC PLC | | | | | 4,572 | | | | 77,286 | |
Blinkx PLC | | | | | 132,006 | | | | 275,805 | |
Britvic PLC | | | | | 175,074 | | | | 1,994,182 | |
BT Group PLC | | | | | 211,214 | | | | 1,330,030 | |
Dixons Retail PLC | | | | | 122,911 | | | | 88,118 | |
Foxtons Group PLC | | | | | 3,967 | | | | 22,788 | |
Genel Energy PLC | | | | | 944 | | | | 15,250 | |
Howden Joinery Group PLC | | | | | 40,360 | | | | 227,286 | |
ITV PLC | | | | | 233,155 | | | | 752,368 | |
Jazztel PLC | | | | | 111,414 | | | | 1,367,762 | |
See Notes to Financial Statements.
| 26 | BLACKROCK FUNDS | JANUARY 31, 2014
|
| |
| Schedule of Investments (continued) | BlackRock Global Long/Short Equity Fund |
| | | | | Shares | | Value |
Reference Entity — Long |
United Kingdom (concluded) | | | | | | | | | | |
Lonmin PLC | | | | | 3,993 | | | $ | 20,061 | |
Randgold Resources Ltd. | | | | | 1,653 | | | | 113,625 | |
Rightmove PLC | | | | | 14,393 | | | | 598,862 | |
Rio Tinto PLC | | | | | 3,801 | | | | 202,169 | |
Thomas Cook Group PLC | | | | | 276,864 | | | | 818,210 | |
Tui Travel PLC | | | | | 28,380 | | | | 198,239 | |
| | | | | | | | | 8,191,196 | |
United States | | | | | | | | | | |
Tahoe Resources, Inc. | | | | | 1,464 | | | | 26,000 | |
Total Reference Entity — Long | | | | | | | | | 141,387,575 | |
|
Reference Entity — Short |
Austria | | | | | | | | | | |
Andritz AG | | | | | (12,670 | ) | | | (695,225 | ) |
Erste Group Bank AG | | | | | (502 | ) | | | (18,214 | ) |
Verbund AG | | | | | (1,135 | ) | | | (23,910 | ) |
| | | | | | | | | (737,349 | ) |
Belgium | | | | | | | | | | |
Belgacom SA | | | | | (5,631 | ) | | | (160,744 | ) |
Colruyt SA | | | | | (379 | ) | | | (21,500 | ) |
D’ieteren SA | | | | | (2,280 | ) | | | (109,252 | ) |
Delhaize Group SA | | | | | (889 | ) | | | (57,099 | ) |
UCB SA | | | | | (8,875 | ) | | | (627,549 | ) |
| | | | | | | | | (976,144 | ) |
Canada | | | | | | | | | | |
Enerplus Corp. | | | | | (1 | ) | | | (18 | ) |
Loblaw Cos. Ltd. | | | | | (5,861 | ) | | | (226,389 | ) |
Penn West Petroleum Ltd. | | | | | (6,976 | ) | | | (52,175 | ) |
SNC-Lavalin Group, Inc. | | | | | (16,797 | ) | | | (696,915 | ) |
| | | | | | | | | (975,497 | ) |
Denmark | | | | | | | | | | |
FLSmidth & Co. A/S | | | | | (17,717 | ) | | | (945,826 | ) |
William Demant Holding A/S | | | | | (5,545 | ) | | | (510,283 | ) |
| | | | | | | | | (1,456,109 | ) |
Finland | | | | | | | | | | |
Metso OYJ | | | | | (20,993 | ) | | | (655,315 | ) |
Nokian Renkaat OYJ | | | | | (10,054 | ) | | | (423,000 | ) |
Valmet Corp. | | | | | (5,825 | ) | | | (49,140 | ) |
| | | | | | | | | (1,127,455 | ) |
France | | | | | | | | | | |
Accor SA | | | | | (5,227 | ) | | | (249,171 | ) |
Alstom SA | | | | | (3,604 | ) | | | (101,799 | ) |
Bureau Veritas SA | | | | | (5,571 | ) | | | (144,717 | ) |
Carrefour SA | | | | | (116,556 | ) | | | (4,005,141 | ) |
Casino Guichard Perrachon SA | | | | | (44,128 | ) | | | (4,548,269 | ) |
CNP Assurances | | | | | (4,563 | ) | | | (89,278 | ) |
Faurecia | | | | | (4,587 | ) | | | (180,597 | ) |
L’Oreal SA | | | | | (18,592 | ) | | | (3,052,331 | ) |
Lafarge SA | | | | | (1,090 | ) | | | (78,129 | ) |
LVMH Moet Hennessy Louis Vuitton SA | | | | | (11,500 | ) | | | (2,045,779 | ) |
Pernod Ricard SA | | | | | (50,443 | ) | | | (5,417,113 | ) |
Remy Cointreau SA | | | | | (28,972 | ) | | | (2,160,223 | ) |
Renault SA | | | | | (4,261 | ) | | | (370,149 | ) |
Sodexo | | | | | (2,670 | ) | | | (262,951 | ) |
Vallourec SA | | | | | (3,990 | ) | | | (199,203 | ) |
Vivendi SA | | | | | (87,529 | ) | | | (2,349,637 | ) |
| | | | | | | | | (25,254,487 | ) |
| | | | | | | | | | | |
| | | | | Shares | | Value |
Reference Entity — Short |
Germany | | | | | | | | | | |
ElringKlinger AG | | | | | (4,244 | ) | | $ | (156,546 | ) |
K+S AG | | | | | (276,067 | ) | | | (8,267,587 | ) |
MAN SE | | | | | (35,970 | ) | | | (4,378,824 | ) |
MTU Aero Engines AG | | | | | (3,686 | ) | | | (326,081 | ) |
| | | | | | | | | (13,129,038 | ) |
Hong Kong | | | | | | | | | | |
Esprit Holdings Ltd. | | | | | (131,500 | ) | | | (247,215 | ) |
Shangri-La Asia Ltd. | | | | | (14,000 | ) | | | (23,226 | ) |
| | | | | | | | | (270,441 | ) |
Japan | | | | | | | | | | |
Advantest Corp. | | | | | (3,800 | ) | | | (40,109 | ) |
Aeon Co. Ltd. | | | | | (112,500 | ) | | | (1,402,766 | ) |
Ajinomoto Co. Inc. | | | | | (7,000 | ) | | | (98,791 | ) |
Asics Corp. | | | | | (7,700 | ) | | | (132,992 | ) |
ASKUL Corp. | | | | | (1,900 | ) | | | (72,661 | ) |
The Bank of Kyoto Ltd. | | | | | (3,000 | ) | | | (23,897 | ) |
The Chiba Bank Ltd. | | | | | (24,000 | ) | | | (151,875 | ) |
Coca-Cola East Japan Co. Ltd. | | | | | (3,700 | ) | | | (90,920 | ) |
Daihatsu Motor Co. Ltd. | | | | | (4,100 | ) | | | (63,944 | ) |
Dentsu, Inc. | | | | | (9,400 | ) | | | (368,729 | ) |
Fast Retailing Co. Ltd. | | | | | (11,400 | ) | | | (4,147,073 | ) |
Fujitsu Ltd. | | | | | (4,000 | ) | | | (22,360 | ) |
HIS Co. Ltd. | | | | | (300 | ) | | | (16,331 | ) |
Hisamitsu Pharmaceutical Co., Inc. | | | | | (1,000 | ) | | | (44,990 | ) |
Hitachi Transport System Ltd. | | | | | (2,000 | ) | | | (31,767 | ) |
Hokkaido Electric Power Co., Inc. | | | | | (12,800 | ) | | | (133,916 | ) |
IHI Corp. | | | | | (20,000 | ) | | | (90,692 | ) |
Itochu Techno-Solutions Corp. | | | | | (800 | ) | | | (32,941 | ) |
JSR Corp. | | | | | (1,000 | ) | | | (17,807 | ) |
JTEKT Corp. | | | | | (6,200 | ) | | | (91,284 | ) |
Kajima Corp. | | | | | (17,000 | ) | | | (62,627 | ) |
The Kansai Electric Power Co., Inc. | | | | | (25,200 | ) | | | (270,941 | ) |
Keihin Corp. | | | | | (6,900 | ) | | | (102,333 | ) |
Komeri Co. Ltd. | | | | | (3,800 | ) | | | (90,017 | ) |
Konami Corp. | | | | | (15,000 | ) | | | (356,515 | ) |
Kurita Water Industries Ltd. | | | | | (10,000 | ) | | | (213,088 | ) |
Kyushu Electric Power Co., Inc. | | | | | (6,400 | ) | | | (73,434 | ) |
MISUMI Group, Inc. | | | | | (600 | ) | | | (17,202 | ) |
Mitsubishi Logistics Corp. | | | | | (7,000 | ) | | | (97,821 | ) |
Mitsui Chemicals, Inc. | | | | | (58,000 | ) | | | (138,453 | ) |
Mitsui Engineering & Shipbuilding Co. Ltd. | | | | | (70,000 | ) | | | (136,553 | ) |
Mitsui OSK Lines Ltd. | | | | | (32,000 | ) | | | (131,168 | ) |
NEC Corp. | | | | | (119,000 | ) | | | (343,891 | ) |
Nihon Kohden Corp. | | | | | (1,500 | ) | | | (58,477 | ) |
Nikon Corp. | | | | | (110,600 | ) | | | (1,889,462 | ) |
Nintendo Co. Ltd. | | | | | (54,800 | ) | | | (6,285,336 | ) |
Nippon Electric Glass Co. Ltd. | | | | | (57,000 | ) | | | (256,678 | ) |
NOK Corp. | | | | | (3,100 | ) | | | (49,943 | ) |
OKUMA Corp. | | | | | (15,000 | ) | | | (143,885 | ) |
Panasonic Corp. | | | | | (298,600 | ) | | | (3,384,228 | ) |
Rakuten, Inc. | | | | | (20,500 | ) | | | (335,434 | ) |
Rohm Co. Ltd. | | | | | (1,300 | ) | | | (64,785 | ) |
Sega Sammy Holdings, Inc. | | | | | (1,000 | ) | | | (23,885 | ) |
Seven Bank Ltd. | | | | | (44,200 | ) | | | (168,472 | ) |
Shimamura Co. Ltd. | | | | | (5,600 | ) | | | (494,636 | ) |
Shiseido Co. Ltd. | | | | | (12,000 | ) | | | (189,728 | ) |
The Shizuoka Bank Ltd. | | | | | (39,000 | ) | | | (387,351 | ) |
Sony Corp. | | | | | (3,900 | ) | | | (61,101 | ) |
Sony Financial Holdings, Inc. | | | | | (2,000 | ) | | | (32,354 | ) |
Sumitomo Heavy Industries Ltd. | | | | | (99,000 | ) | | | (458,395 | ) |
Takata Corp. | | | | | (4,100 | ) | | | (121,735 | ) |
Teijin Ltd. | | | | | (30,000 | ) | | | (67,519 | ) |
Tokyo Electric Power Co., Inc. | | | | | (11,400 | ) | | | (51,737 | ) |
Tokyo Tatemono Co. Ltd. | | | | | (140,000 | ) | | | (1,298,915 | ) |
See Notes to Financial Statements.
| BLACKROCK FUNDS | JANUARY 31, 2014 | 27
|
| |
| Schedule of Investments (continued) | BlackRock Global Long/Short Equity Fund |
| | | | | Shares | | Value |
Reference Entity — Short |
Japan (concluded) | | | | | | | | | | |
Toshiba Corp. | | | | | (38,000 | ) | | $ | (157,973 | ) |
Toyota Boshoku Corp. | | | | | (3,100 | ) | | | (35,303 | ) |
Unicharm Corp. | | | | | (18,000 | ) | | | (977,929 | ) |
Yamada Denki Co. Ltd. | | | | | (23,300 | ) | | | (79,974 | ) |
Yamaha Motor Co. Ltd. | | | | | (2,700 | ) | | | (35,664 | ) |
| | | | | | | | | (26,220,787 | ) |
Netherlands | | | | | | | | | | |
ASM International NV | | | | | (8,730 | ) | | | (291,864 | ) |
Heineken NV | | | | | (160,300 | ) | | | (9,766,395 | ) |
Koninklijke Boskalis Westminster NV | | | | | (381 | ) | | | (18,269 | ) |
Koninklijke Vopak NV | | | | | (34,939 | ) | | | (1,920,266 | ) |
USG People NV | | | | | (31,173 | ) | | | (488,385 | ) |
| | | | | | | | | (12,485,179 | ) |
Singapore | | | | | | | | | | |
Golden Agri-Resources Ltd. | | | | | (93,000 | ) | | | (37,764 | ) |
Jardine Cycle & Carriage Ltd. | | | | | (17,000 | ) | | | (464,268 | ) |
| | | | | | | | | (502,032 | ) |
Spain | | | | | | | | | | |
Banco Santander SA—Rights | | | | | (13,284 | ) | | | (2,669 | ) |
Sweden | | | | | | | | | | |
Husqvarna AB -B Shares | | | | | (26,176 | ) | | | (151,659 | ) |
Sandvik AB | | | | | (106,168 | ) | | | (1,485,272 | ) |
Scania AB -B Shares | | | | | (179,644 | ) | | | (3,670,368 | ) |
Volvo AB -B Shares | | | | | (360,073 | ) | | | (4,760,860 | ) |
| | | | | | | | | (10,068,159 | ) |
Switzerland | | | | | | | | | | |
ABB Ltd. | | | | | (11,235 | ) | | | (279,452 | ) |
Banque Cantonale Vaudoise | | | | | (1,693 | ) | | | (920,306 | ) |
Credit Suisse Group AG | | | | | (75,513 | ) | | | (2,275,277 | ) |
Dufry AG | | | | | (22,135 | ) | | | (3,466,897 | ) |
Holcim Ltd. | | | | | (31,375 | ) | | | (2,277,275 | ) |
Kuehne + Nagel International AG | | | | | (12,383 | ) | | | (1,643,850 | ) |
Nestle SA | | | | | (1,810 | ) | | | (131,173 | ) |
Schindler Holding AG | | | | | (1,436 | ) | | | (207,951 | ) |
Schindler Holding AG | | | | | (419 | ) | | | (61,512 | ) |
SGS SA | | | | | (5,247 | ) | | | (11,863,962 | ) |
Sonova Holding AG | | | | | (3,264 | ) | | | (448,274 | ) |
STMicroelectronics NV | | | | | (16,644 | ) | | | (136,616 | ) |
UBS AG | | | | | (147,324 | ) | | | (2,922,065 | ) |
| | | | | | | | | (26,634,610 | ) |
United Kingdom | | | | | | | | | | |
Associated British Foods PLC | | | | | (36,788 | ) | | | (1,639,442 | ) |
British American Tobacco PLC | | | | | (40,778 | ) | | | (1,945,832 | ) |
Carnival PLC | | | | | (157,695 | ) | | | (6,464,240 | ) |
Croda International PLC | | | | | (3,777 | ) | | | (149,409 | ) |
G4S PLC | | | | | (876,605 | ) | | | (3,431,191 | ) |
Intertek Group PLC | | | | | (52,730 | ) | | | (2,451,611 | ) |
Kazakhmys PLC | | | | | (34 | ) | | | (99 | ) |
Kingfisher PLC | | | | | (176,809 | ) | | | (1,072,039 | ) |
Marks & Spencer Group PLC | | | | | (3,018 | ) | | | (23,322 | ) |
National Grid PLC | | | | | (144,887 | ) | | | (1,875,503 | ) |
Pearson PLC | | | | | (3,398 | ) | | | (62,082 | ) |
SABMiller PLC | | | | | (5,775 | ) | | | (259,473 | ) |
Serco Group PLC | | | | | (83,326 | ) | | | (597,432 | ) |
Spectris PLC | | | | | (20,062 | ) | | | (731,206 | ) |
Standard Chartered PLC | | | | | (168,563 | ) | | | (3,425,865 | ) |
Tesco PLC | | | | | (1,082,029 | ) | | | (5,686,018 | ) |
Unilever PLC | | | | | (39,881 | ) | | | (1,530,631 | ) |
The Weir Group PLC | | | | | (5,944 | ) | | | (204,364 | ) |
| | | | | | | | | (31,549,759 | ) |
| | | | | Shares | | Value |
Reference Entity — Short |
United States | | | | | | | | | | |
Brookfield Office Properties, Inc. | | | | | (79 | ) | | $ | (1,477 | ) |
Total Reference Entity — Short | | | | | | | | | (151,391,192 | ) |
Net Value of Reference Entity — Deutsche Bank AG | $ | (10,003,617 | ) |
The following table represents the individual long and short positions and related values of the basket of equity securities underlying the total return swap with Goldman Sachs & Co. as of January 31, 2014, expiration dates 2/18/14 — 8/04/15:
|
Reference Entity — Long |
China | | | | | | | | | | |
SINA Corp. | | | | | 29,011 | | | $ | 1,891,227 | |
Sohu.com, Inc. | | | | | 6,848 | | | | 498,398 | |
| | | | | | | | | 2,389,625 | |
Cyprus | | | | | | | | | | |
Ocean Rig UDW, Inc. | | | | | 26,231 | | | | 449,599 | |
Ireland | | | | | | | | | | |
FleetMatics Group PLC | | | | | 360 | | | | 14,403 | |
Jazz Pharmaceuticals PLC | | | | | 757 | | | | 114,807 | |
| | | | | | | | | 129,210 | |
Israel | | | | | | | | | | |
Caesarstone Sdot-Yam Ltd. | | | | | 2,781 | | | | 126,035 | |
Check Point Software Technologies Ltd. | | | | | 25,171 | | | | 1,646,939 | |
SodaStream International Ltd. | | | | | 10,181 | | | | 372,217 | |
Wix.com Ltd. | | | | | 1,020 | | | | 29,233 | |
| | | | | | | | | 2,174,424 | |
Netherlands | | | | | | | | | | |
Constellium NV, Class A | | | | | 3,006 | | | | 77,885 | |
Core Laboratories NV | | | | | 464 | | | | 83,019 | |
LyondellBasell Industries NV, Class A | | | | | 91,302 | | | | 7,190,945 | |
NXP Semiconductor NV | | | | | 267,139 | | | | 12,916,171 | |
| | | | | | | | | 20,268,020 | |
Singapore | | | | | | | | | | |
Flextronics International Ltd. | | | | | 43,482 | | | | 354,378 | |
United States | | | | | | | | | | |
AGCO Corp. | | | | | 12,546 | | | | 669,078 | |
Air Lease Corp. | | | | | 111,872 | | | | 3,521,731 | |
Align Technology, Inc. | | | | | 11,920 | | | | 708,286 | |
Amdocs Ltd. | | | | | 38,201 | | | | 1,652,575 | |
Amerco, Inc. | | | | | 412 | | | | 91,765 | |
Amgen, Inc. | | | | | 49,900 | | | | 5,935,605 | |
Amsurg Corp. | | | | | 684 | | | | 28,557 | |
AOL, Inc. | | | | | 1,546 | | | | 71,240 | |
Artisan Partners Asset Management, Inc. | | | | | 2,123 | | | | 134,641 | |
Aspen Technology, Inc. | | | | | 14,804 | | | | 674,618 | |
Assurant, Inc. | | | | | 21,916 | | | | 1,432,211 | |
Bally Technologies, Inc. | | | | | 15,329 | | | | 1,123,922 | |
Bankrate, Inc. | | | | | 2,896 | | | | 48,045 | |
Baxter International, Inc. | | | | | 54,230 | | | | 3,703,909 | |
Benchmark Electronics, Inc. | | | | | 2,867 | | | | 65,167 | |
Blucora, Inc. | | | | | 93,295 | | | | 2,389,285 | |
Bonanza Creek Energy, Inc. | | | | | 658 | | | | 26,787 | |
Bristow Group, Inc. | | | | | 10,746 | | | | 771,455 | |
Broadridge Financial Solutions, Inc. | | | | | 2,187 | | | | 79,366 | |
Cabot Oil & Gas Corp. | | | | | 150,375 | | | | 6,011,993 | |
CalAmp Corp. | | | | | 14,020 | | | | 413,310 | |
Cardinal Health, Inc. | | | | | 23,227 | | | | 1,579,901 | |
Celgene Corp. | | | | | 4,187 | | | | 636,131 | |
Cheniere Energy, Inc. | | | | | 15,279 | | | | 671,359 | |
Chipotle Mexican Grill, Inc. | | | | | 2,097 | | | | 1,157,460 | |
See Notes to Financial Statements.
| 28 | BLACKROCK FUNDS | JANUARY 31, 2014
|
| |
| Schedule of Investments (continued) | BlackRock Global Long/Short Equity Fund |
| | | | | Shares | | Value |
Reference Entity — Long |
United States (continued) | | | | | | | | | | |
Cimarex Energy Co. | | | | | 3,210 | | | $ | 314,516 | |
Cisco Systems, Inc. | | | | | 404,565 | | | | 8,864,019 | |
Citigroup, Inc. | | | | | 108,101 | | | | 5,127,230 | |
CNO Financial Group, Inc. | | | | | 35,033 | | | | 593,459 | |
Comcast Corp., Special Class A | | | | | 2,439 | | | | 127,682 | |
Concho Resources, Inc. | | | | | 1,048 | | | | 102,484 | |
ConocoPhillips | | | | | 3,271 | | | | 212,451 | |
CONVERSANT, Inc. | | | | | 11,075 | | | | 238,113 | |
Crimson Wine Group Ltd. | | | | | 1 | | | | 8 | |
Cvent, Inc. | | | | | 4,416 | | | | 168,735 | |
Devon Energy Corp. | | | | | 1,843 | | | | 109,142 | |
Diamondback Energy, Inc. | | | | | 2,327 | | | | 120,957 | |
DIRECTV, LLC | | | | | 185,190 | | | | 12,857,742 | |
Discovery Communications, Inc. | | | | | 9,556 | | | | 704,468 | |
Discovery Communications, Inc., Class A | | | | | 194 | | | | 15,477 | |
Domino’s Pizza, Inc. | | | | | 53,282 | | | | 3,762,242 | |
Dril-Quip, Inc. | | | | | 444 | | | | 44,649 | |
EchoStar Corp., Class A | | | | | 3,535 | | | | 166,251 | |
EnerSys, Inc. | | | | | 329 | | | | 22,392 | |
Envestnet, Inc. | | | | | 1,356 | | | | 57,969 | |
EQT Corp. | | | | | 46,050 | | | | 4,273,901 | |
Exelis, Inc. | | | | | 11,192 | | | | 219,251 | |
Facebook, Inc. | | | | | 70,006 | | | | 4,380,275 | |
Finisar Corp. | | | | | 7,285 | | | | 172,727 | |
Freescale Semiconductor Ltd. | | | | | 2,049 | | | | 37,148 | |
GameStop Corp., Class A | | | | | 10,978 | | | | 384,998 | |
Gilead Sciences, Inc. | | | | | 10,709 | | | | 863,681 | |
Gogo, Inc. | | | | | 4,872 | | | | 99,340 | |
Health Net, Inc. | | | | | 5,752 | | | | 189,183 | |
IAC/InterActiveCorp | | | | | 95,870 | | | | 6,714,735 | |
II-VI, Inc. | | | | | 6,825 | | | | 104,218 | |
ING US, Inc. | | | | | 3,999 | | | | 135,046 | |
Ixia | | | | | 570 | | | | 7,290 | |
Kaiser Aluminum Corp. | | | | | 887 | | | | 61,921 | |
Kodiak Oil & Gas Corp. | | | | | 4,903 | | | | 52,021 | |
Linear Technology Corp. | | | | | 17,473 | | | | 778,247 | |
LinnCo LLC | | | | | 95,912 | | | | 3,087,407 | |
Manhattan Associates, Inc. | | | | | 19,495 | | | | 657,371 | |
Marathon Petroleum Corp. | | | | | 70,111 | | | | 6,103,163 | |
Matador Resources Co. | | | | | 7,952 | | | | 154,587 | |
Maxim Integrated Products, Inc. | | | | | 117,576 | | | | 3,557,850 | |
MedAssets, Inc. | | | | | 990 | | | | 21,820 | |
Methode Electronics, Inc. | | | | | 1,037 | | | | 34,905 | |
Microsemi Corp. | | | | | 1,776 | | | | 41,629 | |
Murphy USA, Inc. | | | | | 20,209 | | | | 782,897 | |
The NASDAQ OMX Group, Inc. | | | | | 32,185 | | | | 1,227,858 | |
Newfield Exploration Co. | | | | | 19,597 | | | | 485,418 | |
NewMarket Corp. | | | | | 105 | | | | 35,160 | |
Northrop Grumman Corp. | | | | | 56,763 | | | | 6,558,965 | |
Nu Skin Enterprises, Inc., Class A | | | | | 12,282 | | | | 1,045,812 | |
Oasis Petroleum, Inc. | | | | | 24,588 | | | | 1,028,024 | |
Oceaneering International, Inc. | | | | | 330 | | | | 22,490 | |
OpenTable, Inc. | | | | | 2,439 | | | | 183,608 | |
OSI Systems, Inc. | | | | | 13,138 | | | | 761,084 | |
Packaging Corp. of America | | | | | 2,700 | | | | 174,420 | |
Palo Alto Networks, Inc. | | | | | 970 | | | | 57,667 | |
Pattern Energy Group, Inc. | | | | | 4,020 | | | | 112,118 | |
PBF Energy, Inc. | | | | | 2,925 | | | | 75,845 | |
PDC Energy, Inc. | | | | | 2,816 | | | | 140,406 | |
Plains GP Holdings LP, Class A | | | | | 10,959 | | | | 278,578 | |
Polaris Industries, Inc. | | | | | 3,724 | | | | 466,245 | |
Polycom, Inc. | | | | | 4,804 | | | | 57,312 | |
Power Integrations, Inc. | | | | | 3,731 | | | | 220,987 | |
priceline.com, Inc. | | | | | 519 | | | | 594,198 | |
Progress Software Corp. | | | | | 6,689 | | | | 161,673 | |
QUALCOMM, Inc. | | | | | 137,975 | | | | 10,240,505 | |
| | | | | | | | | | | |
| | | | | Shares | | Value |
Reference Entity — Long |
United States (concluded) | | | | | | | | | | |
Questcor Pharmaceuticals, Inc. | | | | | 411 | | | $ | 27,541 | |
Raytheon Co. | | | | | 57,451 | | | | 5,461,867 | |
Regal Entertainment Group, Class A | | | | | 54,599 | | | | 1,064,681 | |
RF Micro Devices, Inc. | | | | | 8,884 | | | | 47,352 | |
RTI International Metals, Inc. | | | | | 3,192 | | | | 99,335 | |
SemGroup Corp., Class A | | | | | 9,178 | | | | 566,833 | |
Skyworks Solutions, Inc. | | | | | 41,091 | | | | 1,243,003 | |
SM Energy Co. | | | | | 32,764 | | | | 2,711,549 | |
Spirit Aerosystems Holdings, Inc., Class A | | | | | 17,839 | | | | 604,920 | |
Spirit Airlines, Inc. | | | | | 3,635 | | | | 170,482 | |
Steel Dynamics, Inc. | | | | | 20,520 | | | | 338,580 | |
Stillwater Mining Co. | | | | | 46,480 | | | | 582,859 | |
Synaptics, Inc. | | | | | 3,874 | | | | 226,087 | |
Targa Resources Corp. | | | | | 6,389 | | | | 576,863 | |
Tesoro Corp. | | | | | 2,697 | | | | 138,949 | |
Tessera Technologies, Inc. | | | | | 6,634 | | | | 131,685 | |
Third Point Reinsurance Ltd. | | | | | 6,774 | | | | 108,181 | |
Thoratec Corp. | | | | | 15,760 | | | | 550,654 | |
TIBCO Software, Inc. | | | | | 6,545 | | | | 139,343 | |
Tidewater, Inc. | | | | | 416 | | | | 21,570 | |
TripAdvisor, Inc. | | | | | 8,002 | | | | 617,674 | |
Ubiquiti Networks, Inc. | | | | | 82,021 | | | | 3,379,265 | |
United Therapeutics Corp. | | �� | | | 113 | | | | 11,596 | |
US Silica Holdings, Inc. | | | | | 10,110 | | | | 299,458 | |
USANA Health Sciences, Inc. | | | | | 226 | | | | 13,531 | |
Valero Energy Corp. | | | | | 34,186 | | | | 1,746,905 | |
Valmont Industries, Inc. | | | | | 5,641 | | | | 825,730 | |
VCA Antech, Inc. | | | | | 28,717 | | | | 917,221 | |
VeriSign, Inc. | | | | | 18,679 | | | | 1,097,391 | |
Viacom, Inc., Class B | | | | | 170,629 | | | | 14,008,641 | |
Vince Holding Corp. | | | | | 1,535 | | | | 35,858 | |
Vishay Intertechnology, Inc. | | | | | 1,902 | | | | 25,829 | |
Waddell & Reed Financial, Inc., Class A | | | | | 4,498 | | | | 291,560 | |
Web.com Group, Inc. | | | | | 12,270 | | | | 414,726 | |
Western Refining, Inc. | | | | | 5,258 | | | | 205,640 | |
Whiting Petroleum Corp. | | | | | 20,840 | | | | 1,216,639 | |
Worthington Industries, Inc. | | | | | 4,730 | | | | 191,754 | |
| | | | | | | | | 164,164,119 | |
Total Reference Entity — Long | | | | | | | | | 189,929,375 | |
|
Reference Entity — Short |
Bermuda | | | | | | | | | | |
Signet Jewelers Ltd. | | | | | (4,930 | ) | | | (392,182 | ) |
Ireland | | | | | | | | | | |
Eaton Corp. PLC | | | | | (7,037 | ) | | | (514,334 | ) |
Netherlands | | | | | | | | | | |
Chicago Bridge & Iron Co. NV | | | | | (39,761 | ) | | | (2,981,677 | ) |
Sweden | | | | | | | | | | |
Autoliv, Inc. | | | | | (5,105 | ) | | | (462,870 | ) |
Switzerland | | | | | | | | | | |
Foster Wheeler AG | | | | | (18,812 | ) | | | (563,984 | ) |
Tyco International Ltd. | | | | | (35,432 | ) | | | (1,434,642 | ) |
| | | | | | | | | (1,998,626 | ) |
United States | | | | | | | | | | |
Abercrombie & Fitch Co., Class A | | | | | (3,954 | ) | | | (139,893 | ) |
ABIOMED, Inc. | | | | | (5,569 | ) | | | (153,092 | ) |
ACADIA Pharmaceuticals, Inc. | | | | | (14,773 | ) | | | (344,211 | ) |
Acadia Realty Trust | | | | | (21,990 | ) | | | (559,646 | ) |
ACI Worldwide, Inc. | | | | | (13,832 | ) | | | (838,358 | ) |
Acuity Brands, Inc. | | | | | (14,779 | ) | | | (1,877,524 | ) |
ADTRAN, Inc. | | | | | (2,100 | ) | | | (53,319 | ) |
The Advisory Board Co. | | | | | (1,395 | ) | | | (88,317 | ) |
See Notes to Financial Statements.
| BLACKROCK FUNDS | JANUARY 31, 2014 | 29
|
| |
| Schedule of Investments (continued) | BlackRock Global Long/Short Equity Fund |
| | | | | Shares | | Value |
Reference Entity — Short |
United States (continued) | | | | | | | | | | |
Alexander & Baldwin, Inc. | | | | | (2,120 | ) | | $ | (82,913 | ) |
Allegheny Technologies, Inc. | | | | | (120,801 | ) | | | (3,797,983 | ) |
Allegiant Travel Co. | | | | | (1,102 | ) | | | (100,359 | ) |
Alnylam Pharmaceuticals, Inc. | | | | | (15,523 | ) | | | (1,298,654 | ) |
Alpha Natural Resources, Inc. | | | | | (652 | ) | | | (3,703 | ) |
Altria Group, Inc. | | | | | (1,339 | ) | | | (47,160 | ) |
Amazon.com, Inc. | | | | | (6,973 | ) | | | (2,501,145 | ) |
American Airlines Group, Inc. | | | | | (21,365 | ) | | | (716,796 | ) |
American Capital Agency Corp. | | | | | (38,300 | ) | | | (802,385 | ) |
Apollo Education Group, Inc. | | | | | (4,556 | ) | | | (147,113 | ) |
Applied Materials, Inc. | | | | | (227,815 | ) | | | (3,831,848 | ) |
Arch Capital Group Ltd. | | | | | (32,547 | ) | | | (1,751,354 | ) |
athenahealth, Inc. | | | | | (15,566 | ) | | | (2,294,428 | ) |
Autodesk, Inc. | | | | | (2,809 | ) | | | (143,961 | ) |
Avis Budget Group, Inc. | | | | | (2,005 | ) | | | (75,609 | ) |
Avon Products, Inc. | | | | | (7,995 | ) | | | (119,046 | ) |
B&G Foods, Inc. | | | | | (5,368 | ) | | | (175,909 | ) |
BancorpSouth, Inc. | | | | | (31,905 | ) | | | (752,001 | ) |
Bank of Hawaii Corp. | | | | | (17,309 | ) | | | (982,805 | ) |
Barnes & Noble, Inc. | | | | | (21,280 | ) | | | (286,854 | ) |
Beacon Roofing Supply, Inc. | | | | | (4,627 | ) | | | (174,854 | ) |
Bemis Co., Inc. | | | | | (31,721 | ) | | | (1,221,576 | ) |
Big Lots, Inc. | | | | | (880 | ) | | | (23,575 | ) |
BioMarin Pharmaceutical, Inc. | | | | | (46,112 | ) | | | (3,176,195 | ) |
Boston Properties, Inc. | | | | | (511 | ) | | | (55,234 | ) |
Brookdale Senior Living, Inc. | | | | | (8,337 | ) | | | (228,934 | ) |
Cabela’s, Inc. | | | | | (22,138 | ) | | | (1,480,147 | ) |
Caesars Entertainment Corp. | | | | | (20,305 | ) | | | (446,913 | ) |
Campbell Soup Co. | | | | | (28,247 | ) | | | (1,164,059 | ) |
CarMax, Inc. | | | | | (1,795 | ) | | | (80,972 | ) |
Celldex Therapeutics, Inc. | | | | | (14,505 | ) | | | (373,939 | ) |
Cepheid, Inc. | | | | | (14,754 | ) | | | (779,896 | ) |
Chemtura Corp. | | | | | (18,828 | ) | | | (472,206 | ) |
Chico’s FAS, Inc. | | | | | (591 | ) | | | (9,811 | ) |
Choice Hotels International, Inc. | | | | | (2,130 | ) | | | (103,369 | ) |
Church & Dwight Co., Inc. | | | | | (897 | ) | | | (57,928 | ) |
City National Corp. | | | | | (4,644 | ) | | | (335,993 | ) |
Clean Harbors, Inc. | | | | | (1,605 | ) | | | (90,008 | ) |
Cogent Communications Group, Inc. | | | | | (1,872 | ) | | | (77,445 | ) |
Cohen & Steers, Inc. | | | | | (479 | ) | | | (17,278 | ) |
Concur Technologies, Inc. | | | | | (14,271 | ) | | | (1,731,643 | ) |
Conn’s, Inc. | | | | | (11,622 | ) | | | (705,572 | ) |
Copart, Inc. | | | | | (1,084 | ) | | | (37,160 | ) |
CoreLogic, Inc. | | | | | (16,021 | ) | | | (510,269 | ) |
The Corporate Executive Board Co. | | | | | (1,844 | ) | | | (134,796 | ) |
Corporate Office Properties Trust | | | | | (12,468 | ) | | | (309,830 | ) |
Coty, Inc., Class A | | | | | (7,549 | ) | | | (101,836 | ) |
CubeSmart | | | | | (16,122 | ) | | | (265,691 | ) |
Cubic Corp. | | | | | (483 | ) | | | (23,923 | ) |
Cypress Semiconductor Corp. | | | | | (1,288 | ) | | | (12,932 | ) |
Darden Restaurants, Inc. | | | | | (2,959 | ) | | | (146,293 | ) |
DeVry, Inc. | | | | | (5,510 | ) | | | (199,131 | ) |
Dominion Resources, Inc. | | | | | (11,243 | ) | | | (763,512 | ) |
Douglas Emmett, Inc. | | | | | (7,182 | ) | | | (182,638 | ) |
Dynegy, Inc. | | | | | (13,841 | ) | | | (281,803 | ) |
Eagle Materials, Inc. | | | | | (4,685 | ) | | | (368,944 | ) |
Eaton Vance Corp. | | | | | (10,657 | ) | | | (405,712 | ) |
Electronic Arts, Inc. | | | | | (2,491 | ) | | | (65,762 | ) |
Elizabeth Arden, Inc. | | | | | (4,291 | ) | | | (116,372 | ) |
EMC Corp. | | | | | (58,977 | ) | | | (1,429,602 | ) |
Equity One, Inc. | | | | | (9,302 | ) | | | (210,783 | ) |
Equity Residential | | | | | (21,707 | ) | | | (1,202,134 | ) |
Essex Property Trust, Inc. | | | | | (1,438 | ) | | | (227,736 | ) |
Family Dollar Stores, Inc. | | | | | (9,383 | ) | | | (580,057 | ) |
Fidelity National Financial, Inc. | | | | | (69,571 | ) | | | (2,194,269 | ) |
Fifth & Pacific Cos., Inc. | | | | | (18,775 | ) | | | (538,843 | ) |
| | | | | | | | | | | |
| | | | | Shares | | Value |
Reference Entity — Short |
United States (continued) | | | | | | | | | | |
First Horizon National Corp. | | | | | (23,596 | ) | | $ | (277,489 | ) |
Five Below, Inc. | | | | | (3,566 | ) | | | (130,694 | ) |
Flotek Industries, Inc. | | | | | (4,257 | ) | | | (91,568 | ) |
Forest City Enterprises, Inc., Class A | | | | | (46,704 | ) | | | (849,546 | ) |
Francesca’s Holdings Corp. | | | | | (2,802 | ) | | | (53,238 | ) |
Fusion-io, Inc. | | | | | (15,156 | ) | | | (166,716 | ) |
Genesco, Inc. | | | | | (6,976 | ) | | | (489,855 | ) |
Genesee & Wyoming, Inc., Class A | | | | | (16,382 | ) | | | (1,479,950 | ) |
Granite Construction, Inc. | | | | | (8,652 | ) | | | (288,025 | ) |
Green Dot Corp., Class A | | | | | (349 | ) | | | (7,860 | ) |
Greif, Inc., Class A | | | | | (1,569 | ) | | | (79,438 | ) |
Guidewire Software, Inc. | | | | | (2,101 | ) | | | (99,188 | ) |
Gulf Coast Ultra Deep Royalty Trust | | | | | (6,997 | ) | | | (17,632 | ) |
Hancock Holding Co. | | | | | (5,725 | ) | | | (198,085 | ) |
Hatteras Financial Corp. | | | | | (2,885 | ) | | | (51,757 | ) |
Hill-Rom Holdings, Inc. | | | | | (59,716 | ) | | | (2,165,899 | ) |
Hillenbrand, Inc. | | | | | (961 | ) | | | (26,014 | ) |
HMS Holdings Corp. | | | | | (7,824 | ) | | | (180,187 | ) |
HNI Corp. | | | | | (524 | ) | | | (17,978 | ) |
Hologic, Inc. | | | | | (3,534 | ) | | | (75,486 | ) |
Hudson City Bancorp, Inc. | | | | | (206,071 | ) | | | (1,862,882 | ) |
ImmunoGen, Inc. | | | | | (6,063 | ) | | | (90,884 | ) |
Ingredion, Inc. | | | | | (15,545 | ) | | | (968,454 | ) |
Integra LifeSciences Holdings Corp. | | | | | (3,938 | ) | | | (182,959 | ) |
Intrepid Potash, Inc. | | | | | (6,806 | ) | | | (100,048 | ) |
Iron Mountain, Inc. | | | | | (1,776 | ) | | | (46,904 | ) |
Ironwood Pharmaceuticals, Inc. | | | | | (27,364 | ) | | | (379,539 | ) |
JC Penney Co., Inc. | | | | | (149,567 | ) | | | (885,437 | ) |
John Wiley & Sons, Inc., Class A | | | | | (7,488 | ) | | | (405,400 | ) |
Joy Global, Inc. | | | | | (98,563 | ) | | | (5,203,141 | ) |
Kellogg Co. | | | | | (48,797 | ) | | | (2,829,250 | ) |
Kennametal, Inc. | | | | | (10,437 | ) | | | (452,340 | ) |
Key Energy Services, Inc. | | | | | (13,487 | ) | | | (98,320 | ) |
Kilroy Realty Corp. | | | | | (9,400 | ) | | | (496,320 | ) |
L Brands, Inc. | | | | | (24,295 | ) | | | (1,272,086 | ) |
Leidos Holdings, Inc. | | | | | (846 | ) | | | (38,358 | ) |
Level 3 Communications, Inc. | | | | | (127,052 | ) | | | (4,078,369 | ) |
Louisiana-Pacific Corp. | | | | | (2,686 | ) | | | (47,086 | ) |
The Macerich Co. | | | | | (15,960 | ) | | | (903,336 | ) |
Manitowoc Co., Inc. | | | | | (4,487 | ) | | | (127,655 | ) |
Marsh & McLennan Cos., Inc. | | | | | (37,512 | ) | | | (1,714,674 | ) |
Mattress Firm Holding Corp. | | | | | (885 | ) | | | (36,020 | ) |
McDermott International, Inc. | | | | | (39,427 | ) | | | (328,821 | ) |
McGraw Hill Financial, Inc. | | | | | (29,902 | ) | | | (2,273,748 | ) |
Meritor, Inc. | | | | | (2,804 | ) | | | (30,788 | ) |
Mettler-Toledo International, Inc. | | | | | (742 | ) | | | (182,755 | ) |
MGIC Investment Corp. | | | | | (2,474 | ) | | | (21,004 | ) |
MGM Resorts International | | | | | (130,469 | ) | | | (3,178,225 | ) |
Mobile Mini, Inc. | | | | | (11,738 | ) | | | (453,908 | ) |
Monro Muffler Brake, Inc. | | | | | (17,465 | ) | | | (969,482 | ) |
National Fuel Gas Co. | | | | | (14,798 | ) | | | (1,115,177 | ) |
National Health Investors, Inc. | | | | | (323 | ) | | | (20,339 | ) |
Navistar International Corp. | | | | | (403 | ) | | | (12,420 | ) |
NetSuite, Inc. | | | | | (4,805 | ) | | | (505,390 | ) |
The New York Times Co. | | | | | (2,208 | ) | | | (31,221 | ) |
NorthStar Realty Finance Corp. | | | | | (4,437 | ) | | | (64,736 | ) |
OGE Energy Corp. | | | | | (2,033 | ) | | | (69,264 | ) |
Omnicom Group, Inc. | | | | | (5 | ) | | | (363 | ) |
ONEOK, Inc. | | | | | (137,705 | ) | | | (9,431,415 | ) |
Parkway Properties, Inc. | | | | | (10,740 | ) | | | (190,528 | ) |
Pebblebrook Hotel Trust | | | | | (6,075 | ) | | | (183,040 | ) |
Pennsylvania Real Estate Investment Trust | | | | | (1,074 | ) | | | (20,030 | ) |
PG&E Corp. | | | | | (32,843 | ) | | | (1,384,332 | ) |
Pitney Bowes, Inc. | | | | | (77,213 | ) | | | (1,944,223 | ) |
Pool Corp. | | | | | (4,505 | ) | | | (244,081 | ) |
PVH Corp. | | | | | (113,014 | ) | | | (13,660,002 | ) |
See Notes to Financial Statements.
| 30 | BLACKROCK FUNDS | JANUARY 31, 2014
|
| |
| Schedule of Investments (continued) | BlackRock Global Long/Short Equity Fund |
| | | | | Shares | | Value |
Reference Entity — Short |
United States (concluded) | | | | | | | | | | |
Questar Corp. | | | | | (15,181 | ) | | $ | (354,021 | ) |
Radian Group, Inc. | | | | | (13,715 | ) | | | (204,079 | ) |
Redwood Trust, Inc. | | | | | (18,873 | ) | | | (352,925 | ) |
Regency Centers Corp. | | | | | (1,417 | ) | | | (68,214 | ) |
Riverbed Technology, Inc. | | | | | (18,573 | ) | | | (366,260 | ) |
Rockwell Collins, Inc. | | | | | (77,641 | ) | | | (5,866,554 | ) |
Sally Beauty Holdings, Inc. | | | | | (2,394 | ) | | | (67,942 | ) |
Schweitzer-Mauduit International, Inc. | | | | | (3,714 | ) | | | (171,327 | ) |
Scientific Games Corp. | | | | | (4,571 | ) | | | (64,360 | ) |
Sempra Energy | | | | | (63,248 | ) | | | (5,863,722 | ) |
ServiceNow, Inc. | | | | | (46,321 | ) | | | (2,938,141 | ) |
The Sherwin-Williams Co. | | | | | (15,151 | ) | | | (2,776,572 | ) |
Sigma-Aldrich Corp. | | | | | (695 | ) | | | (64,614 | ) |
SolarCity Corp. | | | | | (7,971 | ) | | | (590,571 | ) |
The Southern Co. | | | | | (3,908 | ) | | | (161,166 | ) |
Sprint Corp. | | | | | (272,411 | ) | | | (2,252,839 | ) |
Sprouts Farmers Market, Inc. | | | | | (675 | ) | | | (24,125 | ) |
SPX Corp. | | | | | (9,852 | ) | | | (980,964 | ) |
The St Joe Co. | | | | | (3,676 | ) | | | (66,058 | ) |
Starwood Property Trust, Inc. | | | | | (15,701 | ) | | | (474,170 | ) |
SunEdison, Inc. | | | | | (15,955 | ) | | | (221,934 | ) |
SUPERVALU, Inc. | | | | | (3,656 | ) | | | (21,132 | ) |
Synageva BioPharma Corp. | | | | | (9,723 | ) | | | (880,709 | ) |
Sysco Corp. | | | | | (248,492 | ) | | | (8,717,099 | ) |
Target Corp. | | | | | (99,387 | ) | | | (5,629,280 | ) |
TCF Financial Corp. | | | | | (25,719 | ) | | | (414,076 | ) |
Tempur Sealy International, Inc. | | | | | (28,810 | ) | | | (1,420,045 | ) |
Terex Corp. | | | | | (2,543 | ) | | | (104,263 | ) |
TESARO, Inc. | | | | | (967 | ) | | | (30,470 | ) |
Tesla Motors, Inc. | | | | | (72,251 | ) | | | (13,107,054 | ) |
Textron, Inc. | | | | | (71,849 | ) | | | (2,550,640 | ) |
UDR, Inc. | | | | | (5,199 | ) | | | (126,544 | ) |
United Continental Holdings, Inc. | | | | | (14,973 | ) | | | (686,362 | ) |
USG Corp. | | | | | (24,708 | ) | | | (756,065 | ) |
UTi Worldwide, Inc. | | | | | (8,529 | ) | | | (133,564 | ) |
Valley National Bancorp | | | | | (9,203 | ) | | | (89,177 | ) |
Veeco Instruments, Inc. | | | | | (7,191 | ) | | | (273,330 | ) |
Vera Bradley, Inc. | | | | | (1,134 | ) | | | (27,239 | ) |
VeriFone Systems, Inc. | | | | | (6,069 | ) | | | (176,062 | ) |
Verisk Analytics, Inc., Class A | | | | | (8,595 | ) | | | (548,877 | ) |
Visteon Corp. | | | | | (1,007 | ) | | | (81,577 | ) |
Vornado Realty Trust | | | | | (33,533 | ) | | | (3,079,335 | ) |
Vulcan Materials Co. | | | | | (2,852 | ) | | | (176,054 | ) |
WageWorks, Inc. | | | | | (658 | ) | | | (40,921 | ) |
Webster Financial Corp. | | | | | (9,323 | ) | | | (282,860 | ) |
Westamerica BanCorp. | | | | | (6,806 | ) | | | (335,944 | ) |
Weyerhaeuser Co. | | | | | (5,429 | ) | | | (162,219 | ) |
Williams-Sonoma, Inc. | | | | | (26,608 | ) | | | (1,450,668 | ) |
Wolverine World Wide, Inc. | | | | | (903 | ) | | | (25,194 | ) |
Workday, Inc., Class A | | | | | (4,883 | ) | | | (437,224 | ) |
World Acceptance Corp. | | | | | (308 | ) | | | (29,473 | ) |
Wright Medical Group, Inc. | | | | | (14,757 | ) | | | (448,760 | ) |
Wynn Resorts Ltd. | | | | | (3,591 | ) | | | (780,755 | ) |
Yum! Brands, Inc. | | | | | (1,794 | ) | | | (120,467 | ) |
Zynga, Inc., Class A | | | | | (31,622 | ) | | | (139,137 | ) |
| | | | | | | | | (179,578,454 | ) |
Total Reference Entity — Short | | | | | | | | | (185,928,143 | ) |
Net Value of Reference Entity — Goldman Sachs & Co. | $ | 4,001,232 | |
|
The following table represents the individual long and short positions and related values of the basket of equity securities underlying the total return swap with UBS AG as of January 31, 2014, expiration date 3/15/17:
| | | | | Shares | | Value |
Reference Entity — Long |
Australia | | | | | | | | | | |
Amcor Ltd. | | | | | 162,672 | | | $ | 1,525,914 | |
Ansell Ltd. | | | | | 2,907 | | | | 48,730 | |
Aristocrat Leisure Ltd. | | | | | 162,886 | | | | 648,688 | |
Atlas Iron Ltd. | | | | | 130,812 | | | | 114,723 | |
BlueScope Steel Ltd. | | | | | 67,155 | | | | 317,242 | |
Caltex Australia Ltd. | | | | | 13,535 | | | | 229,179 | |
carsales.com Ltd. | | | | | 55,447 | | | | 437,538 | |
Crown Resorts Ltd. | | | | | 1,210 | | | | 17,660 | |
CSL Ltd. | | | | | 38,817 | | | | 2,389,262 | |
CSR Ltd. | | | | | 116,008 | | | | 296,774 | |
DUET Group | | | | | 324,938 | | | | 592,683 | |
DuluxGroup Ltd. | | | | | 17,637 | | | | 82,617 | |
Fortescue Metals Group Ltd. | | | | | 692,040 | | | | 3,209,994 | |
Goodman Group | | | | | 63,357 | | | | 258,880 | |
IOOF Holdings Ltd. | | | | | 8,634 | | | | 66,538 | |
JB Hi-Fi Ltd. | | | | | 1,749 | | | | 27,532 | |
Oil Search Ltd. | | | | | 58,519 | | | | 411,136 | |
Platinum Asset Management Ltd. | | | | | 5,612 | | | | 33,388 | |
Primary Health Care Ltd. | | | | | 277,694 | | | | 1,206,269 | |
REA Group Ltd. | | | | | 1,792 | | | | 63,688 | |
Regis Resources Ltd. | | | | | 18,637 | | | | 43,140 | |
Rio Tinto Ltd. | | | | | 6,639 | | | | 377,242 | |
Seven West Media Ltd. | | | | | 42,979 | | | | 82,304 | |
Westfield Group | | | | | 172,620 | | | | 1,543,505 | |
| | | | | | | | | 14,024,626 | |
Austria | | | | | | | | | | |
Voestalpine AG | | | | | 28,905 | | | | 1,293,724 | |
Belgium | | | | | | | | | | |
bpost SA | | | | | 10,704 | | | | 208,607 | |
Canada | | | | | | | | | | |
Africa Oil Corp. | | | | | 20,441 | | | | 149,141 | |
Aimia, Inc. | | | | | 3,104 | | | | 53,844 | |
Alamos Gold, Inc. | | | | | 4,066 | | | | 37,310 | |
ARC Resources Ltd. | | | | | 1,600 | | | | 41,733 | |
Atco Ltd. Class I | | | | | 799 | | | | 35,769 | |
B2Gold Corp. | | | | | 5,547 | | | | 13,099 | |
Bankers Petroleum Ltd. | | | | | 11,723 | | | | 45,050 | |
Barrick Gold Corp. | | | | | 3,680 | | | | 70,907 | |
Baytex Energy Corp. | | | | | 1,717 | | | | 62,683 | |
Canadian Natural Resources Ltd. | | | | | 92,357 | | | | 3,028,397 | |
CCL Industries, Inc., Class B | | | | | 6,770 | | | | 488,413 | |
Constellation Software, Inc. | | | | | 1,086 | | | | 233,367 | |
Dominion Diamond Corp. | | | | | 9,963 | | | | 145,095 | |
Franco-Nevada Corp. | | | | | 11,928 | | | | 578,863 | |
Gibson Energy, Inc. | | | | | 12,655 | | | | 307,697 | |
The Jean Coutu Group PJC, Inc., Class A | | | | | 434 | | | | 7,513 | |
Linamar Corp. | | | | | 4,113 | | | | 157,984 | |
Magna International, Inc. | | | | | 45,032 | | | | 3,824,940 | |
MEG Energy Corp. | | | | | 1,767 | | | | 48,976 | |
Methanex Corp. | | | | | 28,563 | | | | 1,708,266 | |
Mullen Group Ltd. | | | | | 1,948 | | | | 47,224 | |
Onex Corp. | | | | | 10,889 | | | | 561,193 | |
Open Text Corp. | | | | | 1,569 | | | | 155,470 | |
Osisko Mining Corp. | | | | | 3,935 | | | | 23,601 | |
Pan American Silver Corp. | | | | | 1,286 | | | | 16,188 | |
Parkland Fuel Corp. | | | | | 6,331 | | | | 102,206 | |
Peyto Exploration & Development Corp. | | | | | 30,077 | | | | 881,449 | |
Power Corp. of Canada | | | | | 14,803 | | | | 402,057 | |
Quebecor, Inc., Class B | | | | | 15,908 | | | | 338,799 | |
Raging River Exploration, Inc. | | | | | 10,782 | | | | 67,282 | |
Rogers Communications, Inc., Class B | | | | | 3,770 | | | | 158,585 | |
See Notes to Financial Statements.
| BLACKROCK FUNDS | JANUARY 31, 2014 | 31
|
| |
| Schedule of Investments (continued) | BlackRock Global Long/Short Equity Fund |
| | | | | Shares | | Value |
Reference Entity — Long |
Canada (concluded) | | | | | | | | | | |
Secure Energy Services, Inc. | | | | | 3,292 | | | $ | 47,943 | |
Silver Wheaton Corp. | | | | | 129,892 | | | | 2,821,178 | |
Stantec, Inc. | | | | | 3,104 | | | | 188,902 | |
Teck Resources Ltd., Class B | | | | | 43,464 | | | | 1,045,868 | |
TELUS Corp. | | | | | 19,191 | | | | 670,802 | |
Thomson Reuters Corp. | | | | | 1,838 | | | | 66,308 | |
Tourmaline Oil Corp. | | | | | 1,875 | | | | 79,276 | |
Vermilion Energy, Inc. | | | | | 5,851 | | | | 322,140 | |
West Fraser Timber Co. Ltd. | | | | | 6,050 | | | | 310,662 | |
Westjet Airlines Ltd. | | | | | 1,402 | | | | 31,659 | |
Whitecap Resources, Inc. | | | | | 11,856 | | | | 125,719 | |
| | | | | | | | | 19,503,558 | |
China | | | | | | | | | | |
Anta Sports Products Ltd. | | | | | 11,000 | | | | 16,062 | |
Anton Oilfield Services Group | | | | | 16,000 | | | | 10,211 | |
Biostime International Holdings Ltd. | | | | | 2,000 | | | | 17,242 | |
China Communications Construction Co. Ltd., Class H | | | | | 24,000 | | | | 17,465 | |
China Life Insurance Co. Ltd., Class H | | | | | 21,000 | | | | 57,159 | |
China Oilfield Services Ltd., Class H | | | | | 130,000 | | | | 348,638 | |
China Pacific Insurance Group Co. Ltd., Class H | | | | | 38,800 | | | | 140,894 | |
China Petroleum & Chemical Corp., Class H | | | | | 6,068,000 | | | | 4,793,073 | |
China Railway Construction Corp. | | | | | 65,000 | | | | 54,227 | |
China Telecom Corp. Ltd., Class H | | | | | 298,000 | | | | 136,916 | |
CNOOC Ltd. | | | | | 10,000 | | | | 15,533 | |
Country Garden Holdings Co. Ltd. | | | | | 1,251,000 | | | | 680,342 | |
CSR Corp. Ltd., Class H | | | | | 265,000 | | | | 192,765 | |
Datang International Power Generation Co. Ltd., Class H | | | | | 694,000 | | | | 276,070 | |
Great Wall Motor Co. Ltd., Class H | | | | | 5,000 | | | | 23,531 | |
Greentown China Holdings Ltd. | | | | | 33,000 | | | | 47,028 | |
Guangzhou Baiyunshan Pharmaceutical Holdings Co., Ltd. | | | | | 28,000 | | | | 90,870 | |
Guangzhou R&F Properties Co. Ltd., Class H | | | | | 456,800 | | | | 608,416 | |
Hilong Holding Ltd. | | | | | 17,000 | | | | 12,965 | |
Huaneng Power International, Inc., Class H | | | | | 20,000 | | | | 18,673 | |
Jiangsu Expressway Co. Ltd., Class H | | | | | 18,000 | | | | 22,598 | |
Jiangxi Copper Co. Ltd., Class H | | | | | 65,000 | | | | 116,994 | |
Kingsoft Corp. Ltd. | | | | | 34,000 | | | | 110,945 | |
Lenovo Group Ltd. | | | | | 34,000 | | | | 43,850 | |
People’s Insurance Co. Group of China Ltd., Class H | | | | | 497,000 | | | | 215,124 | |
PetroChina Co. Ltd., Class H | | | | | 206,000 | | | | 198,585 | |
PICC Property & Casualty Co. Ltd., Class H | | | | | 146,000 | | | | 197,225 | |
Ping An Insurance (Group) Co. of China Ltd., Class H | | | | | 19,000 | | | | 153,555 | |
Shunfeng Photovoltaic International Ltd. | | | | | 84,000 | | | | 66,132 | |
Sihuan Pharmaceutical Holdings Group Ltd. | | | | | 294,000 | | | | 314,820 | |
Sinopec Shanghai Petrochemical Co. Ltd., Class H | | | | | 918,000 | | | | 261,138 | |
Sunac China Holdings Ltd. | | | | | 11,000 | | | | 6,605 | |
Tencent Holdings Ltd. | | | | | 74,300 | | | | 5,209,164 | |
Tingyi Cayman Islands Holding Corp. | | | | | 14,000 | | | | 36,221 | |
Want Want China Holdings Ltd. | | | | | 91,000 | | | | 122,995 | |
Zhuzhou CSR Times Electric Co. Ltd., Class H | | | | | 3,000 | | | | 9,251 | |
ZTE Corp., Class H | | | | | 43,200 | | | | 89,479 | |
| | | | | | | | | 14,732,761 | |
Colombia | | | | | | | | | | |
Pacific Rubiales Energy Corp. | | | | | 14,290 | | | | 217,221 | |
| | | | | | | | | | | |
| | | | | Shares | | Value |
Reference Entity — Long |
Denmark | | | | | | | | | | |
D/S Norden A/S | | | | | 9,486 | | | $ | 443,248 | |
Novo Nordisk A/S | | | | | 28,813 | | | | 1,140,562 | |
Pandora A/S | | | | | 27,962 | | | | 1,604,281 | |
Vestas Wind Systems A/S | | | | | 19,404 | | | | 642,207 | |
| | | | | | | | | 3,830,298 | |
Finland | | | | | | | | | | |
Neste Oil OYJ | | | | | 158,438 | | | | 2,828,178 | |
France | | | | | | | | | | |
Metropole Television SA | | | | | 11,204 | | | | 243,057 | |
Technicolor SA, Registered Shares | | | | | 14,236 | | | | 70,510 | |
| | | | | | | | | 313,567 | |
Germany | | | | | | | | | | |
Continental AG | | | | | 8,142 | | | | 1,747,395 | |
Deutz AG | | | | | 1,431 | | | | 14,201 | |
Dialog Semiconductor PLC | | | | | 9,303 | | | | 180,433 | |
Drillisch AG | | | | | 1,364 | | | | 41,836 | |
Duerr AG | | | | | 934 | | | | 78,429 | |
Freenet AG | | | | | 65,408 | | | | 1,994,289 | |
KUKA AG | | | | | 4,064 | | | | 193,918 | |
Merck KGaA | | | | | 2,878 | | | | 445,633 | |
Morphosys AG | | | | | 8,209 | | | | 717,723 | |
Nordex SE | | | | | 9,057 | | | | 120,035 | |
NORMA Group AG | | | | | 291 | | | | 15,654 | |
Osram Licht AG | | | | | 739 | | | | 43,190 | |
ProSiebenSat.1 Media AG, Registered Shares | | | | | 30,022 | | | | 1,344,885 | |
Rheinmetall AG | | | | | 566 | | | | 36,231 | |
Sky Deutschland AG | | | | | 6,339 | | | | 57,517 | |
TUI AG | | | | | 14,043 | | | | 239,023 | |
United Internet AG, Registered Shares | | | | | 29,122 | | | | 1,271,940 | |
| | | | | | | | | 8,542,332 | |
Hong Kong | | | | | | | | | | |
China Mobile Ltd. | | | | | 382,500 | | | | 3,649,937 | |
China Overseas Land & Investment Ltd. | | | | | 136,000 | | | | 365,071 | |
China Resources Land Ltd. | | | | | 56,000 | | | | 131,532 | |
China Unicom Hong Kong Ltd. | | | | | 1,464,000 | | | | 1,908,917 | |
CITIC Pacific Ltd. | | | | | 33,000 | | | | 41,208 | |
COSCO Pacific Ltd. | | | | | 10,000 | | | | 12,795 | |
ENN Energy Holdings Ltd. | | | | | 8,000 | | | | 51,761 | |
Galaxy Entertainment Group Ltd. | | | | | 92,000 | | | | 899,262 | |
Geely Automobile Holdings Ltd. | | | | | 395,000 | | | | 161,420 | |
Haier Electronics Group Co. Ltd. | | | | | 51,000 | | | | 147,944 | |
Hongkong Land Holdings Ltd. | | | | | 33,000 | | | | 198,642 | |
Huabao International Holdings Ltd. | | | | | 54,000 | | | | 27,343 | |
Jardine Strategic Holdings Ltd. | | | | | 1,000 | | | | 32,456 | |
Kerry Properties Ltd. | | | | | 24,000 | | | | 76,975 | |
Li & Fung Ltd. | | | | | 146,000 | | | | 202,129 | |
New World Development Co. Ltd. | | | | | 102,000 | | | | 127,559 | |
Nine Dragons Paper Holdings Ltd. | | | | | 25,000 | | | | 21,352 | |
Sands China Ltd. | | | | | 364,000 | | | | 2,795,248 | |
Shimao Property Holdings Ltd. | | | | | 42,500 | | | | 92,830 | |
Sino Biopharmaceutical Ltd. | | | | | 376,000 | | | | 317,867 | |
SJM Holdings Ltd. | | | | | 48,000 | | | | 148,778 | |
Techtronic Industries Co. | | | | | 3,500 | | | | 8,990 | |
Truly International Holdings | | | | | 356,000 | | | | 195,605 | |
Wynn Macau Ltd. | | | | | 23,200 | | | | 98,536 | |
Xinyi Glass Holdings Ltd. | | | | | 380,000 | | | | 307,879 | |
| | | | | | | | | 12,022,036 | |
Ireland | | | | | | | | | | |
DCC PLC | | | | | 4,101 | | | | 186,406 | |
Kentz Corp. Ltd. | | | | | 6,314 | | | | 68,298 | |
| | | | | | | | | 254,704 | |
See Notes to Financial Statements.
| 32 | BLACKROCK FUNDS | JANUARY 31, 2014
|
| |
| Schedule of Investments (continued) | BlackRock Global Long/Short Equity Fund |
| | | | | Shares | | Value |
Reference Entity — Long |
Israel | | | | | | | | | | |
Bezeq The Israeli Telecommunication Corp. Ltd. | | | | | 67,644 | | | $ | 103,084 | |
Gazit-Globe Ltd. | | | | | 1,996 | | | | 24,746 | |
Israel Discount Bank Ltd. | | | | | 9,945 | | | | 17,055 | |
Paz Oil Co. Ltd. | | | | | 106 | | | | 15,720 | |
| | | | | | | | | 160,605 | |
Italy | | | | | | | | | | |
Banca Generali SpA | | | | | 7,708 | | | | 235,563 | |
Brembo SpA | | | | | 5,874 | | | | 151,990 | |
Exor SpA | | | | | 722 | | | | 28,234 | |
Mediolanum SpA | | | | | 13,136 | | | | 112,860 | |
Prysmian SpA | | | | | 1,119 | | | | 27,319 | |
Salvatore Ferragamo SpA | | | | | 2,233 | | | | 69,005 | |
Unipol Gruppo Finanziario SpA | | | | | 21,285 | | | | 121,438 | |
| | | | | | | | | 746,409 | |
Japan | | | | | | | | | | |
Advance Residence Investment Corp. | | | | | 119 | | | | 251,252 | |
Alps Electric Co. Ltd. | | | | | 3,100 | | | | 41,386 | |
Amada Co. Ltd. | | | | | 8,000 | | | | 64,726 | |
Autobacs Seven Co. Ltd. | | | | | 1,200 | | | | 19,374 | |
Avex Group Holdings, Inc. | | | | | 9,800 | | | | 223,645 | |
Calbee, Inc. | | | | | 900 | | | | 20,939 | |
Citizen Holdings Co. Ltd. | | | | | 6,600 | | | | 51,397 | |
Credit Saison Co. Ltd. | | | | | 32,500 | | | | 794,533 | |
The Dai-ichi Life Insurance Co. Ltd. | | | | | 15,700 | | | | 235,581 | |
Daifuku Co. Ltd. | | | | | 21,500 | | | | 254,504 | |
Daikin Industries Ltd. | | | | | 5,000 | | | | 286,799 | |
Daiwa Securities Group, Inc. | | | | | 38,000 | | | | 352,427 | |
Dowa Holdings Co Ltd. | | | | | 85,000 | | | | 765,318 | |
Enplas Corp. | | | | | 300 | | | | 20,319 | |
Ezaki Glico Co Ltd. | | | | | 2,000 | | | | 26,719 | |
F@N Communications, Inc. | | | | | 11,300 | | | | 452,768 | |
Fuji Heavy Industries Ltd. | | | | | 54,100 | | | | 1,474,848 | |
Fuji Oil Co. Ltd. | | | | | 1,300 | | | | 19,187 | |
Fujikura Ltd. | | | | | 65,000 | | | | 301,416 | |
Fujitsu General Ltd. | | | | | 19,000 | | | | 226,063 | |
GMO internet, Inc. | | | | | 54,800 | | | | 668,355 | |
Hitachi Capital Corp. | | | | | 800 | | | | 19,913 | |
Hitachi Kokusai Electric, Inc. | | | | | 11,000 | | | | 144,501 | |
Horiba Ltd. | | | | | 11,600 | | | | 419,944 | |
Kaken Pharmaceutical Co. Ltd. | | | | | 2,000 | | | | 32,037 | |
Kanamoto Co. Ltd. | | | | | 7,500 | | | | 193,759 | |
KDDI Corp. | | | | | 87,000 | | | | 4,790,408 | |
Komori Corp. | | | | | 1,000 | | | | 15,593 | |
M3, Inc. | | | | | 56 | | | | 165,802 | |
Maeda Road Construction Co. Ltd. | | | | | 6,000 | | | | 97,999 | |
Maruichi Steel Tube Ltd. | | | | | 1,600 | | | | 41,617 | |
Mitsubishi Materials Corp. | | | | | 96,000 | | | | 322,277 | |
Mitsui Mining & Smelting Co. Ltd. | | | | | 353,000 | | | | 940,002 | |
Modec, Inc. | | | | | 700 | | | | 19,273 | |
Monex Group, Inc. | | | | | 7,100 | | | | 29,874 | |
Nachi-Fujikoshi Corp. | | | | | 10,000 | | | | 63,138 | |
Nexon Co. Ltd. | | | | | 39,900 | | | | 344,761 | |
Nihon Nohyaku Co. Ltd. | | | | | 1,000 | | | | 13,953 | |
Nippo Corp. | | | | | 5,000 | | | | 77,868 | |
Nippon Meat Packers, Inc. | | | | | 16,000 | | | | 272,455 | |
Nippon Prologis REIT, Inc. | | | | | 3 | | | | 30,151 | |
Nippon Telegraph & Telephone Corp. | | | | | 31,000 | | | | 1,659,185 | |
Nomura Holdings, Inc. | | | | | 419,100 | | | | 2,911,907 | |
Nomura Real Estate Holdings, Inc. | | | | | 4,100 | | | | 83,097 | |
Nuflare Technology, Inc. | | | | | 1,100 | | | | 114,780 | |
Obic Co. Ltd. | | | | | 8,900 | | | | 274,760 | |
Okasan Securities Group, Inc. | | | | | 6,000 | | | | 55,546 | |
Oriental Land Co. Ltd. | | | | | 4,300 | | | | 652,543 | |
OSG Corp. | | | | | 1,200 | | | | 22,214 | |
| | | | | | | | | | | |
| | | | | Shares | | Value |
Reference Entity — Long |
Japan (concluded) | | | | | | | | | | |
Resorttrust, Inc. | | | | | 16,100 | | | $ | 276,359 | |
Ricoh Co. Ltd. | | | | | 126,200 | | | | 1,326,147 | |
Ship Healthcare Holdings, Inc. | | | | | 700 | | | | 26,742 | |
SHO-BOND Holdings Co. Ltd. | | | | | 700 | | | | 33,156 | |
Showa Shell Sekiyu KK | | | | | 228,400 | | | | 2,173,564 | |
Softbank Corp. | | | | | 5,400 | | | | 399,728 | |
Sojitz Corp. | | | | | 76,000 | | | | 130,289 | |
Sumitomo Osaka Cement Co. Ltd. | | | | | 5,000 | | | | 18,939 | |
Sumitomo Real Estate Sales Co. Ltd. | | | | | 800 | | | | 24,737 | |
Tadano Ltd. | | | | | 41,000 | | | | 575,954 | |
Tokai Tokyo Financial Holdings, Inc. | | | | | 3,500 | | | | 30,559 | |
Tokyo Electron Ltd. | | | | | 8,400 | | | | 437,942 | |
Tokyo Seimitsu Co. Ltd. | | | | | 800 | | | | 15,582 | |
Tosoh Corp. | | | | | 11,000 | | | | 46,902 | |
TS Tech Co. Ltd. | | | | | 1,200 | | | | 44,254 | |
United Arrows Ltd. | | | | | 2,000 | | | | 64,270 | |
| | | | | | | | | 25,986,037 | |
Luxembourg | | | | | | | | | | |
RTL Group SA | | | | | 196 | | | | 23,882 | |
New Zealand | | | | | | | | | | |
Chorus Ltd. | | | | | 8,503 | | | | 9,616 | |
Ryman Healthcare Ltd. | | | | | 20,730 | | | | 132,395 | |
Z Energy Ltd. | | | | | 17,116 | | | | 50,481 | |
| | | | | | | | | 192,492 | |
Norway | | | | | | | | | | |
BW LPG Ltd. | | | | | 17,932 | | | | 199,246 | |
DNO International ASA | | | | | 679,445 | | | | 2,217,767 | |
Norsk Hydro ASA | | | | | 432,356 | | | | 1,966,977 | |
Opera Software ASA | | | | | 163,931 | | | | 2,241,255 | |
Petroleum Geo-Services ASA | | | | | 1,219 | | | | 12,647 | |
REC Silicon ASA | | | | | 317,488 | | | | 138,846 | |
Seadrill Ltd. | | | | | 513 | | | | 18,429 | |
Statoil ASA | | | | | 462,428 | | | | 10,959,845 | |
Storebrand ASA | | | | | 135,499 | | | | 809,419 | |
Subsea 7 SA | | | | | 73,091 | | | | 1,255,161 | |
Telenor ASA | | | | | 406,539 | | | | 8,457,528 | |
TGS Nopec Geophysical Co. ASA | | | | | 3,188 | | | | 82,724 | |
| | | | | | | | | 28,359,844 | |
Portugal | | | | | | | | | | |
Galp Energia SGPS SA | | | | | 3,940 | | | | 60,913 | |
Zon Multimedia Servicos de Telecomunicacoes e Multimedia SGPS SA | | | | | 17,100 | | | | 114,296 | |
| | | | | | | | | 175,209 | |
Singapore | | | | | | | | | | |
CapitaMall Trust | | | | | 43,000 | | | | 62,754 | |
ComfortDelGro Corp. Ltd. | | | | | 132,000 | | | | 199,490 | |
Ezion Holdings Ltd. | | | | | 459,000 | | | | 807,772 | |
IGG, Inc. | | | | | 106,000 | | | | 125,177 | |
| | | | | | | | | 1,195,193 | |
Spain | | | | | | | | | | |
ACS Actividades de Construccion y Servicios SA | | | | | 5,039 | | | | 179,729 | |
Amadeus IT Holding SA, Class A | | | | | 31,451 | | | | 1,244,137 | |
Bankinter SA | | | | | 192,511 | | | | 1,437,536 | |
Gamesa Corp. Tecnologica SA | | | | | 86,709 | | | | 950,657 | |
Mediaset Espana Comunicacion SA | | | | | 15,253 | | | | 187,848 | |
Repsol SA | | | | | 50,216 | | | | 1,173,641 | |
Tecnicas Reunidas SA | | | | | 10,428 | | | | 548,005 | |
| | | | | | | | | 5,721,553 | |
See Notes to Financial Statements.
| BLACKROCK FUNDS | JANUARY 31, 2014 | 33
|
| |
| Schedule of Investments (continued) | BlackRock Global Long/Short Equity Fund |
| | | | | Shares | | Value |
Reference Entity — Long |
Sweden | | | | | | | | | | |
Intrum Justitia AB | | | | | 90,282 | | | $ | 2,549,405 | |
JM AB | | | | | 4,003 | | | | 107,013 | |
Skandinaviska Enskilda Banken AB, Class A | | | | | 165,167 | | | | 2,128,124 | |
Trelleborg AB, B Shares | | | | | 66,030 | | | | 1,316,215 | |
| | | | | | | | | 6,100,757 | |
Switzerland | | | | | | | | | | |
Georg Fischer AG, Registered Shares | | | | | 161 | | | | 110,284 | |
United Kingdom | | | | | | | | | | |
Afren PLC | | | | | 123,371 | | | | 301,413 | |
ASOS PLC | | | | | 2,201 | | | | 225,772 | |
Blinkx PLC | | | | | 173,724 | | | | 362,969 | |
Britvic PLC | | | | | 145,583 | | | | 1,658,264 | |
BT Group PLC | | | | | 297,047 | | | | 1,870,527 | |
Dixons Retail PLC | | | | | 1,033,248 | | | | 740,764 | |
Howden Joinery Group PLC | | | | | 5,488 | | | | 30,905 | |
International Personal Finance PLC | | | | | 1,865 | | | | 14,225 | |
ITV PLC | | | | | 450,959 | | | | 1,455,200 | |
Jazztel PLC | | | | | 116,619 | | | | 1,431,661 | |
Lonmin PLC | | | | | 38,091 | | | | 191,367 | |
Premier Oil PLC | | | | | 4,768 | | | | 21,236 | |
Rightmove PLC | | | | | 24,092 | | | | 1,002,417 | |
Rolls-Royce Holdings PLC | | | | | 3 | | | | 58 | |
Thomas Cook Group PLC | | | | | 112,621 | | | | 332,827 | |
Tui Travel PLC | | | | | 37,892 | | | | 264,681 | |
| | | | | | | | | 9,904,286 | |
United States | | | | | | | | | | |
Tahoe Resources, Inc. | | | | | 3,425 | | | | 60,827 | |
Total Reference Entity — Long | | | | | | | | | 156,508,990 | |
|
Reference Entity — Short |
Australia | | | | | | | | | | |
ALS Ltd. | | | | | (100,024 | ) | | | (698,479 | ) |
Aquila Resources Ltd. | | | | | (36,555 | ) | | | (77,496 | ) |
Bradken Ltd. | | | | | (3,945 | ) | | | (17,252 | ) |
Coca-Cola Amatil Ltd. | | | | | (128,022 | ) | | | (1,309,033 | ) |
Energy Resources of Australia Ltd. | | | | | (25,182 | ) | | | (27,836 | ) |
Harvey Norman Holdings Ltd. | | | | | (28,487 | ) | | | (74,621 | ) |
Metcash Ltd. | | | | | (288,796 | ) | | | (762,100 | ) |
Mineral Resources Ltd. | | | | | (1,896 | ) | | | (18,670 | ) |
Orica Ltd. | | | | | (11,470 | ) | | | (236,101 | ) |
Paladin Energy Ltd. | | | | | (363,172 | ) | | | (160,079 | ) |
SP AusNet | | | | | (3,716 | ) | | | (4,041 | ) |
Ten Network Holdings Ltd. | | | | | (710,162 | ) | | | (221,009 | ) |
UGL Ltd. | | | | | (21,181 | ) | | | (129,766 | ) |
Whitehaven Coal Ltd. | | | | | (126,484 | ) | | | (198,541 | ) |
| | | | | | | | | (3,935,024 | ) |
Austria | | | | | | | | | | |
Andritz AG | | | | | (2,831 | ) | | | (155,342 | ) |
Raiffeisen Bank International AG | | | | | (356 | ) | | | (13,651 | ) |
| | | | | | | | | (168,993 | ) |
Belgium | | | | | | | | | | |
Belgacom SA | | | | | (1,438 | ) | | | (41,049 | ) |
D’ieteren SA | | | | | (304 | ) | | | (14,567 | ) |
| | | | | | | | | (55,616 | ) |
Canada | | | | | | | | | | |
Emera, Inc. | | | | | (1,549 | ) | | | (43,629 | ) |
SNC-Lavalin Group, Inc. | | | | | (7,027 | ) | | | (291,554 | ) |
| | | | | | | | | (335,183 | ) |
| | | | | | | | | | | |
| | | | | Shares | | Value |
Reference Entity — Short |
Denmark | | | | | | | | | | |
FLSmidth & Co. A/S | | | | | (36,731 | ) | | $ | (1,960,892 | ) |
William Demant Holding A/S | | | | | (7,961 | ) | | | (732,618 | ) |
| | | | | | | | | (2,693,510 | ) |
Finland | | | | | | | | | | |
Metso OYJ | | | | | (8,766 | ) | | | (273,638 | ) |
Nokian Renkaat OYJ | | | | | (5,714 | ) | | | (240,404 | ) |
Valmet Corp. | | | | | (11,401 | ) | | | (96,180 | ) |
| | | | | | | | | (610,222 | ) |
France | | | | | | | | | | |
Accor SA | | | | | (356 | ) | | | (16,971 | ) |
Air France-KLM | | | | | (140,235 | ) | | | (1,609,681 | ) |
Alstom SA | | | | | (17,118 | ) | | | (483,517 | ) |
Arkema SA | | | | | (1,521 | ) | | | (162,006 | ) |
Bureau Veritas SA | | | | | (1,548 | ) | | | (40,212 | ) |
Carrefour SA | | | | | (26,998 | ) | | | (927,715 | ) |
Casino Guichard Perrachon SA | | | | | (69,970 | ) | | | (7,211,802 | ) |
Edenred | | | | | (1,600 | ) | | | (44,647 | ) |
Eramet | | | | | (1,512 | ) | | | (144,132 | ) |
Eutelsat Communications SA | | | | | (5,714 | ) | | | (173,371 | ) |
Faurecia | | | | | (1,056 | ) | | | (41,576 | ) |
Klepierre | | | | | (431 | ) | | | (18,680 | ) |
LVMH Moet Hennessy Louis Vuitton SA | | | | | (16,703 | ) | | | (2,971,360 | ) |
Pernod Ricard SA | | | | | (19,560 | ) | | | (2,100,563 | ) |
Remy Cointreau SA | | | | | (31,247 | ) | | | (2,329,852 | ) |
Rubis SCA | | | | | (552 | ) | | | (35,840 | ) |
Schneider Electric SA | | | | | (2,554 | ) | | | (205,776 | ) |
Sodexo | | | | | (2,132 | ) | | | (209,967 | ) |
Vallourec SA | | | | | (16,127 | ) | | | (805,151 | ) |
Vivendi SA | | | | | (1,015 | ) | | | (27,247 | ) |
| | | | | | | | | (19,560,066 | ) |
Germany | | | | | | | | | | |
Aixtron SE | | | | | (72,636 | ) | | | (1,106,782 | ) |
ElringKlinger AG | | | | | (3,426 | ) | | | (126,372 | ) |
K+S AG | | | | | (83,053 | ) | | | (2,487,251 | ) |
MAN SE | | | | | (35,626 | ) | | | (4,336,947 | ) |
MTU Aero Engines AG | | | | | (6,742 | ) | | | (596,430 | ) |
Puma SE | | | | | (2,832 | ) | | | (803,944 | ) |
| | | | | | | | | (9,457,726 | ) |
Hong Kong | | | | | | | | | | |
Esprit Holdings Ltd. | | | | | (26,100 | ) | | | (49,067 | ) |
Hang Lung Properties Ltd. | | | | | (17,000 | ) | | | (47,317 | ) |
Luk Fook Holdings International Ltd. | | | | | (5,000 | ) | | | (16,074 | ) |
| | | | | | | | | (112,458 | ) |
Ireland | | | | | | | | | | |
CRH PLC | | | | | (695,049 | ) | | | (17,887,301 | ) |
Kerry Group PLC | | | | | (564 | ) | | | (37,957 | ) |
| | | | | | | | | (17,925,258 | ) |
Italy | | | | | | | | | | |
Buzzi Unicem SpA | | | | | (12,060 | ) | | | (219,748 | ) |
Prada SpA | | | | | (71,500 | ) | | | (524,082 | ) |
| | | | | | | | | (743,830 | ) |
Japan | | | | | | | | | | |
Adways, Inc. | | | | | (4,700 | ) | | | (122,627 | ) |
Aeon Co. Ltd. | | | | | (26,000 | ) | | | (324,195 | ) |
ANA Holdings, Inc. | | | | | (77,000 | ) | | | (163,189 | ) |
Asics Corp. | | | | | (5,600 | ) | | | (96,722 | ) |
ASKUL Corp. | | | | | (4,500 | ) | | | (172,091 | ) |
Coca-Cola East Japan Co. Ltd. | | | | | (2,200 | ) | | | (54,061 | ) |
Dwango Co. Ltd. | | | | | (1,200 | ) | | | (29,954 | ) |
Fast Retailing Co. Ltd. | | | | | (4,000 | ) | | | (1,455,113 | ) |
Fujitsu Ltd. | | | | | (33,000 | ) | | | (184,473 | ) |
See Notes to Financial Statements.
| 34 | BLACKROCK FUNDS | JANUARY 31, 2014
|
| |
| Schedule of Investments (continued) | BlackRock Global Long/Short Equity Fund |
| | | | | Shares | | Value |
Reference Entity — Short |
Japan (concluded) | | | | | | | | | | |
Haseko Corp. | | | | | (3,700 | ) | | $ | (27,541 | ) |
House Foods Group, Inc. | | | | | (1,000 | ) | | | (14,972 | ) |
Itochu Techno-Solutions Corp. | | | | | (1,100 | ) | | | (45,294 | ) |
The Joyo Bank Ltd. | | | | | (4,000 | ) | | | (18,934 | ) |
JTEKT Corp. | | | | | (100 | ) | | | (1,472 | ) |
The Kansai Electric Power Co., Inc. | | | | | (16,200 | ) | | | (174,177 | ) |
Kawasaki Heavy Industries Ltd. | | | | | (5,000 | ) | | | (21,624 | ) |
Keihin Corp. | | | | | (2,800 | ) | | | (41,526 | ) |
Komeri Co. Ltd. | | | | | (4,400 | ) | | | (104,230 | ) |
Konami Corp. | | | | | (1,300 | ) | | | (30,898 | ) |
Kurita Water Industries Ltd. | | | | | (5,000 | ) | | | (106,544 | ) |
Kyushu Electric Power Co., Inc. | | | | | (5,200 | ) | | | (59,665 | ) |
Leopalace21 Corp. | | | | | (7,400 | ) | | | (38,580 | ) |
McDonald’s Holdings Co. Japan Ltd. | | | | | (5,200 | ) | | | (136,337 | ) |
Mitsubishi Logistics Corp. | | | | | (1,000 | ) | | | (13,975 | ) |
Mitsui Chemicals, Inc. | | | | | (83,000 | ) | | | (198,131 | ) |
Mitsui Engineering & Shipbuilding Co. Ltd. | | | | | (49,000 | ) | | | (95,587 | ) |
Mitsui OSK Lines Ltd. | | | | | (18,000 | ) | | | (73,782 | ) |
Nihon Kohden Corp. | | | | | (1,200 | ) | | | (46,782 | ) |
Nikon Corp. | | | | | (35,400 | ) | | | (612,926 | ) |
Nintendo Co. Ltd. | | | | | (41,900 | ) | | | (4,805,758 | ) |
Nippon Shokubai Co. Ltd. | | | | | (3,000 | ) | | | (31,497 | ) |
Nissan Shatai Co. Ltd. | | | | | (4,000 | ) | | | (50,600 | ) |
NOK Corp. | | | | | (8,200 | ) | | | (132,106 | ) |
OKUMA Corp. | | | | | (14,000 | ) | | | (134,293 | ) |
Onward Holdings Co. Ltd. | | | | | (5,000 | ) | | | (36,089 | ) |
Oracle Corp. Japan | | | | | (2,500 | ) | | | (99,286 | ) |
Orient Corp. | | | | | (7,500 | ) | | | (16,742 | ) |
Panasonic Corp. | | | | | (1,168,000 | ) | | | (13,237,704 | ) |
PeptiDream, Inc. | | | | | (2,600 | ) | | | (324,840 | ) |
Rakuten, Inc. | | | | | (46,500 | ) | | | (760,863 | ) |
Rohm Co. Ltd. | | | | | (3,200 | ) | | | (159,471 | ) |
Seven Bank Ltd. | | | | | (41,600 | ) | | | (158,562 | ) |
Shimamura Co. Ltd. | | | | | (2,200 | ) | | | (194,321 | ) |
Shimizu Corp. | | | | | (5,000 | ) | | | (26,952 | ) |
Shiseido Co. Ltd. | | | | | (2,200 | ) | | | (34,783 | ) |
The Shizuoka Bank Ltd. | | | | | (14,000 | ) | | | (139,049 | ) |
Sony Corp. | | | | | (66,900 | ) | | | (1,048,122 | ) |
Sony Financial Holdings, Inc. | | | | | (1,200 | ) | | | (19,412 | ) |
Sumitomo Heavy Industries Ltd. | | | | | (7,000 | ) | | | (32,886 | ) |
Teijin Ltd. | | | | | (37,000 | ) | | | (83,273 | ) |
Temp Holdings Co. Ltd. | | | | | (2,600 | ) | | | (77,764 | ) |
Tokai Carbon Co. Ltd. | | | | | (5,000 | ) | | | (16,024 | ) |
Tokyo Electric Power Co., Inc. | | | | | (15,700 | ) | | | (71,252 | ) |
Tokyo Tatemono Co. Ltd. | | | | | (61,000 | ) | | | (565,956 | ) |
Toyo Seikan Group Holdings Ltd. | | | | | (1,600 | ) | | | (28,381 | ) |
Unicharm Corp. | | | | | (2,400 | ) | | | (130,391 | ) |
Yamada Denki Co. Ltd. | | | | | (35,100 | ) | | | (120,476 | ) |
| | | | | | | | | (27,002,255 | ) |
Luxembourg | | | | | | | | | | |
APERAM | | | | | (14,851 | ) | | | (266,419 | ) |
L’Occitane International SA | | | | | (116,250 | ) | | | (231,576 | ) |
Millicom International Cellular SA | | | | | (9,944 | ) | | | (966,477 | ) |
Oriflame Cosmetics SA | | | | | (8,851 | ) | | | (244,002 | ) |
SES SA | | | | | (143,345 | ) | | | (4,603,365 | ) |
| | | | | | | | | (6,311,839 | ) |
| | | | | | | | | | | |
| | | | | Shares | | Value |
Reference Entity — Short |
Netherlands | | | | | | | | | | |
Corbion NV | | | | | (31,439 | ) | | $ | (658,851 | ) |
Corio NV | | | | | (11,881 | ) | | | (504,900 | ) |
Delta Lloyd NV | | | | | (2,922 | ) | | | (75,068 | ) |
Heineken NV | | | | | (119,669 | ) | | | (7,290,921 | ) |
Koninklijke Vopak NV | | | | | (19,761 | ) | | | (1,086,075 | ) |
Royal Imtech NV | | | | | (127,612 | ) | | | (363,853 | ) |
USG People NV | | | | | (2,283 | ) | | | (35,768 | ) |
| | | | | | | | | (10,015,436 | ) |
Portugal | | | | | | | | | | |
Banco Comercial Portugues SA | | | | | (540,671 | ) | | | (120,677 | ) |
Singapore | | | | | | | | | | |
Jardine Cycle & Carriage Ltd. | | | | | (16,000 | ) | | | (436,958 | ) |
Sweden | | | | | | | | | | |
Alfa Laval AB | | | | | (2,864 | ) | | | (69,389 | ) |
Sandvik AB | | | | | (200,255 | ) | | | (2,801,533 | ) |
Scania AB, -B Shares | | | | | (147,747 | ) | | | (3,018,670 | ) |
Volvo AB, -B Shares | | | | | (272,519 | ) | | | (3,603,227 | ) |
| | | | | | | | | (9,492,819 | ) |
Switzerland | | | | | | | | | | |
Banque Cantonale Vaudoise | | | | | (1,359 | ) | | | (738,745 | ) |
Coca-Cola HBC AG | | | | | (5,820 | ) | | | (154,155 | ) |
Credit Suisse Group AG | | | | | (7,015 | ) | | | (211,369 | ) |
Dufry AG | | | | | (14,215 | ) | | | (2,226,426 | ) |
Holcim Ltd. | | | | | (6,986 | ) | | | (507,061 | ) |
Kuehne + Nagel International AG | | | | | (25,241 | ) | | | (3,350,757 | ) |
Meyer Burger Technology AG | | | | | (7,015 | ) | | | (106,066 | ) |
Nestle SA | | | | | (59,967 | ) | | | (4,345,886 | ) |
Schindler Holding AG | | | | | (3,255 | ) | | | (471,366 | ) |
SGS SA | | | | | (1,516 | ) | | | (3,427,819 | ) |
The Swatch Group AG | | | | | (9,889 | ) | | | (5,877,283 | ) |
| | | | | | | | | (21,416,933 | ) |
United Kingdom | | | | | | | | | | |
Aggreko PLC | | | | | (326,184 | ) | | | (8,274,896 | ) |
Associated British Foods PLC | | | | | (15,758 | ) | | | (702,249 | ) |
British American Tobacco PLC | | | | | (8,891 | ) | | | (424,258 | ) |
Carnival PLC | | | | | (27,197 | ) | | | (1,114,861 | ) |
Croda International PLC | | | | | (2,356 | ) | | | (93,197 | ) |
Debenhams PLC | | | | | (12,535 | ) | | | (15,234 | ) |
Evraz PLC | | | | | (148,007 | ) | | | (206,656 | ) |
G4S PLC | | | | | (373,389 | ) | | | (1,461,512 | ) |
Inchcape PLC | | | | | (2,365 | ) | | | (22,664 | ) |
Intertek Group PLC | | | | | (27,427 | ) | | | (1,275,182 | ) |
Kazakhmys PLC | | | | | (38,689 | ) | | | (112,899 | ) |
National Grid PLC | | | | | (267,324 | ) | | | (3,460,399 | ) |
Royal Bank of Scotland Group PLC | | | | | (41,858 | ) | | | (233,186 | ) |
SABMiller PLC | | | | | (1,892 | ) | | | (85,008 | ) |
Serco Group PLC | | | | | (18,394 | ) | | | (131,882 | ) |
Spectris PLC | | | | | (16,868 | ) | | | (614,793 | ) |
Standard Chartered PLC | | | | | (81,786 | ) | | | (1,662,214 | ) |
Tesco PLC | | | | | (2,402,675 | ) | | | (12,625,958 | ) |
Unilever PLC | | | | | (18,877 | ) | | | (724,499 | ) |
The Weir Group PLC | | | | | (1,465 | ) | | | (50,369 | ) |
| | | | | | | | | (33,291,916 | ) |
Total Reference Entity — Short | | | | | | | | | (163,686,719 | ) |
Net Value of Reference Entity — UBS AG | | | | | | | | $ | (7,177,729 | ) |
See Notes to Financial Statements.
| BLACKROCK FUNDS | JANUARY 31, 2014 | 35
|
| |
| Schedule of Investments (concluded) | BlackRock Global Long/Short Equity Fund |
| • | | | | Fair Value Measurements – Various inputs are used in determining the fair value of investments and derivative financial instruments. These inputs to valuation techniques are categorized into a disclosure hierarchy consisting of three broad levels for financial statement purposes as follows: |
| • | | | | Level 1 – unadjusted price quotations in active markets/exchanges for identical assets or liabilities that the Fund has the ability to access |
| • | | | | Level 2 – other observable inputs (including, but not limited to, quoted prices for similar assets or liabilities in markets that are active, quoted prices for identical or similar assets or liabilities in markets that are not active, inputs other than quoted prices that are observable for the assets or liabilities (such as interest rates, yield curves, volatilities, prepayment speeds, loss severities, credit risks and default rates) or other market-corroborated inputs) |
| • | | | | Level 3 – unobservable inputs based on the best information available in the circumstances, to the extent observable inputs are not available (including the Fund’s own assumptions used in determining the fair value of investments and derivative financial instruments) |
| | | | | The hierarchy gives the highest priority to unadjusted quoted prices in active markets for identical assets or liabilities (Level 1 measurements) and the lowest priority to unobservable inputs (Level 3 measurements). Accordingly, the degree of judgment exercised in determining fair value is greatest for instruments categorized in Level 3. The inputs used to measure fair value may fall into different levels of the fair value hierarchy. In such cases, for disclosure purposes, the fair value hierarchy classification is determined based on the lowest level input that is significant to the fair value measurement in its entirety. |
| | | | | Changes in valuation techniques may result in transfers into or out of an assigned level within the disclosure hierarchy. In accordance with the Fund’s policy, transfers between different levels of the fair value disclosure hierarchy are deemed to have occurred as of the beginning of the reporting period. The categorization of a value determined for investments and derivative financial instruments is based on the pricing transparency of the investment and derivative financial instrument and is not necessarily an indication of the risks associated with investing in those securities. For information about the Fund’s policy regarding valuation of investments and derivative financial instruments, please refer to Note 2 of the Notes to Financial Statements. |
| | | | | The following tables summarize the Fund’s investments and derivative financial instruments categorized in the disclosure hierarchy as of January 31, 2014: |
| | | | | | Level 1 | | Level 2 | | Level 3 | | Total |
| | Assets:
| | | | | | | | | | | | | | | | | | |
| | Investments:
| | | | | | | | | | | | | | | | | | |
| | Short-Term Securities | | | | $ | 624,983,585 | | | | — | | | | — | | | $ | 624,983,585 | |
| | | | | | Level 1 | | Level 2 | | Level 3 | | Total |
| | Derivative Financial Instruments1
| | | | | | | | | | | | | | | | | | |
| | Assets:
| | | | | | | | | | | | | | | | | | |
| | Equity contracts | | | | | — | | | $ | 16,901,354 | | | | — | | | $ | 16,901,354 | |
| | Foreign currency exchange contracts | | | | $ | 6,414 | | | | — | | | | — | | | | 6,414 | |
| | Liabilities:
| | | | | | | | | | | | | | | | | | |
| | Financial futures contracts | | | | | (1,062,683 | ) | | | — | | | | — | | | | (1,062,683 | ) |
| | Foreign currency exchange contracts | | | | | (1,162 | ) | | | — | | | | — | | | | (1,162 | ) |
| | Total
| | | | $ | (1,057,431 | ) | | $ | 16,901,354 | | | | — | | | $ | 15,843,923 | |
| | 1 | | Derivative financial instruments are financial futures contracts, swaps and foreign currency exchange contracts, which are valued at the unrealized appreciation/depreciation on the instrument. |
| | | | | The carrying amount for certain of the Fund’s assets and/or liabilities approximates fair value for financial statement purposes. As of January 31, 2014, such assets and liabilities are categorized within the disclosure hierarchy as follows: |
| | | | | | Level 1 | | Level 2 | �� | Level 3 | | Total |
| | Assets:
| | | | | | | | | | | | | | | | | | |
| | Cash pledged for financial futures contracts | | | | $ | 2,765,000 | | | | — | | | | — | | | $ | 2,765,000 | |
| | Liabilities:
| | | | | | | | | | | | | | | | | | |
| | Cash received as collateral for OTC swaps | | | | | — | | | $ | (8,270,526 | ) | | | — | | | | (8,270,526 | ) |
| | Total
| | | | $ | 2,765,000 | | | $ | (8,270,526 | ) | | | — | | | $ | (5,505,526 | ) |
| | | | | There were no transfers between levels during the six months ended January 31, 2014. |
See Notes to Financial Statements.
| 36 | BLACKROCK FUNDS | JANUARY 31, 2014
|
| |
| Statements of Assets and Liabilities |
| January 31, 2014 (Unaudited) | | | | BlackRock
Emerging
Markets
Long/Short
Equity Fund | | BlackRock
Global
Long/Short
Equity Fund |
| |
Assets |
Investments at value — affiliated1 | | | | $ | 601,727,131 | | | $ | 624,983,585 | |
Cash pledged for financial futures contracts | | | | | — | | | | 2,765,000 | |
Unrealized appreciation on OTC swaps | | | | | 13,607,610 | | | | 16,901,357 | |
Unrealized appreciation on foreign currency exchange contracts | | | | | — | | | | 6,414 | |
Capital shares sold receivable | | | | | 5,440,578 | | | | 29,378,157 | |
Swap receivable | | | | | 967,768 | | | | 5,065,827 | |
Prepaid expenses | | | | | 61,235 | | | | 75,814 | |
Total assets | | | | | 621,804,322 | | | | 679,176,154 | |
| |
Liabilities |
Cash received as collateral for OTC swaps | | | | | 12,368,084 | | | | 8,270,526 | |
Capital shares redeemed payable | | | | | 7,974,883 | | | | 2,316,382 | |
Investment advisory fees payable | | | | | 841,272 | | | | 741,786 | |
Service and distribution fees payable | | | | | 51,038 | | | | 77,841 | |
Administration fees payable | | | | | 50,877 | | | | 45,331 | |
Swaps payable | | | | | 32,420 | | | | 1,764,693 | |
Unrealized depreciation on foreign currency exchange contracts | | | | | — | | | | 1,162 | |
Variation margin payable on financial futures contracts | | | | | — | | | | 228,470 | |
Other accrued expenses payable | | | | | 162,596 | | | | 5,956 | |
Total liabilities | | | | | 21,481,170 | | | | 13,452,147 | |
Net Assets | | | | $ | 600,323,152 | | | $ | 665,724,007 | |
| |
Net Assets Consist of |
Paid-in capital | | | | $ | 613,301,703 | | | $ | 647,380,225 | |
Accumulated net investment loss | | | | | (11,614,016 | ) | | | (2,581,222 | ) |
Accumulated net realized gain (loss) | | | | | (14,972,145 | ) | | | 5,081,078 | |
Net unrealized appreciation/depreciation | | | | | 13,607,610 | | | | 15,843,926 | |
Net Assets | | | | $ | 600,323,152 | | | $ | 665,724,007 | |
| |
Net Asset Value |
Institutional: | | | | | | | | | | |
Net assets | | | | $ | 426,615,120 | | | $ | 363,104,813 | |
Shares outstanding2 | | | | | 41,411,033 | | | | 30,495,454 | |
Net asset value | | | | $ | 10.30 | | | $ | 11.91 | |
Investor A: | | | | | | | | | | |
Net assets | | | | $ | 154,189,793 | | | $ | 244,817,444 | |
Shares outstanding2 | | | | | 15,025,748 | | | | 20,606,815 | |
Net asset value | | | | $ | 10.26 | | | $ | 11.88 | |
Investor C: | | | | | | | | | | |
Net assets | | | | $ | 19,518,239 | | | $ | 57,801,750 | |
Shares outstanding2 | | | | | 1,927,821 | | | | 4,899,399 | |
Net asset value | | | | $ | 10.12 | | | $ | 11.80 | |
1 Investments at cost — affiliated | | | | $ | 601,727,131 | | | $ | 624,983,585 | |
2 Unlimited number of shares authorized, $0.001 par value. | | | | | | | | | | |
See Notes to Financial Statements.
| BLACKROCK FUNDS | JANUARY 31, 2014 | 37
|
| Six Months Ended January 31, 2014 (Unaudited) | | | | BlackRock
Emerging
Markets
Long/Short
Equity Fund | | BlackRock
Global
Long/Short
Equity Fund |
| |
Investment Income |
Dividends — affiliated | | | | $ | 124,445 | | | $ | 52,497 | |
| |
Expenses |
Investment advisory | | | | | 4,909,570 | | | | 1,959,538 | |
Administration | | | | | 237,953 | | | | 97,553 | |
Service — Investor A | | | | | 216,724 | | | | 93,038 | |
Service and distribution — Investor C | | | | | 104,904 | | | | 103,228 | |
Transfer agent — Institutional | | | | | 330,840 | | | | 8,547 | |
Transfer agent — Investor A | | | | | 67,462 | | | | 2,445 | |
Transfer agent — Investor C | | | | | 9,562 | | | | 1,491 | |
Administration — Institutional | | | | | 57,499 | | | | 20,531 | |
Administration — Investor A | | | | | 21,702 | | | | 9,483 | |
Administration — Investor C | | | | | 2,626 | | | | 2,646 | |
Offering | | | | | — | | | | 32,160 | |
Professional | | | | | 33,224 | | | | 26,664 | |
Printing | | | | | 18,312 | | | | 5,648 | |
Officer and Trustees | | | | | 10,456 | | | | 2,328 | |
Registration | | | | | 44,421 | | | | 18,289 | |
Custodian | | | | | 2,336 | | | | 5,544 | |
Miscellaneous | | | | | 52,215 | | | | 31,905 | |
Recoupment of past waived fees | | | | | 2,347 | | | | 86,590 | |
Recoupment of past waived fees — class specific | | | | | 99,524 | | | | 466 | |
Total expenses | | | | | 6,221,677 | | | | 2,508,094 | |
Less fees waived by Manager | | | | | (237,859 | ) | | | (96,376 | ) |
Less administration waived — Institutional | | | | | (3,163 | ) | | | (2,672 | ) |
Less administration waived — Investor A | | | | | — | | | | (519 | ) |
Less administration waived — Investor C | | | | | — | | | | (108 | ) |
Less transfer agent fees waived and/or reimbursed — Institutional | | | | | (1,096 | ) | | | (109 | ) |
Less transfer agent fees waived and/or reimbursed — Investor A | | | | | — | | | | (64 | ) |
Less transfer agent fees waived and/or reimbursed — Investor C | | | | | — | | | | (1 | ) |
Total expenses after fees waived and/or reimbursed | | | | | 5,979,559 | | | | 2,408,245 | |
Net investment loss | | | | | (5,855,114 | ) | | | (2,355,748 | ) |
| |
Realized and Unrealized Gain (Loss) |
Net realized gain from: | | | | | | | | | | |
Swaps | | | | | 4,858,365 | | | | 7,745,169 | |
Foreign currency transactions | | | | | — | | | | 56,418 | |
| | | | | 4,858,365 | | | | 7,801,587 | |
Net change in unrealized appreciation/depreciation on: | | | | | | | | | | |
Financial futures contracts | | | | | — | | | | (1,062,683 | ) |
Swaps | | | | | (21,217,176 | ) | | | 14,862,728 | |
Foreign currency translations | | | | | — | | | | 3,085 | |
| | | | | (21,217,176 | ) | | | 13,803,130 | |
Total realized and unrealized gain (loss) | | | | | (16,358,811 | ) | | | 21,604,717 | |
Net Increase (Decrease) in Net Assets Resulting from Operations | | | | $ | (22,213,925 | ) | | $ | 19,248,969 | |
See Notes to Financial Statements.
| 38 | BLACKROCK FUNDS | JANUARY 31, 2014
|
| |
| Statements of Changes in Net Assets | |
| | | | BlackRock Emerging Markets
Long/Short Equity Fund | | | | BlackRock Global
Long/Short Equity Fund | |
| Increase (Decrease) in Net Assets: | | | | Six Months Ended
January 31,
2014
(Unaudited) | | Year Ended
July 31,
2013 | | | | Six Months Ended
January 31,
2014
(Unaudited) | | Year Ended
July 31,
2013 |
| |
Operations |
Net investment loss | | | | $ | (5,855,114 | ) | | $ | (7,970,394 | ) | | | | | | $ | (2,355,748 | ) | | $ | (341,036 | ) |
Net realized gain (loss) | | | | | 4,858,365 | | | | (14,471,650 | ) | | | | | | | 7,801,587 | | | | 1,991,124 | |
Net change in unrealized appreciation/depreciation | | | | | (21,217,176 | ) | | | 26,220,971 | | | | | | | | 13,803,130 | | | | 2,040,796 | |
Net increase (decrease) in net assets resulting from operations | | | | | (22,213,925 | ) | | | 3,778,927 | | | | | | | | 19,248,969 | | | | 3,690,884 | |
| |
Distributions to Shareholders From |
Net realized gain: | | | | | | | | | | | | | | | | | | | | | | |
Institutional | | | | | (2,508,489 | ) | | | (1,024,141 | )1 | | | | | | | (2,871,413 | ) | | | — | |
Investor A | | | | | (821,490 | ) | | | (375,842 | )1 | | | | | | | (1,430,461 | ) | | | — | |
Investor C | | | | | (57,380 | ) | | | (21,166 | )1 | | | | | | | (398,115 | ) | | | — | |
Decrease in net assets resulting from distributions to shareholders | | | | | (3,387,359 | ) | | | (1,421,149 | ) | | | | | | | (4,699,989 | ) | | | — | |
| |
Capital Share Transactions |
Net increase in net assets derived from capital share transactions | | | | | 4,701,805 | | | | 424,306,313 | | | | | | | | 567,876,882 | | | | 79,607,261 | |
| |
Net Assets |
Total increase (decrease) in net assets | | | | | (20,899,479 | ) | | | 426,664,091 | | | | | | | | 582,425,862 | | | | 83,298,145 | |
Beginning of period | | | | | 621,222,631 | | | | 194,558,540 | | | | | | | | 83,298,145 | | | | — | |
End of period | | | | $ | 600,323,152 | | | $ | 621,222,631 | | | | | | | $ | 665,724,007 | | | $ | 83,298,145 | |
Accumulated net investment loss, end of period | | | | $ | (11,614,016 | ) | | $ | (5,758,902 | ) | | | | | | $ | (2,581,222 | ) | | $ | (225,474 | ) |
| 1 | | Determined in accordance with federal income tax regulations. |
See Notes to Financial Statements.
| BLACKROCK FUNDS | JANUARY 31, 2014 | 39
|
| |
| Financial Highlights | BlackRock Emerging Markets Long/Short Equity Fund |
| | | | Institutional | |
| | | | Six Months
Ended
January 31,
2014
(Unaudited) | | Year
Ended
July 31,
2013 | | Period
October 6,
20111
to July 31,
2012 |
| |
Per Share Operating Performance |
Net asset value, beginning of period | | | | $ | 10.73 | | | $ | 10.73 | | | $ | 10.00 | |
Net investment loss2 | | | | | (0.09 | ) | | | (0.17 | ) | | | (0.14 | ) |
Net realized and unrealized gain (loss) | | | | | (0.28 | ) | | | 0.21 | | | | 0.89 | |
Net increase (decrease) from investment operations | | | | | (0.37 | ) | | | 0.04 | | | | 0.75 | |
Dividends and distributions from: | | | | | | | | | | | | | | |
Net investment income | | | | | — | | | | — | | | | (0.02 | )3 |
Net realized gain | | | | | (0.06 | ) | | | (0.04 | )3 | | | — | |
Total dividends and distributions | | | | | (0.06 | ) | | | (0.04 | ) | | | (0.02 | ) |
Net asset value, end of period | | | | $ | 10.30 | | | $ | 10.73 | | | $ | 10.73 | |
| |
Total Investment Return4 |
Based on net asset value | | | | | (3.46 | )%5 | | | 0.33 | % | | | 7.47 | %5 |
| |
Ratios to Average Net Assets |
Total expenses | | | | | 1.82 | %6,7 | | | 1.84 | %7 | | | 2.13 | %6,7,8 |
Total expenses excluding recoupment of past fees waived | | | | | 1.79 | %6,7 | | | 1.81 | %7 | | | 2.13 | %6,7 |
Total expenses after fees waived and/or reimbursed | | | | | 1.75 | %6,7 | | | 1.71 | %7 | | | 1.75 | %6,7 |
Net investment loss | | | | | (1.71 | )%6,7 | | | (1.61 | )%7 | | | (1.61 | )%6,7 |
| |
Supplemental Data |
Net assets, end of period (000) | | | | $ | 426,615 | | | $ | 433,886 | | | $ | 126,707 | |
| 1 | | Commencement of operations. |
| 2 | | Based on average shares outstanding. |
| 3 | | Determined in accordance with federal income tax regulations. |
| 4 | | Where applicable, assumes the reinvestment of dividends and distributions. |
| 5 | | Aggregate total investment return. |
| 7 | | Ratios do not include expenses incurred indirectly as a result of investments in underlying funds of approximately 0.18%. |
| 8 | | Organization costs were not annualized in the calculation of the expense ratios. If these expenses were annualized, the total expenses would have been 2.15%. |
See Notes to Financial Statements.
| 40 | BLACKROCK FUNDS | JANUARY 31, 2014
|
| |
| Financial Highlights (continued) | BlackRock Emerging Markets Long/Short Equity Fund |
| | | | Investor A | |
| | | | Six Months
Ended
January 31,
2014
(Unaudited) | | Year
Ended
July 31,
2013 | | Period
October 6,
20111
to July 31,
2012 |
| |
Per Share Operating Performance |
Net asset value, beginning of period | | | | $ | 10.69 | | | $ | 10.71 | | | $ | 10.00 | |
Net investment loss2 | | | | | (0.10 | ) | | | (0.20 | ) | | | (0.16 | ) |
Net realized and unrealized gain (loss) | | | | | (0.28 | ) | | | 0.21 | | | | 0.88 | |
Net increase (decrease) from investment operations | | | | | (0.38 | ) | | | 0.01 | | | | 0.72 | |
Dividends and distributions from: | | | | | | | | | | | | | | |
Net investment income | | | | | — | | | | — | | | | (0.01 | )3 |
Net realized gain | | | | | (0.05 | ) | | | (0.03 | )3 | | | — | |
Total dividends and distributions | | | | | (0.05 | ) | | | (0.03 | ) | | | (0.01 | ) |
Net asset value, end of period | | | | $ | 10.26 | | | $ | 10.69 | | | $ | 10.71 | |
| |
Total Investment Return4 |
Based on net asset value | | | | | (3.55 | )%5 | | | 0.12% | | | | 7.24% | 5 |
| |
Ratios to Average Net Assets |
Total expenses | | | | | 2.00% | 6,7 | | | 2.03% | 7 | | | 2.19% | 6,7,8 |
Total expenses excluding recoupment of past fees waived | | | | | 1.97% | 6,7 | | | 2.01% | 7 | | | 2.19% | 6,7 |
Total expenses after fees waived and/or reimbursed | | | | | 1.93% | 6,7 | | | 1.95% | 7 | | | 2.00% | 6,7 |
Net investment loss | | | | | (1.89)% | 6,7 | | | (1.85)% | 7 | | | (1.85)% | 6,7 |
| |
Supplemental Data |
Net assets, end of period (000) | | | | $ | 154,190 | | | $ | 166,701 | | | $ | 57,655 | |
| 1 | | Commencement of operations. |
| 2 | | Based on average shares outstanding. |
| 3 | | Determined in accordance with federal income tax regulations. |
| 4 | | Where applicable, excludes the effects of any sales charges and assumes the reinvestment of dividends and distributions. |
| 5 | | Aggregate total investment return. |
| 7 | | Ratios do not include expenses incurred indirectly as a result of investments in underlying funds of approximately 0.18%. |
| 8 | | Organization costs were not annualized in the calculation of the expense ratios. If these expenses were annualized, the total expenses would have been 2.20%. |
See Notes to Financial Statements.
| BLACKROCK FUNDS | JANUARY 31, 2014 | 41
|
| |
| Financial Highlights (concluded) | BlackRock Emerging Markets Long/Short Equity Fund |
| | | | Investor C | |
| | | | Six Months
Ended
January 31,
2014
(Unaudited) | | Year
Ended
July 31,
2013 | | Period
October 6,
20111
to July 31,
2012 |
| |
Per Share Operating Performance |
Net asset value, beginning of period | | | | $ | 10.56 | | | $ | 10.65 | | | $ | 10.00 | |
Net investment loss2 | | | | | (0.14 | ) | | | (0.28 | ) | | | (0.22 | ) |
Net realized and unrealized gain (loss) | | | | | (0.27 | ) | | | 0.21 | | | | 0.87 | |
Net increase (decrease) from investment operations | | | | | (0.41 | ) | | | (0.07 | ) | | | 0.65 | |
Distributions from net realized gain | | | | | (0.03 | ) | | | (0.02 | )3 | | | (0.00 | )3,4 |
Net asset value, end of period | | | | $ | 10.12 | | | $ | 10.56 | | | $ | 10.65 | |
| |
Total Investment Return5 |
Based on net asset value | | | | | (3.90 | )%6 | | | (0.70 | )% | | | 6.53% | 6 |
| |
Ratios to Average Net Assets |
Total expenses | | | | | 2.77% | 7,8 | | | 2.81% | 8 | | | 3.00% | 7,8,9 |
Total expenses excluding recoupment of past fees waived | | | | | 2.74% | 7,8 | | | 2.77% | 8 | | | 3.00% | 7,8 |
Total expenses after fees waived and/or reimbursed | | | | | 2.69% | 7,8 | | | 2.72% | 8 | | | 2.75% | 7,8 |
Net investment loss | | | | | (2.66)% | 7,8 | | | (2.62)% | 8 | | | (2.61)% | 7,8 |
| |
Supplemental Data |
Net assets, end of period (000) | | | | $ | 19,518 | | | $ | 20,636 | | | $ | 10,196 | |
| 1 | | Commencement of operations. |
| 2 | | Based on average shares outstanding. |
| 3 | | Determined in accordance with federal income tax regulations. |
| 4 | | Amount is greater than $(0.005) per share. |
| 5 | | Where applicable, excludes the effects of any sales charges and assumes the reinvestment of dividends and distributions. |
| 6 | | Aggregate total investment return. |
| 8 | | Ratios do not include expenses incurred indirectly as a result of investments in underlying funds of approximately 0.18%. |
| 9 | | Organization costs were not annualized in the calculation of the expense ratios. If these expenses were annualized, the total expenses would have been 3.00%. |
See Notes to Financial Statements.
| 42 | BLACKROCK FUNDS | JANUARY 31, 2014
|
| |
| Financial Highlights | BlackRock Global Long/Short Equity Fund |
| | | | Institutional | |
| | | | Six Months
Ended
January 31,
2014
(Unaudited) | | Period
December 20,
20121 to
July 31,
2013 |
| |
Per Share Operating Performance |
Net asset value, beginning of period | | | | $ | 11.29 | | | $ | 10.00 | |
Net investment loss2 | | | | | (0.10 | ) | | | (0.11 | ) |
Net realized and unrealized gain | | | | | 0.87 | | | | 1.40 | |
Net increase from investment operations | | | | | 0.77 | | | | 1.29 | |
Distributions from net realized gains | | | | | (0.15 | ) | | | — | |
Net asset value, end of period | | | | $ | 11.91 | | | $ | 11.29 | |
| |
Total Investment Return3,4 |
Based on net asset value | | | | | 6.82% | | | | 12.90% | |
| |
Ratios to Average Net Assets5 |
Total expenses | | | | | 1.77% | 6 | | | 2.67% | 6,7 |
Total expenses excluding recoupment of past fees waived | | | | | 1.71% | 6 | | | 2.67% | 6 |
Total expenses after fees waived and/or reimbursed | | | | | 1.70% | 6 | | | 1.75% | 6 |
Net investment loss | | | | | (1.66)% | 6 | | | (1.67)% | 6 |
| |
Supplemental Data |
Net assets, end of period (000) | | | | $ | 363,105 | | | $ | 65,630 | |
| 1 | | Commencement of operations. |
| 2 | | Based on average shares outstanding. |
| 3 | | Where applicable, assumes the reinvestment of dividends and distributions. |
| 4 | | Aggregate total investment return. |
| 6 | | Ratios do not include expenses incurred indirectly as a result of investments in underlying funds of approximately 0.18%. |
| 7 | | Organization costs were not annualized in the calculation of the expense ratios. If these expenses were annualized, the total expenses would have been 2.94%. |
See Notes to Financial Statements.
| BLACKROCK FUNDS | JANUARY 31, 2014 | 43
|
| |
| Financial Highlights (continued) | BlackRock Global Long/Short Equity Fund |
| | | | Investor A | |
| | | | Six Months
Ended
January 31,
2014
(Unaudited) | | Period
December 20,
20121 to
July 31,
2013 |
| |
Per Share Operating Performance |
Net asset value, beginning of period | | | | $ | 11.28 | | | $ | 10.00 | |
Net investment loss2 | | | | | (0.11 | ) | | | (0.14 | ) |
Net realized and unrealized gain | | | | | 0.85 | | | | 1.42 | |
Net increase from investment operations | | | | | 0.74 | | | | 1.28 | |
Distributions from net realized gains | | | | | (0.14 | ) | | | — | |
Net asset value, end of period | | | | $ | 11.88 | | | $ | 11.28 | |
| |
Total Investment Return3,4 |
Based on net asset value | | | | | 6.60% | | | | 12.80% | |
| |
Ratios to Average Net Assets5 |
Total expenses | | | | | 2.01% | 6 | | | 2.30% | 6,7 |
Total expenses excluding recoupment of past fees waived | | | | | 1.93% | 6 | | | 2.30% | 6 |
Total expenses after fees waived and/or reimbursed | | | | | 1.93% | 6 | | | 2.00% | 6 |
Net investment loss | | | | | (1.89)% | 6 | | | (1.95)% | 6 |
| |
Supplemental Data |
Net assets, end of period (000) | | | | $ | 244,817 | | | $ | 15,076 | |
| 1 | | Commencement of operations. |
| 2 | | Based on average shares outstanding. |
| 3 | | Where applicable, excludes the effects of any sales charges and assumes the reinvestment of dividends and distributions. |
| 4 | | Aggregate total investment return. |
| 6 | | Ratios do not include expenses incurred indirectly as a result of investments in underlying funds of approximately 0.18%. |
| 7 | | Organization costs were not annualized in the calculation of the expense ratios. If these expenses were annualized, the total expenses would have been 2.57%. |
See Notes to Financial Statements.
| 44 | BLACKROCK FUNDS | JANUARY 31, 2014
|
| |
| Financial Highlights (concluded) | BlackRock Global Long/Short Equity Fund |
| | | | Investor C | |
| | | | Six Months
Ended
January 31,
2014
(Unaudited) | | Period
December 20,
20121 to
July 31,
2013 |
| |
Per Share Operating Performance |
Net asset value, beginning of period | | | | $ | 11.23 | | | $ | 10.00 | |
Net investment loss2 | | | | | (0.15 | ) | | | (0.19 | ) |
Net realized and unrealized gain | | | | | 0.85 | | | | 1.42 | |
Net increase from investment operations | | | | | 0.70 | | | | 1.23 | |
Distributions from net realized gains | | | | | (0.13 | ) | | | — | |
Net asset value, end of period | | | | $ | 11.80 | | | $ | 11.23 | |
| |
Total Investment Return3,4 |
Based on net asset value | | | | | 6.22% | | | | 12.30% | |
| |
Ratios to Average Net Assets5 |
Total expenses | | | | | 2.74% | 6 | | | 3.09% | 6,7 |
Total expenses excluding recoupment of past fees waived | | | | | 2.67% | 6 | | | 3.09% | 6 |
Total expenses after fees waived and/or reimbursed | | | | | 2.67% | 6 | | | 2.75% | 6 |
Net investment loss | | | | | (2.63)% | 6 | | | (2.70)% | 6 |
| |
Supplemental Data |
Net assets, end of period (000) | | | | $ | 57,802 | | | $ | 2,592 | |
| 1 | | Commencement of operations. |
| 2 | | Based on average shares outstanding. |
| 3 | | Where applicable, excludes the effects of any sales charges and assumes the reinvestment of dividends and distributions. |
| 4 | | Aggregate total investment return. |
| 6 | | Ratios do not include expenses incurred indirectly as a result of investments in underlying funds of approximately 0.18%. |
| 7 | | Organization costs were not annualized in the calculation of the expense ratios. If these expenses were annualized, the total expenses would have been 3.36%. |
See Notes to Financial Statements.
| BLACKROCK FUNDS | JANUARY 31, 2014 | 45
|
| |
| Notes to Financial Statements (Unaudited) |
|
1. Organization:
BlackRock FundsSM (the “Trust”) is registered under the Investment Company Act of 1940, as amended (the “1940 Act”), as an open-end management investment company. The Trust is organized as a Massachusetts business trust. BlackRock Emerging Markets Long/Short Equity Fund (“Emerging Markets Long/Short Equity”) and BlackRock Global Long/Short Equity Fund (“Global Long/Short Equity”) (collectively, the “Funds” or individually, a “Fund”) are each a series of the Trust. The Funds are classified as diversified. Each Fund offers multiple classes of shares. Institutional Shares are sold without a sales charge and only to certain eligible investors. Investor A Shares are generally sold with an initial sales charge. Investor C Shares may be subject to a CDSC. All classes of shares have identical voting, dividend, liquidation and other rights and are subject to the same terms and conditions, except that Investor A and Investor C Shares bear certain expenses related to the shareholder servicing of such shares, and Investor C Shares also bear certain expenses related to the distribution of such shares. Each class has exclusive voting rights with respect to matters relating to its shareholder servicing and distribution expenditures.
2. Significant Accounting Policies:
The Funds’ financial statements are prepared in conformity with accounting principles generally accepted in the United States of America (“US GAAP”), which may require management to make estimates and assumptions that affect the reported amounts of assets and liabilities in the financial statements and the reported amounts of increases and decreases in net assets from operations during the reporting period. Actual results could differ from those estimates. The following is a summary of the significant accounting policies followed by the Funds:
Valuation: US GAAP defines fair value as the price the Funds would receive to sell an asset or pay to transfer a liability in an orderly transaction between market participants at the measurement date. The Funds determine the fair values of their financial instruments at market value using independent dealers or pricing services under policies approved by the Board of Trustees of the Trust (the “Board”). The BlackRock Global Valuation Methodologies Committee (the “Global Valuation Committee”) is the committee formed by management to develop global pricing policies and procedures and to provide oversight of the pricing function for the Funds for all financial instruments.
Equity investments traded on a recognized securities exchange or the NASDAQ Stock Market (“NASDAQ”) are valued at the last reported sale price that day or the NASDAQ official closing price, if applicable. For equity investments traded on more than one exchange, the last reported sale price on the exchange where the stock is primarily traded is used. Equity investments traded on a recognized exchange for which there were no sales on that day are valued at the last available bid (long positions) or ask (short positions) price. Swap agreements are valued utilizing quotes received daily by the Funds’ pricing service or through brokers, which are derived using daily swap curves and models that incorporate a number of market data factors, such as discounted cash flows, trades and values of the underlying reference instruments. Certain centrally cleared swaps are valued at the price determined by the relevant exchange or clearing house. Financial futures contracts traded on exchanges are valued at their last sale price. Investments in open-end registered investment companies are valued at NAV each business day. Short-term securities with remaining maturities of 60 days or less may be valued at amortized cost, which approximates fair value.
Securities and other assets and liabilities denominated in foreign currencies are translated into US dollars using exchange rates determined as of the close of business on the New York Stock Exchange (“NYSE”). Foreign currency exchange contracts are valued at the mean between the bid and ask prices and are determined as of the close of business on the NYSE. Interpolated values are derived when the settlement date of the contract is an interim date for which quotations are not available.
In the event that the application of these methods of valuation results in a price for an investment that is deemed not to be representative of the market value of such investment, or if a price is not available, the investment will be valued by the Global Valuation Committee, or its delegate, in accordance with a policy approved by the Board as reflecting fair value (“Fair Value Assets”). When determining the price for Fair Value Assets, the Global Valuation Committee, or its delegate, seeks to determine the price that each Fund might reasonably expect to receive from the current sale of that asset in an arm’s-length transaction. Fair value determinations shall be based upon all available factors that the Global Valuation Committee, or its delegate, deems relevant consistent with the principles of fair value measurements, which include the market approach, income approach and/or in the case of recent investments, the cost approach, as appropriate. The market approach generally consists of using comparable market transactions. The income approach generally is used to discount future cash flows to present value and is adjusted for liquidity as appropriate. These factors include but are not limited to: (i) attributes specific to the investment or asset; (ii) the principal market for the investment or asset; (iii) the customary participants in the principal market for the investment or asset; (iv) data assumptions by market participants for the investment or asset, if reasonably available; (v) quoted prices for similar investments or assets in active markets; and (vi) other factors, such as future cash flows, interest rates, yield curves, volatilities, prepayment speeds, loss severities, credit risks, recovery rates, liquidation amounts and/or default rates. Due to the inherent uncertainty of valuations of such investments, the fair values may differ from the values that would have been used had an active market existed. The Global Valuation Committee, or its delegate, employs various methods for calibrating valuation approaches for investments where an active market does not exist, including regular due diligence of the Funds’ pricing vendors, regular reviews of key inputs and assumptions, transactional back-testing or disposition analysis to compare unrealized gains and losses to realized gains and losses, reviews of missing or stale prices and large movements in market values and reviews of any market related activity. The pricing of all Fair Value Assets is subsequently reported to the Board or a committee thereof on a quarterly basis.
Generally, trading in foreign instruments is substantially completed each day at various times prior to the close of business on the NYSE. Occasionally, events affecting the values of such instruments may occur between the foreign market close and the close of business on the NYSE
| 46 | BLACKROCK FUNDS | JANUARY 31, 2014
|
| |
| Notes to Financial Statements (continued) |
|
that may not be reflected in the computation of the Funds’ net assets. If events (e.g., a company announcement, market volatility or a natural disaster) occur during such periods that are expected to materially affect the value of such instruments, those instruments may be Fair Value Assets and valued at their fair value, as determined in good faith by the Global Valuation Committee, or its delegate, using a pricing service and/or policies approved by the Board. Each business day, the Funds use a pricing service to assist with the valuation of certain foreign exchange-traded equity securities and foreign exchange-traded and Over-the-Counter (“OTC”) options (the “Systematic Fair Value Price”). Using current market factors, the Systematic Fair Value Price is designed to value such foreign securities and foreign options at fair value as of the close of business on the NYSE, which follows the close of the local markets.
Segregation and Collateralization: In cases where the Funds enter into certain investments (e.g., foreign currency exchange contracts and swaps), that would be ”senior securities“ for 1940 Act purposes, the Funds may segregate or designate on their books and records cash or liquid securities having a market value at least equal to the amount of the Funds’ future obligations under such investments. Doing so allows the investment to be excluded from treatment as a “senior security.” Furthermore, if required by an exchange or counterparty agreement, the Funds may be required to deliver/deposit cash and/or securities to/with an exchange, or broker-dealer or custodian as collateral for certain investments or obligations.
Investment Transactions and Investment Income: For financial reporting purposes, investment transactions are recorded on the dates the transactions are entered into (the trade dates). Realized gains and losses on investment transactions are determined on the identified cost basis. Interest income, including amortization and accretion of premiums and discounts on debt securities, is recognized on the accrual basis. Income, expenses and realized and unrealized gains and losses are allocated daily to each class based on its relative net assets.
Dividends and Distributions: Dividends and distributions paid by the Funds are recorded on the ex-dividend dates. The character and timing of dividends and distributions are determined in accordance with federal income tax regulations, which may differ from US GAAP.
Income Taxes: It is each Fund’s policy to comply with the requirements of the Internal Revenue Code of 1986, as amended, applicable to regulated investment companies and to distribute substantially all of its taxable income to its shareholders. Therefore, no federal income tax provision is required.
Each Fund files US federal and various state and local tax returns. No income tax returns are currently under examination. The statute of limitations on Emerging Markets Long/Short Equity’s US federal tax returns remains open for the year ended July 31, 2013 and period ended July 31, 2012. The statute of limitations on Global Long/Short Equity’s US federal tax return remains open for the period ended July 31, 2013. The statutes of limitations on Emerging Markets Long/Short Equity’s state and local tax returns may remain open for an additional year depending upon the jurisdiction.
Management has analyzed tax laws and regulations and their application to the Funds’ facts and circumstances and does not believe there are any uncertain tax positions that require recognition of a tax liability.
Offering Costs: Offering costs are amortized over a 12-month period beginning with the commencement of operations.
Other: Expenses directly related to a Fund or its classes are charged to that Fund or class. Other operating expenses shared by several funds are pro rated among those funds on the basis of relative net assets or other appropriate methods. Expenses directly related to the Funds and other shared expenses pro rated to the Funds are allocated daily to each class based on its relative net assets or other appropriate methods.
The Funds have an arrangement with the custodian whereby fees may be reduced by credits earned on uninvested cash balances, which, if applicable, are shown as fees paid indirectly in the Statements of Operations. The custodian imposes fees on overdrawn cash balances, which can be offset by accumulated credits earned or may result in additional custody charges.
3. Derivative Financial Instruments:
The Funds engage in various portfolio investment strategies using derivative contracts both to increase the returns of the Funds and/or to economically hedge their exposure to certain risks such as equity risk. These contracts may be transacted on an exchange or OTC.
Financial Futures Contracts: The Funds purchase and/or sell financial futures contracts and options on financial futures contracts to gain exposure to, or economically hedge against, changes in interest rates (interest rate risk), changes in the value of equity securities (equity risk) or foreign currencies (foreign currency exchange rate risk). Financial futures contracts are agreements between the Funds and a counterparty to buy or sell a specific quantity of an underlying instrument at a specified price and at a specified date. Depending on the terms of the particular contract, financial futures contracts are settled either through physical delivery of the underlying instrument on the settlement date or by payment of a cash settlement amount on the settlement date.
Upon entering into a financial futures contract, the Funds are required to deposit initial margin with the broker in the form of cash or securities in an amount that varies depending on a contract’s size and risk profile. The initial margin deposit must then be maintained at an established level over the life of the contract. Securities deposited as initial margin are designated on the Schedules of Investments and cash deposited, if any, is recorded on the Statements of Assets and Liabilities as cash pledged for financial futures contracts. Pursuant to the contract, the Funds agree to receive from or pay to the broker an amount of cash equal to the daily fluctuation in value of the contract. Such receipts or payments are known as variation margin. Variation margin is recorded by the Funds as unrealized appreciation or depreciation and, if applicable, as a receivable or payable for variation margin in the Statements of Assets and Liabilities.
| BLACKROCK FUNDS | JANUARY 31, 2014 | 47
|
| |
| Notes to Financial Statements (continued) |
|
When the contract is closed, the Funds record a realized gain or loss equal to the difference between the value of the contract at the time it was opened and the value at the time it was closed. The use of financial futures contracts involves the risk of an imperfect correlation in the movements in the price of financial futures contracts, interest or foreign currency exchange rates and the underlying assets.
Foreign Currency Exchange Contracts: The Funds enter into foreign currency exchange contracts as an economic hedge against either specific transactions or portfolio instruments or to obtain exposure to, or hedge exposure away from, foreign currencies (foreign currency exchange rate risk). A foreign currency exchange contract is an agreement between two parties to buy and sell a currency at a set exchange rate on a future date. Foreign currency exchange contracts, when used by the Funds, help to manage the overall exposure to the currencies, in which some of the investments held by the Funds are denominated. The contract is marked-to-market daily and the change in market value is recorded by the Funds as an unrealized gain or loss. When the contract is closed, the Funds record a realized gain or loss equal to the difference between the value at the time it was opened and the value at the time it was closed. The use of foreign currency exchange contracts involves the risk that the value of a foreign currency exchange contract changes unfavorably due to movements in the value of the referenced foreign currencies.
Swaps: The Funds enter into swap agreements, in which a Fund and a counterparty agree either to make periodic net payments on a specified notional amount or a net payment upon termination. Swap agreements are privately negotiated in the OTC market and may be entered into as a bilateral contract (”OTC swaps“) or centrally cleared (”centrally cleared swaps“). Swaps are marked-to-market daily and changes in value are recorded as unrealized appreciation (depreciation).
For OTC swaps, any upfront premiums paid are recorded as assets and any upfront fees received are recorded as liabilities and are shown as swap premiums paid and swap premiums received, respectively, in the Statements of Assets and Liabilities and amortized over the term of the OTC swap. Payments received or made by the Funds for OTC swaps are recorded in the Statements of Operations as realized gains or losses, respectively. When an OTC swap is terminated, the Funds will record a realized gain or loss equal to the difference between the proceeds from (or cost of) the closing transaction and the Funds’ basis in the contract, if any. Generally, the basis of the contracts is the premium received or paid.
Swap transactions involve, to varying degrees, elements of interest rate, credit and market risk in excess of the amounts recognized in the Statements of Assets and Liabilities. Such risks involve the possibility that there will be no liquid market for these agreements, that the counterparty to the agreements may default on its obligation to perform or disagree as to the meaning of the contractual terms in the agreements, and that there may be unfavorable changes in interest rates and/or market values associated with these transactions.
• | | Total return swaps — The Funds enter into total return swaps to obtain exposure to securities (both long and short) or markets without owning such securities or investing directly in that market or to transfer the risk/return of one market (e.g., fixed income) to another market (e.g., equity) (equity risk and/or interest rate risk). Total return swaps are agreements in which there is an exchange of cash flows whereby one party commits to make payments based on the total return (coupons plus capital gains/losses) of an underlying instrument in exchange for fixed or floating rate interest payments. Certain swaps have no stated expiration and can be terminated by either party at any time. The agreement allows the Manager to change the composition of the basket of securities by trading in and out of the underlying equity positions at its discretion and the resulting gains or losses are recorded in the Statements of Operations. The unrealized appreciation (depreciation) on total return swaps includes dividends on the underlying basket of equity securities and financing income receivable and/or payable due to/from the Funds and the counterparty. To the extent the total return of the instrument or index underlying the transaction exceeds or falls short of the offsetting interest rate obligation, the Funds will receive a payment or make a payment to the counterparty. |
The following is a summary of the Funds’ derivative financial instruments categorized by risk exposure:
Fair Values of Derivative Financial Instruments as of January 31, 2014
| |
| Derivative Assets | |
| | | | | | | Emerging
Markets
Long/Short
Equity | | Global
Long/Short
Equity |
| | | | | Statements of
Assets And
Liabilities Location | | Value | |
Foreign currency exchange contracts | | | | Unrealized appreciation on foreign currency exchange contracts | | | — | | | $ | 6,414 | |
Equity contracts | | | | Unrealized appreciation on OTC swaps | | $ | 13,607,610 | | | | 16,901,357 | |
| | | | | | | | | | | | | | |
Total
| | | | | | | | $ | 13,607,610 | | | $ | 16,907,771 | |
| 48 | BLACKROCK FUNDS | JANUARY 31, 2014
|
| |
| Notes to Financial Statements (continued) |
|
| Derivative Liabilities | |
| | | | | | Emerging
Markets
Long/Short
Equity | | Global
Long/Short
Equity |
| | | | | Statements of Assets And Liabilities Location | | Value | |
Foreign currency exchange contracts | | | | Unrealized depreciation on foreign currency exchange contracts | | | — | | | $ | 1,162 | |
Equity contracts | | | | Net unrealized appreciation/ depreciation1 | | | — | | | | 1,062,683 | |
| | | | | | | | | | | | | | |
Total
| | | | | | | | | — | | | $ | 1,063,845 | |
| 1 | | Includes cumulative appreciation/depreciation on financial futures contracts as reported in the Schedules of Investments. Only current day’s variation margin is reported within the Statements of Assets and Liabilities. |
The Effect of Derivative Financial Instruments in the Statements of Operations
Six Months Ended January 31, 2014 | |
| | | | Net Realized Gain (Loss) From | |
| | | | Emerging
Markets
Long/Short
Equity | | Global
Long/Short
Equity |
Foreign currency exchange contracts: | | | | | | | | | | |
Foreign currency transactions | | | | | — | | | $ | 9,912 | |
Equity contracts: | | | | | | | | | | |
Swaps | | | | $ | 4,858,365 | | | | 7,745,169 | |
Total
| | | | $ | 4,858,365 | | | $ | 7,755,081 | |
| | | | | Net Change in Unrealized
Appreciation/Depreciation on | |
| | | | Emerging
Markets
Long/Short
Equity | | Global
Long/Short
Equity |
Foreign currency exchange contracts: | | | | | | | | | | |
Foreign currency translations | | | | | — | | | $ | 5,154 | |
Equity contracts: | | | | | | | | | | |
Financial futures contracts | | | | | — | | | | (1,062,683 | ) |
Swaps | | | | $ | (21,217,176 | ) | | | 14,862,728 | |
Total
| | | | $ | (21,217,176 | ) | | $ | 13,805,199 | |
For the six months ended January 31, 2014, the average quarterly balances of outstanding derivative financial instruments were as follows:
| | | | | Emerging
Markets
Long/Short
Equity | | Global
Long/Short
Equity |
Financial futures contracts: | | | | | | | | | | |
Average number of contracts — US dollars purchased | | | | | — | | | | 341 | |
Average US dollar amounts purchased | | | | | — | | | $ | 26,143,737 | |
Foreign currency exchange contracts: | | | | | | | | | | |
Average number of contracts — US dollars purchased | | | | | — | | | | 6 | |
Average number of contracts — US dollars sold | | | | | — | | | | 2 | |
Average US dollar amounts purchased | | | | | — | | | $ | 995,687 | |
Average US dollar amounts sold | | | | | — | | | $ | 178,135 | |
Total return swaps: | | | | | | | | | | |
Average number of contracts | | | | | 3 | | | | 4 | |
Average notional value | | | | $ | 129,143,768 | | | $ | (5,527,775 | ) |
Counterparty Credit Risk: A derivative contract may suffer a mark to market loss if the value of the contract decreases due to an unfavorable change in the market rates or values of the underlying instrument. Losses can also occur if the counterparty does not perform under the contract.
The Funds’ risk of loss from counterparty credit risk on OTC derivatives is generally limited to the aggregate unrealized gain netted against any collateral held by such Funds.
In order to better define its contractual rights and to secure rights that will help the Funds mitigate their counterparty risk, the Funds may enter into an International Swaps and Derivatives Association, Inc. Master Agreement (”ISDA Master Agreement“) or similar agreement with its derivative contract counterparties. An ISDA Master Agreement is a bilateral agreement between each Fund and a counterparty that governs certain OTC derivatives and typically contains, among other things, collateral posting terms and netting provisions in the event of a default and/or termination event. Under an ISDA Master Agreement, each Fund may, under certain circumstances, offset with the counterparty certain derivative financial instruments’ payables and/or receivables with collateral held and/or posted and create one single net payment. The provisions of the ISDA Master Agreement typically permit a single net payment in the event of default including the bankruptcy or insolvency of the counterparty. However, bankruptcy or insolvency laws of a particular jurisdiction may impose restrictions on or prohibitions against the right of offset in bankruptcy, insolvency or other events. In addition, certain ISDA Master Agreements allow counterparties to OTC derivatives to terminate derivative contracts prior to maturity in the event the Funds’ net assets decline by a stated percentage or the Funds fail to meet the terms of their ISDA Master Agreements, which would cause the Funds to accelerate payment of any net liability owed to the counterparty.
Collateral Requirements: For derivatives traded under an ISDA Master Agreement, the collateral requirements are typically calculated by netting the mark to market amount for each transaction under such agreement and comparing that amount to the value of any collateral currently pledged by the Funds and the counterparty.
Cash collateral that has been pledged to cover obligations of the Funds and cash collateral received from the counterparty, if any, is reported separately on the Statements of Assets and Liabilities as cash pledged as collateral and cash received as collateral, respectively. Non-cash collateral pledged by the Funds, if any, is noted in the Schedules of Investments. Generally, the amount of collateral due from or to a party has to exceed a minimum transfer amount threshold (e.g., $250,000-$500,000) before a transfer is required, which is determined at the close of business of the Funds and any additional required collateral is delivered to/pledged by the Funds on the next business day. Typically, the Funds and counterparties are not permitted to sell, re-pledge or use the collateral they receive. To the extent amounts due to the Funds from their counterparties are not fully collateralized, contractually or otherwise, the Funds bear the risk of loss from counterparty non-performance. Each Fund attempts to mitigate counterparty risk by entering into agreements only with counterparties that it believes have
| BLACKROCK FUNDS | JANUARY 31, 2014 | 49
|
| |
| Notes to Financial Statements (continued) |
|
the financial resources to honor their obligations and by monitoring the financial stability of those counterparties.
For financial reporting purposes, the Funds do not offset derivative assets and derivative liabilities that are subject to netting arrangements in the Statements of Assets and Liabilities.
At January 31, 2014, the Funds’ derivative assets and liabilities (by type) are as follows:
| | | | Emerging Markets
Long/Short Equity | | | | Global Long/Short Equity | |
| | | | Assets | | Liabilities | |
|
| Assets | | Liabilities |
Derivative Financial Instruments: | | | | | | | | | | | | | | | | | | | | | | |
Financial futures contracts | | | | | — | | | | — | | | | | | | | — | | | $ | 228,470 | |
Foreign currency exchange contracts | | | | | — | | | | — | | | | | | | $ | 6,414 | | | | 1,162 | |
OTC Swaps | | | | $ | 13,607,610 | | | | — | | | | | | | | 16,901,357 | | | | — | |
Total of derivative assets and liabilities in the Statements of Assets and Liabilities | | | | | 13,607,610 | | | | — | | | | | | | | 16,907,771 | | | | 229,632 | |
Derivatives not subject to a master netting agreement or similar agreement (“MNA”) | | | | | — | | | | — | | | | | | | | — | | | | (228,470 | ) |
Total of derivative assets and liabilities subject to MNA | | | | $ | 13,607,610 | | | | — | | | | | | | $ | 16,907,771 | | | $ | 1,162 | |
The following tables present the Funds’ derivative assets and liabilities by counterparty net of amounts available for offset under an MNA and net of the related collateral received by the Fund as of January 31, 2014:
Emerging Markets Long/Short Equity
| |
| Counterparty | | | | Derivative
Assets
Subject to
an MNA by
Counterparty | | Derivatives
Available
for Offset | | Non-cash
Collateral
Received | | Cash
Collateral
Received1 | | Net
Amount of
Derivative
Assets2 |
Goldman Sachs & Co. | | | | $ | 4,231,006 | | | | — | | | | — | | | $ | (2,000,000 | ) | | $ | 2,231,006 | |
Morgan Stanley & Co, Inc. | | | | | 7,684,319 | | | | — | | | | — | | | | (7,684,319 | ) | | | — | |
UBS AG | | | | | 1,692,285 | | | | — | | | | — | | | | (1,692,285 | ) | | | — | |
Total
| | | | $ | 13,607,610 | | | | — | | | | — | | | $ | (11,376,604 | ) | | $ | 2,231,006 | |
Global Long/Short Equity
| |
| Counterparty | | | | Derivative
Assets
Subject to
an MNA by
Counterparty | | Derivatives
Available
for Offset3 | | Non-cash
Collateral
Received | | Cash
Collateral
Received1 | | Net
Amount of
Derivative
Assets2 |
Bank of America NA | | | | $ | 2,452,044 | | | | — | | | | — | | | | — | | | $ | 2,452,044 | |
BNP Paribas S.A. | | | | | 6,008 | | | $ | (1,162 | ) | | | — | | | | — | | | | 4,846 | |
Deutsche Bank AG | | | | | 6,271,369 | | | | — | | | | — | | | $ | (1,800,000 | ) | | | 4,471,369 | |
Goldman Sachs & Co. | | | | | 4,680,951 | | | | — | | | | — | | | | (3,200,000 | ) | | | 1,480,951 | |
State Street Bank & Trust Co. | | | | | 406 | | | | — | | | | — | | | | — | | | | 406 | |
UBS AG | | | | | 3,496,993 | | | | — | | | | — | | | | (3,270,526 | ) | | | 226,467 | |
Total
| | | | $ | 16,907,771 | | | $ | (1,162 | ) | | | — | | | $ | (8,270,526 | ) | | $ | 8,636,083 | |
Global Long/Short Equity
| |
| Counterparty | | | | Derivative
Liabilities
Subject to
an MNA by
Counterparty | | Derivatives
Available
for Offset3 | | Non-cash
Collateral
Pledged | | Cash
Collateral
Pledged | | Net
Amount of
Derivative
Liabilities |
BNP Paribas S.A. | | | | $ | 1,162 | | | $ | (1,162 | ) | | | — | | | | — | | | | — | |
| 1 | | Excess of collateral received from the individual counterparty is not shown for financial reporting purposes. |
| 2 | | Net amount represents the net amount receivable from the counterparty in the event of default. |
| 3 | | The amount of derivatives available for offset is limited to the amount of derivative assets and/or liabilities that are subject to an MNA. |
| 50 | BLACKROCK FUNDS | JANUARY 31, 2014
|
| |
| Notes to Financial Statements (continued) |
|
4. Investment Advisory Agreement and Other Transactions with Affiliates:
The PNC Financial Services Group, Inc. is the largest stockholder and an affiliate, for 1940 Act purposes, of BlackRock, Inc. (“BlackRock”).
The Trust, on behalf of the Funds, entered into an Investment Advisory Agreement with BlackRock Advisors, LLC (”the Manager“), the Funds’ investment advisor, an indirect, wholly owned subsidiary of BlackRock, to provide investment advisory and administration services. The Manager is responsible for the management of each Fund’s portfolio and provides the necessary personnel, facilities, equipment and certain other services necessary to the operations of each Fund. For such services, each Fund pays the Manager a monthly fee based on a percentage of each Fund’s average daily net assets at the following annual rates:
Average Daily Net Assets
| | | | Investment
Advisory Fee |
First $1 Billion | | | | | 1.50 | % |
$1 Billion — $3 Billion | | | | | 1.41 | % |
$3 Billion — $5 Billion | | | | | 1.35 | % |
$5 Billion — $10 Billion | | | | | 1.31 | % |
Greater than $10 Billion | | | | | 1.28 | % |
The Manager voluntarily agreed to waive its advisory fees by the amount of investment advisory fees each Fund pays to the Manager indirectly through its investment in affiliated money market funds. However, the Manager does not waive its investment advisory fees by the amount of investment advisory fees paid in connection with each Fund’s investment in other affiliated investment companies, if any. These amounts are included in fees waived by Manager in the Statements of Operations. For the six months ended January 31, 2014, the amounts waived were as follows:
Emerging Markets Long/Short Equity | | | | $ | 237,859 | |
Global Long/Short Equity | | | | $ | 90,521 | |
The Manager, with respect to each Fund, entered into a sub-advisory agreement with BlackRock Fund Advisors, an affiliate of the Manager. The Manager pays BlackRock Fund Advisors for services it provides, a monthly fee that is a percentage of the investment advisory fees paid by each Fund to the Manager.
The Trust, on behalf of the Funds, entered into a Distribution Agreement and a Distribution and Service Plan with BlackRock Investments, LLC (”BRIL“), an affiliate of the Manager. Pursuant to the Distribution and Service Plan and in accordance with Rule 12b-1 under the 1940 Act, each Fund pays BRIL ongoing service and distribution fees. The fees are accrued daily and paid monthly at annual rates based upon the average daily net assets of the shares of each Fund as follows:
| | | | | Service
Fee | | Distribution
Fee |
Investor A | | | | | 0.25% | | | | — | |
Investor C | | | | | 0.25% | | | | 0.75% | |
Pursuant to sub-agreements with BRIL, broker-dealers and BRIL provide shareholder servicing and distribution services to the Funds. The ongoing service and/or distribution fees compensate BRIL and each broker-dealer for providing shareholder servicing and/or distribution related services to Investor A and Investor C shareholders.
Pursuant to written agreements, certain financial intermediaries, some of which may be affiliates, provide the Funds with sub-accounting, recordkeeping, sub-transfer agency and other administrative services with respect to sub-accounts they service. For these services, these entities receive an asset based fee or an annual fee per shareholder account, which will vary depending on share class and/or net assets.
The Manager maintains a call center, which is responsible for providing certain shareholder services to the Funds, such as responding to shareholder inquiries and processing transactions based upon instructions from shareholders with respect to the subscription and redemption of Fund shares. For the six months ended January 31, 2014, Emerging Markets Long/Short Equity reimbursed the Manager the following amounts for costs incurred in running the call center, which are included in transfer agent —class specific in the Statements of Operations:
| | | | Emerging Markets
Long/Short Equity |
Institutional | | | | $ | 843 | |
Investor A | | | | $ | 742 | |
Investor C | | | | $ | 184 | |
The Trust, on behalf of the Funds, entered into an Administration Agreement with the Manager and State Street Bank and Trust Company as co administrators (together, the ”Administrators“) to provide administrative services (other than investment advice and related portfolio activities). The Administrators receive a combined administration fee computed daily and payable monthly, based on a percentage of the average daily net assets of the Funds. The combined administration fee, which is shown as administration in the Statements of Operations, is paid at the following annual rates:
| Average Daily Net Assets | | | | Administration Fee |
First $500 Million | | | | | 0.075 | % |
$500 Million — $1 Billion | | | | | 0.065 | % |
Greater than $1 Billion | | | | | 0.055 | % |
In addition, each of the share classes is charged an administration fee based on the following percentages of average daily net assets of each respective class:
| Average Daily Net Assets | | | | Administration Fee —
Class Specific |
First $500 Million | | | | | 0.025 | % |
$500 Million — $1 Billion | | | | | 0.015 | % |
Greater than $1 Billion | | | | | 0.005 | % |
For the six months ended January 31, 2014, Emerging Markets Long/Short Equity and Global Long/Short Equity paid the Manager $230,536 and $97,604, respectively, in return for these services, which are included in administration fees, administration fees — class specific and administration fees waived — class specific in the Statements of Operations.
The Administrators may have, at their discretion, voluntarily waived all or any portion of their administration fees for a Fund or a share class, which are included in administration fees waived and administration fees waived - class specific in the Statements of Operations.
| BLACKROCK FUNDS | JANUARY 31, 2014 | 51
|
| |
| Notes to Financial Statements (continued) |
|
The Manager contractually agreed to waive and/or reimburse fees or expenses, excluding interest expense, dividend expense, income tax expense, acquired fund fees and expenses and certain other fund expenses, which constitute extraordinary expenses not incurred in the ordinary course of the Funds’ business, in order to limit expenses as a percentage of average daily net assets as follows: 1.75% for Institutional, 2.00% for Investor A and 2.75% for Investor C. The Manager has agreed not to reduce or discontinue this contractual waiver or reimbursement prior for December 1, 2014 for Emerging Markets Long/Short Equity and Global Long/Short Equity unless approved by the Board, including a majority of the independent trustees or by a vote of the majority of the outstanding voting securities of the Funds.
These amounts are included in fees waived by Manager, administration fees waived, administration fees waived — class specific, transfer agent fees waived and/or reimbursed and fees reimbursed by Manager respectively, in the Statements of Operations.
If during a Fund’s fiscal year the operating expenses of a share class, that at any time during the prior two fiscal years received a waiver or reimbursement from the Manager, are less than the expense limit for that share class, the Manager is entitled to be reimbursed by such share class up to the lesser of (a) the amount of fees waived or expenses reimbursed during those prior two fiscal years under the agreement and (b) the amount by which the expense limit for that share class exceeds the operating expenses of the share class for the current fiscal year, provided that: (1) the Fund, of which the share class is a part, has more than $50 million in assets for the fiscal year and (2) the Manager or an affiliate continues to serve as the Fund’s investment advisor or administrator. In the event the expense limit for a share class is changed subsequent to a fiscal year in which the Manager becomes entitled to reimbursement for fees waived or reimbursed, the amount available to reimburse the Manager shall be calculated by reference to the expense limit for that share class in effect at the time the Manager became entitled to receive such reimbursement, rather than the subsequently changed expense limit for that share class.
For the six months ended January 31, 2014, the Manager recouped the following fund level and class specific waivers and/or reimbursements previously recorded by the Funds:
| | | | | Emerging Markets
Long/Short Equity | | Global Long/
Short Equity |
Fund | | | | $ | 2,347 | | | $ | 86,590 | |
Institutional | | | | $ | 76,399 | | | | — | |
Investor A | | | | $ | 20,142 | | | $ | 393 | |
Investor C | | | | $ | 2,983 | | | $ | 73 | |
On January 31, 2014, the Fund level and class specific waivers and/or reimbursements subject to possible future recoupment under the expense limitation agreement expiring July 31, 2015 are as follows:
| | | | Emerging Markets
Long/Short Equity | | | | Global Long/
Short Equity | |
Expiring July 31,
| | | | 2015 | | 2016 | | | | 2016 | |
Fund | | | | | — | | | | — | | | | | | | $ | 5,642 | |
Institutional | | | | $ | 116,535 | | | $ | 4,208 | | | | | | | $ | 2,781 | |
Investor A | | | | | — | | | | — | | | | | | | $ | 583 | |
Investor C | | | | | — | | | | — | | | | | | | $ | 109 | | |
For the six months ended January 31, 2014, affiliates earned underwriting discounts, direct commissions and dealer concessions on sales of the Funds’ Investor A Shares as follows:
| | | | | Investor A |
Emerging Markets Long/Short Equity | | | | $ | 2,280 | |
Global Long/Short Equity | | | | $ | 27,366 | |
For the six months ended January 31, 2014, affiliates received CDSCs as follows:
| | | | | Investor A | | Investor C |
Emerging Markets Long/Short Equity | | | | $ | 24,028 | | | $ | 5,763 | |
Global Long/Short Equity | | | | | — | | | $ | 5,786 | |
Certain officers and/or trustees of the Trust are officers and/or directors of BlackRock or its affiliates. The Funds reimburse the Manager for a portion of the compensation paid to the Trust’s Chief Compliance Officer, which is included in officer and trustees in the Statements of Operations.
5. Bank Borrowings:
The Trust, on behalf of the Funds, along with certain other funds managed by the Manager and its affiliates (”Participating Funds“), is a party to a 364-day, $800 million credit agreement with a group of lenders, under which the Funds may borrow to fund shareholder redemptions. The agreement expires in April 2014. Excluding commitments designated for a certain individual fund, other Participating Funds, including the Funds, can borrow up to an aggregate commitment amount of $500 million, subject to asset coverage and other limitations as specified in the agreement. The credit agreement has the following terms: a fee of 0.065% per annum on unused commitment amounts and interest at a rate equal to the higher of (a) the one-month LIBOR plus 0.80% per annum or (b) the Fed Funds rate plus 0.80% per annum on amounts borrowed. Participating Funds paid administration and arrangement fees, which, along with commitment fees, were allocated among such funds based upon portions of the aggregate commitment available to them and relative net assets of Participating Funds. The Funds did not borrow under the credit agreement during the six months ended January 31, 2014.
6. Concentration, Market and Credit Risk:
In the normal course of business, the Funds invest in securities and enter into transactions where risks exist due to fluctuations in the market (market risk) or failure of the issuer of a security to meet all its obligations (issuer credit risk). The value of securities held by the Funds may decline in response to certain events, including those directly involving the issuers whose securities are owned by the Funds; conditions affecting the general economy; overall market changes; local, regional or global political, social or economic instability; and currency and interest rate and price fluctuations. Similar to issuer credit risk, the Funds may be exposed to counterparty credit risk, or the risk that an entity with which the Funds have unsettled or open transactions may fail to or be unable to perform on its commitments. The Funds manage counterparty credit risk by entering into transactions only with counterparties that they believe have the financial resources to honor their obligations and by monitoring the financial stability of those counterparties. Financial assets, which potentially
| 52 | BLACKROCK FUNDS | JANUARY 31, 2014
|
| |
| Notes to Financial Statements (continued) |
|
expose the Funds to market, issuer and counterparty credit risks, consist principally of financial instruments and receivables due from counterparties. The extent of the Funds’ exposure to market, issuer and counterparty credit risks with respect to these financial assets is generally approximated by their value recorded in the Statements of Assets and Liabilities, less any collateral held by the Funds.
The Funds invest a substantial amount of their assets in issuers located in a single country or a limited number of countries. When the Funds concentrate their investments in this manner, it assumes the risk that economic, political and social conditions in those countries may have a significant impact on their investment performance. Foreign issuers may not be subject to the same uniform accounting, auditing and financial reporting standards and practices as used in the United States. Foreign securities markets may also be less liquid, more volatile, and less subject to governmental supervision not typically associated with investing in US securities. Please see the Schedules of Investments for concentrations in specific countries.
The Funds invest a significant portion of their assets in securities of issuers located in Europe or with significant exposure to European issuers or countries. The European financial markets have recently experienced volatility and adverse trends due to concerns about economic downturns in, or rising government debt levels of several European countries. These events may spread to other countries in Europe and may affect the value and liquidity of certain of the Funds’ investments.
As of January 31, 2014, the Funds had the following industry classifications:
Emerging Markets Long/Short Equity
| | | | Percent of
Total Investments | |
| Industry | | | | Long | | Short | | Total | |
Oil, Gas & Consumable Fuels | | | | | 5 | % | | | 4 | % | | | 9 | % |
Chemicals | | | | | 4 | | | | 3 | | | | 7 | |
Semiconductors & Semiconductor Equipment | | | | | 3 | | | | 3 | | | | 6 | |
Wireless Telecommunication Services | | | | | 2 | | | | 3 | | | | 5 | |
Metals & Mining | | | | | 3 | | | | 2 | | | | 5 | |
Construction & Engineering | | | | | 2 | | | | 3 | | | | 5 | |
Electronic Equipment, Instruments & Components | | | | | 3 | | | | 1 | | | | 4 | |
Food & Staples Retailing | | | | | 1 | | | | 3 | | | | 4 | |
Food Products | | | | | 1 | | | | 3 | | | | 4 | |
Machinery | | | | | 1 | | | | 2 | | | | 3 | |
Electric Utilities | | | | | 3 | | | | — | | | | 3 | |
Internet Software & Services | | | | | 3 | | | | — | | | | 3 | |
Industrial Conglomerates | | | | | 1 | | | | 1 | | | | 2 | |
Construction Materials | | | | | 2 | | | | — | | | | 2 | |
Beverages | | | | | 1 | | | | 1 | | | | 2 | |
Specialty Retail | | | | | 1 | | | | 1 | | | | 2 | |
Diversified Financial Services | | | | | — | | | | 2 | | | | 2 | |
Communication Equipment | | | | | — | | | | 2 | | | | 2 | |
Independent Power Producers & Energy Traders | | | | | — | | | | 2 | | | | 2 | |
Computers & Peripherals | | | | | 1 | | | | 1 | | | | 2 | |
Real Estate Management & Development | | | | | 1 | | | | 1 | | | | 2 | |
Automobiles | | | | | 2 | | | | — | | | | 2 | |
Transportation Infrastructure | | | | | 2 | | | | — | | | | 2 | |
Textiles, Apparel & Luxury Goods | | | | | 1 | | | | 1 | | | | 2 | |
Other1 | | | | | 12 | | | | 6 | | | | 18 | |
Total
| | | | | 55 | % | | | 45 | % | | | 100 | % |
| | | | | | |
Global Long/Short Equity
| | | | Percent of
Total Investments | |
| Industry | | | | Long | | Short | | Total | |
Oil, Gas & Consumable Fuels | | | | | 8 | % | | | — | | | | 8 | % |
Machinery | | | | | — | | | | 4 | | | | 4 | |
Media | | | | | 4 | | | | — | | | | 4 | |
Internet Software & Services | | | | | 4 | | | | — | | | | 4 | |
Food & Staples Retailing | | | | | — | | | | 4 | | | | 4 | |
Hotels, Restaurants & Leisure | | | | | 2 | | | | 2 | | | | 4 | |
Communications Equipment | | | | | 4 | | | | — | | | | 4 | |
Diversified Telecommunication Services | | | | | 2 | | | | 1 | | | | 3 | |
Metals & Mining | | | | | 2 | | | | 1 | | | | 3 | |
Chemicals | | | | | 2 | | | | 1 | | | | 3 | |
Semiconductors & Semiconductor Equipment | | | | | 2 | | | | 1 | | | | 3 | |
Aerospace & Defense | | | | | 2 | | | | 1 | | | | 3 | |
Beverages | | | | | — | | | | 3 | | | | 3 | |
Textiles, Apparel & Luxury Goods | | | | | — | | | | 3 | | | | 3 | |
Real Estate Investment Trusts (REITs) | | | | | — | | | | 3 | | | | 3 | |
Software | | | | | 1 | | | | 2 | | | | 3 | |
Specialty Retail | | | | | 1 | | | | 2 | | | | 3 | |
Biotechnology | | | | | 1 | | | | 1 | | | | 2 | |
Commercial Services & Supplies | | | | | — | | | | 2 | | | | 2 | |
Household Durables | | | | | — | | | | 2 | | | | 2 | |
Construction Materials | | | | | — | | | | 2 | | | | 2 | |
Commercial Banks | | | | | 1 | | | | 1 | | | | 2 | |
Health Care Equipment & Supplies | | | | | 1 | | | | 1 | | | | 2 | |
Professional Services | | | | | — | | | | 2 | | | | 2 | |
Food Products | | | | | — | | | | 2 | | | | 2 | |
Wireless Telecommunication Services | | | | | 1 | | | | 1 | | | | 2 | |
Multi-Utilities | | | | | — | | | | 2 | | | | 2 | |
Diversified Financial Services | | | | | 2 | | | | — | | | | 2 | |
Other1 | | | | | 10 | | | | 6 | | | | 16 | |
Total
| | | | | 50 | % | | | 50 | % | | | 100 | % |
| 1 | | All other industries held were each 1% or less of investments. |
| BLACKROCK FUNDS | JANUARY 31, 2014 | 53
|
| |
| Notes to Financial Statements (concluded) |
|
7. Capital Share Transactions:
Transactions in capital shares for each class were as follows:
| | | | Six Months Ended
January 31, 2014 | | | | Year Ended
July 31, 2013 | |
| Emerging Markets Long/Short Equity | | | | Shares | | Amount | | | | Shares | | Amount |
Institutional
| | | | | | | | | | | | | | | | | | | | | | |
Shares sold | | | | | 16,662,451 | | | $ | 176,663,690 | | | | | | | | 42,282,366 | | | $ | 450,512,385 | |
Shares issued in reinvestment of dividends | | | | | 185,365 | | | | 1,942,558 | | | | | | | | 83,729 | | | | 893,386 | |
Shares redeemed | | | | | (15,881,800 | ) | | | (167,865,909 | ) | | | | | | | (13,732,266 | ) | | | (146,174,629 | ) |
Net increase | | | | | 966,016 | | | $ | 10,740,339 | | | | | | | | 28,633,829 | | | $ | 305,231,142 | |
|
Investor A
|
Shares sold | | | | | 5,481,233 | | | $ | 57,972,588 | | | | | | | | 17,685,978 | | | $ | 187,908,022 | |
Shares issued in reinvestment of dividends | | | | | 77,828 | | | | 812,385 | | | | | | | | 34,501 | | | | 367,093 | |
Shares redeemed | | | | | (6,131,204 | ) | | | (64,582,583 | ) | | | | | | | (7,506,178 | ) | | | (79,714,999 | ) |
Net increase (decrease) | | | | | (572,143 | ) | | $ | (5,797,610 | ) | | | | | | | 10,214,301 | | | $ | 108,560,116 | |
|
Investor C
|
Shares sold | | | | | 299,272 | | | $ | 3,124,375 | | | | | | | | 1,379,211 | | | $ | 14,538,932 | |
Shares issued in reinvestment of dividends | | | | | 28,486 | | | | 297,780 | | | | | | | | 1,924 | | | | 20,338 | |
Shares redeemed | | | | | (353,648 | ) | | | (3,663,079 | ) | | | | | | | (384,815 | ) | | | (4,044,215 | ) |
Net increase (decrease) | | | | | (25,890 | ) | | $ | (240,924 | ) | | | | | | | 996,320 | | | $ | 10,515,055 | |
Total Net Increase | | | | | 367,983 | | | $ | 4,701,805 | | | | | | | | 39,844,450 | | | $ | 424,306,313 | |
| | | | | | | | | | | | | | | | | | | | | | | |
Global Long/Short Equity
| | | | | | | | | | Period December 20, 20121
to July 31, 2013 | |
Institutional
|
Shares sold | | | | | 28,583,167 | | | $ | 332,930,700 | | | | | | | | 5,825,713 | | | $ | 62,297,256 | |
Shares issued in reinvestment of dividends | | | | | 165,964 | | | | 2,404,061 | | | | | �� | | | — | | | | — | |
Shares redeemed | | | | | (4,065,492 | ) | | | (46,841,314 | ) | | | | | | | (13,898 | ) | | | (155,749 | ) |
Net increase | | | | | 24,683,639 | | | $ | 288,493,447 | | | | | | | | 5,811,815 | | | $ | 62,141,507 | |
|
Investor A
|
Shares sold | | | | | 20,207,579 | | | $ | 236,001,481 | | | | | | | | 1,344,012 | | | $ | 14,968,320 | |
Shares issued in reinvestment of dividends | | | | | 95,680 | | | | 1,395,153 | | | | | | | | — | | | | — | |
Shares redeemed | | | | | (1,033,319 | ) | | | (12,090,676 | ) | | | | | | | (7,137 | ) | | | (79,937 | ) |
Net increase | | | | | 19,269,940 | | | $ | 225,305,958 | | | | | | | | 1,336,875 | | | $ | 14,888,383 | |
|
Investor C
|
Shares sold | | | | | 4,741,042 | | | $ | 54,761,634 | | | | | | | | 230,886 | | | $ | 2,577,446 | |
Shares issued in reinvestment of dividends | | | | | 19,488 | | | | 382,521 | | | | | | | | — | | | | — | |
Shares redeemed | | | | | (92,010 | ) | | | (1,066,678 | ) | | | | | | | (7 | ) | | | (75 | ) |
Net increase | | | | | 4,668,520 | | | $ | 54,077,477 | | | | | | | | 230,879 | | | $ | 2,577,371 | |
Total Net Increase | | | | | 48,622,099 | | | $ | 567,876,882 | | | | | | | | 7,379,569 | | | $ | 79,607,261 | |
| 1 | | Commencement of operations. |
8. Subsequent Events:
Management has evaluated the impact of all subsequent events on each Fund through the date the financial statements were issued and has determined that there were no subsequent events requiring adjustment or additional disclosure in the financial statements.
| 54 | BLACKROCK FUNDS | JANUARY 31, 2014
|
Ronald W. Forbes, Co-Chairman of the Board and Trustee
Rodney D. Johnson, Co-Chairman of the Board and Trustee
Paul L. Audet, Trustee
David O. Beim, Trustee
Henry Gabbay, Trustee
Dr. Matina S. Horner, Trustee
Herbert I. London, Trustee
Ian A. MacKinnon, Trustee
Cynthia A. Montgomery, Trustee
Joseph P. Platt, Trustee
Robert C. Robb, Jr., Trustee
Toby Rosenblatt, Trustee
Kenneth L. Urish, Trustee
Frederick W. Winter, Trustee
John M. Perlowski, President and Chief Executive Officer
Richard Hoerner, CFA, Vice President
Brendan Kyne, Vice President
Neal Andrews, Chief Financial Officer
Jay Fife, Treasurer
Brian Kindelan, Chief Compliance Officer and
Anti-Money Laundering Officer
Benjamin Archibald, Secretary
Investment Advisor and
Co-Administrator
BlackRock Advisors, LLC
Wilmington, DE 19809
Sub-Advisor
BlackRock Fund Advisors
San Francisco, CA 94105
Custodian, Accounting Agent and
Co-Administrator
State Street Bank and Trust Company
Boston, MA 02110
Transfer Agent
BNY Mellon Investment Servicing (US) Inc.
Wilmington, DE 19809
Independent Registered Public Accounting Firm
PricewaterhouseCoopers LLP
Philadelphia, PA 19103
Distributor
BlackRock Investments, LLC
New York, NY 10022
Legal Counsel
Sidley Austin LLP
New York, NY 10019
Address of the Funds
100 Bellevue Parkway
Wilmington, DE 19809
| BLACKROCK FUNDS | JANUARY 31, 2014 | 55
|
General Information
Electronic Delivery
Electronic copies of most financial reports and prospectuses are available on the Funds’ website or shareholders can sign up for e-mail notifications of quarterly statements, annual and semi-annual reports and prospectuses by enrolling in the Funds’ electronic delivery program.
Shareholders Who Hold Accounts with Investment Advisors, Banks or Brokerages:
Please contact your financial advisor. Please note that not all investment advisors, banks or brokerages may offer this service.
Shareholders Who Hold Accounts Directly with BlackRock:
The Funds will mail only one copy of shareholder documents, including prospectuses, annual and semi-annual reports and proxy statements, to shareholders with multiple accounts at the same address. This practice is commonly called “householding” and is intended to reduce expenses and eliminate duplicate mailings of shareholder documents. Mailings of your shareholder documents may be householded indefinitely unless you instruct us otherwise. If you do not want the mailing of these documents to be combined with those for other members of your household, please call the Funds at (800) 441-7762.
The Funds file their complete schedule of portfolio holdings with the SEC for the first and third quarters of each fiscal year on Form N-Q. The Funds’ Forms N-Q are available on the SEC’s website at http://www.sec.gov and may also be reviewed and copied at the SEC’s Public Reference Room in Washington, DC. Information on how to access documents on the SEC’s website without charge may be obtained by calling (800) SEC-0330. The Funds’ Forms N-Q may also be obtained upon request and without charge by calling (800) 441-7762.
A description of the policies and procedures that the Funds use to determine how to vote proxies relating to portfolio securities is available (1) without charge, upon request, by calling (800) 441-7762; (2) at http://www.blackrock.com; and (3) on the SEC’s website at http://www.sec.gov.
Information about how the Funds voted proxies relating to securities held in each Fund’s portfolio during the most recent 12-month period ended June 30 is available upon request and without charge (1) at http://www.blackrock.com or by calling (800) 441-7762 and (2) on the SEC’s website at http://www.sec.gov.
Investor Class shareholders who want to invest regularly can arrange to have $50 or more automatically deducted from their checking or savings account and invested in any of the BlackRock funds.
Investor Class shareholders can establish a systematic withdrawal plan and receive periodic payments of $50 or more from their BlackRock funds, as long as their account balance is at least $10,000.
Shareholders may make investments in conjunction with Traditional, Rollover, Roth, Coverdell, Simple IRAs, SEP IRAs and 403(b) Plans.
BlackRock is committed to maintaining the privacy of its current and former fund investors and individual clients (collectively, “Clients”) and to safeguarding their non-public personal information. The following information is provided to help you understand what personal information BlackRock collects, how we protect that information and why in certain cases we share such information with select parties.
If you are located in a jurisdiction where specific laws, rules or regulations require BlackRock to provide you with additional or different privacy-related rights beyond what is set forth below, then BlackRock will comply with those specific laws, rules or regulations.
BlackRock obtains or verifies personal non-public information from and about you from different sources, including the following: (i) information we receive from you or, if applicable, your financial intermediary, on applications, forms or other documents; (ii) information about your transactions with us, our affiliates, or others; (iii) information we receive from a consumer reporting agency; and (iv) from visits to our websites.
BlackRock does not sell or disclose to non-affiliated third parties any non-public personal information about its Clients, except as permitted by law or as is necessary to respond to regulatory requests or to service Client accounts. These non-affiliated third parties are required to protect the confidentiality and security of this information and to use it only for its intended purpose.
We may share information with our affiliates to service your account or to provide you with information about other BlackRock products or services that may be of interest to you. In addition, BlackRock restricts access to non-public personal information about its Clients to those BlackRock employees with a legitimate business need for the information. BlackRock maintains physical, electronic and procedural safeguards that are designed to protect the non-public personal information of its Clients, including procedures relating to the proper storage and disposal of such information.
BlackRock offers a diverse lineup of open-end mutual funds crossing all investment styles and managed by experts in equity, fixed income and tax-exempt investing.
The report is transmitted to shareholders only. It is not authorized for use as an offer of sale or a solicitation of an offer to buy shares of the Funds unless accompanied or preceded by that Fund’s current prospectus. Past performance results shown in this report should not be considered a representation of future performance. Investment returns and principal value of shares will fluctuate so that shares, when redeemed, may be worth more or less than their original cost. Statements and other information herein are as dated and are subject to change. Please see each Fund’s prospectus for a description of risks associated with global investments.