Washington, D.C. 20549
Name and address of agent for service: John M. Perlowski, Chief Executive Officer, BlackRock Funds, 55 East 52nd Street, New York, NY 10055
JANUARY 31, 2015
| SEMI-ANNUAL REPORT (UNAUDITED) | |  |
BlackRock FundsSM
> | | BlackRock Emerging Markets Long/Short Equity Fund |
> | | BlackRock Global Long/Short Equity Fund |
Not FDIC Insured • May Lose Value • No Bank Guarantee |
Table of Contents
Page |
The Markets in Review | | | | | 3 | |
Semi-Annual Report:
| | | | | | |
Fund Summaries | | | | | 4 | |
About Fund Performance | | | | | 8 | |
Disclosure of Expenses | | | | | 8 | |
Derivative Financial Instruments | | | | | 9 | |
Portfolio Information | | | | | 9 | |
Financial Statements:
| | | | | | |
Schedules of Investments | | | | | 10 | |
Statements of Assets and Liabilities | | | | | 45 | |
Statements of Operations | | | | | 46 | |
Statements of Changes in Net Assets | | | | | 47 | |
Financial Highlights | | | | | 48 | |
Notes to Financial Statements | | | | | 54 | |
Officers and Trustees | | | | | 66 | |
Additional Information | | | | | 67 | |
| 2 | BLACKROCK FUNDS | JANUARY 31, 2015
|
Dear Shareholder,
Market volatility, while remaining below the long-term average level, increased over the course of 2014 and into 2015, driven largely by higher valuations in risk assets (such as equities and high yield bonds), escalating geopolitical risks, uneven global economic growth and expectations around policy moves from the world’s largest central banks. Surprisingly, U.S. interest rates trended lower through the period even as the U.S. Federal Reserve (the “Fed”) gradually reduced its bond buying program, which ultimately ended in October.
The first half of 2014 was generally a strong period for most asset classes; however, volatility ticked up in the summer as geopolitical tensions intensified in Ukraine and the Middle East and investors feared that better U.S. economic indicators may compel the Fed to increase short-term interest rates sooner than previously anticipated. Global credit markets tightened as the U.S. dollar strengthened versus other currencies, ultimately putting a strain on investor flows, and financial markets broadly weakened in the third quarter.
Several themes dominated the markets in the fourth quarter that resulted in the strong performance of U.S. markets versus other areas of the world. Economic growth strengthened considerably in the United States while the broader global economy showed signs of slowing. The European Central Bank and the Bank of Japan took aggressive measures to stimulate growth while the Fed moved toward tighter policy, causing further strengthening in the U.S. dollar. Fixed income investors piled into U.S. Treasuries where yields, although persistently low, were comparatively higher than yields on international sovereign debt, while equity investors favored the relative stability of U.S.-based companies amid rising global risks.
Oil prices, which had been gradually declining since mid-summer, suddenly plummeted in the fourth quarter due to a global supply-and-demand imbalance. Energy stocks sold off sharply and oil-exporting economies struggled, mainly within emerging markets. Conversely, the consumer sectors benefited from lower oil prices as savings at the gas pumps freed up discretionary income for other goods and services.
These trends shifted at the beginning of 2015. U.S. equity markets starkly underperformed international markets due to stretched valuations and uncertainty around the Fed’s pending rate hike. In addition, the stronger U.S. dollar began to hurt earnings of large cap companies. The energy sector continued to struggle, although oil prices showed signs of stabilizing toward the end of January as suppliers became more disciplined in their exploration and production efforts.
At BlackRock, we believe investors need to think globally, extend their scope across a broad array of asset classes and be prepared to move freely as market conditions change over time. We encourage you to talk with your financial advisor and visit blackrock.com for further insight about investing in today’s markets.
Rob Kapito
President, BlackRock Advisors, LLC
Rob Kapito
President, BlackRock Advisors, LLC
Total Returns as of January 31, 2015
| | | | 6-month | | 12-month |
U.S. large cap equities (S&P 500® Index) | | | | | 4.37 | % | | | 14.22 | % |
U.S. small cap equities (Russell 2000® Index) | | | | | 4.72 | | | | 4.41 | |
| International equities (MSCI Europe, Australasia, Far East Index) | | | | | (6.97 | ) | | | (0.43 | ) |
| Emerging market equities (MSCI Emerging Markets Index) | | | | | (9.05 | ) | | | 5.23 | |
| 3-month Treasury bill (BofA Merrill Lynch 3-Month U.S. Treasury Bill Index) | | | | | 0.01 | | | | 0.03 | |
| U.S. Treasury securities (BofA Merrill Lynch 10-Year U.S. Treasury Index) | | | | | 9.29 | | | | 12.25 | |
| U.S. investment grade bonds (Barclays U.S. Aggregate Bond Index) | | | | | 4.36 | | | | 6.61 | |
Tax-exempt municipal
bonds (S&P Municipal
Bond Index) | | | | | 4.51 | | | | 8.81 | |
| U.S. high yield bonds (Barclays U.S. Corporate High Yield 2% Issuer Capped Index) | | | | | (0.89 | ) | | | 2.41 | |
Past performance is no guarantee of future results. Index performance is shown for illustrative purposes only. You cannot invest directly in an index.
| THIS PAGE NOT PART OF YOUR FUND REPORT | | 3
|
| |
| Fund Summary as of January 31, 2015 | BlackRock Emerging Markets Long/Short Equity Fund
|
Investment Objective
BlackRock Emerging Markets Long/Short Equity Fund’s (the “Fund”) investment objective is to seek total return over the long term.
Portfolio Management Commentary
How did the Fund perform?
| • | For the six-month period ended January 31, 2015, the Fund underperformed its benchmark, the BofA Merrill Lynch 3-month U.S. Treasury Bill Index. |
What factors influenced performance?
| • | As part of its investment strategy, the Fund uses derivatives, including total return swaps, to achieve exposure to a market or to hedge market and/or equity risks. Through its use of total return swaps, the Fund’s performance is attributable to stock selection based on bottom-up security analysis coupled with a long-short approach to controlling the Fund’s exposure to trends in emerging markets. The Fund’s net long market position of approximately 20% in emerging markets was the largest detractor from relative return, as emerging market equities declined in the aggregate over the six months. (The net market position is the difference between the Fund’s total long positions and total short positions.) The Fund’s investments in both emerging and developed market companies that generated meaningful revenues via exposure to emerging markets outperformed the broader emerging markets; however, this positive selection was not sufficient to offset the negative impact from a long net market position. |
| • | The Fund experienced positive contributions from positions designed to benefit from declining energy prices, as well as exposures based on the identification of improving country fundamentals in markets such as India, Taiwan and Thailand. The implementation of top-down macro driven |
insights was also additive to performance. At the industry level, the Fund’s positioning was most effective with respect to the energy and semiconductor industries, and was least effective within the chemicals industry.
Describe recent portfolio activity.
| • | As commodity prices tumbled in the fourth quarter of 2014, the Fund began to overweight oil-importing countries and underweight exporters, on the view that structural factors should keep commodity prices range-bound for some period. After profiting from the country and industry positioning around oil in late 2014, the Fund began to trim these positions in January for risk control purposes. |
| • | The Fund’s cash exposure had no material impact on performance as the Fund expresses long and short positions via the use of derivatives. The Fund was fully invested throughout the period. |
Describe portfolio positioning at period end.
| • | The Fund had an approximately 20% net long market exposure in emerging markets at the end of the period. Reflecting the divergent paths for emerging market economies, the Fund continued to have well-balanced exposure to different groups of investment insights in both emerging market stocks and developed market stocks with exposure to emerging markets. Given the recent volatility in oil prices, the Fund had trimmed its exposure to energy. |
The views expressed reflect the opinions of BlackRock as of the date of this report and are subject to change based on changes in market, economic or other conditions. These views are not intended to be a forecast of future events and are no guarantee of future results.
| 4 | BLACKROCK FUNDS | JANUARY 31, 2015
|
| |
| | BlackRock Emerging Markets Long/Short Equity Fund
|
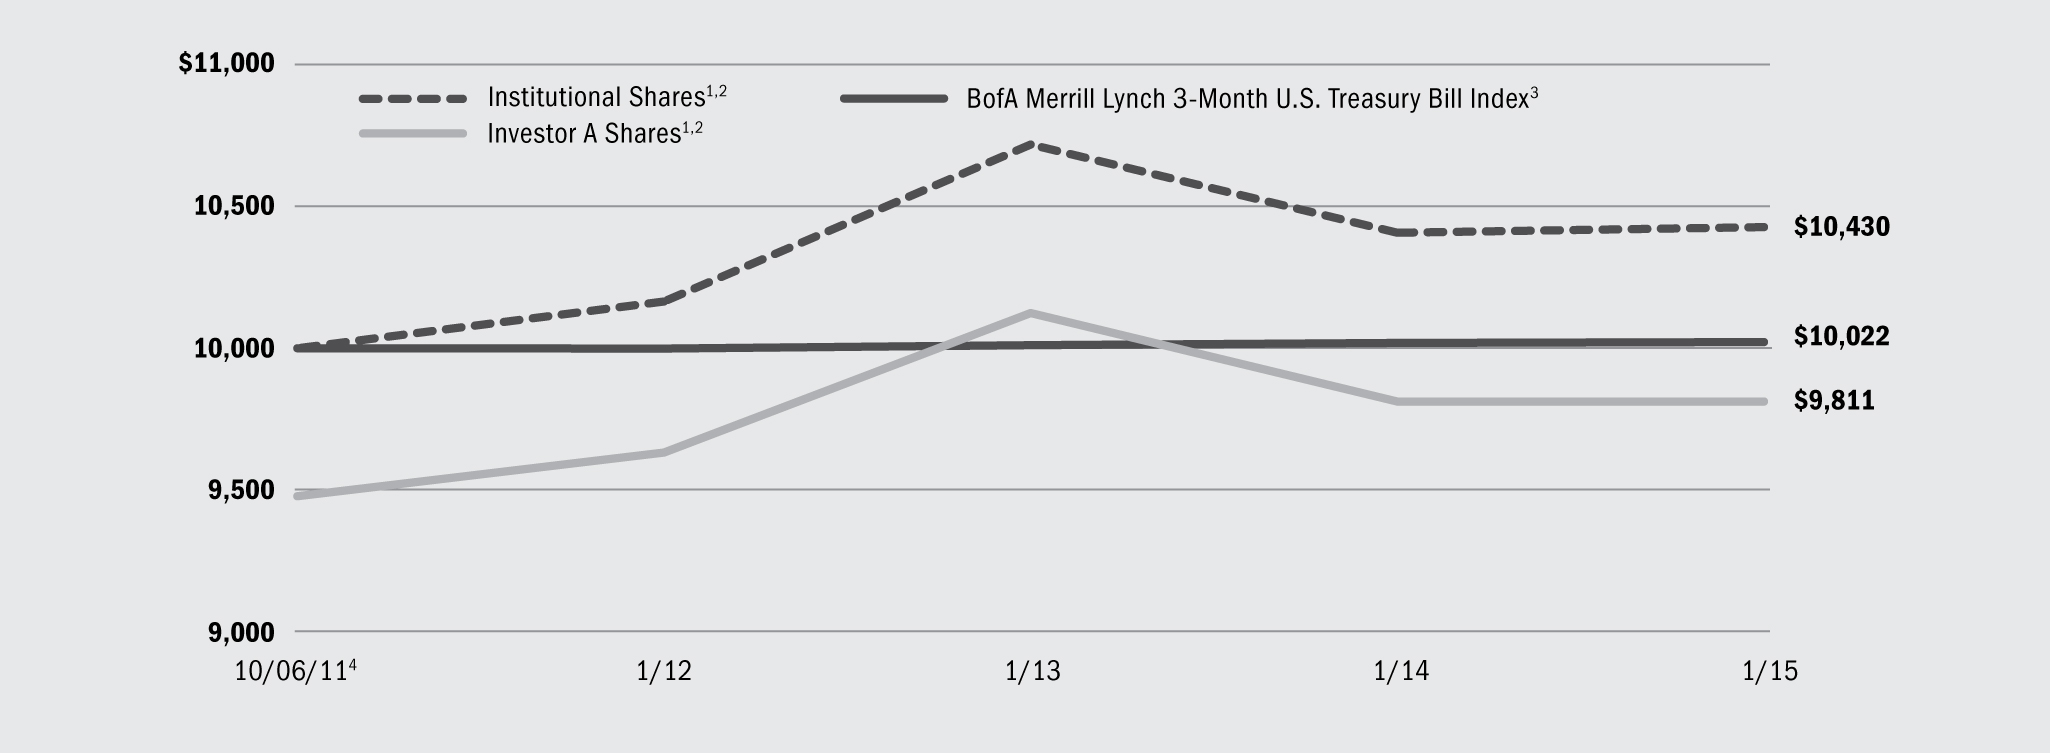
Total Return Based on a $10,000 Investment
| 1 | | Assuming maximum sales charges, if any, transaction costs and other operating expenses, including investment advisory fees. Institutional Shares do not have a sales charge. |
| 2 | | Under normal conditions, the Fund invests at least 80% of its total assets in global equity instruments and related derivative instruments issued by, or tied economically to, companies in emerging markets. |
| 3 | | An unmanaged index that tracks 3-month U.S. Treasury securities. |
| 4 | | Commencement of operations. |
Performance Summary for the Period Ended January 31, 2015
| | | | | | Average Annual Total Returns5
|
| | | | | | 1 Year
|
| | | Since Inception6
|
| | | 6-Month
Total Returns | | | w/o sales
charge | | | w/sales
charge | | | w/o sales
charge | | | w/sales
charge |
Institutional | | (0.19 | )% | | | 0.19 | % | | | N/A | | | | 1.28 | % | | | N/A | |
Investor A | | (0.29 | ) | | | 0.00 | | | | (5.25 | )% | | | 1.06 | | | | (0.57 | )% |
Investor C | | (0.59 | ) | | | (0.69 | ) | | | (1.69 | ) | | | 0.28 | | | | 0.28 | |
BofA Merrill Lynch 3-Month U.S. Treasury Bill Index | | 0.01 | | | | 0.03 | | | | N/A | | | | 0.07 | | | | N/A | |
| 5 | | Assuming maximum sales charges, if any. Average annual total returns with and without sales charges reflect reductions for distribution and service fees. See “About Fund Performance” on page 8 for a detailed description of share classes, including any related sales charges and fees. |
| 6 | | The Fund commenced operations on October 6, 2011. |
| | N/A — Not applicable as share class and index do not have a sales charge. |
| | Past performance is not indicative of future results. |
Expense Example
| | Actual | | Hypothetical8 | | |
| | | Beginning
Account Value
August 1, 2014 | | Ending
Account Value
January 31, 2015 | | Expenses
Paid During
the Period7 | | Beginning
Account Value
August 1, 2014 | | Ending
Account Value
January 31, 2015 | | Expenses
Paid During
the Period7 | | Annualized
Expense
Ratio |
Institutional | | $ | 1,000.00 | | | $ | 998.10 | | | $ | 8.81 | | | $ | 1,000.00 | | | $ | 1,016.38 | | | $ | 8.89 | | | | 1.75 | % |
Investor A | | $ | 1,000.00 | | | $ | 997.10 | | | $ | 10.07 | | | $ | 1,000.00 | | | $ | 1,015.12 | | | $ | 10.16 | | | | 2.00 | % |
Investor C | | $ | 1,000.00 | | | $ | 994.10 | | | $ | 13.77 | | | $ | 1,000.00 | | | $ | 1,011.39 | | | $ | 13.89 | | | | 2.74 | % |
| 7 | | For each class of the Fund, expenses are equal to the annualized net expense ratio for the class, multiplied by the average account value over the period, multiplied by 184/365 (to reflect the one-half year period shown). |
| 8 | | Hypothetical 5% annual return before expenses is calculated by prorating the number of days in the most recent fiscal half year divided by 365. |
See “Disclosure of Expenses” on page 8 for further information on how expenses were calculated.
| BLACKROCK FUNDS | JANUARY 31, 2015 | 5
|
| |
| Fund Summary as of January 31, 2015 | BlackRock Global Long/Short Equity Fund
|
Investment Objective
BlackRock Global Long/Short Equity Fund’s (the “Fund”) investment objective is to seek total return over the long term.
Portfolio Management Commentary
How did the Fund perform?
| • | For the six-month period ended January 31, 2015, the Fund outperformed its benchmark, the BofA Merrill Lynch 3-Month U.S. Treasury Bill Index. |
What factors influenced performance?
| • | As part of its investment strategy, the Fund uses derivatives, including total return swaps, to achieve exposure to a market or to manage market and/or equity risks. Through its use of total return swaps, the Fund’s performance is attributable to stock selection based on bottom-up security analysis coupled with a long-short approach to controlling the Fund’s exposure to trends in global equity markets. The largest positive contribution to performance over the period came from macro/thematic strategies, particularly industry positioning. The Fund also benefited from stock selection in U.S. names. Country selection produced more mixed results. The Fund’s close to 0% net market position over the six months meant that the impact on performance from broader market moves was negligible. (The net market position is the difference between the Fund’s total long positions and total short positions.) At the industry level, the most significant contributor was a long position in the semiconductor industry. Semiconductor manufacturers continued to benefit from the increasingly broad usage of their products and their high exposure to the “internet of things” theme. Semiconductor manufacturers are part of the supply chain in areas as diverse as computer hardware, automobiles, telecommunication services and aerospace & defense. |
| • | A long position in the energy equipment & servicing industry detracted from relative performance. These companies had been attractive and profitable investments for much of 2014 (prior to September), as they benefited from the building out of infrastructure in support of the shale oil fracking boom. Additionally, the industry tends to exhibit a low sensitivity to small movements in oil prices, which the Fund managed via long exposure to airlines, which typically perform well when oil prices drop. Nevertheless, the Fund’s holdings within energy equipment & servicing had a notable negative impact on performance given the dramatic decline in oil prices over the fourth quarter of 2014. |
Describe recent portfolio activity.
| • | The most significant change in the Fund’s positioning over the six-month period was with respect to its relative net positions in the United States and Europe. The Fund entered the period with a net long position in U.S. stocks, where short positions in domestically focused firms were more than offset by long positions in export-focused firms which tend to benefit from a weaker domestic currency and lower cost of labor. However, the outlook for U.S. firms weakened based on a number of trends. These included the impact of a strengthening dollar on exports, signs of slowing momentum in economic numbers, expectations that tighter monetary policy would impede domestic demand, and signs of crowding of capital flows into the United States. |
| • | By contrast, the Fund entered the period short European exporters due to weak trends in company fundamentals and headwinds from strong local currencies. However, European Central Bank actions leading to looser monetary policy than in the United States led to a slight weakening of the euro. In addition, there have been signs of domestic demand returning, and the lack of investor attention to the region is expected to reverse at some point. At period end the Fund had a long position in European stocks. |
| • | The Fund’s cash exposure had no material impact on performance as the Fund expresses long and short positions via the use of derivatives that may require cash collateral. The Fund was fully invested throughout the period. |
Describe portfolio positioning at period end.
| • | The Fund’s net market exposure was essentially neutral, or approximately 0%, at the end of the period. At the country level, the Fund held significant long positions in Spain and Germany as well as Canada, while being short U.K. and U.S. equities. At the industry level, the Fund was long real estate, utilities and energy, while being short consumer staples and retail. |
The views expressed reflect the opinions of BlackRock as of the date of this report and are subject to change based on changes in market, economic or other conditions. These views are not intended to be a forecast of future events and are no guarantee of future results.
| 6 | BLACKROCK FUNDS | JANUARY 31, 2015
|
| |
| | BlackRock Global Long/Short Equity Fund
|
Total Return Based on a $10,000 Investment
| 1 | | Assuming maximum sales charges, if any, transaction costs and other operating expenses, including investment advisory fees. Institutional Shares do not have a sales charge. |
| 2 | | Under normal conditions, the Fund invests at least 80% of its total assets in equity instruments and related derivative instruments issued by, or tied economically to, companies located in developed markets. |
| 3 | | An unmanaged index that tracks 3-month U.S. Treasury securities. |
| 4 | | Commencement of operations. |
Performance Summary for the Period Ended January 31, 2015
| | | Average Annual Total Returns5
|
| | | | 1 Year
| | Since Inception6
|
| | 6-Month
Total Returns | | w/o sales
charge | | w/sales
charge | | w/o sales
charge | | w/sales
charge |
Institutional | | 2.35 | % | | | (0.23 | )% | | | N/A | | | | 9.14 | % | | | N/A | |
Investor A | | 2.19 | | | | (0.48 | ) | | | (5.71 | )% | | | 8.86 | | | | 6.12 | % |
Investor C | | 1.77 | | | | (1.25 | ) | | | (2.23 | ) | | | 8.05 | | | | 8.05 | |
BofA Merrill Lynch 3-Month U.S. Treasury Bill Index | | 0.01 | | | | 0.03 | | | | N/A | | | | 0.05 | | | | N/A | |
| 5 | | Assuming maximum sales charges, if any. Average annual total returns with and without sales charges reflect reductions for distribution and service fees. See “About Fund Performance” on page 8 for a detailed description of share classes, including any related sales charges and fees. |
| 6 | | The Fund commenced operations on December 20, 2012. |
| | N/A — Not applicable as share class and index do not have a sales charge. |
| | Past performance is not indicative of future results. |
Expense Example
| | Actual
| | Hypothetical8
|
| |
|
| Beginning
Account Value
August 1, 2014
|
| Ending
Account Value
January 31, 2015
|
| Expenses
Paid During
the Period7
|
| Beginning
Account Value
August 1, 2014
|
| Ending
Account Value
January 31, 2015
|
| Expenses
Paid During
the Period7
|
| Annualized
Expense
Ratio
|
Institutional | | $ | 1,000.00 | | | $ | 1,023.50 | | | $ | 8.06 | | | $ | 1,000.00 | | | $ | 1,017.24 | | | $ | 8.03 | | | | 1.58 | % |
Investor A | | $ | 1,000.00 | | | $ | 1,021.90 | | | $ | 9.58 | | | $ | 1,000.00 | | | $ | 1,015.73 | | | $ | 9.55 | | | | 1.88 | % |
Investor C | | $ | 1,000.00 | | | $ | 1,017.70 | | | $ | 13.32 | | | $ | 1,000.00 | | | $ | 1,012.00 | | | $ | 13.29 | | | | 2.62 | % |
| 7 | | For each class of the Fund, expenses are equal to the annualized net expense ratio for the class, multiplied by the average account value over the period, multiplied by 184/365 (to reflect the one-half year period shown). |
| 8 | | Hypothetical 5% annual return before expenses is calculated by prorating the number of days in the most recent fiscal half year divided by 365. |
See “Disclosure of Expenses” on page 8 for further information on how expenses were calculated.
| BLACKROCK FUNDS | JANUARY 31, 2015 | 7
|
| • | Institutional Shares are not subject to any sales charge. These shares bear no ongoing distribution or service fees and are available only to certain eligible investors. |
| • | Investor A Shares are subject to a maximum initial sales charge (front-end load) of 5.25% and a service fee of 0.25% per year (but no distribution fee). Certain redemptions of these shares may be subject to a contingent deferred sales charge (“CDSC”) where no initial sales charge was paid at the time of purchase. These shares are generally available through financial intermediaries. |
| • | Investor C Shares are subject to a 1.00% CDSC if redeemed within one year of purchase. In addition, these shares are subject to a distribution fee of 0.75% per year and a service fee of 0.25% per year. These shares are generally available through financial intermediaries. |
Performance information reflects past performance and does not guarantee future results. Current performance may be lower or higher than performance data quoted. Refer to www.blackrock.com/funds to obtain performance data current to the most recent month end. Performance
results do not reflect the deduction of taxes that a shareholder would pay on fund distributions or the redemption of fund shares. Figures shown in each of the performance tables on the previous pages assume reinvestment of all distributions, if any, at net asset value (“NAV”) on the ex-dividend dates. Investment return and principal value of shares will fluctuate so that shares, when redeemed, may be worth more or less than their original cost. Distributions paid to each class of shares will vary because of the different levels of service, distribution and transfer agency fees applicable to each class, which are deducted from the income available to be paid to shareholders.
BlackRock Advisors, LLC (the “Manager”), the Funds’ investment advisor, waived and/or reimbursed a portion of each Fund’s expenses. Without such waiver and/or reimbursement, each Fund’s performance would have been lower. The Manager is under no obligation to waive or reimburse or to continue waiving or reimbursing its fees after the applicable termination date of such agreement. See Note 4 of the Notes to Financial Statements for additional information on waivers and reimbursements.
Shareholders of each Fund may incur the following charges: (a) transactional expenses, such as sales charges; and (b) operating expenses, including investment advisory fees, service and distribution fees, including 12b-1 fees, and other Fund expenses. The expense examples shown on the previous pages (which are based on a hypothetical investment of $1,000 invested on August 1, 2014 and held through January 31, 2015) are intended to assist shareholders both in calculating expenses based on an investment in each Fund and in comparing these expenses with similar costs of investing in other mutual funds.
The expense examples provide information about actual account values and actual expenses. In order to estimate the expenses a shareholder paid during the period covered by this report, shareholders can divide their account value by $1,000 and then multiply the result by the number corresponding to their Fund and share class under the heading entitled “Expenses Paid During the Period.”
The expense examples also provide information about hypothetical account values and hypothetical expenses based on each Fund’s actual expense ratio and an assumed rate of return of 5% per year before expenses. In order to assist shareholders in comparing the ongoing expenses of investing in these Funds and other funds, compare the 5% hypothetical examples with the 5% hypothetical examples that appear in other funds’ shareholder reports.
The expenses shown in the expense examples are intended to highlight shareholders’ ongoing costs only and do not reflect any transactional expenses, such as sales charges, if any. Therefore, the hypothetical examples are useful in comparing ongoing expenses only, and will not help shareholders determine the relative total expenses of owning different funds. If these transactional expenses were included, shareholder expenses would have been higher.
| 8 | BLACKROCK FUNDS | JANUARY 31, 2015
|
| |
| Derivative Financial Instruments |
|
The Funds may invest in various derivative financial instruments. Derivative financial instruments are used to obtain exposure to a security, index and/or market without owning or taking physical custody of securities or to manage market, equity, credit, interest rate, foreign currency exchange rate, commodity and/or other risks. Derivative financial instruments may give rise to a form of economic leverage. Derivative financial instruments also involve risks, including the imperfect correlation between the value of a derivative financial instrument and the underlying asset, possible default of the counterparty to the transaction or illiquidity of the derivative
financial instrument. The Funds’ ability to use a derivative financial instrument successfully depends on the investment advisor’s ability to predict pertinent market movements accurately, which cannot be assured. The use of derivative financial instruments may result in losses greater than if they had not been used, may limit the amount of appreciation a Fund can realize on an investment and/or may result in lower distributions paid to shareholders. The Funds’ investments in these instruments are discussed in detail in the Notes to Financial Statements.
| |
| Portfolio Information as of January 31, 2015 | |
BlackRock Emerging Markets Long/Short Equity Fund
| | | | Percent of Total Investments1
|
Geographic Allocation
|
|
|
| Long
|
| Short
|
| Total
|
| China | | | | | 11 | % | | | 8 | % | | | 19 | % |
| South Korea | | | | | 6 | | | | 6 | | | | 12 | |
| Taiwan | | | | | 4 | | | | 7 | | | | 11 | |
| Hong Kong | | | | | 3 | | | | 7 | | | | 10 | |
| United States | | | | | 5 | | | | 4 | | | | 9 | |
| Brazil | | | | | 3 | | | | 5 | | | | 8 | |
| South Africa | | | | | 3 | | | | 4 | | | | 7 | |
| Thailand | | | | | 2 | | | | 1 | | | | 3 | |
| Turkey | | | | | 1 | | | | 2 | | | | 3 | |
| Mexico | | | | | 2 | | | | 1 | | | | 3 | |
| Japan | | | | | 1 | | | | 1 | | | | 2 | |
| Poland | | | | | — | | | | 2 | | | | 2 | |
| Indonesia | | | | | 1 | | | | 1 | | | | 2 | |
| United Kingdom | | | | | — | | | | 1 | | | | 1 | |
| Malaysia | | | | | — | | | | 1 | | | | 1 | |
| Philippines | | | | | — | | | | 1 | | | | 1 | |
| Malta | | | | | 1 | | | | — | | | | 1 | |
Other2 | | | | | 2 | | | | 3 | | | | 5 | |
Total
| | | | | 45 | % | | | 55 | % | | | 100 | % |
BlackRock Global Long/Short Equity Fund
| | | | Percent of Total Investments1
|
Geographic Allocation
|
|
|
| Long
|
| Short
|
| Total
|
| United States | | | | | 51 | % | | | 20 | % | | | 71 | % |
| Japan | | | | | 4 | | | | 4 | | | | 8 | |
| Canada | | | | | 3 | | | | 1 | | | | 4 | |
| United Kingdom | | | | | 1 | | | | 3 | | | | 4 | |
| Spain | | | | | 2 | | | | — | | | | 2 | |
| Australia | | | | | 1 | | | | 1 | | | | 2 | |
| Germany | | | | | 2 | | | | — | | | | 2 | |
| Hong Kong | | | | | 1 | | | | — | | | | 1 | |
Other2 | | | | | 2 | | | | 4 | | | | 6 | |
Total
| | | | | 67 | % | | | 33 | % | | | 100 | % |
| 1 | | Total investments include the gross notional values of long and short equity securities of the underlying derivative contracts utilized by the Fund and exclude short-term securities. |
| 2 | | Includes holdings within countries representing 1% or less of long-term investments. Please refer to the Schedules of Investments for such countries. |
| BLACKROCK FUNDS | JANUARY 31, 2015 | 9
|
| |
| Schedule of Investments January 31, 2015 (Unaudited) | BlackRock Emerging Markets Long/Short Equity Fund
(Percentages shown are based on Net Assets) |
Short-Term Securities
|
|
|
| Shares
|
| Value
|
| BlackRock Liquidity Funds, TempFund, Institutional Class, 0.07% (a)(b) | | | | | 506,787,730 | | | $ | 506,787,730 | |
Total Short-Term Securities
(Cost — $506,787,730*) — 100.5% | | | | | | | | | 506,787,730 | |
Liabilities in Excess of Other Assets — (0.5)% | | | | | | | | | (2,686,631 | ) |
Net Assets — 100.0% | | | | | | | | $ | 504,101,099 | |
Notes to Schedule of Investments
| * | | | | Cost for federal income tax purposes. |
| (a) | | | | During the six months ended January 31, 2015, investments in issuers considered to be an affiliate of the Fund for purposes of Section 2(a)(3) of the Investment Company Act of 1940, as amended, were as follows: |
Affiliate
|
|
|
| Shares Held at
July 31, 2014
|
| Net
Activity
|
| Shares Held at
January 31, 2015
|
| Income
|
| BlackRock Liquidity Funds, TempFund, Institutional Class | | | | | 591,333,751 | | | | (84,546,021 | ) | | | 506,787,730 | | | $ | 143,783 | |
| (b) | | | | Represents the current yield as of report date. |
| • | | | | Total return swaps outstanding as of January 31, 2015 were as follows:1 |
Reference Entity
|
|
|
| Counterparty
|
| Expiration
Dates
|
| Notional
Amount
|
| Unrealized
Appreciation
|
| Net Value of
Reference
Entities
|
| Equity Securities Long/Short: | | | | Goldman Sachs & Co. | | 1/26/15 — 8/03/16 | | $ | 29,384,796 | | | $ | 5,417,664 | 2 | | $ | 33,840,048 | |
| | | | | Goldman Sachs & Co. | | 8/27/15 — 8/04/16 | | $ | (854,968 | ) | | | 842,245 | 3 | | | (7,921 | ) |
| | | | | Morgan Stanley & Co, Inc. | | 5/16/16 — 1/22/18 | | $ | 33,489,636 | | | | 183,827 | 4 | | | 33,961,483 | |
| | | | | Morgan Stanley & Co, Inc. | | 2/25/16 | | $ | (467,619 | ) | | | 439,064 | 5 | | | (12,012 | ) |
| | | | | UBS AG | | 3/19/15 | | $ | 29,779,219 | | | | 3,187,350 | 6 | | | 32,720,669 | |
| | | | | UBS AG | | 3/19/15 | | $ | (1,086,406 | ) | | | 843,622 | 7 | | | (160,620 | ) |
| |
Total | | | | | | | | | | | | $ | 10,913,772 | | | $ | 100,341,647 | |
| |
| 1 | | The Fund receives or pays the total return on a portfolio of long and short positions underlying the total return swap. In addition, the Fund pays or receives a variable rate of interest, based on a specified benchmark, plus or minus a spread in a range of 20-1200 basis points. The benchmark and spread are determined based upon the country and/or currency of the individual underlying positions. The following are the specified benchmarks used in determining the variable rate of interest: |
IntercontinentalExchange LIBOR:
USD 1 Month; USD Spot Next
Federal Funds Effective Rate — One Day or Overnight
| 2 | | Amount includes $962,412 of dividends and financing fees due to/from the Fund and/or the counterparty. |
| 3 | | Amount includes $(4,802) of dividends and financing fees due to/from the Fund and/or the counterparty. |
| 4 | | Amount includes $(288,020) of dividends and financing fees due to/from the Fund and/or the counterparty. |
| 5 | | Amount includes $(16,543) of dividends and financing fees due to/from the Fund and/or the counterparty. |
| 6 | | Amount includes $245,900 of dividends and financing fees due to/from the Fund and/or the counterparty. |
| 7 | | Amount includes $(82,164) of dividends and financing fees due to/from the Fund and/or the counterparty. |
See Notes to Financial Statements.
| 10 | BLACKROCK FUNDS | JANUARY 31, 2015
|
| |
| Schedule of Investments January 31, 2015 (Unaudited) | BlackRock Emerging Markets Long/Short Equity Fund |
The following table represents the individual long and short positions and related values of equity securities underlying the total return swap with Goldman Sachs & Co. as of January 31, 2015, expiration dates 1/26/15 — 8/03/16:
| | | | | Shares | | Value |
Reference Entity — Long |
Brazil | | | | | | | | | | |
| AES Tiete SA, Preference Shares | | | | | 20,700 | | | $ | 127,753 | |
| AMBEV SA, ADR | | | | | 102,902 | | | | 677,095 | |
| Banco do Brasil SA | | | | | 19,800 | | | | 152,452 | |
| BM&FBovespa SA | | | | | 407,100 | | | | 1,380,643 | |
| Bradespar SA, Preference Shares | | | | | 485,500 | | | | 2,100,682 | |
| Cia Brasileira de Distribuicao Grupo Pao de Acucar, Preference Shares | | | | | 69,400 | | | | 2,304,496 | |
| Cia Energetica de Minas Gerais — ADR | | | | | 3,379 | | | | 15,239 | |
| Cia Energetica de Minas Gerais, Preference Shares | | | | | 103,400 | | | | 458,956 | |
| Cia Energetica de Sao Paulo, Preference B Shares | | | | | 116,400 | | | | 1,022,038 | |
| Cia Paranaense de Energia — ADR | | | | | 11,042 | | | | 128,087 | |
| Cia Paranaense de Energia, Preference B Shares | | | | | 55,200 | | | | 641,849 | |
| Cyrela Brazil Realty SA | | | | | 12,800 | | | | 51,567 | |
| EDP — Energias do Brasil SA | | | | | 326,100 | | | | 1,052,465 | |
| Embraer SA | | | | | 4,900 | | | | 43,353 | |
| Embraer SA, ADR | | | | | 22,222 | | | | 783,548 | |
| Even Construtora e Incorporadora SA | | | | | 518,400 | | | | 836,550 | |
| Gerdau SA, Preference Shares | | | | | 609,400 | | | | 2,068,996 | |
| JBS SA | | | | | 345,500 | | | | 1,473,035 | |
| Light SA | | | | | 10,500 | | | | 55,410 | |
| Metalurgica Gerdau SA, Preference Shares | | | | | 107,900 | | | | 395,690 | |
| MRV Engenharia e Participacoes SA | | | | | 56,400 | | | | 145,243 | |
| Multiplus SA | | | | | 163,000 | | | | 2,110,966 | |
| Petroleo Brasileiro SA — ADR | | | | | 79,460 | | | | 488,679 | |
| Petroleo Brasileiro SA, Preference Shares | | | | | 92,000 | | | | 280,466 | |
| Tractebel Energia SA | | | | | 23,400 | | | | 271,565 | |
| Vale SA, Preference Shares — ADR | | | | | 46,412 | | | | 290,539 | |
| Vale SA, Preference A Shares | | | | | 112,000 | | | | 690,804 | |
| Valid Solucoes e Servicos de Seguranca em Meios de Pagamento e Identificacao S.A | | | | | 28,900 | | | | 414,127 | |
| | | | | | | | | | 20,462,293 | |
China | | | | | | | | | | |
| Agricultural Bank of China Ltd., Class H | | | | | 1,559,000 | | | | 761,281 | |
| Anta Sports Products Ltd. | | | | | 191,000 | | | | 336,553 | |
| Bank of China Ltd., Class H | | | | | 1,200,000 | | | | 669,910 | |
| Beijing Capital International Airport Co. Ltd., Class H | | | | | 888,000 | | | | 843,727 | |
| Beijing Jingneng Clean Energy Co., Ltd., Class H | | | | | 272,000 | | | | 108,768 | |
| China Cinda Asset Management Co., Ltd. | | | | | 3,717,000 | | | | 1,758,135 | |
| China Communications Construction Corp. Ltd., Class H | | | | | 1,598,000 | | | | 1,736,041 | |
| China Communications Services Corp. Ltd., Class H | | | | | 320,000 | | | | 144,100 | |
| China Construction Bank Corp., Class H | | | | | 1,517,000 | | | | 1,214,329 | |
| China Everbright Bank Co., Ltd., Class H | | | | | 398,000 | | | | 212,115 | |
| China Mobile Ltd. | | | | | 359,500 | | | | 4,712,498 | |
| China Railway Group Ltd., Class H | | | | | 555,000 | | | | 405,119 | |
| China Shenhua Energy Co., Ltd., Class H | | | | | 984,500 | | | | 2,702,485 | |
| Country Garden Holdings Co. Ltd. | | | | | 255,000 | | | | 101,606 | |
| Datang International Power Generation Co. Ltd., Class H | | | | | 4,636,000 | | | | 2,534,689 | |
| Dongfeng Motor Group Co. Ltd., Class H | | | | | 2,018,000 | | | | 2,918,513 | |
| Greentown China Holdings Ltd. | | | | | 1,059,000 | | | | 926,179 | |
| Guangzhou Pharmaceutical Co., Ltd. | | | | | 326,000 | | | | 1,154,430 | |
| Guangzhou R&F Properties Co., Ltd., Class H | | | | | 506,400 | | | | 574,132 | |
| Industrial and Commercial Bank of China Ltd., Class H | | | | | 2,468,000 | | | | 1,759,997 | |
| Jiangsu Expressway Co., Ltd., Class H | | | | | 1,336,000 | | | | 1,658,216 | |
| Longfor Properties Co. Ltd. | | | | | 130,500 | | | | 171,443 | |
| Lonking Holdings Ltd. | | | | | 2,050,000 | | | | 387,784 | |
| Metallurgical Corp. of China, Ltd. | | | | | 2,760,000 | | | | 851,762 | |
| | | | | Shares | | Value |
Reference Entity — Long
|
China (concluded) | | | | | | | | | | |
| Ping An Insurance Group Co. of China Ltd., Class H | | | | | 91,000 | | | $ | 964,503 | |
| Shanghai Industrial Holdings Ltd. | | | | | 494,000 | | | | 1,459,448 | |
| Shanghai Pharmaceuticals Holding Co., Ltd., Class H | | | | | 316,300 | | | | 684,923 | |
| Sino-Ocean Land Holdings Ltd. | | | | | 825,000 | | | | 527,556 | |
| Sinopharm Group Co., Class H | | | | | 110,800 | | | | 403,429 | |
| Zhejiang Expressway Co., Ltd., Class H | | | | | 2,395,218 | | | | 3,048,076 | |
| | | | | | | | | | 35,731,747 | |
Hong Kong | | | | | | | | | | |
| China Merchants Holdings International Co., Ltd. | | | | | 238,000 | | | | 874,615 | |
| China Mobile, Ltd., ADR | | | | | 5,338 | | | | 348,678 | |
| China Power International Development, Ltd. | | | | | 9,257,000 | | | | 5,255,774 | |
| China Resources Cement Holdings Ltd. | | | | | 3,264,000 | | | | 1,937,004 | |
| China Resources Land Ltd. | | | | | 276,888 | | | | 708,345 | |
| China Resources Power Holdings Co., Ltd. | | | | | 42,000 | | | | 117,599 | |
| China Travel International Inv HK | | | | | 950,000 | | | | 311,748 | |
| China Unicom Hong Kong Ltd. | | | | | 242,000 | | | | 362,225 | |
| China Unicom Hong Kong, Ltd., ADR | | | | | 26,870 | | | | 401,706 | |
| COSCO Pacific Ltd. | | | | | 1,460,000 | | | | 2,112,735 | |
| CSPC Pharmaceutical Group Ltd. | | | | | 2,972,000 | | | | 2,507,164 | |
| Franshion Properties China Ltd. | | | | | 3,074,000 | | | | 902,527 | |
| GOME Electrical Appliances Holding Ltd. | | | | | 26,552,000 | | | | 3,654,954 | |
| Guangdong Investment Ltd. | | | | | 244,000 | | | | 327,530 | |
| Kingboard Chemical Holdings Ltd. | | | | | 244,500 | | | | 395,435 | |
| KWG Property Holding Ltd. | | | | | 2,286,500 | | | | 1,460,290 | |
| Poly Property Group Co. Ltd. | | | | | 236,000 | | | | 108,414 | |
| REXLot Holdings, Ltd. | | | | | 6,175,000 | | | | 482,218 | |
| Shenzhen Investment Ltd. | | | | | 2,062,000 | | | | 595,116 | |
| Shimao Property Holdings Ltd. | | | | | 1,267,000 | | | | 2,659,434 | |
| Sino Biopharmaceutical Ltd. | | | | | 1,536,000 | | | | 1,534,450 | |
| Skyworth Digital Holdings Ltd. | | | | | 184,000 | | | | 103,765 | |
| Yuexiu Property Co., Ltd. | | | | | 370,000 | | | | 71,910 | |
| | | | | | | | | | 27,233,636 | |
Indonesia | | | | | | | | | | |
| Adaro Energy Tbk PT | | | | | 2,166,500 | | | | 170,235 | |
| Indo Tambangraya Megah Tbk PT | | | | | 86,700 | | | | 114,240 | |
| Matahari Putra Prima Tbk PT | | | | | 9,648,900 | | | | 2,894,480 | |
| Perusahaan Gas Negara Persero Tbk PT | | | | | 2,401,300 | | | | 953,954 | |
| Perusahaan Perkebunan London Sumatra Indonesia Tbk PT | | | | | 467,600 | | | | 67,682 | |
| Tambang Batubara Bukit Asam Persero Tbk PT | | | | | 127,700 | | | | 114,129 | |
| United Tractors Tbk PT | | | | | 860,600 | | | | 1,211,002 | |
| | | | | | | | | | 5,525,722 | |
Malaysia | | | | | | | | | | |
| British American Tobacco Malaysia Bhd | | | | | 167,700 | | | | 3,048,484 | |
| Tenaga Nasional Bhd | | | | | 51,900 | | | | 207,004 | |
| YTL Power International Bhd | | | | | 86,400 | | | | 38,061 | |
| | | | | | | | | | 3,293,549 | |
Mexico | | | | | | | | | | |
| Grupo Aeroportuario del Pacifico SAB de CV, Class B | | | | | 415,904 | | | | 2,749,664 | |
| Grupo Aeroportuario del Pacifico SAB de CV — ADR | | | | | 21,914 | | | | 1,455,308 | |
| Grupo Bimbo SAB de CV, Series A | | | | | 588,934 | | | | 1,498,512 | |
| Wal-Mart de Mexico SAB de CV, Series V | | | | | 48,700 | | | | 94,057 | |
| | | | | | | | | | 5,797,541 | |
Peru | | | | | | | | | | |
| Compania de Minas Buenaventura SA — ADR | | | | | 4,920 | | | | 56,186 | |
Philippines | | | | | | | | | | |
| Globe Telecom, Inc. | | | | | 16,005 | | | | 631,742 | |
| Jollibee Foods Corp. | | | | | 60,960 | | | | 320,042 | |
| Universal Robina Corp. | | | | | 160,490 | | | | 752,952 | |
| | | | | | | | | | 1,704,736 | |
See Notes to Financial Statements.
| BLACKROCK FUNDS | JANUARY 31, 2015 | 11
|
| |
| Schedule of Investments (continued) | BlackRock Emerging Markets Long/Short Equity Fund |
| | | | | Shares | | Value |
Reference Entity — Long
|
Poland | | | | | | | | | | |
| Enea SA | | | | | 227,995 | | | $ | 1,012,988 | |
| Grupa Lotos SA | | | | | 59,150 | | | | 390,314 | |
| KGHM Polska Miedz SA | | | | | 25,653 | | | | 727,252 | |
| PGE SA | | | | | 341,060 | | | | 1,787,087 | |
| Polski Koncern Naftowy Orlen SA | | | | | 123,137 | | | | 1,816,833 | |
| Polskie Gornictwo Naftowe i Gazownictwo SA | | | | | 313,738 | | | | 370,211 | |
| Tauron Polska Energia SA | | | | | 168,088 | | | | 226,140 | |
| | | | | | | | | | 6,330,825 | |
South Africa | | | | | | | | | | |
| AngloGold Ashanti Ltd. | | | | | 10,418 | | | | 126,359 | |
| Bidvest Group Ltd. | | | | | 92,259 | | | | 2,546,218 | |
| Clicks Group, Ltd. | | | | | 131,911 | | | | 1,023,117 | |
| Exxaro Resources Ltd. | | | | | 39,918 | | | | 353,692 | |
| FirstRand Ltd. | | | | | 1,223,442 | | | | 5,444,774 | |
| Gold Fields Ltd. | | | | | 17,133 | | | | 98,700 | |
| Gold Fields, Ltd., ADR | | | | | 190,918 | | | | 1,126,416 | |
| Liberty Holdings Ltd. | | | | | 76,893 | | | | 865,665 | |
| Mediclinic International, Ltd. | | | | | 37,359 | | | | 369,406 | |
| MTN Group Ltd. | | | | | 49,493 | | | | 854,680 | |
| Netcare Ltd. | | | | | 1,784,715 | | | | 5,924,962 | |
| Sanlam Ltd. | | | | | 154,574 | | | | 926,477 | |
| Sibanye Gold, Ltd. | | | | | 459,730 | | | | 1,243,061 | |
| | | | | | | | | | 20,903,527 | |
South Korea | | | | | | | | | | |
| AfreecaTV Co., Ltd. | | | | | 2,797 | | | | 72,520 | |
| Amorepacific Corp. | | | | | 322 | | | | 776,024 | |
| Cell Biotech Co., Ltd. | | | | | 10,709 | | | | 571,682 | |
| Doosan Infracore Co., Ltd. | | | | | 94,925 | | | | 878,881 | |
| Hanjin Kal Corp. | | | | | 1 | | | | 30 | |
| Hyundai Mobis | | | | | 1,617 | | | | 365,552 | |
| Hyundai Steel Co. | | | | | 803 | | | | 48,177 | |
| Kangwon Land, Inc. | | | | | 47,459 | | | | 1,399,533 | |
| Kia Motors Corp. | | | | | 49,510 | | | | 2,069,125 | |
| Korea Electric Power Corp. | | | | | 1,600 | | | | 62,558 | |
| Korea Investment Holdings Co., Ltd. | | | | | 2,726 | | | | 128,465 | |
| Korea Line Corp. | | | | | 58,285 | | | | 1,167,725 | |
| Korean Reinsurance Co. | | | | | 7 | | | | 65 | |
| KT Skylife Co., Ltd. | | | | | 27,850 | | | | 411,252 | |
| KT Submarine Co., Ltd. | | | | | 18,442 | | | | 85,580 | |
| LG Corp. | | | | | 34,844 | | | | 1,960,941 | |
| Lotte Confectionery Co., Ltd. | | | | | 143 | | | | 243,694 | |
| Lotte Food Co., Ltd. | | | | | 504 | | | | 285,026 | |
| LS Corp. | | | | | 17,212 | | | | 754,461 | |
| LS Industrial Systems Co., Ltd. | | | | | 6,633 | | | | 365,589 | |
| Mando Corp. | | | | | 20,606 | | | | 1,186,467 | |
| Medy-Tox, Inc. | | | | | 1,337 | | | | 449,247 | |
| Mirae Asset Securities Co., Ltd. | | | | | 1,780 | | | | 74,907 | |
| Poongsan Corp. | | | | | 1,137 | | | | 23,508 | |
| POSCO — ADR | | | | | 1,671 | | | | 97,302 | |
| SK Innovation Co., Ltd. | | | | | 5,150 | | | | 437,335 | |
| SK Networks Co., Ltd. | | | | | 88,276 | | | | 756,175 | |
| SK Telecom Co., Ltd. | | | | | 246 | | | | 64,468 | |
| SK Telecom Co., Ltd., ADR | | | | | 104,968 | | | | 3,017,830 | |
| SKC Co., Ltd. | | | | | 13,407 | | | | 368,177 | |
| Sungwoo Hitech Co., Ltd. | | | | | 26,622 | | | | 293,649 | |
| Tovis Co., Ltd. | | | | | 7,042 | | | | 126,644 | |
| | | | | | | | | | 18,542,589 | |
Taiwan | | | | | | | | | | |
| Advanced Semiconductor Engineering, Inc. | | | | | 160,000 | | | | 200,915 | |
| Advanced Semiconductor Engineering, Inc. — ADR | | | | | 22,869 | | | | 151,164 | |
| Asia Cement Corp. | | | | | 422,000 | | | | 508,771 | |
| Chicony Electronics Co., Ltd. | | | | | 428,000 | | | | 1,174,447 | |
| Chimei Innolux Corp. | | | | | 4,858,000 | | | | 2,340,405 | |
| | | | | Shares | | Value |
Reference Entity — Long
|
Taiwan (concluded) | | | | | | | | | | |
| Chimei Materials Technology Corp. | | | | | 2,360,355 | | | $ | 2,383,640 | |
| China Steel Chemical Corp. | | | | | 166,000 | | | | 802,655 | |
| CTCI Corp. | | | | | 193,000 | | | | 304,976 | |
| Elan Microelectronics Corp. | | | | | 336,000 | | | | 525,432 | |
| Everlight Electronics Co., Ltd. | | | | | 123,000 | | | | 295,045 | |
| Far Eastern Department Stores Co., Ltd. | | | | | 1,279,508 | | | | 1,091,661 | |
| Foxconn Technology Co., Ltd. | | | | | 353,000 | | | | 955,799 | |
| King Yuan Electronics Co., Ltd. | | | | | 3,907,000 | | | | 3,263,926 | |
| Pegatron Corp. | | | | | 403,000 | | | | 1,071,609 | |
| President Chain Store Corp. | | | | | 10,000 | | | | 76,873 | |
| Sigurd Microelectronics Corp. | | | | | 2,336,000 | | | | 2,224,219 | |
| Siliconware Precision Industries Co. | | | | | 1,450,000 | | | | 2,445,035 | |
| Sitronix Technology Corp. | | | | | 100,000 | | | | 327,408 | |
| Soft-World International Corp. | | | | | 72,000 | | | | 228,119 | |
| Taiwan Cement Corp. | | | | | 1,279,000 | | | | 1,726,795 | |
| Taiwan Semiconductor Manufacturing Co., Ltd. | | | | | 255,000 | | | | 1,121,395 | |
| Unity Opto Technology Co., Ltd. | | | | | 125,000 | | | | 115,737 | |
| Win Semiconductors Corp. | | | | | 139,000 | | | | 146,016 | |
| Wistron Corp. | | | | | 1,770,000 | | | | 1,613,691 | |
| Yuanta Financial Holding Co., Ltd. | | | | | 3,727,500 | | | | 1,788,184 | |
| | | | | | | | | | 26,883,917 | |
Thailand | | | | | | | | | | |
| PTT PCL | | | | | 251,700 | | | | 2,660,807 | |
Turkey | | | | | | | | | | |
| Enka Insaat ve Sanayi AS | | | | | 897,342 | | | | 1,812,903 | |
| KOC Holding AS | | | | | 25,003 | | | | 129,647 | |
| Koza Altin Isletmeleri AS | | | | | 30,199 | | | | 238,850 | |
| Pegasus Hava Tasimaciligi AS | | | | | 24,784 | | | | 307,030 | |
| Tofas Turk Otomobil Fabrikasi AS | | | | | 113,768 | | | | 757,336 | |
| Tupras Turkiye Petrol Rafinerileri AS | | | | | 7,654 | | | | 165,891 | |
| Turk Telekomunikasyon AS | | | | | 183,885 | | | | 550,155 | |
| | | | | | | | | | 3,961,812 | |
United Kingdom | | | | | | | | | | |
| Old Mutual PLC | | | | | 88,659 | | | | 277,896 | |
Total Reference Entity — Long | | | | | | | | | 179,366,783 | |
| |
Reference Entity — Short |
Brazil | | | | | | | | | | |
| Aliansce Shopping Centers SA | | | | | (18,000 | ) | | | (108,003 | ) |
| Equatorial Energia SA | | | | | (71,101 | ) | | | (662,452 | ) |
| Gafisa SA | | | | | (174,000 | ) | | | (123,209 | ) |
| Marcopolo SA, Preferred Shares | | | | | (1,398,700 | ) | | | (1,397,006 | ) |
| Oi SA | | | | | (5,898 | ) | | | (10,969 | ) |
| Smiles SA | | | | | (240,600 | ) | | | (3,788,447 | ) |
| | | | | | | | | | (6,090,086 | ) |
China | | | | | | | | | | |
| AAC Technologies Holdings, Inc. | | | | | (588,500 | ) | | | (3,760,933 | ) |
| Airtac International Group | | | | | (262,000 | ) | | | (2,274,790 | ) |
| AviChina Industry & Technology Co., Ltd. | | | | | (6,292,000 | ) | | | (4,065,483 | ) |
| China Coal Energy Co., Ltd. | | | | | (1,323,000 | ) | | | (728,839 | ) |
| China COSCO Holdings Co., Ltd., Class H | | | | | (429,000 | ) | | | (212,052 | ) |
| China Eastern Airlines Corp., Ltd., Class H, Class H | | | | | (370,000 | ) | | | (187,648 | ) |
| China Longyuan Power Group Corp., Class H | | | | | (29,000 | ) | | | (31,125 | ) |
| China Molybdenum Co., Ltd., Class H | | | | | (1,267,000 | ) | | | (801,617 | ) |
| China Shanshui Cement Group, Ltd. | | | | | (2,165,000 | ) | | | (950,772 | ) |
| China Shipping Container Lines Co., Ltd. | | | | | (457,000 | ) | | | (143,418 | ) |
| China Tian Lun Gas Holdings, Ltd. | | | | | (78,000 | ) | | | (82,001 | ) |
| CITIC Securities Co., Ltd., Class H | | | | | (488,000 | ) | | | (1,567,820 | ) |
| CNOOC, Ltd. | | | | | (211,000 | ) | | | (279,968 | ) |
| Dongfang Electric Corp., Ltd., Class H | | | | | (638,400 | ) | | | (1,400,146 | ) |
| ENN Energy Holdings Ltd. | | | | | (142,000 | ) | | | (839,399 | ) |
See Notes to Financial Statements.
| 12 | BLACKROCK FUNDS | JANUARY 31, 2015
|
| |
| Schedule of Investments (continued) | BlackRock Emerging Markets Long/Short Equity Fund |
| | | | | Shares | | Value |
Reference Entity — Short |
China (concluded) | | | | | | | | | | |
| First Tractor Co., Ltd., Class H, Class H | | | | | (350,000 | ) | | $ | (257,233 | ) |
| Great Wall Motor Co., Ltd. | | | | | (54,000 | ) | | | (308,226 | ) |
| Haitian International Holdings, Ltd. | | | | | (57,000 | ) | | | (110,511 | ) |
| Hengan International Group Co., Ltd. | | | | | (81,500 | ) | | | (967,414 | ) |
| Hilong Holding, Ltd. | | | | | (14,000 | ) | | | (4,322 | ) |
| Lenovo Group, Ltd. | | | | | (920,000 | ) | | | (1,184,587 | ) |
| PetroChina Co., Ltd. | | | | | (2,382,000 | ) | | | (2,586,617 | ) |
| Semiconductor Manufacturing International Corp. | | | | | (8,998,000 | ) | | | (779,935 | ) |
| Shanghai Electric Group Co., Ltd. | | | | | (1,242,000 | ) | | | (761,537 | ) |
| Shui On Land Ltd. | | | | | (5,799,000 | ) | | | (1,305,426 | ) |
| Sinopec Shanghai Petrochemical Co., Ltd., Class H | | | | | (1,276,000 | ) | | | (369,314 | ) |
| SOHO China, Ltd. | | | | | (1,380,500 | ) | | | (958,749 | ) |
| Sohu.com, Inc. | | | | | (2,199 | ) | | | (123,452 | ) |
| TCL Communication Technology Holdings, Ltd. | | | | | (798,000 | ) | | | (702,943 | ) |
| Tingyi Cayman Islands Holding Corp. | | | | | (634,000 | ) | | | (1,561,618 | ) |
| Uni-President China Holdings, Ltd. | | | | | (3,409,000 | ) | | | (2,946,261 | ) |
| Weichai Power Co., Ltd., Class H | | | | | (748,000 | ) | | | (2,959,170 | ) |
| Yanzhou Coal Mining Co., Ltd., Class H | | | | | (1,062,000 | ) | | | (844,547 | ) |
| | | | | | | | | | (36,057,873 | ) |
Hong Kong | | | | | | | | | | |
| Brilliance China Automotive Holdings Ltd. | | | | | (2,314,000 | ) | | | (4,244,557 | ) |
| China Agri-Industries Holdings Ltd. | | | | | (268,000 | ) | | | (108,249 | ) |
| China Everbright International, Ltd. | | | | | (2,829,000 | ) | | | (4,173,977 | ) |
| China Gas Holdings, Ltd. | | | | | (130,000 | ) | | | (200,921 | ) |
| China Mengniu Dairy Co., Ltd. | | | | | (160,000 | ) | | | (729,049 | ) |
| China Oceanwide Holdings, Ltd. | | | | | (5,098,000 | ) | | | (548,363 | ) |
| China Resources Enterprise, Ltd. | | | | | (1,947,985 | ) | | | (4,264,854 | ) |
| Kunlun Energy Co., Ltd. | | | | | (166,000 | ) | | | (172,841 | ) |
| Lee & Man Paper Manufacturing, Ltd. | | | | | (67,000 | ) | | | (35,178 | ) |
| Towngas China Co., Ltd. | | | | | (78,000 | ) | | | (68,118 | ) |
| | | | | | | | | | (14,546,107 | ) |
Indonesia | | | | | | | | | | |
| Charoen Pokphand Indonesia Tbk PT | | | | | (1,470,500 | ) | | | (456,731 | ) |
| Sawit Sumbermas Sarana Tbk PT | | | | | (2,547,500 | ) | | | (331,471 | ) |
| Siloam International Hospitals Tbk PT | | | | | (95,000 | ) | | | (100,493 | ) |
| Surya Citra Media Tbk PT | | | | | (2,749,400 | ) | | | (738,049 | ) |
| Tower Bersama Infrastructure Tbk PT | | | | | (317,500 | ) | | | (237,736 | ) |
| XL Axiata Tbk PT | | | | | (1,329,500 | ) | | | (502,035 | ) |
| | | | | | | | | | (2,366,515 | ) |
Malaysia | | | | | | | | | | |
| Berjaya Sports Toto BHD | | | | | (79 | ) | | | (74 | ) |
Mexico | | | | | | | | | | |
| Alsea SAB de C.V. | | | | | (327,400 | ) | | | (876,299 | ) |
| Cemex SAB de CV | | | | | (1,600,800 | ) | | | (1,421,438 | ) |
| Cemex SAB de CV — ADR | | | | | (108,196 | ) | | | (961,862 | ) |
| Empresas ICA SAB de CV | | | | | (608,937 | ) | | | (632,519 | ) |
| Fibra Uno Administracion SA de CV | | | | | (2,291,200 | ) | | | (6,908,986 | ) |
| Grupo Carso SAB de C.V. | | | | | (35,300 | ) | | | (154,416 | ) |
| Grupo Televisa SAB | | | | | (13,500 | ) | | | (87,866 | ) |
| Grupo Televisa SAB, ADR | | | | | (10,149 | ) | | | (330,959 | ) |
| Mexichem SAB de CV | | | | | (16,000 | ) | | | (44,362 | ) |
| Mexico Real Estate Management SA de C.V. | | | | | (1,452,378 | ) | | | (2,391,320 | ) |
| Minera Frisco SAB de CV, Series A-1 | | | | | (300,800 | ) | | | (394,123 | ) |
| | | | | | | | | | (14,204,150 | ) |
Poland | | | | | | | | | | |
| Grupa Azoty SA | | | | | (5,215 | ) | | | (99,727 | ) |
South Africa | | | | | | | | | | |
| Aspen Pharmacare Holdings, Ltd. | | | | | (6,252 | ) | | | (234,103 | ) |
| Discovery Holdings Ltd. | | | | | (385,280 | ) | | | (3,794,747 | ) |
| Massmart Holdings Ltd. | | | | | (195,851 | ) | | | (2,787,610 | ) |
| | | | | Shares | | Value |
Reference Entity — Short |
South Africa (concluded) | | | | | | | | | | |
| Nampak Ltd. | | | | | (168,277 | ) | | $ | (613,460 | ) |
| Remgro Ltd. | | | | | (526,106 | ) | | | (12,173,958 | ) |
| Resilient Property Income Fund, Ltd. | | | | | (15,734 | ) | | | (119,346 | ) |
| RMB Holdings, Ltd. | | | | | (18,021 | ) | | | (101,784 | ) |
| Sappi Ltd. | | | | | (56,907 | ) | | | (233,648 | ) |
| Tiger Brands, Ltd. | | | | | (8,975 | ) | | | (302,671 | ) |
| | | | | | | | | | (20,361,327 | ) |
South Korea | | | | | | | | | | |
| CJ Korea Express Co., Ltd. | | | | | (6,060 | ) | | | (1,061,312 | ) |
| Daewoo Engineering & Construction Co., Ltd. | | | | | (178,078 | ) | | | (1,099,811 | ) |
| Daewoo International Corp. | | | | | (2,057 | ) | | | (51,429 | ) |
| Daewoo Shipbuilding & Marine Engineering Co., Ltd. | | | | | (15,454 | ) | | | (272,492 | ) |
| Doosan Heavy Industries & Construction Co., Ltd. | | | | | (1,070 | ) | | | (22,702 | ) |
| Eo Technics Co., Ltd. | | | | | (23,666 | ) | | | (2,769,698 | ) |
| Gamevil, Inc. | | | | | (1,527 | ) | | | (254,800 | ) |
| Halla Visteon Climate Control Corp. | | | | | (18,895 | ) | | | (795,408 | ) |
| Hotel Shilla Co., Ltd. | | | | | (38,845 | ) | | | (3,604,368 | ) |
| Hyundai Heavy Industries Co., Ltd. | | | | | (13,349 | ) | | | (1,367,897 | ) |
| Hyundai Hysco Co., Ltd. | | | | | (3,273 | ) | | | (229,072 | ) |
| Hyundai Merchant Marine Co., Ltd. | | | | | (3,082 | ) | | | (8,398 | ) |
| Hyundai Merchant Marine Co., Ltd. | | | | | (20,068 | ) | | | (188,092 | ) |
| Hyundai Mipo Dockyard | | | | | (90,291 | ) | | | (6,336,520 | ) |
| LG International Corp. | | | | | (46,476 | ) | | | (1,552,740 | ) |
| NHN Entertainment Corp. | | | | | (1,733 | ) | | | (117,601 | ) |
| Orion Corp. | | | | | (65 | ) | | | (62,025 | ) |
| Samsung Electro-Mechanics Co., Ltd. | | | | | (3,974 | ) | | | (241,862 | ) |
| Samsung Fine Chemicals Co., Ltd. | | | | | (47,309 | ) | | | (1,471,980 | ) |
| | | | | | | | | | (21,508,207 | ) |
Spain | | | | | | | | | | |
| Abertis Infraestructuras SA | | | | | (23,492 | ) | | | (460,032 | ) |
Taiwan | | | | | | | | | | |
| Chang Hwa Commercial Bank | | | | | (94,000 | ) | | | (53,040 | ) |
| Evergreen Marine Corp. Taiwan Ltd. | | | | | (6,457,000 | ) | | | (4,600,596 | ) |
| Formosa Chemicals & Fibre Corp. | | | | | (222,000 | ) | | | (475,048 | ) |
| Formosa Petrochemical Corp. | | | | | (152,000 | ) | | | (323,818 | ) |
| Giant Manufacturing Co., Ltd. | | | | | (12,000 | ) | | | (104,736 | ) |
| Gigasolar Materials Corp. | | | | | (40,000 | ) | | | (608,731 | ) |
| Gigastorage Corp. | | | | | (1,412,000 | ) | | | (1,140,052 | ) |
| Hermes Microvision, Inc. | | | | | (77,000 | ) | | | (3,635,748 | ) |
| Hiwin Technologies Corp. | | | | | (299,000 | ) | | | (2,459,913 | ) |
| Hotai Motor Co., Ltd. | | | | | (346,000 | ) | | | (4,971,632 | ) |
| Parade Technologies, Ltd. | | | | | (100,000 | ) | | | (995,429 | ) |
| Ruentex Industries, Ltd. | | | | | (1,118,000 | ) | | | (2,423,640 | ) |
| ScinoPharm Taiwan, Ltd. | | | | | (506,880 | ) | | | (849,631 | ) |
| Taiflex Scientific Co., Ltd. | | | | | (530,000 | ) | | | (755,091 | ) |
| Taiwan Glass Industry Corp. | | | | | (69,000 | ) | | | (50,147 | ) |
| Taiwan Mobile Co., Ltd. | | | | | (1,099,000 | ) | | | (3,623,843 | ) |
| Teco Electric and Machinery Co., Ltd. | | | | | (80,000 | ) | | | (74,681 | ) |
| TPK Holding Co., Ltd. | | | | | (244,000 | ) | | | (1,580,765 | ) |
| U-Ming Marine Transport Corp. | | | | | (533,000 | ) | | | (823,675 | ) |
| Unimicron Technology Corp. | | | | | (62,000 | ) | | | (42,460 | ) |
| Yulon Motor Co., Ltd. | | | | | (32,000 | ) | | | (46,732 | ) |
| | | | | | | | | | (29,639,408 | ) | | |
Thailand | | | | | | | | | | |
| Samart Corp. PCL | | | | | (155,200 | ) | | | (193,229 | ) |
Total Reference Entity — Short | | | | | | | | | (145,526,735 | ) |
Net Value of Reference Entity — Goldman Sachs & Co. | $ | 33,840,048 | |
See Notes to Financial Statements.
| BLACKROCK FUNDS | JANUARY 31, 2015 | 13
|
| |
| Schedule of Investments (continued) | BlackRock Emerging Markets Long/Short Equity Fund |
The following table represents the individual long and short positions and related values of equity securities underlying the total return swap with Goldman Sachs & Co. as of January 31, 2015, expiration dates 8/27/15 — 8/04/16:
| | | | | Shares | | Value |
Reference Entity — Long |
Belgium | | | | | | | | | | |
| Nyrstar NV | | | | | 5,253 | | | $ | 19,761 | |
Canada | | | | | | | | | | |
| Dominion Diamond Corp. | | | | | 2,046 | | | | 33,990 | |
| Methanex Corp. | | | | | 15,118 | | | | 668,157 | |
| Parex Resources, Inc. | | | | | 7,927 | | | | 42,919 | |
| | | | | | | | | | 745,066 | |
Denmark | | | | | | | | | | |
| Novo Nordisk A/S, Class B | | | | | 192 | | | | 8,557 | |
| Vestas Wind Systems A/S | | | | | 1,280 | | | | 49,733 | |
| | | | | | | | | | 58,290 | |
France | | | | | | | | | | |
| BioMerieux | | | | | 885 | | | | 96,635 | |
| Ipsen SA | | | | | 4,741 | | | | 241,290 | |
| Teleperformance | | | | | 240 | | | | 17,195 | |
| | | | | | | | | | 355,120 | |
Germany | | | | | | | | | | |
| Aurubis AG | | | | | 105 | | | | 5,692 | |
| Beiersdorf AG | | | | | 991 | | | | 87,123 | |
| Kloeckner & Co. SE | | | | | 9,470 | | | | 97,573 | |
| Krones AG | | | | | 33 | | | | 3,136 | |
| Merck KGaA | | | | | 3,638 | | | | 363,496 | |
| | | | | | | | | | 557,020 | |
Hong Kong | | | | | | | | | | |
| Dah Sing Financial Holdings, Ltd. | | | | | 10,000 | | | | 57,770 | |
| Hang Lung Properties Ltd. | | | | | 2,000 | | | | 5,895 | |
| HKT Trust and HKT Ltd. | | | | | 4,000 | | | | 5,242 | |
| Kerry Properties Ltd. | | | | | 29,500 | | | | 104,241 | |
| Luk Fook Holdings International, Ltd. | | | | | 39,000 | | | | 144,728 | |
| NWS Holdings Ltd. | | | | | 1,000 | | | | 1,856 | |
| Orient Overseas International Ltd. | | | | | 21,000 | | | | 136,991 | |
| Wheelock & Co. Ltd. | | | | | 4,000 | | | | 22,631 | |
| | | | | | | | | | 479,354 | |
Iran | | | | | | | | | | |
| Smurfit Kappa Group PLC | | | | | 5,511 | | | | 135,490 | |
Ireland | | | | | | | | | | |
| Ingersoll-Rand PLC | | | | | 2,286 | | | | 151,790 | |
| Kerry Group PLC, Class A | | | | | 976 | | | | 70,735 | |
| | | | | | | | | | 222,525 | |
Italy | | | | | | | | | | |
| Ansaldo STS SpA | | | | | 20,495 | | | | 205,953 | |
| Parmalat SpA | | | | | 4,267 | | | | 12,103 | |
| Recordati SpA | | | | | 21,056 | | | | 347,986 | |
| | | | | | | | | | 566,042 | |
Japan | | | | | | | | | | |
| Alps Electric Co. Ltd. | | | | | 300 | | | | 6,245 | |
| Citizen Holdings Co. Ltd. | | | | | 4,500 | | | | 35,920 | |
| Daifuku Co. Ltd. | | | | | 8,000 | | | | 91,648 | |
| Disco Corp. | | | | | 9,000 | | | | 824,521 | |
| Enplas Corp. | | | | | 4,000 | | | | 142,739 | |
| Hitachi Capital Corp. | | | | | 200 | | | | 3,932 | |
| Hitachi Maxell, Ltd. | | | | | 100 | | | | 1,697 | |
| Hitachi Metals Ltd. | | | | | 4,000 | | | | 65,181 | |
| Keihin Corp. | | | | | 3,800 | | | | 60,570 | |
| Mazda Motor Corp. | | | | | 14,200 | | | | 291,674 | |
| Mitsubishi Materials Corp. | | | | | 67,000 | | | | 211,275 | |
| Murata Manufacturing Co. Ltd. | | | | | 3,500 | | | | 377,840 | |
| | | | | Shares | | Value |
Reference Entity — Long |
Japan (concluded) | | | | | | | | | | |
| Nachi-Fujikoshi Corp. | | | | | 4,000 | | | $ | 21,509 | |
| Nifco, Inc. | | | | | 2,600 | | | | 89,562 | |
| Omron Corp. | | | | | 400 | | | | 15,992 | |
| OSG Corp. | | | | | 8,200 | | | | 150,977 | |
| Sanrio Co. Ltd. | | | | | 900 | | | | 22,301 | |
| Shimano, Inc. | | | | | 2,400 | | | | 317,264 | |
| Sumitomo Metal Mining Co. Ltd. | | | | | 1,000 | | | | 14,292 | |
| Sysmex Corp. | | | | | 100 | | | | 4,469 | |
| Tadano Ltd. | | | | | 9,000 | | | | 108,322 | |
| Takata Corp. | | | | | 8,000 | | | | 93,306 | |
| TDK Corp. | | | | | 600 | | | | 37,393 | |
| Topcon Corp. | | | | | 600 | | | | 11,889 | |
| Yamato Kogyo Co. Ltd. | | | | | 200 | | | | 5,147 | |
| | | | | | | | | | 3,005,665 | |
Netherlands | | | | | | | | | | |
| Arcadis NV | | | | | 13,268 | | | | 401,560 | |
| Heineken NV | | | | | 4,846 | | | | 361,648 | |
| NXP Semiconductor NV | | | | | 3,306 | | | | 262,298 | |
| | | | | | | | | | 1,025,506 | |
Singapore | | | | | | | | | | |
| ComfortDelGro Corp. Ltd. | | | | | 42,800 | | | | 90,758 | |
| Flextronics International Ltd. | | | | | 81,356 | | | | 904,679 | |
| Indofood Agri Resources, Ltd. | | | | | 15,700 | | | | 8,208 | |
| Noble Group Ltd. | | | | | 107,500 | | | | 84,091 | |
| Singapore Airlines Ltd. | | | | | 12,900 | | | | 120,493 | |
| | | | | | | | | | 1,208,229 | |
Spain | | | | | | | | | | |
| Gamesa Corp. Tecnologica SA | | | | | 526 | | | | 5,200 | |
| Gas Natural SDG SA | | | | | 11,057 | | | | 259,550 | |
| Inmobiliaria Colonial SA | | | | | 5,844 | | | | 3,960 | |
| | | | | | | | | | 268,710 | |
Sweden | | | | | | | | | | |
| Telefonaktiebolaget LM Ericsson, Class B | | | | | 12,640 | | | | 153,251 | |
Switzerland | | | | | | | | | | |
| Garmin Ltd. | | | | | 288 | | | | 15,080 | |
| Kuoni Reisen Holding AG | | | | | 272 | | | | 91,239 | |
| Straumann Holding AG, Registered Shares | | | | | 72 | | | | 16,263 | |
| | | | | | | | | | 122,582 | |
United Kingdom | | | | | | | | | | |
| Inchcape PLC | | | | | 21,959 | | | | 229,381 | |
| Pace PLC | | | | | 86,172 | | | | 432,463 | |
| | | | | | | | | | 661,844 | |
United States | | | | | | | | | | |
| Adobe Systems, Inc. | | | | | 1,431 | | | | 100,356 | |
| Akamai Technologies, Inc. | | | | | 3,680 | | | | 214,010 | |
| AmTrust Financial Services, Inc. | | | | | 3,250 | | | | 164,515 | |
| Aruba Networks, Inc. | | | | | 12,745 | | | | 211,312 | |
| Aspen Technology, Inc. | | | | | 25,109 | | | | 887,478 | |
| The Boeing Co. | | | | | 685 | | | | 99,578 | |
| Briggs & Stratton Corp. | | | | | 183 | | | | 3,369 | |
| Cabot Corp. | | | | | 13,595 | | | | 576,564 | |
| Calpine Corp. | | | | | 12,460 | | | | 260,165 | |
| Caterpillar, Inc. | | | | | 3,455 | | | | 276,296 | |
| CBRE Group, Inc., Class A | | | | | 128 | | | | 4,140 | |
| Century Aluminum Co. | | | | | 2,717 | | | | 62,790 | |
| Citrix Systems, Inc. | | | | | 2,011 | | | | 119,172 | |
| Columbia Sportswear Co. | | | | | 6,284 | | | | 267,070 | |
| Cytec Industries, Inc. | | | | | 7,134 | | | | 342,361 | |
| The Dow Chemical Co. | | | | | 62 | | | | 2,800 | |
| The Estee Lauder Cos., Inc., Class A | | | | | 336 | | | | 23,718 | |
| Foot Locker, Inc. | | | | | 2,778 | | | | 147,845 | |
See Notes to Financial Statements.
| 14 | BLACKROCK FUNDS | JANUARY 31, 2015
|
| |
| Schedule of Investments (continued) | BlackRock Emerging Markets Long/Short Equity Fund |
| | | | | Shares | | Value |
Reference Entity — Long |
United States (concluded) | | | | | | | | | | |
| Greatbatch, Inc. | | | | | 95 | | | $ | 4,613 | |
| Hasbro, Inc. | | | | | 8,113 | | | | 445,566 | |
| HCA Holdings, Inc. | | | | | 8,885 | | | | 629,058 | |
| Houghton Mifflin Harcourt Co. | | | | | 2,692 | | | | 52,979 | |
| Huntsman Corp. | | | | | 1,673 | | | | 36,739 | |
| Hyster-Yale Materials Handling, Inc. | | | | | 1,316 | | | | 82,447 | |
| IAC/InterActiveCorp | | | | | 4,199 | | | | 255,929 | |
| Iconix Brand Group, Inc. | | | | | 25,685 | | | | 853,769 | |
| Ingram Micro, Inc., Class A | | | | | 25,694 | | | | 646,975 | |
| The Interpublic Group of Cos., Inc. | | | | | 14,233 | | | | 283,806 | |
| Invesco Ltd. | | | | | 4,748 | | | | 174,394 | |
| ITT Corp. | | | | | 7,592 | | | | 271,870 | |
| Jones Lang LaSalle, Inc. | | | | | 3,483 | | | | 512,280 | |
| Las Vegas Sands Corp. | | | | | 763 | | | | 41,484 | |
| Lear Corp. | | | | | 2,080 | | | | 208,728 | |
| Liberty TripAdvisor Holdings, Inc., Series A | | | | | 4,755 | | | | 113,835 | |
| Linear Technology Corp. | | | | | 3,956 | | | | 177,783 | |
| LogMeIn, Inc. | | | | | 2,694 | | | | 128,100 | |
| Manpowergroup, Inc. | | | | | 2,850 | | | | 207,708 | |
| Micron Technology, Inc. | | | | | 35,945 | | | | 1,051,930 | |
| Moog, Inc., Class A | | | | | 106 | | | | 7,452 | |
| Newfield Exploration Co. | | | | | 6,542 | | | | 194,821 | |
| Penske Automotive Group, Inc. | | | | | 4,356 | | | | 210,613 | |
| Progress Software Corp. | | | | | 19,446 | | | | 487,122 | |
| Rockwell Automation, Inc. | | | | | 648 | | | | 70,580 | |
| Rovi Corp. | | | | | 17,556 | | | | 405,719 | |
| Sealed Air Corp. | | | | | 5,906 | | | | 239,193 | |
| Skyworks Solutions, Inc. | | | | | 1,335 | | | | 110,872 | |
| Spectrum Brands Holdings, Inc. | | | | | 1,230 | | | | 110,306 | |
| SPX Corp. | | | | | 2,273 | | | | 189,955 | |
| The Timken Co. | | | | | 5,042 | | | | 191,646 | |
| World Fuel Services Corp. | | | | | 11,799 | | | | 577,797 | |
| Xilinx, Inc. | | | | | 3,811 | | | | 147,009 | |
| Zebra Technologies Corp., Class A | | | | | 3,295 | | | | 275,001 | |
| | | | | | | | | | 13,161,618 | |
Total Reference Entity — Long | | | | | | | | | 22,746,073 | |
| | | | | | | | | | | |
Reference Entity — Short |
Australia | | | | | | | | | | |
| New Hope Corp., Ltd. | | | | | (6,338 | ) | | | (11,548 | ) |
| Nufarm, Ltd. | | | | | (3,276 | ) | | | (14,395 | ) |
| Orica Ltd. | | | | | (653 | ) | | | (9,166 | ) |
| | | | | | | | | | (35,109 | ) |
Austria | | | | | | | | | | |
| IMMOFINANZ AG | | | | | (3,185 | ) | | | (7,278 | ) |
Finland | | | | | | | | | | |
| Outokumpu OYJ | | | | | (70,334 | ) | | | (380,537 | ) |
France | | | | | | | | | | |
| Kering | | | | | (2,408 | ) | | | (485,846 | ) |
Germany | | | | | | | | | | |
| Dialog Semiconductor PLC | | | | | (6,797 | ) | | | (259,950 | ) |
| ElringKlinger AG | | | | | (12,465 | ) | | | (434,320 | ) |
| Puma SE | | | | | (18 | ) | | | (3,426 | ) |
| | | | | | | | | | (697,696 | ) |
Hong Kong | | | | | | | | | | |
| Chow Tai Fook Jewellery Group, Ltd. | | | | | (109,800 | ) | | | (145,570 | ) |
| Esprit Holdings Ltd. | | | | | (400 | ) | | | (450 | ) |
| Hong Kong & China Gas Co., Ltd. | | | | | (66,000 | ) | | | (151,138 | ) |
| Hong Kong Exchanges and Clearing, Ltd. | | | | | (45,800 | ) | | | (1,054,094 | ) |
| Melco International Development, Ltd. | | | | | (111,000 | ) | | | (221,009 | ) |
| | | | | Shares | | Value |
Reference Entity — Short |
Hong Kong (concluded) | | | | | | | | | | |
| Shangri-La Asia, Ltd. | | | | | (2,000 | ) | | $ | (2,596 | ) |
| Swire Pacific, Ltd. | | | | | (2,000 | ) | | | (26,783 | ) |
| | | | | | | | | | (1,601,640 | ) |
Ireland | | | | | | | | | | |
| Accenture PLC, Class A | | | | | (6,891 | ) | | | (579,051 | ) |
Italy | | | | | | | | | | |
| Saipem SpA | | | | | (9,504 | ) | | | (85,504 | ) |
Japan | | | | | | | | | | |
| Chiyoda Corp. | | | | | (4,000 | ) | | | (30,808 | ) |
| Daikin Industries, Ltd. | | | | | (1,200 | ) | | | (83,503 | ) |
| DIC Corp. | | | | | (1,000 | ) | | | (2,476 | ) |
| Eisai Co., Ltd. | | | | | (2,900 | ) | | | (144,589 | ) |
| Ibiden Co., Ltd. | | | | | (4,400 | ) | | | (66,147 | ) |
| The Japan Steel Works, Ltd. | | | | | (11,000 | ) | | | (44,002 | ) |
| Nabtesco Corp. | | | | | (500 | ) | | | (12,908 | ) |
| NGK Insulators, Ltd. | | | | | (9,000 | ) | | | (181,361 | ) |
| Nippon Paint Co., Ltd. | | | | | (10,500 | ) | | | (328,915 | ) |
| Nisshinbo Holdings, Inc. | | | | | (4,000 | ) | | | (44,949 | ) |
| Pigeon Corp. | | | | | (1,300 | ) | | | (81,170 | ) |
| Sharp Corp. | | | | | (60,000 | ) | | | (117,451 | ) |
| Shimadzu Corp. | | | | | (3,000 | ) | | | (31,169 | ) |
| Shinko Electric Industries Co., Ltd. | | | | | (3,000 | ) | | | (21,013 | ) |
| Sumco Corp. | | | | | (4,500 | ) | | | (75,523 | ) |
| Sumitomo Rubber Industries, Ltd. | | | | | (1,700 | ) | | | (26,436 | ) |
| Teijin Ltd. | | | | | (47,000 | ) | | | (140,006 | ) |
| Toray Industries, Inc. | | | | | (28,000 | ) | | | (238,506 | ) |
| Toyo Tire & Rubber Co., Ltd. | | | | | (7,100 | ) | | | (159,917 | ) |
| Ube Industries, Ltd. | | | | | (3,000 | ) | | | (4,493 | ) |
| Ushio, Inc. | | | | | (6,200 | ) | | | (71,828 | ) |
| The Yokohama Rubber Co., Ltd. | | | | | (1,000 | ) | | | (9,408 | ) |
| | | | | | | | | | (1,916,578 | ) |
Netherlands | | | | | | | | | | |
| SBM Offshore NV | | | | | (19,881 | ) | | | (216,909 | ) |
Norway | | | | | | | | | | |
| Opera Software ASA | | | | | (101,693 | ) | | | (1,347,163 | ) |
Portugal | | | | | | | | | | |
| Jeronimo Martins SGPS SA | | | | | (35,808 | ) | | | (385,164 | ) |
Singapore | | | | | | | | | | |
| DBS Group Holdings, Ltd. | | | | | (1,700 | ) | | | (24,785 | ) |
| Sembcorp Marine, Ltd. | | | | | (1,000 | ) | | | (2,213 | ) |
| | | | | | | | | | (26,998 | ) |
Switzerland | | | | | | | | | | |
| Clariant AG | | | | | (1,588 | ) | | | (25,513 | ) |
| Dufry AG | | | | | (469 | ) | | | (68,897 | ) |
| Holcim Ltd. | | | | | (1,028 | ) | | | (71,870 | ) |
| OC Oerlikon Corp. AG | | | | | (1,190 | ) | | | (13,536 | ) |
| SGS SA | | | | | (69 | ) | | | (130,886 | ) |
| Sulzer AG | | | | | (3,162 | ) | | | (334,793 | ) |
| The Swatch Group AG | | | | | (11 | ) | | | (4,375 | ) |
| | | | | | | | | | (649,870 | ) |
United Kingdom | | | | | | | | | | |
| AVEVA Group PLC | | | | | (6,948 | ) | | | (137,407 | ) |
| CNH Industrial NV | | | | | (86,125 | ) | | | (655,650 | ) |
| HSBC Holdings PLC | | | | | (4,962 | ) | | | (45,398 | ) |
| Inmarsat PLC | | | | | (33,170 | ) | | | (415,630 | ) |
| Ophir Energy PLC | | | | | (74,375 | ) | | | (150,580 | ) |
| Rotork PLC | | | | | (463 | ) | | | (16,005 | ) |
| Smiths Group PLC | | | | | (2,719 | ) | | | (46,017 | ) |
| Spectris PLC | | | | | (8,856 | ) | | | (278,292 | ) |
| | | | | | | | | | (1,744,979 | ) |
See Notes to Financial Statements.
| BLACKROCK FUNDS | JANUARY 31, 2015 | 15
|
| |
| Schedule of Investments (continued) | BlackRock Emerging Markets Long/Short Equity Fund |
| | | | | Shares | | Value |
Reference Entity — Short |
United States | | | | | | | | | | |
| Aflac, Inc. | | | | | (3,685 | ) | | $ | (210,340 | ) |
| Amazon.com, Inc. | | | | | (1,157 | ) | | | (410,191 | ) |
| American Tower Corp. | | | | | (155 | ) | | | (15,027 | ) |
| Arthur J Gallagher & Co. | | | | | (11,868 | ) | | | (527,295 | ) |
| Balchem Corp. | | | | | (3,070 | ) | | | (162,618 | ) |
| Brady Corp., Class A Class A | | | | | (2,906 | ) | | | (76,050 | ) |
| The Brink’s Co. | | | | | (592 | ) | | | (13,267 | ) |
| CACI International, Inc., Class A Class A | | | | | (6,389 | ) | | | (540,445 | ) |
| Cinemark Holdings, Inc. | | | | | (562 | ) | | | (20,889 | ) |
| Colfax Corp. | | | | | (2,807 | ) | | | (127,185 | ) |
| CommVault Systems, Inc. | | | | | (2,327 | ) | | | (101,411 | ) |
| Coty, Inc., Class A | | | | | (51,186 | ) | | | (973,558 | ) |
| Cray, Inc. | | | | | (15,420 | ) | | | (500,996 | ) |
| Cree, Inc. | | | | | (27,451 | ) | | | (970,667 | ) |
| Crown Castle International Corp. | | | | | (2,135 | ) | | | (184,699 | ) |
| Cypress Semiconductor Corp. | | | | | (9,277 | ) | | | (136,650 | ) |
| Dealertrack Technologies, Inc. | | | | | (8,897 | ) | | | (357,659 | ) |
| Deere & Co. | | | | | (72 | ) | | | (6,134 | ) |
| Diebold, Inc. | | | | | (4,343 | ) | | | (135,502 | ) |
| Donaldson Co., Inc. | | | | | (853 | ) | | | (31,186 | ) |
| Dycom Industries, Inc. | | | | | (572 | ) | | | (17,623 | ) |
| Emerson Electric Co. | | | | | (653 | ) | | | (37,182 | ) |
| Essex Property Trust, Inc. | | | | | (259 | ) | | | (58,547 | ) |
| FARO Technologies, Inc. | | | | | (359 | ) | | | (19,871 | ) |
| First Cash Financial Services, Inc. | | | | | (3,548 | ) | | | (176,407 | ) |
| FleetCor Technologies, Inc. | | | | | (25 | ) | | | (3,512 | ) |
| Franklin Electric Co., Inc. | | | | | (10,626 | ) | | | (363,515 | ) |
| FTI Consulting, Inc. | | | | | (401 | ) | | | (16,309 | ) |
| General Mills, Inc. | | | | | (535 | ) | | | (28,077 | ) |
| General Motors Co. | | | | | (11,779 | ) | | | (384,231 | ) |
| Gentex Corp. | | | | | (2,934 | ) | | | (48,968 | ) |
| Groupon, Inc. | | | | | (17,462 | ) | | | (125,028 | ) |
| HeartWare International, Inc. | | | | | (4,740 | ) | | | (395,932 | ) |
| HEICO Corp. | | | | | (1,735 | ) | | | (105,280 | ) |
| Hillenbrand, Inc. | | | | | (71 | ) | | | (2,230 | ) |
| Infinera Corp. | | | | | (45,136 | ) | | | (727,592 | ) |
| Ingredion, Inc. | | | | | (700 | ) | | | (56,448 | ) |
| Jabil Circuit, Inc. | | | | | (19,009 | ) | | | (391,775 | ) |
| KBR, Inc. | | | | | (4,635 | ) | | | (76,617 | ) |
| McDermott International, Inc. | | | | | (1,143 | ) | | | (2,572 | ) |
| Microsemi Corp. | | | | | (1,654 | ) | | | (46,080 | ) |
| Navistar International Corp. | | | | | (2,883 | ) | | | (84,818 | ) |
| NetSuite, Inc. | | | | | (936 | ) | | | (92,130 | ) |
| Peabody Energy Corp. | | | | | (68,364 | ) | | | (425,908 | ) |
| PriceSmart, Inc. | | | | | (3,081 | ) | | | (251,964 | ) |
| Republic Services, Inc. | | | | | (98 | ) | | | (3,889 | ) |
| Rogers Corp. | | | | | (289 | ) | | | (21,346 | ) |
| Schweitzer-Mauduit International, Inc. | | | | | (2,658 | ) | | | (103,290 | ) |
| Sotheby’s | | | | | (11,851 | ) | | | (504,260 | ) |
| The Spectranetics Corp. | | | | | (10,625 | ) | | | (347,544 | ) |
| TAL International Group, Inc. | | | | | (37,457 | ) | | | (1,522,627 | ) |
| Universal Display Corp. | | | | | (708 | ) | | | (22,557 | ) |
| UTi Worldwide, Inc. | | | | | (8,864 | ) | | | (105,216 | ) |
| Veeco Instruments, Inc. | | | | | (6,302 | ) | | | (183,829 | ) |
| The Western Union Co. | | | | | (13,798 | ) | | | (234,566 | ) |
| WR Grace & Co. | | | | | (203 | ) | | | (17,596 | ) |
| XPO Logistics, Inc. | | | | | (2,353 | ) | | | (86,567 | ) |
| | | | | | | | | | (12,593,672 | ) |
Total Reference Entity — Short | | | | | | | | | (22,753,994 | ) |
Net Value of Reference Entity — Goldman Sachs & Co. | | (7,921 | ) |
The following table represents the individual long and short positions and related values of equity securities underlying the total return swap with Morgan Stanley & Co., Inc. as of January 31, 2015, expiration dates 5/16/16 — 1/22/18:
| | | | | Shares | | Value |
Reference Entity — Long |
Brazil | | | | | | | | | | |
| AMBEV SA | | | | | 135,300 | | | $ | 888,974 | |
| Banco do Brasil SA | | | | | 3,000 | | | | 23,099 | |
| BM&FBovespa SA | | | | | 31,700 | | | | 107,508 | |
| Bradespar SA, Preference Shares | | | | | 108,700 | | | | 470,328 | |
| CCR SA | | | | | 59,400 | | | | 338,258 | |
| Cia Energetica de Minas Gerais, ADR | | | | | 16,437 | | | | 74,131 | |
| Cia Energetica de Sao Paulo, Preference ‘B’ Shares | | | | | 49,100 | | | | 431,117 | |
| Cia Paranaense de Energia — ADR | | | | | 27,266 | | | | 316,286 | |
| Cia Paranaense de Energia, Preference B Shares | | | | | 49,400 | | | | 574,408 | |
| EDP — Energias do Brasil SA | | | | | 112,300 | | | | 362,440 | |
| Embraer SA | | | | | 17,500 | | | | 154,831 | |
| Embraer SA, ADR | | | | | 11,754 | | | | 414,446 | |
| Even Construtora e Incorporadora SA | | | | | 47,000 | | | | 75,845 | |
| Gerdau SA — ADR | | | | | 728,100 | | | | 2,511,945 | |
| Gerdau SA, Preference Shares | | | | | 215,800 | | | | 732,670 | |
| Itau Unibanco Holding SA, Preference Shares | | | | | 32,300 | | | | 396,038 | |
| JBS SA | | | | | 567,000 | | | | 2,417,397 | |
| Metalurgica Gerdau SA, Preference Shares | | | | | 221,100 | | | | 810,817 | |
| Multiplus SA | | | | | 33,600 | | | | 435,144 | |
| Petroleo Brasileiro SA, Preference Shares | | | | | 126,500 | | | | 385,641 | |
| Qualicorp SA | | | | | 81,063 | | | | 802,095 | |
| Telefonica Brasil SA — ADR | | | | | 39,502 | | | | 728,417 | |
| Telefonica Brasil SA, Preference Shares | | | | | 23,500 | | | | 436,150 | |
| | | | | | | | | | 13,887,985 | |
Chile | | | | | | | | | | |
| Empresas COPEC SA | | | | | 41,717 | | | | 472,097 | |
| Enersis SA | | | | | 504,633 | | | | 156,245 | |
| | | | | | | | | | 628,342 | |
China | | | | | | | | | | |
| Agricultural Bank of China Ltd., Class H | | | | | 2,505,000 | | | | 1,223,225 | |
| Anhui Conch Cement Co., Ltd., Class H | | | | | 293,000 | | | | 980,839 | |
| Anhui Expressway Co., Ltd., Class H | | | | | 234,000 | | | | 169,545 | |
| Anta Sports Products Ltd. | | | | | 2,100,000 | | | | 3,700,321 | |
| Beijing Capital International Airport Co. Ltd., Class H | | | | | 2,952,000 | | | | 2,804,821 | |
| China Cinda Asset Management Co., Ltd. | | | | | 293,000 | | | | 138,588 | |
| China Communications Services Corp. Ltd., Class H | | | | | 804,000 | | | | 362,051 | |
| China Shenhua Energy Co. Ltd., Class H | | | | | 521,500 | | | | 1,431,535 | |
| China Unicom Hong Kong Ltd. | | | | | 862,000 | | | | 1,290,238 | |
| CSPC Pharmaceutical Group Ltd. | | | | | 716,000 | | | | 604,014 | |
| Datang International Power Generation Co. Ltd., Class H | | | | | 2,550,000 | | | | 1,394,188 | |
| Dongfeng Motor Group Co. Ltd., Class H | | | | | 62,000 | | | | 89,667 | |
| Greentown China Holdings Ltd. | | | | | 122,000 | | | | 106,699 | |
| Guangzhou Baiyunshan Pharmaceutical Holdings Co., Ltd., Class H, Class H | | | | | 80,000 | | | | 283,296 | |
| Guangzhou R&F Properties Co. Ltd., Class H | | | | | 1,962,000 | | | | 2,224,422 | |
| Industrial & Commercial Bank of China Ltd., Class H | | | | | 931,000 | | | | 663,921 | |
| Longfor Properties Co. Ltd. | | | | | 86,000 | | | | 112,982 | |
| Lonking Holdings Ltd. | | | | | 589,000 | | | | 111,417 | |
| Ping An Insurance Group Co. of China Ltd., Class H | | | | | 85,000 | | | | 900,909 | |
| Shanghai Pharmaceuticals Holding Co., Ltd., Class H | | | | | 297,600 | | | | 644,429 | |
| Sino-Ocean Land Holdings Ltd. | | | | | 274,500 | | | | 175,532 | |
| Sinopharm Group Co. Ltd., Class H | | | | | 321,600 | | | | 1,170,964 | |
| Zhejiang Expressway Co. Ltd., Class H | | | | | 3,254,000 | | | | 4,140,934 | |
| | | | | | | | | | 24,724,537 | |
See Notes to Financial Statements.
| 16 | BLACKROCK FUNDS | JANUARY 31, 2015
|
| |
| Schedule of Investments (continued) | BlackRock Emerging Markets Long/Short Equity Fund |
| | | | | Shares | | Value |
Reference Entity — Long |
Hong Kong | | | | | | | | | | |
| China Mobile Ltd. | | | | | 129,000 | | | $ | 1,690,994 | |
| China Mobile, Ltd., ADR | | | | | 83,969 | | | | 5,484,855 | |
| China Power International Development, Ltd. | | | | | 1,416,000 | | | | 803,951 | |
| China Resources Cement Holdings Ltd. | | | | | 3,190,000 | | | | 1,893,089 | |
| China Travel International Inv HK | | | | | 3,186,000 | | | | 1,045,506 | |
| China Unicom Hong Kong, Ltd., ADR | | | | | 6,437 | | | | 96,233 | |
| Franshion Properties China Ltd. | | | | | 1,894,000 | | | | 556,079 | |
| GOME Electrical Appliances Holding Ltd. | | | | | 15,860,000 | | | | 2,183,172 | |
| Guangdong Investment Ltd. | | | | | 152,000 | | | | 204,035 | |
| Kingboard Chemical Holdings Ltd. | | | | | 684,500 | | | | 1,107,056 | |
| KWG Property Holding Ltd. | | | | | 1,454,000 | | | | 928,608 | |
| REXLot Holdings, Ltd. | | | | | 2,150,000 | | | | 167,898 | |
| Shanghai Industrial Holdings, Ltd. | | | | | 148,000 | | | | 437,244 | |
| Shenzhen Investment Ltd. | | | | | 2,016,000 | | | | 581,840 | |
| Shimao Property Holdings Ltd. | | | | | 251,000 | | | | 526,849 | |
| Sino Biopharmaceutical Ltd. | | | | | 1,184,000 | | | | 1,182,805 | |
| Yuexiu Property Co., Ltd. | | | | | 3,912,560 | | | | 760,414 | |
| | | | | | | | | | 19,650,628 | |
Hungary | | | | | | | | | | |
| MOL Hungarian Oil & Gas PLC | | | | | 34,310 | | | | 1,373,164 | |
| OTP Bank PLC | | | | | 22,044 | | | | 292,307 | |
| | | | | | | | | | 1,665,471 | |
Indonesia | | | | | | | | | | |
| Adaro Energy Tbk PT | | | | | 10,553,100 | | | | 829,219 | |
| Matahari Putra Prima Tbk PT | | | | | 2,246,300 | | | | 673,846 | |
| Perusahaan Perkebunan London Sumatra Indonesia Tbk PT | | | | | 2,126,700 | | | | 307,827 | |
| United Tractors Tbk PT | | | | | 1,538,600 | | | | 2,165,056 | |
| | | | | | | | | | 3,975,948 | |
Malaysia | | | | | | | | | | |
| British American Tobacco Malaysia Bhd | | | | | 16,600 | | | | 301,758 | |
| YTL Power International Bhd | | | | | 28,800 | | | | 12,687 | |
| | | | | | | | | | 314,445 | |
Mexico | | | | | | | | | | |
| Grupo Aeroportuario del Pacifico SAB de CV, ADR | | | | | 30,288 | | | | 2,011,426 | |
| Grupo Aeroportuario del Pacifico SAB de CV, Class B | | | | | 69,688 | | | | 460,728 | |
| Grupo Bimbo SAB de CV, Series A | | | | | 341,342 | | | | 868,527 | |
| Promotora y Operadora de Infraestructura SAB de CV | | | | | 60,995 | | | | 686,552 | |
| | | | | | | | | | 4,027,233 | |
Philippines | | | | | | | | | | |
| Aboitiz Equity Ventures, Inc. | | | | | 44,000 | | | | 56,368 | |
| Energy Development Corp. | | | | | 752,000 | | | | 145,433 | |
| Globe Telecom, Inc. | | | | | 9,850 | | | | 388,795 | |
| Universal Robina Corp. | | | | | 192,260 | | | | 902,003 | |
| | | | | | | | | | 1,492,599 | |
Poland | | | | | | | | | | |
| Enea SA | | | | | 69,678 | | | | 309,581 | |
| Grupa Lotos SA | | | | | 141,909 | | | | 936,417 | |
| KGHM Polska Miedz SA | | | | | 18,296 | | | | 518,684 | |
| Polski Koncern Naftowy Orlen SA | | | | | 189,500 | | | | 2,795,990 | |
| Tauron Polska Energia SA | | | | | 1,708,359 | | | | 2,298,371 | |
| | | | | | | | | | 6,859,043 | |
Qatar | | | | | | | | | | |
| Qatar National Bank | | | | | 16,181 | | | | 878,615 | |
South Africa | | | | | | | | | | |
| AngloGold Ashanti, Ltd., ADR | | | | | 8,148 | | | | 100,872 | |
| Bidvest Group Ltd. | | | | | 37,280 | | | | 1,028,875 | |
| Clicks Group, Ltd. | | | | | 62,048 | | | | 481,252 | |
| | | | | Shares | | Value |
Reference Entity — Long |
South Africa (concluded) | | | | | | | | | | |
| FirstRand Ltd. | | | | | 581,656 | | | $ | 2,588,586 | |
| Gold Fields Ltd. | | | | | 90,907 | | | | 523,699 | |
| Liberty Holdings Ltd. | | | | | 11,438 | | | | 128,769 | |
| MMI Holdings Ltd. | | | | | 163,409 | | | | 439,640 | |
| MTN Group Ltd. | | | | | 99,355 | | | | 1,715,732 | |
| Sanlam Ltd. | | | | | 126,731 | | | | 759,593 | |
| Sibanye Gold, Ltd. | | | | | 237,334 | | | | 641,726 | |
| | | | | | | | | | 8,408,744 | |
South Korea | | | | | | | | | | |
| Amorepacific Corp. | | | | | 446 | | | | 1,074,866 | |
| Doosan Infracore Co., Ltd. | | | | | 15,663 | | | | 145,019 | |
| Hyundai Engineering & Construction Co., Ltd. | | | | | 1,179 | | | | 46,658 | |
| Hyundai Mobis | | | | | 10,192 | | | | 2,304,083 | |
| Hyundai Motor Co. | | | | | 5,410 | | | | 831,430 | |
| Hyundai Steel Co. | | | | | 8,545 | | | | 512,669 | |
| Industrial Bank of Korea | | | | | 23,466 | | | | 275,662 | |
| Kangwon Land, Inc. | | | | | 25,948 | | | | 765,189 | |
| Korea Electric Power Corp. | | | | | 3,733 | | | | 145,956 | |
| Korea Line Corp. | | | | | 11,072 | | | | 221,825 | |
| KT Skylife Co., Ltd. | | | | | 67,340 | | | | 994,387 | |
| KT Submarine Co., Ltd. | | | | | 22,854 | | | | 106,054 | |
| LG Corp. | | | | | 1,513 | | | | 85,148 | |
| Lotte Confectionery Co., Ltd. | | | | | 38 | | | | 64,758 | |
| Lotte Food Co., Ltd. | | | | | 530 | | | | 299,730 | |
| LS Corp. | | | | | 10,289 | | | | 451,002 | |
| Mando Corp. | | | | | 2,743 | | | | 157,938 | |
| Medy-Tox, Inc. | | | | | 3,171 | | | | 1,065,491 | |
| Poongsan Corp. | | | | | 30,030 | | | | 620,885 | |
| SK Innovation Co., Ltd. | | | | | 8,844 | | | | 751,027 | |
| SK Networks Co., Ltd. | | | | | 142,356 | | | | 1,219,426 | |
| SK Telecom Co., Ltd., ADR | | | | | 48,540 | | | | 1,395,525 | |
| SKC Co., Ltd. | | | | | 7,627 | | | | 209,449 | |
| Sungwoo Hitech Co., Ltd. | | | | | 34,182 | | | | 377,038 | |
| | | | | | | | | | 14,121,215 | |
Spain | | | | | | | | | | |
| Cemex Latam Holdings SA | | | | | 22,821 | | | | 142,351 | |
Taiwan | | | | | | | | | | |
| Advanced Semiconductor Engineering, Inc. | | | | | 1,563,000 | | | | 1,962,689 | |
| Advanced Semiconductor Engineering, Inc. — ADR | | | | | 46,974 | | | | 310,498 | |
| Asia Cement Corp. | | | | | 477,080 | | | | 575,177 | |
| Cheng Uei Precision Industry Co., Ltd. | | | | | 134,000 | | | | 236,376 | |
| Chicony Electronics Co., Ltd. | | | | | 134,000 | | | | 367,701 | |
| Chimei Materials Technology Corp. | | | | | 215,600 | | | | 217,727 | |
| China Steel Chemical Corp. | | | | | 36,000 | | | | 174,070 | |
| CTCI Corp. | | | | | 292,000 | | | | 461,414 | |
| Elan Microelectronics Corp. | | | | | 51,000 | | | | 79,753 | |
| Everlight Electronics Co., Ltd. | | | | | 45,000 | | | | 107,943 | |
| Far Eastern Department Stores Ltd. | | | | | 642,192 | | | | 547,911 | |
| Far Eastern New Century Corp. | | | | | 773,000 | | | | 777,998 | |
| Foxconn Technology Co., Ltd. | | | | | 53,000 | | | | 143,505 | |
| Innolux Corp. | | | | | 3,853,000 | | | | 1,856,233 | |
| King Yuan Electronics Co., Ltd. | | | | | 1,364,000 | | | | 1,139,492 | |
| Novatek Microelectronics Corp. | | | | | 13,000 | | | | 71,507 | |
| Pou Chen Corp. | | | | | 408,000 | | | | 558,755 | |
| President Chain Store Corp. | | | | | 25,000 | | | | 192,182 | |
| Realtek Semiconductor Corp. | | | | | 30,150 | | | | 91,415 | |
| Shin Kong Financial Holding Co., Ltd. | | | | | 1,913,000 | | | | 533,286 | |
| Sitronix Technology Corp. | | | | | 46,000 | | | | 150,608 | |
| Soft-World International Corp. | | | | | 31,000 | | | | 98,218 | |
| Taiwan Cement Corp. | | | | | 1,198,000 | | | | 1,617,435 | |
| Taiwan Paiho, Ltd. | | | | | 168,000 | | | | 284,026 | |
| Taiwan Semiconductor Manufacturing Co. Ltd. | | | | | 224,000 | | | | 985,069 | |
| Transcend Information, Inc. | | | | | 41,000 | | | | 130,646 | |
| Unity Opto Technology Co., Ltd. | | | | | 254,000 | | | | 235,178 | |
See Notes to Financial Statements.
| BLACKROCK FUNDS | JANUARY 31, 2015 | 17
|
| |
| Schedule of Investments (continued) | BlackRock Emerging Markets Long/Short Equity Fund |
| | | | | Shares | | Value |
Reference Entity — Long |
Taiwan (concluded) | | | | | | | | | | |
| Win Semiconductors Corp. | | | | | 611,000 | | | $ | 641,839 | |
| Wistron Corp. | | | | | 2,506,000 | | | | 2,284,694 | |
| Yuanta Financial Holding Co., Ltd. | | | | | 1,104,775 | | | | 529,991 | |
| | | | | | | | | | 17,363,336 | |
Turkey | | | | | | | | | | |
| Enka Insaat ve Sanayi AS | | | | | 652,817 | | | | 1,318,888 | |
| Haci Omer Sabanci Holding AS | | | | | 350,361 | | | | 1,475,832 | |
| KOC Holding AS | | | | | 78,379 | | | | 406,416 | |
| Koza Altin Isletmeleri AS | | | | | 72,402 | | | | 572,642 | |
| Pegasus Hava Tasimaciligi AS | | | | | 865 | | | | 10,716 | |
| TAV Havalimanlari Holding AS | | | | | 103,570 | | | | 772,551 | |
| Tekfen Holding | | | | | 31,515 | | | | 73,804 | |
| Tupras Turkiye Petrol Rafinerileri AS | | | | | 99,119 | | | | 2,148,282 | |
| Turk Hava Yollari | | | | | 43,359 | | | | 165,476 | |
| Turk Telekomunikasyon AS | | | | | 248,287 | | | | 742,835 | |
| | | | | | | | | | 7,687,442 | |
United Kingdom | | | | | | | | | | |
| Old Mutual PLC | | | | | 542,475 | | | | 1,700,351 | |
Total Reference Entity — Long | | | | | | | | | 127,528,285 | |
| | | | | | | | | | | |
Reference Entity — Short |
Brazil | | | | | | | | | | |
| Aliansce Shopping Centers SA | | | | | (109,600 | ) | | | (657,620 | ) |
| Duratex SA | | | | | (18,480 | ) | | | (51,172 | ) |
| Equatorial Energia SA | | | | | (521,309 | ) | | | (4,857,067 | ) |
| Klabin SA | | | | | (945,538 | ) | | | (4,824,156 | ) |
| Kroton Educacional SA | | | | | (683,300 | ) | | | (3,132,243 | ) |
| Marcopolo SA, Preference Shares | | | | | (52,600 | ) | | | (52,536 | ) |
| Oi SA | | | | | (27,700 | ) | | | (51,513 | ) |
| Smiles SA | | | | | (201,187 | ) | | | (3,167,856 | ) |
| | | | | | | | | | (16,794,163 | ) |
China | | | | | | | | | | |
| Airtac International Group | | | | | (2,000 | ) | | | (17,365 | ) |
| Aluminum Corp. of China Ltd. — ADR | | | | | (12,765 | ) | | | (141,947 | ) |
| Aluminum Corp. of China Ltd., Class H | | | | | (4,920,000 | ) | | | (2,221,230 | ) |
| AviChina Industry & Technology Co., Ltd., Class H | | | | | (764,000 | ) | | | (493,647 | ) |
| BBMG Corp. | | | | | (148,500 | ) | | | (129,958 | ) |
| China Coal Energy Co., Ltd. | | | | | (1,184,000 | ) | | | (652,264 | ) |
| China COSCO Holdings Co., Ltd., Class H | | | | | (675,500 | ) | | | (333,895 | ) |
| China Eastern Airlines Corp., Ltd., Class H, Class H | | | | | (554,000 | ) | | | (280,965 | ) |
| China Longyuan Power Group Corp., Class H | | | | | (3,000 | ) | | | (3,220 | ) |
| China Petroleum & Chemical Corp. | | | | | (40,000 | ) | | | (31,649 | ) |
| China Railway Construction Corp., Ltd. | | | | | (91,500 | ) | | | (104,877 | ) |
| China Shanshui Cement Group, Ltd. | | | | | (1,885,000 | ) | | | (827,809 | ) |
| China Shipping Container Lines Co., Ltd., Class H | | | | | (17,878,000 | ) | | | (5,610,574 | ) |
| China Shipping Development Co., Ltd., Class H | | | | | (1,622,000 | ) | | | (1,154,057 | ) |
| CNOOC, Ltd. | | | | | (1,298,000 | ) | | | (1,722,269 | ) |
| CNOOC, Ltd. — ADR | | | | | (3,411 | ) | | | (454,175 | ) |
| ENN Energy Holdings Ltd. | | | | | (444,000 | ) | | | (2,624,598 | ) |
| First Tractor Co., Ltd., Class H, Class H | | | | | (86,000 | ) | | | (63,206 | ) |
| Great Wall Motor Co., Ltd. | | | | | (196,500 | ) | | | (1,121,599 | ) |
| Haitian International Holdings, Ltd. | | | | | (289,000 | ) | | | (560,309 | ) |
| Hengan International Group Co., Ltd. | | | | | (5,500 | ) | | | (65,286 | ) |
| Hilong Holding, Ltd. | | | | | (240,000 | ) | | | (74,094 | ) |
| Kangda International Environmental Co., Ltd. | | | | | (278,000 | ) | | | (122,728 | ) |
| Kingsoft Corp., Ltd. | | | | | (35,000 | ) | | | (83,407 | ) |
| Maanshan Iron & Steel Co., Ltd., Class H | | | | | (258,000 | ) | | | (70,086 | ) |
| PetroChina Co., Ltd. | | | | | (2,514,000 | ) | | | (2,729,956 | ) |
| Semiconductor Manufacturing International Corp. | | | | | (47,380,000 | ) | | | (4,106,835 | ) |
| Shanghai Electric Group Co., Ltd. | | | | | (1,388,000 | ) | | | (851,058 | ) |
| Shui On Land Ltd. | | | | | (298,500 | ) | | | (67,196 | ) |
| | | | | Shares | | Value |
Reference Entity — Short |
China (concluded) | | | | | | | | | | |
| SOHO China, Ltd. | | | | | (70,500 | ) | | $ | (48,962 | ) |
| Sunac China Holdings, Ltd. | | | | | (759,000 | ) | | | (679,471 | ) |
| Sunny Optical Technology Group Co., Ltd. | | | | | (106,000 | ) | | | (160,788 | ) |
| TCL Communication Technology Holdings, Ltd. | | | | | (261,000 | ) | | | (229,910 | ) |
| Tingyi Cayman Islands Holding Corp. | | | | | (2,408,000 | ) | | | (5,931,194 | ) |
| Uni-President China Holdings, Ltd. | | | | | (787,000 | ) | | | (680,172 | ) |
| Want Want China Holdings, Ltd. | | | | | (433,000 | ) | | | (518,524 | ) |
| Weichai Power Co., Ltd., Class H | | | | | (14,000 | ) | | | (55,385 | ) |
| Yanzhou Coal Mining Co., Ltd., Class H | | | | | (1,830,000 | ) | | | (1,455,293 | ) |
| | | | | | | | | | (36,479,958 | ) |
Egypt | | | | | | | | | | |
| Global Telecom Holding, — GDR | | | | | (20,739 | ) | | | (59,825 | ) |
Greece | | | | | | | | | | |
| Eurobank Ergasias SA | | | | | (3,702,983 | ) | | | (457,921 | ) |
Hong Kong | | | | | | | | | | |
| Beijing Enterprises Water Group Ltd. | | | | | (302,000 | ) | | | (198,272 | ) |
| Brilliance China Automotive Holdings Ltd. | | | | | (72,000 | ) | | | (132,069 | ) |
| China Agri-Industries Holdings Ltd. | | | | | (3,005,000 | ) | | | (1,213,761 | ) |
| China Everbright International, Ltd. | | | | | (54,000 | ) | | | (79,673 | ) |
| China Gas Holdings, Ltd. | | | | | (54,000 | ) | | | (83,460 | ) |
| China Mengniu Dairy Co., Ltd. | | | | | (38,000 | ) | | | (173,149 | ) |
| China Oceanwide Holdings, Ltd. | | | | | (268,000 | ) | | | (28,827 | ) |
| China Resources Enterprise, Ltd. | | | | | (8,007 | ) | | | (17,530 | ) |
| Kunlun Energy Co., Ltd. | | | | | (4,384,000 | ) | | | (4,564,675 | ) |
| Towngas China Co., Ltd. | | | | | (47,000 | ) | | | (41,045 | ) |
| | | | | | | | | | (6,532,461 | ) |
Malta | | | | | | | | | | |
| Brait SE | | | | | (739,085 | ) | | | (4,881,890 | ) |
Mexico | | | | | | | | | | |
| Alfa SAB de C.V. | | | | | (50,400 | ) | | | (92,364 | ) |
| Alsea SAB de C.V. | | | | | (57,286 | ) | | | (153,328 | ) |
| Compartamos SAB de C.V. | | | | | (41,200 | ) | | | (77,840 | ) |
| Empresas ICA SAB de C.V. | | | | | (78,400 | ) | | | (81,436 | ) |
| Fibra Uno Administracion SA de C.V. | | | | | (131,627 | ) | | | (396,914 | ) |
| Grupo Financiero Inbursa SAB de C.V. | | | | | (15,900 | ) | | | (40,998 | ) |
| Grupo Lala SAB de C.V. | | | | | (53,800 | ) | | | (105,127 | ) |
| Grupo Mexico SAB de C.V. | | | | | (21,600 | ) | | | (57,049 | ) |
| Grupo Televisa SAB | | | | | (48,700 | ) | | | (316,967 | ) |
| Mexichem SAB de CV | | | | | (113,972 | ) | | | (316,000 | ) |
| Minera Frisco SAB de CV, Series A-1 | | | | | (257,800 | ) | | | (337,782 | ) |
| | | | | | | | | | (1,975,805 | ) |
South Africa | | | | | | | | | | |
| Aspen Pharmacare Holdings, Ltd. | | | | | (155,087 | ) | | | (5,807,142 | ) |
| Discovery Holdings Ltd. | | | | | (51,370 | ) | | | (505,960 | ) |
| Nampak Ltd. | | | | | (63,770 | ) | | | (232,476 | ) |
| Resilient Property Income Fund, Ltd. | | | | | (11,731 | ) | | | (88,982 | ) |
| RMB Holdings, Ltd. | | | | | (1,877 | ) | | | (10,601 | ) |
| Tiger Brands, Ltd. | | | | | (725 | ) | | | (24,450 | ) |
| | | | | | | | �� | | (6,669,611 | ) |
South Korea | | | | | | | | | | |
| Cheil Industries, Inc. | | | | | (4,596 | ) | | | (571,558 | ) |
| Daewoo Engineering & Construction Co., Ltd. | | | | | (72,037 | ) | | | (444,901 | ) |
| Daewoo Shipbuilding & Marine Engineering Co., Ltd. | | | | | (8,836 | ) | | | (155,800 | ) |
| Doosan Corp. | | | | | (11,745 | ) | | | (1,111,017 | ) |
| Eo Technics Co., Ltd. | | | | | (6,831 | ) | | | (799,451 | ) |
| Halla Visteon Climate Control Corp. | | | | | (15,613 | ) | | | (657,248 | ) |
| Hanjin Transportation Co., Ltd. | | | | | (2,427 | ) | | | (140,530 | ) |
| Hotel Shilla Co., Ltd. | | | | | (1,016 | ) | | | (94,273 | ) |
| Hyundai Glovis Co., Ltd. | | | | | (264 | ) | | | (58,801 | ) |
| Hyundai Heavy Industries Co., Ltd. | | | | | (27,097 | ) | | | (2,776,680 | ) |
See Notes to Financial Statements.
| 18 | BLACKROCK FUNDS | JANUARY 31, 2015
|
| |
| Schedule of Investments (continued) | BlackRock Emerging Markets Long/Short Equity Fund |
| | | | | Shares | | Value |
Reference Entity — Short |
South Korea (concluded) | | | | | | | | | | |
| Hyundai Hysco Co., Ltd. | | | | | (745 | ) | | $ | (52,141 | ) |
| i-SENS, Inc. | | | | | (736 | ) | | | (42,136 | ) |
| Interpark INT Corp. | | | | | (3,304 | ) | | | (70,666 | ) |
| LG Household & Health Care Ltd. | | | | | (861 | ) | | | (541,668 | ) |
| LG International Corp. | | | | | (2,273 | ) | | | (75,940 | ) |
| Orion Corp/Republic of Korea | | | | | (332 | ) | | | (316,804 | ) |
| Samsung Heavy Industries Co., Ltd. | | | | | (5,775 | ) | | | (93,495 | ) |
| | | | | | | | | | (8,003,109 | ) |
Taiwan | | | | | | | | | | |
| Chang Hwa Commercial Bank | | | | | (783,360 | ) | | | (442,018 | ) |
| Eclat Textile Co., Ltd. | | | | | (48,280 | ) | | | (499,811 | ) |
| Formosa Petrochemical Corp. | | | | | (504,000 | ) | | | (1,073,712 | ) |
| Hermes Microvision, Inc. | | | | | (6,000 | ) | | | (283,305 | ) |
| Highwealth Construction Corp. | | | | | (118,000 | ) | | | (239,179 | ) |
| Hiwin Technologies Corp. | | | | | (80,330 | ) | | | (660,886 | ) |
| MediaTek, Inc. | | | | | (10,000 | ) | | | (152,052 | ) |
| Motech Industries, Inc. | | | | | (48,000 | ) | | | (64,218 | ) |
| Quanta Computer, Inc. | | | | | (143,000 | ) | | | (348,490 | ) |
| Ruentex Industries, Ltd. | | | | | (316,000 | ) | | | (685,036 | ) |
| Taiwan Mobile Co., Ltd. | | | | | (98,000 | ) | | | (323,145 | ) |
| TPK Holding Co., Ltd. | | | | | (11,000 | ) | | | (71,264 | ) |
| TSRC Corp. | | | | | (1,000 | ) | | | (1,189 | ) |
| Yang Ming Marine Transport Corp. | | | | | (110,000 | ) | | | (59,234 | ) |
| | | | | | | | | | (4,903,539 | ) |
Thailand | | | | | | | | | | |
| BEC World PCL | | | | | (28,300 | ) | | | (44,530 | ) |
| Minor International PCL | | | | | (1,181,500 | ) | | | (1,308,566 | ) |
| PTT Exploration & Production PCL | | | | | (248,200 | ) | | | (826,575 | ) |
| Siam Commercial Bank PCL | | | | | (32,400 | ) | | | (177,690 | ) |
| | | | | | | | | | (2,357,361 | ) |
Turkey | | | | | | | | | | |
| BIM Birlesik Magazalar | | | | | (128,716 | ) | | | (2,597,511 | ) |
| Turkcell Iletisim Hizmetleri AS—ADR | | | | | (128,369 | ) | | | (1,853,648 | ) |
| | | | | | | | | | (4,451,159 | ) |
Total Reference Entity — Short | | | | | | | | | (93,566,802 | ) |
Net Value of Reference Entity — Morgan Stanley & Co., Inc. | $ | 33,961,483 | |
The following table represents the individual long and short positions and related values of equity securities underlying the total return swap with Morgan Stanley & Co., Inc. as of January 31, 2015, expiration date 2/25/16:
Reference Entity — Long |
Australia | | | | | | | | | | |
| Ramsay Health Care Ltd. | | | | | 9,700 | | | $ | 446,382 | |
Belgium | | | | | | | | | | |
| Nyrstar NV | | | | | 3,896 | | | | 14,656 | |
Canada | | | | | | | | | | |
| Dominion Diamond Corp. | | | | | 4,148 | | | | 68,910 | |
| Methanex Corp. | | | | | 6,480 | | | | 286,391 | |
| Parex Resources, Inc. | | | | | 7,210 | | | | 39,037 | |
| | | | | | | | | | 394,338 | |
Denmark | | | | | | | | | | |
| Novo Nordisk A/S, Class B | | | | | 19,820 | | | | 883,391 | |
| Vestas Wind Systems A/S | | | | | 2,512 | | | | 97,600 | |
| | | | | | | | | | 980,991 | |
France | | | | | | | | | | |
| BioMerieux | | | | | 62 | | | | 6,770 | |
| Hermes International | | | | | 50 | | | | 16,969 | |
| Ingenico | | | | | 378 | | | | 39,517 | |
| | | | | Shares | | Value |
Reference Entity — Long |
France (concluded) | | | | | | | | | | |
| Ipsen SA | | | | | 4,904 | | | $ | 249,586 | |
| | | | | | | | | | 312,842 | |
Germany | | | | | | | | | | |
| Duerr AG | | | | | 2,807 | | | | 255,468 | |
| Kloeckner & Co. SE | | | | | 47,035 | | | | 484,622 | |
| Merck KGaA | | | | | 436 | | | | 43,564 | |
| | | | | | | | | | 783,654 | |
Hong Kong | | | | | | | | | | |
| Dah Sing Financial Holdings, Ltd. | | | | | 4,400 | | | | 25,419 | |
| Hang Lung Properties Ltd. | | | | | 10,000 | | | | 29,403 | |
| Hutchison Whampoa Ltd. | | | | | 64,000 | | | | 849,503 | |
| Kerry Properties Ltd. | | | | | 61,500 | | | | 217,315 | |
| Luk Fook Holdings International, Ltd. | | | | | 41,000 | | | | 152,149 | |
| Orient Overseas International Ltd. | | | | | 4,000 | | | | 26,093 | |
| Wheelock & Co. Ltd. | | | | | 1,000 | | | | 5,658 | |
| | | | | | | | | | 1,305,540 | |
Iran | | | | | | | | | | |
| Smurfit Kappa Group PLC | | | | | 5,974 | | | | 146,873 | |
Ireland | | | | | | | | | | |
| Ingersoll-Rand PLC | | | | | 961 | | | | 63,810 | |
| Kerry Group PLC, Class A | | | | | 792 | | | | 57,400 | |
| | | | | | | | | | 121,210 | |
Italy | | | | | | | | | | |
| Ansaldo STS SpA | | | | | 29,701 | | | | 298,464 | |
| Parmalat SpA | | | | | 6,145 | | | | 17,429 | |
| Recordati SpA | | | | | 16,910 | | | | 279,466 | |
| | | | | | | | | | 595,359 | |
Japan | | | | | | | | | | |
| Alps Electric Co. Ltd. | | | | | 1,300 | | | | 27,063 | |
| Casio Computer Co. Ltd. | | | | | 600 | | | | 9,393 | |
| Citizen Holdings Co. Ltd. | | | | | 13,000 | | | | 103,768 | |
| Daifuku Co. Ltd. | | | | | 11,800 | | | | 135,181 | |
| Disco Corp. | | | | | 4,400 | | | | 403,099 | |
| Enplas Corp. | | | | | 1,800 | | | | 64,233 | |
| FANUC Corp. | | | | | 900 | | | | 152,440 | |
| Fujitsu General Ltd. | | | | | 3,000 | | | | 29,426 | |
| Hitachi Capital Corp. | | | | | 500 | | | | 9,830 | |
| Hitachi Maxell, Ltd. | | | | | 1,000 | | | | 16,972 | |
| Keihin Corp. | | | | | 16,600 | | | | 264,594 | |
| Mazda Motor Corp. | | | | | 3,200 | | | | 65,729 | |
| Mitsubishi Materials Corp. | | | | | 33,000 | | | | 104,061 | |
| Murata Manufacturing Co. Ltd. | | | | | 8,600 | | | | 928,407 | |
| Nifco, Inc. | | | | | 2,900 | | | | 99,896 | |
| Nippon Sheet Glass Co., Ltd. | | | | | 9,000 | | | | 8,354 | |
| Omron Corp. | | | | | 2,100 | | | | 83,955 | |
| OSG Corp. | | | | | 11,400 | | | | 209,894 | |
| Sanken Electric Co., Ltd. | | | | | 1,000 | | | | 8,179 | |
| Sanrio Co. Ltd. | | | | | 1,700 | | | | 42,123 | |
| Shimano, Inc. | | | | | 3,300 | | | | 436,238 | |
| Sumitomo Metal Mining Co. Ltd. | | | | | 3,000 | | | | 42,876 | |
| Tadano Ltd. | | | | | 10,000 | | | | 120,358 | |
| Takata Corp. | | | | | 12,900 | | | | 150,456 | |
| TDK Corp. | | | | | 100 | | | | 6,232 | |
| Topcon Corp. | | | | | 1,300 | | | | 25,760 | |
| TS Tech Co., Ltd. | | | | | 1,500 | | | | 37,793 | |
| | | | | | | | | | 3,586,310 | |
Netherlands | | | | | | | | | | |
| Arcadis NV | | | | | 28,397 | | | | 859,443 | |
| Heineken NV | | | | | 5,292 | | | | 394,933 | |
| NXP Semiconductor NV | | | | | 3,023 | | | | 239,845 | |
| | | | | | | | | | 1,494,221 | |
See Notes to Financial Statements.
| BLACKROCK FUNDS | JANUARY 31, 2015 | 19
|
| |
| Schedule of Investments (continued) | BlackRock Emerging Markets Long/Short Equity Fund |
| | | | | Shares | | Value |
Reference Entity — Long |
Norway | | | | | | | | | | |
| BW LPG Ltd. | | | | | 6,839 | | | $ | 42,240 | |
Singapore | | | | | | | | | | |
| ComfortDelGro Corp. Ltd. | | | | | 117,700 | | | | 249,583 | |
| Flextronics International Ltd. | | | | | 60,970 | | | | 677,986 | |
| Noble Group Ltd. | | | | | 59,300 | | | | 46,387 | |
| Singapore Airlines Ltd. | | | | | 6,600 | | | | 61,648 | |
| Venture Corp. Ltd. | | | | | 17,300 | | | | 103,887 | |
| | | | | | | | | | 1,139,491 | |
Spain | | | | | | | | | | |
| Gamesa Corp. Tecnologica SA | | | | | 30,526 | | | | 301,802 | |
| Gas Natural SDG SA | | | | | 17,073 | | | | 400,768 | |
| Inmobiliaria Colonial SA | | | | | 14,338 | | | | 9,716 | |
| | | | | | | | | | 712,286 | |
Sweden | | | | | | | | | | |
| Telefonaktiebolaget LM Ericsson, Class B | | | | | 30,165 | | | | 365,728 | |
Switzerland | | | | | | | | | | |
| Garmin Ltd. | | | | | 1,087 | | | | 56,916 | |
| Kuoni Reisen Holding AG | | | | | 201 | | | | 67,423 | |
| | | | | | | | | | 124,339 | |
United Kingdom | | | | | | | | | | |
| African Barrick Gold PLC | | | | | 474 | | | | 2,013 | |
| Inchcape PLC | | | | | 36,876 | | | | 385,203 | |
| Pace PLC | | | | | 92,306 | | | | 463,247 | |
| | | | | | | | | | 850,463 | |
United States | | | | | | | | | | |
| Adobe Systems, Inc. | | | | | 2,371 | | | | 166,278 | |
| Air Lease Corp. | | | | | 153 | | | | 5,346 | |
| Akamai Technologies, Inc. | | | | | 1,718 | | | | 99,910 | |
| AmTrust Financial Services, Inc. | | | | | 2,471 | | | | 125,082 | |
| Aruba Networks, Inc. | | | | | 27,697 | | | | 459,216 | |
| Aspen Technology, Inc. | | | | | 12,875 | | | | 455,067 | |
| The Boeing Co. | | | | | 4,615 | | | | 670,883 | |
| Cabot Corp. | | | | | 9,205 | | | | 390,384 | |
| Cabot Microelectronics Corp. | | | | | 12,984 | | | | 641,539 | |
| Calpine Corp. | | | | | 12,326 | | | | 257,367 | |
| Cameron International Corp. | | | | | 6,780 | | | | 303,608 | |
| Caterpillar, Inc. | | | | | 5,283 | | | | 422,482 | |
| CBRE Group, Inc., Class A | | | | | 391 | | | | 12,645 | |
| Century Aluminum Co. | | | | | 17,405 | | | | 402,230 | |
| Citrix Systems, Inc. | | | | | 4,073 | | | | 241,366 | |
| Columbia Sportswear Co. | | | | | 5,491 | | | | 233,367 | |
| Cytec Industries, Inc. | | | | | 18,391 | | | | 882,584 | |
| Deckers Outdoor Corp. | | | | | 514 | | | | 33,950 | |
| Eastman Chemical Co. | | | | | 287 | | | | 20,345 | |
| The Estee Lauder Cos., Inc., Class A | | | | | 945 | | | | 66,708 | |
| Foot Locker, Inc. | | | | | 605 | | | | 32,198 | |
| Fossil Group, Inc. | | | | | 120 | | | | 11,736 | |
| Greatbatch, Inc. | | | | | 1,717 | | | | 83,378 | |
| Hasbro, Inc. | | | | | 7,899 | | | | 433,813 | |
| HCA Holdings, Inc. | | | | | 10,103 | | | | 715,292 | |
| Houghton Mifflin Harcourt Co. | | | | | 1,795 | | | | 35,326 | |
| Huntsman Corp. | | | | | 7,432 | | | | 163,207 | |
| Hyster-Yale Materials Handling, Inc. | | | | | 1,573 | | | | 98,548 | |
| IAC/InterActiveCorp | | | | | 5,950 | | | | 362,652 | |
| Iconix Brand Group, Inc. | | | | | 7,206 | | | | 239,527 | |
| Ingram Micro, Inc., Class A | | | | | 20,166 | | | | 507,780 | |
| The Interpublic Group of Cos., Inc. | | | | | 7,670 | | | | 152,940 | |
| Invesco Ltd. | | | | | 2,241 | | | | 82,312 | |
| ITT Corp. | | | | | 3,741 | | | | 133,965 | |
| Jones Lang LaSalle, Inc. | | | | | 439 | | | | 64,568 | |
| Lear Corp. | | | | | 1,439 | | | | 144,404 | |
| Liberty TripAdvisor Holdings, Inc., Series A | | | | | 9,809 | | | | 234,827 | |
| | | | | Shares | | Value |
Reference Entity — Long |
United States (concluded) | | | | | | | | | | |
| Linear Technology Corp. | | | | | 4,540 | | | $ | 204,028 | |
| LogMeIn, Inc. | | | | | 5,302 | | | | 252,110 | |
| LyondellBasell Industries NV, Class A | | | | | 724 | | | | 57,261 | |
| Manpowergroup, Inc. | | | | | 22,025 | | | | 1,605,182 | |
| Micron Technology, Inc. | | | | | 8,842 | | | | 258,761 | |
| Moog, Inc., Class A | | | | | 439 | | | | 30,862 | |
| Penske Automotive Group, Inc. | | | | | 17,974 | | | | 869,043 | |
| Progress Software Corp. | | | | | 20,906 | | | | 523,695 | |
| Rovi Corp. | | | | | 9,239 | | | | 213,513 | |
| Sealed Air Corp. | | | | | 1,511 | | | | 61,196 | |
| Sirona Dental Systems, Inc. | | | | | 75 | | | | 6,767 | |
| Skyworks Solutions, Inc. | | | | | 1,435 | | | | 119,177 | |
| Spectrum Brands Holdings, Inc. | | | | | 1,221 | | | | 109,499 | |
| SPX Corp. | | | | | 1,586 | | | | 132,542 | |
| The Timken Co. | | | | | 2,410 | | | | 91,604 | |
| Unisys Corp. | | | | | 314 | | | | 6,886 | |
| VF Corp. | | | | | 41 | | | | 2,844 | |
| WABCO Holdings, Inc. | | | | | 1,934 | | | | 184,059 | |
| World Fuel Services Corp. | | | | | 10,080 | | | | 493,618 | |
| Xilinx, Inc. | | | | | 5,960 | | | | 229,907 | |
| Zebra Technologies Corp., Class A | | | | | 2,705 | | | | 225,759 | |
| | | | | | | | | | 15,065,143 | |
Total Reference Entity — Long | | | | | | | | | 28,482,066 | |
| |
Reference Entity — Short |
Australia | | | | | | | | | | |
| Nufarm, Ltd. | | | | | (3,620 | ) | | | (15,907 | ) |
| Orica Ltd. | | | | | (17,119 | ) | | | (240,296 | ) |
| | | | | | | | | | (256,203 | ) |
Canada | | | | | | | | | | |
| Teck Resources, Ltd. | | | | | (6,923 | ) | | | (89,623 | ) |
Finland | | | | | | | | | | |
| Outokumpu OYJ | | | | | (24,476 | ) | | | (132,426 | ) |
France | | | | | | | | | | |
| Kering | | | | | (2,237 | ) | | | (451,344 | ) |
Germany | | | | | | | | | | |
| ElringKlinger AG | | | | | (11,748 | ) | | | (409,338 | ) |
Hong Kong | | | | | | | | | | |
| Esprit Holdings Ltd. | | | | | (30,200 | ) | | | (33,988 | ) |
| Henderson Land Development Co., Ltd. | | | | | (4,000 | ) | | | (28,515 | ) |
| Hong Kong & China Gas Co., Ltd. | | | | | (205,700 | ) | | | (471,045 | ) |
| Hong Kong Exchanges and Clearing, Ltd. | | | | | (19,700 | ) | | | (453,398 | ) |
| Melco International Development, Ltd. | | | | | (141,000 | ) | | | (280,741 | ) |
| Shangri-La Asia, Ltd. | | | | | (4,000 | ) | | | (5,193 | ) |
| Swire Pacific, Ltd. | | | | | (6,000 | ) | | | (80,350 | ) |
| | | | | | | | | | (1,353,230 | ) |
Ireland | | | | | | | | | | |
| Accenture PLC, Class A | | | | | (2,204 | ) | | | (185,202 | ) |
Italy | | | | | | | | | | |
| Saipem SpA | | | | | (3,463 | ) | | | (31,155 | ) |
Japan | | | | | | | | | | |
| Asahi Glass Co., Ltd. | | | | | (86,000 | ) | | | (457,519 | ) |
| Daihatsu Motor Co. Ltd. | | | | | (4,100 | ) | | | (57,172 | ) |
| Daikin Industries, Ltd. | | | | | (800 | ) | | | (55,669 | ) |
| Eisai Co., Ltd. | | | | | (31,800 | ) | | | (1,585,495 | ) |
| Honda Motor Co., Ltd. | | | | | (200 | ) | | | (6,035 | ) |
| Ibiden Co., Ltd. | | | | | (4,000 | ) | | | (60,133 | ) |
| The Japan Steel Works, Ltd. | | | | | (6,000 | ) | | | (24,001 | ) |
| JGC Corp. | | | | | (1,000 | ) | | | (20,338 | ) |
| Nabtesco Corp. | | | | | (900 | ) | | | (23,235 | ) |
See Notes to Financial Statements.
| 20 | BLACKROCK FUNDS | JANUARY 31, 2015
|
| |
| Schedule of Investments (continued) | BlackRock Emerging Markets Long/Short Equity Fund |
| | | | | Shares | | Value |
Reference Entity — Short |
Japan (concluded) | | | | | | | | | | |
| NGK Insulators, Ltd. | | | | | (17,000 | ) | | $ | (342,571 | ) |
| Nikon Corp. | | | | | (3,100 | ) | | | (39,334 | ) |
| Nippon Electric Glass Co. Ltd. | | | | | (70,000 | ) | | | (361,272 | ) |
| Nippon Paint Co., Ltd. | | | | | (15,500 | ) | | | (485,541 | ) |
| Nisshinbo Holdings, Inc. | | | | | (4,000 | ) | | | (44,949 | ) |
| Pigeon Corp. | | | | | (1,400 | ) | | | (87,414 | ) |
| Shimadzu Corp. | | | | | (9,000 | ) | | | (93,509 | ) |
| Shinko Electric Industries Co., Ltd. | | | | | (7,900 | ) | | | (55,335 | ) |
| Sony Corp. | | | | | (23,900 | ) | | | (562,154 | ) |
| Sumco Corp. | | | | | (2,200 | ) | | | (36,922 | ) |
| Sumitomo Chemical Co., Ltd. | | | | | (5,000 | ) | | | (19,671 | ) |
| Sumitomo Rubber Industries, Ltd. | | | | | (200 | ) | | | (3,110 | ) |
| Teijin Ltd. | | | | | (75,000 | ) | | | (223,413 | ) |
| Toray Industries, Inc. | | | | | (35,000 | ) | | | (298,133 | ) |
| Toyo Tire & Rubber Co., Ltd. | | | | | (37,200 | ) | | | (837,877 | ) |
| Toyota Boshoku Corp. | | | | | (500 | ) | | | (6,600 | ) |
| Toyota Tsusho Corp. | | | | | (1,400 | ) | | | (33,156 | ) |
| Ube Industries, Ltd. | | | | | (7,000 | ) | | | (10,484 | ) |
| Ushio, Inc. | | | | | (5,900 | ) | | | (68,352 | ) |
| | | | | | | | | | (5,899,394 | ) |
Netherlands | | | | | | | | | | |
| SBM Offshore NV | | | | | (64,887 | ) | | | (707,940 | ) |
Portugal | | | | | | | | | | |
| Jeronimo Martins SGPS SA | | | | | (14,823 | ) | | | (159,442 | ) |
Singapore | | | | | | | | | | |
| DBS Group Holdings, Ltd. | | | | | (1,700 | ) | | | (24,785 | ) |
| Ezion Holdings, Ltd. | | | | | (20,600 | ) | | | (19,314 | ) |
| | | | | | | | | | (44,099 | ) |
Sweden | | | | | | | | | | |
| SKF AB, -B Shares | | | | | (1,141 | ) | | | (26,895 | ) |
Switzerland | | | | | | | | | | |
| Clariant AG | | | | | (548 | ) | | | (8,804 | ) |
| Holcim Ltd. | | | | | (765 | ) | | | (53,483 | ) |
| OC Oerlikon Corp. AG | | | | | (2,383 | ) | | | (27,106 | ) |
| Panalpina Welttransport Holding AG | | | | | (17 | ) | | | (2,082 | ) |
| SGS SA | | | | | (46 | ) | | | (87,257 | ) |
| Sulzer AG | | | | | (3,811 | ) | | | (403,510 | ) |
| The Swatch Group AG | | | | | (7 | ) | | | (2,797 | ) |
| | | | | | | | | | (585,039 | ) |
United Kingdom | | | | | | | | | | |
| AVEVA Group PLC | | | | | (3,272 | ) | | | (64,709 | ) |
| CNH Industrial NV | | | | | (8,131 | ) | | | (61,899 | ) |
| Croda International PLC | | | | | (4,289 | ) | | | (171,287 | ) |
| HSBC Holdings PLC | | | | | (26,467 | ) | | | (242,152 | ) |
| Inmarsat PLC | | | | | (38,111 | ) | | | (477,542 | ) |
| Ophir Energy PLC | | | | | (105,388 | ) | | | (213,370 | ) |
| Smiths Group PLC | | | | | (3,569 | ) | | | (60,402 | ) |
| Spectris PLC | | | | | (4,065 | ) | | | (127,739 | ) |
| Vodafone Group PLC | | | | | (11,875 | ) | | | (41,758 | ) |
| | | | | | | | | | (1,460,858 | ) |
United States | | | | | | | | | | |
| Aflac, Inc. | | | | | (1,515 | ) | | | (86,476 | ) |
| Amazon.com, Inc. | | | | | (806 | ) | | | (285,751 | ) |
| American Airlines Group, Inc. | | | | | (815 | ) | | | (40,000 | ) |
| American Tower Corp. | | | | | (360 | ) | | | (34,902 | ) |
| Amphenol Corp., Class A Class A | | | | | (2,648 | ) | | | (142,224 | ) |
| Arthur J Gallagher & Co. | | | | | (10,791 | ) | | | (479,444 | ) |
| Balchem Corp. | | | | | (7,421 | ) | | | (393,090 | ) |
| Brady Corp., Class A Class A | | | | | (2,466 | ) | | | (64,535 | ) |
| | | | | Shares | | Value |
Reference Entity — Short |
United States (concluded) | | | | | | | | | | |
| The Brink’s Co. | | | | | (1,232 | ) | | $ | (27,609 | ) |
| CACI International, Inc., Class A Class A | | | | | (4,741 | ) | | | (401,041 | ) |
| Cavium, Inc. | | | | | (2,308 | ) | | | (135,734 | ) |
| Cinemark Holdings, Inc. | | | | | (1,384 | ) | | | (51,443 | ) |
| The Coca-Cola Co. | | | | | (22,453 | ) | | | (924,390 | ) |
| Colfax Corp. | | | | | (2,668 | ) | | | (120,887 | ) |
| CommVault Systems, Inc. | | | | | (934 | ) | | | (40,704 | ) |
| Coty, Inc., Class A | | | | | (19,613 | ) | | | (373,039 | ) |
| Cray, Inc. | | | | | (3,679 | ) | | | (119,531 | ) |
| Crown Castle International Corp. | | | | | (3,162 | ) | | | (273,545 | ) |
| Cypress Semiconductor Corp. | | | | | (3,380 | ) | | | (49,787 | ) |
| Dealertrack Technologies, Inc. | | | | | (15,058 | ) | | | (605,332 | ) |
| Deere & Co. | | | | | (5,380 | ) | | | (458,322 | ) |
| Diebold, Inc. | | | | | (38,289 | ) | | | (1,194,617 | ) |
| Donaldson Co., Inc. | | | | | (5,403 | ) | | | (197,534 | ) |
| Dycom Industries, Inc. | | | | | (293 | ) | | | (9,027 | ) |
| Emerson Electric Co. | | | | | (3,225 | ) | | | (183,632 | ) |
| Essex Property Trust, Inc. | | | | | (839 | ) | | | (189,656 | ) |
| FARO Technologies, Inc. | | | | | (1,380 | ) | | | (76,383 | ) |
| First Cash Financial Services, Inc. | | | | | (4,109 | ) | | | (204,299 | ) |
| FleetCor Technologies, Inc. | | | | | (2,664 | ) | | | (374,292 | ) |
| Franklin Electric Co., Inc. | | | | | (7,805 | ) | | | (267,009 | ) |
| FTI Consulting, Inc. | | | | | (496 | ) | | | (20,172 | ) |
| General Motors Co. | | | | | (36,978 | ) | | | (1,206,222 | ) |
| Genesee & Wyoming, Inc., Class A | | | | | (1,778 | ) | | | (146,596 | ) |
| Gentex Corp. | | | | | (7,157 | ) | | | (119,450 | ) |
| Groupon, Inc. | | | | | (12,841 | ) | | | (91,942 | ) |
| Guess?, Inc. | | | | | (5,728 | ) | | | (107,572 | ) |
| HEICO Corp. | | | | | (1,324 | ) | | | (80,340 | ) |
| Hillenbrand, Inc. | | | | | (1,183 | ) | | | (37,158 | ) |
| Infinera Corp. | | | | | (19,607 | ) | | | (316,065 | ) |
| Ingredion, Inc. | | | | | (29 | ) | | | (2,339 | ) |
| Jabil Circuit, Inc. | | | | | (33,615 | ) | | | (692,805 | ) |
| JDS Uniphase Corp. | | | | | (14,177 | ) | | | (172,251 | ) |
| Juniper Networks, Inc. | | | | | (2,371 | ) | | | (53,893 | ) |
| KBR, Inc. | | | | | (6,388 | ) | | | (105,594 | ) |
| Marketo, Inc. | | | | | (4,535 | ) | | | (156,140 | ) |
| Mettler-Toledo International, Inc. | | | | | (1,319 | ) | | | (400,910 | ) |
| Microsemi Corp. | | | | | (902 | ) | | | (25,130 | ) |
| NetSuite, Inc. | | | | | (37 | ) | | | (3,642 | ) |
| Oracle Corp. | | | | | (3,712 | ) | | | (155,496 | ) |
| Palo Alto Networks, Inc. | | | | | (1,021 | ) | | | (129,044 | ) |
| PriceSmart, Inc. | | | | | (4,334 | ) | | | (354,435 | ) |
| Republic Services, Inc. | | | | | (2,745 | ) | | | (108,922 | ) |
| Rogers Corp. | | | | | (229 | ) | | | (16,914 | ) |
| Schweitzer-Mauduit International, Inc. | | | | | (4,074 | ) | | | (158,316 | ) |
| SEACOR Holdings, Inc. | | | | | (256 | ) | | | (18,419 | ) |
| Sotheby’s | | | | | (16,593 | ) | | | (706,032 | ) |
| The Spectranetics Corp. | | | | | (20,040 | ) | | | (655,508 | ) |
| SunEdison, Inc. | | | | | (36,443 | ) | | | (682,577 | ) |
| Tempur Sealy International, Inc. | | | | | (3,345 | ) | | | (184,075 | ) |
| Teradata Corp. | | | | | (27,080 | ) | | | (1,206,685 | ) |
| Ubiquiti Networks, Inc. | | | | | (244 | ) | | | (6,416 | ) |
| UTi Worldwide, Inc. | | | | | (2,347 | ) | | | (27,859 | ) |
| Varian Medical Systems, Inc. | | | | | (168 | ) | | | (15,550 | ) |
| The Western Union Co. | | | | | (40,671 | ) | | | (691,407 | ) |
| WR Grace & Co. | | | | | (482 | ) | | | (41,779 | ) |
| | | | | | | | | | (16,701,890 | ) |
Total Reference Entity — Short | | | | | | | | | (28,494,078 | ) |
Net Value of Reference Entity — Morgan Stanley & Co., Inc. | $ | (12,012 | ) |
See Notes to Financial Statements.
| BLACKROCK FUNDS | JANUARY 31, 2015 | 21
|
| |
| Schedule of Investments (continued) | BlackRock Emerging Markets Long/Short Equity Fund |
The following table represents the individual long and short positions and related values of equity securities underlying the total return swap with UBS AG as of January 31, 2015, expiration date 3/19/15:
| | | | | Shares | | Value |
Reference Entity — Long |
Brazil | | | | | | | | | | |
| AES Tiete SA, Preference Shares | | | | | 65,800 | | | $ | 406,093 | |
| AMBEV SA | | | | | 8,600 | | | | 56,505 | |
| Banco do Brasil SA | | | | | 23,800 | | | | 183,251 | |
| Bradespar SA, Preference Shares | | | | | 142,900 | | | | 618,306 | |
| Cia Energetica de Minas Gerais, ADR | | | | | 53,365 | | | | 240,676 | |
| Cia Energetica de Sao Paulo, Preference ‘B’ Shares | | | | | 229,382 | | | | 2,014,065 | |
| Cia Paranaense de Energia — ADR | | | | | 8,542 | | | | 99,087 | |
| Cia Paranaense de Energia, Preference B Shares | | | | | 7,600 | | | | 88,370 | |
| Cyrela Brazil Realty SA | | | | | 100,900 | | | | 406,496 | |
| EDP — Energias do Brasil SA | | | | | 155,600 | | | | 502,188 | |
| Embraer SA | | | | | 10,100 | | | | 89,360 | |
| Even Construtora e Incorporadora SA | | | | | 407,600 | | | | 657,750 | |
| Gerdau SA — ADR | | | | | 234,967 | | | | 810,636 | |
| Gerdau SA, Preference Shares | | | | | 14,300 | | | | 48,550 | |
| Itau Unibanco Holding SA, Preference Shares | | | | | 13,900 | | | | 170,431 | |
| JBS SA | | | | | 253,400 | | | | 1,080,368 | |
| Metalurgica Gerdau SA, Preference Shares | | | | | 308,700 | | | | 1,132,063 | |
| MRV Engenharia e Participacoes SA | | | | | 53,100 | | | | 136,745 | |
| Multiplus SA | | | | | 145,760 | | | | 1,887,696 | |
| Petroleo Brasileiro SA — ADR | | | | | 165,086 | | | | 1,015,279 | |
| Petroleo Brasileiro SA, Preference Shares | | | | | 411,600 | | | | 1,254,780 | |
| Telefonica Brasil SA — ADR | | | | | 68,637 | | | | 1,265,666 | |
| Vale SA, Preference Shares — ADR | | | | | 50,194 | | | | 314,214 | |
| Vale SA, Preference Shares | | | | | 9,100 | | | | 56,128 | |
| Valid Solucoes e Servicos de Seguranca em Meios de Pagamento e Identificacao SA | | | | | 11,600 | | | | 166,224 | |
| | | | | | | | | | 14,700,927 | |
Chile | | | | | | | | | | |
| Aguas Andinas SA, Class A | | | | | 711,796 | | | | 407,689 | |
| Empresas COPEC SA | | | | | 4,241 | | | | 47,994 | |
| | | | | | | | | | 455,683 | |
China | | | | | | | | | | |
| Agile Property Holdings Ltd. | | | | | 148,000 | | | | 90,154 | |
| Agricultural Bank of China Ltd., Class H | | | | | 481,000 | | | | 234,879 | |
| Anhui Conch Cement Co., Ltd., Class H | | | | | 145,000 | | | | 485,398 | |
| Anhui Expressway Co., Ltd., Class H | | | | | 780,000 | | | | 565,149 | |
| Bank of China Ltd., Class H | | | | | 1,127,000 | | | | 629,157 | |
| Beijing Capital International Airport Co. Ltd., Class H | | | | | 1,486,000 | | | | 1,411,912 | |
| China Cinda Asset Management Co., Ltd. | | | | | 776,000 | | | | 367,047 | |
| China Communications Services Corp. Ltd., Class H | | | | | 132,000 | | | | 59,441 | |
| China Construction Bank Corp., Class H | | | | | 537,000 | | | | 429,858 | |
| China Railway Group Ltd., Class H | | | | | 26,000 | | | | 18,979 | |
| China Shenhua Energy Co. Ltd., Class H | | | | | 68,000 | | | | 186,662 | |
| China Southern Airlines Co. Ltd., Class H | | | | | 956,000 | | | | 509,054 | |
| China Unicom Hong Kong Ltd. | | | | | 266,000 | | | | 398,148 | |
| Country Garden Holdings Co. Ltd. | | | | | 338,000 | | | | 134,678 | |
| CSPC Pharmaceutical Group Ltd. | | | | | 650,000 | | | | 548,337 | |
| Datang International Power Generation Co. Ltd., Class H | | | | | 1,344,000 | | | | 734,819 | |
| Dongfeng Motor Group Co. Ltd., Class H | | | | | 344,000 | | | | 497,507 | |
| Greentown China Holdings Ltd. | | | | | 214,500 | | | | 187,597 | |
| Guangzhou Baiyunshan Pharmaceutical Holdings Co., Ltd., Class H, Class H | | | | | 220,000 | | | | 779,063 | |
| Longfor Properties Co. Ltd. | | | | | 88,500 | | | | 116,266 | |
| Lonking Holdings Ltd. | | | | | 829,000 | | | | 156,816 | |
| Metallurgical Corp. of China, Ltd. | | | | | 3,596,000 | | | | 1,109,759 | |
| Ping An Insurance Group Co. of China Ltd., Class H | | | | | 284,000 | | | | 3,010,097 | |
| | | | | Shares | | Value |
Reference Entity — Long |
China (concluded) | | | | | | | | | | |
| Shanghai Pharmaceuticals Holding Co., Ltd., Class H | | | | | 673,300 | | | $ | 1,457,978 | |
| Shenzhen Expressway Co., Ltd. | | | | | 496,000 | | | | 385,664 | |
| Sihuan Pharmaceutical Holdings Group Ltd. | | | | | 191,000 | | | | 122,957 | |
| Sino-Ocean Land Holdings Ltd. | | | | | 238,500 | | | | 152,511 | |
| Sinopharm Group Co. Ltd., Class H | | | | | 74,000 | | | | 269,438 | |
| Zhejiang Expressway Co. Ltd., Class H | | | | | 2,522,000 | | | | 3,209,415 | |
| | | | | | | | | | 18,258,740 | |
Hong Kong | | | | | | | | | | |
| China Mobile Ltd. | | | | | 213,000 | | | | 2,792,106 | |
| China Mobile, Ltd., ADR | | | | | 30,570 | | | | 1,996,832 | |
| China Power International Development, Ltd. | | | | | 5,484,000 | | | | 3,113,607 | |
| China Resources Cement Holdings Ltd. | | | | | 2,940,000 | | | | 1,744,728 | |
| China Travel International Inv HK | | | | | 1,752,000 | | | | 574,930 | |
| China Unicom Hong Kong, Ltd., ADR | | | | | 51,128 | | | | 764,364 | |
| Franshion Properties China Ltd. | | | | | 1,536,000 | | | | 450,970 | |
| GOME Electrical Appliances Holding Ltd. | | | | | 6,461,000 | | | | 889,374 | |
| Guangdong Investment Ltd. | | | | | 170,000 | | | | 228,197 | |
| Kingboard Chemical Holdings Ltd. | | | | | 772,000 | | | | 1,248,572 | |
| KWG Property Holding Ltd. | | | | | 443,000 | | | | 282,925 | |
| REXLot Holdings, Ltd. | | | | | 5,200,000 | | | | 406,078 | |
| Shanghai Industrial Holdings, Ltd. | | | | | 362,000 | | | | 1,069,474 | |
| Shenzhen Investment Ltd. | | | | | 5,032,000 | | | | 1,452,292 | |
| Shimao Property Holdings Ltd. | | | | | 1,346,000 | | | | 2,825,255 | |
| Sino Biopharmaceutical Ltd. | | | | | 1,144,000 | | | | 1,142,845 | |
| Skyworth Digital Holdings Ltd. | | | | | 202,000 | | | | 113,916 | |
| Yuexiu Property Co., Ltd. | | | | | 2,374,000 | | | | 461,392 | |
| | | | | | | | | | 21,557,857 | |
Hungary | | | | | | | | | | |
| MOL Hungarian Oil & Gas PLC | | | | | 76,896 | | | | 3,077,553 | |
| OTP Bank PLC | | | | | 23,099 | | | | 306,296 | |
| | | | | | | | | | 3,383,849 | |
Indonesia | | | | | | | | | | |
| Indo Tambangraya Megah Tbk PT | | | | | 326,500 | | | | 430,213 | |
| Telekomunikasi Indonesia Persero Tbk PT | | | | | 4,415,300 | | | | 980,185 | |
| Telekomunikasi Indonesia Persero Tbk PT, ADR | | | | | 9,524 | | | | 420,008 | |
| United Tractors Tbk PT | | | | | 864,300 | | | | 1,216,208 | |
| | | | | | | | | | 3,046,614 | |
Malaysia | | | | | | | | | | |
| British American Tobacco Malaysia Bhd | | | | | 26,600 | | | | 483,540 | |
| KNM Group BHD | | | | | 1,246,400 | | | | 203,599 | |
| YTL Power International Bhd | | | | | 1,133,800 | | | | 499,463 | |
| | | | | | | | | | 1,186,602 | |
Netherlands | | | | | | | | | | |
| Yandex NV | | | | | 40,427 | | | | 601,958 | |
Philippines | | | | | | | | | | |
| Energy Development Corp. | | | | | 537,400 | | | | 103,931 | |
| Globe Telecom, Inc. | | | | | 17,945 | | | | 708,317 | |
| Jollibee Foods Corp. | | | | | 90,570 | | | | 475,495 | |
| Universal Robina Corp. | | | | | 674,430 | | | | 3,164,143 | |
| | | | | | | | | | 4,451,886 | |
Poland | | | | | | | | | | |
| Enea SA | | | | | 107,904 | | | | 479,420 | |
| Grupa Lotos SA | | | | | 21,634 | | | | 142,757 | |
| PGE SA | | | | | 591,489 | | | | 3,099,285 | |
| Polski Koncern Naftowy Orlen SA | | | | | 65,997 | | | | 973,757 | |
| Tauron Polska Energia SA | | | | | 980,338 | | | | 1,318,915 | |
| | | | | | | | | | 6,014,134 | |
Russia | | | | | | | | | | |
| Polymetal International PLC | | | | | 134,490 | | | | 1,211,099 | |
See Notes to Financial Statements.
| 22 | BLACKROCK FUNDS | JANUARY 31, 2015
|
| |
| Schedule of Investments (continued) | BlackRock Emerging Markets Long/Short Equity Fund |
| | | | | Shares | | Value |
Reference Entity — Long |
South Africa | | | | | | | | | | |
| AngloGold Ashanti Ltd. | | | | | 7,088 | | | $ | 85,970 | |
| AngloGold Ashanti, Ltd., ADR | | | | | 53,480 | | | | 662,082 | |
| Bidvest Group Ltd. | | | | | 100,236 | | | | 2,766,372 | |
| Clicks Group, Ltd. | | | | | 72,953 | | | | 565,832 | |
| FirstRand Ltd. | | | | | 160,472 | | | | 714,160 | |
| Liberty Holdings Ltd. | | | | | 12,553 | | | | 141,322 | |
| MMI Holdings Ltd. | | | | | 259,013 | | | | 696,855 | |
| Netcare Ltd. | | | | | 354,032 | | | | 1,175,328 | |
| Sanlam Ltd. | | | | | 42,305 | | | | 253,565 | |
| Sasol Ltd. | | | | | 14,641 | | | | 528,832 | |
| Sibanye Gold, Ltd. | | | | | 592,874 | | | | 1,603,069 | |
| Truworths International Ltd. | | | | | 147,983 | | | | 1,024,777 | |
| | | | | | | | | | 10,218,164 | |
South Korea | | | | | | | | | | |
| AfreecaTV Co., Ltd. | | | | | 13,576 | | | | 351,997 | |
| Amorepacific Corp. | | | | | 266 | | | | 641,063 | |
| Doosan Infracore Co., Ltd. | | | | | 26,906 | | | | 249,114 | |
| Hankook Tire Co., Ltd. | | | | | 37,002 | | | | 1,779,284 | |
| Hyundai Mobis | | | | | 4,855 | | | | 1,097,559 | |
| Hyundai Steel Co. | | | | | 5,466 | | | | 327,940 | |
| Kangwon Land, Inc. | | | | | 42,875 | | | | 1,264,354 | |
| Kia Motors Corp. | | | | | 31,538 | | | | 1,318,038 | |
| Korea Investment Holdings Co., Ltd. | | | | | 5,884 | | | | 277,289 | |
| Korea Line Corp. | | | | | 6,438 | | | | 128,984 | |
| KT Skylife Co., Ltd. | | | | | 65,260 | | | | 963,673 | |
| KT Submarine Co., Ltd. | | | | | 38,729 | | | | 179,722 | |
| LG Corp. | | | | | 93,819 | | | | 5,279,919 | |
| Lotte Food Co., Ltd. | | | | | 593 | | | | 335,358 | |
| LS Industrial Systems Co., Ltd. | | | | | 12,538 | | | | 691,054 | |
| Mando Corp. | | | | | 8,107 | | | | 466,791 | |
| Medy-Tox, Inc. | | | | | 7,588 | | | | 2,549,651 | |
| Mirae Asset Securities Co., Ltd. | | | | | 5,742 | | | | 241,639 | |
| Poongsan Corp. | | | | | 12,150 | | | | 251,207 | |
| POSCO | | | | | 1,788 | | | | 415,344 | |
| Posco ICT Co., Ltd. | | | | | 1 | | | | 5 | |
| SK Hynix, Inc. | | | | | 15,371 | | | | 663,959 | |
| SK Innovation Co., Ltd. | | | | | 1,611 | | | | 136,805 | |
| SK Networks Co., Ltd. | | | | | 53,439 | | | | 457,760 | |
| SK Telecom Co. Ltd. | | | | | 227 | | | | 59,489 | |
| SK Telecom Co., Ltd., ADR | | | | | 91,876 | | | | 2,641,435 | |
| SKC Co., Ltd. | | | | | 12,432 | | | | 341,402 | |
| Sungwoo Hitech Co., Ltd. | | | | | 159,528 | | | | 1,759,640 | |
| Tovis Co., Ltd. | | | | | 4,036 | | | | 72,583 | |
| Woori Bank | | | | | 30,538 | | | | 245,734 | |
| | | | | | | | | | 25,188,792 | |
Taiwan | | | | | | | | | | |
| Advanced Semiconductor Engineering, Inc. | | | | | 858,000 | | | | 1,077,407 | |
| Advanced Semiconductor Engineering, Inc. — ADR | | | | | 97,054 | | | | 641,527 | |
| Ardentec Corp. | | | | | 203,000 | | | | 172,404 | |
| Chicony Electronics Co., Ltd. | | | | | 714,000 | | | | 1,959,241 | |
| Chimei Materials Technology Corp. | | | | | 585,200 | | | | 590,973 | |
| China Steel Chemical Corp. | | | | | 1,000 | | | | 4,835 | |
| CTCI Corp. | | | | | 688,000 | | | | 1,087,167 | |
| Elan Microelectronics Corp. | | | | | 564,000 | | | | 881,975 | |
| Everlight Electronics Co., Ltd. | | | | | 101,000 | | | | 242,273 | |
| Far Eastern Department Stores Ltd. | | | | | 653 | | | | 557 | |
| Far Eastern New Century Corp. | | | | | 331,000 | | | | 333,140 | |
| Innolux Corp. | | | | | 6,806,000 | | | | 3,278,880 | |
| King Yuan Electronics Co., Ltd. | | | | | 1,425,000 | | | | 1,190,452 | |
| Novatek Microelectronics Corp. | | | | | 56,000 | | | | 308,029 | |
| President Chain Store Corp. | | | | | 127,000 | | | | 976,286 | |
| Sigurd Microelectronics Corp. | | | | | 41,000 | | | | 39,038 | |
| Sitronix Technology Corp. | | | | | 1,027,000 | | | | 3,362,485 | |
| Taiwan Cement Corp. | | | | | 692,000 | | | | 934,278 | |
| | | | | Shares | | Value |
Reference Entity — Long |
Taiwan (concluded) | | | | | | | | | | |
| Taiwan Paiho, Ltd. | | | | | 51,000 | | | $ | 86,222 | |
| Unity Opto Technology Co., Ltd. | | | | | 73,000 | | | | 67,590 | |
| Win Semiconductors Corp. | | | | | 370,000 | | | | 388,675 | |
| Wistron Corp. | | | | | 3,559,000 | | | | 3,244,704 | |
| Yuanta Financial Holding Co., Ltd. | | | | | 9,171,950 | | | | 4,400,036 | |
| | | | | | | | | | 25,268,174 | |
Thailand | | | | | | | | | | |
| PTT PCL | | | | | 605,900 | | | | 6,405,176 | |
Turkey | | | | | | | | | | |
| Enka Insaat ve Sanayi AS | | | | | 1,984,051 | | | | 4,008,385 | |
| Haci Omer Sabanci Holding AS | | | | | 705,458 | | | | 2,971,613 | |
| KOC Holding AS | | | | | 119,908 | | | | 621,754 | |
| Koza Altin Isletmeleri AS | | | | | 39,133 | | | | 309,511 | |
| TAV Havalimanlari Holding AS | | | | | 114,316 | | | | 852,708 | |
| Tekfen Holding | | | | | 95,602 | | | | 223,887 | |
| Tofas Turk Otomobil Fabrikasi AS | | | | | 34,093 | | | | 226,952 | |
| Tupras Turkiye Petrol Rafinerileri AS | | | | | 15,930 | | | | 345,263 | |
| Turk Hava Yollari | | | | | 286,606 | | | | 1,093,806 | |
| Turk Telekomunikasyon AS | | | | | 450,427 | | | | 1,347,606 | |
| | | | | | | | | | 12,001,485 | |
United Kingdom | | | | | | | | | | |
| British American Tobacco PLC | | | | | 31,403 | | | | 1,773,533 | |
| Old Mutual PLC | | | | | 247,856 | | | | 776,888 | |
| | | | | | | | | | 2,550,421 | |
United States | | | | | | | | | | |
| Genpact Ltd. | | | | | 36,100 | | | | 724,527 | |
Total Reference Entity — Long | | | | | | | | | 157,226,088 | |
| |
Reference Entity — Short |
Brazil | | | | | | | | | | |
| Aliansce Shopping Centers SA | | | | | (6,800 | ) | | | (40,801 | ) |
| Cia Hering | | | | | (48,900 | ) | | | (331,498 | ) |
| Cia Siderurgica Nacional SA, ADR | | | | | (188,843 | ) | | | (283,264 | ) |
| Duratex SA | | | | | (123,960 | ) | | | (343,249 | ) |
| Equatorial Energia SA | | | | | (85,600 | ) | | | (797,540 | ) |
| Oi SA, ADR | | | | | (85,736 | ) | | | (168,900 | ) |
| Smiles SA | | | | | (31,700 | ) | | | (499,143 | ) |
| | | | | | | | | | (2,464,395 | ) |
Chile | | | | | | | | | | |
| Latam Airlines Group SA — ADR | | | | | (243,643 | ) | | | (2,526,578 | ) |
China | | | | | | | | | | |
| AAC Technologies Holdings, Inc. | | | | | (232,000 | ) | | | (1,482,645 | ) |
| Airtac International Group | | | | | (12,000 | ) | | | (104,189 | ) |
| Aluminum Corp. of China Ltd. — ADR | | | | | (22,644 | ) | | | (251,801 | ) |
| Aluminum Corp. of China Ltd., Class H | | | | | (1,858,000 | ) | | | (838,831 | ) |
| AviChina Industry & Technology Co., Ltd., Class H | | | | | (376,000 | ) | | | (242,947 | ) |
| China Coal Energy Co., Ltd. | | | | | (6,226,000 | ) | | | (3,429,894 | ) |
| China COSCO Holdings Co., Ltd., Class H | | | | | (11,645,000 | ) | | | (5,756,038 | ) |
| China Eastern Airlines Corp., Ltd., Class H, Class H | | | | | (954,000 | ) | | | (483,827 | ) |
| China Longyuan Power Group Corp., Class H | | | | | (1,385,000 | ) | | | (1,486,494 | ) |
| China Minsheng Banking Corp., Ltd. | | | | | (61,500 | ) | | | (74,652 | ) |
| China Petroleum & Chemical Corp. | | | | | (296,000 | ) | | | (234,206 | ) |
| China Shanshui Cement Group, Ltd. | | | | | (2,840,000 | ) | | | (1,247,203 | ) |
| China Shipping Container Lines Co., Ltd., Class H | | | | | (13,329,000 | ) | | | (4,182,981 | ) |
| China Shipping Development Co., Ltd., Class H | | | | | (1,058,000 | ) | | | (752,769 | ) |
| China Tian Lun Gas Holdings, Ltd. | | | | | (52,500 | ) | | | (55,193 | ) |
| CNOOC, Ltd. | | | | | (465,000 | ) | | | (616,992 | ) |
| CNOOC, Ltd. — ADR | | | | | (4,946 | ) | | | (658,560 | ) |
| Dongfang Electric Corp., Ltd., Class H | | | | | (2,473,400 | ) | | | (5,424,690 | ) |
| ENN Energy Holdings Ltd. | | | | | (38,000 | ) | | | (224,628 | ) |
See Notes to Financial Statements.
| BLACKROCK FUNDS | JANUARY 31, 2015 | 23
|
| |
| Schedule of Investments (continued) | BlackRock Emerging Markets Long/Short Equity Fund |
| | | | | Shares | | Value |
Reference Entity — Short |
China (concluded) | | | | | | | | | | |
| First Tractor Co., Ltd., Class H, Class H | | | | | (572,000 | ) | | $ | (420,393 | ) |
| Guangshen Railway Co., Ltd. | | | | | (214,000 | ) | | | (110,673 | ) |
| Guangzhou Shipyard International Co., Ltd. | | | | | (432,000 | ) | | | (1,326,264 | ) |
| Haitian International Holdings, Ltd. | | | | | (13,000 | ) | | | (25,204 | ) |
| Hengan International Group Co., Ltd. | | | | | (11,500 | ) | | | (136,506 | ) |
| Hilong Holding, Ltd. | | | | | (799,000 | ) | | | (246,671 | ) |
| Kingsoft Corp., Ltd. | | | | | (221,000 | ) | | | (526,657 | ) |
| Lenovo Group, Ltd. | | | | | (54,000 | ) | | | (69,530 | ) |
| Maanshan Iron & Steel Co., Ltd., Class H | | | | | (1,158,000 | ) | | | (314,572 | ) |
| PetroChina Co., Ltd. | | | | | (358,000 | ) | | | (388,753 | ) |
| PetroChina Co., Ltd., ADR | | | | | (14,830 | ) | | | (1,610,093 | ) |
| Semiconductor Manufacturing International Corp. | | | | | (3,845,820 | ) | | | (333,351 | ) |
| Shanghai Electric Group Co., Ltd. | | | | | (336,000 | ) | | | (206,020 | ) |
| Shui On Land Ltd. | | | | | (19,000 | ) | | | (4,277 | ) |
| SINA Corp. | | | | | (14,436 | ) | | | (522,872 | ) |
| Sinopec Shanghai Petrochemical Co., Ltd., Class H | | | | | (24,000 | ) | | | (6,946 | ) |
| SOHO China, Ltd. | | | | | (41,500 | ) | | | (28,821 | ) |
| Sohu.com, Inc. | | | | | (562 | ) | | | (31,551 | ) |
| Sunny Optical Technology Group Co., Ltd. | | | | | (1,098,000 | ) | | | (1,665,522 | ) |
| TCL Communication Technology Holdings, Ltd. | | | | | (82,000 | ) | | | (72,232 | ) |
| Tingyi Cayman Islands Holding Corp. | | | | | (416,000 | ) | | | (1,024,658 | ) |
| Uni-President China Holdings, Ltd. | | | | | (1,726,000 | ) | | | (1,491,712 | ) |
| Want Want China Holdings, Ltd. | | | | | (124,000 | ) | | | (148,492 | ) |
| Weichai Power Co., Ltd., Class H | | | | | (41,800 | ) | | | (165,365 | ) |
| Yanzhou Coal Mining Co., Ltd., Class H | | | | | (2,146,000 | ) | | | (1,706,590 | ) |
| Zijin Mining Group Co., Ltd., Class H | | | | | (464,000 | ) | | | (141,293 | ) |
| | | | | | | | | | (40,273,558 | ) |
Colombia | | | | | | | | | | |
| Bancolombia SA, ADR | | | | | (10,384 | ) | | | (480,468 | ) |
Egypt | | | | | | | | | | |
| Global Telecom Holding — GDR | | | | | (271,353 | ) | | | (782,762 | ) |
Hong Kong | | | | | | | | | | |
| Alibaba Pictures Group, Ltd. | | | | | (4,280,000 | ) | | | (844,033 | ) |
| Beijing Enterprises Water Group Ltd. | | | | | (5,576,000 | ) | | | (3,660,807 | ) |
| Brilliance China Automotive Holdings Ltd. | | | | | (28,000 | ) | | | (51,360 | ) |
| China Agri-Industries Holdings Ltd. | | | | | (149,000 | ) | | | (60,183 | ) |
| China Everbright International, Ltd. | | | | | (436,000 | ) | | | (643,285 | ) |
| China Gas Holdings, Ltd. | | | | | (36,000 | ) | | | (55,640 | ) |
| China Mengniu Dairy Co., Ltd. | | | | | (13,000 | ) | | | (59,235 | ) |
| China Resources Enterprise, Ltd. | | | | | (4,000 | ) | | | (8,758 | ) |
| Kunlun Energy Co., Ltd. | | | | | (974,000 | ) | | | (1,014,141 | ) |
| Lee & Man Paper Manufacturing, Ltd. | | | | | (1,191,000 | ) | | | (625,323 | ) |
| Towngas China Co., Ltd. | | | | | (154,000 | ) | | | (134,489 | ) |
| | | | | | | | | | (7,157,254 | ) |
Indonesia | | | | | | | | | | |
| Charoen Pokphand Indonesia Tbk PT | | | | | (48,800 | ) | | | (15,157 | ) |
| Matahari Department Store Tbk PT | | | | | (285,700 | ) | | | (348,932 | ) |
| Tower Bersama Infrastructure Tbk PT | | | | | (212,600 | ) | | | (159,189 | ) |
| | | | | | | | | | (523,278 | ) |
Malaysia | | | | | | | | | | |
| Dialog Group BHD | | | | | (3,960,800 | ) | | | (1,764,232 | ) |
| Malaysia Airports Holdings BHD | | | | | (60 | ) | | | (118 | ) |
| Sapurakencana Petroleum Bhd | | | | | (3,806,300 | ) | | | (2,797,866 | ) |
| | | | | | | | | | (4,562,216 | ) |
Malta | | | | | | | | | | |
| Brait SE | | | | | (259,137 | ) | | | (1,711,682 | ) |
Mexico | | | | | | | | | | |
| Cemex SAB de CV — ADR | | | | | (154,436 | ) | | | (1,372,936 | ) |
| Grupo Televisa SAB, ADR | | | | | (35,031 | ) | | | (1,142,361 | ) |
| Minera Frisco SAB de CV, Series A-1 | | | | | (560,700 | ) | | | (734,657 | ) |
| | | | | | | | | | (3,249,954 | ) |
| | | | | Shares | | Value |
Reference Entity — Short |
Poland | | | | | | | | | | |
| Getin Noble Bank SA | | | | | (190,323 | ) | | $ | (102,201 | ) |
| LPP SA | | | | | (118 | ) | | | (238,669 | ) |
| | | | | | | | | | (340,870 | ) |
South Africa | | | | | | | | | | |
| Aspen Pharmacare Holdings, Ltd. | | | | | (15,527 | ) | | | (581,399 | ) |
| Discovery Holdings Ltd. | | | | | (64,855 | ) | | | (638,778 | ) |
| Nampak Ltd. | | | | | (96,504 | ) | | | (351,809 | ) |
| Remgro Ltd. | | | | | (3,371 | ) | | | (78,004 | ) |
| RMB Holdings, Ltd. | | | | | (268,909 | ) | | | (1,518,823 | ) |
| Tiger Brands, Ltd. | | | | | (272 | ) | | | (9,173 | ) |
| | | | | | | | | | (3,177,986 | ) |
South Korea | | | | | | | | | | |
| Chabiotech Co., Ltd. | | | | | (5,289 | ) | | | (67,871 | ) |
| CJ Korea Express Co., Ltd. | | | | | (16,529 | ) | | | (2,894,791 | ) |
| Daewoo International Corp. | | | | | (4,244 | ) | | | (106,109 | ) |
| Daewoo Shipbuilding & Marine Engineering Co., Ltd. | | | | | (36,819 | ) | | | (649,209 | ) |
| Doosan Corp. | | | | | (14,784 | ) | | | (1,398,491 | ) |
| Doosan Heavy Industries & Construction Co., Ltd. | | | | | (42,481 | ) | | | (901,313 | ) |
| Eo Technics Co., Ltd. | | | | | (1,996 | ) | | | (233,598 | ) |
| Hanjin Transportation Co., Ltd. | | | | | (3,401 | ) | | | (196,927 | ) |
| Hanmi Pharm Co., Ltd. | | | | | (1,492 | ) | | | (132,921 | ) |
| Hanwha Chemical Corp. | | | | | (3,595 | ) | | | (40,223 | ) |
| Hotel Shilla Co., Ltd. | | | | | (32,397 | ) | | | (3,006,068 | ) |
| Hyundai Glovis Co., Ltd. | | | | | (1,305 | ) | | | (290,662 | ) |
| Hyundai Heavy Industries Co., Ltd. | | | | | (15,219 | ) | | | (1,559,519 | ) |
| Hyundai Marine & Fire Insurance Co., Ltd. | | | | | (40,361 | ) | | | (960,522 | ) |
| Hyundai Merchant Marine Co., Ltd. | | | | | (8,830 | ) | | | (24,061 | ) |
| Hyundai Merchant Marine Co., Ltd. | | | | | (57,487 | ) | | | (538,809 | ) |
| Kolao Holdings | | | | | (113,099 | ) | | | (1,743,678 | ) |
| KONA I Co., Ltd. | | | | | (1 | ) | | | (31 | ) |
| NHN Entertainment Corp. | | | | | (14,106 | ) | | | (957,227 | ) |
| OCI Co., Ltd. | | | | | (9,159 | ) | | | (649,348 | ) |
| Orion Corp/Republic of Korea | | | | | (614 | ) | | | (585,897 | ) |
| S-Oil Corp. | | | | | (57,303 | ) | | | (3,152,072 | ) |
| Samsung Electro-Mechanics Co., Ltd. | | | | | (71,897 | ) | | | (4,375,728 | ) |
| Samsung Fine Chemicals Co., Ltd. | | | | | (4 | ) | | | (125 | ) |
| Samsung Life Insurance Co., Ltd. | | | | | (4,148 | ) | | | (426,058 | ) |
| Samsung SDI Co., Ltd. | | | | | (50,789 | ) | | | (5,926,606 | ) |
| Seegene, Inc. | | | | | (2,149 | ) | | | (64,055 | ) |
| | | | | | | | | | (30,881,919 | ) |
Taiwan | | | | | | | | | | |
| Eclat Textile Co., Ltd. | | | | | (360 | ) | | | (3,727 | ) |
| Evergreen Marine Corp. Taiwan Ltd. | | | | | (1,213,000 | ) | | | (864,259 | ) |
| First Financial Holding Co., Ltd. | | | | | (219 | ) | | | (128 | ) |
| Formosa Chemicals & Fibre Corp. | | | | | (175,000 | ) | | | (374,474 | ) |
| Gigastorage Corp. | | | | | (26,000 | ) | | | (20,993 | ) |
| Hiwin Technologies Corp. | | | | | (99,710 | ) | | | (820,328 | ) |
| Hotai Motor Co., Ltd. | | | | | (6,000 | ) | | | (86,213 | ) |
| Taiwan Glass Industry Corp. | | | | | (235,000 | ) | | | (170,792 | ) |
| Unimicron Technology Corp. | | | | | (334,000 | ) | | | (228,735 | ) |
| Yang Ming Marine Transport Corp. | | | | | (1,745,000 | ) | | | (939,669 | ) |
| Yulon Motor Co., Ltd. | | | | | (227,000 | ) | | | (331,504 | ) |
| | | | | | | | | | (3,840,822 | ) |
Thailand | | | | | | | | | | |
| CP ALL PCL | | | | | (10,046,900 | ) | | | (12,738,966 | ) |
| Hemaraj Land and Development PCL | | | | | (820,200 | ) | | | (111,265 | ) |
| Home Product Center PCL | | | | | (5,962,001 | ) | | | (1,484,580 | ) |
| Krung Thai Bank PCL | | | | | (25 | ) | | | (17 | ) |
| True Corp. PCL | | | | | (15,871,100 | ) | | | (6,594,774 | ) |
| | | | | | | | | | (20,929,602 | ) |
Turkey | | | | | | | | | | |
| Turkcell Iletisim Hizmetleri AS—ADR | | | | | (110,947 | ) | | | (1,602,075 | ) |
Total Reference Entity — Short | | | | | | | | | (124,505,419 | ) |
Net Value of Reference Entity — UBS AG | | | | | | | | $ | 32,720,669 | |
See Notes to Financial Statements.
| 24 | BLACKROCK FUNDS | JANUARY 31, 2015
|
| |
| Schedule of Investments (continued) | BlackRock Emerging Markets Long/Short Equity Fund |
The following table represents the individual long and short positions and related values of equity securities underlying the total return swap with UBS AG as of January 31, 2015, expiration date 3/19/15:
| | | | | Shares | | Value |
Reference Entity — Long |
Australia | | | | | | | | | | |
| Ramsay Health Care Ltd. | | | | | 1,243 | | | $ | 57,201 | |
Belgium | | | | | | | | | | |
| Fagron | | | | | 90 | | | | 3,675 | |
| Nyrstar NV | | | | | 5,574 | | | | 20,968 | |
| | | | | | | | | | 24,643 | |
Canada | | | | | | | | | | |
| Dominion Diamond Corp. | | | | | 701 | | | | 11,646 | |
| Methanex Corp. | | | | | 10,276 | | | | 454,159 | |
| Parex Resources, Inc. | | | | | 18,709 | | | | 101,297 | |
| | | | | | | | | | 567,102 | |
Denmark | | | | | | | | | | |
| Novo Nordisk A/S, Class B | | | | | 16,916 | | | | 753,957 | |
| Vestas Wind Systems A/S | | | | | 1,867 | | | | 72,540 | |
| | | | | | | | | | 826,497 | |
France | | | | | | | | | | |
| BioMerieux | | | | | 359 | | | | 39,200 | |
| Ingenico | | | | | 799 | | | | 83,529 | |
| Ipsen SA | | | | | 1,470 | | | | 74,815 | |
| Valeo SA | | | | | 423 | | | | 59,644 | |
| | | | | | | | | | 257,188 | |
Germany | | | | | | | | | | |
| Duerr AG | | | | | 6,522 | | | | 593,575 | |
| Gerresheimer AG | | | | | 74 | | | | 4,035 | |
| Kloeckner & Co. SE | | | | | 33,047 | | | | 340,497 | |
| Merck KGaA | | | | | 1,404 | | | | 140,283 | |
| SAP AG | | | | | 9,755 | | | | 636,687 | |
| | | | | | | | | | 1,715,077 | |
Hong Kong | | | | | | | | | | |
| Dah Sing Financial Holdings, Ltd. | | | | | 5,200 | | | | 30,041 | |
| Hang Lung Properties Ltd. | | | | | 10,000 | | | | 29,403 | |
| Kerry Properties Ltd. | | | | | 13,000 | | | | 45,936 | |
| Luk Fook Holdings International, Ltd. | | | | | 4,000 | | | | 14,844 | |
| Orient Overseas International Ltd. | | | | | 3,500 | | | | 22,832 | |
| Wheelock & Co. Ltd. | | | | | 1,000 | | | | 5,658 | |
| | | | | | | | | | 148,714 | |
Iran | | | | | | | | | | |
| Smurfit Kappa Group PLC | | | | | 3,031 | | | | 74,518 | |
Ireland | | | | | | | | | | |
| Ingersoll-Rand PLC | | | | | 572 | | | | 37,981 | |
| Kerry Group PLC, Class A | | | | | 224 | | | | 16,234 | |
| | | | | | | | | | 54,215 | |
Italy | | | | | | | | | | |
| Ansaldo STS SpA | | | | | 22,406 | | | | 225,157 | |
| Parmalat SpA | | | | | 7,128 | | | | 20,217 | |
| Recordati SpA | | | | | 16,967 | | | | 280,409 | |
| | | | | | | | | | 525,783 | |
Japan | | | | | | | | | | |
| Alps Electric Co. Ltd. | | | | | 900 | | | | 18,736 | |
| Casio Computer Co. Ltd. | | | | | 4,000 | | | | 62,619 | |
| Citizen Holdings Co. Ltd. | | | | | 4,800 | | | | 38,314 | |
| Daifuku Co. Ltd. | | | | | 11,300 | | | | 129,453 | |
| Dainippon Screen Manufacturing Co., Ltd. | | | | | 54,000 | | | | 320,671 | |
| Disco Corp. | | | | | 4,400 | | | | 403,099 | |
| Enplas Corp. | | | | | 2,900 | | | | 103,486 | |
| Fujitsu General Ltd. | | | | | 14,000 | | | | 137,323 | |
| Hitachi Capital Corp. | | | | | 1,400 | | | | 27,525 | |
| | | | | Shares | | Value |
Reference Entity — Long |
Japan (concluded) | | | | | | | | | | |
| Hitachi Maxell, Ltd. | | | | | 700 | | | $ | 11,880 | |
| Hitachi Metals Ltd. | | | | | 2,000 | | | | 32,591 | |
| Keihin Corp. | | | | | 19,300 | | | | 307,630 | |
| Mazda Motor Corp. | | | | | 15,700 | | | | 322,485 | |
| Mitsubishi Materials Corp. | | | | | 69,000 | | | | 217,582 | |
| Murata Manufacturing Co. Ltd. | | | | | 2,800 | | | | 302,272 | |
| Nifco, Inc. | | | | | 6,500 | | | | 223,906 | |
| Oki Electric Industry Co. Ltd. | | | | | 69,000 | | | | 140,938 | |
| Omron Corp. | | | | | 4,700 | | | | 187,900 | |
| OSG Corp. | | | | | 11,000 | | | | 202,530 | |
| Shimano, Inc. | | | | | 900 | | | | 118,974 | |
| Square Enix Holdings Co., Ltd. | | | | | 2,400 | | | | 52,690 | |
| Tadano Ltd. | | | | | 20,000 | | | | 240,716 | |
| Takata Corp. | | | | | 36,200 | | | | 422,209 | |
| Topcon Corp. | | | | | 500 | | | | 9,908 | |
| TS Tech Co., Ltd. | | | | | 4,900 | | | | 123,455 | |
| | | | | | | | | | 4,158,892 | |
Netherlands | | | | | | | | | | |
| Arcadis NV | | | | | 11,970 | | | | 362,276 | |
| Heineken NV | | | | | 2,249 | | | | 167,839 | |
| NXP Semiconductor NV | | | | | 3,784 | | | | 300,222 | |
| | | | | | | | | | 830,337 | |
Singapore | | | | | | | | | | |
| ComfortDelGro Corp. Ltd. | | | | | 272,000 | | | | 576,777 | |
| Indofood Agri Resources, Ltd. | | | | | 57,200 | | | | 29,905 | |
| Singapore Airlines Ltd. | | | | | 29,400 | | | | 274,611 | |
| Venture Corp. Ltd. | | | | | 3,100 | | | | 18,616 | |
| Wing Tai Holdings, Ltd. | | | | | 53,200 | | | | 71,894 | |
| | | | | | | | | | 971,803 | |
Spain | | | | | | | | | | |
| Gamesa Corp. Tecnologica SA | | | | | 10,354 | | | | 102,367 | |
| Gas Natural SDG SA | | | | | 20,763 | | | | 487,386 | |
| Inmobiliaria Colonial SA | | | | | 17,303 | | | | 11,725 | |
| | | | | | | | | | 601,478 | |
Sweden | | | | | | | | | | |
| Telefonaktiebolaget LM Ericsson, Class B | | | | | 12,167 | | | | 147,516 | |
Switzerland | | | | | | | | | | |
| Garmin Ltd. | | | | | 40 | | | | 2,094 | |
| Kuoni Reisen Holding AG | | | | | 697 | | | | 233,801 | |
| Straumann Holding AG, Registered Shares | | | | | 12 | | | | 2,711 | |
| | | | | | | | | | 238,606 | |
United Kingdom | | | | | | | | | | |
| Inchcape PLC | | | | | 18,796 | | | | 196,341 | |
| Pace PLC | | | | | 120,175 | | | | 603,110 | |
| | | | | | | | | | 799,451 | |
United States | | | | | | | | | | |
| Akamai Technologies, Inc. | | | | | 16,889 | | | | 982,180 | |
| AmTrust Financial Services, Inc. | | | | | 4,390 | | | | 222,222 | |
| Aruba Networks, Inc. | | | | | 20,015 | | | | 331,849 | |
| Aspen Technology, Inc. | | | | | 6,286 | | | | 222,179 | |
| The Boeing Co. | | | | | 3,743 | | | | 544,120 | |
| Cabot Corp. | | | | | 14,663 | | | | 621,858 | |
| Cabot Microelectronics Corp. | | | | | 4,948 | | | | 244,481 | |
| Calpine Corp. | | | | | 15,603 | | | | 325,791 | |
| Cameron International Corp. | | | | | 7,567 | | | | 338,850 | |
| Caterpillar, Inc. | | | | | 3,490 | | | | 279,095 | |
| CBRE Group, Inc., Class A | | | | | 95 | | | | 3,072 | |
| Century Aluminum Co. | | | | | 24,072 | | | | 556,304 | |
| Cirrus Logic, Inc. | | | | | 21,325 | | | | 565,112 | |
| Citrix Systems, Inc. | | | | | 5,573 | | | | 330,256 | |
| Columbia Sportswear Co. | | | | | 3,166 | | | | 134,555 | |
| Cytec Industries, Inc. | | | | | 8,555 | | | | 410,554 | |
See Notes to Financial Statements.
| BLACKROCK FUNDS | JANUARY 31, 2015 | 25
|
| |
| Schedule of Investments (continued) | BlackRock Emerging Markets Long/Short Equity Fund |
| | | | | Shares | | Value |
Reference Entity — Long |
United States (concluded) | | | | | | | | | | |
| The Dow Chemical Co. | | | | | 18,404 | | | $ | 831,125 | |
| Eastman Chemical Co. | | | | | 5,597 | | | | 396,771 | |
| The Estee Lauder Cos., Inc., Class A | | | | | 739 | | | | 52,166 | |
| Foot Locker, Inc. | | | | | 4,253 | | | | 226,345 | |
| Hasbro, Inc. | | | | | 14,300 | | | | 785,356 | |
| HCA Holdings, Inc. | | | | | 3,395 | | | | 240,366 | |
| Houghton Mifflin Harcourt Co. | | | | | 1,836 | | | | 36,132 | |
| Hyster-Yale Materials Handling, Inc. | | | | | 1,770 | | | | 110,891 | |
| IAC/InterActiveCorp | | | | | 2,252 | | | | 137,259 | |
| Iconix Brand Group, Inc. | | | | | 15,611 | | | | 518,910 | |
| Ingram Micro, Inc., Class A | | | | | 18,986 | | | | 478,067 | |
| The Interpublic Group of Cos., Inc. | | | | | 35,205 | | | | 701,988 | |
| Invesco Ltd. | | | | | 6,406 | | | | 235,292 | |
| Jones Lang LaSalle, Inc. | | | | | 6,989 | | | | 1,027,942 | |
| Lear Corp. | | | | | 1,427 | | | | 143,199 | |
| Liberty TripAdvisor Holdings, Inc., Series A | | | | | 2,080 | | | | 49,795 | |
| Linear Technology Corp. | | | | | 4,382 | | | | 196,927 | |
| LogMeIn, Inc. | | | | | 8,254 | | | | 392,478 | |
| Manpowergroup, Inc. | | | | | 37 | | | | 2,697 | |
| Mead Johnson Nutrition Co. | | | | | 200 | | | | 19,698 | |
| Micron Technology, Inc. | | | | | 9,281 | | | | 271,608 | |
| Moog, Inc., Class A | | | | | 800 | | | | 56,240 | |
| NRG Energy, Inc. | | | | | 578 | | | | 14,253 | |
| Penske Automotive Group, Inc. | | | | | 10,709 | | | | 517,780 | |
| Progress Software Corp. | | | | | 21,260 | | | | 532,563 | |
| Rovi Corp. | | | | | 6,983 | | | | 161,377 | |
| Sealed Air Corp. | | | | | 2,497 | | | | 101,129 | |
| Skyworks Solutions, Inc. | | | | | 130 | | | | 10,797 | |
| Spectrum Brands Holdings, Inc. | | | | | 659 | | | | 59,099 | |
| SPX Corp. | | | | | 1,583 | | | | 132,291 | |
| Tessera Technologies, Inc. | | | | | 83 | | | | 3,078 | |
| The Timken Co. | | | | | 8,526 | | | | 324,073 | |
| Tyson Foods, Inc., Class A | | | | | 13,232 | | | | 516,577 | |
| Unisys Corp. | | | | | 474 | | | | 10,395 | |
| VF Corp. | | | | | 1,342 | | | | 93,095 | |
| WABCO Holdings, Inc. | | | | | 1,863 | | | | 177,302 | |
| Western Digital Corp. | | | | | 3,153 | | | | 306,566 | |
| World Fuel Services Corp. | | | | | 11,156 | | | | 546,309 | |
| Xilinx, Inc. | | | | | 2,805 | | | | 108,203 | |
| Zebra Technologies Corp., Class A | | | | | 2,363 | | | | 197,216 | |
| | | | | | | | | | 16,835,833 | |
Total Reference Entity — Long | | | | | | | | | 28,834,854 | |
| |
Reference Entity —Short |
Australia | | | | | | | | | | |
| Orica Ltd. | | | | | (11,839 | ) | | | (166,182 | ) |
| Whitehaven Coal Ltd. | | | | | (2,172 | ) | | | (2,074 | ) |
| | | | | | | | | | (168,256 | ) |
Canada | | | | | | | | | | |
| New Gold, Inc. | | | | | (16,998 | ) | | | (74,509 | ) |
| Teck Resources, Ltd. | | | | | (13 | ) | | | (168 | ) |
| | | | | | | | | | (74,677 | ) |
Denmark | | | | | | | | | | |
| FLSmidth & Co. A/S | | | | | (9,484 | ) | | | (400,701 | ) |
Finland | | | | | | | | | | |
| Outokumpu OYJ | | | | | (46,484 | ) | | | (251,498 | ) |
| Outotec OYJ | | | | | (23,835 | ) | | | (138,021 | ) |
| | | | | | | | | | (389,519 | ) |
France | | | | | | | | | | |
| Kering | | | | | (2,939 | ) | | | (592,982 | ) |
| Peugeot SA | | | | | (1,636 | ) | | | (4,173 | ) |
| | | | | | | | | | (597,155 | ) |
| | | | | Shares | | Value |
Reference Entity — Short |
Germany | | | | | | | | | | |
| Dialog Semiconductor PLC | | | | | (2,264 | ) | | $ | (86,586 | ) |
| ElringKlinger AG | | | | | (7,106 | ) | | | (247,596 | ) |
| Puma SE | | | | | (94 | ) | | | (17,891 | ) |
| | | | | | | | | | (352,073 | ) |
Hong Kong | | | | | | | | | | |
| Esprit Holdings Ltd. | | | | | (200 | ) | | | (225 | ) |
| Hong Kong & China Gas Co., Ltd. | | | | | (218,900 | ) | | | (501,273 | ) |
| Hong Kong Exchanges and Clearing, Ltd. | | | | | (100 | ) | | | (2,301 | ) |
| Melco International Development, Ltd. | | | | | (16,000 | ) | | | (31,857 | ) |
| Swire Pacific, Ltd. | | | | | (500 | ) | | | (6,696 | ) |
| | | | | | | | | | (542,352 | ) |
Ireland | | | | | | | | | | |
| Accenture PLC, Class A Class A | | | | | (9,885 | ) | | | (830,637 | ) |
Italy | | | | | | | | | | |
| Saipem SpA | | | | | (5,457 | ) | | | (49,095 | ) |
Japan | | | | | | | | | | |
| Asahi Glass Co., Ltd. | | | | | (23,000 | ) | | | (122,360 | ) |
| Daihatsu Motor Co. Ltd. | | | | | (5,400 | ) | | | (75,300 | ) |
| Ibiden Co., Ltd. | | | | | (1,700 | ) | | | (25,557 | ) |
| The Japan Steel Works, Ltd. | | | | | (26,000 | ) | | | (104,005 | ) |
| Nabtesco Corp. | | | | | (200 | ) | | | (5,163 | ) |
| NGK Insulators, Ltd. | | | | | (6,000 | ) | | | (120,907 | ) |
| Nikon Corp. | | | | | (4,700 | ) | | | (59,635 | ) |
| Nippon Electric Glass Co. Ltd. | | | | | (77,000 | ) | | | (397,399 | ) |
| Nippon Paint Co., Ltd. | | | | | (25,200 | ) | | | (789,396 | ) |
| Pigeon Corp. | | | | | (1,000 | ) | | | (62,438 | ) |
| Sharp Corp. | | | | | (49,000 | ) | | | (95,918 | ) |
| Shimadzu Corp. | | | | | (7,000 | ) | | | (72,729 | ) |
| Shinko Electric Industries Co., Ltd. | | | | | (7,800 | ) | | | (54,635 | ) |
| Sony Corp. | | | | | (18,400 | ) | | | (432,788 | ) |
| Sumco Corp. | | | | | (66,000 | ) | | | (1,107,666 | ) |
| Sumitomo Chemical Co., Ltd. | | | | | (5,000 | ) | | | (19,671 | ) |
| Sumitomo Rubber Industries, Ltd. | | | | | (700 | ) | | | (10,885 | ) |
| Teijin Ltd. | | | | | (32,000 | ) | | | (95,323 | ) |
| Toray Industries, Inc. | | | | | (69,000 | ) | | | (587,748 | ) |
| Toyo Tire & Rubber Co., Ltd. | | | | | (24,800 | ) | | | (558,585 | ) |
| Toyota Tsusho Corp. | | | | | (1,100 | ) | | | (26,051 | ) |
| Ube Industries, Ltd. | | | | | (8,000 | ) | | | (11,981 | ) |
| Ushio, Inc. | | | | | (700 | ) | | | (8,110 | ) |
| | | | | | | | | | (4,844,250 | ) |
Netherlands | | | | | | | | | | |
| OCI | | | | | (1,017 | ) | | | (35,807 | ) |
| SBM Offshore NV | | | | | (10,596 | ) | | | (115,606 | ) |
| | | | | | | | | | (151,413 | ) |
Norway | | | | | | | | | | |
| Opera Software ASA | | | | | (18,378 | ) | | | (243,460 | ) |
Portugal | | | | | | | | | | |
| Jeronimo Martins SGPS SA | | | | | (12,024 | ) | | | (129,334 | ) |
Singapore | | | | | | | | | | |
| DBS Group Holdings, Ltd. | | | | | (1,200 | ) | | | (17,496 | ) |
| Sembcorp Marine, Ltd. | | | | | (6,000 | ) | | | (13,277 | ) |
| United Overseas Bank, Ltd. | | | | | (4,000 | ) | | | (68,403 | ) |
| | | | | | | | | | (99,176 | ) |
Sweden | | | | | | | | | | |
| Elekta AB, -B Shares | | | | | (22,736 | ) | | | (244,006 | ) |
Switzerland | | | | | | | | | | |
| Holcim Ltd. | | | | | (1,300 | ) | | | (91,249 | ) |
| OC Oerlikon Corp. AG | | | | | (537 | ) | | | (6,108 | ) |
| Sulzer AG | | | | | (1,521 | ) | | | (161,044 | ) |
| The Swatch Group AG | | | | | (513 | ) | | | (204,027 | ) |
| | | | | | | | | | (462,428 | ) |
See Notes to Financial Statements.
| 26 | BLACKROCK FUNDS | JANUARY 31, 2015
|
| |
| Schedule of Investments (continued) | BlackRock Emerging Markets Long/Short Equity Fund |
| | | | | Shares | | Value |
Reference Entity — Short |
United Kingdom | | | | | | | | | | |
| AVEVA Group PLC | | | | | (2,938 | ) | | $ | (58,103 | ) |
| CNH Industrial NV | | | | | (17,521 | ) | | | (133,383 | ) |
| Croda International PLC | | | | | (1,368 | ) | | | (54,633 | ) |
| Inmarsat PLC | | | | | (14,081 | ) | | | (176,439 | ) |
| Ophir Energy PLC | | | | | (124,313 | ) | | | (251,685 | ) |
| Spectris PLC | | | | | (4,181 | ) | | | (131,385 | ) |
| Vodafone Group PLC | | | | | (83,511 | ) | | | (293,665 | ) |
| | | | | | | | | | (1,099,293 | ) |
United States | | | | | | | | | | |
| Advanced Micro Devices, Inc. | | | | | (12,913 | ) | | | (33,186 | ) |
| Aflac, Inc. | | | | | (3,350 | ) | | | (191,218 | ) |
| Amazon.com, Inc. | | | | | (3,321 | ) | | | (1,177,394 | ) |
| American Tower Corp. | | | | | (647 | ) | | | (62,727 | ) |
| Arthur J Gallagher & Co. | | | | | (13,336 | ) | | | (592,518 | ) |
| Atmel Corp. | | | | | (778 | ) | | | (6,481 | ) |
| Balchem Corp. | | | | | (6,516 | ) | | | (345,153 | ) |
| Brady Corp., Class A Class A | | | | | (286 | ) | | | (7,485 | ) |
| The Brink’s Co. | | | | | (245 | ) | | | (5,490 | ) |
| CACI International, Inc., Class A Class A | | | | | (1,910 | ) | | | (161,567 | ) |
| Cavium, Inc. | | | | | (868 | ) | | | (51,047 | ) |
| Cinemark Holdings, Inc. | | | | | (1,120 | ) | | | (41,630 | ) |
| Cliffs Natural Resources, Inc. | | | | | (10,910 | ) | | | (70,042 | ) |
| The Coca-Cola Co. | | | | | (15,920 | ) | | | (655,426 | ) |
| Colfax Corp. | | | | | (1,360 | ) | | | (61,622 | ) |
| CommVault Systems, Inc. | | | | | (1,510 | ) | | | (65,806 | ) |
| Coty, Inc., Class A | | | | | (16,427 | ) | | | (312,442 | ) |
| Cray, Inc. | | | | | (1,201 | ) | | | (39,021 | ) |
| Cree, Inc. | | | | | (5,581 | ) | | | (197,344 | ) |
| Crown Castle International Corp. | | | | | (4,932 | ) | | | (426,667 | ) |
| Cypress Semiconductor Corp. | | | | | (3,563 | ) | | | (52,483 | ) |
| Dealertrack Technologies, Inc. | | | | | (14,563 | ) | | | (585,433 | ) |
| Deere & Co. | | | | | (13,479 | ) | | | (1,148,276 | ) |
| Diebold, Inc. | | | | | (4,656 | ) | | | (145,267 | ) |
| Donaldson Co., Inc. | | | | | (1,874 | ) | | | (68,513 | ) |
| Dycom Industries, Inc. | | | | | (402 | ) | | | (12,386 | ) |
| Emerson Electric Co. | | | | | (3,110 | ) | | | (177,083 | ) |
| Essex Property Trust, Inc. | | | | | (5,997 | ) | | | (1,355,622 | ) |
| FARO Technologies, Inc. | | | | | (835 | ) | | | (46,217 | ) |
| Finisar Corp. | | | | | (2,150 | ) | | | (39,001 | ) |
| FireEye, Inc. | | | | | (1,280 | ) | | | (43,277 | ) |
| | | | | Shares | | Value |
Reference Entity — Short |
United States (concluded) | | | | | | | | | | |
| First Cash Financial Services, Inc. | | | | | (2,893 | ) | | $ | (143,840 | ) |
| FleetCor Technologies, Inc. | | | | | (1,090 | ) | | | (153,145 | ) |
| Franklin Electric Co., Inc. | | | | | (7,591 | ) | | | (259,688 | ) |
| General Mills, Inc. | | | | | (1,749 | ) | | | (91,788 | ) |
| Genesee & Wyoming, Inc., Class A | | | | | (1,608 | ) | | | (132,580 | ) |
| Gentex Corp. | | | | | (3,522 | ) | | | (58,782 | ) |
| Groupon, Inc. | | | | | (7,197 | ) | | | (51,531 | ) |
| Guess?, Inc. | | | | | (2,070 | ) | | | (38,875 | ) |
| HEICO Corp. | | | | | (957 | ) | | | (58,071 | ) |
| Hill-Rom Holdings, Inc. | | | | | (5,474 | ) | | | (261,438 | ) |
| Ingredion, Inc. | | | | | (269 | ) | | | (21,692 | ) |
| IPG Photonics Corp. | | | | | (10,378 | ) | | | (774,614 | ) |
| Jabil Circuit, Inc. | | | | | (20,517 | ) | | | (422,855 | ) |
| KBR, Inc. | | | | | (3,922 | ) | | | (64,831 | ) |
| Marketo, Inc. | | | | | (1,184 | ) | | | (40,765 | ) |
| McDermott International, Inc. | | | | | (234,215 | ) | | | (526,984 | ) |
| Mettler-Toledo International, Inc. | | | | | (3,634 | ) | | | (1,104,554 | ) |
| Microsemi Corp. | | | | | (206 | ) | | | (5,739 | ) |
| NetSuite, Inc. | | | | | (872 | ) | | | (85,831 | ) |
| Oracle Corp. | | | | | (4,946 | ) | | | (207,188 | ) |
| Peabody Energy Corp. | | | | | (25,952 | ) | | | (161,681 | ) |
| PriceSmart, Inc. | | | | | (3,477 | ) | | | (284,349 | ) |
| Republic Services, Inc. | | | | | (1,158 | ) | | | (45,949 | ) |
| Schweitzer-Mauduit International, Inc. | | | | | (4,730 | ) | | | (183,808 | ) |
| SEACOR Holdings, Inc. | | | | | (442 | ) | | | (31,802 | ) |
| Sotheby’s | | | | | (8,817 | ) | | | (375,163 | ) |
| The Spectranetics Corp. | | | | | (16,415 | ) | | | (536,935 | ) |
| SunEdison, Inc. | | | | | (39,399 | ) | | | (737,943 | ) |
| TAL International Group, Inc. | | | | | (1,228 | ) | | | (49,918 | ) |
| Tempur Sealy International, Inc. | | | | | (8,485 | ) | | | (466,930 | ) |
| Teradata Corp. | | | | | (428 | ) | | | (19,072 | ) |
| Ubiquiti Networks, Inc. | | | | | (3,418 | ) | | | (89,876 | ) |
| Varian Medical Systems, Inc. | | | | | (111 | ) | | | (10,274 | ) |
| Veeco Instruments, Inc. | | | | | (13,176 | ) | | | (384,344 | ) |
| The Western Union Co. | | | | | (41,024 | ) | | | (697,408 | ) |
| WR Grace & Co. | | | | | (549 | ) | | | (47,587 | ) |
| XPO Logistics, Inc. | | | | | (41,098 | ) | | | (1,511,995 | ) |
| | | | | | | | | | (18,317,649 | ) |
Total Reference Entity — Short | | | | | | | | | (28,995,474 | ) |
Net Value of Reference Entity — UBS AG | | | | | | | | $ | (160,620 | ) |
| • | | | | Fair Value Measurements — Various inputs are used in determining the fair value of investments and derivative financial instruments. These inputs to valuation techniques are categorized into a disclosure hierarchy consisting of three broad levels for financial statement purposes. The hierarchy gives the highest priority to unadjusted quoted prices in active markets for identical assets or liabilities (Level 1 measurements) and the lowest priority to unobservable inputs (Level 3 measurements). Accordingly, the degree of judgment exercised in determining fair value is greatest for instruments categorized in Level 3. The inputs used to measure fair value may fall into different levels of the fair value hierarchy. In such cases, for disclosure purposes, the fair value hierarchy classification is determined based on the lowest level input that is significant to the fair value measurement in its entirety. The categorization of a value determined for investments and derivative financial instruments is based on the pricing transparency of the investment and derivative financial instrument and is not necessarily an indication of the risks associated with investing in those securities. The three levels of the fair value hierarchy are as follows: |
| | • | | | | Level 1 — unadjusted quoted prices in active markets/exchanges for identical assets or liabilities that the Fund has the ability to access |
| | • | | | | Level 2 — other observable inputs (including, but not limited to, quoted prices for similar assets or liabilities in markets that are active, quoted prices for identical or similar assets or liabilities in markets that are not active, inputs other than quoted prices that are observable for the assets or liabilities (such as interest rates, yield curves, volatilities, prepayment speeds, loss severities, credit risks and default rates) or other market-corroborated inputs) |
| | • | | | | Level 3 — unobservable inputs based on the best information available in the circumstances, to the extent observable inputs are not available (including the Fund’s own a`ssumptions used in determining the fair value of investments and derivative financial instruments) |
| | | | | Changes in valuation techniques may result in transfers into or out of an assigned level within the disclosure hierarchy. In accordance with the Fund’s policy, transfers between different levels of the fair value disclosure hierarchy are deemed to have occurred as of the beginning of the reporting period. For information about the Fund’s policy regarding valuation of investments and derivative financial instruments, refer to Note 2 of the Notes to Financial Statements. |
See Notes to Financial Statements.
| BLACKROCK FUNDS | JANUARY 31, 2015 | 27
|
| |
| Schedule of Investments (concluded) | BlackRock Emerging Markets Long/Short Equity Fund |
As of January 31, 2015, the following table summarizes the Fund’s investments and derivative financial instruments categorized in the disclosure hierarchy:
| | Level 1 | | Level 2 | | Level 3 | | Total |
Assets: | | | | | | | | | | | | | | | |
Investments: | | | | | | | | | | | | | | | |
Short-Term Securities | $ | 506,787,730 | | | | — | | | | — | | | $ | 506,787,730 | |
| | | | | | | | | | | | | | | | |
| | Level 1 | | Level 2 | | Level 3 | | Total |
Derivative Financial Instruments1 | | | | | | | | | | | | | | | |
Assets: | | | | | | | | | | | | | | | |
Equity Contracts | | — | | | $ | 10,913,772 | | | | — | | | $ | 10,913,772 | |
| 1 | | Derivative financial instruments are swaps, which are valued at the unrealized appreciation/depreciation on the instrument. |
The Fund may hold liabilities in which the fair value approximates the carrying amount for financial statement purposes. As of January 31, 2015, cash received as collateral for OTC derivatives of $ 11,485,093 is categorized as Level 2 within the disclosure hierarchy.
During the six months ended January 31, 2015, there were no transfers between levels.
See Notes to Financial Statements.
| 28 | BLACKROCK FUNDS | JANUARY 31, 2015
|
| |
| Schedule of Investments January 31, 2015 (Unaudited) | BlackRock Global Long/Short Equity Fund
(Percentages shown are based on Net Assets) |
Common Stocks
|
|
|
| Shares
|
| Value
|
Consumer Finance — 0.1% | | | | | | | | | | |
| LendingClub Corp. (a) | | | | | 98,316 | | | $ | 1,753,122 | |
|
Preferred Securities (a) |
Preferred Stocks | | | | | | | | | | |
Household Durables — 0.1% | | | | | | | | | | |
| AliphCo., 0.00% | | | | | 88,751 | | | | 982,216 | |
Internet Software & Services — 0.1% | | | | | | | | | | |
| Uber Technologies, Inc., Series E, 0.00% | | | | | 45,020 | | | | 1,499,954 | |
Software — 0.1% | | | | | | | | | | |
| Apigee Corp., Series H, 0.00% | | | | | 162,335 | | | | 506,485 | |
| Palantir Technologies, Inc., | | | | | 326,264 | | | | 2,469,819 | |
| | | | | | | | | | 2,976,304 | |
Common Stocks
|
|
|
| Shares
|
| Value
|
Total Preferred Stocks — 0.3% | | | | | | | | $ | 5,458,474 | |
Total Long-Term Investments
(Cost — $5,972,355) — 0.4% | | | | | | | | | 7,211,596 | |
|
Short-Term Securities | | | | | | | | | | |
| BlackRock Liquidity Funds, TempFund, Institutional Class, 0.07% (b)(c) | | | | | 1,684,084,362 | | | | 1,684,084,362 | |
Total Short-Term Securities | | | | | | | | | | |
(Cost — $1,684,084,362) — 98.7% | | | | | | | | | 1,684,084,362 | |
Total Investments | | | | | | | | | | |
(Cost — $1,690,056,717) — 99.1% | | | | | | | | | 1,691,295,958 | |
Other Assets Less Liabilities — 0.9% | | | | | | | | | 15,353,956 | |
Net Assets — 100.0% | | | | | | | | $ | 1,706,649,914 | |
Notes to Schedule of Investments
| (a) | | | | Restricted security as to resale. As of report date, the Fund held restricted securities with a current value of $7,211,596 and an original cost of $5,972,355 which were 0.4% and 0.4%, respectively, of its net assets. |
| (b) | | | | During the six months ended January 31, 2015, investments in issuers considered to be an affiliate of the Fund for purposes of Section 2(a)(3) of the Investment Company Act of 1940, as amended, were as follows: |
Affiliate
|
|
|
| Shares
Held at
July 31, 2014
|
| Net
Activity
|
| Shares
Held at
January 31, 2015
|
| Income
|
BlackRock Liquidity Funds, TempFund, Institutional Class | | | | 1,390,678,750 | | 293,405,612 | | 1,684,084,362 | | $419,111 |
| (c) | | | | Represents current yield as of report date. |
| • | | | | As of January 31, 2015, total return swaps outstanding were as follows:1 |
Reference Entity
|
|
|
| Counterparty
|
| Expiration
Dates
|
| Notional
Amount
|
| Unrealized
Appreciation
(Depreciation)
|
| Net Value of
Reference
Entities
|
Basket of Equity
Securities Long/Short: | | | | Bank of America N.A. | | 2/23/15 | | $ | (45,994,501 | ) | | $ | (1,626,010 | )2 | | $ | (46,283,748 | ) |
| | | | | Deutsche Bank AG | | 2/16/15 — 2/02/16 | | $ | 48,639,163 | | | | 615,096 | 3 | | | 47,215,112 | |
| | | | | Goldman Sachs & Co. | | 3/26/15 — 8/04/16 | | $ | (67,669,229 | ) | | | 34,847,188 | 4 | | | (44,832,941 | ) |
| | | | | UBS AG | | 2/12/15 | | $ | 50,338,707 | | | | 5,312,473 | 5 | | | 56,288,398 | |
Total | | | | | | | | | | | | $ | 39,148,747 | | | $ | 12,386,821 | |
| 1 | | The Fund receives or pays the total return on a portfolio of long and short positions underlying the total return swap. In addition, the Fund pays or receives a variable rate of interest, based on a specified benchmark, plus or minus a spread in a range of 20-467 basis points. The benchmark and spread are determined based upon the country and/or currency of the individual underlying positions. The following are the specified benchmarks used in determining the variable rate of interest: |
| | Association of Banks in Singapore Swap Offered Rate | IntercontinentalExchange LIBOR: |
| | Australian Bank Bill Short Term Rates 1 Day Reference Rate | CHF 1 Week; CHF Spot Next |
| | Bank of Canada Overnight Repo Rate | EUR 1 Month; EUR 1 Week; EUR Overnight |
| | Canada Bankers Acceptances 1 Month | GBP 1 Week; GBP Overnight |
| | Copenhagen Interbank Offered Rates 1 Week | JPY 1 Week; JPY Spot Next |
| | Danish Krone Overnight Deposit | USD 1 Month; USD Spot Next |
| | Federal Funds Rate Open | Nigeria Interbank Offered Rate 1 Week |
| | Garban Intercapital Federal Funds Rate | Norwegian Krone Overnight Deposit |
| | Hong Kong Dollar HIBOR Fixings: | Stockholm Interbank Offered Rate |
| | 1 Month; 2 Week | Stockholm Interbank Offered Rate Overnight |
| | | Tel Aviv Interbank Offered Rate Overnight |
| 2 | | Amount includes $ (1,336,763) of net dividends and financing fees. |
| 3 | | Amount includes $ 2,039,147 of net dividends and financing fees. |
| 4 | | Amount includes $ 12,010,900 of net dividends and financing fees. |
| 5 | | Amount includes $ (637,218) of net dividends and financing fees. |
See Notes to Financial Statements.
| BLACKROCK FUNDS | JANUARY 31, 2015 | 29
|
| |
| Schedule of Investments (continued) | BlackRock Global Long/Short Equity Fund |
The following table represents the individual long and short positions and related values of the equity securities underlying the total return swap with Bank of America N.A. as of January 31, 2015, expiration date 2/23/15:
| | | | | Shares | | Value |
Reference Entity — Long |
Bermuda | | | | | | | | | | |
| Assured Guaranty Ltd. | | | | | 109,257 | | | $ | 2,668,056 | |
Netherlands | | | | | | | | | | |
| AVG Technologies NV | | | | | 25,732 | | | | 508,979 | |
| Core Laboratories NV | | | | | 1,235 | | | | 114,546 | |
| NXP Semiconductor NV | | | | | 17,731 | | | | 1,406,778 | |
| | | | | | | | | | 2,030,303 | |
Singapore | | | | | | | | | | |
| Flextronics International Ltd. | | | | | 164,219 | | | | 1,826,115 | |
United Kingdom | | | | | | | | | | |
| Liberty Global PLC | | | | | 363 | | | | 16,549 | |
United States | | | | | | | | | | |
| AbbVie, Inc. | | | | | 24,787 | | | | 1,495,895 | |
| Activision Blizzard, Inc. | | | | | 2,166 | | | | 45,259 | |
| Acxiom Corp. | | | | | 97,123 | | | | 1,767,639 | |
| Air Lease Corp. | | | | | 24,174 | | | | 844,640 | |
| Alcoa, Inc. | | | | | 177,868 | | | | 2,783,634 | |
| Ally Financial, Inc. | | | | | 181,141 | | | | 3,389,148 | |
| Amdocs Ltd. | | | | | 54,258 | | | | 2,614,150 | |
| Amkor Technology, Inc. | | | | | 6,053 | | | | 38,437 | |
| AmTrust Financial Services, Inc. | | | | | 96,846 | | | | 4,902,345 | |
| ANN, Inc. | | | | | 5,287 | | | | 175,000 | |
| Apartment Investment & Management Co., Class A | | | | | 81,913 | | | | 3,265,052 | |
| ArcBest Corp. | | | | | 31,745 | | | | 1,182,819 | |
| Aruba Networks, Inc. | | | | | 63,121 | | | | 1,046,546 | |
| Aspen Technology, Inc. | | | | | 36,998 | | | | 1,307,694 | |
| Assurant, Inc. | | | | | 14,195 | | | | 901,524 | |
| Axalta Coating Systems, Ltd. | | | | | 10,863 | | | | 278,853 | |
| The Babcock & Wilcox Co. | | | | | 209,090 | | | | 5,693,521 | |
| Berry Plastics Group, Inc. | | | | | 197,632 | | | | 6,683,914 | |
| Best Buy Co., Inc. | | | | | 32,121 | | | | 1,130,659 | |
| Blackstone Mortgage Trust, Inc., Class A | | | | | 44,622 | | | | 1,302,962 | |
| The Boeing Co. | | | | | 49,909 | | | | 7,255,271 | |
| Boise Cascade Co. | | | | | 84,092 | | | | 3,400,680 | |
| Bonanza Creek Energy, Inc. | | | | | 4,859 | | | | 126,723 | |
| Booz Allen Hamilton Holding Corp. | | | | | 87,413 | | | | 2,544,592 | |
| BP Prudhoe Bay Royalty Trust | | | | | 11,080 | | | | 861,470 | |
| Brinker International, Inc. | | | | | 92,151 | | | | 5,384,383 | |
| Brixmor Property Group, Inc. | | | | | 288,035 | | | | 7,805,748 | |
| Cabot Corp. | | | | | 2,945 | | | | 124,897 | |
| Cabot Microelectronics Corp. | | | | | 35,738 | | | | 1,765,815 | |
| Cal-Maine Foods, Inc. | | | | | 4,492 | | | | 157,445 | |
| Calpine Corp. | | | | | 513,111 | | | | 10,713,758 | |
| Cameron International Corp. | | | | | 19,760 | | | | 884,853 | |
| Capstead Mortgage Corp. | | | | | 9,429 | | | | 113,337 | |
| Cardinal Health, Inc. | | | | | 45,026 | | | | 3,745,713 | |
| Catalent, Inc. | | | | | 125,683 | | | | 3,471,364 | |
| Caterpillar, Inc. | | | | | 27,155 | | | | 2,171,585 | |
| CBL & Associates Properties, Inc. | | | | | 92,045 | | | | 1,897,968 | |
| CBS Corp., Class B | | | | | 75,032 | | | | 4,112,504 | |
| Celanese Corp., Series A | | | | | 9,299 | | | | 499,914 | |
| CenterPoint Energy, Inc. | | | | | 336,975 | | | | 7,780,753 | |
| Chatham Lodging Trust | | | | | 13,555 | | | | 421,967 | |
| Chesapeake Lodging Trust | | | | | 1,128 | | | | 41,420 | |
| Cirrus Logic, Inc. | | | | | 60,593 | | | | 1,605,715 | |
| CIT Group, Inc. | | | | | 15,094 | | | | 661,419 | |
| Citrix Systems, Inc. | | | | | 1,142 | | | | 67,675 | |
| Clearwater Paper Corp. | | | | | 2,912 | | | | 215,546 | |
| Coca-Cola Enterprises, Inc. | | | | | 394,649 | | | | 16,614,723 | |
| Comcast Corp., Special Class A | | | | | 249 | | | | 13,172 | |
| Compass Minerals International, Inc. | | | | | 35,488 | | | | 3,101,651 | |
| | | | | Shares | | Value |
Reference Entity — Long |
United States (continued) | | | | | | | | | | |
| Computer Sciences Corp. | | | | | 16,075 | | | $ | 975,431 | |
| Core-Mark Holding Co., Inc. | | | | | 5,500 | | | | 366,740 | |
| Crane Co. | | | | | 97,651 | | | | 5,951,828 | |
| Cytec Industries, Inc. | | | | | 39,309 | | | | 1,886,439 | |
| DDR Corp. | | | | | 140,099 | | | | 2,745,940 | |
| Delek U.S. Holdings, Inc. | | | | | 51,723 | | | | 1,595,655 | |
| Diodes, Inc. | | | | | 40,102 | | | | 1,059,896 | |
| DIRECTV | | | | | 109,469 | | | | 9,335,516 | |
| Dover Corp. | | | | | 13,997 | | | | 980,350 | |
| The Dow Chemical Co. | | | | | 12,405 | | | | 560,210 | |
| DST Systems, Inc. | | | | | 2,180 | | | | 210,806 | |
| DuPont Fabros Technology, Inc. | | | | | 73,411 | | | | 2,735,294 | |
| Dynegy, Inc. | | | | | 476,028 | | | | 13,005,085 | |
| Eastman Chemical Co. | | | | | 108,093 | | | | 7,662,713 | |
| Edwards Lifesciences Corp. | | | | | 889 | | | | 111,436 | |
| EnLink Midstream LLC | | | | | 37,307 | | | | 1,180,393 | |
| FMSA Holdings, Inc. | | | | | 25,761 | | | | 133,700 | |
| Foot Locker, Inc. | | | | | 28,064 | | | | 1,493,566 | |
| Forest City Enterprises, Inc., Class A | | | | | 3,618 | | | | 88,641 | |
| Genworth Financial, Inc., Class A | | | | | 65,948 | | | | 460,317 | |
| Geo Group, Inc. | | | | | 10,844 | | | | 471,931 | |
| Glacier Bancorp, Inc. | | | | | 8,993 | | | | 200,274 | |
| Google, Inc., Class C | | | | | 163 | | | | 87,127 | |
| Great Plains Energy, Inc. | | | | | 21,806 | | | | 644,803 | |
| Green Plains Renewable Energy, Inc. | | | | | 5,485 | | | | 128,404 | |
| Greenhill & Co., Inc. | | | | | 26,443 | | | | 975,218 | |
| Halyard Health, Inc. | | | | | 76,487 | | | | 3,409,026 | |
| The Hanover Insurance Group, Inc. | | | | | 32,561 | | | | 2,246,709 | |
| Harris Corp. | | | | | 5,322 | | | | 357,266 | |
| HCA Holdings, Inc. | | | | | 36,095 | | | | 2,555,526 | |
| Host Hotels & Resorts, Inc. | | | | | 472,812 | | | | 10,822,667 | |
| Hubbell, Inc., Class B | | | | | 6,715 | | | | 712,059 | |
| IAC/InterActiveCorp | | | | | 6,231 | | | | 379,779 | |
| Iconix Brand Group, Inc. | | | | | 211,994 | | | | 7,046,681 | |
| Ingram Micro, Inc., Class A | | | | | 159,254 | | | | 4,010,016 | |
| The Interpublic Group of Cos., Inc. | | | | | 220,676 | | | | 4,400,279 | |
| Invesco Ltd. | | | | | 5,546 | | | | 203,705 | |
| ITC Holdings Corp. | | | | | 184,081 | | | | 7,830,806 | |
| Jack in the Box, Inc. | | | | | 19,146 | | | | 1,623,389 | |
| Jones Lang LaSalle, Inc. | | | | | 60,327 | | | | 8,872,895 | |
| KeyCorp | | | | | 8,284 | | | | 107,609 | |
| Keysight Technologies, Inc. | | | | | 125,426 | | | | 4,187,974 | |
| KLX, Inc. | | | | | 6,481 | | | | 254,768 | |
| Korn/Ferry International | | | | | 3,874 | | | | 110,409 | |
| Lancaster Colony Corp. | | | | | 7,844 | | | | 705,411 | |
| Landstar System, Inc. | | | | | 1,405 | | | | 90,032 | |
| Lannett Co., Inc. | | | | | 5,152 | | | | 244,359 | |
| Lear Corp. | | | | | 7,322 | | | | 734,763 | |
| Liberty Interactive Corp., Series A | | | | | 54,232 | | | | 1,483,788 | |
| Liberty TripAdvisor Holdings, Inc., Series A | | | | | 65,345 | | | | 1,564,359 | |
| LifeLock, Inc. | | | | | 12,211 | | | | 181,333 | |
| Lincoln National Corp. | | | | | 13,312 | | | | 665,334 | |
| Lions Gate Entertainment Corp. | | | | | 48,469 | | | | 1,392,514 | |
| LogMeIn, Inc. | | | | | 17,803 | | | | 846,533 | |
| LyondellBasell Industries NV, Class A | | | | | 7,339 | | | | 580,442 | |
| Mack-Cali Realty Corp. | | | | | 10,685 | | | | 208,464 | |
| Manpowergroup, Inc. | | | | | 162,901 | | | | 11,872,225 | |
| Marathon Petroleum Corp. | | | | | 21,771 | | | | 2,015,777 | |
| Marvell Technology Group Ltd. | | | | | 245,586 | | | | 3,804,127 | |
| MBIA, Inc. | | | | | 364,073 | | | | 2,919,865 | |
| Mead Johnson Nutrition Co. | | | | | 496 | | | | 48,851 | |
| MedAssets, Inc. | | | | | 3,821 | | | | 70,727 | |
| Micron Technology, Inc. | | | | | 461,881 | | | | 13,516,947 | |
| MRC Global, Inc. | | | | | 328,147 | | | | 3,547,269 | |
| Nationstar Mortgage Holdings, Inc. | | | | | 47,382 | | | | 1,218,191 | |
| New Residential Investment Corp. | | | | | 11,989 | | | | 152,860 | |
See Notes to Financial Statements.
| 30 | BLACKROCK FUNDS | JANUARY 31, 2015
|
| |
| Schedule of Investments (continued) | BlackRock Global Long/Short Equity Fund |
| | | | | Shares | | Value |
Reference Entity — Long |
United States (concluded) | | | | | | | | | | |
| Newmont Mining Corp. | | | | | 255,193 | | | $ | 6,418,104 | |
| NIC, Inc. | | | | | 88,428 | | | | 1,451,988 | |
| NRG Energy, Inc. | | | | | 34,155 | | | | 842,262 | |
| Nucor Corp. | | | | | 62,426 | | | | 2,724,895 | |
| OSI Systems, Inc. | | | | | 27,536 | | | | 1,926,969 | |
| Outerwall, Inc. | | | | | 8,763 | | | | 544,007 | |
| Outfront Media, Inc. | | | | | 69,883 | | | | 1,981,183 | |
| Patterson-UTI Energy, Inc. | | | | | 43,071 | | | | 739,098 | |
| Pegasystems, Inc. | | | | | 33,326 | | | | 652,190 | |
| Penske Automotive Group, Inc. | | | | | 60,967 | | | | 2,947,754 | |
| PolyOne Corp. | | | | | 7,891 | | | | 280,841 | |
| Prestige Brands Holdings, Inc. | | | | | 29,138 | | | | 998,268 | |
| Progress Software Corp. | | | | | 104,059 | | | | 2,606,678 | |
| QUALCOMM, Inc. | | | | | 1,863 | | | | 116,363 | |
| Reliance Steel & Aluminum Co. | | | | | 22,886 | | | | 1,198,540 | |
| Reynolds American, Inc. | | | | | 1,072 | | | | 72,842 | |
| Rite Aid Corp. | | | | | 69,971 | | | | 488,398 | |
| Rock-Tenn Co., Class A | | | | | 96,358 | | | | 6,253,634 | |
| Rovi Corp. | | | | | 37,376 | | | | 863,759 | |
| Royal Gold, Inc. | | | | | 12,588 | | | | 912,126 | |
| RPC, Inc. | | | | | 107,386 | | | | 1,339,103 | |
| Sanderson Farms, Inc. | | | | | 80,535 | | | | 6,439,579 | |
| SeaWorld Entertainment, Inc. | | | | | 224,961 | | | | 3,939,067 | |
| ServiceMaster Global Holdings, Inc. | | | | | 193,706 | | | | 5,474,132 | |
| Six Flags Entertainment Corp. | | | | | 37,453 | | | | 1,608,981 | |
| Southwest Airlines Co. | | | | | 5,467 | | | | 246,999 | |
| Spirit Airlines, Inc. | | | | | 1,968 | | | | 145,908 | |
| SPX Corp. | | | | | 13,310 | | | | 1,112,317 | |
| Stanley Black & Decker, Inc. | | | | | 10,741 | | | | 1,005,895 | |
| Steel Dynamics, Inc. | | | | | 296,903 | | | | 5,059,227 | |
| Stillwater Mining Co. | | | | | 88,807 | | | | 1,213,992 | |
| Swift Transportation Co. | | | | | 96,199 | | | | 2,364,571 | |
| Telephone & Data Systems, Inc. | | | | | 37,912 | | | | 881,454 | |
| Tesoro Corp. | | | | | 67,979 | | | | 5,555,924 | |
| Tessera Technologies, Inc. | | | | | 9,946 | | | | 368,798 | |
| Time Warner Cable, Inc. | | | | | 4,153 | | | | 565,348 | |
| Time Warner, Inc. | | | | | 2,286 | | | | 178,148 | |
| The Timken Co. | | | | | 7,363 | | | | 279,868 | |
| TimkenSteel Corp. | | | | | 70,380 | | | | 1,900,260 | |
| TRI Pointe Homes, Inc. | | | | | 187,205 | | | | 2,682,648 | |
| Tribune Co., Class A | | | | | 13,831 | | | | 814,508 | |
| Trinity Industries, Inc. | | | | | 38,532 | | | | 1,019,942 | |
| TrueBlue, Inc. | | | | | 2,079 | | | | 45,863 | |
| U.S. Silica Holdings, Inc. | | | | | 31,122 | | | | 784,274 | |
| Union Pacific Corp. | | | | | 56,516 | | | | 6,624,240 | |
| Unit Corp. | | | | | 26,860 | | | | 799,891 | |
| United Continental Holdings, Inc. | | | | | 3,116 | | | | 216,157 | |
| United States Steel Corp. | | | | | 81,673 | | | | 1,996,088 | |
| Valero Energy Corp. | | | | | 50,715 | | | | 2,681,809 | |
| Vector Group Ltd. | | | | | 59,510 | | | | 1,331,834 | |
| Viacom, Inc., Class B | | | | | 106,772 | | | | 6,878,252 | |
| Voya Financial, Inc. | | | | | 163,278 | | | | 6,369,475 | |
| Waddell & Reed Financial, Inc., Class A | | | | | 87,371 | | | | 3,906,357 | |
| Washington Federal, Inc. | | | | | 50,609 | | | | 1,005,095 | |
| WESCO International, Inc. | | | | | 27,476 | | | | 1,834,298 | |
| Western Refining, Inc. | | | | | 5,237 | | | | 194,450 | |
| Whiting Petroleum Corp. | | | | | 139,956 | | | | 4,201,479 | |
| WPX Energy, Inc. | | | | | 119,183 | | | | 1,270,491 | |
| Xilinx, Inc. | | | | | 8,606 | | | | 331,976 | |
| Zayo Group Holdings, Inc. | | | | | 7,024 | | | | 194,916 | |
| Zebra Technologies Corp., Class A | | | | | 7,493 | | | | 625,366 | |
| | | | | | | | | | 409,964,078 | |
Total Reference Entity — Long | | | | | | | | | 416,505,101 | |
| | | | | Shares | | Value |
Reference Entity — Short |
Canada | | | | | | | | | | |
| Lululemon Athletica, Inc. | | | | | (24,254 | ) | | $ | (1,606,585 | ) |
Ireland | | | | | | | | | | |
| Accenture PLC, Class A Class A | | | | | (189,296 | ) | | | (15,906,543 | ) |
Israel | | | | | | | | | | |
| Check Point Software Technologies, Ltd. | | | | | (21,788 | ) | | | (1,681,380 | ) |
United States | | | | | | | | | | |
| Acadia Healthcare Co., Inc. | | | | | (141,242 | ) | | | (8,156,725 | ) |
| Actuant Corp. | | | | | (23,725 | ) | | | (548,285 | ) |
| Aflac, Inc. | | | | | (4,981 | ) | | | (284,315 | ) |
| Akorn, Inc. | | | | | (82,413 | ) | | | (3,509,146 | ) |
| Allegheny Technologies, Inc. | | | | | (13,511 | ) | | | (385,469 | ) |
| Allegiant Travel Co. | | | | | (21,147 | ) | | | (3,833,317 | ) |
| Alliance Data Systems Corp. | | | | | (12,369 | ) | | | (3,572,538 | ) |
| Amazon.com, Inc. | | | | | (43,707 | ) | | | (15,495,443 | ) |
| Amedisys, Inc. | | | | | (19,590 | ) | | | (552,046 | ) |
| Ameren Corp. | | | | | (43,265 | ) | | | (1,959,039 | ) |
| American Airlines Group, Inc. | | | | | (13,437 | ) | | | (659,488 | ) |
| American Eagle Outfitters, Inc. | | | | | (352,976 | ) | | | (4,955,783 | ) |
| American Tower Corp. | | | | | (1,236 | ) | | | (119,830 | ) |
| Amsurg Corp. | | | | | (10,504 | ) | | | (579,611 | ) |
| AptarGroup, Inc. | | | | | (3,032 | ) | | | (191,350 | ) |
| Arthur J Gallagher & Co. | | | | | (81,400 | ) | | | (3,616,602 | ) |
| Axiall Corp. | | | | | (253,163 | ) | | | (11,202,463 | ) |
| Balchem Corp. | | | | | (27,225 | ) | | | (1,442,108 | ) |
| Bank of Hawaii Corp. | | | | | (15,184 | ) | | | (857,289 | ) |
| Bio-Techne Corp. | | | | | (2,540 | ) | | | (236,271 | ) |
| Boyd Gaming Corp. | | | | | (274,615 | ) | | | (3,586,472 | ) |
| The Brink’s Co. | | | | | (2,013 | ) | | | (45,111 | ) |
| Bristow Group, Inc. | | | | | (13,099 | ) | | | (729,745 | ) |
| CACI International, Inc., Class A Class A | | | | | (7,405 | ) | | | (626,389 | ) |
| Caesars Entertainment Corp. | | | | | (122,431 | ) | | | (1,333,274 | ) |
| Campbell Soup Co. | | | | | (181,460 | ) | | | (8,299,980 | ) |
| Carnival Corp. | | | | | (199,209 | ) | | | (8,757,228 | ) |
| Casey’s General Stores, Inc. | | | | | (13,875 | ) | | | (1,266,787 | ) |
| Cerner Corp. | | | | | (35,392 | ) | | | (2,348,259 | ) |
| Churchill Downs, Inc. | | | | | (1,880 | ) | | | (178,581 | ) |
| CLARCOR, Inc. | | | | | (41,296 | ) | | | (2,582,239 | ) |
| Clean Harbors, Inc. | | | | | (6,727 | ) | | | (318,322 | ) |
| Coach, Inc. | | | | | (75,408 | ) | | | (2,804,424 | ) |
| Cobalt International Energy, Inc. | | | | | (18,118 | ) | | | (165,236 | ) |
| The Coca-Cola Co. | | | | | (408,209 | ) | | | (16,805,965 | ) |
| Colfax Corp. | | | | | (22,882 | ) | | | (1,036,783 | ) |
| CommVault Systems, Inc. | | | | | (10,475 | ) | | | (456,500 | ) |
| comScore, Inc. | | | | | (108,089 | ) | | | (4,492,179 | ) |
| ConAgra Foods, Inc. | | | | | (204,048 | ) | | | (7,229,421 | ) |
| CONSOL Energy, Inc. | | | | | (48,974 | ) | | | (1,417,797 | ) |
| Constellation Brands, Inc. | | | | | (4,613 | ) | | | (509,506 | ) |
| CoreLogic, Inc. | | | | | (1,395 | ) | | | (46,314 | ) |
| Cornerstone OnDemand, Inc. | | | | | (5,743 | ) | | | (189,232 | ) |
| CoStar Group, Inc. | | | | | (23,121 | ) | | | (4,266,056 | ) |
| Coty, Inc., Class A | | | | | (123,378 | ) | | | (2,346,650 | ) |
| Cray, Inc. | | | | | (8,264 | ) | | | (268,497 | ) |
| Crocs, Inc. | | | | | (358,578 | ) | | | (3,800,927 | ) |
| Dealertrack Technologies, Inc. | | | | | (60,998 | ) | | | (2,452,120 | ) |
| Dean Foods Co. | | | | | (252,062 | ) | | | (4,567,363 | ) |
| Deere & Co. | | | | | (45,976 | ) | | | (3,916,695 | ) |
| Diebold, Inc. | | | | | (287,108 | ) | | | (8,957,770 | ) |
| Dillard’s, Inc., Class A Class A | | | | | (4,355 | ) | | | (494,728 | ) |
| Donaldson Co., Inc. | | | | | (17,808 | ) | | | (651,060 | ) |
| Duke Energy Corp. | | | | | (4,674 | ) | | | (407,292 | ) |
| Eclipse Resources Corp. | | | | | (15,649 | ) | | | (97,024 | ) |
| Electronics For Imaging, Inc. | | | | | (8 | ) | | | (309 | ) |
| EMCOR Group, Inc. | | | | | (8 | ) | | | (323 | ) |
| Emerson Electric Co. | | | | | (5,779 | ) | | | (329,056 | ) |
| Enbridge Energy Management LLC | | | | | (29,356 | ) | | | (1,100,556 | ) |
See Notes to Financial Statements.
| BLACKROCK FUNDS | JANUARY 31, 2015 | 31
|
| |
| Schedule of Investments (continued) | BlackRock Global Long/Short Equity Fund |
| | | | | Shares | | Value |
Reference Entity — Short |
United States (continued) | | | | | | | | | | |
| Energizer Holdings, Inc. | | | | | (1,664 | ) | | $ | (213,009 | ) |
| Equifax, Inc. | | | | | (1,371 | ) | | | (115,795 | ) |
| Essex Property Trust, Inc. | | | | | (3,702 | ) | | | (836,837 | ) |
| The EW Scripps Co. | | | | | (47,170 | ) | | | (930,664 | ) |
| ExamWorks Group, Inc. | | | | | (1,100 | ) | | | (40,656 | ) |
| Exxon Mobil Corp. | | | | | (20,318 | ) | | | (1,776,200 | ) |
| FireEye, Inc. | | | | | (116,580 | ) | | | (3,941,570 | ) |
| First Cash Financial Services, Inc. | | | | | (12,929 | ) | | | (642,830 | ) |
| First Niagara Financial Group, Inc. | | | | | (117,561 | ) | | | (954,595 | ) |
| FirstEnergy Corp. | | | | | (115,732 | ) | | | (4,667,472 | ) |
| FirstMerit Corp. | | | | | (42,960 | ) | | | (703,900 | ) |
| FleetCor Technologies, Inc. | | | | | (409 | ) | | | (57,464 | ) |
| Flotek Industries, Inc. | | | | | (86,977 | ) | | | (1,406,418 | ) |
| Franklin Electric Co., Inc. | | | | | (41,990 | ) | | | (1,436,478 | ) |
| Freeport-McMoRan, Inc. | | | | | (5,125 | ) | | | (86,151 | ) |
| Frontier Communications Corp. | | | | | (827,726 | ) | | | (5,558,180 | ) |
| Gentex Corp. | | | | | (3,769 | ) | | | (62,905 | ) |
| Granite Construction, Inc. | | | | | (92,701 | ) | | | (3,159,250 | ) |
| Group 1 Automotive, Inc. | | | | | (4,752 | ) | | | (382,013 | ) |
| Groupon, Inc. | | | | | (365,347 | ) | | | (2,615,885 | ) |
| Guidewire Software, Inc. | | | | | (67,350 | ) | | | (3,374,235 | ) |
| Gulfport Energy Corp. | | | | | (40,997 | ) | | | (1,577,975 | ) |
| The Hain Celestial Group, Inc. | | | | | (2,594 | ) | | | (136,885 | ) |
| HB Fuller Co. | | | | | (6 | ) | | | (247 | ) |
| Health Care REIT, Inc. | | | | | (2,712 | ) | | | (222,248 | ) |
| Healthcare Services Group, Inc. | | | | | (120,510 | ) | | | (3,797,270 | ) |
| Heartland Express, Inc. | | | | | (7,976 | ) | | | (204,903 | ) |
| HeartWare International, Inc. | | | | | (3,377 | ) | | | (282,081 | ) |
| HEICO Corp. | | | | | (718 | ) | | | (43,568 | ) |
| Helmerich & Payne, Inc. | | | | | (1,560 | ) | | | (92,914 | ) |
| Hexcel Corp. | | | | | (7,204 | ) | | | (318,633 | ) |
| Hospira, Inc. | | | | | (37,441 | ) | | | (2,374,883 | ) |
| Hudson City Bancorp, Inc. | | | | | (461,842 | ) | | | (4,142,723 | ) |
| Humana, Inc. | | | | | (2,722 | ) | | | (398,610 | ) |
| Impax Laboratories, Inc. | | | | | (13,050 | ) | | | (478,543 | ) |
| Imperva, Inc. | | | | | (5,797 | ) | | | (242,083 | ) |
| Infinera Corp. | | | | | (9,165 | ) | | | (147,740 | ) |
| Integra LifeSciences Holdings Corp. | | | | | (12,357 | ) | | | (688,532 | ) |
| Intrepid Potash, Inc. | | | | | (429,601 | ) | | | (5,717,989 | ) |
| Investors Bancorp, Inc. | | | | | (7,499 | ) | | | (82,564 | ) |
| j2 Global, Inc. | | | | | (11,274 | ) | | | (647,579 | ) |
| Jabil Circuit, Inc. | | | | | (20,642 | ) | | | (425,432 | ) |
| Janus Capital Group, Inc. | | | | | (160,687 | ) | | | (2,818,450 | ) |
| Kate Spade & Co. | | | | | (55,698 | ) | | | (1,756,158 | ) |
| KB Home | | | | | (64,979 | ) | | | (809,638 | ) |
| KBR, Inc. | | | | | (6,910 | ) | | | (114,222 | ) |
| Kilroy Realty Corp. | | | | | (1,000 | ) | | | (74,150 | ) |
| Kinder Morgan, Inc. | | | | | (122,231 | ) | | | (5,017,583 | ) |
| Life Time Fitness, Inc. | | | | | (7,123 | ) | | | (389,414 | ) |
| Loews Corp. | | | | | (125,172 | ) | | | (4,789,081 | ) |
| Louisiana-Pacific Corp. | | | | | (510,587 | ) | | | (8,358,309 | ) |
| Magellan Health, Inc. | | | | | (1,073 | ) | | | (64,509 | ) |
| Magnum Hunter Resources Corp., (Issued 12/27/07, 1 Share for 1 Warrant, Expires 4/15/16, Strike Price $45.82) | | | | | (60 | ) | | | — | |
| MarketAxess Holdings, Inc. | | | | | (2,678 | ) | | | (203,448 | ) |
| Marketo, Inc. | | | | | (7,289 | ) | | | (250,960 | ) |
| Martin Marietta Materials, Inc. | | | | | (36,261 | ) | | | (3,906,760 | ) |
| Matthews International Corp., Class A | | | | | (1,798 | ) | | | (83,301 | ) |
| McDermott International, Inc. | | | | | (553,599 | ) | | | (1,245,598 | ) |
| McDonald’s Corp. | | | | | (111,715 | ) | | | (10,326,935 | ) |
| Medical Properties Trust, Inc. | | | | | (24,734 | ) | | | (380,162 | ) |
| Medidata Solutions, Inc. | | | | | (123,481 | ) | | | (5,308,448 | ) |
| Mercury General Corp. | | | | | (28,458 | ) | | | (1,626,375 | ) |
| Mettler-Toledo International, Inc. | | | | | (1,102 | ) | | | (334,953 | ) |
| MSC Industrial Direct Co., Inc. | | | | | (4,604 | ) | | | (345,622 | ) |
| | | | | Shares | | Value |
Reference Entity — Short |
United States (continued) | | | | | | | | | | |
| Neogen Corp. | | | | | (33,464 | ) | | $ | (1,542,690 | ) |
| Netflix, Inc. | | | | | (3,674 | ) | | | (1,623,173 | ) |
| NetSuite, Inc. | | | | | (20,257 | ) | | | (1,993,896 | ) |
| Olin Corp. | | | | | (321,339 | ) | | | (8,055,969 | ) |
| ONEOK, Inc. | | | | | (6 | ) | | | (264 | ) |
| Oracle Corp. | | | | | (263,848 | ) | | | (11,052,593 | ) |
| Palo Alto Networks, Inc. | | | | | (17,589 | ) | | | (2,223,074 | ) |
| Pandora Media, Inc. | | | | | (16,361 | ) | | | (271,593 | ) |
| Pinnacle Entertainment, Inc. | | | | | (136,869 | ) | | | (2,894,779 | ) |
| Plum Creek Timber Co., Inc. | | | | | (12,740 | ) | | | (567,185 | ) |
| Polaris Industries, Inc. | | | | | (3,759 | ) | | | (543,514 | ) |
| Post Holdings, Inc. | | | | | (3,716 | ) | | | (175,581 | ) |
| Precision Castparts Corp. | | | | | (2,056 | ) | | | (411,406 | ) |
| PriceSmart, Inc. | | | | | (21,457 | ) | | | (1,754,753 | ) |
| The Procter & Gamble Co. | | | | | (1,211 | ) | | | (102,075 | ) |
| Proofpoint, Inc. | | | | | (144,005 | ) | | | (7,200,250 | ) |
| Public Service Enterprise Group, Inc. | | | | | (1,563 | ) | | | (66,709 | ) |
| PVH Corp. | | | | | (20,205 | ) | | | (2,227,803 | ) |
| Ralph Lauren Corp. | | | | | (7,705 | ) | | | (1,285,887 | ) |
| Republic Services, Inc. | | | | | (2,472 | ) | | | (98,089 | ) |
| Royal Caribbean Cruises, Ltd. | | | | | (62,419 | ) | | | (4,715,755 | ) |
| SCANA Corp. | | | | | (57,896 | ) | | | (3,692,028 | ) |
| Schweitzer-Mauduit International, Inc. | | | | | (34,397 | ) | | | (1,336,667 | ) |
| Scientific Games Corp. | | | | | (125,447 | ) | | | (1,481,529 | ) |
| Select Medical Holdings Corp. | | | | | (6,691 | ) | | | (90,462 | ) |
| Sensient Technologies Corp. | | | | | (47,793 | ) | | | (2,915,373 | ) |
| ServiceNow, Inc. | | | | | (120,426 | ) | | | (8,779,055 | ) |
| Snyder’s-Lance, Inc. | | | | | (51,254 | ) | | | (1,490,979 | ) |
| Solera Holdings, Inc. | | | | | (6 | ) | | | (310 | ) |
| Sotheby’s | | | | | (83,211 | ) | | | (3,540,628 | ) |
| The Southern Co. | | | | | (249,360 | ) | | | (12,647,539 | ) |
| The Spectranetics Corp. | | | | | (54,596 | ) | | | (1,785,835 | ) |
| Splunk, Inc. | | | | | (63,538 | ) | | | (3,281,738 | ) |
| Staples, Inc. | | | | | (330,708 | ) | | | (5,638,571 | ) |
| Stericycle, Inc. | | | | | (10,427 | ) | | | (1,368,961 | ) |
| Stifel Financial Corp. | | | | | (4,305 | ) | | | (202,981 | ) |
| SunEdison, Inc. | | | | | (331,411 | ) | | | (6,207,328 | ) |
| SYNNEX Corp. | | | | | (38,718 | ) | | | (2,872,488 | ) |
| Sysco Corp. | | | | | (255,974 | ) | | | (10,026,502 | ) |
| TAL International Group, Inc. | | | | | (11,220 | ) | | | (456,093 | ) |
| Tech Data Corp. | | | | | (738 | ) | | | (42,140 | ) |
| TECO Energy, Inc. | | | | | (90,275 | ) | | | (1,925,566 | ) |
| Teleflex, Inc. | | | | | (1,114 | ) | | | (122,050 | ) |
| Tempur Sealy International, Inc. | | | | | (27,131 | ) | | | (1,493,019 | ) |
| Teradata Corp. | | | | | (12,484 | ) | | | (556,287 | ) |
| Thermo Fisher Scientific, Inc. | | | | | (1,705 | ) | | | (213,483 | ) |
| Tidewater, Inc. | | | | | (75,461 | ) | | | (2,207,989 | ) |
| Tiffany & Co. | | | | | (30,812 | ) | | | (2,669,552 | ) |
| Total System Services, Inc. | | | | | (38,366 | ) | | | (1,357,005 | ) |
| Twitter, Inc. | | | | | (34,354 | ) | | | (1,289,306 | ) |
| Tyler Technologies, Inc. | | | | | (8,594 | ) | | | (911,652 | ) |
| UIL Holdings Corp. | | | | | (4,203 | ) | | | (193,338 | ) |
| United Bankshares, Inc. | | | | | (9,935 | ) | | | (335,902 | ) |
| United Natural Foods, Inc. | | | | | (7,959 | ) | | | (615,072 | ) |
| UnitedHealth Group, Inc. | | | | | (131,166 | ) | | | (13,936,387 | ) |
| US Ecology, Inc. | | | | | (50,905 | ) | | | (2,110,521 | ) |
| USG Corp. | | | | | (139,522 | ) | | | (4,248,445 | ) |
| Varian Medical Systems, Inc. | | | | | (6,784 | ) | | | (627,927 | ) |
| Veeco Instruments, Inc. | | | | | (47,261 | ) | | | (1,378,603 | ) |
| Verisk Analytics, Inc., Class A | | | | | (23,120 | ) | | | (1,487,772 | ) |
| Virtus Investment Partners, Inc. | | | | | (23,097 | ) | | | (3,132,646 | ) |
| WageWorks, Inc. | | | | | (19,459 | ) | | | (1,071,023 | ) |
| Wal-Mart Stores, Inc. | | | | | (77,027 | ) | | | (6,545,754 | ) |
| WellCare Health Plans, Inc. | | | | | (19,025 | ) | | | (1,385,971 | ) |
| Westar Energy, Inc. | | | | | (10,966 | ) | | | (468,468 | ) |
| WEX, Inc. | | | | | (23,483 | ) | | | (2,161,610 | ) |
See Notes to Financial Statements.
| 32 | BLACKROCK FUNDS | JANUARY 31, 2015
|
| |
| Schedule of Investments (continued) | BlackRock Global Long/Short Equity Fund |
| | | | | Shares | | Value |
Reference Entity — Short |
United States (concluded) | | | | | | | | | | |
| Wolverine World Wide, Inc. | | | | | (212,150 | ) | | $ | (5,972,022 | ) |
| Workday, Inc., Class A | | | | | (1,468 | ) | | | (116,647 | ) |
| WR Grace & Co. | | | | | (10,744 | ) | | | (931,290 | ) |
| XPO Logistics, Inc. | | | | | (55,763 | ) | | | (2,051,521 | ) |
| Yelp, Inc. | | | | | (1,789 | ) | | | (93,869 | ) |
| ZS Pharma, Inc. | | | | | (1,822 | ) | | | (81,862 | ) |
| Zynga, Inc., Class A | | | | | (393,853 | ) | | | (1,008,264 | ) |
| | | | | | | | | | (443,594,341 | ) |
Total Reference Entity — Short | | | | | | | | | (462,788,849 | ) |
Net Value of Reference Entity — Bank of America N.A. | $ | (46,283,748 | ) |
The following table represents the individual long and short positions and related values of the equity securities underlying the total return swap with Deutsche Bank AG as of January 31, 2015, expiration dates—2/16/15 — 2/02/16:
Reference Entity — Long |
Australia | | | | | | | | | | |
| Aristocrat Leisure Ltd. | | | | | 23,653 | | | $ | 128,137 | |
| Arrium Ltd. | | | | | 868,194 | | | | 137,013 | |
| AusNet Services | | | | | 670,761 | | | | 728,072 | |
| Boral Ltd. | | | | | 14,738 | | | | 63,788 | |
| Caltex Australia Ltd. | | | | | 15,789 | | | | 408,623 | |
| CSR Ltd. | | | | | 27,596 | | | | 85,243 | |
| Dexus Property Group | | | | | 211,466 | | | | 1,262,890 | |
| Fairfax Media, Ltd. | | | | | 2,171,908 | | | | 1,510,836 | |
| iiNET, Ltd. | | | | | 83,704 | | | | 485,797 | |
| JB Hi-Fi Ltd. | | | | | 181,724 | | | | 2,355,615 | |
| Newcrest Mining Ltd. | | | | | 142,408 | | | | 1,537,645 | |
| Qantas Airways Ltd. | | | | | 551,660 | | | | 1,111,634 | |
| Rio Tinto Ltd. | | | | | 140,475 | | | | 6,264,073 | |
| Seven West Media Ltd. | | | | | 40,045 | | | | 40,590 | |
| Transpacific Industries Group, Ltd. | | | | | 2,559,436 | | | | 1,643,829 | |
| Woodside Petroleum Ltd. | | | | | 16,473 | | | | 437,506 | |
| | | | | | | | | | 18,201,291 | |
Austria | | | | | | | | | | |
| Andritz AG | | | | | 16,271 | | | | 880,772 | |
| Voestalpine AG | | | | | 157,989 | | | | 5,626,387 | |
| | | | | | | | | | 6,507,159 | |
Canada | | | | | | | | | | |
| Agnico Eagle Mines Ltd. | | | | | 38,500 | | | | 1,297,978 | |
| Aimia, Inc. | | | | | 245,220 | | | | 2,630,321 | |
| Air Canada | | | | | 56,143 | | | | 519,147 | |
| Boardwalk Real Estate Investment Trust | | | | | 27,029 | | | | 1,304,548 | |
| Canadian Real Estate Investment Trust | | | | | 66,616 | | | | 2,527,917 | |
| Canfor Corp. | | | | | 1,146 | | | | 28,634 | |
| Capital Power Corp. | | | | | 9,330 | | | | 185,690 | |
| Centerra Gold, Inc. | | | | | 9,688 | | | | 58,096 | |
| Chartwell Retirement Residences | | | | | 8,533 | | | | 84,880 | |
| Cogeco Cable, Inc. | | | | | 5,943 | | | | 341,417 | |
| Detour Gold Corp. | | | | | 28,960 | | | | 296,278 | |
| Dominion Diamond Corp. | | | | | 116,917 | | | | 1,942,329 | |
| Domtar Corp. | | | | | 81,345 | | | | 3,116,294 | |
| Emera, Inc. | | | | | 138,890 | | | | 4,544,776 | |
| Encana Corp. | | | | | 35,299 | | | | 431,688 | |
| Finning International, Inc. | | | | | 18,375 | | | | 302,948 | |
| Franco-Nevada Corp. | | | | | 19,834 | | | | 1,144,587 | |
| Goldcorp, Inc. | | | | | 152,666 | | | | 3,687,196 | |
| Industrial Alliance Insurance & Financial Services, Inc. | | | | | 3,188 | | | | 101,508 | |
| | | | | Shares | | Value |
Reference Entity — Long |
Canada (concluded) | | | | | | | | | | |
| Kinross Gold Corp. | | | | | 23,005 | | | $ | 78,029 | |
| Linamar Corp. | | | | | 109,563 | | | | 6,276,140 | |
| Magna International, Inc. | | | | | 9,547 | | | | 917,284 | |
| Methanex Corp. | | | | | 107,481 | | | | 4,750,242 | |
| New Gold, Inc. | | | | | 32,277 | | | | 141,483 | |
| Onex Corp. | | | | | 35,350 | | | | 1,940,397 | |
| Open Text Corp. | | | | | 57,575 | | | | 3,265,015 | |
| Pan American Silver Corp. | | | | | 83,961 | | | | 983,190 | |
| Quebecor, Inc., Class B | | | | | 42,073 | | | | 1,054,557 | |
| Raging River Exploration, Inc. | | | | | 143,757 | | | | 834,915 | |
| Royal Bank of Canada | | | | | 77,953 | | | | 4,400,998 | |
| Silver Wheaton Corp. | | | | | 5,979 | | | | 137,347 | |
| Superior Plus Corp. | | | | | 12,715 | | | | 122,077 | |
| TELUS Corp. | | | | | 149,739 | | | | 5,136,636 | |
| Whitecap Resources, Inc. | | | | | 8,269 | | | | 80,757 | |
| | | | | | | | | | 54,665,299 | |
Denmark | | | | | | | | | | |
| Novo Nordisk A/S, Class B | | | | | 294,103 | | | | 13,108,368 | |
| Novozymes A/S, Class B | | | | | 660 | | | | 30,099 | |
| Vestas Wind Systems A/S | | | | | 61,849 | | | | 2,403,057 | |
| | | | | | | | | | 15,541,524 | |
France | | | | | | | | | | |
| Faurecia | | | | | 11,708 | | | | 470,268 | |
| Natixis | | | | | 45,664 | | | | 290,422 | |
| Technicolor SA, Registered Shares | | | | | 305,119 | | | | 1,822,693 | |
| Technip SA | | | | | 10,550 | | | | 616,085 | |
| | | | | | | | | | 3,199,468 | |
Germany | | | | | | | | | | |
| Bayerische Motoren Werke AG, Preference Shares | | | | | 528 | | | | 44,700 | |
| Commerzbank AG | | | | | 382,185 | | | | 4,582,130 | |
| Continental AG | | | | | 828 | | | | 186,835 | |
| Duerr AG | | | | | 16,996 | | | | 1,546,827 | |
| Fresenius SE & Co. KGaA | | | | | 111,272 | | | | 6,368,845 | |
| K+S AG, Registered Shares | | | | | 312,391 | | | | 9,863,183 | |
| Kloeckner & Co. SE | | | | | 20,016 | | | | 206,233 | |
| Krones AG | | | | | 884 | | | | 83,691 | |
| Nordex SE | | | | | 5,328 | | | | 102,832 | |
| ProSiebenSat.1 Media AG, Registered Shares | | | | | 264,036 | | | | 11,688,267 | |
| Salzgitter AG | | | | | 79,083 | | | | 2,155,867 | |
| Solarworld AG | | | | | 10 | | | | 129 | |
| Telefonica Deutschland Holding AG | | | | | 9,572 | | | | 53,325 | |
| ThyssenKrupp AG | | | | | 72,701 | | | | 1,888,675 | |
| United Internet AG, Registered Shares | | | | | 2,498 | | | | 108,214 | |
| Volkswagen AG, Preference Shares | | | | | 2,058 | | | | 459,115 | |
| | | | | | | | | | 39,338,868 | |
Hong Kong | | | | | | | | | | |
| Cheung Kong Holdings Ltd. | | | | | 149,000 | | | | 2,843,334 | |
| CLP Holdings Ltd. | | | | | 272,000 | | | | 2,428,299 | |
| Galaxy Entertainment Group Ltd. | | | | | 175,000 | | | | 914,056 | |
| Hang Lung Properties Ltd. | | | | | 499,000 | | | | 1,467,218 | |
| HKT Trust and HKT Ltd. | | | | | 219,000 | | | | 287,017 | |
| Hutchison Whampoa Ltd. | | | | | 530,000 | | | | 7,034,944 | |
| Kerry Properties Ltd. | | | | | 352,500 | | | | 1,245,584 | |
| Li & Fung Ltd. | | | | | 324,000 | | | | 321,396 | |
| MGM China Holdings Ltd. | | | | | 135,600 | | | | 328,456 | |
| MTR Corp. | | | | | 32,500 | | | | 143,976 | |
| New World Development Co. Ltd. | | | | | 871,000 | | | | 1,038,448 | |
| Power Assets Holdings Ltd. | | | | | 11,500 | | | | 120,281 | |
| Sino Land Co., Ltd. | | | | | 162,000 | | | | 270,913 | |
| Swire Properties Ltd. | | | | | 103,200 | | | | 331,317 | |
| Wheelock & Co. Ltd. | | | | | 200,000 | | | | 1,131,559 | |
| | | | | | | | | | 19,906,798 | |
See Notes to Financial Statements.
| BLACKROCK FUNDS | JANUARY 31, 2015 | 33
|
| |
| Schedule of Investments (continued) | BlackRock Global Long/Short Equity Fund |
| | | | | Shares | | Value |
Reference Entity — Long |
Iran | | | | | | | | | | |
| Smurfit Kappa Group PLC | | | | | 229,017 | | | $ | 5,630,451 | |
Ireland | | | | | | | | | | |
| Bank of Ireland | | | | | 1,099,644 | | | | 330,959 | |
| Glanbia PLC | | | | | 4,712 | | | | 76,141 | |
| Kerry Group PLC, Class A | | | | | 2,790 | | | | 202,203 | |
| | | | | | | | | | 609,303 | |
Isle of Man | | | | | | | | | | |
| Playtech PLC | | | | | 42,959 | | | | 437,244 | |
Italy | | | | | | | | | | |
| A2A SpA | | | | | 44,931 | | | | 42,824 | |
| Ansaldo STS SpA | | | | | 37,793 | | | | 379,780 | |
| Autogrill SpA | | | | | 39,755 | | | | 339,618 | |
| Moncler SpA | | | | | 86,853 | | | | 1,290,146 | |
| Telecom Italia SpA, Non-Convertible Savings Shares | | | | | 186,142 | | | | 175,786 | |
| UnipolSai SpA | | | | | 21,984 | | | | 60,939 | |
| | | | | | | | | | 2,289,093 | |
Japan | | | | | | | | | | |
| Advance Residence Investment Corp. | | | | | 16 | | | | 40,973 | |
| Asahi Group Holdings Ltd. | | | | | 183,200 | | | | 6,010,205 | |
| Casio Computer Co. Ltd. | | | | | 37,100 | | | | 580,794 | |
| Chubu Electric Power Co., Inc. | | | | | 4,000 | | | | 52,816 | |
| Citizen Holdings Co. Ltd. | | | | | 13,900 | | | | 110,951 | |
| COMSYS Holdings Corp. | | | | | 254,700 | | | | 3,465,006 | |
| CyberAgent, Inc. | | | | | 30,600 | | | | 1,347,373 | |
| Daifuku Co. Ltd. | | | | | 11,700 | | | | 134,035 | |
| Disco Corp. | | | | | 92,900 | | | | 8,510,891 | |
| FANUC Corp. | | | | | 900 | | | | 152,440 | |
| Frontier Real Estate Investment Corp. | | | | | 176 | | | | 802,315 | |
| Fujitsu General Ltd. | | | | | 45,000 | | | | 441,395 | |
| Haseko Corp. | | | | | 882,200 | | | | 7,167,918 | |
| Hitachi Metals Ltd. | | | | | 8,000 | | | | 130,362 | |
| Japan Airport Terminal Co., Ltd. | | | | | 1,100 | | | | 49,566 | |
| Japan Real Estate Investment Corp. | | | | | 288 | | | | 1,399,217 | |
| Kaken Pharmaceutical Co. Ltd. | | | | | 3,000 | | | | 63,836 | |
| Keihin Corp. | | | | | 53,900 | | | | 859,133 | |
| Kissei Pharmaceutical Co. Ltd. | | | | | 5,400 | | | | 161,995 | |
| Kyushu Electric Power Co., Inc. | | | | | 22,000 | | | | 212,303 | |
| Makita Corp. | | | | | 5,000 | | | | 221,783 | |
| Mazda Motor Corp. | | | | | 64,600 | | | | 1,326,913 | |
| Mitsubishi Chemical Holdings Corp. | | | | | 195,600 | | | | 1,013,762 | |
| Mitsubishi Corp. | | | | | 75,600 | | | | 1,318,857 | |
| Mitsubishi Gas Chemical Co., Inc. | | | | | 175,000 | | | | 791,236 | |
| Mitsubishi Materials Corp. | | | | | 526,000 | | | | 1,658,668 | |
| Mitsubishi Motors Corp. | | | | | 378,100 | | | | 3,196,535 | |
| Mitsui & Co. Ltd. | | | | | 21,400 | | | | 272,310 | |
| Mitsui Mining & Smelting Co. Ltd. | | | | | 137,000 | | | | 286,080 | |
| Murata Manufacturing Co. Ltd. | | | | | 49,600 | | | | 5,354,532 | |
| Nagoya Railroad Co. Ltd. | | | | | 26,000 | | | | 102,141 | |
| NH Foods Ltd. | | | | | 13,000 | | | | 321,387 | |
| Nifco, Inc. | | | | | 72,100 | | | | 2,483,629 | |
| Nihon M&A Center, Inc. | | | | | 30,700 | | | | 1,065,482 | |
| Nippo Corp. | | | | | 7,000 | | | | 108,846 | |
| Nippon Paper Industries Co., Ltd. | | | | | 28,800 | | | | 454,149 | |
| Nippon Steel & Sumitomo Metal | | | | | 1,166,000 | | | | 2,725,284 | |
| Nishimatsu Construction Co., Ltd. | | | | | 26,000 | | | | 104,447 | |
| Nisshin Steel Holdings Co. Ltd. | | | | | 15,000 | | | | 155,270 | |
| OSG Corp. | | | | | 2,400 | | | | 44,575 | |
| Resona Holdings, Inc. | | | | | 456,800 | | | | 2,266,281 | |
| Senshu Ikeda Holdings, Inc. | | | | | 146,400 | | | | 650,081 | |
| Start Today Co., Ltd. | | | | | 30,900 | | | | 624,589 | |
| Sumitomo Metal Mining Co. Ltd. | | | | | 374,000 | | | | 5,345,236 | |
| Sumitomo Mitsui Trust Holdings, Inc. | | | | | 1,437,000 | | | | 5,053,247 | |
| | | | | Shares | | Value |
Reference Entity — Long |
Japan (concluded) | | | | | | | | | | |
| Sumitomo Real Estate Sales Co. Ltd. | | | | | 20,300 | | | $ | 480,157 | |
| Tadano Ltd. | | | | | 38,000 | | | | 457,361 | |
| Taiheiyo Cement Corp. | | | | | 115,000 | | | | 337,451 | |
| Takashimaya Co. Ltd. | | | | | 40,000 | | | | 350,843 | |
| Takata Corp. | | | | | 48,800 | | | | 569,166 | |
| Temp Holdings Co., Ltd. | | | | | 12,000 | | | | 405,653 | |
| Tokyo Steel Manufacturing Co., Ltd. | | | | | 47,700 | | | | 358,440 | |
| Yamato Kogyo Co. Ltd. | | | | | 1,600 | | | | 41,177 | |
| | | | | | | | | | 71,639,092 | |
Netherlands | | | | | | | | | | |
| Arcadis NV | | | | | 40,136 | | | | 1,214,728 | |
Norway | | | | | | | | | | |
| Akastor ASA | | | | | 206,351 | | | | 507,334 | |
| Aker Solutions ASA | | | | | 242,505 | | | | 1,183,869 | |
| Norsk Hydro ASA | | | | | 854,483 | | | | 5,021,574 | |
| Statoil ASA | | | | | 51,437 | | | | 861,378 | |
| Storebrand ASA | | | | | 384,837 | | | | 1,163,355 | |
| Subsea 7 SA | | | | | 289,314 | | | | 2,461,057 | |
| TGS Nopec Geophysical Co. ASA | | | | | 202,148 | | | | 4,688,930 | |
| | | | | | | | | | 15,887,497 | |
Portugal | | | | | | | | | | |
| CTT — Correios de Portugal SA | | | | | 8,323 | | | | 87,572 | |
Singapore | | | | | | | | | | |
| CapitaCommercial Trust | | | | | 209,100 | | | | 273,586 | |
| ComfortDelGro Corp. Ltd. | | | | | 319,600 | | | | 677,713 | |
| Noble Group Ltd. | | | | | 5,043,000 | | | | 3,944,862 | |
| Yangzijiang Shipbuilding Holdings Ltd. | | | | | 4,427,000 | | | | 4,047,066 | |
| | | | | | | | | | 8,943,227 | |
Spain | | | | | | | | | | |
| Abengoa SA, -B Shares | | | | | 38,574 | | | | 113,970 | |
| Amadeus IT Holding SA, Class A | | | | | 176,561 | | | | 7,080,845 | |
| Banco Popular Espanol SA | | | | | 1,567,502 | | | | 6,625,848 | |
| CaixaBank SA | | | | | 417,994 | | | | 1,820,674 | |
| Distribuidora Internacional de Alimentacion SA | | | | | 349,085 | | | | 2,260,021 | |
| Ebro Foods SA | | | | | 22,961 | | | | 390,695 | |
| Endesa SA | | | | | 174,377 | | | | 3,480,186 | |
| Ferrovial SA | | | | | 19,028 | | | | 377,494 | |
| Gamesa Corp. Tecnologica SA | | | | | 65,476 | | | | 647,344 | |
| Iberdrola SA | | | | | 899,565 | | | | 6,209,178 | |
| International Consolidated Airlines Group SA | | | | | 5,705 | | | | 46,738 | |
| Mediaset Espana Comunicacion SA | | | | | 131,389 | | | | 1,599,549 | |
| Sacyr SA | | | | | 236,021 | | | | 872,867 | |
| Telefonica SA | | | | | 617,696 | | | | 9,262,601 | |
| Tubacex SA | | | | | 8,153 | | | | 23,850 | |
| | | | | | | | | | 40,811,860 | |
Sweden | | | | | | | | | | |
| Hennes & Mauritz AB, Class B | | | | | 4,555 | | | | 187,723 | |
Switzerland | | | | | | | | | | |
| Flughafen Zuerich AG, Registered Shares | | | | | 525 | | | | 357,426 | |
United Kingdom | | | | | | | | | | |
| Anglo American PLC | | | | | 17,867 | | | | 298,444 | |
| Howden Joinery Group PLC | | | | | 674,903 | | | | 4,306,928 | |
| Inchcape PLC | | | | | 67,845 | | | | 708,702 | |
| International Consolidated Airlines Group SA | | | | | 67,187 | | | | 547,318 | |
| Pace PLC | | | | | 93,435 | | | | 468,913 | |
| Premier Oil PLC | | | | | 805,985 | | | | 1,747,447 | |
| Rio Tinto PLC | | | | | 40,368 | | | | 1,773,890 | |
| Vedanta Resources PLC | | | | | 99,455 | | | | 555,755 | |
| | | | | | | | | | 10,407,397 | |
Total Reference Entity — Long | | | | | | | | | 315,863,020 | |
See Notes to Financial Statements.
| 34 | BLACKROCK FUNDS | JANUARY 31, 2015
|
| |
| Schedule of Investments (continued) | BlackRock Global Long/Short Equity Fund |
| | | | | Shares | | Value |
Reference Entity — Short |
Australia | | | | | | | | | | |
| AGL Energy, Ltd. | | | | | (5,107 | ) | | $ | (56,456 | ) |
| TPG Telecom, Ltd. | | | | | (132,191 | ) | | | (683,701 | ) |
| | | | | | | | | | (740,157 | ) |
Austria | | | | | | | | | | |
| Verbund AG | | | | | (54,968 | ) | | | (962,085 | ) |
Belgium | | | | | | | | | | |
| Anheuser-Busch InBev NV | | | | | (27,245 | ) | | | (3,322,966 | ) |
Canada | | | | | | | | | | |
| Agrium, Inc. | | | | | (12,873 | ) | | | (1,373,410 | ) |
| Alimentation Couche-Tard, Inc. | | | | | (2,862 | ) | | | (112,142 | ) |
| AltaGas, Ltd. | | | | | (7,604 | ) | | | (256,957 | ) |
| Bank of Montreal | | | | | (4,893 | ) | | | (280,827 | ) |
| Canadian Utilities, Ltd. | | | | | (1,696 | ) | | | (56,231 | ) |
| Cineplex, Inc. | | | | | (43,411 | ) | | | (1,543,829 | ) |
| George Weston, Ltd. | | | | | (53 | ) | | | (4,201 | ) |
| Gildan Activewear, Inc. | | | | | (824 | ) | | | (48,103 | ) |
| Hudson’s Bay Co. | | | | | (94,365 | ) | | | (1,739,221 | ) |
| Husky Energy, Inc. | | | | | (2,455 | ) | | | (52,840 | ) |
| Inter Pipeline, Ltd. | | | | | (2,282 | ) | | | (59,335 | ) |
| Loblaw Cos., Ltd. | | | | | (156,332 | ) | | | (7,766,774 | ) |
| Manitoba Telecom Services, Inc. | | | | | (6,858 | ) | | | (138,434 | ) |
| Mullen Group, Ltd. | | | | | (429 | ) | | | (6,884 | ) |
| Norbord, Inc. | | | | | (18,352 | ) | | | (408,432 | ) |
| Northland Power, Inc. | | | | | (15,091 | ) | | | (203,082 | ) |
| Paramount Resources, Ltd. | | | | | (109 | ) | | | (2,446 | ) |
| Pembina Pipeline Corp. | | | | | (3,137 | ) | | | (97,465 | ) |
| Saputo, Inc. | | | | | (68 | ) | | | (1,955 | ) |
| Sierra Wireless, Inc. | | | | | (46,826 | ) | | | (1,693,651 | ) |
| | | | | | | | | | (15,846,219 | ) |
Denmark | | | | | | | | | | |
| FLSmidth & Co. A/S | | | | | (5,231 | ) | | | (221,796 | ) |
| William Demant Holding A/S | | | | | (10,148 | ) | | | (770,403 | ) |
| | | | | | | | | | (992,199 | ) |
Finland | | | | | | | | | | |
| Cargotec OYJ | | | | | (4,482 | ) | | | (143,735 | ) |
France | | | | | | | | | | |
| Accor SA | | | | | (2,869 | ) | | | (143,700 | ) |
| Air Liquide SA | | | | | (22,275 | ) | | | (2,808,174 | ) |
| Bollore SA | | | | | (300 | ) | | | (1,291 | ) |
| Cie de Saint-Gobain | | | | | (60,719 | ) | | | (2,586,671 | ) |
| Kering | | | | | (13,722 | ) | | | (2,768,596 | ) |
| L’Oreal SA | | | | | (11,271 | ) | | | (2,015,303 | ) |
| Legrand SA | | | | | (5,079 | ) | | | (273,763 | ) |
| LVMH Moet Hennessy Louis Vuitton SA | | | | | (2,823 | ) | | | (454,007 | ) |
| Neopost SA | | | | | (4,953 | ) | | | (257,457 | ) |
| Rubis SCA | | | | | (11,791 | ) | | | (683,817 | ) |
| Sodexo | | | | | (1,630 | ) | | | (161,719 | ) |
| Vinci SA | | | | | (1,957 | ) | | | (103,582 | ) |
| | | | | | | | | | (12,258,080 | ) |
Germany | | | | | | | | | | |
| Drillisch AG | | | | | (95,295 | ) | | | (3,691,904 | ) |
| Leoni AG | | | | | (13,747 | ) | | | (857,619 | ) |
| Rheinmetall AG | | | | | (17,270 | ) | | | (747,333 | ) |
| | | | | | | | | | (5,296,856 | ) |
Hong Kong | | | | | | | | | | |
| Chow Tai Fook Jewellery Group, Ltd. | | | | | (2,606,400 | ) | | | (3,455,508 | ) |
| Esprit Holdings Ltd. | | | | | (2,078,700 | ) | | | (2,339,442 | ) |
| Hong Kong & China Gas Co., Ltd. | | | | | (3,356,000 | ) | | | (7,685,113 | ) |
| Melco International Development, Ltd. | | | | | (266,000 | ) | | | (529,626 | ) |
| Sun Hung Kai Properties, Ltd. | | | | | (12,000 | ) | | | (195,268 | ) |
| Swire Pacific, Ltd. | | | | | (190,500 | ) | | | (2,551,095 | ) |
| | | | | | | | | | (16,756,052 | ) |
| | | | | Shares | | Value |
Reference Entity — Short |
Japan | | | | | | | | | | |
| Aeon Co. Ltd. | | | | | (94,100 | ) | | $ | (993,897 | ) |
| AEON Financial Service Co., Ltd. | | | | | (146,200 | ) | | | (2,627,251 | ) |
| Asahi Glass Co., Ltd. | | | | | (1,185,000 | ) | | | (6,304,180 | ) |
| Asics Corp. | | | | | (9,900 | ) | | | (242,940 | ) |
| Chiyoda Corp. | | | | | (12,000 | ) | | | (92,423 | ) |
| Coca-Cola East Japan Co. Ltd. | | | | | (122,900 | ) | | | (2,046,281 | ) |
| Coca-Cola West Co., Ltd. | | | | | (22,500 | ) | | | (321,824 | ) |
| Cosmos Pharmaceutical Corp. | | | | | (19,700 | ) | | | (3,174,330 | ) |
| Daihatsu Motor Co. Ltd. | | | | | (140,700 | ) | | | (1,961,988 | ) |
| Daikin Industries, Ltd. | | | | | (16,400 | ) | | | (1,141,210 | ) |
| Don Quijote Holdings Co., Ltd. | | | | | (16,900 | ) | | | (1,230,448 | ) |
| Eisai Co., Ltd. | | | | | (153,700 | ) | | | (7,663,224 | ) |
| HIS Co. Ltd. | | | | | (1,600 | ) | | | (54,863 | ) |
| Hitachi Zosen Corp. | | | | | (7,200 | ) | | | (39,450 | ) |
| Hokuriku Electric Power Co. | | | | | (37,700 | ) | | | (532,782 | ) |
| House Foods Group, Inc. | | | | | (11,000 | ) | | | (220,070 | ) |
| Ibiden Co., Ltd. | | | | | (14,700 | ) | | | (220,990 | ) |
| IHI Corp. | | | | | (1,904,000 | ) | | | (9,919,973 | ) |
| IT Holdings Corp. | | | | | (9,200 | ) | | | (152,816 | ) |
| Iwatani Corp. | | | | | (439,000 | ) | | | (2,834,134 | ) |
| Japan Exchange Group, Inc. | | | | | (30,600 | ) | | | (712,076 | ) |
| Japan Retail Fund Investment Corp. | | | | | (55 | ) | | | (119,135 | ) |
| The Japan Steel Works, Ltd. | | | | | (98,000 | ) | | | (392,019 | ) |
| K’s Holdings Corp. | | | | | (30,200 | ) | | | (886,970 | ) |
| Kagome Co., Ltd. | | | | | (156,000 | ) | | | (2,470,476 | ) |
| Kajima Corp. | | | | | (57,000 | ) | | | (225,522 | ) |
| Kakaku.com, Inc. | | | | | (4,700 | ) | | | (66,487 | ) |
| Kansai Paint Co., Ltd. | | | | | (35,000 | ) | | | (611,740 | ) |
| Kao Corp. | | | | | (4,100 | ) | | | (179,777 | ) |
| Keisei Electric Railway Co., Ltd. | | | | | (43,000 | ) | | | (553,927 | ) |
| Kirin Holdings Co., Ltd. | | | | | (143,100 | ) | | | (1,926,729 | ) |
| Komeri Co. Ltd. | | | | | (2,100 | ) | | | (45,041 | ) |
| Konami Corp. | | | | | (18,700 | ) | | | (348,914 | ) |
| Kubota Corp. | | | | | (5,000 | ) | | | (74,227 | ) |
| Kurita Water Industries Ltd. | | | | | (27,400 | ) | | | (583,715 | ) |
| Kyocera Corp. | | | | | (230,000 | ) | | | (10,123,371 | ) |
| Kyowa Hakko Kirin Co., Ltd. | | | | | (71,000 | ) | | | (808,513 | ) |
| Leopalace21 Corp. | | | | | (32,300 | ) | | | (208,991 | ) |
| McDonald’s Holdings Co. Japan Ltd. | | | | | (13,800 | ) | | | (302,691 | ) |
| Mitsui Engineering & Shipbuilding Co. Ltd. | | | | | (710,000 | ) | | | (1,154,316 | ) |
| Mitsui OSK Lines Ltd. | | | | | (18,000 | ) | | | (60,767 | ) |
| Nabtesco Corp. | | | | | (1,700 | ) | | | (43,888 | ) |
| NGK Insulators, Ltd. | | | | | (334,000 | ) | | | (6,730,514 | ) |
| NHK Spring Co., Ltd. | | | | | (87,400 | ) | | | (788,332 | ) |
| Nikon Corp. | | | | | (5,700 | ) | | | (73,003 | ) |
| Nippon Electric Glass Co. Ltd. | | | | | (808,000 | ) | | | (4,170,113 | ) |
| Nippon Paint Co., Ltd. | | | | | (159,600 | ) | | | (4,999,507 | ) |
| Nippon Shinyaku Co., Ltd. | | | | | (28,000 | ) | | | (924,959 | ) |
| Nisshin Seifun Group, Inc. | | | | | (4,900 | ) | | | (60,264 | ) |
| Ono Pharmaceutical Co., Ltd. | | | | | (95,700 | ) | | | (10,071,859 | ) |
| Onward Holdings Co. Ltd. | | | | | (292,000 | ) | | | (1,883,066 | ) |
| Osaka Gas Co., Ltd. | | | | | (25,000 | ) | | | (98,541 | ) |
| Pigeon Corp. | | | | | (25,900 | ) | | | (1,617,153 | ) |
| Pola Orbis Holdings, Inc. | | | | | (7,700 | ) | | | (327,900 | ) |
| Rakuten, Inc. | | | | | (10,300 | ) | | | (142,596 | ) |
| Rengo Co., Ltd. | | | | | (440,000 | ) | | | (1,848,687 | ) |
| Rinnai Corp. | | | | | (6,800 | ) | | | (455,168 | ) |
| Ryohin Keikaku Co., Ltd. | | | | | (12,700 | ) | | | (1,406,877 | ) |
| Santen Pharmaceutical Co., Ltd. | | | | | (19,800 | ) | | | (1,235,610 | ) |
| Sega Sammy Holdings, Inc. | | | | | (20,100 | ) | | | (261,746 | ) |
| Shimadzu Corp. | | | | | (84,000 | ) | | | (872,747 | ) |
| Shimamura Co. Ltd. | | | | | (5,200 | ) | | | (462,545 | ) |
| Sohgo Security Services Co., Ltd. | | | | | (40,700 | ) | | | (1,041,690 | ) |
| Sony Corp. | | | | | (123,800 | ) | | | (2,911,909 | ) |
| Sugi Holdings Co., Ltd. | | | | | (2,400 | ) | | | (112,686 | ) |
| Sumco Corp. | | | | | (144,800 | ) | | | (2,430,151 | ) |
See Notes to Financial Statements.
| BLACKROCK FUNDS | JANUARY 31, 2015 | 35
|
| |
| Schedule of Investments (continued) | BlackRock Global Long/Short Equity Fund |
| | | | | Shares | | Value |
Reference Entity — Short |
Japan (concluded) | | | | | | | | | | |
| Sumitomo Forestry Co., Ltd. | | | | | (108,900 | ) | | $ | (1,012,877 | ) |
| T&D Holdings, Inc. | | | | | (12,500 | ) | | | (140,770 | ) |
| Teijin Ltd. | | | | | (227,000 | ) | | | (676,198 | ) |
| Terumo Corp. | | | | | (27,500 | ) | | | (681,971 | ) |
| Tokyo Gas Co., Ltd. | | | | | (458,000 | ) | | | (2,732,023 | ) |
| Toray Industries, Inc. | | | | | (59,000 | ) | | | (502,567 | ) |
| Toyo Tire & Rubber Co., Ltd. | | | | | (303,800 | ) | | | (6,842,665 | ) |
| Toyota Tsusho Corp. | | | | | (128,700 | ) | | | (3,047,942 | ) |
| Tsumura & Co. | | | | | (10,100 | ) | | | (229,835 | ) |
| Ushio, Inc. | | | | | (17,000 | ) | | | (196,947 | ) |
| Yamazaki Baking Co., Ltd. | | | | | (18,000 | ) | | | (265,014 | ) |
| | | | | | | | | | (124,930,798 | ) |
Luxembourg | | | | | | | | | | |
| ArcelorMittal | | | | | (28,742 | ) | | | (274,865 | ) |
| Millicom International Cellular SA | | | | | (828 | ) | | | (52,802 | ) |
| | | | | | | | | | (327,667 | ) |
Macau | | | | | | | | | | |
| Wynn Macau, Ltd. | | | | | (338,800 | ) | | | (938,187 | ) |
Netherlands | | | | | | | | | | |
| Akzo Nobel NV | | | | | (11,487 | ) | | | (827,537 | ) |
| ING Groep NV | | | | | (18,481 | ) | | | (232,225 | ) |
| Randstad Holding NV | | | | | (5,798 | ) | | | (304,766 | ) |
| SBM Offshore NV | | | | | (19,677 | ) | | | (215,390 | ) |
| TomTom NV | | | | | (130,698 | ) | | | (858,821 | ) |
| | | | | | | | | | (2,438,739 | ) |
Norway | | | | | | | | | | |
| Opera Software ASA | | | | | (116,062 | ) | | | (1,537,514 | ) |
Portugal | | | | | | | | | | |
| Jeronimo Martins SGPS SA | | | | | (401,008 | ) | | | (4,313,387 | ) |
Singapore | | | | | | | | | | |
| Golden Agri-Resources Ltd. | | | | | (17,471,100 | ) | | | (5,419,593 | ) |
| Suntec Real Estate Investment Trust | | | | | (492,000 | ) | | | (682,566 | ) |
| | | | | | | | | | (6,102,159 | ) |
Sweden | | | | | | | | | | |
| Assa Abloy AB | | | | | (30,605 | ) | | | (1,671,459 | ) |
| Hexagon AB, -B Shares | | | | | (52,531 | ) | | | (1,663,289 | ) |
| ICA Gruppen AB | | | | | (63,229 | ) | | | (2,429,349 | ) |
| SKF AB, -B Shares | | | | | (76,876 | ) | | | (1,812,112 | ) |
| Volvo AB, -B Shares | | | | | (3,714 | ) | | | (43,495 | ) |
| | | | | | | | | | (7,619,704 | ) |
Switzerland | | | | | | | | | | |
| Dufry AG | | | | | (24,625 | ) | | | (3,617,468 | ) |
| STMicroelectronics NV | | | | | (282,839 | ) | | | (2,348,515 | ) |
| | | | | | | | | | (5,965,983 | ) |
United Kingdom | | | | | | | | | | |
| Ashmore Group PLC | | | | | (54,444 | ) | | | (229,119 | ) |
| Associated British Foods PLC | | | | | (131,265 | ) | | | (6,121,834 | ) |
| AVEVA Group PLC | | | | | (45,166 | ) | | | (893,222 | ) |
| CNH Industrial NV | | | | | (15,632 | ) | | | (119,003 | ) |
| Drax Group PLC | | | | | (10,076 | ) | | | (54,672 | ) |
| easyJet PLC | | | | | (178,880 | ) | | | (4,987,690 | ) |
| Greene King PLC | | | | | (58,324 | ) | | | (736,906 | ) |
| Hargreaves Lansdown PLC | | | | | (521,433 | ) | | | (7,904,204 | ) |
| ICAP PLC | | | | | (56,992 | ) | | | (400,200 | ) |
| Michael Page International PLC | | | | | (441,966 | ) | | | (3,092,658 | ) |
| Mitie Group PLC | | | | | (233,615 | ) | | | (948,970 | ) |
| Ocado Group PLC | | | | | (291,238 | ) | | | (1,794,923 | ) |
| Pennon Group PLC | | | | | (36,120 | ) | | | (482,822 | ) |
| Serco Group PLC | | | | | (139,879 | ) | | | (325,299 | ) |
| Smiths Group PLC | | | | | (83,255 | ) | | | (1,409,010 | ) |
| | | | | Shares | | Value |
Reference Entity — Short |
United Kingdom (concluded) | | | | | |
| Spectris PLC | | | | | (53,506 | ) | | $ | (1,681,381 | ) |
| Sports Direct International PLC | | | | | (496,959 | ) | | | (5,300,024 | ) |
| Standard Life PLC | | | | | (685,828 | ) | | | (4,143,665 | ) |
| Taylor Wimpey PLC | | | | | (22,630 | ) | | | (45,974 | ) |
| Telecity Group PLC | | | | | (180,040 | ) | | | (2,332,468 | ) |
| Tesco PLC | | | | | (1,471,588 | ) | | | (4,976,414 | ) |
| Unilever NV | | | | | (9,803 | ) | | | (425,103 | ) |
| Vodafone Group PLC | | | | | (1,938,099 | ) | | | (6,815,282 | ) |
| Whitbread PLC | | | | | (39,096 | ) | | | (2,934,578 | ) |
| | | | | | | | | | (58,155,421 | ) |
Total Reference Entity — Short | | | | | | | | | (268,647,908 | ) |
Net Value of Reference Entity — Deutsche Bank AG | $ | 47,215,112 | |
The following table represents the individual long and short positions and related values of the equity securities underlying the total return swap with Goldman Sachs & Co. as of January 31, 2015, expiration dates 3/26/15 — 8/04/16:
| | | | |
Reference Entity — Long |
Bermuda | | | | | | | | | | |
| Assured Guaranty Ltd. | | | | | 101,834 | | | $ | 2,486,786 | |
Netherlands | | | | | | | | | | |
| AVG Technologies NV | | | | | 19,892 | | | | 393,464 | |
| Core Laboratories NV | | | | | 5,976 | | | | 554,274 | |
| NXP Semiconductor NV | | | | | 194,601 | | | | 15,439,643 | |
| | | | | | | | | | 16,387,381 | |
Singapore | | | | | | | | | | |
| Flextronics International Ltd. | | | | | 309,802 | | | | 3,444,998 | |
United Kingdom | | | | | | | | | | |
| Markit Ltd. | | | | | 186,165 | | | | 4,886,831 | |
| Noble Corp. PLC | | | | | 28,033 | | | | 454,696 | |
| | | | | | | | | | 5,341,527 | |
United States | | | | | | | | | | |
| AbbVie, Inc. | | | | | 34,718 | | | | 2,095,231 | |
| Activision Blizzard, Inc. | | | | | 3,214 | | | | 67,157 | |
| Acxiom Corp. | | | | | 49,513 | | | | 901,137 | |
| Advent Software, Inc. | | | | | 10,527 | | | | 440,555 | |
| Air Lease Corp. | | | | | 154,042 | | | | 5,382,227 | |
| Alaska Air Group, Inc. | | | | | 5,139 | | | | 348,784 | |
| Alcoa, Inc. | | | | | 693,513 | | | | 10,853,478 | |
| Ally Financial, Inc. | | | | | 203,797 | | | | 3,813,042 | |
| Amdocs Ltd. | | | | | 48,364 | | | | 2,330,178 | |
| American Financial Group, Inc. | | | | | 6,944 | | | | 403,030 | |
| American Water Works Co., Inc. | | | | | 47,950 | | | | 2,691,913 | |
| AmTrust Financial Services, Inc. | | | | | 14,655 | | | | 741,836 | |
| Apartment Investment & Management Co., Class A | | | | | 54,740 | | | | 2,181,936 | |
| ArcBest Corp. | | | | | 88,321 | | | | 3,290,840 | |
| Aruba Networks, Inc. | | | | | 60,985 | | | | 1,011,131 | |
| Aspen Technology, Inc. | | | | | 109,375 | | | | 3,865,859 | |
| Assurant, Inc. | | | | | 4,720 | | | | 299,767 | |
| Axalta Coating Systems, Ltd. | | | | | 7,678 | | | | 197,094 | |
| The Babcock & Wilcox Co. | | | | | 216,195 | | | | 5,886,990 | |
| Berry Plastics Group, Inc. | | | | | 184,082 | | | | 6,225,653 | |
| Best Buy Co., Inc. | | | | | 69,445 | | | | 2,444,464 | |
| Blackstone Mortgage Trust, Inc., Class A | | | | | 66,227 | | | | 1,933,828 | |
| The Boeing Co. | | | | | 140,329 | | | | 20,399,627 | |
| Boise Cascade Co. | | | | | 79,149 | | | | 3,200,786 | |
| Booz Allen Hamilton Holding Corp. | | | | | 95,732 | | | | 2,786,759 | |
| Brinker International, Inc. | | | | | 106,096 | | | | 6,199,189 | |
| Broadridge Financial Solutions, Inc. | | | | | 1,243 | | | | 59,652 | |
See Notes to Financial Statements.
| 36 | BLACKROCK FUNDS | JANUARY 31, 2015
|
| |
| Schedule of Investments (continued) | BlackRock Global Long/Short Equity Fund |
| | | | | Shares | | Value |
Reference Entity — Long |
United States (continued) | | | | | | | | | | |
| Cabot Corp. | | | | | 9,383 | | | $ | 397,933 | |
| Cabot Microelectronics Corp. | | | | | 24,995 | | | | 1,235,003 | |
| Cal-Maine Foods, Inc. | | | | | 8,301 | | | | 290,950 | |
| Calpine Corp. | | | | | 492,230 | | | | 10,277,762 | |
| Cameron International Corp. | | | | | 30,896 | | | | 1,383,523 | |
| Capstead Mortgage Corp. | | | | | 25,888 | | | | 311,174 | |
| Cardinal Health, Inc. | | | | | 68,906 | | | | 5,732,290 | |
| Catalent, Inc. | | | | | 97,460 | | | | 2,691,845 | |
| Caterpillar, Inc. | | | | | 27,058 | | | | 2,163,828 | |
| CBL & Associates Properties, Inc. | | | | | 45,022 | | | | 928,354 | |
| CBS Corp., Class B | | | | | 81,695 | | | | 4,477,703 | |
| Celanese Corp., Series A | | | | | 15,836 | | | | 851,343 | |
| CenterPoint Energy, Inc. | | | | | 396,016 | | | | 9,144,009 | |
| Chatham Lodging Trust | | | | | 9,876 | | | | 307,440 | |
| Cirrus Logic, Inc. | | | | | 108,203 | | | | 2,867,379 | |
| CIT Group, Inc. | | | | | 21,224 | | | | 930,036 | |
| Citrix Systems, Inc. | | | | | 4,217 | | | | 249,899 | |
| Clearwater Paper Corp. | | | | | 9,105 | | | | 673,952 | |
| Coca-Cola Enterprises, Inc. | | | | | 521,434 | | | | 21,952,371 | |
| CommScope Holding Co., Inc. | | | | | 106,824 | | | | 3,002,289 | |
| Compass Minerals International, Inc. | | | | | 74,207 | | | | 6,485,692 | |
| Computer Sciences Corp. | | | | | 28,725 | | | | 1,743,033 | |
| Core-Mark Holding Co., Inc. | | | | | 4,285 | | | | 285,724 | |
| Crane Co. | | | | | 90,186 | | | | 5,496,837 | |
| Crimson Wine Group Ltd. | | | | | 1 | | | | 9 | |
| Cytec Industries, Inc. | | | | | 27,667 | | | | 1,327,739 | |
| DDR Corp. | | | | | 150,296 | | | | 2,945,802 | |
| Delek U.S. Holdings, Inc. | | | | | 91,515 | | | | 2,823,238 | |
| Diodes, Inc. | | | | | 48,138 | | | | 1,272,287 | |
| DIRECTV | | | | | 40,381 | | | | 3,443,692 | |
| Domino’s Pizza, Inc. | | | | | 1,495 | | | | 148,080 | |
| Dover Corp. | | | | | 32,382 | | | | 2,268,035 | |
| The Dow Chemical Co. | | | | | 10,237 | | | | 462,303 | |
| DST Systems, Inc. | | | | | 3,882 | | | | 375,389 | |
| DuPont Fabros Technology, Inc. | | | | | 58,496 | | | | 2,179,561 | |
| Dynegy, Inc. | | | | | 524,294 | | | | 14,323,712 | |
| Eagle Materials, Inc. | | | | | 4,067 | | | | 289,652 | |
| Eastman Chemical Co. | | | | | 13,312 | | | | 943,688 | |
| EnLink Midstream LLC | | | | | 55,631 | | | | 1,760,165 | |
| FMSA Holdings, Inc. | | | | | 70,430 | | | | 365,532 | |
| Foot Locker, Inc. | | | | | 5,573 | | | | 296,595 | |
| GATX Corp. | | | | | 3,221 | | | | 184,080 | |
| General Dynamics Corp. | | | | | 832 | | | | 110,831 | |
| Genworth Financial, Inc., Class A | | | | | 9,237 | | | | 64,474 | |
| Geo Group, Inc. | | | | | 28,763 | | | | 1,251,766 | |
| Glacier Bancorp, Inc. | | | | | 26,784 | | | | 596,480 | |
| Great Plains Energy, Inc. | | | | | 61,471 | | | | 1,817,697 | |
| Green Plains Renewable Energy, Inc. | | | | | 15,890 | | | | 371,985 | |
| Greenhill & Co., Inc. | | | | | 53,356 | | | | 1,967,769 | |
| Halyard Health, Inc. | | | | | 30,821 | | | | 1,373,692 | |
| The Hanover Insurance Group, Inc. | | | | | 52,552 | | | | 3,626,088 | |
| Hasbro, Inc. | | | | | 993 | | | | 54,536 | |
| HCA Holdings, Inc. | | | | | 135,466 | | | | 9,590,993 | |
| HD Supply Holdings, Inc. | | | | | 16,067 | | | | 463,212 | |
| Health Net, Inc. | | | | | 52,528 | | | | 2,845,442 | |
| Host Hotels & Resorts, Inc. | | | | | 689,331 | | | | 15,778,787 | |
| Hubbell, Inc., Class B | | | | | 13,112 | | | | 1,390,396 | |
| Huntsman Corp. | | | | | 19,717 | | | | 432,985 | |
| Iconix Brand Group, Inc. | | | | | 50,530 | | | | 1,679,617 | |
| Ingram Micro, Inc., Class A | | | | | 121,758 | | | | 3,065,866 | |
| The Interpublic Group of Cos., Inc. | | | | | 263,507 | | | | 5,254,330 | |
| Invesco Ltd. | | | | | 1,607 | | | | 59,025 | |
| ITC Holdings Corp. | | | | | 233,918 | | | | 9,950,872 | |
| ITT Corp. | | | | | 1,278 | | | | 45,765 | |
| Jack in the Box, Inc. | | | | | 27,951 | | | | 2,369,965 | |
| Jones Lang LaSalle, Inc. | | | | | 74,953 | | | | 11,024,087 | |
| | | | | Shares | | Value |
Reference Entity — Long |
United States (continued) | | | | | | | | | | |
| Keysight Technologies, Inc. | | | | | 120,282 | | | $ | 4,016,216 | |
| KLX, Inc. | | | | | 2,281 | | | | 89,666 | |
| Korn/Ferry International | | | | | 7,948 | | | | 226,518 | |
| Lancaster Colony Corp. | | | | | 20,652 | | | | 1,857,234 | |
| Landstar System, Inc. | | | | | 1,967 | | | | 126,045 | |
| Lannett Co., Inc. | | | | | 2,901 | | | | 137,594 | |
| Lear Corp. | | | | | 3,252 | | | | 326,338 | |
| Liberty Interactive Corp., Series A | | | | | 76,281 | | | | 2,087,048 | |
| Liberty TripAdvisor Holdings, Inc., Series A | | | | | 82,268 | | | | 1,969,496 | |
| LifeLock, Inc. | | | | | 25,029 | | | | 371,681 | |
| Lions Gate Entertainment Corp. | | | | | 78,076 | | | | 2,243,123 | |
| LogMeIn, Inc. | | | | | 58,811 | | | | 2,796,463 | |
| LyondellBasell Industries NV, Class A | | | | | 75,620 | | | | 5,980,786 | |
| Mack-Cali Realty Corp. | | | | | 36,858 | | | | 719,100 | |
| Manpowergroup, Inc. | | | | | 274,577 | | | | 20,011,172 | |
| Marathon Petroleum Corp. | | | | | 138,273 | | | | 12,802,697 | |
| Marvell Technology Group Ltd. | | | | | 366,526 | | | | 5,677,488 | |
| MAXIMUS, Inc. | | | | | 51,057 | | | | 2,844,896 | |
| MBIA, Inc. | | | | | 415,887 | | | | 3,335,414 | |
| MedAssets, Inc. | | | | | 1,950 | | | | 36,094 | |
| Memorial Resource Development Corp. | | | | | 4,216 | | | | 80,736 | |
| The Michaels Cos., Inc. | | | | | 54,790 | | | | 1,413,582 | |
| Micron Technology, Inc. | | | | | 83,938 | | | | 2,456,446 | |
| MRC Global, Inc. | | | | | 311,521 | | | | 3,367,542 | |
| Nationstar Mortgage Holdings, Inc. | | | | | 25,815 | | | | 663,704 | |
| New Residential Investment Corp. | | | | | 3,717 | | | | 47,392 | |
| Newmont Mining Corp. | | | | | 481,672 | | | | 12,114,051 | |
| NIC, Inc. | | | | | 106,581 | | | | 1,750,060 | |
| NRG Energy, Inc. | | | | | 44,599 | | | | 1,099,811 | |
| Nucor Corp. | | | | | 88,201 | | | | 3,849,974 | |
| ON Semiconductor Corp. | | | | | 189,986 | | | | 1,901,760 | |
| OSI Systems, Inc. | | | | | 14,272 | | | | 998,755 | |
| Outerwall, Inc. | | | | | 7,104 | | | | 441,016 | |
| Outfront Media, Inc. | | | | | 35,658 | | | | 1,010,904 | |
| Patterson-UTI Energy, Inc. | | | | | 71,812 | | | | 1,232,294 | |
| Pegasystems, Inc. | | | | | 68,093 | | | | 1,332,580 | |
| Penske Automotive Group, Inc. | | | | | 64,196 | | | | 3,103,877 | |
| Phillips 66 | | | | | 37,830 | | | | 2,660,206 | |
| Pilgrim’s Pride Corp. | | | | | 5,485 | | | | 148,918 | |
| PolyOne Corp. | | | | | 10,584 | | | | 376,685 | |
| PRA Health Sciences, Inc. | | | | | 1,713 | | | | 44,761 | |
| Prestige Brands Holdings, Inc. | | | | | 36,745 | | | | 1,258,884 | |
| Progress Software Corp. | | | | | 94,945 | | | | 2,378,372 | |
| Reliance Steel & Aluminum Co. | | | | | 25,423 | | | | 1,331,402 | |
| Rite Aid Corp. | | | | | 114,561 | | | | 799,636 | |
| Rock-Tenn Co., Class A | | | | | 85,842 | | | | 5,571,146 | |
| Rovi Corp. | | | | | 5,033 | | | | 116,313 | |
| RPC, Inc. | | | | | 120,201 | | | | 1,498,906 | |
| Sanderson Farms, Inc. | | | | | 69,271 | | | | 5,538,909 | |
| SeaWorld Entertainment, Inc. | | | | | 255,735 | | | | 4,477,920 | |
| ServiceMaster Global Holdings, Inc. | | | | | 54,053 | | | | 1,527,538 | |
| Simon Property Group, Inc. | | | | | 2,192 | | | | 435,463 | |
| Six Flags Entertainment Corp. | | | | | 75,978 | | | | 3,264,015 | |
| Skyworks Solutions, Inc. | | | | | 161,000 | | | | 13,371,050 | |
| SPX Corp. | | | | | 18,579 | | | | 1,552,647 | |
| Stanley Black & Decker, Inc. | | | | | 9,460 | | | | 885,929 | |
| Steel Dynamics, Inc. | | | | | 211,826 | | | | 3,609,515 | |
| Stillwater Mining Co. | | | | | 75,052 | | | | 1,025,961 | |
| Swift Transportation Co. | | | | | 79,615 | | | | 1,956,937 | |
| Symetra Financial Corp. | | | | | 1,886 | | | | 38,305 | |
| Telephone & Data Systems, Inc. | | | | | 40,046 | | | | 931,069 | |
| Tesoro Corp. | | | | | 30,363 | | | | 2,481,568 | |
| Tessera Technologies, Inc. | | | | | 48,424 | | | | 1,795,562 | |
| Time Warner, Inc. | | | | | 15,285 | | | | 1,191,160 | |
| The Timken Co. | | | | | 14,816 | | | | 563,156 | |
| TimkenSteel Corp. | | | | | 16,513 | | | | 445,851 | |
See Notes to Financial Statements.
| BLACKROCK FUNDS | JANUARY 31, 2015 | 37
|
| |
| Schedule of Investments (continued) | BlackRock Global Long/Short Equity Fund |
| | | | | Shares | | Value |
Reference Entity — Long |
United States (concluded) | | | | | | | | | | |
| TRI Pointe Homes, Inc. | | | | | 421,575 | | | $ | 6,041,170 | |
| Tribune Co., Class A | | | | | 30,212 | | | | 1,779,185 | |
| Trinity Industries, Inc. | | | | | 38,480 | | | | 1,018,566 | |
| U.S. Silica Holdings, Inc. | | | | | 15,127 | | | | 381,200 | |
| Ultra Petroleum Corp. | | | | | 3,980 | | | | 50,745 | |
| Union Pacific Corp. | | | | | 53,639 | | | | 6,287,027 | |
| United States Steel Corp. | | | | | 72,939 | | | | 1,782,629 | |
| Valero Energy Corp. | | | | | 274,918 | | | | 14,537,664 | |
| Vector Group Ltd. | | | | | 15,813 | | | | 353,895 | |
| Viacom, Inc., Class B | | | | | 125,764 | | | | 8,101,717 | |
| Virgin America, Inc. | | | | | 3,164 | | | | 106,121 | |
| Voya Financial, Inc. | | | | | 44,218 | | | | 1,724,944 | |
| WABCO Holdings, Inc. | | | | | 14,536 | | | | 1,383,391 | |
| Waddell & Reed Financial, Inc., Class A | | | | | 101,372 | | | | 4,532,342 | |
| Washington Federal, Inc. | | | | | 34,975 | | | | 694,603 | |
| Weingarten Realty Investors | | | | | 8,630 | | | | 323,452 | |
| WESCO International, Inc. | | | | | 139,586 | | | | 9,318,761 | |
| Western Refining, Inc. | | | | | 30,494 | | | | 1,132,242 | |
| Whiting Petroleum Corp. | | | | | 145,376 | | | | 4,364,187 | |
| WPX Energy, Inc. | | | | | 237,772 | | | | 2,534,650 | |
| Xilinx, Inc. | | | | | 17,877 | | | | 689,605 | |
| Zayo Group Holdings, Inc. | | | | | 9,253 | | | | 256,771 | |
| Zebra Technologies Corp., Class A | | | | | 1,683 | | | | 140,463 | |
| | | | | | | | | | 517,861,398 | |
Total Reference Entity — Long | | | | | | | | | 545,522,090 | |
| |
Reference Entity — Short |
Australia | | | | | | | | | | |
| InterOil Corp. | | | | | (106,526 | ) | | | (4,006,443 | ) |
Canada | | | | | | | | | | |
| Lululemon Athletica, Inc. | | | | | (165,034 | ) | | | (10,931,852 | ) |
Ireland | | | | | | | | | | |
| Accenture PLC, Class A Class A | | | | | (115,097 | ) | | | (9,671,601 | ) |
| FleetMatics Group PLC | | | | | (8,370 | ) | | | (296,382 | ) |
| | | | | | | | | | (9,967,983 | ) |
Israel | | | | | | | | | | |
| Check Point Software Technologies, Ltd. | | | | | (29,348 | ) | | | (2,264,785 | ) |
Netherlands | | | | | | | | | | |
| InterXion Holding NV | | | | | (3,929 | ) | | | (107,223 | ) |
United States | | | | | | | | | | |
| ABIOMED, Inc. | | | | | (89,424 | ) | | | (4,626,798 | ) |
| Acadia Healthcare Co., Inc. | | | | | (83,909 | ) | | | (4,845,745 | ) |
| Actuant Corp. | | | | | (13,397 | ) | | | (309,605 | ) |
| Akorn, Inc. | | | | | (56,719 | ) | | | (2,415,095 | ) |
| Allegheny Technologies, Inc. | | | | | (259,789 | ) | | | (7,411,780 | ) |
| Allegiant Travel Co. | | | | | (12,008 | ) | | | (2,176,690 | ) |
| Alliance Data Systems Corp. | | | | | (5,696 | ) | | | (1,645,176 | ) |
| Amazon.com, Inc. | | | | | (40,924 | ) | | | (14,508,786 | ) |
| Amedisys, Inc. | | | | | (3,863 | ) | | | (108,859 | ) |
| Ameren Corp. | | | | | (91,998 | ) | | | (4,165,669 | ) |
| American Airlines Group, Inc. | | | | | (10,594 | ) | | | (519,954 | ) |
| American Eagle Outfitters, Inc. | | | | | (333,854 | ) | | | (4,687,310 | ) |
| Amsurg Corp. | | | | | (5,578 | ) | | | (307,794 | ) |
| Antero Resources Corp. | | | | | (2,485 | ) | | | (86,105 | ) |
| AptarGroup, Inc. | | | | | (5,208 | ) | | | (328,677 | ) |
| Arthur J Gallagher & Co. | | | | | (24,376 | ) | | | (1,083,026 | ) |
| athenahealth, Inc. | | | | | (79,894 | ) | | | (11,161,991 | ) |
| Avery Dennison Corp. | | | | | (139,063 | ) | | | (7,268,823 | ) |
| Axiall Corp. | | | | | (120,037 | ) | | | (5,311,637 | ) |
| Balchem Corp. | | | | | (26,007 | ) | | | (1,377,591 | ) |
| Bank of Hawaii Corp. | | | | | (7,941 | ) | | | (448,349 | ) |
| | | | | Shares | | Value |
Reference Entity — Short |
United States (continued) | | | | | | | | | | |
| Bio-Techne Corp. | | | | | (2,836 | ) | | $ | (263,805 | ) |
| The Boston Beer Co., Inc. | | | | | (183 | ) | | | (57,557 | ) |
| Boyd Gaming Corp. | | | | | (199,693 | ) | | | (2,607,991 | ) |
| Brady Corp., Class A Class A | | | | | (1,875 | ) | | | (49,069 | ) |
| Bristow Group, Inc. | | | | | (12,577 | ) | | | (700,665 | ) |
| Cabela’s, Inc. | | | | | (38,199 | ) | | | (2,099,035 | ) |
| Cablevision Systems Corp. | | | | | (180,656 | ) | | | (3,418,012 | ) |
| CACI International, Inc., Class A Class A | | | | | (1,582 | ) | | | (133,821 | ) |
| Caesars Entertainment Corp. | | | | | (100,670 | ) | | | (1,096,296 | ) |
| Campbell Soup Co. | | | | | (290,182 | ) | | | (13,272,925 | ) |
| CarMax, Inc. | | | | | (200,904 | ) | | | (12,476,138 | ) |
| Carnival Corp. | | | | | (113,246 | ) | | | (4,978,294 | ) |
| Casey’s General Stores, Inc. | | | | | (7,741 | ) | | | (706,753 | ) |
| Cerner Corp. | | | | | (55,353 | ) | | | (3,672,672 | ) |
| CLARCOR, Inc. | | | | | (58,539 | ) | | | (3,660,444 | ) |
| Clean Harbors, Inc. | | | | | (33,868 | ) | | | (1,602,634 | ) |
| Coach, Inc. | | | | | (251,228 | ) | | | (9,343,169 | ) |
| Cobalt International Energy, Inc. | | | | | (103,236 | ) | | | (941,512 | ) |
| The Coca-Cola Co. | | | | | (204,712 | ) | | | (8,427,993 | ) |
| Colfax Corp. | | | | | (10,073 | ) | | | (456,408 | ) |
| CommVault Systems, Inc. | | | | | (9,155 | ) | | | (398,975 | ) |
| comScore, Inc. | | | | | (63,434 | ) | | | (2,636,317 | ) |
| ConAgra Foods, Inc. | | | | | (200,205 | ) | | | (7,093,263 | ) |
| CONSOL Energy, Inc. | | | | | (28,273 | ) | | | (818,503 | ) |
| Constellation Brands, Inc. | | | | | (15,678 | ) | | | (1,731,635 | ) |
| Cornerstone OnDemand, Inc. | | | | | (3,154 | ) | | | (103,924 | ) |
| CoStar Group, Inc. | | | | | (18,459 | ) | | | (3,405,870 | ) |
| Coty, Inc., Class A | | | | | (354,316 | ) | | | (6,739,090 | ) |
| Cray, Inc. | | | | | (113,766 | ) | | | (3,696,257 | ) |
| Cree, Inc. | | | | | (14,613 | ) | | | (516,716 | ) |
| Crocs, Inc. | | | | | (213,134 | ) | | | (2,259,220 | ) |
| CVB Financial Corp. | | | | | (4,373 | ) | | | (63,890 | ) |
| Darden Restaurants, Inc. | | | | | (45,536 | ) | | | (2,795,000 | ) |
| Darling International, Inc. | | | | | (75,394 | ) | | | (1,280,190 | ) |
| Dealertrack Technologies, Inc. | | | | | (60,704 | ) | | | (2,440,301 | ) |
| Dean Foods Co. | | | | | (537,590 | ) | | | (9,741,131 | ) |
| Deere & Co. | | | | | (18,282 | ) | | | (1,557,444 | ) |
| Demandware, Inc. | | | | | (31,959 | ) | | | (1,711,724 | ) |
| Diebold, Inc. | | | | | (151,906 | ) | | | (4,739,467 | ) |
| Dillard’s, Inc., Class A Class A | | | | | (7,602 | ) | | | (863,587 | ) |
| Donaldson Co., Inc. | | | | | (22,859 | ) | | | (835,725 | ) |
| Eclipse Resources Corp. | | | | | (58,992 | ) | | | (365,750 | ) |
| Education Realty Trust, Inc. | | | | | (1 | ) | | | (46 | ) |
| Ellie Mae, Inc. | | | | | (2,242 | ) | | | (99,186 | ) |
| Enbridge Energy Management LLC | | | | | (23,592 | ) | | | (884,452 | ) |
| Energizer Holdings, Inc. | | | | | (965 | ) | | | (123,530 | ) |
| Essex Property Trust, Inc. | | | | | (11,394 | ) | | | (2,575,614 | ) |
| The EW Scripps Co. | | | | | (76,881 | ) | | | (1,516,862 | ) |
| ExamWorks Group, Inc. | | | | | (1,250 | ) | | | (46,200 | ) |
| Exxon Mobil Corp. | | | | | (15,334 | ) | | | (1,340,498 | ) |
| FireEye, Inc. | | | | | (12,474 | ) | | | (421,746 | ) |
| First Cash Financial Services, Inc. | | | | | (12,496 | ) | | | (621,301 | ) |
| First Niagara Financial Group, Inc. | | | | | (44,900 | ) | | | (364,588 | ) |
| FirstEnergy Corp. | | | | | (35,108 | ) | | | (1,415,906 | ) |
| FirstMerit Corp. | | | | | (14,177 | ) | | | (232,290 | ) |
| Five Below, Inc. | | | | | (135,172 | ) | | | (4,503,931 | ) |
| Flotek Industries, Inc. | | | | | (72,234 | ) | | | (1,168,024 | ) |
| Franklin Electric Co., Inc. | | | | | (28,742 | ) | | | (983,264 | ) |
| Generac Holdings, Inc. | | | | | (99,933 | ) | | | (4,371,069 | ) |
| Graham Holdings Co., Class B | | | | | (1,441 | ) | | | (1,347,796 | ) |
| Granite Construction, Inc. | | | | | (62,786 | ) | | | (2,139,747 | ) |
| Group 1 Automotive, Inc. | | | | | (26,057 | ) | | | (2,094,722 | ) |
| Groupon, Inc. | | | | | (290,745 | ) | | | (2,081,734 | ) |
| Guidewire Software, Inc. | | | | | (14,342 | ) | | | (718,534 | ) |
| Gulfport Energy Corp. | | | | | (20,175 | ) | | | (776,536 | ) |
| The Hain Celestial Group, Inc. | | | | | (7,912 | ) | | | (417,516 | ) |
See Notes to Financial Statements.
| 38 | BLACKROCK FUNDS | JANUARY 31, 2015
|
| |
| Schedule of Investments (continued) | BlackRock Global Long/Short Equity Fund |
| | | | | Shares | | Value |
Reference Entity — Short |
United States (continued) | | | | | | | | | | |
| Healthcare Services Group, Inc. | | | | | (137,935 | ) | | $ | (4,346,332 | ) |
| Heartland Express, Inc. | | | | | (5,473 | ) | | | (140,601 | ) |
| HeartWare International, Inc. | | | | | (27,204 | ) | | | (2,272,350 | ) |
| HEICO Corp. | | | | | (2,134 | ) | | | (129,491 | ) |
| Hillenbrand, Inc. | | | | | (2,174 | ) | | | (68,285 | ) |
| HMS Holdings Corp. | | | | | (5,507 | ) | | | (108,956 | ) |
| Hospira, Inc. | | | | | (102,059 | ) | | | (6,473,602 | ) |
| Hudson City Bancorp, Inc. | | | | | (352,440 | ) | | | (3,161,387 | ) |
| iGATE Corp. | | | | | (1,102 | ) | | | (39,011 | ) |
| Impax Laboratories, Inc. | | | | | (9,981 | ) | | | (366,003 | ) |
| Imperva, Inc. | | | | | (1,933 | ) | | | (80,722 | ) |
| Infinera Corp. | | | | | (23,090 | ) | | | (372,211 | ) |
| Integra LifeSciences Holdings Corp. | | | | | (51,406 | ) | | | (2,864,342 | ) |
| Intrepid Potash, Inc. | | | | | (83,430 | ) | | | (1,110,453 | ) |
| IPG Photonics Corp. | | | | | (2,155 | ) | | | (160,849 | ) |
| j2 Global, Inc. | | | | | (32,362 | ) | | | (1,858,873 | ) |
| Jabil Circuit, Inc. | | | | | (10,632 | ) | | | (219,126 | ) |
| Janus Capital Group, Inc. | | | | | (302,787 | ) | | | (5,310,884 | ) |
| Kate Spade & Co. | | | | | (345,793 | ) | | | (10,902,853 | ) |
| KB Home | | | | | (195,771 | ) | | | (2,439,307 | ) |
| Kinder Morgan, Inc. | | | | | (180,922 | ) | | | (7,426,848 | ) |
| Life Time Fitness, Inc. | | | | | (36,220 | ) | | | (1,980,147 | ) |
| LinkedIn Corp. | | | | | (3,511 | ) | | | (789,062 | ) |
| Lithia Motors, Inc., Class A Class A | | | | | (574 | ) | | | (48,618 | ) |
| Loews Corp. | | | | | (49,879 | ) | | | (1,908,371 | ) |
| Louisiana-Pacific Corp. | | | | | (828,761 | ) | | | (13,566,818 | ) |
| Lumber Liquidators Holdings, Inc. | | | | | (14,954 | ) | | | (944,345 | ) |
| MarketAxess Holdings, Inc. | | | | | (3,170 | ) | | | (240,825 | ) |
| Marketo, Inc. | | | | | (54,292 | ) | | | (1,869,274 | ) |
| Martin Marietta Materials, Inc. | | | | | (69,292 | ) | | | (7,465,520 | ) |
| McDermott International, Inc. | | | | | (1,285,579 | ) | | | (2,892,553 | ) |
| McDonald’s Corp. | | | | | (73,607 | ) | | | (6,804,231 | ) |
| Medidata Solutions, Inc. | | | | | (78,427 | ) | | | (3,371,577 | ) |
| Mercury General Corp. | | | | | (19,693 | ) | | | (1,125,455 | ) |
| Mettler-Toledo International, Inc. | | | | | (4,851 | ) | | | (1,474,461 | ) |
| Monro Muffler Brake, Inc. | | | | | (84,832 | ) | | | (4,847,300 | ) |
| MSC Industrial Direct Co., Inc. | | | | | (23,671 | ) | | | (1,776,982 | ) |
| Navistar International Corp. | | | | | (97,864 | ) | | | (2,879,159 | ) |
| Neogen Corp. | | | | | (38,094 | ) | | | (1,756,133 | ) |
| Netflix, Inc. | | | | | (1,142 | ) | | | (504,536 | ) |
| NetSuite, Inc. | | | | | (35,117 | ) | | | (3,456,566 | ) |
| New York REIT, Inc. | | | | | (46,433 | ) | | | (484,296 | ) |
| The New York Times Co. | | | | | (102,923 | ) | | | (1,295,801 | ) |
| Nexstar Broadcasting Group, Inc. | | | | | (67,028 | ) | | | (3,344,362 | ) |
| Nimble Storage, Inc. | | | | | (2,269 | ) | | | (50,894 | ) |
| Ocwen Financial Corp. | | | | | (119,658 | ) | | | (732,307 | ) |
| Olin Corp. | | | | | (279,357 | ) | | | (7,003,480 | ) |
| Oracle Corp. | | | | | (339,409 | ) | | | (14,217,843 | ) |
| Palo Alto Networks, Inc. | | | | | (5,804 | ) | | | (733,568 | ) |
| Pandora Media, Inc. | | | | | (33,568 | ) | | | (557,229 | ) |
| Peabody Energy Corp. | | | | | (754,338 | ) | | | (4,699,526 | ) |
| Pinnacle Entertainment, Inc. | | | | | (247,483 | ) | | | (5,234,265 | ) |
| Plum Creek Timber Co., Inc. | | | | | (16,374 | ) | | | (728,971 | ) |
| Polaris Industries, Inc. | | | | | (4,624 | ) | | | (668,584 | ) |
| Post Holdings, Inc. | | | | | (73,623 | ) | | | (3,478,687 | ) |
| Precision Castparts Corp. | | | | | (29,142 | ) | | | (5,831,314 | ) |
| PriceSmart, Inc. | | | | | (8,267 | ) | | | (676,075 | ) |
| Proofpoint, Inc. | | | | | (54,246 | ) | | | (2,712,300 | ) |
| PVH Corp. | | | | | (11,432 | ) | | | (1,260,492 | ) |
| Ralph Lauren Corp. | | | | | (17,905 | ) | | | (2,988,165 | ) |
| RealPage, Inc. | | | | | (78,660 | ) | | | (1,416,667 | ) |
| Redwood Trust, Inc. | | | | | (214,637 | ) | | | (4,277,715 | ) |
| ResMed, Inc. | | | | | (15,316 | ) | | | (956,791 | ) |
| Restoration Hardware Holdings, Inc. | | | | | (16,786 | ) | | | (1,469,279 | ) |
| | | | | Shares | | Value |
Reference Entity — Short |
United States (concluded) | | | | | | | | | | |
| RLI Corp. | | | | | (2,877 | ) | | $ | (134,960 | ) |
| Royal Caribbean Cruises, Ltd. | | | | | (16,884 | ) | | | (1,275,586 | ) |
| SCANA Corp. | | | | | (5,827 | ) | | | (371,588 | ) |
| Schweitzer-Mauduit International, Inc. | | | | | (27,565 | ) | | | (1,071,176 | ) |
| Scientific Games Corp. | | | | | (13,267 | ) | | | (156,683 | ) |
| Select Medical Holdings Corp. | | | | | (5,266 | ) | | | (71,196 | ) |
| Sensient Technologies Corp. | | | | | (14,989 | ) | | | (914,329 | ) |
| ServiceNow, Inc. | | | | | (94,632 | ) | | | (6,898,673 | ) |
| Snyder’s-Lance, Inc. | | | | | (38,947 | ) | | | (1,132,968 | ) |
| Sotheby’s | | | | | (61,069 | ) | | | (2,598,486 | ) |
| The Southern Co. | | | | | (57,078 | ) | | | (2,894,996 | ) |
| The Spectranetics Corp. | | | | | (112,370 | ) | | | (3,675,623 | ) |
| Splunk, Inc. | | | | | (31,601 | ) | | | (1,632,192 | ) |
| Staples, Inc. | | | | | (413,323 | ) | | | (7,047,157 | ) |
| Starbucks Corp. | | | | | (126,003 | ) | | | (11,029,043 | ) |
| Stericycle, Inc. | | | | | (19,594 | ) | | | (2,572,496 | ) |
| Stifel Financial Corp. | | | | | (4,023 | ) | | | (189,684 | ) |
| SunEdison, Inc. | | | | | (214,439 | ) | | | (4,016,442 | ) |
| SYNNEX Corp. | | | | | (19,449 | ) | | | (1,442,921 | ) |
| Sysco Corp. | | | | | (175,993 | ) | | | (6,893,646 | ) |
| TAL International Group, Inc. | | | | | (75,559 | ) | | | (3,071,473 | ) |
| TECO Energy, Inc. | | | | | (20,015 | ) | | | (426,920 | ) |
| Tempur Sealy International, Inc. | | | | | (147,094 | ) | | | (8,094,583 | ) |
| Teradata Corp. | | | | | (2,772 | ) | | | (123,520 | ) |
| Tidewater, Inc. | | | | | (153,066 | ) | | | (4,478,711 | ) |
| Tiffany & Co. | | | | | (9,111 | ) | | | (789,377 | ) |
| Total System Services, Inc. | | | | | (26,043 | ) | | | (921,141 | ) |
| Tronox, Ltd., Class A Class A | | | | | (55,617 | ) | | | (1,175,743 | ) |
| Twitter, Inc. | | | | | (46,989 | ) | | | (1,763,497 | ) |
| Tyler Technologies, Inc. | | | | | (8,777 | ) | | | (931,064 | ) |
| UIL Holdings Corp. | | | | | (981 | ) | | | (45,126 | ) |
| Under Armour, Inc., Class A | | | | | (174,715 | ) | | | (12,593,457 | ) |
| United Bankshares, Inc. | | | | | (11,432 | ) | | | (386,516 | ) |
| United Natural Foods, Inc. | | | | | (3,512 | ) | | | (271,407 | ) |
| UnitedHealth Group, Inc. | | | | | (52,726 | ) | | | (5,602,138 | ) |
| Urban Edge Properties | | | | | (29,743 | ) | | | (706,087 | ) |
| US Ecology, Inc. | | | | | (20,979 | ) | | | (869,789 | ) |
| USG Corp. | | | | | (292,277 | ) | | | (8,899,835 | ) |
| UTi Worldwide, Inc. | | | | | (7,330 | ) | | | (87,007 | ) |
| Valley National Bancorp | | | | | (91,117 | ) | | | (827,342 | ) |
| Varian Medical Systems, Inc. | | | | | (8,940 | ) | | | (827,486 | ) |
| Veeco Instruments, Inc. | | | | | (98,767 | ) | | | (2,881,033 | ) |
| Verisk Analytics, Inc., Class A | | | | | (68,297 | ) | | | (4,394,912 | ) |
| ViaSat, Inc. | | | | | (41,734 | ) | | | (2,346,286 | ) |
| Vornado Realty Trust | | | | | (41,623 | ) | | | (4,596,844 | ) |
| WageWorks, Inc. | | | | | (6,314 | ) | | | (347,523 | ) |
| Wal-Mart Stores, Inc. | | | | | (120,315 | ) | | | (10,224,369 | ) |
| WellCare Health Plans, Inc. | | | | | (5,209 | ) | | | (379,476 | ) |
| The Western Union Co. | | | | | (10,532 | ) | | | (179,044 | ) |
| WEX, Inc. | | | | | (48,698 | ) | | | (4,482,651 | ) |
| WisdomTree Investments, Inc. | | | | | (47,435 | ) | | | (826,318 | ) |
| Wolverine World Wide, Inc. | | | | | (237,564 | ) | | | (6,687,427 | ) |
| Workday, Inc., Class A | | | | | (1,215 | ) | | | (96,544 | ) |
| WR Grace & Co. | | | | | (7,762 | ) | | | (672,810 | ) |
| Wright Medical Group, Inc. | | | | | (1,618 | ) | | | (39,495 | ) |
| XPO Logistics, Inc. | | | | | (127,502 | ) | | | (4,690,799 | ) |
| Yelp, Inc. | | | | | (6,717 | ) | | | (352,441 | ) |
| Zillow, Inc., Class A | | | | | (46,033 | ) | | | (4,461,518 | ) |
| Zynga, Inc., Class A | | | | | (520,483 | ) | | | (1,332,437 | ) |
| | | | | | | | | | (563,076,745 | ) |
Total Reference Entity — Short | | | | | | | | | (590,355,031 | ) |
Net Value of Reference Entity — Goldman Sachs & Co. | $ | (44,832,941 | ) |
See Notes to Financial Statements.
| BLACKROCK FUNDS | JANUARY 31, 2015 | 39
|
| |
| Schedule of Investments (continued) | BlackRock Global Long/Short Equity Fund |
The following table represents the individual long and short positions and related values of the equity securities underlying the total return swap with UBS AG as of January 31, 2015, expiration date 2/12/15:
| | | | | Shares | | Value |
Reference Entity — Long |
Australia | | | | | | | | | | |
| Aristocrat Leisure Ltd. | | | | | 103,067 | | | $ | 558,351 | |
| Arrium Ltd. | | | | | 2,676,148 | | | | 422,334 | |
| AusNet Services | | | | | 415,522 | | | | 451,025 | |
| Boral Ltd. | | | | | 72,402 | | | | 313,365 | |
| Caltex Australia Ltd. | | | | | 28,259 | | | | 731,350 | |
| CSR Ltd. | | | | | 217,619 | | | | 672,216 | |
| Dexus Property Group | | | | | 152,718 | | | | 912,043 | |
| Downer EDI Ltd. | | | | | 136,182 | | | | 442,172 | |
| Fairfax Media, Ltd. | | | | | 3,427,254 | | | | 2,384,087 | |
| iiNET, Ltd. | | | | | 86,188 | | | | 500,214 | |
| JB Hi-Fi Ltd. | | | | | 341,439 | | | | 4,425,936 | |
| Newcrest Mining Ltd. | | | | | 98,140 | | | | 1,059,663 | |
| Qantas Airways Ltd. | | | | | 131,025 | | | | 264,025 | |
| Rio Tinto Ltd. | | | | | 187,493 | | | | 8,360,703 | |
| Seven West Media Ltd. | | | | | 74,723 | | | | 75,739 | |
| Transpacific Industries Group, Ltd. | | | | | 1,989,866 | | | | 1,278,016 | |
| Woodside Petroleum Ltd. | | | | | 2,825 | | | | 75,391 | |
| | | | | | | | | | 22,926,630 | |
Austria | | | | | | | | | | |
| Andritz AG | | | | | 9,907 | | | | 536,280 | |
| Voestalpine AG | | | | | 210,346 | | | | 7,490,951 | |
| | | | | | | | | | 8,027,231 | |
Belgium | | | | | | | | | | |
| bpost SA | | | | | 14,421 | | | | 379,473 | |
Canada | | | | | | | | | | |
| Agnico Eagle Mines Ltd. | | | | | 113,762 | | | | 3,835,338 | |
| Aimia, Inc. | | | | | 229,013 | | | | 2,456,478 | |
| Air Canada | | | | | 78,795 | | | | 728,607 | |
| Boardwalk Real Estate Investment Trust | | | | | 18,158 | | | | 876,391 | |
| Canadian National Railway Co. | | | | | 5,210 | | | | 343,261 | |
| Canadian Real Estate Investment Trust | | | | | 40,290 | | | | 1,528,908 | |
| Canfor Corp. | | | | | 26,217 | | | | 655,064 | |
| Capital Power Corp. | | | | | 2,390 | | | | 47,567 | |
| CCL Industries, Inc., Class B | | | | | 30,817 | | | | 3,185,499 | |
| Centerra Gold, Inc. | | | | | 16,970 | | | | 101,764 | |
| Cogeco Cable, Inc. | | | | | 14,744 | | | | 847,023 | |
| Detour Gold Corp. | | | | | 54,959 | | | | 562,263 | |
| Dominion Diamond Corp. | | | | | 23,552 | | | | 391,267 | |
| Domtar Corp. | | | | | 63,732 | | | | 2,441,547 | |
| Eldorado Gold Corp. | | | | | 87,626 | | | | 420,649 | |
| Emera, Inc. | | | | | 183,777 | | | | 6,013,573 | |
| Encana Corp. | | | | | 6,123 | | | | 74,881 | |
| Finning International, Inc. | | | | | 23,518 | | | | 387,741 | |
| Franco-Nevada Corp. | | | | | 9,303 | | | | 536,861 | |
| Goldcorp, Inc. | | | | | 77,968 | | | | 1,883,086 | |
| IAMGOLD Corp. | | | | | 40,933 | | | | 109,524 | |
| Kinross Gold Corp. | | | | | 247,074 | | | | 838,033 | |
| Linamar Corp. | | | | | 86,140 | | | | 4,934,391 | |
| Magna International, Inc. | | | | | 20,047 | | | | 1,926,134 | |
| Methanex Corp. | | | | | 82,924 | | | | 3,664,918 | |
| Onex Corp. | | | | | 37,035 | | | | 2,032,888 | |
| Open Text Corp. | | | | | 124,862 | | | | 7,080,787 | |
| Pan American Silver Corp. | | | | | 10,385 | | | | 121,609 | |
| Quebecor, Inc., Class B | | | | | 1,765 | | | | 44,240 | |
| Raging River Exploration, Inc. | | | | | 186,065 | | | | 1,080,633 | |
| Royal Bank of Canada | | | | | 213,057 | | | | 12,028,574 | |
| Silver Wheaton Corp. | | | | | 22,184 | | | | 509,602 | |
| Superior Plus Corp. | | | | | 140,075 | | | | 1,344,861 | |
| TELUS Corp. | | | | | 373,220 | | | | 12,802,912 | |
| | | | | Shares | | Value |
Reference Entity — Long |
Canada (concluded) | | | | | | | | | | |
| Vermilion Energy, Inc. | | | | | 1,126 | | | $ | 49,596 | |
| Yamana Gold, Inc. | | | | | 111,037 | | | | 459,632 | |
| | | | | | | | | | 76,346,102 | |
Denmark | | | | | | | | | | |
| Novo Nordisk A/S, Class B | | | | | 150,785 | | | | 6,720,589 | |
| Novozymes A/S, Class B | | | | | 31,859 | | | | 1,452,912 | |
| | | | | | | | | | 8,173,501 | |
France | | | | | | | | | | |
| EDF | | | | | 121,228 | | | | 3,286,365 | |
| Faurecia | | | | | 22,100 | | | | 887,677 | |
| Natixis | | | | | 187,912 | | | | 1,195,116 | |
| Societe Generale SA | | | | | 424 | | | | 17,026 | |
| Technicolor SA, Registered Shares | | | | | 233,899 | | | | 1,397,245 | |
| | | | | | | | | | 6,783,429 | |
Germany | | | | | | | | | | |
| Aareal Bank AG | | | | | 1,137 | | | | 43,054 | |
| Commerzbank AG | | | | | 370,550 | | | | 4,442,635 | |
| Continental AG | | | | | 6,928 | | | | 1,563,281 | |
| Duerr AG | | | | | 55,516 | | | | 5,052,581 | |
| Fresenius SE & Co. KGaA | | | | | 77,586 | | | | 4,440,768 | |
| Hochtief AG | | | | | 7,940 | | | | 552,191 | |
| K+S AG, Registered Shares | | | | | 417,282 | | | | 13,174,928 | |
| Kloeckner & Co. SE | | | | | 56,163 | | | | 578,671 | |
| Krones AG | | | | | 1,089 | | | | 103,099 | |
| LEG Immobilien AG | | | | | 2,958 | | | | 226,497 | |
| Nordex SE | | | | | 28,952 | | | | 558,780 | |
| ProSiebenSat.1 Media AG, Registered Shares | | | | | 138,943 | | | | 6,150,687 | |
| Salzgitter AG | | | | | 46,470 | | | | 1,266,810 | |
| ThyssenKrupp AG | | | | | 47,358 | | | | 1,230,298 | |
| United Internet AG, Registered Shares | | | | | 25,385 | | | | 1,099,683 | |
| Volkswagen AG, Preference Shares | | | | | 3,316 | | | | 739,759 | |
| | | | | | | | | | 41,223,722 | |
Hong Kong | | | | | | | | | | |
| Cheung Kong Holdings Ltd. | | | | | 189,000 | | | | 3,606,645 | |
| CLP Holdings Ltd. | | | | | 384,000 | | | | 3,428,187 | |
| Galaxy Entertainment Group Ltd. | | | | | 315,000 | | | | 1,645,302 | |
| Hutchison Whampoa Ltd. | | | | | 234,000 | | | | 3,105,994 | |
| Kerry Properties Ltd. | | | | | 501,500 | | | | 1,772,086 | |
| Li & Fung Ltd. | | | | | 932,000 | | | | 924,510 | |
| MGM China Holdings Ltd. | | | | | 124,000 | | | | 300,358 | |
| New World Development Co. Ltd. | | | | | 1,323,000 | | | | 1,577,344 | |
| Power Assets Holdings Ltd. | | | | | 43,500 | | | | 454,975 | |
| Shun Tak Holdings, Ltd. | | | | | 92,000 | | | | 42,043 | |
| Sino Land Co., Ltd. | | | | | 114,000 | | | | 190,642 | |
| Swire Properties Ltd. | | | | | 62,400 | | | | 200,331 | |
| Wheelock & Co. Ltd. | | | | | 75,000 | | | | 424,335 | |
| | | | | | | | | | 17,672,752 | |
Iran | | | | | | | | | | |
| Smurfit Kappa Group PLC | | | | | 203,679 | | | | 5,007,509 | |
Ireland | | | | | | | | | | |
| Bank of Ireland | | | | | 1,565,459 | | | | 471,154 | |
| Kerry Group PLC, Class A | | | | | 1,432 | | | | 103,783 | |
| | | | | | | | | | 574,937 | |
Isle of Man | | | | | | | | | | |
| Playtech PLC | | | | | 63,305 | | | | 644,330 | |
Italy | | | | | | | | | | |
| A2A SpA | | | | | 255,359 | | | | 243,382 | |
| Ansaldo STS SpA | | | | | 26,559 | | | | 266,890 | |
| Autogrill SpA | | | | | 47,775 | | | | 408,131 | |
See Notes to Financial Statements.
| 40 | BLACKROCK FUNDS | JANUARY 31, 2015
|
| |
| Schedule of Investments (continued) | BlackRock Global Long/Short Equity Fund |
| | | | | Shares | | Value |
Reference Entity — Long |
Italy (concluded) | | | | | | | | | | |
| Moncler SpA | | | | | 162,482 | | | $ | 2,413,566 | |
| Telecom Italia SpA, Non-Convertible Savings Shares | | | | | 1,069,436 | | | | 1,009,940 | |
| | | | | | | | | | 4,341,909 | |
Japan | | | | | | | | | | |
| Asahi Group Holdings Ltd. | | | | | 146,100 | | | | 4,793,072 | |
| Casio Computer Co. Ltd. | | | | | 116,300 | | | | 1,820,655 | |
| Chubu Electric Power Co., Inc. | | | | | 5,200 | | | | 68,661 | |
| Citizen Holdings Co. Ltd. | | | | | 5,700 | | | | 45,498 | |
| COMSYS Holdings Corp. | | | | | 363,800 | | | | 4,949,231 | |
| CyberAgent, Inc. | | | | | 76,900 | | | | 3,386,046 | |
| Disco Corp. | | | | | 82,100 | | | | 7,521,466 | |
| Frontier Real Estate Investment Corp. | | | | | 172 | | | | 784,081 | |
| Fuji Electric Co. Ltd. | | | | | 14,000 | | | | 60,564 | |
| Fujitsu General Ltd. | | | | | 200,000 | | | | 1,961,757 | |
| Haseko Corp. | | | | | 807,800 | | | | 6,563,414 | |
| Hitachi Metals Ltd. | | | | | 16,000 | | | | 260,724 | |
| Hoya Corp. | | | | | 59,500 | | | | 2,305,778 | |
| Japan Airport Terminal Co., Ltd. | | | | | 1,300 | | | | 58,578 | |
| Japan Real Estate Investment Corp. | | | | | 276 | | | | 1,340,917 | |
| Kaken Pharmaceutical Co. Ltd. | | | | | 17,000 | | | | 361,737 | |
| Kanamoto Co. Ltd. | | | | | 1,800 | | | | 47,288 | |
| Keihin Corp. | | | | | 87,500 | | | | 1,394,696 | |
| Keyence Corp. | | | | | 32,200 | | | | 15,051,463 | |
| Kissei Pharmaceutical Co. Ltd. | | | | | 8,800 | | | | 263,992 | |
| Kyowa Exeo Corp. | | | | | 58,600 | | | | 618,444 | |
| Kyushu Electric Power Co., Inc. | | | | | 112,300 | | | | 1,083,713 | |
| Makita Corp. | | | | | 7,900 | | | | 350,417 | |
| Mazda Motor Corp. | | | | | 22,600 | | | | 464,214 | |
| Mitsubishi Chemical Holdings Corp. | | | | | 12,700 | | | | 65,822 | |
| Mitsubishi Corp. | | | | | 42,500 | | | | 741,421 | |
| Mitsubishi Gas Chemical Co., Inc. | | | | | 153,000 | | | | 691,767 | |
| Mitsubishi Materials Corp. | | | | | 345,000 | | | | 1,087,910 | |
| Mitsubishi Motors Corp. | | | | | 694,900 | | | | 5,874,827 | |
| Mitsui & Co. Ltd. | | | | | 158,300 | | | | 2,014,328 | |
| Mitsui Mining & Smelting Co. Ltd. | | | | | 94,000 | | | | 196,288 | |
| Murata Manufacturing Co. Ltd. | | | | | 101,300 | | | | 10,935,767 | |
| Nagoya Railroad Co. Ltd. | | | | | 15,000 | | | | 58,928 | |
| NH Foods Ltd. | | | | | 101,000 | | | | 2,496,933 | |
| Nifco, Inc. | | | | | 35,700 | | | | 1,229,758 | |
| Nihon M&A Center, Inc. | | | | | 39,700 | | | | 1,377,838 | |
| Nippo Corp. | | | | | 32,000 | | | | 497,583 | |
| Nippon Paper Industries Co., Ltd. | | | | | 63,400 | | | | 999,759 | |
| Nippon Steel & Sumitomo Metal | | | | | 830,000 | | | | 1,939,953 | |
| Nishimatsu Construction Co., Ltd. | | | | | 11,000 | | | | 44,189 | |
| Nisshin Steel Holdings Co. Ltd. | | | | | 14,800 | | | | 153,200 | |
| NSK Ltd. | | | | | 95,000 | | | | 1,113,266 | |
| Resona Holdings, Inc. | | | | | 917,100 | | | | 4,549,925 | |
| Senshu Ikeda Holdings, Inc. | | | | | 77,300 | | | | 343,246 | |
| Shikoku Electric Power Co., Inc. | | | | | 7,600 | | | | 95,570 | |
| Shinsei Bank Ltd. | | | | | 369,000 | | | | 668,821 | |
| Start Today Co., Ltd. | | | | | 52,800 | | | | 1,067,259 | |
| Sumitomo Dainippon Pharma Co. Ltd. | | | | | 177,700 | | | | 1,868,008 | |
| Sumitomo Metal Mining Co. Ltd. | | | | | 349,000 | | | | 4,987,934 | |
| Sumitomo Mitsui Trust Holdings, Inc. | | | | | 3,804,000 | | | | 13,376,863 | |
| Sumitomo Real Estate Sales Co. Ltd. | | | | | 15,400 | | | | 364,257 | |
| Taiheiyo Cement Corp. | | | | | 231,000 | | | | 677,836 | |
| Takashimaya Co. Ltd. | | | | | 52,000 | | | | 456,097 | |
| Takata Corp. | | | | | 68,700 | | | | 801,265 | |
| Temp Holdings Co., Ltd. | | | | | 19,200 | | | | 649,045 | |
| Tokyo Steel Manufacturing Co., Ltd. | | | | | 33,400 | | | | 250,983 | |
| TS Tech Co., Ltd. | | | | | 29,300 | | | | 738,213 | |
| Zenkoku Hosho Co., Ltd. | | | | | 86,300 | | | | 2,750,181 | |
| | | | | | | | | | 120,721,446 | |
| | | | | Shares | | Value |
Reference Entity — Long |
Netherlands | | | | | | | | | | |
| Arcadis NV | | | | | 56,790 | | | $ | 1,718,766 | |
Norway | | | | | | | | | | |
| Akastor ASA | | | | | 202,663 | | | | 498,267 | |
| Aker Solutions ASA | | | | | 233,605 | | | | 1,140,421 | |
| Norsk Hydro ASA | | | | | 428,024 | | | | 2,515,385 | |
| Seadrill Ltd. | | | | | 76,575 | | | | 818,356 | |
| Statoil ASA | | | | | 374,648 | | | | 6,273,960 | |
| Storebrand ASA | | | | | 832,745 | | | | 2,517,373 | |
| Subsea 7 SA | | | | | 533,048 | | | | 4,534,386 | |
| TGS Nopec Geophysical Co. ASA | | | | | 901 | | | | 20,899 | |
| | | | | | | | | | 18,319,047 | |
Portugal | | | | | | | | | | |
| CTT — Correios de Portugal SA | | | | | 14,759 | | | | 155,290 | |
Singapore | | | | | | | | | | |
| CapitaCommercial Trust | | | | | 1,372,300 | | | | 1,795,514 | |
| ComfortDelGro Corp. Ltd. | | | | | 630,700 | | | | 1,337,402 | |
| Jardine Cycle & Carriage Ltd. | | | | | 1,200 | | | | 37,455 | |
| Noble Group Ltd. | | | | | 6,982,000 | | | | 5,461,634 | |
| Yangzijiang Shipbuilding Holdings Ltd. | | | | | 2,321,000 | | | | 2,121,807 | |
| | | | | | | | | | 10,753,812 | |
Spain | | | | | | | | | | |
| Abengoa SA, B Shares | | | | | 136,137 | | | | 402,226 | |
| Amadeus IT Holding SA, Class A | | | | | 283,042 | | | | 11,351,185 | |
| Banco Popular Espanol SA | | | | | 966,267 | | | | 4,084,412 | |
| Bankinter SA | | | | | 6,482 | | | | 45,034 | |
| CaixaBank SA | | | | | 364,869 | | | | 1,589,276 | |
| Ebro Foods SA | | | | | 28,026 | | | | 476,879 | |
| Ferrovial SA | | | | | 54,648 | | | | 1,084,155 | |
| Gamesa Corp. Tecnologica SA | | | | | 45,689 | | | | 451,715 | |
| Iberdrola SA | | | | | 2,041,708 | | | | 14,092,733 | |
| Mediaset Espana Comunicacion SA | | | | | 55,515 | | | | 675,848 | |
| Sacyr SA | | | | | 126,812 | | | | 468,984 | |
| Telefonica SA | | | | | 1,562,488 | | | | 23,430,139 | |
| | | | | | | | | | 58,152,586 | |
Sweden | | | | | | | | | | |
| Intrum Justitia AB | | | | | 95,101 | | | | 2,530,791 | |
Switzerland | | | | | | | | | | |
| Glencore PLC | | | | | 1,521,563 | | | | 5,673,271 | |
| Kuehne & Nagel International AG, Registered Shares | | | | | 309 | | | | 42,605 | |
| | | | | | | | | | 5,715,876 | |
United Kingdom | | | | | | | | | | |
| Anglo American PLC | | | | | 283,363 | | | | 4,733,187 | |
| Domino’s Pizza Group PLC | | | | | 19,037 | | | | 193,260 | |
| Howden Joinery Group PLC | | | | | 708,735 | | | | 4,522,828 | |
| Inchcape PLC | | | | | 44,567 | | | | 465,543 | |
| International Consolidated Airlines Group SA | | | | | 94,146 | | | | 766,931 | |
| Pace PLC | | | | | 54,771 | | | | 274,874 | |
| Premier Oil PLC | | | | | 506,988 | | | | 1,099,195 | |
| Rio Tinto PLC | | | | | 165,076 | | | | 7,253,931 | |
| Thomas Cook Group PLC | | | | | 217,515 | | | | 417,640 | |
| Vedanta Resources PLC | | | | | 43,247 | | | | 241,664 | |
| | | | | | | | | | 19,969,053 | |
United States | | | | | | | | | | |
| Tahoe Resources, Inc. | | | | | 2,996 | | | | 40,884 | |
Total Reference Entity — Long | | | | | | | | | 430,179,076 | |
See Notes to Financial Statements.
| BLACKROCK FUNDS | JANUARY 31, 2015 | 41
|
| |
| Schedule of Investments (continued) | BlackRock Global Long/Short Equity Fund |
| | | | | Shares | | Value |
Reference Entity — Short |
Australia | | | | | | | | | | |
| ALS Ltd. | | | | | (1,173,368 | ) | | $ | (4,430,537 | ) |
| Ansell, Ltd. | | | | | (150,758 | ) | | | (2,646,210 | ) |
| APA Group | | | | | (475,099 | ) | | | (2,994,911 | ) |
| Bendigo and Adelaide Bank, Ltd. | | | | | (860,928 | ) | | | (8,915,801 | ) |
| Coca-Cola Amatil Ltd. | | | | | (1,450,965 | ) | | | (10,890,739 | ) |
| Cochlear, Ltd. | | | | | (999 | ) | | | (64,209 | ) |
| G8 Education, Ltd. | | | | | (796,790 | ) | | | (2,585,737 | ) |
| Harvey Norman Holdings Ltd. | | | | | (1,493,256 | ) | | | (4,560,822 | ) |
| Healthscope, Ltd. | | | | | (61,525 | ) | | | (128,689 | ) |
| Iluka Resources, Ltd. | | | | | (215,041 | ) | | | (1,167,812 | ) |
| Incitec Pivot, Ltd. | | | | | (3,031,212 | ) | | | (8,454,424 | ) |
| Metcash Ltd. | | | | | (3,444,319 | ) | | | (3,888,230 | ) |
| Oil Search, Ltd. | | | | | (288,421 | ) | | | (1,735,650 | ) |
| Tatts Group, Ltd. | | | | | (2,150,284 | ) | | | (6,435,175 | ) |
| TPG Telecom, Ltd. | | | | | (391,263 | ) | | | (2,023,638 | ) |
| | | | | | | | | | (60,922,584 | ) |
Austria | | | | | | | | | | |
| Verbund AG | | | | | (17,479 | ) | | | (305,929 | ) |
Belgium | | | | | | | | | | |
| Anheuser-Busch InBev NV | | | | | (186,657 | ) | | | (22,765,821 | ) |
Canada | | | | | | | | | | |
| Agrium, Inc. | | | | | (46,395 | ) | | | (4,949,847 | ) |
| Alimentation Couche-Tard, Inc. | | | | | (132,988 | ) | | | (5,210,886 | ) |
| AltaGas, Ltd. | | | | | (55,544 | ) | | | (1,876,965 | ) |
| Bank of Montreal | | | | | (47,648 | ) | | | (2,734,688 | ) |
| Canadian Utilities, Ltd. | | | | | (72,988 | ) | | | (2,419,914 | ) |
| Cineplex, Inc. | | | | | (1,700 | ) | | | (60,457 | ) |
| Concordia Healthcare Corp. | | | | | (991 | ) | | | (42,839 | ) |
| George Weston, Ltd. | | | | | (28,020 | ) | | | (2,220,960 | ) |
| Gildan Activewear, Inc. | | | | | (73,288 | ) | | | (4,278,354 | ) |
| Husky Energy, Inc. | | | | | (7,666 | ) | | | (165,000 | ) |
| Inter Pipeline, Ltd. | | | | | (9,133 | ) | | | (237,471 | ) |
| Manitoba Telecom Services, Inc. | | | | | (204,962 | ) | | | (4,137,306 | ) |
| Mullen Group, Ltd. | | | | | (218,346 | ) | | | (3,503,640 | ) |
| Norbord, Inc. | | | | | (112,347 | ) | | | (2,500,333 | ) |
| Northland Power, Inc. | | | | | (52,065 | ) | | | (700,646 | ) |
| Paramount Resources, Ltd. | | | | | (71,762 | ) | | | (1,610,085 | ) |
| Pembina Pipeline Corp. | | | | | (33,306 | ) | | | (1,034,800 | ) |
| Saputo, Inc. | | | | | (63,757 | ) | | | (1,833,384 | ) |
| | | | | | | | | | (39,517,575 | ) |
Finland | | | | | | | | | | |
| Nokia OYJ | | | | | (37,753 | ) | | | (290,341 | ) |
| Outokumpu OYJ | | | | | (22,745 | ) | | | (123,420 | ) |
| | | | | | | | | | (413,761 | ) |
France | | | | | | | | | | |
| Air Liquide SA | | | | | (10,607 | ) | | | (1,337,208 | ) |
| Bollore SA | | | | | (100 | ) | | | (430 | ) |
| Cie de Saint-Gobain | | | | | (7,709 | ) | | | (328,409 | ) |
| Dassault Systemes | | | | | (1,424 | ) | | | (87,997 | ) |
| Kering | | | | | (37,320 | ) | | | (7,529,805 | ) |
| Orpea | | | | | (720 | ) | | | (46,937 | ) |
| Peugeot SA | | | | | (3,354 | ) | | | (8,554 | ) |
| Remy Cointreau SA | | | | | (36,894 | ) | | | (2,730,643 | ) |
| Rubis SCA | | | | | (14,759 | ) | | | (855,946 | ) |
| Total SA | | | | | (1,868 | ) | | | (96,043 | ) |
| | | | | | | | | | (13,021,972 | ) |
Germany | | | | | | | | | | |
| Leoni AG | | | | | (21,980 | ) | | | (1,371,242 | ) |
| Rheinmetall AG | | | | | (17,561 | ) | | | (759,926 | ) |
| | | | | | | | | | (2,131,168 | ) |
| | | | | Shares | | Value |
Reference Entity — Short |
Hong Kong | | | | | | | | | | |
| Chow Tai Fook Jewellery Group, Ltd. | | | | | (22,600 | ) | | $ | (29,963 | ) |
| Esprit Holdings Ltd. | | | | | (27,500 | ) | | | (30,949 | ) |
| Hong Kong & China Gas Co., Ltd. | | | | | (187,000 | ) | | | (428,223 | ) |
| Melco International Development, Ltd. | | | | | (1,252,000 | ) | | | (2,492,825 | ) |
| Sun Hung Kai Properties, Ltd. | | | | | (35,000 | ) | | | (569,531 | ) |
| Swire Pacific, Ltd. | | | | | (4,000 | ) | | | (53,566 | ) |
| WH Group, Ltd. | | | | | (379,500 | ) | | | (215,394 | ) |
| | | | | | | | | | (3,820,451 | ) |
Italy | | | | | | | | | | |
| Saipem SpA | | | | | (17,471 | ) | | | (158,530 | ) |
| Yoox SpA | | | | | (81,184 | ) | | | (1,756,610 | ) |
| | | | | | | | | | (1,915,140 | ) |
Japan | | | | | | | | | | |
| Acom Co., Ltd. | | | | | (552,200 | ) | | | (1,502,222 | ) |
| Aeon Co. Ltd. | | | | | (22,000 | ) | | | (232,367 | ) |
| AEON Financial Service Co., Ltd. | | | | | (45,300 | ) | | | (814,052 | ) |
| Asahi Glass Co., Ltd. | | | | | (328,000 | ) | | | (1,744,955 | ) |
| Asics Corp. | | | | | (2,600 | ) | | | (63,802 | ) |
| Coca-Cola East Japan Co. Ltd. | | | | | (33,900 | ) | | | (564,434 | ) |
| Coca-Cola West Co., Ltd. | | | | | (20,400 | ) | | | (291,787 | ) |
| Cosmos Pharmaceutical Corp. | | | | | (3,000 | ) | | | (483,401 | ) |
| Daihatsu Motor Co. Ltd. | | | | | (37,400 | ) | | | (521,523 | ) |
| Daikin Industries, Ltd. | | | | | (5,100 | ) | | | (354,888 | ) |
| Dena Co., Ltd. | | | | | (205,600 | ) | | | (2,703,582 | ) |
| Don Quijote Holdings Co., Ltd. | | | | | (1,500 | ) | | | (109,211 | ) |
| Eisai Co., Ltd. | | | | | (351,000 | ) | | | (17,500,270 | ) |
| Hokuriku Electric Power Co. | | | | | (45,500 | ) | | | (643,012 | ) |
| House Foods Group, Inc. | | | | | (8,100 | ) | | | (162,052 | ) |
| Ibiden Co., Ltd. | | | | | (30,400 | ) | | | (457,014 | ) |
| IHI Corp. | | | | | (739,000 | ) | | | (3,850,241 | ) |
| IT Holdings Corp. | | | | | (12,800 | ) | | | (212,613 | ) |
| Iwatani Corp. | | | | | (28,000 | ) | | | (180,765 | ) |
| Japan Exchange Group, Inc. | | | | | (32,200 | ) | | | (749,309 | ) |
| Japan Retail Fund Investment Corp. | | | | | (600 | ) | | | (1,299,658 | ) |
| The Japan Steel Works, Ltd. | | | | | (78,000 | ) | | | (312,015 | ) |
| Kagome Co., Ltd. | | | | | (39,700 | ) | | | (628,705 | ) |
| Kajima Corp. | | | | | (79,000 | ) | | | (312,565 | ) |
| Kansai Paint Co., Ltd. | | | | | (21,000 | ) | | | (367,044 | ) |
| Kao Corp. | | | | | (14,200 | ) | | | (622,642 | ) |
| Keisei Electric Railway Co., Ltd. | | | | | (25,000 | ) | | | (322,051 | ) |
| Kenedix Office Investment Corp. | | | | | (154 | ) | | | (914,528 | ) |
| Kirin Holdings Co., Ltd. | | | | | (102,900 | ) | | | (1,385,467 | ) |
| Konami Corp. | | | | | (2,700 | ) | | | (50,378 | ) |
| Kubota Corp. | | | | | (6,000 | ) | | | (89,072 | ) |
| Kurita Water Industries Ltd. | | | | | (11,200 | ) | | | (238,599 | ) |
| Kyocera Corp. | | | | | (127,400 | ) | | | (5,607,467 | ) |
| Kyowa Hakko Kirin Co., Ltd. | | | | | (15,000 | ) | | | (170,813 | ) |
| McDonald’s Holdings Co. Japan Ltd. | | | | | (92,200 | ) | | | (2,022,326 | ) |
| Mitsui Engineering & Shipbuilding Co. Ltd. | | | | | (618,000 | ) | | | (1,004,743 | ) |
| Nabtesco Corp. | | | | | (1,800 | ) | | | (46,470 | ) |
| NGK Insulators, Ltd. | | | | | (121,000 | ) | | | (2,438,300 | ) |
| NHK Spring Co., Ltd. | | | | | (31,800 | ) | | | (286,830 | ) |
| Nikon Corp. | | | | | (5,500 | ) | | | (69,786 | ) |
| Nippon Electric Glass Co. Ltd. | | | | | (181,000 | ) | | | (934,147 | ) |
| Nippon Paint Co., Ltd. | | | | | (110,300 | ) | | | (3,455,173 | ) |
| Nippon Shinyaku Co., Ltd. | | | | | (5,000 | ) | | | (165,171 | ) |
| The Nishi-Nippon City Bank, Ltd. | | | | | (69,000 | ) | | | (224,068 | ) |
| Nomura Real Estate Office Fund, Inc. | | | | | (315 | ) | | | (1,609,680 | ) |
| Ono Pharmaceutical Co., Ltd. | | | | | (11,700 | ) | | | (1,231,356 | ) |
| Onward Holdings Co. Ltd. | | | | | (62,000 | ) | | | (399,829 | ) |
| Orix JREIT, Inc. | | | | | (447 | ) | | | (669,830 | ) |
| Osaka Gas Co., Ltd. | | | | | (67,000 | ) | | | (264,090 | ) |
| Pigeon Corp. | | | | | (3,300 | ) | | | (206,047 | ) |
| Pola Orbis Holdings, Inc. | | | | | (8,700 | ) | | | (370,484 | ) |
See Notes to Financial Statements.
| 42 | BLACKROCK FUNDS | JANUARY 31, 2015
|
| |
| Schedule of Investments (continued) | BlackRock Global Long/Short Equity Fund |
| | | | | Shares | | Value |
Reference Entity — Short |
Japan (concluded) | | | | | | | | | | |
| Rakuten, Inc. | | | | | (8,000 | ) | | $ | (110,754 | ) |
| Rengo Co., Ltd. | | | | | (70,000 | ) | | | (294,109 | ) |
| Sankyo Co., Ltd. | | | | | (3,100 | ) | | | (111,414 | ) |
| Santen Pharmaceutical Co., Ltd. | | | | | (7,000 | ) | | | (436,832 | ) |
| Sega Sammy Holdings, Inc. | | | | | (9,400 | ) | | | (122,409 | ) |
| Sekisui House, Ltd. | | | | | (6,100 | ) | | | (78,882 | ) |
| Shimadzu Corp. | | | | | (111,000 | ) | | | (1,153,272 | ) |
| Shimamura Co. Ltd. | | | | | (1,700 | ) | | | (151,217 | ) |
| Shimizu Corp. | | | | | (84,000 | ) | | | (579,570 | ) |
| Showa Shell Sekiyu KK | | | | | (13,700 | ) | | | (133,706 | ) |
| Sohgo Security Services Co., Ltd. | | | | | (10,700 | ) | | | (273,860 | ) |
| Sony Corp. | | | | | (172,400 | ) | | | (4,055,034 | ) |
| Sumco Corp. | | | | | (249,400 | ) | | | (4,185,634 | ) |
| Sumitomo Forestry Co., Ltd. | | | | | (14,700 | ) | | | (136,724 | ) |
| Taiyo Nippon Sanso Corp. | | | | | (5,000 | ) | | | (59,904 | ) |
| Teijin Ltd. | | | | | (73,000 | ) | | | (217,456 | ) |
| Terumo Corp. | | | | | (6,100 | ) | | | (151,274 | ) |
| Tokyo Gas Co., Ltd. | | | | | (244,000 | ) | | | (1,455,488 | ) |
| Toyo Tire & Rubber Co., Ltd. | | | | | (42,600 | ) | | | (959,505 | ) |
| Toyota Tsusho Corp. | | | | | (77,900 | ) | | | (1,844,869 | ) |
| Tsumura & Co. | | | | | (9,400 | ) | | | (213,906 | ) |
| Ushio, Inc. | | | | | (4,800 | ) | | | (55,609 | ) |
| Yamada Denki Co. Ltd. | | | | | (750,100 | ) | | | (2,786,720 | ) |
| Yamazaki Baking Co., Ltd. | | | | | (21,000 | ) | | | (309,183 | ) |
| | | | | | | | | | (80,738,165 | ) |
Luxembourg | | | | | | | | | | |
| APERAM | | | | | (276,068 | ) | | | (7,166,603 | ) |
| Millicom International Cellular SA | | | | | (9,421 | ) | | | (600,782 | ) |
| | | | | | | | | | (7,767,385 | ) |
Macau | | | | | | | | | | |
| Wynn Macau, Ltd. | | | | | (72,800 | ) | | | (201,594 | ) |
Netherlands | | | | | | | | | | |
| Akzo Nobel NV | | | | | (8,213 | ) | | | (591,675 | ) |
| OCI | | | | | (216,598 | ) | | | (7,626,154 | ) |
| Randstad Holding NV | | | | | (1,957 | ) | | | (102,868 | ) |
| SBM Offshore NV | | | | | (210,291 | ) | | | (2,294,350 | ) |
| TomTom NV | | | | | (25,197 | ) | | | (165,570 | ) |
| | | | | | | | | | (10,780,617 | ) |
Norway | | | | | | | | | | |
| Opera Software ASA | | | | | (35,215 | ) | | | (466,505 | ) |
Portugal | | | | | | | | | | |
| Jeronimo Martins SGPS SA | | | | | (498,622 | ) | | | (5,363,359 | ) |
Singapore | | | | | | | | | | |
| Genting Singapore PLC | | | | | (1,878,000 | ) | | | (1,497,356 | ) |
| Golden Agri-Resources Ltd. | | | | | (6,510,000 | ) | | | (2,019,423 | ) |
| Singapore Press Holdings, Ltd. | | | | | (31,200 | ) | | | (95,148 | ) |
| Suntec Real Estate Investment Trust | | | | | (3,202,600 | ) | | | (4,443,061 | ) |
| | | | | | | | | | (8,054,988 | ) |
| | | | | Shares | | Value |
Reference Entity — Short |
Sweden | | | | | | | | | | |
| Assa Abloy AB | | | | | (76,307 | ) | | $ | (4,167,425 | ) |
| Elekta AB, -B Shares | | | | | (439,428 | ) | | | (4,716,010 | ) |
| Getinge AB, -B Shares | | | | | (19,833 | ) | | | (488,834 | ) |
| Hexagon AB, -B Shares | | | | | (29,097 | ) | | | (921,298 | ) |
| ICA Gruppen AB | | | | | (4,473 | ) | | | (171,859 | ) |
| SKF AB, -B Shares | | | | | (37,222 | ) | | | (877,392 | ) |
| | | | | | | | | | (11,342,818 | ) |
Switzerland | | | | | | | | | | |
| Barry Callebaut AG | | | | | (60 | ) | | | (59,827 | ) |
| Dufry AG | | | | | (63,791 | ) | | | (9,371,042 | ) |
| Holcim Ltd. | | | | | (38,619 | ) | | | (2,699,966 | ) |
| SGS SA | | | | | (1,561 | ) | | | (2,961,051 | ) |
| STMicroelectronics NV | | | | | (260,052 | ) | | | (2,159,306 | ) |
| Sulzer AG | | | | | (5,382 | ) | | | (569,847 | ) |
| The Swatch Group AG | | | | | (321 | ) | | | (128,267 | ) |
| | | | | | | | | | (17,949,306 | ) |
United Kingdom | | | | | | | | | | |
| Aggreko PLC | | | | | (177,726 | ) | | | (4,144,931 | ) |
| Associated British Foods PLC | | | | | (5,405 | ) | | | (252,074 | ) |
| AVEVA Group PLC | | | | | (38,856 | ) | | | (768,433 | ) |
| Carnival PLC | | | | | (94,280 | ) | | | (4,221,023 | ) |
| Centrica PLC | | | | | (1,516,301 | ) | | | (6,691,476 | ) |
| CNH Industrial NV | | | | | (127,366 | ) | | | (969,608 | ) |
| Drax Group PLC | | | | | (37,100 | ) | | | (201,303 | ) |
| easyJet PLC | | | | | (109,230 | ) | | | (3,045,647 | ) |
| Greene King PLC | | | | | (137,677 | ) | | | (1,739,506 | ) |
| Hargreaves Lansdown PLC | | | | | (323,950 | ) | | | (4,910,635 | ) |
| ICAP PLC | | | | | (20,518 | ) | | | (144,078 | ) |
| Michael Page International PLC | | | | | (108,468 | ) | | | (759,005 | ) |
| Mitie Group PLC | | | | | (42,605 | ) | | | (173,066 | ) |
| Ocado Group PLC | | | | | (1,286,721 | ) | | | (7,930,166 | ) |
| Serco Group PLC | | | | | (61,225 | ) | | | (142,383 | ) |
| Sports Direct International PLC | | | | | (352,572 | ) | | | (3,760,150 | ) |
| Standard Life PLC | | | | | (185,632 | ) | | | (1,121,559 | ) |
| Telecity Group PLC | | | | | (209,520 | ) | | | (2,714,390 | ) |
| Tesco PLC | | | | | (5,715,745 | ) | | | (19,328,719 | ) |
| Unilever NV | | | | | (191,979 | ) | | | (8,325,098 | ) |
| Vodafone Group PLC | | | | | (2,813,258 | ) | | | (9,892,759 | ) |
| Whitbread PLC | | | | | (65,943 | ) | | | (4,949,736 | ) |
| | | | | | | | | | (86,185,745 | ) |
United States | | | | | | | | | | |
| Samsonite International SA | | | | | (74,400 | ) | | | (225,795 | ) |
Total Reference Entity — Short | | | | | | | | | (373,890,678 | ) |
Net Value of Reference Entity — UBS AG | | | | | | | | $ | 56,288,398 | |
See Notes to Financial Statements.
| BLACKROCK FUNDS | JANUARY 31, 2015 | 43
|
| |
| Schedule of Investments (concluded) | BlackRock Global Long/Short Equity Fund |
| • | | | | Fair Value Measurements — Various inputs are used in determining the fair value of investments and derivative financial instruments. These inputs to valuation techniques are categorized into a disclosure hierarchy consisting of three broad levels for financial statement purposes. The hierarchy gives the highest priority to unadjusted quoted prices in active markets for identical assets or liabilities (Level 1 measurements) and the lowest priority to unobservable inputs (Level 3 measurements). Accordingly, the degree of judgment exercised in determining fair value is greatest for instruments categorized in Level 3. The inputs used to measure fair value may fall into different levels of the fair value hierarchy. In such cases, for disclosure purposes, the fair value hierarchy classification is determined based on the lowest level input that is significant to the fair value measurement in its entirety. The categorization of a value determined for investments and derivative financial instruments is based on the pricing transparency of the investment and derivative financial instrument and is not necessarily an indication of the risks associated with investing in those securities. The three levels of the fair value hierarchy are as follows: |
| | • | | | | Level 1 — unadjusted quoted prices in active markets/exchanges for identical assets or liabilities that the Fund has the ability to access |
| | • | | | | Level 2 — other observable inputs (including, but not limited to, quoted prices for similar assets or liabilities in markets that are active, quoted prices for identical or similar assets or liabilities in markets that are not active, inputs other than quoted prices that are observable for the assets or liabilities (such as interest rates, yield curves, volatilities, prepayment speeds, loss severities, credit risks and default rates) or other market-corroborated inputs) |
| | • | | | | Level 3 — unobservable inputs based on the best information available in the circumstances, to the extent observable inputs are not available (including the Fund’s own assumptions used in determining the fair value of investments and derivative financial instruments) |
| | | | | Changes in valuation techniques may result in transfers into or out of an assigned level within the disclosure hierarchy. In accordance with the Fund’s policy, transfers between different levels of the fair value disclosure hierarchy are deemed to have occurred as of the beginning of the reporting period. For information about the Fund’s policy regarding valuation of investments and derivative financial instruments, refer to Note 2 of the Notes to Financial Statements. |
| | | | | As of January 31, 2015, the following table summarizes the Fund’s investments and derivative financial instruments categorized in the disclosure hierarchy: |
| | Level 1 | | Level 2 | | Level 3 | | Total |
Assets:
| | | | | | | | | | | | | | | |
Investments:
| | | | | | | | | | | | | | | |
Long-Term Investments:
| | | | | | | | | | | | | | | |
| Common Stocks | | — | | | $ | 1,753,122 | | | | — | | | $ | 1,753,122 | |
| Preferred Securities | | — | | | | — | | | $ | 5,458,474 | | | | 5,458,474 | |
| Short-Term Securities | $ | 1,684,084,362 | | | | — | | | | — | | | | 1,684,084,362 | |
Total
| $ | 1,684,084,362 | | | $ | 1,753,122 | | | $ | 5,458,474 | | | $ | 1,691,295,958 | |
| | | | | | | | |
| | Level 1 | | Level 2 | | Level 3 | | Total |
Derivative Financial Instruments1
| | | | | | | | | | | | | | | |
Assets:
| | | | | | | | | | | | | | | |
| Equity Contracts | | — | | | $ | 39,148,747 | | | | — | | | $ | 39,148,747 | |
| 1 | | Derivative financial instruments are swaps, which are valued at the unrealized appreciation/depreciation on the instrument. |
| | | | | The Fund may hold assets and/or liabilities in which the fair value approximates the carrying amount for financial statement purposes. As of January 31, 2015, such assets and/or liabilities are categorized within the disclosure hierarchy as follows: |
| | Level 1 | | Level 2 | | Level 3 | | Total |
Assets:
| | | | | | | | | | | | | | | |
| Cash pledged as collateral for financial futures contracts | $ | 27,397 | | | | — | | | | — | | | $ | 27,397 | |
| Cash pledged as collateral for OTC derivatives | | — | | | $ | 10,043,245 | | | | — | | | | 10,043,245 | |
Liabilities:
| | | | | | | | | | | | | | | |
| Cash received as collateral for OTC swaps | | — | | | | (28,227,615 | ) | | | — | | | | (28,227,615 | ) |
Total
| $ | 27,397 | | | $ | (18,184,370 | ) | | | — | | | $ | (18,156,973 | ) |
Total | $ | 1,684,084,362 | | | $ | 1,753,122 | | | $ | 5,458,474 | | | $ | 1,691,295,958 | |
| | | | | During the six months ended January 31, 2015, there were no transfers between levels. |
See Notes to Financial Statements.
| 44 | BLACKROCK FUNDS | JANUARY 31, 2015
|
| |
| Statements of Assets and Liabilities |
|
| January 31, 2015 (Unaudited) | | | | BlackRock
Emerging
Markets
Long/Short
Equity Fund | | BlackRock
Global
Long/Short
Equity Fund |
| |
Assets |
Investments at value — affiliated1 | | | | $ | 506,787,730 | | | $ | 1,684,084,362 | |
Investments at value — unaffiliated2 | | | | | — | | | | 7,211,596 | |
Cash pledged as collateral for OTC derivatives | | | | | — | | | | 10,043,245 | |
Cash pledged as collateral for financial futures contracts | | | | | — | | | | 27,397 | |
Unrealized appreciation on OTC swaps | | | | | 10,913,772 | | | | 40,774,757 | |
Capital shares sold receivable | | | | | 3,007,531 | | | | 13,299,578 | |
Swap receivable | | | | | — | | | | 971,120 | |
Prepaid expenses | | | | | 54,684 | | | | 233,436 | |
Total assets | | | | | 520,763,717 | | | | 1,756,645,491 | |
| |
Liabilities |
Cash received as collateral for OTC swaps | | | | | 11,485,093 | | | | 28,227,615 | |
Capital shares redeemed payable | | | | | 2,559,512 | | | | 17,504,472 | |
Investment advisory fees payable | | | | | 622,689 | | | | 2,037,231 | |
Swap payable | | | | | 1,536,978 | | | | — | |
Unrealized depreciation on OTC derivatives | | | | | — | | | | 1,626,010 | |
Administration fees payable | | | | | 27,195 | | | | 87,096 | |
Service and distribution fees payable | | | | | 18,046 | | | | 143,622 | |
Recoupment payable | | | | | 2,092 | | | | 45,163 | |
Other accrued expenses payable | | | | | 411,013 | | | | 324,368 | |
Total liabilities | | | | | 16,662,618 | | | | 49,995,577 | |
Net Assets | | | | $ | 504,101,099 | | | $ | 1,706,649,914 | |
| |
Net Assets Consist of |
Paid-in capital | | | | $ | 508,372,901 | | | $ | 1,680,281,388 | |
Accumulated net investment loss | | | | | (10,557,262 | ) | | | (23,922,752 | ) |
Accumulated net realized gain (loss) | | | | | (4,628,312 | ) | | | 9,915,392 | |
Net unrealized appreciation/depreciation | | | | | 10,913,772 | | | | 40,375,886 | |
Net Assets | | | | $ | 504,101,099 | | | $ | 1,706,649,914 | |
| |
Net Asset Value |
Institutional: | | | | | | | | | | |
Net assets | | | | $ | 461,619,199 | | | $ | 1,355,832,614 | |
Shares outstanding3 | | | | | 44,708,888 | | | | 114,231,832 | |
Net asset value | | | | $ | 10.32 | | | $ | 11.87 | |
Investor A: | | | | | | | | | | |
Net assets | | | | $ | 29,954,727 | | | $ | 244,279,149 | |
Shares outstanding3 | | | | | 2,919,632 | | | | 20,686,618 | |
Net asset value | | | | $ | 10.26 | | | $ | 11.81 | |
Investor C: | | | | | | | | | | |
Net assets | | | | $ | 12,527,173 | | | $ | 106,538,151 | |
Shares outstanding3 | | | | | 1,246,857 | | | | 9,151,868 | |
Net asset value | | | | $ | 10.05 | | | $ | 11.64 | |
1 Investments at cost — affiliated | | | | $ | 506,787,730 | | | $ | 1,684,084,362 | |
2 Investments at cost — unaffiliated | | | | | — | | | $ | 5,972,355 | |
3 Unlimited number of shares authorized, $0.001 par value. | | | | | | | | | | |
See Notes to Financial Statements.
| BLACKROCK FUNDS | JANUARY 31, 2015 | 45
|
| Six Months Ended January 31, 2015 (Unaudited) | | | | BlackRock
Emerging
Markets
Long/Short
Equity Fund | | BlackRock
Global
Long/Short
Equity Fund |
| |
Investment Income |
Dividends — affiliated | | | | $ | 143,783 | | | $ | 419,111 | |
| |
Expenses |
Investment advisory | | | | | 4,194,298 | | | | 11,693,278 | |
Administration | | | | | 192,885 | | | | 478,947 | |
Service — Investor A | | | | | 47,971 | | | | 304,967 | |
Service and distribution — Investor C | | | | | 74,191 | | | | 538,863 | |
Transfer agent — Institutional | | | | | 498,879 | | | | 335,854 | |
Transfer agent — Investor A | | | | | 34,127 | | | | 98,319 | |
Transfer agent — Investor C | | | | | 9,924 | | | | 41,605 | |
Administration — Institutional | | | | | 60,676 | | | | 111,307 | |
Administration — Investor A | | | | | 4,685 | | | | 29,610 | |
Administration — Investor C | | | | | 1,795 | | | | 13,038 | |
Professional | | | | | 48,133 | | | | 41,405 | |
Registration | | | | | 42,957 | | | | 217,955 | |
Accounting services | | | | | 12,090 | | | | 32,612 | |
Printing | | | | | 18,303 | | | | 19,603 | |
Officer and Trustees | | | | | 8,482 | | | | 19,314 | |
Custodian | | | | | 4,054 | | | | 14,061 | |
Miscellaneous | | | | | 49,951 | | | | 38,227 | |
Recoupment of past waived fees | | | | | — | | | | 5,855 | |
Recoupment of past waived fees — class specific | | | | | 2,092 | | | | 39,309 | |
Total expenses | | | | | 5,305,493 | | | | 14,074,129 | |
Less fees waived by Manager | | | | | (192,423 | ) | | | (541,873 | ) |
Less administration fees waived — Institutional | | | | | (53,797 | ) | | | — | |
Less administration fees waived — Investor A | | | | | (2,974 | ) | | | (1,006 | ) |
Less administration fees waived — Investor C | | | | | (72 | ) | | | (347 | ) |
Less transfer agent fees waived and/or reimbursed — Institutional | | | | | (39,889 | ) | | | — | |
Less transfer agent fees waived and/or reimbursed — Investor A | | | | | (966 | ) | | | (3,431 | ) |
Less transfer agent fees waived and/or reimbursed — Investor C | | | | | (2 | ) | | | (35 | ) |
Total expenses after fees waived and/or reimbursed | | | | | 5,015,370 | | | | 13,527,437 | |
Net investment loss | | | | | (4,871,587 | ) | | | (13,108,326 | ) |
| |
Realized and Unrealized Gain (Loss) |
Net realized gain (loss) from: | | | | | | | | | | |
Futures | | | | | — | | | | 1,666,868 | |
Swaps | | | | | 28,815,594 | | | | 32,708,450 | |
Foreign currency transactions | | | | | — | | | | (291,940 | ) |
| | | | | 28,815,594 | | | | 34,083,378 | |
Net change in unrealized appreciation/depreciation on: | | | | | | | | | | |
Futures | | | | | — | | | | 325,958 | |
Investments | | | | | — | | | | 1,239,241 | |
Swaps | | | | | (24,283,961 | ) | | | 9,241,655 | |
Foreign currency translations | | | | | — | | | | (5,235 | ) |
| | | | | (24,283,961 | ) | | | 10,801,619 | |
Total realized and unrealized gain | | | | | 4,531,633 | | | | 44,884,997 | |
Net Increase (Decrease) in Net Assets Resulting from Operations | | | | $ | (339,954 | ) | | $ | 31,776,671 | |
See Notes to Financial Statements.
| 46 | BLACKROCK FUNDS | JANUARY 31, 2015
|
| |
| Statements of Changes in Net Assets |
|
| | | | BlackRock Emerging Markets
Long/Short Equity Fund
| | | | BlackRock Global
Long/Short Equity Fund
|
| Increase (Decrease) in Net Assets: | | | | Six Months Ended
January 31,
2015
(Unaudited) | | Year Ended
July 31,
2014 | | | | Six Months Ended
January 31,
2015
(Unaudited) | | Year Ended
July 31,
2014 |
| |
Operations |
Net investment loss | | | | $ | (4,871,587 | ) | | $ | (11,209,040 | ) | | | | | | $ | (13,108,326 | ) | | $ | (12,719,452 | ) |
Net realized gain (loss) | | | | | 28,815,594 | | | | (12,363,207 | ) | | | | | | | 34,083,378 | | | | (17,573,067 | ) |
Net change in unrealized appreciation/depreciation | | | | | (24,283,961 | ) | | | 372,947 | | | | | | | | 10,801,619 | | | | 27,533,471 | |
Net increase (decrease) in net assets resulting from operations | | | | | (339,954 | ) | | | (23,199,300 | ) | | | | | | | 31,776,671 | | | | (2,759,048 | ) |
| |
Distributions to Shareholders From1 |
Net realized gain: | | | | | | | | | | | | | | | | | | | | | | |
Institutional | | | | | — | | | | (2,508,489 | ) | | | | | | | (1,390,162 | ) | | | (2,871,413 | ) |
Investor A | | | | | — | | | | (821,490 | ) | | | | | | | (265,166 | ) | | | (1,430,461 | ) |
Investor C | | | | | — | | | | (57,381 | ) | | | | | | | (120,722 | ) | | | (398,135 | ) |
Decrease in net assets resulting from distributions to shareholders | | | | | — | | | | (3,387,360 | ) | | | | | | | (1,776,050 | ) | | | (4,700,009 | ) |
| |
Capital Share Transactions |
Net increase (decrease) in net assets derived from capital share transactions | | | | | (85,755,110 | ) | | | (4,439,808 | ) | | | | | | | 276,017,632 | | | | 1,324,792,573 | |
| |
Net Assets |
Total increase (decrease) in net assets | | | | | (86,095,064 | ) | | | (31,026,468 | ) | | | | | | | 306,018,253 | | | | 1,317,333,516 | |
Beginning of period | | | | | 590,196,163 | | | | 621,222,631 | | | | | | | | 1,400,631,661 | | | | 83,298,145 | |
End of period | | | | $ | 504,101,099 | | | $ | 590,196,163 | | | | | | | $ | 1,706,649,914 | | | $ | 1,400,631,661 | |
Accumulated net investment loss, end of period | | | | $ | (10,557,262 | ) | | $ | (5,685,675 | ) | | | | | | $ | (23,922,752 | ) | | $ | (10,814,426 | ) |
| 1 | | Distributions for annual periods are determined in accordance with federal income tax regulations. |
See Notes to Financial Statements.
| BLACKROCK FUNDS | JANUARY 31, 2015 | 47
|
| |
| Financial Highlights | BlackRock Emerging Markets Long/Short Equity Fund
|
| | | | Institutional
|
| | | | | | Year Ended July 31,
| |
| | | | Six Months
Ended
January 31,
2015
(Unaudited) | | 2014 | | 2013 | | Period
October 6,
20111
to July 31,
2012 |
| |
Per Share Operating Performance |
Net asset value, beginning of period | | | | $ | 10.34 | | | $ | 10.73 | | | $ | 10.73 | | | $ | 10.00 | |
Net investment loss2 | | | | | (0.09 | ) | | | (0.18 | ) | | | (0.17 | ) | | | (0.14 | ) |
Net realized and unrealized gain (loss) | | | | | 0.07 | | | | (0.15 | ) | | | 0.21 | | | | 0.89 | |
Net increase (decrease) from investment operations | | | | | (0.02 | ) | | | (0.33 | ) | | | 0.04 | | | | 0.75 | |
Distributions from:3 | | | | | | | | | | | | | | | | | | |
Net investment income | | | | | — | | | | — | | | | — | | | | (0.02 | ) |
Net realized gain | | | | | — | | | | (0.06 | ) | | | (0.04 | ) | | | — | |
Total distributions | | | | | — | | | | (0.06 | ) | | | (0.04 | ) | | | (0.02 | ) |
Net asset value, end of period | | | | $ | 10.32 | | | $ | 10.34 | | | $ | 10.73 | | | $ | 10.73 | |
| |
Total Return4 |
Based on net asset value | | | | | (0.19)% | 5 | | | (3.09)% | | | | 0.33% | | | | 7.47% | 5 |
| |
Ratios to Average Net Assets |
Total expenses6 | | | | | 1.86% | 7 | | | 1.85% | | | | 1.84% | | | | 2.13% | 7,8 |
Total expenses excluding recoupment of past fees waived6 | | | | | 1.86% | 7 | | | 1.84% | | | | 1.81% | | | | 2.13% | 7 |
Total expenses after fees waived and/or reimbursed6 | | | | | 1.75% | 7 | | | 1.75% | | | | 1.71% | | | | 1.75% | 7 |
Net investment loss6 | | | | | (1.70)% | 7 | | | (1.72)% | | | | (1.61)% | | | | (1.61)% | 7 |
| |
Supplemental Data |
Net assets, end of period (000) | | | | $ | 461,619 | | | $ | 509,665 | | | $ | 433,886 | | | $ | 126,707 | |
| 1 | | Commencement of operations. |
| 2 | | Based on average shares outstanding. |
| 3 | | Distributions for annual periods are determined in accordance with federal income tax regulations. |
| 4 | | Where applicable, assumes the reinvestment of distributions. |
| 6 | | Ratios do not include expenses incurred indirectly as a result of investments in underlying funds of approximately 0.18%. |
| 8 | | Organization costs were not annualized in the calculation of the expense ratios. If these expenses were annualized, the total expenses would have been 2.15%. |
See Notes to Financial Statements.
| 48 | BLACKROCK FUNDS | JANUARY 31, 2015
|
| |
| Financial Highlights (continued) | BlackRock Emerging Markets Long/Short Equity Fund
|
| | | | Investor A
|
| | | | | | Year Ended July 31,
| |
| | | | Six Months
Ended
January 31,
2015
(Unaudited) | | 2014 | | 2013 | | Period
October 6,
20111
to July 31,
2012 |
| |
Per Share Operating Performance |
Net asset value, beginning of period | | | | $ | 10.29 | | | $ | 10.69 | | | $ | 10.71 | | | $ | 10.00 | |
Net investment loss2 | | | | | (0.10 | ) | | | (0.20 | ) | | | (0.20 | ) | | | (0.16 | ) |
Net realized and unrealized gain (loss) | | | | | 0.07 | | | | (0.15 | ) | | | 0.21 | | | | 0.88 | |
Net increase (decrease) from investment operations | | | | | (0.03 | ) | | | (0.35 | ) | | | 0.01 | | | | 0.72 | |
Distributions from:3 | | | | | | | | | | | | | | | | | | |
Net investment income | | | | | — | | | | — | | | | — | | | | (0.01 | ) |
Net realized gain | | | | | — | | | | (0.05 | ) | | | (0.03 | ) | | | — | |
Total distributions | | | | | — | | | | (0.05 | ) | | | (0.03 | ) | | | (0.01 | ) |
Net asset value, end of period | | | | $ | 10.26 | | | $ | 10.29 | | | $ | 10.69 | | | $ | 10.71 | |
| |
Total Return4 |
Based on net asset value | | | | | (0.29)% | 5 | | | (3.27)% | | | | 0.12% | | | | 7.24% | 5 |
| |
Ratios to Average Net Assets |
Total expenses6 | | | | | 2.09% | 7 | | | 2.01% | | | | 2.03% | | | | 2.19% | 7,8 |
Total expenses excluding recoupment of past fees waived6 | | | | | 2.09% | 7 | | | 2.00% | | | | 2.01% | | | | 2.19% | 7 |
Total expenses after fees waived and/or reimbursed6 | | | | | 2.00% | 7 | | | 1.94% | | | | 1.95% | | | | 2.00% | 7 |
Net investment loss6 | | | | | (1.95)% | 7 | | | (1.91)% | | | | (1.85)% | | | | (1.85)% | 7 |
| |
Supplemental Data |
Net assets, end of period (000) | | | | $ | 29,955 | | | $ | 64,400 | | | $ | 166,701 | | | $ | 57,655 | |
| 1 | | Commencement of operations. |
| 2 | | Based on average shares outstanding. |
| 3 | | Distributions for annual periods are determined in accordance with federal income tax regulations. |
| 4 | | Where applicable, excludes the effects of any sales charges and assumes the reinvestment of distributions. |
| 6 | | Ratios do not include expenses incurred indirectly as a result of investments in underlying funds of approximately 0.18%. |
| 8 | | Organization costs were not annualized in the calculation of the expense ratios. If these expenses were annualized, the total expenses would have been 2.20%. |
See Notes to Financial Statements.
| BLACKROCK FUNDS | JANUARY 31, 2015 | 49
|
| |
| Financial Highlights (concluded) | BlackRock Emerging Markets Long/Short Equity Fund
|
| | | | Investor C
|
| | | | | | Year Ended July 31,
| |
| | | | Six Months
Ended
January 31,
2015
(Unaudited) | | 2014 | | 2013 | | Period
October 6,
20111
to July 31,
2012 |
| |
Per Share Operating Performance |
Net asset value, beginning of period | | | | $ | 10.11 | | | $ | 10.56 | | | $ | 10.65 | | | $ | 10.00 | |
Net investment loss2 | | | | | (0.14 | ) | | | (0.27 | ) | | | (0.28 | ) | | | (0.22 | ) |
Net realized and unrealized gain (loss) | | | | | 0.08 | | | | (0.15 | ) | | | 0.21 | | | | 0.87 | |
Net increase (decrease) from investment operations | | | | | (0.06 | ) | | | (0.42 | ) | | | (0.07 | ) | | | 0.65 | |
Distributions from net realized gain3 | | | | | — | | | | (0.03 | ) | | | (0.02 | ) | | | (0.00 | )4 |
Net asset value, end of period | | | | $ | 10.05 | | | $ | 10.11 | | | $ | 10.56 | | | $ | 10.65 | |
| |
Total Return5 |
Based on net asset value | | | | | (0.59)% | 6 | | | (3.99)% | | | | (0.70 | )% | | | 6.53% | 6 |
| |
Ratios to Average Net Assets |
Total expenses7 | | | | | 2.81% | 8 | | | 2.79% | | | | 2.81% | | | | 3.00% | 8,9 |
Total expenses excluding recoupment of past fees waived7 | | | | | 2.79% | 8 | | | 2.78% | | | | 2.77% | | | | 3.00% | 8 |
Total expenses after fees waived and/or reimbursed7 | | | | | 2.74% | 8 | | | 2.72% | | | | 2.72% | | | | 2.75% | 8 |
Net investment loss7 | | | | | (2.69)% | 8 | | | (2.68)% | | | | (2.62)% | | | | (2.61)% | 8 |
| |
Supplemental Data |
Net assets, end of period (000) | | | | $ | 12,527 | | | $ | $16,131 | | | $ | $20,636 | | | $ | $10,196 | |
| 1 | | Commencement of operations. |
| 2 | | Based on average shares outstanding. |
| 3 | | Distributions for annual periods are determined in accordance with federal income tax regulations. |
| 4 | | Amount is greater than $(0.005) per share. |
| 5 | | Where applicable, excludes the effects of any sales charges and assumes the reinvestment of distributions. |
| 7 | | Ratios do not include expenses incurred indirectly as a result of investments in underlying funds of approximately 0.18%. |
| 9 | | Organization costs were not annualized in the calculation of the expense ratios. If these expenses were annualized, the total expenses would have been 3.00%. |
See Notes to Financial Statements.
| 50 | BLACKROCK FUNDS | JANUARY 31, 2015
|
| |
| Financial Highlights | BlackRock Global Long/Short Equity Fund
|
| | | | Institutional
|
| | | | Six Months
Ended
January 31,
2015
(Unaudited) | | Year
Ended
July 31,
2014 | | Period
December 20,
20121
to July 31,
2013 |
| |
Per Share Operating Performance |
Net asset value, beginning of period | | | | $ | 11.61 | | | $ | 11.29 | | | $ | 10.00 | |
Net investment loss2 | | | | | (0.09 | ) | | | (0.19 | ) | | | (0.11 | ) |
Net realized and unrealized gain | | | | | 0.36 | | | | 0.66 | | | | 1.40 | |
Net increase from investment operations | | | | | 0.27 | | | | 0.47 | | | | 1.29 | |
Distributions from net realized gains3 | | | | | (0.01 | ) | | | (0.15 | ) | | | — | |
Net asset value, end of period | | | | $ | 11.87 | | | $ | 11.61 | | | $ | 11.29 | |
| |
Total Return4 |
Based on net asset value | | | | | 2.35% | 5 | | | 4.13% | | | | 12.90% | 5 |
| |
Ratios to Average Net Assets |
Total expenses6 | | | | | 1.65% | 7 | | | 1.71% | | | | 2.67% | 7,8 |
Total expenses excluding recoupment of past fees waived6 | | | | | 1.65% | 7 | | | 1.69% | | | | 2.67% | 7 |
Total expenses after fees waived and/or reimbursed6 | | | | | 1.58% | 7 | | | 1.64% | | | | 1.75% | 7 |
Net investment loss6 | | | | | (1.53)% | 7 | | | (1.61)% | | | | (1.67)% | 7 |
| |
Supplemental Data |
Net assets, end of period (000) | | | | $ | 1,355,833 | | | $ | 1,005,213 | | | $ | 65,630 | |
| 1 | | Commencement of operations. |
| 2 | | Based on average shares outstanding. |
| 3 | | Distributions for annual periods are determined in accordance with federal income tax regulations. |
| 4 | | Where applicable, assumes the reinvestment of distributions. |
| 6 | | Ratios do not include expenses incurred indirectly as a result of investments in underlying funds of approximately 0.18%. |
| 8 | | Organization costs were not annualized in the calculation of the expense ratios. If these expenses were annualized, the total expenses would have been 2.94%. |
See Notes to Financial Statements.
| BLACKROCK FUNDS | JANUARY 31, 2015 | 51
|
| |
| Financial Highlights (continued) | BlackRock Global Long/Short Equity Fund
|
| | | | Investor A
|
| | | | Six Months
Ended
January 31,
2015
(Unaudited) | | Year
Ended
July 31,
2014 | | Period
December 20,
20121
to July 31,
2013 |
| |
Per Share Operating Performance |
Net asset value, beginning of period | | | | $ | 11.57 | | | $ | 11.28 | | | $ | 10.00 | |
Net investment loss2 | | | | | (0.11 | ) | | | (0.21 | ) | | | (0.14 | ) |
Net realized and unrealized gain | | | | | 0.36 | | | | 0.64 | | | | 1.42 | |
Net increase from investment operations | | | | | 0.25 | | | | 0.43 | | | | 1.28 | |
Distributions from net realized gains3 | | | | | (0.01 | ) | | | (0.14 | ) | | | — | |
Net asset value, end of period | | | | $ | 11.81 | | | $ | 11.57 | | | $ | 11.28 | |
| |
Total Return4 |
Based on net asset value | | | | | 2.19% | 5 | | | 3.82% | | | | 12.80% | 5 |
| |
Ratios to Average Net Assets |
Total expenses6 | | | | | 1.96% | 7 | | | 1.97% | | | | 2.30% | 7,8 |
Total expenses excluding recoupment of past fees waived6 | | | | | 1.93% | 7 | | | 1.95% | | | | 2.30% | 7 |
Total expenses after fees waived and/or reimbursed6 | | | | | 1.88% | 7 | | | 1.89% | | | | 2.00% | 7 |
Net investment loss6 | | | | | (1.83)% | 7 | | | (1.86)% | | | | (1.95)% | 7 |
| |
Supplemental Data |
Net assets, end of period (000) | | | | $ | 244,279 | | | $ | 294,439 | | | $ | 15,076 | |
| 1 | | Commencement of operations. |
| 2 | | Based on average shares outstanding. |
| 3 | | Distributions for annual periods are determined in accordance with federal income tax regulations. |
| 4 | | Where applicable, excludes the effects of any sales charges and assumes the reinvestment of distributions. |
| 6 | | Ratios do not include expenses incurred indirectly as a result of investments in underlying funds of approximately 0.18%. |
| 8 | | Organization costs were not annualized in the calculation of the expense ratios. If these expenses were annualized, the total expenses would have been 2.57%. |
See Notes to Financial Statements.
| 52 | BLACKROCK FUNDS | JANUARY 31, 2015
|
| |
| Financial Highlights (concluded) | BlackRock Global Long/Short Equity Fund
|
| | | | Investor C
|
| | | | Six Months
Ended
January 31,
2015
(Unaudited) | | Year
Ended
July 31,
2014 | | Period
December 20,
20121
to July 31,
2013 |
| |
Per Share Operating Performance |
Net asset value, beginning of period | | | | $ | 11.45 | | | $ | 11.23 | | | $ | 10.00 | |
Net investment loss2 | | | | | (0.15 | ) | | | (0.30 | ) | | | (0.19 | ) |
Net realized and unrealized gain | | | | | 0.35 | | | | 0.65 | | | | 1.42 | |
Net increase from investment operations | | | | | 0.20 | | | | 0.35 | | | | 1.23 | |
Distributions from net realized gains3 | | | | | (0.01 | ) | | | (0.13 | ) | | | — | |
Net asset value, end of period | | | | $ | 11.64 | | | $ | 11.45 | | | $ | 11.23 | |
| |
Total Return4 |
Based on net asset value | | | | | 1.77% | 5 | | | 3.07% | | | | 12.30% | 5 |
| |
Ratios to Average Net Assets |
Total expenses6 | | | | | 2.69% | 7 | | | 2.72% | | | | 3.09% | 7,8 |
Total expenses excluding recoupment of past fees waived6 | | | | | 2.68% | 7 | | | 2.70% | | | | 3.09% | 7 |
Total expenses after fees waived and/or reimbursed6 | | | | | 2.62% | 7 | | | 2.64% | | | | 2.75% | 7 |
Net investment loss6 | | | | | (2.57)% | 7 | | | (2.61)% | | | | (2.70)% | 7 |
| |
Supplemental Data |
Net assets, end of period (000) | | | | $ | 106,538 | | | $ | $100,980 | | | $ | 2,592 | |
| 1 | | Commencement of operations. |
| 2 | | Based on average shares outstanding. |
| 3 | | Distributions for annual periods are determined in accordance with federal income tax regulations. |
| 4 | | Where applicable, excludes the effects of any sales charges and assumes the reinvestment of distributions. |
| 6 | | Ratios do not include expenses incurred indirectly as a result of investments in underlying funds of approximately 0.18%. |
| 8 | | Organization costs were not annualized in the calculation of the expense ratios. If these expenses were annualized, the total expenses would have been 3.36%. |
See Notes to Financial Statements.
| BLACKROCK FUNDS | JANUARY 31, 2015 | 53
|
| |
| Notes to Financial Statements (Unaudited) |
|
1. Organization:
BlackRock FundsSM (the “Trust”) is registered under the Investment Company Act of 1940, as amended (the “1940 Act”), as an open-end management investment company. The Trust is organized as a Massachusetts business trust. The Board of Trustees of the Trust are referred to throughout this report as the “Board of Trustees” or the “Board.” The following are referred to herein collectively as the “Funds” or individually, a “Fund”:
Fund Name
|
|
|
| Herein Referred To As
|
| Diversification
Classification
|
BlackRock Emerging Markets Long/Short Equity Fund | | | | Emerging Markets Long/Short Equity | | Diversified |
BlackRock Global Long/Short Equity Fund | | | | Global Long/Short Equity | | Diversified |
Each Fund offers multiple classes of shares. All classes of shares have identical voting, dividend, liquidation and other rights and are subject to the same terms and conditions, except that each bears certain expenses and may have a conversion privilege as outlined below. Institutional Shares are sold only to certain eligible investors. Investor A and Investor C Shares are generally available through financial intermediaries. Each class has exclusive voting rights with respect to matters relating to its shareholder servicing and distribution expenditures.
Share Class
|
|
|
| Initial
Sales Charge
|
| CDSC
|
| Conversion
Privilege
|
Institutional Shares | | | | No | | No | | None |
Investor A Shares | | | | Yes | | No1 | | None |
Investor C Shares | | | | No | | Yes | | None |
| 1 | | Investor A Shares may be subject to a CDSC where no initial sales charge was paid at the time of purchase. |
2. Significant Accounting Policies:
The Funds’ financial statements are prepared in conformity with accounting principles generally accepted in the United States of America (“U.S. GAAP”), which may require management to make estimates and assumptions that affect the reported amounts of assets and liabilities in the financial statements and the reported amounts of increases and decreases in net assets from operations during the reporting period. Actual results could differ from those estimates. Each Fund is considered an investment company under U.S. GAAP and follows the accounting and reporting guidance applicable to investment companies. The following is a summary of significant accounting policies followed by the Funds:
Valuation: The Funds’ investments are valued at fair value as of the close of trading on the New York Stock Exchange (“NYSE”) (generally 4:00 p.m., Eastern time). U.S. GAAP defines fair value as the price the Funds would receive to sell an asset or pay to transfer a liability in an orderly transaction between market participants at the measurement date. The Funds determine the fair values of their financial instruments at market value using independent dealers or pricing services under policies approved by the Board. The BlackRock Global Valuation Methodologies Committee (the “Global Valuation Committee”) is the committee formed by management to develop global pricing policies and procedures and to provide oversight of the pricing function for the Funds for all financial instruments.
Equity investments traded on a recognized securities exchange are valued at the official close each day, if available. For equity investments traded on more than one exchange, the official close price on the exchange where the stock is primarily traded is used. Equity investments traded on a recognized exchange for which there were no sales on that day may be valued at the last available bid (long positions) or ask (short positions) price. Swap agreements are valued utilizing quotes received daily by the Funds’ pricing service or through brokers, which are derived using daily swap curves and models that incorporate a number of market data factors, such as discounted cash flows, trades and values of the underlying reference instruments. Certain centrally cleared swaps are valued at the price determined by the relevant exchange or clearinghouse. Financial futures contracts traded on exchanges are valued at their last sale price. Investments in open-end registered investment companies are valued at net asset value (“NAV”) each business day.
Securities and other assets and liabilities denominated in foreign currencies are translated into U.S. dollars using exchange rates determined as of the close of business on the NYSE. Forward foreign currency exchange contracts are valued at the mean between the bid and ask prices and are determined as of the close of business on the NYSE. Interpolated values are derived when the settlement date of the contract is an interim date for which quotations are not available.
In the event that the application of these methods of valuation results in a price for an investment that is deemed not to be representative of the market value of such investment, or if a price is not available, the investment will be valued by the Global Valuation Committee, or its delegate, in accordance with a policy approved by the Board as reflecting fair value (“Fair Value Investments”). When determining the price for Fair Value Investments, the Global Valuation Committee, or its delegate, seeks to determine the price that each Fund might reasonably expect to receive or pay from the current sale or purchase of that asset or liability in an arm’s-length transaction. Fair value determinations shall be based upon all available factors that the Global Valuation Committee, or its delegate, deems relevant consistent with the principles of fair value measurement, which include the market approach, income approach and/or in the case of recent investments, the cost approach, as appropriate. The market approach generally consists of using comparable market transactions. The income approach generally is used to discount future cash flows to present value and is adjusted for liquidity as appropriate. These factors include but are not limited to: (i) attributes specific to the investment or asset; (ii) the principal market for the investment or
| 54 | BLACKROCK FUNDS | JANUARY 31, 2015
|
| |
| Notes to Financial Statements (continued) |
|
asset; (iii) the customary participants in the principal market for the investment or asset; (iv) data assumptions by market participants for the investment or asset, if reasonably available; (v) quoted prices for similar investments or assets in active markets; and (vi) other factors, such as future cash flows, interest rates, yield curves, volatilities, prepayment speeds, loss severities, credit risks, recovery rates, liquidation amounts and/or default rates. Due to the inherent uncertainty of valuations of such investments, the fair values may differ from the values that would have been used had an active market existed. The Global Valuation Committee, or its delegate, employs various methods for calibrating valuation approaches for investments where an active market does not exist, including regular due diligence of the Funds’ pricing vendors, regular reviews of key inputs and assumptions, transactional back-testing or disposition analysis to compare unrealized gains and losses to realized gains and losses, reviews of missing or stale prices and large movements in market values and reviews of any market related activity. The pricing of all Fair Value Investments is subsequently reported to the Board or a committee thereof on a quarterly basis.
Generally, trading in foreign instruments is substantially completed each day at various times prior to the close of business on the NYSE. Occasionally, events affecting the values of such instruments may occur between the foreign market close and the close of business on the NYSE that may not be reflected in the computation of the Funds’ net assets. If events (e.g., a company announcement, market volatility or a natural disaster) occur during such periods that are expected to materially affect the value of such instruments, those instruments may be Fair Value Investments and be valued at their fair value, as determined in good faith by the Global Valuation Committee, or its delegate, using a pricing service and/or policies approved by the Board. Each business day, the Funds use a pricing service to assist with the valuation of certain foreign exchange-traded equity securities and foreign exchange-traded and OTC options (the “Systematic Fair Value Price”). Using current market factors, the Systematic Fair Value Price is designed to value such foreign securities and foreign options at fair value as of the close of business on the NYSE, which follows the close of the local markets.
Foreign Currency: Each Fund’s books and records are maintained in U.S. dollars. Purchases and sales of investment securities are recorded at the rates of exchange prevailing on the respective date of such transactions. Generally, when the U.S. dollar rises in value against a foreign currency, the Fund’s investments denominated in that currency will lose value because that currency is worth fewer U.S. dollars; the opposite effect occurs if the U.S. dollar falls in relative value.
Each Fund does not isolate the portion of the results of operations arising as a result of changes in the foreign exchange rates from the changes in the market prices of investments held or sold for financial reporting purposes. Accordingly, the effects of changes in foreign currency exchange rates on investments are not segregated in the Statements of Operations from the effects of changes in market prices of those investments, but are included as a component of net realized and unrealized gain (loss) from investments. Each Fund reports realized currency gains (losses) on foreign currency related transactions as components of net realized gain (loss) for financial reporting purposes, whereas such components are generally treated as ordinary income for federal income tax purposes.
Segregation and Collateralization: In cases where the Fund enters into certain investments (e.g. swaps), that would be “senior securities” for 1940 Act purposes, the Fund may segregate or designate on their books and record cash or liquid securities having a market value at least equal to the amount of the Fund’s future obligations under such investments. Doing so allows the investment to be excluded from treatment as a “senior security.” Furthermore, if required by an exchange or counterparty agreement, the Fund may be required to deliver/deposit cash and/or securities to/with an exchange, or broker-dealer or custodian as collateral for certain investments or obligations.
Investment Transactions and Investment Income: For financial reporting purposes, investment transactions are recorded on the dates the transactions are entered into (the trade dates). Realized gains and losses on investment transactions are determined on the identified cost basis. Interest income, including amortization and accretion of premiums and discounts on debt securities, is recognized on the accrual basis. Income, expenses and realized and unrealized gains and losses are allocated daily to each class based on its relative net assets.
Distributions: Distributions paid by the Fund is recorded on the ex-dividend date. The character and timing of distributions are determined in accordance with federal income tax regulations, which may differ from U.S. GAAP.
Other: Expenses directly related to a Fund or its classes are charged to that Fund or the applicable class. Other operating expenses shared by several funds are prorated among those funds on the basis of relative net assets or other appropriate methods. Expenses directly related to the Funds and other shared expenses prorated to the Funds are allocated daily to each class based on its relative net assets or other appropriate methods.
The Funds have an arrangement with the custodian whereby fees may be reduced by credits earned on uninvested cash balances, which, if applicable, are shown as fees paid indirectly in the Statements of Operations. The custodian imposes fees on overdrawn cash balances, which can be offset by accumulated credits earned or may result in additional custody charges.
| BLACKROCK FUNDS | JANUARY 31, 2015 | 55
|
| |
| Notes to Financial Statements (continued) |
|
3. Derivative Financial Instruments:
The Funds engage in various portfolio investment strategies using derivative contracts both to increase the returns of the Funds and/or to economically hedge their exposure to certain risks such as equity risk. These contracts may be transacted on an exchange or OTC.
Financial Futures Contracts: The Funds invest in long and/or short positions in financial futures contracts and options on financial futures contracts to gain exposure to, or economically hedge against, changes in the value of equity securities (equity risk). Financial futures contracts are agreements between the Funds and a counterparty to buy or sell a specific quantity of an underlying instrument at a specified price and at a specified date. Depending on the terms of the particular contract, financial futures contracts are settled either through physical delivery of the underlying instrument on the settlement date or by payment of a cash settlement amount on the settlement date.
Upon entering into a financial futures contract, the Funds are required to deposit initial margin with the broker in the form of cash or securities in an amount that varies depending on a contract’s size and risk profile. The initial margin deposit must then be maintained at an established level over the life of the contract. Securities deposited as initial margin are designated on the Schedules of Investments and cash deposited, if any, is recorded on the Statements of Assets and Liabilities as cash pledged for financial futures contracts. Pursuant to the contract, the Funds agree to receive from or pay to the broker an amount of cash equal to the daily fluctuation in value of the contract. Such receipts or payments are known as variation margin. Variation margin is recorded by the Funds as unrealized appreciation or depreciation and, if applicable, as a receivable or payable for variation margin in the Statements of Assets and Liabilities.
When the contract is closed, the Funds record a realized gain or loss equal to the difference between the value of the contract at the time it was opened and the value at the time it was closed. The use of financial futures contracts involves the risk of an imperfect correlation in the movements in the price of financial futures contracts, interest or foreign currency exchange rates and the underlying assets.
Forward Foreign Currency Exchange Contracts: The Funds enter into forward foreign currency exchange contracts as an economic hedge against either specific transactions or portfolio instruments or to obtain exposure to, or hedge exposure away from, foreign currencies (foreign currency exchange rate risk). A forward foreign currency exchange contract is an agreement between two parties to buy and sell a currency at a set exchange rate on a future date. Forward foreign currency exchange contracts, when used by the Funds, help to manage the overall exposure to the currencies in which some of the investments held by the Funds are denominated. The contract is marked-to-market daily and the change in market value is recorded by the Funds as an unrealized gain or loss. When the contract is closed, the Funds record a realized gain or loss equal to the difference between the value at the time it was opened and the value at the time it was closed. The use of forward foreign currency exchange contracts involves the risk that the value of a forward foreign currency exchange contract changes unfavorably due to movements in the value of the referenced foreign currencies.
Swaps: The Funds enter into swap agreements, in which the Funds and a counterparty agree either to make periodic net payments on a specified notional amount or a net payment upon termination. Swap agreements are privately negotiated in the OTC market and may be entered into as a bilateral contract (“OTC swaps”) or centrally cleared (“centrally cleared swaps”). Swaps are marked-to-market daily and changes in value are recorded as unrealized appreciation (depreciation).
For OTC swaps, any upfront premiums paid are recorded as assets and any upfront fees received are recorded as liabilities and are shown as swap premiums paid and swap premiums received, respectively, in the Statements of Assets and Liabilities and amortized over the term of the OTC swap. Payments received or made by the Funds for OTC swaps are recorded in the Statements of Operations as realized gains or losses, respectively. When an OTC swap is terminated, the Funds will record a realized gain or loss equal to the difference between the proceeds from (or cost of) the closing transaction and the Funds’ basis in the contract, if any. Generally, the basis of the contract is the premium received or paid.
In a centrally cleared swap, immediately following execution of the swap agreement, the swap agreement is novated to a central counterparty (the “CCP”) and the Funds’ counterparty on the swap agreement becomes the CCP. The Funds are required to interface with the CCP through a broker. Upon entering into a centrally cleared swap, the Funds are required to deposit initial margin with the broker in the form of cash or securities in an amount that varies depending on the size and risk profile of the particular swap. Securities deposited as initial margin are designated on the Schedules of Investments and cash deposited is recorded on the Statements of Assets and Liabilities as cash pledged for centrally cleared swaps. The daily change in valuation of centrally cleared swaps is recorded as a receivable or payable for variation margin in the Statements of Assets and Liabilities. Payments received from (paid to) the counterparty, including at termination, are recorded as realized gain (loss) in the Statements of Operations.
Swap transactions involve, to varying degrees, elements of interest rate, credit and market risk in excess of the amounts recognized in the Statements of Assets and Liabilities. Such risks involve the possibility that there will be no liquid market for these agreements, that the counterparty to the agreements may default on its obligation to perform or disagree as to the meaning of the contractual terms in the agreements, and that there may be unfavorable changes in interest rates and/or market values associated with these transactions.
| 56 | BLACKROCK FUNDS | JANUARY 31, 2015
|
| |
| Notes to Financial Statements (continued) |
|
• | | Total return swaps — The Funds enter into total return swaps to obtain exposure to securities (both long and short) or markets without owning such securities or investing directly in that market or to transfer the risk/return of one market (e.g., fixed income) to another market (e.g., equity) (equity risk and/or interest rate risk). Total return swaps are agreements in which there is an exchange of cash flows whereby one party commits to make payments based on the total return (dividends or interest plus capital gains/losses) of an underlying instrument in exchange for fixed or floating rate interest payments. |
The Funds will pay an amount equal to any depreciation on a long position and appreciation on a short position including dividend income from such positions. Conversely, the Funds will receive any appreciation on a long position and any depreciation on a short position including dividend income from such positions. In addition, the Funds will also pay or receive a variable rate of interest based on the underlying benchmark rate plus or minus a spread (“financing fees”). The benchmark and spread are determined based upon the country and/or currency of the individual underlying positions. The unrealized appreciation (depreciation) on total return swaps includes dividends on the underlying basket of equity securities and financing fees. The agreement allows the Manager to change the composition of the basket of securities by trading in and out of the underlying equity positions at its discretion. The resulting gains or losses are recorded in the Statements of Operations. Certain swaps have no stated expiration and can be terminated by either party at any time.
The following is a summary of the Funds’ derivative financial instruments categorized by risk exposure:
Fair Values of Derivative Financial Instruments as of January 31, 2015
|
| | | �� | Value
|
| | | | Emerging Markets
Long/Short Equity
| | Global
Long/Short Equity
|
|
| Statements of Assets
and Liabilities Location
|
| Derivative
Assets
|
| Derivative
Liabilities
|
| Derivative
Assets
|
| Derivative
Liabilities
|
Equity contracts | | Net Unrealized appreciation/depreciation on OTC swaps | | $10,913,772 | | — | | $40,774,757 | | $(1,626,010) |
| 1 | | Includes cumulative appreciation/depreciation on financial futures contracts and centrally cleared swaps, if any, as reported in the Schedules of Investments. Only current day’s variation margin is reported within the Statements of Assets and Liabilities. |
The Effect of Derivative Financial Instruments in the Statements of Operations
For the six months ended January 31, 2015
|
|
| | | | Net Realized Gain (Loss) From
|
| Net Change in Unrealized
Appreciation/(Depreciation) on
|
| | | | Emerging
Markets
Long/Short
Equity
|
| Global
Long/Short
Equity
|
| Emerging
Markets
Long/Short
Equity
|
| Global
Long/Short
Equity
|
Equity contracts: | | | | | | | | | | | | | | | | | | |
Financial futures contracts | | | | | — | | | $ | 1,666,868 | | | | — | | | $ | 325,958 | |
Swaps | | | | $ | 28,815,594 | | | | 32,708,450 | | | $ | (24,283,961 | ) | | | 9,241,655 | |
Total
| | | | $ | 28,815,594 | | | $ | 34,375,318 | | | $ | (24,283,961 | ) | | $ | 9,567,613 | |
For the six months ended January 31, 2015, the average quarterly balances of outstanding derivative financial instruments were as follows:
|
|
|
| Emerging
Markets
Long/Short
Equity
|
| Global
Long/Short
Equity
|
Financial futures contracts: | | | | | | | | | | |
Average notional value of contracts purchased | | | | | — | | | $ | 120,054,797 | 1 |
Total return swaps: | | | | | | | | | | |
Average notional amount | | | | $ | 88,902,427 | | | $ | (45,735,775 | ) |
| 1 | | Average amounts for the period are shown due to limited outstanding derivative financial instruments as of each quarter. |
Counterparty Credit Risk: A derivative contract may suffer a mark-to-market loss if the value of the contract decreases due to an unfavorable change in the market rates or values of the underlying instrument. Losses can also occur if the counterparty does not perform under the contract.
The Funds’ risk of loss from counterparty credit risk on OTC derivatives is generally limited to the aggregate unrealized gain netted against any collateral held by such Fund.
With exchange-traded futures and centrally cleared swaps, there is less counterparty credit risk to the Funds since the exchange or clearinghouse, as counterparty to such instruments, guarantees against a possible default. The clearinghouse stands between the buyer and the seller of the contract; therefore, credit risk is limited to failure of the clearinghouse. While offset rights may exist under applicable law, a Fund does not have a contractual right of offset against a clearing broker or clearinghouse in the event of a default (including the bankruptcy or insolvency) of the clearing broker or clearinghouse. Additionally, credit risk exists in exchange-traded futures and centrally cleared swaps with respect to initial and variation margin that is held in a clearing
| BLACKROCK FUNDS | JANUARY 31, 2015 | 57
|
| |
| Notes to Financial Statements (continued) |
|
broker’s customer accounts. While clearing brokers are required to segregate customer margin from their own assets, in the event that a clearing broker becomes insolvent or goes into bankruptcy and at that time there is a shortfall in the aggregate amount of margin held by the clearing broker for all its clients, typically the shortfall would be allocated on a pro rata basis across all the clearing broker’s customers, potentially resulting in losses to the Funds.
In order to better define its contractual rights and to secure rights that will help the Funds mitigate their counterparty risk, the Funds may enter into an International Swaps and Derivatives Association, Inc. Master Agreement (“ISDA Master Agreement”) or similar agreement with their counterparties. An ISDA Master Agreement is a bilateral agreement between each Fund and a counterparty that governs certain OTC derivatives and typically contains, among other things, collateral posting terms and netting provisions in the event of a default and/or termination event. Under an ISDA Master Agreement, each Fund may, under certain circumstances, offset with the counterparty certain derivative financial instruments’ payables and/or receivables with collateral held and/or posted and create one single net payment. The provisions of the ISDA Master Agreement typically permit a single net payment in the event of default including the bankruptcy or insolvency of the counterparty. Bankruptcy or insolvency laws of a particular jurisdiction may restrict or prohibit the right of offset in bankruptcy, insolvency or other events. In addition, certain ISDA Master Agreements allow counterparties to terminate derivative contracts prior to maturity in the event the Funds’ net assets decline by a stated percentage or the Funds fail to meet the terms of their respective ISDA Master Agreements. The result would cause the Funds to accelerate payment of any net liability owed to the counterparty.
Collateral Requirements: For derivatives traded under an ISDA Master Agreement, the collateral requirements are typically calculated by netting the mark-to-market amount for each transaction under such agreement and comparing that amount to the value of any collateral currently pledged by the Funds and the counterparty.
Cash collateral that has been pledged to cover obligations of the Funds and cash collateral received from the counterparty, if any, is reported separately on the Statements of Assets and Liabilities as cash pledged as collateral and cash received as collateral, respectively. Non-cash collateral pledged by the Funds, if any, is noted in the Schedules of Investments. Generally, the amount of collateral due from or to a party has to exceed a minimum transfer amount threshold (typically either $250,000 or $500,000) before a transfer is required, which is determined at the close of business of the Funds. Any additional required collateral is delivered to/pledged by the Funds on the next business day. Typically, the Funds and counterparties are not permitted to sell, re-pledge or use the collateral they receive. To the extent amounts due to the Funds from their counterparties are not fully collateralized, the Funds bear the risk of loss from counterparty non-performance. Likewise, to the extent the Funds have delivered collateral to a counterparty and stand ready to perform under the terms of their agreement with such counterparty, the Funds bear the risk of loss from a counterparty in the amount of the value of the collateral in the event the counterparty fails to return such collateral.
As of January 31, 2015, the Funds’ derivative assets and liabilities (by type) are as follows:
| | | | Emerging Markets
Long/Short Equity
| | Global Long/Short Equity
|
| | | | | | | | | |
|
|
|
| Assets
|
| Liabilities
|
| Assets
|
| Liabilities
|
Derivative Financial Instruments: | | | | | | | | | | | | | | | | | | |
Swaps — OTC1 | | | | $ | 10,913,772 | | | | — | | | $ | 40,774,757 | | | $ | 1,626,010 | |
Derivatives not subject to a Master Netting Agreement or similar agreement (“MNA”) | | | | | — | | | | — | | | | — | | | | — | |
Total of derivative assets and liabilities subject to an MNA | | | | $ | 10,913,772 | | | | — | | | $ | 40,774,757 | | | $ | 1,626,010 | |
| 1 | | Includes unrealized appreciation/depreciation on OTC swaps in the Statements of Assets and Liabilities and reported in the Schedules of Investments. |
As of January 31, 2015, the following table presents the Funds’ derivative assets and liabilities by counterparty net of amounts available for offset under an MNA and net of the related collateral received and pledged by the Funds:
Emerging Markets Long/Short Equity
|
Counterparty
|
|
|
| Derivative
Assets
Subject to
an MNA by
Counterparty
|
| Derivatives
Available
for Offset
|
| Non-cash
Collateral
Received
|
| Cash
Collateral
Received2
|
| Net
Amount of
Derivative
Assets3
|
Goldman Sachs & Co. | | | | $ | 6,259,909 | | | | — | | | | — | | | $ | (4,800,000 | ) | | $ | 1,459,909 | |
Morgan Stanley & Co, LLC | | | | | 622,891 | | | | — | | | | — | | | | (580,000 | ) | | | 42,891 | |
UBS AG | | | | | 4,030,972 | | | | — | | | | — | | | | (4,030,972 | ) | | | — | |
Total
| | | | $ | 10,913,772 | | | | — | | | | — | | | $ | (9,410,972 | ) | | $ | 1,502,800 | |
| 2 | | Excess of collateral received from the individual counterparty is not shown for financial reporting purposes. |
| 3 | | Net amount represents the net amount receivable from the counterparty in the event of default. |
| 58 | BLACKROCK FUNDS | JANUARY 31, 2015
|
| |
| Notes to Financial Statements (continued) |
|
Global Long/Short Equity
|
|
Counterparty
|
|
|
| Derivative
Assets
Subject to
an MNA by
Counterparty
|
| Derivatives
Available
for Offset
|
| Non-cash
Collateral
Received
|
| Cash
Collateral
Received1
|
| Net
Amount of
Derivative
Assets2
|
Deutsche Bank AG | | | | $ | 615,096 | | | | — | | | | — | | | $ | (615,096 | ) | | | — | |
Goldman Sachs & Co. | | | | | 34,847,188 | | | | — | | | | — | | | | (22,700,000 | ) | | $ | 12,147,188 | |
UBS AG | | | | | 5,312,473 | | | | — | | | | — | | | | (3,227,615 | ) | | | 2,084,858 | |
Total | | | | $ | 40,774,757 | | | | — | | | | — | | | $ | (26,542,711 | ) | | $ | 14,232,046 | |
Counterparty
|
|
|
| Derivative
Liabilities
Subject to
an MNA by
Counterparty
|
| Derivatives
Available
for Offset
|
| Non-cash
Collateral
Pledged
|
| Cash
Collateral
Pledged3
|
| Net
Amount of
Derivative
Liabilities4
|
Bank of America NA | | | | $ | 1,626,010 | | | | — | | | | — | | | $ | (1,626,010 | ) | | | — | |
| 1 | | Excess of collateral received from the individual counterparty is not shown for financial reporting purposes. |
| 2 | | Net amount represents the net amount receivable from the counterparty in the event of default. |
| 3 | | Excess of collateral pledged to the individual counterparty is not shown for financial reporting purposes. |
| 4 | | Net amount represents the net amount payable due to the counterparty in the event of default. |
4. Investment Advisory Agreement and Other Transactions with Affiliates:
The PNC Financial Services Group, Inc. is the largest stockholder and an affiliate, for 1940 Act purposes, of BlackRock, Inc. (“BlackRock”).
The Trust, on behalf of the Funds, entered into an Investment Advisory Agreement with BlackRock Advisors, LLC (the “Manager”), the Funds’ investment advisor, an indirect, wholly owned subsidiary of BlackRock, to provide investment advisory and administration services. The Manager is responsible for the management of each Fund’s portfolio and provides the necessary personnel, facilities, equipment and certain other services to the operations of each Fund. For such services, each Fund pays the Manager a monthly fee based on a percentage of each Fund’s average daily net assets at the following annual rates:
Average Daily Net Assets
|
|
|
| Investment
Advisory Fee
|
First $1 Billion | | | | 1.50% |
$1 Billion — $3 Billion | | | | 1.41% |
$3 Billion — $5 Billion | | | | 1.35% |
$5 Billion — $10 Billion | | | | 1.31% |
Greater than $10 Billion | | | | 1.28% |
The Manager voluntarily agreed to waive its investment advisory fees by the amount of investment advisory fees each Fund pays to the Manager indirectly through its investment in affiliated money market funds. However, the Manager does not waive its investment advisory fees by the amount of investment advisory fees paid in connection with each Fund’s investment in other affiliated investment companies, if any. These amounts are included in fees waived by Manager in the Statements of Operations. For the six months ended January 31, 2015, the amounts waived were as follows:
Emerging Markets Long/Short Equity | | | | $ | 192,423 | |
Global Long/Short Equity | | | | $ | 541,873 | |
The Trust, on behalf of the Funds, entered into a Distribution Agreement and a Distribution and Service Plan with BlackRock Investments, LLC (“BRIL”), an affiliate of the Manager. Pursuant to the Distribution and Service Plan and in accordance with Rule 12b-1 under the 1940 Act, the Fund pays BRIL ongoing service and distribution fees. The fees are accrued daily and paid monthly at annual rates based upon the average daily net assets of the relevant share class of each Fund as follows:
|
|
|
| Service
Fee
|
| Distribution
Fee
|
Investor A | | | | | 0.25 | % | | | — | |
Investor C | | | | | 0.25 | % | | | 0.75 | % |
Pursuant to sub-agreements with BRIL, broker-dealers and BRIL provide shareholder servicing and distribution services to the Fund. The ongoing service and/or distribution fee compensates BRIL and each broker-dealer for providing shareholder servicing and/or distribution related services to Investor A and Investor C shareholders.
| BLACKROCK FUNDS | JANUARY 31, 2015 | 59
|
| |
| Notes to Financial Statements (continued) |
|
Pursuant to written agreements, certain financial intermediaries, some of which may be affiliates, provide the Funds with sub-accounting, recordkeeping, sub-transfer agency and other administrative services with respect to sub-accounts they service. For these services, these entities receive an asset based fee or an annual fee per shareholder account, which will vary depending on share class and/or net assets. For the six months ended January 31, 2015, the Funds paid the following amounts to affiliates of BlackRock in return for these services, which are included in transfer agent in the Statements of Operations:
Emerging Markets Long/Short Equity
| Global Long/Short Equity
|
$324 | $2,906 |
The Manager maintains a call center, which is responsible for providing certain shareholder services to the Funds, such as responding to shareholder inquiries and processing transactions based upon instructions from shareholders with respect to the subscription and redemption of Fund shares. For the six months ended January 31, 2015, the Funds reimbursed the Manager the following amounts for costs incurred in running the call center, which are included in transfer agent — class specific in the Statements of Operations:
|
|
|
| Emerging
Markets
Long/Short
Equity
|
| Global
Long/Short
Equity
|
Institutional | | | | $ | 909 | | | $ | 1,659 | |
Investor A | | | | $ | 746 | | | $ | 513 | |
Investor C | | | | $ | 180 | | | $ | 892 | |
Effective January 1, 2015, The Trust, on behalf of the Funds, entered into an Administration Agreement with the Manager to provide administrative services. For these services, the Manager receives an administration fee computed daily and payable monthly, based on a percentage of the average daily net assets of the Funds. The administration fee, which is shown as administration in the Statements of Operations, is paid at the annual rates below. In addition, each of the share classes is charged an administration fee, which is shown as administration — class specific in the Statements of Operations, at an annual rate of 0.02% of the average daily net assets of each respective class.
Average Daily Net Assets
|
|
|
| Administration Fee
|
First $500 Million | | | | 0.0425% |
$500 Million — $1 Billion | | | | 0.0400% |
$1 Billion — $2 Billion | | | | 0.0375% |
$2 Billion — $4 Billion | | | | 0.0350% |
$4 Billion — $13 Billion | | | | 0.0325% |
Greater than $13 Billion | | | | 0.0300% |
Prior to January 1, 2015, State Street Bank and Trust Company and the Manager acted as co-administrators for the Funds. For these services, the co-administrators received an administration fee computed daily and payable monthly to each administrator pursuant to separate fee arrangements, based on a percentage of the average daily net assets of each Fund. The combined administration fee, which is shown as administration in the Statements of Operations, was paid at the annual rates below. In addition, each of the share classes was charged an administration fee, which is shown as administration — class specific in the Statements of Operations, based on the following percentages of average daily net assets of each respective class:
Average Daily Net Assets
|
|
|
| Administration
Fee
|
| Administration Fee —
Class Specific
|
First $500 Million | | | | 0.075% | | 0.025% |
500 Million — $1 Billion | | | | 0.065% | | 0.015% |
Greater than $1 Billion | | | | 0.055% | | 0.005% |
For the six months ended January 31, 2015, the Funds paid the following to the Manager in return for these services, which are included in administration and administration — class specific in the Statements of Operations:
|
|
|
| Administration Fees
|
Emerging Markets Long/Short Equity | | | | $ | 195,650 | |
Global Long/Short Equity | | | | $ | 481,339 | |
The Administrators may have, at their discretion, voluntarily waived all or any portion of their administration fees for a Fund or a share class, which are included in administration fees waived and administration fees waived — class specific in the Statements of Operations.
| 60 | BLACKROCK FUNDS | JANUARY 31, 2015
|
| |
| Notes to Financial Statements (continued) |
|
The Manager contractually agreed to waive and/or reimburse fees or expenses in order to limit expenses, excluding interest expense, dividend expense, tax expense, acquired fund fees and expenses and certain other fund expenses, which constitute extraordinary expenses not incurred in the ordinary course of the Funds’ business. The current expense limitations as a percentage of average daily net assets are as follows: 1.75% for Institutional; 2.00% for Investor A, and 2.75% for Investor C. The Manager has agreed not to reduce or discontinue this contractual waiver or reimbursement prior to December 1, 2015 unless approved by the Board, including a majority of the Independent Trustees.
These amounts are included in fees waived by Manager, fees reimbursed by Manager, administration fees waived — class specific and transfer agent fees waived and/or reimbursed respectively, in the Statements of Operations.
If during the Funds’ fiscal year the operating expenses of a share class, that at any time during the prior two fiscal years received a waiver or reimbursement from the Manager, are less than the expense limit for that share class, the Manager is entitled to be reimbursed by such share class up to the lesser of (a) the amount of fees waived or expenses reimbursed during those prior two fiscal years under the agreement and (b) the amount by which the expense limit for that share class exceeds the operating expenses of the share class for the current fiscal year, provided that: (1) the Fund, of which the share class is a part, has more than $50 million in assets for the fiscal year and (2) the Manager or an affiliate continues to serve as the Fund’s investment advisor or administrator. In the event the expense limit for a share class is changed subsequent to a fiscal year in which the Manager becomes entitled to reimbursement for fees waived or reimbursed, the amount available to reimburse the Manager shall be calculated by reference to the expense limit for that share class in effect at the time the Manager became entitled to receive such reimbursement, rather than the subsequently changed expense limit for that share class.
For the six months ended January 31, 2015, the Manager recouped the following Fund level and class specific waivers and/or reimbursements previously recorded by the Funds:
|
|
|
| Emerging Markets
Long/Short Equity
|
| Global Long/
Short Equity
|
Fund | | | | | — | | | $ | 5,855 | |
Institutional | | | | | — | | | $ | 2,791 | |
Investor A | | | | $ | 908 | | | $ | 30,535 | |
Investor C | | | | $ | 1,184 | | | $ | 5,983 | |
On January 31, 2015, the Fund level and class specific waivers and/or reimbursements subject to possible future recoupment under the expense limitation agreement are as follows:
| | Emerging Markets
Long/Short Equity
| | Global
Long/Short Equity
|
Expiring January 31,
|
| 2015
|
| 2016
|
| 2015
|
| 2016
|
Fund | | | — | | | — | | — | | | — |
Institutional | | $ | 116,535 | | $ | 93,686 | | — | | | — |
Investor A | | | — | | $ | 3,940 | | — | | $ | 4,437 |
Investor C | | | — | | $ | 74 | | — | | $ | 382 |
For the six months ended January 31, 2015, affiliates earned underwriting discounts, direct commissions and dealer concessions on sales of the Funds’ Investor A Shares as follows:
|
|
|
| Investor A
|
Emerging Markets Long/Short Equity | | | | $ | 802 | |
Global Long/Short Equity | | | | $ | 12,369 | |
For the six months ended January 31, 2015, affiliates received CDSCs as follows:
|
|
|
| Investor A
|
| Investor C
|
Emerging Markets Long/Short Equity | | | | $ | 7,157 | | | $ | 967 | |
Global Long/Short Equity | | | | $ | 25,451 | | | $ | 23,047 | |
Certain officers and/or trustees of the Trust are officers and/or directors of BlackRock or its affiliates. The Funds reimburse the Manager for a portion of the compensation paid to the Trust’s Chief Compliance Officer, which is included in officer and trustees in the Statements of Operations.
5. Purchases and Sales
For the six months ended January 31, 2015, purchases of investments, excluding short-term securities were $1,499,957 for Global Long/Short Equity.
| BLACKROCK FUNDS | JANUARY 31, 2015 | 61
|
| |
| Notes to Financial Statements (continued) |
|
6. Income Tax Information:
It is each Fund’s policy to comply with the requirements of the Internal Revenue Code of 1986, as amended, applicable to regulated investment companies, and to distribute substantially all of their taxable income to their shareholders. Therefore, no federal income tax provision is required.
Each Fund files U.S. federal and various state and local tax returns. No income tax returns are currently under examination. The statute of limitations on Emerging Markets Long/Short Equity’s U.S. federal tax returns remains open for the two years ended July 31, 2014 and the period ended July 31, 2012. The statute of limitations on Global Long/Short Equity’s U.S. federal tax returns remains open for the year ended July 31, 2014 and the period ended July 31, 2013. The statutes of limitations on each Fund’s state and local tax returns may remain open for an additional year depending upon the jurisdiction.
Management has analyzed tax laws and regulations and their application to the Funds’ facts and circumstances and does not believe that there are any uncertain tax positions that require recognition of a tax liability.
As of January 31, 2015, gross unrealized appreciation and depreciation based on cost for federal income tax purposes were as follows:
|
|
|
| Global
Long/Short
Equity
|
| | | | | | |
Tax cost | | | | $ | 1,690,056,717 | |
Gross unrealized appreciation | | | | $ | 1,257,035 | |
Gross unrealized depreciation | | | | | (17,794 | ) |
Net unrealized appreciation | | | | $ | 1,239,241 | |
7. Bank Borrowings:
The Funds, along with certain other funds managed by the Manager and its affiliates (“Participating Funds”), were parties to a 364-day, $1.1 billion credit agreement with a group of lenders, under which the Funds may borrow to fund shareholder redemptions. Excluding commitments designated for a certain fund, the Participating Funds, including the Funds, could borrow up to an aggregate commitment amount of $650 million, subject to asset coverage and other limitations as specified in the agreement. Effective November 25, 2014, the credit agreement was amended to an aggregate commitment amount of $2.1 billion, of which the Participating Funds, including the Funds, can borrow up to $1.6 billion at any time outstanding, subject to asset coverage and other limitations as specified in the agreement. The agreement terminates on April 23, 2015, unless otherwise extended to November 24, 2015 or renewed for a period of 364 days from April 23, 2015. The credit agreement has the following terms: a fee of 0.06% per annum on unused commitment amounts and interest at a rate equal to the higher of (a) the one-month LIBOR (but in any event, not less than 0.00%) on the date the loan is made plus 0.80% per annum or (b) the Fed Funds rate (but in any event, not less than 0.00%) in effect from time to time plus 0.80% per annum on amounts borrowed. Participating Funds paid administration, legal and arrangement fees, which are included in miscellaneous expenses in the Statement of Operations, and along with commitment fees, were allocated among such funds based upon portions of the aggregate commitment available to them and relative net assets of Participating Funds. During the six months ended January 31, 2015, the Funds did not borrow under the credit agreement.
8. Principal Risk:
In the normal course of business, the Funds invest in securities and enter into transactions where risks exist due to fluctuations in the market (market risk) or failure of the issuer of a security to meet all its obligations (issuer credit risk). The value of securities held by the Funds may decline in response to certain events, including those directly involving the issuers whose securities are owned by the Funds; conditions affecting the general economy; overall market changes; local, regional or global political, social or economic instability; and currency and interest rate and price fluctuations. Similar to issuer credit risk, the Funds may be exposed to counterparty credit risk, or the risk that an entity with which the Funds have unsettled or open transactions may fail to or be unable to perform on its commitments. The Funds manage counterparty credit risk by entering into transactions only with counterparties that they believe have the financial resources to honor their obligations and by monitoring the financial stability of those counterparties. Financial assets, which potentially expose the Funds to market, issuer and counterparty credit risks, consist principally of financial instruments and receivables due from counterparties. The extent of the Funds’ exposure to market, issuer and counterparty credit risks with respect to these financial assets is generally approximated by their value recorded in the Statements of Assets and Liabilities, less any collateral held by the Funds.
The Funds invest a substantial amount of their assets in issuers located in a single country or a limited number of countries. When the Funds concentrate their investments in this manner, they assume the risk that economic, political and social conditions in those countries may have a significant impact on their investment performance. Foreign issuers may not be subject to the same uniform accounting, auditing and financial reporting standards and practices as used in the United States. Foreign securities markets may also be less liquid, more volatile, and less subject to governmental supervision not typically associated with investing in U.S. securities. Investment percentages in specific countries are presented in the Schedules of Investments.
| 62 | BLACKROCK FUNDS | JANUARY 31, 2015
|
| |
| Notes to Financial Statements (continued) |
|
Global Long/Short Equity invests a significant portion of its assets in securities of issuers located in Europe or with significant exposure to European issuers or countries. The European financial markets have recently experienced volatility and adverse trends due to concerns about economic downturns in, or rising government debt levels of, several European countries. These events may spread to other countries in Europe and may affect the value and liquidity of certain of the Fund’s investments.
As of January 31, 2015, the Funds had the following industry classifications:
Emerging Markets Long/Short Equity
|
|
|
| Percent of Total Investments
|
Industry
|
|
|
| Long
|
| Short
|
| Total
|
Electronic Equipment, Instruments & Components | | | | | 2 | % | | | 3 | % | | | 5 | % |
Machinery | | | | | 1 | | | | 3 | | | | 4 | |
Oil, Gas & Consumable Fuels | | | | | 4 | | | | — | | | | 4 | |
Wireless Telecommunication Services | | | | | 3 | | | | 1 | | | | 4 | |
Semiconductors & Semiconductor Equipment | | | | | 3 | | | | 1 | | | | 4 | |
Metals & Mining | | | | | 3 | | | | 1 | | | | 4 | |
Real Estate Management & Development | | | | | 2 | | | | 2 | | | | 4 | |
Multi-Utilities | | | | | — | | | | 3 | | | | 3 | |
Transportation Infrastructure | | | | | 3 | | | | — | | | | 3 | |
Industrial Conglomerates | | | | | 3 | | | | — | | | | 3 | |
Food Products | | | | | 1 | | | | 2 | | | | 3 | |
Food & Staples Retailing | | | | | 1 | | | | 2 | | | | 3 | |
Diversified Financial Services | | | | | 1 | | | | 2 | | | | 3 | |
Technology Hardware, Storage & Peripherals | | | | | 1 | | | | 2 | | | | 3 | |
Marine | | | | | 1 | | | | 2 | | | | 3 | |
Software | | | | | 1 | | | | 2 | | | | 3 | |
Health Care Providers & Services | | | | | 2 | | | | — | | | | 2 | |
Independent Power and Renewable Electricity Producers | | | | | 2 | | | | — | | | | 2 | |
Pharmaceuticals | | | | | 1 | | | | 1 | | | | 2 | |
Electric Utilities | | | | | 1 | | | | 1 | | | | 2 | |
Insurance | | | | | 1 | | | | 1 | | | | 2 | |
Media | | | | | 1 | | | | 1 | | | | 2 | |
Banks | | | | | 1 | | | | 1 | | | | 2 | |
Diversified Telecommunication Services | | | | | 1 | | | | 1 | | | | 2 | |
Construction Materials | | | | | 1 | | | | 1 | | | | 2 | |
Chemicals | | | | | 1 | | | | 1 | | | | 2 | |
Auto Components | | | | | 1 | | | | 1 | | | | 2 | |
Electrical Equipment | | | | | — | | | | 1 | | | | 1 | |
Specialty Retail | | | | | 1 | | | | — | | | | 1 | |
Capital Markets | | | | | 1 | | | | — | | | | 1 | |
Other1 | | | | | 10 | | | | 9 | | | | 19 | |
Total | | | | | 55 | % | | | 45 | % | | | 100 | % |
| 1 | | All other industries held were each less than 1% of long-term investments. |
| BLACKROCK FUNDS | JANUARY 31, 2015 | 63
|
| |
| Notes to Financial Statements (continued) |
|
Global Long/Short Equity
|
|
|
| Percent of Total Investments
|
Industry
|
|
|
| Long
|
| Short
|
| Total
|
Metals & Mining | | | | | 5 | % | | | — | | | | 5 | % |
Hotels, Restaurants & Leisure | | | | | 1 | | | | 3 | | | | 4 | |
Chemicals | | | | | 2 | | | | 2 | | | | 4 | |
Semiconductors & Semiconductor Equipment | | | | | 3 | | | | 1 | | | | 4 | |
Specialty Retail | | | | | 1 | | | | 3 | | | | 4 | |
Food Product | | | | | 1 | | | | 3 | | | | 4 | |
Software | | | | | 1 | | | | 2 | | | | 3 | |
Oil, Gas & Consumable Fuels | | | | | 2 | | | | 1 | | | | 3 | |
Real Estate Investment Trusts (REITs) | | | | | 2 | | | | 1 | | | | 3 | |
Beverages | | | | | 1 | | | | 2 | | | | 3 | |
Food & Staples Retailing | | | | | — | | | | 3 | | | | 3 | |
Media | | | | | 3 | | | | — | | | | 3 | |
Textiles, Apparel & Luxury Goods | | | | | — | | | | 3 | | | | 3 | |
Banks | | | | | 2 | | | | 1 | | | | 3 | |
Electric Utilities | | | | | 2 | | | | 1 | | | | 3 | |
Pharmaceuticals | | | | | 1 | | | | 2 | | | | 3 | |
Electronic Equipment, Instruments & Components | | | | | 2 | | | | 1 | | | | 3 | |
Machinery | | | | | 1 | | | | 1 | | | | 2 | |
IT Services | | | | | 1 | | | | 1 | | | | 2 | |
Health Care Providers & Services | | | | | 1 | | | | 1 | | | | 2 | |
Professional Services | | | | | 1 | | | | 1 | | | | 2 | |
Diversified Telecommunication Services | | | | | 2 | | | | — | | | | 2 | |
Independent Power and Renewable Electricity Producers | | | | | 1 | | | | — | | | | 1 | |
Internet & Catalog Retail | | | | | — | | | | 1 | | | | 1 | |
Internet Software & Services | | | | | — | | | | 1 | | | | 1 | |
Trading Companies & Distributors | | | | | 1 | | | | — | | | | 1 | |
Containers & Packaging | | | | | 1 | | | | — | | | | 1 | |
Real Estate Management & Development | | | | | 1 | | | | — | | | | 1 | |
Other1 | | | | | 10 | | | | 16 | | | | 26 | |
Total | | | | | 49 | % | | | 51 | % | | | 100 | % |
| | | | | | | | | | | | | | |
| 1 | | All other industries held were each less than 1% of long-term investments. |
9. Capital Share Transactions:
Transactions in capital shares for each class were as follows:
| | | | Six Months Ended
January 31, 2015
| | | | Year Ended
July 31, 2014
|
Emerging Markets Long/Short Equity
|
|
|
| Shares
|
| Amount
|
|
|
| Shares
|
| Amount
|
Institutional |
Shares sold | | | | | 10,904,713 | | | $ | 113,157,732 | | | | | | | | 47,440,774 | | | $ | 489,242,017 | |
Shares issued in reinvestment of distributions | | | | | — | | | | — | | | | | | | | 207,731 | | | | 2,177,025 | |
Shares redeemed | | | | | (15,496,748 | ) | | | (160,855,057 | ) | | | | | | | (38,792,599 | ) | | | (398,103,561 | ) |
Net increase (decrease) | | | | | (4,592,035 | ) | | $ | (47,697,325 | ) | | | | | | | 8,855,906 | | | $ | 93,315,481 | |
|
Investor A
|
Shares sold | | | | | 252,633 | | | $ | 2,612,053 | | | | | | | | 8,527,033 | | | $ | 88,740,800 | |
Shares issued in reinvestment of distributions | | | | | — | | | | — | | | | | | | | 78,499 | | | | 819,531 | |
Shares redeemed | | | | | (3,593,828 | ) | | | (37,138,268 | ) | | | | | | | (17,942,596 | ) | | | (183,792,179 | ) |
Net decrease | | | | | (3,341,195 | ) | | $ | (34,526,215 | ) | | | | | | | (9,337,064 | ) | | $ | (94,231,848 | ) |
|
Investor C
|
Shares sold | | | | | 40,193 | | | $ | 406,754 | | | | | | | | 437,110 | | | $ | 4,509,364 | |
Shares issued in reinvestment of distributions | | | | | — | | | | — | | | | | | | | 5,448 | | | | 56,167 | |
Shares redeemed | | | | | (388,931 | ) | | | (3,938,324 | ) | | | | | | | (800,674 | ) | | | (8,088,972 | ) |
Net decrease | | | | | (348,738 | ) | | $ | (3,531,570 | ) | | | | | | | (358,116 | ) | | $ | (3,523,441 | ) |
Total Net Decrease | | | | | (8,281,968 | ) | | $ | (85,755,110 | ) | | | | | | | (839,274 | ) | | $ | (4,439,808 | ) |
| | | | | | | | | | | | | | | | | | | | | | | |
| 64 | BLACKROCK FUNDS | JANUARY 31, 2015
|
| |
| Notes to Financial Statements (concluded) |
|
| | | | Six Months Ended
January 31, 2015
| | | | Year Ended
July 31, 2014
|
Global Long/Short Equity Fund
|
|
|
| Shares
|
| Amount
|
|
|
| Shares
|
| Amount
|
Institutional |
Shares sold | | | | | 53,955,122 | | | $ | 638,634,627 | | | | | | | | 5,825,713 | | | $ | 62,297,256 | |
Shares issued in reinvestment of distributions | | | | | 93,936 | | | | 1,125,345 | | | | | | | | — | | | | — | |
Shares redeemed | | | | | (26,391,077 | ) | | | (312,654,695 | ) | | | | | | | (13,898 | ) | | | (155,749 | ) |
Net increase | | | | | 27,657,980 | | | $ | 327,105,277 | | | | | | | | 5,811,815 | | | $ | 62,141,507 | |
|
Investor A |
Shares sold | | | | | 5,677,799 | | | $ | 66,890,570 | | | | | | | | 1,344,012 | | | $ | 14,968,320 | |
Shares issued in reinvestment of distributions | | | | | 21,895 | | | | 260,983 | | | | | | | | — | | | | — | |
Shares redeemed | | | | | (10,463,159 | ) | | | (122,135,815 | ) | | | | | | | (7,137 | ) | | | (79,937 | ) |
Net increase (decrease) | | | | | (4,763,465 | ) | | $ | (54,984,262 | ) | | | | | | | 1,336,875 | | | $ | 14,888,383 | |
|
Investor C |
Shares sold | | | | | 1,840,377 | | | $ | 21,500,577 | | | | | | | | 230,886 | | | $ | 2,577,446 | |
Shares issued in reinvestment of distributions | | | | | 9,958 | | | | 117,105 | | | | | | | | — | | | | — | |
Shares redeemed | | | | | (1,519,285 | ) | | | (17,721,065 | ) | | | | | | | (7 | ) | | | (75 | ) |
Net increase | | | | | 331,050 | | | $ | 3,896,617 | | | | | | | | 230,879 | | | $ | 2,577,371 | |
Total Net Increase | | | | | 23,225,565 | | | $ | 276,017,632 | | | | | | | | 7,379,569 | | | $ | 79,607,261 | |
10. Subsequent Events:
Management has evaluated the impact of all subsequent events on the Fund through the date the financial statements were issued and has determined that there were no subsequent events requiring adjustment or additional disclosure in the financial statements.
| BLACKROCK FUNDS | JANUARY 31, 2015 | 65
|
Rodney D. Johnson, Chairman of the Board and Trustee
David O. Beim, Trustee
Collette Chilton, Trustee
Frank J. Fabozzi, Trustee
Dr. Matina S. Horner, Trustee
Herbert I. London, Trustee
Ian A. MacKinnon, Trustee
Cynthia A. Montgomery, Trustee
Barbara G. Novick, Trustee
Joseph P. Platt, Trustee
Robert C. Robb, Jr., Trustee
Toby Rosenblatt, Trustee
Mark Stalnecker, Trustee
Kenneth L. Urish, Trustee
Frederick W. Winter, Trustee
John M. Perlowski, President and Chief Executive Officer
Richard Hoerner, CFA, Vice President
Jennifer McGovern, Vice President
Neal Andrews, Chief Financial Officer
Jay Fife, Treasurer
Charles Park, Chief Compliance Officer and Anti-Money Laundering Compliance Officer
Benjamin Archibald, Secretary
| |
Effective September 19, 2014, Brendan Kyne resigned as a Vice President of the Trust and Jennifer McGovern became a Vice President of the Trust. Effective December 31, 2014, Paul L. Audet and Henry Gabbay resigned as Trustees of the Trust and Ronald W. Forbes resigned as a Trustee of the Trust and Co-Chair of the Board. Effective January 1, 2015, Collette Chilton, Barbara G. Novick and Mark Stalnecker were appointed to serve as Trustees of the Trust. Effective March 1, 2015, Charles Park resigned as Anti-Money Laundering Compliance Officer of the Trust and Fernanda Piedra became Anti-Money Laundering Compliance Officer of the Trust. |
|
| |
Investment Advisor and
Co-Administrator
BlackRock Advisors, LLC
Wilmington, DE 19809
Sub-Advisor
BlackRock Fund Advisors
San Francisco, CA 94105
| | Custodian, Accounting Agent and
Co-Administrator
State Street Bank and Trust Company
Boston, MA 02110
Transfer Agent
BNY Mellon Investment Servicing (US) Inc.
Wilmington, DE 19809
| | Independent Registered Public
Accounting Firm
PricewaterhouseCoopers LLP
Philadelphia, PA 19103
Distributor
BlackRock Investments, LLC
New York, NY 10022
| | Legal Counsel
Sidley Austin LLP
New York, NY 10019
Address of the Funds
100 Bellevue Parkway
Wilmington, DE 19809 |
| 66 | BLACKROCK FUNDS | JANUARY 31, 2015
|
General Information
Householding
The Funds will mail only one copy of shareholder documents, including prospectuses, annual and semi-annual reports and proxy statements, to shareholders with multiple accounts at the same address. This practice is commonly called “householding” and is intended to reduce expenses and eliminate duplicate mailings of shareholder documents. Mailings of your shareholder documents may be householded indefinitely unless you instruct us otherwise. If you do not want the mailing of these documents to be combined with those for other members of your household, please call the Funds at (800) 441-7762.
Availability of Quarterly Schedule of Investments
The Funds file their complete schedule of portfolio holdings with the SEC for the first and third quarters of each fiscal year on Form N-Q. The Funds’ Forms N-Q are available on the SEC’s website at http://www.sec.gov and may also be reviewed and copied at the SEC’s Public Reference Room in Washington, DC. Information on how to access documents on the SEC’s website without charge may be obtained by calling (800) SEC-0330. The Funds’ Forms N-Q may also be obtained upon request and without charge by calling (800) 441-7762.
Availability of Proxy Voting Policies and Procedures
A description of the policies and procedures that the Funds use to determine how to vote proxies relating to portfolio securities is available upon request and without charge, (1) by calling (800) 441-7762; (2) at http://www.blackrock.com; and (3) on the SEC’s website at http://www.sec.gov.
Availability of Proxy Voting Record
Information about how the Funds voted proxies relating to securities held in each Fund’s portfolio during the most recent 12-month period ended June 30 is available upon request and without charge (1) at http://www.blackrock.com or by calling (800) 441-7762 and (2) on the SEC’s website at http://www.sec.gov.
BlackRock’s Mutual Fund Family
BlackRock offers a diverse lineup of open-end mutual funds crossing all investment styles and managed by experts in equity, fixed income and tax-exempt investing. Visit BlackRock online at http://www.blackrock.com for more information.
| BLACKROCK FUNDS | JANUARY 31, 2015 | 67
|
| |
| Additional Information (continued) |
|
Shareholder Privileges
Account Information
Call us at (800) 441-7762 from 8:00 AM to 6:00 PM EST on any business day to get information about your account balances, recent transactions and share prices. You can also reach us on the Web at http://www.blackrock.com/funds.
Automatic Investment Plans
Investor Class shareholders who want to invest regularly can arrange to have $50 or more automatically deducted from their checking or savings account and invested in any of the BlackRock funds.
Systematic Withdrawal Plans
Investor Class shareholders can establish a systematic withdrawal plan and receive periodic payments of $50 or more from their BlackRock funds, as long as their account balance is at least $10,000.
Retirement Plans
Shareholders may make investments in conjunction with Traditional, Rollover, Roth, Coverdell, Simple IRAs, SEP IRAs and 403(b) Plans.
| 68 | BLACKROCK FUNDS | JANUARY 31, 2015
|
| |
| Additional Information (concluded) |
|
BlackRock Privacy Principles
BlackRock is committed to maintaining the privacy of its current and former fund investors and individual clients (collectively, “Clients”) and to safeguarding their non-public personal information. The following information is provided to help you understand what personal information BlackRock collects, how we protect that information and why in certain cases we share such information with select parties.
If you are located in a jurisdiction where specific laws, rules or regulations require BlackRock to provide you with additional or different privacy-related rights beyond what is set forth below, then BlackRock will comply with those specific laws, rules or regulations.
BlackRock obtains or verifies personal non-public information from and about you from different sources, including the following: (i) information we receive from you or, if applicable, your financial intermediary, on applications, forms or other documents; (ii) information about your transactions with us, our affiliates, or others; (iii) information we receive from a consumer reporting agency; and (iv) from visits to our websites.
BlackRock does not sell or disclose to non-affiliated third parties any non-public personal information about its Clients, except as permitted by law or as is necessary to respond to regulatory requests or to service Client accounts. These non-affiliated third parties are required to protect the confidentiality and security of this information and to use it only for its intended purpose.
We may share information with our affiliates to service your account or to provide you with information about other BlackRock products or services that may be of interest to you. In addition, BlackRock restricts access to non-public personal information about its Clients to those BlackRock employees with a legitimate business need for the information. BlackRock maintains physical, electronic and procedural safeguards that are designed to protect the non-public personal information of its Clients, including procedures relating to the proper storage and disposal of such information.
| BLACKROCK FUNDS | JANUARY 31, 2015 | 69
|
[THIS PAGE INTENTIONALLY LEFT BLANK]
[THIS PAGE INTENTIONALLY LEFT BLANK]
The report is transmitted to shareholders only. It is not authorized for use as an offer of sale or a solicitation of an offer to buy shares of the Funds unless accompanied or preceded by that Fund’s current prospectus. Past performance results shown in this report should not be considered a representation of future performance. Investment returns and principal value of shares will fluctuate so that shares, when redeemed, may be worth more or less than their original cost. Statements and other information herein are as dated and are subject to change. Please see each Fund’s prospectus for a description of risks associated with global investments.
EMLSGLS-1/15-SAR | | 
| |
Item 2 – Code of Ethics – Not Applicable to this semi-annual report
Item 3 – Audit Committee Financial Expert – Not Applicable to this semi-annual report
Item 4 – Principal Accountant Fees and Services – Not Applicable to this semi-annual report
Item 5 – Audit Committee of Listed Registrants – Not Applicable
Item 6 – Investments
(a) The registrant’s Schedule of Investments is included as part of the Report to Stockholders filed under Item 1 of this Form.
(b) Not Applicable due to no such divestments during the semi-annual period covered since the previous Form N-CSR filing.
Item 7 – Disclosure of Proxy Voting Policies and Procedures for Closed-End Management Investment Companies – Not Applicable
Item 8 – Portfolio Managers of Closed-End Management Investment Companies – Not Applicable
Item 9 – Purchases of Equity Securities by Closed-End Management Investment Company and Affiliated Purchasers – Not Applicable
Item 10 – Submission of Matters to a Vote of Security Holders –There have been no material changes to these procedures.
Item 11 – Controls and Procedures
(a) – The registrant’s principal executive and principal financial officers, or persons performing similar functions, have concluded that the registrant’s disclosure controls and procedures (as defined in Rule 30a-3(c) under the Investment Company Act of 1940, as amended (the “1940 Act”)) are effective as of a date within 90 days of the filing of this report based on the evaluation of these controls and procedures required by Rule 30a-3(b) under the 1940 Act and Rule 15d-15(b) under the Securities Exchange Act of 1934, as amended.
(b) – There were no changes in the registrant’s internal control over financial reporting (as defined in Rule 30a-3(d) under the 1940 Act) that occurred during the second fiscal quarter of the period covered by this report that have materially affected, or are reasonably likely to materially affect, the registrant’s internal control over financial reporting.
Item 12 – Exhibits attached hereto
| | (a)(1) – Code of Ethics – Not Applicable to this semi-annual report |
| | (a)(2) – Certifications – Attached hereto |
(a)(3) – Not Applicable
(b) – Certifications – Attached hereto
Pursuant to the requirements of the Securities Exchange Act of 1934 and the Investment Company Act of 1940, the registrant has duly caused this report to be signed on its behalf by the undersigned, thereunto duly authorized.
BlackRock Funds
By: /s/ John M. Perlowski
John M. Perlowski
Chief Executive Officer (principal executive officer) of
BlackRock Funds
Date: April 2, 2015
Pursuant to the requirements of the Securities Exchange Act of 1934 and the Investment Company Act of 1940, this report has been signed below by the following persons on behalf of the registrant and in the capacities and on the dates indicated.
By: /s/ John M. Perlowski
John M. Perlowski
Chief Executive Officer (principal executive officer) of
BlackRock Funds
Date: April 2, 2015
By: /s/ Neal J. Andrews
Neal J. Andrews
Chief Financial Officer (principal financial officer) of
BlackRock Funds
Date: April 2, 2015