UNITED STATES
SECURITIES AND EXCHANGE COMMISSION
Washington, D.C. 20549
FORM N-CSR
CERTIFIED SHAREHOLDER REPORT OF REGISTERED MANAGEMENT INVESTMENT COMPANIES
Investment Company Act file number: 811-05742
Name of Fund: BlackRock Funds
BlackRock Emerging Market Allocation Portfolio
Fund Address: 100 Bellevue Parkway, Wilmington, DE 19809
Name and address of agent for service: John M. Perlowski, Chief Executive Officer, BlackRock Funds, 55 East 52nd Street, New York, NY 10055
Registrant’s telephone number, including area code: (800) 441-7762
Date of fiscal year end: 10/31/2015
Date of reporting period: 04/30/2015
Item 1 – Report to Stockholders
APRIL 30, 2015
| SEMI-ANNUAL REPORT (UNAUDITED) | |  |
BlackRock Emerging Market Allocation Portfolio | of BlackRock FundsSM
Not FDIC Insured • May Lose Value • No Bank Guarantee |
Table of Contents
Page
The Markets in Review | | | | | 3 | |
Semi-Annual Report:
| | | | | | |
Fund Summary | | | | | 4 | |
Derivative Financial Instruments | | | | | 6 | |
About Fund Performance | | | | | 7 | |
Disclosure of Expenses | | | | | 7 | |
Financial Statements:
| | | | | | |
Consolidated Schedule of Investments | | | | | 8 | |
Consolidated Statement of Assets and Liabilities | | | | | 25 | |
Consolidated Statement of Operations | | | | | 26 | |
Consolidated Statement of Changes in Net Assets | | | | | 27 | |
Consolidated Financial Highlights | | | | | 28 | |
Notes to Consolidated Financial Statements | | | | | 31 | |
Officers and Trustees | | | | | 42 | |
Additional Information | | | | | 43 | |
| | | | | | | |

| 2 | BLACKROCK EMERGING MARKET ALLOCATION PORTFOLIO | APRIL 30, 2015
|
Dear Shareholder,
Financial market performance was generally positive for the 6- and 12-month periods ended April 30, 2015, although volatility increased from the remarkably low levels seen in recent years. In 2014, as the U.S. Federal Reserve (the “Fed”) gradually reduced its bond buying program (which ultimately ended in October), U.S. interest rates surprisingly trended lower and stock prices forged ahead despite high valuations on the back of a multi-year bull market.
Around mid-year, however, geopolitical tensions intensified in Ukraine and the Middle East and oil prices became highly volatile, stoking worries about economic growth outside the United States. As the U.S. economy continued to post stronger data, investors grew concerned that the Fed would raise short-term rates sooner than previously anticipated. The U.S. dollar appreciated and global credit markets tightened, ultimately putting a strain on investor flows, and financial markets broadly weakened in the third quarter.
U.S. economic growth picked up considerably in the fourth quarter while the broader global economy showed signs of slowing. U.S. markets significantly outperformed international markets during this period even as the European Central Bank (“ECB”) and the Bank of Japan eased monetary policy, which drove further strengthening in the U.S. dollar. Oil prices plummeted due to a global supply-and-demand imbalance, sparking a selloff in energy-related assets and stress in emerging markets. Fixed income investors piled into U.S. Treasuries as their persistently low yields became attractive as compared to international sovereign debt.
Equity markets reversed in 2015, with U.S. stocks underperforming international markets. Investors had held high expectations for the U.S. economy, but after a harsh winter, first-quarter data disappointed and high valuations took their toll on U.S. stocks. The continued appreciation of the dollar was an additional headwind for exporters. Although U.S. economic momentum had broadly weakened, the labor market — a key determinant for the Fed’s decision on the future of interest rate policy — showed improvement, keeping investors on edge about when to expect the first rate hike.
In contrast, economic reports in Europe and Asia easily beat investors’ very low expectations, and accommodative policies from central banks in those regions helped international equities rebound. The ECB’s asset purchase program was the largest in scale and effect on the markets. Global sentiment improved with a ceasefire in Ukraine and an improving outlook for Greece’s continued membership in the eurozone. Emerging market stocks rebounded in April as oil prices appeared to stabilize.
At BlackRock, we believe investors need to think globally, extend their scope across a broad array of asset classes and be prepared to move freely as market conditions change over time. We encourage you to talk with your financial advisor and visit blackrock.com for further insight about investing in today’s markets.
Sincerely,
Rob Kapito
President, BlackRock Advisors, LLC
Rob Kapito
President, BlackRock Advisors, LLC
Total Returns as of April 30, 2015 | | | | 6-month | | 12-month |
U.S. large cap equities
(S&P 500® Index) | | | | | 4.40 | % | | | 12.98 | % |
U.S. small cap equities
(Russell 2000® Index) | | | | | 4.65 | | | | 9.71 | |
International equities
(MSCI Europe, Australasia, Far East Index) | | | | | 6.81 | | | | 1.66 | |
Emerging market equities
(MSCI Emerging
Markets Index) | | | | | 3.92 | | | | 7.80 | |
3-month Treasury bill
(BofA Merrill Lynch 3-Month U.S. Treasury Bill Index) | | | | | 0.01 | | | | 0.02 | |
U.S. Treasury securities
(BofA Merrill Lynch
10-Year U.S.
Treasury Index) | | | | | 3.59 | | | | 8.03 | |
U.S. investment grade
bonds (Barclays U.S. Aggregate Bond Index) | | | | | 2.06 | | | | 4.46 | |
Tax-exempt municipal
bonds (S&P Municipal
Bond Index) | | | | | 1.27 | | | | 4.86 | |
U.S. high yield bonds
(Barclays U.S. Corporate
High Yield 2% Issuer
Capped Index) | | | | | 1.52 | | | | 2.59 | |
Past performance is no guarantee of future results. Index performance is shown for illustrative purposes only. You cannot invest directly in an index.
| | THIS PAGE NOT PART OF YOUR FUND REPORT | 3 |
| |
| Fund Summary as of April 30, 2015 |
|
Investment Objective
BlackRock Emerging Market Allocation Portfolio’s (the “Fund”) investment objective is to seek total return.
Portfolio Management Commentary
How did the Fund perform?
| • | | For the six-month period ended April 30, 2015, the Fund outperformed its custom blended benchmark (60% MSCI Emerging Markets Index (“MSCI EM” or the “equity benchmark”)/40% JPMorgan Emerging Markets Bond Index Plus (“EMBI+” or the “fixed income benchmark”). |
What factors influenced performance?
| • | | As part of its investment strategy, the Fund uses derivatives, including total return swaps, to achieve exposure to specific markets or to manage market and/or equity risks. Through the use of total return swaps, the Fund seeks to manage more effectively its desired exposures to fixed income and equity markets. |
| • | | Within equities, stock selection and thematic investment ideas were the largest contributors to performance relative to the benchmark. Overweights in Chinese transportation and telecommunication stocks, which were based on analyst sentiment and the investment advisor’s thematic views, were among the most important contributors. An underweight position in oil & gas producers also contributed to outperformance, as energy stocks lagged due to the decline in oil prices. |
| • | | Within fixed income, the Fund’s underweights in Venezuela and Ukraine made important contributions to performance given that both markets underperformed during that period. |
| • | | The largest detractors from performance within equities were the Fund’s underweight positions in Mexican telecommunications and media stocks, as well as its short position in computer producers, mainly in China and South Korea. On the fixed income side, the most important detractors from performance were slight underweight positions in the sovereign bonds of Turkey, Hungary and Mexico. |
Describe recent portfolio activity.
| • | | At period end, the Fund was slightly overweight in both fixed income and equities, given the use of a small amount of leverage to compensate for the lower risk profile of the Fund versus the custom blended benchmark. Within fixed income, the Fund remained strategically biased toward high quality issuers and significantly underweight in the lowest rated benchmark constituents. |
| • | | As oil prices declined during late 2014, the Fund increased its short position in oil producing countries such as Russia and Mexico, while overweighting those countries that stood to gain the greatest benefit from lower oil prices, such as India. The positions were gradually scaled back to neutral as oil prices started to stabilize at the beginning of 2015. |
| • | | The Fund’s cash exposure resulted from maintaining long and short positions via the use of derivatives. The Fund was fully invested throughout the period, and the cash exposure did not have a material impact on performance. |
Describe portfolio positioning at period end.
| • | | At the end of the period, the Fund’s largest equity overweights were in Indonesia, Philippines and Turkey, while its largest equity underweights were in Thailand, South Korea and China. Within fixed income, the Fund’s largest out-of-benchmark allocations were to the bonds of developed market companies that conduct a significant amount of business in the emerging markets. Within the emerging markets, the Fund was overweight in investment grade Asian countries, as well as in Peru, Uruguay and Chile. |
| 4 | BLACKROCK EMERGING MARKET ALLOCATION PORTFOLIO | APRIL 30, 2015
|
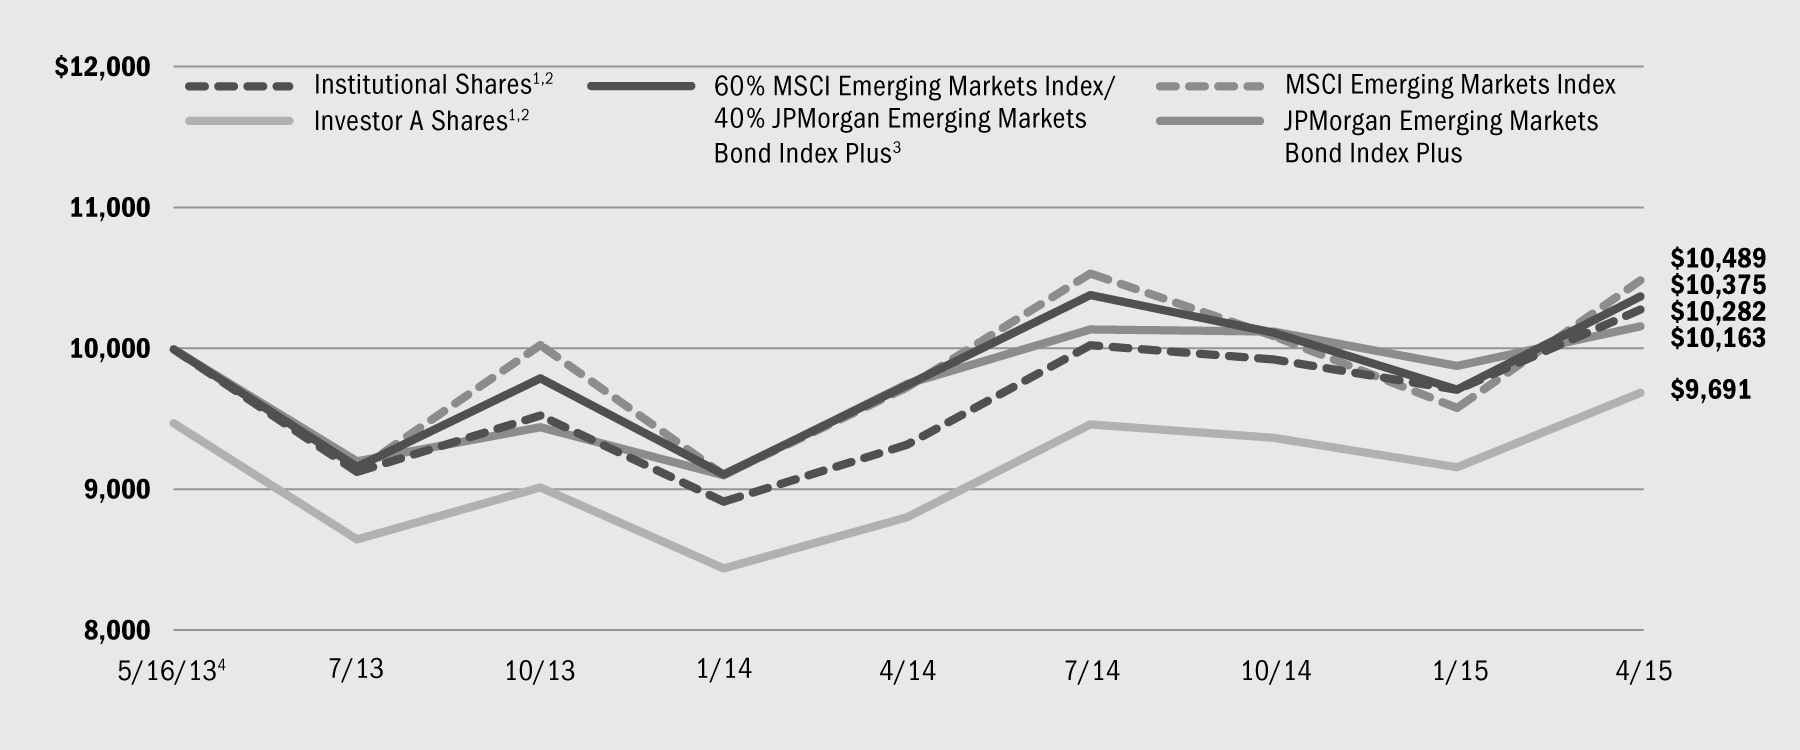
Total Return Based on a $10,000 Investment
| 1 | | Assuming maximum sales charges, if any, transaction costs and other operating expenses, including investment advisory fees. Institutional Shares do not have a sales charge. |
| 2 | | Under normal circumstances, the Fund seeks to invest at least 80% of its net assets plus any borrowings for investment purposes in equity and debt instruments and related derivative instruments issued by, or tied economically to, companies or other issuers located in emerging markets. |
| 3 | | A customized weighted index comprised of the returns of the (60%) MSCI Emerging Markets Index and (40%) JPMorgan Emerging Markets Bond Index Plus. The MSCI Emerging Markets Index is a free float-adjusted market capitalization index that is designed to measure equity market performance of emerging markets and consists of the following 23 emerging market country indexes: Brazil, Chile, China, Colombia, Czech Republic, Egypt, Greece, Hungary, India, Indonesia, Korea, Malaysia, Mexico, Peru, Philippines, Poland, Qatar, Russia, South Africa, Taiwan, Thailand, Turkey and United Arab Emirates. JPMorgan Emerging Markets Bond Index Plus is a market capitalization-weighted index that tracks returns for actively traded external debt instruments in emerging markets. |
| 4 | | Commencement of operations. |
Performance Summary for the Period Ended April 30, 2015
| | | | | | Average Annual Total Returns5
|
|
| | | | | | 1 Year
| | Since Inception6
|
|
|
|
|
| 6-Month
Total Returns
|
| w/o sales
charge
|
| w/sales
charge
|
| w/o sales
charge
|
| w/sales
charge
|
Institutional | | | | | 3.57 | % | | | 10.29 | % | | | N/A | | | | 1.43 | % | | | N/A | |
Investor A | | | | | 3.41 | | | | 10.03 | | | | 4.25 | % | | | 1.16 | | | | (1.59 | )% |
Investor C | | | | | 3.08 | | | | 9.26 | | | | 8.26 | | | | 0.46 | | | | 0.46 | |
60% MSCI Emerging Markets Index/40% JPMorgan Emerging Markets Bond Index Plus | | | | | 2.54 | | | | 6.45 | | | | N/A | | | | 1.90 | | | | N/A | |
MSCI Emerging Markets Index | | | | | 3.92 | | | | 7.80 | | | | N/A | | | | 2.47 | | | | N/A | |
JPMorgan Emerging Markets Bond Index Plus | | | | | 0.36 | | | | 4.18 | | | | N/A | | | | 0.83 | | | | N/A | |
| 5 | | Assuming maximum sales charges, if any. Average annual total returns with and without sales charges reflect reductions for distribution and service fees. See “About Fund Performance” on page 7 for a detailed description of share classes, including any related sales charges and fees. |
| 6 | | The Fund commenced operations on May 16, 2013. |
| | N/A — Not applicable as share class and index do not have a sales charge. |
| | Past performance is not indicative of future results. |
Expense Example
| | | Actual | | Hypothetical8 | | |
| | | Beginning
Account Value
November 1, 2014 | | Ending
Account Value
April 30, 2015 | | Expenses Paid
During the Period7 | | Beginning
Account Value
November 1, 2014 | | Ending
Account Value
April 30, 2015 | | Expenses Paid
During the Period7 | | Annualized
Expense Ratio |
| Institutional | | $1,000.00 | | $1,035.70 | | $ 7.07 | | $1,000.00 | | $1,017.85 | | $ 7.00 | | 1.40% |
| Investor A | | $1,000.00 | | $1,034.10 | | $ 8.32 | | $1,000.00 | | $1,016.61 | | $ 8.25 | | 1.65% |
| Investor C | | $1,000.00 | | $1,030.80 | | $12.08 | | $1,000.00 | | $1,102.89 | | $11.98 | | 2.40% |
| 7 | | For each class of the Fund, expenses are equal to the annualized net expense ratio for the class, multiplied by the average account value over the period, multiplied by 181/365 (to reflect the one-half year period shown). |
| 8 | | Hypothetical 5% annual return before expenses is calculated by prorating the number of days in the most recent fiscal half year divided by 365. |
See “Disclosure of Expenses” on Page 7 for further information on how expenses were calculated.
| BLACKROCK EMERGING MARKET ALLOCATION PORTFOLIO | APRIL 30, 2015 | 5
|
Portfolio Information as of April 30, 2015
| Portfolio Composition | | | | Percent of
Long-Term Investments |
Foreign Government Obligations | | | | | 67 | % |
Corporate Bonds | | | | | 15 | |
Foreign Agency Obligations | | | | | 9 | |
Investment Companies | | | | | 9 | |
| | | | Percent of Total investments1 | |
Geographic Allocation
| | | | Long | | Short | | Total |
China | | | | | 10 | % | | | 6 | % | | | 16 | % |
Taiwan | | | | | 8 | | | | 3 | | | | 11 | |
South Korea | | | | | 6 | | | | 4 | | | | 10 | |
Brazil | | | | | 7 | | | | 2 | | | | 9 | |
Hong Kong | | | | | 5 | | | | 2 | | | | 7 | |
United States | | | | | 7 | | | | — | | | | 7 | |
Mexico | | | | | 4 | | | | 2 | | | | 6 | |
South Africa | | | | | 4 | | | | 1 | | | | 5 | |
Turkey | | | | | 4 | | | | 1 | | | | 5 | |
Russia | | | | | 3 | | | | — | | | | 3 | |
Poland | | | | | 3 | | | | — | | | | 3 | |
Philippines | | | | | 2 | | | | — | | | | 2 | |
Malaysia | | | | | 2 | | | | — | | | | 2 | |
Indonesia | | | | | 2 | | | | — | | | | 2 | |
Thailand | | | | | 1 | | | | 1 | | | | 2 | |
Colombia | | | | | 1 | | | | 1 | | | | 2 | |
Other2 | | | | | 6 | | | | 2 | | | | 8 | |
| | | | | | | | | | | | | | |
Total
| | | | | 75 | % | | | 25 | % | | | 100 | % |
| 1 | | Total investments include the gross notional values of long and short equity securities of the underlying derivative contracts utilized by the Fund and exclude short-term securities. |
| 2 | | Other includes a 1% or less investment in each of the following countries: Argentina, Australia, Austria, Belgium, Canada, Chile, Czech Republic, Denmark, Egypt, Finland, France, Germany, Hungary, India, Ireland, Israel, Italy, Japan, Kazakhstan, Lithuania, Malta, Netherlands, Norway, Panama, Peru, Romania, Saudi Arabia, Singapore, Spain, Sweden, Switzerland, Ukraine, United Arab Emirates, United Kingdom, Uruguay and Venezuela. |
Derivative Financial Instruments
The Fund may invest in various derivative financial instruments. Derivative financial instruments are used to obtain exposure to a security, index and/or market without owning or taking physical custody of securities or to manage market, equity, credit, interest rate, foreign currency exchange rate, commodity and/or other risks. Derivative financial instruments may give rise to a form of economic leverage. Derivative financial instruments also involve risks, including the imperfect correlation between the value of a derivative financial instrument and the underlying asset, possible default of the counterparty to the transaction or illiquidity of the derivative
financial instrument. The Fund’s ability to use a derivative financial instrument successfully depends on the investment advisor’s ability to predict pertinent market movements accurately, which cannot be assured. The use of derivative financial instruments may result in losses greater than if they had not been used, may limit the amount of appreciation the Fund can realize on an investment and/or may result in lower distributions paid to shareholders. The Fund’s investments in these instruments are discussed in detail in the Notes to Consolidated Financial Statements.
| 6 | BLACKROCK EMERGING MARKET ALLOCATION PORTFOLIO | APRIL 30, 2015
|
| • | | Institutional Shares are not subject to any sales charge. These shares bear no ongoing distribution or service fees and are available only to certain eligible investors. |
| • | | Investor A Shares are subject to a maximum initial sales charge (front-end load) of 5.25% and a service fee of 0.25% per year (but no distribution fee). Certain redemptions of these shares may be subject to a contingent deferred sales charge (“CDSC”) where no initial sales charge was paid at the time of purchase. These shares are generally available through financial intermediaries. |
| • | | Investor C Shares are subject to a 1.00% CDSC if redeemed within one year of purchase. In addition, these shares are subject to a distribution fee of 0.75% per year and a service fee of 0.25% per year. These shares are generally available through financial intermediaries. |
Performance information reflects past performance and does not guarantee future results. Current performance may be lower or higher than the performance data quoted. Refer to www.blackrock.com/funds to obtain performance data current to the most recent month end.
Performance results do not reflect the deduction of taxes that a shareholder would pay on Fund distributions or the redemption of Fund shares. Figures shown in the performance tables on the previous page assume reinvestment of all distributions, if any, at net asset value (“NAV”) on the ex-dividend date. Investment return and principal value of shares will fluctuate so that shares, when redeemed, may be worth more or less than their original cost. Distributions paid to each class of shares will vary because of the different levels of service, distribution and transfer agency fees applicable to each class, which are deducted from the income available to be paid to shareholders.
BlackRock Advisors, LLC (the “Manager”), the Fund’s investment advisor, waived and/or reimbursed a portion of the Fund’s expenses. Without such waiver and/or reimbursement, the Fund’s performance would have been lower. The Manager is under no obligation to waive and/or reimburse or to continue waiving and/or reimbursing its fees and such voluntary waiver may be reduced or discontinued at any time. See Note 4 of the Notes to Consolidated Financial Statements for additional information on waivers and reimbursements.
Disclosure of Expenses
Shareholders of the Fund may incur the following charges: (a) transactional expenses, such as sales charges; and (b) operating expenses, including investment advisory fees, service and distribution fees, including 12b-1 fees, and other Fund expenses. The expense example on the previous page (which is based on a hypothetical investment of $1,000 invested on November 1, 2014 and held through April 30, 2015) is intended to assist shareholders both in calculating expenses based on an investment in the Fund and in comparing these expenses with similar costs of investing in other mutual funds.
The expense example provides information about actual account values and actual expenses. In order to estimate the expenses a shareholder paid during the period covered by this report, shareholders can divide their account value by $1,000 and then multiply the result by the number corresponding to their share class under the heading entitled “Expenses Paid During the Period.”
The expense example also provides information about hypothetical account values and hypothetical expenses based on the Fund’s actual expense ratio and an assumed rate of return of 5% per year before expenses. In order to assist shareholders in comparing the ongoing expenses of investing in the Fund and other funds, compare the 5% hypothetical examples with the 5% hypothetical examples that appear in shareholder reports of other funds.
The expenses shown in the expense example are intended to highlight shareholders’ ongoing costs only and do not reflect any transactional expenses, such as sales charges, if any. Therefore, the hypothetical examples are useful in comparing ongoing expenses only, and will not help shareholders determine the relative total expenses of owning different funds. If these transactional expenses were included, shareholder expenses would have been higher.
| BLACKROCK EMERGING MARKET ALLOCATION PORTFOLIO | APRIL 30, 2015 | 7
|
| |
| Consolidated Schedule of Investments April 30, 2015 (Unaudited) |
(Percentages shown are based on Net Assets)
|
| | |
| Corporate Bonds | | | | Par (000) | | Value |
United States — 8.6% | | | | | | | | | | |
3M Co., 3.88%, 6/15/44 | | | | $ | 100 | | | $ | 103,269 | |
Amazon.com, Inc.: | | | | | | | | | | |
4.80%, 12/05/34 | | | | | 100 | | | | 106,183 | |
4.95%, 12/05/44 | | | | | 75 | | | | 79,674 | |
American Express Co., 4.05%, 12/03/42 | | | | | 75 | | | | 72,331 | |
Apple, Inc.: | | | | | | | | | | |
3.85%, 5/04/43 | | | | | 150 | | | | 144,986 | |
3.45%, 2/09/45 | | | | | 175 | | | | 156,490 | |
Bristol-Myers Squibb Co., 4.50%, 3/01/44 | | | | | 100 | | | | 110,397 | |
Eli Lilly & Co.: | | | | | | | | | | |
5.55%, 3/15/37 | | | | | 75 | | | | 92,135 | |
3.70%, 3/01/45 | | | | | 100 | | | | 96,648 | |
General Electric Co.: | | | | | | | | | | |
4.13%, 10/09/42 | | | | | 125 | | | | 129,694 | |
4.50%, 3/11/44 | | | | | 100 | | | | 109,767 | |
The Goldman Sachs Group, Inc.: | | | | | | | | | | |
6.13%, 2/15/33 | | | | | 200 | | | | 249,576 | |
4.80%, 7/08/44 | | | | | 150 | | | | 159,441 | |
Intel Corp.: | | | | | | | | | | |
4.80%, 10/01/41 | | | | | 75 | | | | 81,497 | |
4.25%, 12/15/42 | | | | | 100 | | | | 100,961 | |
International Business Machines Corp.: | | | | | | | | | | |
5.60%, 11/30/39 | | | | | 75 | | | | 90,334 | |
4.00%, 6/20/42 | | | | | 75 | | | | 72,338 | |
Merck & Co., Inc.: | | | | | | | | | | |
6.50%, 12/01/33 | | | | | 100 | | | | 134,595 | |
3.70%, 2/10/45 | | | | | 150 | | | | 144,977 | |
Microsoft Corp.: | | | | | | | | | | |
3.50%, 2/12/35 | | | | | 75 | | | | 71,480 | |
5.30%, 2/08/41 | | | | | 175 | | | | 209,434 | |
3.75%, 2/12/45 | | | | | 200 | | | | 189,478 | |
Morgan Stanley: | | | | | | | | | | |
6.38%, 7/24/42 | | | | | 75 | | | | 96,927 | |
4.30%, 1/27/45 | | | | | 225 | | | | 221,250 | |
Oracle Corp.: | | | | | | | | | | |
4.30%, 7/08/34 | | | | | 225 | | | | 233,789 | |
5.38%, 7/15/40 | | | | | 200 | | | | 234,898 | |
PepsiCo, Inc.: | | | | | | | | | | |
4.00%, 3/05/42 | | | | | 100 | | | | 101,974 | |
4.25%, 10/22/44 | | | | | 100 | | | | 104,780 | |
Pfizer, Inc.: | | | | | | | | | | |
7.20%, 3/15/39 | | | | | 100 | | | | 142,793 | |
4.40%, 5/15/44 | | | | | 125 | | | | 131,862 | |
The Procter & Gamble Co., 5.55%, 3/05/37 | | | | | 150 | | | | 193,807 | |
Wal-Mart Stores, Inc.: | | | | | | | | | | |
5.25%, 9/01/35 | | | | | 250 | | | | 302,958 | |
6.50%, 8/15/37 | | | | | 200 | | | | 273,777 | |
5.63%, 4/01/40 | | | | | 75 | | | | 93,956 | |
5.63%, 4/15/41 | | | | | 200 | | | | 251,763 | |
4.30%, 4/22/44 | | | | | 200 | | | | 215,453 | |
| | | | | | | | | 5,305,672 | |
Total Corporate Bonds — 8.6% | | | | | | | | | 5,305,672 | |
| Foreign Agency Obligations | | | | Par (000) | | Value |
Chile — 0.7% | | | | | | | | | | |
Corp. Nacional del Cobre de Chile: | | | | | | | | | | |
4.50%, 8/13/23 | | | | $ | 200 | | | $ | 215,502 | |
4.25%, 7/17/42 | | | | | 200 | | | | 189,464 | |
| | | | | | | | | 404,966 | |
China — 0.3% | | | | | | | | | | |
State Grid Overseas Investment 2013, Ltd., 3.13%, 5/22/23 | | | | | 200 | | | | 200,899 | |
Hong Kong — 0.5% | | | | | | | | | | |
Sinochem Overseas Capital Co., Ltd., 4.50%, 11/12/20 | | | | | 100 | | | | 107,724 | |
Sinopec Group Overseas Development 2012, Ltd., 3.90%, 5/17/22 | | | | | 200 | | | | 208,166 | |
| | | | | | | | | 315,890 | |
Kazakhstan — 0.2% | | | | | | | | | | |
KazMunayGas National Co. JSC, 9.13%, 7/02/18 | | | | | 100 | | | | 113,050 | |
Malaysia — 1.0% | | | | | | | | | | |
Petroliam Nasional BHD, 7.63%, 10/15/26 | | | | | 200 | | | | 275,052 | |
Petronas Capital, Ltd., 5.25%, 8/12/19 | | | | | 300 | | | | 335,100 | |
| | | | | | | | | 610,152 | |
Mexico — 0.3% | | | | | | | | | | |
Petroleos Mexicanos: | | | | | | | | | | |
5.50%, 1/21/21 | | | | | 100 | | | | 109,750 | |
6.50%, 6/02/41 | | | | | 50 | | | | 55,187 | |
| | | | | | | | | 164,937 | |
Netherlands — 0.3% | | | | | | | | | | |
Kazakhstan Temir Zholy Finance BV, 6.38%, 10/06/20 | | | | | 200 | | | | 211,240 | |
Philippines — 0.3% | | | | | | | | | | |
Power Sector Assets & Liabilities Management Corp., 7.39%, 12/02/24 | | | | | 150 | | | | 202,125 | |
South Africa — 0.3% | | | | | | | | | | |
Eskom Holdings SOC, Ltd., 5.75%, 1/26/21 | | | | | 200 | | | | 199,200 | |
United Kingdom — 1.3% | | | | | | | | | | |
HSBC Holdings PLC: | | | | | | | | | | |
6.50%, 9/15/37 | | | | | 225 | | | | 282,813 | |
6.10%, 1/14/42 | | | | | 225 | | | | 292,310 | |
Sinopec Group Overseas Development 2013, Ltd., 4.38%, 10/17/23 | | | | | 200 | | | | 214,950 | |
| | | | | | | | | 790,073 | |
Total Foreign Agency Obligations — 5.2% | | | 3,212,532 | |
Portfolio Abbreviations
| | | | ADR
ETF
GDR
INR
JSC | | American Depositary Receipts
Exchange-Traded Fund
Global Depositary Receipts
Indian Rupee
Joint Stock Company | | LIBOR
MSCI
REIT
THB
TWD | | London InterBank Offered Rate
Morgan Stanley Capital International
Real Estate Investment Trust
Thai Baht
Taiwan Dollar |
See Notes to Consolidated Financial Statements.
| 8 | BLACKROCK EMERGING MARKET ALLOCATION PORTFOLIO | APRIL 30, 2015
|
| |
| Consolidated Schedule of Investments (continued) |
(Percentages shown are based on Net Assets)
|
| Foreign Government Obligations | Par (000) | | Value |
Argentine Republic Government International Bond: | | | |
8.75%, 6/02/17 | | | | $ | 25 | | | $ | 24,375 | |
8.28%, 12/31/33 | | | | | 189 | | | | 191,270 | |
2.50%, 12/31/38 | | | | | 165 | | | | 95,288 | |
Banco Nacional de Desenvolvimento Economico e Social, 5.50%, 7/12/20 | | | | | 100 | | | | 105,625 | |
Brazilian Government International Bond: | | | | |
4.88%, 1/22/21 | | | | | 900 | | | | 961,650 | |
8.88%, 4/15/24 | | | | | 100 | | | | 135,000 | |
4.25%, 1/07/25 | | | | | 400 | | | | 394,442 | |
8.75%, 2/04/25 | | | | | 250 | | | | 335,000 | |
8.25%, 1/20/34 | | | | | 200 | | | | 264,000 | |
7.13%, 1/20/37 | | | | | 300 | | | | 363,750 | |
5.00%, 1/27/45 | | | | | 200 | | | | 187,500 | |
Chile Government International Bond, 2.25%, 10/30/22 | | | | | 250 | | | | 249,375 | |
Colombia Government International Bond: | | | | |
4.38%, 7/12/21 | | | | | 800 | | | | 848,800 | |
4.00%, 2/26/24 | | | | | 200 | | | | 205,500 | |
8.13%, 5/21/24 | | | | | 150 | | | | 198,937 | |
7.38%, 9/18/37 | | | | | 100 | | | | 133,250 | |
6.13%, 1/18/41 | | | | | 250 | | | | 292,500 | |
5.63%, 2/26/44 | | | | | 200 | | | | 220,500 | |
Indonesia Government International Bond: | | | | |
3.75%, 4/25/22 | | | | | 600 | | | | 611,250 | |
8.50%, 10/12/35 | | | | | 100 | | | | 144,500 | |
6.63%, 2/17/37 | | | | | 100 | | | | 121,375 | |
7.75%, 1/17/38 | | | | | 200 | | | | 272,750 | |
Lithuania Government International Bond: | | | | |
5.13%, 9/14/17 | | | | | 200 | | | | 217,400 | |
7.38%, 2/11/20 | | | | | 500 | | | | 607,000 | |
6.13%, 3/09/21 | | | | | 700 | | | | 827,750 | |
6.63%, 2/01/22 | | | | | 200 | | | | 246,452 | |
Mexico Government International Bond: | | | | |
5.63%, 1/15/17 | | | | | 200 | | | | 214,700 | |
5.95%, 3/19/19 | | | | | 150 | | | | 171,225 | |
5.13%, 1/15/20 | | | | | 200 | | | | 224,000 | |
3.63%, 3/15/22 | | | | | 400 | | | | 413,000 | |
4.00%, 10/02/23 | | | | | 400 | | | | 420,400 | |
8.30%, 8/15/31 | | | | | 200 | | | | 306,000 | |
6.75%, 9/27/34 | | | | | 100 | | | | 132,500 | |
6.05%, 1/11/40 | | | | | 150 | | | | 181,688 | |
4.75%, 3/08/44 | | | | | 330 | | | | 338,827 | |
5.55%, 1/21/45 | | | | | 250 | | | | 285,625 | |
5.75%, 10/12/49 | | | | | 276 | | | | 293,940 | |
Panama Government International Bond: | | | | |
7.13%, 1/29/26 | | | | | 500 | | | | 647,500 | |
6.70%, 1/26/36 | | | | | 100 | | | | 129,250 | |
4.30%, 4/29/53 | | | | | 200 | | | | 189,000 | |
Peruvian Government International Bond: | | | | |
7.13%, 3/30/19 | | | | | 200 | | | | 237,000 | |
8.75%, 11/21/33 | | | | | 100 | | | | 157,750 | |
6.55%, 3/14/37 | | | | | 430 | | | | 569,212 | |
5.63%, 11/18/50 | | | | | 150 | | | | 180,375 | |
Philippine Government International Bond: | | | | |
8.38%, 6/17/19 | | | | | 150 | | | | 188,437 | |
4.00%, 1/15/21 | | | | | 300 | | | | 329,250 | |
5.50%, 3/30/26 | | | | | 400 | | | | 491,000 | |
9.50%, 2/02/30 | | | | | 100 | | | | 167,875 | |
7.75%, 1/14/31 | | | | | 100 | | | | 149,500 | |
6.38%, 10/23/34 | | | | | 400 | | | | 559,000 | |
5.00%, 1/13/37 | | | | | 400 | | | | 488,000 | |
| Foreign Government Obligations | Par (000) | | Value |
Poland Government International Bond: | | | | |
6.38%, 7/15/19 | | | | $ | 200 | | | $ | 234,800 | |
5.13%, 4/21/21 | | | | | 700 | | | | 798,868 | |
5.00%, 3/23/22 | | | | | 200 | | | | 228,150 | |
4.00%, 1/22/24 | | | | | 250 | | | | 272,007 | |
Romanian Government International Bond: | | | | |
6.75%, 2/07/22 | | | | | 100 | | | | 120,250 | |
4.38%, 8/22/23 | | | | | 300 | | | | 318,000 | |
4.88%, 1/22/24 | | | | | 400 | | | | 439,500 | |
6.13%, 1/22/44 | | | | | 126 | | | | 157,601 | |
Russian Foreign Bond — Eurobond: | | | | |
5.00%, 4/29/20 | | | | | 700 | | | | 712,250 | |
4.50%, 4/04/22 | | | | | 200 | | | | 194,464 | |
4.88%, 9/16/23 | | | | | 200 | | | | 196,000 | |
12.75%, 6/24/28 | | | | | 200 | | | | 316,000 | |
7.50%, 3/31/30 | | | | | 375 | | | | 438,649 | |
South Africa Government International Bond: | | | | |
5.88%, 5/30/22 | | | | | 500 | | | | 562,700 | |
5.88%, 9/16/25 | | | | | 200 | | | | 227,900 | |
6.25%, 3/08/41 | | | | | 100 | | | | 119,070 | |
Turkey Government International Bond: | | | | |
6.75%, 4/03/18 | | | | | 600 | | | | 663,000 | |
7.50%, 11/07/19 | | | | | 100 | | | | 116,290 | |
5.13%, 3/25/22 | | | | | 200 | | | | 211,750 | |
5.75%, 3/22/24 | | | | | 200 | | | | 220,408 | |
7.38%, 2/05/25 | | | | | 100 | | | | 122,875 | |
6.88%, 3/17/36 | | | | | 50 | | | | 60,865 | |
6.75%, 5/30/40 | | | | | 100 | | | | 121,250 | |
4.88%, 4/16/43 | | | | | 400 | | | | 386,000 | |
6.63%, 2/17/45 | | | | | 200 | | | | 242,000 | |
Ukraine Government International Bond: | | | | |
6.75%, 11/14/17 | | | | | 100 | | | | 46,500 | |
7.95%, 2/23/21 | | | | | 200 | | | | 91,532 | |
Uruguay Government International Bond, 7.63%, 3/21/36 | | | | | 200 | | | | 279,000 | |
Venezuela Government International Bond: | | | | |
7.75%, 10/13/19 | | | | | 250 | | | | 115,625 | |
12.75%, 8/23/22 | | | | | 250 | | | | 136,875 | |
8.25%, 10/13/24 | | | | | 235 | | | | 102,813 | |
11.75%, 10/21/26 | | | | | 250 | | | | 126,875 | |
9.25%, 9/15/27 | | | | | 185 | | | | 90,650 | |
11.95%, 8/05/31 | | | | | 300 | | | | 151,500 | |
7.00%, 3/31/38 | | | | | 150 | | | | 61,125 | |
Total Foreign Government Obligations — 39.5% | | 24,403,435 | |
|
Investment Companies | | | | | Shares | | | | | |
United States — 5.3% | | | | | | | | | | |
BlackRock Emerging Markets Flexible Dynamic Bond Portfolio (a) | | 316,117 | | | | 2,841,892 | |
iShares MSCI Frontier 100 ETF (a) | | | | | 13,244 | | | | 410,564 | |
Total Investment Companies — 5.3% | | | | | 3,252,456 | |
Total Long-Term Investments
(Cost — $36,067,587) — 58.6% | | | | | | | | | 36,174,095 | |
See Notes to Consolidated Financial Statements.
| BLACKROCK EMERGING MARKET ALLOCATION PORTFOLIO | APRIL 30, 2015 | 9
|
| |
| Consolidated Schedule of Investments (continued) |
(Percentages shown are based on Net Assets) |
| Short-Term Securities | | | | Shares | | Value |
BlackRock Liquidity Funds, TempFund, Institutional Class, 0.03% (a)(b) | | | | | 30,478,690 | | | $ | 30,478,690 | |
Total Short-Term Securities
(Cost — $30,478,690) — 49.3% | | | | | | | | | 30,478,690 | |
Total Investments (Cost — $66,546,277)
— 107.9% | 66,652,785 | |
Liabilities in Excess of Other Assets — (7.9)% | | | | | | | | | (4,893,506 | ) |
Net Assets — 100.0% | | | | | | | | $ | 61,759,279 | |
Notes to Consolidated Schedule of Investments
| (a) | | | | During the six months ended April 30, 2015, investments in issuers considered to be affiliates of the Fund for purposes of Section 2(a)(3) of the Investment Company Act of 1940, as amended, were as follows: |
| Affiliate | | | | Shares
Held at
October 31, 2014 | | Shares
Purchased | | Shares
Sold | | Shares
Held at
April 30,
2015 | | Value at
April 30, 2015 | | Income | | Realized
Gain |
BlackRock Emerging Markets Flexible Dynamic Bond Portfolio | | 309,065 | | | | 7,052 | | | | — | | | | 316,117 | | | $ | 2,841,892 | | | $ | 62,187 | | | | — | |
BlackRock Liquidity Funds, TempFund, Institutional Class | | 24,500,331 | | | | 5,978,359 | 1 | | | — | | | | 30,478,690 | | | $ | 30,478,690 | | | $ | 9,118 | | | | — | |
iShares MSCI Frontier 100 ETF | | 13,244 | | | | — | | | | — | | | | 13,244 | | | $ | 410,564 | | | $ | 39,433 | | | | — | |
| 1 | | Represents net shares purchased. |
| (b) | | | | Represents the current yield as of report date. |
| • | | | | As of April 30, 2015, financial futures contracts outstanding were as follows: |
Contracts
Long | Issue | Exchange | Expiration | | Notional
Value | | Unrealized
Depreciation |
152 | SGX S&P Nifty Index | Singapore Exchange
Derivatives Clearing Limited | May 2015 | $ | 2,509,976 | | $(44,035) |
| • | | | | As of April 30, 2015, forward foreign currency exchange contracts outstanding were as follows: |
Contracts
Purchased | Currency
Sold | Counterparty | Settlement Date | Unrealized
Depreciation |
INR 163,633,417 | USD 2,572,448 | Standard Chartered Bank | 6/30/2015 | $(28,766) |
| • | | | | As of April 30, 2015, OTC interest rate swaps outstanding were as follows: |
| Fixed Rate | Floating Rate | | Counterparty | | Effective
Date | | Expiration
Date | | Notional
Amount
(000) | Value | Premiums
Paid
(Received) | Unrealized
Appreciation |
THB 2.42%2 | 6 Month LIBOR | | Bank of America N.A. | | 9/16/153 | | 9/16/20 | | 95,460 | $ | 52,079 | — | $ | 52,079 | |
TWD 1.48%2 | 3 Month LIBOR | | Bank of America N.A. | | 9/16/153 | | 9/16/20 | | 85,540 | | 11,347 | — | | 11,347 | |
Total | | | | | | | | | | $ | 63,426 | — | $ | 63,426 | |
| 2 | | Fund pays the floating rate and receives the fixed rate. |
| | | |
| 3 | | Forward swap. |
See Notes to Consolidated Financial Statements.
| 10 | BLACKROCK EMERGING MARKET ALLOCATION PORTFOLIO | APRIL 30, 2015
|
| |
| Consolidated Schedule of Investments (continued) |
| • | | | | As of April 30, 2015, OTC total return swaps outstanding were as follows:1 |
| Reference Entity | Counterparty | | Expiration Dates | | Net Notional
Amount | Unrealized
Appreciation | | Net Value of
Reference Entities |
Equity Securities Long/Short: | Goldman Sachs & Co. | | 5/01/15 — 10/03/16 | | $ | 16,712,553 | $ | 2,478,2792 | | | $ | 18,959,797 | |
| Goldman Sachs & Co. | | 5/14/15 — 7/27/23 | | $ | 477,986 | | 28,3693 | | | | 499,684 | |
| UBS AG | | 7/10/15 | | $ | 14,949,004 | | 1,972,0054 | | | | 16,715,866 | |
Total | | | | | | | $ | 4,478,653 | | | $ | 36,175,347 | |
| 1 | | The Fund receives or pays the total return on a portfolio of long and short positions underlying the total return swap. In addition, the Fund pays or receives a variable rate of interest, based on a specified benchmark, plus or minus a spread in a range of 20-1125 basis points. The benchmark and spread are determined based upon the country and/or currency of the individual underlying positions. The following are the specified benchmarks used in determining the variable rate of interest:
IntercontinentalExchange LIBOR:
USD 1 Month; USD Spot Next |
| 2 | | Amount includes $231,035 of net dividends and financing fees. |
| 3 | | Amount includes $6,671 of net dividends and financing fees. |
| 4 | | Amount includes $205,143 of net dividends and financing fees. |
See Notes to Consolidated Financial Statements.
| BLACKROCK EMERGING MARKET ALLOCATION PORTFOLIO | APRIL 30, 2015 | 11
|
| |
Consolidated Schedule of Investments (continued)
|
The following table represents the individual long and short positions and related values of the equity securities underlying the total return swap with Goldman Sachs & Co. as of April 30, 2015, expiration dates 5/01/15 — 10/03/16:
| | Shares | Value |
Reference Entity — Long |
Brazil | | | | | | |
AMBEV SA | | 29,000 | | $ | 182,300 | |
AMBEV SA — ADR | | 66,308 | | | 419,730 | |
Banco Bradesco SA, Preference Shares | | 2,040 | | | 21,775 | |
Banco do Brasil SA | | 24,500 | | | 216,462 | |
Banco do Estado do Rio Grande do Sul, Preference Shares | | 1,400 | | | 5,432 | |
Bradespar SA, Preference Shares | | 44,000 | | | 175,974 | |
Braskem SA — ADR | | 24,569 | | | 203,923 | |
Braskem SA, Preference A Shares | | 10,300 | | | 43,074 | |
BRF SA | | 2,500 | | | 53,436 | |
BRF SA — ADR | | 3,206 | | | 68,833 | |
Cia Brasileira de Distribuicao Grupo Pao de Acucar — ADR | | 7,449 | | | 249,839 | |
Cia Brasileira de Distribuicao Grupo Pao de Acucar, Preference Shares | | 1,700 | | | 57,551 | |
Cia Energetica de Minas Gerais, Preference Shares | | 6,700 | | | 32,355 | |
Cia Energetica de Sao Paulo, Preference ‘B’ Shares | | 24,600 | | | 155,130 | |
Cia Paranaense de Energia — ADR | | 707 | | | 7,735 | |
Cyrela Brazil Realty SA | | 10,200 | | | 39,711 | |
EDP — Energias do Brasil SA | | 19,900 | | | 75,625 | |
Even Construtora e Incorporadora SA | | 33,800 | | | 55,642 | |
Gerdau SA — ADR | | 60,679 | | | 203,881 | |
Gerdau SA, Preference Shares | | 6,000 | | | 20,014 | |
Itau Unibanco Holding SA, Preference Shares | | 14,940 | | | 191,055 | |
Itau Unibanco Holding SA, Preference Shares — ADR | | 32,189 | | | 412,663 | |
JBS SA | | 17,200 | | | 88,713 | |
Lojas Renner SA | | 1,300 | | | 45,326 | |
Metalurgica Gerdau SA, Preference Shares | | 25,200 | | | 82,301 | |
Multiplus SA | | 15,400 | | | 171,227 | |
Petroleo Brasileiro SA — ADR | | 1,109 | | | 9,626 | |
Petroleo Brasileiro SA, Preference Shares | | 4,800 | | | 20,790 | |
Vale SA, Preference Shares | | 2,700 | | | 16,265 | |
Valid Solucoes e Servicos de Seguranca em Meios de Pagamento e Identificacao SA | | 900 | | | 13,995 | |
Via Varejo SA | | 2,500 | | | 15,682 | |
| | | | | 3,356,065 | |
Chile | | | | | | |
Banco Santander Chile — ADR | | 8,559 | | | 186,672 | |
China | | | | | | |
Anhui Conch Cement Co., Ltd., Class H | | 49,500 | | | 200,141 | |
Anhui Expressway Co., Ltd., Class H | | 38,000 | | | 32,819 | |
Anta Sports Products Ltd. | | 143,000 | | | 315,131 | |
Bank of China Ltd., Class H | | 408,000 | | | 279,563 | |
Beijing Capital International Airport Co. Ltd., Class H | | 404,000 | | | 429,402 | |
Byd Co. Ltd., Class H | | 7,000 | | | 42,290 | |
China Biologic Products, Inc. | | 1,038 | | | 99,274 | |
China Cinda Asset Management Co. Ltd. | | 263,000 | | | 156,074 | |
China Citic Bank Corp. Ltd., Class H | | 110,000 | | | 99,754 | |
China CNR Corp., Ltd. | | 10,500 | | | 21,446 | |
China Communications Construction Co. Ltd., Class H | | 7,000 | | | 12,732 | |
| | Shares | Value |
Reference Entity — Long |
China (concluded) | | | | | | |
China Communications Services Corp. Ltd., Class H | | 76,000 | | $ | 42,829 | |
China Construction Bank Corp., Class H | | 714,000 | | | 693,104 | |
China Everbright Bank Co. Ltd., Class H | | 165,000 | | | 111,795 | |
China International Marine Containers Group Co. Ltd., Class H | | 3,600 | | | 9,701 | |
China Life Insurance Co. Ltd., Class H | | 69,000 | | | 334,876 | |
China Medical System Holdings Ltd. | | 38,000 | | | 67,061 | |
China Pacific Insurance Group Co. Ltd., Class H | | 18,200 | | | 98,649 | |
China Railway Group Ltd., Class H | | 184,000 | | | 258,217 | |
China Southern Airlines Co. Ltd., Class H | | 86,000 | | | 84,513 | |
China Unicom Hong Kong Ltd. | | 46,000 | | | 86,394 | |
CSR Corp. Ltd., Class H | | 30,000 | | | 57,834 | |
Dalian Wanda Commercial Properties Co., Ltd. | | 21,900 | | | 179,574 | |
Datang International Power Generation Co. Ltd., Class H | | 210,000 | | | 122,843 | |
Dongfeng Motor Group Co. Ltd., Class H | | 156,000 | | | 259,172 | |
Great Wall Motor Co. Ltd., Class H | | 10,500 | | | 79,670 | |
Greentown China Holdings Ltd. | | 7,500 | | | 9,305 | |
Guangzhou Baiyunshan Pharmaceutical Holdings Co., Ltd., Class H | | 14,000 | | | 53,540 | |
Guangzhou R&F Properties Co. Ltd., Class H | | 70,000 | | | 89,281 | |
Industrial & Commercial Bank of China Ltd., Class H | | 381,000 | | | 330,503 | |
Intime Retail Group Co. Ltd. | | 196,500 | | | 219,714 | |
Jiangsu Expressway Co. Ltd., Class H | | 14,000 | | | 19,222 | |
Jiangxi Copper Co. Ltd., Class H | | 8,000 | | | 16,510 | |
Lenovo Group Ltd. | | 92,000 | | | 158,200 | |
Longfor Properties Co. Ltd. | | 38,000 | | | 65,955 | |
Lonking Holdings Ltd. | | 105,000 | | | 26,042 | |
Luoyang Glass Co., Ltd. | | 8,000 | | | 6,448 | |
Metallurgical Corp. of China, Ltd. | | 85,000 | | | 50,161 | |
New China Life Insurance Co. Ltd., Class H | | 15,500 | | | 95,916 | |
Ping An Insurance Group Co. of China Ltd., Class H | | 35,500 | | | 507,694 | |
Shanghai Pharmaceuticals Holding Co. Ltd., Class H | | 47,600 | | | 148,162 | |
Shenzhen Expressway Co., Ltd. | | 58,000 | | | 55,330 | |
Shenzhou International Group Holdings Ltd. | | 3,000 | | | 14,110 | |
Sihuan Pharmaceutical Holdings Group Ltd. | | 131,000 | | | 74,538 | |
Sino-Ocean Land Holdings Ltd. | | 432,500 | | | 359,795 | |
Sinopharm Group Co. Ltd., Class H | | 22,800 | | | 108,295 | |
TCL Communication Technology Holdings, Ltd. | | 40,000 | | | 42,572 | |
Tencent Holdings Ltd. | | 31,900 | | | 658,380 | |
Weichai Power Co. Ltd., Class H | | 3,000 | | | 11,886 | |
Zhejiang Expressway Co. Ltd., Class H | | 408,000 | | | 647,983 | |
Zhuzhou CSR Times Electric Co. Ltd., Class H | | 14,000 | | | 119,043 | |
ZTE Corp., Class H | | 800 | | | 2,692 | |
| | | | | 8,066,135 | |
Czech Republic | | | | | | |
CEZ AS | | 4,059 | | | 105,454 | |
Hong Kong | | | | | | |
Belle International Holdings Ltd. | | 111,000 | | | 142,465 | |
China Merchants Holdings International Co. Ltd. | | 16,000 | | | 72,587 | |
China Mobile Ltd. | | 41,500 | | | 592,756 | |
China Mobile, Ltd. — ADR | | 3,744 | | | 267,434 | |
China Overseas Land & Investment Ltd. | | 40,000 | | | 166,615 | |
China Power International Development, Ltd. | | 554,000 | | | 357,145 | |
China Resources Cement Holdings Ltd. | | 262,000 | | | 166,513 | |
See Notes to Consolidated Financial Statements.
| 12 | BLACKROCK EMERGING MARKET ALLOCATION PORTFOLIO | APRIL 30, 2015
|
| |
Consolidated Schedule of Investments (continued)
|
| | | | | Shares | | Value |
Reference Entity — Long |
Hong Kong (concluded) | | | | | | | | | | |
China Resources Land Ltd. | | | | | 72,222 | | | $ | 262,036 | |
China Taiping Insurance Holdings Co. Ltd. | | | | | 30,400 | | | | 112,939 | |
China Traditional Chinese Medicine Co., Ltd. | | | | | 24,000 | | | | 18,688 | |
China Travel International Inv HK | | | | | 890,000 | | | | 396,475 | |
China Unicom Hong Kong, Ltd. — ADR | | | | | 3,930 | | | | 73,845 | |
Franshion Properties China Ltd. | | | | | 268,000 | | | | 108,277 | |
KWG Property Holding Ltd. | | | | | 141,000 | | | | 142,466 | |
REXLot Holdings, Ltd. | | | | | 625,000 | | | | 46,548 | |
Shanghai Industrial Holdings, Ltd. | | | | | 48,000 | | | | 191,375 | |
Shimao Property Holdings Ltd. | | | | | 68,000 | | | | 160,093 | |
Sino Biopharmaceutical Ltd. | | | | | 240,000 | | | | 274,003 | |
Skyworth Digital Holdings Ltd. | | | | | 66,000 | | | | 58,795 | |
Yuexiu Property Co. Ltd. | | | | | 144,000 | | | | 35,211 | |
| | | | | | | | | 3,646,266 | |
Hungary | | | | | | | | | | |
MOL Hungarian Oil & Gas PLC | | | | | 4,067 | | | | 226,235 | |
OTP Bank PLC | | | | | 7,019 | | | | 155,206 | |
| | | | | | | | | 381,441 | |
Indonesia | | | | | | | | | | |
Adaro Energy Tbk PT | | | | | 1,155,200 | | | | 77,780 | |
Bank Negara Indonesia Persero Tbk PT | | | | | 7,700 | | | | 3,800 | |
Indofood Sukses Makmur Tbk PT | | | | | 26,900 | | | | 13,962 | |
Lippo Karawaci Tbk PT | | | | | 45,300 | | | | 4,133 | |
Matahari Putra Prima Tbk PT | | | | | 363,100 | | | | 110,721 | |
Pembangunan Perumahan Persero Tbk PT | | | | | 26,400 | | | | 7,955 | |
Telekomunikasi Indonesia Persero Tbk PT | | | | | 49,400 | | | | 9,935 | |
Telekomunikasi Indonesia Persero Tbk PT — ADR | | | | | 2,906 | | | | 120,250 | |
United Tractors Tbk PT | | | | | 182,300 | | | | 299,752 | |
| | | | | | | | | 648,288 | |
Malaysia | | | | | | | | | | |
British American Tobacco Malaysia Bhd | | | | | 27,500 | | | | 516,228 | |
IFCA MSC BHD | | | | | 26,700 | | | | 11,529 | |
IOI Corp. Bhd | | | | | 24,400 | | | | 29,734 | |
KNM Group BHD | | | | | 69,000 | | | | 12,343 | |
MISC Bhd | | | | | 22,800 | | | | 58,341 | |
YTL Power International Bhd | | | | | 89,000 | | | | 39,983 | |
| | | | | | | | | 668,158 | |
Mexico | | | | | | | | | | |
Alfa SAB de CV, Series A | | | | | 11,300 | | | | 22,943 | |
Arca Continental SAB de CV | | | | | 6,200 | | | | 38,089 | |
Gentera SAB de CV | | | | | 6,100 | | | | 10,413 | |
Gruma SAB de CV | | | | | 54,824 | | | | 661,054 | |
Grupo Aeroportuario del Pacifico SAB de CV — ADR | | | | | 5,543 | | | | 393,830 | |
Grupo Aeroportuario del Pacifico SAB de CV, Class B | | | | | 45,700 | | | | 325,369 | |
Grupo Bimbo SAB de CV, Series A | | | | | 104,600 | | | | 280,897 | |
OHL Mexico SAB de CV | | | | | 178,000 | | | | 358,622 | |
Wal-Mart de Mexico SAB de C.V. | | | | | 324,706 | | | | 767,002 | |
| | | | | | | | | 2,858,219 | |
Peru | | | | | | | | | | |
Compania de Minas Buenaventura SA — ADR | | | | | 1,645 | | | | 18,391 | |
Philippines | | | | | | | | | | |
Energy Development Corp. | | | | | 578,900 | | | | 104,991 | |
Globe Telecom, Inc. | | | | | 3,320 | | | | 162,318 | |
Jollibee Foods Corp. | | | | | 5,540 | | | | 24,722 | |
| | | | | Shares | | Value |
Reference Entity — Long |
Philippines (concluded) | | | | | | | | | | |
Metropolitan Bank & Trust Co. | | | | | 4 | | | $ | 9 | |
Universal Robina Corp. | | | | | 35,460 | | | | 172,924 | |
| | | | | | | | | 464,964 | |
Poland | | | | | | | | | | |
Bank Handlowy w Warszawie SA | | | | | 751 | | | | 23,783 | |
Enea SA | | | | | 35,519 | | | | 160,829 | |
Grupa Azoty SA | | | | | 193 | | | | 4,396 | |
KGHM Polska Miedz SA | | | | | 6,569 | | | | 230,326 | |
PGE SA | | | | | 68,002 | | | | 391,293 | |
Polski Koncern Naftowy Orlen SA | | | | | 12,743 | | | | 242,010 | |
Polskie Gornictwo Naftowe i Gazownictwo SA | | | | | 20,412 | | | | 36,817 | |
Tauron Polska Energia SA | | | | | 108,388 | | | | 144,967 | |
| | | | | | | | | 1,234,421 | |
Russia | | | | | | | | | | |
Alrosa AO | | | | | 99,600 | | | | 132,410 | |
Gazprom OAO | | | | | 37,450 | | | | 111,710 | |
Gazprom OAO — ADR | | | | | 1,821 | | | | 10,669 | |
Lukoil OAO — ADR | | | | | 1,696 | | | | 86,760 | |
MMC Norilsk Nickel | | | | | 415 | | | | 77,977 | |
MMC Norilsk Nickel OJSC — ADR | | | | | 3,321 | | | | 62,559 | |
Mobile Telesystems — ADR | | | | | 8,162 | | | | 98,597 | |
Mobile TeleSystems OJSC | | | | | 7,700 | | | | 39,368 | |
Moscow Exchange MICEX-RTS OAO | | | | | 51,100 | | | | 76,544 | |
Novolipetsk Steel OJSC | | | | | 9,270 | | | | 12,222 | |
Novolipetsk Steel OJSC, -GDR | | | | | 4,957 | | | | 65,432 | |
Rosneft Oil Co. | | | | | 9,920 | | | | 49,142 | |
Severstal OAO | | | | | 4,280 | | | | 47,892 | |
Sistema JSFC | | | | | 60,200 | | | | 18,508 | |
Sistema JSFC — GDR | | | | | 22,129 | | | | 167,074 | |
Surgutneftegas OAO | | | | | 113,800 | | | | 84,529 | |
Surgutneftegas OAO — ADR | | | | | 5,764 | | | | 41,748 | |
Tatneft OAO | | | | | 12,132 | | | | 69,438 | |
Tatneft OAO — ADR | | | | | 1,358 | | | | 46,582 | |
| | | | | | | | | 1,299,161 | |
South Africa | | | | | | | | | | |
Barclays Africa Group Ltd. | | | | | 366 | | | | 5,863 | |
Barloworld Ltd. | | | | | 2,797 | | | | 22,313 | |
Bidvest Group Ltd. | | | | | 14,260 | | | | 386,504 | |
Clicks Group, Ltd. | | | | | 2,467 | | | | 18,906 | |
FirstRand Ltd. | | | | | 76,237 | | | | 364,191 | |
The Foschini Group Ltd. | | | | | 4,725 | | | | 69,961 | |
Investec Ltd. | | | | | 1,206 | | | | 11,467 | |
Liberty Holdings Ltd. | | | | | 412 | | | | 5,742 | |
Mediclinic International Ltd. | | | | | 6,791 | | | | 71,913 | |
MMI Holdings Ltd. | | | | | 5,200 | | | | 14,796 | |
Mr. Price Group Ltd. | | | | | 2,646 | | | | 56,492 | |
MTN Group Ltd. | | | | | 4,612 | | | | 92,604 | |
Netcare Ltd. | | | | | 33,439 | | | | 116,977 | |
Sanlam Ltd. | | | | | 2,064 | | | | 13,349 | |
Sasol Ltd. | | | | | 9,392 | | | | 378,155 | |
Sasol, Ltd. — ADR | | | | | 16,716 | | | | 672,819 | |
Sibanye Gold, Ltd. | | | | | 49,614 | | | | 117,749 | |
Standard Bank Group Ltd. | | | | | 19,074 | | | | 279,585 | |
| | | | | | | | | 2,699,386 | |
South Korea | | | | | | | | | | |
Amorepacific Corp. | | | | | 24 | | | | 86,955 | |
Amorepacific Group | | | | | 9 | | | | 13,685 | |
Asiana Airlines, Inc. | | | | | 551 | | | | 3,948 | |
CJ O Shopping Co., Ltd. | | | | | 27 | | | | 6,040 | |
See Notes to Consolidated Financial Statements.
| BLACKROCK EMERGING MARKET ALLOCATION PORTFOLIO | APRIL 30, 2015 | 13
|
| |
Consolidated Schedule of Investments (continued)
|
| | | | | Shares | | Value |
Reference Entity — Long |
South Korea (concluded) | | | | | | | | | | |
Doosan Infracore Co., Ltd. | | | | | 3,081 | | | $ | 34,051 | |
GS Home Shopping, Inc. | | | | | 37 | | | | 8,241 | |
Hankook Tire Co., Ltd. | | | | | 1,234 | | | | 51,859 | |
Hanwha Corp. | | | | | 765 | | | | 30,041 | |
Hyosung Corp. | | | | | 2,473 | | | | 273,534 | |
Hyundai Engineering & Construction Co., Ltd. | | | | | 2,203 | | | | 105,989 | |
Hyundai Home Shopping Network Corp. | | | | | 93 | | | | 11,693 | |
Hyundai Mobis | | | | | 486 | | | | 106,861 | |
Hyundai Motor Co. | | | | | 1,657 | | | | 260,051 | |
Hyundai Steel Co. | | | | | 3,057 | | | | 223,442 | |
Industrial Bank of Korea | | | | | 10,969 | | | | 150,713 | |
Kangwon Land, Inc. | | | | | 9,643 | | | | 328,714 | |
KEPCO Plant Service & Engineering Co., Ltd. | | | | | 146 | | | | 13,252 | |
Korea Electric Power Corp. | | | | | 609 | | | | 26,482 | |
Korea Investment Holdings Co., Ltd. | | | | | 634 | | | | 40,593 | |
KT Skylife Co., Ltd. | | | | | 3,110 | | | | 50,504 | |
KT&G Corp. | | | | | 543 | | | | 48,171 | |
LG Corp. | | | | | 3,227 | | | | 200,233 | |
LG Display Co., Ltd. | | | | | 2,473 | | | | 68,485 | |
LG Display Co., Ltd. — ADR | | | | | 17,942 | | | | 247,959 | |
LG Electronics, Inc. | | | | | 143 | | | | 8,041 | |
LG Innotek Co., Ltd. | | | | | 578 | | | | 53,662 | |
Lotte Food Co., Ltd. | | | | | 108 | | | | 76,567 | |
LOTTE Himart Co., Ltd. | | | | | 905 | | | | 60,076 | |
Lotte Shopping Co., Ltd. | | | | | 483 | | | | 116,484 | |
LS Corp. | | | | | 1,998 | | | | 100,444 | |
Medy-Tox, Inc. | | | | | 620 | | | | 214,336 | |
NCSoft Corp. | | | | | 939 | | | | 178,871 | |
Okins Electronics Co., Ltd. | | | | | 779 | | | | 11,227 | |
Poongsan Corp. | | | | | 710 | | | | 19,128 | |
Samsung Card Co., Ltd. | | | | | 649 | | | | 24,834 | |
Samsung Electronics Co. Ltd. | | | | | 527 | | | | 691,347 | |
Samsung Electronics Co., Ltd., -GDR | | | | | 587 | | | | 384,947 | |
Samsung SDS Co., Ltd. | | | | | 164 | | | | 39,020 | |
Silicon Works Co., Ltd. | | | | | 1,354 | | | | 51,289 | |
SK C&C Co., Ltd. | | | | | 341 | | | | 80,704 | |
SK Hynix, Inc. | | | | | 5,875 | | | | 251,362 | |
SK Networks Co., Ltd. | | | | | 10,389 | | | | 76,787 | |
SKC Co., Ltd. | | | | | 2,766 | | | | 108,876 | |
Sungwoo Hitech Co., Ltd. | | | | | 13,238 | | | | 139,045 | |
Woori Bank | | | | | 6,758 | | | | 67,510 | |
| | | | | | | | | 5,146,053 | |
Taiwan | | | | | | | | | | |
Advanced Semiconductor Engineering, Inc. | | | | | 32,000 | | | | 45,380 | |
Advanced Semiconductor Engineering, Inc. — ADR | | | | | 34,681 | | | | 247,275 | |
Ardentec Corp. | | | | | 7,000 | | | | 6,553 | |
AU Optronics Corp. | | | | | 342,000 | | | | 171,631 | |
AU Optronics Corp. — ADR | | | | | 53,805 | | | | 270,101 | |
Catcher Technology Co., Ltd. | | | | | 28,000 | | | | 327,652 | |
Chicony Electronics Co., Ltd. | | | | | 25,000 | | | | 71,887 | |
Chimei Materials Technology Corp. | | | | | 46,350 | | | | 49,825 | |
China Airlines Ltd. | | | | | 52,000 | | | | 27,676 | |
Compeq Manufacturing Co., Ltd. | | | | | 129,000 | | | | 81,654 | |
CTCI Corp. | | | | | 40,000 | | | | 70,331 | |
Elan Microelectronics Corp. | | | | | 119,000 | | | | 194,833 | |
Far Eastern Department Stores Ltd. | | | | | 85,445 | | | | 68,671 | |
Far Eastern New Century Corp. | | | | | 23,805 | | | | 26,148 | |
Faraday Technology Corp. | | | | | 151,000 | | | | 207,528 | |
Feng TAY Enterprise Co., Ltd. | | | | | 59,000 | | | | 364,072 | |
First Financial Holding Co., Ltd. | | | | | 465 | | | | 292 | |
| | | | | Shares | | Value |
Reference Entity — Long |
Taiwan (concluded) | | | | | | | | | | |
Foxconn Technology Co., Ltd. | | | | | 35,000 | | | $ | 99,751 | |
Gigabyte Technology Co., Ltd. | | | | | 53,000 | | | | 64,310 | |
Highwealth Construction Corp. | | | | | 23,000 | | | | 59,998 | |
Hon Hai Precision Industry Co. Ltd. | | | | | 29,040 | | | | 87,017 | |
Innolux Corp. | | | | | 586,000 | | | | 302,280 | |
Inotera Memories, Inc. | | | | | 4,000 | | | | 4,594 | |
Inventec Co. Ltd. | | | | | 37,000 | | | | 26,111 | |
King Yuan Electronics Co., Ltd. | | | | | 279,000 | | | | 253,616 | |
Lite-On Technology Corp. | | | | | 57,000 | | | | 72,018 | |
Nanya Technology Corp. | | | | | 16,000 | | | | 35,536 | |
Pegatron Corp. | | | | | 31,000 | | | | 91,836 | |
Pou Chen Corp. | | | | | 277,000 | | | | 388,175 | |
Realtek Semiconductor Corp. | | | | | 3,070 | | | | 9,561 | |
Shin Kong Financial Holding Co., Ltd. | | | | | 65,000 | | | | 21,081 | |
Siliconware Precision Industries Co. | | | | | 11,000 | | | | 18,071 | |
Siliconware Precision Industries Co. — ADR | | | | | 39,518 | | | | 320,491 | |
Sitronix Technology Corp. | | | | | 45,000 | | | | 162,332 | |
Soft-World International Corp. | | | | | 1,000 | | | | 2,843 | |
Taiwan Cement Corp. | | | | | 127,000 | | | | 180,361 | |
Taiwan Cooperative Financial Holding Co., Ltd. | | | | | 78,008 | | | | 42,088 | |
Taiwan Paiho, Ltd. | | | | | 48,000 | | | | 130,330 | |
Taiwan PCB Techvest Co., Ltd. | | | | | 15,000 | | | | 24,377 | |
Taiwan Semiconductor Manufacturing Co. Ltd. | | | | | 150,000 | | | | 722,141 | |
Taiwan Semiconductor Manufacturing Co. Ltd. — ADR | | | | | 9,643 | | | | 235,675 | |
Transcend Information, Inc. | | | | | 1,000 | | | | 3,842 | |
United Microelectronics Corp. | | | | | 288,000 | | | | 137,986 | |
United Microelectronics Corp. — ADR | | | | | 52,164 | | | | 126,237 | |
Yuanta Financial Holding Co., Ltd. | | | | | 768,925 | | | | 446,923 | |
| | | | | | | | | 6,301,090 | |
Thailand | | | | | | | | | | |
Advanced Info Service PCL | | | | | 1,900 | | | | 13,833 | |
Central Pattana PCL | | | | | 50,900 | | | | 64,851 | |
Delta Electronics Thailand PCL | | | | | 4,600 | | | | 11,652 | |
Indorama Ventures PCL | | | | | 63,300 | | | | 47,429 | |
PTT Global Chemical PCL, Foreign Registered Shares | | | | | 87,600 | | | | 170,736 | |
PTT PCL | | | | | 40,000 | | | | 431,973 | |
Siam Cement PCL, Foreign Registered Shares | | | | | 3,400 | | | | 54,953 | |
Supalai PCL | | | | | 5,200 | | | | 3,155 | |
Thanachart Capital PCL | | | | | 21,700 | | | | 22,381 | |
| | | | | | | | | 820,963 | |
Turkey | | | | | | | | | | |
Akbank TAS | | | | | 55,080 | | | | 160,478 | |
Arcelik AS | | | | | 2,307 | | | | 12,427 | |
Enka Insaat ve Sanayi AS | | | | | 123,961 | | | | 266,429 | |
Eregli Demir ve Celik Fabrikalari TAS | | | | | 28,482 | | | | 48,064 | |
Haci Omer Sabanci Holding AS | | | | | 123,034 | | | | 449,775 | |
KOC Holding AS | | | | | 96,175 | | | | 454,872 | |
Koza Altin Isletmeleri AS | | | | | 3,271 | | | | 34,170 | |
TAV Havalimanlari Holding AS | | | | | 6,401 | | | | 56,277 | |
Tofas Turk Otomobil Fabrikasi AS | | | | | 3,564 | | | | 21,842 | |
Turk Hava Yollari | | | | | 68,676 | | | | 227,814 | |
Turkiye Is Bankasi, Class C | | | | | 32,146 | | | | 72,283 | |
Yapi ve Kredi Bankasi | | | | | 25,951 | | | | 40,633 | |
| | | | | | | | | 1,845,064 | |
United States | | | | | | | | | | |
Genpact Ltd. | | | | | 12,953 | | | | 283,153 | |
Total Reference Entity — Long | | | | | | | | | 40,029,344 | |
See Notes to Consolidated Financial Statements.
| 14 | BLACKROCK EMERGING MARKET ALLOCATION PORTFOLIO | APRIL 30, 2015
|
| |
Consolidated Schedule of Investments (continued)
|
| | | | | Shares | | Value |
Reference Entity — Short |
Brazil | | | | | | | | | | |
Cia de Saneamento Basico do Estado de Sao Paulo — ADR | | | | | (2,026 | ) | | $ | (11,933 | ) |
CPFL Energia SA — ADR | | | | | (6,617 | ) | | | (86,151 | ) |
Embraer SA — ADR | | | | | (683 | ) | | | (21,296 | ) |
Equatorial Energia SA | | | | | (43,500 | ) | | | (462,294 | ) |
Gol Linhas Aereas Inteligentes SA — ADR | | | | | (46,262 | ) | | | (117,506 | ) |
Kroton Educacional SA | | | | | (49,100 | ) | | | (179,260 | ) |
Oi SA — ADR | | | | | (15,242 | ) | | | (29,417 | ) |
Tim Participacoes SA — ADR | | | | | (5,411 | ) | | | (85,061 | ) |
WEG SA | | | | | (1,700 | ) | | | (9,056 | ) |
| | | | | | | | | (1,001,974 | ) |
China | | | | | | | | | | |
AAC Technologies Holdings, Inc. | | | | | (30,000 | ) | | | (158,361 | ) |
Airtac International Group | | | | | (6,000 | ) | | | (49,047 | ) |
Alibaba Group Holding, Ltd. — ADR | | | | | (2,901 | ) | | | (235,822 | ) |
Aluminum Corp. of China Ltd. — ADR | | | | | (335 | ) | | | (5,390 | ) |
AviChina Industry & Technology Co., Ltd., Class H | | | | | (468,000 | ) | | | (530,221 | ) |
BBMG Corp. | | | | | (7,500 | ) | | | (9,282 | ) |
Beijing Jingneng Clean Energy Co., Ltd. | | | | | (16,000 | ) | | | (7,909 | ) |
Biostime International Holdings, Ltd. | | | | | (13,000 | ) | | | (59,583 | ) |
China COSCO Holdings Co., Ltd., Class H | | | | | (73,000 | ) | | | (67,117 | ) |
China Eastern Airlines Corp., Ltd. , Class H, Class H | | | | | (12,000 | ) | | | (9,266 | ) |
China Longyuan Power Group Corp., Class H | | | | | (59,000 | ) | | | (73,118 | ) |
China Minsheng Banking Corp., Ltd. | | | | | (88,500 | ) | | | (129,224 | ) |
China Petroleum & Chemical Corp. — ADR | | | | | (1,064 | ) | | | (100,516 | ) |
China Shanshui Cement Group, Ltd. | | | | | (763,000 | ) | | | (619,217 | ) |
China Shipping Container Lines Co., Ltd., Class H | | | | | (43,000 | ) | | | (24,250 | ) |
China Tian Lun Gas Holdings, Ltd. | | | | | (126,000 | ) | | | (127,617 | ) |
CNOOC, Ltd. | | | | | (81,000 | ) | | | (138,122 | ) |
Country Garden Holdings Co., Ltd. | | | | | (143,000 | ) | | | (77,204 | ) |
Dalian Port PDA Co., Ltd. | | | | | (40,000 | ) | | | (21,778 | ) |
Dongfang Electric Corp., Ltd., Class H | | | | | (35,200 | ) | | | (79,806 | ) |
ENN Energy Holdings Ltd. | | | | | (30,000 | ) | | | (215,922 | ) |
Fosun International, Ltd. | | | | | (70,000 | ) | | | (174,473 | ) |
Guangshen Railway Co., Ltd. | | | | | (56,000 | ) | | | (37,085 | ) |
Haitian International Holdings, Ltd. | | | | | (11,000 | ) | | | (27,359 | ) |
Huadian Fuxin Energy Corp., Ltd. | | | | | (32,000 | ) | | | (17,212 | ) |
Parkson Retail Group, Ltd. | | | | | (26,500 | ) | | | (6,714 | ) |
PetroChina Co., Ltd. — ADR | | | | | (1,733 | ) | | | (223,418 | ) |
Semiconductor Manufacturing International Corp. | | | | | (4,083,000 | ) | | | (449,973 | ) |
Shandong Weigao Group Medical Polymer Co., Ltd., Class H | | | | | (48,000 | ) | | | (44,360 | ) |
Shanghai Electric Group Co., Ltd. | | | | | (40,000 | ) | | | (40,788 | ) |
Shui On Land Ltd. | | | | | (1,166,500 | ) | | | (376,996 | ) |
Sichuan Expressway Co., Ltd. | | | | | (46,000 | ) | | | (25,221 | ) |
SINA Corp. | | | | | (578 | ) | | | (25,429 | ) |
Sinopec Engineering Group Co., Ltd. | | | | | (40,500 | ) | | | (43,716 | ) |
SOHO China, Ltd. | | | | | (71,500 | ) | | | (54,241 | ) |
Sohu.com, Inc. | | | | | (502 | ) | | | (33,358 | ) |
Sunac China Holdings, Ltd. | | | | | (106,000 | ) | | | (139,384 | ) |
Sunny Optical Technology Group Co., Ltd. | | | | | (63,000 | ) | | | (140,194 | ) |
Tingyi Cayman Islands Holding Corp. | | | | | (332,000 | ) | | | (701,107 | ) |
Uni-President China Holdings, Ltd. | | | | | (745,000 | ) | | | (602,686 | ) |
Want Want China Holdings, Ltd. | | | | | (106,000 | ) | | | (116,273 | ) |
Wisdom Holdings Group | | | | | (80,000 | ) | | | (69,775 | ) |
Yanzhou Coal Mining Co., Ltd., Class H | | | | | (2,000 | ) | | | (2,000 | ) |
| | | | | | | | | (6,090,534 | ) |
| | | | | Shares | | Value |
Reference Entity — Short |
Colombia | | | | | | | | | | |
Bancolombia SA — ADR | | | | | (9,051 | ) | | $ | (409,739 | ) |
Hong Kong | | | | | | | | | | |
Alibaba Pictures Group, Ltd. | | | | | (40,000 | ) | | | (19,676 | ) |
Beijing Enterprises Holdings Ltd. | | | | | (22,000 | ) | | | (201,052 | ) |
Beijing Enterprises Water Group Ltd. | | | | | (28,000 | ) | | | (24,148 | ) |
Brilliance China Automotive Holdings Ltd. | | | | | (36,000 | ) | | | (67,562 | ) |
China Agri-Industries Holdings Ltd. | | | | | (539,000 | ) | | | (307,797 | ) |
China Everbright International, Ltd. | | | | | (40,000 | ) | | | (74,590 | ) |
China Gas Holdings, Ltd. | | | | | (62,000 | ) | | | (109,544 | ) |
China High Speed Transmission Equipment Group Co., Ltd. | | | | | (11,000 | ) | | | (9,907 | ) |
China Oceanwide Holdings, Ltd. | | | | | (440,000 | ) | | | (68,352 | ) |
China Resources Enterprise, Ltd. | | | | | (46,101 | ) | | | (141,224 | ) |
China Resources Gas Group, Ltd. | | | | | (4,000 | ) | | | (13,891 | ) |
China Resources Power Holdings Co., Ltd. | | | | | (30,000 | ) | | | (90,500 | ) |
China State Construction International Holdings Ltd. | | | | | (64,000 | ) | | | (123,349 | ) |
CITIC, Ltd. | | | | | (37,000 | ) | | | (74,018 | ) |
Hopewell Highway Infrastructure, Ltd. | | | | | (386,500 | ) | | | (192,255 | ) |
Kunlun Energy Co., Ltd. | | | | | (248,000 | ) | | | (294,413 | ) |
Lee & Man Paper Manufacturing, Ltd. | | | | | (12,000 | ) | | | (6,799 | ) |
Poly Property Group Co., Ltd. | | | | | (123,000 | ) | | | (78,807 | ) |
Sinopec Kantons Holdings Ltd. | | | | | (80,000 | ) | | | (72,302 | ) |
Towngas China Co., Ltd. | | | | | (219,000 | ) | | | (234,857 | ) |
| | | | | | | | | (2,205,043 | ) |
Indonesia | | | | | | | | | | |
Bumi Serpong Damai Tbk PT | | | | | (110,200 | ) | | | (15,790 | ) |
Charoen Pokphand Indonesia Tbk PT | | | | | (233,900 | ) | | | (51,003 | ) |
Jasa Marga Persero Tbk PT | | | | | (18,100 | ) | | | (8,623 | ) |
Perusahaan Gas Negara Persero Tbk PT | | | | | (98,100 | ) | | | (30,921 | ) |
Surya Citra Media Tbk PT | | | | | (42,900 | ) | | | (9,565 | ) |
XL Axiata Tbk PT | | | | | (125,500 | ) | | | (38,950 | ) |
| | | | | | | | | (154,852 | ) |
Malaysia | | | | | | | | | | |
Gamuda BHD | | | | | (45,000 | ) | | | (66,045 | ) |
Lafarge Malaysia BHD | | | | | (24,800 | ) | | | (67,196 | ) |
Petronas Dagangan BHD | | | | | (2,500 | ) | | | (15,027 | ) |
| | | | | | | | | (148,268 | ) |
Mexico | | | | | | | | | | |
Alsea SAB de C.V. | | | | | (13,900 | ) | | | (41,740 | ) |
Cemex SAB de C.V. | | | | | (39,832 | ) | | | (38,425 | ) |
Cemex SAB de C.V. — ADR | | | | | (6,239 | ) | | | (60,019 | ) |
Fibra Uno Administracion SA de C.V. | | | | | (174,100 | ) | | | (434,399 | ) |
Fomento Economico Mexicano SAB de C.V. | | | | | (31,000 | ) | | | (281,025 | ) |
Fomento Economico Mexicano SAB de C.V. — ADR | | | | | (7,009 | ) | | | (634,244 | ) |
Genomma Lab Internacional SAB de C.V. | | | | | (232,500 | ) | | | (274,296 | ) |
Grupo Financiero Inbursa SAB de C.V. | | | | | (42,600 | ) | | | (101,710 | ) |
Grupo Lala SAB de C.V. | | | | | (59,900 | ) | | | (121,307 | ) |
Grupo Televisa SAB — ADR | | | | | (793 | ) | | | (28,873 | ) |
Mexichem SAB de C.V. | | | | | (37,721 | ) | | | (108,034 | ) |
Mexico Real Estate Management SA de C.V. | | | | | (131,300 | ) | | | (199,064 | ) |
Minera Frisco SAB de C.V., Series A-1 | | | | | (97,800 | ) | | | (81,213 | ) |
PLA Administradora Industrial S de RL de C.V. | | | | | (85,513 | ) | | | (168,886 | ) |
Promotora y Operadora de Infraestructura SAB de C.V. | | | | | (3,400 | ) | | | (39,090 | ) |
Southern Copper Corp. | | | | | (8,834 | ) | | | (287,812 | ) |
| | | | | | | | | (2,900,137 | ) |
See Notes to Consolidated Financial Statements.
| BLACKROCK EMERGING MARKET ALLOCATION PORTFOLIO | APRIL 30, 2015 | 15
|
| |
Consolidated Schedule of Investments (continued)
|
| | | | | Shares | | Value |
Reference Entity — Short |
Poland | | | | | | | | | | |
Cyfrowy Polsat SA | | | | | (2,238 | ) | | $ | (15,602 | ) |
Powszechny Zaklad Ubezpieczen SA | | | | | (90 | ) | | | (11,738 | ) |
| | | | | | | | | (27,340 | ) |
South Africa | | | | | | | | | | |
Aspen Pharmacare Holdings, Ltd. | | | | | (547 | ) | | | (16,634 | ) |
Imperial Holdings, Ltd. | | | | | (1,256 | ) | | | (21,033 | ) |
Nampak Ltd. | | | | | (28,660 | ) | | | (102,641 | ) |
Remgro Ltd. | | | | | (29,462 | ) | | | (654,401 | ) |
RMB Holdings, Ltd. | | | | | (4,490 | ) | | | (27,020 | ) |
Woolworths Holdings, Ltd. | | | | | (1,547 | ) | | | (11,638 | ) |
| | | | | | | | | (833,367 | ) |
South Korea | | | | | | | | | | |
Able C&C Co., Ltd. | | | | | (270 | ) | | | (7,971 | ) |
Chabiotech Co., Ltd. | | | | | (24,383 | ) | | | (372,857 | ) |
CJ Korea Express Co., Ltd. | | | | | (26 | ) | | | (4,960 | ) |
Daelim Industrial Co., Ltd. | | | | | (968 | ) | | | (74,548 | ) |
Daewoo Engineering & Construction Co., Ltd. | | | | | (6,778 | ) | | | (44,874 | ) |
Doosan Corp. | | | | | (2,336 | ) | | | (270,571 | ) |
Eo Technics Co., Ltd. | | | | | (416 | ) | | | (42,836 | ) |
Gamevil, Inc. | | | | | (337 | ) | | | (37,092 | ) |
Halla Visteon Climate Control Corp. | | | | | (1,193 | ) | | | (44,758 | ) |
Hanjin Heavy Industries & Construction Co., Ltd. | | | | | (1,009 | ) | | | (5,838 | ) |
Hite Jinro Co., Ltd. | | | | | (3,822 | ) | | | (80,912 | ) |
Hotel Shilla Co., Ltd. | | | | | (6,265 | ) | | | (623,690 | ) |
Hyundai Glovis Co., Ltd. | | | | | (84 | ) | | | (18,426 | ) |
Hyundai Heavy Industries Co., Ltd. | | | | | (1,587 | ) | | | (206,197 | ) |
Hyundai Mipo Dockyard | | | | | (2,910 | ) | | | (241,923 | ) |
Hyundai Securities Co., Ltd. | | | | | (2,833 | ) | | | (29,335 | ) |
i-SENS, Inc. | | | | | (1,539 | ) | | | (70,801 | ) |
Korea Aerospace Industries, Ltd. | | | | | (629 | ) | | | (38,424 | ) |
LG International Corp. | | | | | (2,880 | ) | | | (110,206 | ) |
Lotte Confectionery Co., Ltd. | | | | | (54 | ) | | | (93,932 | ) |
POSCO — ADR | | | | | (126 | ) | | | (7,444 | ) |
Samsung Fine Chemicals Co., Ltd. | | | | | (2,158 | ) | | | (87,328 | ) |
Samsung Heavy Industries Co., Ltd. | | | | | (1,661 | ) | | | (27,977 | ) |
Samsung SDI Co., Ltd. | | | | | (32 | ) | | | (3,563 | ) |
Samsung Techwin Co., Ltd. | | | | | (6,363 | ) | | | (163,432 | ) |
Seegene, Inc. | | | | | (414 | ) | | | (13,775 | ) |
Seoul Semiconductor Co., Ltd. | | | | | (614 | ) | | | (11,066 | ) |
SK Chemicals Co., Ltd. | | | | | (137 | ) | | | (8,898 | ) |
| | | | | | | | | (2,743,634 | ) |
Taiwan | | | | | | | | | | |
Advantech Co., Ltd. | | | | | (1,000 | ) | | | (8,238 | ) |
Asia Cement Corp. | | | | | (9,000 | ) | | | (11,381 | ) |
AVY Precision Technology, Inc. | | | | | (4,000 | ) | | | (9,785 | ) |
Career Technology MFG. Co., Ltd. | | | | | (143,000 | ) | | | (142,019 | ) |
Center Laboratories, Inc. | | | | | (1,000 | ) | | | (2,889 | ) |
Chang Hwa Commercial Bank | | | | | (603,000 | ) | | | (368,438 | ) |
Cheng Shin Rubber Industry Co., Ltd. | | | | | (1,000 | ) | | | (2,393 | ) |
China Steel Chemical Corp. | | | | | (1,000 | ) | | | (4,856 | ) |
China Steel Corp. | | | | | (23,000 | ) | | | (19,319 | ) |
CTBC Financial Holding Co., Ltd. | | | | | (184,000 | ) | | | (143,221 | ) |
eMemory Technology, Inc. | | | | | (819 | ) | | | (9,248 | ) |
Evergreen Marine Corp. Taiwan Ltd. | | | | | (525,000 | ) | | | (357,133 | ) |
Everlight Chemical Industrial Corp. | | | | | (84,000 | ) | | | (76,728 | ) |
Far EasTone Telecommunications Co., Ltd. | | | | | (77,000 | ) | | | (183,587 | ) |
Formosa Petrochemical Corp. | | | | | (3,000 | ) | | | (7,734 | ) |
Genius Electronic Optical Co., Ltd. | | | | | (15,000 | ) | | | (42,743 | ) |
Giant Manufacturing Co., Ltd. | | | | | (17,000 | ) | | | (146,627 | ) |
| | | | | Shares | | Value |
Reference Entity — Short |
Taiwan (concluded) | | | | | | | | | | |
Gigastorage Corp. | | | | | (52,000 | ) | | $ | (45,392 | ) |
HannStar Display Corp. | | | | | (527,000 | ) | | | (106,420 | ) |
Hiwin Technologies Corp. | | | | | (20,000 | ) | | | (152,494 | ) |
Hotai Motor Co., Ltd. | | | | | (11,000 | ) | | | (190,590 | ) |
Kuo Toong International Co., Ltd. | | | | | (2,000 | ) | | | (3,383 | ) |
MediaTek, Inc. | | | | | (1,000 | ) | | | (12,854 | ) |
Parade Technologies, Ltd. | | | | | (6,000 | ) | | | (59,367 | ) |
Phison Electronics Corp. | | | | | (6,000 | ) | | | (55,336 | ) |
Pixart Imaging, Inc. | | | | | (7,000 | ) | | | (21,335 | ) |
President Chain Store Corp. | | | | | (22,000 | ) | | | (162,804 | ) |
Quanta Computer, Inc. | | | | | (3,000 | ) | | | (7,527 | ) |
ScinoPharm Taiwan, Ltd. | | | | | (92,249 | ) | | | (154,467 | ) |
Taiwan Mobile Co., Ltd. | | | | | (69,000 | ) | | | (243,090 | ) |
Tong Hsing Electronic Industries, Ltd. | | | | | (15,000 | ) | | | (48,054 | ) |
TPK Holding Co., Ltd. | | | | | (13,000 | ) | | | (80,755 | ) |
U-Ming Marine Transport Corp. | | | | | (159,000 | ) | | | (238,549 | ) |
Unimicron Technology Corp. | | | | | (69,000 | ) | | | (41,072 | ) |
Wistron Corp. | | | | | (13,000 | ) | | | (11,059 | ) |
| | | | | | | | | (3,170,887 | ) |
Thailand | | | | | | | | | | |
BEC World PCL | | | | | (36,100 | ) | | | (44,078 | ) |
CP ALL PCL | | | | | (2,100 | ) | | | (2,675 | ) |
IRPC PCL | | | | | (322,900 | ) | | | (45,058 | ) |
| | | | | | | | | (91,811 | ) |
Turkey | | | | | | | | | | |
Anadolu Efes Biracilik Ve Malt Sanayii AS | | | | | (5,863 | ) | | | (49,358 | ) |
Emlak Konut Gayrimenkul Yatirim Ortakligi | | | | | (33,868 | ) | | | (39,121 | ) |
Turkcell Iletisim Hizmetleri AS | | | | | (121,657 | ) | | | (541,685 | ) |
Turkcell Iletisim Hizmetleri AS — ADR | | | | | (52,565 | ) | | | (581,369 | ) |
Turkiye Sise ve Cam Fabrikalari | | | | | (36,145 | ) | | | (46,190 | ) |
| | | | | | | | | (1,257,723 | ) |
United States | | | | | | | | | | |
Bizlink Holding, Inc. | | | | | (8,000 | ) | | | (34,238 | ) |
Total Reference Entity — Short | | | | | | | | | (21,069,547 | ) |
Net Value of Reference Entity — Goldman Sachs & Co. | $ | 18,959,797 | |
See Notes to Consolidated Financial Statements.
| 16 | BLACKROCK EMERGING MARKET ALLOCATION PORTFOLIO | APRIL 30, 2015
|
| |
Consolidated Schedule of Investments (continued)
|
The following table represents the individual long positions and related values of the equity securities underlying the total return swap with Goldman Sachs & Co. as of April 30, 2015, expiration dates 5/14/15 — 7/27/23:
| | | | | Shares | | Value |
Reference Entity — Long |
Australia | | | | | | | | | | |
BHP Billiton Ltd. | | | | | 138 | | | $ | 3,524 | |
Ramsay Health Care Ltd. | | | | | 52 | | | | 2,564 | |
Rio Tinto Ltd. | | | | | 36 | | | | 1,623 | |
Woodside Petroleum Ltd. | | | | | 44 | | | | 1,213 | |
| | | | | | | | | 8,924 | |
Austria | | | | | | | | | | |
Andritz AG | | | | | 9 | | | | 527 | |
BUWOG AG | | | | | 9 | | | | 182 | |
IMMOFINANZ AG | | | | | 181 | | | | 544 | |
Raiffeisen Bank International AG | | | | | 16 | | | | 266 | |
Vienna Insurance Group AG | | | | | 17 | | | | 677 | |
| | | | | | | | | 2,196 | |
Belgium | | | | | | | | | | |
Anheuser-Busch InBev NV | | | | | 57 | | | | 6,940 | |
KBC Groep NV | | | | | 14 | | | | 921 | |
| | | | | | | | | 7,861 | |
Canada | | | | | | | | | | |
BlackBerry Ltd. | | | | | 186 | | | | 1,889 | |
Brookfield Renewable Energy Partners LP | | | | | 38 | | | | 1,243 | |
Eldorado Gold Corp. | | | | | 249 | | | | 1,240 | |
First Quantum Minerals Ltd. | | | | | 54 | | | | 827 | |
Kinross Gold Corp. | | | | | 387 | | | | 940 | |
Methanex Corp. | | | | | 8 | | | | 481 | |
New Gold, Inc. | | | | | 163 | | | | 547 | |
Yamana Gold, Inc. | | | | | 113 | | | | 432 | |
| | | | | | | | | 7,559 | |
Denmark | | | | | | | | | | |
Chr Hansen Holding A/S | | | | | 15 | | | | 726 | |
Novo Nordisk A/S, Class B | | | | | 19 | | | | 1,067 | |
Rockwool International A/S, -B Shares | | | | | 3 | | | | 397 | |
| | | | | | | | | 2,190 | |
Finland | | | | | | | | | | |
Kone OYJ, Class B | | | | | 21 | | | | 903 | |
Nokia OYJ | | | | | 81 | | | | 547 | |
Valmet Corp. | | | | | 52 | | | | 603 | |
| | | | | | | | | 2,053 | |
France | | | | | | | | | | |
Airbus Group NV | | | | | 29 | | | | 2,010 | |
Casino Guichard-Perrachon SA | | | | | 11 | | | | 973 | |
Christian Dior SA | | | | | 4 | | | | 782 | |
Danone SA | | | | | 25 | | | | 1,809 | |
Edenred | | | | | 32 | | | | 858 | |
Imerys SA | | | | | 19 | | | | 1,446 | |
Lafarge SA | | | | | 12 | | | | 876 | |
Pernod Ricard SA | | | | | 12 | | | | 1,491 | |
Renault SA | | | | | 11 | | | | 1,157 | |
SEB SA | | | | | 10 | | | | 926 | |
Societe BIC SA | | | | | 10 | | | | 1,713 | |
Valeo SA | | | | | 10 | | | | 1,603 | |
| | | | | | | | | 15,644 | |
| | | | | Shares | | Value |
Reference Entity — Long |
Germany | | | | | | | | | | |
adidas AG | | | | | 7 | | | $ | 573 | |
Bayer AG, Registered Shares | | | | | 5 | | | | 720 | |
Bayerische Motoren Werke AG | | | | | 25 | | | | 2,949 | |
Daimler AG, Registered Shares | | | | | 40 | | | | 3,846 | |
Fuchs Petrolub SE, Preference Shares | | | | | 20 | | | | 842 | |
GEA Group AG | | | | | 24 | | | | 1,153 | |
Henkel AG & Co. KGaA, Preference Shares | | | | | 20 | | | | 2,323 | |
MAN SE | | | | | 6 | | | | 651 | |
Merck KGaA | | | | | 22 | | | | 2,372 | |
Puma SE | | | | | 3 | | | | 612 | |
Symrise AG | | | | | 21 | | | | 1,273 | |
Volkswagen AG, Preference Shares | | | | | 15 | �� | | | 3,862 | |
Wacker Chemie AG | | | | | 5 | | | | 620 | |
| | | | | | | | | 21,796 | |
Hong Kong | | | | | | | | | | |
Bank of East Asia Ltd. | | | | | 400 | | | | 1,735 | |
BOC Hong Kong Holdings Ltd. | | | | | 500 | | | | 1,939 | |
Cathay Pacific Airways Ltd. | | | | | 1,000 | | | | 2,575 | |
Champion REIT | | | | | 1,000 | | | | 542 | |
CLP Holdings Ltd. | | | | | 500 | | | | 4,377 | |
Galaxy Entertainment Group Ltd. | | | | | 1,000 | | | | 4,806 | |
Hang Seng Bank Ltd. | | | | | 200 | | | | 3,896 | |
Henderson Land Development Co. Ltd. | | | | | 1,210 | | | | 9,701 | |
Hong Kong & China Gas Co. Ltd. | | | | | 1,540 | | | | 3,668 | |
Kerry Logistics Network, Ltd. | | | | | 250 | | | | 403 | |
MTR Corp. | | | | | 1,000 | | | | 4,915 | |
Sands China Ltd. | | | | | 400 | | | | 1,630 | |
Wharf Holdings Ltd. | | | | | 1,000 | | | | 7,205 | |
Wynn Macau Ltd. | | | | | 400 | | | | 810 | |
| | | | | | | | | 48,202 | |
Ireland | | | | | | | | | | |
Accenture PLC, Class A | | | | | 47 | | | | 4,355 | |
Israel | | | | | | | | | | |
Bank Leumi Le-Israel BM | | | | | 545 | | | | 2,118 | |
Israel Chemicals Ltd. | | | | | 121 | | | | 846 | |
The Israel Corp. Ltd. | | | | | 2 | | | | 737 | |
| | | | | | | | | 3,701 | |
Italy | | | | | | | | | | |
Pirelli & C SpA | | | | | 121 | | | | 2,093 | |
Prysmian SpA | | | | | 72 | | | | 1,468 | |
Saipem SpA | | | | | 30 | | | | 398 | |
Tenaris SA | | | | | 93 | | | | 1,428 | |
| | | | | | | | | 5,387 | |
Japan | | | | | | | | | | |
Advantest Corp. | | | | | 100 | | | | 1,179 | |
Nexon Co. Ltd. | | | | | 200 | | | | 2,551 | |
Nitto Denko Corp. | | | | | 100 | | | | 6,409 | |
Sharp Corp. | | | | | 1,000 | | | | 2,155 | |
Sumco Corp. | | | | | 100 | | | | 1,509 | |
Tokyo Electron Ltd. | | | | | 100 | | | | 5,481 | |
Tokyo Seimitsu Co. Ltd. | | | | | 100 | | | | 2,155 | |
Toyota Motor Corp. | | | | | 100 | | | | 6,961 | |
Yamaha Motor Co. Ltd. | | | | | 100 | | | | 2,353 | |
| | | | | | | | | 30,753 | |
See Notes to Consolidated Financial Statements.
| BLACKROCK EMERGING MARKET ALLOCATION PORTFOLIO | APRIL 30, 2015 | 17
|
| |
Consolidated Schedule of Investments (continued)
|
| | | | | Shares | | Value |
Reference Entity — Long |
Netherlands | | | | | | | | | | |
Akzo Nobel NV | | | | | 21 | | | $ | 1,607 | |
Chicago Bridge & Iron Co. NV | | | | | 5 | | | | 238 | |
Koninklijke Boskalis Westminster NV | | | | | 39 | | | | 2,026 | |
Royal Dutch Shell PLC, Class B | | | | | 227 | | | | 7,268 | |
Unilever NV CVA | | | | | 160 | | | | 6,979 | |
| | | | | | | | | 18,118 | |
Norway | | | | | | | | | | |
Telenor ASA | | | | | 53 | | | | 1,197 | |
Singapore | | | | | | | | | | |
Flextronics International Ltd. | | | | | 213 | | | | 2,455 | |
Kenon Holdings Ltd. | | | | | 14 | | | | 303 | |
| | | | | | | | | 2,758 | |
Spain | | | | | | | | | | |
Banco Bilbao Vizcaya Argentaria SA | | | | | 144 | | | | 1,447 | |
Banco Santander SA | | | | | 390 | | | | 2,949 | |
Banco Santander SA, Rights | | | | | 390 | | | | 65 | |
Indra Sistemas SA | | | | | 38 | | | | 447 | |
Obrascon Huarte Lain SA | | | | | 12 | | | | 278 | |
Tecnicas Reunidas SA | | | | | 10 | | | | 465 | |
Telefonica SA | | | | | 88 | | | | 1,340 | |
| | | | | | | | | 6,991 | |
Sweden | | | | | | | | | | |
Alfa Laval AB | | | | | 28 | | | | 523 | |
Atlas Copco AB, Class A | | | | | 50 | | | | 1,561 | |
Investment AB Kinnevik, Class B | | | | | 27 | | | | 930 | |
Telefonaktiebolaget LM Ericsson, Class B | | | | | 58 | | | | 634 | |
Volvo AB, Class B | | | | | 63 | | | | 870 | |
| | | | | | | | | 4,518 | |
Switzerland | | | | | | | | | | |
ABB Ltd., Registered Shares | | | | | 89 | | | | 1,950 | |
Cie Financiere Richemont SA, Registered Shares | | | | | 23 | | | | 2,050 | |
Clariant AG | | | | | 37 | | | | 812 | |
DKSH Holding AG | | | | | 11 | | | | 866 | |
Dufry AG | | | | | 6 | | | | 882 | |
Glencore PLC | | | | | 298 | | | | 1,416 | |
Holcim Ltd., Registered Shares | | | | | 12 | | | | 964 | |
Nestle SA, Registered Shares | | | | | 113 | | | | 8,767 | |
OC Oerlikon Corp. AG, Registered Shares | | | | | 108 | | | | 1,413 | |
Schindler Holding AG, Participation Certificates | | | | | 17 | | | | 2,876 | |
SGS SA, Registered Shares | | | | | 1 | | | | 1,938 | |
Sika AG — Bearer Shares | | | | | 1 | | | | 3,432 | |
The Swatch Group AG, Bearer Shares | | | | | 2 | | | | 894 | |
| | | | | | | | | 28,260 | |
United Kingdom | | | | | | | | | | |
3i Group PLC | | | | | 143 | | | | 1,108 | |
BG Group PLC | | | | | 103 | | | | 1,866 | |
British American Tobacco PLC | | | | | 84 | | | | 4,615 | |
Burberry Group PLC | | | | | 21 | | | | 560 | |
Diageo PLC | | | | | 64 | | | | 1,777 | |
Eurasian Natural Resources Corp. PLC | | | | | 448 | | | | 1,496 | |
G4S PLC | | | | | 140 | | | | 628 | |
HSBC Holdings PLC | | | | | 756 | | | | 7,552 | |
Intertek Group PLC | | | | | 26 | | | | 1,039 | |
Investec PLC | | | | | 60 | | | | 573 | |
Mondi PLC | | | | | 47 | | | | 952 | |
Noble Corp. PLC | | | | | 45 | | | | 779 | |
| | | | | Shares | | Value |
Reference Entity — Long |
United Kingdom (concluded) | | | | | | | | | | |
Old Mutual PLC | | | | | 503 | | | $ | 1,804 | |
Rexam PLC | | | | | 135 | | | | 1,198 | |
Rotork PLC | | | | | 11 | | | | 397 | |
SABMiller PLC | | | | | 69 | | | | 3,652 | |
Standard Chartered PLC | | | | | 92 | | | | 1,506 | |
Vodafone Group PLC | | | | | 1,091 | | | | 3,844 | |
| | | | | | | | | 35,346 | |
United States | | | | | | | | | | |
3M Co. | | | | | 13 | | | | 2,033 | |
Actavis PLC | | | | | 2 | | | | 566 | |
Adobe Systems, Inc. | | | | | 9 | | | | 685 | |
Advanced Micro Devices, Inc. | | | | | 151 | | | | 341 | |
The AES Corp. | | | | | 83 | | | | 1,100 | |
Air Lease Corp. | | | | | 35 | | | | 1,352 | |
Alexion Pharmaceuticals, Inc. | | | | | 6 | | | | 1,015 | |
Amazon.com, Inc. | | | | | 10 | | | | 4,218 | |
American International Group, Inc. | | | | | 22 | | | | 1,238 | |
Amgen, Inc. | | | | | 29 | | | | 4,579 | |
Apple, Inc. | | | | | 133 | | | | 16,645 | |
Applied Materials, Inc. | | | | | 83 | | | | 1,643 | |
Atmel Corp. | | | | | 142 | | | | 1,076 | |
Avon Products, Inc. | | | | | 76 | | | | 621 | |
The Boeing Co. | | | | | 17 | | | | 2,437 | |
Bristol-Myers Squibb Co. | | | | | 47 | | | | 2,995 | |
Bunge Ltd. | | | | | 21 | | | | 1,814 | |
California Resources Corp. | | | | | 4 | | | | 37 | |
Caterpillar, Inc. | | | | | 31 | | | | 2,693 | |
Chevron Corp. | | | | | 41 | | | | 4,553 | |
Citigroup, Inc. | | | | | 141 | | | | 7,518 | |
The Coca-Cola Co. | | | | | 60 | | | | 2,434 | |
Colgate-Palmolive Co. | | | | | 19 | | | | 1,278 | |
Corning, Inc. | | | | | 114 | | | | 2,386 | |
Costco Wholesale Corp. | | | | | 6 | | | | 858 | |
Cypress Semiconductor Corp. | | | | | 84 | | | | 1,119 | |
Dresser-Rand Group, Inc. | | | | | 12 | | | | 992 | |
Dril-Quip, Inc. | | | | | 9 | | | | 717 | |
eBay, Inc. | | | | | 15 | | | | 874 | |
Entropic Communications, Inc. | | | | | 250 | | | | 755 | |
Expeditors International of Washington, Inc. | | | | | 56 | | | | 2,567 | |
Exxon Mobil Corp. | | | | | 104 | | | | 9,087 | |
Facebook, Inc., Class A | | | | | 56 | | | | 4,411 | |
FedEx Corp. | | | | | 4 | | | | 678 | |
Fluor Corp. | | | | | 12 | | | | 722 | |
FMC Corp. | | | | | 18 | | | | 1,068 | |
General Electric Co. | | | | | 135 | | | | 3,656 | |
Google, Inc., Class A | | | | | 16 | | | | 8,780 | |
Halyard Health, Inc. | | | | | 1 | | | | 48 | |
Hewlett-Packard Co. | | | | | 19 | | | | 626 | |
The Home Depot, Inc. | | | | | 74 | | | | 7,917 | |
Honeywell International, Inc. | | | | | 13 | | | | 1,312 | |
Intel Corp. | | | | | 182 | | | | 5,924 | |
International Business Machines Corp. | | | | | 24 | | | | 4,111 | |
Jabil Circuit, Inc. | | | | | 41 | | | | 923 | |
Johnson & Johnson | | | | | 89 | | | | 8,829 | |
Kansas City Southern | | | | | 7 | | | | 717 | |
KBR, Inc. | | | | | 32 | | | | 559 | |
Kimberly-Clark Corp. | | | | | 14 | | | | 1,536 | |
Kosmos Energy Ltd. | | | | | 128 | | | | 1,252 | |
Las Vegas Sands Corp. | | | | | 16 | | | | 846 | |
Lear Corp. | | | | | 16 | | | | 1,777 | |
See Notes to Consolidated Financial Statements.
| 18 | BLACKROCK EMERGING MARKET ALLOCATION PORTFOLIO | APRIL 30, 2015
|
| |
Consolidated Schedule of Investments (continued)
|
| | | | | Shares | | Value |
Reference Entity — Long |
United States (concluded) | | | | | | | | | | |
Marvell Technology Group Ltd. | | | | | 49 | | | $ | 687 | |
Mastercard, Inc., Class A | | | | | 27 | | | | 2,436 | |
Merck & Co., Inc. | | | | | 93 | | | | 5,539 | |
MGM Resorts International | | | | | 80 | | | | 1,692 | |
Micron Technology, Inc. | | | | | 37 | | | | 1,041 | |
Microsoft Corp. | | | | | 190 | | | | 9,242 | |
Monsanto Co. | | | | | 5 | | | | 570 | |
The Mosaic Co. | | | | | 26 | | | | 1,144 | |
Newfield Exploration Co. | | | | | 26 | | | | 1,020 | |
NIKE, Inc., Class B | | | | | 19 | | | | 1,878 | |
NVIDIA Corp. | | | | | 42 | | | | 932 | |
Occidental Petroleum Corp. | | | | | 12 | | | | 961 | |
ON Semiconductor Corp. | | | | | 151 | | | | 1,740 | |
Oracle Corp. | | | | | 93 | | | | 4,057 | |
Pall Corp. | | | | | 32 | | | | 3,114 | |
Paragon Offshore PLC | | | | | 14 | | | | 25 | |
PepsiCo, Inc. | | | | | 33 | | | | 3,139 | |
Pfizer, Inc. | | | | | 396 | | | | 13,436 | |
Philip Morris International, Inc. | | | | | 28 | | | | 2,337 | |
The Procter & Gamble Co. | | | | | 73 | | | | 5,804 | |
QUALCOMM, Inc. | | | | | 60 | | | | 4,080 | |
Raytheon Co. | | | | | 5 | | | | 520 | |
Samsonite International SA | | | | | 600 | | | | 2,188 | |
SanDisk Corp. | | | | | 7 | | | | 469 | |
Schlumberger Ltd. | | | | | 63 | | | | 5,960 | |
Teradyne, Inc. | | | | | 34 | | | | 621 | |
Texas Instruments, Inc. | | | | | 29 | | | | 1,572 | |
Thermo Fisher Scientific, Inc. | | | | | 18 | | | | 2,262 | |
United Technologies Corp. | | | | | 19 | | | | 2,161 | |
Verizon Communications, Inc. | | | | | 121 | | | | 6,094 | |
Visa, Inc., Class A | | | | | 64 | | | | 4,227 | |
Visteon Corp. | | | | | 11 | | | | 1,115 | |
VMware, Inc., Class A | | | | | 6 | | | | 529 | |
Wal-Mart Stores, Inc. | | | | | 88 | | | | 6,868 | |
Western Digital Corp. | | | | | 11 | | | | 1,075 | |
Wynn Resorts Ltd. | | | | | 8 | | | | 889 | |
Yum! Brands, Inc. | | | | | 29 | | | | 2,493 | |
| | | | | | | | | 241,835 | |
Net Value of Reference Entity — Goldman Sachs & Co. | $ | 499,684 | |
The following table represents the individual long and short positions and related values of the equity securities underlying the total return swap with UBS AG as of April 30, 2015, expiration date 7/10/15:
| | | | | Shares | | Value |
Reference Entity — Long |
Brazil | | | | | | | | | | |
AMBEV SA | | | | | 40,400 | | | $ | 253,963 | |
Banco Bradesco SA, Preference Shares | | | | | 18,720 | | | | 199,816 | |
Banco do Brasil SA | | | | | 24,300 | | | | 214,695 | |
Bradespar SA, Preference Shares | | | | | 30,300 | | | | 121,182 | |
Braskem SA, Preference A Shares | | | | | 36,800 | | | | 153,896 | |
BRF SA | | | | | 3,000 | | | | 64,123 | |
Cia Brasileira de Distribuicao Grupo Pao de Acucar, Preference Shares | | | | | 1,800 | | | | 60,937 | |
Cia Energetica de Sao Paulo, Preference ‘B’ Shares | | | | | 10,100 | | | | 63,692 | |
Cia Paranaense de Energia, Preference ‘B’ Shares | | | | | 9,700 | | | | 109,171 | |
Cyrela Brazil Realty SA | | | | | 2,500 | | | | 9,733 | |
EDP — Energias do Brasil SA | | | | | 20,500 | | | | 77,905 | |
Even Construtora e Incorporadora SA | | | | | 14,500 | | | | 23,870 | |
Gerdau SA, Preference Shares | | | | | 57,700 | | | | 192,464 | |
Itau Unibanco Holding SA, Preference Shares | | | | | 30,700 | | | | 392,596 | |
JBS SA | | | | | 97,900 | | | | 504,942 | |
Lojas Renner SA | | | | | 2,900 | | | | 101,112 | |
Metalurgica Gerdau SA, Preference Shares | | | | | 44,900 | | | | 146,639 | |
MRV Engenharia e Participacoes SA | | | | | 6,400 | | | | 17,524 | |
Multiplus SA | | | | | 21,500 | | | | 239,052 | |
Petroleo Brasileiro SA, Preference Shares | | | | | 66,100 | | | | 286,299 | |
Suzano Papel e Celulose SA, Preference ‘A’ Shares | | | | | 21,300 | | | | 106,749 | |
Telefonica Brasil SA, Preference Shares | | | | | 2,800 | | | | 46,466 | |
Vale SA, Preference Shares | | | | | 17,800 | | | | 107,227 | |
Valid Solucoes e Servicos de Seguranca em Meios de Pagamento e Identificacao SA | | | | | 1,600 | | | | 24,879 | |
| | | | | | | | | 3,518,932 | |
Chile | | | | | | | | | | |
Aguas Andinas SA, Class A | | | | | 31,333 | | | | 18,533 | |
Banco Santander Chile SA | | | | | 545,445 | | | | 29,366 | |
Empresas COPEC SA | | | | | 31,940 | | | | 366,638 | |
| | | | | | | | | 414,537 | |
China | | | | | | | | | | |
Agile Property Holdings Ltd. | | | | | 40,000 | | | | 33,405 | |
Agricultural Bank of China Ltd., Class H | | | | | 757,000 | | | | 426,176 | |
Air China Ltd., Class H | | | | | 38,000 | | | | 45,832 | |
Anhui Expressway Co., Ltd., Class H | | | | | 86,000 | | | | 74,274 | |
Anta Sports Products Ltd. | | | | | 91,000 | | | | 200,538 | |
Bank of Communications Co. Ltd., Class H | | | | | 125,000 | | | | 128,133 | |
China Cinda Asset Management Co. Ltd. | | | | | 249,000 | | | | 147,766 | |
China CNR Corp., Ltd. | | | | | 15,500 | | | | 31,659 | |
China Communications Construction Co. Ltd., Class H | | | | | 136,000 | | | | 247,364 | |
China Communications Services Corp. Ltd., Class H | | | | | 192,000 | | | | 108,201 | |
China Construction Bank Corp., Class H | | | | | 194,000 | | | | 188,323 | |
China Everbright Bank Co. Ltd., Class H | | | | | 314,000 | | | | 212,749 | |
China Life Insurance Co. Ltd., Class H | | | | | 1,000 | | | | 4,853 | |
China Machinery Engineering Corp. | | | | | 68,000 | | | | 90,271 | |
China Medical System Holdings Ltd. | | | | | 71,000 | | | | 125,297 | |
China Pacific Insurance Group Co. Ltd., Class H | | | | | 10,000 | | | | 54,203 | |
China Petroleum & Chemical Corp. Class H | | | | | 122,000 | | | | 115,139 | |
China Railway Construction Corp. Ltd., Class H | | | | | 42,000 | | | | 83,863 | |
See Notes to Consolidated Financial Statements.
| BLACKROCK EMERGING MARKET ALLOCATION PORTFOLIO | APRIL 30, 2015 | 19
|
| |
Consolidated Schedule of Investments (continued)
|
| | | | | Shares | | Value |
Reference Entity — Long |
China (concluded) | | | | | | | | | | |
China Railway Group Ltd., Class H | | | | | 2,000 | | | $ | 2,807 | |
China Unicom Hong Kong Ltd. | | | | | 24,000 | | | | 45,075 | |
CITIC Securities Co. Ltd., Class H | | | | | 1,000 | | | | 4,430 | |
Cogobuy Group | | | | | 6,000 | | | | 7,574 | |
CSPC Pharmaceutical Group Ltd. | | | | | 262,000 | | | | 272,461 | |
Dalian Wanda Commercial Properties Co., Ltd. | | | | | 23,600 | | | | 193,514 | |
Datang International Power Generation Co. Ltd., Class H | | | | | 48,000 | | | | 28,078 | |
Dongfeng Motor Group Co. Ltd., Class H | | | | | 230,000 | | | | 382,112 | |
Greentown China Holdings Ltd. | | | | | 107,000 | | | | 132,745 | |
Guangzhou Baiyunshan Pharmaceutical Holdings Co., Ltd., Class H | | | | | 34,000 | | | | 130,026 | |
Guangzhou R&F Properties Co. Ltd., Class H | | | | | 156,000 | | | | 198,970 | |
Haitong Securities Co. Ltd., Class H | | | | | 17,200 | | | | 56,177 | |
Huaneng Power International, Inc., Class H | | | | | 78,000 | | | | 110,621 | |
Industrial & Commercial Bank of China Ltd., Class H | | | | | 16,000 | | | | 13,879 | |
Jiangsu Expressway Co. Ltd., Class H | | | | | 34,000 | | | | 46,683 | |
Jintian Pharmaceutical Group Ltd. | | | | | 44,000 | | | | 23,415 | |
Lenovo Group Ltd. | | | | | 58,000 | | | | 99,735 | |
Longfor Properties Co. Ltd. | | | | | 45,000 | | | | 78,104 | |
Lonking Holdings Ltd. | | | | | 105,000 | | | | 26,042 | |
Metallurgical Corp. of China, Ltd. | | | | | 248,000 | | | | 146,352 | |
PetroChina Co. Ltd., Class H | | | | | 114,000 | | | | 147,033 | |
PICC Property & Casualty Co. Ltd., Class H | | | | | 60,000 | | | | 132,932 | |
Shanghai Pharmaceuticals Holding Co. Ltd., Class H | | | | | 84,700 | | | | 263,642 | |
Sihuan Pharmaceutical Holdings Group Ltd. | | | | | 323,000 | | | | 183,784 | |
Sino-Ocean Land Holdings Ltd. | | | | | 53,500 | | | | 44,506 | |
Sinopec Shanghai Petrochemical Co. Ltd., Class H | | | | | 148,000 | | | | 89,414 | |
Sinopharm Group Co. Ltd., Class H | | | | | 29,200 | | | | 138,694 | |
Sinotrans Ltd., Class H | | | | | 18,000 | | | | 13,776 | |
Tencent Holdings Ltd. | | | | | 5,900 | | | | 121,769 | |
Weichai Power Co. Ltd., Class H | | | | | 1,000 | | | | 3,962 | |
Zhejiang Expressway Co. Ltd., Class H | | | | | 300,000 | | | | 476,458 | |
Zhuzhou CSR Times Electric Co. Ltd., Class H | | | | | 8,000 | | | | 68,025 | |
ZTE Corp., Class H | | | | | 4,000 | | | | 13,460 | |
| | | | | | | | | 6,014,301 | |
Colombia | | | | | | | | | | |
Almacenes Exito SA | | | | | 763 | | | | 8,187 | |
Cementos Argos SA | | | | | 1,951 | | | | 8,289 | |
Corp. Financiera Colombiana SA | | | | | 204 | | | | 3,280 | |
Ecopetrol SA | | | | | 26,107 | | | | 22,249 | |
Grupo Argos SA | | | | | 1,923 | | | | 15,097 | |
Grupo de Inversiones Suramericana SA | | | | | 1,587 | | | | 26,077 | |
Interconexion Electrica SA | | | | | 4,360 | | | | 14,643 | |
Isagen SA ESP | | | | | 8,850 | | | | 11,833 | |
| | | | | | | | | 109,655 | |
Egypt | | | | | | | | | | |
Telecom Egypt | | | | | 10,596 | | | | 13,700 | |
Hong Kong | | | | | | | | | | |
AIA Group Ltd. | | | | | 800 | | | | 5,320 | |
Belle International Holdings Ltd. | | | | | 116,000 | | | | 148,883 | |
China Everbright Ltd. | | | | | 20,000 | | | | 66,117 | |
China Mobile Ltd. | | | | | 37,000 | | | | 528,482 | |
China Overseas Land & Investment Ltd. | | | | | 44,000 | | | | 183,277 | |
China Power International Development, Ltd. | | | | | 383,000 | | | | 246,907 | |
China Resources Cement Holdings Ltd. | | | | | 532,000 | | | | 338,110 | |
China Taiping Insurance Holdings Co. Ltd. | | | | | 8,800 | | | | 32,693 | |
| | | | | Shares | | Value |
Reference Entity — Long |
Hong Kong (concluded) | | | | | | | | | | |
China Travel International Inv HK | | | | | 48,000 | | | $ | 21,383 | |
Franshion Properties China Ltd. | | | | | 362,000 | | | | 146,255 | |
Guangdong Investment Ltd. | | | | | 128,000 | | | | 190,869 | |
Huabao International Holdings Ltd. | | | | | 71,000 | | | | 79,750 | |
Kingboard Chemical Holdings Ltd. | | | | | 68,500 | | | | 124,670 | |
KWG Property Holding Ltd. | | | | | 379,000 | | | | 382,940 | |
PAX Global Technology, Ltd. | | | | | 4,000 | | | | 5,811 | |
REXLot Holdings, Ltd. | | | | | 200,000 | | | | 14,895 | |
Shanghai Industrial Holdings, Ltd. | | | | | 3,000 | | | | 11,961 | |
Shimao Property Holdings Ltd. | | | | | 65,000 | | | | 153,030 | |
Sino Biopharmaceutical Ltd. | | | | | 156,000 | | | | 178,102 | |
Skyworth Digital Holdings Ltd. | | | | | 240,000 | | | | 213,801 | |
Yuexiu Property Co. Ltd. | | | | | 380,000 | | | | 92,918 | |
| | | | | | | | | 3,166,174 | |
Hungary | | | | | | | | | | |
MOL Hungarian Oil & Gas PLC | | | | | 8,099 | | | | 450,524 | |
Indonesia | | | | | | | | | | |
Adaro Energy Tbk PT | | | | | 1,179,200 | | | | 79,396 | |
Gudang Garam Tbk PT | | | | | 4,300 | | | | 16,526 | |
Indo Tambangraya Megah Tbk PT | | | | | 100 | | | | 97 | |
Indofood Sukses Makmur Tbk PT | | | | | 409,100 | | | | 212,335 | |
Lippo Karawaci Tbk PT | | | | | 160,200 | | | | 14,616 | |
Matahari Putra Prima Tbk PT | | | | | 477,100 | | | | 145,483 | |
Pembangunan Perumahan Persero Tbk PT | | | | | 392,400 | | | | 118,240 | |
Perusahaan Perkebunan London Sumatra Indonesia Tbk PT | | | | | 235,500 | | | | 25,748 | |
Summarecon Agung Tbk PT | | | | | 31,900 | | | | 4,358 | |
Telekomunikasi Indonesia Persero Tbk PT | | | | | 889,800 | | | | 178,958 | |
United Tractors Tbk PT | | | | | 154,700 | | | | 254,370 | |
| | | | | | | | | 1,050,127 | |
Malaysia | | | | | | | | | | |
Astro Malaysia Holdings Bhd | | | | | 25,500 | | | | 22,451 | |
British American Tobacco Malaysia Bhd | | | | | 25,500 | | | | 478,684 | |
IFCA MSC BHD | | | | | 28,900 | | | | 12,479 | |
IOI Corp. Bhd | | | | | 63,000 | | | | 76,771 | |
KNM Group BHD | | | | | 685,300 | | | | 122,591 | |
MISC Bhd | | | | | 44,500 | | | | 113,868 | |
Tenaga Nasional Bhd | | | | | 57,500 | | | | 231,422 | |
YTL Power International Bhd | | | | | 78,500 | | | | 35,266 | |
| | | | | | | | | 1,093,532 | |
Philippines | | | | | | | | | | |
Energy Development Corp. | | | | | 800,400 | | | | 145,163 | |
Globe Telecom, Inc. | | | | | 2,645 | | | | 129,317 | |
Jollibee Foods Corp. | | | | | 15,730 | | | | 70,194 | |
Megaworld Corp. | | | | | 83,000 | | | | 9,840 | |
Metro Pacific Investments Corp. | | | | | 245,000 | | | | 24,878 | |
Universal Robina Corp. | | | | | 21,040 | | | | 102,604 | |
| | | | | | | | | 481,996 | |
Poland | | | | | | | | | | |
Bank Handlowy w Warszawie SA | | | | | 1,730 | | | | 54,786 | |
Enea SA | | | | | 29,721 | | | | 134,576 | |
KGHM Polska Miedz SA | | | | | 4,489 | | | | 157,395 | |
PGE SA | | | | | 56,210 | | | | 323,440 | |
Polski Koncern Naftowy Orlen SA | | | | | 5,143 | | | | 97,674 | |
Polskie Gornictwo Naftowe i Gazownictwo SA | | | | | 24,830 | | | | 44,786 | |
Tauron Polska Energia SA | | | | | 219,992 | | | | 294,236 | |
| | | | | | | | | 1,106,893 | |
See Notes to Consolidated Financial Statements.
| 20 | BLACKROCK EMERGING MARKET ALLOCATION PORTFOLIO | APRIL 30, 2015
|
| |
Consolidated Schedule of Investments (continued)
|
| | | | | Shares | | Value |
Reference Entity — Long |
Russia | | | | | | | | | | |
Alrosa AO | | | | | 32,700 | | | $ | 43,472 | |
Gazprom OAO — ADR | | | | | 42,567 | | | | 249,398 | |
Lukoil OAO — ADR | | | | | 4,260 | | | | 218,121 | |
Magnit OJSC — GDR | | | | | 690 | | | | 37,855 | |
MMC Norilsk Nickel | | | | | 613 | | | | 115,180 | |
MMC Norilsk Nickel OJSC — ADR | | | | | 1,259 | | | | 23,717 | |
Mobile Telesystems — ADR | | | | | 2,879 | | | | 34,778 | |
Mobile TeleSystems OJSC | | | | | 12,750 | | | | 65,187 | |
Moscow Exchange MICEX-RTS OAO | | | | | 6,900 | | | | 10,336 | |
Severstal PAO, -GDR | | | | | 169 | | | | 1,873 | |
Sistema JSFC | | | | | 15,600 | | | | 4,796 | |
Surgutneftegas OAO | | | | | 65,600 | | | | 48,727 | |
Tatneft OAO | | | | | 5,700 | | | | 32,624 | |
Tatneft OAO — ADR | | | | | 583 | | | | 19,998 | |
| | | | | | | | | 906,062 | |
South Africa | | | | | | | | | | |
AngloGold Ashanti Ltd. | | | | | 3,455 | | | | 39,237 | |
Barclays Africa Group Ltd. | | | | | 1,394 | | | | 22,329 | |
Barloworld Ltd. | | | | | 459 | | | | 3,662 | |
Bidvest Group Ltd. | | | | | 1,042 | | | | 28,243 | |
Capitec Bank Holdings, Ltd. | | | | | 235 | | | | 11,065 | |
Clicks Group, Ltd. | | | | | 13,420 | | | | 102,846 | |
Exxaro Resources Ltd. | | | | | 1,840 | | | | 15,062 | |
FirstRand Ltd. | | | | | 63,192 | | | | 301,874 | |
Investec Ltd. | | | | | 1,246 | | | | 11,848 | |
Mediclinic International Ltd. | | | | | 7,414 | | | | 78,510 | |
MMI Holdings Ltd. | | | | | 8,543 | | | | 24,309 | |
Mr. Price Group Ltd. | | | | | 3,443 | | | | 73,508 | |
MTN Group Ltd. | | | | | 22,925 | | | | 460,309 | |
Netcare Ltd. | | | | | 134,922 | | | | 471,986 | |
Pick n Pay Stores Ltd. | | | | | 7,577 | | | | 36,278 | |
Sasol Ltd. | | | | | 381 | | | | 15,340 | |
Sibanye Gold, Ltd. | | | | | 68,273 | | | | 162,032 | |
Standard Bank Group Ltd. | | | | | 6,237 | | | | 91,422 | |
Truworths International Ltd. | | | | | 4,112 | | | | 29,970 | |
| | | | | | | | | 1,979,830 | |
South Korea | | | | | | | | | | |
Amorepacific Corp. | | | | | 125 | | | | 452,892 | |
Asiana Airlines, Inc. | | | | | 2,014 | | | | 14,429 | |
Daewoo International Corp. | | | | | 405 | | | | 11,815 | |
Doosan Infracore Co., Ltd. | | | | | 9,992 | | | | 110,430 | |
GOLFZON Co., Ltd. | | | | | 129 | | | | 15,102 | |
Hankook Tire Co., Ltd. | | | | | 4,079 | | | | 171,420 | |
Hanwha Corp. | | | | | 368 | | | | 14,451 | |
Hyosung Corp. | | | | | 838 | | | | 92,690 | |
Hyundai Department Store Co., Ltd. | | | | | 134 | | | | 18,190 | |
Hyundai Engineering & Construction Co., Ltd. | | | | | 977 | | | | 47,005 | |
Hyundai Mobis | | | | | 2,667 | | | | 586,414 | |
Hyundai Motor Co. | | | | | 39 | | | | 6,121 | |
Hyundai Steel Co. | | | | | 2,350 | | | | 171,766 | |
Hyundai Wia Corp. | | | | | 86 | | | | 12,186 | |
Kangwon Land, Inc. | | | | | 2,754 | | | | 93,879 | |
Kia Motors Corp. | | | | | 880 | | | | 40,552 | |
Korea Electric Power Corp. | | | | | 1,690 | | | | 73,488 | |
Korea Investment Holdings Co., Ltd. | | | | | 1,059 | | | | 67,805 | |
Korea Petrochemical Ind Co., Ltd. | | | | | 738 | | | | 119,144 | |
KT Skylife Co., Ltd. | | | | | 1,779 | | | | 28,890 | |
LG Display Co., Ltd. | | | | | 2,079 | | | | 57,574 | |
LG Electronics, Inc. | | | | | 1,718 | | | | 96,608 | |
LG Innotek Co., Ltd. | | | | | 78 | | | | 7,242 | |
| | | | | Shares | | Value |
Reference Entity — Long |
South Korea (concluded) | | | | | | | | | | |
Lotte Food Co., Ltd. | | | | | 18 | | | $ | 12,761 | |
Lotte Himart Co., Ltd. | | | | | 312 | | | | 20,711 | |
Lotte Shopping Co., Ltd. | | | | | 43 | | | | 10,370 | |
LS Corp. | | | | | 311 | | | | 15,635 | |
Medy-Tox, Inc. | | | | | 267 | | | | 92,303 | |
NCSoft Corp. | | | | | 36 | | | | 6,858 | |
Neowiz Games Corp. | | | | | 186 | | | | 3,779 | |
Poongsan Corp. | | | | | 1,410 | | | | 37,987 | |
Posco ICT Co., Ltd. | | | | | 1 | | | | 5 | |
Samsung Card Co., Ltd. | | | | | 106 | | | | 4,056 | |
Samsung Electro-Mechanics Co., Ltd. | | | | | 528 | | | | 33,135 | |
Samsung Electronics Co. Ltd. | | | | | 611 | | | | 801,543 | |
Samsung Electronics Co., Ltd. -GDR | | | | | 73 | | | | 47,872 | |
Samsung SDS Co., Ltd. | | | | | 56 | | | | 13,324 | |
Shinhan Financial Group Co., Ltd. | | | | | 748 | | | | 30,958 | |
Shinsegae Co., Ltd. | | | | | 143 | | | | 26,831 | |
SK C&C Co., Ltd. | | | | | 116 | | | | 27,453 | |
SK Hynix, Inc. | | | | | 1,015 | | | | 43,427 | |
SK Networks Co., Ltd. | | | | | 24,987 | | | | 184,684 | |
SK Telecom Co. Ltd. | | | | | 72 | | | | 19,294 | |
SKC Co., Ltd. | | | | | 2,390 | | | | 94,076 | |
Spigen Korea Co., Ltd. | | | | | 207 | | | | 28,525 | |
Sungwoo Hitech Co., Ltd. | | | | | 9,115 | | | | 95,739 | |
Tovis Co., Ltd. | | | | | 381 | | | | 5,532 | |
Woori Bank | | | | | 3,211 | | | | 32,077 | |
Yuhan Corp. | | | | | 47 | | | | 10,126 | |
| | | | | | | | | 4,009,154 | |
Spain | | | | | | | | | | |
Cemex Latam Holdings SA | | | | | 637 | | | | 3,557 | |
Taiwan | | | | | | | | | | |
Advanced Semiconductor Engineering, Inc. | | | | | 213,000 | | | | 302,061 | |
Ardentec Corp. | | | | | 24,000 | | | | 22,466 | |
AU Optronics Corp. | | | | | 394,000 | | | | 197,728 | |
Cathay Financial Holding Co. Ltd. | | | | | 12,000 | | | | 20,964 | |
Cheng Uei Precision Industry Co., Ltd. | | | | | 11,000 | | | | 21,631 | |
Chicony Electronics Co., Ltd. | | | | | 71,085 | | | | 204,403 | |
Chimei Materials Technology Corp. | | | | | 600 | | | | 645 | |
China Airlines Ltd. | | | | | 51,000 | | | | 27,144 | |
Compeq Manufacturing Co., Ltd. | | | | | 18,000 | | | | 11,394 | |
CTCI Corp. | | | | | 113,000 | | | | 198,684 | |
Elan Microelectronics Corp. | | | | | 80,000 | | | | 130,980 | |
Elite Advanced Laser Corp. | | | | | 14,000 | | | | 60,733 | |
Everlight Electronics Co., Ltd. | | | | | 46,000 | | | | 106,344 | |
Far Eastern Department Stores Ltd. | | | | | 181,077 | | | | 145,530 | |
Faraday Technology Corp. | | | | | 40,000 | | | | 54,974 | |
Feng TAY Enterprise Co., Ltd. | | | | | 1,000 | | | | 6,171 | |
Foxconn Technology Co., Ltd. | | | | | 21,000 | | | | 59,851 | |
Gigabyte Technology Co., Ltd. | | | | | 62,000 | | | | 75,231 | |
Highwealth Construction Corp. | | | | | 7,000 | | | | 18,260 | |
Hon Hai Precision Industry Co. Ltd. | | | | | 81,200 | | | | 243,311 | |
Innolux Corp. | | | | | 1,501,311 | | | | 774,431 | |
King Yuan Electronics Co., Ltd. | | | | | 298,000 | | | | 270,887 | |
Lite-On Technology Corp. | | | | | 85,000 | | | | 107,396 | |
Nanya Technology Corp. | | | | | 59,000 | | | | 131,038 | |
PChome Online, Inc. | | | | | 6,000 | | | | 101,492 | |
Pegatron Corp. | | | | | 35,000 | | | | 103,686 | |
Pou Chen Corp. | | | | | 271,000 | | | | 379,767 | |
Siliconware Precision Industries Co. | | | | | 117,000 | | | | 192,208 | |
Sitronix Technology Corp. | | | | | 52,000 | | | | 187,583 | |
Soft-World International Corp. | | | | | 23,000 | | | | 65,401 | |
See Notes to Consolidated Financial Statements.
| BLACKROCK EMERGING MARKET ALLOCATION PORTFOLIO | APRIL 30, 2015 | 21
|
| |
Consolidated Schedule of Investments (continued)
|
| | | | | Shares | | Value |
Reference Entity — Long |
Taiwan (concluded) | | | | | | | | | | |
Taiwan Cement Corp. | | | | | 204,000 | | | $ | 289,714 | |
Taiwan Paiho, Ltd. | | | | | 19,000 | | | | 51,589 | |
Taiwan Semiconductor Manufacturing Co. Ltd. | | | | | 62,000 | | | | 298,485 | |
Transcend Information, Inc. | | | | | 7,000 | | | | 26,895 | |
TXC Corp. | | | | | 6,000 | | | | 7,788 | |
United Microelectronics Corp. | | | | | 64,000 | | | | 30,664 | |
Yuanta Financial Holding Co., Ltd. | | | | | 187,250 | | | | 108,836 | |
Zhen Ding Technology Holding Ltd. | | | | | 19,000 | | | | 66,146 | |
| | | | | | | | | 5,102,511 | |
Thailand | | | | | | | | | | |
Advanced Info Service PCL | | | | | 6,100 | | | | 44,411 | |
Airports of Thailand PCL | | | | | 6,500 | | | | 57,182 | |
Bangkok Dusit Medical Services PCL | | | | | 46,200 | | | | 28,310 | |
Central Pattana PCL | | | | | 31,600 | | | | 40,261 | |
Delta Electronics Thailand PCL | | | | | 1,900 | | | | 4,813 | |
Kasikornbank PCL, Foreign Registered Shares | | | | | 28,100 | | | | 178,396 | |
Krung Thai Bank PCL | | | | | 29,100 | | | | 17,655 | |
Nawarat Patanakarn PCL | | | | | 6,576 | | | | 363 | |
PTT PCL | | | | | 4,200 | | | | 45,357 | |
Siam Cement PCL, Foreign Registered Shares | | | | | 2,200 | | | | 35,558 | |
Siam Commercial Bank PCL | | | | | 900 | | | | 4,341 | |
Thanachart Capital PCL | | | | | 100,700 | | | | 103,862 | |
TMB Bank PCL | | | | | 130,900 | | | | 10,324 | |
| | | | | | | | | 570,833 | |
Turkey | | | | | | | | | | |
Arcelik AS | | | | | 15,379 | | | | 82,840 | |
Enka Insaat ve Sanayi AS | | | | | 197,431 | | | | 424,339 | |
Eregli Demir ve Celik Fabrikalari TAS | | | | | 9,965 | | | | 16,816 | |
KOC Holding AS | | | | | 17,250 | | | | 81,586 | |
Koza Altin Isletmeleri AS | | | | | 16,554 | | | | 172,931 | |
TAV Havalimanlari Holding AS | | | | | 32,735 | | | | 287,802 | |
Tofas Turk Otomobil Fabrikasi AS | | | | | 15,455 | | | | 94,715 | |
Tupras Turkiye Petrol Rafinerileri AS | | | | | 9,018 | | | | 219,044 | |
Turk Hava Yollari | | | | | 85,197 | | | | 282,618 | |
Turk Telekomunikasyon AS | | | | | 67,790 | | | | 187,370 | |
Turkiye Is Bankasi, Class C | | | | | 14,606 | | | | 32,843 | |
Yapi ve Kredi Bankasi | | | | | 3,518 | | | | 5,508 | |
| | | | | | | | | 1,888,412 | |
United Arab Emirates | | | | | | | | | | |
Emaar Properties PJSC | | | | | 11,503 | | | | 25,508 | |
United Kingdom | | | | | | | | | | |
British American Tobacco PLC | | | | | 1,600 | | | | 88,509 | |
Old Mutual PLC | | | | | 1,147 | | | | 4,131 | |
| | | | | | | | | 92,640 | |
Total Reference Entity — Long | | | | | | | | | 31,998,878 | |
|
Reference Entity — Short |
Brazil | | | | | | | | | | |
AES Tiete SA | | | | | (800 | ) | | | (4,594 | ) |
BB Seguridade Participacoes SA | | | | | (7,400 | ) | | | (86,576 | ) |
CCR SA | | | | | (17,900 | ) | | | (98,621 | ) |
Cia de Transmissao de Energia Eletrica Paulista | | | | | (8,100 | ) | | | (114,257 | ) |
Cielo SA | | | | | (73,040 | ) | | | (1,016,710 | ) |
Duratex SA | | | | | (38,110 | ) | | | (107,388 | ) |
EcoRodovias Infraestrutura e Logistica SA | | | | | (2,900 | ) | | | (8,537 | ) |
Equatorial Energia SA | | | | | (1,100 | ) | | | (11,690 | ) |
| | | | | Shares | | Value |
Reference Entity — Short |
Brazil (concluded) | | | | | | | | | | |
Iguatemi Empresa de Shopping Centers SA | | | | | (1,500 | ) | | $ | (13,442 | ) |
Itausa — Investimentos Itau SA | | | | | (26,500 | ) | | | (93,319 | ) |
Klabin SA | | | | | (99,800 | ) | | | (612,126 | ) |
Kroton Educacional SA | | | | | (5,600 | ) | | | (20,445 | ) |
Localiza Rent a Car SA | | | | | (1,300 | ) | | | (15,153 | ) |
Ultrapar Participacoes SA | | | | | (2,700 | ) | | | (62,138 | ) |
| | | | | | | | | (2,264,996 | ) |
Chile | | | | | | | | | | |
Colbun SA | | | | | (152,676 | ) | | | (46,191 | ) |
China | | | | | | | | | | |
AAC Technologies Holdings, Inc. | | | | | (11,500 | ) | | | (60,705 | ) |
Aluminum Corp. of China Ltd., Class H | | | | | (100,000 | ) | | | (64,520 | ) |
AviChina Industry & Technology Co., Ltd., Class H | | | | | (56,000 | ) | | | (63,445 | ) |
BBMG Corp. | | | | | (59,500 | ) | | | (73,639 | ) |
China Coal Energy Co., Ltd. | | | | | (105,000 | ) | | | (69,020 | ) |
China Huishan Dairy Holdings Co., Ltd. | | | | | (715,000 | ) | | | (152,425 | ) |
China Longyuan Power Group Corp., Class H | | | | | (5,000 | ) | | | (6,196 | ) |
China Minsheng Banking Corp., Ltd. | | | | | (5,000 | ) | | | (7,301 | ) |
China Modern Dairy Holdings, Ltd. | | | | | (291,000 | ) | | | (118,389 | ) |
China Molybdenum Co., Ltd., Class H | | | | | (91,000 | ) | | | (91,022 | ) |
China National Building Material Co., Ltd., Class H | | | | | (48,000 | ) | | | (58,221 | ) |
China Shanshui Cement Group, Ltd. | | | | | (23,000 | ) | | | (18,666 | ) |
China Shipping Container Lines Co., Ltd., Class H | | | | | (81,000 | ) | | | (45,680 | ) |
China Tian Lun Gas Holdings, Ltd. | | | | | (27,000 | ) | | | (27,346 | ) |
CNOOC, Ltd. | | | | | (4,000 | ) | | | (6,821 | ) |
ENN Energy Holdings Ltd. | | | | | (10,000 | ) | | | (71,974 | ) |
Evergrande Real Estate Group, Ltd. | | | | | (34,000 | ) | | | (32,150 | ) |
Fosun International, Ltd. | | | | | (7,500 | ) | | | (18,694 | ) |
Guangshen Railway Co., Ltd. | | | | | (90,000 | ) | | | (59,601 | ) |
Haitian International Holdings, Ltd. | | | | | (19,000 | ) | | | (47,256 | ) |
Hilong Holding, Ltd. | | | | | (292,000 | ) | | | (109,999 | ) |
Kangda International Environmental Co., Ltd. | | | | | (9,000 | ) | | | (4,940 | ) |
Kingdee International Software Group Co., Ltd. | | | | | (186,000 | ) | | | (110,357 | ) |
Kingsoft Corp., Ltd. | | | | | (24,000 | ) | | | (93,824 | ) |
Li Ning Co., Ltd. | | | | | (155,500 | ) | | | (86,010 | ) |
Maanshan Iron & Steel Co., Ltd., Class H | | | | | (226,000 | ) | | | (87,818 | ) |
Semiconductor Manufacturing International Corp. | | | | | (103,000 | ) | | | (11,351 | ) |
Shanghai Electric Group Co., Ltd. | | | | | (12,000 | ) | | | (12,236 | ) |
Shui On Land Ltd. | | | | | (352,000 | ) | | | (113,761 | ) |
Sichuan Expressway Co., Ltd. | | | | | (32,000 | ) | | | (17,545 | ) |
Sinopec Engineering Group Co., Ltd. | | | | | (6,000 | ) | | | (6,476 | ) |
SOHO China, Ltd. | | | | | (32,000 | ) | | | (24,276 | ) |
Sunac China Holdings, Ltd. | | | | | (58,000 | ) | | | (76,267 | ) |
Sunny Optical Technology Group Co., Ltd. | | | | | (128,000 | ) | | | (284,839 | ) |
Tingyi Cayman Islands Holding Corp. | | | | | (80,000 | ) | | | (168,942 | ) |
Uni-President China Holdings, Ltd. | | | | | (95,000 | ) | | | (76,853 | ) |
Want Want China Holdings, Ltd. | | | | | (23,000 | ) | | | (25,229 | ) |
Yanzhou Coal Mining Co., Ltd., Class H | | | | | (68,000 | ) | | | (67,996 | ) |
| | | | | | | | | (2,471,790 | ) |
Egypt | | | | | | | | | | |
Global Telecom Holding — GDR | | | | | (18,789 | ) | | | (41,148 | ) |
Hong Kong | | | | | | | | | | |
Alibaba Pictures Group, Ltd. | | | | | (90,000 | ) | | | (44,270 | ) |
AVIC International Holding HK, Ltd. | | | | | (46,000 | ) | | | (7,455 | ) |
Beijing Enterprises Water Group Ltd. | | | | | (454,000 | ) | | | (391,548 | ) |
See Notes to Consolidated Financial Statements.
| 22 | BLACKROCK EMERGING MARKET ALLOCATION PORTFOLIO | APRIL 30, 2015
|
| |
Consolidated Schedule of Investments (continued)
|
| | | | | Shares | | Value |
Reference Entity — Short |
Hong Kong (concluded) | | | | | | | | | | |
China Agri-Industries Holdings Ltd. | | | | | (101,000 | ) | | $ | (57,676 | ) |
China Everbright International, Ltd. | | | | | (1,000 | ) | | | (1,865 | ) |
China Gas Holdings, Ltd. | | | | | (8,000 | ) | | | (14,135 | ) |
China Resources Gas Group, Ltd. | | | | | (2,000 | ) | | | (6,946 | ) |
China Resources Power Holdings Co., Ltd. | | | | | (2,000 | ) | | | (6,033 | ) |
China Singyes Solar Technologies Holdings, Ltd. | | | | | (88,000 | ) | | | (144,111 | ) |
GCL-Poly Energy Holdings Ltd. | | | | | (187,000 | ) | | | (56,555 | ) |
Geely Automobile Holdings, Ltd. | | | | | (20,000 | ) | | | (11,251 | ) |
Kunlun Energy Co., Ltd. | | | | | (22,000 | ) | | | (26,117 | ) |
Lee & Man Paper Manufacturing, Ltd. | | | | | (15,000 | ) | | | (8,498 | ) |
Tech Pro Technology Development, Ltd. | | | | | (16,000 | ) | | | (13,006 | ) |
Towngas China Co., Ltd. | | | | | (19,000 | ) | | | (20,376 | ) |
WH Group, Ltd. | | | | | (77,500 | ) | | | (54,094 | ) |
| | | | | | | | | (863,936 | ) |
India | | | | | | | | | | |
Larsen & Toubro Ltd. — GDR | | | | | (523 | ) | | | (13,285 | ) |
Indonesia | | | | | | | | | | |
Charoen Pokphand Indonesia Tbk PT | | | | | (55,700 | ) | | | (12,146 | ) |
Tower Bersama Infrastructure Tbk PT | | | | | (201,400 | ) | | | (131,677 | ) |
| | | | | | | | | (143,823 | ) |
Malaysia | | | | | | | | | | |
Bumi Armada BHD | | | | | (110,500 | ) | | | (36,823 | ) |
Dialog Group BHD | | | | | (27,400 | ) | | | (12,429 | ) |
Gamuda BHD | | | | | (172,500 | ) | | | (253,171 | ) |
Lafarge Malaysia BHD | | | | | (1,300 | ) | | | (3,523 | ) |
Petronas Dagangan BHD | | | | | (16,400 | ) | | | (98,576 | ) |
Sapurakencana Petroleum Bhd | | | | | (444,000 | ) | | | (330,618 | ) |
UMW Holdings BHD | | | | | (32,600 | ) | | | (97,294 | ) |
| | | | | | | | | (832,434 | ) |
Malta | | | | | | | | | | |
Brait SE | | | | | (87,394 | ) | | | (665,212 | ) |
Mexico | | | | | | | | | | |
Minera Frisco SAB de CV, Series A-1 | | | | | (54,300 | ) | | | (45,091 | ) |
Poland | | | | | | | | | | |
LPP SA | | | | | (118 | ) | | | (250,760 | ) |
Russia | | | | | | | | | | |
MegaFon OAO — GDR | | | | | (1,325 | ) | | | (22,525 | ) |
NovaTek OAO — GDR | | | | | (1,017 | ) | | | (98,471 | ) |
Uralkali OJSC — GDR | | | | | (8,414 | ) | | | (123,752 | ) |
| | | | | | | | | (244,748 | ) |
South Africa | | | | | | | | | | |
Aspen Pharmacare Holdings, Ltd. | | | | | (12,746 | ) | | | (387,600 | ) |
Discovery Holdings Ltd. | | | | | (4,903 | ) | | | (54,411 | ) |
Imperial Holdings, Ltd. | | | | | (1,369 | ) | | | (22,926 | ) |
Nampak Ltd. | | | | | (27,994 | ) | | | (100,256 | ) |
Remgro Ltd. | | | | | (826 | ) | | | (18,347 | ) |
Resilient Property Income Fund, Ltd. | | | | | (23,869 | ) | | | (199,721 | ) |
RMB Holdings, Ltd. | | | | | (3,167 | ) | | | (19,058 | ) |
Steinhoff International Holdings, Ltd. | | | | | (3,787 | ) | | | (24,030 | ) |
Woolworths Holdings, Ltd. | | | | | (106,690 | ) | | | (802,602 | ) |
| | | | | | | | | (1,628,951 | ) |
South Korea | | | | | | | | | | |
Able C&C Co., Ltd. | | | | | (294 | ) | | | (8,679 | ) |
Chabiotech Co., Ltd. | | | | | (1,290 | ) | | | (19,726 | ) |
Cheil Industries, Inc. | | | | | (414 | ) | | | (60,933 | ) |
Cosmax, Inc. | | | | | (114 | ) | | | (15,391 | ) |
| | | | | Shares | | Value |
Reference Entity — Short |
South Korea (concluded) | | | | | | | | | | |
CrucialTec Co., Ltd. | | | | | (6,092 | ) | | $ | (65,940 | ) |
Daelim Industrial Co., Ltd. | | | | | (116 | ) | | | (8,933 | ) |
Daewoo Engineering & Construction Co., Ltd. | | | | | (5,240 | ) | | | (34,692 | ) |
Daewoo Shipbuilding & Marine Engineering Co., Ltd. | | | | | (13,219 | ) | | | (222,204 | ) |
Doosan Heavy Industries & Construction Co., Ltd. | | | | | (1,237 | ) | | | (35,096 | ) |
Eo Technics Co., Ltd. | | | | | (2,172 | ) | | | (223,654 | ) |
GS Holdings | | | | | (325 | ) | | | (15,161 | ) |
Hanjin Transportation Co., Ltd. | | | | | (884 | ) | | | (50,057 | ) |
Hansol Technics Co., Ltd. | | | | | (551 | ) | | | (9,730 | ) |
Hanwha Chemical Corp. | | | | | (745 | ) | | | (11,879 | ) |
Hanwha Life Insurance Co., Ltd. | | | | | (5,254 | ) | | | (38,866 | ) |
Hotel Shilla Co., Ltd. | | | | | (34 | ) | | | (3,385 | ) |
Hyundai Glovis Co., Ltd. | | | | | (311 | ) | | | (68,220 | ) |
Hyundai Heavy Industries Co., Ltd. | | | | | (1,154 | ) | | | (149,938 | ) |
Interpark Corp. | | | | | (1,319 | ) | | | (10,975 | ) |
Kolao Holdings | | | | | (12,528 | ) | | | (233,824 | ) |
OCI Co., Ltd. | | | | | (117 | ) | | | (10,783 | ) |
Paradise Co., Ltd. | | | | | (1,416 | ) | | | (32,851 | ) |
S-Oil Corp. | | | | | (1,977 | ) | | | (134,701 | ) |
Samsung Fine Chemicals Co., Ltd. | | | | | (85 | ) | | | (3,440 | ) |
Samsung Fire & Marine Insurance Co., Ltd. | | | | | (114 | ) | | | (30,042 | ) |
Samsung Heavy Industries Co., Ltd. | | | | | (26,590 | ) | | | (447,873 | ) |
Samsung SDI Co., Ltd. | | | | | (1,421 | ) | | | (158,202 | ) |
Samsung Techwin Co., Ltd. | | | | | (2,090 | ) | | | (53,681 | ) |
| | | | | | | | | (2,158,856 | ) |
Taiwan | | | | | | | | | | |
Advantech Co., Ltd. | | | | | (8,000 | ) | | | (65,902 | ) |
Epistar Corp. | | | | | (26,000 | ) | | | (40,613 | ) |
Formosa Chemicals & Fibre Corp. | | | | | (7,000 | ) | | | (17,837 | ) |
Hermes Microvision, Inc. | | | | | (1,000 | ) | | | (70,318 | ) |
Hiwin Technologies Corp. | | | | | (16,480 | ) | | | (125,656 | ) |
Hotai Motor Co., Ltd. | | | | | (25,000 | ) | | | (433,159 | ) |
Kinsus Interconnect Technology Corp. | | | | | (2,000 | ) | | | (6,100 | ) |
MediaTek, Inc. | | | | | (32,000 | ) | | | (411,334 | ) |
Quanta Computer, Inc. | | | | | (15,000 | ) | | | (37,634 | ) |
Radiant Opto-Electronics Corp. | | | | | (17,000 | ) | | | (55,902 | ) |
ScinoPharm Taiwan, Ltd. | | | | | (2,000 | ) | | | (3,349 | ) |
Tong Hsing Electronic Industries, Ltd. | | | | | (5,000 | ) | | | (16,018 | ) |
Unimicron Technology Corp. | | | | | (165,000 | ) | | | (98,215 | ) |
Winbond Electronics Corp. | | | | | (123,000 | ) | | | (40,719 | ) |
Wistron Corp. | | | | | (125,000 | ) | | | (106,339 | ) |
Yang Ming Marine Transport Corp. | | | | | (639,000 | ) | | | (334,516 | ) |
| | | | | | | | | (1,863,611 | ) |
Thailand | | | | | | | | | | |
Charoen Pokphand Foods PCL | | | | | (79,200 | ) | | | (53,577 | ) |
CP ALL PCL | | | | | (664,600 | ) | | | (846,753 | ) |
Hemaraj Land and Development PCL | | | | | (123,245 | ) | | | (16,151 | ) |
Home Product Center PCL | | | | | (187,059 | ) | | | (40,856 | ) |
True Corp. PCL | | | | | (822,500 | ) | | | (304,398 | ) |
| | | | | | | | | (1,261,735 | ) |
Turkey | | | | | | | | | | |
BIM Birlesik Magazalar | | | | | (8,960 | ) | | | (165,882 | ) |
Emlak Konut Gayrimenkul Yatirim Ortakligi | | | | | (31,068 | ) | | | (35,887 | ) |
Petkim Petrokimya Holding | | | | | (64,840 | ) | | | (91,117 | ) |
Ulker Biskuvi Sanayi | | | | | (24,451 | ) | | | (186,836 | ) |
Zorlu Enerji Elektrik Uretim | | | | | (8,719 | ) | | | (6,723 | ) |
| | | | | | | | | (486,445 | ) |
Total Reference Entity — Short | | | | | | | | | (15,283,012 | ) |
Net Value of Reference Entity — UBS AG | $ | 16,715,866 | |
See Notes to Consolidated Financial Statements.
| BLACKROCK EMERGING MARKET ALLOCATION PORTFOLIO | APRIL 30, 2015 | 23
|
| |
| Schedule of Investments (concluded) |
|
| • | | | | Fair Value Measurements — Various inputs are used in determining the fair value of investments and derivative financial instruments. These inputs to valuation techniques are categorized into a disclosure hierarchy consisting of three broad levels for financial statement purposes. The hierarchy gives the highest priority to unadjusted quoted prices in active markets for identical assets or liabilities (Level 1 measurements) and the lowest priority to unobservable inputs (Level 3 measurements). Accordingly, the degree of judgment exercised in determining fair value is greatest for instruments categorized in Level 3. The inputs used to measure fair value may fall into different levels of the fair value hierarchy. In such cases, for disclosure purposes, the fair value hierarchy classification is determined based on the lowest level input that is significant to the fair value measurement in its entirety. The categorization of a value determined for investments and derivative financial instruments is based on the pricing transparency of the investment and derivative financial instrument and is not necessarily an indication of the risks associated with investing in those securities. The three levels of the fair value hierarchy are as follows: |
| • | | | | Level 1 — unadjusted quoted prices in active markets/exchanges for identical assets or liabilities that the Fund has the ability to access |
| • | | | | Level 2 — other observable inputs (including, but not limited to, quoted prices for similar assets or liabilities in markets that are active, quoted prices for identical or similar assets or liabilities in markets that are not active, inputs other than quoted prices that are observable for the assets or liabilities (such as interest rates, yield curves, volatilities, prepayment speeds, loss severities, credit risks and default rates) or other market-corroborated inputs) |
| • | | | | Level 3 — unobservable inputs based on the best information available in the circumstances, to the extent observable inputs are not available (including the Fund’s own assumptions used in determining the fair value of investments and derivative financial instruments) |
| | | | | Changes in valuation techniques may result in transfers into or out of an assigned level within the disclosure hierarchy. In accordance with the Fund’s policy, transfers between different levels of the fair value disclosure hierarchy are deemed to have occurred as of the beginning of the reporting period. For information about the Fund’s policy regarding valuation of investments and derivative financial instruments, refer to Note 2 of the Notes to Consolidated Financial Statements. |
| | | | | As of April 30, 2015, the following table summarizes the Fund’s investments and derivative financial instruments categorized in the disclosure hierarchy: |
| | | | | Level 1 | | Level 2 | | Level 3 | | Total |
Assets:
| | | | | | | | | | | | | | | | | | |
Investments:
| | | | | | | | | | | | | | | | | | |
Corporate Bonds | | | | | — | | | $ | 5,305,672 | | | | — | | | $ | 5,305,672 | |
Foreign Agency Obligations | | | | | — | | | | 3,212,532 | | | | — | | | | 3,212,532 | |
Foreign Government Obligations | | | | | — | | | | 24,403,435 | | | | — | | | | 24,403,435 | |
Investment Companies | | | | $ | 3,252,456 | | | | — | | | | — | | | | 3,252,456 | |
Short-Term Securities | | | | | 30,478,690 | | | | — | | | | — | | | | 30,478,690 | |
Total
| | | | $ | 33,731,146 | | | $ | 32,921,639 | | | | — | | | $ | 66,652,785 | |
| | | | | | | | | | | | | | | | | | |
| | | | | Level 1 | | Level 2 | | Level 3 | | Total |
Derivative Financial Instruments1
| | | | | | | | | | | | | | | | | | |
Assets:
| | | | | | | | | | | | | | | | | | |
Equity Contracts | | | | | — | | | $ | 4,478,653 | | | | — | | | $ | 4,478,653 | |
Interest Rate Contracts | | | | | — | | | | 63,426 | | | | — | | | | 63,426 | |
Liabilities:
| | | | | | | | | | | | | | | | | | |
Equity Contracts | | | | $ | (44,035 | ) | | | — | | | | — | | | | (44,035 | ) |
Foreign Currency Exchange Contracts | | | | | — | | | | (28,766 | ) | | | — | | | | (28,766 | ) |
Total
| | | | $ | (44,035 | ) | | $ | 4,513,313 | | | | — | | | $ | 4,469,278 | |
| | | | | | | | | | | | | | | | | | |
| 1 | | Derivative financial instruments are swaps, financial futures contracts and foreign currency exchange contracts which are valued at the unrealized appreciation (depreciation) of the investment. |
| | | | | The Fund may hold assets and/or liabilities in which the fair value approximates the carrying amount for financial statement purposes. As of April 30, 2015, such assets and/or liabilities are categorized within the disclosure hierarchy as follows: |
| | | | | Level 1 | | Level 2 | | Level 3 | | Total |
Assets:
| | | | | | | | | | | | | | | | | | |
Cash | | | | $ | 116,286 | | | | — | | | | — | | | $ | 116,286 | |
Cash pledged for financial futures contracts | | | | | 101,000 | | | | — | | | | — | | | | 101,000 | |
Foreign currency at value | | | | | 4,121 | | | | — | | | | — | | | | 4,121 | |
Liabilities:
| | | | | | | | | | | | | | | | | | |
Cash received as collateral for OTC derivatives | | | | | — | | | $ | (8,129,792 | ) | | | — | | | | (8,129,792 | ) |
Total
| | | | $ | 221,407 | | | $ | (8,129,792 | ) | | | — | | | $ | (7,908,385 | ) |
| | | | | | | | | | | | | | | | | | |
| | | | | During the six months ended April 30, 2015, there were no transfers between levels. |
See Notes to Consolidated Financial Statements.
| 24 | BLACKROCK EMERGING MARKET ALLOCATION PORTFOLIO | APRIL 30, 2015
|
Consolidated Statement of Assets and Liabilities |
| April 30, 2015 (Unaudited) | | | |
Assets |
Investments at value — unaffiliated (cost — $32,796,605) | | | | $ | 32,921,639 | |
Investments at value — affiliated (cost — $33,749,672) | | | | | 33,731,146 | |
Unrealized appreciation on OTC swaps | | | | | 4,542,079 | |
Cash | | | | | 116,286 | |
Cash pledged for financial futures contracts | | | | | 101,000 | |
Investments sold receivable | | | | | 349,938 | |
Interest receivable | | | | | 348,387 | |
Capital shares sold receivable | | | | | 10,283 | |
Dividends receivable | | | | | 7,646 | |
Foreign currency at value (cost — $3,994) | | | | | 4,121 | |
Prepaid expenses | | | | | 32,537 | |
Total assets | | | | | 72,165,062 | |
| |
Liabilities |
Cash received as collateral for OTC derivatives | | | | | 8,192,792 | |
Investments purchased payable | | | | | 1,919,358 | |
Capital shares redeemed payable | | | | | 91,952 | |
Investment advisory fees payable | | | | | 36,067 | |
Unrealized depreciation on forward foreign currency exchange contracts | | | | | 28,766 | |
Variation margin payable on financial futures contracts | | | | | 8,056 | |
Administration fees payable | | | | | 2,094 | |
Service and distribution fees payable | | | | | 1,501 | |
Other accrued expenses payable | | | | | 125,197 | |
Total liabilities | | | | | 10,405,783 | |
Net Assets | | | | $ | 61,759,279 | |
| |
Net Assets Consist of |
Paid-in capital | | | | $ | 59,485,782 | |
Undistributed net investment income | | | | | 137,265 | |
Accumulated net realized loss | | | | | (2,272,068 | ) |
Net unrealized appreciation (depreciation) | | | | | 4,408,300 | |
Net Assets | | | | $ | 61,759,279 | |
| |
Net Asset Value |
Institutional — Based on net assets of $58,635,620 and 5,793,585 shares outstanding, unlimited number of shares authorized, $0.001 par value | | | | $ | 10.12 | |
Investor A — Based on net assets of $1,589,857 and 157,547 shares outstanding, unlimited number of shares authorized, $0.001 par value | | | | $ | 10.09 | |
Investor C — Based on net assets of $1,533,802 and 152,954 shares outstanding, unlimited number of shares authorized, $0.001 par value | | | | $ | 10.03 | |
See Notes to Consolidated Financial Statements.
| BLACKROCK EMERGING MARKET ALLOCATION PORTFOLIO | APRIL 30, 2015 | 25
|
Consolidated Statement of Operations |
| Six Months Ended April 30, 2015 (Unaudited) | | | |
Investment Income |
Interest | | | | $ | 535,890 | |
Dividends — affiliated | | | | | 73,350 | |
Total income | | | | | 609,240 | |
| |
Expenses |
Investment advisory | | | | | 273,520 | |
Professional | | | | | 64,307 | |
Administration | | | | | 14,524 | |
Administration — Institutional | | | | | 5,597 | |
Administration — Investor A | | | | | 102 | |
Administration — Investor C | | | | | 217 | |
Service — Investor A | | | | | 1,207 | |
Service and distribution — Investor C | | | | | 9,871 | |
Transfer agent — Institutional | | | | | 1,097 | |
Transfer agent — Investor A | | | | | 733 | |
Transfer agent — Investor C | | | | | 1,812 | |
Registration | | | | | 26,728 | |
Accounting Services | | | | | 24,687 | |
Printing | | | | | 16,377 | |
Custodian | | | | | 3,829 | |
Officer and Trustees | | | | | 2,346 | |
Miscellaneous | | | | | 35,121 | |
Total expenses | | | | | 482,075 | |
Less fees waived by the Manager | | | | | (78,185 | ) |
Less administration fees waived — Institutional | | | | | (5,597 | ) |
Less administration fees waived — Investor A | | | | | (102 | ) |
Less administration fees waived — Investor C | | | | | (215 | ) |
Less transfer agent fees waived and/or reimbursed — Institutional | | | | | (1,097 | ) |
Less transfer agent fees waived and/or reimbursed — Investor A | | | | | (727 | ) |
Less transfer agent fees waived and/or reimbursed — Investor C | | | | | (1,810 | ) |
Total expenses after fees waived and/or reimbursed | | | | | 394,342 | |
Net investment income | | | | | 214,898 | |
| |
Realized and Unrealized Gain (Loss) |
Net realized gain (loss) from:
| | | | | | |
Investments — unaffiliated | | | | | (158,965 | ) |
Capital gain distributions received from affiliated investment companies | | | | | 37,390 | |
Financial futures contracts | | | | | (21,624 | ) |
Foreign currency transactions | | | | | (55,188 | ) |
Swaps | | | | | (851,026 | ) |
| | | | | (1,049,413 | ) |
Net change in unrealized appreciation (depreciation) on:
| | | | | | |
Investments — unaffiliated | | | | | 415,676 | |
Investments — affiliated | | | | | (54,052 | ) |
Financial futures contracts | | | | | (119,406 | ) |
Foreign currency translations | | | | | (196,142 | ) |
Swaps | | | | | 2,903,909 | |
| | | | | 2,949,985 | |
Total realized and unrealized gain | | | | | 1,900,572 | |
Net Increase in Net Assets Resulting from Operations | | | | $ | 2,115,470 | |
See Notes to Consolidated Financial Statements.
| 26 | BLACKROCK EMERGING MARKET ALLOCATION PORTFOLIO | APRIL 30, 2015
|
Consolidated Statement of Changes in Net Assets |
| Increase (Decrease) in Net Assets: | | | | Six Months
Ended
April 30,
2015
(Unaudited) | | Year Ended
October 31,
2014 |
Operations |
Net investment income | | | | $ | 214,898 | | | $ | 267,273 | |
Net realized gain (loss) | | | | | (1,049,413 | ) | | | 593,910 | |
Net change in unrealized appreciation (depreciation) | | | | | 2,949,985 | | | | 1,298,991 | |
Net increase in net assets resulting from operations | | | | | 2,115,470 | | | | 2,160,174 | |
| |
Distributions to Shareholders From1 |
Net investment income:
| | | | | | | | | | |
Institutional | | | | | (336,028 | ) | | | (418,234 | ) |
Investor A | | | | | (3,973 | ) | | | (1,158 | ) |
Investor C | | | | | — | | | | (613 | ) |
Decrease in net assets resulting from distributions to shareholders | | | | | (340,001 | ) | | | (420,005 | ) |
| |
Capital Share Transactions |
Net increase in net assets derived from capital share transactions | | | | | 5,324,830 | | | | 4,244,374 | |
| |
Net Assets |
Total increase in net assets | | | | | 7,100,299 | | | | 5,984,543 | |
Beginning of period | | | | | 54,658,980 | | | | 48,674,437 | |
End of period | | | | $ | 61,759,279 | | | $ | 54,658,980 | |
Undistributed net investment income, end of period | | | | $ | 137,265 | | | $ | 262,368 | |
| 1 | | Distributions for annual periods determined in accordance with federal income tax regulations. |
See Notes to Consolidated Financial Statements.
| BLACKROCK EMERGING MARKET ALLOCATION PORTFOLIO | APRIL 30, 2015 | 27
|
Consolidated Financial Highlights |
| | | | Institutional
|
| | | | Six Months
Ended
April 30, 2015
(Unaudited) | | Year Ended
October 31,
2014 | | Period
May 16, 20131
to October 31,
2013 |
Per Share Operating Performance |
Net asset value, beginning of period | | | | $ | 9.84 | | | $ | 9.53 | | | $ | 10.00 | |
Net investment income2 | | | | | 0.04 | | | | 0.05 | | | | 0.05 | |
Net realized and unrealized gain (loss) | | | | | 0.30 | | | | 0.34 | | | | (0.52 | ) |
Net increase (decrease) from investment operations | | | | | 0.34 | | | | 0.39 | | | | (0.47 | ) |
Distributions from net investment income3 | | | | | (0.06 | ) | | | (0.08 | ) | | | — | |
Net asset value, end of period | | | | $ | 10.12 | | | $ | 9.84 | | | $ | 9.53 | |
| |
Total Return4 |
Based on net asset value | | | | | 3.57% | 5 | | | 4.18% | | | | (4.70)% | 5 |
| |
Ratios to Average Net Assets6 |
Total expenses | | | | | 1.71% | 7 | | | 2.01% | | | | 1.92% | 7,8 |
Total expenses after fees waived and/or reimbursed | | | | | 1.40% | 7 | | | 1.40% | | | | 1.40% | 7 |
Net investment income | | | | | 0.83% | 7 | | | 0.56% | | | | 1.08% | 7 |
| |
Supplemental Data |
Net assets, end of period (000) | | | | $ | 58,636 | | | $ | 51,671 | | | $ | 48,532 | |
Portfolio turnover rate9 | | | | | 28% | | | | 37% | | | | 12% | |
| 1 | | Commencement of operations. |
| 2 | | Based on average shares outstanding. |
| 3 | | Distributions for annual periods are determined in accordance with federal income tax regulations. |
| 4 | | Where applicable, assumes the reinvestment of distributions. |
| 6 | | Ratios do not include expenses incurred indirectly as a result of investments in underlying funds of approximately 0.13% for the six months ended April 30, 2015 and 0.12% for the year ended October 31, 2014 and period ended October 31, 2013. |
| 8 | | Organization costs were not annualized in the calculation of the expense ratios. If these expenses were annualized, the total expenses would have been 1.97%. |
| 9 | | Excludes investments underlying the total return swaps. |
See Notes to Consolidated Financial Statements.
| 28 | BLACKROCK EMERGING MARKET ALLOCATION PORTFOLIO | APRIL 30, 2015
|
Consolidated Financial Highlights (continued) |
| | | | Investor A
|
| | | | Six Months
Ended
April 30, 2015
(Unaudited) | | Year Ended
October 31,
2014 | | Period
May 16, 20131
to October 31,
2013 |
Per Share Operating Performance |
Net asset value, beginning of period | | | | $ | 9.81 | | | $ | 9.52 | | | $ | 10.00 | |
Net investment income2 | | | | | 0.04 | | | | 0.02 | | | | 0.04 | |
Net realized and unrealized gain (loss) | | | | | 0.29 | | | | 0.35 | | | | (0.52 | ) |
Net increase (decrease) from investment operations | | | | | 0.33 | | | | 0.37 | | | | (0.48 | ) |
Distributions from net investment income3 | | | | | (0.05 | ) | | | (0.08 | ) | | | — | |
Net asset value, end of period | | | | $ | 10.09 | | | $ | 9.81 | | | $ | 9.52 | |
| |
Total Return4 |
Based on net asset value | | | | | 3.41% | 5 | | | 3.90% | | | | (4.80)% | 5 |
| |
Ratios to Average Net Assets6 |
Total expenses | | | | | 2.11% | 7 | | | 2.54% | | | | 2.63% | 7,8 |
Total expenses after fees waived and/or reimbursed | | | | | 1.65% | 7 | | | 1.65% | | | | 1.65% | 7 |
Net investment income | | | | | 0.85% | 7 | | | 0.23% | | | | 0.82% | 7 |
| |
Supplemental Data |
Net assets, end of period (000) | | | | $ | 1,590 | | | $ | 698 | | | $ | 71 | |
Portfolio turnover rate9 | | | | | 28% | | | | 37% | | | | 12% | |
| 1 | | Commencement of operations. |
| 2 | | Based on average shares outstanding. |
| 3 | | Distributions for annual periods are determined in accordance with federal income tax regulations. |
| 4 | | Where applicable, excludes the effects of any sales charges and assumes the reinvestment of distributions. |
| 6 | | Ratios do not include expenses incurred indirectly as a result of investments in underlying funds of approximately 0.13% for the six months ended April 30, 2015 and 0.12% for the year ended October 31, 2014 and period ended October 31, 2013. |
| 8 | | Organization costs were not annualized in the calculation of the expense ratios. If these expenses were annualized, the total expenses would have been 2.66%. |
| 9 | | Excludes investments underlying the total return swaps. |
See Notes to Consolidated Financial Statements.
| BLACKROCK EMERGING MARKET ALLOCATION PORTFOLIO | APRIL 30, 2015 | 29
|
Consolidated Financial Highlights (concluded) |
| | | | Investor C
|
| | | | Six Months
Ended
April 30, 2015
(Unaudited) | | Year Ended
October 31,
2014 | | Period
May 16, 20131
to October 31,
2013 |
Per Share Operating Performance |
Net asset value, beginning of period | | | | $ | 9.73 | | | $ | 9.49 | | | $ | 10.00 | |
Net investment income (loss)2 | | | | | (0.02 | ) | | | (0.05 | ) | | | 0.00 | 3 |
Net realized and unrealized gain (loss) | | | | | 0.32 | | | | 0.34 | | | | (0.51 | ) |
Net increase (decrease) from investment operations | | | | | 0.30 | | | | 0.29 | | | | (0.51 | ) |
Distributions from net investment income4 | | | | | — | | | | (0.05 | ) | | | — | |
Net asset value, end of period | | | | $ | 10.03 | | | $ | 9.73 | | | $ | 9.49 | |
| |
Total Return5 |
Based on net asset value | | | | | 3.08% | 6 | | | 3.14% | | | | (5.10)% | 6 |
| |
Ratios to Average Net Assets7 |
Total expenses | | | | | 2.89% | 8 | | | 3.25% | | | | 3.43% | 8,9 |
Total expenses after fees waived and/or reimbursed | | | | | 2.40% | 8 | | | 2.40% | | | | 2.40% | 8 |
Net investment income (loss) | | | | | (0.42)% | 8 | | | (0.57)% | | | | 0.06% | 8 |
| |
Supplemental Data |
Net assets, end of period (000) | | | | $ | 1,534 | | | $ | 2,290 | | | $ | 71 | |
Portfolio turnover rate10 | | | | | 28% | | | | 37% | | | | 12% | |
| 1 | | Commencement of operations. |
| 2 | | Based on average shares outstanding. |
| 3 | | Amount is less than $0.005 per share. |
| 4 | | Distributions for annual periods are determined in accordance with federal income tax regulations. |
| 5 | | Where applicable, excludes the effects of any sales charges and assumes the reinvestment of distributions. |
| 6 | | Aggregate total return. |
| 7 | | Ratios do not include expenses incurred indirectly as a result of investments in underlying funds of approximately 0.13% for the six months ended April 30, 2015 and 0.12% for the year ended October 31, 2014 and period ended October 31, 2013. |
| 9 | | Organization costs were not annualized in the calculation of the expense ratios. If these expenses were annualized, the total expenses would have been 3.47%. |
| 10 | | Excludes investments underlying the total return swaps. |
See Notes to Consolidated Financial Statements.
| 30 | BLACKROCK EMERGING MARKET ALLOCATION PORTFOLIO | APRIL 30, 2015
|
| |
Notes to Consolidated Financial Statements (Unaudited)
|
1. Organization:
BlackRock FundsSM (the “Trust”) is registered under the Investment Company Act of 1940, as amended (the “1940 Act”), as an open-end management investment company. The Trust is organized as a Massachusetts business trust. BlackRock Emerging Market Allocation Portfolio (the “Fund”) is a series of the Trust. The Fund is classified as non-diversified.
The Fund offers multiple classes of shares. All classes of shares have identical voting, dividend, liquidation and other rights and are subject to the same terms and conditions, except that certain classes bear expenses related to the shareholder servicing and distribution of such shares. Institutional Shares are sold only to certain eligible investors. Investor A and Investor C Shares are generally available through financial intermediaries. Each class has exclusive voting rights with respect to matters relating to its shareholder servicing and distribution expenditures.
Share Class
|
|
|
| Initial Sales Charge
|
| CDSC
|
| Conversion Privilege
|
Institutional | | | | No | | No | | None |
Investor A Shares | | | | Yes | | No1 | | None |
Investor C Shares | | | | No | | Yes | | None |
| 1 | | Investor A Shares may be subject to a CDSC where no initial sales charge was paid at the time of purchase. |
Basis of Consolidation: The accompanying consolidated financial statements of the Fund include the accounts of BlackRock Cayman Emerging Market Allocation Fund, Ltd. (the “Subsidiary”), which is a wholly owned subsidiary of the Fund and primarily invests in commodity-related instruments. The Subsidiary enables the Fund to hold these commodity-related instruments and satisfy regulated investment company tax requirements. The Fund may invest up to 25% of its total assets in the Subsidiary. Intercompany accounts and transactions, if any, have been eliminated. During the six months ended April 30, 2015, there were no transactions in the Subsidiary. The Subsidiary is subject to the same investment policies and restrictions that apply to the Fund, except that the Subsidiary may invest without limitation in commodity-related instruments.
2. Significant Accounting Policies:
The Fund’s consolidated financial statements are prepared in conformity with accounting principles generally accepted in the United States of America (“U.S. GAAP”), which may require management to make estimates and assumptions that affect the reported amounts of assets and liabilities in the consolidated financial statements and the reported amounts of increases and decreases in net assets from operations during the reporting period. Actual results could differ from those estimates. The Fund is considered an investment company under U.S. GAAP and follows the accounting and reporting guidance applicable to investment companies. The following is a summary of significant accounting policies followed by the Fund:
Valuation: The Fund’s investments are valued at fair value as of the close of trading on the New York Stock Exchange (“NYSE”) (generally 4:00 p.m., Eastern time). U.S. GAAP defines fair value as the price the Fund would receive to sell an asset or pay to transfer a liability in an orderly transaction between market participants at the measurement date. The Fund determines the fair values of its financial instruments at market value using independent dealers or pricing services under policies approved by the Board of Trustees of the Trust (the “Board”). The BlackRock Global Valuation Methodologies Committee (the “Global Valuation Committee”) is the committee formed by management to develop global pricing policies and procedures and to provide oversight of the pricing function for the Fund for all financial instruments.
Bond investments are valued on the basis of last available bid prices or current market quotations provided by dealers or pricing services. Floating rate loan interests are valued at the mean of the bid prices from one or more brokers or dealers as obtained from a pricing service. In determining the value of a particular investment, pricing services may use certain information with respect to transactions in such investments, quotations from dealers, pricing matrixes, market transactions in comparable investments, various relationships observed in the market between investments and calculated yield measures. Asset-backed and mortgage-backed securities are valued by independent pricing services using models that consider estimated cash flows of each tranche of the security, establish a benchmark yield and develop an estimated tranche-specific spread to the benchmark yield based on the unique attributes of the tranche. Financial futures contracts traded on exchanges are valued at their last sale price. Swap agreements are valued utilizing quotes received daily by the Fund’s pricing service or through brokers, which are derived using daily swap curves and models that incorporate a number of market data factors, such as discounted cash flows, trades and values of the underlying reference instruments. Investments in open-end registered investment companies are valued at NAV each business day.
| BLACKROCK EMERGING MARKET ALLOCATION PORTFOLIO | APRIL 30, 2015 | 31
|
| |
Notes to Consolidated Financial Statements (continued)
|
Equity investments traded on a recognized securities exchange are valued at the official close price each day, if available. For equity investments traded on more than one exchange, the official close price on the exchange where the stock is primarily traded is used. Equity investments traded on a recognized exchange for which there were no sales on that day may be valued at the last available bid (long positions) or ask (short positions) price.
Securities and other assets and liabilities denominated in foreign currencies are translated into U.S. dollars using exchange rates determined as of the close of business on the NYSE. Forward foreign currency exchange contracts are valued at the mean between the bid and ask prices and are determined as of the close of business on the NYSE. Interpolated values are derived when the settlement date of the contract is an interim date for which quotations are not available.
In the event that the application of these methods of valuation results in a price for an investment that is deemed not to be representative of the market value of such investment, or if a price is not available, the investment will be valued by the Global Valuation Committee, or its delegate, in accordance with a policy approved by the Board as reflecting fair value (“Fair Value Investments”). When determining the price for Fair Value Investments, the Global Valuation Committee, or its delegate, seeks to determine the price that the Fund might reasonably expect to receive or pay from the current sale or purchase of that asset or liability in an arm’s-length transaction. Fair value determinations shall be based upon all available factors that the Global Valuation Committee, or its delegate, deems relevant consistent with the principles of fair value measurement. The pricing of all Fair Value Investments is subsequently reported to the Board or a committee thereof on a quarterly basis.
Generally, trading in foreign instruments is substantially completed each day at various times prior to the close of business on the NYSE. Occasionally, events affecting the values of such instruments may occur between the foreign market close and the close of business on the NYSE that may not be reflected in the computation of the Fund’s net assets. If events (e.g., a company announcement, market volatility or a natural disaster) occur during such periods that are expected to materially affect the value of such instruments, those instruments may be Fair Value Investments and will be valued at their fair value, as determined in good faith by the Global Valuation Committee, or its delegate, using a pricing service and/or policies approved by the Board. Each business day, the Fund uses a pricing service to assist with the valuation of certain foreign exchange-traded equity securities and foreign exchange-traded and OTC options (the “Systematic Fair Value Price”). Using current market factors, the Systematic Fair Value Price is designed to value such foreign securities and foreign options at fair value as of the close of business on the NYSE, which follows the close of the local markets.
Foreign Currency: The Fund’s books and records are maintained in U.S. dollars. Purchases and sales of investment securities are recorded at the rates of exchange prevailing on the respective date of such transactions. Generally, when the U.S. dollar rises in value against a foreign currency, the Fund’s investments denominated in that currency will lose value because that currency is worth fewer U.S. dollars; the opposite effect occurs if the U.S. dollar falls in relative value.
The Fund does not isolate the portion of the results of operations arising as a result of changes in the foreign exchange rates from the changes in the market prices of investments held or sold for financial reporting purposes. Accordingly, the effects of changes in foreign currency exchange rates on investments are not segregated in the Consolidated Statement of Operations from the effects of changes in market prices of those investments, but are included as a component of net realized and unrealized gain (loss) from investments. The Fund reports realized currency gains (losses) on foreign currency related transactions as components of net realized gain (loss) for financial reporting purposes, whereas such components are generally treated as ordinary income for federal income tax purposes.
Segregation and Collateralization: In cases where the Fund enters into certain investments (e.g., financial futures contracts and swaps) that would be “senior securities” for 1940 Act purposes, the Fund may segregate or designate on its books and records cash or liquid securities having a market value at least equal to the amount of the Fund’s future obligations under such investments. Doing so allows the investment to be excluded from treatment as a “senior security.” Furthermore, if required by an exchange or counterparty agreement, the Fund may be required to deliver/deposit cash and/or securities to/with an exchange, or broker-dealer or custodian as collateral for certain investments or obligations.
Investment Transactions and Investment Income: For financial reporting purposes, investment transactions are recorded on the dates the transactions are entered into (the trade dates). Realized gains and losses on investment transactions are determined on the identified cost basis. Interest income, including amortization and accretion of premiums and discounts on debt securities, is recognized on the accrual basis. Income, expenses and realized and unrealized gains and losses are allocated daily to each class based on its relative net assets.
Distributions: Distributions paid by the Fund are recorded on the ex-dividend date. The character and timing of distributions are determined in accordance with federal income tax regulations, which may differ from U.S. GAAP.
| 32 | BLACKROCK EMERGING MARKET ALLOCATION PORTFOLIO | APRIL 30, 2015
|
| |
Notes to Consolidated Financial Statements (continued)
|
Net income and realized gains from investments held by the Subsidiary are treated as ordinary income for tax purposes. Accordingly, the net investment income (loss) and realized gains (losses) reported in the Fund’s consolidated financial statements presented under U.S. GAAP for such investments held by the Subsidiary may differ significantly from distributions. As such, any net gain will pass through to the Fund as ordinary income for federal income tax purposes. If a net loss is realized by the Subsidiary in any taxable year, the loss will generally not be available to offset the Fund’s ordinary income and/or capital gains for that year.
Other: Expenses directly related to the Fund or its classes are charged to the Fund or the applicable class. Other operating expenses shared by several funds are prorated among those funds on the basis of relative net assets or other appropriate methods. Expenses directly related to the Fund and other shared expenses prorated to the Fund are allocated daily to each class based on its relative net assets or other appropriate methods.
The Fund has an arrangement with its custodian whereby fees may be reduced by credits earned on uninvested cash balances, which, if applicable, are shown as fees paid indirectly in the Consolidated Statement of Operations. The custodian imposes fees on overdrawn cash balances, which can be offset by accumulated credits earned or may result in additional custody charges.
3. Derivative Financial Instruments:
The Fund engages in various portfolio investment strategies using derivative contracts both to increase the returns of the Fund and/or to economically manage its exposure to certain risks such as equity risk and interest rate risk. These contracts may be transacted on an exchange or OTC.
Financial Futures Contracts: The Fund invests in long and/or short positions in financial futures contracts and options on financial futures contracts to gain exposure to, or economically hedge against, changes in the value of equity securities (equity risk). Financial futures contracts are agreements between the Fund and a counterparty to buy or sell a specific quantity of an underlying instrument at a specified price and at a specified date. Depending on the terms of the particular contract, financial futures contracts are settled either through physical delivery of the underlying instrument on the settlement date or by payment of a cash settlement amount on the settlement date.
Upon entering into a financial futures contract, the Fund is required to deposit initial margin with the broker in the form of cash or securities in an amount that varies depending on a contract’s size and risk profile. The initial margin deposit must then be maintained at an established level over the life of the contract. Securities deposited as initial margin are designated on the Consolidated Schedule of Investments and cash deposited, if any, is recorded on the Consolidated Statement of Assets and Liabilities as cash pledged for financial futures contracts. Pursuant to the contract, the Fund agrees to receive from or pay to the broker an amount of cash equal to the daily fluctuation in value of the contract. Such receipts or payments are known as variation margin. Variation margin is recorded by the Fund as unrealized appreciation (depreciation) and, if applicable, as a receivable or payable for variation margin in the Consolidated Statement of Assets and Liabilities.
When the contract is closed, the Fund records a realized gain or loss equal to the difference between the value of the contract at the time it was opened and the value at the time it was closed. The use of financial futures contracts involves the risk of an imperfect correlation in the movements in the price of financial futures contracts, interest or foreign currency exchange rates and the underlying assets.
Forward Foreign Currency Exchange Contracts: The Fund enters into forward foreign currency exchange contracts as an economic hedge against either specific transactions or portfolio instruments or to obtain exposure to, or hedge exposure away from, foreign currencies (foreign currency exchange rate risk). A forward foreign currency exchange contract is an agreement between two parties to buy and sell a currency at a set exchange rate on a future date. Forward foreign currency exchange contracts, when used by the Fund, help to manage the overall exposure to the currencies in which some of the investments held by the Fund are denominated. The contract is marked-to-market daily and the change in market value is recorded by the Fund as an unrealized gain or loss. When the contract is closed, the Fund records a realized gain or loss equal to the difference between the value at the time it was opened and the value at the time it was closed. The use of forward foreign currency exchange contracts involves the risk that the value of a forward foreign currency exchange contract changes unfavorably due to movements in the value of the referenced foreign currencies.
Swaps: The Fund enters into swap agreements in which the Fund and a counterparty agree either to make periodic net payments on a specified notional amount or a net payment upon termination. Swap agreements are privately negotiated in the OTC market and may be entered into as a bilateral contract (“OTC swaps”) or centrally cleared (“centrally cleared swaps”). Swaps are marked-to-market daily and changes in value are recorded as unrealized appreciation (depreciation).
| BLACKROCK EMERGING MARKET ALLOCATION PORTFOLIO | APRIL 30, 2015 | 33
|
| |
Notes to Consolidated Financial Statements (continued)
|
For OTC swaps, any upfront premiums paid are recorded as assets and any upfront fees received are recorded as liabilities and are shown as swap premiums paid and swap premiums received, respectively, in the Consolidated Statement of Assets and Liabilities and amortized over the term of the OTC swap. Payments received or made by the Fund for OTC swaps are recorded in the Consolidated Statement of Operations as realized gains or losses, respectively. When an OTC swap is terminated, the Fund will record a realized gain or loss equal to the difference between the proceeds from (or cost of) the closing transaction and the Fund’s basis in the contract, if any. Generally, the basis of the contract is the premium received or paid.
In a centrally cleared swap, immediately following execution of the swap agreement, the swap agreement is notated to a central counterparty (the “CCP”) and the Fund’s counterparty on the swap agreement becomes the CCP. The Fund is required to interface with the CCP through a broker. Upon entering into a centrally cleared swap, the Fund is required to deposit initial margin with the broker in the form of cash or securities in an amount that varies depending on the size and risk profile of the particular swap. Securities deposited as initial margin are designated on the Consolidated Schedule of Investments and cash deposited is recorded on the Consolidated Statement of Assets and Liabilities as cash pledged for centrally cleared swaps. The daily change in valuation of centrally cleared swaps is recorded as a receivable or payable for variation margin in the Consolidated Statement of Assets and Liabilities. Payments received from (paid to) the counterparty, including at termination, are recorded as realized gain (loss) in the Consolidated Statement of Operations.
Swap transactions involve, to varying degrees, elements of interest rate, credit and market risk in excess of the amounts recognized in the Consolidated Statement of Assets and Liabilities. Such risks involve the possibility that there will be no liquid market for these agreements, that the counterparty to the agreements may default on its obligation to perform or disagree as to the meaning of the contractual terms in the agreements, and that there may be unfavorable changes in interest rates and/or market values associated with these transactions.
• | | Total return swaps — The Fund enters into total return swaps to obtain exposure to securities (both long and short) or markets without owning such securities or investing directly in that market or to transfer the risk/return of one market (e.g., fixed income) to another market (e.g., equity) (equity risk and/or interest rate risk). Total return swaps are agreements in which there is an exchange of cash flows whereby one party commits to make payments based on the total return (dividends or interest plus capital gains/losses) of an underlying instrument in exchange for fixed or floating rate interest payments. |
| | The Fund will pay an amount equal to any depreciation on a long position and appreciation on a short position including dividends from such positions. Conversely, the Fund will receive any appreciation on a long position and any depreciation on a short position including dividends from such positions. In addition, the Fund will also pay or receive a variable rate of interest based on the underlying benchmark rate plus or minus a spread (“financing fees”). The benchmark and spread are determined based upon the country and/or currency of each individual underlying position. The unrealized appreciation (depreciation) on total return swaps includes dividends on the underlying basket of equity securities and financing fees. The agreement allows BlackRock Advisors, LLC (the “Manager”) to change the composition of the basket of securities by trading in and out of the underlying equity positions at its discretion. The resulting gains or losses are recorded in the Consolidated Statement of Operations. Certain swaps have no stated expiration and can be terminated by either party at any time. |
• | | Interest rate swaps — The Fund enters into interest rate swaps to gain or reduce exposure to interest rates or to manage duration, the yield curve or interest rate risk by economically hedging the value of the fixed rate bonds, which may decrease when interest rates rise (interest rate risk). Interest rate swaps are agreements in which one party pays a stream of interest payments, either fixed or floating, for another party’s stream of interest payments, either fixed or floating, on the same notional amount for a specified period of time. In more complex swaps, the notional principal amount may decline (or amortize) over time. |
| 34 | BLACKROCK EMERGING MARKET ALLOCATION PORTFOLIO | APRIL 30, 2015
|
| |
Notes to Consolidated Financial Statements (continued)
|
The following is a summary of the Fund’s derivative financial instruments categorized by risk exposure:
Fair Values of Derivative Financial Instruments as of April 30, 2015
|
| | | |
|
| Value
|
|
|
|
| Consolidated Statement of Assets and
Liabilities Location
|
| Derivative Assets
|
| Derivative Liabilities
|
Equity contracts | | | | Net unrealized appreciation on OTC swaps; Net unrealized depreciation on financial futures contracts1 | | $ | 4,478,653 | | | $ | (44,035 | ) |
Foreign currency exchange contracts | | | | Net unrealized depreciation on forward foreign currency exchange contracts | | | — | | | $ | (28,766 | ) |
Interest rate contracts | | | | Net unrealized appreciation on OTC swaps | | $ | 63,426 | | | | — | |
| 1 | | Includes cumulative appreciation (depreciation) on financial futures contracts as reported in the Consolidated Schedule of Investments. Only current day’s variation margin is reported within the Consolidated Statement of Assets and Liabilities. |
The Effect of Derivative Financial Instruments in the Consolidated Statement of Operations
Six Months Ended April 30, 2015
|
|
|
|
|
| Net Realized Loss from
|
| Net Change in Unrealized
Appreciation (Depreciation) on
|
Equity contracts:
| | | | | | | | | | |
Financial futures contracts | | | | $ | (21,624 | ) | | $ | (119,406 | ) |
Swaps | | | | | (851,026 | ) | | | 2,840,483 | |
Foreign currency exchange contracts:
| | | | | | | | | | |
Forward foreign currency exchange contracts | | | | | — | | | | (28,766 | ) |
Interest rate contracts:
| | | | | | | | | | |
Swaps | | | | | — | | | | 63,426 | |
Total
| | | | $ | (872,650 | ) | | $ | 2,755,737 | |
For the six months ended April 30, 2015, the average quarterly balances of outstanding derivative financial instruments were as follows:
Financial futures contracts:
| | | | | | |
Average notional value of contracts purchased | | | | $ | 2,506,927 | |
Foreign currency exchange contracts:
| | | | | | |
Average USD amounts sold | | | | $ | 1,286,224 | |
Interest rate swaps:
| | | | | | |
Average notional amount-receives fixed rate | | | | $ | 2,844,425 | |
Total return swaps:
| | | | | | |
Average notional amount | | | | $ | 31,516,569 | |
Counterparty Credit Risk: A derivative contract may suffer a mark-to-market loss if the value of the contract decreases due to an unfavorable change in the market rates or values of the underlying instrument. Losses can also occur if the counterparty does not perform under the contract.
The Fund’s risk of loss from counterparty credit risk on OTC derivatives is generally limited to the aggregate unrealized gain less the value of any collateral held by the Fund.
With exchange-traded futures and centrally cleared swaps, there is less counterparty credit risk to the Fund since the exchange or clearinghouse, as counterparty to such instruments, guarantees against a possible default. The clearinghouse stands between the buyer and the seller of the contract; therefore, credit risk is limited to failure of the clearinghouse. While offset rights may exist under applicable law, the Fund does not have a contractual right of offset against a clearing broker or clearinghouse in the event of a default (including the bankruptcy or insolvency) of the clearing broker or clearinghouse. Additionally, credit risk exists in exchange-traded futures and centrally cleared swaps with respect to initial and variation margin that is held in a clearing broker’s customer accounts. While clearing brokers are required to segregate customer margin from their own assets, in the event that a clearing broker becomes insolvent or goes into bankruptcy and at that time there is a shortfall in the aggregate amount of margin held by the clearing broker for all its clients, typically the shortfall would be allocated on a pro rata basis across all the clearing broker’s customers, potentially resulting in losses to the Fund.
In order to better define its contractual rights and to secure rights that will help the Fund mitigate its counterparty risk, the Fund may enter into an International Swaps and Derivatives Association, Inc. Master Agreement (“ISDA Master Agreement”) or similar agreement with its counterparties. An ISDA Master Agreement is a bilateral agreement between the Fund and a counterparty that governs certain OTC derivatives and typically contains, among other things, collateral posting terms and netting provisions in the event of a default and/or termination event. Under an ISDA Master
| BLACKROCK EMERGING MARKET ALLOCATION PORTFOLIO | APRIL 30, 2015 | 35
|
| |
Notes to Consolidated Financial Statements (continued)
|
Agreement, the Fund may, under certain circumstances, offset with the counterparty certain derivative financial instruments’ payables and/or receivables with collateral held and/or posted and create one single net payment. The provisions of the ISDA Master Agreement typically permit a single net payment in the event of default including the bankruptcy or insolvency of the counterparty. Bankruptcy or insolvency laws of a particular jurisdiction may restrict or prohibit the right of offset in bankruptcy, insolvency or other events. In addition, certain ISDA Master Agreements allow counterparties to terminate derivative contracts prior to maturity in the event the Fund’s net assets decline by a stated percentage or the Fund fails to meet the terms of its ISDA Master Agreements. The result would cause the Fund to accelerate payment of any net liability owed to the counterparty.
Collateral Requirements:
For derivatives traded under an ISDA Master Agreement, the collateral requirements are typically calculated by netting the mark-to-market amount for each transaction under such agreement and comparing that amount to the value of any collateral currently pledged by the Fund and the counterparty.
Cash collateral that has been pledged to cover obligations of the Fund and cash collateral received from the counterparty, if any, is reported separately on the Consolidated Statement of Assets and Liabilities as cash pledged as collateral and cash received as collateral, respectively. Non-cash collateral pledged by the Fund, if any, is noted in the Consolidated Schedule of Investments. Generally, the amount of collateral due from or to a party has to exceed a minimum transfer amount threshold (typically either $250,000 or $500,000) before a transfer is required, which is determined at the close of business of the Fund. Any additional required collateral is delivered to/pledged by the Fund on the next business day. Typically, the Fund and counterparties are not permitted to sell, re-pledge or use the collateral they receive. To the extent amounts due to the Fund from its counterparties are not fully collateralized, the Fund bears the risk of loss from counterparty non-performance. Likewise, to the extent the Fund has delivered collateral to a counterparty and stands ready to perform under the terms of its agreement with such counterparty, the Fund bears the risk of loss from a counterparty in the amount of the value of the collateral in the event the counterparty fails to return such collateral.
For financial reporting purposes, the Fund does not offset derivative assets and derivative liabilities that are subject to netting arrangements, if any, in the Consolidated Statement of Assets and Liabilities.
As of April 30, 2015, the Fund’s derivative assets and liabilities (by type) are as follows:
|
|
|
| Assets
|
| Liabilities
|
| Derivative Financial Instruments: | | | | | |
Financial futures contracts | | | | | — | | | $ | 8,056 | |
Forward foreign currency exchange contracts | | | | | — | | | | 28,766 | |
Swaps — OTC1 | | | | $ | 4,542,079 | | | | — | |
Total derivative assets and liabilities in the Consolidated Statement of Assets and Liabilities | | | | | 4,542,079 | | | | 36,822 | |
Derivatives not subject to a Master Netting Agreement or similar agreement (“MNA”) | | | | | — | | | | (8,056 | ) |
Total derivative assets subject to an MNA | | | | $ | 4,542,079 | | | $ | 28,766 | |
| 1 | | Includes unrealized appreciation (depreciation) on OTC swap and swap premiums paid/received in the Consolidated Statement of Assets and Liabilities. |
As of April 30, 2015, the following table presents the Fund’s derivative assets and liabilities by counterparty net of amounts available for offset under an MNA and net of the related collateral received by the Fund:
Counterparty
|
|
|
| Derivative Assets
Subject to an MNA
by Counterparty
|
| Derivatives
Available for
Offset
|
| Non-cash
Collateral
Received
|
| Cash Collateral
Received2
|
| Net Amount of
Derivative Assets3
|
Bank of America N.A | | | | $ | 63,426 | | | | — | | | | — | | | | — | | | $ | 63,426 | |
Goldman Sachs & Co | | | | | 2,506,648 | | | | — | | | | — | | | $ | (2,400,000 | ) | | | 106,648 | |
UBS AG | | | | | 1,972,005 | | | | — | | | | — | | | | (1,972,005 | ) | | | — | |
Total
| | | | $ | 4,542,079 | | | | — | | | | — | | | $ | (4,372,005 | ) | | $ | 170,074 | |
Counterparty
|
|
|
| Derivative Liabilities
Subject to an MNA
by Counterparty
|
| Derivatives
Available for
Offset
|
| Non-cash
Collateral
Pledged
|
| Cash Collateral
Pledged
|
| Net Amount of
Derivative
Liabilities4
|
Standard Chartered Bank | | | | $ | 28,766 | | | | — | | | | — | | | | — | | | $ | 28,766 | |
| 2 | | Excess of collateral received from the individual counterparty is not shown for financial reporting purposes. |
| 3 | | Net amount represents the net amount receivable from the counterparty in the event of default. |
| 4 | | Net amount represents the net amount payable due to the counterparty in the event of default. |
| 36 | BLACKROCK EMERGING MARKET ALLOCATION PORTFOLIO | APRIL 30, 2015
|
| |
Notes to Consolidated Financial Statements (continued)
|
4. Investment Advisory Agreement and Other Transactions with Affiliates:
The PNC Financial Services Group, Inc. is the largest stockholder and an affiliate of BlackRock, Inc. (“BlackRock”) for 1940 Act purposes.
The Trust, on behalf of the Fund, entered into an Investment Advisory Agreement with the Manager, the Fund’s investment advisor, an indirect, wholly owned subsidiary of BlackRock, to provide investment advisory services. The Manager is responsible for the management of the Fund’s portfolio and provides the necessary personnel, facilities, equipment and certain other services necessary to the operations of the Fund. For such services, the Fund pays the Manager a monthly fee based on a percentage of the Fund’s average daily net assets at the following annual rates:
Average Daily Net Assets
|
|
|
| Investment
Advisory Fee
|
First $1 Billion | | | | | 1.00 | % |
$1 Billion - $3 Billion | | | | | 0.94 | % |
$3 Billion - $5 Billion | | | | | 0.90 | % |
$5 Billion - $10 Billion | | | | | 0.87 | % |
Greater than $10 Billion | | | | | 0.85 | % |
The Manager voluntarily agreed to waive its investment advisory fees by the amount of investment advisory fees the Fund pays to the Manager indirectly through its investment in affiliated money market funds. The Manager has contractually agreed to waive its advisory fees on assets estimated to be attributed to investments in other equity and fixed income mutual funds managed by the Manager or its affiliates, if any. For the six months ended April 30, 2015, the Fund waived $22,082, which is included in fees waived by Manager in the Consolidated Statement of Operations.
The Manager, with respect to the Fund, entered into separate sub-advisory agreements with BlackRock International Limited, BlackRock Asset Management North Asia Limited and BlackRock (Singapore) Limited (collectively, the “Sub-Advisors”), each an affiliate of the Manager. The Manager pays the Sub-Advisors for services they provide a monthly fee that is a percentage of the investment advisory fees paid by the Fund to the Manager.
The Trust, on behalf of the Fund, entered into a Distribution Agreement and Distribution and Service Plan with BlackRock Investments, LLC (“BRIL”), an affiliate of the Manager. Pursuant to the Distribution and Service Plan and in accordance with Rule 12b-1 under the 1940 Act, the Fund pays BRIL ongoing service and distribution fees. The fees are accrued daily and paid monthly at annual rates based upon the average daily net assets of the shares of the Fund as follows:
|
|
|
| Service
Fee
|
| Distribution
Fee
|
Investor A | | | | | 0.25 | % | | — | |
Investor C | | | | | 0.25 | % | | 0.75 | % |
Pursuant to sub-agreements with BRIL, broker-dealers and BRIL provide shareholder servicing and distribution services to the Fund. The ongoing service and/or distribution fee compensates BRIL and each broker-dealer for providing shareholder servicing and/or distribution related services to Investor A and Investor C shareholders.
Pursuant to written agreements, certain financial intermediaries, some of which may be affiliates, provide the Fund with sub-accounting, recordkeeping, sub-transfer agency and other administrative services with respect to sub-accounts they service. For these services, these entities receive an asset-based fee or an annual fee per shareholder account, which will vary depending on share class and/or net assets.
| BLACKROCK EMERGING MARKET ALLOCATION PORTFOLIO | APRIL 30, 2015 | 37
|
| |
Notes to Consolidated Financial Statements (continued)
|
Effective January 1, 2015, the Trust, on behalf of the Fund, entered into an Administration Agreement with the Manager to provide administrative services. For these services, the Manager receives an administration fee computed daily and payable monthly, based on a percentage of the average daily net assets of the Fund. The administration fee, which is shown as administration in the Consolidated Statement of Operations, is paid at the annual rates below.
Average Daily Net Assets
| Administration Fee
|
First $500 Million | 0.0425% |
$500 Million - $1 Billion | 0.0400% |
$1 Billion - $2 Billion | 0.0375% |
$2 Billion - $4 Billion | 0.0350% |
$4 Billion - $13 Billion | 0.0325% |
Greater than $13 Billion | 0.0300% |
In addition, the Manager charges each of the share classes an administration fee, which is shown as administration — class specific in the Consolidated Statement of Operations, at an annual rate of 0.02% of the average daily net assets of each respective class.
Prior to January 1, 2015, State Street Bank and Trust Company and the Manager acted as co-administrators for the Fund. For these services, the co-administrators received an administration fee computed daily and payable monthly to each administrator pursuant to separate fee arrangements, based on a percentage of the average daily net assets of the Fund. The combined administration fee, which is shown as administration in the Consolidated Statement of Operations, was paid at the annual rates below. In addition, each of the share classes was charged an administration fee, which is shown as administration — class specific in the Consolidated Statement of Operations, based on the following percentages of average daily net assets of each respective class:
Average Daily Net Assets
|
| Administration Fee
|
| Administration
Fee — Class Specific
|
First $500 Million | | 0.075% | | 0.025% |
$500 Million - $1 Billion | | 0.065% | | 0.015% |
Greater than $1 Billion | | 0.055% | | 0.005% |
In addition, the administrators may have, at their discretion, voluntarily waived all or any portion of their administration fees for the Fund or a share class which are included in administration fees waived — class specific in the Consolidated Statement of Operations.
The Manager contractually agreed to waive and/or reimburse fees or expenses in order to limit expenses, excluding interest expense, dividend expense, tax expense, acquired fund fees and expenses and certain other fund expenses, which constitute extraordinary expenses not incurred in the ordinary course of the Fund’s business. The current expense limitations as a percentage of average daily net assets are as follows:
|
| Expense
Limitation
|
Institutional | | 1.40% |
Investor A | | 1.65% |
Investor C | | 2.40% |
The Manager has agreed not to reduce or discontinue this contractual waiver or reimbursement prior to March 1, 2016 unless approved by the Board, including a majority of the independent Trustees or by a vote of the majority of the outstanding voting securities of the Fund.
These amounts are included in fees waived by the Manager, administration fees waived — class specific, transfer agent fees waived and/or reimbursed — class specific in the Consolidated Statement of Operations.
If during the Fund’s fiscal year the operating expenses of a share class, that at any time during the prior two fiscal years received a waiver or reimbursement from the Manager, are less than the expense limit for that share class, the Manager is entitled to be reimbursed by such share class up to the lesser of (a) the amount of fees waived or expenses reimbursed during those prior two fiscal years under the agreement and (b) the amount by which the expense limit for that share class exceeds the operating expenses of the share class for the current fiscal year, provided that: (1) the Fund, of which the share class is a part, has more than $50 million in assets for the fiscal year and (2) the Manager or an affiliate continues to serve as the Fund’s investment advisor or administrator. In the event the expense limit for a share class is changed subsequent to a fiscal year in which the
| 38 | BLACKROCK EMERGING MARKET ALLOCATION PORTFOLIO | APRIL 30, 2015
|
| |
Notes to Consolidated Financial Statements (continued)
|
Manager becomes entitled to reimbursement for fees waived or reimbursed, the amount available to reimburse the Manager shall be calculated by reference to the expense limit for that share class in effect at the time the Manager became entitled to receive such reimbursement, rather than the subsequently changed expense limit for that share class.
On April 30, 2015, the Fund level and class specific waivers and/or reimbursements subject to possible future recoupment under the expense limitation agreement are as follows:
| | | | Expiring October 31,
|
|
|
|
| 2016
|
| 2017
|
Fund level | | | | $ | 276,538 | | | $ | 56,103 | |
Institutional | | | | $ | 13,572 | | | $ | 6,693 | |
Investor A | | | | $ | 873 | | | $ | 829 | |
Investor C | | | | $ | 2,361 | | | $ | 2,025 | |
The following Fund level and class specific waivers and/or reimbursements previously recorded by the Fund which were subject to recoupment by the Manager expired on October 31, 2014:
Fund level | | | | $ | 88,195 | |
Institutional | | | | $ | 5,354 | |
Investor A | | | | $ | 103 | |
Investor C | | | | $ | 92 | |
For the six months ended April 30, 2015, affiliates earned underwriting discounts, direct commissions and dealer concessions on sales of the Fund’s Investor A Shares, which totaled $1,119.
For the six months ended April 30, 2015, affiliates received CDSCs of $1,112 for the Fund’s Investor C Shares.
Certain officers and/or trustees of the Trust are officers and/or directors of BlackRock or its affiliates. The Fund reimburses the Manager for a portion of the compensation paid to the Trust’s Chief Compliance Officer, which is included in officer and trustees in the Consolidated Statement of Operations.
5. Purchases and Sales:
For the six months ended April 30, 2015, purchases and sales of investments, excluding short-term securities, were $15,255,996 and $8,639,607, respectively.
6. Income Tax Information:
It is the Fund’s policy to comply with the requirements of the Internal Revenue Code of 1986, as amended, applicable to regulated investment companies, and to distribute substantially all of its taxable income to its shareholders. Therefore, no federal income tax provision is required.
The Fund files U.S. federal and various state and local tax returns. No income tax returns are currently under examination. The statute of limitations on the Fund’s U.S. federal tax returns remains open for the year ended October 31, 2014 and the period ended October 31, 2013. The statutes of limitations on the Fund’s state and local tax returns may remain open for an additional year depending upon the jurisdiction.
Management has analyzed tax laws and regulations and their application to the Fund as of April 30, 2015, inclusive of the open tax return years, and does not believe there are any uncertain tax positions that require recognition of a tax liability in the Fund’s financial statements.
As of October 31, 2014, the Fund had a capital loss carryforward of $504,509, with no expiration dates, available to offset future realized capital gains.
As of April 30, 2015 gross unrealized appreciation and depreciation based on cost for federal income tax purposes were as follows:
Tax cost | | | | $ | 67,248,150 | |
Gross unrealized appreciation | | | | $ | 643,728 | |
Gross unrealized depreciation | | | | | (1,239,093 | ) |
Net unrealized depreciation | | | | $ | (595,365 | ) |
| BLACKROCK EMERGING MARKET ALLOCATION PORTFOLIO | APRIL 30, 2015 | 39
|
| |
| Notes to Consolidated Financial Statements (continued) |
|
7. Bank Borrowings:
The Trust, on behalf of the Fund, along with certain other funds managed by the Manager and its affiliates (“Participating Funds”), is a party to a 364-day, $2.1 billion credit agreement with a group of lenders, under which the Fund may borrow to fund shareholder redemptions. Excluding commitments designated for certain individual funds, the Participating Funds, including the Fund, can borrow up to an aggregate commitment amount of $1.6 billion, subject to asset coverage and other limitations as specified in the agreement. The credit agreement has the following terms: a fee of 0.06% per annum on unused commitment amounts and interest at a rate equal to the higher of (a) one-month LIBOR (but, in any event, not less than 0.00%) on the date the loan is made plus 0.80% per annum or (b) the Fed Funds rate (but, in any event, not less than 0.00%) in effect from time to time plus 0.80% per annum on amounts borrowed. The agreement expires in April 2016 unless extended or renewed. Prior to November 25, 2014, the aggregate commitment amount was $1.1 billion, of which the Participating Funds, including the Fund, could borrow up to $650 million at any time outstanding, subject to asset coverage and other limitations as specified in the agreement. Participating Funds paid administration, legal and arrangement fees, which are included in miscellaneous expenses in the Consolidated Statement of Operations, and along with commitment fees, were allocated among such funds based upon portions of the aggregate commitment available to them and relative net assets of Participating Funds. During the six months ended April 30, 2015, the Fund did not borrow under the credit agreement.
8. Principal Risks:
In the normal course of business, the Fund invests in securities and enters into transactions where risks exist due to fluctuations in the market (market risk) or failure of the issuer of a security to meet all its obligations (issuer credit risk). The value of securities held by the Fund may decline in response to certain events, including those directly involving the issuers whose securities are owned by the Fund; conditions affecting the general economy; overall market changes; local, regional or global political, social or economic instability; and currency and interest rate and price fluctuations. Similar to issuer credit risk, the Fund may be exposed to counterparty credit risk, or the risk that an entity with which the Fund has unsettled or open transactions may fail to or be unable to perform on its commitments. The Fund manages counterparty credit risk by entering into transactions only with counterparties that it believes have the financial resources to honor their obligations and by monitoring the financial stability of those counterparties. Financial assets, which potentially expose the Fund to market, issuer and counterparty credit risks, consist principally of financial instruments and receivables due from counterparties. The extent of the Fund’s exposure to market, issuer and counterparty credit risks with respect to these financial assets is generally approximated by their value recorded in the Consolidated Statement of Assets and Liabilities, less any collateral held by the Fund.
As of April 30, 2015, the Fund had the following industry classifications:
|
|
|
| Percent of
Total Investments1
|
Industry
|
|
|
| Long
|
| Short
|
| Total
|
Metals & Mining | | | | | 5 | % | | | 2 | % | | | 7 | % |
Capital Goods | | | | | 4 | | | | 3 | | | | 7 | |
Food, Beverage & Tobacco | | | | | 3 | | | | 3 | | | | 6 | |
Technology Hardware & Equipment | | | | | 5 | | | | 1 | | | | 6 | |
Banks | | | | | 4 | | | | 1 | | | | 5 | |
Semiconductors & Semiconductor Equipment | | | | | 4 | | | | 1 | | | | 5 | |
Telecommunication Services | | | | | 2 | | | | 2 | | | | 4 | |
Real Estate Management & Development | | | | | 2 | | | | 2 | | | | 4 | |
Energy | | | | | 3 | | | | — | | | | 3 | |
Transportation | | | | | 3 | | | | — | | | | 3 | |
Software & Services | | | | | 2 | | | | 1 | | | | 3 | |
Utilities | | | | | 2 | | | | 1 | | | | 3 | |
Food & Staples Retailing | | | | | 2 | | | | 1 | | | | 3 | |
Retailing | | | | | 1 | | | | 1 | | | | 2 | |
Oil, Gas & Consumable Fuels | | | | | 1 | | | | 1 | | | | 2 | |
Other | | | | | 32 | 1 | | | 5 | 2 | | | 37 | |
Total
| | | | | 75 | % | | | 25 | % | | | 100 | % |
| 1 | | Consists of Foreign Government Obligations (17%) and Investment Companies (2%) with the remainder consisting of other industries that were each 1% or less of total investments (13%). |
| 2 | | All other industries held were each 1% or less of total investments. |
| 40 | BLACKROCK EMERGING MARKET ALLOCATION PORTFOLIO | APRIL 30, 2015
|
| |
Notes to Consolidated Financial Statements (concluded)
|
9. Capital Share Transactions:
Transactions in capital shares for each class were as follows:
| | | | Six months Ended
April 30, 2015
|
|
| | Year Ended
October 31, 2014
|
|
|
|
| Shares
|
| Amount
|
|
|
| Shares
|
| Amount
|
Institutional
| | | | | | | | | | | | | | | | | | | | | | |
Shares sold | | | | | 612,636 | | | $ | 5,959,565 | | | | | | | | 203,220 | | | $ | 1,975,469 | |
Shares issued in reinvestment of distributions | | | | | 899 | | | | 8,237 | | | | | | | | 235 | | | | 2,148 | |
Shares redeemed | | | | | (71,135 | ) | | | (690,465 | ) | | | | | | | (45,465 | ) | | | (441,872 | ) |
Net increase | | | | | 542,400 | | | $ | 5,277,337 | | | | | | | | 157,990 | | | $ | 1,535,745 | |
|
Investor A
|
Shares sold | | | | | 117,764 | | | $ | 1,135,990 | | | | | | | | 133,990 | | | $ | 1,250,374 | |
Shares issued in reinvestment of distributions | | | | | 421 | | | | 3,850 | | | | | | | | 106 | | | | 969 | |
Shares redeemed | | | | | (31,854 | ) | | | (304,529 | ) | | | | | | | (70,299 | ) | | | (648,259 | ) |
Net increase | | | | | 86,331 | | | $ | 835,311 | | | | | | | | 63,797 | | | $ | 603,084 | |
|
Investor C
|
Shares sold | | | | | 28,055 | | | $ | 273,324 | | | | | | | | 228,616 | | | $ | 2,113,145 | |
Shares issued in reinvestment of distributions | | | | | — | | | | — | | | | | | | | 52 | | | | 473 | |
Shares redeemed | | | | | (110,442 | ) | | | (1,061,142 | ) | | | | | | | (859 | ) | | | (8,073 | ) |
Net increase (decrease) | | | | | (82,387 | ) | | $ | (787,818 | ) | | | | | | | 227,809 | | | $ | 2,105,545 | |
Total Net Increase
| | | | | 546,344 | | | $ | 5,324,830 | | | | | | | | 449,596 | | | $ | 4,244,374 | |
At April 30, 2015, the following shares of the Fund were owned by affiliates:
Institutional | | | | | 5,091,436 | |
Investor A | | | | | 2,500 | |
Investor C | | | | | 2,500 | |
10. Subsequent Events:
Management has evaluated the impact of all subsequent events on the Fund through the date the financial statements were issued and has determined that there were no subsequent events requiring adjustment or additional disclosure in the financial statements.
| BLACKROCK EMERGING MARKET ALLOCATION PORTFOLIO | APRIL 30, 2015 | 41
|
Rodney D. Johnson, Chair of the Board and Trustee
David O. Beim, Trustee
Collette Chilton, Trustee
Frank J. Fabozzi, Trustee
Dr. Matina S. Horner, Trustee
Herbert I. London, Trustee
Ian A. MacKinnon, Trustee
Cynthia A. Montgomery, Trustee
Barbara G. Novick, Trustee
Joseph P. Platt, Trustee
Robert C. Robb, Jr., Trustee
Toby Rosenblatt, Trustee
Mark Stalnecker, Trustee
Kenneth L. Urish, Trustee
Frederick W. Winter, Trustee
John M. Perlowski, President and Chief Executive Officer
Richard Hoerner, Vice President
Jennifer McGovern, Vice President
Neal Andrews, Chief Financial Officer
Jay Fife, Treasurer
Charles Park, Chief Compliance Officer
Fernanda Piedra, Anti-Money Laundering Compliance Officer
Benjamin Archibald, Secretary
Effective December 31, 2014, Paul L. Audet and Henry Gabbay resigned as Trustees of the Trust and Ronald W. Forbes resigned as a Trustee of the Trust and Co-Chair of the Board. Effective January 1, 2015, Collette Chilton, Barbara G. Novick and Mark Stalnecker were appointed to serve as Trustees of the Trust.
Effective March 1, 2015, Charles Park resigned as Anti-Money Laundering Compliance Officer of the Trust and Fernanda Piedra became Anti-Money Laundering Compliance Officer of the Trust.
Effective May 18, 2015, Ian A. MacKinnon resigned as a Trustee of the Trust. |
|
| | | | | | | |
Investment Advisor and
Administrator
BlackRock Advisors, LLC
Wilmington, DE 19809
Accounting Agent and Custodian
State Street Bank and Trust Company
Boston, MA 02110 | | Sub-Advisors
BlackRock International Limited
Edinburgh, EH3 8BL
United Kingdom
BlackRock Asset Management
North Asia Limited
Hong Kong, China
BlackRock (Singapore) Limited
079912 Singapore | | Transfer Agent
BNY Mellon Investment
Servicing (US) Inc.
Wilmington, DE 19809
Independent Registered
Public Accounting Firm
Deloitte & Touche LLP
Boston, MA 02116 | | Distributor
BlackRock Investments, LLC
New York, NY 10022
Legal Counsel
Sidley Austin LLP
New York, NY 10019
Address of the Fund
100 Bellevue Parkway
Wilmington, DE 19809 |
| 42 | BLACKROCK EMERGING MARKET ALLOCATION PORTFOLIO | APRIL 30, 2015
|
General Information
Householding
The Fund will mail only one copy of shareholder documents, including prospectuses, annual and semi-annual reports and proxy statements, to shareholders with multiple accounts at the same address. This practice is commonly called “householding” and is intended to reduce expenses and eliminate duplicate mailings of shareholder documents. Mailings of your shareholder documents may be householded indefinitely unless you instruct us otherwise. If you do not want the mailing of these documents to be combined with those for other members of your household, please call the Fund at (800) 441-7762.
Availability of Quarterly Schedule of Investments
The Fund files its complete schedule of portfolio holdings with the SEC for the first and third quarters of each fiscal year on Form N-Q. The Fund’s Forms N-Q are available on the SEC’s website at http://www.sec.gov and may also be reviewed and copied at the SEC’s Public Reference Room in Washington, DC. Information on how to access documents on the SEC’s website without charge may be obtained by calling (800) SEC-0330. The Fund’s Forms N-Q may also be obtained upon request and without charge by calling (800) 441-7762.
Availability of Proxy Voting Policies and Procedures
A description of the policies and procedures that the Fund uses to determine how to vote proxies relating to portfolio securities is available upon request and without charge (1) by calling (800) 441-7762; (2) at http://www.blackrock.com; and (3) on the SEC’s website at http://www.sec.gov.
Availability of Proxy Voting Record
Information about how the Fund voted proxies relating to securities held in the Fund’s portfolio during the most recent 12-month period ended June 30 is available upon request and without charge (1) at http://www.blackrock.com or by calling (800) 441-7762 and (2) on the SEC’s website at http://www.sec.gov.
BlackRock’s Mutual Fund Family
BlackRock offers a diverse lineup of open-end mutual funds crossing all investment styles and managed by experts in equity, fixed income and tax-exempt investing. Visit http://www.blackrock.com for more information.
Shareholder Privileges
Account Information
Call us at (800) 441-7762 from 8:00 AM to 6:00 PM EST on any business day to get information about your account balances, recent transactions and share prices. You can also reach us on the Web at http://www.blackrock.com/funds.
Automatic Investment Plans
Investor Class shareholders who want to invest regularly can arrange to have $50 or more automatically deducted from their checking or savings account and invested in any of the BlackRock funds.
Systematic Withdrawal Plans
Investor Class shareholders can establish a systematic withdrawal plan and receive periodic payments of $50 or more from their BlackRock funds, as long as their account balance is at least $10,000.
Retirement Plans
Shareholders may make investments in conjunction with Traditional, Rollover, Roth, Coverdell, Simple IRAs, SEP IRAs and 403(b) Plans.
| BLACKROCK EMERGING MARKET ALLOCATION PORTFOLIO | APRIL 30, 2015 | 43
|
| |
| Additional Information (concluded) |
|
BlackRock Privacy Principles
BlackRock is committed to maintaining the privacy of its current and former fund investors and individual clients (collectively, “Clients”) and to safeguarding their non-public personal information. The following information is provided to help you understand what personal information BlackRock collects, how we protect that information and why in certain cases we share such information with select parties.
If you are located in a jurisdiction where specific laws, rules or regulations require BlackRock to provide you with additional or different privacy-related rights beyond what is set forth below, then BlackRock will comply with those specific laws, rules or regulations.
BlackRock obtains or verifies personal non-public information from and about you from different sources, including the following: (i) information we receive from you or, if applicable, your financial intermediary, on applications, forms or other documents; (ii) information about your transactions with us, our affiliates, or others; (iii) information we receive from a consumer reporting agency; and (iv) from visits to our websites.
BlackRock does not sell or disclose to non-affiliated third parties any non-public personal information about its Clients, except as permitted by law or as is necessary to respond to regulatory requests or to service Client accounts. These non-affiliated third parties are required to protect the confidentiality and security of this information and to use it only for its intended purpose.
We may share information with our affiliates to service your account or to provide you with information about other BlackRock products or services that may be of interest to you. In addition, BlackRock restricts access to non-public personal information about its Clients to those BlackRock employees with a legitimate business need for the information. BlackRock maintains physical, electronic and procedural safeguards that are designed to protect the non-public personal information of its Clients, including procedures relating to the proper storage and disposal of such information.
| 44 | BLACKROCK EMERGING MARKET ALLOCATION PORTFOLIO | APRIL 30, 2015
|
[THIS PAGE INTENTIONALLY LEFT BLANK]
[THIS PAGE INTENTIONALLY LEFT BLANK]
[THIS PAGE INTENTIONALLY LEFT BLANK]
The report is intended for current holders. It is not authorized for use as an offer of sale or a solicitation of an offer to buy shares of the Fund unless preceded or accompanied by the Fund’s current prospectus. Past performance results shown in this report should not be considered a representation of future performance. Investment returns and principal value of shares will fluctuate so that shares, when redeemed, may be worth more or less than their original cost. Statements and other information herein are as dated and are subject to change.
EMAP-4/15-SAR
Item 2 – Code of Ethics – Not Applicable to this semi-annual report
Item 3 – Audit Committee Financial Expert – Not Applicable to this semi-annual report
Item 4 – Principal Accountant Fees and Services – Not Applicable to this semi-annual report
Item 5 – Audit Committee of Listed Registrants – Not Applicable
Item 6 – Investments
(a) The registrant’s Schedule of Investments is included as part of the Report to Stockholders filed under Item 1 of this Form.
(b) Not Applicable due to no such divestments during the semi-annual period covered since the previous Form N-CSR filing.
Item 7 – Disclosure of Proxy Voting Policies and Procedures for Closed-End Management Investment Companies – Not Applicable
Item 8 – Portfolio Managers of Closed-End Management Investment Companies – Not Applicable
Item 9 – Purchases of Equity Securities by Closed-End Management Investment Company and Affiliated Purchasers – Not Applicable
Item 10 – Submission of Matters to a Vote of Security Holders –There have been no material changes to these procedures.
Item 11 – Controls and Procedures
(a) – The registrant’s principal executive and principal financial officers, or persons performing similar functions, have concluded that the registrant’s disclosure controls and procedures (as defined in Rule 30a-3(c) under the Investment Company Act of 1940, as amended (the “1940 Act”)) are effective as of a date within 90 days of the filing of this report based on the evaluation of these controls and procedures required by Rule 30a-3(b) under the 1940 Act and Rule 15d-15(b) under the Securities Exchange Act of 1934, as amended.
(b) – There were no changes in the registrant’s internal control over financial reporting (as defined in Rule 30a-3(d) under the 1940 Act) that occurred during the second fiscal quarter of the period covered by this report that have materially affected, or are reasonably likely to materially affect, the registrant’s internal control over financial reporting.
Item 12 – Exhibits attached hereto
| | (a)(1) – Code of Ethics – Not Applicable to this semi-annual report |
| | (a)(2) – Certifications – Attached hereto |
(a)(3) – Not Applicable
(b) – Certifications – Attached hereto
Pursuant to the requirements of the Securities Exchange Act of 1934 and the Investment Company Act of 1940, the registrant has duly caused this report to be signed on its behalf by the undersigned, thereunto duly authorized.
BlackRock Funds
By: /s/ John M. Perlowski
John M. Perlowski
Chief Executive Officer (principal executive officer) of
BlackRock Funds
Date: July 1, 2015
Pursuant to the requirements of the Securities Exchange Act of 1934 and the Investment Company Act of 1940, this report has been signed below by the following persons on behalf of the registrant and in the capacities and on the dates indicated.
By: /s/ John M. Perlowski
John M. Perlowski
Chief Executive Officer (principal executive officer) of
BlackRock Funds
Date: July 1, 2015
By: /s/ Neal J. Andrews
Neal J. Andrews
Chief Financial Officer (principal financial officer) of
BlackRock Funds
Date: July 1, 2015