UNITED STATES
SECURITIES AND EXCHANGE COMMISSION
Washington, D.C. 20549
FORM N-CSR
CERTIFIED SHAREHOLDER REPORT OF REGISTERED MANAGEMENT INVESTMENT COMPANIES
Investment Company Act file number 811-05742
Name of Fund: BlackRock Funds: Exchange Portfolio
Fund Address: 100 Bellevue Parkway, Wilmington, DE 19809
Name and address of agent for service: John M. Perlowski, Chief Executive Officer, BlackRock Funds: Exchange Portfolio,
55 East 52nd Street, New York, NY 10055
Registrant’s telephone number, including area code: (800) 441-7762
Date of fiscal year end: 12/31/2012
Date of reporting period: 06/30/2012
Item 1 – Report to Stockholders
2
| | |

| | June 30, 2012 |
|
Semi-Annual Report (Unaudited) |
BlackRock Exchange Portfolio | of BlackRock FundsSM
| | | | |
| | Not FDIC Insured ¡ No Bank Guarantee ¡ May Lose Value | | |
Table of Contents
| | | | |
|
| | | | | |
| 2 | | BLACKROCK EXCHANGE PORTFOLIO | | JUNE 30, 2012 |
Dear Shareholder
One year ago, risk assets were in a broad retreat as sovereign debt problems loomed over Europe and confidence in both the US and global economic recoveries was waning. Last summer’s prolonged debt ceiling debate in Washington, DC ended with Standard & Poor’s historic downgrade of US government debt, an event that triggered financial-market turmoil all over the world. Extraordinary levels of volatility persisted in the months that followed as the debt situation in Europe intensified. Macro-level news drove asset prices broadly up and down in lockstep, in a “risk on” – “risk off” trading pattern. Equity markets crumbled while safe-haven assets such as US Treasuries and gold rallied to historic highs by the end of the third quarter of 2011.
By October, however, improving economic data and more concerted efforts among European leaders toward stemming the region’s debt crisis drew investors back to the markets. Improving sentiment carried over into early 2012 as investors saw some relief from the world’s financial woes. Risk assets (including stocks, commodities and high yield bonds) moved boldly higher through the first two months of 2012 while climbing Treasury yields pressured higher-quality fixed income assets.
However, risk assets reversed course in the spring when Europe’s debt problems boiled over once again. Markets became highly volatile as political instability in Greece threatened the country’s membership in the euro zone. Spain faced severe deficit issues while the nation’s banks clamored for liquidity. Yields on Spanish and Italian government debt rose to levels deemed unsustainable. European leaders conferred and debated vehemently over the need for fiscal integration among the 17 euro-zone nations to resolve the crisis for the long term.
Alongside the drama in Europe, investors were discouraged by gloomy economic reports from various parts of the world. A slowdown in China, a key powerhouse for global growth, became particularly worrisome. In the United States, disappointing jobs reports dealt a crushing blow to sentiment. Risk assets sold off through April and May as investors ran back to safe havens including US, German and UK government debt as well as gold. As the period drew to a close, risk assets were beginning to rebound modestly as European leaders stepped up their efforts to move toward fiscal unity and investors anticipated additional stimulus from central banks on both sides of the Atlantic.
All asset classes posted gains for the 6-month period ended June 30, 2012, with US stocks delivering the largest returns. On a 12-month basis, US large-cap stocks generated positive results; however, small-cap stocks finished in negative territory and international and emerging equities, which experienced significant downturns in 2011, lagged the broader rebound. Among fixed income asset classes, safe-haven US Treasury bonds and municipal bonds outperformed corporate credits for the 12-month period. Continued low short-term interest rates kept yields on money market securities near their all-time lows.
We know that investors continue to face a world of uncertainty and highly volatile markets, but we also believe these challenging times present many opportunities. We remain committed to working with you and your financial professional to identify actionable ideas for your portfolio. We encourage you to visit www.blackrock.com/newworld for more information.
Sincerely,

Rob Kapito
President, BlackRock Advisors, LLC

“We know that investors continue to face a world of uncertainty and highly volatile markets, but we also believe these challenging times present many opportunities.”
Rob Kapito
President, BlackRock Advisors, LLC
Total Returns as of June 30, 2012
| | | | |
| | |
| | 6-month | | 12-month |
| US large cap equities (S&P 500® Index) | | 9.49% | | 5.45% |
| US small cap equities (Russell 2000® Index) | | 8.53 | | (2.08) |
| International equities (MSCI Europe, Australasia, Far East Index) | | 2.96 | | (13.83) |
| Emerging market equities (MSCI Emerging Markets Index) | | 3.93 | | (15.95) |
3-month Treasury bill (BofA Merrill Lynch 3-Month Treasury Bill Index) | | 0.04 | | 0.05 |
| US Treasury securities (BofA Merrill Lynch 10- Year US Treasury Index) | | 3.44 | | 17.36 |
| US investment grade bonds (Barclays US Aggregate Bond Index) | | 2.37 | | 7.47 |
| Tax-exempt municipal bonds (S&P Municipal Bond Index) | | 4.14 | | 10.16 |
| US high yield bonds (Barclays US Corporate High Yield 2% Issuer Capped Index) | | 7.23 | | 7.21 |
Past performance is no guarantee of future results. Index performance is shown for illustrative purposes only. You cannot invest directly in an index.
| | | | | | |
|
| | | | | | | |
| | THIS PAGE NOT PART OF YOUR FUND REPORT | | JUNE 30, 2012 | | 3 |
Fund Summary as of June 30, 2012
BlackRock Exchange Portfolio’s (the “Fund”), one portfolio of BlackRock FundsSM (the “Trust”), investment objective is long-term growth of capital and consequent long-term growth of income.
|
Portfolio Management Commentary |
How did the Fund perform?
| • | | For the six-month period ended June 30, 2012, the BlackRock Shares of the Fund underperformed its benchmark, the Standard & Poor’s (“S&P”) 500® Index. |
What factors influenced performance?
| • | | Stock selection in health care had the largest negative impact on relative performance during the reporting period. This weakness was due to the Fund’s substantial weighting in the slower-growth pharmaceuticals industry. While each of the Fund’s investments in the space delivered a positive return, holdings collectively lagged the strong performance of the overall health care sector. The Fund’s top holding in health care, Novartis AG-ADR, increased by just 1.5% during the period. Stock selection in industrials also negatively impacted returns. After rising sharply during the first two months of the six-month period, Caterpillar, Inc. declined throughout the latter half of the period as investors feared a significant slowdown in China, which is a major driver of machinery and mining equipment demand. The Boeing Co. also detracted despite rising modestly during the period as investors waited to see if the company would deliver on its production schedule. Stock selection in the information technology (“IT”) sector detracted from performance, as the Fund did not hold Apple, Inc., the largest S&P 500 Index holding, which surged 44% during the period. The Fund’s investment in the IT services |
| | industry also contributed negatively to IT performance. After an excellent performance in 2011, International Business Machines Corp. lagged higher-growth technology peers. In addition, the Fund’s position in The Western Union Co. negatively impacted performance as the stock declined by more than 6% during the period after reporting slowing growth in February. |
| • | | Contributing positively to performance were the Fund’s investments in financials. American Express Co., a large holding in the segment, boosted performance as the stock climbed 24% during the period. An overweight in the sector also contributed positively, as financials were the second-best sector within the S&P 500® Index. From a sector allocation perspective, the Fund’s lack of ownership in utilities also benefited performance. |
Describe recent portfolio activity.
| • | | During the six-month period, the Fund’s allocation to the financials sector increased as a result of relative market movements and limited trading, while its weightings in energy and industrials modestly declined. |
Describe portfolio positioning at period end.
| • | | Relative to the S&P 500® Index, the Fund ended the period with notable sector overweights in consumer staples, industrials and financials, and underweights in IT, consumer discretionary and materials. |
The views expressed reflect the opinions of BlackRock as of the date of this report and are subject to change based on changes in market, economic or other conditions. These views are not intended to be a forecast of future events and are no guarantee of future results.
| | | | | |
| Ten Largest Holdings | | Percent of
Long-Term
Investments |
International Business Machines Corp. | | 7% |
American Express Co. | | 7 |
Berkshire Hathaway, Inc., Class B | | 7 |
Target Corp. | | 7 |
Exxon Mobil Corp. | | 6 |
Microsoft Corp. | | 5 |
Schlumberger Ltd. | | 5 |
Caterpillar, Inc. | | 5 |
The Procter & Gamble Co. | | 5 |
The Boeing Co. | | 4 |
| | |
| Sector Allocation | | Percent of
Long-Term
Investments |
Financials | | 18% |
Consumer Staples | | 17 |
Information Technology | | 15 |
Industrials | | 15 |
Health Care | | 14 |
Energy | | 11 |
Consumer Discretionary | | 7 |
Telecommunication Services | | 2 |
Materials | | 1 |
For Fund compliance purposes, the Fund’s sector classifications refer to any one or more of the sector sub-classifications used by one or more widely recognized market indexes or ratings group indexes, and/or as defined by Fund management. These definitions may not apply for purposes of this report, which may combine sector sub-classifications for reporting ease.
| | | | |
|
| | | | | |
| 4 | | BLACKROCK EXCHANGE PORTFOLIO | | JUNE 30, 2012 |
|
Total Return Based on a $10,000 Investment |
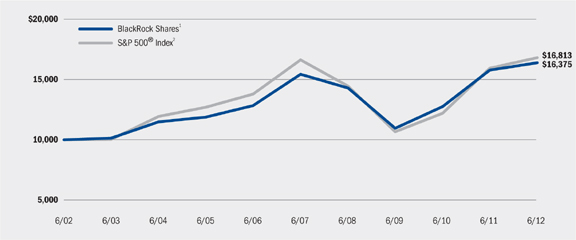
| | 1 | The Fund normally invests largely in a diversified and supervised portfolio of common stocks, or securities convertible into common stocks. Shares of the Fund are not currently offered to the public |
| | 2 | This unmanaged index covers 500 industrial, utility, transportation and financial companies of the US markets (mostly New York Stock Exchange (“NYSE”) issues) representing about 75% of NYSE market capitalization and 30% of NYSE issues. |
|
Performance Summary for the Period Ended June 30, 2012 |
| | | | | | | | | | |
| | | | | 6-Month
Total Returns | | Average Annual Total Returns3 |
| | | | | | 1 Year | | 5 Years | | 10 Years |
BlackRock Shares | | | | 6.72% | | 3.83% | | 1.19% | | 5.05% |
S&P 500® Index | | | | 9.49 | | 5.45 | | 0.22 | | 5.33 |
| | 3 | See “About Fund Performance” on page 6 for a detailed description of performance related information. Past performance is not indicative of future results. |
| | | | | | | | | | | | | | |
| | | Actual | | Hypothetical5 | | |
| | | Beginning
Account Value
January 1, 2012 | | Ending
Account Value
June 30, 2012 | | Expenses Paid
During the Period4 | | Beginning
Account Value
January 1, 2012 | | Ending
Account Value
June 30, 2012 | | Expenses Paid
During the Period4 | | Annualized
Expense
Ratio |
BlackRock Shares | | $1,000.00 | | $1,067.20 | | $3.19 | | $1,000.00 | | $1,021.78 | | $3.12 | | 0.62% |
| | 4 | For the BlackRock Shares of the Fund, expenses are equal to the annualized expense ratio multiplied by the average account value over the period, multiplied by 182/366 (to reflect the one-half year period shown). |
| | 5 | Hypothetical 5% annual return before expenses is calculated by pro rating the number of days in the most recent fiscal half year divided by 366. |
See “Disclosure of Expenses” on page 6 for further information on how expenses were calculated.
| | | | | | |
|
| | | | | | | |
| | BLACKROCK EXCHANGE PORTFOLIO | | JUNE 30, 2012 | | 5 |
About Fund Performance
| • | | BlackRock Shares are not subject to any sales charge. These shares bear no ongoing distribution or service fees and are available only to eligible investors. |
Performance information reflects past performance and does not guarantee future results. Current performance may be lower or higher than the performance data quoted. Refer to www.blackrock.com/funds to obtain performance data current to the most recent month-end. Performance results do not reflect the deduction of taxes that a shareholder would pay on Fund distributions or the redemption of Fund shares. Figures shown in the performance table on the previous page assume reinvestment of all dividends and distributions, if any, at net asset value
(“NAV”) on the ex-dividend date. Investment return and principal value of shares will fluctuate so that shares, when redeemed, may be worth more or less than their original cost.
BlackRock Advisors, LLC (the “Manager”) the Fund’s investment advisor, waived and/or reimbursed a portion of the Fund’s expenses. Without such waiver and/or reimbursement, the Fund’s performance would have been lower. The Manager is under no obligation to waive or reimburse or to continue waiving or reimbursing its fees after May 1, 2013.
Disclosure of Expenses
Shareholders of the Fund may incur the following charges: (a) expenses related to transactions, including sales charges and exchange fees; and (b) operating expenses, including investment advisory fees and other Fund expenses. The expense example shown on the previous page (which is based on a hypothetical investment of $1,000 invested on January 1, 2012 and held through June 30, 2012) is intended to assist shareholders both in calculating expenses based on an investment in the Fund and in comparing these expenses with similar costs of investing in other mutual funds.
The expense example provides information about actual account values and actual expenses. In order to estimate the expenses a shareholder paid during the period covered by this report, shareholders can divide their account value by $1,000 and then multiply the result by the number under the heading entitled “Expenses Paid During the Period.”
The expense example also provides information about hypothetical account values and hypothetical expenses based on the Fund’s actual expense ratio and an assumed rate of return of 5% per year before expenses. In order to assist shareholders in comparing the ongoing expenses of investing in this Fund and other funds, compare the 5% hypothetical examples with the 5% hypothetical examples that appear in other funds’ shareholder reports.
The expenses shown in the expense example are intended to highlight shareholders’ ongoing costs only and do not reflect any transactional expenses, such as sales charges or exchange fees, if any. Therefore, the hypothetical examples are useful in comparing ongoing expenses only, and will not help shareholders determine the relative total expenses of owning different funds. If these transactional expenses were included, shareholder expenses would have been higher.
| | | | |
|
| | | | | |
| 6 | | BLACKROCK EXCHANGE PORTFOLIO | | JUNE 30, 2012 |
| | |
| Schedule of Investments June 30, 2012 (Unaudited) | | (Percentages shown are based on Net Assets) |
| | | | | | | | |
| Common Stocks | | Shares | | | Value | |
| | |
Aerospace & Defense – 7.2% | | | | | | | | |
The Boeing Co. | | | 126,232 | | | $ | 9,379,038 | |
General Dynamics Corp. | | | 93,000 | | | | 6,134,280 | |
| | | | | | | | |
| | | | | | | 15,513,318 | |
| | |
Beverages – 3.2% | | | | | | | | |
The Coca-Cola Co. | | | 87,735 | | | | 6,860,000 | |
| | |
Capital Markets – 1.5% | | | | | | | | |
Ameriprise Financial, Inc. | | | 61,125 | | | | 3,194,393 | |
| | |
Consumer Finance – 7.3% | | | | | | | | |
American Express Co. | | | 271,045 | | | | 15,777,529 | |
| | |
Diversified Financial Services – 2.1% | | | | | | | | |
JPMorgan Chase & Co. | | | 124,728 | | | | 4,456,531 | |
| | |
Diversified Telecommunication Services – 1.3% | | | | | |
Verizon Communications, Inc. | | | 64,800 | | | | 2,879,712 | |
| | |
Energy Equipment & Services – 5.0% | | | | | | | | |
Schlumberger Ltd. | | | 168,194 | | | | 10,917,473 | |
| | |
Food & Staples Retailing – 3.9% | | | | | | | | |
Wal-Mart Stores, Inc. | | | 119,846 | | | | 8,355,663 | |
| | |
Food Products – 1.3% | | | | | | | | |
General Mills, Inc. | | | 16,994 | | | | 654,949 | |
Kraft Foods, Inc., Class A | | | 53,285 | | | | 2,057,867 | |
| | | | | | | | |
| | | | | | | 2,712,816 | |
| | |
Health Care Equipment & Supplies – 0.4% | | | | | |
Medtronic, Inc. | | | 22,800 | | | | 883,044 | |
| | |
Household Products – 4.6% | | | | | | | | |
The Procter & Gamble Co. | | | 162,456 | | | | 9,950,430 | |
| | |
Industrial Conglomerates – 3.1% | | | | | | | | |
General Electric Co. | | | 317,848 | | | | 6,623,952 | |
| | |
Insurance – 6.9% | | | | | | | | |
Berkshire Hathaway, Inc., Class B (a) | | | 180,100 | | | | 15,007,733 | |
| | |
IT Services – 9.4% | | | | | | | | |
International Business Machines Corp. | | | 81,355 | | | | 15,911,411 | |
The Western Union Co. | | | 266,480 | | | | 4,487,523 | |
| | | | | | | | |
| | | | | | | 20,398,934 | |
| | |
Life Sciences Tools & Services – 0.5% | | | | | | | | |
Agilent Technologies, Inc. | | | 29,749 | | | | 1,167,351 | |
| | |
Machinery – 4.7% | | | | | | | | |
Caterpillar, Inc. | | | 119,415 | | | | 10,139,528 | |
| | |
| | | | | | | | |
| Common Stocks | | Shares | | | Value | |
| | |
Metals & Mining – 0.8% | | | | | | | | |
Freeport-McMoRan Copper & Gold, Inc. | | | 53,600 | | | $ | 1,826,152 | |
| | |
Multiline Retail – 6.5% | | | | | | | | |
Target Corp. | | | 242,683 | | | | 14,121,724 | |
| | |
Oil, Gas & Consumable Fuels – 6.3% | | | | | | | | |
BP Plc - ADR | | | 31,546 | | | | 1,278,875 | |
Exxon Mobil Corp. | | | 144,677 | | | | 12,380,011 | |
| | | | | | | | |
| | | | | | | 13,658,886 | |
| | |
Pharmaceuticals – 12.7% | | | | | | | | |
AstraZeneca Plc - ADR | | | 64,000 | | | | 2,864,000 | |
Johnson & Johnson | | | 115,747 | | | | 7,819,867 | |
Merck & Co., Inc. | | | 83,999 | | | | 3,506,958 | |
Novartis AG - ADR | | | 155,916 | | | | 8,715,704 | |
Pfizer, Inc. | | | 204,166 | | | | 4,695,818 | |
| | | | | | | | |
| | | | | | | 27,602,347 | |
| | |
Semiconductors & Semiconductor Equipment – 0.5% | | | | | | | | |
Intel Corp. | | | 40,915 | | | | 1,090,385 | |
| | |
Software – 5.2% | | | | | | | | |
Microsoft Corp. | | | 367,277 | | | | 11,235,003 | |
| | |
Tobacco – 4.3% | | | | | | | | |
Altria Group, Inc. | | | 77,000 | | | | 2,660,350 | |
Philip Morris International, Inc. | | | 77,000 | | | | 6,719,020 | |
| | | | | | | | |
| | | | | | | 9,379,370 | |
| | |
Wireless Telecommunication Services – 0.8% | | | | | |
Vodafone Group Plc - ADR | | | 64,452 | | | | 1,816,257 | |
| | |
Total Long-Term Investments | | | | | | | | |
(Cost – $42,778,734) – 99.5% | | | | | | | 215,568,531 | |
| | |
| | | | | | | | |
| | | | | | | | |
| | |
Short-Term Securities | | | | | | | | |
| | |
BlackRock Liquidity Funds, TempFund, Institutional Class, 0.15% (b)(c) | | | 942,569 | | | | 942,569 | |
| | |
Total Short-Term Securities
(Cost – $942,569) – 0.4% | | | | | | | 942,569 | |
| | |
Total Investments
(Cost – $43,721,303) – 99.9% | | | | | | | 216,511,100 | |
Other Assets Less Liabilities – 0.1% | | | | | | | 211,818 | |
| | | | | | | | |
Net Assets – 100.0% | | | | | | $ | 216,722,918 | |
| | | | | | | | |
| (a) | Non-income producing security. |
| (b) | Investments in companies considered to be an affiliate of the Fund during the period, for purposes of Section 2(a)(3) of the Investment Company Act of 1940, as amended, were as follows: |
| | | | | | | | |
| Affiliate | | Shares
Held at
December 31,
2011 | | Net Activity | | Shares
Held at
June 30,
2012 | | Income |
| |
BlackRock Liquidity Funds, TempFund, Institutional Class | | 685,887 | | 256,682 | | 942,569 | | $451 |
| |
| (c) | Represents the current yield as of report date. |
| | |
ADR | | American Depositary Receipts |
| | | | | | |
See Notes to Financial Statements. |
| | | | | | | |
| | BLACKROCK EXCHANGE PORTFOLIO | | JUNE 30, 2012 | | 7 |
| | |
| Schedule of Investments (concluded) | | |
| — | | For Fund compliance purposes, the Fund’s industry classifications refer to any one or more of the industry sub-classifications used by one or more widely recognized market indexes or ratings group indexes, and/or as defined by Fund management. These definitions may not apply for purposes of this report, which may combine such industry sub-classifications for reporting ease. |
| — | | Fair Value Measurements – Various inputs are used in determining the fair value of investments. These inputs to valuation techniques are categorized into a disclosure hierarchy consisting of three broad levels for financial statement purposes as follows: |
| | — | | Level 1 - unadjusted price quotations in active markets/exchanges for identical assets and liabilities |
| | — | | Level 2 - other observable inputs (including, but not limited to: quoted prices for similar assets or liabilities in markets that are active, quoted prices for identical or similar assets or liabilities in markets that are not active, inputs other than quoted prices that are observable for the assets or liabilities (such as interest rates, yield curves, volatilities, prepayment speeds, loss severities, credit risks and default rates) or other market–corroborated inputs) |
| | — | | Level 3 - unobservable inputs based on the best information available in the circumstances, to the extent observable inputs are not available (including the Fund’s own assumptions used in determining the fair value of investments) |
Changes in valuation techniques may result in transfers into or out of an assigned level within the disclosure hierarchy. In accordance with the Fund’s policy, transfers between different levels of the fair value disclosure hierarchy are deemed to have occurred as of the beginning of the reporting period. The categorization of a value determined for investments is based on the pricing transparency of the investment and is not necessarily an indication of the risks associated with investing in those securities. For information about the Fund’s policy regarding valuation of investments and other significant accounting policies, please refer to Note 1 of the Notes to Financial Statements.
The following table summarizes the Fund’s investments categorized in the disclosure hierarchy as of June 30, 2012:
| | | | | | | | | | | | |
| | | Level 1 | | | Level 2 | | Level 3 | | Total | |
Assets: | | | | | | | | | | | | |
Investments: | | | | | | | | | | | | |
Long-
Term Investments1 | | $ | 215,568,531 | | | – | | – | | $ | 215,568,531 | |
Short-
Term Securities | | | 942,569 | | | – | | – | | | 942,569 | |
Total | | $ | 216,511,100 | | | – | | – | | $ | 216,511,100 | |
| 1 | See above Schedule of Investments for values in each industry. |
There were no transfers between levels during the period ended June 30, 2012.
| | | | |
See Notes to Financial Statements. |
| | | | | |
| 8 | | BLACKROCK EXCHANGE PORTFOLIO | | JUNE 30, 2012 |
| | |
| Statement of Assets and Liabilities | | |
June 30, 2012 (Unaudited)
| | | | |
Assets | | | | |
Investments at value – unaffiliated (cost – $42,778,734) | | $ | 215,568,531 | |
Investments at value – affiliated (cost – $942,569) | | | 942,569 | |
Dividends receivable – unaffiliated | | | 354,351 | |
Receivable from advisor | | | 588 | |
Dividends receivable – affiliated | | | 125 | |
Prepaid expenses | | | 4,595 | |
| | | | |
Total assets | | | 216,870,759 | |
| | | | |
| | | | |
Liabilities | | | | |
Investment advisory fees payable | | | 84,215 | |
Professional fees payable | | | 31,264 | |
Custodian fees payable | | | 11,286 | |
Other affiliates payable | | | 8,434 | |
Printing fees payable | | | 2,541 | |
Officer’s and Trustees’ fees payable | | | 1,148 | |
Other accrued expenses payable | | | 8,953 | |
| | | | |
Total liabilities | | | 147,841 | |
| | | | |
Net Assets | | $ | 216,722,918 | |
| | | | |
| | | | |
Net Assets Consist of | | | | |
Paid-in capital | | $ | 40,928,081 | |
Undistributed net investment income | | | 1,881,950 | |
Accumulated net realized gain | | | 1,123,090 | |
Net unrealized appreciation/depreciation | | | 172,789,797 | |
| | | | |
Net Assets | | $ | 216,722,918 | |
| | | | |
| | | | |
Net Asset Value | | | | |
BlackRock Shares outstanding, unlimited number of shares authorized, $0.001 per value | | | 337,919 | |
| | | | |
Net asset value | | $ | 641.35 | |
| | | | |
| | | | | | |
See Notes to Financial Statements. |
| | | | | | | |
| | BLACKROCK EXCHANGE PORTFOLIO | | JUNE 30, 2012 | | 9 |
Six Months Ended June 30, 2012 (Unaudited)
| | | | |
Investment Income | | | | |
Dividends and reclaims | | $ | 2,963,930 | |
Foreign taxes withheld | | | (57,955 | ) |
Dividends – affiliated | | | 451 | |
Securities lending – affiliated | | | 45 | |
| | | | |
Total income | | | 2,906,471 | |
| | | | |
| | | | |
Expenses | | | | |
Investment advisory | | | 534,921 | |
Administration | | | 106,984 | |
Professional | | | 34,912 | |
Printing | | | 10,929 | |
Custodian | | | 7,181 | |
Transfer agent | | | 3,998 | |
Officer and Trustees | | | 3,972 | |
Miscellaneous | | | 6,714 | |
| | | | |
Total expenses | | | 709,611 | |
Less fees waived by advisor | | | (15,565 | ) |
Less administration fees waived | | | (26,746 | ) |
Less transfer agent fees waived | | | (681 | ) |
Less transfer agent fees reimbursed | | | (3,317 | ) |
| | | | |
Total expenses after fees waived and reimbursed | | | 663,302 | |
| | | | |
Net investment income | | | 2,243,169 | |
| | | | |
| | | | |
Realized and Unrealized Gain | | | | |
Net realized gain from redemption-in-kind transactions | | | 1,316,635 | |
Net change in unrealized appreciation/depreciation on investments | | | 10,237,147 | |
| | | | |
Total realized and unrealized gain | | | 11,553,782 | |
| | | | |
Net Increase in Net Assets Resulting from Operations | | $ | 13,796,951 | |
| | | | |
| | | | |
See Notes to Financial Statements. |
| | | | | |
| 10 | | BLACKROCK EXCHANGE PORTFOLIO | | JUNE 30, 2012 |
Statements of Changes in Net Assets
| | | | | | | | |
| Increase (Decrease) in Net Assets: | | Six Months
Ended June 30, 2012 (Unaudited) | | | Year Ended
December 31,
2011 | |
Operations | | | | | | | | |
Net investment income | | $ | 2,243,169 | | | $ | 3,778,814 | |
Net realized gain from investment transactions | | | – | | | | 2,690 | |
Net realized gain from redemption-in-kind transactions | | | 1,316,635 | | | | 4,687,384 | |
Net change in unrealized appreciation/depreciation | | | 10,237,147 | | | | (6,181,650 | ) |
| | | | |
Net increase in net assets resulting from operations | | | 13,796,951 | | | | 2,287,238 | |
| | | | |
| | | | | | | | |
Dividends to Shareholders From | | | | | | | | |
Net investment income from BlackRock Shares | | | (423,052 | ) | | | (3,783,611 | ) |
| | | | |
| | | | | | | | |
Capital Share Transactions | | | | | | | | |
Shares issued in reinvestment of dividends | | | 79,442 | | | | 696,827 | |
Shares redeemed | | | (2,996,292 | ) | | | (11,582,371 | ) |
| | | | |
Net decrease in net assets derived from capital share transactions | | | (2,916,850 | ) | | | (10,885,544 | ) |
| | | | |
| | | | | | | | |
Net Assets | | | | | | | | |
Total increase (decrease) in net assets | | | 10,457,049 | | | | (12,381,917 | ) |
Beginning of period | | | 206,265,869 | | | | 218,647,786 | |
| | | | |
End of period | | $ | 216,722,918 | | | $ | 206,265,869 | |
| | | | |
Undistributed net investment income | | $ | 1,881,950 | | | $ | 61,833 | |
| | | | |
| | | | | | |
See Notes to Financial Statements. |
| | | | | | | |
| | BLACKROCK EXCHANGE PORTFOLIO | | JUNE 30, 2012 | | 11 |
| | | | | | | | | | | | | | | | | | | | | | | | | | | | | | | | | | | |
| | | BlackRock |
| | | Six Months Ended June 30, 2012 | | Year Ended
December 31, | | Period October 1, 2008 to December 31, | | Year Ended
September 30, |
| | | (Unaudited) | | 2011 | | 2010 | | 2009 | | 2008 | | 2008 | | 2007 |
Per Share Operating Performance | | | | | | | | | | | | | | | | | | | | | | | | | | | | | | | | | | | |
Net asset value, beginning of period | | | | $ 602.01 | | | | $ | 606.04 | | | | $ | 548.49 | | | | $ | 443.11 | | | | | $ 572.26 | | | | $ | 676.66 | | | | $ | 575.50 | |
| | | | | |
Net investment income1 | | | | 6.62 | | | | | 10.61 | | | | | 8.67 | | | | | 9.12 | | | | | 2.24 | | | | | 8.07 | | | | | 6.21 | |
Net realized and unrealized gain (loss) | | | | 33.97 | | | | | (3.88) | | | | | 57.43 | | | | | 105.72 | | | | | (124.70) | | | | | (105.98) | | | | | 100.52 | |
| | | | | |
Net increase (decrease) from investment operations | | | | 40.59 | | | | | 6.73 | | | | | 66.10 | | | | | 114.84 | | | | | (122.46) | | | | | (97.91) | | | | | 106.73 | |
| | | | | |
Dividends from net investment income | | | | (1.25) | | | | | (10.76) | | | | | (8.55) | | | | | (9.46) | | | | | (6.69) | | | | | (6.49) | | | | | (5.57) | |
| | | | | |
Net asset value, end of period | | | | $ 641.35 | | | | $ | 602.01 | | | | $ | 606.04 | | | | $ | 548.49 | | | | | $ 443.11 | | | | $ | 572.26 | | | | $ | 676.66 | |
| | | | | |
| | | | | |
Total Investment Return2 | | | | | | | | | | | | | | | | | | | | | | | | | | | | | | | | | | | |
Based on net asset value | | | | 6.72%3 | | | | | 1.14% | | | | | 12.12% | | | | | 26.10% | | | | | (21.35)%3 | | | | | (14.56)% | | | | | 18.62% | |
| | | | | |
| | | | | | | | | | | | | | | | | | | | | | | | | | | | | | | | | | | |
Ratios to Average Net Assets | | | | | | | | | | | | | | | | | | | | | | | | | | | | | | | | | | | |
Total expenses | | | | 0.66%4 | | | | | 0.67% | | | | | 0.67% | | | | | 0.68% | | | | | 0.71%4 | | | | | 0.65% | | | | | 0.65% | |
| | | | | |
Total expenses after fees waived, reimbursed and paid indirectly | | | | 0.62%4 | | | | | 0.62% | | | | | 0.62% | | | | | 0.61% | | | | | 0.60%4 | | | | | 0.60% | | | | | 0.60% | |
| | | | | |
Net investment income | | | | 2.10%4 | | | | | 1.74% | | | | | 1.54% | | | | | 1.96% | | | | | 1.94%4 | | | | | 1.28% | | | | | 0.99% | |
| | | | | |
| | | | | |
Supplemental Data | | | | | | | | | | | | | | | | | | | | | | | | | | | | | | | | | | | |
Net assets, end of period (000) | | | | $216,723 | | | | $ | 206,266 | | | | $ | 218,648 | | | | $ | 202,530 | | | | | $175,546 | | | | $ | 238,201 | | | | $ | 313,012 | |
| | | | | |
Portfolio turnover | | | | – | | | | | – | | | | | 2% | | | | | – | | | | | – | | | | | – | | | | | 1% | |
| | | | | |
1 Based on average shares outstanding.
2 Where applicable, total investment returns include the reinvestment of dividends and distributions.
3 Aggregate total investment return.
4 Annualized.
| | | | |
See Notes to Financial Statements. |
| | | | | |
| 12 | | BLACKROCK EXCHANGE PORTFOLIO | | JUNE 30, 2012 |
| | |
| Notes to Financial Statements (Unaudited) | | |
1. Organization and Significant Accounting Policies:
BlackRock FundsSM (the “Trust”) is registered under the Investment Company Act of 1940, as amended (the “1940 Act”), as an open-end management investment company. The Trust is organized as a Massachusetts business trust. These financial statements relate to one series of the Trust, BlackRock Exchange Portfolio (the “Fund”). The Fund is classified as diversified. The Fund’s financial statements are prepared in conformity with accounting principles generally accepted in the United States of America (“US GAAP”), which may require management to make estimates and assumptions that affect the reported amounts and disclosures in the financial statements. Actual results could differ from those estimates.
The following is a summary of significant accounting policies followed by the Fund:
Valuation: US GAAP defines fair value as the price the Fund would receive to sell an asset or pay to transfer a liability in an orderly transaction between market participants at the measurement date. The Fund fair values its financial instruments at market value using independent dealers or pricing services under policies approved annually by the Board of Trustees of the Trust (the “Board”). The BlackRock Global Valuation Methodologies Committee (the “Global Valuation Committee”) is the committee formed by management to develop global pricing policies and procedures and to provide oversight of the pricing function for the Fund for all financial instruments.
Equity investments traded on a recognized securities exchange or the NASDAQ Global Market System (“NASDAQ”) are valued at the last reported sale price that day or the NASDAQ official closing price, if applicable. For equity investments traded on more than one exchange, the last reported sale price on the exchange where the stock is primarily traded is used. Equity investments traded on a recognized exchange for which there were no sales on that day are valued at the last available bid price. If no bid price is available, the prior day’s price will be used, unless it is determined that such prior day’s price no longer reflects the fair value of the security. Investments in open-end registered investment companies are valued at NAV each business day. Short-term securities with remaining maturities of 60 days or less may be valued at amortized cost, which approximates fair value.
The Fund values its investment in BlackRock Liquidity Series, LLC Money Market Series (the “Money Market Series”) at fair value, which is ordinarily based upon its pro rata ownership in the underlying fund’s net assets. The Money Market Series seeks current income consistent with maintaining liquidity and preserving capital. Although the Money Market Series is not registered under the 1940 Act, its investments will follow the parameters of investments by a money market fund that is subject to Rule 2a-7 under the 1940 Act. The Fund may withdraw up to 25% of its investment daily, although the manager of the Money Market Series, in its sole discretion, may permit an investor to withdraw more than 25% on any one day.
In the event that application of these methods of valuation results in a price for an investment, which is deemed not to be representative of the market value of such investment or if a price is not available, the investment will be valued by the Global Valuation Committee, or its delegate, in accordance with a policy approved by the Board as reflecting fair value (“Fair Value Assets”). When determining the price for Fair Value Assets, the Global Valuation Committee, or its delegate, seeks to determine the price that the Fund might reasonably expect to receive from the current sale of that asset in an arm’s-length transaction. Fair value determinations shall be based upon all available factors that the Global Valuation Committee, or its delegate, deems relevant. These factors include but are not limited to (i) attributes specific to the investment or asset; (ii) the principal market for the investment or asset; (iii) the typical participants in the principal market for the investment or asset; (iv) data assumptions by market participants for the investment or asset, if reasonably available; (v) quoted prices for similar investments or assets in active markets; and (vi) other factors, such as future cash flows, interest rates, yield curves, volatilities, prepayment speeds, loss severities, credit risks and/or default rates. The Global Valuation Committee, or its delegate, employs various methods for calibrating valuation approaches, including regular due diligence of the Fund’s pricing vendors, a regular review of key inputs and assumptions, transactional back-testing or disposition analysis to compare unrealized gains and losses to realized gains and losses, reviews of missing or stale prices and large movements in market values and reviews of any market related activity. The pricing of all Fair Value Assets is subsequently reported to the Board or a committee thereof on a quarterly basis.
Redemptions-In-Kind: The Fund transferred securities and cash to shareholders in connection with redemption-in-kind transactions. For purposes of US GAAP, these transactions were treated as a sale of securities and the resulting gains and losses were recognized based on the market value of the securities on the date of the transfers. For tax purposes, no gains or losses were recognized. Gains and losses resulting from such redemptions-in-kind are shown as redemption-in-kind transactions in the Statement of Operations.
Investment Transactions and Investment Income: For financial reporting purposes, investment transactions are recorded on the dates the transactions are entered into (the trade dates). Realized gains and losses on investment transactions are determined on the identified cost basis. Dividend income is recorded on the ex-dividend dates. Dividends from foreign securities where the ex-dividend date may have passed are subsequently recorded when the Fund is informed of the ex-dividend date. Under the applicable foreign tax laws, a withholding tax at various rates may be imposed on capital gains, dividends and interest.
Dividends and Distributions: Dividends and distributions paid by the Fund are recorded on the ex-dividend dates. The amount and timing of dividends and distributions are determined in accordance with federal income tax regulations, which may differ from US GAAP.
| | | | | | |
|
| | | | | | | |
| | BLACKROCK EXCHANGE PORTFOLIO | | JUNE 30, 2012 | | 13 |
| | |
| Notes to Financial Statements (continued) | | |
Securities Lending: The Fund may lend securities to approved borrowers, such as banks, brokers and other financial institutions. The borrower pledges cash, securities issued or guaranteed by the US government or irrevocable letters of credit issued by a bank as collateral, which will be maintained at all times in an amount equal to at least 100% of the current market value of the loaned securities. The market value of the loaned securities is determined at the close of business of the Fund and any additional required collateral is delivered to the Fund on the next business day. Securities lending income, as disclosed in the Statement of Operations, represents the income earned from the investment of the cash collateral, net of rebates paid to, or fees paid by, borrowers and less the fees paid to the securities lending agent. During the term of the loan, the Fund earns dividend or interest income on the securities loaned but does not receive dividend or interest income on the securities received as collateral. Loans of securities are terminable at any time and the borrower, after notice, is required to return borrowed securities within the standard time period for settlement of securities transactions. In the event that the borrower defaults on its obligation to return borrowed securities because of insolvency or for any other reason, the Fund could experience delays and costs in gaining access to the collateral. The Fund also could suffer a loss if the value of an investment purchased with cash collateral falls below the market value of loaned securities or if the value of an investment purchased with cash collateral falls below the value of the original cash collateral received. During the six months ended June 30, 2012, any securities on loan were collateralized by cash.
Income Taxes: It is the Fund’s policy to comply with the requirements of the Internal Revenue Code of 1986, as amended, applicable to regulated investment companies and to distribute substantially all of its taxable income to its shareholders. Therefore, no federal income tax provision is required.
The Fund files US federal and various state and local tax returns. No income tax returns are currently under examination. The statute of limitations on the Fund’s US federal tax returns remains open for each of the four periods ended December 31, 2011. The statutes of limitations on the Fund’s state and local tax returns may remain open for an additional year depending upon the jurisdiction. Management does not believe there are any uncertain tax positions that require recognition of a tax liability.
Recent Accounting Standard: In December 2011, the Financial Accounting Standards Board issued guidance that will expand current disclosure requirements on the offsetting of certain assets and liabilities. The new disclosures will be required for investments and derivative financial instruments subject to master netting or similar agreements which are eligible for offset in the Statement of Assets and Liabilities and will require an entity to disclose both gross and net information about such investments and transactions in the financial statements. The guidance is effective for financial statements with fiscal years beginning on or after January 1, 2013, and interim periods within those fiscal years. Management is evaluating the impact of this guidance on the Fund’s financial statement disclosures.
Other: Expenses directly related to the Fund are charged to the Fund. Other operating expenses shared by several funds are pro rated among those funds on the basis of relative net assets or other appropriate methods.
The Fund has an arrangement with the custodian whereby fees may be reduced by credits earned on uninvested cash balances, which, if applicable, are shown as fees paid indirectly in the Statement of Operations. The custodian imposes fees on overdrawn cash balances, which can be offset by accumulated credits earned or may result in additional custody charges.
2. Investment Advisory Agreement and Other Transactions with Affiliates:
The PNC Financial Services Group, Inc. (“PNC”) is the largest stockholder and an affiliate, for 1940 Act purposes, of BlackRock, Inc. (“BlackRock”).
The Trust, on behalf of the Fund, entered into an Investment Advisory Agreement with the Manager, the Fund’s investment advisor, an indirect, wholly owned subsidiary of BlackRock, to provide investment advisory and administration services. The Manager is responsible for the management of the Fund’s portfolio and provides the necessary personnel, facilities, equipment and certain other services necessary to the operations of the Fund. For such services, the Fund pays the Manager a monthly fee based on a percentage of the Fund’s average daily net assets at the following annual rates:
| | |
| Average Daily Net Assets | | Investment Advisory Fee |
First $1 Billion | | 0.500% |
$1 Billion - $3 Billion | | 0.470 |
$3 Billion - $5 Billion | | 0.450 |
$5 Billion - $10 Billion | | 0.440 |
Greater than $10 Billion | | 0.430 |
The Manager voluntarily agreed to waive its investment advisory fees by the amount of investment advisory fees the Fund pays to the Manager indirectly through its investment in affiliated money market funds. However, the Manager does not waive its investment advisory fees by the amount of investment advisory fees paid in connection with the Fund’s investment in other affiliated investment companies, if any. This amount is included in fees waived by advisor in the Statement of Operations. For the six months ended June 30, 2012, the Manager waived $239.
| | | | |
|
| | | | | |
| 14 | | BLACKROCK EXCHANGE PORTFOLIO | | JUNE 30, 2012 |
| | |
| Notes to Financial Statements (continued) | | |
BNY Mellon Investment Servicing (US) Inc. (“BNYMIS”) and the Manager act as co-administrators for the Fund. For these services, the co-administrators receive a combined administration fee computed daily and payable monthly, based on a percentage of the average daily net assets of the Fund. The combined administration fee is paid at the following annual rates: 0.075% of the first $500 million, 0.065% of the next $500 million and 0.055% of average daily net assets in excess of $1 billion. In addition, the Fund is charged an administration fee based on the following percentages of average daily net assets of the BlackRock Share class: 0.025% of the first $500 million, 0.015% of the next $500 million and 0.005% of average daily net assets in excess of $1 billion. In addition, BNYMIS and the Manager may have, at their discretion, voluntarily waived all or any portion of their administration fees for the Fund which are included in administration fees waived in the Statement of Operations. For the six months ended June 30, 2012, the Fund paid $52,114 to the Manager in return for these services, which is included in administration in the Statement of Operations.
The Manager contractually agreed to waive and/or reimburse fees or expenses, excluding interest expense, dividend expense, acquired fund fees and expenses and certain other fund expenses, in order to limit expenses to 0.62% of the Fund’s average daily net assets. The Manager has agreed not to reduce or discontinue this contractual waiver or reimbursement prior to May 1, 2013 unless approved by the Board, including a majority of the Independent Trustees. These amounts are shown as fees waived by advisor, administration fees waived, transfer agent fees waived and transfer agent fees reimbursed, in the Statement of Operations. For the six months ended June 30, 2012, the Manager waived $15,326 of investment advisory fees, which is included in fees waived by advisor.
If during the Fund’s fiscal year the operating expenses of the BlackRock Share class, that at any time during the prior two fiscal years received a waiver or reimbursement from the Manager, are less than the expense limit for the BlackRock Share class, the Manager is entitled to be reimbursed by the BlackRock Share class up to the lesser of (a) the amount of fees waived or expenses reimbursed during those prior two fiscal years under the agreement and (b) the amount by which the expense limit for the BlackRock Share class exceeds the operating expenses of the BlackRock Share class for the current fiscal year, provided that: (1) the Fund has more than $50 million in assets for the fiscal year and (2) the Manager or an affiliate continues to serve as the Fund’s investment advisor or administrator. In the event the expense limit for the BlackRock Share class is changed subsequent to a fiscal year in which the Manager becomes entitled to reimbursement for fees waived or reimbursed, the amount available to reimburse the Manager shall be calculated by reference to the expense limit for the BlackRock Share class in effect at the time the Manager became entitled to receive such reimbursement, rather than the subsequently changed expense limit for the BlackRock Share class.
On June 30, 2012, the amounts subject to possible future recoupment under the expense limitation agreement are as follows:
| | | | |
Expiring December 31, |
2012 | | 2013 | | 2014 |
$89,309 | | $96,115 | | $46,070 |
The Fund received an exemptive order from the SEC permitting it, among other things, to pay an affiliated securities lending agent a fee based on a share of the income derived from the securities lending activities and has retained BlackRock Investment Management, LLC (“BIM”) as the securities lending agent. BIM may, on behalf of the Fund, invest cash collateral received by the Fund for such loans, among other things, in a private investment company managed by the Manager or in registered money market funds advised by the Manager or its affiliates. As securities lending agent, BIM is responsible for all transaction fees and all other operational costs relating to securities lending activities, other than extraordinary expenses. BIM does not receive any fees for managing the cash collateral. The market value of securities on loan and the value of the related collateral, if applicable, are shown in the Statement of Assets and Liabilities as securities loaned at value and collateral on securities loaned at value, respectively. The cash collateral invested by BIM is disclosed in the Schedule of Investments, if any. Securities lending income is equal to the total of income earned from the reinvestment of cash collateral, net of rebates paid to, or fees paid by, borrowers of securities. The Fund retains 65% of securities lending income and pays a fee to BIM equal to 35% of such income. The share of income earned by the Fund is shown as securities lending – affiliated in the Statement of Operations. For the six months ended June 30, 2012, BIM received $24 in securities lending agent fees related to securities lending activities for the Fund.
Certain officers and/or trustees of the Trust are officers and/or directors of BlackRock or its affiliates. The Fund reimburses the Manager for compensation paid to the Trust’s Chief Compliance Officer.
3. Investments:
Purchases and sales of investments, excluding short-term securities, for the six months ended June 30, 2012, were $0 and $1,512,181, including $1,512,181 of sales representing redemptions-in-kind, respectively.
4. Income Tax Information
As of December 31, 2011, the Fund had a capital loss carryforward in the amount of $193,545 available to offset future realized capital gains, all of which is due to expire December 31, 2016.
| | | | | | |
|
| | | | | | | |
| | BLACKROCK EXCHANGE PORTFOLIO | | JUNE 30, 2012 | | 15 |
Notes to Financial Statements (concluded)
As of June 30, 2012, gross unrealized appreciation and gross unrealized depreciation based on cost for federal income tax purposes were as follows:
| | | | |
Tax cost | | $ | 40,757,001 | |
| | | | |
Gross unrealized appreciation | | $ | 176,080,751 | |
Gross unrealized depreciation | | | (326,652 | ) |
| | | | |
Net unrealized appreciation | | $ | 175,754,099 | |
| | | | |
5. Borrowings:
The Trust, on behalf of the Fund, along with certain other funds managed by the Manager and its affiliates, is a party to a $500 million credit agreement with a group of lenders. The Fund may borrow under the credit agreement to fund shareholder redemptions. Effective November 2011 to November 2012, the credit agreement has the following terms: a commitment fee of 0.065% per annum based on the Fund’s pro rata share of the unused portion of the credit agreement and interest at a rate equal to the higher of (a) the one-month LIBOR plus 0.80% per annum or (b) the Fed Funds rate plus 0.80% per annum on amounts borrowed. In addition, the Fund paid administration and arrangement fees which were allocated to the Fund based on its net assets as of October 31, 2011. The Fund did not borrow under the credit agreement during the six months ended June 30, 2012.
6. Concentration, Market and Credit Risk:
In the normal course of business, the Fund invests in securities and enters into transactions where risks exist due to fluctuations in the market (market risk) or failure of the issuer of a security to meet all its obligations (issuer credit risk). The value of securities held by the Fund may decline in response to certain events, including those directly involving the issuers whose securities are owned by the Fund; conditions affecting the general economy; overall market changes; local, regional or global political, social or economic instability; and currency and interest rate
and price fluctuations. Similar to issuer credit risk, the Fund may be exposed to counterparty credit risk, or the risk that an entity with which the Fund has unsettled or open transactions may fail to or be unable to perform on its commitments. The Fund manages counterparty credit risk by entering into transactions only with counterparties that it believes have the financial resources to honor their obligations and by monitoring the financial stability of those counterparties. Financial assets, which potentially expose the Fund to market, issuer and counterparty credit risks, consist principally of financial instruments and receivables due from counterparties. The extent of the Fund’s exposure to market, issuer and counterparty credit risks with respect to these financial assets is generally approximated by their value recorded in the Fund’s Statement of Assets and Liabilities, less any collateral held by the Fund.
7. Capital Shares Transactions:
Transactions in BlackRock Shares were as follows:
| | | | | | | | |
| | | Six Months Ended
June 30, 2012 | | | Year Ended
December 31,
2011 | |
| | | | |
Shares issued in reinvestment of dividends | | | 123 | | | | 1,156 | |
Shares redeemed | | | (4,833 | )1 | | | (19,308 | )2 |
| | | | |
Net decrease | | | (4,710 | ) | | | (18,152 | ) |
| | | | |
| 1Including | (2,485) representing redemptions-in-kind. |
| 2Including | (11,258) representing redemptions-in-kind. |
8. Subsequent Events:
Management has evaluated the impact of all subsequent events on the Fund through the date the financial statements were issued and has determined that there were no subsequent events requiring adjustment or additional disclosure in the financial statements.
| | | | |
|
| | | | | |
| 16 | | BLACKROCK EXCHANGE PORTFOLIO | | JUNE 30, 2012 |
Disclosure of Investment Advisory Agreement
The Board of Trustees (the “Board,” and the members of which are referred to as “Board Members”) of BlackRock FundsSM (the “Trust”) met on April 17, 2012 and May 15-16, 2012 to consider the approval of the Trust’s investment advisory agreement (the “Agreement”) with BlackRock Advisors, LLC (“BlackRock”), the Trust’s investment advisor, on behalf of BlackRock Exchange Portfolio (the “Fund”), a series of the Trust.
Activities and Composition of the Board
The Board consists of fourteen individuals, twelve of whom are not “interested persons” of the Trust as defined in the Investment Company Act of 1940, as amended (the “1940 Act”) (the “Independent Board Members”). The Board Members are responsible for the oversight of the operations of the Fund and perform the various duties imposed on the directors of investment companies by the 1940 Act. The Independent Board Members have retained independent legal counsel to assist them in connection with their duties. The Co-Chairs of the Board are each Independent Board Members. The Board has established five standing committees: an Audit Committee, a Governance and Nominating Committee, a Compliance Committee, a Performance Oversight and Contract Committee and an Executive Committee, each of which is chaired by an Independent Board Member and composed of Independent Board Members (except for the Executive Committee, which also has one interested Board Member).
The Agreement
Pursuant to the 1940 Act, the Board is required to consider the continuation of the Agreement on an annual basis. The Board has four quarterly meetings per year, each extending over two days, and a fifth meeting to consider specific information surrounding the consideration of renewing the Agreement. In connection with this process, the Board assessed, among other things, the nature, scope and quality of the services provided to the Fund by BlackRock, its personnel and its affiliates, including investment management, administrative and shareholder services, oversight of fund accounting and custody, marketing services, risk oversight, compliance and assistance in meeting applicable legal and regulatory requirements.
The Board, acting directly and through its committees, considers at each of its meetings, and from time to time as appropriate, factors that are relevant to its annual consideration of the renewal of the Agreement, including the services and support provided by BlackRock to the Fund and its shareholders. Among the matters the Board considered were: (a) investment performance for one-, three- and five-year periods, as applicable, against peer funds, and applicable benchmarks, if any, as well as senior management’s and portfolio managers’ analysis of the reasons for any over performance or underperformance against its peers and/or benchmark, as applicable; (b) fees, including advisory, administration, if applicable, and other amounts paid to BlackRock and its affiliates by the Fund for services, such as marketing and distribution, call center and fund accounting; (c) Fund operating expenses and how BlackRock allocates expenses to the Fund; (d) the resources devoted to, risk oversight of, and compliance reports relating to, implementation of
the Fund’s investment objective, policies and restrictions; (e) the Fund’s compliance with its Code of Ethics and other compliance policies and procedures; (f) the nature, cost and character of non-investment management services provided by BlackRock and its affiliates; (g) BlackRock’s and other service providers’ internal controls and risk and compliance oversight mechanisms; (h) BlackRock’s implementation of the proxy voting policies approved by the Board; (i) the use of brokerage commissions and execution quality of portfolio transactions; (j) BlackRock’s implementation of the Fund’s valuation and liquidity procedures; (k) an analysis of management fees for products with similar investment objectives across the open-end fund, exchange traded fund (“ETF”), closed-end fund and institutional account product channels, as applicable; (l) BlackRock’s compensation methodology for its investment professionals and the incentives it creates; and (m) periodic updates on BlackRock’s business.
The Board has engaged in an ongoing strategic review with BlackRock of opportunities to consolidate funds and of BlackRock’s commitment to investment performance. In addition, the Board requested, to the extent reasonably possible, an analysis of the risk and return relative to selected funds in peer groups. BlackRock provides information to the Board in response to specific questions. These questions covered issues such as profitability, investment performance and management fee levels. The Board considered the importance of: (i) managing fixed income assets with a view toward preservation of capital; (ii) portfolio managers’ investments in the funds they manage; (iii) BlackRock’s controls surrounding the coding of quantitative investment models; and (iv) BlackRock’s oversight of relationships with third party service providers.
Board Considerations in Approving the Agreement
The Approval Process: Prior to the April 17, 2012 meeting, the Board requested and received materials specifically relating to the Agreement. The Board is engaged in a process with its independent legal counsel and BlackRock to review periodically the nature and scope of the information provided to better assist its deliberations. The materials provided in connection with the April meeting included (a) information independently compiled and prepared by Lipper, Inc. (“Lipper”) on Fund fees and expenses and the investment performance of the Fund as compared with a peer group of funds as determined by Lipper (collectively, “Peers”); (b) information on the profitability of the Agreement to BlackRock and a discussion of fall-out benefits to BlackRock and its affiliates; (c) a general analysis provided by BlackRock concerning investment management fees (a combination of the advisory fee and the administration fee, if any) charged to other clients, such as institutional clients, ETFs and closed-end funds, under similar investment mandates, as well as the performance of such other clients, as applicable; (d) the existence, impact and sharing of economies of scale; (e) a summary of aggregate amounts paid by the Fund to BlackRock; (f) sales and redemption data regarding the Fund’s shares; and (g) if applicable, a comparison of management fees to similar BlackRock open-end funds, as classified by Lipper.
| | | | | | |
See Notes to Financial Statements. |
| | | | | | | |
| | BLACKROCK EXCHANGE PORTFOLIO | | JUNE 30, 2012 | | 17 |
| | |
Disclosure of Investment Advisory Agreement (continued) |
At an in-person meeting held on April 17, 2012, the Board reviewed materials relating to its consideration of the Agreement. As a result of the discussions that occurred during the April 17, 2012 meeting, and as a culmination of the Board’s year-long deliberative process, the Board presented BlackRock with questions and requests for additional information. BlackRock responded to these requests with additional written information in advance of the May 15-16, 2012 Board meeting.
At an in-person meeting held on May 15-16, 2012, the Board, including all the Independent Board Members, unanimously approved the continuation of the Agreement between BlackRock and the Trust with respect to the Fund for a one-year term ending June 30, 2013. In approving the continuation of the Agreement, the Board considered: (a) the nature, extent and quality of the services provided by BlackRock; (b) the investment performance of the Fund and BlackRock; (c) the advisory fee and the cost of the services and profits to be realized by BlackRock and its affiliates from their relationship with the Fund; (d) economies of scale; (e) fall-out benefits to BlackRock as a result of its relationship with the Fund; and (f) other factors deemed relevant by the Board Members.
The Board also considered other matters it deemed important to the approval process, such as payments made to BlackRock or its affiliates relating to the distribution of Fund shares and securities lending, services related to the valuation and pricing of Fund portfolio holdings, direct and indirect benefits to BlackRock and its affiliates from their relationship with the Fund and advice from independent legal counsel with respect to the review process and materials submitted for the Board’s review. The Board noted the willingness of BlackRock personnel to engage in open, candid discussions with the Board. The Board did not identify any particular information as controlling, and each Board Member may have attributed different weights to the various items considered.
A. Nature, Extent and Quality of the Services Provided by BlackRock: The Board, including the Independent Board Members, reviewed the nature, extent and quality of services provided by BlackRock, including the investment advisory services and the resulting performance of the Fund. Throughout the year, the Board compared the Fund’s performance to the performance of a comparable group of mutual funds and/or the performance of a relevant benchmark, if any. The Board met with BlackRock’s senior management personnel responsible for investment operations, including the senior investment officers. The Board also reviewed the materials provided by the Fund’s portfolio management team discussing Fund performance and the Fund’s investment objective, strategies and outlook.
The Board considered, among other factors, the number, education and experience of BlackRock’s investment personnel generally and the Fund’s portfolio management team, investments by portfolio managers in the funds they manage, BlackRock’s portfolio trading capabilities, BlackRock’s use of technology, BlackRock’s commitment to compliance, BlackRock’s credit analysis capabilities, BlackRock’s risk analysis and oversight capabilities and BlackRock’s approach to training and retaining
portfolio managers and other research, advisory and management personnel. The Board engaged in a review of BlackRock’s compensation structure with respect to the Fund’s portfolio management team and BlackRock’s ability to attract and retain high-quality talent and create performance incentives.
In addition to advisory services, the Board considered the quality of the administrative and non-investment advisory services provided to the Fund. BlackRock and its affiliates provide the Fund with certain administrative, shareholder and other services (in addition to any such services provided to Fund by third parties) and officers and other personnel as are necessary for the operations of the Fund. In particular, BlackRock and its affiliates provide the Fund with the following administrative services, including, among others: (i) preparing disclosure documents, such as the prospectus, the statement of additional information and periodic shareholder reports; (ii) assisting with daily accounting and pricing; (iii) overseeing and coordinating the activities of other service providers; (iv) organizing Board meetings and preparing the materials for such Board meetings; (v) providing legal and compliance support; and (vi) performing other administrative functions necessary for the operation of the Fund, such as tax reporting, fulfilling regulatory filing requirements and call center services. The Board reviewed the structure and duties of BlackRock’s fund administration, accounting, legal and compliance departments and considered BlackRock’s policies and procedures for assuring compliance with applicable laws and regulations.
B. The Investment Performance of the Fund and BlackRock: The Board, including the Independent Board Members, also reviewed and considered the performance history of the Fund. In preparation for the April 17, 2012 meeting, the Board worked with its independent counsel, BlackRock and Lipper to develop a template for, and was provided with, reports independently prepared by Lipper, which included a comprehensive analysis of the Fund’s performance. The Board also reviewed a narrative and statistical analysis of the Lipper data that was prepared by BlackRock, which analyzed various factors that affect Lipper’s rankings. In connection with its review, the Board received and reviewed information regarding the investment performance of the Fund as compared to funds in the Fund’s applicable Lipper category. The Board was provided with a description of the methodology used by Lipper to select peer funds and periodically meets with Lipper representatives to review their methodology. The Board and the Board’s Performance Oversight and Contract Committee regularly review, and meet with Fund management to discuss, the performance of the Fund throughout the year.
The Board noted that, in general, the Fund performed better than its Peers in that the Fund’s performance was at or above the median of its Lipper Performance Universe in two of the one-, three- and five-year periods reported.
C. Consideration of the Advisory/Management Fees and the Cost of the Services and Profits to be Realized by BlackRock and its Affiliates from their Relationship with the Fund: The Board, including the Independent Board Members, reviewed the Fund’s contractual management fee rate
| | | | |
|
| | | | | |
| 18 | | BLACKROCK EXCHANGE PORTFOLIO | | JUNE 30, 2012 |
| | |
Disclosure of Investment Advisory Agreement (continued) |
compared with the other funds in its Lipper category. It also compared the Fund’s total expense ratio, as well as actual management fee rate, to those of other funds in its Lipper category. The Board considered the services provided and the fees charged by BlackRock to other types of clients with similar investment mandates, including separately managed institutional accounts.
The Board received and reviewed statements relating to BlackRock’s financial condition and profitability with respect to the services it provided the Fund. The Board was also provided with a profitability analysis that detailed the revenues earned and the expenses incurred by BlackRock for services provided to the Fund. The Board reviewed BlackRock’s profitability with respect to the Fund and other funds the Board currently oversees for the year ended December 31, 2011 compared to available aggregate profitability data provided for the years ended December 31, 2010 and December 31, 2009. The Board reviewed BlackRock’s profitability with respect to other fund complexes managed by BlackRock and/or its affiliates. The Board reviewed BlackRock’s assumptions and methodology of allocating expenses in the profitability analysis, noting the inherent limitations in allocating costs among various advisory products. The Board recognized that profitability may be affected by numerous factors including, among other things, fee waivers and expense reimbursements by BlackRock, the types of funds managed, expense allocations and business mix, and the difficulty of comparing profitability as a result of those factors.
The Board noted that, in general, individual fund or product line profitability of other advisors is not publicly available. The Board considered BlackRock’s operating margin, in general, compared to the operating margin for leading investment management firms whose operations include advising open-end funds, among other product types. In addition, the Board considered, among other things, certain third party data comparing BlackRock’s operating margin with that of other publicly-traded asset management firms. The Board considered the differences between BlackRock and these other firms, including the contribution of technology at BlackRock, BlackRock’s expense management and the relative product mix.
In addition, the Board considered the cost of the services provided to the Fund by BlackRock, and BlackRock’s and its affiliates’ profits relating to the management and distribution of the Fund and the other funds advised by BlackRock and its affiliates. As part of its analysis, the Board reviewed BlackRock’s methodology in allocating its costs to the management of the Fund. The Board also considered whether BlackRock has the financial resources necessary to attract and retain high quality investment management personnel to perform its obligations under the Agreement and to continue to provide the high quality of services that is expected by the Board.
The Board noted that the Fund’s contractual management fee ratio (a combination of the advisory fee and the administration fee, if any) was lower than or equal to the median contractual management fee ratio paid by the Fund’s Peers, in each case before taking into account any
expense reimbursements or fee waivers. The Board also noted that the Fund has an advisory fee arrangement that includes breakpoints that adjust the fee rate downward as the size of the Fund increases above certain contractually specified levels. The Board also noted that BlackRock has contractually agreed to waive fees and/or reimburse expenses in order to limit, to a specified amount, the Fund’s total operating expenses as a percentage of the Fund’s average daily net assets.
D. Economies of Scale: The Board, including the Independent Board Members, considered the extent to which economies of scale might be realized as the assets of Fund increase, as well as the existence of expense caps. The Board also considered the extent to which the Fund benefits from such economies and whether there should be changes in the advisory fee rate or structure in order to enable the Fund to participate in these economies of scale, for example through the use of revised breakpoints in the advisory fee based upon the asset level of the Fund. In its consideration, the Board took into account the existence of expense caps and further considered the continuation and/or implementation, as applicable, of such caps.
E. Other Factors Deemed Relevant by the Board Members: The Board, including the Independent Board Members, also took into account other ancillary or “fall-out” benefits that BlackRock or its affiliates may derive from their respective relationships with the Fund, both tangible and intangible, such as BlackRock’s ability to leverage its investment professionals who manage other portfolios and risk management personnel, an increase in BlackRock’s profile in the investment advisory community, and the engagement of BlackRock’s affiliates as service providers to the Fund, including for administrative, distribution, securities lending and cash management services. The Board also considered BlackRock’s overall operations and its efforts to expand the scale of, and improve the quality of, its operations. The Board also noted that BlackRock may use and benefit from third party research obtained by soft dollars generated by certain registered fund transactions to assist in managing all or a number of its other client accounts. The Board further noted that it had considered the investment by BlackRock’s funds in ETFs without any offset against the management fees payable by the funds to BlackRock.
In connection with its consideration of the Agreement, the Board also received information regarding BlackRock’s brokerage and soft dollar practices. The Board received reports from BlackRock which included information on brokerage commissions and trade execution practices throughout the year.
The Board noted the competitive nature of the open-end fund marketplace, and that shareholders are able to redeem their Fund shares if they believe that the Fund’s fees and expenses are too high or if they are dissatisfied with the performance of the Fund.
Conclusion
The Board, including all the Independent Board Members, unanimously approved the continuation of the Agreement between BlackRock and the Trust, with respect to the Fund, for a one-year term ending June 30, 2013.
| | | | | | |
|
| | | | | | | |
| | BLACKROCK EXCHANGE PORTFOLIO | | JUNE 30, 2012 | | 19 |
| | |
Disclosure of Investment Advisory Agreement (concluded) |
Based upon its evaluation of all of the aforementioned factors in their totality, the Board, including the Independent Board Members, was satisfied that the terms of the Agreement were fair and reasonable and in the best interest of the Fund and its shareholders. In arriving at its decision to approve the Agreement, the Board did not identify any single factor or group of factors as all-important or controlling, but considered all factors together, and different Board Members may have attributed different weights to the various factors considered. The Independent
Board Members were also assisted by the advice of independent legal counsel in making this determination. The contractual fee arrangements for the Fund reflect the results of several years of review by the Board Members and predecessor Board Members, and discussions between such Board Members (and predecessor Board Members) and BlackRock. As a result, the Board Members’ conclusions may be based in part on their consideration of these arrangements in prior years.
| | | | |
|
| | | | | |
| 20 | | BLACKROCK EXCHANGE PORTFOLIO | | JUNE 30, 2012 |
Ronald W. Forbes, Co-Chairman of the Board and Trustee
Rodney D. Johnson, Co-Chairman of the Board and Trustee
Paul L. Audet, Trustee
David O. Beim, Trustee
Henry Gabbay, Trustee
Dr. Matina S. Horner, Trustee
Herbert I. London, Trustee
Ian A. MacKinnon, Trustee1
Cynthia A. Montgomery, Trustee
Joseph P. Platt, Trustee
Robert C. Robb, Jr., Trustee
Toby Rosenblatt, Trustee
Kenneth L. Urish, Trustee
Frederick W. Winter, Trustee
John M. Perlowski, President and Chief Executive Officer
Richard Hoerner, CFA, Vice President
Brendan Kyne, Vice President
Simon Mendelson, Vice President
Christopher Stavrakos, CFA, Vice President
Neal Andrews, Chief Financial Officer
Jay Fife, Treasurer
Brian Kindelan, Chief Compliance Officer and Anti-Money Laundering Officer
Benjamin Archibald, Secretary2
| | 1 | Effective May 15, 2012, Ian A. MacKinnon became a Trustee of the Trust. |
| | 2 | Effective May 16, 2012, Ira P. Shapiro resigned as Secretary of the Trust and Benjamin Archibald became Secretary of the Trust. |
Investment Advisor and Co-Administrator
BlackRock Advisors, LLC
Wilmington, DE 19809
Accounting Agent, Co-Administrator and Transfer Agent
BNY Mellon Investment Servicing (US) Inc.
Wilmington, DE 19809
Custodian
The Bank of New York Mellon
New York, NY 10286
Distributor
BlackRock Investments, LLC
New York, NY 10022
Legal Counsel
Sidley Austin LLP
New York, NY 10019
Independent Registered Public Accounting Firm
Deloitte & Touche LLP
Philadelphia, PA 19103
Address of the Trust
100 Bellevue Parkway
Wilmington, DE 19809
| | | | | | |
|
| | | | | | | |
| | BLACKROCK EXCHANGE PORTFOLIO | | JUNE 30, 2012 | | 21 |
Electronic Delivery
Electronic copies of most financial reports and prospectuses are available on the Fund’s website or shareholders can sign up for e-mail notifications of quarterly statements, annual and semi-annual reports and prospectuses by enrolling in the Fund’s electronic delivery program.
To enroll:
Shareholders Who Hold Accounts with Investment Advisors, Banks or Brokerages:
Please contact your financial advisor. Please note that not all investment advisors, banks or brokerages may offer this service.
Shareholders Who Hold Accounts Directly With BlackRock
1) Access the BlackRock website at http://www.blackrock.com/ edelivery
2) Select “eDelivery” under the “More Information” section
3) Log into your account
Householding
The Fund will mail only one copy of shareholder documents, including annual and semi-annual reports and proxy statements, to shareholders with multiple accounts at the same address. This practice is commonly called “householding” and it is intended to reduce expenses and eliminate duplicate mailings of shareholder documents. Mailings of your shareholder documents may be householded indefinitely unless you instruct us otherwise. If you do not want the mailing of these documents
to be combined with those for other members of your household, please contact the Fund at (800) 441-7762.
Availability of Quarterly Schedule of Investments
The Fund files its complete schedule of portfolio holdings with the Securities and Exchange Commission (the “SEC”) for the first and third quarters of each fiscal year on Form N-Q. The Fund’s Forms N-Q are available on the SEC’s website at http://www.sec.gov and may also be reviewed and copied at the SEC’s Public Reference Room in Washington, D.C. Information on how to access documents on the SEC’s website without charge may be obtained by calling (800) SEC-0330. The Fund’s Forms N-Q may also be obtained upon request and without charge by calling (800) 441-7762.
Availability of Proxy Voting Policies and Procedures
A description of the policies and procedures that the Fund uses to determine how to vote proxies relating to portfolio securities is available (1) without charge, upon request, by calling (800) 441-7762; (2) at http://www.blackrock.com; and (3) on the SEC’s website at http:// www.sec.gov.
Availability of Proxy Voting Record
Information about how the Fund voted proxies relating to securities held in the Fund’s portfolios during the most recent 12-month period ended June 30 is available upon request and without charge (1) at http:// www.blackrock.com or by calling (800) 441-7762 and (2) on the SEC’s website at http://www.sec.gov.
Account Information
Call us at (800) 441-7762 from 8:00 AM to 6:00 PM EST on any business day to get information about your account balances, recent transactions and share prices. You can also reach us on the Web at http://www.blackrock.com/funds.
Automatic Investment Plans
Investor Class shareholders who want to invest regularly can arrange to have $50 or more automatically deducted from their checking or savings account and invested in any of the BlackRock funds.
Systematic Withdrawal Plan
Investor Class shareholders can establish a systematic withdrawal plan and receive periodic payments of $50 or more from their BlackRock funds, as long as their account balance is at least $10,000.
Retirement Plans
Shareholders may make investments in conjunction with Traditional, Rollover, Roth, Coverdell, Simple IRAs, SEP IRAs and 403(b) Plans.
| | | | |
|
| | | | | |
| 22 | | BLACKROCK EXCHANGE PORTFOLIO | | JUNE 30, 2012 |
| | |
| Additional Information (concluded) | | |
|
BlackRock Privacy Principles |
BlackRock is committed to maintaining the privacy of its current and former fund investors and individual clients (collectively, “Clients”) and to safeguarding their non-public personal information. The following information is provided to help you understand what personal information BlackRock collects, how we protect that information and why in certain cases we share such information with select parties.
If you are located in a jurisdiction where specific laws, rules or regulations require BlackRock to provide you with additional or different privacy-related rights beyond what is set forth below, then BlackRock will comply with those specific laws, rules or regulations.
BlackRock obtains or verifies personal non-public information from and about you from different sources, including the following: (i) information we receive from you or, if applicable, your financial intermediary, on applications, forms or other documents; (ii) information about your transactions with us, our affiliates, or others; (iii) information we receive from a consumer reporting agency; and (iv) from visits to our websites.
BlackRock does not sell or disclose to non-affiliated third parties any non-public personal information about its Clients, except as permitted by law or as is necessary to respond to regulatory requests or to service Client accounts. These non-affiliated third parties are required to protect the confidentiality and security of this information and to use it only for its intended purpose.
We may share information with our affiliates to service your account or to provide you with information about other BlackRock products or services that may be of interest to you. In addition, BlackRock restricts access to non-public personal information about its Clients to those BlackRock employees with a legitimate business need for the information. BlackRock maintains physical, electronic and procedural safeguards that are designed to protect the non-public personal information of its Clients, including procedures relating to the proper storage and disposal of such information.
| | | | | | |
|
| | | | | | | |
| | BLACKROCK EXCHANGE PORTFOLIO | | JUNE 30, 2012 | | 23 |
| | |
| A World-Class Mutual Fund Family | | |
BlackRock offers a diverse lineup of open-end mutual funds crossing all investment styles and managed by experts in equity, fixed income and tax-exempt investing.
| | | | |
Equity Funds | | | | |
| | |
BlackRock ACWI ex-US Index Fund BlackRock All-Cap Energy & Resources Portfolio BlackRock Balanced Capital Fund† BlackRock Basic Value Fund BlackRock Capital Appreciation Fund BlackRock China Fund BlackRock Commodity Strategies Fund BlackRock Emerging Markets Fund BlackRock Emerging Markets Long/Short Equity Fund BlackRock Energy & Resources Portfolio BlackRock Equity Dividend Fund BlackRock EuroFund BlackRock Flexible Equity Fund BlackRock Focus Growth Fund BlackRock Global Allocation Fund† | | BlackRock Global Dividend Income Portfolio BlackRock Global Dynamic Equity Fund BlackRock Global Opportunities Portfolio BlackRock Global SmallCap Fund BlackRock Health Sciences Opportunities Portfolio BlackRock Index Equity Portfolio BlackRock India Fund BlackRock International Fund BlackRock International Index Fund BlackRock International Opportunities Portfolio BlackRock Large Cap Core Fund BlackRock Large Cap Core Plus Fund BlackRock Large Cap Growth Fund BlackRock Large Cap Value Fund BlackRock Latin America Fund BlackRock Managed Volatility Portfolio† | | BlackRock Mid-Cap Growth Equity Portfolio BlackRock Mid Cap Value Opportunities Fund BlackRock Natural Resources Trust BlackRock Pacific Fund BlackRock Russell 1000 Index Fund BlackRock Science & Technology Opportunities Portfolio BlackRock Small Cap Growth Equity Portfolio BlackRock Small Cap Growth Fund II BlackRock Small Cap Index Fund BlackRock S&P 500 Index Fund BlackRock S&P 500 Stock Fund BlackRock U.S. Opportunities Portfolio BlackRock Value Opportunities Fund BlackRock World Gold Fund |
| | | | |
Fixed Income Funds | | | | |
| | |
BlackRock Bond Index Fund BlackRock Core Bond Portfolio BlackRock CoreAlpha Bond Fund BlackRock Emerging Market Debt Portfolio BlackRock Floating Rate Income Portfolio BlackRock Global Long/Short Credit Fund BlackRock GNMA Portfolio | | BlackRock High Yield Bond Portfolio BlackRock Inflation Protected Bond Portfolio BlackRock International Bond Portfolio BlackRock Long Duration Bond Portfolio BlackRock Low Duration Bond Portfolio BlackRock Multi-Asset Income Portfolio† BlackRock Secured Credit Portfolio | | BlackRock Strategic Income Opportunities Portfolio BlackRock Total Return Fund BlackRock US Government Bond Portfolio BlackRock US Mortgage Portfolio BlackRock World Income Fund |
| | | | |
Municipal Bond Funds | | | | |
| | |
BlackRock California Municipal Bond Fund BlackRock High Yield Municipal Fund BlackRock Intermediate Municipal Fund | | BlackRock National Municipal Fund BlackRock New Jersey Municipal Bond Fund BlackRock New York Municipal Bond Fund | | BlackRock Pennsylvania Municipal Bond Fund BlackRock Short-Term Municipal Fund |
| | | | | | | | | | | | |
Target Risk & Target Date Funds† | | | | | | | | | | | | |
| | | |
BlackRock Prepared Portfolios | | BlackRock Lifecycle Prepared Portfolios | | LifePath Portfolios | | LifePath Index Portfolios |
Conservative Prepared Portfolio | | 2015 | | 2035 | | Retirement | | 2040 | | Retirement | | 2040 |
Moderate Prepared Portfolio | | 2020 | | 2040 | | 2020 | | 2045 | | 2020 | | 2045 |
Growth Prepared Portfolio | | 2025 | | 2045 | | 2025 | | 2050 | | 2025 | | 2050 |
Aggressive Growth Prepared Portfolio | | 2030 | | 2050 | | 2030 | | 2055 | | 2030 | | 2055 |
| | | | | | 2035 | | | | 2035 | | |
† Mixed asset fund.
BlackRock mutual funds are currently distributed by BlackRock Investments, LLC. You should consider the investment objectives, risks, charges and expenses of the funds under consideration carefully before investing. Each fund’s prospectus contains this and other information and is available at www.blackrock.com or by calling (800) 441-7762 or from your financial advisor. The prospectus should be read carefully before investing.
| | | | |
|
| | | | | |
| 24 | | BLACKROCK EXCHANGE PORTFOLIO | | JUNE 30, 2012 |
[THIS PAGE INTENTIONALLY LEFT BLANK.]
[THIS PAGE INTENTIONALLY LEFT BLANK.]
[THIS PAGE INTENTIONALLY LEFT BLANK.]
This report is transmitted to shareholders only. It is not authorized for use as an offer of sale or a solicitation of an offer to buy shares of the Fund unless accompanied or preceded by the Fund’s current prospectus. Past performance results shown in this report should not be considered a representation of future performance. Investment returns and principal value of shares will fluctuate so that shares, when redeemed, may be worth more or less than their original cost. Statements and other information herein are as dated and are subject to change.
EXCH-6/12-SAR 
| | |
| Item 2 – Code of Ethics – Not Applicable to this semi-annual report |
|
| Item 3 – Audit Committee Financial Expert – Not Applicable to this semi-annual report |
|
| Item 4 – Principal Accountant Fees and Services – Not Applicable to this semi-annual report |
|
| Item 5 – Audit Committee of Listed Registrants – Not Applicable |
|
| Item 6 – Investments |
| | (a) The registrant’s Schedule of Investments is included as part of the Report to Stockholders filed under Item 1 of this Form. |
| | (b) Not Applicable due to no such divestments during the semi-annual period covered since the previous Form N-CSR filing. |
|
| Item 7 – Disclosure of Proxy Voting Policies and Procedures for Closed-End Management Investment Companies – Not Applicable |
|
| Item 8 – Portfolio Managers of Closed-End Management Investment Companies - Not Applicable |
| |
| Item 9 – | | Purchases of Equity Securities by Closed-End Management Investment Company and Affiliated Purchasers – Not Applicable |
|
| Item 10 – Submission of Matters to a Vote of Security Holders – There have been no material changes to these procedures. |
| |
| Item 11 – | | Controls and Procedures |
| |
| | (a) – The registrant’s principal executive and principal financial officers, or persons performing similar functions, have concluded that the registrant’s disclosure controls and procedures (as defined in Rule 30a-3(c) under the Investment Company Act of 1940, as amended (the “1940 Act”)) are effective as of a date within 90 days of the filing of this report based on the evaluation of these controls and procedures required by Rule 30a-3(b) under the 1940 Act and Rule 15d-15(b) under the Securities Exchange Act of 1934, as amended. |
| |
| | (b) – There were no changes in the registrant’s internal control over financial reporting (as defined in Rule 30a-3(d) under the 1940 Act) that occurred during the second fiscal quarter of the period covered by this report that have materially affected, or are reasonably likely to materially affect, the registrant’s internal control over financial reporting. |
| |
| Item 12 – | | Exhibits attached hereto |
| |
| | (a)(1) – Code of Ethics – Not Applicable to this semi-annual report |
| |
| | (a)(2) – Certifications – Attached hereto |
| |
| | (a)(3) – Not Applicable |
| |
| | (b) – Certifications – Attached hereto |
2
Pursuant to the requirements of the Securities Exchange Act of 1934 and the Investment Company Act of 1940, the registrant has duly caused this report to be signed on its behalf by the undersigned, thereunto duly authorized.
| | |
| BlackRock Funds: Exchange Portfolio |
| |
| By: | | /s/ John M. Perlowski |
| | John M. Perlowski |
| | Chief Executive Officer (principal executive officer) of |
| | BlackRock Funds: Exchange Portfolio |
| |
| Date: | | September 4, 2012 |
Pursuant to the requirements of the Securities Exchange Act of 1934 and the Investment Company Act of 1940, this report has been signed below by the following persons on behalf of the registrant and in the capacities and on the dates indicated.
| | |
| By: | | /s/ John M. Perlowski |
| | John M. Perlowski |
| | Chief Executive Officer (principal executive officer) of |
| | BlackRock Funds: Exchange Portfolio |
| |
| Date: | | September 4, 2012 |
| | |
| By: | | /s/ Neal J. Andrews |
| | Neal J. Andrews |
| | Chief Financial Officer (principal financial officer) of |
| | BlackRock Funds: Exchange Portfolio |
| |
| Date: | | September 4, 2012 |
3