UNITED STATES
SECURITIES AND EXCHANGE COMMISSION
Washington, D.C. 20549
FORM N-CSR
CERTIFIED SHAREHOLDER REPORT OF REGISTERED MANAGEMENT INVESTMENT COMPANIES
Investment Company Act file number 811-05742
Name of Fund: BlackRock Funds
BlackRock Commodity Strategies Fund
BlackRock Global Long/Short Credit Fund
BlackRock Multi-Asset Real Return Fund
BlackRock Short Obligations Fund
BlackRock Short-Term Treasury Fund
BlackRock Strategic Risk Allocation Fund
BlackRock Ultra-Short Obligations Fund
Fund Address: 100 Bellevue Parkway, Wilmington, DE 19809
Name and address of agent for service: John M. Perlowski, Chief Executive Officer, BlackRock Funds, 55 East 52nd Street, New York, NY 10055
Registrant’s telephone number, including area code: (800) 441-7762
Date of fiscal year end: 07/31/2013
Date of reporting period: 01/31/2013
Item 1 – Report to Stockholders
JANUARY 31, 2013
| | | | |
SEMI-ANNUAL REPORT (UNAUDITED) | | | | BLACKROCK ® |
BlackRock FundsSM
„ BlackRock Commodity Strategies Fund
„ BlackRock Global Long/Short Credit Fund
| | |
Not FDIC Insured ¡ May Lose Value ¡ No Bank Guarantee | | |
| | | | | | |
| | | | | | | |
| 2 | | BLACKROCK FUNDS | | JANUARY 31, 2013 | | |
Dear Shareholder
Financial markets have substantially improved over the past year, providing investors with considerable relief compared to where things were during the global turmoil seen in 2011. Despite a number of headwinds, higher-risk asset classes boasted strong returns as investors sought meaningful yields in the ongoing low-interest-rate environment.
Rising investor confidence drove equity markets higher in early 2012, while climbing US Treasury yields pressured higher-quality fixed income assets. The second quarter, however, brought a market reversal as Europe’s debt crisis boiled over once again. Political instability in Greece and severe deficit and liquidity problems in Spain raised the specter of a euro collapse. Alongside the drama in Europe, investors were discouraged by gloomy economic reports from various parts of the world. A slowdown in China, a key powerhouse for global growth, emerged as a particular concern. But as the outlook for the global economy worsened, investors grew increasingly optimistic that the world’s largest central banks would soon intervene to stimulate growth. This theme, along with the European Central Bank’s (“ECB’s”) firm commitment to preserve the euro currency bloc, drove most asset classes higher through the summer. Policy relief came in early September, when the ECB announced its decision to support the eurozone’s troubled peripheral countries with unlimited purchases of short term sovereign debt. Days later, the US Federal Reserve announced its own much-anticipated stimulus package.
Although financial markets world-wide were buoyed by accommodative monetary policy, risk assets weakened in the fall. Global trade slowed as many European countries fell into recession and growth continued to decelerate in China, where a once-a-decade leadership change compounded uncertainty. In the United States, stocks slid on lackluster corporate earnings reports and market volatility rose during the lead up to the US Presidential election. In the post-election environment, investors grew increasingly concerned over automatic tax increases and spending cuts that had been scheduled to take effect at the beginning of 2013 (known as the “fiscal cliff”). There was widespread fear that the fiscal cliff would push the nation into recession unless politicians could agree upon alternate measures to reduce the deficit before the end of 2012. Worries that bipartisan gridlock would preclude a timely budget deal triggered higher levels of volatility in financial markets around the world in the months leading up to the last day of the year. Ultimately, the United States averted the worst of the fiscal cliff with a last-minute tax deal; however, decisions relating to spending cuts and the debt ceiling continue to weigh on investors’ minds.
Investors shook off the nerve-wracking finale to 2012 and began the New Year with a powerful equity rally. Key indicators signaled broad-based improvements in the world’s major economies, particularly China. In the United States, economic data was mixed, but pointed to a continued recovery. The risk of inflation remained low and the US Federal Reserve showed no signs of curtailing its stimulus programs. Additionally, January saw the return of funds that investors had pulled out of the market in late 2012 amid uncertainty about tax-rate increases ahead of the fiscal cliff deadline. In fixed income markets, rising US Treasuries yields dragged down higher-quality asset classes, while high yield bonds continued to benefit from investor demand for yield in the low-rate environment.
On the whole, riskier asset classes outperformed lower-risk investments for the 6- and 12-month periods ended January 31, 2013. International equities were the strongest performers. US stocks and high yield bonds also generated significant returns. Emerging market equities were particularly volatile, but still posted gains for both the 6- and 12-month periods. US Treasury yields remained low, but experienced increasing volatility in recent months. Rising yields near the end of the period resulted in negative returns for Treasuries and investment-grade bonds for the 6-month period. Tax-exempt municipal bonds, however, benefited from favorable supply-and-demand dynamics. Near-zero short term interest rates continued to keep yields on money market securities near their all-time lows.
While investors continue to face a host of unknowns, we believe new opportunities abound. BlackRock was built to provide the global market insight, breadth of capabilities, unbiased investment advice and deep risk management expertise these times require. We encourage you to visit www.blackrock.com/newworld for more information.
Sincerely,

Rob Kapito
President, BlackRock Advisors, LLC

“Despite a number of headwinds, higher-risk asset classes boasted strong returns as investors sought meaningful yields in the ongoing low-interest-rate environment.”
Rob Kapito
President, BlackRock Advisors, LLC
| | | | | | | | |
| Total Returns as of January 31, 2013 | |
| | | 6-month | | | 12-month | |
US large cap equities
(S&P 500® Index) | | | 9.91 | % | | | 16.78 | % |
US small cap equities
(Russell 2000® Index) | | | 15.51 | | | | 15.47 | |
International equities
(MSCI Europe, Australasia, Far East Index) | | | 18.61 | | | | 17.25 | |
Emerging market equities
(MSCI Emerging Markets Index) | | | 13.11 | | | | 7.64 | |
3-month Treasury bill
(BofA Merrill Lynch
3-Month US Treasury
Bill Index) | | | 0.07 | | | | 0.11 | |
US Treasury securities
(BofA Merrill Lynch
10- Year US Treasury
Index) | | | (2.90 | ) | | | 1.28 | |
US investment grade
bonds (Barclays US
Aggregate Bond Index) | | | (0.29 | ) | | | 2.59 | |
Tax-exempt municipal
bonds (S&P Municipal Bond Index) | | | 2.21 | | | | 5.50 | |
US high yield bonds
(Barclays US Corporate
High Yield 2% Issuer
Capped Index) | | | 7.37 | | | | 13.87 | |
|
| Past performance is no guarantee of future results. Index performance is shown for illustrative purposes only. You cannot invest directly in an index. | |
| | | | | | |
| | | | | | | |
| | THIS PAGE NOT PART OF YOUR FUND REPORT | | | | 3 |
| | |
| Fund Summary as of January 31, 2013 | | BlackRock Commodity Strategies Fund |
BlackRock Commodity Strategies Fund’s (the “Fund”) investment objective is to seek total return.
|
| Portfolio Management Commentary |
How did the Fund perform?
| Ÿ | | For the six-month period ended January 31, 2013, the Fund outperformed its benchmark, the Dow Jones-UBS Commodity Index Total ReturnSM. |
What factors influenced performance?
| Ÿ | | The Fund’s commodity-related equity strategy and commodity-linked derivatives strategy, through the use of commodity-linked notes (“CLN”), both outperformed the benchmark index for the period. The equity strategy was the more significant driver of the Fund’s performance as equities of commodity-related companies outperformed commodity futures returns during the period. The mining and agriculture sectors performed particularly well. Stock selection within mining resulted in notable positive returns for the Fund. In particular, the Fund’s overweight positions in iron ore producers had a positive impact as these stocks benefited from a strong rebound in the price of iron ore during the period. The commodity-linked derivatives strategy outperformed the benchmark index due to the Fund’s positions in deferred-month forwards, which outperformed prompt-month forwards (i.e., contracts priced as of the nearest month of delivery). |
| Ÿ | | There were no detractors from Fund performance relative to the benchmark index during the period. |
Describe recent portfolio activity.
| Ÿ | | During the six-month period, the Fund sought to maintain generally equal weightings between the aggregate equity and derivatives strategies as well as balanced and broad equity exposure across commodity sectors. In the final month of the reporting period, the Dow Jones-UBS Commodity Index Total ReturnSM rebalanced. Accordingly, at the end of January, the Fund rebalanced to reset its strategy and sector allocations. During the rebalance, the Fund increased its target equity sector weightings (relative to the 2012 targets) in agriculture and gold and decreased its weighting in metals and mining. |
| Ÿ | | Also during the period, the Fund maintained a position in cash and cash equivalents, predominantly comprised of US Treasury bills, as collateral against the Fund’s exposure to commodity-linked notes. The Fund’s cash balance did not have a material impact on performance. |
Describe portfolio positioning at period end.
| Ÿ | | At the end of the period, the Fund’s net assets were invested in roughly equal allocations to the commodity-related equity strategy and the commodity-linked derivatives strategy (including collateral held against the commodity-linked note exposure). Aggregating both strategies, the Fund was overweight relative to the benchmark index in energy and metals, and underweight in agriculture and livestock. |
The views expressed reflect the opinions of BlackRock as of the date of this report and are subject to change based on changes in market, economic or other conditions. These views are not intended to be a forecast of future events and are no guarantee of future results.
| | |
| Ten Largest Holdings | | Percent of
Long-Term Investments |
| | | | |
International Bank for Reconstruction & Development
3-month LIBOR, 11/05/13-CLN | | | 6 | % |
Swedish Export Credit Corp. 3-month LIBOR,
4/29/13-CLN | | | 6 | |
Canadian Imperial Bank of Commerce 3-month
LIBOR, 11/04/13-CLN | | | 5 | |
Chevron Corp. | | | 4 | |
Exxon Mobil Corp. | | | 3 | |
JPMorgan Chase Bank, N.A. 3-month LIBOR,
11/04/13-CLN | | | 3 | |
UBS AG 3-month LIBOR, 10/28/13-CLN | | | 3 | |
ETFS All Commodities DJ-UBSCISM | | | 3 | |
BHP Billiton Plc | | | 2 | |
BP Plc | | | 2 | |
| | |
| Portfolio Composition | | Percent of
Long-Term Investments |
| | | | |
Common Stocks | | | 74 | % |
Commodity-Linked Notes | | | 23 | |
Investment Companies | | | 3 | |
| | | | | | |
| | | | | | | |
| 4 | | BLACKROCK FUNDS | | JANUARY 31, 2013 | | |
| | |
| | | BlackRock Commodity Strategies Fund |
|
| Total Return Based on a $10,000 Investment |
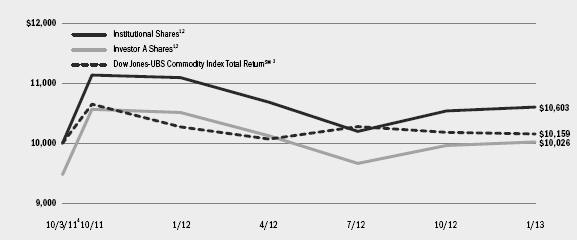
| | 1 | | Assuming maximum sales charges, if any, transaction costs and other operating expenses, including investment advisory fees. Institutional Shares do not have a sales charge. |
| | 2 | | The Fund utilizes two strategies and under normal circumstances expects to invest approximately 50% of its total assets in each strategy; provided, however, that from time to time, Fund management may alter the weightings if it deems it prudent to do so based on market conditions, trends or movements or other similar factors. |
| | 3 | | An unmanaged commodity index composed of futures contracts on 19 physical commodities and assumes that the futures positions are fully collateralized. |
| | 4 | | Commencement of operations. |
|
| Performance Summary for the Period Ended January 31, 2013 |
| | | | | | | | | | | | | | | | | | | | |
| | | | | | Average Annual Total Returns5 | |
| | | | | | 1 Year | | | Since Inception6 | |
| | | 6-Month
Total Returns | | | w/o sales
charge | | | w/ sales
charge | | | w/o sales
charge | | | w/ sales
charge | |
Institutional | | | 3.95 | % | | | (4.42 | )% | | | N/A | | | | 4.51 | % | | | N/A | |
Investor A | | | 3.73 | | | | (4.63 | ) | | | (9.65 | )% | | | 4.31 | | | | 0.19 | % |
Investor C | | | 3.34 | | | | (5.38 | ) | | | (6.33 | ) | | | 3.50 | | | | 3.50 | |
Dow Jones-UBS Commodity Index Total ReturnSM | | | (1.18 | ) | | | (1.13 | ) | | | N/A | | | | 1.20 | | | | N/A | |
| | 5 | | Assuming maximum sales charges, if any. Average annual total returns with and without sales charges reflect reductions for distribution and service fees. See “About Fund Performance” on page 8 for a detailed description of share classes, including any related sales charges and fees. |
| | 6 | | The Fund commenced operations on October 3, 2011. |
N/A—Not applicable as share class and index do not have a sales charge.
Past performance is not indicative of future results.
| | | | | | | | | | | | | | | | | | | | | | | | | | | | |
| | | Actual | | | Hypothetical8 | | | | |
| | | Beginning
Account Value
August 1, 2012 | | | Ending
Account Value
January 31, 2013 | | | Expenses Paid
During the Period7 | | | Beginning
Account Value
August 1, 2012 | | | Ending
Account Value
January 31, 2013 | | | Expenses Paid
During the Period7 | | | Annualized
Expense Ratio | |
Institutional | | | $1,000.00 | | | | $1,039.50 | | | | $6.68 | | | | $1,000.00 | | | | $1,018.65 | | | | $6.61 | | | | 1.30% | |
Investor A | | | $1,000.00 | | | | $1,037.30 | | | | $7.70 | | | | $1,000.00 | | | | $1,017.64 | | | | $7.63 | | | | 1.50% | |
Investor C | | | $1,000.00 | | | | $1,033.40 | | | | $11.53 | | | | $1,000.00 | | | | $1,013.86 | | | | $11.42 | | | | 2.25% | |
| | 7 | | For each class of the Fund, expenses are equal to the annualized expense ratio for the class, multiplied by the average account value over the period, multiplied by 184/ 365 (to reflect the one-half year period shown). |
| | 8 | | Hypothetical 5% annual return before expenses is calculated by pro rating the number of days in the most recent fiscal half year divided by 365. See “Disclosure of Expenses” on page 8 for further information on how expenses were calculated. |
| | | | | | |
| | | | | | | |
| | BLACKROCK FUNDS | | JANUARY 31, 2013 | | 5 |
| | |
| Fund Summary as of January 31, 2013 | | BlackRock Global Long/Short Credit Fund |
BlackRock Global Long/Short Credit Fund’s (the “Fund”) investment objective is to seek absolute total returns over a complete market cycle.
|
| Portfolio Management Commentary |
How did the Fund perform?
| Ÿ | | For the six-month period ended January 31, 2013, the Fund outperformed its benchmark, the BofA Merrill Lynch 3-Month US Treasury Bill Index. |
What factors influenced performance?
| Ÿ | | The Fund’s net long position in credit drove positive results as risk assets performed well amid improving economic data and supportive global monetary policy during the period. Specifically, long positions in US and European high yield debt generated positive returns. Long positions in higher-quality covered bonds and subordinated debt of European financial issuers also had a positive impact. As credit spreads continued to compress, long positions in select US and European non-financial investment grade corporate bonds contributed positively to results. Additionally, the Fund benefited from its participation in the new-issue market in the United States. |
| Ÿ | | As risk assets rallied during the period, the Fund’s hedges against its long credit positions had a negative impact on performance. Short positions in the senior unsecured debt of select Spanish and French financial issuers also detracted modestly from returns. |
| Ÿ | | As part of its investment strategy, the Fund uses derivatives to fully hedge against duration (sensitivity to interest rate movements) and currency risk. During the period, the Fund’s holdings of foreign exchange contracts had a net negative impact on performance. |
Describe recent portfolio activity.
| Ÿ | | During the six-month period, the Fund established long positions in attractive US investment grade credits, mainly in the aviation sector. More specifically, the Fund took long positions in leasing companies and issuers with high-quality aircraft-backed debt. Given the anticipation of US sequestration and spending cuts, the Fund took short positions in select defense issuers. The Fund also took short positions in technology issuers and then closed those positions later in the period. In Europe, the Fund expressed its high-quality bias in financials by holding subordinated debt issues and covered bonds, while shorting the senior unsecured debt of select Spanish and French banks. In non-financial sectors, the Fund continued to utilize the new-issue market to add long positions in various European credits, with a focus on industrial names. The Fund |
also engaged in long/short paired trades to capitalize on credit spread movements between securities within the same industries.
|
| Ÿ | | In US leveraged finance markets, the Fund increased its exposure to bank loans with a focus on issuers with superior credit fundamentals and stable cash flows. Within US high yield, the Fund’s high-quality bias led to a preference for the communications and capital goods sectors as well as consumer-driven names in light of the improved outlook for the US economy. In the higher-beta (i.e., more volatile) sectors, the Fund favored long positions in fundamentally strong issuers. In European high yield markets, the Fund sought attractive issues on a risk/reward basis, with exposures primarily in communications and select consumer cyclical names. |
| Ÿ | | The Fund also utilized long/short paired trades to capitalize on credit spread movements between European sovereigns. In particular, the Fund established a short position in Belgium versus a long position in Germany, as well as a short position in France versus a long position in the Netherlands. Similar to Germany, sovereign debt in the Netherlands is attractive due to the country’s AAA credit rating, strong balance sheet and low ratio of debt-to-gross domestic product. The Fund also took long positions in local governments including Madrid and Valencia given their attractive risk/reward profiles. |
| Ÿ | | The Fund’s cash exposure had no material impact on performance as the Fund expresses long and short positions via the credit default swap market, which does not require a cash outlay like that of traditional cash bonds. |
Describe portfolio positioning at period end.
| Ÿ | | The Fund’s net long credit position at period end was driven primarily by exposure to US bank loans and high yield debt, along with European investment grade credits. Altogether, the Fund was positioned with less exposure to European credit risk versus the United States given a more cautious outlook for Europe. The Fund continued to seek attractive long and short opportunities in global credit markets while maintaining hedges to protect the Fund against near-term risks. |
The views expressed reflect the opinions of BlackRock as of the date of this report and are subject to change based on changes in market, economic or other conditions.
These views are not intended to be a forecast of future events and are no guarantee of future results.
| | | | | | |
| | | | | | | |
| 6 | | BLACKROCK FUNDS | | JANUARY 31, 2013 | | |
| | |
| | | BlackRock Global Long/Short Credit Fund |
|
| Total Return Based on a $10,000 Investment |
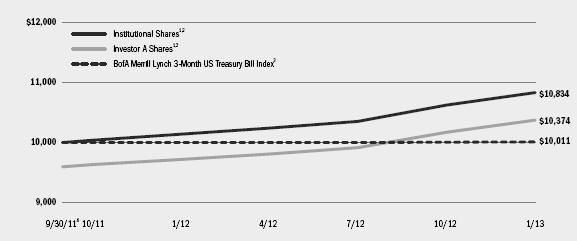
| | 1 | | Assuming maximum sales charges, if any, transaction costs and other operating expenses, including investment advisory fees. Institutional Shares do not have a sales charge. |
| | 2 | | The Fund seeks to provide absolute total returns over a complete market cycle through diversified long and short exposure to the global fixed income markets. |
| | 3 | | An unmanaged index that measures returns of three-month Treasury Bills. |
| | 4 | | Commencement of operations. |
|
| Performance Summary for the Period Ended January 31, 2013 |
| | | | | | | | | | | | | | | | | | | | |
| | | | | | Average Annual Total Returns5 | |
| | | | | | 1 Year | | | Since Inception6 | |
| | | 6-Month
Total Returns | | | w/o sales
charge | | | w/sales
charge | | | w/o sales
charge | | | w/sales
charge | |
Institutional | | | 4.63 | % | | | 6.85 | % | | | N/A | | | | 6.18 | % | | | N/A | |
Investor A | | | 4.63 | | | | 6.72 | | | | 2.47 | % | | | 6.00 | | | | 2.79 | % |
Investor C | | | 4.15 | | | | 5.90 | | | | 4.90 | | | | 5.23 | | | | 5.23 | |
BofA Merrill Lynch 3-Month US Treasury Bill Index | | | 0.07 | | | | 0.11 | | | | N/A | | | | 0.08 | | | | N/A | |
| | 5 | | Assuming maximum sales charges, if any. Average annual total returns with and without sales charges reflect reductions for distribution and service fees. See “About Fund Performance” on page 8 for a detailed description of share classes, including any related sales charges and fees. |
| | 6 | | The Fund commenced operations on September 30, 2011. |
N/A—Not applicable as share class and index do not have a sales charge.
Past performance is not indicative of future results.
| | | | | | | | | | | | | | | | | | | | | | | | | | | | | | | | | | | | |
| | | Actual | | | Hypothetical9 | |
| | | | | | | | | Including
Interest Expense | | | Excluding
Interest Expense | | | | | | Including
Interest Expense | | | Excluding
Interest Expense | |
| | | Beginning
Account Value
August 1, 2012 | | | Ending
Account Value
January 31, 2013 | | | Expenses Paid
During the Period7 | | | Expenses Paid
During the Period8 | | | Beginning
Account Value
August 1, 2012 | | | Ending
Account Value
January 31, 2013 | | | Expenses Paid
During the Period7 | | | Ending Account Value
January 31, 2013 | | | Expenses Paid
During the Period8 | |
Institutional | | | $1,000.00 | | | | $1,046.30 | | | | $7.53 | | | | $6.19 | | | | $1,000.00 | | | | $1,017.85 | | | | $7.43 | | | | $1,019.16 | | | | $6.11 | |
Investor A | | | $1,000.00 | | | | $1,046.30 | | | | $8.56 | | | | $7.22 | | | | $1,000.00 | | | | $1,016.84 | | | | $8.44 | | | | $1,018.15 | | | | $7.12 | |
Investor C | | | $1,000.00 | | | | $1,041.50 | | | | $12.40 | | | | $11.06 | | | | $1,000.00 | | | | $1,013.06 | | | | $12.23 | | | | $1,014.37 | | | | $10.92 | |
| | 7 | | For each class of the Fund, expenses are equal to the annualized expense ratio for the class (1.46% for Institutional, 1.66% for Investor A and 2.41% for Investor C), multiplied by the average account value over the period, multiplied by 184/365 (to reflect the one-half year period shown). |
| | 8 | | For each class of the Fund, expenses are equal to the annualized expense ratio for the class (1.20% for Institutional, 1.40% for Investor A and 2.15% for Investor C), multiplied by the average account value over the period, multiplied by 184/365 (to reflect the one-half year period shown). |
| | 9 | | Hypothetical 5% annual return before expenses is calculated by pro rating the number of days in the most recent fiscal half year divided by 365. |
See “Disclosure of Expenses” on page 8 for further information on how expenses were calculated.
| | | | | | |
| | | | | | | |
| | BLACKROCK FUNDS | | JANUARY 31, 2013 | | 7 |
| Ÿ | | Institutional Shares are not subject to any sales charge. These shares bear no ongoing distribution or service fees and are available only to eligible investors. |
| Ÿ | | Investor A Shares are subject to a maximum initial sales charge (front-end load) of 5.25% for BlackRock Commodity Strategies Fund and 4.00% for BlackRock Global Long/Short Credit Fund. These shares are subject to a service fee of 0.25% per year (but no distribution fee). |
| Ÿ | | Investor C Shares are subject to a 1.00% contingent deferred sales charge (“CDSC”) if redeemed within one year of purchase. In addition, these shares are subject to a distribution fee of 0.75% per year and a service fee of 0.25% per year. |
Performance information reflects past performance and does not guarantee future results. Current performance may be lower or higher than the performance data quoted. Refer to www.blackrock.com/funds to obtain performance data current to the most recent month end. Performance results do not reflect the deduction of taxes that a shareholder
would pay on fund distributions or the redemption of fund shares. Figures shown in each of the performance tables on the previous pages assume reinvestment of all dividends and distributions, if any, at net asset value (“NAV”) on the ex-dividend date. Investment return and principal value of shares will fluctuate so that shares, when redeemed, may be worth more or less than their original cost. Dividends paid to each class of shares will vary because of the different levels of service, distribution and transfer agency fees applicable to each class, which are deducted from the income available to be paid to shareholders.
BlackRock Advisors, LLC (the “Manager”), the Funds’ investment advisor, waived and/or reimbursed a portion of each Fund’s expenses. Without such waiver and/or reimbursement, each Fund’s performance would have been lower. The Manager is under no obligation to waive or reimburse or to continue waiving or reimbursing its fees after the applicable termination date. See Note 3 of the Notes to Financial Statements for additional information on waivers and reimbursements.
Shareholders of the Funds may incur the following charges: (a) transactional expenses, such as sales charges; and (b) operating expenses, including investment advisory fees, service and distribution fees, including 12b-1 fees, and other Fund expenses. The expense examples on the previous pages (which are based on a hypothetical investment of $1,000 invested on August 1, 2012 and held through January 31, 2013) are intended to assist shareholders both in calculating expenses based on an investment in each Fund and in comparing these expenses with similar costs of investing in other mutual funds.
The expense examples provide information about actual account values and actual expenses. In order to estimate the expenses a shareholder paid during the period covered by this report, shareholders can divide their account value by $1,000 and then multiply the result by the number corresponding to their Fund and share class under the headings entitled “Expenses Paid During the Period.”
The expense examples also provide information about hypothetical account values and hypothetical expenses based on a Fund’s actual expense ratio and an assumed rate of return of 5% per year before expenses. In order to assist shareholders in comparing the ongoing expenses of investing in these Funds and other funds, compare the 5% hypothetical examples with the 5% hypothetical examples that appear in other funds’ shareholder reports.
The expenses shown in the expense examples are intended to highlight shareholders’ ongoing costs only and do not reflect any transactional expenses, such as sales charges, if any. Therefore, the hypothetical examples are useful in comparing ongoing expenses only, and will not help shareholders determine the relative total expenses of owning different funds. If these transactional expenses were included, shareholder expenses would have been higher.
| | | | | | |
| | | | | | | |
| 8 | | BLACKROCK FUNDS | | JANUARY 31, 2013 | | |
| | |
| Derivative Financial Instruments | | |
The Funds may invest in various derivative financial instruments, including financial futures contracts, foreign currency exchange contracts, options and swaps, as specified in Note 2 of the Notes to Financial Statements, which may constitute forms of economic leverage. Such derivative financial instruments are used to obtain exposure to a security, index and/or market without owning or taking physical custody of securities or to hedge market, equity, credit, interest rate and/or foreign currency exchange rate risks. Derivative financial instruments involve risks, including the imperfect correlation between the value of a derivative financial instrument and the underlying asset, possible default of the counterparty to the transaction or illiquidity of the derivative financial
instrument. The Funds’ ability to use a derivative financial instrument successfully depends on the investment advisor’s ability to predict pertinent market movements accurately, which cannot be assured. The use of derivative financial instruments may result in losses greater than if they had not been used, may require a Fund to sell or purchase portfolio investments at inopportune times or for distressed values, may limit the amount of appreciation a Fund can realize on an investment, may result in lower dividends paid to shareholders or may cause a Fund to hold an investment that it might otherwise sell. The Funds’ investments in these instruments are discussed in detail in the Notes to Financial Statements.
|
| BlackRock Global Long/Short Credit Fund’s Portfolio Information |
| | | | |
| Geographic Allocation | | Percent of Long Investments | |
United States | | | 42 | % |
United Kingdom | | | 12 | |
Spain | | | 9 | |
Germany | | | 7 | |
Netherlands | | | 6 | |
France | | | 5 | |
Italy | | | 5 | |
Luxembourg | | | 3 | |
Portugal | | | 3 | |
Ireland | | | 2 | |
Bermuda | | | 2 | |
Cayman Islands | | | 1 | |
Canada | | | 1 | |
Cyprus | | | 1 | |
Japan | | | 1 | |
| | | | |
| Geographic Allocation | | Percent of
Short Investments | |
United States | | | 98 | % |
Italy | | | 1 | |
France | | | 1 | |
| | | | |
| Credit Quality Allocation1 | | Percent of Long-Term Investments | |
AAA/Aaa2 | | | 1 | % |
AA/Aa | | | 2 | |
A | | | 10 | |
BBB/Baa | | | 27 | |
BB/Ba | | | 21 | |
B | | | 15 | |
CCC/Caa | | | 4 | |
Not Rated | | | 20 | |
| 1 | | Using the higher of Standard & Poor’s (“S&P’s”) or Moody’s Investors Service ratings. |
| 2 | | Includes US Treasury Obligations which are deemed AAA/Aaa by the investment advisor. |
| | | | | | |
| | | | | | | |
| | BLACKROCK FUNDS | | JANUARY 31, 2013 | | 9 |
| | |
Consolidated Schedule of Investments January 31, 2013 (Unaudited) | | BlackRock Commodity Strategies Fund (Percentages shown are based on Net Assets) |
| | | | | | | | |
| Commodity-Linked Notes | | Par
(000) | | | Value | |
Canadian Imperial Bank of Commerce 3-month LIBOR (Indexed to the Dow Jones-UBS Commodity Index Total ReturnSM 4 Month Forward, multiplied by 3), 11/04/13 | | | USD 14,000 | | | $ | 12,719,000 | |
International Bank for Reconstruction & Development 3-month LIBOR (Indexed to the Dow Jones-UBS Commodity Index Total ReturnSM, multiplied by 3), 11/05/13 | | | 16,000 | | | | 13,960,474 | |
JPMorgan Chase Bank, N.A. 3-month LIBOR (Indexed to the Dow Jones-UBS Commodity Index Total ReturnSM 4 Month Forward, multiplied by 3), 11/04/13 | | | 8,000 | | | | 7,302,400 | |
Swedish Export Credit Corp. 3-month LIBOR (Indexed to the Dow Jones-UBS Commodity Index Total ReturnSM 4 Month Forward, multiplied by 3), 4/29/13 | | | 14,000 | | | | 13,321,143 | |
UBS AG 3-month LIBOR (Indexed to the Dow Jones-UBS Commodity Index Total ReturnSM 4 Month Forward, multiplied by 3), 10/28/13 | | | 8,000 | | | | 7,278,419 | |
Total Commodity-Linked Notes — 14.4% | | | | | | | 54,581,436 | |
| | | | | | | | |
| | |
| | |
| Common Stocks | | Shares | | | | |
Biotechnology — 0.1% | | | | | | | | |
Genus Plc | | | 13,950 | | | | 314,120 | |
Chemicals — 4.1% | | | | | | | | |
Agrinos AS (a) | | | 35,000 | | | | 237,054 | |
Agrium, Inc. | | | 14,850 | | | | 1,685,327 | |
American Vanguard Corp. | | | 7,300 | | | | 247,470 | |
CF Industries Holdings, Inc. | | | 5,850 | | | | 1,340,645 | |
China BlueChemical Ltd., H Shares | | | 70,000 | | | | 50,293 | |
Israel Chemicals Ltd. | | | 14,600 | | | | 193,912 | |
Monsanto Co. | | | 30,075 | | | | 3,048,101 | |
The Mosaic Co. | | | 44,500 | | | | 2,725,625 | |
Nufarm Ltd. | | | 21,034 | | | | 122,311 | |
Potash Corp. of Saskatchewan, Inc. | | | 39,040 | | | | 1,659,200 | |
Sinofert Holdings Ltd. | | | 300,000 | | | | 74,672 | |
Syngenta AG | | | 7,420 | | | | 3,190,881 | |
Uralkali OJSC — GDR | | | 18,600 | | | | 712,380 | |
Yara International ASA | | | 6,300 | | | | 335,969 | |
| | | | | | | | |
| | | | | | | | 15,623,840 | |
Energy Equipment & Services — 4.3% | | | | | | | | |
Cameron International Corp. (a) | | | 21,750 | | | | 1,376,993 | |
Ensco Plc | | | 33,850 | | | | 2,151,845 | |
Halliburton Co. | | | 107,200 | | | | 4,360,896 | |
National Oilwell Varco, Inc. | | | 30,750 | | | | 2,279,805 | |
Rowan Cos. Plc | | | 47,500 | | | | 1,637,800 | |
Schlumberger Ltd. | | | 58,250 | | | | 4,546,413 | |
| | | | | | | | |
| | | | | | | | 16,353,752 | |
| | | | | | | | |
| Common Stocks | | Shares | | | Value | |
Food & Staples Retailing — 0.1% | | | | | | | | |
The Andersons, Inc. | | | 7,000 | | | $ | 330,050 | |
Olam International Ltd. | | | 31,000 | | | | 40,540 | |
| | | | | | | | |
| | | | | | | | 370,590 | |
Food Products — 2.3% | | | | | | | | |
Adecoagro SA (a) | | | 63,750 | | | | 541,875 | |
Archer-Daniels-Midland Co. | | | 35,700 | | | | 1,018,521 | |
Astra Agro Lestari Tbk PT | | | 75,000 | | | | 145,183 | |
BRF-Brasil Foods SA — ADR | | | 26,500 | | | | 588,300 | |
Bunge Ltd. | | | 26,045 | | | | 2,074,745 | |
China Agri-Industries Holdings Ltd. | | | 59,800 | | | | 36,538 | |
First Resources Ltd. | | | 153,000 | | | | 241,482 | |
Golden Agri-Resources Ltd. | | | 700,000 | | | | 359,689 | |
GrainCorp Ltd. | | | 15,764 | | | | 198,573 | |
Indofood Agri Resources Ltd. | | | 186,000 | | | | 196,280 | |
Ingredion, Inc. | | | 11,700 | | | | 773,019 | |
Kuala Lumpur Kepong Bhd | | | 34,500 | | | | 240,956 | |
New Britain Palm Oil Ltd. | | | 30,200 | | | | 268,702 | |
Origin Enterprises Plc (a) | | | 13,424 | | | | 79,834 | |
Perusahaan Perkebunan London Sumatra Indonesia Tbk PT | | | 690,000 | | | | 156,150 | |
Smithfield Foods, Inc. (a) | | | 28,100 | | | | 655,011 | |
Tate & Lyle Plc | | | 18,300 | | | | 235,819 | |
Tyson Foods, Inc., Class A | | | 19,400 | | | | 429,128 | |
Wilmar International Ltd. | | | 174,000 | | | | 536,603 | |
| | | | | | | | |
| | | | | | | | 8,776,408 | |
Machinery — 1.2% | | | | | | | | |
AGCO Corp. | | | 18,800 | | | | 996,400 | |
CNH Global NV | | | 21,100 | | | | 1,007,314 | |
Deere & Co. | | | 25,140 | | | | 2,364,668 | |
Kubota Corp. | | | 28,000 | | | | 319,817 | |
| | | | | | | | |
| | | | | | | | 4,688,199 | |
Metals & Mining — 16.1% | | | | | | | | |
African Minerals Ltd. (a) | | | 36,430 | | | | 176,521 | |
African Rainbow Minerals Ltd. | | | 17,357 | | | | 390,846 | |
Agnico-Eagle Mines Ltd. | | | 17,349 | | | | 793,698 | |
Alamos Gold, Inc. | | | 36,201 | | | | 556,408 | |
Anglo American Plc | | | 41,773 | | | | 1,249,484 | |
AngloGold Ashanti Ltd. | | | 12,828 | | | | 358,579 | |
Antofagasta Plc | | | 105,356 | | | | 1,910,383 | |
Aquarius Platinum Ltd. | | | 35,755 | | | | 35,749 | |
Atlas Iron Ltd. | | | 229,137 | | | | 355,167 | |
B2Gold Corp. (a) | | | 52,223 | | | | 201,059 | |
Banro Corp. (a) | | | 89,124 | | | | 218,923 | |
Barrick Gold Corp. | | | 60,896 | | | | 1,939,099 | |
Beadell Resources Ltd. (a) | | | 277,609 | | | | 286,625 | |
BHP Billiton Plc | | | 164,427 | | | | 5,638,487 | |
Centerra Gold, Inc. | | | 29,000 | | | | 263,425 | |
Cia de Minas Buenaventura SA — ADR | | | 5,880 | | | | 173,989 | |
Detour Gold Corp. (a) | | | 15,000 | | | | 317,024 | |
Discovery Metals Ltd. (a) | | | 408,213 | | | | 458,667 | |
Eldorado Gold Corp. | | | 96,416 | | | | 1,077,841 | |
| | | | |
| To simplify the listings of portfolio holdings in the Schedules of Investments, the names and descriptions of many of the securities have been abbreviated according to the following list: | | ADR American Depositary Receipts CAD Canadian Dollar CHF Swiss Franc DIP Debtor In Possession ETF Exchange Traded Fund EUR Euro FKA Formerly Known As | | GBP British Pound GDR Global Depositary Receipts LIBOR London Interbank Offered Rate SEK Swedish Krona SPDR Standard & Poor’s Depositary Receipts USD US Dollar |
See Notes to Financial Statements.
| | | | | | |
| | | | | | | |
| 10 | | BLACKROCK FUNDS | | JANUARY 31, 2013 | | |
| | |
Consolidated Schedule of Investments (continued) | | BlackRock Commodity Strategies Fund (Percentages shown are based on Net Assets) |
| | | | | | | | |
| Common Stocks | | Shares | | | Value | |
Metals & Mining (concluded) | | | | | | | | |
Evolution Mining Ltd. (a) | | | 59,876 | | | $ | 96,909 | |
First Quantum Minerals Ltd. | | | 103,063 | | | | 2,078,000 | |
Fortescue Metals Group Ltd. | | | 389,858 | | | | 1,912,282 | |
Franco-Nevada Corp. | | | 13,947 | | | | 745,453 | |
Freeport-McMoRan Copper & Gold, Inc. | | | 46,000 | | | | 1,621,500 | |
Fresnillo Plc | | | 62,555 | | | | 1,644,416 | |
Glencore International Plc | | | 306,384 | | | | 1,912,559 | |
Goldcorp, Inc. | | | 68,691 | | | | 2,419,405 | |
Harmony Gold Mining Co. Ltd. | | | 66,230 | | | | 426,806 | |
IAMGOLD Corp. | | | 35,940 | | | | 295,116 | |
Iluka Resources Ltd. | | | 56,667 | | | | 574,402 | |
Impala Platinum Holdings Ltd. | | | 52,571 | | | | 952,853 | |
Industrias Penoles SAB de CV | | | 13,793 | | | | 676,242 | |
Kenmare Resources Plc (a) | | | 432,416 | | | | 228,277 | |
Kinross Gold Corp. | | | 63,823 | | | | 523,433 | |
Kumba Iron Ore Ltd. | | | 15,603 | | | | 1,050,724 | |
London Mining Plc (a) | | | 157,625 | | | | 416,297 | |
Metminco Ltd. (a) | | | 2,726,370 | | | | 168,636 | |
Mineral Deposits Ltd. (a) | | | 78,012 | | | | 332,861 | |
New Gold, Inc. (a) | | | 193,152 | | | | 1,876,522 | |
Newcrest Mining Ltd. | | | 67,854 | | | | 1,662,013 | |
Newmont Mining Corp. | | | 17,722 | | | | 761,337 | |
Osisko Mining Corp. (a) | | | 18,667 | | | | 129,325 | |
PanAust Ltd. | | | 435,792 | | | | 1,345,545 | |
Petropavlovsk Plc | | | 4,540 | | | | 25,030 | |
Polymetal International Plc | | | 16,000 | | | | 271,407 | |
Randgold Resources Ltd. — ADR | | | 20,029 | | | | 1,885,931 | |
Rio Tinto Plc | | | 83,753 | | | | 4,731,543 | |
Romarco Minerals, Inc. (a) | | | 200,000 | | | | 178,464 | |
SEMAFO, Inc. | | | 71,759 | | | | 200,729 | |
Silver Lake Resources Ltd. (a) | | | 173,919 | | | | 463,369 | |
Silver Wheaton Corp. | | | 32,500 | | | | 1,131,016 | |
Sociedad Minera Cerro Verde SAA | | | 27,747 | | | | 1,054,386 | |
Tahoe Resources, Inc. (a) | | | 16,500 | | | | 266,177 | |
Teck Resources Ltd., Class B | | | 71,792 | | | | 2,616,442 | |
Vale SA — ADR | | | 162,424 | | | | 3,126,662 | |
Vedanta Resources Plc | | | 23,000 | | | | 439,221 | |
Volcan Cia Minera SAA, Class B | | | 405,373 | | | | 417,215 | |
Xstrata Plc | | | 126,821 | | | | 2,375,070 | |
Yamana Gold, Inc. | | | 71,965 | | | | 1,176,087 | |
Zhaojin Mining Industry Co. Ltd., H Shares | | | 86,500 | | | | 130,178 | |
| | | | | | | | |
| | | | | | | | 60,741,814 | |
Oil, Gas & Consumable Fuels — 17.9% | | | | | | | | |
Alpha Natural Resources, Inc. (a) | | | 17,640 | | | | 156,290 | |
Anadarko Petroleum Corp. | | | 44,213 | | | | 3,537,924 | |
BG Group Plc | | | 193,600 | | | | 3,436,175 | |
BP Plc | | | 695,500 | | | | 5,148,427 | |
Chevron Corp. | | | 76,850 | | | | 8,849,277 | |
ConocoPhillips | | | 56,250 | | | | 3,262,500 | |
Cosan Ltd., Class A | | | 17,300 | | | | 340,291 | |
Devon Energy Corp. | | | 33,200 | | | | 1,898,708 | |
Enbridge, Inc. | | | 28,000 | | | | 1,231,001 | |
ENI SpA | | | 109,300 | | | | 2,730,029 | |
EOG Resources, Inc. | | | 27,600 | | | | 3,449,448 | |
EQT Corp. | | | 20,300 | | | | 1,206,023 | |
Exxon Mobil Corp. | | | 89,632 | | | | 8,064,191 | |
Hess Corp. | | | 55,450 | | | | 3,724,022 | |
Hyperdynamics Corp. (a) | | | 69,000 | | | | 35,397 | |
Nexen, Inc. | | | 47,200 | | | | 1,262,579 | |
Noble Energy, Inc. | | | 23,800 | | | | 2,565,402 | |
| | | | | | | | |
| Common Stocks | | Shares | | | Value | |
Oil, Gas & Consumable Fuels (concluded) | | | | | | | | |
Oil Search Ltd. | | | 158,250 | | | $ | 1,208,454 | |
Peabody Energy Corp. | | | 9,404 | | | | 236,511 | |
Phillips 66 | | | 26,169 | | | | 1,585,056 | |
Range Resources Corp. | | | 28,050 | | | | 1,884,119 | |
Royal Dutch Shell Plc, B Shares | | | 112,600 | | | | 4,092,645 | |
Scorpio Tankers, Inc. | | | 84,000 | | | | 708,120 | |
Sterling Resources Ltd. (a) | | | 99,517 | | | | 64,855 | |
Suncor Energy, Inc. | | | 61,500 | | | | 2,090,285 | |
TransCanada Corp. | | | 61,000 | | | | 2,887,317 | |
Valero Energy Corp. | | | 36,000 | | | | 1,574,280 | |
Whitehaven Coal Ltd. | | | 122,589 | | | | 420,572 | |
| | | | | | | | |
| | | | | | | | 67,649,898 | |
Total Common Stocks — 46.1% | | | | | | | 174,518,621 | |
| | | | | | | | |
Investment Companies | | | | | | | | |
ELEMENTSSM Linked to the Rogers International Commodity Index — Total Return | | | 97,000 | | | | 1,767,090 | |
ETFS All Commodities DJ-UBSCISM | | | 467,000 | | | | 5,152,950 | |
Total Investment Companies — 1.9% | | | | 6,920,040 | |
Total Long-Term Investments
(Cost — $236,666,037) — 62.4% | | | | 236,020,097 | |
| | | | | | | | |
| | | | | | | | | |
Short-Term Securities | | | | | | | | |
Money Market Funds — 27.7% | | | | | | | | |
BlackRock Liquidity Funds, TempFund, Institutional Class, 0.10% (b)(c) | | | 104,752,052 | | | | 104,752,052 | |
| | |
| | | Par (000) | | | | |
U.S. Treasury Bills — 31.7% | | | | | | | | |
0.09%, 2/28/13 (d) | | | USD 9,000 | | | | 8,999,967 | |
0.07%, 4/04/13 (d) | | | 19,000 | | | | 18,998,195 | |
0.08%, 5/23/13 (d) | | | 92,000 | | | | 91,977,276 | |
| | | | | | | | |
| | | | | | | | 119,975,438 | |
Total Short-Term Securities (Cost — $224,728,006) — 59.4% | | | | 224,727,490 | |
| Total Investments (Cost — $461,394,043) — 121.8% | | | | 460,747,587 | |
| Liabilities in Excess of Other Assets — (21.8)% | | | | (82,316,336 | ) |
| | | | | | | | |
| Net Assets — 100.0% | | | | | | $ | 378,431,251 | |
| | | | | | | | |
See Notes to Financial Statements.
| | | | | | |
| | | | | | | |
| | BLACKROCK FUNDS | | JANUARY 31, 2013 | | 11 |
| | |
| Consolidated Schedule of Investments (continued) | | BlackRock Commodity Strategies Fund |
|
| Notes to Consolidated Schedule of Investments |
| (a) | | Non-income producing security. |
| (b) | | Investments in issuers considered to be an affiliate of the Fund during the six months ended January 31, 2013, for purposes of Section 2(a)(3) of the Investment Company Act of 1940, as amended, were as follows: |
| | | | | | | | | | | | | | | | | | | | |
| Affiliate | | Shares Held at
July 31, 2012 | | | Net Activity | | | Shares Held at
January 31, 2013 | | | Income | | | Realized
Gain | |
BlackRock Liquidity Funds, TempFund, Institutional Class | | | 1,457,853 | | | | 103,294,199 | | | | 104,752,052 | | | $ | 8,721 | | | $ | 105 | |
| (c) | | Represents the current yield as of report date. |
| (d) | | Rate shown reflects the discount rate at the time of purchase. |
| Ÿ | | For Fund compliance purposes, the Fund’s industry classifications refer to any one or more of the industry sub-classifications used by one or more widely recognized market indexes or ratings group indexes and/or as defined by Fund management. These definitions may not apply for purposes of this report, which may combine such industry sub-classifications for reporting ease. |
| Ÿ | | Foreign currency exchange contracts as of January 31, 2013 were as follows: |
| | | | | | | | | | | | | | | | | | | | |
Currency Purchased | | | Currency Sold | | | Counterparty | | Settlement
Date | | | Unrealized
Appreciation
(Depreciation) | |
| GBP | | | 127,378 | | | USD | | | 200,684 | | | UBS AG | | | 2/01/13 | | | $ | 1,336 | |
| USD | | | 1,119,647 | | | CAD | | | 1,122,138 | | | Citigroup, Inc. | | | 2/01/13 | | | | (5,416 | ) |
| Total | | | | | | | | | | | | | | | | | | $ | (4,080 | ) |
| | | | | | | | | | | | | | | | | | | | |
| Ÿ | | Fair Value Measurements — Various inputs are used in determining the fair value of investments and derivative financial instruments. These inputs to valuation techniques are categorized into a disclosure hierarchy consisting of three broad levels for financial statement purposes as follows: |
| Ÿ | | Level 1 — unadjusted price quotations in active markets/exchanges for identical assets and liabilities that the Fund has the ability to access |
| Ÿ | | Level 2 — other observable inputs (including, but not limited to, quoted prices for similar assets or liabilities in markets that are active, quoted prices for identical or similar assets or liabilities in markets that are not active, inputs other than quoted prices that are observable for the assets or liabilities (such as interest rates, yield curves, volatilities, prepayment speeds, loss severities, credit risks and default rates) or other market–corroborated inputs) |
| Ÿ | | Level 3 — unobservable inputs based on the best information available in the circumstances, to the extent observable inputs are not available (including the Fund’s own assumptions used in determining the fair value of investments and derivative financial instruments) |
The hierarchy gives the highest priority to unadjusted quoted prices in active markets for identical assets or liabilities (Level 1 measurements) and the lowest priority to unobservable inputs (Level 3 measurements). Accordingly, the degree of judgment exercised in determining fair value is greatest for instruments categorized in Level 3. The inputs used to measure fair value may fall into different levels of the fair value hierarchy. In such cases, for disclosure purposes, the level in the fair value hierarchy within which the fair value measurement falls in its entirety is determined based on the lowest level input that is significant to the fair value measurement in its entirety.
Changes in valuation techniques may result in transfers into or out of an assigned level within the disclosure hierarchy. In accordance with the Fund’s policy, transfers between different levels of the fair value disclosure hierarchy are deemed to have occurred as of the beginning of the reporting period. The categorization of a value determined for investments and derivative financial instruments is based on the pricing transparency of the investment and derivative financial instrument and is not necessarily an indication of the risks associated with investing in those securities. For information about the Fund’s policy regarding valuation of investments and derivative financial instruments and other significant accounting policies, please refer to Note 1 of the Notes to Financial Statements.
| | | | | | |
See Notes to Financial Statements. | | | | |
| | | | | | | |
| 12 | | BLACKROCK FUNDS | | JANUARY 31, 2013 | | |
| | |
| Consolidated Schedule of Investments (continued) | | BlackRock Commodity Strategies Fund |
The following tables summarize the Fund’s investments and derivative financial instruments categorized in the disclosure hierarchy as of January 31, 2013:
| | | | | | | | | | | | | | | | |
| | | Level 1 | | | Level 2 | | | Level 3 | | | Total | |
Assets: | | | | | | | | | | | | | | | | |
| Investments: | | | | | | | | | | | | | | | | |
Long-Term Investments: | | | | | | | | | | | | | | | | |
Commodity-Linked Notes | | | — | | | | — | | | $ | 54,581,436 | | | $ | 54,581,436 | |
Common Stocks: | | | | | | | | | | | | | | | | |
Biotechnology | | | — | | | $ | 314,120 | | | | — | | | | 314,120 | |
Chemicals | | $ | 11,655,802 | | | | 3,968,038 | | | | — | | | | 15,623,840 | |
Energy Equipment & Services | | | 16,353,752 | | | | — | | | | — | | | | 16,353,752 | |
Food & Staples Retailing | | | 330,050 | | | | 40,540 | | | | — | | | | 370,590 | |
Food Products | | | 6,670,091 | | | | 2,106,317 | | | | — | | | | 8,776,408 | |
Machinery | | | 4,368,382 | | | | 319,817 | | | | — | | | | 4,688,199 | |
Metals & Mining | | | 28,889,544 | | | | 31,852,270 | | | | — | | | | 60,741,814 | |
Oil, Gas & Consumable Fuels | | | 50,613,596 | | | | 17,036,302 | | | | — | | | | 67,649,898 | |
Investment Companies | | | 6,920,040 | | | | — | | | | — | | | | 6,920,040 | |
Short-Term Securities: | | | | | | | | | | | | | | | | |
Money Market Funds | | | 104,752,052 | | | | — | | | | — | | | | 104,752,052 | |
U.S. Treasury Bills | | | — | | | | 119,975,438 | | | | — | | | | 119,975,438 | |
Total | | $ | 230,553,309 | | | $ | 175,612,842 | | | $ | 54,581,436 | | | $ | 460,747,587 | |
| | | | |
| | | | | | | | | | | | | | | | |
| | | Level 1 | | | Level 2 | | | Level 3 | | | Total | |
| Derivative Financial Instruments1 | | | | | | | | | | | | | | | | |
Assets: | | | | | | | | | | | | | | | | |
Foreign currency exchange contracts | | $ | 1,336 | | | | — | | | | — | | | $ | 1,336 | |
Liabilities: | | | | | | | | | | | | | | | | |
Foreign currency exchange contracts | | | (5,416 | ) | | | — | | | | — | | | | (5,416 | ) |
Total | | $ | (4,080 | ) | | | — | | | | — | | | $ | (4,080 | ) |
| | | | |
1 Derivative financial instruments are foreign currency exchange contracts which are valued at the unrealized appreciation/depreciation on the instrument. | |
Certain of the Fund’s assets are held at carrying amount, which approximates fair value for financial statement purposes. As of January 31, 2013, such assets and liabilities are categorized within the disclosure hierarchy as follows: | |
| | | Level 1 | | | Level 2 | | | Level 3 | | | Total | |
Assets: | | | | | | | | | | | | | | | | |
Foreign currency at value | | $ | 16,984 | | | | — | | | | — | | | $ | 16,984 | |
Liabilities: | | | | | | | | | | | | | | | | |
Bank overdraft | | | — | | | $ | (350,854 | ) | | | — | | | | (350,854 | ) |
Total | | $ | 16,984 | | | $ | (350,854 | ) | | | — | | | $ | (333,870 | ) |
| | | | |
There were no transfers between Level 1 and Level 2 during the six months ended January 31, 2013.
Certain of the Fund’s investments are categorized as Level 3 were valued utilizing transaction prices or third party pricing information without adjustment. Such valuations are based on unobservable inputs. A significant change in third party information inputs could result in a significantly lower or higher value in such Level 3 investments.
| | | | | | |
See Notes to Financial Statements. | | | | |
| | | | | | | |
| | BLACKROCK FUNDS | | JANUARY 31, 2013 | | 13 |
| | |
| Consolidated Schedule of Investments (concluded) | | BlackRock Commodity Strategies Fund |
A reconciliation of Level 3 investments is presented when the Fund had a significant amount of Level 3 investments at the beginning and/or end of the period in relation to net assets. The following table is a reconciliation of Level 3 investments for which significant unobservable inputs were used in determining fair value:
| | | | |
| | | Commodity-Linked
Notes | |
| Assets: | |
Opening Balance, as of July 31, 2012 | | | $13,009,726 | |
Transfers into Level 32 | | | — | |
Transfers out of Level 32 | | | — | |
Accrued discounts/premiums | | | — | |
Net realized gain (loss) | | | — | |
Net change in unrealized appreciation/depreciation3 | | | (4,428,290 | ) |
Purchases | | | 46,000,000 | |
Sales | | | — | |
Closing Balance, as of January 31, 2013 | | | $54,581,436 | |
| 2 | | Transfers into and transfers out of Level 3 represent the values as of the beginning of the reporting period. |
| 3 | | Included in the related net change in unrealized appreciation/depreciation in the Statement of Operations. The change in unrealized appreciation/depreciation on investments still held as of January 31, 2013 was $(4,428,290). |
| | | | | | |
See Notes to Financial Statements. | | | | |
| | | | | | | |
| 14 | | BLACKROCK FUNDS | | JANUARY 31, 2013 | | |
| | |
Schedule of Investments January 31, 2013 (Unaudited) | | BlackRock Global Long/Short Credit Fund (Percentages shown are based on Net Assets) |
| | | | | | | | |
| Corporate Bonds | | Par (000) | | | Value | |
Belgium — 0.1% | | | | | | | | |
Ontex IV SA, 9.00%, 4/15/19 | | EUR | 350 | | | $ | 484,732 | |
Bermuda — 1.3% | | | | | | | | |
Aircastle Ltd.: | | | | | | | | |
6.25%, 12/01/19 | | USD | 2,455 | | | | 2,651,400 | |
7.63%, 4/15/20 | | | 1,000 | | | | 1,147,500 | |
Digicel Group Ltd., 8.25%, 9/30/20 (a) | | | 679 | | | | 757,085 | |
Seadrill Ltd., 5.63%, 9/15/17 (a) | | | 2,950 | | | | 2,986,875 | |
| | | | | | | | |
| | | | | | | | 7,542,860 | |
Brazil — 0.1% | | | | | | | | |
OGX Austria GmbH, 8.38%, 4/01/22 (a) | | | 500 | | | | 448,750 | |
Canada — 0.4% | | | | | | | | |
Bombardier, Inc., 4.25%, 1/15/16 (a) | | | 490 | | | | 504,700 | |
Methanex Corp., 3.25%, 12/15/19 | | | 2,000 | | | | 2,010,732 | |
| | | | | | | | |
| | | | | | | | 2,515,432 | |
Cayman Islands — 0.8% | | | | | | | | |
Affinity Water Programme Finance Ltd.,
4.50%, 3/31/36 | | GBP | 955 | | | | 1,522,711 | |
MCE Finance Ltd., 5.00%, 2/15/21 (a) | | USD | 454 | | | | 454,000 | |
Punch Taverns Finance B Ltd: | | | | | | | | |
Series A6, 5.94%, 12/30/24 | | GBP | 83 | | | | 123,739 | |
Series A7, 4.77%, 6/30/33 | | | 630 | | | | 924,171 | |
Transocean, Inc.: | | | | | | | | |
2.50%, 10/15/17 | | USD | 170 | | | | 170,580 | |
6.50%, 11/15/20 | | | 300 | | | | 350,668 | |
6.38%, 12/15/21 | | | 850 | | | | 1,000,364 | |
| | | | | | | | |
| | | | | | | | 4,546,233 | |
Finland — 0.3% | | | | | | | | |
Nokia Oyj, 4.25%, 10/26/17 (b) | | EUR | 800 | | | | 1,466,958 | |
France — 3.6% | | | | | | | | |
Accor SA, 2.88%, 6/19/17 | | | 300 | | | | 414,502 | |
Autoroutes Du Sud de la France SA: | | | | | | | | |
4.13%, 4/13/20 | | | 1,400 | | | | 2,092,756 | |
2.88%, 1/18/23 | | | 1,900 | | | | 2,547,562 | |
Banque Federative du Credit Mutuel SA,
1.63%, 1/11/18 | | | 2,700 | | | | 3,601,442 | |
Electricite de France SA: | | | | | | | | |
2.75%, 3/10/23 | | | 1,300 | | | | 1,741,300 | |
5.25%, 12/29/49 (a)(c) | | USD | 7,800 | | | | 7,614,430 | |
Eutelsat SA, 3.13%, 10/10/22 | | EUR | 1,100 | | | | 1,502,443 | |
La Financiere Atalian SA, 7.25%, 1/15/20 | | | 1,230 | | | | 1,665,909 | |
| | | | | | | | |
| | | | | | | | 21,180,344 | |
Germany — 2.0% | | | | | | | | |
Bayerische Landesbank, 4.50%, 2/07/19 (c) | | | 2,650 | | | | 3,130,749 | |
Deutsche Bank AG, 2.38%, 1/11/23 | | | 2,400 | | | | 3,152,988 | |
Hella KGaA Hueck & Co., 2.38%, 1/24/20 | | | 1,540 | | | | 2,066,129 | |
HSH Nordbank AG: | | | | | | | | |
1.03%, 2/14/17 (c) | | | 70 | | | | 70,338 | |
1.15%, 2/14/17 (c) | | | 480 | | | | 482,287 | |
SAP AG, 2.13%, 11/13/19 | | | 970 | | | | 1,304,577 | |
Techem Energy Metering Service GmbH & Co. KG, 7.88%, 10/01/20 | | | 452 | | | | 658,217 | |
Techem GmbH: | | | | | | | | |
6.13%, 10/01/19 | | | 301 | | | | 433,217 | |
6.13%, 10/01/19 (a) | | | 169 | | | | 243,235 | |
| | | | | | | | |
| | | | | | | | 11,541,737 | |
| | | | | | | | |
| Corporate Bonds | | Par (000) | | | Value | |
Guernsey — 0.3% | | | | | | | | |
Doric Nimrod Air Finance Alpha Ltd.
Pass-Through Trust, Series 2012-1,
Class A, 5.13%, 11/30/24 (a) | | USD | 1,500 | | | $ | 1,612,500 | |
Ireland — 1.4% | | | | | | | | |
AIB Mortgage Bank, 2.63%, 7/28/17 | | EUR | 1,390 | | | | 1,879,404 | |
Ardagh Packaging Finance Plc/Ardagh MP Holdings USA, Inc.: | | | | | | | | |
7.38%, 10/15/17 | | | 300 | | | | 435,851 | |
7.00%, 11/15/20 (a) | | USD | 489 | | | | 492,668 | |
4.88%, 11/15/22 (a) | | | 200 | | | | 199,000 | |
Depfa Bank Plc, 0.95%, 12/15/15 (c) | | EUR | 3,130 | | | | 3,430,378 | |
Nara Cable Funding Ltd., 8.88%, 12/01/18 | | | 535 | | | | 744,940 | |
Porsche International Financing Plc,
3.88%, 2/01/16 | | | 594 | | | | 855,596 | |
| | | | | | | | |
| | | | | | | | 8,037,837 | |
Italy — 1.8% | | | | | | | | |
Buzzi Unicem SpA, 6.25%, 9/28/18 | | | 1,948 | | | | 2,844,939 | |
Cerved Technologies SpA: | | | | | | | | |
6.38%, 1/15/20 | | | 691 | | | | 931,197 | |
8.00%, 1/15/21 | | | 710 | | | | 956,802 | |
Davide Campari-Milano SpA, 4.50%, 10/25/19 | | | 484 | | | | 687,191 | |
Intesa Sanpaolo SpA, 3.88%, 1/16/18 | | USD | 1,690 | | | | 1,661,071 | |
Lottomatica Group SpA, 3.50%, 3/05/20 | | EUR | 1,000 | | | | 1,358,837 | |
Snam SpA, 3.88%, 3/19/18 | | | 1,419 | | | | 1,995,536 | |
| | | | | | | | |
| | | | | | | | 10,435,573 | |
Japan — 0.3% | | | | | | | | |
Nippon Life Insurance Co.,
5.00%, 10/18/42 (a)(c) | | USD | 2,000 | | | | 2,039,782 | |
Luxembourg — 1.6% | | | | | | | | |
Cirsa Funding Luxembourg SA, 8.75%, 5/15/18 | | EUR | 4,370 | | | | 5,874,214 | |
GCL Holdings SCA, 9.38%, 4/15/18 | | | 1,550 | | | | 2,251,898 | |
Intelsat Jackson Holdings SA,
7.25%, 10/15/20 (a) | | USD | 500 | | | | 535,000 | |
Schmolz + Bickenbach Luxembourg SA,
9.88%, 5/15/19 | | EUR | 391 | | | | 477,807 | |
Trinseo Materials Operating SCA/Trinseo Materials Finance, Inc., 8.75%, 2/01/19 (a) | | USD | 349 | | | | 345,510 | |
| | | | | | | | |
| | | | | | | | 9,484,429 | |
Netherlands — 1.7% | | | | | | | | |
Allianz Finance II BV, 5.75%, 7/08/41 (c) | | EUR | 500 | | | | 736,982 | |
Cooperatieve Centrale Raiffeisen- Boerenleenbank BA, 3.95%, 11/09/22 | | USD | 2,860 | | | | 2,861,012 | |
Enel Finance International NV, 4.88%, 4/17/23 | | EUR | 1,196 | | | | 1,642,513 | |
ING Bank NV: | | | | | | | | |
0.99%, 5/23/16 (c) | | USD | 150 | | | | 141,600 | |
1.13%, 11/21/16 (c) | | | 300 | | | | 279,300 | |
1.01%, 7/03/17 (c) | | | 230 | | | | 212,750 | |
IVG Finance BV, 1.75%, 3/29/17 (b) | | EUR | 200 | | | | 248,856 | |
LyondellBasell Industries NV, 5.75%, 4/15/24 | | USD | 660 | | | | 763,950 | |
NXP BV/NXP Funding LLC, 5.75%, 2/15/21 (a) | | | 1,540 | | | | 1,540,000 | |
Siemens Financieringsmaatschappij NV,
2.75%, 9/10/25 | | GBP | 1,000 | | | | 1,492,752 | |
| | | | | | | | |
| | | | | | | | 9,919,715 | |
See Notes to Financial Statements.
| | | | | | |
| | | | | | | |
| | BLACKROCK FUNDS | | JANUARY 31, 2013 | | 15 |
| | |
Schedule of Investments (continued) | | BlackRock Global Long/Short Credit Fund (Percentages shown are based on Net Assets) |
| | | | | | | | |
| Corporate Bonds | | Par (000) | | | Value | |
Portugal — 0.6% | | | | | | | | |
Banco Espirito Santo SA, 4.75%, 1/15/18 | | EUR | 1,000 | | | $ | 1,342,986 | |
Caixa Geral de Depositos SA, 5.63%, 12/04/15 | | | 1,600 | | | | 2,256,758 | |
| | | | | | | | |
| | | | | | | | 3,599,744 | |
Spain — 2.4% | | | | | | | | |
AyT Cedulas Cajas Global: | | | | | | | | |
4.00%, 3/21/17 | | | 1,400 | | | | 1,850,491 | |
3.75%, 12/14/22 | | | 900 | | | | 1,020,478 | |
4.75%, 5/25/27 | | | 800 | | | | 931,310 | |
AyT Cedulas Cajas IX Fondo de Titulizacion,
3.75%, 3/31/15 | | | 2,000 | | | | 2,706,709 | |
AyT Cedulas Cajas VIII Fondo de Titulizacion de Activos, 4.25%, 11/18/19 | | | 100 | | | | 126,302 | |
AyT Cedulas Cajas X Fondo de Titulizacion: | | | | | | | | |
0.26%, 6/30/15 (c) | | | 1,100 | | | | 1,370,974 | |
3.75%, 6/30/25 | | | 1,400 | | | | 1,498,524 | |
Banco Santander SA, 3.25%, 2/17/15 | | | 200 | | | | 275,713 | |
Bankinter SA, 3.88%, 10/30/15 | | | 1,050 | | | | 1,462,179 | |
Cedulas TDA 6 Fondo de Titulizacion de Activos: | | | | | | | | |
3.88%, 5/23/25 | | | 400 | | | | 431,941 | |
4.25%, 4/10/31 | | | 400 | | | | 401,387 | |
Kutxabank SA, 3.00%, 2/01/17 | | | 1,500 | | | | 2,023,999 | |
| | | | | | | | |
| | | | | | | | 14,100,007 | |
Sweden — 0.1% | | | | | | | | |
Scandinavian Airlines System Denmark-Norway- Sweden: | | | | | | | | |
9.65%, 6/16/14 | | | 500 | | | | 678,977 | |
10.50%, 6/16/14 | | SEK | 1,000 | | | | 154,533 | |
| | | | | | | | |
| | | | | | | | 833,510 | |
Switzerland — 0.2% | | | | | | | | |
Dufry Finance SCA, 5.50%, 10/15/20 (a) | | USD | 1,153 | | | | 1,204,885 | |
United Kingdom — 7.2% | | | | | | | | |
Abbey National Treasury Services Plc,
1.75%, 1/15/18 | | EUR | 2,015 | | | | 2,659,448 | |
Algeco Scotsman Global Finance Plc,
9.00%, 10/15/18 | | | 1,311 | | | | 1,851,267 | |
Annington Finance No. 4 Plc, Series B3,
1.51%, 1/10/23 (c) | | GBP | 2,302 | | | | 3,468,450 | |
Annington Finance No. 5 Plc,
13.00%, 1/15/23 (d) | | | 1,000 | | | | 1,823,892 | |
Co-Operative Group Ltd.: | | | | | | | | |
5.63%, 7/08/20 (e) | | | 830 | | | | 1,388,985 | |
6.25%, 7/08/26 (e) | | | 800 | | | | 1,342,821 | |
Enterprise Inns Plc, 6.50%, 12/06/18 | | | 1,120 | | | | 1,749,703 | |
Gala Group Finance Plc, 8.88%, 9/01/18 | | | 908 | | | | 1,508,486 | |
Great Places Housing Group Ltd.,
4.90%, 10/22/42 | | | 685 | | | | 1,101,720 | |
House of Fraser Funding Plc, 8.88%, 8/15/18 | | | 200 | | | | 334,115 | |
Imperial Tobacco Finance Plc, 4.50%, 7/05/18 | | EUR | 588 | | | | 891,952 | |
Lloyds TSB Bank Plc, 11.88%, 12/16/21 (c) | | | 91 | | | | 151,681 | |
Marks & Spencer Plc, 4.75%, 6/12/25 | | GBP | 500 | | | | 788,993 | |
Mondi Finance Plc, 5.75%, 4/03/17 | | EUR | 1,000 | | | | 1,529,824 | |
Phones4u Finance Plc, 9.50%, 4/01/18 | | GBP | 483 | | | | 811,997 | |
Severn Trent Utilities Finance Plc,
3.63%, 1/16/26 | | | 845 | | | | 1,324,886 | |
Standard Chartered Plc, 3.95%, 1/11/23 (a) | | USD | 3,000 | | | | 2,955,093 | |
Together Housing Finance Plc, 4.50%, 12/17/42 | | GBP | 940 | | | | 1,464,868 | |
| | | | | | | | |
| Corporate Bonds | | Par (000) | | | Value | |
United Kingdom (concluded) | | | | | | | | |
The Unique Pub Finance Co. Plc: | | | | | | | | |
Series 2012-02, Class A4, 5.66%, 6/30/27 | | GBP | 2,225 | | | $ | 3,272,994 | |
Series 2012-99, Class A3, 6.54%, 3/30/21 | | | 2,400 | | | | 3,787,351 | |
Vodafone Group Plc, 8.13%, 11/26/18 | | | 1,700 | | | | 3,528,065 | |
Voyage Care Bondco Plc, 11.00%, 2/01/19 | | | 1,950 | | | | 3,120,521 | |
WM Treasury Plc, 4.63%, 12/03/42 | | | 865 | | | | 1,351,579 | |
| | | | | | | | |
| | | | | | | | 42,208,691 | |
United States — 21.2% | | | | | | | | |
313 Group, Inc., 6.38%, 12/01/19 (a) | | USD | 525 | | | | 514,500 | |
The ADT Corp., 4.13%, 6/15/23 (a) | | | 480 | | | | 486,885 | |
Ally Financial, Inc., 8.00%, 11/01/31 | | | 700 | | | | 884,625 | |
Altria Group, Inc., 4.25%, 8/09/42 | | | 300 | | | | 281,571 | |
American Tower Corp., 3.50%, 1/31/23 | | | 4,810 | | | | 4,696,676 | |
Amgen, Inc., 4.38%, 12/05/18 | | EUR | 1,000 | | | | 1,539,193 | |
AvalonBay Communities, Inc., 2.85%, 3/15/23 | | USD | 4,000 | | | | 3,891,720 | |
Aviation Capital Group Corp., 6.75%, 4/06/21 (a) | | | 500 | | | | 543,035 | |
Axiall Corp., 4.88%, 5/15/23 (a) | | | 180 | | | | 181,350 | |
Bank of America Corp., 3.30%, 1/11/23 | | | 2,600 | | | | 2,564,162 | |
Brocade Communications Systems, Inc.,
4.63%, 1/15/23 (a) | | | 1,200 | | | | 1,197,000 | |
CCO Holdings LLC/CCO Holdings Capital Corp.,
6.50%, 4/30/21 | | | 500 | | | | 535,000 | |
Ceridian Corp., 8.88%, 7/15/19 (a) | | | 745 | | | | 830,675 | |
CHS/Community Health Systems, Inc.,
5.13%, 8/15/18 | | | 1,000 | | | | 1,052,500 | |
CIT Group, Inc.: | | | | | | | | |
5.50%, 2/15/19 (a) | | | 690 | | | | 738,300 | |
5.00%, 8/15/22 | | | 530 | | | | 559,745 | |
Clean Harbors, Inc., 5.25%, 8/01/20 | | | 750 | | | | 783,750 | |
Clear Channel Worldwide Holdings, Inc.: | | | | | | | | |
7.63%, 3/15/20 | | | 740 | | | | 773,300 | |
6.50%, 11/15/22 (a) | | | 741 | | | | 789,165 | |
6.50%, 11/15/22 (a) | | | 554 | | | | 584,470 | |
CNH Capital LLC, 3.88%, 11/01/15 (a) | | | 1,500 | | | | 1,541,250 | |
Comcast Corp., 4.25%, 1/15/33 | | | 4,500 | | | | 4,385,201 | |
Continental Airlines Pass-Through Certificates: | | | | | | | | |
Series 2012-2, Class A, 4.00%, 4/29/26 | | | 2,800 | | | | 2,922,500 | |
Series 2012-2, Class B, 5.50%, 4/29/22 | | | 1,000 | | | | 1,046,250 | |
Series 2012-3, Class C, 6.13%, 4/29/18 | | | 4,500 | | | | 4,477,500 | |
Series 2012-3, Class RJ03,
7.88%, 1/02/20 | | | 465 | | | | 483,322 | |
Continental Rubber of America Corp.,
4.50%, 9/15/19 (a) | | | 4,360 | | | | 4,469,000 | |
Crown Americas LLC/Crown Americas Capital Corp. IV, 4.50%, 1/15/23 (a) | | | 883 | | | | 869,755 | |
Crown Castle International Corp.,
5.25%, 1/15/23 (a) | | | 1,000 | | | | 1,050,000 | |
Denbury Resources, Inc., 4.63%, 7/15/23 | | | 813 | | | | 796,740 | |
DigitalGlobe, Inc., 5.25%, 2/01/21 (a) | | | 562 | | | | 560,595 | |
DIRECTV Holdings LLC/DIRECTV Financing Co., Inc., 3.80%, 3/15/22 | | | 1,000 | | | | 1,008,802 | |
The Dun & Bradstreet Corp., 4.38%, 12/01/22 | | | 2,250 | | | | 2,274,554 | |
Eagle Spinco, Inc., 4.63%, 2/15/21 (a) | | | 208 | | | | 209,300 | |
El Paso Pipeline Partners Operating Co. LLC,
5.00%, 10/01/21 | | | 1,355 | | | | 1,503,458 | |
Energy Future Intermediate Holding Co. LLC/EFIH Finance, Inc., 10.00%, 12/01/20 | | | 850 | | | | 975,375 | |
Energy Transfer Partners LP, 6.50%, 2/01/42 | | | 500 | | | | 576,787 | |
See Notes to Financial Statements.
| | | | | | |
| | | | | | | |
| 16 | | BLACKROCK FUNDS | | JANUARY 31, 2013 | | |
| | |
Schedule of Investments (continued) | | BlackRock Global Long/Short Credit Fund (Percentages shown are based on Net Assets) |
| | | | | | | | |
| Corporate Bonds | | Par (000) | | | Value | |
United States (continued) | | | | | | | | |
Entergy Mississippi, Inc., 3.10%, 7/01/23 | | USD | 4,000 | | | $ | 3,917,756 | |
Enterprise Products Operating LLC, 4.45%, 2/15/43 | | | 3,000 | | | | 2,850,318 | |
First Data Corp., 7.38%, 6/15/19 (a) | | | 500 | | | | 526,250 | |
Ford Motor Credit Co. LLC, 2.38%, 1/16/18 | | | 5,000 | | | | 4,933,840 | |
HCA, Inc.: | | | | | | | | |
6.50%, 2/15/20 | | | 570 | | | | 634,125 | |
4.75%, 5/01/23 | | | 736 | | | | 740,600 | |
HD Supply, Inc.: | | | | | | | | |
8.13%, 4/15/19 (a) | | | 655 | | | | 741,787 | |
7.50%, 7/15/20 (a) | | | 1,080 | | | | 1,066,500 | |
11.50%, 7/15/20 (a) | | | 715 | | | | 824,037 | |
IAC/InterActiveCorp., 4.75%, 12/15/22 (a) | | | 582 | | | | 577,635 | |
Infor US, Inc., 9.38%, 4/01/19 | | | 660 | | | | 745,800 | |
Jefferies Group, Inc.: | | | | | | | | |
5.13%, 1/20/23 | | | 2,000 | | | | 2,051,430 | |
6.50%, 1/20/43 | | | 400 | | | | 407,217 | |
Lear Corp., 4.75%, 1/15/23 (a) | | | 400 | | | | 398,000 | |
Level 3 Communications, Inc.,
8.88%, 6/01/19 (a) | | | 500 | | | | 543,750 | |
Level 3 Financing, Inc., 8.13%, 7/01/19 | | | 509 | | | | 554,810 | |
MarkWest Energy Partners LP/MarkWest Energy Finance Corp., 4.50%, 7/15/23 | | | 800 | | | | 796,000 | |
Meccanica Holdings USA, Inc.: | | | | | | | | |
6.25%, 7/15/19 (a) | | | 2,205 | | | | 2,250,864 | |
6.25%, 1/15/40 (a) | | | 1,270 | | | | 1,089,826 | |
NCR Corp., 5.00%, 7/15/22 (a) | | | 500 | | | | 506,250 | |
Nuance Communications, Inc.,
5.38%, 8/15/20 (a) | | | 500 | | | | 515,000 | |
Owens Corning, 4.20%, 12/15/22 | | | 1,500 | | | | 1,521,805 | |
Packaging Corp. of America, 3.90%, 6/15/22 | | | 1,800 | | | | 1,839,515 | |
Penske Truck Leasing Co. LP/PTL Finance Corp.: | | | | | | | | |
2.50%, 3/15/16 (a) | | | 1,500 | | | | 1,525,047 | |
3.38%, 3/15/18 (a) | | | 1,500 | | | | 1,536,323 | |
Post Holdings, Inc., 7.38%, 2/15/22 | | | 603 | | | | 669,330 | |
Precision Castparts Corp.: | | | | | | | | |
2.50%, 1/15/23 | | | 2,000 | | | | 1,950,726 | |
3.90%, 1/15/43 | | | 400 | | | | 389,347 | |
Prudential Financial, Inc., 5.63%, 6/15/43 (c) | | | 3,500 | | | | 3,609,375 | |
QEP Resources, Inc., 5.25%, 5/01/23 | | | 605 | | | | 635,250 | |
Rain CII Carbon LLC/CII Carbon Corp., 8.50%, 1/15/21 | | EUR | 930 | | | | 1,310,099 | |
Reynolds Group Issuer, Inc./Reynolds Group Issuer LLC/Reynolds Group Issuer Luxembourg SA, 5.75%, 10/15/20 | | USD | 1,085 | | | | 1,109,413 | |
Rockwood Specialties Group, Inc., 4.63%, 10/15/20 | | | 960 | | | | 980,400 | |
Sabine Pass Liquefaction LLC,
5.63%, 2/01/21 (a) | | | 3,062 | | | | 3,073,483 | |
SABMiller Holdings, Inc., 1.88%, 1/20/20 | | EUR | 970 | | | | 1,288,594 | |
Six Flags Entertainment Corp.,
5.25%, 1/15/21 (a) | | USD | 3,038 | | | | 3,022,810 | |
Spectrum Brands Escrow Corp., 6.38%, 11/15/20 (a) | | | 2,000 | | | | 2,127,500 | |
Sprint Nextel Corp., 9.00%, 11/15/18 (a) | | | 500 | | | | 618,750 | |
SunGard Data Systems, Inc.,
6.63%, 11/01/19 (a) | | | 1,200 | | | | 1,239,000 | |
Tenet Healthcare Corp.: | | | | | | | | |
4.75%, 6/01/20 (a) | | | 574 | | | | 577,587 | |
4.50%, 4/01/21 (a) | | | 767 | | | | 754,536 | |
| | | | | | | | |
| Corporate Bonds | | Par (000) | | | Value | |
United States (concluded) | | | | | | | | |
U.S. Airways Pass-Through Trust: | | | | | | | | |
Series 2012-1, Class B, 8.00%, 10/01/19 | | USD | 1,000 | | | $ | 1,080,000 | |
Series 2012-2, Class A, 4.63%, 6/03/25 | | | 4,000 | | | | 4,130,000 | |
Series 2012-2, Class B, 6.75%, 6/03/21 | | | 3,000 | | | | 3,120,000 | |
U.S. Coatings Acquisition, Inc./Flash Dutch 2 BV, 7.38%, 5/01/21 (a) | | | 243 | | | | 250,290 | |
Unifrax I LLC/Unifrax Holding Co., 7.50%, 2/15/19 (a) | | | 245 | | | | 248,675 | |
Verisk Analytics, Inc., 4.13%, 9/12/22 | | | 1,500 | | | | 1,530,991 | |
The Williams Cos, Inc., 3.70%, 1/15/23 | | | 2,070 | | | | 2,038,526 | |
Wyndham Worldwide Corp., 2.95%, 3/01/17 | | | 1,300 | | | | 1,321,484 | |
Zayo Group LLC/Zayo Capital, Inc., 8.13%, 1/01/20 | | | 820 | | | | 914,300 | |
| | | | | | | | |
| | | | | | | | 123,662,962 | |
Total Corporate Bonds — 47.4% | | | | | | | 276,866,681 | |
| | | | | | | | |
| | | | | | | | | |
Floating Rate Loan Interests | | | | | | | | |
Australia — 0.2% | | | | | | | | |
FMG Resources August 2006 Pty Ltd., Term Loan, 5.25%, 10/18/17 | | | 823 | | | | 832,969 | |
Germany — 0.1% | | | | | | | | |
Kabel Deutschland GmbH, Facility F, 4.25%, 2/01/19 | | | 740 | | | | 740,925 | |
Ireland — 0.3% | | | | | | | | |
AWAS Finance Luxembourg 2012 SA,
Term B-1 Loan, 4.75%, 7/16/18 | | | 1,729 | | | | 1,740,745 | |
Luxembourg — 0.5% | | | | | | | | |
Alpha Topco Ltd. (Formula One), Facility B-2, 6.00%, 4/30/19 | | | 576 | | | | 582,436 | |
Intelsat Jackson Holdings S.A. (FKA Intelsat Jackson Holdings Ltd.), Term B-1 Loan, 4.50%, 4/02/18 | | | 1,244 | | | | 1,258,975 | |
Mirror Bidco Corp., Term B Loan, 5.25%, 12/28/19 | | | 875 | | | | 881,930 | |
| | | | | | | | |
| | | | | | | | 2,723,341 | |
Netherlands — 0.2% | | | | | | | | |
NXP BV/NXP Funding LLC, Tranche C Loan, 4.75%, 1/10/20 | | | 1,250 | | | | 1,265,625 | |
United States — 7.4% | | | | | | | | |
ACCO Brands Corp., Term B Loan, 4.25%, 5/01/19 | | | 145 | | | | 146,856 | |
Alcatel-Lucent USA, Inc.: | | | | | | | | |
Term B Loan, 6.50%, 6/29/16 | | | 440 | | | | 444,950 | |
Term C Loan, 7.50%, 1/24/19 | | | 490 | | | | 494,777 | |
Term D Loan, 7.50%, 12/15/18 | | | 190 | | | | 189,118 | |
Alliance Laundry Systems LLC, Initial Term Loan (First Lien), 5.50%, 12/10/18 | | EUR | 285 | | | | 288,206 | |
Alliant Holdings I LLC, Initial Term Loan, 5.00%, 12/20/19 | | USD | 465 | | | | 470,036 | |
Altegrity, Inc. (FKA US Investigations Services, Inc.), Tranche D Term Loan, 7.75%, 2/21/15 | | | 337 | | | | 335,465 | |
American Capital Ltd. (FKA American Capital Strategies Ltd.), Senior Secured Term Loan, 5.50%, 8/22/16 | | | 303 | | | | 309,060 | |
See Notes to Financial Statements.
| | | | | | |
| | | | | | | |
| | BLACKROCK FUNDS | | JANUARY 31, 2013 | | 17 |
| | |
Schedule of Investments (continued) | | BlackRock Global Long/Short Credit Fund (Percentages shown are based on Net Assets) |
| | | | | | | | |
| Floating Rate Loan Interests | | Par (000) | | | Value | |
United States (continued) | | | | | | | | |
Ameriforge Group, Inc., Term Loan, 5.00%, 12/19/19 | | USD | 205 | | | $ | 207,243 | |
Apex Tool Group LLC, Term B Loan, 4.50%, 1/08/20 | | | 995 | | | | 1,003,915 | |
Ascend Performance Materials Operations LLC, Term B Loan, 6.75%, 4/10/18 | | | 199 | | | | 199,989 | |
Asurion, LLC (FKA Asurion Corp.), Term Loan (First Lien), 5.50%, 5/24/18 | | | 724 | | | | 731,049 | |
Bausch & Lomb, Inc., Parent Term Loan, 5.25%, 5/17/19 | | | 704 | | | | 710,684 | |
Biomet, Inc., Dollar Term B-1 Loan, 4.06%, 7/25/17 | | | 788 | | | | 795,905 | |
Booz Allen Hamilton, Inc, Initial Tranche B Term Loan, 4.50%, 7/31/19 | | | 379 | | | | 383,394 | |
Bright Horizons Family Solutions LLC (FKA Bright Horizons Family Solutions, Inc.), Term B Loan, 4.00%, 1/23/20 | | | 635 | | | | 638,702 | |
CCC Holdings, Inc., Term Loan, 5.25%, 12/20/19 | | | 470 | | | | 473,525 | |
CDW LLC (FKA CDW Corp.), Extended Term Loan, 4.00%, 7/15/17 | | | 287 | | | | 288,125 | |
Cequel Communications, LLC, Term Loan, 4.00%, 2/14/19 | | | 213 | | | | 215,060 | |
Ceridian Corp., Extended US Term Loan, 6.06%, 5/09/17 | | | 495 | | | | 499,826 | |
CHG Buyer Corp., Term Loan (First Lien), 5.00%, 11/19/19 | | | 718 | | | | 726,581 | |
DaVita, Inc., Tranche B-2 Term Loan, 4.00%, 11/01/19 | | | 445 | | | | 449,450 | |
DJO Finance LLC (ReAble Therapeutics Finance LLC), Tranche B-3 Term Loan, 6.25%, 9/15/17 | | | 179 | | | | 180,347 | |
Eastman Kodak Co., Term Loan (DIP), 8.50%, 7/20/13 | | | 166 | | | | 166,053 | |
Evergreen Acquisition Co. 1 LP, New Term Loan, 5.00%, 7/09/19 | | | 998 | | | | 1,005,809 | |
Federal-Mogul Corp.: | | | | | | | | |
Tranche B Term Loan, 2.24%, 12/29/14 | | | 997 | | | | 944,289 | |
Tranche C Term Loan, 2.24%, 12/28/15 | | | 319 | | | | 302,016 | |
First Data Corp., 2018 Term Loan,
5.31%, 9/24/18 | | | 705 | | | | 705,000 | |
Flash Dutch 2 BV & U.S. Coatings Acquisition, Inc.: | | | | | | | | |
Term B Loan, 5.25%, 1/15/20 | | EUR | 90 | | | | 122,812 | |
Term B Loan, 4.75%, 1/31/20 | | | 1,215 | | | | 1,232,253 | |
Freescale Semiconductor, Inc., Tranche B-1 Term Loan, 4.46%, 12/01/16 | | USD | 1,040 | | | | 1,040,437 | |
Getty Images, Inc., Tranche B Term Loan, 4.75%, 10/18/19 | | | 230 | | | | 232,530 | |
GMACM Borrower LLC (RFC Borrower LLC): | | | | | | | | |
Term A-1 Loan, 6.00%, 11/18/13 | | | 370 | | | | 370,348 | |
Term A-2 Loan, 7.75%, 11/18/13 | | | 65 | | | | 65,305 | |
Harrah’s Las Vegas Propco LLC, Senior Loan, 3.31%, 2/13/13 | | | 4,000 | | | | 3,691,680 | |
HD Supply, Inc., Term Loan, 7.25%, 10/12/17 | | | 1,432 | | | | 1,469,010 | |
INEOS U.S. Finance LLC, Cash Dollar Term Loan, 6.50%, 5/04/18 | | | 516 | | | | 526,948 | |
Interactive Data Corp., Term B Loan, 4.50%, 2/11/18 | | | 499 | | | | 500,521 | |
iStar Financial, Inc., Term Loan, 5.75%, 10/15/17 | | | 283 | | | | 286,815 | |
| | | | | | | | |
| Floating Rate Loan Interests | | Par (000) | | | Value | |
United States (continued) | | | | | | | | |
Laureate Education, Inc., Extended Term Loan, 5.25%, 6/15/18 | | USD | 967 | | | $ | 972,065 | |
Level 3 Financing, Inc., Tranche B-II 2019 Term Loan, 4.75%, 8/01/19 | | | 400 | | | | 404,376 | |
MGM Resorts International (MGM Grand Detroit LLC), Term B Loan, 4.25%, 12/20/19 | | | 850 | | | | 861,679 | |
Michaels Stores, Inc., Term B Loan, 3.75%, 1/16/20 | | | 2,680 | | | | 2,700,073 | |
The Neiman Marcus Group, Inc., Term Loan, 4.75%, 5/16/18 | | | 750 | | | | 751,410 | |
NEP/NCP Holdco, Inc., Term B Loan, 5.25%, 1/22/20 | | | 180 | | | | 182,776 | |
NP Opco LLC (Station GVR Acquisition LLC), B Term Loan, 5.50%, 9/28/19 | | | 454 | | | | 461,805 | |
Nuveen Investments, Inc., First-Lien Incremental Term Loan, 7.25%, 5/13/17 | | | 145 | | | | 145,605 | |
Ocwen Financial Corp., Term B Loan, 5.00%, 1/31/18 | | | 205 | | | | 207,563 | |
Par Pharmaceutical Companies, Inc. (Par Pharmaceutical, Inc.), Term B Loan, 5.00%, 9/30/19 | | | 834 | | | | 842,504 | |
Party City Holdings, Inc., Term Loan, 5.75%, 7/27/19 | | | 983 | | | | 993,449 | |
PetCo Animal Supplies, Inc., New Loan, 4.50%, 11/24/17 | | | 199 | | | | 199,889 | |
PVH Corp. (FKA Phillips-Van Heusen Corp.), Term B Loan, 3.25%, 12/31/19 | | | 1,135 | | | | 1,143,513 | |
Realogy Corp.: | | | | | | | | |
Extended First-Lien Term Loan, 4.46%, 10/10/16 | | | 204 | | | | 205,303 | |
Extended Synthetic Commitment, 0.05%, 10/10/16 | | | 13 | | | | 13,416 | |
Rexnord LLC/RBS Global, Inc., Term B Loan, 4.50%, 4/01/18 | | | 619 | | | | 624,600 | |
Riverbed Technology, Inc., Term Loan, 4.00%, 12/18/19 | | | 870 | | | | 877,978 | |
Sequa Corp., Term Loan B, 5.25%, 6/19/17 | | | 1,536 | | | | 1,558,565 | |
Silver II Borrower SCA (Silver II U.S. Holdings LLC), Initial Term Loan, 5.00%, 12/13/19 | | | 1,000 | | | | 1,008,500 | |
SunGard Data Systems, Inc. (Solar Capital Corp.), Tranche D Term Loan, 4.50%, 1/31/20 | | | 580 | | | | 586,044 | |
Toys ’R’ Us-Delaware, Inc., Term B-3 Loan, 5.25%, 5/25/18 | | | 189 | | | | 185,269 | |
Univision Communications, Inc., Extended First-Lien Term Loan, 4.45%, 3/31/17 | | | 675 | | | | 675,844 | |
Vantage Drilling Co., Tranche B Term Loan, 6.25%, 10/25/17 | | | 494 | | | | 496,658 | |
Walter Energy, Inc. (FKA Walter Industries, Inc.), B Term Loan, 5.75%, 4/02/18 | | | 886 | | | | 894,271 | |
Weather Channel, Term Loan, 4.25%, 2/13/17 | | | 500 | | | | 504,870 | |
WESCO Distribution, Inc., Tranche B-1 Loan, 4.50%, 12/12/19 | | | 570 | | | | 575,700 | |
West Corp., Term B-6 Loan, 5.75%, 6/30/18 | | | 572 | | | | 578,739 | |
Wilsonart LLC, Initial Term Loan, 5.50%, 10/31/19 | | | 710 | | | | 718,577 | |
The Yankee Candle Company, Inc., Initial Term Loan, 5.25%, 4/02/19 | | | 181 | | | | 182,266 | |
See Notes to Financial Statements.
| | | | | | |
| | | | | | | |
| 18 | | BLACKROCK FUNDS | | JANUARY 31, 2013 | | |
| | |
Schedule of Investments (continued) | | BlackRock Global Long/Short Credit Fund (Percentages shown are based on Net Assets) |
| | | | | | | | |
| Floating Rate Loan Interests | | Par (000) | | | Value | |
United States (concluded) | | | | | | | | |
Zayo Group LLC/Zayo Capital, Inc., Term Loan, 5.25%, 7/02/19 | | | USD 960 | | | $ | 972,475 | |
| | | | | | | | |
| | | | | | | | 43,369,871 | |
Total Floating Rate Loan Interests — 8.7% | | | | 50,673,476 | |
| | | | | | | | |
| | |
Foreign Agency Obligations | | | | | | | | |
Spain — 1.5% | | | | | | | | |
Autonomous Community of Madrid Spain: | | | | | | | | |
3.00%, 11/05/13 | | | CHF 1,090 | | | | 1,198,335 | |
3.00%, 7/29/14 | | | 180 | | | | 194,923 | |
Autonomous Community of Valencia Spain: | | | | | | | | |
2.13%, 2/22/13 | | | 1,690 | | | | 1,849,687 | |
5.50%, 4/26/13 | | | EUR 150 | | | | 203,241 | |
4.75%, 3/20/14 | | | 1,960 | | | | 2,631,465 | |
3.25%, 7/06/15 | | | 520 | | | | 650,909 | |
4.38%, 7/16/15 | | | 880 | | | | 1,126,630 | |
4.00%, 11/02/16 | | | 1,000 | | | | 1,218,618 | |
Total Foreign Agency Obligations — 1.5% | | | | 9,073,808 | |
| | | | | | | | |
| | |
Foreign Government Obligations | | | | | | | | |
Cyprus — 0.3% | | | | | | | | |
Republic of Cyprus: | | | | | | | | |
3.75%, 6/03/13 | | | 680 | | | | 826,352 | |
4.38%, 7/15/14 | | | 1,130 | | | | 1,294,646 | |
| | | | | | | | |
| | | | | | | | 2,120,998 | |
Germany — 2.9% | | | | | | | | |
Bundesrepublik Deutschland: | | | | | | | | |
0.50%, 4/07/17 | | | 400 | | | | 540,971 | |
4.25%, 7/04/18 | | | 2,500 | | | | 4,006,164 | |
3.25%, 1/04/20 | | | 5,050 | | | | 7,823,801 | |
2.00%, 1/04/22 | | | 3,200 | | | | 4,516,602 | |
| | | | | | | | |
| | | | | | | | 16,887,538 | |
Italy — 1.5% | | | | | | | | |
Buoni Poliennali Del Tesoro, 3.50%, 11/01/17 | | | 6,540 | | | | 9,037,062 | |
Netherlands — 2.4% | | | | | | | | |
Kingdom of Netherlands: | | | | | | | | |
4.50%, 7/15/17 | | | 2,100 | | | | 3,301,308 | |
1.25%, 1/15/18 | | | 7,705 | | | | 10,587,326 | |
| | | | | | | | |
| | | | | | | | 13,888,634 | |
Portugal — 1.4% | | | | | | | | |
Republic of Portugal, 3.50%, 3/25/15 | | | USD 8,050 | | | | 7,989,625 | |
| | | | | | | | |
| Foreign Government Obligations | | Par (000) | | | Value | |
Spain — 2.9% | | | | | | | | |
Kingdom of Spain, 4.50%, 1/31/18 | | | EUR 8,360 | | | $ | 11,652,034 | |
Spain Letras del Tesoro, 2.48%, 4/16/14 (f) | | | 3,900 | | | | 5,187,446 | |
| | | | | | | | |
| | | | | | | | 16,839,480 | |
Total Foreign Government Obligations — 11.4% | | | | 66,763,337 | |
| | | | | | | | |
| | |
| Non-Agency Mortgage-Backed Securities | | Par | | | Value | |
Collateralized Mortgage Obligations — 1.2% | | | | | | | | |
United Kingdom — 1.2% | | | | | | | | |
Fosse Master Issuer Plc, Series 2012-1, Class 2A2, 1.70%, 10/18/54 (a)(c) | | | GBP 1,552 | | | | 1,584,639 | |
Gemgarto, Series 2012-1, Class A1, 3.47%, 5/14/45 (c) | | | 458 | | | | 754,540 | |
Lanark Master Issuer Plc, Series 2012-2X, Class 2A, 2.15%, 12/22/54 (c) | | | 890 | | | | 1,471,912 | |
Residential Mortgage Securities Plc, Series 2012-26, Class A1, 2.78%, 2/14/41 (c) | | | 1,164 | | | | 1,931,463 | |
Silk Road Finance Number Three Plc, Series 2012-1, Class A, 1.87%, 6/21/55 (c) | | | 728 | | | | 1,177,124 | |
Total Non-Agency Mortgage-Backed Securities — 1.2% | | | | 6,919,678 | |
| | | | | | | | |
| | |
Preferred Securities | | | | | | | | |
Capital Trusts | | | | | | | | |
Belgium — 0.1% | | | | | | | | |
Fortis Bank SA/NV, 4.63% (c)(g) | | | EUR 650 | | | | 803,134 | |
Germany — 0.1% | | | | | | | | |
IVG Immobilien AG, 0.00% (c)(g) | | | 400 | | | | 336,732 | |
Netherlands — 0.1% | | | | | | | | |
Achmea BV, 5.13% (g) | | | 490 | | | | 642,032 | |
United Kingdom — 0.2% | | | | | | | | |
Aviva Plc, 5.90% (c)(g) | | | GBP 780 | | | | 1,113,367 | |
United States — 1.1% | | | | | | | | |
Citigroup, Inc., 5.95% (c)(g) | | | USD 2,350 | | | | 2,373,500 | |
General Electric Capital Corp., 6.25% (c)(g) | | | 2,000 | | | | 2,183,140 | |
Prudential Financial, Inc., 5.88%, 9/15/42 (c) | | | 2,000 | | | | 2,097,500 | |
| | | | | | | | |
| | | | | | | | 6,654,140 | |
Total Capital Trusts — 1.6% | | | | 9,549,405 | |
| | | | | | | | |
| | |
| Trust Preferreds | | Shares | | | | |
United States — 0.2% | | | | | | | | |
Stanley Black & Decker, Inc., 5.75%, 7/25/52 | | | 40,000 | | | | 1,036,400 | |
Total Preferred Securities — 1.8% | | | | 10,585,805 | |
| | | | | | | | |
| | |
See Notes to Financial Statements.
| | | | | | |
| | | | | | | |
| | BLACKROCK FUNDS | | JANUARY 31, 2013 | | 19 |
| | |
Schedule of Investments (continued) | | BlackRock Global Long/Short Credit Fund (Percentages shown are based on Net Assets) |
| | | | | | | | |
| U.S. Treasury Obligations | | Par (000) | | | Value | |
U.S. Treasury Notes: | | | | | | | | |
0.25%, 9/15/15 | | | USD 930 | | | $ | 927,311 | |
0.75%, 10/31/17 | | | 606 | | | | 603,917 | |
1.75%, 5/15/22 | | | 1,400 | | | | 1,383,813 | |
Total U.S. Treasury Obligations — 0.5% | | | | 2,915,041 | |
Total Long-Term Investments (Cost — $409,600,979) — 72.5% | | | | 423,797,826 | |
| | | | | | | | |
| | |
| Short-Term Securities | | | | | | |
Borrowed Bond Agreements — 20.9% | | | | | | | | |
Bank of America Corp., 0.20%, Open
(Purchased on 11/26/12 to be repurchased at $21,872,132, collateralized by U.S. Treasury Notes, 1.63% due at 8/15/22, par and fair value of USD 21,316,000 and $20,738,144, respectively) | | | 21,449 | | | | 21,449,220 | |
Barclays Plc, (0.40)%, Open
(Purchased on 1/31/13 to be repurchased at EUR 765,612, collateralized by Commerzbank AG, 7.75% due at 3/16/21, par and fair value of EUR 700,000 and $1,012,234, respectively) | | | EUR 792 | | | | 1,074,906 | |
Barclays Plc, (0.40)%, Open
(Purchased on 1/31/13 to be repurchased at EUR 877,701, collateralized by Commerzbank AG, 7.75% due at 3/16/21, par and fair value of EUR 800,000 and $1,156,838, respectively) | | | 908 | | | | 1,232,277 | |
Barclays Plc, (0.16)%, Open
(Purchased on 1/16/13 to be repurchased at EUR 7,346,094, collateralized by Buoni Poliennali Del Tesoro, 4.75% due at 9/01/21, par and fair value of EUR 6,540,000 and $9,428,153, respectively) | | | 7,450 | | | | 10,115,863 | |
Barclays Plc, (0.10)%, Open
(Purchased on 8/23/12 to be repurchased at EUR 2,902,994, collateralized by Republic of France, 4.00% due at 4/25/18, par and fair value of EUR 2,500,000 and $3,880,365, respectively) | | | 2,920 | | | | 3,964,412 | |
Barclays Plc, (0.08)%, Open
(Purchased on 1/28/13 to be repurchased at EUR 3,311,819, collateralized by Buoni Poliennali Del Tesoro, 4.75% due at 9/01/21, par and fair value of EUR 2,950,000 and $4,252,760, respectively) | | | 3,335 | | | | 4,528,308 | |
Barclays Plc, (0.08)%, Open
(Purchased on 1/29/13 to be repurchased at EUR 839,884, collateralized by Buoni Poliennali Del Tesoro, 4.75% due at 9/01/21, par and fair value of EUR 750,000 and $1,081,210, respectively) | | | 846 | | | | 1,148,385 | |
Barclays Plc, (0.06)%, Open
(Purchased on 1/16/13 to be repurchased at EUR 7,535,696, collateralized by Kingdom of Spain, 5.85% due at 1/31/22, par and fair value of EUR 6,540,000 and $9,404,941, respectively) | | | 7,577 | | | | 10,288,441 | |
Barclays Plc, (0.06)%, Open
(Purchased on 1/29/13 to be repurchased at EUR 6,009,228, collateralized by Republic of France, 3.75% due at 10/25/19, par and fair value of EUR 5,250,000 and $8,127,524, respectively) “ | | | 6,034 | | | | 8,192,829 | |
| | | | | | | | |
| Short-Term Securities | | Par (000) | | | Value | |
Borrowed Bond Agreements (continued) | | | | | | | | |
Barclays Plc, (0.06)%, Open
(Purchased on 10/24/12 to be repurchased at EUR 578,092, collateralized by Republic of Belgium, 4.25% due at 9/28/21, par and fair value of EUR 500,000 and $792,407, respectively) | | | EUR 581 | | | $ | 789,216 | |
Barclays Plc, 0.00%, Open
(Purchased on 6/08/12 to be repurchased at EUR 128,085, collateralized by Republic of France, 3.75% due at 4/25/17, par and fair value of EUR 115,000 and $174,431, respectively) | | | 128 | | | | 173,913 | |
Barclays Plc, 0.03%, Open
(Purchased on 5/16/12 to be repurchased at EUR 131,275, collateralized by Kingdom of Belgium, 5.50% due at 9/28/17, par and fair value of EUR 110,000 and $178,754, respectively) | | | 131 | | | | 177,954 | |
Barclays Plc, 0.05%, Open
(Purchased on 5/23/12 to be repurchased at EUR 246,657, collateralized by Kingdom of Spain, 3.40% due at 4/30/14, par and fair value of EUR 240,000 and $332,106, respectively) | | | 247 | | | | 334,909 | |
Barclays Plc, 0.15%, Open
(Purchased on 2/08/12 to be repurchased at EUR 142,341, collateralized by Kingdom of Belgium, 3.25% due at 9/28/16, par and fair value of EUR 135,000 and $198,919, respectively) | | | 142 | | | | 192,907 | |
Credit Suisse Group AG, (0.13)%, Open
(Purchased on 1/29/13 to be repurchased at $15,609,556, collateralized by U.S. Treasury Bonds, 1.63% due at 11/15/22, par and fair value of USD 16,261,000 and $15,742,681, respectively) | | | USD 15,814 | | | | 15,813,823 | |
Credit Suisse Group AG, (0.11)%, Open
(Purchased on 1/23/13 to be repurchased at $6,310,044, collateralized by U.S. Treasury Notes, 0.75% due at 12/31/17, par and fair value of USD 6,345,000 and $6,310,794, respectively) | | | 6,345 | | | | 6,345,000 | |
Credit Suisse Group AG, 0.07%, Open
(Purchased on 1/08/13 to be repurchased at $301,573, collateralized by U.S. Treasury Bonds, 2.75% due at 11/15/42, par and fair value of USD 315,000 and $289,603, respectively) | | | 295 | | | | 295,313 | |
Credit Suisse Group AG, 0.07%, Open
(Purchased on 12/17/12 to be repurchased at $1,890,286, collateralized by U.S. Treasury Notes, 1.00% due at 11/30/19, par and fair value of USD 1,900,000 and $1,857,843, respectively) | | | 1,881 | | | | 1,881,000 | |
Credit Suisse Group AG, 0.08%, Open
(Purchased on 12/12/12 to be repurchased at $65,236, collateralized by U.S. Treasury Notes, 0.38% due at 11/15/15, par and fair value of USD 65,000 and $64,995, respectively) | | | 65 | | | | 65,081 | |
Credit Suisse Group AG, 0.09%, Open
(Purchased on 1/18/13 to be repurchased at $5,330,579, collateralized by U.S. Treasury Bonds, 2.75% due at 8/15/42, par and fair value of USD 5,435,000 and $5,005,298, respectively) | | | 5,190 | | | | 5,190,425 | |
See Notes to Financial Statements.
| | | | | | |
| | | | | | | |
| 20 | | BLACKROCK FUNDS | | JANUARY 31, 2013 | | |
| | |
Schedule of Investments (continued) | | BlackRock Global Long/Short Credit Fund (Percentages shown are based on Net Assets) |
| | | | | | | | |
| Short-Term Securities | | Par (000) | | | Value | |
Borrowed Bond Agreements (concluded) | |
Credit Suisse Group AG, 0.12%, Open
(Purchased on 11/07/12 to be repurchased at $3,243,014, collateralized by U.S. Treasury Notes, 0.63% due at 9/30/17, par and fair value of USD 3,240,000 and $3,212,917, respectively) | | | USD 3,224 | | | $ | 3,223,800 | |
Credit Suisse Group AG, 0.14%, Open
(Purchased on 12/13/12 to be repurchased at $3,801,893, collateralized by U.S. Treasury Notes, 0.63% due at 11/30/17, par and fair value of USD 3,780,000 and $3,741,315, respectively) | | | 3,775 | | | | 3,775,275 | |
Credit Suisse Group AG, 0.18%, Open
(Purchased on 10/05/12 to be repurchased at $1,697,119, collateralized by U.S. Treasury Bonds, 3.00% due at 5/15/42, par and fair value of USD 1,550,000 and $1,507,375, respectively) | | | 1,610 | | | | 1,610,062 | |
Credit Suisse Group AG, 0.19%, Open
(Purchased on 10/01/12 to be repurchased at $161,718, collateralized by U.S. Treasury Notes, 0.63% due at 8/31/17, par and fair value of USD 160,000 and $158,875, respectively) | | | 160 | | | | 160,200 | |
Deutsche Bank AG, (0.03)%, Open
(Purchased on 8/24/12 to be repurchased at $2,160,401, collateralized by U.S. Treasury Notes, 0.50% due at 7/31/17, par and fair value of USD 2,180,000 and $2,154,283, respectively) | | | 2,164 | | | | 2,163,650 | |
Deutsche Bank AG, 0.18%, Open
(Purchased on 8/24/12 to be repurchased at $892,596, collateralized by U.S. Treasury Bonds, 0.25% due at 8/15/15, par and fair value of USD 890,000 and $887,775, respectively) | | | 888 | | | | 887,775 | |
UBS AG, (0.05)%, Open
(Purchased on 10/23/12 to be repurchased at EUR 12,250,851, collateralized by Republic of France, 4.25% due at 10/25/17, par and fair value of EUR 10,235,000 and $15,923,180, respectively) | | | EUR12,282 | | | | 16,676,397 | |
| | | | | | | | 121,751,341 | |
| | | Shares | | | | |
Money Market Funds — 29.7% | | | | | | | | |
BlackRock Liquidity Funds, TempFund, Institutional Class, 0.10% (h)(i) | | | 173,744,351 | | | | 173,744,351 | |
Total Short-Term Securities (Cost — $293,835,770) — 50.6% | | | | 295,495,692 | |
| | | | | | | | |
| | |
Options Purchased | | | | | | | | |
(Cost — $849,739) — 0.1% | | | | 822,756 | |
Total Investments Before Options Written and Borrowed Bonds (Cost — $704,286,488) — 123.2% | | | | 720,116,274 | |
| | | | | | | | |
| | |
| | | | | | | | |
| Options Written | | | | | Value | |
(Premiums Received — $248,900) — (0.1)% | | | $ | (247,950 | ) |
| | | | | | | | |
| | |
| Borrowed Bonds | | Par (000) | | | | |
Corporate Bonds — (0.4)% | | | | | | | | |
Commerzbank AG, 7.75%, 3/16/21 | | | EUR 1,500 | | | | (2,169,072 | ) |
Foreign Government Obligations — (9.2)% | | | | | |
Buoni Poliennali Del Tesoro, 4.75%, 9/01/21 | | | 10,240 | | | | (14,762,123 | ) |
Kingdom of Belgium: | | | | | | | | |
3.25%, 9/28/16 | | | 135 | | | | (198,919 | ) |
4.25%, 9/28/21 | | | 500 | | | | (792,407 | ) |
5.50%, 9/28/17 | | | 110 | | | | (178,754 | ) |
Kingdom of Spain: | | | | | | | | |
3.40%, 4/30/14 | | | 240 | | | | (332,106 | ) |
5.85%, 1/31/22 | | | 6,540 | | | | (9,404,941 | ) |
Republic of France: | | | | | | | | |
3.75%, 4/25/17-10/25/19 | | | 5,365 | | | | (8,301,955 | ) |
4.00%, 4/25/18 | | | 2,500 | | | | (3,880,365 | ) |
4.25%, 10/25/17 | | | 10,235 | | | | (15,923,180 | ) |
| | | | | | | | |
| | | | | | | | (53,774,750 | ) |
U.S. Treasury Obligations — (10.5)% | | | | | |
U.S. Treasury Bonds: | | | | | | | | |
2.75%, 8/15/42-11/15/42 | | | USD 5,750 | | | | (5,294,901 | ) |
3.00%, 5/15/42 | | | 1,550 | | | | (1,507,375 | ) |
U.S. Treasury Notes: | | | | | | | | |
0.25%, 8/15/15 | | | 890 | | | | (887,775 | ) |
0.38%, 11/15/15 | | | 65 | | | | (64,995 | ) |
0.50%, 7/31/17 | | | 2,180 | | | | (2,154,283 | ) |
0.63%, 8/31/17-11/30/17 | | | 7,180 | | | | (7,113,107 | ) |
0.75%, 12/31/17 | | | 6,345 | | | | (6,310,794 | ) |
1.00%, 11/30/19 | | | 1,900 | | | | (1,857,843 | ) |
1.63%, 8/15/22-11/15/22 | | | 37,577 | | | | (36,480,825 | ) |
| | | | | | | | |
| | | | | | | | (61,671,898 | ) |
Total Borrowed Bonds (Proceeds — $116,837,864) — (20.1)% | | | | (117,615,720 | ) |
Total Investments Net of Options Written and Borrowed
Bonds — 103.0% | | | | 602,252,604 | |
| Liabilities in Excess of Other Assets — (3.0)% | | | | (17,639,352 | ) |
| | | | | | | | |
| Net Assets — 100.0% | | | | | | $ | 584,613,252 | |
| | | | | | | | |
See Notes to Financial Statements.
| | | | | | |
| | | | | | | |
| | BLACKROCK FUNDS | | JANUARY 31, 2013 | | 21 |
| | |
Schedule of Investments (continued) | | BlackRock Global Long/Short Credit Fund |
|
| Notes to Schedule of Investments |
| (a) | | Security exempt from registration pursuant to Rule 144A under the Securities Act of 1933, as amended. These securities may be resold in transactions exempt from registration to qualified institutional investors. |
| (b) | | Convertible security. |
| (c) | | Variable rate security. Rate shown is as of report date. |
| (d) | | Represents a payment-in-kind security which may pay interest/dividends in additional par/shares. |
| (e) | | Represents a step-up bond that pays an initial coupon rate for the first period and then a higher coupon rate for the following periods. Rate shown is as of report date. |
| (f) | | Represents a zero-coupon bond. Rate shown reflects the current yield as of report date. |
| (g) | | Security is perpetual in nature and has no stated maturity date. |
| (h) | | Investments in issuers considered to be an affiliate of the Fund during the six months ended January 31, 2013, for purposes of Section 2(a)(3) of the Investment Company Act of 1940, as amended, were as follows: |
| | | | | | | | | | | | | | | | | | | | |
| Affiliate | | Shares Held at
July 31, 2012 | | | Net Activity | | | Shares Held at
January 31, 2013 | | | Income | | | Realized
Gain | |
BlackRock Liquidity Funds, TempFund, Institutional Class | | | 93,785,586 | | | | 79,958,765 | | | | 173,744,351 | | | $ | 68,598 | | | $ | 793 | |
| (i) | | Represents the current yield as of report date. |
| Ÿ | | Financial futures contracts as of January 31, 2013 were as follows: |
| | | | | | | | | | | | | | | | | | | | |
Contracts
Purchased/ (Sold) | | | Issue | | Exchange | | Expiration | | | | | Notional Value | | | Unrealized
Appreciation
(Depreciation) | |
| | (302) | | | Euro-Bobl | | Eurex | | March 2013 | | | USD | | | | (51,535,472 | ) | | $ | 400,364 | |
| | 19 | | | Euro-Bund | | Eurex | | March 2013 | | | USD | | | | 3,660,742 | | | | (24,604 | ) |
| | (13) | | | Euro-Schatz | | Eurex | | March 2013 | | | USD | | | | (1,945,967 | ) | | | 8,757 | |
| | (124) | | | Gilt British | | London | | March 2013 | | | USD | | | | (22,885,689 | ) | | | 361,879 | |
| | (17) | | | U.S. Treasury Notes (5 Year) | | Chicago Board Options | | March 2013 | | | USD | | | | (2,103,484 | ) | | | 9,818 | |
| | (36) | | | U.S. Treasury Notes (10 Year) | | Chicago Board Options | | March 2013 | | | USD | | | | (4,726,125 | ) | | | 59,780 | |
| | Total | | | | | | | | | | | | | | | | | $ | 815,994 | |
| | | | | | | | | | | | | | | | | | | | |
| Ÿ | | Foreign currency exchange contracts as of January 31, 2013 were as follows: |
| | | | | | | | | | | | | | | | | | | | |
Currency
Purchased | | | Currency
Sold | | | Counterparty | | Settlement
Date | | | Unrealized
Appreciation
(Depreciation) | |
| EUR | | | 6,027,000 | | | USD | | | 8,129,995 | | | Royal Bank of Scotland Group Plc | | | 2/01/13 | | | $ | 53,415 | |
| USD | | | 3,118,443 | | | CHF | | | 2,877,886 | | | Goldman Sachs Group, Inc. | | | 4/17/13 | | | | (46,622 | ) |
| USD | | | 38,686,368 | | | GBP | | | 24,150,000 | | | Goldman Sachs Group, Inc. | | | 4/17/13 | | | | 400,197 | |
| USD | | | 5,173,865 | | | GBP | | | 3,263,000 | | | Royal Bank of Scotland Group Plc | | | 4/17/13 | | | | 872 | |
| USD | | | 151,792 | | | SEK | | | 990,000 | | | BNP Paribas SA | | | 4/17/13 | | | | (3,668 | ) |
| USD | | | 131,797,575 | | | EUR | | | 98,910,000 | | | Citigroup, Inc. | | | 4/23/13 | | | | (2,561,146 | ) |
| USD | | | 2,167,920 | | | EUR | | | 1,627,000 | | | Goldman Sachs Group, Inc. | | | 4/23/13 | | | | (42,186 | ) |
| USD | | | 8,133,973 | | | EUR | | | 6,027,000 | | | Royal Bank of Scotland Group Plc | | | 4/23/13 | | | | (53,066 | ) |
| USD | | | 133,153 | | | EUR | | | 100,000 | | | UBS AG | | | 4/23/13 | | | | (2,687 | ) |
| USD | | | 87,497 | | | EUR | | | 65,000 | | | UBS AG | | | 4/23/13 | | | | (799 | ) |
| Total | | | | | | | | | | | | | | | | | | $ | (2,255,690 | ) |
| | | | | | | | | | | | | | | | | | | | |
| | | | | | |
See Notes to Financial Statements. | | | | |
| | | | | | | |
| 22 | | BLACKROCK FUNDS | | JANUARY 31, 2013 | | |
| | |
| Schedule of Investments (continued) | | BlackRock Global Long/Short Credit Fund |
| Ÿ | | Exchange-traded options purchased as of January 31, 2013 were as follows: |
| | | | | | | | | | | | | | | | | | | | | | |
| Description | | Put/
Call | | | Strike Price | | | Expiration
Date | | Contracts | | | Market
Value | |
Dell, Inc. | | | Put | | | | USD | | | | 11.00 | | | 2/16/13 | | | 2,000 | | | $ | 9,000 | |
CAC 40 Index | | | Put | | | | EUR | | | | 3,750.00 | | | 3/15/13 | | | 108 | | | | 115,700 | |
DAX Index | | | Put | | | | EUR | | | | 7,700.00 | | | 3/15/13 | | | 59 | | | | 43,019 | |
DAX Index | | | Put | | | | EUR | | | | 7,800.00 | | | 3/15/13 | | | 33 | | | | 32,418 | |
FTSE MIB Index | | | Put | | | | EUR | | | | 17,500.00 | | | 3/15/13 | | | 47 | | | | 90,619 | |
SPDR S&P 500® ETF Trust | | | Put | | | | USD | | | | 147.00 | | | 4/20/13 | | | 1,900 | | | | 532,000 | |
| | | | | | |
| Total | | | | | | | | | | | | | | | | | | | | $ | 822,756 | |
| | | | | | | | | | | | | | | | | | | | | | |
| Ÿ | | Exchange-traded options written as of January 31, 2013 were as follows: |
| | | | | | | | | | | | | | | | | | | | |
| Description | | Put/
Call | | Strike Price | | | Expiration
Date | | Contracts | | | Market
Value | |
SPDR S&P 500® ETF Trust | | Put | | | USD | | | | 140.00 | | | 4/20/13 | | | 1,900 | | | $ | (247,950 | ) |
| Ÿ | | Credit default swaps – buy protection outstanding as of January 31, 2013 were as follows: |
| | | | | | | | | | | | | | | | | | | | |
| Issuer/Index | | Pay Fixed Rate | | | Counterparty | | Expiration
Date | | Notional Amount (000) | | | Unrealized
Appreciation
(Depreciation) | |
Kingdom of Spain | | | 1.00 | % | | JPMorgan Chase & Co. | | 6/20/14 | | | USD | | | | 4,990 | | | $ | (65,381 | ) |
iTraxx Europe Series 9 3-6% | | | 5.00 | % | | JPMorgan Chase & Co. | | 6/20/15 | | | EUR | | | | 1,470 | | | | (169,063 | ) |
Republic of Portugal | | | 1.00 | % | | JPMorgan Chase & Co. | | 6/20/15 | | | USD | | | | 8,050 | | | | (237,711 | ) |
iTraxx Europe Series 18 Version 1 | | | 1.00 | % | | JPMorgan Chase & Co. | | 12/20/15 | | | EUR | | | | 45,900 | | | | (123,886 | ) |
iTraxx Europe Series 18 Version 1 | | | 1.00 | % | | JPMorgan Chase & Co. | | 12/20/15 | | | EUR | | | | 44,571 | | | | (120,299 | ) |
Republic of Portugal | | | 1.00 | % | | Barclays Plc | | 12/20/15 | | | USD | | | | 900 | | | | (31,869 | ) |
Republic of Portugal | | | 1.00 | % | | Deutsche Bank AG | | 12/20/15 | | | USD | | | | 1,100 | | | | (38,951 | ) |
CDX.NA.IG Series 17 Version 1 | | | 1.00 | % | | Credit Suisse Group AG | | 12/20/16 | | | USD | | | | 4,000 | | | | (124,709 | ) |
CDX.NA.IG Series 17 Version 1 | | | 1.00 | % | | Morgan Stanley | | 12/20/16 | | | USD | | | | 1,000 | | | | (13,755 | ) |
Republic of Ireland | | | 1.00 | % | | Citigroup, Inc. | | 12/20/16 | | | USD | | | | 500 | | | | (80,380 | ) |
Republic of Ireland | | | 1.00 | % | | Citigroup, Inc. | | 12/20/16 | | | USD | | | | 200 | | | | (31,397 | ) |
Republic of Ireland | | | 1.00 | % | | Citigroup, Inc. | | 3/20/17 | | | USD | | | | 500 | | | | (65,456 | ) |
Banco de Sabadell SA | | | 5.00 | % | | BNP Paribas SA | | 6/20/17 | | | EUR | | | | 185 | | | | (21,882 | ) |
CDX.NA.HY Series 18 Version 2 | | | 5.00 | % | | Credit Suisse Group AG | | 6/20/17 | | | USD | | | | 1,485 | | | | (147,334 | ) |
CDX.NA.HY Series 18 Version 2 | | | 5.00 | % | | Credit Suisse Group AG | | 6/20/17 | | | USD | | | | 495 | | | | (43,951 | ) |
CDX.NA.HY Series 18 Version 2 | | | 5.00 | % | | Morgan Stanley | | 6/20/17 | | | USD | | | | 495 | | | | (34,019 | ) |
CDX.NA.IG Series 18 Version 1 | | | 1.00 | % | | Credit Suisse Group AG | | 6/20/17 | | | USD | | | | 7,500 | | | | (162,582 | ) |
CDX.NA.IG Series 18 Version 1 | | | 1.00 | % | | JPMorgan Chase & Co. | | 6/20/17 | | | USD | | | | 500 | | | | (7,387 | ) |
iTraxx Europe Crossover Series 17 Version 1 | | | 5.00 | % | | Citigroup, Inc. | | 6/20/17 | | | EUR | | | | 1,850 | | | | (177,758 | ) |
La Caixa | | | 3.00 | % | | BNP Paribas SA | | 6/20/17 | | | EUR | | | | 185 | | | | (7,044 | ) |
La Caixa | | | 3.00 | % | | BNP Paribas SA | | 6/20/17 | | | EUR | | | | 140 | | | | (5,665 | ) |
Lloyds TSB Bank Plc | | | 3.00 | % | | Morgan Stanley | | 6/20/17 | | | EUR | | | | 275 | | | | (35,702 | ) |
Republic of Portugal | | | 1.00 | % | | Citigroup, Inc. | | 6/20/17 | | | USD | | | | 1,000 | | | | (194,814 | ) |
Banco Bilbao Vizcaya Argentaria SA | | | 3.00 | % | | Citigroup, Inc. | | 9/20/17 | | | EUR | | | | 230 | | | | (17,496 | ) |
Banco de Sabadell SA | | | 5.00 | % | | JPMorgan Chase & Co. | | 9/20/17 | | | EUR | | | | 650 | | | | (79,869 | ) |
Barclays Bank Plc | | | 1.00 | % | | BNP Paribas SA | | 9/20/17 | | | EUR | | | | 500 | | | | (19,778 | ) |
Kingdom of Spain | | | 1.00 | % | | Barclays Plc | | 9/20/17 | | | USD | | | | 665 | | | | (72,548 | ) |
Kingdom of Spain | | | 1.00 | % | | Barclays Plc | | 9/20/17 | | | USD | | | | 110 | | | | (12,652 | ) |
Kingdom of Spain | | | 1.00 | % | | BNP Paribas SA | | 9/20/17 | | | USD | | | | 1,020 | | | | (99,981 | ) |
Peugeot SA | | | 5.00 | % | | Barclays Plc | | 9/20/17 | | | EUR | | | | 800 | | | | (15,439 | ) |
Peugeot SA | | | 5.00 | % | | BNP Paribas SA | | 9/20/17 | | | EUR | | | | 638 | | | | (21,681 | ) |
Peugeot SA | | | 5.00 | % | | Citigroup, Inc. | | 9/20/17 | | | EUR | | | | 1,070 | | | | (30,475 | ) |
Banco Bilbao Vizcaya Argentaria SA | | | 3.00 | % | | BNP Paribas SA | | 12/20/17 | | | EUR | | | | 300 | | | | (19,934 | ) |
| | | | | | |
See Notes to Financial Statements. | | | | |
| | | | | | | |
| | BLACKROCK FUNDS | | JANUARY 31, 2013 | | 23 |
| | |
| Schedule of Investments (continued) | | BlackRock Global Long/Short Credit Fund |
| Ÿ | | Credit default swaps — buy protection outstanding as of January 31, 2013 were as follows: (continued) |
| | | | | | | | | | | | | | | | |
| Issuer/Index | | Pay Fixed Rate | | | Counterparty | | Expiration
Date | | Notional
Amount (000) | | | Unrealized
Appreciation (Depreciation) | |
Banco Popular Espanol SA | | | 5.00 | % | | BNP Paribas SA | | 12/20/17 | | EUR | 800 | | | $ | (101,695 | ) |
Barclays Bank Plc | | | 1.00 | % | | JPMorgan Chase & Co. | | 12/20/17 | | EUR | 1,540 | | | | (26,933 | ) |
Barclays Bank Plc | | | 1.00 | % | | JPMorgan Chase & Co. | | 12/20/17 | | EUR | 1,540 | | | | (26,933 | ) |
Clariant AG | | | 1.00 | % | | BNP Paribas SA | | 12/20/17 | | EUR | 1,900 | | | | (60,161 | ) |
Clariant AG | | | 1.00 | % | | JPMorgan Chase & Co. | | 12/20/17 | | EUR | 1,590 | | | | (29,684 | ) |
Compagnie de Saint-Gobain SA | | | 1.00 | % | | Goldman Sachs Group, Inc. | | 12/20/17 | | EUR | 500 | | | | (1,536 | ) |
Compagnie de Saint-Gobain SA | | | 1.00 | % | | JPMorgan Chase & Co. | | 12/20/17 | | EUR | 25 | | | | (311 | ) |
Deutsche DSM | | | 1.00 | % | | Deutsche Bank AG | | 12/20/17 | | EUR | 500 | | | | (2,812 | ) |
Finmeccanica SpA | | | 5.00 | % | | BNP Paribas SA | | 12/20/17 | | EUR | 870 | | | | (41,519 | ) |
iTraxx Europe Crossover Series 18 Version 1 | | | 5.00 | % | | Barclays Plc | | 12/20/17 | | EUR | 2,800 | | | | (178,836 | ) |
iTraxx Europe Crossover Series 18 Version 1 | | | 5.00 | % | | BNP Paribas SA | | 12/20/17 | | EUR | 7,100 | | | | (49,728 | ) |
iTraxx Europe Crossover Series 18 Version 1 | | | 5.00 | % | | JPMorgan Chase & Co. | | 12/20/17 | | EUR | 2,800 | | | | (178,147 | ) |
iTraxx Europe Crossover Series 18 Version 1 | | | 5.00 | % | | JPMorgan Chase & Co. | | 12/20/17 | | EUR | 2,750 | | | | (147,014 | ) |
iTraxx Europe Crossover Series 18 Version 1 | | | 5.00 | % | | JPMorgan Chase & Co. | | 12/20/17 | | EUR | 2,750 | | | | (163,647 | ) |
iTraxx Europe Crossover Series 18 Version 1 | | | 5.00 | % | | JPMorgan Chase & Co. | | 12/20/17 | | EUR | 530 | | | | (14,758 | ) |
iTraxx Europe Series 18 Version 1 | | | 1.00 | % | | Citigroup, Inc. | | 12/20/17 | | EUR | 2,235 | | | | (27,026 | ) |
iTraxx Sub Financials Series 18 Version 1 | | | 1.00 | % | | Citigroup, Inc. | | 12/20/17 | | EUR | 60 | | | | (1,403 | ) |
iTraxx Sub Financials Series 18 Version 1 | | | 1.00 | % | | UBS AG | | 12/20/17 | | EUR | 3,250 | | | | (48,084 | ) |
Lafarge SA | | | 1.00 | % | | Barclays Plc | | 12/20/17 | | EUR | 500 | | | | (9,975 | ) |
Lafarge SA | | | 1.00 | % | | Credit Suisse Group AG | | 12/20/17 | | EUR | 500 | | | | (10,226 | ) |
Ryder System, Inc. | | | 1.00 | % | | BNP Paribas SA | | 12/20/17 | | USD | 1,000 | | | | (30,040 | ) |
Societe Generale SA | | | 3.00 | % | | Barclays Plc | | 12/20/17 | | EUR | 230 | | | | (5,917 | ) |
Societe Generale SA | | | 3.00 | % | | Citigroup, Inc. | | 12/20/17 | | EUR | 500 | | | | (19,564 | ) |
Societe Generale SA | | | 3.00 | % | | Deutsche Bank AG | | 12/20/17 | | EUR | 550 | | | | (21,192 | ) |
Societe Generale SA | | | 3.00 | % | | JPMorgan Chase & Co. | | 12/20/17 | | EUR | 140 | | | | (3,719 | ) |
Societe Generale SA | | | 3.00 | % | | UBS AG | | 12/20/17 | | EUR | 190 | | | | (5,147 | ) |
Telenor ASA | | | 1.00 | % | | Barclays Plc | | 12/20/17 | | EUR | 1,520 | | | | (10,526 | ) |
UPM-Kymmene Oyj | | | 5.00 | % | | JPMorgan Chase & Co. | | 12/20/17 | | EUR | 440 | | | | (14,811 | ) |
Wolters Kluwer NV | | | 1.00 | % | | Citigroup, Inc. | | 12/20/17 | | EUR | 2,350 | | | | 24,355 | |
Xerox Corp. | | | 1.00 | % | | Credit Suisse Group AG | | 12/20/17 | | USD | 650 | | | | (27,051 | ) |
Xerox Corp. | | | 1.00 | % | | JPMorgan Chase & Co. | | 12/20/17 | | USD | 225 | | | | (8,105 | ) |
Xerox Corp. | | | 1.00 | % | | JPMorgan Chase & Co. | | 12/20/17 | | USD | 125 | | | | (4,637 | ) |
Banco Popular Espanol SA | | | 5.00 | % | | Barclays Plc | | 3/20/18 | | EUR | 1,380 | | | | (19,147 | ) |
Barrick Gold Corp. | | | 1.00 | % | | JPMorgan Chase & Co. | | 3/20/18 | | USD | 2,000 | | | | (1,931 | ) |
Commerzbank AG | | | 1.00 | % | | Barclays Plc | | 3/20/18 | | EUR | 3,750 | | | | (16,809 | ) |
Dell, Inc. | | | 1.00 | % | | Barclays Plc | | 3/20/18 | | USD | 500 | | | | 388 | |
Dell, Inc. | | | 1.00 | % | | Barclays Plc | | 3/20/18 | | USD | 500 | | | | (418 | ) |
Dell, Inc. | | | 1.00 | % | | Credit Suisse Group AG | | 3/20/18 | | USD | 1,250 | | | | (3,744 | ) |
Deutsche Bank AG | | | 1.00 | % | | Barclays Plc | | 3/20/18 | | EUR | 3,700 | | | | (4,643 | ) |
Deutsche Bank AG | | | 1.00 | % | | Citigroup, Inc. | | 3/20/18 | | EUR | 1,500 | | | | (1,176 | ) |
Expedia, Inc. | | | 1.00 | % | | Credit Suisse Group AG | | 3/20/18 | | USD | 1,000 | | | | (7,310 | ) |
Expedia, Inc. | | | 1.00 | % | | JPMorgan Chase & Co. | | 3/20/18 | | USD | 1,000 | | | | 1,720 | |
Kingdom of Spain | | | 1.00 | % | | Citigroup, Inc. | | 3/20/18 | | USD | 2,350 | | | | (34,554 | ) |
Koninklijke DSM NV | | | 1.00 | % | | Credit Suisse Group AG | | 3/20/18 | | EUR | 7,600 | | | | (22,500 | ) |
Lockheed Martin Corp. | | | 1.00 | % | | BNP Paribas SA | | 3/20/18 | | USD | 2,500 | | | | (11,355 | ) |
Marks & Spencer Group Plc | | | 1.00 | % | | Credit Suisse Group AG | | 3/20/18 | | EUR | 1,320 | | | | 20,424 | |
Northrop Grumman Corp. | | | 1.00 | % | | BNP Paribas SA | | 3/20/18 | | USD | 2,500 | | | | (11,137 | ) |
Peugeot SA | | | 5.00 | % | | Citigroup, Inc. | | 3/20/18 | | EUR | 3,200 | | | | 154,531 | |
Republic of Ireland | | | 1.00 | % | | Bank of America Corp. | | 3/20/18 | | USD | 850 | | | | 3,017 | |
See Notes to Financial Statements.
| | | | | | |
| | | | | | | |
| 24 | | BLACKROCK FUNDS | | JANUARY 31, 2013 | | |
| | |
Schedule of Investments (continued) | | BlackRock Global Long/Short Credit Fund |
| Ÿ | | Credit default swaps — buy protection outstanding as of January 31, 2013 were as follows: (concluded) |
| | | | | | | | | | | | | | | | |
| Issuer/Index | | Pay
Fixed Rate | | | Counterparty | | Expiration
Date | | Notional
Amount (000) | | | Unrealized
Appreciation
(Depreciation) | |
Republic of Ireland | | | 1.00 | % | | Deutsche Bank AG | | 3/20/18 | | USD | 1,000 | | | $ | 3,550 | |
Republic of Italy | | | 1.00 | % | | Barclays Plc | | 3/20/18 | | USD | 6,750 | | | | 22,924 | |
Xstrata Plc | | | 1.00 | % | | JPMorgan Chase & Co. | | 3/20/18 | | EUR | 2,590 | | | | 23,275 | |
Total | | | | | | | | | | | | | | $ | (3,482,525 | ) |
| | | | | | | | | | | | | | | | |
| Ÿ | | Credit default swaps — sold protection outstanding as of January 31, 2013 were as follows: |
| | | | | | | | | | | | | | | | | | | | |
| Issuer/Index | | Receive
Fixed Rate | | | Counterparty | | Expiration
Date | | Credit
Rating1 | | | Notional
Amount (000)2 | | | Unrealized
Appreciation
(Depreciation) | |
iTraxx Europe Series 9 0-3% | | | 5.00 | % | | JPMorgan Chase & Co. | | 6/20/13 | | | BBB+ | | | EUR | 570 | | | $ | 46,851 | |
iTraxx Europe Series 9 0-3% | | | 5.00 | % | | Morgan Stanley | | 6/20/13 | | | BBB+ | | | EUR | 290 | | | | 39,400 | |
ARAMARK Corp. | | | 5.00 | % | | BNP Paribas SA | | 12/20/16 | | | B | | | USD | 250 | | | | 35,465 | |
CDX.NA.HY Series 17 Version 5 | | | 5.00 | % | | Credit Suisse Group AG | | 12/20/16 | | | B+ | | | USD | 960 | | | | 109,820 | |
CDX.NA.HY Series 17 Version 5 | | | 5.00 | % | | Credit Suisse Group AG | | 12/20/16 | | | B+ | | | USD | 960 | | | | 88,691 | |
CDX.NA.IG Series 17 Version 1 | | | 1.00 | % | | Credit Suisse Group AG | | 12/20/16 | | | BBB+ | | | USD | 5,000 | | | | 138,915 | |
Republic of Italy | | | 1.00 | % | | Citigroup, Inc. | | 12/20/16 | | | Not Rated | | | USD | 500 | | | | 42,744 | |
Republic of Italy | | | 1.00 | % | | Citigroup, Inc. | | 12/20/16 | | | Not Rated | | | USD | 200 | | | | 16,556 | |
Sunrise Communications Holdings SA | | | 5.00 | % | | Credit Suisse Group AG | | 3/20/17 | | | B- | | | EUR | 500 | | | | 67,553 | |
CDX.NA.HY Series 18 Version 2 | | | 5.00 | % | | Credit Suisse Group AG | | 6/20/17 | | | B+ | | | USD | 1,485 | | | | 157,673 | |
Sunrise Communications Holdings SA | | | 5.00 | % | | Citigroup, Inc. | | 6/20/17 | | | B- | | | EUR | 290 | | | | 42,114 | |
Ardagh Packaging Finance Plc | | | 5.00 | % | | Barclays Plc | | 9/20/17 | | | CCC+ | | | EUR | 90 | | | | 12,091 | |
Ardagh Packaging Finance Plc | | | 5.00 | % | | Credit Suisse Group AG | | 9/20/17 | | | CCC+ | | | EUR | 140 | | | | 19,189 | |
Credit Suisse Group AG | | | 1.00 | % | | BNP Paribas SA | | 9/20/17 | | | A | | | EUR | 500 | | | | 26,798 | |
Gas Natural SDG SA | | | 1.00 | % | | Barclays Plc | | 9/20/17 | | | BBB | | | EUR | 300 | | | | 36,696 | |
Gas Natural SDG SA | | | 1.00 | % | | Barclays Plc | | 9/20/17 | | | BBB | | | EUR | 275 | | | | 40,770 | |
Repsol International Finance BV | | | 1.00 | % | | Barclays Plc | | 9/20/17 | | | BBB- | | | EUR | 275 | | | | 39,572 | |
BASF SE | | | 1.00 | % | | Barclays Plc | | 12/20/17 | | | A+ | | | EUR | 500 | | | | 4,267 | |
CDX.NA.HY Series 19 Version 1 | | | 5.00 | % | | Credit Suisse Group AG | | 12/20/17 | | | B+ | | | USD | 4,000 | | | | 6,207 | |
CDX.NA.IG Series 19 Version 1 | | | 1.00 | % | | Goldman Sachs Group, Inc. | | 12/20/17 | | | BBB+ | | | USD | 6,500 | | | | (3,847 | ) |
Credit Suisse Group AG | | | 1.00 | % | | JPMorgan Chase & Co. | | 12/20/17 | | | A | | | EUR | 1,540 | | | | 26,867 | |
Deutsche Bank AG | | | 1.00 | % | | JPMorgan Chase & Co. | | 12/20/17 | | | A+ | | | EUR | 1,540 | | | | 51,219 | |
Deutsche Telekom AG | | | 1.00 | % | | Deutsche Bank AG | | 12/20/17 | | | BBB+ | | | EUR | 1,000 | | | | (458 | ) |
E. ON AG | | | 1.00 | % | | JPMorgan Chase & Co. | | 12/20/17 | | | A- | | | EUR | 500 | | | | (243 | ) |
Gas Natural SDG SA | | | 1.00 | % | | JPMorgan Chase & Co. | | 12/20/17 | | | BBB | | | EUR | 495 | | | | 28,063 | |
Holcim Ltd. | | | 1.00 | % | | Goldman Sachs Group, Inc. | | 12/20/17 | | | BBB | | | EUR | 600 | | | | 3,323 | |
Holcim Ltd. | | | 1.00 | % | | JPMorgan Chase & Co. | | 12/20/17 | | | BBB | | | EUR | 1,130 | | | | 2,586 | |
Imperial Tobacco Group Plc | | | 1.00 | % | | Citigroup, Inc. | | 12/20/17 | | | BBB | | | EUR | 500 | | | | 2,497 | |
Imperial Tobacco Group Plc | | | 1.00 | % | | Deutsche Bank AG | | 12/20/17 | | | BBB | | | EUR | 1,000 | | | | (2,249 | ) |
iTraxx Europe Crossover Series 18 Version 1 | | | 5.00 | % | | Barclays Plc | | 12/20/17 | | | B+ | | | EUR | 7,350 | | | | 18,822 | |
iTraxx Europe Crossover Series 18 Version 1 | | | 5.00 | % | | Barclays Plc | | 12/20/17 | | | B+ | | | EUR | 1,350 | | | | 37,541 | |
iTraxx Europe Crossover Series 18 Version 1 | | | 5.00 | % | | Citigroup, Inc. | | 12/20/17 | | | B+ | | | EUR | 110 | | | | 6,773 | |
iTraxx Europe Crossover Series 18 Version 1 | | | 5.00 | % | | Deutsche Bank AG | | 12/20/17 | | | B+ | | | EUR | 7,350 | | | | (22,942 | ) |
iTraxx Europe Crossover Series 18 Version 1 | | | 5.00 | % | | Deutsche Bank AG | | 12/20/17 | | | B+ | | | EUR | 5,600 | | | | (14,340 | ) |
iTraxx Europe Series 18 Version 1 | | | 1.00 | % | | JPMorgan Chase & Co. | | 12/20/17 | | | A- | | | EUR | 34,400 | | | | 143,861 | |
iTraxx Europe Series 18 Version 1 | | | 1.00 | % | | JPMorgan Chase & Co. | | 12/20/17 | | | A- | | | EUR | 22,950 | | | | 95,977 | |
iTraxx Financials Series 18 Version 1 | | | 1.00 | % | | JPMorgan Chase & Co. | | 12/20/17 | | | A | | | EUR | 3,750 | | | | 17,082 | |
Pearson Plc | | | 1.00 | % | | Citigroup, Inc. | | 12/20/17 | | | BBB+ | | | EUR | 2,350 | | | | (15,795 | ) |
Sabre Holdings Corp. TSG | | | 5.00 | % | | Goldman Sachs Group, Inc. | | 12/20/17 | | | CCC+ | | | USD | 1,000 | | | | 54,883 | |
Stora Enso Oyj | | | 5.00 | % | | JPMorgan Chase & Co. | | 12/20/17 | | | BB | | | EUR | 440 | | | | 20,601 | |
See Notes to Financial Statements.
| | | | | | |
| | | | | | | |
| | BLACKROCK FUNDS | | JANUARY 31, 2013 | | 25 |
| | |
| Schedule of Investments (continued) | | BlackRock Global Long/Short Credit Fund |
| Ÿ | | Credit default swaps — sold protection outstanding as of January 31, 2013 were as follows: (concluded) |
| | | | | | | | | | | | | | | | | | | | |
| Issuer/Index | | Receive
Fixed Rate | | | Counterparty | | Expiration
Date | | Credit
Rating1 | | | Notional
Amount (000)2 | | | Unrealized
Appreciation (Depreciation) | |
Sunrise Communications Holdings SA | | | 5.00 | % | | Credit Suisse Group AG | | 12/20/17 | | | B- | | | EUR | 490 | | | $ | 4,790 | |
Sunrise Communications Holdings SA | | | 5.00 | % | | Goldman Sachs Group, Inc. | | 12/20/17 | | | B- | | | EUR | 570 | | | | 11,097 | |
ThyssenKrupp AG | | | 1.00 | % | | Credit Suisse Group AG | | 12/20/17 | | | BB | | | EUR | 800 | | | | 13,691 | |
ThyssenKrupp AG | | | 1.00 | % | | Goldman Sachs Group, Inc. | | 12/20/17 | | | BB | | | EUR | 600 | | | | 11,988 | |
ThyssenKrupp AG | | | 1.00 | % | | JPMorgan Chase & Co. | | 12/20/17 | | | BB | | | EUR | 540 | | | | 10,789 | |
Glencore International AG | | | 1.00 | % | | JPMorgan Chase & Co. | | 3/20/18 | | | BBB | | | EUR | 2,590 | | | | (1,912 | ) |
Holcim Ltd. | | | 1.00 | % | | JPMorgan Chase & Co. | | 3/20/18 | | | BBB | | | EUR | 1,280 | | | | (3,443 | ) |
Intesa Sanpaolo SpA | | | 1.00 | % | | Bank of America Corp. | | 3/20/18 | | | BBB+ | | | EUR | 2,600 | | | | (27,784 | ) |
Republic of Italy | | | 1.00 | % | | Barclays Plc | | 3/20/18 | | | Not Rated | | | EUR | 5,050 | | | | (25,153 | ) |
Sabre Holdings Corp. TSG | | | 5.00 | % | | Goldman Sachs Group, Inc. | | 3/20/18 | | | CCC+ | | | USD | 1,500 | | | | 8,565 | |
Schaeffler Finance BV | | | 5.00 | % | | Barclays Plc | | 3/20/18 | | | B | | | EUR | 650 | | | | 16,691 | |
Schaeffler Finance BV | | | 5.00 | % | | Credit Suisse Group AG | | 3/20/18 | | | B | | | EUR | 650 | | | | 13,624 | |
Swiss Reinsurnace Co. Ltd. | | | 1.00 | % | | Barclays Plc | | 3/20/18 | | | AA- | | | EUR | 3,700 | | | | (6,323 | ) |
Swiss Reinsurnace Co. Ltd. | | | 1.00 | % | | Citigroup, Inc. | | 3/20/18 | | | AA- | | | EUR | 1,500 | | | | (1,789 | ) |
ThyssenKrupp AG | | | 1.00 | % | | Credit Suisse Group AG | | 3/20/18 | | | BB | | | EUR | 1,450 | | | | (20,545 | ) |
UniCredit SpA | | | 3.00 | % | | Barclays Plc | | 3/20/18 | | | BBB+ | | | EUR | 1,300 | | | | (3,453 | ) |
UniCredit SpA | | | 3.00 | % | | JPMorgan Chase & Co. | | 3/20/18 | | | BBB+ | | | EUR | 2,600 | | | | (14,846 | ) |
Total | | | | | | | | | | | | | | | | | | $ | 1,407,580 | |
| 1 | | Using S&P’s rating of the underlying securities of the index, as applicable. |
| 2 | | The maximum potential amount the Fund may pay should a negative credit event take place as defined under the terms of the agreement. |
| Ÿ | | Fair Value Measurements — Various inputs are used in determining the fair value of investments and derivative financial instruments. These inputs to valuation techniques are categorized into a disclosure hierarchy consisting of three broad levels for financial statement purposes as follows: |
| Ÿ | | Level 1 — unadjusted price quotations in active markets/exchanges for identical assets and liabilities that the Fund has the ability to access |
| Ÿ | | Level 2 — other observable inputs (including, but not limited to, quoted prices for similar assets or liabilities in markets that are active, quoted prices for identical or similar assets or liabilities in markets that are not active, inputs other than quoted prices that are observable for the assets or liabilities (such as interest rates, yield curves, volatilities, prepayment speeds, loss severities, credit risks and default rates) or other market–corroborated inputs) |
| Ÿ | | Level 3 — unobservable inputs based on the best information available in the circumstances, to the extent observable inputs are not available (including the Fund’s own assumptions used in determining the fair value of investments and derivative financial instruments) |
The hierarchy gives the highest priority to unadjusted quoted prices in active markets for identical assets or liabilities (Level 1 measurements) and the lowest priority to unobservable inputs (Level 3 measurements). Accordingly, the degree of judgment exercised in determining fair value is greatest for instruments categorized in Level 3. The inputs used to measure fair value may fall into different levels of the fair value hierarchy. In such cases, for disclosure purposes, the level in the fair value hierarchy within which the fair value measurement falls in its entirety is determined based on the lowest level input that is significant to the fair value measurement in its entirety.
Changes in valuation techniques may result in transfers into or out of an assigned level within the disclosure hierarchy. In accordance with the Fund’s policy, transfers between different levels of the fair value disclosure hierarchy are deemed to have occurred as of the beginning of the reporting period. The categorization of a value determined for investments and derivative financial instruments is based on the pricing transparency of the investment and derivative financial instrument and is not necessarily an indication of the risks associated with investing in those securities. For information about the Fund’s policy regarding valuation of investments and derivative financial instruments and other significant accounting policies, please refer to Note 1 of the Notes to Financial Statements.
The following tables summarize the Fund’s investments and derivative financial instruments categorized in the disclosure hierarchy as of January 31, 2013:
| | | | | | | | | | | | | | | | |
| | | Level 1 | | | Level 2 | | | Level 3 | | | Total | |
Assets: | | | | | | | | | | | | | | | | |
| Investments: | | | | | | | | | | | | | | | | |
Long-Term Investments: | | | | | | | | | | | | | | | | |
Corporate Bonds. | | | — | | | $ | 276,866,681 | | | | — | | | $ | 276,866,681 | |
Floating Rate Loan Interests | | | — | | | | 49,367,157 | | | $ | 1,306,319 | | | | 50,673,476 | |
Foreign Agency Obligations | | | — | | | | 9,073,808 | | | | — | | | | 9,073,808 | |
See Notes to Financial Statements.
| | | | | | |
| | | | | | | |
| 26 | | BLACKROCK FUNDS | | JANUARY 31, 2013 | | |
| | |
| Schedule of Investments (concluded) | | BlackRock Global Long/Short Credit Fund |
| | | | | | | | | | | | | | | | |
| | | Level 1 | | | Level 2 | | | Level 3 | | | Total | |
Foreign Government Obligations | | | — | | | $ | 66,763,337 | | | | — | | | $ | 66,763,337 | |
Non-Agency Mortgage-Backed Securities | | | — | | | | 6,919,678 | | | | — | | | | 6,919,678 | |
Preferred Securities | | $ | 1,036,400 | | | | 9,549,405 | | | | — | | | | 10,585,805 | |
U.S. Treasury Obligations | | | — | | | | 2,915,041 | | | | — | | | | 2,915,041 | |
Short-Term Securities: | | | | | | | | | | | | | | | | |
Borrowed Bond Agreements | | | — | | | | 121,751,341 | | | | — | | | | 121,751,341 | |
Money Market Funds | | | 173,744,351 | | | | — | | | | — | | | | 173,744,351 | |
Options Purchased: | | | | | | | | | | | | | | | | |
Equity Contracts | | | 822,756 | | | | — | | | | — | | | | 822,756 | |
| Liabilities: | | | | | | | | | | | | | | | | |
Investments: | | | | | | | | | | | | | | | | |
Borrowed Bonds | | | — | | | | (117,615,720 | ) | | | — | | | | (117,615,720 | ) |
| |
| Total | | $ | 175,603,507 | | | $ | 425,590,728 | | | $ | 1,306,319 | | | $ | 602,500,554 | |
| | | | |
| | | | | | | | | | | | | | | | |
| | | Level 1 | | | Level 2 | | | Level 3 | | | Total | |
| Derivative Financial Instruments1 | | | | | | | | | | | | | | | | |
| Assets: | | | | | | | | | | | | | | | | |
Credit contracts | | | — | | | $ | 1,826,886 | | | | — | | | $ | 1,826,886 | |
Foreign currency exchange contracts | | | — | | | | 401,069 | | | | — | | | | 401,069 | |
Interest rate contracts | | $ | 840,598 | | | | — | | | | — | | | | 840,598 | |
Liabilities: | | | | | | | | | | | | | | | | |
Credit contracts | | | — | | | | (3,901,831 | ) | | | — | | | | (3,901,831 | ) |
Equity contracts | | | (247,950 | ) | | | — | | | �� | — | | | | (247,950 | ) |
Foreign currency exchange contracts | | | 53,415 | | | | (2,710,174 | ) | | | — | | | | (2,656,759 | ) |
Interest rate contracts | | | (24,604 | ) | | | — | | | | — | | | | (24,604 | ) |
| |
| Total | | $ | 621,459 | | | $ | (4,384,050 | ) | | | — | | | $ | (3,762,591 | ) |
| | | | |
| 1 | | Derivative financial instruments are swaps, financial futures contracts, foreign currency exchange contracts and options written. Swaps, financial futures contracts and foreign currency exchange contracts are valued at the unrealized appreciation/depreciation on the instrument and options written are shown at value. |
Certain of the Fund’s assets are held at carrying amount, which approximates fair value for financial statement purposes. As of January 31, 2013, such assets are categorized within the disclosure hierarchy as follows:
| | | | | | | | | | | | | | | | |
| | | Level 1 | | | Level 2 | | | Level 3 | | | Total | |
Assets: | | | | | | | | | | | | | | | | |
Cash | | $ | 638,170 | | | | — | | | | — | | | $ | 638,170 | |
Foreign currency at value | | | 4,168,723 | | | | — | | | | — | | | | 4,168,723 | |
Cash pledged as collateral for financial futures contracts | | | 1,271,000 | | | | — | | | | — | | | | 1,271,000 | |
Cash pledged as collateral for borrowed bond agreements | | | 1,400,000 | | | | — | | | | — | | | | 1,400,000 | |
Liabilities: | | | | | | | | | | | | | | | | |
Cash received as collateral for borrowed bond agreements | | | — | | | $ | (560,000 | ) | | | — | | | | (560,000 | ) |
Cash received as collateral for swap contracts | | | — | | | | (600,000 | ) | | | — | | | | (600,000 | ) |
| |
Total | | $ | 7,477,893 | | | $ | (1,160,000 | ) | | | — | | | $ | 6,317,893 | |
| | | | |
There were no transfers between levels during the six months ended January 31, 2013.
Certain of the Fund’s investments that are categorized as Level 3 were valued utilizing transaction prices or third party pricing information without adjustment. Such valuations are based on unobservable inputs. A significant change in third party information inputs could result in a significantly lower or higher value in such Level 3 investments.
See Notes to Financial Statements.
| | | | | | |
| | | | | | | |
| | BLACKROCK FUNDS | | JANUARY 31, 2013 | | 27 |
| | |
| Statements of Assets and Liabilities | | |
| | | | | | | | |
| January 31, 2013 (Unaudited) | | BlackRock
Commodity
Strategies Fund1 | | | BlackRock
Global Long/Short
Credit Fund | |
| | | | | | | | |
| Assets | | | | | | | | |
Investments at value — unaffiliated2 | | $ | 355,995,535 | | | $ | 546,371,923 | |
Investments at value — affiliated3 | | | 104,752,052 | | | | 173,744,351 | |
Cash | | | — | | | | 638,170 | |
Cash pledged as collateral for financial futures contracts | | | — | | | | 1,271,000 | |
Cash pledged as collateral for swap contracts | | | — | | | | 1,400,000 | |
Foreign currency at value4 | | | 16,984 | | | | 4,168,723 | |
Investments sold receivable | | | 20,262,239 | | | | 29,152,555 | |
Swap premiums paid | | | — | | | | 6,500,971 | |
Unrealized appreciation on foreign currency exchange contracts | | | 1,336 | | | | 454,484 | |
Variation margin receivable | | | — | | | | 9,049 | |
Unrealized appreciation on swaps | | | — | | | | 1,826,886 | |
Capital shares sold receivable | | | 1,690,630 | | | | 13,076,512 | |
Interest receivable | | | 70,980 | | | | 3,932,042 | |
Receivable from Manager | | | 3,748 | | | | 1,926 | |
Dividends receivable — unaffiliated | | | 54,737 | | | | — | |
Dividends receivable — affiliated | | | 1,535 | | | | 11,934 | |
Prepaid expenses | | | 32,257 | | | | 52,949 | |
| | | | |
Total assets | | | 482,882,033 | | | | 782,613,475 | |
| | | | |
| | | | | | | | |
| Liabilities | | | | | | | | |
Bank overdraft | | | 350,854 | | | | — | |
Options written at value5 | | | — | | | | 247,950 | |
Borrowed bonds at value6 | | | — | | | | 117,615,720 | |
Cash received as collateral for swap contracts | | | — | | | | 600,000 | |
Cash received as collateral for borrowed bond agreements | | | — | | | | 560,000 | |
Variation margin payable | | | — | | | | 186,767 | |
Investments purchased payable | | | 103,384,292 | | | | 64,003,021 | |
Swap premiums received | | | — | | | | 4,563,232 | |
Unrealized depreciation on foreign currency exchange contracts | | | 5,416 | | | | 2,710,174 | |
Unrealized depreciation on swaps | | | — | | | | 3,901,831 | |
Interest expense payable | | | — | | | | 1,109,547 | |
Income dividends payable | | | 87 | | | | 216,271 | |
Capital shares redeemed payable | | | 251,570 | | | | 1,675,327 | |
Investment advisory fees payable | | | 353,106 | | | | 424,679 | |
Offering costs payable | | | 24,279 | | | | 969 | |
Other affiliates payable | | | 20,512 | | | | 26,813 | |
Service and distribution fees payable | | | 13,071 | | | | 60,163 | |
Officer’s and Trustees’ fees payable | | | 84 | | | | 54 | |
Other accrued expenses payable | | | 47,511 | | | | 97,705 | |
| | | | |
Total liabilities | | | 104,450,782 | | | | 198,000,223 | |
| | | | |
Net Assets | | $ | 378,431,251 | | | $ | 584,613,252 | |
| | | | |
| | | | | | | | |
| Net Assets Consist of | | | | | | | | |
Paid-in capital | | $ | 383,849,872 | | | $ | 571,776,880 | |
Undistributed net investment income (loss) | | | (711,946 | ) | | | 2,271,622 | |
Accumulated net realized loss | | | (4,072,467 | ) | | | (908,685 | ) |
Net unrealized appreciation/depreciation | | | (634,208 | ) | | | 11,473,435 | |
| | | | |
Net Assets | | $ | 378,431,251 | | | $ | 584,613,252 | |
| | | | |
| | |
1 Consolidated Statement of Assets and Liabilities. | | | | | | | | |
2 Investments at cost — unaffiliated | | $ | 356,641,991 | | | $ | 530,542,137 | |
3 Investments at cost — affiliated | | $ | 104,752,052 | | | $ | 173,744,351 | |
4 Foreign currency at cost | | $ | 16,979 | | | $ | 4,149,679 | |
5 Premiums received | | | — | | | $ | 248,900 | |
6 Proceeds received from borrowed bond agreements | | | — | | | $ | 116,837,864 | |
| | | | | | |
See Notes to Financial Statements. | | | | |
| | | | | | | |
| 28 | | BLACKROCK FUNDS | | JANUARY 31, 2013 | | |
| | |
| Statements of Assets and Liabilities (concluded) | | |
| | | | | | | | |
| January 31, 2013 (Unaudited) | | BlackRock
Commodity
Strategies Fund1 | | | BlackRock Global Long/Short Credit Fund | |
| | | | | | | | |
| Net Asset Value | | | | | | | | |
| Institutional | | | | | | | | |
Net assets | | $ | 347,083,062 | | | $ | 339,599,850 | |
| | | | |
Shares outstanding2 | | | 33,630,909 | | | | 31,968,274 | |
| | | | |
Net asset value | | $ | 10.32 | | | $ | 10.62 | |
| | | | |
| | | | | | | | |
| Investor A | | | | | | | | |
Net assets | | $ | 19,669,096 | | | $ | 213,887,346 | |
| | | | |
Shares outstanding2 | | | 1,908,988 | | | | 20,164,060 | |
| | | | |
Net asset value | | $ | 10.30 | | | $ | 10.61 | |
| | | | |
| | | | | | | | |
| Investor C | | | | | | | | |
Net assets | | $ | 11,679,093 | | | $ | 31,126,056 | |
| | | | |
Shares outstanding2 | | | 1,144,594 | | | | 2,947,178 | |
| | | | |
Net asset value | | $ | 10.20 | | | $ | 10.56 | |
| | | | |
| | 1 | | Consolidated Statement of Assets and Liabilities. |
| | 2 | | Unlimited number of shares authorized, $0.001 par value. |
| | | | | | |
See Notes to Financial Statements. | | | | |
| | | | | | | |
| | BLACKROCK FUNDS | | JANUARY 31, 2013 | | 29 |
| | | | | | | | |
| Period Ended January 31, 2013 (Unaudited) | | BlackRock
Commodity
Strategies Fund1 | | | BlackRock
Global Long/Short
Credit Fund | |
| | | | | | | | |
| Investment Income | | | | | | | | |
Dividends — unaffiliated | | $ | 1,113,388 | | | | — | |
Foreign taxes withheld | | | (61,631 | ) | | | — | |
Dividends — affiliated | | | 8,721 | | | $ | 68,598 | |
Interest | | | 89,495 | | | | 5,969,791 | |
| | | | |
Total income | | | 1,149,973 | | | | 6,038,389 | |
| | | | |
| | | | | | | | |
| Expenses | | | | | | | | |
Investment advisory | | | 1,559,785 | | | | 1,695,062 | |
Administration | | | 101,725 | | | | 133,564 | |
Service and distribution — class specific | | | 69,781 | | | | 255,239 | |
Professional | | | 54,015 | | | | 32,044 | |
Transfer agent — class specific | | | 37,632 | | | | 104,459 | |
Administration — class specific | | | 33,873 | | | | 44,021 | |
Offering | | | 29,547 | | | | 48,947 | |
Custodian | | | 28,039 | | | | 16,607 | |
Registration | | | 20,139 | | | | 30,355 | |
Printing | | | 8,895 | | | | 14,225 | |
Officer and Trustees | | | 2,935 | | | | 5,559 | |
Miscellaneous | | | 15,531 | | | | 45,400 | |
Recoupment of past waived fees | | | — | | | | 3,250 | |
Recoupment of past waived fees — class specific | | | 17,554 | | | | 13,044 | |
| | | | |
Total expenses excluding interest expense | | | 1,979,451 | | | | 2,441,776 | |
Interest expense | | | — | | | | 463,862 | |
| | | | |
Total expenses | | | 1,979,451 | | | | 2,905,638 | |
Less fees waived by Manager | | | (128,628 | ) | | | (35,138 | ) |
Less administration fees waived — class specific | | | (7,029 | ) | | | (23,166 | ) |
Less transfer agent fees waived — class specific | | | (508 | ) | | | (353 | ) |
Less transfer agent fees reimbursed — class specific | | | (16,729 | ) | | | (18,026 | ) |
| | | | |
Total expenses after fees waived and reimbursed | | | 1,826,557 | | | | 2,828,955 | |
| | | | |
Net investment income (loss) | | | (676,584 | ) | | | 3,209,434 | |
| | | | |
| | | | | | | | |
| Realized and Unrealized Gain (Loss) | | | | | | | | |
Net realized gain (loss) from: | | | | | | | | |
Investments | | | (2,541,915 | ) | | | 5,170,086 | |
Capital gain distributions received from affiliated underlying funds | | | 105 | | | | 793 | |
Options written | | | — | | | | 480,148 | |
Financial futures contracts | | | — | | | | 78,884 | |
Swaps | | | — | | | | (85,645 | ) |
Foreign currency transactions | | | (55,357 | ) | | | (4,083,713 | ) |
Securities sold short | | | — | | | | 15,479 | |
Borrowed bonds | | | — | | | | (466,767 | ) |
| | | | |
| | | (2,597,167 | ) | | | 1,109,265 | |
| | | | |
Net change in unrealized appreciation/depreciation on: | | | | | | | | |
Investments | | | 2,404,662 | | | | 14,540,692 | |
Options written | | | — | | | | (744 | ) |
Financial futures contracts | | | — | | | | 1,057,419 | |
Swaps | | | — | | | | (2,344,532 | ) |
Foreign currency translations | | | 11,923 | | | | (2,017,309 | ) |
Securities sold short | | | — | | | | 1,016 | |
Borrowed bonds | | | — | | | | (360,971 | ) |
| | | | |
| | | 2,416,585 | | | | 10,875,571 | |
| | | | |
Total realized and unrealized gain (loss) | | | (180,582 | ) | | | 11,984,836 | |
| | | | |
Net Increase (Decrease) in Net Assets Resulting from Operations | | $ | (857,166 | ) | | $ | 15,194,270 | |
| | | | |
| 1 | | Consolidated Statement of Operations. |
| | | | | | |
See Notes to Financial Statements. | | | | |
| | | | | | | |
| 30 | | BLACKROCK FUNDS | | JANUARY 31, 2013 | | |
| | |
| Statements of Changes in Net Assets | | |
| | | | | | | | | | | | | | | | | | |
| | | BlackRock
Commodity
Strategies Fund1 | | | | | BlackRock
Global Long/Short
Credit Fund | |
| Increase in Net Assets: | | Six Months Ended
January 31,
2013 (Unaudited) | | | Period
October 3, 20112 to July 31,
2012 | | | | | Six Months Ended
January 31,
2013 (Unaudited) | | | Period September 30, 20112 to July 31, 2012 | |
| | | | | | | | | | | | | | | | | | |
| Operations | | | | | | | | | | | | | | | | | | |
Net investment income (loss) | | $ | (676,584 | ) | | $ | (93,087 | ) | | | | $ | 3,209,434 | | | $ | 618,989 | |
Net realized gain (loss) | | | (2,597,167 | ) | | | (48,547 | ) | | | | | 1,109,265 | | | | 2,939,420 | |
Net change in unrealized appreciation/depreciation | | | 2,416,585 | | | | (3,050,793 | ) | | | | | 10,875,571 | | | | 597,864 | |
| | | | |
Net increase (decrease) in net assets resulting from operations | | | (857,166 | ) | | | (3,192,427 | ) | | | | | 15,194,270 | | | | 4,156,273 | |
| | | | |
| | | | | | | | | | | | | | | | | | |
| Dividends and Distributions to Shareholders From | | | | | | | | | | | | | | | | | | |
Net investment income: | | | | | | | | | | | | | | | | | | |
Institutional | | | (68,445 | ) | | | (29,207 | )3 | | | | | (1,675,603 | ) | | | (320,151 | )3 |
Investor A | | | — | | | | (793 | )3 | | | | | (883,225 | ) | | | (116,668 | )3 |
Investor C | | | — | | | | — | | | | | | (64,211 | ) | | | (9,593 | )3 |
Net realized gain: | | | | | | | | | | | | | | | | | | |
Institutional | | | — | | | | (1,302,498 | )3 | | | | | (2,006,485 | ) | | | (44,796 | )3 |
Investor A | | | — | | | | (63,444 | )3 | | | | | (1,285,274 | ) | | | (6,528 | )3 |
Investor C | | | — | | | | (54,453 | )3 | | | | | (208,252 | ) | | | (3,383 | )3 |
| | | | |
Decrease in net assets resulting from dividends and distributions to shareholders | | | (68,445 | ) | | | (1,450,395 | ) | | | | | (6,123,050 | ) | | | (501,119 | ) |
| | | | |
| | | | | | | | | | | | | | | | | | |
| Capital Share Transactions | | | | | | | | | | | | | | | | | | |
Net increase in net assets derived from capital share transactions | | | 292,458,218 | | | | 91,541,466 | | | | | | 357,913,220 | | | | 213,973,658 | |
| | | | |
| | | | | | | | | | | | | | | | | | |
| Net Assets | | | | | | | | | | | | | | | | | | |
Total increase in net assets | | | 291,532,607 | | | | 86,898,644 | | | | | | 366,984,440 | | | | 217,628,812 | |
Beginning of period | | | 86,898,644 | | | | — | | | | | | 217,628,812 | | | | — | |
| | | | |
End of period | | $ | 378,431,251 | | | $ | 86,898,644 | | | | | $ | 584,613,252 | | | $ | 217,628,812 | |
| | | | |
Undistributed net investment income (loss) | | $ | (711,946 | ) | | $ | 33,083 | | | | | $ | 2,271,622 | | | $ | 1,685,227 | |
| | | | |
| 1 | | Consolidated Statement of Changes in Net Assets. |
| 2 | | Commencement of operations. |
| 3 | | Dividends and distributions are determined in accordance with federal income tax regulations. |
| | | | | | |
See Notes to Financial Statements. | | | | |
| | | | | | | |
| | BLACKROCK FUNDS | | JANUARY 31, 2013 | | 31 |
| | |
| Consolidated Statement of Cash Flows | | |
| | | | |
| Six Months Ended January 31, 2013 (Unaudited) | | BlackRock
Commodity
Strategies Fund | |
| | | | |
| Cash Used for Operating Activities | | | | |
Net decrease in net assets resulting from operations | | $ | (857,166 | ) |
Adjustments to reconcile net decrease in net assets resulting from operations to net cash used for operating activities: | | | | |
Increase in dividends receivable — unaffiliated | | | (27,063 | ) |
Increase in interest receivable | | | (48,421 | ) |
Increase in dividends receivable — affiliated | | | (1,305 | ) |
Increase in prepaid expenses | | | (21,125 | ) |
Decrease in deferred offering costs | | | 31,748 | |
Decrease in receivable from Manager | | | 2,882 | |
Increase in service and distribution fees payable | | | 2,989 | |
Increase in investment advisory fees payable | | | 313,031 | |
Increase in other affiliates payable | | | 17,963 | |
Decrease in Officer’s and Trustees’ fees payable | | | (1,122 | ) |
Decrease in professional fees payable | | | (51,673 | ) |
Increase in other accrued expenses payable | | | 10,544 | |
Decrease in offering costs payable | | | (86,510 | ) |
Net realized and unrealized loss on investments | | | 140,912 | |
Amortization of premium and accretion of discount on investments | | | (41,251 | ) |
Proceeds from sales of long-term investments | | | 24,546,546 | |
Purchases of long-term investments | | | (120,255,596 | ) |
Net purchase of short-term securities | | | (195,231,804 | ) |
| | | | |
Cash used for operating activities | | | (291,556,421 | ) |
| | | | |
| | | | |
| Cash Provided by Financing Activities | | | | |
Proceeds from shares sold | | | 345,094,527 | |
Shares redeemed | | | (53,872,446 | ) |
Cash dividends paid to shareholders | | | (4,665 | ) |
Increase in bank overdraft | | | 350,854 | |
| | | | |
Cash provided by financing activities | | | 291,568,270 | |
| | | | |
| | | | |
| Cash and Foreign Currency | | | | |
Net increase in cash and foreign currency | | | 11,849 | |
Cash and foreign currency at beginning of period | | | 5,135 | |
| | | | |
Cash and foreign currency at end of period | | $ | 16,984 | |
| | | | |
| | | | |
| Non-Cash Financing Activities | | | | |
Capital shares issued in reinvestment of dividends paid to shareholders | | $ | 63,693 | |
| | | | |
| | | | | | |
See Notes to Financial Statements. | | | | |
| | | | | | | |
| 32 | | BLACKROCK FUNDS | | JANUARY 31, 2013 | | |
| | |
| Consolidated Financial Highlights | | BlackRock Commodity Strategies Fund |
| | | | | | | | | | | | | | | | | | | | | | | | | | | | | | |
| | | Institutional | | | | | Investor A | | | | | Investor C |
| | | Six Months
Ended
January 31,
2013
(Unaudited) | | | Period
October 3,
20111 to July 31,
2012 | | | | | Six Months
Ended
January 31,
2013
(Unaudited) | | | Period
October 3,
20111 to July 31,
2012 | | | | | Six Months
Ended
January 31,
2013
(Unaudited) | | | Period
October 3,
20111 to July 31,
2012 | | | |
| | | | | | | | | | | | | | | | | | | | | | | | | | | | | | |
| Per Share Operating Performance | | | | | | | | | | | | | | | | | | | | | | | | | | | | | | |
Net asset value, beginning of period | | $ | 9.93 | | | $ | 10.00 | | | | | $ | 9.93 | | | $ | 10.00 | | | | | $ | 9.87 | | | $ | 10.00 | | | |
| | | |
Net investment loss2 | | | (0.02 | ) | | | (0.01 | ) | | | | | (0.02 | ) | | | (0.02 | ) | | | | | (0.06 | ) | | | (0.08 | ) | | |
Net realized and unrealized gain | | | 0.41 | | | | 0.22 | | | | | | 0.39 | | | | 0.22 | | | | | | 0.39 | | | | 0.22 | | | |
| | | |
Net increase from investment operations | | | 0.39 | | | | 0.21 | | | | | | 0.37 | | | | 0.20 | | | | | | 0.33 | | | | 0.14 | | | |
| | | |
| Dividends and distributions from: | | | | | | | | | | | | | | | | | | | | | | | | | | | | | | |
Net investment income | | | (0.00 | )3 | | | (0.01 | )4 | | | | | — | | | | (0.00 | )3,4 | | | | | — | | | | — | | | |
Net realized gain | | | — | | | | (0.27 | )4 | | | | | — | | | | (0.27 | )4 | | | | | — | | | | (0.27 | )4 | | |
| | | |
Total dividends and distributions | | | (0.00 | )3 | | | (0.28 | ) | | | | | — | | | | (0.27 | ) | | | | | — | | | | (0.27 | ) | | |
Net asset value, end of period | | $ | 10.32 | | | $ | 9.93 | | | | | $ | 10.30 | | | $ | 9.93 | | | | | $ | 10.20 | | | $ | 9.87 | | | |
| | | |
| | | | | | | | | | | | | | | | | | | | | | | | | | | | | | |
| Total Investment Return5,6 | | | | | | | | | | | | | | | | | | | | | | | | | | | | | | |
Based on net asset value | | | 3.95% | | | | 2.00% | | | | | | 3.73% | | | | 1.97% | | | | | | 3.34% | | | | 1.29% | | | |
| | | |
| | | | | | | | | | | | | | | | | | | | | | | | | | | | | | |
| Ratios to Average Net Assets7 | | | | | | | | | | | | | | | | | | | | | | | | | | | | | | |
Total expenses | | | 1.38% | 8 | | | 1.87% | 9 | | | | | 1.77% | 8 | | | 2.08% | 9 | | | | | 2.49% | 8 | | | 2.85% | 9 | | |
| | | |
Total expenses excluding recoupment of past waived fees | | | 1.37% | 8 | | | 1.87% | 9 | | | | | 1.77% | 8 | | | 2.08% | 9 | | | | | 2.49% | 8 | | | 2.85% | 9 | | |
| | | |
Total expenses after fees waived and reimbursed | | | 1.30% | | | | 1.30% | | | | | | 1.50% | | | | 1.50% | | | | | | 2.25% | | | | 2.24% | | | |
| | | |
Net investment loss | | | (0.45)% | | | | (0.08)% | | | | | | (0.47)% | | | | (0.26)% | | | | | | (1.24)% | | | | (0.97)% | | | |
| | | |
| | | | | | | | | | | | | | | | | | | | | | | | | | | | | | |
| Supplemental Data | | | | | | | | | | | | | | | | | | | | | | | | | | | | | | |
Net assets, end of period (000) | | $ | 347,083 | | | $ | 62,974 | | | | | $ | 19,669 | | | $ | 15,274 | | | | | $ | 11,679 | | | $ | 8,651 | | | |
| | | |
Portfolio turnover | | | 28% | | | | 127% | | | | | | 28% | | | | 127% | | | | | | 28% | | | | 127% | | | |
| | | |
| | 1 | | Commencement of operations. |
| | 2 | | Based on average shares outstanding. |
| | 3 | | Amount is greater than $(0.005) per share. |
| | 4 | | Dividends and distributions are determined in accordance with federal income tax regulations. |
| | 5 | | Where applicable, total investment returns exclude the effects of any sales charges and include the reinvestment of dividends and distributions. |
| | 6 | | Aggregate total investment return. |
| | 8 | | Offering costs were not annualized in the calculation of the expense ratios. If these expenses were annualized, the total expenses for Institutional, Investor A and Investor C would have been 1.39%, 1.80% and 2.52%, respectively. |
| | 9 | | Organization costs were not annualized in the calculation of the expense ratios. If these expenses were annualized, the total expenses for Institutional, Investor A and Investor C would have been 1.89%, 2.08% and 2.85%, respectively. |
| | | | | | |
See Notes to Financial Statements. | | | | |
| | | | | | | |
| | BLACKROCK FUNDS | | JANUARY 31, 2013 | | 33 |
| | |
| Financial Highlights | | BlackRock Global Long/Short Credit Fund |
| | | | | | | | | | | | | | | | | | | | | | | | | | |
| | | Institutional | | | Investor A | | | Investor C |
| | | Six Months
Ended
January 31,
2013
(Unaudited) | | | Period
September 30,
20111 to July 31, 2012 | | | Six Months
Ended
January 31,
2013
(Unaudited) | | | Period
September 30,
20111 to July 31, 2012 | | | Six Months
Ended
January 31,
2013
(Unaudited) | | | Period
September 30,
20111 to July 31, 2012 | | | |
| | | | | | | | | | | | | | | | | | | | | | | | | | |
| Per Share Operating Performance | | | | | | | | | | | | | | | | | | | | | | | | | | |
Net asset value, beginning of period | | $ | 10.32 | | | $ | 10.00 | | | $ | 10.30 | | | $ | 10.00 | | | $ | 10.26 | | | $ | 10.00 | | | |
| | | | | | | | | | | |
Net investment income (loss)2 | | | 0.10 | | | | 0.06 | | | | 0.09 | | | | 0.06 | | | | 0.05 | | | | (0.01) | | | |
Net realized and unrealized gain | | | 0.38 | | | | 0.30 | | | | 0.38 | | | | 0.28 | | | | 0.37 | | | | 0.29 | | | |
| | | | | | | | | | | |
Net increase from investment operations | | | 0.48 | | | | 0.36 | | | | 0.47 | | | | 0.34 | | | | 0.42 | | | | 0.28 | | | |
| | | | | | | | | | | |
| Dividends and distributions from: | | | | | | | | | | | | | | | | | | | | | | | | | | |
Net investment income | | | (0.09) | | | | (0.03) | 3 | | | (0.07) | | | | (0.03) | 3 | | | (0.03) | | | | (0.01) | 3 | | |
Net realized gain | | | (0.09) | | | | (0.01) | 3 | | | (0.09) | | | | (0.01) | 3 | | | (0.09) | | | | (0.01) | 3 | | |
| | | | | | | | | | | |
Total dividends and distributions | | | (0.18) | | | | (0.04) | | | | (0.16) | | | | (0.04) | | | | (0.12) | | | | (0.02) | | | |
| | | | | | | | | | | |
Net asset value, end of period | | $ | 10.62 | | | $ | 10.32 | | | $ | 10.61 | | | $ | 10.30 | | | $ | 10.56 | | | $ | 10.26 | | | |
| | | | | | | | | | | |
| | | | | | | | | | | | | | | | | | | | | | | | | | |
| Total Investment Return4,5 | | | | | | | | | | | | | | | | | | | | | | | | | | |
Based on net asset value | | | 4.63% | | | | 3.55% | | | | 4.63% | | | | 3.32% | | | | 4.15% | | | | 2.79% | | | |
| | | | | | | | | | | |
| | | | | | | | | | | | | | | | | | | | | | | | | | |
| Ratios to Average Net Assets6 | | | | | | | | | | | | | | | | | | | | | | | | | | |
Total expenses | | | 1.48% | 7 | | | 1.73% | 8 | | | 1.71% | 7 | | | 1.93% | 8 | | | 2.45% | 7 | | | 2.66% | 8 | | |
| | | | | | | | | | | |
Total expenses excluding recoupment of past waived fees | | | 1.47% | 7 | | | 1.73% | 8 | | | 1.71% | 7 | | | 1.93% | 8 | | | 2.45% | 7 | | | 2.66% | 8 | | |
| | | | | | | | | | | |
Total expenses after fees waived and reimbursed | | | 1.46% | | | | 1.46% | | | | 1.66% | | | | 1.66% | | | | 2.41% | | | | 2.40% | | | |
| | | | | | | | | | | |
Total expenses after fees waived, reimbursed and excluding interest expense | | | 1.20% | | | | 1.20% | | | | 1.40% | | | | 1.39% | | | | 2.15% | | | | 2.14% | | | |
| | | | | | | | | | | |
Net investment income (loss) | | | 1.94% | | | | 0.70% | | | | 1.71% | | | | 0.67% | | | | 0.98% | | | | (0.16)% | | | |
| | | | | | | | | | | |
| | | | | | | | | | | | | | | | | | | | | | | | | | |
| Supplemental Data | | | | | | | | | | | | | | | | | | | | | | | | | | |
Net assets, end of period (000) | | $ | 339,600 | | | $ | 133,444 | | | $ | 213,887 | | | $ | 71,053 | | | $ | 31,126 | | | $ | 13,132 | | | |
| | | | | | | | | | | |
Portfolio turnover | | | 129% | | | | 355% | | | | 129% | | | | 355% | | | | 129% | | | | 355% | | | |
| | | | | | | | | | | |
| | 1 | | Commencement of operations. |
| | 2 | | Based on average shares outstanding. |
| | 3 | | Dividends and distributions are determined in accordance with federal income tax regulations. |
| | 4 | | Where applicable, total investment returns exclude the effects of any sales charges and include the reinvestment of dividends and distributions. |
| | 5 | | Aggregate total investment return. |
| | 7 | | Offering costs were not annualized in the calculation of the expense ratios. If these expenses were annualized, the total expenses for Institutional, Investor A and Investor C would have been 1.49%, 1.72% and 2.46%, respectively. |
| | 8 | | Organization costs were not annualized in the calculation of the expense ratios. If these expenses were annualized, the total expenses for Institutional, Investor A and Investor C would have been 1.75%, 1.93% and 2.66%, respectively. |
| | | | | | |
See Notes to Financial Statements. | | | | |
| | | | | | | |
| 34 | | BLACKROCK FUNDS | | JANUARY 31, 2013 | | |
| | |
| Notes to Financial Statements (Unaudited) | | |
1. Organization and Significant Accounting Policies:
BlackRock FundsSM (the “Trust”) is registered under the Investment Company Act of 1940, as amended (the “1940 Act”), as an open-end management investment company. The Trust is organized as a Massachusetts business trust. BlackRock Commodity Strategies Fund (“Commodity Strategies”) and BlackRock Global Long/Short Credit Fund (“Global Long/Short Credit”) (collectively, the “Funds” or individually, a “Fund”) are each a series of the Trust. Commodity Strategies is classified as non-diversified and Global Long/Short Credit is classified as diversified. The Funds’ financial statements are prepared in conformity with accounting principles generally accepted in the United States of America (“US GAAP”), which may require management to make estimates and assumptions that affect the reported amounts of assets and liabilities in the financial statements and the reported amounts of increases and decreases in net assets from operations during the reporting period. Actual results could differ from those estimates. Each Fund offers multiple classes of shares. Institutional Shares are sold without a sales charge and only to certain eligible investors. Investor A Shares are generally sold with a front-end sales charge. Investor C Shares may be subject to a CDSC. All classes of shares have identical voting, dividend, liquidation and other rights and the same terms and conditions, except that Investor A and Investor C Shares bear certain expenses related to the shareholder servicing of such shares, and Investor C Shares also bear certain expenses related to the distribution of such shares. Each class has exclusive voting rights with respect to matters relating to its shareholder servicing and distribution expenditures.
The following is a summary of significant accounting policies followed by the Funds:
Basis of Consolidation: The accompanying consolidated financial statements of Commodity Strategies include the accounts of BlackRock Cayman Commodity Strategies Fund, Ltd. (the “Subsidiary”), which is a wholly owned subsidiary of Commodity Strategies, which primarily invests in commodity-related instruments. The Subsidiary enables Commodity Strategies to hold these commodity-related instruments and satisfy Regulated Investment Company (“RIC”) tax requirements. Commodity Strategies may invest up to 25% of its total assets in the Subsidiary. Intercompany accounts and transactions, if any, have been eliminated. The Subsidiary is subject to the same investment policies and restrictions that apply to Commodity Strategies.
Valuation: US GAAP defines fair value as the price the Funds would receive to sell an asset or pay to transfer a liability in an orderly transaction between market participants at the measurement date. The Funds determine the fair values of their financial instruments at market value using independent dealers or pricing services under policies approved by the Board of Trustees of the Trust (the “Board”). The BlackRock Global Valuation Methodologies Committee (the “Global Valuation Committee”) is the committee formed by management to develop global pricing policies and procedures and to provide oversight of the pricing function for the Funds for all financial instruments.
Equity investments traded on a recognized securities exchange or the NASDAQ Global Market System (“NASDAQ”) are valued at the last reported sale price that day or the NASDAQ official closing price, if applicable. For equity investments traded on more than one exchange, the last reported sale price on the exchange where the stock is primarily traded is used. Equity investments traded on a recognized exchange for which there were no sales on that day are valued at the last available bid price. If no bid price is available, the prior day’s price will be used, unless it is determined that such prior day’s price no longer reflects the fair value of the security.
The Funds value their bond investments on the basis of last available bid prices or current market quotations provided by dealers or pricing services. Floating rate loan interests are valued at the mean of the bid prices from one or more brokers or dealers as obtained from a pricing service. In determining the value of a particular investment, pricing services may use certain information with respect to transactions in such investments, quotations from dealers, pricing matrixes, market transactions in comparable investments, various relationships observed in the market between investments and calculated yield measures. Financial futures contracts traded on exchanges are valued at their last sale price. Swap agreements are valued utilizing quotes received daily by the Funds’ pricing service or through brokers, which are derived using daily swap curves and models that incorporate a number of market data factors, such as discounted cash flows, trades and values of the underlying reference instruments. Investments in open-end registered investment companies are valued at NAV each business day. Short-term securities with remaining maturities of 60 days or less may be valued at amortized cost, which approximates fair value.
Securities and other assets and liabilities denominated in foreign currencies are translated into US dollars using exchange rates determined as of the close of business on the New York Stock Exchange (“NYSE”). Foreign currency exchange contracts are valued at the mean between the bid and ask prices and are determined as of the close of business on the NYSE. Interpolated values are derived when the settlement date of the contract is an interim date for which quotations are not available.
Exchange-traded options are valued at the mean between the last bid and ask prices at the close of the options market in which the options trade. An exchange-traded option for which there is no mean price is valued at the last bid (long positions) or ask (short positions) price. If no bid or ask price is available, the prior day’s price will be used, unless it is determined that the prior day’s price no longer reflects the fair value of the option. Over-the-counter (“OTC”) options and swaptions are valued by an independent pricing service using a mathematical model, which incorporates a number of market data factors, such as the trades and prices of the underlying instruments.
In the event that application of these methods of valuation results in a price for an investment that is deemed not to be representative of the market value of such investment, or if a price is not available, the investment will be valued by the Global Valuation Committee, or its delegate,
| | | | | | |
| | | | | | | |
| | BLACKROCK FUNDS | | JANUARY 31, 2013 | | 35 |
| | |
| Notes to Financial Statements (continued) | | |
in accordance with a policy approved by the Board as reflecting fair value (“Fair Value Assets”). When determining the price for Fair Value Assets, the Global Valuation Committee, or its delegate, seeks to determine the price that each Fund might reasonably expect to receive from the current sale of that asset in an arm’s-length transaction. Fair value determinations shall be based upon all available factors that the Global Valuation Committee deem relevant consistent with the principles of fair value measurement which include the market approach, income approach and/or in the case of recent investments, the cost approach, as appropriate. A market approach generally consists of using comparable market transactions. The income approach generally is used to discount future cash flows to present value and adjusted for liquidity as appropriate. These factors include but are not limited to: (i) attributes specific to the investment or asset; (ii) the principal market for the investment or asset; (iii) the customary participants in the principal market for the investment or asset; (iv) data assumptions by market participants for the investment or asset, if reasonably available; (v) quoted prices for similar investments or assets in active markets; and (vi) other factors, such as future cash flows, interest rates, yield curves, volatilities, prepayment speeds, loss severities, credit risks, recovery rates, liquidation amount and/or default rates. Due to the inherent uncertainty of valuations of such investments, the fair values may differ from the values that would have been used had an active market existed. The Global Valuation Committee, or its delegate, employs various methods for calibrating valuation approaches investments where an active market does not exist, including regular due diligence of the Funds’ pricing vendors, a regular review of key inputs and assumptions, transactional back-testing or disposition analysis to compare unrealized gains and losses to realized gains and losses, reviews of missing or stale prices and large movements in market values and reviews of any market related activity. The pricing of all Fair Value Assets is subsequently reported to the Board or a committee thereof on a quarterly basis.
Generally, trading in foreign instruments is substantially completed each day at various times prior to the close of business on the NYSE. Occasionally, events affecting the values of such instruments may occur between the foreign market close and the close of business on the NYSE that may not be reflected in the computation of each Fund’s net assets. If events (for example, a company announcement, market volatility or a natural disaster) occur during such periods that are expected to affect the value of such instruments materially, those instruments may be Fair Value Assets and valued at their fair value, as determined in good faith by the Global Valuation Committee using a pricing service and/or policies approved by the Board. Each business day, the Funds use a pricing service to assist with the valuation of certain foreign exchange-traded equity securities and foreign exchange-traded and OTC options (the “Systematic Fair Value Price”). Using current market factors, the Systematic Fair Value Price is designed to value such foreign securities and foreign options at fair value as of the close of business on the NYSE, which follows the close of the local markets.
Foreign Currency: The Funds’ books and records are maintained in US dollars. Purchases and sales of investment securities are recorded at the
rates of exchange prevailing on the respective date of such transactions. Generally, when the US dollar rises in value against a foreign currency, the Funds’ investments denominated in that currency will lose value because that currency is worth fewer US dollars; the opposite effect occurs if the US dollar falls in relative value.
The Funds do not isolate the portion of the results of operations arising as a result of changes in the foreign exchange rates from the changes in the market prices of investments held or sold for financial reporting purposes. Accordingly, the effects of changes in foreign currency exchange rates on investments are not segregated in the Statements of Operations from the effects of changes in market prices of those investments but are included as a component of net realized and unrealized gain (loss) from investments. The Funds report realized currency gains (losses) on foreign currency related transactions as components of net realized gain (loss) for financial reporting purposes, whereas such components are treated as ordinary income for federal income tax purposes.
Zero-Coupon Bonds: Commodity Strategies invests in zero-coupon bonds, which are normally issued at a significant discount from face value and do not provide for periodic interest payments. Zero-coupon bonds may experience greater volatility in market value than similar maturity debt obligations which provide for regular interest payments.
Commodity-Linked Notes: Commodity Strategies invests in commodity-linked notes to provide exposure to the investment returns of the commodities markets, without investing directly in commodities. In a commodity-linked note, Commodity Strategies purchases a note and, in return, the issuer typically provides for an interest payment and a principal payment at maturity linked to the price movement of the underlying commodity index less an agreed-upon fee. These notes may be issued by US and foreign banks, brokerage firms, insurance companies and other corporations. Performance of a particular commodity index will affect the value of the commodity-linked note. The value of the commodity-linked note is generally based on a multiple of the performance of the index. The multiple (or leverage) will increase the volatility of the note’s value relative to the change in the underlying index. In addition to credit, interest rate and counterparty risk typically associated with traditional debt investments, commodity-linked notes are subject to risks affecting the underlying commodity index. The value of the commodity-linked notes may fluctuate by changes in overall market movements, volatility of the underlying benchmark, changes in interest rates or factors affecting a particular industry or commodity, such as drought, floods, weather, livestock disease, embargoes, tariffs and international economic, political and regulatory developments. The commodity-linked notes have an automatic redemption feature if the underlying index declines from the original trade date by the amount specified in the agreement. Commodity Strategies has the option to request prepayment from the issuer at any time. The value of the commodity-linked note, which is marked-to-market daily, is recorded on the Consolidated Statement of Assets and Liabilities. The daily change in value, including any fees to be paid, is included in net change in unrealized appreciation/depreciation on investments on the Consolidated Statement of Operations. Interest
| | | | | | |
| | | | | | | |
| 36 | | BLACKROCK FUNDS | | JANUARY 31, 2013 | | |
| | |
| Notes to Financial Statements (continued) | | |
accruals are included in interest income on the Consolidated Statement of Operations. Commodity Strategies realizes a gain or loss when a commodity-linked note is sold or matures.
Capital Trusts: Global Long/Short Credit may invest in capital trusts. These securities are typically issued by corporations, generally in the form of interest-bearing notes with preferred securities characteristics, or by an affiliated business trust of a corporation, generally in the form of beneficial interests in subordinated debentures or similarly structured securities. The securities can be structured as either fixed or adjustable coupon securities that can have either a perpetual or stated maturity date. Dividends can be deferred without creating an event of default or acceleration, although maturity cannot take place unless all cumulative payment obligations have been met. The deferral of payments does not affect the purchase or sale of these securities in the open market. Payments on these securities are treated as interest rather than dividends for federal income tax purposes. These securities generally are rated below that of the issuing company’s senior debt securities.
Floating Rate Loan Interests: Global Long/Short Credit may invest in floating rate loan interests. The floating rate loan interests Global Long/ Short Credit holds are typically issued to companies (the “borrower”) by banks, other financial institutions, and privately and publicly offered corporations (the “lender”). Floating rate loan interests are generally non-investment grade, often involve borrowers whose financial condition is troubled or uncertain and companies that are highly leveraged. Global Long/Short Credit may invest in obligations of borrowers who are in bankruptcy proceedings. Floating rate loan interests may include fully funded term loans or revolving lines of credit. Floating rate loan interests are typically senior in the corporate capital structure of the borrower. Floating rate loan interests generally pay interest at rates that are periodically determined by reference to a base lending rate plus a premium. The base lending rates are generally the lending rate offered by one or more European banks, such as the London Interbank Offered Rate (“LIBOR”), the prime rate offered by one or more US banks or the certificate of deposit rate. Floating rate loan interests may involve foreign borrowers, and investments may be denominated in foreign currencies. Global Long/Short Credit considers these investments to be investments in debt securities for purposes of its investment policies.
When Global Long/Short Credit purchases a floating rate loan interest it may receive a facility fee and when it sells a floating rate loan interest it may pay a facility fee. On an ongoing basis, Global Long/Short Credit may receive a commitment fee based on the undrawn portion of the underlying line of credit amount of a floating rate loan interest. Facility and commitment fees are typically amortized to income over the term of the loan or term of the commitment, respectively. Consent and amendment fees are recorded to income as earned. Prepayment penalty fees, which may be received by Global Long/Short Credit upon the prepayment of a floating rate loan interest by a borrower, are recorded as realized gains. Global Long/Short Credit may invest in multiple series or tranches of a loan. A different series or tranche may have varying terms and carry different associated risks.
Floating rate loan interests are usually freely callable at the borrower’s option. Global Long/Short Credit may invest in such loans in the form of participations in loans (“Participations”) or assignments (“Assignments”) of all or a portion of loans from third parties. Participations typically will result in Global Long/Short Credit having a contractual relationship only with the lender, not with the borrower. Global Long/Short Credit will have the right to receive payments of principal, interest and any fees to which it is entitled only from the lender selling the Participation and only upon receipt by the lender of the payments from the borrower. In connection with purchasing Participations, Global Long/Short Credit generally will have no right to enforce compliance by the borrower with the terms of the loan agreement, nor any rights of offset against the borrower, and Global Long/Short Credit may not benefit directly from any collateral supporting the loan in which it has purchased the Participation. As a result, Global Long/Short Credit will assume the credit risk of both the borrower and the lender that is selling the Participation. Global Long/ Short Credit’s investment in loan participation interests involves the risk of insolvency of the financial intermediaries who are parties to the transactions. In the event of the insolvency of the lender selling the Participation, Global Long/Short Credit may be treated as a general creditor of the lender and may not benefit from any offset between the lender and the borrower. Assignments typically result in Global Long/Short Credit having a direct contractual relationship with the borrower, and Global Long/Short Credit may enforce compliance by the borrower with the terms of the loan agreement.
Borrowed Bond Agreements: Global Long/Short Credit may enter into borrowed bond agreements. In a borrowed bond agreement, Global Long/Short Credit borrows a bond from a counterparty in exchange for cash collateral with the commitment that the security and the cash will be returned to the counterparty and Global Long/Short Credit, respectively, at a mutually agreed upon rate and date. Certain agreements have no stated maturity and can be terminated by either party at any time. Borrowed bond agreements are entered into primarily in connection with short sales of bonds. Earnings on cash collateral and compensation to the lender of the bond are based on agreed upon rates between Global Long/Short Credit and the counterparty. The value of the underlying cash collateral approximates the market value and accrued interest of the borrowed bond. To the extent that a borrowed bond transaction exceeds one business day, the value of the cash collateral in the possession of the counterparty is monitored on a daily basis to ensure the adequacy of the collateral. As the market value of the borrowed bond changes, the cash collateral is periodically increased or decreased with a frequency and in amounts prescribed in the borrowed bond agreement. Full realization of the collateral by Global Long/Short Credit may be limited if the value of an investment purchased with the cash collateral by the lender decreases. Global Long/Short Credit may also experience delays in gaining access to the collateral.
Short Sales: Global Long/Short Credit may enter into short sale transactions in which Global Long/Short Credit sells a security it does not hold in anticipation of a decline in the market price of that security. When Global Long/Short Credit makes a short sale, it will borrow the security
| | | | | | |
| | | | | | | |
| | BLACKROCK FUNDS | | JANUARY 31, 2013 | | 37 |
| | |
| Notes to Financial Statements (continued) | | |
sold short (borrowed bond) and deliver the security to the counterparty to which it sold the security short. An amount equal to the proceeds received by Global Long/Short Credit is reflected as an asset and an equivalent liability. The amount of the liability is subsequently marked-to-market to reflect the market value of the short sale. Global Long/Short Credit is required to repay the counterparty interest on the security sold short, which is shown as interest expense in the Statements of Operations. Global Long/Short Credit is exposed to market risk based on the amount, if any, that the market value of the security increases beyond the market value at which the position was sold. Thus, a short sale of a security involves the risk that instead of declining, the price of the security sold short will rise. The short sale of securities involves the possibility of a theoretically unlimited loss since there is a theoretically unlimited potential for the market price of the security sold short to increase. A gain, limited to the price at which Global Long/Short Credit sold the security short, or a loss, unlimited as to the dollar amount, will be recognized upon the termination of a short sale if the market price is either less than or greater than the proceeds originally received. There is no assurance Global Long/Short Credit will be able to close out a short position at a particular time or at an acceptable price
Segregation and Collateralization: In cases in which the 1940 Act and the interpretive positions of the Securities and Exchange Commission (“SEC”) require that a Fund either deliver collateral or segregate assets in connection with certain investments (e.g., financial futures contracts, foreign currency exchange contracts, swaps, short sales and options written), that Fund will, consistent with SEC rules and/or certain interpretive letters issued by the SEC, segregate collateral or designate on its books and records cash or liquid securities having a market value at least equal to the amount that would otherwise be required to be physically segregated. Furthermore, based on requirements and agreements with certain exchanges and third party broker-dealers, a Fund engaging in such transactions may have requirements to deliver/deposit securities to/with an exchange or broker-dealer as collateral for certain investments.
Investment Transactions and Investment Income: For financial reporting purposes, investment transactions are recorded on the dates the transactions are entered into (the trade dates). Realized gains and losses on investment transactions are determined on the identified cost basis. Dividend income is recorded on the ex-dividend dates. Dividends from foreign securities where the ex-dividend date may have passed are subsequently recorded when the Funds are informed of the ex-dividend date. Under the applicable foreign tax laws, a withholding tax at various rates may be imposed on capital gains, dividends and interest. Upon notification from issuers, some of the dividend income received from a real estate investment trust may be redesignated as a reduction of cost of the related investment and/or realized gain. Interest income, including amortization and accretion of premiums and discounts on debt securities, is recognized on the accrual basis. Income and realized and unrealized gains and losses are allocated daily to each class based on its relative net assets.
Dividends and Distributions: Dividends and distributions paid by the Funds are recorded on the ex-dividend dates. The portion of distributions that exceeds a Fund’s current and accumulated earnings and profits, which are measured on a tax basis, will constitute a nontaxable return of capital. Distributions in excess of a Fund’s taxable income and net capital gains, but not in excess of a Fund’s earnings and profits, will be taxable to shareholders as ordinary income and will not constitute a non-taxable return of capital. Dividends from net investment income are declared and paid at least annually for Commodity Strategies. Global Long/Short Credit’s dividends from net investment income are declared daily and paid monthly. The character and timing of dividends and distributions are determined in accordance with federal income tax regulations, which may differ from US GAAP.
Income Taxes: It is the Funds’ policy to comply with the requirements of the Internal Revenue Code of 1986, as amended, applicable to RICs and to distribute substantially all of their taxable income to their shareholders. Therefore, no federal income tax provision is required.
The Funds file US federal and various state and local tax returns. No income tax returns are currently under examination. The statute of limitations on the Funds’ US federal tax returns remains open for the period ended July 31, 2012. Management does not believe there are any uncertain tax positions that require recognition of a tax liability.
Recent Accounting Standards: In December 2011, the Financial Accounting Standards Board (“FASB”) issued guidance that will expand current disclosure requirements on the offsetting of certain assets and liabilities. The new disclosures will be required for investments and derivative financial instruments subject to master netting or similar agreements which are eligible for offset in the Statements of Assets and Liabilities and will require an entity to disclose both gross and net information about such investments and transactions in the financial statements. In January 2013, the FASB issued guidance that clarifies which investments and transactions are subject to the offsetting disclosure requirements. The scope of the disclosure requirements for offsetting will be limited to derivative instruments, repurchase agreements and reverse repurchase agreements, and securities borrowing and securities lending transactions. The guidance is effective for financial statements with fiscal years beginning on or after January 1, 2013, and interim periods within those fiscal years. Management is evaluating the impact of this guidance on the Funds’ financial statement disclosures.
Offering Costs: Offering costs are amortized over a 12-month period beginning with the commencement of operations.
Other: Expenses directly related to a Fund or its classes are charged to that Fund or class. Other operating expenses shared by several funds are pro rated among those funds on the basis of relative net assets or other appropriate methods. Expenses directly related to the Funds and other shared expenses pro rated to the Funds are allocated daily to each class based on its relative net assets or other appropriate methods.
| | | | | | |
| | | | | | | |
| 38 | | BLACKROCK FUNDS | | JANUARY 31, 2013 | | |
| | |
| Notes to Financial Statements (continued) | | |
The Funds have an arrangement with the custodian whereby fees may be reduced by credits earned on uninvested cash balances, which, if applicable, are shown as fees paid indirectly in the Statements of Operations. The custodian imposes fees on overdrawn cash balances, which can be offset by accumulated credits earned or may result in additional custody charges.
2. Derivative Financial Instruments:
The Funds engage in various portfolio investment strategies using derivative contracts both to increase the returns of the Funds and/or to economically hedge, or protect, their exposure to certain risks such as credit risk, equity risk, interest rate risk or foreign currency exchange rate risk. These contracts may be transacted on an exchange or OTC.
Losses may arise if the value of the contract decreases due to an unfavorable change in the market rates or values of the underlying instrument or if the counterparty does not perform under the contract. The Funds’ maximum risk of loss from counterparty credit risk on OTC derivatives is generally the aggregate unrealized gain netted against any collateral pledged by/posted to the counterparty. For OTC options purchased, the Funds bear the risk of loss in the amount of the premiums paid plus the positive change in market value net of any collateral received on the options should the counterparty fail to perform under the contracts. Options written by the Funds do not give rise to counterparty credit risk, as options written obligate the Funds and not the counterparty to perform. Counterparty risk related to exchange-traded financial futures contracts, options and centrally cleared swaps is deemed to be minimal due to the protection against defaults provided by the exchange on which these contracts trade.
The Funds may mitigate counterparty risk by procuring collateral and through netting provisions included within an International Swaps and Derivatives Association, Inc. master agreement (“ISDA Master Agreement”) implemented between a Fund and each of its respective counterparties. An ISDA Master Agreement allows each Fund to offset with each separate counterparty certain derivative financial instrument’s payables and/or receivables with collateral held. The amount of collateral moved to/from applicable counterparties is generally based upon minimum transfer amounts of up to $500,000. To the extent amounts due to the Funds from their counterparties are not fully collateralized contractually or otherwise, the Funds bear the risk of loss from counterparty non-performance. See Note 1 “Segregation and Collateralization” for information with respect to collateral practices. In addition, the Funds manage counterparty risk by entering into agreements only with counterparties that they believe have the financial resources to honor their obligations and by monitoring the financial stability of those counterparties.
Certain ISDA Master Agreements allow counterparties to OTC derivatives to terminate derivative contracts prior to maturity in the event the Funds’ net assets decline by a stated percentage or the Funds fail to meet the terms of their ISDA Master Agreements, which would cause the Funds to accelerate payment of any net liability owed to the counterparty.
Financial Futures Contracts: Global Long/Short Credit purchases or sells financial futures contracts and options on financial futures contracts to gain exposure to, or economically hedge against changes in interest rates (interest rate risk) or changes in the value of equity securities (equity risk). Financial futures contracts are agreements between Global Long/Short Credit and a counterparty to buy or sell a specific quantity of an underlying instrument at a specified price and at a specified date. Depending on the terms of the particular contract, financial futures contracts are settled either through physical delivery of the underlying instrument on the settlement date or by payment of a cash settlement amount on the settlement date. Pursuant to the contract, Global Long/ Short Credit agrees to receive from or pay to the broker an amount of cash equal to the daily fluctuation in value of the contract. Such receipts or payments are known as variation margin and are recorded by Global Long/Short Credit as unrealized appreciation or depreciation. When the contract is closed, Global Long/Short Credit records a realized gain or loss equal to the difference between the value of the contract at the time it was opened and the value at the time it was closed. The use of financial futures contracts involves the risk of an imperfect correlation in the movements in the price of financial futures contracts, interest or foreign currency exchange rates and the underlying assets.
Foreign Currency Exchange Contracts: The Funds enter into foreign currency exchange contracts as an economic hedge against either specific transactions or portfolio instruments or to obtain exposure to foreign currencies (foreign currency exchange rate risk). A foreign currency exchange contract is an agreement between two parties to buy and sell a currency at a set exchange rate on a future date. Foreign currency exchange contracts, when used by the Funds, help to manage the overall exposure to the currencies in which some of the investments held by the Funds are denominated. The contract is marked-to-market daily and the change in market value is recorded by the Funds as an unrealized gain or loss. When the contract is closed, the Funds record a realized gain or loss equal to the difference between the value at the time it was opened and the value at the time it was closed. The use of foreign currency exchange contracts involves the risk that the value of a foreign currency exchange contract changes unfavorably due to movements in the value of the referenced foreign currencies and the risk that the counterparty to the contract does not perform its obligations under the agreement.
Options: Global Long/Short Credit purchases and writes call and put options to increase or decrease its exposure to underlying instruments (including credit risk, equity risk and/or foreign currency exchange rate risk) and/or, in the case of options written, to generate gains from options premiums. A call option gives the purchaser (holder) of the option the right (but not the obligation) to buy, and obligates the seller (writer) to sell (when the option is exercised), the underlying instrument at the exercise or strike price at any time or at a specified time during the option period. A put option gives the holder the right to sell and obligates the writer to buy the underlying instrument at the exercise or strike price at any time or at a specified time during the option period. When Global Long/Short Credit purchases (writes) an option, an amount equal to the premium paid (received) by Global Long/Short Credit is reflected
| | | | | | |
| | | | | | | |
| | BLACKROCK FUNDS | | JANUARY 31,2013 | | 39 |
| | |
| Notes to Financial Statements (continued) | | |
as an asset (liability). The amount of the asset (liability) is subsequently marked-to-market to reflect the current market value of the option purchased (written). When an instrument is purchased or sold through an exercise of an option, the related premium paid (or received) is added to (or deducted from) the basis of the instrument acquired or deducted from (or added to) the proceeds of the instrument sold. When an option expires (or Global Long/Short Credit enters into a closing transaction), Global Long/Short Credit realizes a gain or loss on the option to the extent of the premiums received or paid (or gain or loss to the extent the cost of the closing transaction exceeds the premiums received or paid). When Global Long/Short Credit writes a call option, such option is “covered,” meaning that Global Long/Short Credit holds the underlying instrument subject to being called by the option counterparty. When Global Long/Short Credit writes a put option, such option is covered by cash in an amount sufficient to cover the obligation.
Options on swaps (swaptions) are similar to options on securities except that instead of selling or purchasing the right to buy or sell a security, the writer or purchaser of the swap option is granting or buying the right to enter into a previously agreed upon interest rate or credit default swap agreement (interest rate risk and/or credit risk) at any time before the expiration of the option.
Global Long/Short Credit also purchases or sells listed or OTC foreign currency options, foreign currency futures and related options on foreign currency futures as a short or long hedge against possible variations in foreign exchange rates or to gain exposure to foreign currencies (foreign currency exchange rate risk). When foreign currency is purchased or sold through an exercise of a foreign currency option, the related premium paid (or received) is added to (or deducted from) the basis of the foreign currency acquired or deducted from (or added to) the proceeds of the foreign currency sold (receipts from the foreign currency purchased). Such transactions may be effected with respect to hedges on non-US dollar denominated instruments owned by Global Long/Short Credit but not yet delivered, or committed or anticipated to be purchased by Global Long/Short Credit.
In purchasing and writing options, Global Long/Short Credit bears the risk of an unfavorable change in the value of the underlying instrument or the risk that Global Long/Short Credit may not be able to enter into a closing transaction due to an illiquid market. Exercise of a written option could result in Global Long/Short Credit purchasing or selling a security at a price different from the current market value.
Swaps: Global Long/Short Credit enters into swap agreements, in which Global Long/Short Credit and a counterparty agree either to make periodic net payments on a specified notional amount or net payment upon termination. Swap agreements are privately negotiated in the OTC market and may be entered into as a bilateral contract or centrally cleared (“centrally cleared swaps”). In a centrally cleared swap, immediately following execution of the swap agreement, the swap agreement is novated to a central counterparty (the “CCP”) and the Fund faces the CCP through a future commission merchant. Unlike a bilateral swap
agreement, for centrally cleared swaps, the Fund has no credit exposure to the counterparty as the CCP stands between the Fund and the counterparty. These payments received or made by Global Long/Short Credit are recorded in the Statements of Operations as realized gains or losses, respectively. Any upfront fees paid are recorded as assets and any upfront fees received are recorded as liabilities and are shown as swap premiums paid and swap premiums received, respectively on the Statements of Assets and Liabilities and amortized over the term of the swap. Swaps are marked-to-market daily and changes in value are recorded as unrealized appreciation (depreciation). The daily change in valuation of centrally cleared swaps, if any, is recorded as a receivable or payable for variation margin in the Statements of Assets and Liabilities. When the swap is terminated, Global Long/Short Credit will record a realized gain or loss equal to the difference between the proceeds from (or cost of) the closing transaction and Global Long/Short Credit’s basis in the contract, if any. Generally, the basis of the contracts is the premium received or paid. Swap transactions involve, to varying degrees, elements of interest rate, credit and market risk in excess of the amounts recognized in the Statements of Assets and Liabilities. Such risks involve the possibility that there will be no liquid market for these agreements, that the counterparty to the agreements may default on its obligation to perform or disagree as to the meaning of the contractual terms in the agreements, and that there may be unfavorable changes in interest rates and/or market values associated with these transactions.
| Ÿ | | Credit default swaps — Global Long/Short Credit enters into credit default swaps to manage its exposure to the market or certain sectors of the market, to reduce its risk exposure to defaults of corporate and/or sovereign issuers or to create exposure to corporate and/or sovereign issuers to which it is not otherwise exposed (credit risk). Global Long/Short Credit may either buy or sell (write) credit default swaps on single-name issuers (corporate or sovereign), a combination or basket of single-name issuers or traded indexes. Credit default swaps on single-name issuers are agreements in which the protection buyer pays fixed periodic payments to the seller in consideration for a guarantee from the protection seller to make a specific payment should a negative credit event take place with respect to the referenced entity (e.g., bankruptcy, failure to pay, obligation accelerators, repudiation, moratorium or restructuring). Credit default swaps on traded indexes are agreements in which the buyer pays fixed periodic payments to the seller in consideration for a guarantee from the seller to make a specific payment should a write-down, principal or interest shortfall or default of all or individual underlying securities included in the index occurs. As a buyer, if an underlying credit event occurs, Global Long/Short Credit will either receive from the seller an amount equal to the notional amount of the swap and deliver the referenced security or underlying securities comprising the index or receive a net settlement of cash equal to the notional amount of the swap less the recovery value of the security or underlying securities comprising the index. As a seller (writer), if an underlying credit event occurs, Global Long/Short Credit will either pay the buyer an amount equal to the notional amount of the swap |
| | | | | | |
| | | | | | | |
| 40 | | BLACKROCK FUNDS | | JANUARY 31, 2013 | | |
| | |
| Notes to Financial Statements (continued) | | |
| | and take delivery of the referenced security or underlying securities comprising the index or pay a net settlement of cash equal to the |
| | notional amount of the swap less the recovery value of the security or underlying securities comprising the index. |
Derivative Financial Instruments Categorized by Risk Exposure:
| | | | | | | | | | | | |
| Fair Values of Derivative Financial Instruments as of January 31, 2013 | |
| | | Asset Derivatives | |
| | | |
| Commodity
Strategies |
| | | |
| Global
Long/Short Credit |
|
| | | Statements of Assets and Liabilities Location | | | | | | Value | | | | |
Interest rate contracts | | Net unrealized appreciation/depreciation | | | — | | | | | $ | 840,198 | |
Foreign currency exchange contracts | | Unrealized appreciation on foreign currency exchange contracts; Investments at value — unaffiliated1 | | $ | 1,336 | | | | | | 454,484 | |
Credit contracts | | Unrealized appreciation on swaps; Swap premiums paid | | | — | | | | | | 8,327,857 | |
Equity contracts | | Investments at value — unaffiliated1 | | | — | | | | | | 822,756 | |
Total | | | | $ | 1,336 | | | | | $ | 10,445,295 | |
| |
| | 1 | | Includes options purchased at value as reported in the Schedules of Investments. |
| | | | | | | | | | | | |
| | | Liability Derivatives | |
| | | |
| Commodity
Strategies |
| | | |
| Global
Long/Short Credit |
|
| | | Statements of Assets and Liabilities Location | | | | | | Value | | | | |
Interest rate contracts | | Net unrealized appreciation/depreciation2 | | | — | | | | | $ | 24,604 | |
Foreign currency exchange contracts | | Unrealized depreciation on foreign currency exchange contracts | | $ | 5,416 | | | | | | 2,710,174 | |
Credit contracts | | Unrealized depreciation on swaps; Swap premiums received; Options written at value | | | — | | | | | | 8,465,063 | |
Equity contracts | | Options written at value | | | — | | | | | | 247,950 | |
| Total | | | | $ | 5,416 | | | | | $ | 11,447,791 | |
| |
| | 2 | | Includes cumulative appreciation/depreciation on financial futures contracts and centrally cleared swaps, if any, as reported in the Schedules of Investments. Only current day’s variation margin is reported within the Statements of Assets and Liabilities. |
| | | | | | |
| | | | |
| | | | | | | |
| | BLACKROCK FUNDS | | JANUARY 31, 2013 | | 41 |
| | |
| Notes to Financial Statements (continued) | | |
| | | | | | | | |
The Effect of Derivative Financial Instruments in the Statements of Operations
Six Months Ended January 31, 2013 | |
| | | Net Realized Gain (Loss) From | |
| | | | | | Global | |
| | | Commodity Strategies | | | Long/Short Credit | |
Interest rate contracts: | | | | | | | | |
Financial futures contracts | | | — | | | $ | (103,963 | ) |
Foreign currency exchange contracts: | | | | | | | | |
Foreign currency transactions | | $ | (351,850 | ) | | | (4,941,042 | ) |
Options3 | | | — | | | | (181,022 | ) |
Credit contracts: | | | | | | | | |
Swaps | | | — | | | | (85,645 | ) |
Options | | | — | | | | 154,688 | |
Equity contracts: | | | | | | | | |
Financial futures contracts | | | — | | | | 182,847 | |
Options3 | | | — | | | | (1,024,088 | ) |
| | | | |
| Total | | $ | (351,850 | ) | | $ | (5,998,225 | ) |
| | | | | |
| | | | | | | |
| | | Net Change in Unrealized Appreciation/Depreciation on | |
| | | Commodity Strategies | | | Global Long/Short Credit | |
Interest rate contracts: | | | | | | | | |
Financial futures contracts | | | — | | | $ | 1,057,419 | |
Foreign currency exchange contracts: | | | | | | | | |
Foreign currency translations | | $ | (3,765 | ) | | | (1,968,831 | ) |
Options3 | | | — | | | | 11,312 | |
Credit contracts: | | | | | | | | |
Swaps | | | — | | | | (2,344,532 | ) |
Options | | | — | | | | (1,694 | ) |
Equity contracts: | | | | | | | | |
Options3 | | | — | | | | 3,723 | |
| | | | |
| Total | | $ | (3,765 | ) | | $ | (3,242,603 | ) |
| | |
| | 3 | | Options purchased are included in the net realized gain (loss) from investments and net change in unrealized appreciation/depreciation on investments. |
For the six months ended January 31, 2013, the average quarterly balances of outstanding derivative financial instruments were as follows:
| | | | | | | | |
| | | Commodity Strategies | | | Global Long/Short Credit | |
Financial futures contracts: | | | | | | | | |
Average number of contracts purchased | | | — | | | | 10 | |
Average number of contracts sold | | | — | | | | 422 | |
Average notional value of contracts purchased | | | — | | | $ | 1,830,371 | |
Average notional value of contracts sold | | | — | | | $ | 71,692,278 | |
Foreign currency exchange contracts: | | | | | | | | |
Average number of contracts - US dollars purchased | | | 1 | | | | 11 | |
Average number of contracts - US dollars sold | | | 1 | | | | 1 | |
Average US dollar amounts purchased | | $ | 560,524 | | | $ | 169,036,449 | |
Average US dollar amounts sold | | $ | 100,342 | | | $ | 4,583,001 | |
Options: | | | | | | | | |
Average number of option contracts purchased | | | — | | | | 2,301 | |
Average number of option contracts written | | | — | | | | 950 | |
Average notional value of option contracts purchased | | | — | | | $ | 30,953,202 | |
Average notional value of option contracts written | | | — | | | $ | 13,300,000 | |
Average number of swaption contracts purchased | | | — | | | | 2 | |
Average number of swaption contracts written | | | — | | | | 3 | |
Average notional value of swaption contracts purchased | | | — | | | $ | 15,307,445 | |
Average notional value of swaption contracts written | | | — | | | $ | 25,788,158 | |
Credit default swaps: | | | | | | | | |
Average number of contracts - buy protection | | | — | | | | 80 | |
Average number of contracts - sell protection | | | — | | | | 54 | |
Average notional value - buy protection | | | — | | | $ | 188,787,023 | |
Average notional value - sell protection | | | — | | | $ | 117,255,329 | |
| |
| | | | | | |
| | | | |
| | | | | | | |
| 42 | | BLACKROCK FUNDS | | JANUARY 31, 2013 | | |
| | |
| Notes to Financial Statements (continued) | | |
3. Investment Advisory Agreement and Other Transactions with Affiliates:
The PNC Financial Services Group, Inc. (“PNC”) is the largest stockholder and an affiliate, for 1940 Act purposes, of BlackRock, Inc. (“BlackRock”).
The Trust, on behalf of the Funds, entered into an Investment Advisory Agreement with the Manager, the Funds’ investment advisor, an indirect, wholly owned subsidiary of BlackRock, to provide investment advisory and administration services. The Manager is responsible for the management of each Fund’s portfolio and provides the necessary personnel, facilities, equipment and certain other services necessary to the operations of each Fund. For such services, each Fund pays the Manager a monthly fee based on a percentage of each Fund’s average daily net assets at the following annual rates:
| | | | | | | | |
| | | Commodity
Strategies | | | Global Long/Short Credit | |
| Average Daily Net Assets | | Investment | | | Advisory Fee | |
First $1 Billion | | | 1.15 | % | | | 0.95 | % |
$1 Billion - $3 Billion | | | 1.08 | % | | | 0.89 | % |
$3 Billion - $5 Billion | | | 1.04 | % | | | 0.86 | % |
$5 Billion - $10 Billion | | | 1.00 | % | | | 0.83 | % |
Greater than $10 Billion | | | 0.98 | % | | | 0.81 | % |
The Manager voluntarily agreed to waive its investment advisory fees by the amount of investment advisory fees each Fund pays to the Manager indirectly through its investment in affiliated money market funds. However, the Manager does not waive its investment advisory fees by the amount of investment advisory fees paid in connection with each Fund’s investment in other affiliated investment companies, if any. These amounts are included in fees waived by Manager in the Statements of Operations. For the six months ended January 31, 2013, the Manager waived $4,607 and $34,995 for Commodity Strategies and Global Long/Short Credit, respectively.
For Commodity Strategies, the Manager provides investment management and other services to the Subsidiary. The Manager does not receive separate compensation from the Subsidiary for providing investment management or administrative services. However, Commodity Strategies pays the Manager based on Commodity Strategies’ net assets which include the assets of the Subsidiary.
The Manager entered into separate sub-advisory agreements with BlackRock International Limited (“BIL”), an affiliate of the Manager, to serve as sub-advisor for Commodity Strategies and with BlackRock Financial Management, Inc. (“BFM”) and BIL, each an affiliate of the Manager, to serve as sub-advisors for Global Long/Short Credit. The Manager pays BFM and BIL, as applicable, for services they provide, a monthly fee that is a percentage of the investment advisory fees paid by Funds to the Manager.
The Trust, on behalf of the Funds, entered into a Distribution Agreement and Distribution and Service Plan with BlackRock Investments, LLC (“BRIL”), an affiliate of the Manager. Pursuant to the Distribution and
Service Plan and in accordance with Rule 12b-1 under the 1940 Act, the Funds pay BRIL ongoing service and distribution fees. The fees are accrued daily and paid monthly at annual rates based upon the average daily net assets of the shares of each Fund as follows:
| | | | | | | | |
| | | Service Fee | | | Distribution Fee | |
Investor A | | | 0.25 | % | | | N/A | |
Investor C | | | 0.25 | % | | | 0.75 | % |
Pursuant to sub-agreements with BRIL, broker-dealers and BRIL provide shareholder servicing and distribution services to each Fund. The ongoing service and/or distribution fees compensate BRIL and each broker-dealer for providing shareholder servicing and/or distribution related services to Investor A and Investor C shareholders.
For the six months ended January 31, 2013, the following table shows the class specific service and distribution fees borne directly by each class of each Fund:
| | | | | | | | | | | | |
| | | Investor A | | | Investor C | | | Total | |
Commodity Strategies | | $ | 21,781 | | | $ | 48,000 | | | $ | 69,781 | |
Global Long/Short Credit | | $ | 156,858 | | | $ | 98,381 | | | $ | 255,239 | |
Pursuant to written agreements, certain financial intermediaries, some of which may be affiliates, provide the Funds with sub-accounting, recordkeeping, sub-transfer agency and other administrative services with respect to sub-accounts they service. For these services, these entities receive an asset based fee or annual fee per shareholder account, which will vary depending on share class and/or net assets.
The Manager maintains a call center, which is responsible for providing certain shareholder services to the Funds, such as responding to shareholder inquiries and processing transactions based upon instructions from shareholders with respect to the subscription and redemption of Fund shares. For the six months ended January 31, 2013, each Fund reimbursed the Manager the following amounts for costs incurred in running the call center, which are included in transfer agent — class specific in the Statements of Operations:
| | | | | | | | | | | | | | | | |
| | | Institutional | | | Investor A | | | Investor C | | | Total | |
Commodity Strategies | | $ | 180 | | | $ | 348 | | | $ | 109 | | | $ | 637 | |
Global Long/Short Credit | | $ | 289 | | | $ | 376 | | | $ | 63 | | | $ | 728 | |
For the six months ended January 31, 2013, the following table shows the class specific transfer agent fees borne directly by each class of each Fund:
| | | | | | | | | | | | | | | | |
| | | Institutional | | | Investor A | | | Investor C | | | Total | |
Commodity Strategies | | $ | 21,864 | | | $ | 10,866 | | | $ | 4,902 | | | $ | 37,632 | |
Global Long/Short Credit | | $ | 58,649 | | | $ | 40,237 | | | $ | 5,573 | | | $ | 104,459 | |
BNY Mellon Investment Servicing (US) Inc. (“BNYMIS”) and the Manager act as co-administrators for the Funds. For these services, the co-administrators receive a combined administration fee computed daily and payable monthly, based on a percentage of the average daily net
| | | | | | |
| | | | | | | |
| | BLACKROCK FUNDS | | JANUARY 31, 2013 | | 43 |
| | |
| Notes to Financial Statements (continued) | | |
assets of each Fund. The combined administration fee is paid at the following annual rates: 0.075% of the first $500 million, 0.065% of the next $500 million and 0.055% of the average daily net assets in excess of $1 billion. In addition, each of the share classes is charged an administration fee based on the following percentages of average daily net assets of each respective class: 0.025% of the first $500 million, 0.015% of the next $500 million and 0.005% of the average daily net assets in excess of $1 billion. In addition, BNYMIS and the Manager may have, at their discretion, voluntarily waived all or any portion of their administration fees for a Fund or a share class which are included in administration fees waived and administration fees waived — class specific in the Statements of Operations. For the six months ended January 31, 2013, the Funds paid the following to the Manager in return for these services, which are included in administration, administration —class specific, administration fees waived and administration fees waived — class specific in the Statements of Operations:
| | | | |
Commodity Strategies | | $ | 87,855 | |
Global Long/Short Credit | | $ | 102,617 | |
For the six months ended January 31, 2013, the following table shows the administration fees — class specific borne directly by each class of each Fund:
| | | | | | | | | | | | | | | | |
| | | Institutional | | | Investor A | | | Investor C | | | Total | |
Commodity Strategies | | $ | 30,497 | | | $ | 2,178 | | | $ | 1,198 | | | $ | 33,873 | |
Global Long/Short Credit | | $ | 25,876 | | | $ | 15,686 | | | $ | 2,459 | | | $ | 44,021 | |
The Manager contractually agreed to waive and/or reimburse fees or expenses, excluding interest expense, dividend expense, income tax expense, acquired fund fees and expenses and certain other fund expenses, which constitute extraordinary expenses not incurred in the ordinary course of the Funds’ business, in order to limit expenses. The expense limitations as a percentage of average daily net assets are as follows:
| | | | | | | | | | | | |
| | | Institutional | | | Investor A | | | Investor C | |
Commodity Strategies | | | 1.30 | % | | | 1.50 | % | | | 2.25 | % |
Global Long/Short Credit | | | 1.20 | % | | | 1.40 | % | | | 2.15 | % |
The Manager has agreed not to reduce or discontinue this contractual waiver or reimbursement prior to December 1, 2013 unless approved by the Board, including a majority of the Independent Trustees.
These amounts waived or reimbursed are included in fees waived by Manager, and shown as administration fees waived—class specific, transfer agent fees waived—class specific and transfer agent fees reimbursed—class specific, respectively, in the Statements of Operations. For the six months ended January 31, 2013, the Manager waived
$124,021 and $143 of investment advisory fees for Commodity Strategies and Global Long/Short Credit, respectively, which are included in fees waived by Manager. Class specific expense waivers or reimbursements are as follows:
| | | | | | | | | | | | | | | | |
| Administration Fees Waived | |
| | | | Institutional | | | | Investor A | | | | Investor C | | | | Total | |
Commodity Strategies | | $ | 3,657 | | | $ | 2,178 | | | $ | 1,194 | | | $ | 7,029 | |
Global Long/Short Credit | | $ | 9,512 | | | $ | 11,972 | | | $ | 1,682 | | | $ | 23,166 | |
| | | | | | | | | | | | | | | | |
| Transfer Agent Fees Waived | |
| | | | Institutional | | | | Investor A | | | | Investor C | | | | Total | |
Commodity Strategies. | | $ | 52 | | | $ | 348 | | | $ | 108 | | | $ | 508 | |
Global Long/Short Credit | | $ | 45 | | | $ | 269 | | | $ | 39 | | | $ | 353 | |
| | | | | | | | | | | | | | | | |
| Transfer Agent Fees Reimbursed | |
| | | | Institutional | | | | Investor A | | | | Investor C | | | | Total | |
Commodity Strategies | | $ | 2,064 | | | $ | 10,223 | | | $ | 4,442 | | | $ | 16,729 | |
Global Long/Short Credit | | $ | 2,035 | | | $ | 14,448 | | | $ | 1,543 | | | $ | 18,026 | |
If during a Fund’s fiscal year the operating expenses of a share class, that at any time during the prior two fiscal years received a waiver or reimbursement from the Manager, are less than the expense limit for that share class, the Manager is entitled to be reimbursed by such share class up to the lesser of (a) the amount of fees waived or expenses reimbursed during those prior two fiscal years under the agreement and (b) the amount by which the expense limit for that share class exceeds the operating expenses of the share class for the current fiscal year, provided that: (1) the Fund of which the share class is a part has more than $50 million in assets for the fiscal year and (2) the Manager or an affiliate continues to serve as the Fund’s investment advisor or administrator. In the event the expense limit for a share class is changed subsequent to a fiscal year in which the Manager becomes entitled to reimbursement for fees waived or reimbursed, the amount available to reimburse the Manager shall be calculated by reference to the expense limit for that share class in effect at the time the Manager became entitled to receive such reimbursement, rather than the subsequently changed expense limit for that share class.
For the six months ended January 31, 2013, the Manager recouped the following class specific waivers and/or reimbursements previously recorded by the Funds:
| | | | | | | | | | | | | | | | |
| | | Fund Level | | | Institutional | | | Investor C | | | Total | |
Commodity Strategies | | | — | | | $ | 17,554 | | | | — | | | $ | 17,554 | |
Global Long/Short Credit | | $ | 3,250 | | | $ | 12,812 | | | $ | 232 | | | $ | 16,294 | |
| | | | | | |
| | | | | | | |
| 44 | | BLACKROCK FUNDS | | JANUARY 31, 2013 | | |
| | |
| Notes to Financial Statements (continued) | | |
On January 31, 2013, the Fund level and class specific waivers and/or reimbursements subject to possible future recoupment under the expense limitation agreement are as follows:
| | | | | | | | |
| | | Expires July 31, | |
| | | 2014 | | | 2015 | |
Commodity Strategies | | | | | | | | |
Fund Level | | $ | 255,733 | | | $ | 124,021 | |
Institutional | | $ | 120 | | | $ | 5,773 | |
Investor A | | $ | 9,256 | | | $ | 12,749 | |
Investor C | | $ | 6,654 | | | $ | 5,744 | |
Global Long/Short Credit | | | | | | | | |
Fund Level | | $ | 85,984 | | | $ | 143 | |
Institutional | | $ | 22,123 | | | $ | 11,592 | |
Investor A | | $ | 29,414 | | | $ | 26,689 | |
Investor C | | $ | 4,966 | | | $ | 3,264 | |
For the six months ended January 31, 2013, affiliates earned underwriting discounts, direct commissions and dealer concessions on sales of each Fund’s Investor A Shares as follows:
| | | | |
Commodity Strategies | | $ | 6,007 | |
Global Long/Short Credit | | $ | 17,543 | |
For the six months ended January 31, 2013, affiliates received CDSCs as follows:
| | | | |
| | | Investor C | |
Commodity Strategies | | $ | 3,040 | |
Global Long/Short Credit | | $ | 9,468 | |
Certain officers and/or trustees of the Trust are officers and/or directors of BlackRock or its affiliates. The Funds reimburse the Manager for a portion of the compensation paid to the Trust’s Chief Compliance Officer, which is included in officer and trustees in the Statements of Operations.
4. Investments:
Purchases and sales of investments including paydowns and excluding short-term securities and US government securities for the six months ended January 31, 2013, were as follows:
| | | | | | | | |
| | | Purchases | | | Sales | |
Commodity Strategies | | $ | 223,236,009 | | | $ | 44,438,810 | |
Global Long/Short Credit | | $ | 645,849,563 | | | $ | 334,690,196 | |
Purchases and sales of US government securities, for the six months ended January 31, 2013, were $21,438,705 and $18,709,055 for Global Long/Short Credit, respectively.
Transactions in options written for the six months ended January 31, 2013 were as follows:
| | | | | | | | | | | | | | | | | | | | |
| | | Global Long/Short Credit | |
| | | Calls | | | Puts | |
| | | Notional
(000)1 | | | Premiums
Received | | | Contracts | | | Notional
(000)1 | | | Premiums
Received | |
Outstanding options, beginning of period | | | 1,680 | | | $ | 9,155 | | | | — | | | | — | | | | — | |
Options written | | | 2,670 | | | | 7,580 | | | | 1,900 | | | | 79,010 | | | $ | 712,313 | |
Options expired | | | (4,350 | ) | | | (16,735 | ) | | | — | | | | (79,010 | ) | | | (463,413 | ) |
| | | | | | | | |
Outstanding options, end of period | | | — | | | | — | | | | 1,900 | | | | — | | | $ | 248,900 | |
| | | | | | | | |
| | 1 | | Amount shown is in currency in which the transaction was denominated. |
5. Income Tax Information:
As of January 31, 2013, gross unrealized appreciation and gross unrealized depreciation based on cost for federal income tax purposes were as follows:
| | | | | | | | |
| | | Commodity
Strategies | | | Global Long/Short Credit | |
Tax cost | | $ | 461,507,981 | | | $ | 704,288,322 | |
| | | | |
Gross unrealized appreciation | | $ | 11,997,509 | | | $ | 17,367,150 | |
Gross unrealized depreciation | | | (12,757,903 | ) | | | (1,539,198 | ) |
| | | | |
Net unrealized appreciation (depreciation) | | $ | (760,394 | ) | | $ | 15,827,952 | |
| | | | |
6. Borrowings:
The Trust, on behalf of the Funds, along with certain other funds managed by the Manager and its affiliates, is a party to a $500 million credit agreement with a group of lenders. The Funds may borrow under the credit agreement to fund shareholder redemptions. Effective November 2011 to November 2012, the credit agreement had the following terms: a commitment fee of 0.065% per annum based on the Funds’ pro rata share of the unused portion of the credit agreement and interest at a rate equal to the higher of (a) the one-month LIBOR plus 0.80% per annum or (b) the Fed Funds rate plus 0.80% per annum on amounts borrowed. In addition, the Funds paid administration and arrangement fees which were allocated to the Funds based on their net assets as of October 31, 2011. The credit agreement, which expired in November 2012, was renewed with the same terms until November 2013. Effective November 2012 to November 2013, the credit agreement has the following terms: a commitment fee of 0.065% per annum based on the Funds’ pro rata share of the unused portion of the credit agreement and interest at a rate equal to the higher of (a) the one-month LIBOR plus 0.80% per annum or (b) the Fed Funds rate plus 0.80% per annum on amounts borrowed. In addition, the Funds paid administration and arrangement fees which were allocated to the Funds based on their net assets as of October 31, 2012. The Funds did not borrow under the credit agreement during the six months ended January 31, 2013.
| | | | | | |
| | | | | | | |
| | BLACKROCK FUNDS | | JANUARY 31, 2013 | | 45 |
| | |
| Notes to Financial Statements (continued) | | |
7. Concentration, Market and Credit Risk:
In the normal course of business, the Funds invest in securities and enter into transactions where risks exist due to fluctuations in the market (market risk) or failure of the issuer of a security to meet all its obligations (issuer credit risk). The value of securities held by the Funds may decline in response to certain events, including those directly involving the issuers whose securities are owned by the Funds; conditions affecting the general economy; overall market changes; local, regional or global political, social or economic instability; and currency and interest rate and price fluctuations. Similar to issuer credit risk, the Funds may be exposed to counterparty credit risk, or the risk that an entity with which the Funds have unsettled or open transactions may fail to or be unable to perform on its commitments. The Funds manage counterparty credit risk by entering into transactions only with counterparties that they believe have the financial resources to honor their obligations and by monitoring the financial stability of those counterparties. Financial assets, which potentially expose the Funds to market, issuer and counterparty credit risks, consist principally of financial instruments and
receivables due from counterparties. The extent of the Funds’ exposure to market, issuer and counterparty credit risks with respect to these financial assets is generally approximated by their value recorded in Statements of Assets and Liabilities, less any collateral held by the Funds.
As of January 31, 2013, Commodity Strategies invested a significant portion of its assets in securities in the Materials and Energy sectors and Commodity-Linked Notes. Changes in economic conditions affecting the Materials and Energy sectors and Commodity-Linked Notes would have a greater impact on Commodity Strategies and could affect the value, income and/or liquidity of positions in such securities.
As of January 31, 2013, Global Long/Short Credit invested a substantial amount of its assets in issuers located in a single country or a limited number of countries. When Global Long/Short Credit concentrates its investments in this manner, it assumes the risk that economic, political and social conditions in those countries may have a significant impact on its investment performance.
8. Capital Share Transactions:
Transactions in capital shares for each class were as follows:
| | | | | | | | | | | | | | | | | | |
| | | Six Months Ended
January 31, 2013 | | | | | Period
October 3, 20111 to
July 31, 2012 | |
| Commodity Strategies | | Shares | | | Amount | | | | | Shares | | | Amount | |
| Institutional | | | | | | | | | | | | | | |
Shares sold | | | 31,959,363 | | | $ | 334,853,791 | | | | | | 7,436,604 | | | $ | 76,261,209 | |
Shares issued in reinvestment of dividends and distributions | | | 6,319 | | | | 63,693 | | | | | | 14,233 | | | | 145,470 | |
Shares redeemed | | | (4,675,314 | ) | | | (48,949,269 | ) | | | | | (1,110,296 | ) | | | (10,828,248 | ) |
| | | | | | | | | | |
Net increase | | | 27,290,368 | | | $ | 285,968,215 | | | | | | 6,340,541 | | | $ | 65,578,431 | |
| | | | | | | | | | |
| | | | | | | | | | | | | | | | | | |
| Investor A | | | | | | | | | | | | | | | | | | |
Shares sold | | | 758,454 | | | $ | 7,762,071 | | | | | | 2,033,983 | | | $ | 21,470,402 | |
Shares issued in reinvestment of dividends and distributions | | | — | | | | — | | | | | | 5,912 | | | | 60,487 | |
Shares redeemed | | | (387,977 | ) | | | (3,965,056 | ) | | | | | (501,384 | ) | | | (4,902,555 | ) |
| | | | | | | | | | |
Net increase | | | 370,477 | | | $ | 3,797,015 | | | | | | 1,538,511 | | | $ | 16,628,334 | |
| | | | | | | | | | |
| | | | | | | | | | | | | | | | | | |
| Investor C | | | | | | | | | | | | | | | | | | |
Shares sold | | | 383,936 | | | $ | 3,879,649 | | | | | | 910,910 | | | $ | 9,683,048 | |
Shares issued in reinvestment of distributions | | | — | | | | — | | | | | | 4,999 | | | | 51,041 | |
Shares redeemed | | | (116,012 | ) | | | (1,186,661 | ) | | | | | (39,239 | ) | | | (399,388 | ) |
| | | | | | | | | | |
Net increase | | | 267,924 | | | $ | 2,692,988 | | | | | | 876,670 | | | $ | 9,334,701 | |
Total Net Increase | | | 27,928,769 | | | $ | 292,458,218 | | | | | | 8,755,722 | | | $ | 91,541,466 | |
| | | | | | | | | | |
| | | | | | |
| | | | | | | |
| 46 | | BLACKROCK FUNDS | | JANUARY 31, 2013 | | |
| | |
| Notes to Financial Statements (concluded) | | |
| | | | | | | | | | | | | | | | | | |
Global Long/Short Credit | | Six Months
Ended
January 31, 2013 | | | | | Period
September 30, 20111 to
July 31, 2012 | |
| | Shares | | | Amount | | | | | Shares | | | Amount | |
| Institutional | | | | | | | | | | | | | | | | | | |
Shares sold | | | 22,475,059 | | | $ | 237,166,350 | | | | | | 18,720,394 | | | $ | 190,002,450 | |
Shares issued in reinvestment of dividends and distributions | | | 245,437 | | | | 2,587,732 | | | | | | 20,133 | | | | 206,555 | |
Shares redeemed | | | (3,685,553 | ) | | | (38,891,603 | ) | | | | | (5,807,196 | ) | | | (59,421,672 | ) |
| | | | | | | | | | |
Net increase | | | 19,034,943 | | | $ | 200,862,479 | | | | | | 12,933,331 | | | $ | 130,787,333 | |
| | | | | | | | | | |
| | | | | | | | | | | | | | | | | | |
| Investor A | | | | | | | | | | | | | | | | | | |
Shares sold | | | 14,616,971 | | | $ | 153,750,176 | | | | | | 7,851,912 | | | $ | 79,951,902 | |
Shares issued in reinvestment of dividends and distributions | | | 200,951 | | | | 2,116,616 | | | | | | 11,669 | | | | 119,439 | |
Shares redeemed | | | (1,550,122 | ) | | | (16,308,107 | ) | | | | | (967,321 | ) | | | (9,833,980 | ) |
| | | | | | | | | | |
Net increase | | | 13,267,800 | | | $ | 139,558,685 | | | | | | 6,896,260 | | | $ | 70,237,361 | |
| | | | | | | | | | |
| | | | | | | | | | | | | | | | | | |
| Investor C | | | | | | | | | | | | | | | | | | |
Shares sold | | | 1,835,017 | | | $ | 19,248,615 | | | | | | 1,436,613 | | | $ | 14,537,311 | |
Shares issued in reinvestment of dividends and distributions | | | 24,091 | | | | 252,656 | | | | | | 1,113 | | | | 11,295 | |
Shares redeemed | | | (191,985 | ) | | | (2,009,215 | ) | | | | | (157,671 | ) | | | (1,599,642 | ) |
| | | | | | | | | | |
Net increase | | | 1,667,123 | | | $ | 17,492,056 | | | | | | 1,280,055 | | | $ | 12,948,964 | |
| | | | | | | | | | |
Total Net Increase | | | 33,969,866 | | | $ | 357,913,220 | | | | | | 21,109,646 | | | $ | 213,973,658 | |
| | | | | | | | | | |
| | 1 | | Commencement of operations. |
At January 31, 2013, shares owned by affiliates for Global Long/Short Credit were as follows:
| | | | |
| | | Shares | |
Institutional | | | 2,496,000 | |
Investor A | | | 2,000 | |
Investor C | | | 2,000 | |
9. Subsequent Events:
Management has evaluated the impact of all subsequent events on the Funds through the date the financial statements were issued and has determined that there were no subsequent events requiring adjustment or additional disclosure in the financial statements.
| | | | | | |
| | | | | | | |
| | BLACKROCK FUNDS | | JANUARY 31, 2013 | | 47 |
Ronald W. Forbes, Co-Chair of the Board and Trustee
Rodney D. Johnson, Co-Chair of the Board and Trustee
Paul L. Audet, Trustee
David O. Beim, Trustee
Henry Gabbay, Trustee
Dr. Matina S. Horner, Trustee
Herbert I. London, Trustee
Ian A. MacKinnon, Trustee
Cynthia A. Montgomery, Trustee
Joseph P. Platt, Trustee
Robert C. Robb, Jr., Trustee
Toby Rosenblatt, Trustee
Kenneth L. Urish, Trustee
Frederick W. Winter, Trustee
John M. Perlowski, President and Chief Executive Officer
Richard Hoerner, CFA, Vice President
Brendan Kyne, Vice President
Simon Mendelson, Vice President
Christopher Stavrakos, CFA, Vice President
Neal Andrews, Chief Financial Officer
Jay Fife, Treasurer
Brian Kindelan, Chief Compliance Officer and Anti-Money Laundering Officer
Benjamin Archibald, Secretary
Investment Advisor and Co-Administrator
BlackRock Advisors, LLC
Wilmington, DE 19809
Sub-Advisors
BlackRock International Limited1,2
Edinburgh, Scotland EH3 8JB
BlackRock Financial Management, Inc.2
New York, NY 10055
Distributor
BlackRock Investments, LLC
New York, NY 10022
Accounting Agent, Co-Administrator and Transfer Agent
BNY Mellon Investment Servicing (US) Inc.
Wilmington, DE 19809
Custodian
The Bank of New York Mellon
New York, NY 10286
Legal Counsel
Sidley Austin LLP
New York, NY 10019
Independent Registered Public Accounting Firm
PricewaterhouseCoopers LLC
Philadelphia, PA 19103
Address of the Trust
100 Bellevue Parkway
Wilmington, DE 19809
| | 1 | | For Commodity Strategies. |
| | 2 | | For Global Long/Short Credit. |
| | | | | | |
| | | | | | | |
| 48 | | BLACKROCK FUNDS | | JANUARY 31, 2013 | | |
Electronic Delivery
Electronic copies of most financial reports and prospectuses are available on the Funds’ websites or shareholders can sign up for
e-mail notifications of quarterly statements, annual and semi-annual reports and prospectuses by enrolling in the Funds’ electronic delivery program.
To enroll:
Shareholders Who Hold Accounts with Investment Advisors, Banks or Brokerages:
Please contact your financial advisor. Please note that not all investment advisors, banks or brokerages may offer this service.
Shareholders Who Hold Accounts Directly with BlackRock:
| 1) | | Access the BlackRock website at http://www.blackrock.com/ edelivery |
| 2) | | Select “eDelivery” under the “More Information” section |
Householding
The Funds will mail only one copy of shareholder documents, including prospectuses, annual and semi-annual reports and proxy statements, to shareholders with multiple accounts at the same address. This practice is commonly called “householding” and is intended to reduce expenses and eliminate duplicate mailings of shareholder documents. Mailings of your shareholder documents may be householded indefinitely unless you instruct us otherwise. If you do not want the mailing of these documents to be combined with those for other members of your household, please call the Funds at (800) 441-7762.
Availability of Quarterly Schedule of Investments
The Funds file their complete schedule of portfolio holdings with the SEC for the first and third quarters of each fiscal year on Form N-Q. The Funds’ Forms N-Q are available on the SEC’s website at
http:// www.sec.gov and may also be reviewed and copied at the SEC’s Public Reference Room in Washington, DC. Information on how to access documents on the SEC’s website without charge may be obtained by calling (800) SEC-0330. The Funds’ Forms N-Q may also be obtained upon request and without charge by calling (800) 441-7762.
Availability of Proxy Voting Policies and Procedures
A description of the policies and procedures that the Funds use to determine how to vote proxies relating to portfolio securities is available (1) without charge, upon request, by calling
(800) 441-7762; (2) at http://www.blackrock.com; and (3) on the SEC’s website at http:// www.sec.gov.
Availability of Proxy Voting Record
Information about how the Funds voted proxies relating to securities held in the Funds’ portfolios during the most recent 12-month period ended June 30 is available upon request and without charge (1) at http://www.blackrock.com or by calling (800) 441-7762 and (2) on the SEC’s website at http://www.sec.gov.
Account Information
Call us at (800) 441-7762 from 8:00 AM to 6:00 PM EST on any business day to get information about your account balances, recent transactions and share prices. You can also reach us on the Web
at http:// www.blackrock.com/funds.
Automatic Investment Plans
Investor Class shareholders who want to invest regularly can arrange to have $50 or more automatically deducted from their checking or savings account and invested in any of the BlackRock funds.
Systematic Withdrawal Plan
Investor Class shareholders can establish a systematic withdrawal plan and receive periodic payments of $50 or more from their BlackRock funds, as long as their account balance is at least $10,000.
Retirement Plans
Shareholders may make investments in conjunction with Traditional, Rollover, Roth, Coverdell, Simple IRAs, SEP IRAs and 403(b) Plans.
| | | | | | |
| | | | | | | |
| | BLACKROCK FUNDS | | JANUARY 31, 2013 | | 49 |
| | |
| Additional Information (concluded) | | |
|
| BlackRock Privacy Principles |
BlackRock is committed to maintaining the privacy of its current and former fund investors and individual clients (collectively, “Clients”) and to safeguarding their non-public personal information. The following information is provided to help you understand what personal information BlackRock collects, how we protect that information and why in certain cases we share such information with select parties.
If you are located in a jurisdiction where specific laws, rules or regulations require BlackRock to provide you with additional or different privacy-related rights beyond what is set forth below, then BlackRock will comply with those specific laws, rules or regulations.
BlackRock obtains or verifies personal non-public information from and about you from different sources, including the following: (i) information we receive from you or, if applicable, your financial intermediary, on applications, forms or other documents; (ii) information about your transactions with us, our affiliates, or others; (iii) information we receive from a consumer reporting agency; and (iv) from visits to our websites.
BlackRock does not sell or disclose to non-affiliated third parties any non-public personal information about its Clients, except as permitted by law or as is necessary to respond to regulatory requests or to service Client accounts. These non-affiliated third parties are required to protect the confidentiality and security of this information and to use it only for its intended purpose.
We may share information with our affiliates to service your account or to provide you with information about other BlackRock products or services that may be of interest to you. In addition, BlackRock restricts access to non-public personal information about its Clients to those BlackRock employees with a legitimate business need for the information. BlackRock maintains physical, electronic and procedural safeguards that are designed to protect the non-public personal information of its Clients, including procedures relating to the proper storage and disposal of such information.
| | | | | | |
| | | | | | | |
| 50 | | BLACKROCK FUNDS | | JANUARY 31, 2013 | | |
| | |
| A World-Class Mutual Fund Family | | |
BlackRock offers a diverse lineup of open-end mutual funds crossing all investment styles and managed by experts in equity, fixed income and tax-exempt investing.
BlackRock ACWI ex-US Index Fund
BlackRock All-Cap Energy & Resources Portfolio
BlackRock Basic Value Fund
BlackRock Capital Appreciation Fund
BlackRock China Fund
BlackRock Commodity Strategies Fund
BlackRock Disciplined Small Cap Core Fund
BlackRock Emerging Markets Fund
BlackRock Emerging Markets Long/Short Equity Fund
BlackRock Energy & Resources Portfolio
BlackRock Equity Dividend Fund
BlackRock EuroFund BlackRock Flexible Equity Fund
BlackRock Focus Growth Fund
BlackRock Global Dividend Income Portfolio
BlackRock Global Long/Short Equity Fund
BlackRock Global Opportunities Portfolio
BlackRock Global SmallCap Fund
BlackRock Health Sciences Opportunities Portfolio
BlackRock Index Equity Portfolio
BlackRock India Fund
BlackRock International Fund
BlackRock International Index Fund
BlackRock International Opportunities Portfolio
BlackRock Large Cap Core Fund
BlackRock Large Cap Core Plus Fund
BlackRock Large Cap Growth Fund
BlackRock Large Cap Value Fund
BlackRock Latin America Fund
BlackRock Long-Horizon Equity Fund
BlackRock Mid-Cap Growth Equity Portfolio
BlackRock Mid-Cap Value Opportunities Fund
BlackRock Natural Resources Trust
BlackRock Pacific Fund
BlackRock Real Estate Securities Fund
BlackRock Russell 1000 Index Fund
BlackRock Science & Technology Opportunities Portfolio
BlackRock Small Cap Growth Equity Portfolio
BlackRock Small Cap Growth Fund II
BlackRock Small Cap Index Fund
BlackRock S&P 500 Index Fund
BlackRock S&P 500 Stock Fund
BlackRock U.S. Opportunities Portfolio
BlackRock Value Opportunities Fund
BlackRock World Gold Fund
|
| Taxable Fixed Income Funds |
BlackRock Bond Index Fund
BlackRock Core Bond Portfolio
BlackRock CoreAlpha Bond Fund
BlackRock Emerging Market Local Debt Portfolio
BlackRock Floating Rate Income Portfolio
BlackRock Global Long/Short Credit Fund
BlackRock GNMA Portfolio
BlackRock High Yield Bond Portfolio
BlackRock Inflation Protected Bond Portfolio
BlackRock International Bond Portfolio
BlackRock Long Duration Bond Portfolio
BlackRock Low Duration Bond Portfolio
BlackRock Secured Credit Portfolio
BlackRock Strategic Income Opportunities Portfolio
BlackRock Total Return Fund
BlackRock U.S. Government Bond Portfolio
BlackRock U.S. Mortgage Portfolio
BlackRock World Income Fund
|
| Municipal Fixed Income Funds |
BlackRock California Municipal Bond Fund
BlackRock High Yield Municipal Fund
BlackRock Intermediate Municipal Fund
BlackRock National Municipal Fund
BlackRock New Jersey Municipal Bond Fund
BlackRock New York Municipal Bond Fund
BlackRock Pennsylvania Municipal Bond Fund
BlackRock Short-Term Municipal Fund
| | | | | | | | | | | | | | |
| BlackRock Balanced Capital Fund | | LifePath Active Portfolios | | LifePath Index Portfolios |
| BlackRock Global Allocation Fund | | 2015 | | | 2040 | | | | | Retirement | | 2040 | | |
| BlackRock Managed Volatility Portfolio | | 2020 | | | 2045 | | | | | 2020 | | 2045 | | |
| BlackRock Multi-Asset Income Portfolio | | 2025 | | | 2050 | | | | | 2025 | | 2050 | | |
| BlackRock Multi-Asset Real Return Fund | | 2030 | | | 2055 | | | | | 2030 | | 2055 | | |
| BlackRock Strategic Risk Allocation Fund | | 2035 | | | | | | | | 2035 | | | | |
| | | | | | |
| BlackRock Prepared Portfolios | | LifePath Portfolios | | | | | | | | | | | | |
Conservative Prepared Portfolio | | Retirement | | | 2040 | | | | | | | | | |
Moderate Prepared Portfolio | | 2020 | | | 2045 | | | | | | | | | |
Growth Prepared Portfolio | | 2025 | | | 2050 | | | | | | | | | |
Aggressive Growth Prepared Portfolio | | 2030 | | | 2055 | | | | | | | | | |
| | 2035 | | | | | | | | | | | | |
BlackRock mutual funds are currently distributed by BlackRock Investments, LLC. You should consider the investment objectives, risks, charges and expenses of the funds under consideration carefully before investing. Each fund’s prospectus contains this and other information and is available at www.blackrock.com or by calling (800) 441-7762 or from your financial advisor. The prospectus should be read carefully before investing.
| | | | | | |
| | | | | | | |
| | BLACKROCK FUNDS | | JANUARY 31, 2013 | | 51 |
This report is transmitted to shareholders only. It is not authorized for use as an offer of sale or a solicitation of an offer to buy shares of the Funds unless accompanied or preceded by that Fund’s current prospectus. Past performance results shown in this report should not be considered a representation of future performance. Investment returns and principal value of shares will fluctuate so that shares, when redeemed, may be worth more or less than their original cost. Statements and other information herein are as dated and are subject to change.
Investment in foreign securities involves special risks including fluctuating foreign exchange rates, foreign government regulations, differing degrees of liquidity and the possibility of substantial volatility due to adverse political, economic or other developments.
| | |
CSGLSC-1/13-SAR 
| | |
JANUARY 31, 2013
| | | | |
SEMI-ANNUAL REPORT (UNAUDITED) | | | | BLACKROCK ® |
BlackRock FundsSM
„ BlackRock Multi-Asset Real Return Fund
„ BlackRock Strategic Risk Allocation Fund
| | |
Not FDIC Insured ¡ May Lose Value ¡ No Bank Guarantee | | |
| | | | | | |
| | | | | | | |
| 2 | | BLACKROCK FUNDS | | JANUARY 31, 2013 | | |
Dear Shareholder
Financial markets have substantially improved over the past year, providing investors with considerable relief compared to where things were during the global turmoil seen in 2011. Despite a number of headwinds, higher-risk asset classes boasted strong returns as investors sought meaningful yields in the ongoing low-interest-rate environment.
Rising investor confidence drove equity markets higher in early 2012, while climbing US Treasury yields pressured higher-quality fixed income assets. The second quarter, however, brought a market reversal as Europe’s debt crisis boiled over once again. Political instability in Greece and severe deficit and liquidity problems in Spain raised the specter of a euro collapse. Alongside the drama in Europe, investors were discouraged by gloomy economic reports from various parts of the world. A slowdown in China, a key powerhouse for global growth, emerged as a particular concern. But as the outlook for the global economy worsened, investors grew increasingly optimistic that the world’s largest central banks would soon intervene to stimulate growth. This theme, along with the European Central Bank’s (“ECB’s”) firm commitment to preserve the euro currency bloc, drove most asset classes higher through the summer. Policy relief came in early September, when the ECB announced its decision to support the eurozone’s troubled peripheral countries with unlimited purchases of short term sovereign debt. Days later, the US Federal Reserve announced its own much-anticipated stimulus package.
Although financial markets world-wide were buoyed by accommodative monetary policy, risk assets weakened in the fall. Global trade slowed as many European countries fell into recession and growth continued to decelerate in China, where a once-a-decade leadership change compounded uncertainty. In the United States, stocks slid on lackluster corporate earnings reports and market volatility rose during the lead up to the US Presidential election. In the post-election environment, investors grew increasingly concerned over automatic tax increases and spending cuts that had been scheduled to take effect at the beginning of 2013 (known as the “fiscal cliff”). There was widespread fear that the fiscal cliff would push the nation into recession unless politicians could agree upon alternate measures to reduce the deficit before the end of 2012. Worries that bipartisan gridlock would preclude a timely budget deal triggered higher levels of volatility in financial markets around the world in the months leading up to the last day of the year. Ultimately, the United States averted the worst of the fiscal cliff with a last-minute tax deal; however, decisions relating to spending cuts and the debt ceiling continue to weigh on investors’ minds.
Investors shook off the nerve-wracking finale to 2012 and began the New Year with a powerful equity rally. Key indicators signaled broad-based improvements in the world’s major economies, particularly China. In the United States, economic data was mixed, but pointed to a continued recovery. The risk of inflation remained low and the US Federal Reserve showed no signs of curtailing its stimulus programs. Additionally, January saw the return of funds that investors had pulled out of the market in late 2012 amid uncertainty about tax-rate increases ahead of the fiscal cliff deadline. In fixed income markets, rising US Treasuries yields dragged down higher-quality asset classes, while high yield bonds continued to benefit from investor demand for yield in the low-rate environment.
On the whole, riskier asset classes outperformed lower-risk investments for the 6- and 12-month periods ended January 31, 2013. International equities were the strongest performers. US stocks and high yield bonds also generated significant returns. Emerging market equities were particularly volatile, but still posted gains for both the 6- and 12-month periods. US Treasury yields remained low, but experienced increasing volatility in recent months. Rising yields near the end of the period resulted in negative returns for Treasuries and investment-grade bonds for the 6-month period. Tax-exempt municipal bonds, however, benefited from favorable supply-and-demand dynamics. Near-zero short term interest rates continued to keep yields on money market securities near their all-time lows.
While investors continue to face a host of unknowns, we believe new opportunities abound. BlackRock was built to provide the global market insight, breadth of capabilities, unbiased investment advice and deep risk management expertise these times require. We encourage you to visit www.blackrock.com/newworld for more information.
Sincerely,

Rob Kapito
President, BlackRock Advisors, LLC

“Despite a number of headwinds, higher-risk asset classes boasted strong returns as investors sought meaningful yields in the ongoing low-interest-rate environment.”
Rob Kapito
President, BlackRock Advisors, LLC
| | | | | | | | |
| Total Returns as of January 31, 2013 | |
| | | 6-month | | | 12-month | |
US large cap equities
(S&P 500® Index) | | | 9.91 | % | | | 16.78 | % |
US small cap equities
(Russell 2000® Index) | | | 15.51 | | | | 15.47 | |
International equities
(MSCI Europe, Australasia, Far East Index) | | | 18.61 | | | | 17.25 | |
Emerging market equities (MSCI Emerging Markets Index) | | | 13.11 | | | | 7.64 | |
3-month Treasury bill
(BofA Merrill Lynch
3-Month US Treasury Bill Index) | | | 0.07 | | | | 0.11 | |
US Treasury securities
(BofA Merrill Lynch
10- Year US Treasury Index) | | | (2.90 | ) | | | 1.28 | |
US investment grade
bonds (Barclays
US Aggregate Bond
Index) | | | (0.29 | ) | | | 2.59 | |
Tax-exempt municipal
bonds (S&P Municipal
Bond Index) | | | 2.21 | | | | 5.50 | |
US high yield bonds
(Barclays US Corporate
High Yield 2% Issuer Capped Index) | | | 7.37 | | | | 13.87 | |
|
| Past performance is no guarantee of future results. Index performance is shown for illustrative purposes only. You cannot invest directly in an index. | |
| | | | | | |
| | | | | | | |
| | | THIS PAGE NOT PART OF YOUR FUND REPORT | | | | 3 |
| | |
| Fund Summary as of January 31, 2013 | | BlackRock Multi-Asset Real Return Fund |
BlackRock Multi-Asset Real Return Fund’s (the “Fund”) investment objective is to seek to generate returns in excess of the actual rate of inflation over a complete market cycle.
| | |
| Portfolio Composition | | Percent of
Investment Companies |
| | | | |
Equity Funds | | | 46 | % |
Fixed Income Funds | | | 44 | |
Short-Term Securities | | | 10 | |
| | |
| Portfolio Holdings | | Percent of
Investment Companies |
| | | | |
BlackRock Floating Rate Income Portfolio, Institutional Class | | | 29 | % |
iShares Dow Jones U.S. Real Estate Index Fund | | | 10 | |
BlackRock Liquidity Funds, TempFund, Institutional Class | | | 10 | |
iShares Barclays 0-5 Year TIPS Bond Fund | | | 10 | |
SPDR S&P Oil & Gas Equipment & Services ETF | | | 8 | |
Health Care Select Sector SPDR Fund | | | 7 | |
Financial Select Sector SPDR Fund | | | 7 | |
iShares FTSE EPRA/NAREIT Developed Real Estate ex-U.S. Index Fund | | | 5 | |
iShares Barclays TIPS Bond Fund | | | 5 | |
Alerian MLP ETF | | | 5 | |
iShares Gold Trust | | | 4 | |
| | | | | | | | | | | | | | | | | | | | | | | | | | | | |
| | | Actual | | | Hypothetical2 | | | | |
| | | Beginning
Account Value
December 27, 2012 | | | Ending
Account Value
January 31, 2013 | | | Expenses Paid
During the Period1 | | | Beginning Account Value
December 27, 2012 | | | Ending Account Value
January 31, 2013 | | | Expenses Paid
During the Period1 | | | Annualized
Expense
Ratio | |
Institutional | | $ | 1,000.00 | | | $ | 1,034.00 | | | $ | 0.78 | | | $ | 1,000.00 | | | $ | 1,004.03 | | | $ | 0.77 | | | | 0.80 | % |
Investor A | | $ | 1,000.00 | | | $ | 1,034.00 | | | $ | 1.02 | | | $ | 1,000.00 | | | $ | 1,003.79 | | | $ | 1.01 | | | | 1.05 | % |
Investor C | | $ | 1,000.00 | | | $ | 1,034.00 | | | $ | 1.76 | | | $ | 1,000.00 | | | $ | 1,003.07 | | | $ | 1.73 | | | | 1.80 | % |
| | 1 | | For each class of the Fund, expenses are equal to the annualized expense ratio for the class, multiplied by the average account value over the period, multiplied by 35/365 (to reflect the period from December 27, 2012, the commencement of operations, to January 31, 2013). |
| | 2 | | Hypothetical 5% annual return before expenses is calculated by pro rating the number of days in the most recent fiscal period divided by 365. |
See “Disclosure of Expenses” on page 6 for further information on how expenses were calculated.
| | | | | | |
| | | | | | | |
| 4 | | BLACKROCK FUNDS | | JANUARY 31, 2013 | | |
| | |
| Fund Summary as of January 31, 2013 | | BlackRock Strategic Risk Allocation Fund |
BlackRock Strategic Risk Allocation Fund’s (the “Fund”) investment objective is to seek total return.
| | |
| Portfolio Composition | | Percent of
Affiliated Investment Companies |
| | | | |
Fixed Income Funds | | | 52 | % |
Short-Term Securities | | | 48 | |
| | |
| Portfolio Holdings | | Percent of
Affiliated Investment Companies |
| | | | |
iShares Barclays TIPS Bond Fund | | | 52 | % |
BlackRock Liquidity Funds, TempFund, Institutional Class | | | 48 | |
| | | | | | | | | | | | | | | | | | | | | | | | | | | | |
| | | Actual | | | Hypothetical2 | | | | |
| | | Beginning
Account Value
December 27,
2012 | | | Ending
Account
Value
January 31,
2013 | | | Expenses
Paid
During the
Period1 | | | Beginning
Account
Value
December 27,
2012 | | | Ending
Account
Value
January 31,
2013 | | | Expenses Paid
During the
Period1 | | | Annualized
Expense
Ratio | |
Institutional | | $ | 1,000.00 | | | $ | 1,006.70 | | | $ | 0.96 | | | $ | 1,000.00 | | | $ | 1,003.84 | | | $ | 0.96 | | | | 1.00 | % |
Investor A | | $ | 1,000.00 | | | $ | 1,006.70 | | | $ | 1.20 | | | $ | 1,000.00 | | | $ | 1,003.60 | | | $ | 1.20 | | | | 1.25 | % |
Investor C | | $ | 1,000.00 | | | $ | 1,005.60 | | | $ | 1.92 | | | $ | 1,000.00 | | | $ | 1,002.88 | | | $ | 1.92 | | | | 2.00 | % |
| | 1 | | For each class of the Fund, expenses are equal to the annualized expense ratio for the class, multiplied by the average account value over the period, multiplied by 35/365 (to reflect the period from December 27, 2012, the commencement of operations, to January 31, 2013). |
| | 2 | | Hypothetical 5% annual return before expenses is calculated by pro rating the number of days in the most recent fiscal period divided by 365. |
See “Disclosure of Expenses” on page 6 for further information on how expenses were calculated.
| | | | | | |
| | | | | | | |
| | | BLACKROCK FUNDS | | JANUARY 31, 2013 | | 5 |
| Ÿ | | Institutional Shares are not subject to any sales charge. These shares bear no ongoing distribution or service fees and are available only to eligible investors. |
| Ÿ | | Investor A Shares are subject to a maximum initial sales charge (front-end load) of 5.25% and a service fee of 0.25% per year (but no distribution fee). |
| Ÿ | | Investor C Shares are subject to a 1.00% contingent deferred sales charge (“CDSC”) if redeemed within one year of purchase.
In addition, these shares are subject to a distribution fee of 0.75% per year and a service fee of 0.25% per year. |
Refer to www.blackrock.com/funds to obtain performance data current to the most recent month end. Performance information reflects past performance and does not guarantee future results. Current performance may be lower or higher than the performance data quoted. Performance results do not reflect the deduction of taxes that a shareholder would
pay on fund distributions or the redemption of fund shares. Investment return and principal value of shares will fluctuate so that shares, when redeemed, may be worth more or less than their original cost. Dividends paid to each class of shares will vary because of the different levels of service, distribution and transfer agency fees applicable to each class, which are deducted from the income available to be paid to shareholders.
BlackRock Advisors, LLC (the “Manager”), the Funds’ investment advisor, waived and/or reimbursed a portion of each Fund’s expenses. Without such waiver and/or reimbursement, each Fund’s performance would have been lower. The Manager is under no obligation to waive or reimburse or to continue waiving or reimbursing its fees after the applicable termination date. See Note 3 of the Notes to Consolidated Financial Statements for additional information on waivers and reimbursements.
Shareholders of the Funds may incur the following charges: (a) transactional expenses, such as sales charges; and (b) operating expenses, including investment advisory fees, service and distribution fees, including 12b-1 fees, acquired fund fees and expenses and other Fund expenses. The expense examples on the previous pages (which are based on a hypothetical investment of $1,000 invested on December 27, 2012 (commencement of operations) and held through January 31, 2013) are intended to assist shareholders both in calculating expenses based on an investment in each Fund and in comparing these expenses with similar costs of investing in other mutual funds.
The expense examples provide information about actual account values and actual expenses. In order to estimate the expenses a shareholder paid during the period covered by this report, shareholders can divide their account value by $1,000 and then multiply the result by the number corresponding to their Fund and share class under the headings entitled “Expenses Paid During the Period.”
The expense examples also provide information about hypothetical account values and hypothetical expenses based on each Fund’s actual expense ratio and an assumed rate of return of 5% per year before expenses. In order to assist shareholders in comparing the ongoing expenses of investing in these Funds and other funds, compare the 5% hypothetical examples with the 5% hypothetical examples that appear in other funds’ shareholder reports.
The expenses shown in the expense examples are intended to highlight shareholders’ ongoing costs only and do not reflect any transactional expenses, such as sales charges, if any. Therefore, the hypothetical examples are useful in comparing ongoing expenses only, and will not help shareholders determine the relative total expenses of owning different funds. If these transactional expenses were included, shareholder expenses would have been higher.
| | | | | | |
| | | | | | | |
| 6 | | BLACKROCK FUNDS | | JANUARY 31, 2013 | | |
| | |
| Derivative Financial Instruments | | |
The Funds may invest in various derivative financial instruments, including financial futures contracts, foreign currency exchange contracts and swaps, as specified in Note 2 of the Notes to Consolidated Financial Statements, which may constitute forms of economic leverage. Such derivative financial instruments are used to obtain exposure to a security, index and/or market without owning or taking physical custody of securities or to hedge market, equity, credit, interest rate, foreign currency exchange rate and/or commodity risks. Derivative financial instruments involve risks, including the imperfect correlation between the value of a derivative financial instrument and the underlying asset, possible default of the counterparty to the transaction or illiquidity of the derivative financial instrument. The Funds’ ability to use a derivative financial
instrument successfully depends on the investment advisor’s ability to predict pertinent market movements accurately, which cannot be assured. The use of derivative financial instruments may result in losses greater than if they had not been used, may require a Fund to sell or purchase portfolio investments at inopportune times or for distressed values, may limit the amount of appreciation a Fund can realize on an investment, may result in lower dividends paid to shareholders or may cause a Fund to hold an investment that it might otherwise sell. The Funds’ investments in these instruments are discussed in detail in the Notes to Consolidated Financial Statements.
| | | | | | |
| | | | | | | |
| | | BLACKROCK FUNDS | | JANUARY 31, 2013 | | 7 |
| | |
| Consolidated Schedule of Investments January 31, 2013 (Unaudited) | | BlackRock Multi-Asset Real Return Fund (Percentages shown are based on Net Assets) |
| | | | | | | | |
| Investment Companies | | Shares | | | Value | |
Equity Funds — 46.1% | | | | | | | | |
Alerian MLP ETF | | | 28,125 | | | $ | 486,281 | |
Financial Select Sector SPDR Fund | | | 42,761 | | | | 743,187 | |
Health Care Select Sector SPDR Fund | | | 17,478 | | | | 749,981 | |
iShares Dow Jones U.S. Real Estate Index Fund (a) | | | 15,454 | | | | 1,039,590 | |
iShares FTSE EPRA/NAREIT Developed
Real Estate ex-U.S. Index Fund (a) | | | 15,263 | | | | 510,700 | |
iShares Gold Trust (a) | | | 27,898 | | | | 451,948 | |
SPDR S&P Oil & Gas Equipment & Services ETF | | | 20,408 | | | | 783,871 | |
| | | | | | | | |
| | | | | | | | 4,765,558 | |
Fixed Income Funds — 43.8% | | | | | | | | |
BlackRock Floating Rate Income Portfolio, Institutional
Class (a) | | | 289,950 | | | | 3,032,875 | |
iShares Barclays 0-5 Year TIPS Bond Fund (a) | | | 9,705 | | | | 1,002,818 | |
| | | | | | | | |
| Investment Companies | | Shares | | | Value | |
Fixed Income Funds (concluded) | | | | | | | | |
iShares Barclays TIPS Bond Fund (a) | | | 4,102 | | | $ | 495,439 | |
| | | | | | | | |
| | | | | | | | 4,531,132 | |
| | | | | | | | |
| | |
Short-Term Securities — 9.8% | | | | | | | | |
BlackRock Liquidity Funds, TempFund,
Institutional Class, 0.10% (a)(b) | | | 1,012,597 | | | | 1,012,597 | |
| Total Investment Companies (Cost — $10,014,567) — 99.7% | | | | 10,309,287 | |
| Other Assets Less Liabilities — 0.3% | | | | 35,646 | |
| | | | | | | | |
Net Assets — 100.0% | | | $ | 10,344,933 | |
| | | | | | | | |
|
| Notes to Consolidated Schedule of Investments |
| (a) | | Investments in issuers considered to be an affiliate of the Fund during the period ended January 31, 2013, for purposes of Section 2(a)(3) of the Investment Company Act of 1940, as amended, were as follows: |
| | | | | | | | | | | | | | | | |
| Affiliate | | Shares Purchased | | | Shares Held at
January 31, 2013 | | | Value at
January 31, 2013 | | | Income | |
| BlackRock Floating Rate Income Portfolio, Institutional Class | | | 289,950 | | | | 289,950 | | | $ | 3,032,875 | | | | — | |
| BlackRock Liquidity Funds, TempFund, Institutional Class | | | 1,012,597 | 1 | | | 1,012,597 | | | $ | 1,012,597 | | | $ | 12,843 | |
| iShares Barclays 0-5 Year TIPS Bond Fund | | | 9,705 | | | | 9,705 | | | $ | 1,002,818 | | | | — | |
| iShares Barclays TIPS Bond Fund | | | 4,102 | | | | 4,102 | | | $ | 495,439 | | | | — | |
| iShares Gold Trust | | | 27,898 | | | | 27,898 | | | $ | 451,948 | | | | — | |
| iShares Dow Jones U.S. Real Estate Index Fund | | | 15,454 | | | | 15,454 | | | $ | 1,039,590 | | | | — | |
| iShares FTSE EPRA/NAREIT Developed Real Estate ex-U.S. Index Fund | | | 15,263 | | | | 15,263 | | | $ | 510,700 | | | | — | |
| 1 | | Represents net shares purchased. |
| (b) | | Represents the current yield as of report date. |
| | | | |
| To simplify the listings of portfolio holdings in the Consolidated Schedules of Investments, the names and descriptions of many of the securities have been abbreviated according to the following list: | | AUD Australian Dollar CAD Canadian Dollar ETF Exchange Traded Fund EUR Euro GBP British Pound JPY Japanese Yen LIBOR London Interbank Offered Rate | | MLP Master Limited Partnership REIT Real Estate Investment Trust S&P Standard & Poor’s SPDR Standard & Poor’s Depositary Receipts USD US Dollar |
See Notes to Consolidated Financial Statements.
| | | | | | |
| | | | | | | |
| 8 | | BLACKROCK FUNDS | | JANUARY 31, 2013 | | |
| | |
| Consolidated Schedule of Investments (concluded) | | BlackRock Multi-Asset Real Return Fund |
| Ÿ | | Total return swaps outstanding as of January 31, 2013 were as follows: |
| | | | | | | | | | | | | | | | |
| Reference Entity | | Fixed Amount | | | Counterparty | | Expiration
Date | | Contracts | | | Unrealized
Appreciation | |
Excess Return on the S&P GSCI Commodity Index | | | USD 1,012,374 | 1 | | JPMorgan Chase & Co. | | 12/31/13 | | | 2,138 | | | $ | 45,217 | |
| 1 | | Fund receives the total return of the referenced entity and pays the fixed amount. Net payment at termination. |
| Ÿ | | Fair Value Measurements — Various inputs are used in determining the fair value of investments and derivative financial instruments. These inputs to valuation techniques are categorized into a disclosure hierarchy consisting of three broad levels for financial statement purposes as follows: |
| Ÿ | | Level 1 — unadjusted price quotations in active markets/exchanges for identical assets and liabilities that the Fund has the ability to access |
| Ÿ | | Level 2 — other observable inputs (including, but not limited to, quoted prices for similar assets or liabilities in markets that are active, quoted prices for identical or similar assets or liabilities in markets that are not active, inputs other than quoted prices that are observable for the assets or liabilities (such as interest rates, yield curves, volatilities, prepayment speeds, loss severities, credit risks and default rates) or other market-corroborated inputs) |
| Ÿ | | Level 3 — unobservable inputs based on the best information available in the circumstances, to the extent observable inputs are not available (including the Fund’s own assumptions used in determining the fair value of investments and derivative financial instruments) |
The hierarchy gives the highest priority to unadjusted quoted prices in active markets for identical assets or liabilities (Level 1 measurements) and the lowest priority to unobservable inputs (Level 3 measurements). Accordingly, the degree of judgment exercised in determining fair value is greatest for instruments categorized in Level 3. The inputs used to measure fair value may fall into different levels of the fair value hierarchy. In such cases, for disclosure purposes, the level in the fair value hierarchy within which the fair value measurement falls in its entirety is determined based on the lowest level input that is significant to the fair value measurement in its entirety.
Changes in valuation techniques may result in transfers into or out of an assigned level within the disclosure hierarchy. In accordance with the Fund’s policy, transfers between different levels of the fair value disclosure hierarchy are deemed to have occurred as of the beginning of the reporting period. The categorization of a value determined for investments and derivative financial instruments is based on the pricing transparency of the investment and derivative financial instrument and is not necessarily an indication of the risks associated with investing in those securities. For information about the Fund’s policy regarding valuation of investments and derivative financial instruments and other significant accounting policies, please refer to Note 1 of the Notes to Consolidated Financial Statements.
The following tables summarize the Fund’s investments and derivative financial instruments categorized in the disclosure hierarchy as of January 31, 2013:
| | | | | | | | | | | | | | | | |
| | | Level 1 | | | Level 2 | | | Level 3 | | | Total | |
Assets: | | | | | | | | | | | | | | | | |
| Investments: | | | | | | | | | | | | | | | | |
Investment Companies | | $ | 10,309,287 | | | | — | | | | — | | | $ | 10,309,287 | |
| | | | | | | | | | | | | | | | |
| | | Level 1 | | | Level 2 | | | Level 3 | | | Total | |
| Derivative Financial Instruments1 | | | | | | | | | | | | | | | | |
Assets: | | | | | | | | | | | | | | | | |
| Commodity contracts | | | — | | | $ | 45,217 | | | | — | | | $ | 45,217 | |
| 1 | | Derivative financial instruments are swaps which are valued at the unrealized appreciation/depreciation on the instrument. |
See Notes to Consolidated Financial Statements.
| | | | | | |
| | | | | | | |
| | | BLACKROCK FUNDS | | JANUARY 31, 2013 | | 9 |
| | |
| Consolidated Schedule of Investments January 31, 2013 (Unaudited) | | BlackRock Strategic Risk Allocation Fund (Percentages shown are based on Net Assets) |
| | | | | | | | |
Affiliated Investment Companies (a) | | Shares | | | Value | |
Fixed Income Funds — 51.2% | |
iShares Barclays TIPS Bond Fund | | | 106,645 | | | $ | 12,880,583 | |
| | | | | | | | |
| | |
Short-Term Securities — 47.3% | | | | | | | | |
BlackRock Liquidity Funds, TempFund,
Institutional Class, 0.10% (b) | | | 11,907,799 | | | | 11,907,799 | |
| | | | | | |
| | | | | Value | |
Total Affiliated Investment Companies
(Cost — $24,958,268) — 98.5% | | $ | 24,788,382 | |
| Other Assets Less Liabilities — 1.5% | | | 382,622 | |
| | | | | | |
Net Assets — 100.0% | | $ | 25,171,004 | |
| | | | | | |
|
| Notes to Consolidated Schedule of Investments |
| (a) | | Investments in issuers considered to be an affiliate of the Fund during the period ended January 31, 2013, for purposes of Section 2(a)(3) of the Investment Company Act of 1940, as amended, were as follows: |
| | | | | | | | | | | | | | | | |
| Affiliate | | Shares
Purchased | | | Shares Held at
January 31, 2013 | | | Value at
January 31, 2013 | | | Income | |
BlackRock Liquidity Funds, TempFund, Institutional Class | | | 11,907,799 | 1 | | | 11,907,799 | | | $ | 11,907,799 | | | $ | 1,341 | |
iShares Barclays TIPS Bond Fund | | | 106,645 | | | | 106,645 | | | $ | 12,880,583 | | | | — | |
| 1 | | Represents net shares purchased. |
| (b) | | Represents the current yield as of report date. |
| Ÿ | | Financial futures contracts as of January 31, 2013 were as follows: |
| | | | | | | | | | | | | | | | |
Contracts
Purchased | | | Issue | | Exchange | | Expiration | | Notional Value | | | Unrealized
Appreciation | |
| | 1 | | | ASX SPI 200 Futures | | Sydney | | March 2013 | | USD | 126,309 | | | $ | 5,453 | |
| | 20 | | | E-mini Russell 2000 Futures | | New York | | March 2013 | | USD | 1,804,200 | | | | 143,254 | |
| | 27 | | | E-mini S&P 500 Futures | | Chicago Mercantile | | March 2013 | | USD | 2,015,955 | | | | 121,625 | |
| | 22 | | | EURO STOXX 50 Index Futures | | Eurex | | March 2013 | | USD | 809,814 | | | | 17,384 | |
| | 4 | | | FTSE 100 Index Futures | | London | | March 2013 | | USD | 397,133 | | | | 21,613 | |
| | 35 | | | mini MSCI Emerging Markets Index Futures | | New York | | March 2013 | | USD | 1,875,650 | | | | 36,277 | |
| | 4 | | | TOPIX Index Futures | | Tokyo | | March 2013 | | USD | 410,083 | | | | 33,736 | |
| | Total | | | | | | | | | | | | | $ | 379,342 | |
| | | | | | | | | | | | | | | | |
| Ÿ | | Foreign currency exchange contracts as of January 31, 2013 were as follows: |
| | | | | | | | | | | | | | | | | | | | |
| Currency Purchased | | | Currency
Sold | | | Counterparty | | Settlement
Date | | | Unrealized
Appreciation
(Depreciation) | |
| USD | | | 250,000 | | | AUD | | | 241,972 | | | HSBC Holdings Plc | | | 3/07/13 | | | $ | (1,697 | ) |
| USD | | | 158,000 | | | CAD | | | 157,532 | | | HSBC Holdings Plc | | | 3/07/13 | | | | 171 | |
| USD | | | 178,000 | | | EUR | | | 134,559 | | | HSBC Holdings Plc | | | 3/07/13 | | | | (4,739 | ) |
| USD | | | 120,000 | | | GBP | | | 74,298 | | | HSBC Holdings Plc | | | 3/07/13 | | | | 2,164 | |
| USD | | | 108,000 | | | JPY | | | 9,294,382 | | | HSBC Holdings Plc | | | 3/07/13 | | | | 6,339 | |
| Total | | | | | | | | | | | | | | | | | | $ | 2,238 | |
| | | | | | | | | | | | | | | | | | | | |
| | | | | | |
| See Notes to Consolidated Financial Statements. | | | | |
| | | | | | | |
| 10 | | BLACKROCK FUNDS | | JANUARY 31, 2013 | | |
| | |
Consolidated Schedule of Investments (continued) | | BlackRock Strategic Risk Allocation Fund |
| Ÿ | | Credit default swaps — sold protection outstanding as of January 31, 2013 were as follows: |
| | | | | | | | | | | | | | | | | | | | |
| Index | | Receive
Fixed Rate | | | Counterparty | | Expiration
Date | | Credit
Rating1 | | | Notional
Amount (000)2 | | | Unrealized
Appreciation | |
CDX.NA.IG Series 19 Version 1 | | | 1.00 | % | | Bank of America Corp. | | 12/20/17 | | | BBB+ | | | USD | 2,700 | | | $ | 11,534 | |
CDX.NA.HY Series 19 Version 1 | | | 5.00 | % | | Bank of America Corp. | | 12/20/17 | | | B+ | | | USD | 3,700 | | | | 91,352 | |
iTraxx Europe Crossover Series 18 Version 1 | | | 5.00 | % | | Bank of America Corp. | | 12/20/17 | | | B+ | | | EUR | 1,000 | | | | 25,423 | |
iTraxx Europe Series 18 Version 1 | | | 1.00 | % | | Bank of America Corp. | | 12/20/17 | | | A- | | | EUR | 2,000 | | | | 7,672 | |
Total | | | | | | | | | | | | | | | | | | $ | 135,981 | |
| | | | | | | | | | | | | | | | | | | | |
| 1 | | Using S&P’s rating of the issuer or the underlying securities of the index. |
| 2 | | The maximum potential amount the Fund may pay should a negative credit event take place as defined under the terms of the agreement. |
| Ÿ | | Total return swaps outstanding as of January 31, 2013 were as follows: |
| | | | | | | | | | | | | | | | | | |
| Reference Entity | | | | Fixed Amount/ Fixed Rate/ Floating Rate | | | Counterparty | | Expiration
Date | | Contracts/
Notional
Amount (000) | | | Unrealized Appreciation (Depreciation) | |
Canadian (10 Year) Bond Futures March 2013 | | | | CAD | 135,603,900 | 3 | | Bank of America Corp. | | 2/22/13 | | | 10 | | | $ | (18,988 | ) |
Long Gilt Futures March 2013 | | | | GBP | 95,223,840 | 3 | | Bank of America Corp. | | 2/25/13 | | | 8 | | | | (33,747 | ) |
U.S. Treasury (10 Year) Notes Futures March 2013 | | | | USD | 558,148,920 | 3 | | Bank of America Corp. | | 2/26/13 | | | 42 | | | | (67,677 | ) |
Euro-Bund Futures March 2013 | | | | EUR | 247,360,880 | 3 | | Bank of America Corp. | | 3/05/13 | | | 17 | | | | (83,245 | ) |
Japanese Government (10 Year) Bond Futures March 2013 | | | | JPY | 18,672,667,000 | 3 | | Bank of America Corp. | | 3/06/13 | | | 13 | | | | 10,152 | |
Australian (10 Year) Bond Futures March 2013 | | | | AUD | 96,759,200 | 3 | | Bank of America Corp. | | 3/13/13 | | | 10 | | | | (1,921 | ) |
JPMorgan EMBI Plus Index | | 3-month LIBOR Plus 0.415% | | | JPMorgan Chase & Co. | | 3/20/13 | | USD | 3,600 | | | | (79,602 | ) |
S&P GSCI Light Energy Official Close Index | | | | USD | 1,300,086 | 3 | | JPMorgan Chase & Co. | | 3/28/13 | | | 3,858 | | | | 41,600 | |
Net Total Return on the FTSE EPRA/NAREIT | | | | | | | | | | | | | | | | | | |
| Global REIT Index | | 3-month LIBOR Minus 0.10% | | | JPMorgan Chase & Co. | | 6/28/13 | | USD | 1 | | | | 87,842 | |
Total | | | | | | | | | | | | | | | | $ | (145,586 | ) |
| | | | | | | | | | | | | | | | | | |
| 3 | | Fund receives the total return of the referenced entity and pays the fixed amount. Net payment at termination. |
| Ÿ | | Fair Value Measurements — Various inputs are used in determining the fair value of investments and derivative financial instruments. These inputs to valuation techniques are categorized into a disclosure hierarchy consisting of three broad levels for financial statement purposes as follows: |
| Ÿ | | Level 1 — unadjusted price quotations in active markets/exchanges for identical assets and liabilities that the Fund has the ability to access |
| Ÿ | | Level 2 — other observable inputs (including, but not limited to, quoted prices for similar assets or liabilities in markets that are active, quoted prices for identical or similar assets or liabilities in markets that are not active, inputs other than quoted prices that are observable for the assets or liabilities (such as interest rates, yield curves, volatilities, prepayment speeds, loss severities, credit risks and default rates) or other market-corroborated inputs) |
| Ÿ | | Level 3 — unobservable inputs based on the best information available in the circumstances, to the extent observable inputs are not available (including the Fund’s own assumptions used in determining the fair value of investments and derivative financial instruments) |
The hierarchy gives the highest priority to unadjusted quoted prices in active markets for identical assets or liabilities (Level 1 measurements) and the lowest priority to unobservable inputs (Level 3 measurements). Accordingly, the degree of judgment exercised in determining fair value is greatest for instruments categorized in Level 3. The inputs used to measure fair value may fall into different levels of the fair value hierarchy. In such cases, for disclosure purposes, the level in the fair value hierarchy within which the fair value measurement falls in its entirety is determined based on the lowest level input that is significant to the fair value measurement in its entirety.
Changes in valuation techniques may result in transfers into or out of an assigned level within the disclosure hierarchy. In accordance with the Fund’s policy, transfers between different levels of the fair value disclosure hierarchy are deemed to have occurred as of the beginning of the reporting period. The categorization of a value determined for investments and derivative financial instruments is based on the pricing transparency of the investment and derivative financial instrument and is not necessarily an indication of the risks associated with investing in those securities. For information about the Fund’s policy regarding valuation of investments and derivative financial instruments and other significant accounting policies, please refer to Note 1 of the Notes to Consolidated Financial Statements.
See Notes to Consolidated Financial Statements.
| | | | | | |
| | | | | | | |
| | | BLACKROCK FUNDS | | JANUARY 31, 2013 | | 11 |
| | |
| Consolidated Schedule of Investments (concluded) | | BlackRock Strategic Risk Allocation Fund |
The following tables summarize the Fund’s investments and derivative financial instruments categorized in the disclosure hierarchy as of January 31, 2013:
| | | | | | | | | | | | | | | | |
| | | Level 1 | | | Level 2 | | | Level 3 | | | Total | |
Assets: | | | | | | | | | | | | | | | | |
Investments: | | | | | | | | | | | | | | | | |
Affiliated Investment Companies | | $ | 24,788,382 | | | | — | | | | — | | | $ | 24,788,382 | |
| | | | | | | | | | | | | | | | |
| | | Level 1 | | | Level 2 | | | Level 3 | | | Total | |
Derivative Financial Instruments1 | | | | | | | | | | | | | | | | |
Assets: | | | | | | | | | | | | | | | | |
Commodity contracts | | | — | | | $ | 41,600 | | | | — | | | $ | 41,600 | |
Credit contracts | | | — | | | | 135,981 | | | | — | | | | 135,981 | |
Equity contracts | | $ | 379,342 | | | | 87,842 | | | | — | | | | 467,184 | |
Foreign currency exchange contracts | | | — | | | | 8,674 | | | | — | | | | 8,674 | |
Interest rate contracts | | | — | | | | 10,152 | | | | — | | | | 10,152 | |
Liabilities: | | | | | | | | | | | | | | | | |
Foreign currency exchange contracts | | | — | | | | (6,436 | ) | | | — | | | | (6,436 | ) |
Interest rate contracts | | | — | | | | (285,180 | ) | | | — | | | | (285,180 | ) |
Total | | $ | 379,342 | | | $ | (7,367 | ) | | | — | | | $ | 371,975 | |
| | | | |
| 1 | | Derivative financial instruments are swaps, financial futures contracts and foreign currency exchange contracts which are valued at the unrealized appreciation/depreciation on the instrument. |
Certain of the Fund’s assets and liabilities are held at carrying amount, which approximates fair value for financial statement purposes. As of January 31, 2013, such assets and liabilities are categorized within the disclosure hierarchy as follows:
| | | | | | | | | | | | | | | | |
| | | Level 1 | | | Level 2 | | | Level 3 | | | Total | |
Assets: | | | | | | | | | | | | | | | | |
Cash pledged as collateral for financial futures contracts | | $ | 389,000 | | | | — | | | | — | | | $ | 389,000 | |
Liabilities: | | | | | | | | | | | | | | | | |
Bank overdraft | | | — | | | $ | (3,469 | ) | | | — | | | | (3,469 | ) |
Foreign bank overdraft | | | — | | | | (1,322 | ) | | | — | | | | (1,322 | ) |
Total | | $ | 389,000 | | | $ | (4,791 | ) | | | — | | | $ | 384,209 | |
| | | | |
| | | | | | |
| See Notes to Consolidated Financial Statements. | | | | |
| | | | | | | |
| 12 | | BLACKROCK FUNDS | | JANUARY 31, 2013 | | |
| | |
| Consolidated Statements of Assets and Liabilities | | |
| | | | | | | | |
| January 31, 2013 (Unaudited) | | BlackRock Multi-Asset Real
Return Fund | | | BlackRock Strategic Risk
Allocation Fund | |
| | | | | | | | |
| Assets | | | | | | | | |
Investments at value — unaffiliated1 | | $ | 2,763,320 | | | | — | |
Investments at value — affiliated2 | | | 7,545,967 | | | $ | 24,788,382 | |
Cash pledged as collateral for financial futures contracts | | | — | | | | 389,000 | |
Swap premiums paid | | | — | | | | 31,502 | |
Unrealized appreciation on foreign currency exchange contracts | | | — | | | | 8,674 | |
Variation margin receivable | | | — | | | | 20,808 | |
Unrealized appreciation on swaps | | | 45,217 | | | | 275,575 | |
Deferred offering costs | | | 147,353 | | | | 147,353 | |
Dividends receivable — affiliated | | | 88 | | | | 977 | |
Receivable from Manager | | | 15,627 | | | | 2,815 | |
| | | | |
Total assets | | | 10,517,572 | | | | 25,665,086 | |
| | | | |
| | | | | | | | |
| Liabilities | | | | | | | | |
Bank overdraft | | | — | | | | 3,469 | |
Foreign bank overdraft3 | | | — | | | | 1,322 | |
Variation margin payable | | | — | | | | 7,526 | |
Swap premiums received | | | — | | | | 18,168 | |
Unrealized depreciation on foreign currency exchange contracts | | | — | | | | 6,436 | |
Unrealized depreciation on swaps | | | — | | | | 285,180 | |
Offering costs payable | | | 162,981 | | | | 162,981 | |
Professional fees payable | | | 8,120 | | | | 6,790 | |
Officer’s and Trustees’ fees payable | | | 215 | | | | 154 | |
Other affiliates payable | | | 55 | | | | 353 | |
Service and distribution fees payable | | | 26 | | | | 26 | |
Other accrued expenses payable | | | 1,242 | | | | 1,677 | |
| | | | |
Total liabilities | | | 172,639 | | | | 494,082 | |
| | | | |
Net Assets | | $ | 10,344,933 | | | $ | 25,171,004 | |
| | | | |
| | | | | | | | |
| Net Assets Consist of | | | | | | | | |
Paid-in capital | | $ | 10,000,000 | | | $ | 25,097,002 | |
Undistributed (distributions in excess of) net investment income | | | 4,996 | | | | (114,815 | ) |
Accumulated net realized loss | | | — | | | | (13,506 | ) |
Net unrealized appreciation/depreciation | | | 339,937 | | | | 202,323 | |
| | | | |
Net Assets | | $ | 10,344,933 | | | $ | 25,171,004 | |
| | | | |
1 Investments at cost — unaffiliated | | $ | 2,535,142 | | | | — | |
2 Investments at cost — affiliated | | $ | 7,479,425 | | | $ | 24,958,268 | |
3 Foreign bank overdraft at cost | | $ | — | | | $ | 1,289 | |
| | | | | | |
| See Notes to Consolidated Financial Statements. | | | | |
| | | | | | | |
| | | BLACKROCK FUNDS | | JANUARY 31, 2013 | | 13 |
| | |
| Consolidated Statements of Assets and Liabilities (concluded) | | |
| | | | | | | | |
| January 31, 2013 (Unaudited) | | BlackRock
Multi-Asset Real
Return Fund | | | BlackRock
Strategic Risk
Allocation Fund | |
| | | | | | | | |
| Net Asset Value | | | | | | | | |
| Institutional | | | | | | | | |
Net assets | | $ | 10,293,239 | | | $ | 25,120,702 | |
| | | | |
Shares outstanding4 | | | 995,000 | | | | 2,504,683 | |
| | | | |
Net asset value | | $ | 10.34 | | | $ | 10.03 | |
| | | | |
| Investor A | | | | | | | | |
Net assets | | $ | 25,856 | | | $ | 25,160 | |
| | | | |
Shares outstanding4 | | | 2,500 | | | | 2,509 | |
| | | | |
Net asset value | | $ | 10.34 | | | $ | 10.03 | |
| | | | |
| Investor C | | | | | | | | |
Net assets | | $ | 25,838 | | | $ | 25,142 | |
| | | | |
Shares outstanding4 | | | 2,500 | | | | 2,509 | |
| | | | |
Net asset value | | $ | 10.34 | | | $ | 10.02 | |
| | | | |
| | 4 | | Unlimited number of shares authorized, $0.001 par value. |
| | | | | | |
| See Notes to Consolidated Financial Statements. | | | | |
| | | | | | | |
| 14 | | BLACKROCK FUNDS | | JANUARY 31, 2013 | | |
| | |
| Consolidated Statements of Operations | | |
| | | | | | | | |
| Period December 27, 20121 to January 31, 2013 (Unaudited) | | BlackRock
Multi-Asset Real
Return Fund | | | BlackRock
Strategic Risk
Allocation Fund | |
| | | | | | | | |
| Investment Income | | | | | | | | |
Dividends — affiliated | | $ | 12,843 | | | $ | 1,341 | |
| | | | |
| | | | | | | | |
| Expenses | | | | | | | | |
Investment advisory | | | 5,864 | | | | 18,093 | |
Organization and offering | | | 86,118 | | | | 86,118 | |
Professional | | | 8,120 | | | | 6,790 | |
Administration | | | 733 | | | | 1,809 | |
Printing | | | 630 | | | | 630 | |
Officer and Trustees | | | 316 | | | | 353 | |
Administration — class specific | | | 245 | | | | 603 | |
Custodian | | | 154 | | | | 296 | |
Service and distribution — class specific | | | 30 | | | | 30 | |
Transfer agent — class specific | | | 11 | | | | 13 | |
Miscellaneous | | | 560 | | | | 560 | |
| | | | |
Total expenses | | | 102,781 | | | | 115,295 | |
Less fees waived by Manager | | | (5,864 | ) | | | (18,093 | ) |
Less administration fees waived | | | (733 | ) | | | (1,045 | ) |
Less administration fees waived — class specific | | | (184 | ) | | | (599 | ) |
Less transfer agent fees reimbursed — class specific | | | (7 | ) | | | (12 | ) |
Less expenses reimbursed by Manager | | | (88,146 | ) | | | (71,392 | ) |
| | | | |
Total expenses after fees waived and reimbursed | | | 7,847 | | | | 24,154 | |
| | | | |
Net investment income (loss) | | | 4,996 | | | | (22,813 | ) |
| | | | |
| | | | | | | | |
| Realized and Unrealized Gain (Loss) | | | | | | | | |
| Net realized loss from: | | | | | | | | |
Swaps | | | — | | | | (11,473 | ) |
Foreign currency transactions | | | — | | | | (2,033 | ) |
| | | | |
| | | — | | | | (13,506 | ) |
| | | | |
| Net change in unrealized appreciation/depreciation on: | | | | | | | | |
Investments — unaffiliated | | | 228,178 | | | | — | |
Investments — affiliated | | | 66,542 | | | | (169,886 | ) |
Financial futures contracts | | | — | | | | 379,342 | |
Swaps | | | 45,217 | | | | (9,605 | ) |
Foreign currency translations | | | — | | | | 2,472 | |
| | | | |
| | | 339,937 | | | | 202,323 | |
| | | | |
Total realized and unrealized gain | | | 339,937 | | | | 188,817 | |
| | | | |
Net Increase in Net Assets Resulting from Operations | | $ | 344,933 | | | $ | 166,004 | |
| | | | |
| | 1 | | Commencement of operations. |
| | | | | | |
| See Notes to Consolidated Financial Statements. | | | | |
| | | | | | | |
| | | BLACKROCK FUNDS | | JANUARY 31, 2013 | | 15 |
| | |
| Consolidated Statements of Changes in Net Assets | | |
| | | | | | | | | | |
| | | BlackRock
Multi-Asset Real
Return Fund | | | BlackRock
Strategic Risk
Allocation Fund |
| Increase in Net Assets: | | Period December 27,
20121 to January 31, 2013 (Unaudited) | | | Period
December 27,
20121 to January 31, 2013 (Unaudited) |
| | | | | | | | | | |
| Operations | | | | | | | | | | |
Net investment income (loss) | | $ | 4,996 | | | $ | (22,813 | ) | | |
Net realized loss | | | — | | | | (13,506 | ) | | |
Net change in unrealized appreciation/depreciation | | | 339,937 | | | | 202,323 | | | |
| | | |
Net increase in net assets resulting from operations | | | 344,933 | | | | 166,004 | | | |
| | | |
| | | | | | | | | | |
| Dividends to Shareholders From | | | | | | | | | | |
| Net investment income: | | | | | | | | | | |
Institutional | | | — | | | | (91,821 | ) | | |
Investor A | | | — | | | | (91 | ) | | |
Investor C | | | — | | | | (90 | ) | | |
| | | |
Decrease in net assets resulting from dividends to shareholders | | | — | | | | (92,002 | ) | | |
| | | |
| | | | | | | | | | |
| Capital Share Transactions | | | | | | | | | | |
Net increase in net assets derived from capital share transactions | | | 10,000,000 | | | | 25,097,002 | | | |
| | | |
| | | | | | | | | | |
| Net Assets | | | | | | | | | | |
Total increase in net assets | | | 10,344,933 | | | | 25,171,004 | | | |
Beginning of period | | | — | | | | — | | | |
| | | |
End of period | | $ | 10,344,933 | | | $ | 25,171,004 | | | |
| | | |
Undistributed (distributions in excess of) net investment income | | $ | 4,996 | | | $ | (114,815 | ) | | |
| | | |
| | 1 | | Commencement of operations. |
| | | | | | |
| See Notes to Consolidated Financial Statements. | | | | |
| | | | | | | |
| 16 | | BLACKROCK FUNDS | | JANUARY 31, 2013 | | |
| | |
| Consolidated Financial Highlights | | BlackRock Multi-Asset Real Return Fund |
| | | | | | | | | | | | | | |
| | | Period December 27, 20121 to January 31, 2013
(Unaudited) |
| | | Institutional | | | Investor A | | | Investor C | | | |
| | | | | | | | | | | | | | |
| Per Share Operating Performance | | | | | | | | | | | | | | |
Net asset value, beginning of period | | $ | 10.00 | | | $ | 10.00 | | | $ | 10.00 | | | |
| | | |
Net investment income (loss)2 | | | 0.01 | | | | 0.00 | 3 | | | (0.00 | )4 | | |
Net realized and unrealized gain | | | 0.33 | | | | 0.34 | | | | 0.34 | | | |
| | | |
Net asset value, end of period | | $ | 10.34 | | | $ | 10.34 | | | $ | 10.34 | | | |
| | | |
| | | | | | | | | | | | | | |
| Total Investment Return5,6 | | | | | | | | | | | | | | |
Based on net asset value | | | 3.40 | % | | | 3.40 | % | | | 3.40 | % | | |
| | | |
| | | | | | | | | | | | | | |
| Ratios to Average Net Assets7,8 | | | | | | | | | | | | | | |
Total expenses9 | | | 3.99% | | | | 4.38% | | | | 5.13% | | | |
| | | |
Total expenses after fees waived and reimbursed | | | 0.80% | | | | 1.05% | | | | 1.80% | | | |
| | | |
Net investment income (loss) | | | 0.51% | | | | 0.26% | | | | (0.49)% | | | |
| | | |
| | | | | | | | | | | | | | |
| Supplemental Data | | | | | | | | | | | | | | |
Net assets, end of period (000) | | $ | 10,293 | | | $ | 26 | | | $ | 26 | | | |
| | | |
Portfolio turnover | | | 0% | | | | 0% | | | | 0% | | | |
| | | |
| | 1 | | Commencement of operations. |
| | 2 | | Based on average shares outstanding. |
| | 3 | | Amount is less than $0.005 per share. |
| | 4 | | Amount is greater than $(0.005) per share. |
| | 5 | | Where applicable, total investment returns exclude the effects of any sales charges and include the reinvestment of dividends and distributions. |
| | 6 | | Aggregate total investment return. |
| | 7 | | Ratios do not include expenses incurred indirectly as a result of investments in underlying funds of approximately 0.41%. |
| | 9 | | Organization costs were not annualized in the calculation of the expense ratios. If these expenses were annualized, the total expenses for Institutional, Investor A and Investor C would have been 10.51%, 10.90% and 11.65%, respectively. |
| | | | | | |
| See Notes to Consolidated Financial Statements. | | | | |
| | | | | | | |
| | | BLACKROCK FUNDS | | JANUARY 31, 2013 | | 17 |
| | |
| Consolidated Financial Highlights | | BlackRock Strategic Risk Allocation Fund |
| | | | | | | | | | | | | | |
| | | Period December 27, 20121 to January 31, 2013
(Unaudited) |
| | | Institutional | | | Investor A | | | Investor C | | | |
| | | | | | | | | | | | | | |
| Per Share Operating Performance | | | | | | | | | | | | | | |
Net asset value, beginning of period | | $ | 10.00 | | | $ | 10.00 | | | $ | 10.00 | | | |
| | | |
Net investment loss2 | | | (0.01 | ) | | | (0.01 | ) | | | (0.02 | ) | | |
Net realized and unrealized gain | | | 0.08 | | | | 0.08 | | | | 0.08 | | | |
| | | |
Net increase from investment operations | | | 0.07 | | | | 0.07 | | | | 0.06 | | | |
| | | |
Dividends from net investment income | | | (0.04 | ) | | | (0.04 | ) | | | (0.04 | ) | | |
| | | |
Net asset value, end of period | | $ | 10.03 | | | $ | 10.03 | | | $ | 10.02 | | | |
| | | |
| | | | | | | | | | | | | | |
| Total Investment Return3,4 | | | | | | | | | | | | | | |
Based on net asset value | | | 0.67 | % | | | 0.67 | % | | | 0.56 | % | | |
| | | |
| | | | | | | | | | | | | | |
| Ratios to Average Net Assets5,6 | | | | | | | | | | | | | | |
Total expenses7 | | | 2.14% | | | | 2.56% | | | | 3.31% | | | |
| | | |
Total expenses after fees waived and reimbursed | | | 1.00% | | | | 1.25% | | | | 2.00% | | | |
| | | |
Net investment loss | | | (0.94)% | | | | (1.20)% | | | | (1.95)% | | | |
| | | |
| | | | | | | | | | | | | | |
| Supplemental Data | | | | | | | | | | | | | | |
Net assets, end of period (000) | | $ | 25,121 | | | $ | 25 | | | $ | 25 | | | |
| | | |
Portfolio turnover | | | 0% | | | | 0% | | | | 0% | | | |
| | | |
| | 1 | | Commencement of operations. |
| | 2 | | Based on average shares outstanding. |
| | 3 | | Where applicable, total investment returns exclude the effects of any sales charges and include the reinvestment of dividends and distributions. |
| | 4 | | Aggregate total investment return. |
| | 5 | | Ratios do not include expenses incurred indirectly as a result of investments in underlying funds of approximately 0.10%. |
| | 7 | | Organization costs were not annualized in the calculation of the expense ratios. If these expenses were annualized, the total expenses for Institutional, Investor A and Investor C would have been 4.78%, 5.20% and 5.95%, respectively. |
| | | | | | |
| See Notes to Consolidated Financial Statements. | | | | |
| | | | | | | |
| 18 | | BLACKROCK FUNDS | | JANUARY 31, 2013 | | |
| | |
| Notes to Consolidated Financial Statements (Unaudited) | | |
1. Organization and Significant Accounting Policies:
BlackRock FundsSM (the “Trust”) is registered under the Investment Company Act of 1940, as amended (the “1940 Act”), as an open-end management investment company. The Trust is organized as a Massachusetts business trust. BlackRock Multi-Asset Real Return Fund (“Multi-Asset Real Return”) and BlackRock Strategic Risk Allocation Fund (“Strategic Risk Allocation”) (collectively, the “Funds” or individually, a “Fund”) are each a series of the Trust. Strategic Risk Allocation is classified as non-diversified. Multi-Asset Real Return is classified as diversified. The Funds’ financial statements are prepared in conformity with accounting principles generally accepted in the United States of America (“US GAAP”), which may require management to make estimates and assumptions that affect the reported amounts of assets and liabilities in the financial statements and the reported amounts of increases and decreases in net assets from operations during the reporting period. Actual results could differ from those estimates. Each Fund offers multiple classes of shares. Institutional Shares are sold without a sales charge and only to certain eligible investors. Investor A Shares are generally sold with a front-end sales charge. Investor C Shares may be subject to a CDSC. All classes of shares have identical voting, dividend, liquidation and other rights and the same terms and conditions, except that Investor A and Investor C Shares bear certain expenses related to the shareholder servicing of such shares, and Investor C Shares also bear certain expenses related to the distribution of such shares. Each class has exclusive voting rights with respect to matters relating to its shareholder servicing and distribution expenditures.
As of January 31, 2013, Multi-Asset Real Return’s investment in BlackRock Floating Rate Income Portfolio, and Strategic Risk Allocation’s investments in iShares Barclays TIP Bond Fund and BlackRock Liquidity Funds, TempFund were 29%, 51% and 47%, respectively, of each Fund’s net assets. The financial statements of BlackRock Floating Rate Income Portfolio, iShares Barclays TIP Bond Fund and BlackRock Liquidity Funds, TempFund, including the Schedule of Investments, can be read in conjunction with each Fund’s financial statements. The BlackRock Floating Rate Income Portfolio, iShares Barclays TIP Bond Fund and BlackRock Liquidity Funds, TempFund financial statements, included in filings under BlackRock Funds II, iShares Trust and BlackRock Liquidity Funds, respectively, are available, without charge, on the SEC’s website at http://www.sec.gov.
The following is a summary of significant accounting policies followed by the Funds:
Basis of Consolidation: The accompanying consolidated financial statements include the accounts of BlackRock Cayman Multi-Asset Real Return Fund, Ltd. and BlackRock Cayman Strategic Risk Allocation Fund, Ltd. (the “Subsidiaries”), which are wholly owned subsidiaries of the Funds, which primarily invest in commodity-related instruments and other derivatives. The Subsidiaries enable the Funds to hold these commodity-related instruments and other derivatives and satisfy Regulated Investment Company (“RIC”) tax requirements. Each Fund may
invest up to 25% of its total assets in the Subsidiaries. Intercompany accounts and transactions, if any, have been eliminated. The Subsidiaries are subject to the same investment policies and restrictions that apply to the Funds.
Valuation: US GAAP defines fair value as the price the Funds would receive to sell an asset or pay to transfer a liability in an orderly transaction between market participants at the measurement date. The Funds determine the fair values of their financial instruments at market value using independent dealers or pricing services under policies approved by the Board of Trustees of the Trust (the “Board”). The BlackRock Global Valuation Methodologies Committee (the “Global Valuation Committee”) is the committee formed by management to develop global pricing policies and procedures and to provide oversight of the pricing function for the Funds for all financial instruments.
Equity investments traded on a recognized securities exchange or the NASDAQ Global Market System (“NASDAQ”) are valued at the last reported sale price that day or the NASDAQ official closing price, if applicable. For equity investments traded on more than one exchange, the last reported sale price on the exchange where the stock is primarily traded is used. Equity investments traded on a recognized exchange for which there were no sales on that day are valued at the last available bid price. If no bid price is available, the prior day’s price will be used, unless it is determined that such prior day’s price no longer reflects the fair value of the security. Financial futures contracts traded on exchanges are valued at their last sale price. Swap agreements are valued utilizing quotes received daily by the Funds’ pricing service or through brokers, which are derived using daily swap curves and models that incorporate a number of market data factors, such as discounted cash flows, trades and values of the underlying reference instruments. Investments in open-end registered investment companies are valued at net asset value (“NAV”) each business day.
Securities and other assets and liabilities denominated in foreign currencies are translated into US dollars using exchange rates determined as of the close of business on the New York Stock Exchange (“NYSE”). Foreign currency exchange contracts are valued at the mean between the bid and ask prices and are determined as of the close of business on the NYSE. Interpolated values are derived when the settlement date of the contract is an interim date for which quotations are not available.
In the event that application of these methods of valuation results in a price for an investment that is deemed not to be representative of the market value of such investment, or if a price is not available, the investment will be valued by the BlackRock Global Valuation Committee, or its delegate, in accordance with a policy approved by the Board as reflecting fair value (“Fair Value Assets”). When determining the price for Fair Value Assets, the Global Valuation Committee, or its delegate, seeks to determine the price that each Fund might reasonably expect to receive from the current sale of that asset in an arm’s-length transaction. Fair value determinations shall be based upon all available factors that the
| | | | | | |
| | | | | | | |
| | | BLACKROCK FUNDS | | JANUARY 31, 2013 | | 19 |
| | |
| Notes to Consolidated Financial Statements (continued) | | |
Global Valuation Committee deem relevant consistent with the principles
of fair value measurement which include the market approach, income approach and/or in the case of recent investments, the cost approach, as appropriate. A market approach generally consists of using comparable market transactions. The income approach generally is used to discount future cash flows to present value and adjusted for liquidity as appropriate. These factors include but are not limited to: (i) attributes specific to the investment or asset; (ii) the principal market for the investment or asset; (iii) the customary participants in the principal market for the investment or asset; (iv) data assumptions by market participants for the investment or asset, if reasonably available; (v) quoted prices for similar investments or assets in active markets; and (vi) other factors, such as future cash flows, interest rates, yield curves, volatilities, prepayment speeds, loss severities, credit risks, recovery rates, liquidation amounts and/or default rates. Due to the inherent uncertainty of valuations of such investments, the fair values may differ from the values that would have been used had an active market existed. The Global Valuation Committee, or its delegate, employs various methods for calibrating valuation approaches for investments where an active market does not exist, including regular due diligence of the Funds’ pricing vendors, a regular review of key inputs and assumptions, transactional back-testing or disposition analysis to compare unrealized gains and losses to realized gains and losses, reviews of missing or stale prices and large movements in market values and reviews of any market related activity. The pricing of all Fair Value Assets is subsequently reported to the Board or a committee thereof on a quarterly basis.
Foreign Currency: The Funds’ books and records are maintained in US dollars. Purchases and sales of investment securities are recorded at the rates of exchange prevailing on the respective date of such transactions. Generally, when the US dollar rises in value against a foreign currency, the Funds’ investments denominated in that currency will lose value because that currency is worth fewer US dollars; the opposite effect occurs if the US dollar falls in relative value.
The Funds do not isolate the portion of the results of operations arising as a result of changes in the foreign exchange rates from the changes in the market prices of investments held or sold for financial reporting purposes. Accordingly, the effects of changes in foreign currency exchange rates on investments are not segregated in the Consolidated Statements of Operations from the effects of changes in market prices of those investments but are included as a component of net realized and unrealized gain (loss) from investments. The Funds report realized currency gains (losses) on foreign currency related transactions as components of net realized gain (loss) for financial reporting purposes, whereas such components are treated as ordinary income for federal income tax purposes.
Segregation and Collateralization: In cases in which the 1940 Act and the interpretive positions of the Securities and Exchange Commission (“SEC”) require a Fund either deliver collateral or segregate assets in connection with certain investments (e.g., financial futures contracts, foreign currency exchange contracts and swaps), the Fund will, consistent with SEC rules and/or certain interpretive letters issued by the SEC,
segregate collateral or designate on its books and records cash or liquid securities having a market value at least equal to the amount that would otherwise be required to be physically segregated. Furthermore, based on requirements and agreements with certain exchanges and third party broker-dealers, a Fund engaging in such transactions may have requirements to deliver/deposit securities to/with an exchange or broker-dealer as collateral for certain investments.
Investment Transactions and Investment Income: For financial reporting purposes, investment transactions are recorded on the dates the transactions are entered into (the trade dates). Realized gains and losses on investment transactions are determined on the identified cost basis. Dividend income is recorded on the ex-dividend dates. Income and realized and unrealized gains and losses are allocated daily to each class based on its relative net assets.
Dividends and Distributions: Dividends and distributions paid by the Funds are recorded on the ex-dividend dates. The portion of distributions that exceeds a Fund’s current and accumulated earnings and profits, which are measured on a tax basis, will constitute a nontaxable return of capital. Distributions in excess of a Fund’s taxable income and net capital gains, but not in excess of a Fund’s earnings and profits, will be taxable to shareholders as ordinary income and will not constitute a non-taxable return of capital. The character and timing of dividends and distributions are determined in accordance with federal income tax regulations, which may differ from US GAAP.
Income Taxes: It is the Funds’ policy to comply with the requirements of the Internal Revenue Code of 1986, as amended, applicable to RICs and to distribute substantially all of their taxable income to their shareholders. Therefore, no federal income tax provision is required.
The Funds file US federal and various state and local tax returns. Management does not believe there are any uncertain tax positions that require recognition of a tax liability.
Recent Accounting Standards: In December 2011, the Financial Accounting Standards Board (the “FASB”) issued guidance that will expand current disclosure requirements on the offsetting of certain assets and liabilities. The new disclosures will be required for investments and derivative financial instruments subject to master netting or similar agreements which are eligible for offset in the Consolidated Statements of Assets and Liabilities and will require an entity to disclose both gross and net information about such investments and transactions in the financial statements. In January 2013, the FASB issued guidance that clarifies which investments and transactions are subject to offsetting disclosure requirements. The scope of the disclosure requirements for offsetting will be limited to derivative instruments, repurchase agreements and reverse repurchase agreements, and securities borrowing and securities lending transactions. The guidance is effective for financial statements with fiscal years beginning on or after January 1, 2013, and interim periods within those fiscal years. Management is
| | | | | | |
| | | | | | | |
| 20 | | BLACKROCK FUNDS | | JANUARY 31, 2013 | | |
| | |
| Notes to Consolidated Financial Statements (continued) | | |
evaluating the impact of this guidance on the Funds’ financial statement disclosures.
Organization and Offering Costs: Upon commencement of operations, organization costs associated with the establishment of the Funds were expensed by the Funds and reimbursed by the Manager. The Manager reimbursed Multi-Asset Real Return and Strategic Risk Allocation $70,490 and $70,490, respectively, which are included in expenses reimbursed by Manager in the Consolidated Statements of Operations. Offering costs are amortized over a 12-month period beginning with the commencement of operations.
Other: Expenses directly related to a Fund or its classes are charged to that Fund or class. Other operating expenses shared by several funds are pro rated among those funds on the basis of relative net assets or other appropriate methods. Expenses directly related to the Funds and other shared expenses pro rated to the Funds are allocated daily to each class based on its relative net assets or other appropriate methods.
The Funds have an arrangement with the custodian whereby fees may be reduced by credits earned on uninvested cash balances, which, if applicable, are shown as fees paid indirectly in the Consolidated Statements of Operations. The custodian imposes fees on overdrawn cash balances, which can be offset by accumulated credits earned or may result in additional custody charges.
2. Derivative Financial Instruments:
The Funds engage in various portfolio investment strategies using derivative contracts both to increase the returns of the Funds and/or to economically hedge, or protect, their exposure to certain risks such as credit risk, equity risk, interest rate risk, foreign currency exchange rate risk or commodity price risk. These contracts may be transacted on an exchange or OTC.
Losses may arise if the value of the contract decreases due to an unfavorable change in the market rates or values of the underlying instrument or if the counterparty does not perform under the contract. The Funds’ maximum risk of loss from counterparty credit risk on OTC derivatives is generally the aggregate unrealized gain netted against any collateral pledged by/posted to the counterparty. Counterparty risk related to exchange-traded financial futures contracts and centrally cleared swaps is deemed to be minimal due to the protection against defaults provided by the exchange on which these contracts trade.
The Funds may mitigate counterparty risk by procuring collateral and through netting provisions included within an International Swaps and Derivatives Association, Inc. master agreement (“ISDA Master Agreement”) implemented between a Fund and each of its respective counterparties. An ISDA Master Agreement allows each Fund to offset with each separate counterparty certain derivative financial instrument’s payables and/or receivables with collateral held. The amount of collateral moved to/from applicable counterparties is generally based upon minimum transfer amounts of up to $500,000. To the extent amounts
due to the Funds from their counterparties are not fully collateralized, contractually or otherwise, the Funds bear the risk of loss from counterparty non-performance. See Note 1 “Segregation and Collateralization” for information with respect to collateral practices. In addition, the Funds manage counterparty risk by entering into agreements only with counterparties that they believe have the financial resources to honor their obligations and by monitoring the financial stability of those counterparties.
Certain ISDA Master Agreements allow counterparties to OTC derivatives to terminate derivative contracts prior to maturity in the event the Funds’ net assets decline by a stated percentage or the Funds fail to meet the terms of their ISDA Master Agreements, which would cause the Funds to accelerate payment of any net liability owed to the counterparty.
Financial Futures Contracts: Strategic Risk Allocation purchases or sells financial futures contracts to gain exposure to, or economically hedge against changes in the value of equity securities (equity risk). Financial futures contracts are agreements between Strategic Risk Allocation and a counterparty to buy or sell a specific quantity of an underlying instrument at a specified price and at a specified date. Depending on the terms of the particular contract, financial futures contracts are settled either through physical delivery of the underlying instrument on the settlement date or by payment of a cash settlement amount on the settlement date. Pursuant to the contract, Strategic Risk Allocation agrees to receive from or pay to the broker an amount of cash equal to the daily fluctuation in value of the contract. Such receipts or payments are known as variation margin and are recorded by Strategic Risk Allocation as unrealized appreciation or depreciation. When the contract is closed, Strategic Risk Allocation records a realized gain or loss equal to the difference between the value of the contract at the time it was opened and the value at the time it was closed. The use of financial futures contracts involves the risk of an imperfect correlation in the movements in the price of financial futures contracts, interest or foreign currency exchange rates and the underlying assets.
Foreign Currency Exchange Contracts: Strategic Risk Allocation enters into foreign currency exchange contracts as an economic hedge against either specific transactions or portfolio instruments or to obtain exposure to foreign currencies (foreign currency exchange rate risk). A foreign currency exchange contract is an agreement between two parties to buy and sell a currency at a set exchange rate on a future date. Foreign currency exchange contracts, when used by Strategic Risk Allocation, help to manage the overall exposure to the currencies in which some of the investments held by Strategic Risk Allocation are denominated. The contract is marked-to-market daily and the change in market value is recorded by Strategic Risk Allocation as an unrealized gain or loss. When the contract is closed, Strategic Risk Allocation records a realized gain or loss equal to the difference between the value at the time it was opened and the value at the time it was closed. The use of foreign currency exchange contracts involves the risk that the value of a foreign currency exchange contract changes unfavorably due to movements in
| | | | | | |
| | | | | | | |
| | | BLACKROCK FUNDS | | JANUARY 31, 2013 | | 21 |
| | |
| Notes to Consolidated Financial Statements (continued) | | |
the value of the referenced foreign currencies and the risk that the counterparty to the contract does not perform its obligations under the agreement.
Swaps: The Funds enter into swap agreements, in which the Funds and a counterparty agree either to make periodic net payments on a specified notional amount or a net payment upon termination. Swap agreements are privately negotiated in the OTC market and may be entered into as a bilateral contract or centrally cleared (“centrally cleared swaps”). In a centrally cleared swap, immediately following execution of the swap agreement, the swap agreement is novated to a central counterparty (the “CCP”) and the Fund faces the CCP through a future commission merchant. Unlike a bilateral swap agreement, for centrally cleared swaps, the Fund has no credit exposure to the counterparty as the CCP stands between the Fund and the counterparty. These payments received or made by the Funds are recorded in the Consolidated Statements of Operations as realized gains or losses, respectively. Any upfront fees paid are recorded as assets and any upfront fees received are recorded as liabilities and are shown as swap premiums paid and swap premiums received, respectively in the Consolidated Statements of Assets and Liabilities and amortized over the term of the swap. Swaps are marked-to-market daily and changes in value are recorded as unrealized appreciation (depreciation). The daily change in valuation of centrally cleared swaps, if any, is recorded as a receivable or payable for variation margin in the Consolidated Statements of Assets and Liabilities. When the swap is terminated, the Funds will record a realized gain or loss equal to the difference between the proceeds from (or cost of) the closing transaction and the Funds’ basis in the contract, if any. Generally, the basis of the contracts is the premium received or paid. Swap transactions involve, to varying degrees, elements of interest rate, credit and market risk in excess of the amounts recognized in the Consolidated Statements of Assets and Liabilities. Such risks involve the possibility that there will be no liquid market for these agreements, that the counterparty to the agreements may default on its obligation to perform or disagree as to the meaning of the contractual terms in the agreements, and that there may be unfavorable changes in interest rates and/or market values associated with these transactions.
| Ÿ | | Credit default swaps — Strategic Risk Allocation enters into credit default swaps to manage its exposure to the market or certain sectors of the market, to reduce its risk exposure to defaults of corporate and/or sovereign issuers or to create exposure to corporate and/or |
sovereign issuers to which it is not otherwise exposed (credit risk). Strategic Risk Allocation may either buy or sell (write) credit default swaps on single-name issuers (corporate or sovereign), a combination or basket of single-name issuers or traded indexes. Credit default swaps on single-name issuers are agreements in which the protection buyer pays fixed periodic payments to the seller in consideration for a guarantee from the protection seller to make a specific payment should a negative credit event take place with respect to the referenced entity (e.g., bankruptcy, failure to pay, obligation accelerators, repudiation, moratorium or restructuring). Credit default swaps on traded indexes are agreements in which the buyer pays fixed periodic payments to the seller in consideration for a guarantee from the seller to make a specific payment should a write-down, principal or interest shortfall or default of all or individual underlying securities included in the index occurs. As a buyer, if an underlying credit event occurs, Strategic Risk Allocation will either receive from the seller an amount equal to the notional amount of the swap and deliver the referenced security or underlying securities comprising the index or receive a net settlement of cash equal to the notional amount of the swap less the recovery value of the security or underlying securities comprising the index. As a seller (writer), if an underlying credit event occurs, Strategic Risk Allocation will either pay the buyer an amount equal to the notional amount of the swap and take delivery of the referenced security or underlying securities comprising the index or pay a net settlement of cash equal to the notional amount of the swap less the recovery value of the security or underlying securities comprising the index.
| Ÿ | | Total return swaps — The Funds enter into total return swaps to obtain exposure to a security or market without owning such security or investing directly in that market or to transfer the risk/return of one market (e.g., fixed income) to another market (e.g., equity or commodity prices) (equity risk, commodity price risk and/or interest rate risk). Total return swaps are agreements in which there is an exchange of cash flows whereby one party commits to make payments based on the total return (coupons plus capital gains/losses) of an underlying instrument in exchange for fixed or floating rate interest payments. To the extent the total return of the instrument or index underlying the transaction exceeds or falls short of the offsetting interest rate obligation, the Funds will receive a payment from or make a payment to the counterparty. |
| | | | | | | | | | | | |
| Derivative Financial Instruments Categorized by Risk Exposure: | | | | | | |
| Fair Values of Derivative Financial Instruments as of January 31, 2013 | |
| | | Asset Derivatives | |
| | | | | Multi-Asset
Real Return | | | | | Strategic Risk
Allocation | |
| | | Consolidated Statements of Assets and Liabilities Location | | | | | Value | | | |
Interest rate contracts | | Unrealized appreciation on swaps | | | — | | | | | $ | 10,152 | |
Foreign currency exchange contracts | | Unrealized appreciation on foreign currency exchange contracts | | | — | | | | | | 8,674 | |
Credit contracts | | Unrealized appreciation on swaps; Swap premiums paid | | | — | | | | | | 167,483 | |
| | | | | | |
| | | | | | | |
| 22 | | BLACKROCK FUNDS | | JANUARY 31, 2013 | | |
| | |
| Notes to Consolidated Financial Statements (continued) | | |
| | | | | | | | | | | | |
| Fair Values of Derivative Financial Instruments as of January 31, 2013 | |
| | | Asset Derivatives | |
| | | | | Multi-Asset
Real Return | | | | | Strategic Risk
Allocation | |
| | | Consolidated Statements of Assets and Liabilities Location | | | | | Value | | | |
Equity contracts | | Net unrealized appreciation on swaps; Net unrealized appreciation/depreciation1 | | | — | | | | | $ | 467,184 | |
Commodity contracts | | Unrealized appreciation on swaps | | $ | 45,217 | | | | | | 41,600 | |
Total | | | | $ | 45,217 | | | | | $ | 695,093 | |
| 1 | | Includes cumulative appreciation/depreciation on financial futures contracts and centrally cleared swaps, if any, as reported in the Consolidated Schedules of Investments. Only current day’s variation margin is reported within the Consolidated Statements of Assets and Liabilities. |
| | | | | | |
| | | Liability Derivatives | |
| | | | | Strategic Risk
Allocation | |
| | | Consolidated Statements of Assets and Liabilities Location | | Value | |
Interest rate contracts | | Unrealized depreciation on swaps | | $ | 285,180 | |
Foreign currency exchange contracts | | Unrealized depreciation on foreign currency exchange contracts | | | 6,436 | |
Credit contracts | | Swap premiums received | | | 18,168 | |
Total | | | | $ | 309,784 | |
| | | | | | |
| The Effect of Derivative Financial Instruments in the Consolidated Statements of Operations Period Ended January 31, 2013 | |
| | | Net Realized Loss From | | | |
| | | | | Strategic Risk
Allocation | |
| Credit contracts: | | | | | | |
Swaps | | | | $ | (11,473 | ) |
| | | | | | | | |
| | | Net Change in Unrealized
Appreciation/Depreciation on | |
| | | Multi-Asset Real Return | | | Strategic Risk
Allocation | |
| Interest rate contracts: | | | | | | | | |
Swaps | | | — | | | $ | (275,028) | |
| Foreign currency exchange contracts: | | | | | | | | |
Foreign currency translations | | | — | | | | 2,238 | |
| Credit contracts: | | | | | | | | |
Swaps | | | — | | | | 135,981 | |
| Equity contracts: | | | | | | | | |
Financial futures contracts | | | — | | | | 379,342 | |
Swaps | | | — | | | | 87,842 | |
| Commodity contracts: | | | | | | | | |
Swaps | | $ | 45,217 | | | | 41,600 | |
| Total | | $ | 45,217 | | | $ | 371,975 | |
| |
| | | | | | |
| | | | | | | |
| | | BLACKROCK FUNDS | | JANUARY 31, 2013 | | 23 |
| | |
| Notes to Consolidated Financial Statements (continued) | | |
For the period ended January 31, 2013, the actual contracts of derivative financial instruments were as follows:
| | | | | | | | |
| | | Multi-Asset
Real Return | | | Strategic Risk
Allocation | |
Financial futures contracts: | | | | | | | | |
Number of contracts purchased | | | — | | | | 113 | |
Notional value of contracts purchased | | | — | | | $ | 7,439,144 | |
Foreign currency exchange contracts: | | | | | | | | |
Number of contracts — US dollars purchased | | | — | | | | 5 | |
US dollar amounts purchased | | | — | | | $ | 814,000 | |
Credit default swaps: | | | | | | | | |
Number of contracts — sell protection | | | — | | | | 4 | |
Notional value — sell protection | | | — | | | $ | 10,473,375 | |
Total return swaps: | | | | | | | | |
Number of contracts | | | 2,138 | | | | 3,960 | |
Notional value | | $ | 1,012,374 | | | $ | 1,490,991,996 | |
| |
3. Investment Advisory Agreement and Other Transactions with Affiliates:
The PNC Financial Services Group, Inc. (“PNC”) is the largest stockholder and an affiliate, for 1940 Act purposes, of BlackRock, Inc. (“BlackRock”).
The Trust, on behalf of the Funds, entered into an Investment Advisory Agreement with the Manager, the Funds’ investment advisor, an indirect, wholly owned subsidiary of BlackRock, to provide investment advisory and administration services. The Manager is responsible for the management of each Fund’s portfolio and provides the necessary personnel, facilities, equipment and certain other services necessary to the operations of each Fund. For such services, each Fund pays the Manager a monthly fee based on a percentage of each Fund’s average daily net assets at the following annual rates:
| | | | | | | | |
| | | Multi-Asset
Real Return | | | Strategic Risk Allocation | |
| Average Daily Net Assets | | Investment Advisory Fee | |
First $1 Billion | | | 0.60 | % | | | 0.75 | % |
$1 Billion - $3 Billion | | | 0.56 | % | | | 0.71 | % |
$3 Billion - $5 Billion | | | 0.54 | % | | | 0.68 | % |
$5 Billion - $10 Billion | | | 0.52 | % | | | 0.65 | % |
Greater than $10 Billion | | | 0.51 | % | | | 0.64 | % |
The Manager voluntarily agreed to waive its investment advisory fees by the amount of investment advisory fees each Fund pays to the Manager indirectly through its investment in affiliated money market funds. However, the Manager does not waive its investment advisory fees by the amount of investment advisory fees paid in connection with Strategic Risk Allocation’s investment in other affiliated investment companies, if any. These amounts are included in fees waived by Manager in the Consolidated Statements of Operations. For the period ended January 31, 2013, the Manager waived $125 and $895 for Multi-Asset Real Return and Strategic Risk Allocation, respectively.
The Manager entered into separate sub-advisory agreements with BlackRock Financial Management, Inc. (“BFM”), an affiliate of the Manager, to serve as sub-advisor for Multi-Asset Real Return and Strategic Risk Allocation. BlackRock International Limited (“BIL”), an affiliate of the Manager, serves as sub-advisor for Strategic Risk Allocation. The Manager pays BFM and BIL, for services they provide, a monthly fee that
is a percentage of the investment advisory fees paid by the applicable Fund to the Manager.
The Manager provides investment management and other services to the Subsidiaries. The Manager does not receive separate compensation from the Subsidiaries for providing investment management or administrative services. However, the Funds pay the Manager based on each Fund’s net assets which includes the assets of the Subsidiaries.
The Trust, on behalf of the Funds, entered into a Distribution Agreement and Distribution and Service Plan with BlackRock Investments, LLC (“BRIL”), an affiliate of the Manager. Pursuant to the Distribution and Service Plan and in accordance with Rule 12b-1 under the 1940 Act, the Funds pay BRIL ongoing service and distribution fees. The fees are accrued daily and paid monthly at annual rates based upon the average daily net assets of the shares of each Fund as follows:
| | | | | | | | |
| | | Service
Fee | | | Distribution
Fee | |
Investor A | | | 0.25 | % | | | N/A | |
Investor C | | | 0.25 | % | | | 0.75 | % |
Pursuant to sub-agreements with BRIL, broker-dealers and BRIL provide shareholder servicing and distribution services to the Fund. The ongoing service and/or distribution fee compensates BRIL and each broker-dealer for providing shareholder servicing and/or distribution related services to Investor A and Investor C shareholders.
For the period ended January 31, 2013, the following table shows the class specific service and distribution fees borne directly by each class of each Fund:
| | | | | | | | | | | | | | |
| | | Investor A | | | Investor C | | | Total | |
Multi-Asset Real Return | | $ | 6 | | | $ | 24 | | | | | $ | 30 | |
Strategic Risk Allocation | | $ | 6 | | | $ | 24 | | | | | $ | 30 | |
Pursuant to written agreements, certain financial intermediaries, some of which may be affiliates, provide the Funds with sub-accounting, recordkeeping, sub-transfer agency and other administrative services
| | | | | | |
| | | | | | | |
| 24 | | BLACKROCK FUNDS | | JANUARY 31, 2013 | | |
| | |
| Notes to Consolidated Financial Statements (continued) | | |
with respect to sub-accounts they service. For these services, these entities receive an asset based fee or an annual fee per shareholder account, which will vary depending on share class and/or net assets.
The Manager maintains a call center, which is responsible for providing certain shareholder services to the Funds, such as responding to shareholder inquiries and processing transactions based upon instructions from shareholders with respect to the subscription and redemption of Fund shares.
For the period ended January 31, 2013, the following table shows the class specific transfer agent fees borne directly by each class of each Fund:
| | | | | | | | | | | | | | | | |
| | | Institutional | | | Investor A | | | Investor C | | | Total | |
Multi-Asset Real Return | | $ | 5 | | | $ | 3 | | | $ | 3 | | | $ | 11 | |
Strategic Risk Allocation | | $ | 5 | | | $ | 4 | | | $ | 4 | | | $ | 13 | |
BNY Mellon Investment Servicing (US) Inc. (“BNYMIS”) and the Manager act as co-administrators for the Funds. For these services, the co-administrators receive a combined administration fee computed daily and payable monthly, based on a percentage of the average daily net assets of each Fund. The combined administration fee is paid at the following annual rates: 0.075% of the first $500 million, 0.065% of the next $500 million and 0.055% of the average daily net assets in excess of $1 billion. In addition, each of the share classes is charged an administration fee based on the following percentages of average daily net assets of each respective class: 0.025% of the first $500 million, 0.015% of the next $500 million and 0.005% of the average daily net assets in excess of $1 billion. In addition, BNYMIS and the Manager may have, at their discretion, voluntarily waived all or any portion of their administration fees for a Fund or a share class which are included in administration fees waived and administration fees waived — class specific in the Consolidated Statements of Operations. For the period ended January 31, 2013, the Funds paid the following to the Manager in return for these services, which are included in administration, administration — class specific, administration fees waived and administration fees waived — class specific in the Consolidated Statements of Operations:
| | | | |
Multi-Asset Real Return | | $ | 61 | |
Strategic Risk Allocation | | $ | 433 | |
For the period ended January 31, 2013, the following table shows the class specific administration fees borne directly by each class of each Fund:
| | | | | | | | | | | | | | | | | | |
| | | Institutional | | | Investor A | | | Investor C | | | Total | |
Multi-Asset Real Return | | $ | 243 | | | $ | 1 | | | $ | 1 | | | | | $ | 245 | |
Strategic Risk Allocation | | $ | 601 | | | $ | 1 | | | $ | 1 | | | | | $ | 603 | |
The Manager contractually agreed to waive and/or reimburse fees or expenses, excluding interest expense, dividend expense, income tax expense, acquired fund fees and expenses and certain other fund expenses, which constitute extraordinary expenses not incurred in the
ordinary course of the Funds’ business, in order to limit expenses. The expense limitations as a percentage of average daily net assets are as follows:
| | | | | | | | | | | | |
| | | Institutional | | | Investor A | | | Investor C | |
Multi-Asset Real Return | | | 0.80 | % | | | 1.05 | % | | | 1.80 | % |
Strategic Risk Allocation | | | 1.00 | % | | | 1.25 | % | | | 2.00 | % |
The Manager has agreed not to reduce or discontinue this contractual waiver or reimbursement prior to December 1, 2013 unless approved by the Board, including a majority of the Independent Trustees.
In addition, BlackRock has contractually agreed to waive the management fee on assets estimated to be attributed to Multi-Asset Real Return’s investments in other equity and fixed income mutual funds managed by BlackRock or its affiliates. These amounts waived or reimbursed are included in fees waived by Manager and expenses reimbursed by Manager, and shown as administration fees waived — class specific, and transfer agent fees reimbursed — class specific and expenses reimbursed, respectively, in the Consolidated Statements of Operations. For the period ended January 31, 2013, the Manager waived $5,739 and $17,198 of investment advisory fees for Multi-Asset Real Return and Strategic Risk Allocation, respectively, which are included in fees waived by Manager. The Manager reimbursed expenses of $17,656 and $902 for Multi-Asset Real Return and Strategic Risk Allocation, respectively, which are included in expenses reimbursed by Manager. Class specific expense waivers or reimbursements are as follows:
| | | | | | | | | | | | | | | | |
| Administration Fees Waived | |
| | | Institutional | | | Investor A | | | Investor C | | | Total | |
Multi-Asset Real Return | | $ | 182 | | | $ | 1 | | | $ | 1 | | | $ | 184 | |
Strategic Risk Allocation | | $ | 597 | | | $ | 1 | | | $ | 1 | | | $ | 599 | |
| | | | | | | | | | | | | | | | |
| Transfer Agent Fees Reimbursed | |
| | | Institutional | | | Investor A | | | Investor C | | | Total | |
Multi-Asset Real Return | | $ | 1 | | | $ | 3 | | | $ | 3 | | | $ | 7 | |
Strategic Risk Allocation | | $ | 4 | | | $ | 4 | | | $ | 4 | | | $ | 12 | |
If during a Fund’s fiscal year the operating expenses of a share class, that at any time during the prior two fiscal years received a waiver or reimbursement from the Manager, are less than the expense limit for that share class, the Manager is entitled to be reimbursed by such share class up to the lesser of (a) the amount of fees waived or expenses reimbursed during those prior two fiscal years under the agreement and (b) the amount by which the expense limit for that share class exceeds the operating expenses of the share class for the current fiscal year, provided that: (1) the Fund, of which the share class is a part, has more than $50 million in assets for the fiscal year and (2) the Manager or an affiliate continues to serve as the Fund’s investment advisor or administrator. In the event the expense limit for a share class is changed subsequent to a fiscal year in which the Manager becomes entitled to reimbursement for fees waived or reimbursed, the amount available to reimburse the Manager shall be calculated by reference to the expense limit for that share class in effect at the time the Manager became
| | | | | | |
| | | | | | | |
| | | BLACKROCK FUNDS | | JANUARY 31, 2013 | | 25 |
| | |
| Notes to Consolidated Financial Statements (continued) | | |
entitled to receive such reimbursement, rather than the subsequently changed expense limit for that share class.
On January 31, 2013, the Fund level and class specific waivers and/or reimbursements subject to possible future recoupment under the expense limitation agreement are as follows:
| | | | |
| | | Expiring July 31, | |
| | | | 2015 | |
Multi-Asset Real Return | | | | |
Fund Level | | $ | 22,394 | |
Institutional | | $ | 183 | |
Investor A | | $ | 4 | |
Investor C | | $ | 4 | |
Strategic Risk Allocation | | | | |
Fund Level | | $ | 19,145 | |
Institutional | | $ | 602 | |
Investor A | | $ | 5 | |
Investor C | | $ | 5 | |
Certain officers and/or trustees of the Trust are officers and/or directors of BlackRock or its affiliates. The Funds reimburse the Manager for a portion of the compensation paid to the Trust’s Chief Compliance Officer, which is included in Officer and Trustees in the Consolidated Statements of Operations.
4. Investments:
Purchases of investments for the period ended January 31, 2013, were $8,549,673 and $13,050,469 for Multi-Asset Real Return and Strategic Risk Allocation, respectively. There were no sales for the period ended January 31, 2013.
5. Income Tax Information:
As of January 31, 2013, gross unrealized appreciation and gross unrealized depreciation based on cost for federal income tax purposes were as follows:
| | | | | | | | |
| | | Multi-Asset Real Return | | | Strategic Risk
Allocation | |
Tax cost | | $ | 10,014,567 | | | $ | 24,958,268 | |
| | | | |
Gross unrealized appreciation | | $ | 300,904 | | | | — | |
| | | | |
Gross unrealized depreciation | | | (6,184 | ) | | $ | (169,886 | ) |
| | | | |
Net unrealized appreciation (depreciation) | | $ | 294,720 | | | $ | (169,886 | ) |
| | | | |
6. Market and Credit Risk:
In the normal course of business, the Funds invest in securities and enter into transactions where risks exist due to fluctuations in the market (market risk) or failure of the issuer of a security to meet all its obligations (issuer credit risk). The value of securities held by the Funds may decline in response to certain events, including those directly involving the issuers whose securities are owned by the Funds; conditions affecting the general economy; overall market changes; local, regional or global political, social or economic instability; and currency and interest rate and price fluctuations. Similar to issuer credit risk, the Funds may be exposed to counterparty credit risk, or the risk that an entity with which the Funds have unsettled or open transactions may fail to or be unable to perform on its commitments. The Funds manage counterparty credit risk by entering into transactions only with counterparties that they believe have the financial resources to honor their obligations and by monitoring the financial stability of those counterparties. Financial assets, which potentially expose the Funds to market, issuer and counterparty credit risks, consist principally of financial instruments and receivables due from counterparties. The extent of the Funds’ exposure to market, issuer and counterparty credit risks with respect to these financial assets is generally approximated by their value recorded in the Consolidated Statements of Assets and Liabilities, less any collateral held by the Funds.
7. Capital Share Transactions:
Transactions in capital shares for each class were as follows:
| | | | | | | | |
| | | Period December 27, 20121 to
January 31, 2013 | |
| Multi-Asset Real Return | | Shares | | | Amount | |
| Institutional | | | | | | | | |
Shares sold | | | 995,000 | | | $ | 9,950,000 | |
| | | | |
Net increase | | | 995,000 | | | $ | 9,950,000 | |
| | | | |
| | | | | | | | |
| Investor A | | | | | | | | |
Shares sold | | | 2,500 | | | $ | 25,000 | |
| | | | |
Net increase | | | 2,500 | | | $ | 25,000 | |
| | | | |
| 1 | | Commencement of operations. |
| | | | | | |
| | | | | | | |
| 26 | | BLACKROCK FUNDS | | JANUARY 31, 2013 | | |
| | |
| Notes to Consolidated Financial Statements (concluded) | | |
| | | | | | | | | | |
| | | Period December 27, 20121 to
January 31, 2013 |
| Multi-Asset Real Return (concluded) | | Shares | | | Amount |
| Investor C | | | | | | | | | | |
Shares sold | | | 2,500 | | | $ | 25,000 | | | |
| | | | | | |
Net increase | | | 2,500 | | | $ | 25,000 | | | |
Total Net Increase | | | 1,000,000 | | | $ | 10,000,000 | | | |
| | | | | | |
| | | | | | | | | | |
| Strategic Risk Allocation | | | | | | | | | | |
| Institutional | | | | | | | | | | |
Shares sold | | | 2,495,501 | | | $ | 24,955,000 | | | |
Shares issued in reinvestment of dividends | | | 9,182 | | | | 91,821 | | | |
| | | | | | |
Net increase | | | 2,504,683 | | | $ | 25,046,821 | | | |
| | | | | | |
| | | | | | | | | | |
| Investor A | | | | | | | | | | |
Shares sold | | | 2,500 | | | $ | 25,000 | | | |
Shares issued in reinvestment of dividends | | | 9 | | | | 91 | | | |
| | | | | | |
Net increase | | | 2,509 | | | $ | 25,091 | | | |
| | | | | | |
| | | | | | | | | | |
| Investor C | | | | | | | | | | |
Shares sold | | | 2,500 | | | $ | 25,000 | | | |
Shares issued in reinvestment of dividends | | | 9 | | | | 90 | | | |
| | | | | | |
Net increase | | | 2,509 | | | $ | 25,090 | | | |
Total Net Increase | | | 2,509,701 | | | $ | 25,097,002 | | | |
| | | | | | |
| | 1 | | Commencement of operations. |
At January 31, 2013, shares owned by affiliates for Multi-Asset Real Return and Strategic Risk Allocation were as follows:
| | | | | | | | |
| Shares | | Multi-Asset
Real Return | | | Strategic Risk
Allocation | |
Institutional | | | 995,000 | | | | 2,504,182 | |
Investor A | | | 2,500 | | | | 2,509 | |
Investor C | | | 2,500 | | | | 2,509 | |
8. Subsequent Events:
Management has evaluated the impact of all subsequent events on the Funds through the date the financial statements were issued and has determined that there were no subsequent events requiring adjustment or additional disclosure in the financial statements.
| | | | | | |
| | | | | | | |
| | | BLACKROCK FUNDS | | JANUARY 31, 2013 | | 27 |
| | |
| Disclosure of Investment Advisory Agreement and Sub-Advisory Agreements | | |
The Board of Trustees (the “Board,” and the members of which are referred to as “Board Members”) of BlackRock FundsSM (the “Trust”) met on September 20-21, 2012 to consider the approval of the Trust’s proposed investment advisory agreement (the “Advisory Agreement”) with BlackRock Advisors, LLC (the “Manager”) on behalf of BlackRock Multi-Asset Real Return Fund (“Multi-Asset Real Return Fund”) and BlackRock Strategic Risk Allocation Fund (“Strategic Risk Allocation Fund,” and together with Multi-Asset Real Return Fund, the “Funds”), each a portfolio of the Trust. The Advisory Agreement was the same agreement that had previously been approved by the Board with respect to other portfolios of the Trust. The Board also considered the approval of the sub-advisory agreement between the Manager and BlackRock Financial Management, Inc. (the “Sub-Advisor”) with respect to each of Multi-Asset Real Return Fund and Strategic Risk Allocation Fund (the “Sub-Advisory Agreement”). The Sub-Advisory Agreement was substantially the same as the sub-advisory agreements previously approved with respect to certain other portfolios of the Trust. The Manager and the Sub-Advisor are referred to herein as “BlackRock.” The Advisory Agreement and the Sub-Advisory Agreement are referred to herein as the “Agreements.” The Funds commenced operations in December 2012.
Activities and Composition of the Board
The Board consists of fourteen individuals, twelve of whom are not “interested persons” of the Trust or the Funds as defined in the Investment Company Act of 1940, as amended (the “1940 Act”) (the “Independent Board Members”). The Board Members are responsible for the oversight of the operations of the Trust and perform the various duties imposed on the directors of investment companies by the 1940 Act. The Independent Board Members have retained independent legal counsel to assist them in connection with their duties. The Co-Chairs of the Board are each Independent Board Members. The Board has established five standing committees: an Audit Committee, a Governance and Nominating Committee, a Compliance Committee, a Performance Oversight and Contract Committee and an Executive Committee, each of which is chaired by an Independent Board Member and composed of Independent Board Members (except for the Executive Committee, which also has one interested Board Member).
The Agreements
Pursuant to the 1940 Act, the Board is required to consider the initial approval of the Agreements. In connection with this process, the Board assessed, among other things, the nature, scope and quality of the services to be provided to the Funds by BlackRock, its personnel and its affiliates, including investment management, administrative and shareholder services, oversight of fund accounting and custody, marketing services, risk oversight, compliance and assistance in meeting applicable legal and regulatory requirements.
Board Considerations in Approving the Agreements
The Approval Process: At an in-person meeting held on September 20-21, 2012, the Board reviewed materials relating to its consideration of the Agreements. The Board considered all factors it believed relevant
with respect to the Trust and the Funds, including, among other factors: (a) the nature, extent and quality of the services to be provided by BlackRock; (b) the investment performance of BlackRock portfolio management; (c) the advisory fee and the cost of the services to be provided and profits to be realized by BlackRock and its affiliates from their relationship with the Funds; (d) economies of scale; (e) fall out benefits to BlackRock as a result of its relationship with the Funds; (f) possible alternatives to the proposed Agreements; (g) the policies and practices of BlackRock with respect to portfolio transactions for the Funds; and (h) other factors deemed relevant by the Board Members.
In determining to approve the Agreements, the Board met with the relevant investment advisory personnel from BlackRock and considered all information it deemed reasonably necessary to evaluate the terms of the Agreements. The Board received materials in advance of the September 2012 meeting relating to its consideration of the Agreements, including (a) with respect to each Fund, fees and estimated expense ratios of each class of the Fund, and for a representative class of the Fund, in comparison to the fees and expense ratios of a peer group of funds; (b) information regarding BlackRock’s economic outlook for the Funds and its general investment outlook for the markets; (c) information regarding fees paid to service providers that are affiliates of BlackRock; and (d) information outlining the legal duties of the Board under the 1940 Act with respect to the consideration and approval of the Agreements. The Board also noted information received at prior Board meetings concerning compliance records and regulatory matters relating to BlackRock.
The Board also considered other matters it deemed important to the approval process, such as services related to the valuation and pricing of Fund portfolio holdings, direct and indirect benefits to BlackRock and its affiliates from their relationship with the Funds and advice from independent legal counsel with respect to the review process and materials submitted for the Board’s review. The Board noted the willingness of BlackRock personnel to engage in open, candid discussions with the Board. The Board did not identify any particular information as controlling, and each Board Member may have attributed different weights to the various items considered.
A. Nature, Extent and Quality of the Services: The Board, including the Independent Board Members, reviewed the nature, extent and quality of services to be provided by BlackRock, including the investment advisory services to be provided to each Fund. The Board received information concerning the investment philosophy and investment process to be used by BlackRock in managing the Funds, as well as a description of the capabilities, personnel and services of BlackRock. In connection with this review, the Board considered BlackRock’s in-house research capabilities as well as other resources available to its personnel. The Board considered the scope of the services provided by BlackRock to the Funds under the Agreements relative to services typically provided by third parties to other funds. The Board noted that the standard of care applicable under the Agreements was comparable to that found generally in investment company advisory agreements. The Board concluded that the scope of BlackRock’s services to be provided to the Funds was
| | | | | | |
| | | | | | | |
| 28 | | BLACKROCK FUNDS | | JANUARY 31, 2013 | | |
| | |
| Disclosure of Investment Advisory Agreement and Sub-Advisory Agreements (continued) | | |
consistent with each Fund’s operational requirements, including, in addition to seeking to meet its investment objective, compliance with investment restrictions, tax and reporting requirements and related shareholder services.
The Board, including the Independent Board Members, also considered the quality of the administrative and non-investment advisory services to be provided by BlackRock and its affiliates to the Funds. The Board evaluated the procedures of BlackRock designed to fulfill its fiduciary duty to the Funds with respect to possible conflicts of interest, including BlackRock’s code of ethics (regulating the personal trading of BlackRock’s officers and employees), the procedures by which BlackRock allocates trades among its various investment advisory clients, the integrity of the systems in place to ensure compliance with the foregoing and the record of BlackRock in these matters. The Board also noted information received at prior Board meetings concerning standards of BlackRock with respect to the execution of portfolio transactions.
The Board, including the Independent Board Members, considered, among other factors, the number, education and experience of BlackRock’s investment personnel generally and the portfolio management team for each Fund. The Board also took into account the time and attention to be devoted by senior management of BlackRock to the Funds. The Board also considered the business reputation of BlackRock and its financial resources and concluded that BlackRock would be able to meet any reasonably foreseeable obligation under the Agreements.
B. The Investment Performance of the Funds and BlackRock: The Board, including the Independent Board Members, previously received and considered information about BlackRock’s investment performance for other funds. The Board, however, could not consider the performance history of the Funds because each Fund was newly organized and had not yet commenced operations as of the September 2012 meeting.
C. Consideration of the Advisory Fees and the Cost of the Services and Profits to be Realized by BlackRock and its Affiliates from their Relationship with the Funds: In connection with the initial approval of the Agreements, the Board, including the Independent Board Members, reviewed each Fund’s contractual management fee ratio (a combination of the advisory fee and the administration fee, if any) compared with the other funds in the applicable Fund’s peer group of funds. Both the peer group and the funds within the peer group (collectively, “Peers”) were selected by Lipper, Inc. (“Lipper”), which is not affiliated with BlackRock. It also compared each Fund’s estimated total expense ratio, as well as the Fund’s estimated actual management fee ratio, to those of its respective Peers. The Board noted that each Fund has an advisory fee arrangement that includes breakpoints that adjust the fee rate downward as the size of the Fund increases above certain contractually specified levels. The Board considered the fee waivers and expense reimbursement arrangements in place, including the contractual agreement by BlackRock to waive fees and/or reimburse expenses in order to limit, to a specified amount, each Fund’s total operating expenses as a percentage of the
Fund’s average daily net assets on a class-by-class basis, as applicable. Additionally, the Board noted information received at prior Board meetings concerning the services rendered, and the fee rates offered, to other clients advised by BlackRock.
The Board noted that Strategic Risk Allocation Fund’s contractual management fee ratio (a combination of the advisory fee and the administration fee, if any) was lower than or equal to the median contractual management fee ratio paid by the Fund’s Peers, in each case before taking into account any expense reimbursements or fee waivers.
The Board noted that Multi-Asset Real Return Fund’s contractual management fee ratio (a combination of the advisory fee and the administration fee, if any) was above the median contractual management fee ratio paid by the Fund’s Peers, in each case before taking into account any expense reimbursements or fee waivers. The Board also noted, however, that the Fund’s actual management fee ratio, when the fact that the management fee will only be charged on assets that are not invested in underlying mutual funds advised by BlackRock or its affiliates is taken into account, was lower than or equal to the median actual management fee ratio paid by the Fund’s Peers.
Following consideration of this information, the Board, including the independent Board Members, concluded that the fees to be paid pursuant to the Agreements were fair and reasonable in light of the services provided.
As the Funds had not commenced operations as of the date of the September 2012 meeting, BlackRock was not able to provide the Board with specific information concerning the expected profits to be realized by BlackRock and its affiliates from their relationships with the Funds. BlackRock, however, will provide the Board with such information at future meetings.
D. Economies of Scale: The Board, including the Independent Board Members, considered the extent to which economies of scale might be realized in respect of the management of the Funds in tandem with other portfolios of the Trust. Since each Fund is newly formed, BlackRock was not able to provide the Board with specific information concerning the extent to which economies of scale would be realized as the Funds grow and whether fee levels would reflect such economies of scale, if any.
E. Other Factors Deemed Relevant by the Board Members: The Board, including the Independent Board Members, also took into account other ancillary or “fall-out” benefits that BlackRock or its affiliates may derive from their respective relationships with the Funds, both tangible and intangible, such as BlackRock’s ability to leverage its investment professionals who manage other portfolios and risk management personnel, an increase in BlackRock’s profile in the investment advisory community, and the engagement of BlackRock’s affiliates as service providers to the Funds, including for administrative, distribution, securities lending and cash management services. The Board also considered BlackRock’s overall operations and its efforts to expand the scale of, and improve the
| | | | | | |
| | | | | | | |
| | | BLACKROCK FUNDS | | JANUARY 31, 2013 | | 29 |
| | |
| Disclosure of Investment Advisory Agreement and Sub-Advisory Agreements (concluded) | | |
quality of, its operations. The Board also noted that BlackRock may use and benefit from third party research obtained by soft dollars generated by certain registered fund transactions to assist in managing all or a number of its other client accounts. The Board further noted that it had considered the investment by BlackRock’s funds in ETFs without any offset against the management fees payable by the funds to BlackRock.
The Board, including all of the Independent Board Members, concluded that these ancillary benefits that BlackRock and its affiliates could receive with regard to providing investment advisory and other services to the Funds were consistent with those generally available to other mutual fund sponsors.
Conclusion
The Board, including the Independent Board Members, unanimously approved (i) the Advisory Agreement between the Manager and the Trust
on behalf of each Fund and (ii) the Sub-Advisory Agreement between the Manager and the Sub-Advisor with respect to each Fund, each for a two-year term ending September 20, 2014. Based upon its evaluation of all of the aforementioned factors in their totality, the Board, including the Independent Board Members, was satisfied that the terms of the Agreements were fair and reasonable and in the best interest of each Fund and its shareholders. In arriving at a decision to approve the Agreements, the Board did not identify any single factor or group of factors as all-important or controlling, but considered all factors together, and different Board Members may have attributed different weights to the various factors considered. The Independent Board Members were also assisted by the advice of independent legal counsel in making this determination.
| | | | | | |
| | | | | | | |
| 30 | | BLACKROCK FUNDS | | JANUARY 31, 2013 | | |
Ronald W. Forbes, Co-Chair of the Board and Trustee
Rodney D. Johnson, Co-Chair of the Board and Trustee
Paul L. Audet, Trustee
David O. Beim, Trustee
Henry Gabbay, Trustee
Dr. Matina S. Horner, Trustee
Herbert I. London, Trustee
Ian A. MacKinnon, Trustee
Cynthia A. Montgomery, Trustee
Joseph P. Platt, Trustee
Robert C. Robb, Jr., Trustee
Toby Rosenblatt, Trustee
Kenneth L. Urish, Trustee
Frederick W. Winter, Trustee
John M. Perlowski, President and Chief Executive Officer
Richard Hoerner, CFA, Vice President
Brendan Kyne, Vice President
Simon Mendelson, Vice President
Christopher Stavrakos, CFA, Vice President
Neal Andrews, Chief Financial Officer
Jay Fife, Treasurer
Brian Kindelan, Chief Compliance Officer and Anti-Money Laundering Officer
Benjamin Archibald, Secretary
Investment Advisor and Co-Administrator
BlackRock Advisors, LLC
Wilmington, DE 19809
Sub-Advisors
BlackRock Financial Management, Inc.1,2
New York, NY 10055
BlackRock International Limited2
Edinburgh, Scotland EH3 8JB
Distributor
BlackRock Investments, LLC
New York, NY 10022
Accounting Agent, Co-Administrator and Transfer Agent
BNY Mellon Investment Servicing (US) Inc.
Wilmington, DE 19809
Custodian
The Bank of New York Mellon
New York, NY 10286
Legal Counsel
Sidley Austin LLP
New York, NY 10019
Independent Registered Public Accounting Firm
Deloitte & Touche LLP
Philadelphia, PA 19103
Address of the Trust
100 Bellevue Parkway
Wilmington, DE 19809
| 1 | | For Multi-Asset Real Return. |
| 2 | | For Strategic Risk Allocation. |
| | | | | | |
| | | | | | | |
| | | BLACKROCK FUNDS | | JANUARY 31, 2013 | | 31 |
Electronic Delivery
Electronic copies of most financial reports and prospectuses are available on the Funds’ websites or shareholders can sign up for e-mail notifications of quarterly statements, annual and semi-annual reports and prospectuses by enrolling in the Funds’ electronic delivery program.
To enroll:
Shareholders Who Hold Accounts with Investment Advisors, Banks or Brokerages:
Please contact your financial advisor. Please note that not all investment advisors, banks or brokerages may offer this service.
Shareholders Who Hold Accounts Directly with BlackRock:
| 1) | Access the BlackRock website at http://www.blackrock.com/ edelivery |
| 2) | Select “eDelivery” under the “More Information” section |
Householding
The Funds will mail only one copy of shareholder documents, including prospectuses, annual and semi-annual reports and proxy statements, to shareholders with multiple accounts at the same address. This practice is commonly called “householding” and is intended to reduce expenses and eliminate duplicate mailings of shareholder documents. Mailings of your shareholder documents may be householded indefinitely unless you instruct us otherwise. If you do not want the mailing of these documents to be combined with those for other members of your household, please call the Funds at (800) 441-7762.
Availability of Quarterly Schedule of Investments
The Funds file their complete schedule of portfolio holdings with the SEC for the first and third quarters of each fiscal year on Form N-Q. The Funds’ Forms N-Q are available on the SEC’s website at http:// www.sec.gov and may also be reviewed and copied at the SEC’s Public Reference Room in Washington, DC. Information on how to access documents on the SEC’s website without charge may be obtained by calling (800) SEC-0330. The Funds’ Forms N-Q may also be obtained upon request and without charge by calling (800) 441-7762.
Availability of Proxy Voting Policies and Procedures
A description of the policies and procedures that the Funds use to determine how to vote proxies relating to portfolio securities is available (1) without charge, upon request, by calling (800) 441-7762; (2) at http://www.blackrock.com; and (3) on the SEC’s website at http:// www.sec.gov.
Availability of Proxy Voting Record
Information about how the Funds voted proxies relating to securities held in the Funds’ portfolios during the most recent 12-month period ended June 30 is available upon request and without charge (1) at http://www.blackrock.com or by calling (800) 441-7762 and (2) on the SEC’s website at http://www.sec.gov.
Account Information
Call us at (800) 441-7762 from 8:00 AM to 6:00 PM EST on any business day to get information about your account balances, recent transactions and share prices. You can also reach us on the Web at http:// www.blackrock.com/funds.
Automatic Investment Plans
Investor Class shareholders who want to invest regularly can arrange to have $50 or more automatically deducted from their checking or savings account and invested in any of the BlackRock funds.
Systematic Withdrawal Plan
Investor Class shareholders can establish a systematic withdrawal plan and receive periodic payments of $50 or more from their BlackRock funds, as long as their account balance is at least $10,000.
Retirement Plans
Shareholders may make investments in conjunction with Traditional, Rollover, Roth, Coverdell, Simple IRAs, SEP IRAs and 403(b) Plans.
| | | | | | |
| | | | | | | |
| 32 | | BLACKROCK FUNDS | | JANUARY 31, 2013 | | |
| | |
| Additional Information (concluded) | | |
|
| BlackRock Privacy Principles |
BlackRock is committed to maintaining the privacy of its current and former fund investors and individual clients (collectively, “Clients”) and to safeguarding their non-public personal information. The following information is provided to help you understand what personal information BlackRock collects, how we protect that information and why in certain cases we share such information with select parties.
If you are located in a jurisdiction where specific laws, rules or regulations require BlackRock to provide you with additional or different privacy-related rights beyond what is set forth below, then BlackRock will comply with those specific laws, rules or regulations.
BlackRock obtains or verifies personal non-public information from and about you from different sources, including the following: (i) information we receive from you or, if applicable, your financial intermediary, on applications, forms or other documents; (ii) information about your transactions with us, our affiliates, or others; (iii) information we receive from a consumer reporting agency; and (iv) from visits to our websites.
BlackRock does not sell or disclose to non-affiliated third parties any non-public personal information about its Clients, except as permitted by law or as is necessary to respond to regulatory requests or to service Client accounts. These non-affiliated third parties are required to protect the confidentiality and security of this information and to use it only for its intended purpose.
We may share information with our affiliates to service your account or to provide you with information about other BlackRock products or services that may be of interest to you. In addition, BlackRock restricts access to non-public personal information about its Clients to those BlackRock employees with a legitimate business need for the information. BlackRock maintains physical, electronic and procedural safeguards that are designed to protect the non-public personal information of its Clients, including procedures relating to the proper storage and disposal of such information.
| | | | | | |
| | | | | | | |
| | | BLACKROCK FUNDS | | JANUARY 31, 2013 | | 33 |
| | |
| | |
A World-Class Mutual Fund Family | | |
BlackRock offers a diverse lineup of open-end mutual funds crossing all investment styles and managed by experts in equity, fixed income and tax-exempt investing.
| | | | |
Equity Funds | | | | |
BlackRock ACWI ex-US Index Fund | | BlackRock Global Opportunities Portfolio | | BlackRock Mid-Cap Value Opportunities Fund |
BlackRock All-Cap Energy & Resources Portfolio | | BlackRock Global SmallCap Fund | | BlackRock Natural Resources Trust |
BlackRock Basic Value Fund | | BlackRock Health Sciences Opportunities Portfolio | | BlackRock Pacific Fund |
BlackRock Capital Appreciation Fund | | BlackRock Index Equity Portfolio | | BlackRock Real Estate Securities Fund |
BlackRock China Fund | | BlackRock India Fund | | BlackRock Russell 1000 Index Fund |
BlackRock Commodity Strategies Fund | | BlackRock International Fund | | BlackRock Science & Technology |
BlackRock Disciplined Small Cap Core Fund | | BlackRock International Index Fund | | Opportunities Portfolio |
BlackRock Emerging Markets Fund | | BlackRock International Opportunities Portfolio | | BlackRock Small Cap Growth Equity Portfolio |
BlackRock Emerging Markets Long/Short | | BlackRock Large Cap Core Fund | | BlackRock Small Cap Growth Fund II |
Equity Fund | | BlackRock Large Cap Core Plus Fund | | BlackRock Small Cap Index Fund |
BlackRock Energy & Resources Portfolio | | BlackRock Large Cap Growth Fund | | BlackRock S&P 500 Index Fund |
BlackRock Equity Dividend Fund | | BlackRock Large Cap Value Fund | | BlackRock S&P 500 Stock Fund |
BlackRock EuroFund | | BlackRock Latin America Fund | | BlackRock U.S. Opportunities Portfolio |
BlackRock Flexible Equity Fund | | BlackRock Long-Horizon Equity Fund | | BlackRock Value Opportunities Fund |
BlackRock Focus Growth Fund | | BlackRock Mid-Cap Growth Equity Portfolio | | BlackRock World Gold Fund |
BlackRock Global Dividend Income Portfolio | | | | |
BlackRock Global Long/Short Equity Fund | | | | |
| | | | |
Taxable Fixed Income Funds | | | | |
BlackRock Bond Index Fund | | BlackRock High Yield Bond Portfolio | | BlackRock Strategic Income |
BlackRock Core Bond Portfolio | | BlackRock Inflation Protected Bond Portfolio | | Opportunities Portfolio |
BlackRock CoreAlpha Bond Fund | | BlackRock International Bond Portfolio | | BlackRock Total Return Fund |
BlackRock Emerging Market Local Debt Portfolio | | BlackRock Long Duration Bond Portfolio | | BlackRock U.S. Government Bond Portfolio |
BlackRock Floating Rate Income Portfolio | | BlackRock Low Duration Bond Portfolio | | BlackRock U.S. Mortgage Portfolio |
BlackRock Global Long/Short Credit Fund | | BlackRock Secured Credit Portfolio | | BlackRock World Income Fund |
BlackRock GNMA Portfolio | | | | |
| | | | |
Municipal Fixed Income Funds | | | | |
BlackRock California Municipal Bond Fund | | BlackRock National Municipal Fund | | BlackRock Pennsylvania Municipal Bond Fund |
BlackRock High Yield Municipal Fund | | BlackRock New Jersey Municipal Bond Fund | | BlackRock Short-Term Municipal Fund |
BlackRock Intermediate Municipal Fund | | BlackRock New York Municipal Bond Fund |
| | | | |
Mixed Asset Funds | | | | |
BlackRock Balanced Capital Fund | | LifePath Active Portfolios | | LifePath Index Portfolios |
BlackRock Global Allocation Fund | | 2015 2040 | | Retirement 2040 |
BlackRock Managed Volatility Portfolio | | 2020 2045 | | 2020 2045 |
BlackRock Multi-Asset Income Portfolio | | 2025 2050 | | 2025 2050 |
BlackRock Multi-Asset Real Return Fund | | 2030 2055 | | 2030 2055 |
BlackRock Strategic Risk Allocation Fund | | 2035 | | 2035 |
| | | | |
BlackRock Prepared Portfolios | | LifePath Portfolios | | |
Conservative Prepared Portfolio | | Retirement 2040 | | |
Moderate Prepared Portfolio | | 2020 2045 | | |
Growth Prepared Portfolio | | 2025 2050 | | |
Aggressive Growth Prepared Portfolio | | 2030 2055 | | |
| | 2035 | | |
BlackRock mutual funds are currently distributed by BlackRock Investments, LLC. You should consider the investment objectives, risks, charges and expenses of the funds under consideration carefully before investing. Each fund’s prospectus contains this and other information and is available at www.blackrock.com or by calling (800) 441-7762 or from your financial advisor. The prospectus should be read carefully before investing.
| | | | | | |
| | | | | | | |
| 34 | | BLACKROCK FUNDS | | JANUARY 31, 2013 | | |
| | |
This report is transmitted to shareholders only. It is not authorized for use as an offer of sale or a solicitation of an offer to buy shares of the Funds unless accompanied or preceded by the Fund’s current prospectus. Past performance results shown in this report should not be considered a representation of future performance. Investment returns and principal value of shares will fluctuate so that shares, when redeemed, may be worth more or less than their original cost. Statements and other information herein are as dated and are subject to change. Investment in foreign securities involves special risks including fluctuating foreign exchange rates, foreign government regulations, differing degrees of liquidity and the possibility of substantial volatility due to adverse political, economic or other developments. | |  |
| | |
| MRRSRA-1/13-SAR | |  |
JANUARY 31, 2013
| | | | |
SEMI-ANNUAL REPORT (UNAUDITED) | | | | BLACKROCK ® |
BlackRock FundsSM
„ BlackRock Short Obligations Fund
„ BlackRock Short-Term Treasury Fund
„ BlackRock Ultra-Short Obligations Fund
| | |
Not FDIC Insured ¡ May Lose Value ¡ No Bank Guarantee | | |
| | | | | | |
| | | | | | | |
| 2 | | BLACKROCK FUNDS | | JANUARY 31, 2013 | | |
Dear Shareholder
Financial markets have substantially improved over the past year, providing investors with considerable relief compared to where things were during the global turmoil seen in 2011. Despite a number of headwinds, higher-risk asset classes boasted strong returns as investors sought meaningful yields in the ongoing low-interest-rate environment.
Rising investor confidence drove equity markets higher in early 2012, while climbing US Treasury yields pressured higher-quality fixed income assets. The second quarter, however, brought a market reversal as Europe’s debt crisis boiled over once again. Political instability in Greece and severe deficit and liquidity problems in Spain raised the specter of a euro collapse. Alongside the drama in Europe, investors were discouraged by gloomy economic reports from various parts of the world. A slowdown in China, a key powerhouse for global growth, emerged as a particular concern. But as the outlook for the global economy worsened, investors grew increasingly optimistic that the world’s largest central banks would soon intervene to stimulate growth. This theme, along with the European Central Bank’s (“ECB’s”) firm commitment to preserve the euro currency bloc, drove most asset classes higher through the summer. Policy relief came in early September, when the ECB announced its decision to support the eurozone’s troubled peripheral countries with unlimited purchases of short term sovereign debt. Days later, the US Federal Reserve announced its own much-anticipated stimulus package.
Although financial markets world-wide were buoyed by accommodative monetary policy, risk assets weakened in the fall. Global trade slowed as many European countries fell into recession and growth continued to decelerate in China, where a once-a-decade leadership change compounded uncertainty. In the United States, stocks slid on lackluster corporate earnings reports and market volatility rose during the lead up to the US Presidential election. In the post-election environment, investors grew increasingly concerned over automatic tax increases and spending cuts that had been scheduled to take effect at the beginning of 2013 (known as the “fiscal cliff”). There was widespread fear that the fiscal cliff would push the nation into recession unless politicians could agree upon alternate measures to reduce the deficit before the end of 2012. Worries that bipartisan gridlock would preclude a timely budget deal triggered higher levels of volatility in financial markets around the world in the months leading up to the last day of the year. Ultimately, the United States averted the worst of the fiscal cliff with a last-minute tax deal; however, decisions relating to spending cuts and the debt ceiling continue to weigh on investors’ minds.
Investors shook off the nerve-wracking finale to 2012 and began the New Year with a powerful equity rally. Key indicators signaled broad-based improvements in the world’s major economies, particularly China. In the United States, economic data was mixed, but pointed to a continued recovery. The risk of inflation remained low and the US Federal Reserve showed no signs of curtailing its stimulus programs. Additionally, January saw the return of funds that investors had pulled out of the market in late 2012 amid uncertainty about tax-rate increases ahead of the fiscal cliff deadline. In fixed income markets, rising US Treasuries yields dragged down higher-quality asset classes, while high yield bonds continued to benefit from investor demand for yield in the low-rate environment.
On the whole, riskier asset classes outperformed lower-risk investments for the 6- and 12-month periods ended January 31, 2013. International equities were the strongest performers. US stocks and high yield bonds also generated significant returns. Emerging market equities were particularly volatile, but still posted gains for both the 6- and 12-month periods. US Treasury yields remained low, but experienced increasing volatility in recent months. Rising yields near the end of the period resulted in negative returns for Treasuries and investment-grade bonds for the 6-month period. Tax-exempt municipal bonds, however, benefited from favorable supply-and-demand dynamics. Near-zero short term interest rates continued to keep yields on money market securities near their all-time lows.
While investors continue to face a host of unknowns, we believe new opportunities abound. BlackRock was built to provide the global market insight, breadth of capabilities, unbiased investment advice and deep risk management expertise these times require. We encourage you to visit www.blackrock.com/newworld for more information.
Sincerely,

Rob Kapito
President, BlackRock Advisors, LLC

“Despite a number of headwinds, higher-risk asset classes boasted strong returns as investors sought meaningful yields in the ongoing low-interest-rate environment.”
Rob Kapito
President, BlackRock Advisors, LLC
| | | | | | | | |
| Total Returns as of January 31, 2013 | |
| | | 6-month | | | 12-month | |
US large cap equities (S&P 500® Index) | | | 9.91 | % | | | 16.78 | % |
US small cap equities (Russell 2000® Index) | | | 15.51 | | | | 15.47 | |
International equities (MSCI Europe, Australasia, Far East Index) | | | 18.61 | | | | 17.25 | |
Emerging market equities (MSCI Emerging Markets Index) | | | 13.11 | | | | 7.64 | |
3-month Treasury bill (BofA Merrill Lynch 3-Month US Treasury Bill Index) | | | 0.07 | | | | 0.11 | |
US Treasury securities (BofA Merrill Lynch 10- Year US Treasury Index) | | | (2.90 | ) | | | 1.28 | |
US investment grade bonds (Barclays US Aggregate Bond Index) | | | (0.29 | ) | | | 2.59 | |
Tax-exempt municipal bonds (S&P Municipal Bond Index) | | | 2.21 | | | | 5.50 | |
US high yield bonds (Barclays US Corporate High Yield 2% Issuer Capped Index) | | | 7.37 | | | | 13.87 | |
|
| Past performance is no guarantee of future results. Index performance is shown for illustrative purposes only. You cannot invest directly in an index. | |
| | | | | | |
| | | | | | | |
| | THIS PAGE IS NOT PART OF YOUR FUND REPORT | | | | 3 |
| | |
| Fund Summary as of January 31, 2013 | | BlackRock Short Obligations Fund |
BlackRock Short Obligations Fund’s (the “Fund”) investment objective is to seek current income consistent with preservation of capital.
| | | | |
| Portfolio Composition | | Percent of
Net Assets | |
Corporate Bonds | | | 44 | % |
Commercial Paper | | | 30 | |
Certificates of Deposit | | | 15 | |
Repurchase Agreements | | | 9 | |
Corporate Notes | | | 2 | |
| | | | |
| Portfolio Composition | | Percent of
Net Assets | |
1-7 days | | | 3 | % |
8-14 days | | | — | |
15-30 days | | | 3 | |
31-60 days | | | 15 | |
61-90 days | | | 4 | |
91-120 days | | | 10 | |
121-150 days | | | 4 | |
> 150 days | | | 61 | |
| | | | | | | | | | | | | | | | | | | | | | | | | | | | |
| | | Actual | | | Hypothetical1 | | | | |
| | | Beginning Account Value
November 15, 2012 | | | Ending Account Value January 31, 2013 | | | Expenses Paid
During the Period2 | | | Beginning Account Value
November 15, 2012 | | | Ending
Account Value
January 31, 2013 | | | Expenses Paid
During the Period2 | | | Annualized
Expense Ratio | |
BlackRock | | $ | 1,000.00 | | | $ | 1,000.63 | | | $ | 0.42 | | | $ | 1,000.00 | | | $ | 1,010.13 | | | $ | 0.42 | | | | 0.20 | % |
| | 1 | | Hypothetical 5% annual return before expenses is calculated by pro rating the number of days in the most recent fiscal period divided by 365. |
| | 2 | | For each class of the Fund, expenses are equal to the annualized expense ratio for the class, multiplied by the average account value over the period, multiplied by 77/365 (to reflect the period from November 15, 2012, the commencement of operations, to January 31, 2013). |
See “Disclosure of Expenses” on page 7 for further information on how expenses were calculated.
| | | | | | |
| | | | | | | |
| 4 | | BLACKROCK FUNDS | | JANUARY 31, 2013 | | |
| | |
| Fund Summary as of January 31, 2013 | | BlackRock Short-Term Treasury Fund |
BlackRock Short-Term Treasury Fund’s (the “Fund”) investment objective is to seek current income consistent with liquidity and preservation of capital.
| | | | |
| Portfolio Composition | | Percent of
Net Assets | |
U.S. Treasury Obligations | | | 53 | % |
Repurchase Agreements | | | 47 | |
| | | | |
| Maturity Breakdown | | Percent of
Net Assets | |
1-7 days | | | 47 | % |
8-14 days | | | 5 | |
15-30 days | | | — | |
31-60 days | | | 10 | |
61-90 days | | | 5 | |
91-120 days | | | 7 | |
121-150 days | | | 9 | |
> 150 days | | | 17 | |
| | | | | | | | | | | | | | | | | | | | | | | | | | | | |
| | | Actual | | | Hypothetical1 | | | | |
| | | Beginning
Account Value
November 15,
2012 | | | Ending
Account
Value
January 31,
2013 | | | Expenses
Paid
During
the
Period2 | | | Beginning
Account
Value
November 15,
2012 | | | Ending
Account
Value
January 31,
2013 | | | Expenses Paid
During the
Period2 | | | Annualized
Expense
Ratio | |
| | | | | | | | | | | | | | | | | | | | | | |
Institutional Daily | | $ | 1,000.00 | | | $ | 1,000.00 | | | $ | 0.30 | | | $ | 1,000.00 | | | $ | 1,010.25 | | | $ | 0.30 | | | | 0.14 | % |
| | 1 | | Hypothetical 5% annual return before expenses is calculated by pro rating the number of days in the most recent fiscal period divided by 365. |
| | 2 | | For each class of the Fund, expenses are equal to the annualized expense ratio for the class, multiplied by the average account value over the period, multiplied by 77/365 (to reflect the period from November 15, 2012, the commencement of operations, to January 31, 2013). |
See “Disclosure of Expenses” on page 7 for further information on how expenses were calculated.
| | | | | | |
| | | | | | | |
| | BLACKROCK FUNDS | | JANUARY 31, 2013 | | 5 |
| | |
| Fund Summary as of January 31, 2013 | | BlackRock Ultra-Short Obligations Fund |
BlackRock Ultra-Short Obligations Fund’s (the “Fund”) investment objective is to seek current income consistent with preservation of capital.
| | | | |
| Portfolio Composition | | Percent of
Net Assets | |
Commercial Paper | | | 36 | % |
Corporate Bonds | | | 26 | |
Certificates of Deposit | | | 25 | |
Repurchase Agreements | | | 11 | |
Corporate Notes | | | 2 | |
| | | | |
| Maturity Breakdown | | Percent of
Net Assets | |
1-7 days | | | 8 | % |
8-14 days | | | 6 | |
15-30 days | | | 22 | |
31-60 days | | | 2 | |
61-90 days | | | 7 | |
91-120 days | | | 11 | |
121-150 days | | | 3 | |
> 150 days | | | 41 | |
| | | | | | | | | | | | | | | | | | | | | | | | | | | | |
| | | Actual | | | Hypothetical1 | | | | |
| | | Beginning
Account Value
November 15, 2012 | | | Ending Account Value
January 31, 2013 | | | Expenses Paid
During the Period2 | | | Beginning Account Value
November 15, 2012 | | | Ending Account Value
January 31, 2013 | | | Expenses Paid
During the Period2 | | | Annualized
Expense Ratio | |
BlackRock | | $ | 1,000.00 | | | $ | 1,000.56 | | | $ | 0.36 | | | $ | 1,000.00 | | | $ | 1,010.19 | | | $ | 0.36 | | | | 0.17 | % |
| | 1 | | Hypothetical 5% annual return before expenses is calculated by pro rating the number of days in the most recent fiscal period divided by 365. |
| | 2 | | For each class of the Fund, expenses are equal to the annualized expense ratio for the class, multiplied by the average account value over the period, multiplied by 77/365 (to reflect the period from November 15, 2012, the commencement of operations, to January 31, 2013). |
See “Disclosure of Expenses” on page 7 for further information on how expenses were calculated.
| | | | | | |
| | | | | | | |
| 6 | | BLACKROCK FUNDS | | JANUARY 31, 2013 | | |
| Ÿ | | BlackRock and Institutional Daily Shares are not subject to any sales charge. These shares bear no ongoing distribution or service fees and are available only to eligible investors. |
Refer to www.blackrock.com/funds to obtain performance data current to the most recent month-end. Performance information reflects past performance and does not guarantee future results. Current performance may be lower or higher than the performance data quoted. Performance results do not reflect the deduction of taxes that a shareholder would pay on fund distributions or the redemption of fund shares. Performance data does not reflect this potential fee. Investment return and principal value of shares will fluctuate
so that shares, when redeemed, may be worth more or less than their original cost.
BlackRock Advisors, LLC (the “Manager”), the Funds’ investment advisor, waived and/or reimbursed a portion of each Fund’s expenses. Without such waiver and/or reimbursement, a Fund’s performance would have been lower. The Manager is under no obligation to waive or reimburse or to continue waiving or reimbursing its fees after the applicable termination date. See Note 2 of the Notes to Financial Statements for additional information on waivers and reimbursements.
Shareholders of the Funds may incur the following charges: (a) transactional expenses, such as sales charges; and (b) operating expenses, including investment advisory fees, service and distribution fees, including 12b-1 fees, acquired fund fees and expenses, and other Fund expenses. The expense examples on the previous pages (which are based on a hypothetical investment of $1,000 invested on November 15, 2012 (commencement of operations) and held through January 31, 2013) are intended to assist shareholders both in calculating expenses based on an investment in the Funds and in comparing these expenses with similar costs of investing in other mutual funds.
The expense examples provide information about actual account values and actual expenses. In order to estimate the expenses a shareholder paid during the period covered by this report, shareholders can divide their account value by $1,000 and then multiply the result by the number corresponding to their Fund and share class under the headings entitled “Expenses Paid During the Period.”
The expense examples also provide information about hypothetical account values and hypothetical expenses based on each Fund’s actual expense ratios and an assumed rate of return of 5% per year before expenses. In order to assist shareholders in comparing the ongoing expenses of investing in these Funds and other funds, compare the 5% hypothetical example with the 5% hypothetical examples that appear in other funds’ shareholder reports.
The expenses shown in the expense examples are intended to highlight shareholders’ ongoing costs only and do not reflect any transactional expenses, such as sales charges, if any. Therefore, the hypothetical examples are useful in comparing ongoing expenses only, and will not help shareholders determine the relative total expenses of owning different funds. If these transactional expenses were included, shareholder expenses would have been higher.
| | | | | | |
| | | | | | | |
| | BLACKROCK FUNDS | | JANUARY 31, 2013 | | 7 |
| | |
Schedule of Investments January 31, 2013 (Unaudited) | | BlackRock Short Obligations Fund (Percentages shown are based on Net Assets) |
| | | | | | | | |
| Corporate Bonds | | Par
(000) | | | Value | |
Automobiles — 4.0% | | | | | | | | |
Daimler Finance North America LLC,
0.91%, 1/09/15 (a)(b) | | $ | 500 | | | $ | 499,819 | |
Volkswagen International Finance N.V.,
0.92%, 4/01/14 (a)(b) | | | 500 | | | | 501,505 | |
| | | | | | | | |
| | | | | | | | 1,001,324 | |
Commercial Banks — 23.8% | | | | | |
The Bear Stearns Cos. LLC, 5.70%, 11/15/14 | | | 500 | | | | 542,503 | |
BNP Paribas SA, 0.71%, 4/08/13 (b) | | | 300 | | | | 300,179 | |
Commonwealth Bank of Australia, 0.86%, 3/19/13 (a)(b) | | | 280 | | | | 280,184 | |
Cooperatieve Centrale Raiffeisen- Boerenleenbank BA, 0.66%, 4/14/14 (b) | | | 400 | | | | 400,280 | |
Credit Suisse USA, Inc.: | | | | | | | | |
5.50%, 8/15/13 | | | 295 | | | | 302,727 | |
5.13%, 1/15/14 | | | 250 | | | | 260,755 | |
Deutsche Bank A.G., 4.88%, 5/20/13 | | | 500 | | | | 506,512 | |
HSBC Bank Plc, 2.00%, 1/19/14 (a) | | | 750 | | | | 757,257 | |
ING Bank N.V.: | | | | | | | | |
1.36%, 3/15/13 (a)(b) | | | 700 | | | | 700,591 | |
2.00%, 10/18/13 (a) | | | 500 | | | | 504,565 | |
Nordea Bank AB: | | | | | | | | |
1.75%, 10/04/13 (a) | | | 380 | | | | 383,087 | |
1.21%, 1/14/14 (a)(b) | | | 500 | | | | 504,250 | |
Westpac Banking Corp., 1.04%, 3/31/14 (a)(b) | | | 500 | | | | 503,337 | |
| | | | | | | | |
| | | | | | | | 5,946,227 | |
Computers & Peripherals — 2.0% | | | | | |
Hewlett-Packard Co., 0.59%, 5/24/13 (b) | | | 500 | | | | 499,049 | |
Diversified Financial Services — 4.1% | | | | | |
General Electric Capital Corp., 5.90%, 5/13/14 | | | 500 | | | | 533,995 | |
Toyota Motor Credit Corp., 0.48%, 12/05/14 (b) | | | 500 | | | | 500,370 | |
| | | | | | | | |
| | | | | | | | 1,034,365 | |
Diversified Telecommunication Services — 4.2% | | | | | |
Cellco Partnership/Verizon Wireless Capital LLC: | | | | | | | | |
7.38%, 11/15/13 | | | 500 | | | | 525,503 | |
5.55%, 2/01/14 | | | 500 | | | | 522,929 | |
| | | | | | | | |
| | | | | | | | 1,048,432 | |
Food Products — 1.0% | | | | | |
General Mills, Inc., 0.60%, 1/29/16 (b) | | | 250 | | | | 250,223 | |
Media — 4.1% | | | | | |
Comcast Cable Communications Holdings, Inc.,
8.38%, 3/15/13 | | | 500 | | | | 504,369 | |
NBC Universal Media LLC, 2.10%, 4/01/14 | | | 500 | | | | 507,982 | |
| | | | | | | | |
| | | | | | | | 1,012,351 | |
Oil, Gas & Consumable Fuels — 1.2% | | | | | |
Total Capital Canada, Ltd., 0.68%, 1/15/16 (b) | | | 300 | | | | 301,124 | |
Total Long-Term Investments (Cost — $11,094,624) — 44.4% | | | | 11,093,095 | |
| | | | | | | | |
| | |
| | | | | | | | |
| Short-Term Securities | | Par
(000) | | | Value | |
Certificates of Deposit | |
Euro — 1.3% | | | | | |
Skandinaviska Enskilda Banken AB, Stockholm,
0.37%, 4/05/13 | | $ | 325 | | | $ | 325,075 | |
Yankee — 13.9% (c) | | | | | |
Bank of Nova Scotia, Houston, 0.51%, 3/27/14 (b) | | | 500 | | | | 500,897 | |
Barclays Bank Plc, New York, 0.71%, 9/10/13 | | | 250 | | | | 250,322 | |
Credit Industriel et Commercial, New York: | | | | | | | | |
0.45%, 3/07/13 | | | 250 | | | | 250,056 | |
0.50%, 7/01/13 | | | 500 | | | | 500,146 | |
Credit Suisse, New York, 0.69%, 12/06/13 | | | 250 | | | | 250,340 | |
Deutsche Bank A.G., New York, 0.71%, 2/05/14 | | | 250 | | | | 250,000 | |
National Australia Bank Ltd. New York, 1.50%, 1/30/14 (b) | | | 900 | | | | 910,452 | |
Societe Generale, New York, 1.31%, 2/22/13 | | | 250 | | | | 250,018 | |
Sumitomo Mitsui Banking Corp., New York, 0.80%, 4/11/13 | | | 300 | | | | 300,320 | |
| | | | | | | | |
| | | | | | | | 3,462,551 | |
Total Certificates of Deposit — 15.2% | | | | 3,787,626 | |
| | | | | | | | |
| | | | | | | | | |
Commercial Paper (d) | | | | | |
Antalis US Funding Corp., 0.45%, 3/21/13 | | | 500 | | | | 499,855 | |
AT&T, Inc., 0.51%, 7/22/13 | | | 500 | | | | 498,736 | |
BNP Paribas Finance, Inc.: | | | | | | | | |
0.40%, 2/21/13 | | | 350 | | | | 349,969 | |
0.40%, 6/24/13 | | | 300 | | | | 299,561 | |
BP Capital Markets, 0.45%, 8/07/13 | | | 376 | | | | 375,588 | |
Ciesco LLC, 0.57%, 5/06/13 | | | 350 | | | | 349,732 | |
Daimler Finance North America LLC, 0.95%, 11/05/13 | | | 375 | | | | 373,034 | |
Electricite de France, 0.38%, 3/07/13 | | | 300 | | | | 299,943 | |
Erste Abwicklungsanstalt, 0.43%, 9/12/13 | | | 500 | | | | 499,037 | |
Govco LLC: | | | | | | | | |
0.57%, 5/20/13 | | | 350 | | | | 349,651 | |
0.50%, 6/27/13 | | | 300 | | | | 299,539 | |
Reckitt Benckiser TSY: | | | | | | | | |
0.60%, 12/09/13 | | | 500 | | | | 498,180 | |
0.55%, 1/03/14 | | | 300 | | | | 298,180 | |
Skandinaviska Enskilda Banken AB, 0.41%, 6/28/13 | | | 500 | | | | 499,385 | |
Societe Generale North America, Inc., 0.61%, 7/08/13 | | | 500 | | | | 498,958 | |
Suncorp Metway Ltd.: | | | | | | | | |
0.45%, 3/18/13 (a) | | | 500 | | | | 499,864 | |
0.58%, 7/24/13 | | | 500 | | | | 498,937 | |
Vodafone Group Plc, 0.80%, 1/02/14 | | | 500 | | | | 496,519 | |
Total Commercial Paper — 29.9% | | | | 7,484,668 | |
| | | | | | | | |
| | |
See Notes to Financial Statements.
| | | | | | |
| | | | | | | |
| 8 | | BLACKROCK FUNDS | | JANUARY 31, 2013 | | |
| | |
Schedule of Investments (continued) | | BlackRock Short Obligations Fund (Percentages shown are based on Net Assets) |
| | | | | | | | |
| Corporate Notes — 2.0% | | Par
(000) | | | Value | |
UBS A.G., 2.25%, 8/12/13 | | $ | 500 | | | $ | 504,661 | |
| | | | | | | | |
| | |
| Repurchase Agreements | | | | | | |
Barclays Capital, Inc., 0.85%, 5/28/13
(Purchased on 11/29/12 to be repurchased at $753,188, collateralized by various corporate/debt obligations, 3.64% to 12.50% due from 4/01/14 to 6/26/37, aggregate par and fair value of $870,182 and $892,543, respectively) | | | 750 | | | | 751,508 | |
Citigroup Global Markets, Inc., 0.41%, 2/01/13
(Purchased on 1/31/13 to be repurchased at $500,006, collateralized by U.S. Treasury Note, 0.75% due at 10/31/17, par and fair value of $511,100 and $510,040, respectively) | | | 500 | | | | 500,000 | |
Mizuho Securities USA, 0.76%, 2/01/13 (e)
(Purchased on 12/05/12 to be repurchased at $250,000, collateralized by various U.S. government sponsoredagency and corporate/debt obligations, 1.70% to 6.61% due from 2/25/36 to 1/25/42, aggregate par and fair value of $3,211,868 and $278,957, respectively) | | | 250 | | | | 250,000 | |
| | | | | | | | |
| Repurchase Agreements | | Par (000) | | | Value | |
RBS Securities Inc., 1.10%, 3/06/13
(Purchased on 12/06/12 to be repurchased at $752,063, collateralized by various corporate/debt obligations, 0.00% to 100.00% due from 3/16/17 to 10/25/46, aggregate par and fair value of $154,415,357 and $936,131,respectively) | | $ | 750 | | | $ | 750,000 | |
Total Repurchase Agreements — 9.0% | | | | 2,251,508 | |
Total Short-Term Securities (Cost — $14,019,920) — 56.1% | | | | 14,028,463 | |
| Total Investments (Cost $25,114,544) — 100.5% | | | | | | | 25,121,558 | |
| Liabilities in Excess of Other Assets — (0.5)% | | | | | | | (113,689 | ) |
| | | | | | | | |
| Net Assets — 100.0% | | | | | | $ | 25,007,869 | |
| | | | | | | | |
|
| Notes to Schedule of Investments |
| (a) | | Security exempt from registration pursuant to Rule 144A under the Securities Act of 1933, as amended. These securities may be resold in transactions exempt from registration to qualified institutional investors. |
| (b) | | Variable rate security. Rate shown is as of report date. |
| (c) | | Issuer is a US branch of a foreign domiciled bank. |
| (d) | | Rate shown reflects the discount rate at the time of purchase. |
| (e) | | Variable rate security. Rate shown is as of report date and maturity shown is the date the principal owed can be recovered through demand. |
| Ÿ | | For Fund compliance purposes, the Fund’s industry classifications refer to any one or more of the industry sub-classifications used by one or more widely recognized market indexes or ratings group indexes and/or as defined by Fund management. These definitions may not apply for purposes of this report, which may combine industry sub-classifications for reporting ease. |
| Ÿ | | Fair Value Measurements — Various inputs are used in determining the fair value of investments. These inputs to valuation techniques are categorized into a disclosure hierarchy consisting of three broad levels for financial statement purposes as follows: |
| Ÿ | | Level 1 — unadjusted price quotations in active markets/exchanges for identical assets and liabilities that the Fund has the ability to access |
| Ÿ | | Level 2 — other observable inputs (including, but not limited to, quoted prices for similar assets or liabilities in markets that are active, quoted prices for identical or similar assets or liabilities in markets that are not active, inputs other than quoted prices that are observable for the assets or liabilities (such as interest rates, yield curves, volatilities, prepayment speeds, loss severities, credit risks and default rates) or other market–corroborated inputs) |
| Ÿ | | Level 3 — unobservable inputs based on the best information available in the circumstances, to the extent observable inputs are not available (including the Fund’s own assumptions used in determining the fair value of investments) |
The hierarchy gives the highest priority to unadjusted quoted prices in active markets for identical assets or liabilities (Level 1 measurements) and the lowest priority to unobservable inputs (Level 3 measurements). Accordingly, the degree of judgment exercised in determining fair value is greatest for instruments categorized in Level 3. The inputs used to measure fair value may fall into different levels of the fair value hierarchy. In such cases, for disclosure purposes, the level in the fair value hierarchy within which the fair value measurement falls in its entirety is determined based on the lowest level input that is significant to the fair value measurement in its entirety.
See Notes to Financial Statements.
| | | | | | |
| | | | | | | |
| | BLACKROCK FUNDS | | JANUARY 31, 2013 | | 9 |
| | |
| Schedule of Investments (concluded) | | BlackRock Short Obligations Fund |
Changes in valuation techniques may result in transfers into or out of an assigned level within the disclosure hierarchy. In accordance with the Fund’s policy, transfers between different levels of the fair value disclosure hierarchy are deemed to have occurred as of the beginning of the reporting period. The categorization of a value determined for investments is based on the pricing transparency of the investment and is not necessarily an indication of the risks associated with investing in those securities. For information about the Fund’s policy regarding valuation of investments and other significant accounting policies, please refer to Note 1 of the Notes to Financial Statements.
The following table summarizes the Fund’s investments categorized in the disclosure hierarchy as of January 31, 2013:
| | | | | | | | | | | | | | | | |
| | | Level 1 | | | Level 2 | | | Level 3 | | | Total | |
Assets: | | | | | | | | | | | | | | | | |
| Investments:1 | | | | | | | | | | | | | | | | |
Long-Term Investments | | | — | | | $ | 11,093,095 | | | | — | | | $ | 11,093,095 | |
Short-Term Securities | | | — | | | | 14,028,463 | | | | — | | | | 14,028,463 | |
| |
Total | | | — | | | $ | 25,121,558 | | | | — | | | $ | 25,121,558 | |
| | | | |
| 1 | | See above Schedule of Investments for values in each security type. |
Certain of the Fund’s assets are held at carrying amount, which approximates fair value for financial statement purposes. As of January 31, 2013, cash of $38,424 is categorized as Level 1 within the disclosure hierarchy.
| | | | | | |
| See Notes to Financial Statements. | | | | |
| | | | | | | |
| 10 | | BLACKROCK FUNDS | | JANUARY 31, 2013 | | |
| | |
Schedule of Investments January 31, 2013 (Unaudited) | | BlackRock Short-Term Treasury Fund (Percentages shown are based on Net Assets) |
| | | | | | | | |
| Money Market Funds — 0.0% | | Shares | | | Value | |
BlackRock Liquidity Funds, T-Fund, Institutional Class,
0.01% (a)(b) | | | 4,865 | | | $ | 4,865 | |
| | | | | | | | |
| | |
| U.S. Treasury Obligations | | Par
(000) | | | | |
U.S. Treasury Bills: (c) | | | | | | | | |
0.08%, 2/14/13 | | $ | 750 | | | | 749,996 | |
0.11%, 3/07/13 | | | 1,500 | | | | 1,499,937 | |
0.13%, 4/11/13 | | | 750 | | | | 749,928 | |
0.12%, 5/02/13 | | | 500 | | | | 499,913 | |
0.14%, 5/23/13 | | | 500 | | | | 499,877 | |
0.14%, 6/06/13 | | | 300 | | | | 299,917 | |
0.12%, 6/27/13 | | | 500 | | | | 499,828 | |
0.13%, 6/27/13 | | | 600 | | | | 599,793 | |
0.17%, 11/14/13 | | | 250 | | | | 249,767 | |
U.S. Treasury Notes: | | | | | | | | |
0.50%, 10/15/13 | | | 950 | | | | 952,375 | |
0.25%, 10/31/13 | | | 500 | | | | 500,351 | |
0.50%, 11/15/13 | | | 100 | | | | 100,266 | |
0.25%, 11/30/13 | | | 150 | | | | 150,111 | |
0.25%, 1/31/14 | | | 500 | | | | 500,391 | |
0.25%, 2/28/14 | | | 100 | | | | 100,070 | |
Total U.S. Treasury Obligations — 53.0% | | | | 7,952,520 | |
| | | | | | | | |
| | | | | | | | | |
Repurchase Agreements | | | | | | | | |
Credit Suisse Securities (USA) LLC, 0.13%, 2/01/13 (Purchased on 1/31/13 to be repurchased at $1,000,004, collateralized by U.S. Treasury Notes, 0.25% to 2.63% due from 2/28/14 to 11/15/20, aggregate par and fair value of $1,020,000 and $1,021,833, respectively) | | | 1,000 | | | | 1,000,000 | |
HSBC Securities (USA) Inc., 0.13%, 2/01/13 (Purchased on 1/31/13 to be repurchased at $1,013,004, collateralized by U.S. Treasury Note, 1.38% due at 1/31/20, par and fair value of $1,035,000 and $1,036,294, respectively) | | | 1,013 | | | | 1,013,000 | |
| | | | | | | | |
| Repurchase Agreements | | Par
(000) | | | Value | |
Merrill Lynch, Pierce, Fenner & Smith, Inc., 0.13%, 2/01/13 (Purchased on 1/31/13 to be repurchased at $1,000,004, collateralized by U.S. Treasury Note, 0.25% due at 3/31/17, par and fair value of $1,018,600 and $1,020,042, respectively) | | $ | 1,000 | | | $ | 1,000,000 | |
Mizuho Securities USA, 0.15%, 2/01/13
(Purchased on 1/31/13 to be repurchased at $2,000,008, collateralized by Fannie Mae Strip, 5.50% due at 10/31/13, par and fair value of $30,700,434 and $2,220,000, respectively) | | | 2,000 | | | | 2,000,000 | |
Morgan Stanley & Co. LLC, 0.14%, 2/01/13
(Purchased on 1/31/13 to be repurchased at $1,000,004, collateralized by U.S. Treasury Note, 1.00% due at 1/01/39, par and fair value of $1,004,100 and $1,020,044, respectively) | | | 1,000 | | | | 1,000,000 | |
RBS Securities Inc., 0.13%, 2/01/13
(Purchased on 1/31/13 to be repurchased at $1,000,004, collateralized by U.S. Treasury Note, 0.25% due at 3/31/17, par and fair value of $945,000 and $1,023,807, respectively) | | | 1,000 | | | | 1,000,000 | |
Total Repurchase Agreements — 46.8% | | | | | | | 7,013,000 | |
| Total Investments (Cost $14,969,298) — 99.8% | | | | 14,970,385 | |
| Other Assets Less Liabilities — 0.2% | | | | 30,669 | |
| | | | | | | | |
| Net Assets — 100.0% | | | $ | 15,001,054 | |
| | | | | | | | |
|
| Notes to Schedule of Investments |
| (a) | | Represents the current yield as of report date. |
| (b) | | Investments in issuers considered to be an affiliate of the Fund during the period ended January 31, 2013, for purposes of Section 2(a)(3) of the Investment Company Act of 1940, as amended, were as follows: |
| | | | | | | | | | | | |
| Affiliate | | Net
Activity
(Shares) | | | Shares at
January 31,
2013 | | | Income | |
BlackRock Liquidity Funds, T-Fund, Institutional Class | | | 4,865 | | | | 4,865 | | | $ | 19 | |
| (c) | | Rate shown reflects the discount rate at the time of purchase. |
| Ÿ | | Fair Value Measurements — Various inputs are used in determining the fair value of investments. These inputs to valuation techniques are categorized into a disclosure hierarchy consisting of three broad levels for financial statement purposes as follows: |
See Notes to Financial Statements.
| | | | | | |
| | | | | | | |
| | BLACKROCK FUNDS | | JANUARY 31, 2013 | | 11 |
| | |
| Schedule of Investments (concluded) | | BlackRock Short-Term Treasury Fund |
| Ÿ | | Level 1 — unadjusted price quotations in active markets/exchanges for identical assets and liabilities that the Fund has the ability to access |
| Ÿ | | Level 2 — other observable inputs (including, but not limited to, quoted prices for similar assets or liabilities in markets that are active, quoted prices for identical or similar assets or liabilities in markets that are not active, inputs other than quoted prices that are observable for the assets or liabilities (such as interest rates, yield curves, volatilities, prepayment speeds, loss severities, credit risks and default rates) or other market–corroborated inputs) |
| Ÿ | | Level 3 — unobservable inputs based on the best information available in the circumstances, to the extent observable inputs are not available (including the Fund’s own assumptions used in determining the fair value of investments) |
The hierarchy gives the highest priority to unadjusted quoted prices in active markets for identical assets or liabilities (Level 1 measurements) and the lowest priority to unobservable inputs (Level 3 measurements). Accordingly, the degree of judgment exercised in determining fair value is greatest for instruments categorized in Level 3. The inputs used to measure fair value may fall into different levels of the fair value hierarchy. In such cases, for disclosure purposes, the level in the fair value hierarchy within which the fair value measurement falls in its entirety is determined based on the lowest level input that is significant to the fair value measurement in its entirety.
Changes in valuation techniques may result in transfers into or out of an assigned level within the disclosure hierarchy. In accordance with the Fund’s policy, transfers between different levels of the fair value disclosure hierarchy are deemed to have occurred as of the beginning of the reporting period. The categorization of a value determined for investments is based on the pricing transparency of the investment and is not necessarily an indication of the risks associated with investing in those securities. For information about the Fund’s policy regarding valuation of investments and other significant accounting policies, please refer to Note 1 of the Notes to Financial Statements.
The following table summarizes the Fund’s investments categorized in the disclosure hierarchy as of January 31, 2013:
| | | | | | | | | | | | | | | | |
| | | Level 1 | | | Level 2 | | | Level 3 | | | Total | |
Assets: | | | | | | | | | | | | | | | | |
| Investments: | | | | | | | | | | | | | | | | |
Short-Term Securities1 | | $ | 4,865 | | | $ | 14,965,520 | | | | — | | | $ | 14,970,385 | |
| 1 | | See above Schedule of Investments for values in each security type. |
Certain of the Fund’s liabilities are held at carrying amount, which approximates fair value for financial statement purposes. As of January 31, 2013, bank overdraft of $3,329 is categorized as Level 2 within the disclosure hierarchy.
| | | | | | |
| See Notes to Financial Statements. | | | | |
| | | | | | | |
| 12 | | BLACKROCK FUNDS | | JANUARY 31, 2013 | | |
| | |
Schedule of Investments January 31, 2013 (Unaudited) | | BlackRock Ultra-Short Obligations Fund (Percentages shown are based on Net Assets) |
| | | | | | | | |
| Corporate Bonds | | Par
(000) | | | Value | |
Automobiles — 2.4% | | | | | | | | |
Volkswagen International Finance N.V.,
1.63%, 8/12/13 | | $ | 600 | | | $ | 603,498 | |
Commercial Banks — 13.7% | | | | | | | | |
ANZ New Zealand International Ltd.,
1.31%, 12/20/13 (a)(b) | | | 410 | | | | 413,308 | |
Australia & New Zealand Banking Group Ltd.,
1.05%, 1/10/14 (b) | | | 200 | | | | 201,204 | |
Commonwealth Bank of Australia,
1.01%, 8/07/13 (a)(b) | | | 400 | | | | 400,711 | |
Deutsche Bank A.G., 4.88%, 5/20/13 | | | 333 | | | | 337,337 | |
HSBC Bank Plc: | | | | | | | | |
0.96%, 8/12/13 (a)(b) | | | 300 | | | | 300,847 | |
2.00%, 1/19/14 (a) | | | 250 | | | | 252,419 | |
ING Bank N.V., 2.00%, 10/18/13 | | | 500 | | | | 504,565 | |
Nordea Bank AB, 1.75%, 10/04/13 (a) | | | 250 | | | | 252,031 | |
Royal Bank of Canada, 0.33%, 9/03/13 (b) | | | 750 | | | | 750,661 | |
| | | | | | | | 3,413,083 | |
Computers & Peripherals — 3.0% | | | | | | | | |
Hewlett-Packard Co., 0.59%, 5/24/13 (b) | | | 500 | | | | 499,049 | |
International Business Machines Corp.,
6.50%, 10/15/13 | | | 250 | | | | 260,720 | |
| | | | | | | | 759,769 | |
Diversified Financial Services — 5.2% | | | | | | | | |
American Express Credit Corp.,
5.88%, 5/02/13 | | | 350 | | | | 354,662 | |
American Honda Finance Corp.,
4.63%, 4/02/13 (a) | | | 250 | | | | 251,725 | |
General Electric Capital Corp.,
1.31%, 9/23/13 (b) | | | 410 | | | | 412,066 | |
Toyota Motor Credit Corp., 0.55%, 4/23/13 (b) | | | 275 | | | | 275,275 | |
| | | | | | | | 1,293,728 | |
Diversified Telecommunication Services — 1.5% | | | | | | | | |
Cellco Partnership/Verizon Wireless Capital LLC,
7.38%, 11/15/13 | | | 350 | | | | 367,852 | |
Total Long-Term Investments (Cost — $6,440,305) — 25.8% | | | | | | | 6,437,930 | |
| | | | | | | | |
| | | | | | | | | |
Short-Term Securities | | | | | | | | |
Certificates of Deposit | | | | | | | | |
Euro — 1.3% | | | | | | | | |
Skandinaviska Enskilda Banken AB, Stockholm,
0.37%, 4/05/13 | | | 325 | | | | 325,075 | |
Yankee — 22.8% (c) | | | | | | | | |
Bank of Nova Scotia, Houston,
0.55%, 7/30/13 (b) | | | 600 | | | | 600,879 | |
Credit Industriel et Commercial, New York, 0.45%, 3/07/13 | | | 250 | | | | 250,056 | |
Credit Suisse, New York, 0.69%, 12/06/13 | | | 250 | | | | 250,340 | |
National Australia Bank Ltd., New York,
0.98%, 8/06/13 (b) | | | 900 | | | | 903,260 | |
National Bank of Canada, New York,
0.38%, 3/01/13 | | | 500 | | | | 500,030 | |
| | | | | | | | |
| Certificates of Deposit | | Par (000) | | | Value | |
Yankee (concluded) (c) | | | | | | | | |
Rabobank Nederland, New York,
0.36%, 8/09/13 (b) | | $ | 500 | | | $ | 499,923 | |
Societe Generale, New York, 1.31%, 2/22/13 | | | 250 | | | | 250,019 | |
Sumitomo Mitsui Banking Corp., New York: | | | | | | | | |
0.80%, 4/11/13 | | | 300 | | | | 300,320 | |
0.79%, 7/17/13 | | | 700 | | | | 701,617 | |
Toronto Dominion Bank, New York,
0.33%, 11/07/13 | | | 500 | | | | 500,310 | |
UBS A.G., Stamford, 0.58%, 2/22/13 | | | 950 | | | | 950,296 | |
| | | | | | | | 5,707,050 | |
Total Certificates of Deposit — 24.1% | | | | | | | 6,032,125 | |
| | | | | | | | |
| | |
Commercial Paper | | | | | | | | |
Antalis US Funding Corp., 0.48%, 2/14/13 (d) | | | 750 | | | | 749,945 | |
Avery Dennison Corp., 0.40%, 2/19/13 (d) | | | 750 | | | | 749,890 | |
BNP Paribas Finance, Inc., 0.40%, 2/21/13 (d) | | | 750 | | | | 749,934 | |
BP Capital Market Plc, 0.45%, 8/06/13 (d) | | | 250 | | | | 249,727 | |
Ciesco LLC, 0.57%, 5/06/13 (d) | | | 250 | | | | 249,809 | |
Daimler Finance North America LLC,
0.95%, 11/05/13 (d) | | | 375 | | | | 373,034 | |
Erste Abwicklungsanstalt, 0.41%, 6/12/13 (d) | | | 300 | | | | 299,692 | |
Govco LLC: | | | | | | | | |
0.57%, 5/20/13 (d) | | | 250 | | | | 249,751 | |
0.50%, 6/27/13 (d) | | | 500 | | | | 499,232 | |
Kreditanstalt Fuer Wiederaufbau,
0.26%, 2/26/13 (d) | | | 280 | | | | 279,990 | |
LMA Americas LLC, 0.32%, 2/01/13 (d) | | | 650 | | | | 649,996 | |
Reckitt Benckiser TSY, 0.30%, 7/11/13 (d) | | | 500 | | | | 499,456 | |
Royal Park Investments Funding,
0.40%, 2/26/13 (d) | | | 250 | | | | 249,803 | |
Societe Generale North America, Inc.,
0.42%, 4/08/13 (d) | | | 500 | | | | 499,696 | |
Suncorp Metway Ltd., 0.37%, 2/27/13 (d) | | | 1,000 | | | | 999,860 | |
Tesco Treasury Services, 0.30%, 2/13/13 (d) | | | 750 | | | | 749,927 | |
Vodafone Group Plc, 0.73%, 1/02/14 (d) | | | 250 | | | | 248,259 | |
Westpac Banking Corp., 0.38%, 11/29/13 (b) | | | 500 | | | | 499,895 | |
Total Commercial Paper — 35.4% | | | | | | | 8,847,896 | |
| | | | | | | | |
| | |
Corporate Notes — 1.6% | | | | | | | | |
JPMorgan Chase Bank NA, 0.32%, 5/28/13 (b) | | | 400 | | | | 399,520 | |
| | | | | | | | |
| | |
U.S. Treasury Obligations — 1.2% | | | | | | | | |
U.S. Treasury Notes, 0.25%, 1/31/14 | | | 307 | | | | 307,240 | |
| | | | | | | | |
| | |
See Notes to Financial Statements.
| | | | | | |
| | | | | | | |
| | BLACKROCK FUNDS | | JANUARY 31, 2013 | | 13 |
| | |
Schedule of Investments (continued) | | BlackRock Ultra-Short Obligations Fund (Percentages shown are based on Net Assets) |
| | | | | | | | |
| Repurchase Agreements | | Par
(000) | | | Value | |
Barclays Capital, Inc., 0.85%, 5/28/13
(Purchased on 11/26/12 to be repurchased at $753,241, collateralized by various corporate/debt obligations, 3.64% to 12.50% due from 12/01/13 to 6/26/37, aggregate par and fair value of $977,519 and $894,302, respectively) | | $ | 750 | | | $ | 751,508 | |
Deutsche Bank Securities Inc., 0.50%, 2/07/13 (e)
(Purchased on 11/20/12 to be repurchased at $750,896, collateralized by various corporate/debt and U.S.municipal obligations, 0.00% to 10.55%due from 2/15/15 to 12/11/49,aggregate par and fair value of $33,092,396 and $886,653,respectively) | | | 750 | | | | 750,084 | |
JPMorgan Securities LLC, 0.61%, 2/19/13
(Purchased on 11/19/12 to be repurchased at $751,169, collateralized by various corporate/debt obligations, 0.30% to 5.81% due from 4/25/32 to 6/25/47, aggregate par and fair value of $5,065,025 and $940,839, respectively) | | | 750 | | | | 750,157 | |
| | | | | | | | |
| Repurchase Agreements | | Par
(000) | | | Value | |
Mizuho Securities USA, 0.76%, 2/01/13 (f)
(Purchased on 12/05/12 to be repurchased at $250,000, collateralized by various U.S. government sponsoredagency and corporate/debt obligations, 1.70% to 6.61% due from 2/25/36 to 1/25/42, aggregate par and fair value of $3,211,868 and $278,957, respectively) | | $ | 250 | | | $ | 250,000 | |
RBS Securities Inc., 1.10%, 3/06/13
(Purchased on 12/06/12 to be repurchased at $250,688, collateralized by various corporate/debt obligations, 0.00% to 7.15% due from 11/05/19 to 10/25/46, aggregate par and fair value of $54,705,991 and $310,702,respectively) | | | 250 | | | | 250,000 | |
Total Repurchase Agreements — 11.0% | | | | | | | 2,751,749 | |
Total Short-Term Securities (Cost — $18,331,923) — 73.3% | | | | 18,338,530 | |
| Total Investments (Cost $24,772,228) — 99.1% | | | | 24,776,460 | |
| Other Assets Less Liabilities — 0.9% | | | | | | | 227,905 | |
| | | | | | | | |
| Net Assets — 100.0% | | | | | | $ | 25,004,365 | |
| | | | | | | | |
|
| Notes to Schedule of Investments |
| (a) | | Security exempt from registration pursuant to Rule 144A under the Securities Act of 1933, as amended. These securities may be resold in transactions exempt from registration to qualified institutional investors. |
| (b) | | Variable rate security. Rate shown is as of report date. |
| (c) | | Issuer is a US branch of a foreign domiciled bank. |
| (d) | | Rate shown reflects the discount rate at the time of purchase. |
| (e) | | Rate shown is as of report date and maturity shown is the final maturity date or the date the principal owed can be recovered through demand. |
| (f) | | Variable rate security. Rate shown is as of report date and maturity shown is the date the principal owed can be recovered through demand. |
| Ÿ | | For Fund compliance purposes, the Fund’s industry classifications refer to any one or more of the industry sub-classifications used by one or more widely recognized market indexes or ratings group indexes and/or as defined by Fund management. These definitions may not apply for purposes of this report, which may combine industry sub-classifications for reporting ease. |
| Ÿ | | Fair Value Measurements — Various inputs are used in determining the fair value of investments. These inputs to valuation techniques are categorized into a disclosure hierarchy consisting of three broad levels for financial statement purposes as follows: |
| Ÿ | | Level 1 — unadjusted price quotations in active markets/exchanges for identical assets and liabilities that the Fund has the ability to access |
| Ÿ | | Level 2 — other observable inputs (including, but not limited to, quoted prices for similar assets or liabilities in markets that are active, quoted prices for identical or similar assets or liabilities in markets that are not active, inputs other than quoted prices that are observable for the assets or liabilities (such as interest rates, yield curves, volatilities, prepayment speeds, loss severities, credit risks and default rates) or other market–corroborated inputs) |
| Ÿ | | Level 3 — unobservable inputs based on the best information available in the circumstances, to the extent observable inputs are not available (including the Fund’s own assumptions used in determining the fair value of investments) |
The hierarchy gives the highest priority to unadjusted quoted prices in active markets for identical assets or liabilities (Level 1 measurements) and the lowest priority to unobservable inputs (Level 3 measurements). Accordingly, the degree of judgment exercised in determining fair value is greatest for instruments categorized in Level 3. The inputs used to measure fair value may fall into different levels of the fair value hierarchy. In such cases, for disclosure purposes, the level in the fair value hierarchy within which the fair value measurement falls in its entirety is determined based on the lowest level input that is significant to the fair value measurement in its entirety.
See Notes to Financial Statements.
| | | | | | |
| | | | | | | |
| 14 | | BLACKROCK FUNDS | | JANUARY 31, 2013 | | |
| | |
| Schedule of Investments (concluded) | | BlackRock Ultra-Short Obligations Fund |
Changes in valuation techniques may result in transfers into or out of an assigned level within the disclosure hierarchy. In accordance with the Fund’s policy, transfers between different levels of the fair value disclosure hierarchy are deemed to have occurred as of the beginning of the reporting period. The categorization of a value determined for investments is based on the pricing transparency of the investment and is not necessarily an indication of the risks associated with investing in those securities. For information about the Fund’s policy regarding valuation of investments and other significant accounting policies, please refer to Note 1 of the Notes to Financial Statements.
The following table summarizes the Fund’s investments categorized in the disclosure hierarchy as of January 31, 2013:
| | | | | | | | | | | | | | | | |
| | | Level 1 | | | Level 2 | | | Level 3 | | | Total | |
Assets: | | | | | | | | | | | | | | | | |
| Investments:1 | | | | | | | | | | | | | | | | |
Long-Term Investments | | | — | | | $ | 6,437,930 | | | | — | | | $ | 6,437,930 | |
Short-Term Securities | | | — | | | | 18,338,530 | | | | — | | | | 18,338,530 | |
| |
Total | | | — | | | $ | 24,776,460 | | | | — | | | $ | 24,776,460 | |
| | | | |
| 1 | | See above Schedule of Investments for values in each security type. |
Certain of the Fund’s assets are held at carrying amount, which approximates fair value for financial statement purposes. As of January 31, 2013, cash of $164,445 is categorized as Level 1 within the disclosure hierarchy.
| | | | | | |
| See Notes to Financial Statements. | | | | |
| | | | | | | |
| | BLACKROCK FUNDS | | JANUARY 31, 2013 | | 15 |
| | |
| Statements of Assets and Liabilities | | |
| | | | | | | | | | | | |
| January 31, 2013 (Unaudited) | | BlackRock Short
Obligations Fund | | | BlackRock
Short-Term
Treasury Fund | | | BlackRock Ultra-Short
Obligations Fund | |
| | | | | | | | | | | | |
| Assets | | | | | | | | | | | | |
Investments at value — unaffiliated1 | | $ | 22,870,050 | | | $ | 7,952,520 | | | $ | 22,024,711 | |
Investments at value — affiliated2 | | | — | | | | 4,865 | | | | — | |
Repurchase agreements at value3 | | | 2,251,508 | | | | 7,013,000 | | | | 2,751,749 | |
Cash | | | 38,424 | | | | — | | | | 164,445 | |
Interest receivable | | | 88,698 | | | | 2,058 | | | | 51,868 | |
Deferred offering costs | | | 60,951 | | | | 77,889 | | | | 60,074 | |
Receivable from Manager | | | 19,914 | | | | 19,149 | | | | 19,822 | |
Prepaid expenses | | | 501 | | | | 471 | | | | 500 | |
| | | | |
Total assets | | | 25,330,046 | | | | 15,069,952 | | | | 25,073,169 | |
| | | | |
| | | | | | | | | | | | |
| Liabilities | | | | | | | | | | | | |
Bank overdraft | | | — | | | | 3,329 | | | | — | |
Investments purchased payable | | | 250,000 | | | | — | | | | — | |
Offering costs payable | | | 49,515 | | | | 51,978 | | | | 48,405 | |
Professional fees payable | | | 10,135 | | | | 10,135 | | | | 10,135 | |
Income dividends payable | | | 9,036 | | | | 127 | | | | 6,783 | |
Printing fees payable | | | 1,155 | | | | 1,338 | | | | 1,155 | |
Officer’s and Trustees’ fees payable | | | 885 | | | | 792 | | | | 885 | |
Other affiliates payable | | | 263 | | | | 158 | | | | 264 | |
Other accrued expenses payable | | | 1,188 | | | | 1,041 | | | | 1,177 | |
| | | | |
Total liabilities | | | 322,177 | | | | 68,898 | | | | 68,804 | |
| | | | |
Net Assets | | $ | 25,007,869 | | | $ | 15,001,054 | | | $ | 25,004,365 | |
| | | | |
| | | | | | | | | | | | |
| Net Assets Consist of | | | | | | | | | | | | |
Paid-in capital | | $ | 25,000,000 | | | $ | 15,000,000 | | | $ | 25,000,000 | |
Distributions in excess of net investment income | | | (50 | ) | | | (33 | ) | | | (51 | ) |
Accumulated net realized gain | | | 905 | | | | — | | | | 185 | |
Net unrealized appreciation/depreciation | | | 7,014 | | | | 1,087 | | | | 4,231 | |
| | | | |
| Net Assets | | $ | 25,007,869 | | | $ | 15,001,054 | | | $ | 25,004,365 | |
| | | | |
1 Investments at cost — unaffiliated | | $ | 22,863,036 | | | $ | 7,951,433 | | | $ | 22,020,479 | |
2 Investments at cost — affiliated | | | — | | | $ | 4,865 | | | | — | |
3 Repurchase agreements at cost | | $ | 2,251,508 | | | $ | 7,013,000 | | | | 2,751,749 | |
| | | | | | |
| See Notes to Financial Statements. | | | | |
| | | | | | | |
| 16 | | BLACKROCK FUNDS | | JANUARY 31, 2013 | | |
| | |
| Statements of Assets and Liabilities (concluded) | | |
| | | | | | | | | | | | |
| January 31, 2013 (Unaudited) | | BlackRock Short
Obligations Fund | | | BlackRock
Short-Term
Treasury Fund | | | BlackRock Ultra-Short
Obligations Fund | |
| | | | | | | | | | | | |
| Net Asset Value | | | | | | | | | | | | |
| Institutional Daily | | | | | | | | | | | | |
Net assets | | | — | | | $ | 15,001,054 | | | | — | |
| | | | |
Shares outstanding4 | | | — | | | | 1,500,000 | | | | — | |
| | | | |
Net asset value | | | — | | | $ | 10.00 | | | | — | |
| | | | |
| BlackRock | | | | | | | | | | | | |
Net assets | | $ | 25,007,869 | | | | — | | | $ | 25,004,365 | |
| | | | |
Shares outstanding4 | | | 2,500,000 | | | | — | | | | 2,500,000 | |
| | | | |
Net asset value | | $ | 10.00 | | | | — | | | $ | 10.00 | |
| | | | |
| | 4 | | Unlimited number of shares authorized, $0.001 par value. |
| | | | | | |
| See Notes to Financial Statements. | | | | |
| | | | | | | |
| | BLACKROCK FUNDS | | JANUARY 31, 2013 | | 17 |
| | | | | | | | | | | | |
| Period November 15, 20121 to January 31, 2013 (Unaudited) | | BlackRock Short Obligations Fund | | | BlackRock Short-Term Treasury Fund | | | BlackRock Ultra-Short Obligations Fund | |
| | | | | | | | | | | | |
| Investment Income | | | | | | | | | | | | |
Interest — unaffiliated | | $ | 26,184 | | | $ | 4,740 | | | $ | 22,784 | |
Interest — affiliated | | | — | | | | 19 | | | | — | |
| | | | |
Total Income | | | 26,184 | | | | 4,759 | | | | 22,784 | |
| | | | |
| | | | | | | | | | | | |
| Expenses | | | | | | | | | | | | |
Investment advisory | | | 13,184 | | | | 7,911 | | | | 13,187 | |
Organization and offering | | | 21,545 | | | | 28,296 | | | | 22,226 | |
Professional | | | 10,135 | | | | 10,135 | | | | 10,135 | |
Administration | | | 3,955 | | | | 2,373 | | | | 3,956 | |
Administration — Institutional Daily | | | — | | | | 791 | | | | — | |
Administration — BlackRock | | | 1,318 | | | | — | | | | 1,319 | |
Printing | | | 1,155 | | | | 1,338 | | | | 1,155 | |
Officer and Trustees | | | 1,084 | | | | 926 | | | | 1,084 | |
Custodian | | | 571 | | | | 389 | | | | 572 | |
Transfer agent — Institutional Daily | | | — | | | | 8 | | | | — | |
Transfer agent — BlackRock | | | 8 | | | | — | | | | 8 | |
Miscellaneous | | | 1,049 | | | | 1,078 | | | | 1,049 | |
| | | | |
Total expenses | | | 54,004 | | | | 53,245 | | | | 54,691 | |
Less fees waived by Manager | | | (13,184 | ) | | | (7,911 | ) | | | (13,187 | ) |
Less administration fees waived | | | (3,955 | ) | | | (2,373 | ) | | | (3,956 | ) |
Less administration fees waived — Institutional Daily | | | — | | | | (791 | ) | | | — | |
Less administration fees waived — BlackRock | | | (1,318 | ) | | | — | | | | (1,319 | ) |
Less transfer agent fees reimbursed — Institutional Daily | | | — | | | | (8 | ) | | | — | |
Less transfer agent fees reimbursed — BlackRock | | | (8 | ) | | | — | | | | (8 | ) |
Less expenses reimbursed by Manager | | | (25,168 | ) | | | (37,686 | ) | | | (27,273 | ) |
| | | | |
Total expenses after fees waived and reimbursed | | | 10,371 | | | | 4,476 | | | | 8,948 | |
| | | | |
Net investment income | | | 15,813 | | | | 283 | | | | 13,836 | |
| | | | |
| | | | | | | | | | | | |
| Realized and Unrealized Gain | | | | | | | | | | | | |
Net realized gain from investments | | | 905 | | | | — | | | | 185 | |
Net change in unrealized appreciation/depreciation | | | 7,014 | | | | 1,087 | | | | 4,231 | |
| | | | |
Net realized and unrealized gain | | | 7,919 | | | | 1,087 | | | | 4,416 | |
| | | | |
Net Increase in Net Assets Resulting from Operations | | $ | 23,732 | | | $ | 1,370 | | | $ | 18,252 | |
| | | | |
| | 1 | | Commencement of operations. |
| | | | | | |
| See Notes to Financial Statements. | | | | |
| | | | | | | |
| 18 | | BLACKROCK FUNDS | | JANUARY 31, 2013 | | |
| | |
| Statements of Changes in Net Assets | | |
| | | | | | | | | | | | |
| | | BlackRock
Short
Obligations
Fund | | | BlackRock
Short-Term
Treasury
Fund | | | BlackRock
Ultra-Short
Obligations
Fund | |
| Increase (Decrease) in Net Assets: | | Period
November 15, 20121 to January 31, 2013
(Unaudited) | | | Period
November 15, 20121
to January 31, 2013
(Unaudited) | | | Period
November 15, 20121
to January 31, 2013
(Unaudited) | |
| | | | | | | | | | | | |
| Operations | | | | | | | | | | | | |
Net investment income | | $ | 15,813 | | | $ | 283 | | | $ | 13,836 | |
Net realized gain | | | 905 | | | | — | | | | 185 | |
Net change in unrealized appreciation/depreciation | | | 7,014 | | | | 1,087 | | | | 4,231 | |
| | | | |
Net increase in net assets resulting from operations | | | 23,732 | | | | 1,370 | | | | 18,252 | |
| | | | |
| | | | | | | | | | | | |
| Dividends to Shareholders From | | | | | | | | | | | | |
Net investment income: | | | | | | | | | | | | |
Institutional Daily | | | — | | | | (316 | ) | | | — | |
BlackRock | | | (15,863 | ) | | | — | | | | (13,887 | ) |
| | | | |
Decrease in net assets resulting from dividends to shareholders | | | (15,863 | ) | | | (316 | ) | | | (13,887 | ) |
| | | | |
| | | | | | | | | | | | |
| Capital Share Transactions | | | | | | | | | | | | |
Net increase in net assets derived from capital share transactions | | | 25,000,000 | | | | 15,000,000 | | | | 25,000,000 | |
| | | | |
| | | | | | | | | | | | |
| Net Assets | | | | | | | | | | | | |
Total increase in net assets | | | 25,007,869 | | | | 15,001,054 | | | | 25,004,365 | |
Beginning of period | | | — | | | | — | | | | — | |
| | | | |
End of period | | $ | 25,007,869 | | | $ | 15,001,054 | | | $ | 25,004,365 | |
| | | | |
Distributions in excess of net investment income | | $ | (50 | ) | | $ | (33 | ) | | $ | (51 | ) |
| | | | |
| | 1 | | Commencement of operations. |
| | | | | | |
| See Notes to Financial Statements. | | | | |
| | | | | | | |
| | BLACKROCK FUNDS | | JANUARY 31, 2013 | | 19 |
| | |
| Financial Highlights | | BlackRock Short Obligations Fund |
| | | | |
| | | BlackRock | |
| | | Period
November 15, 20121
to January 31, 2013
(Unaudited) | |
| | | | |
| Per Share Operating Performance | | | | |
Net asset value, beginning of period | | $ | 10.00 | |
| | | | |
Net investment income2 | | | 0.01 | |
Net realized and unrealized gain | | | 0.00 | 3 |
| | | | |
Net increase from investment operations | | | 0.01 | |
| | | | |
Dividends from net investment income | | | (0.01 | ) |
| | | | |
Net asset value, end of period | | $ | 10.00 | |
| | | | |
| | | | |
| Total Investment Return4 | | | | |
Based on net asset value | | | 0.06% | 5 |
| | | | |
| | | | |
| Ratios to Average Net Assets6 | | | | |
Total expenses7 | | | 0.95% | |
| | | | |
Total expenses after fees waived and reimbursed | | | 0.20% | |
| | | | |
Net investment income | | | 0.30% | |
| | | | |
| | | | |
| Supplemental Data | | | | |
Net assets, end of period (000) | | $ | 25,008 | |
| | | | |
Portfolio turnover | | | 13% | |
| | | | |
| | 1 | | Commencement of operations. |
| | 2 | | Based on average shares outstanding. |
| | 3 | | Amount is less than $0.005 per share. |
| | 4 | | Where applicable, total investment returns include the reinvestment of dividends and distributions. |
| | 5 | | Aggregate total investment return. |
| | 7 | | Organization costs were not annualized in the calculation of the expense ratio. If these expenses were annualized, the total expenses for BlackRock Shares would have been 1.02%. |
| | | | | | |
| See Notes to Financial Statements. | | | | |
| | | | | | | |
| 20 | | BLACKROCK FUNDS | | JANUARY 31,2013 | | |
| | |
| Financial Highlights | | BlackRock Short-Term Treasury Fund |
| | | | |
| | | Institutional Daily | |
| | | Period
November 15, 20121
to January 31, 2013
(Unaudited) | |
| | | | |
| Per Share Operating Performance | | | | |
Net asset value, beginning of period | | $ | 10.00 | |
| | | | |
Net investment income2 | | | 0.00 | 3 |
Net realized and unrealized gain | | | 0.00 | 3 |
| | | | |
Net increase from investment operations | | | 0.00 | 3 |
| | | | |
Dividends from net investment income | | | (0.00 | )4 |
| | | | |
Net asset value, end of period | | $ | 10.00 | |
| | | | |
| | | | |
| Total Investment Return5 | | | | |
Based on net asset value | | | 0.00 | %6 |
| | | | |
| | | | |
| Ratios to Average Net Assets7 | | | | |
Total expenses8 | | | 1.50 | % |
| | | | |
Total expenses after fees waived and reimbursed | | | 0.14 | % |
| | | | |
Net investment income | | | 0.01 | % |
| | | | |
| | | | |
| Supplemental Data | | | | |
Net assets, end of period (000) | | $ | 15,001 | |
| | | | |
Portfolio turnover | | | 0 | % |
| | | | |
| | 1 | | Commencement of operations. |
| | 2 | | Based on average shares outstanding. |
| | 3 | | Amount is less than $0.005 per share. |
| | 4 | | Amount is greater than $(0.005) per share. |
| | 5 | | Where applicable, total investment returns include the reinvestment of dividends and distributions. |
| | 6 | | Aggregate total investment return. |
| | 8 | | Organization costs were not annualized in the calculation of the expense ratio. If these expenses were annualized, the total expenses for Institutional Daily Shares would have been 1.68%. |
| | | | | | |
| See Notes to Financial Statements. | | | | |
| | | | | | | |
| | BLACKROCK FUNDS | | JANUARY 31, 2013 | | 21 |
| | |
| Financial Highlights | | BlackRock Ultra-Short Obligations Fund |
| | | | |
| | | BlackRock | |
| | | Period
November 15, 20121
to January 31, 2013 (Unaudited) | |
| | | | |
| Per Share Operating Performance | | | | |
Net asset value, beginning of period | | $ | 10.00 | |
| | | | |
Net investment income2 | | | 0.01 | |
Net realized and unrealized gain | | | 0.00 | 3 |
| | | | |
Net increase from investment operations | | | 0.01 | |
| | | | |
Dividends from net investment income | | | (0.01 | ) |
| | | | |
Net asset value, end of period | | $ | 10.00 | |
| | | | |
| | | | |
| Total Investment Return4 | | | | |
Based on net asset value | | | 0.06 | %5 |
| | | | |
| | | | |
| Ratios to Average Net Assets6 | | | | |
Total expenses7 | | | 0.94 | % |
| | | | |
Total expenses after fees waived and reimbursed | | | 0.17 | % |
| | | | |
Net investment income | | | 0.26 | % |
| | | | |
| | | | |
| Supplemental Data | | | | |
Net assets, end of period (000) | | $ | 25,004 | |
| | | | |
Portfolio turnover | | | 38 | % |
| | | | |
| | 1 | | Commencement of operations. |
| | 2 | | Based on average shares outstanding. |
| | 3 | | Amount is less than $0.005 per share. |
| | 4 | | Where applicable, total investment returns include the reinvestment of dividends and distributions. |
| | 5 | | Aggregate total investment return. |
| | 7 | | Organization costs were not annualized in the calculation of the expense ratio. If these expenses were annualized, the total expenses for BlackRock Shares would have been 1.04%. |
| | | | | | |
| See Notes to Financial Statements. | | | | |
| | | | | | | |
| 22 | | BLACKROCK FUNDS | | JANUARY 31, 2013 | | |
| | |
| Notes to Financial Statements (Unaudited) | | |
1. Organization and Significant Accounting Policies:
BlackRock FundsSM (the “Trust”), is registered under the Investment Company Act of 1940, as amended (the “1940 Act”), as an open-end management investment company. The Trust is organized as a Massa-chusetts business trust. BlackRock Short Obligations Fund (“Short Obligations”), BlackRock Short-Term Treasury Fund (“Short-Term Treasury”) and BlackRock Ultra-Short Obligations Fund (“Ultra-Short Obligations”) (collectively, the “Funds” or individually, a “Fund”) are each a series of the Trust. Each of the Funds is classified as diversified. The Funds’ financial statements are prepared in conformity with accounting principles generally accepted in the United States of America (“US GAAP”), which may require management to make estimates and assumptions that affect the reported amounts of assets and liabilities in the financial statements and the reported amounts of increases and decreases in net assets from operations during the reporting period. Actual results may differ from these estimates. Each Fund commenced operations on November 15, 2012. Short-Term Treasury offers separate classes of shares. Short-Term Treasury’s Institutional and Institutional Daily Shares have equal voting, dividend, liquidation and other rights, except that only shares of the respective classes are entitled to vote on matters concerning only that class. As of the report date there were no Institutional Shares outstanding.
The following is a summary of significant accounting policies followed by the Funds:
Valuation: US GAAP defines fair value as the price the Funds would receive to sell an asset or pay to transfer a liability in an orderly transaction between market participants at the measurement date. The Funds determine the fair value of their financial instruments at market value using independent dealers or pricing services under policies approved by the Board of Trustees of the Trust (the “Board”). The BlackRock Global Valuation Methodologies Committee (the “Global Valuation Committee”) is the committee formed by management to develop global pricing policies and procedures and to provide oversight of the pricing function for the Funds for all financial instruments.
The Funds value their bond investments on the basis of last available bid prices or current market quotations provided by dealers or pricing services. In determining the value of a particular investment, pricing services may use certain information with respect to transactions in such investments, quotations from dealers, pricing matrixes, market transactions in comparable investments, various relationships observed in the market between investments and calculated yield measures. Investments in open-end registered investment companies are valued at net asset value (“NAV”) each business day. Short-term securities with remaining maturities of 60 days or less may be valued at amortized cost, which approximates fair value.
In the event that application of these methods of valuation results in a price for an investment that is deemed not to be representative of the market value of such investment, or if a price is not available, the invest-
ment will be valued by the Global Valuation Committee, or its delegate, in accordance with a policy approved by the Board as reflecting fair value (“Fair Value Assets”). When determining the price for Fair Value Assets, the Global Valuation Committee, or its delegate, seeks to determine the price that each Fund might reasonably expect to receive from the current sale of that asset in an arm’s-length transaction. Fair value determinations shall be based upon all available factors that the Global Valuation Committee, or its delegate, deem relevant consistent with the principles of fair value measurement which include the market approach, income approach and/or in the case of recent investments, the cost approach, as appropriate. A market approach generally consists of using comparable market transactions. The income approach generally is used to discount future cash flows to present value and adjusted for liquidity as appropriate. These factors include but are not limited to (i) attributes specific to the investment or asset; (ii) the principal market for the investment or asset; (iii) the customary participants in the principal market for the investment or asset; (iv) data assumptions by market participants for the investment or asset, if reasonably available; (v) quoted prices for similar investments or assets in active markets; and (vi) other factors, such as future cash flows, interest rates, yield curves, volatilities, prepayment speeds, loss severities, credit risks, recovery rates, liquidation amounts and/or default rates. Due to the inherent uncertainty of valuations of such investments, the fair values may differ from the values that would have been used had an active market existed. The Global Valuation Committee, or its delegate, employs various methods for calibrating valuation approaches for investments where an active market does not exist, including regular due diligence of the Funds’ pricing vendors, a regular review of key inputs and assumptions, transactional back-testing or disposition analysis to compare unrealized gains and losses to realized gains and losses, reviews of missing or stale prices and large movements in market values and reviews of any market related activity. The pricing of all Fair Value Assets is subsequently reported to the Board or a committee thereof on a quarterly basis.
Repurchase Agreements: The Funds may invest in repurchase agreements. In a repurchase agreement, the Funds purchase a security from a counterparty who agrees to repurchase the same security at a mutually agreed upon date and price. On a daily basis, the counterparty is required to maintain collateral subject to the agreement and in value no less than the agreed repurchase amount. The agreements are conditioned upon the collateral being deposited under the Federal Reserve book entry system or held in a segregated account by the Funds’ custodian or designated sub-custodians under tri-party repurchase agreements. In the event the counterparty defaults and the fair value of the collateral declines, the Funds could experience losses, delays and costs in liquidating the collateral.
Investment Transactions and Investment Income: For financial reporting purposes, investment transactions are recorded on the dates the transactions are entered into (the trade dates). Realized gains and losses on investment transactions are determined on the identified cost basis. Interest income, including amortization and accretion of premium and discount on debt securities, is recognized on the accrual basis. Income
| | | | | | |
| | | | | | | |
| | BLACKROCK FUNDS | | JANUARY 31, 2013 | | 23 |
| | |
| Notes to Financial Statements (continued) | | |
and realized and unrealized gains and losses are allocated daily to each class based on its relative net assets.
Dividends and Distributions: Dividends from net investment income are declared daily and paid monthly. Distributions of capital gains are recorded on the ex-dividend dates. The portion of distributions that exceeds a Fund’s current and accumulated earnings and profits, which are measured on a tax basis, will constitute a nontaxable return of capital. Distributions in excess of a Fund’s taxable income and net capital gains, but not in excess of a Fund’s earnings and profits, will be taxable to shareholders as ordinary income and will not constitute a nontaxable return of capital. The character and timing of dividends and distributions are determined in accordance with federal income tax regulations, which may differ from US GAAP.
Income Taxes: It is each Fund’s policy to comply with the requirements of the Internal Revenue Code of 1986, as amended, applicable to regulated investment companies and to distribute substantially all of their taxable income to its shareholders. Therefore, no federal income tax provision is required.
Each Fund files US federal and various state and local tax returns. Management does not believe there are any uncertain tax positions that require recognition of a tax liability.
Recent Accounting Standards: In December 2011, the Financial Accounting Standard Board (the “FASB”) issued guidance that will expand current disclosure requirements on the offsetting of certain assets and liabilities. The new disclosures will be required for investments and derivative financial instruments subject to master netting or similar agreements which are eligible for offset in the Statements of Assets and Liabilities and will require an entity to disclose both gross and net information about such investments and transactions in the financial statements. In January 2013, the FASB issued guidance that clarifies which investments and transactions are subject to the offsetting disclosure requirements. The scope of the disclosure requirements for offsetting will be limited to derivative instruments, repurchase agreements and reverse repurchase agreements, and securities borrowing and securities lending transactions. The guidance is effective for financial statements with fiscal years beginning on or after January 1, 2013, and interim periods within those fiscal years. Management is evaluating the impact of this guidance on the Funds’ financial statement disclosures.
Organization and Offering Costs: Upon commencement of operations, organization costs associated with the establishment of the Funds were expensed by the Funds and reimbursed by the Manager. The Manager reimbursed Short Obligations, Short-Term Treasury and Ultra-Short Obligations $5,249, $7,472 and $6,165, respectively, which are included in expenses reimbursed by Manager in the Statements of Operations. Offering costs are amortized over a 12-month period beginning with the commencement of operations.
Other: Expenses directly related to a Fund or its classes are charged to that Fund or class. Other operating expenses shared by several funds are pro rated among those funds on the basis of relative net assets or other appropriate methods. Expenses directly related to the Funds and other shared expenses pro rated to the Funds are allocated daily to each class based on its relative net assets or other appropriate methods.
The Funds have an arrangement with the custodian whereby fees may be reduced by credits earned on uninvested cash balances, which, if applicable, are shown as fees paid indirectly in the Statements of Operations. The custodian imposes fees on overdrawn cash balances, which can be offset by accumulated credits earned or may result in additional custody charges.
2. Investment Advisory Agreement and Other Transactions with Affiliates:
The PNC Financial Services Group, Inc. (“PNC”) is the largest stockholder and an affiliate, for 1940 Act purposes, of BlackRock, Inc. (“BlackRock”).
The Trust, on behalf of the Funds, entered into an Investment Advisory Agreement with the Manager, the Funds’ investment advisor, an indirect, wholly owned subsidiary of BlackRock, to provide investment advisory and administration services. The Manager is responsible for the management of each Fund’s portfolio and provides the necessary personnel, facilities, equipment and certain other services necessary to the operations of each Fund. For such services, each Fund pays the Manager a monthly fee based on a percentage of each Fund’s average daily net assets as follows:
| | | | |
| Average Daily Net Assets | | Investment Advisory Fee | |
First $1 billion | | | 0.250 | % |
$1 billion - $3 billion | | | 0.240 | % |
$3 billion - $5 billion | | | 0.230 | % |
$5 billion - $10 billion | | | 0.220 | % |
Greater than $10 billion | | | 0.210 | % |
The Manager voluntarily agreed to waive its investment advisory fees by the amount of investment advisory fees each Fund pays to the Manager indirectly through its investment in affiliated money market funds. However, the Manager does not waive its investment advisory fees by the amount of investment advisory fees paid in connection with each Fund’s investment in other affiliated investment companies, if any. These amounts are included in fees waived by Manager in the Statements of Operations. For the period ended January 31, 2013, the Manager waived $148, $76 and $130 for Short Obligations, Short-Term Treasury and Ultra-Short Obligations, respectively.
Pursuant to written agreements, certain financial intermediaries, some of which may be affiliates, provide the Funds with sub-accounting, recordkeeping, sub-transfer agency and other administrative services with respect to sub-accounts they service. For these services, these entities receive an asset based fee or an annual fee per shareholder account, which will vary depending on share class and/or net assets.
| | | | | | |
| | | | | | | |
| 24 | | BLACKROCK FUNDS | | JANUARY 31, 2013 | | |
| | |
| Notes to Financial Statements (continued) | | |
The Manager maintains a call center, which is responsible for providing certain shareholder services to the Funds, such as responding to shareholder inquiries and processing transactions based upon instructions from shareholders with respect to the subscription and redemption of Fund shares.
BNY Mellon Investment Servicing (US) Inc. (“BNYMIS”) and the Manager act as co-administrators for the Funds. For these services, the co-administrators receive a combined administration fee computed daily and payable monthly, based on a percentage of the average daily net assets of each Fund. The combined administration fee is paid at the following annual rates:
| | | | |
| Average Daily Net Assets | | Administration Fee | |
First $500 million | | | 0.075 | % |
$500 million - $1 billion | | | 0.065 | % |
Greater than $1 billion | | | 0.055 | % |
In addition, each of the share classes is charged an administration fee
based on the following percentages of average daily net assets of each respective class:
| | | | |
| Average Daily Net Assets | | Administration Fee — Class Specific | |
First $500 million | | | 0.025 | % |
$500 million - $1 billion | | | 0.015 | % |
Greater than $1 billion | | | 0.005 | % |
In addition, BNYMIS and the Manager may have, at their discretion, voluntarily waived all or any portion of their administration fees for a Fund or a share class which are included in administration fees waived and administration fees waived – class specific in the Statements of Operations. For the period ended January 31, 2013, the Funds paid the following to the Manager in return for these services, which are included in administration, administration — class specific, administration fees waived and administration fees waived — class specific in the Statements of Operations:
| | | | |
| Administration Fees | | | |
Short Obligations | | $ | 2,570 | |
Short-Term Treasury | | $ | 1,310 | |
Ultra-Short Obligations | | $ | 2,571 | |
The Manager contractually or voluntarily agreed to waive and/or reimburse fees or expenses, excluding interest expense, dividend expense, income tax expense, acquired fund fees and expenses and certain other fund expenses, which constitute extraordinary expenses not incurred in the ordinary course of business, in order to limit expenses. The expense limitations as a percentage of average daily net assets are as follows:
| | | | | | | | | | | | | | | | | | | | |
| | | Short Obligations | | | Short-Term Treasury | | | Ultra-Short Obligations | |
| | | Contractual1 | | | Voluntary2,3 | | | Contractual1 | | | Contractual1 | | | Voluntary2,4 | |
Institutional5 | | | — | | | | — | | | | 0.20 | % | | | — | | | | — | |
Institutional Daily | | | — | | | | — | | | | 0.20 | % | | | — | | | | — | |
BlackRock | | | 0.30 | % | | | 0.10 | % | | | — | | | | 0.25 | % | | | 0.10 | % |
| 1 | | The Manager has agreed not to reduce or discontinue this contractual waiver or reimbursement prior to December 1, 2013 unless approved by the Board, including a majority of the independent trustees. |
| 2 | | The voluntary waiver or reimbursement may be reduced or discontinued at any time without notice. |
| 3 | | Prior to December 17, 2012, Short Obligations had a voluntary expense cap of 0.25% and from December 17, 2012 to January 22, 2013 a voluntary expense cap of 0.18%. |
| 4 | | Prior to January 22, 2013, Ultra-Short Obligations had a voluntary expense cap of 0.18%. |
| 5 | | There were no shares outstanding as of January 31, 2013. |
The Manager voluntarily agreed to waive and/or reimburse fees and/or expenses to enable Short-Term Treasury to maintain minimum levels of daily net investment income. These amounts are reported in the Statements of Operations as fees waived by Manager. The Manager may discontinue the waiver or reimbursement at any time.
These amounts waived or reimbursed are included in fees waived by Manager and expenses reimbursed by Manager, and shown as administration fees waived — class specific, and transfer agent fees reimbursed — class specific and expenses reimbursed, respectively, in the Statements of Operations. For the period ended January 31, 2013, the Manager waived $13,036, $7,835 and $13,057 of investment advisory fees for Short Obligations, Short-Term Treasury and Ultra-Short Obligations,
respectively, which are included in fees waived by Manager. The Manager reimbursed expenses of $19,919, $30,214 and $21,108 Short Obligations, Short-Term Treasury and Ultra-Short Obligations, respectively, which are included in expenses reimbursed by Manager.
If during a Fund’s fiscal year the operating expenses of a share class, that at any time during the prior two fiscal years received a waiver or reimbursement from the Manager, are less than the expense limit for that share class, the Manager is entitled to be reimbursed by such share class up to the lesser of (a) the amount of fees waived or expenses reimbursed during those prior two fiscal years under the agreement and (b) the amount by which the expense limit for that share class exceeds the operating expenses of the share class for the current fiscal year,
| | | | | | |
| | | | | | | |
| | | BLACKROCK FUNDS | | JANUARY 31, 2013 | | 25 |
| | |
| Notes to Financial Statements (continued) | | |
provided that: (1) the Fund of which the share class is a part has more than $50 million in assets for the fiscal year and (2) the Manager or an affiliate continues to serve as the Fund’s investment advisor or administrator. In the event the expense limit for a share class is changed subsequent to a fiscal year in which the Manager becomes entitled to reimbursement for fees waived or reimbursed, the amount available to reimburse the Manager shall be calculated by reference to the expense limit for that share class in effect at the time the Manager became entitled to receive such reimbursement, rather than the subsequently changed expense limit for that share class.
On January 31, 2013, the Fund level and class specific waivers and/or reimbursements subject to possible future recoupment under the expense limitation agreement are as follows:
| | | | |
| | | Expiring July 31, | |
| | | | 2015 | |
Short Obligations | | | | |
Fund Level | | $ | 26,160 | |
BlackRock | | $ | 1,326 | |
Short-Term Treasury | | | | |
Fund Level | | $ | 38,603 | |
Institutional Daily | | $ | 799 | |
Ultra-Short Obligations | | | | |
Fund Level | | $ | 27,724 | |
BlackRock | | $ | 1,327 | |
Certain officers and/or trustees of the Trust are officers and/or directors of BlackRock or its affiliates. The Funds reimburse the Manager for compensation paid to the Trust’s Chief Compliance Officer, which is included in officer and directors in the Statements of Operations.
3. Investments:
Purchases and sales of investments including paydowns and excluding short-term securities and US government securities for the period ended January 31, 2013, were as follows:
| | | | | | | | |
| | | Purchases | | | Sales | |
Short Obligations | | $ | 14,591,586 | | | $ | 1,297,982 | |
Ultra-Short Obligations | | $ | 10,650,395 | | | $ | 2,135,000 | |
Purchases and sales of US government securities, for the period ended January 31, 2013, were as follows:
| | | | | | | | |
| | | Purchases | | | Sales | |
Short-Term Treasury | | $ | 2,303,492 | | | | — | |
Ultra-Short Obligations | | $ | 1,165,625 | | | $ | 858,483 | |
4. Income Tax Information:
As of January 31, 2013, gross unrealized appreciation and gross unrealized depreciation based on cost for federal tax purposes were as follows:
| | | | | | | | | | | | |
| | | Short
Obligations | | | Short-Term
Treasury | | | Ultra-Short
Obligations | |
Tax cost | | $ | 25,114,544 | | | $ | 14,969,298 | | | $ | 24,772,228 | |
| | | | |
Gross unrealized appreciation | | $ | 12,786 | | | $ | 1,087 | | | $ | 7,652 | |
Gross unrealized depreciation | | | (5,772 | ) | | | — | | | | (3,421 | ) |
| | | | |
Net unrealized appreciation | | $ | 7,014 | | | $ | 1,087 | | | $ | 4,231 | |
| | | | |
5. Concentration, Market and Credit Risk:
In the normal course of business, the Funds invest in securities and enter into transactions where risks exist due to fluctuations in the market (market risk) or failure of the issuer of a security to meet all its obligations (issuer credit risk). The value of securities held by the Funds may decline in response to certain events, including those directly involving the issuers whose securities are owned by the Funds; conditions affecting the general economy; overall market changes; local, regional or global political, social or economic instability; and currency and interest rate and price fluctuations. Similar to issuer credit risk, the Funds may be exposed to counterparty credit risk, or the risk that an entity with which the Funds have unsettled or open transactions may fail to or be unable to perform on its commitments. The Funds manage counterparty risk by entering into transactions only with counterparties that they believe have the financial resources to honor their obligations and by monitoring the financial stability of those counterparties. Financial assets, which potentially expose the Funds to market, issuer and counterparty credit risks, consist principally of financial instruments and receivables due from counterparties. The extent of the Funds’ exposure to market, issuer and counterparty credit risks with respect to these financial assets is generally approximated by their value as recorded in Statements of Assets and Liabilities, less any collateral held by the Funds.
As of January 31, 2013, Short Obligations and Ultra-Short Obligations invested a significant portion of its assets in securities in the financial services sector. Changes in economic conditions affecting the financial services sector would have a greater impact on the Fund and could affect the value, income and/or liquidity of positions in such securities.
| | | | | | |
| | | | | | | |
| 26 | | BLACKROCK FUNDS | | JANUARY 31, 2013 | | |
| | |
| Notes to Financial Statements (concluded) | | |
6. Capital Share Transactions:
Transactions in capital shares for each class were as follows:
| | | | | | | | |
| | | Period November 15, 20121 to January 31, 2013 | |
| Short Obligations | | Shares | | | Amount | |
| BlackRock | | | | | | | | |
Shares sold | | | 2,500,000 | | | $ | 25,000,000 | |
| | | | |
Net increase | | | 2,500,000 | | | $ | 25,000,000 | |
| | | | |
| Short-Term Treasury | | | | | | | | |
| Institutional Daily | | | | | | | | |
Shares sold | | | 1,500,000 | | | $ | 15,000,000 | |
| | | | |
Net increase | | | 1,500,000 | | | $ | 15,000,000 | |
| | | | |
| Ultra-Short Obligations | | | | | | | | |
| BlackRock | | | | | | | | |
Shares sold | | | 2,500,000 | | | $ | 25,000,000 | |
| | | | |
Net increase | | | 2,500,000 | | | $ | 25,000,000 | |
| | | | |
1 Commencement of operations.
At January 31, 2013, all shares outstanding were owned by affiliates.
7. Subsequent Events:
Management has evaluated the impact of all subsequent events on the Funds through the date the financial statements were issued and has determined that there were no subsequent events requiring adjustment or additional disclosure in the financial statements.
| | | | | | |
| | | | | | | |
| | BLACKROCK FUNDS | | JANUARY 31, 2013 | | 27 |
| | |
| Disclosure of Investment Advisory Agreement | | |
The Board of Trustees (the “Board,” and the members of which are referred to as “Board Members”) of BlackRock FundsSM (the “Trust”) met on September 20-21, 2012 to consider the approval of the Trust’s proposed investment advisory agreement (the “Agreement”) with BlackRock Advisors, LLC (the “Manager”) on behalf of BlackRock Short Obligations Fund, BlackRock Short-Term Treasury Fund and BlackRock Ultra-Short Obligations Fund (each a “Fund” and together, the “Funds), each a portfolio of the Trust. The Agreement was the same agreement that had previously been approved by the Board with respect to other portfolios of the Trust. The Funds commenced operations in November 2012.
Activities and Composition of the Board
The Board consists of fourteen individuals, twelve of whom are not “interested persons” of the Trust or the Funds as defined in the Investment Company Act of 1940, as amended (the “1940 Act”) (the “Independent Board Members”). The Board Members are responsible for the oversight of the operations of the Trust and perform the various duties imposed on the directors of investment companies by the 1940 Act. The Independent Board Members have retained independent legal counsel to assist them in connection with their duties. The Co-Chairs of the Board are each Independent Board Members. The Board has established five standing committees: an Audit Committee, a Governance and Nominating Committee, a Compliance Committee, a Performance Oversight and Contract Committee and an Executive Committee, each of which is chaired by an Independent Board Member and composed of Independent Board Members (except for the Executive Committee, which also has one interested Board Member).
The Agreement
Pursuant to the 1940 Act, the Board is required to consider the initial approval of the Agreement. In connection with this process, the Board assessed, among other things, the nature, scope and quality of the services to be provided to the Funds by BlackRock, its personnel and its affiliates, including investment management, administrative and shareholder services, oversight of fund accounting and custody, marketing services, risk oversight, compliance and assistance in meeting applicable legal and regulatory requirements.
Board Considerations in Approving the Agreement
The Approval Process: At an in-person meeting held on September 20-21, 2012, the Board reviewed materials relating to its consideration of the Agreement. The Board considered all factors it believed relevant with respect to the Trust and the Funds, including, among other factors: (a) the nature, extent and quality of the services to be provided by BlackRock; (b) the investment performance of BlackRock portfolio management; (c) the advisory fee and the cost of the services to be provided and profits to be realized by BlackRock and its affiliates from their relationship with the Funds; (d) economies of scale; (e) fall out benefits to BlackRock as a result of its relationship with the Funds; (f) possible alternatives to the proposed Agreement; (g) the policies and practices of BlackRock with respect to portfolio transactions for the Funds; and (h) other factors deemed relevant by the Board Members.
In determining to approve the Agreement, the Board met with the relevant investment advisory personnel from BlackRock and considered all information it deemed reasonably necessary to evaluate the terms of the Agreement. The Board received materials in advance of the September 2012 meeting relating to its consideration of the Agreement, including (a) with respect to each Fund, fees and estimated expense ratios of each class of the Fund, and for a representative class of the Fund, in comparison to the fees and expense ratios of a peer group of funds; (b) information regarding BlackRock’s economic outlook for the Funds and its general investment outlook for the markets; (c) information regarding fees paid to service providers that are affiliates of BlackRock; and (d) information outlining the legal duties of the Board under the 1940 Act with respect to the consideration and approval of the Agreement. The Board also noted information received at prior Board meetings concerning compliance records and regulatory matters relating to BlackRock.
The Board also considered other matters it deemed important to the approval process, such as services related to the valuation and pricing of Fund portfolio holdings, direct and indirect benefits to BlackRock and its affiliates from their relationship with the Funds and advice from independent legal counsel with respect to the review process and materials submitted for the Board’s review. The Board noted the willingness of BlackRock personnel to engage in open, candid discussions with the Board. The Board did not identify any particular information as controlling, and each Board Member may have attributed different weights to the various items considered.
A. Nature, Extent and Quality of the Services
The Board, including the Independent Board Members, reviewed the nature, extent and quality of services to be provided by BlackRock, including the investment advisory services to be provided to each Fund. The Board received information concerning the investment philosophy and investment process to be used by BlackRock in managing the Funds, as well as a description of the capabilities, personnel and services of BlackRock. In connection with this review, the Board considered BlackRock’s in-house research capabilities as well as other resources available to its personnel. The Board considered the scope of the services provided by BlackRock to the Funds under the Agreement relative to services typically provided by third parties to other funds. The Board noted that the standard of care applicable under the Agreement was comparable to that found generally in investment company advisory agreements. The Board concluded that the scope of BlackRock’s services to be provided to the Funds was consistent with each Fund’s operational requirements, including, in addition to seeking to meet its investment objective, compliance with investment restrictions, tax and reporting requirements and related shareholder services.
The Board, including the Independent Board Members, also considered the quality of the administrative and non-investment advisory services to be provided by BlackRock and its affiliates to the Funds. The Board evaluated the procedures of BlackRock designed to fulfill its fiduciary duty to the Funds with respect to possible conflicts of interest, including
| | | | | | |
| | | | | | | |
| 28 | | BLACKROCK FUNDS | | JANUARY 31, 2013 | | |
| | |
| Disclosure of Investment Advisory Agreement (continued) | | |
BlackRock’s code of ethics (regulating the personal trading of BlackRock’s officers and employees), the procedures by which BlackRock allocates trades among its various investment advisory clients, the integrity of the systems in place to ensure compliance with the foregoing and the record of BlackRock in these matters. The Board also noted information received at prior Board meetings concerning standards of BlackRock with respect to the execution of portfolio transactions.
The Board, including the Independent Board Members, considered, among other factors, the number, education and experience of BlackRock’s investment personnel generally and the portfolio management team for each Fund. The Board also took into account the time and attention to be devoted by senior management of BlackRock to the Funds. The Board also considered the business reputation of BlackRock and its financial resources and concluded that BlackRock would be able to meet any reasonably foreseeable obligation under the Agreement.
B. The Investment Performance of the Funds and BlackRock
The Board, including the Independent Board Members, previously received and considered information about BlackRock’s investment performance for other funds. The Board, however, could not consider the performance history of the Funds because each Fund was newly organized and had not yet commenced operations as of the September 2012 meeting.
C. Consideration of the Advisory Fees and the Cost of the Services and Profits to be Realized by BlackRock and its Affiliates from their Relationship with the Funds
In connection with the initial approval of the Agreement, the Board, including the Independent Board Members, reviewed each Fund’s contractual management fee ratio (a combination of the advisory fee and the administration fee, if any) compared with the other funds in the applicable Fund’s peer group of funds. Both the peer group and the funds within the peer group (collectively, “Peers”) were selected by Lipper, Inc. (“Lipper”), which is not affiliated with BlackRock. It also compared each Fund’s estimated total expense ratio, as well as the Fund’s estimated actual management fee ratio, to those of its respective Peers. The Board noted that each Fund has an advisory fee arrangement that includes breakpoints that adjust the fee rate downward as the size of the Fund increases above certain contractually specified levels. The Board considered the fee waivers and expense reimbursement arrangements in place, including the contractual agreement by BlackRock and in the case of BlackRock Short Obligations Fund and BlackRock Ultra-Short Obligations Fund, the voluntary agreement by BlackRock to waive fees and/or reimburse expenses in order to limit, to a specified amount, each Fund’s total operating expenses as a percentage of the Fund’s average daily net assets on a class-by-class basis, as applicable. Additionally, the Board noted information received at prior Board meetings concerning the services rendered, and the fee rates offered, to other clients advised by BlackRock.
The Board noted that each Fund’s contractual management fee ratio (a combination of the advisory fee and the administration fee, if any) was lower than or equal to the median contractual management fee ratio paid by the Fund’s Peers, in each case before taking into account any expense reimbursements or fee waivers.
Following consideration of this information, the Board, including the independent Board Members, concluded that the fees to be paid pursuant to the Agreement were fair and reasonable in light of the services provided.
As the Funds had not commenced operations as of the date of the September 2012 meeting, BlackRock was not able to provide the Board with specific information concerning the expected profits to be realized by BlackRock and its affiliates from their relationships with the Funds. BlackRock, however, will provide the Board with such information at future meetings.
D. Economies of Scale
The Board, including the Independent Board Members, considered the extent to which economies of scale might be realized in respect of the management of the Funds in tandem with other portfolios of the Trust. Since each Fund is newly formed, BlackRock was not able to provide the Board with specific information concerning the extent to which economies of scale would be realized as the Funds grow and whether fee levels would reflect such economies of scale, if any.
E. Other Factors Deemed Relevant by the Board Members
The Board, including the Independent Board Members, also took into account other ancillary or “fall-out” benefits that BlackRock or its affiliates may derive from their respective relationships with the Funds, both tangible and intangible, such as BlackRock’s ability to leverage its investment professionals who manage other portfolios and risk management personnel, an increase in BlackRock’s profile in the investment advisory community, and the engagement of BlackRock’s affiliates as service providers to the Funds, including for administrative, distribution, securities lending and cash management services. The Board also considered BlackRock’s overall operations and its efforts to expand the scale of, and improve the quality of, its operations. The Board also noted that BlackRock may use and benefit from third party research obtained by soft dollars generated by certain registered fund transactions to assist in managing all or a number of its other client accounts.
The Board, including all of the Independent Board Members, concluded that these ancillary benefits that BlackRock and its affiliates could receive with regard to providing investment advisory and other services to the Funds were consistent with those generally available to other mutual fund sponsors.
| | | | | | |
| | | | | | | |
| | BLACKROCK FUNDS | | JANUARY 31, 2013 | | 29 |
| | |
| Disclosure of Investment Advisory Agreement (concluded) | | |
Conclusion
The Board, including the Independent Board Members, unanimously approved the Agreement between the Manager and the Trust on behalf of each Fund, for a two-year term ending September 20, 2014. Based upon its evaluation of all of the aforementioned factors in their totality, the Board, including the Independent Board Members, was satisfied that the terms of the Agreement were fair and reasonable and in the best
interest of each Fund and its shareholders. In arriving at a decision to approve the Agreement, the Board did not identify any single factor or group of factors as all-important or controlling, but considered all factors together, and different Board Members may have attributed different weights to the various factors considered. The Independent Board Members were also assisted by the advice of independent legal counsel in making this determination.
| | | | | | |
| | | | | | | |
| 30 | | BLACKROCK FUNDS | | JANUARY 31, 2013 | | |
Ronald W. Forbes, Co-Chairman of the Board and Trustee
Rodney D. Johnson, Co-Chairman of the Board and Trustee
Paul L. Audet, Trustee
David O. Beim, Trustee
Henry Gabbay, Trustee
Dr. Matina S. Horner, Trustee
Herbert I. London, Trustee
Ian A. MacKinnon, Trustee
Cynthia A. Montgomery, Trustee
Joseph P. Platt, Trustee
Robert C. Robb, Jr., Trustee
Toby Rosenblatt, Trustee
Kenneth L. Urish, Trustee
Frederick W. Winter, Trustee
John M. Perlowski, President and Chief Executive Officer
Richard Hoerner, CFA, Vice President
Brendan Kyne, Vice President
Simon Mendelson, Vice President
Christopher Stavrakos, CFA, Vice President
Neal Andrews, Chief Financial Officer
Jay Fife, Treasurer
Brian Kindelan, Chief Compliance Officer and Anti-Money Laundering Officer
Benjamin Archibald, Secretary
Investment Advisor and Co-Administrator
BlackRock Advisors, LLC
Wilmington, DE 19809
Distributor
BlackRock Investments, LLC
New York, NY 10022
Accounting Agent, Co-Administrator and Transfer Agent
BNY Mellon Investment Servicing (US) Inc.
Wilmington, DE 19809
Custodian
The Bank of New York Mellon
New York, NY 10286
Legal Counsel
Sidley Austin LLP
New York, NY 10019
Independent Registered Public Accounting Firm
PricewaterhouseCoopers LLP
Philadelphia, PA 19103
Address of the Trust
100 Bellevue Parkway
Wilmington, DE 19809
| | | | | | |
| | | | | | | |
| | BLACKROCK FUNDS | | JANUARY 31, 2013 | | 31 |
Electronic Delivery
Electronic copies of most financial reports and prospectuses are available on the Funds’ website or shareholders can sign up for e-mail notifications of quarterly statements, annual and semi-annual reports and prospectuses by enrolling in the Funds’ electronic delivery program.
To enroll:
Shareholders Who Hold Accounts with Investment Advisors, Banks or Brokerages:
Please contact your financial advisor. Please note that not all investment advisors, banks or brokerages may offer this service.
Shareholders Who Hold Accounts Directly with BlackRock:
1) Access the BlackRock website at
http://www.blackrock.com/ edelivery
2) Select “eDelivery” under the “More Information” section
3) Log into your account
Householding
The Funds will mail only one copy of shareholder documents, including prospectuses, annual and semi-annual reports and proxy statements, to shareholders with multiple accounts at the same address. This practice is commonly called “householding” and is intended to reduce expenses and eliminate duplicate mailings of shareholder documents. Mailings of your shareholder documents may be householded indefinitely unless you instruct us otherwise. If you do not want the mailing of these documents to be combined with those for other members of your household, please call the Funds at (800) 441-7762.
Availability of Quarterly Schedule of Investments
The Funds file their complete schedule of portfolio holdings with the Securities and Exchange Commission’s (the “SEC”) for the first and third quarters of each fiscal year on Form N-Q. The Funds’
Forms N-Q are available on the SEC’s website at http://www.sec.gov and may also be reviewed and copied at the SEC’s Public Reference Room in Washington, DC. Information on how to access documents on the SEC’s website without charge may be obtained by calling
(800) SEC-0330. The Funds’ Forms N-Q may also be obtained upon request and without charge by calling (800) 441-7762.
Availability of Proxy Voting Policies and Procedures
A description of the policies and procedures that the Funds use to determine how to vote proxies relating to portfolio securities is available (1) without charge, upon request, by calling
(800) 441-7762; (2) at http://www.blackrock.com; and (3) on the SEC’s website at http:// www.sec.gov.
Availability of Proxy Voting Record
Information about how the Funds voted proxies relating to securities held in the Funds’ portfolios during the most recent 12-month period ended June 30 is available upon request and without charge (1) at http://www.blackrock.com or by calling (800) 441-7762 and (2) on the SEC’s website at http://www.sec.gov.
Account Information
Call us at (800) 441-7762 from 8:00 AM to 6:00 PM EST on any business day to get information about your account balances, recent transactions and share prices. You can also reach us on the Web at http:// www.blackrock.com/funds.
Retirement Plans
Shareholders may make investments in conjunction with Traditional, Rollover, Roth, Coverdell, Simple IRAs, SEP IRAs and 403(b) Plans.
| | | | | | |
| | | | | | | |
| 32 | | BLACKROCK FUNDS | | JANUARY 31, 2012 | | |
| | |
| Additional Information (concluded) | | |
|
| BlackRock Privacy Principles |
BlackRock is committed to maintaining the privacy of its current and former fund investors and individual clients (collectively, “Clients”) and to safeguarding their non-public personal information. The following information is provided to help you understand what personal information BlackRock collects, how we protect that information and why in certain cases we share such information with select parties.
If you are located in a jurisdiction where specific laws, rules or regulations require BlackRock to provide you with additional or different privacy-related rights beyond what is set forth below, then BlackRock will comply with those specific laws, rules or regulations.
BlackRock obtains or verifies personal non-public information from and about you from different sources, including the following: (i) information we receive from you or, if applicable, your financial intermediary, on applications, forms or other documents; (ii) information about your transactions with us, our affiliates, or others; (iii) information we receive from a consumer reporting agency; and (iv) from visits to our websites.
BlackRock does not sell or disclose to non-affiliated third parties any non-public personal information about its Clients, except as permitted by law or as is necessary to respond to regulatory requests or to service Client accounts. These non-affiliated third parties are required to protect the confidentiality and security of this information and to use it only for its intended purpose.
We may share information with our affiliates to service your account or to provide you with information about other BlackRock products or services that may be of interest to you. In addition, BlackRock restricts access to non-public personal information about its Clients to those BlackRock employees with a legitimate business need for the information. BlackRock maintains physical, electronic and procedural safeguards that are designed to protect the non-public personal information of its Clients, including procedures relating to the proper storage and disposal of such information.
| | | | | | |
| | | | | | | |
| | BLACKROCK FUNDS | | JANUARY 31, 2013 | | 33 |
| | |
| A World-Class Mutual Fund Family | | |
BlackRock offers a diverse lineup of open-end mutual funds crossing all investment styles and managed by experts in equity, fixed income and tax-exempt investing.
BlackRock ACWI ex-US Index Fund
BlackRock All-Cap Energy & Resources Portfolio
BlackRock Basic Value Fund
BlackRock Capital Appreciation Fund
BlackRock China Fund
BlackRock Commodity Strategies Fund
BlackRock Disciplined Small Cap Core Fund
BlackRock Emerging Markets Fund
BlackRock Emerging Markets Long/Short Equity Fund
BlackRock Energy & Resources Portfolio
BlackRock Equity Dividend Fund
BlackRock EuroFund BlackRock Flexible Equity Fund
BlackRock Focus Growth Fund
BlackRock Global Dividend Income Portfolio
BlackRock Global Long/Short Equity Fund
BlackRock Global Opportunities Portfolio
BlackRock Global SmallCap Fund
BlackRock Health Sciences Opportunities Portfolio
BlackRock Index Equity Portfolio
BlackRock India Fund
BlackRock International Fund
BlackRock International Index Fund
BlackRock International Opportunities Portfolio
BlackRock Large Cap Core Fund
BlackRock Large Cap Core Plus Fund
BlackRock Large Cap Growth Fund
BlackRock Large Cap Value Fund
BlackRock Latin America Fund
BlackRock Long-Horizon Equity Fund
BlackRock Mid-Cap Growth Equity Portfolio
BlackRock Mid-Cap Value Opportunities Fund
BlackRock Natural Resources Trust
BlackRock Pacific Fund
BlackRock Real Estate Securities Fund
BlackRock Russell 1000 Index Fund
BlackRock Science & Technology Opportunities Portfolio
BlackRock Small Cap Growth Equity Portfolio
BlackRock Small Cap Growth Fund II
BlackRock Small Cap Index Fund
BlackRock S&P 500 Index Fund
BlackRock S&P 500 Stock Fund
BlackRock U.S. Opportunities Portfolio
BlackRock Value Opportunities Fund
BlackRock World Gold Fund
|
| Taxable Fixed Income Funds |
BlackRock Bond Index Fund
BlackRock Core Bond Portfolio
BlackRock CoreAlpha Bond Fund
BlackRock Emerging Market Local Debt Portfolio
BlackRock Floating Rate Income Portfolio
BlackRock Global Long/Short Credit Fund
BlackRock GNMA Portfolio
BlackRock High Yield Bond Portfolio
BlackRock Inflation Protected Bond Portfolio
BlackRock International Bond Portfolio
BlackRock Long Duration Bond Portfolio
BlackRock Low Duration Bond Portfolio
BlackRock Secured Credit Portfolio
BlackRock Strategic Income Opportunities Portfolio
BlackRock Total Return Fund
BlackRock U.S. Government Bond Portfolio
BlackRock U.S. Mortgage Portfolio
BlackRock World Income Fund
|
| Municipal Fixed Income Funds |
BlackRock California Municipal Bond Fund
BlackRock High Yield Municipal Fund
BlackRock Intermediate Municipal Fund
BlackRock National Municipal Fund
BlackRock New Jersey Municipal Bond Fund
BlackRock New York Municipal Bond Fund
BlackRock Pennsylvania Municipal Bond Fund
BlackRock Short-Term Municipal Fund
| | | | | | | | | | | | | | |
| BlackRock Balanced Capital Fund | | LifePath Active Portfolios | | LifePath Index Portfolios |
| BlackRock Global Allocation Fund | | 2015 | | | 2040 | | | | | Retirement | | 2040 | | |
| BlackRock Managed Volatility Portfolio | | 2020 | | | 2045 | | | | | 2020 | | 2045 | | |
| BlackRock Multi-Asset Income Portfolio | | 2025 | | | 2050 | | | | | 2025 | | 2050 | | |
| BlackRock Multi-Asset Real Return Fund | | 2030 | | | 2055 | | | | | 2030 | | 2055 | | |
| BlackRock Strategic Risk Allocation Fund | | 2035 | | | | | | | | 2035 | | | | |
| | | | | | |
| BlackRock Prepared Portfolios | | LifePath Portfolios | | | | | | | | | | | | |
Conservative Prepared Portfolio | | Retirement | | | 2040 | | | | | | | | | |
Moderate Prepared Portfolio | | 2020 | | | 2045 | | | | | | | | | |
Growth Prepared Portfolio | | 2025 | | | 2050 | | | | | | | | | |
Aggressive Growth Prepared Portfolio | | 2030 | | | 2055 | | | | | | | | | |
| | 2035 | | | | | | | | | | | | |
BlackRock mutual funds are currently distributed by BlackRock Investments, LLC. You should consider the investment objectives, risks, charges and expenses of the funds under consideration carefully before investing. Each fund’s prospectus contains this and other information and is available at www.blackrock.com or by calling (800) 441-7762 or from your financial advisor. The prospectus should be read carefully before investing.
| | | | | | |
| | | | | | | |
| 34 | | BLACKROCK FUNDS | | JANUARY 31, 2013 | | |
This report is transmitted to shareholders only. It is not authorized for use as an offer of sale or a solicitation of an offer to buy shares of the Funds unless accompanied or preceded by that Fund’s current prospectus. Past performance results shown in this report should not be considered a representation of future performance. Investment returns and principal value of shares will fluctuate so that shares, when redeemed, may be worth more or less than their original cost. Statements and other information herein are as dated and are subject to change.
| | |
SHORTS-1/13-SAR | |  |
Item 2 – Code of Ethics – Not Applicable to this semi-annual report
Item 3 – Audit Committee Financial Expert – Not Applicable to this semi-annual report
Item 4 – Principal Accountant Fees and Services – Not Applicable to this semi-annual report
Item 5 – Audit Committee of Listed Registrants – Not Applicable
Item 6 – Investments
(a) The registrant’s Schedule of Investments is included as part of the Report to Stockholders filed under Item 1 of this Form.
(b) Not Applicable due to no such divestments during the semi-annual period covered since the previous Form N-CSR filing.
Item 7 – Disclosure of Proxy Voting Policies and Procedures for Closed-End Management Investment Companies – Not Applicable
Item 8 – Portfolio Managers of Closed-End Management Investment Companies – Not Applicable
Item 9 – Purchases of Equity Securities by Closed-End Management Investment Company and Affiliated Purchasers – Not Applicable
Item 10 – Submission of Matters to a Vote of Security Holders – There have been no material changes to these procedures.
Item 11 – Controls and Procedures
(a) – The registrant’s principal executive and principal financial officers, or persons performing similar functions, have concluded that the registrant’s disclosure controls and procedures (as defined in Rule 30a-3(c) under the Investment Company Act of 1940, as amended (the “1940 Act”)) are effective as of a date within 90 days of the filing of this report based on the evaluation of these controls and procedures required by Rule 30a-3(b) under the 1940 Act and Rule 15d-15(b) under the Securities Exchange Act of 1934, as amended.
(b) – There were no changes in the registrant’s internal control over financial reporting (as defined in Rule 30a-3(d) under the 1940 Act) that occurred during the second fiscal quarter of the period covered by this report that have materially affected, or are reasonably likely to materially affect, the registrant’s internal control over financial reporting.
Item 12 – Exhibits attached hereto
(a)(1) – Code of Ethics – Not Applicable to this semi-annual report
(a)(2) – Certifications – Attached hereto
(a)(3) – Not Applicable
(b) – Certifications – Attached hereto
2
Pursuant to the requirements of the Securities Exchange Act of 1934 and the Investment Company Act of 1940, the registrant has duly caused this report to be signed on its behalf by the undersigned, thereunto duly authorized.
BlackRock Funds
| | | | |
| By: | | /s/ John M. Perlowski | | |
| | John M. Perlowski | | |
| | Chief Executive Officer (principal executive officer) of |
| | BlackRock Funds | | |
Date: April 3, 2013
Pursuant to the requirements of the Securities Exchange Act of 1934 and the Investment Company Act of 1940, this report has been signed below by the following persons on behalf of the registrant and in the capacities and on the dates indicated.
| | | | |
| By: | | /s/ John M. Perlowski | | |
| | John M. Perlowski | | |
| | Chief Executive Officer (principal executive officer) of |
| | BlackRock Funds | | |
Date: April 3, 2013
| | | | |
| By: | | /s/ Neal J. Andrews | | |
| | Neal J. Andrews | | |
| | Chief Financial Officer (principal financial officer) of |
| | BlackRock Funds | | |
Date: April 3, 2013
3