UNITED STATES
SECURITIES AND EXCHANGE COMMISSION
Washington, D.C. 20549
FORM N-CSR
CERTIFIED SHAREHOLDER REPORT OF REGISTERED MANAGEMENT INVESTMENT
COMPANIES
Investment Company Act file number 811-05742
Name of Fund: BlackRock Funds
BlackRock All-Cap Energy & Resources Portfolio
BlackRock China Fund
BlackRock Energy & Resources Portfolio
BlackRock Flexible Equity Fund
BlackRock Global Opportunities Portfolio
BlackRock Health Sciences Opportunities Portfolio
BlackRock International Opportunities Portfolio
BlackRock Managed Volatility Portfolio
BlackRock Mid-Cap Growth Equity Portfolio
BlackRock Science & Technology Opportunities Portfolio
BlackRock Small Cap Growth Equity Portfolio
BlackRock U.S. Opportunities Portfolio
BlackRock World Gold Fund
Fund Address: 100 Bellevue Parkway, Wilmington, DE 19809
Name and address of agent for service: John M. Perlowski, Chief Executive Officer, BlackRock Funds, 55 East 52nd
Street, New York, NY 10055
Registrant’s telephone number, including area code: (800) 441-7762
Date of fiscal year end: 09/30/2013
Date of reporting period: 03/31/2013
Item 1 – Report to Stockholders
| | | | | | | | |
| | | | | | | | |
| | | | | | | | |
2 | | | | BLACKROCK FUNDS | | MARCH 31, 2013 | | |
Dear Shareholder
Despite continued global headwinds, risk assets (such as equities) have generated strong performance as investors sought meaningful yields in the ongoing low-interest-rate environment. About this time one year ago, concerns about Europe’s debt crisis dominated the markets as political instability in Greece and severe deficit and liquidity problems in Spain raised the specter of a full-blown euro collapse. Investors were also discouraged by gloomy economic reports from various parts of the world, particularly in China. As the outlook for the global economy worsened, however, investors grew increasingly optimistic that the world’s largest central banks would intervene to stimulate growth. This theme, along with the European Central Bank’s (“ECB’s”) firm commitment to preserve the euro currency bloc, drove most asset classes higher through the summer of 2012. In early September, the ECB announced it would purchase unlimited amounts of short term sovereign bonds to support the region’s debt-laden countries. Days later, the US Federal Reserve announced its own much-anticipated stimulus package.
Although financial markets world-wide were buoyed by these aggressive policy actions, risk assets weakened in the fall of 2012. Global trade began to slow as many European countries fell into recession and growth continued to decelerate in China. In the United States, stocks slid on lackluster corporate earnings and volatility rose in advance of the US Presidential election. In the post-election environment, investors grew increasingly concerned over the “fiscal cliff,” the automatic tax increases and spending cuts that had been scheduled to take effect at the beginning of 2013. There was widespread fear that the fiscal cliff would push the United States into recession unless politicians could agree upon alternate measures to reduce the nation’s deficit. Worries that bipartisan gridlock would preclude a timely budget deal triggered high levels of volatility in financial markets around the world in the months leading up to the last day of the year. Ultimately, the worst of the fiscal cliff was averted with a last-minute tax deal, although the postponement of decisions relating to spending cuts and the debt ceiling left some lingering uncertainty.
Investors shook off the nerve-wracking finale to 2012 and the New Year began with a powerful relief rally in risk assets. Money that had been pulled to the sidelines amid year-end tax-rate uncertainty poured back into the markets in January. Key indicators signaling modest but broad-based improvements in the world’s major economies underpinned the rally. Underlying this aura of comfort was the absence of negative headlines out of Europe. Against this backdrop, global equities surged through January while rising US Treasury yields pressured high quality fixed income assets (as prices move in the opposite direction as yields).
However, bond markets regained strength in February when economic momentum slowed and investors toned down their risk appetite. US stocks continued to rise, but at a more moderate pace. Uncertainty about how long the Federal Reserve would maintain its monetary easing bias drove high levels of volatility later in the month, but these fears abated as the budget sequester (automatic spending cuts scheduled to take effect March 1) began to appear imminent and was deemed likely to deter any near-term changes in the central bank’s policy stance. Improving labor market data and rising home prices pushed US stocks higher at the end of the period, with major indices reaching new all-time highs. Outside the United States, equity prices weakened in the final two months of the period due to a resurgence of macro risk out of Europe. Italy’s February presidential election ended in a stalemate, further propagating the ongoing theme of political instability in the eurozone. In March, a severe banking crisis in Cyprus underscored the fragility of the broader European banking system.
For the 6- and 12-month periods ended March 31, 2013, US and international stocks and high yield bonds posted strong gains, while emerging market equities lagged as the pace of global growth failed to impress investors. US Treasury yields were highly volatile over the past 12 months. While remaining relatively low from a historical standpoint, yields began inching higher in the later part of the period, pressuring Treasuries and investment-grade bonds. Tax-exempt municipal bonds, however, benefited from favorable supply-and-demand dynamics. Near-zero short term interest rates continued to keep yields on money market securities near their all-time lows.
Markets have always been unpredictable, but that does not mean investors can delay taking action. At BlackRock, we believe it’s time for a different approach to investing. One that seeks out more opportunities in more places across a broader array of investments in a portfolio designed to move freely as the markets move up and down. People everywhere are asking, “So what do I do with my money?” Visit www.blackrock.com for answers.
Sincerely,

Rob Kapito
President, BlackRock Advisors, LLC

“Despite continued global headwinds, risk assets (such as equities) have generated strong performance as investors sought meaningful yields in the ongoing low-interest-rate environment.”
Rob Kapito
President, BlackRock Advisors, LLC
Total Returns as of March 31, 2013
| | | | | | | | |
| | | 6-month | | | 12-month | |
US large cap equities (S&P 500® Index) | | | 10.19 | % | | | 13.96 | % |
US small cap equities (Russell 2000® Index) | | | 14.48 | | | | 16.30 | |
International equities (MSCI Europe, Australasia, Far East Index) | | | 12.04 | | | | 11.25 | |
Emerging market equities (MSCI Emerging Markets Index) | | | 3.87 | | | | 1.96 | |
3-month Treasury bill (BofA Merrill Lynch 3-Month US Treasury Bill Index) | | | 0.06 | | | | 0.12 | |
US Treasury securities (BofA Merrill Lynch 10- Year US Treasury Index) | | | (0.55 | ) | | | 6.19 | |
US investment grade bonds (Barclays US Aggregate Bond Index) | | | 0.09 | | | | 3.77 | |
Tax-exempt municipal bonds (S&P Municipal Bond Index) | | | 1.26 | | | | 5.82 | |
US high yield bonds (Barclays US Corporate High Yield 2% Issuer Capped Index) | | | 6.28 | | | | 13.08 | |
Past performance is no guarantee of future results. Index performance is shown for illustrative purposes only. You cannot invest directly in an index.
| | | | | | | | |
| | | | | | | | |
| | | | | | | | |
| | | | THIS PAGE NOT PART OF YOUR FUND REPORT | | | | 3 |
| | |
| | |
| | |
| Fund Summary as of March 31, 2013 | | BlackRock All-Cap Energy & Resources Portfolio |
| | | |
BlackRock All-Cap Energy & Resources Portfolio’s (the “Fund”) investment objective is to provide long-term growth of capital.
|
Portfolio Management Commentary |
How did the Fund perform?
| • | | For the six-month period ended March 31, 2013, the Fund underperformed its custom benchmark, which is a blend of 70% Wilshire 5000 Modified Energy Cap Weighted Index and 30% MSCI All-Country World Energy Index. The Fund also underperformed the S&P 500® Index. The following discussion of relative performance pertains to the Fund’s custom blended benchmark. |
What factors influenced performance?
| • | | The Fund’s exposure to gold and silver producers was the leading detractor from relative performance as gold and silver prices declined 10% in a rising equity market. In this environment, precious metals-related stocks dramatically underperformed, including key portfolio holdings Silver Wheaton Corp. and Goldcorp, Inc. Additionally, the Fund’s underweight to the oil & gas refining & marketing segment significantly hindered results relative to the benchmark index as refiners generally benefited from the dynamics of US versus global oil prices during the period. Selection among integrated oil & gas stocks also detracted from results as oil-related holdings such as Occidental Petroleum Corp., Cenovus Energy, Inc. and Suncor Energy, Inc. declined due to deteriorating revenues for North American crude oil production. |
| • | | Conversely, stock selection among oil & gas exploration & production companies contributed positively to Fund performance. Several holdings within this group rallied toward the end of the period as natural gas prices began to rise. Following a period during which a glut of North American supply and warmer-than-normal winter weather had pressured |
| | gas prices, these conditions were finally alleviated, allowing gas prices to rise. Gas-related holdings such as EQT Corp., Range Resources Corp. and Cabot Oil & Gas Corp. generated double-digit gains during the period. Additionally, one of the Fund’s largest holdings, Plains Exploration & Production Co., rose more than 25% following the announcement that the company would be acquired by Freeport-McMoRan Copper & Gold, Inc. |
Describe recent portfolio activity.
| • | | During the six-month period, the Fund reduced its overall number of positions, but made a new investment in Cairn Energy Plc, an oil & gas exploration & production company based in the United Kingdom. The Fund also increased its existing position in US exploration & production company Anadarko Petroleum Corp., which has attained access to a valuable natural gas resource in the Rovuma Basin off the coast of Mozambique. |
Describe portfolio positioning at period end.
| • | | As of period end, the Fund continued to maintain its focus on energy stocks, with a slight bias toward oil versus gas. Over half of the Fund’s net assets were invested in exploration & production stocks. The Fund remained overweight in coal producers and underweight in the larger integrated oil & gas companies, the refining segment and storage & transportation companies, while maintaining a neutral weighting in the oil services space. |
The views expressed reflect the opinions of BlackRock as of the date of this report and are subject to change based on changes in market, economic or other conditions. These views are not intended to be a forecast of future events and are no guarantee of future results.
| | | | | |
| Ten Largest Holdings | | Percent of
Long-Term
Investments |
EOG Resources, Inc. | | | | 6 | % |
Whiting Petroleum Corp. | | | | 5 | |
Anadarko Petroleum Corp. | | | | 4 | |
Chevron Corp. | | | | 4 | |
Occidental Petroleum Corp. | | | | 4 | |
Noble Energy, Inc. | | | | 4 | |
CONSOL Energy, Inc. | | | | 4 | |
Range Resources Corp. | | | | 4 | |
Apache Corp. | | | | 3 | |
Denbury Resources, Inc. | | | | 3 | |
| | | | | |
| Industry Allocation | | Percent of
Long-Term
Investments |
Oil, Gas & Consumable Fuels | | | | 85 | % |
Energy Equipment & Services | | | | 15 | |
For Fund compliance purposes, the Fund’s industry classifications refer to any one or more of the industry sub-classifications used by one or more widely recognized market indexes or ratings group indexes, and/or as defined by Fund management. These definitions may not apply for purposes of this report, which may combine such industry sub-classifications for reporting ease.
| | | | | | | | |
| | | | | | | | |
| | | | | | | | |
4 | | | | BLACKROCK FUNDS | | MARCH 31, 2013 | | |
| | |
| | |
| | |
| | BlackRock All-Cap Energy & Resources Portfolio |
| | |
Total Return Based on a $10,000 Investment |
| | 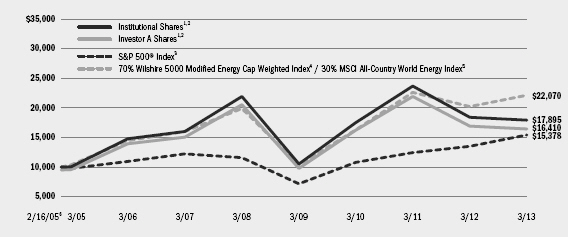 |
| | 1 Assuming maximum sales charges, if any, transaction costs and other operating expenses, including investment advisory fees. Institutional Shares do not have a sales charge. 2 Under normal market conditions, the Fund invests at least 80% of its total assets in equity securities of global energy and natural resources companies and companies in associated businesses, as well as utilities (such as gas, water, cable, electrical and telecommunications utilities). 3 This unmanaged index covers 500 industrial, utility, transportation and financial companies of the US markets (mostly New York Stock Exchange (“NYSE”) issues) representing about 75% of NYSE market capitalization and 30% of NYSE issues. 4 The Wilshire 5000 Modified Energy Cap Weighted Index is a customized index comprised of the energy sector constituents of the Wilshire 5000 (Full Cap) Index which have been market capitalization weighted and the six largest securities and all securities that have a percentage market value below 0.01% have been removed. 5 The MSCI All-Country World Energy Index is comprised of the energy sector constituents of the MSCI All-Country World Index, a free float-adjusted market capitalization weighted index designed to measure the equity market performance of developed and emerging markets. 6 Commencement of operations. |
|
Performance Summary for the Period Ended March 31, 2013 |
| | | | | | | | | | | | | | | | | | | | | | | | | | | | | | | | | | | | | |
| | | | | Average Annual Total Returns7 |
| | | | | | | | | | |
| | | | | 1 Year | | | | 5 Years | | Since Inception8 |
| | | 6-Month
Total Returns | | w/o sales
charge | | w/ sales
charge | | | | w/o sales
charge | | w/ sales
charge | | w/o sales
charge | | w/ sales
charge |
Institutional | | | | 2.99 | % | | | | (2.43 | )% | | | | N/A | | | | | | | (3.94 | )% | | | | N/A | | | | | 7.43 | % | | | | N/A | |
Service | | | | 2.73 | | | | | (2.80 | ) | | | | N/A | | | | | | | (4.29 | ) | | | | N/A | | | | | 7.01 | | | | | N/A | |
Investor A | | | | 2.73 | | | | | (2.80 | ) | | | | (7.89 | )% | | | | | | (4.32 | ) | | | | (5.35 | )% | | | | 6.99 | | | | | 6.29 | % |
Investor B | | | | 2.38 | | | | | (3.52 | ) | | | | (7.86 | ) | | | | | | (5.04 | ) | | | | (5.36 | ) | | | | 6.22 | | | | | 6.22 | |
Investor C | | | | 2.30 | | | | | (3.51 | ) | | | | (4.48 | ) | | | | | | (5.02 | ) | | | | (5.02 | ) | | | | 6.23 | | | | | 6.23 | |
S&P 500® Index | | | | 10.19 | | | | | 13.96 | | | | | N/A | | | | | | | 5.81 | | | | | N/A | | | | | 5.44 | | | | | N/A | |
| 70% Wilshire 5000 Modified Energy Cap Weighted Index / 30% MSCI All-Country World Energy Index | | | | 10.64 | | | | | 9.59 | | | | | N/A | | | | | | | 2.13 | | | | | N/A | | | | | 10.23 | | | | | N/A | |
| | 7 | Assuming maximum sales charges, if any. Average annual total returns with and without sales charges reflect reductions for distribution and service fees. See “About Fund Performance” on page 12 for a detailed description of share classes, including any related sales charges and fees. |
| | 8 | The Fund commenced operations on February 16, 2005. |
| | | N/A - Not applicable as share class and index do not have a sales charge. |
| | | Past performance is not indicative of future results. |
| | | | | | | | | | | | | | | | | | | | | | | | | | | | | | | | | | | | | | | | |
| | | Actual | | | | Hypothetical10 | | |
| | | Beginning
Account Value
October 1, 2012 | | Ending
Account Value
March 31, 2013 | | Expenses Paid
During the Period9 | | | | Beginning
Account Value
October 1, 2012 | | Ending
Account Value
March 31, 2013 | | Expenses Paid
During the Period9 | | Annualized
Expense
Ratio |
Institutional | | | | $1,000.00 | | | | | $1,029.90 | | | | | $ 4.86 | | | | | | | $1,000.00 | | | | | $1,020.14 | | | | | $ 4.84 | | | | | 0.96 | % |
Service | | | | $1,000.00 | | | | | $1,027.30 | | | | | $ 6.77 | | | | | | | $1,000.00 | | | | | $1,018.25 | | | | | $ 6.74 | | | | | 1.34 | % |
Investor A | | | | $1,000.00 | | | | | $1,027.30 | | | | | $ 6.98 | | | | | | | $1,000.00 | | | | | $1,018.05 | | | | | $ 6.94 | | | | | 1.38 | % |
Investor B | | | | $1,000.00 | | | | | $1,023.80 | | | | | $10.60 | | | | | | | $1,000.00 | | | | | $1,014.46 | | | | | $10.55 | | | | | 2.10 | % |
Investor C | | | | $1,000.00 | | | | | $1,023.00 | | | | | $10.59 | | | | | | | $1,000.00 | | | | | $1,014.46 | | | | | $10.55 | | | | | 2.10 | % |
| | 9 | For each class of the Fund, expenses are equal to the annualized expense ratio for the class, multiplied by the average account value over the period, multiplied by 182/365 (to reflect the one-half year period shown). |
| | 10 | Hypothetical 5% annual return before expenses is calculated by pro rating the number of days in the most recent fiscal half year divided by 365. |
| | | See “Disclosure of Expenses” on page 13 for further information on how expenses were calculated. |
| | | | | | | | |
| | | | | | | | |
| | | | BLACKROCK FUNDS | | MARCH 31, 2013 | | 5 |
| | |
| | |
| | |
| Fund Summary as of March 31, 2013 | | BlackRock China Fund |
| | |
BlackRock China Fund’s (the “Fund”) investment objective is to seek to maximize total return. Total return means the combination of capital appreciation and investment income.
|
Portfolio Management Commentary |
How did the Fund perform?
| • | | US and certain other financial markets were closed on March 29, 2013, while some foreign financial markets were open. The Fund was re-priced for financial reporting purposes to reflect, in the valuation, the transactions related to foreign market activities. For the six-month period ended March 31, 2013, the Fund outperformed its benchmark, the MSCI China 10/40 Index, and the MSCI China Index. The following discussion of relative performance pertains to the MSCI China 10/40 Index. |
What factors influenced performance?
| • | | Stock selection substantially boosted positive performance during the reporting period, particularly within the financials sector. Overweight positions in property names such as Shenzhen Investment Ltd. and China Vanke Co. Ltd. substantially contributed to relative performance. Also in financials, Hong Kong-listed Asian regional insurer AIA Group Ltd. added to returns. The stock performed well following strong results in the fourth quarter of 2012 that beat expectations. In the information technology sector, outperformance came from a lack of ownership in internet company Tencent, Inc., which missed earnings estimates. The Fund’s substantial underweight in China Mobile Ltd. also aided performance. The stock declined on uncertainty over whether the listed company will bear the capital expenditure costs for the infrastructure required to support new long-term evolution mobile network technology. |
| • | | The largest detractor from performance was the Fund’s investment in tele-communication services company China Unicom Hong Kong Ltd. The stock performed poorly as investors were concerned it would miss earnings esti- |
| | mates. Holdings in enterprise resource planning software developer Kingdee International Software Group Co. Ltd. and online game developer Shanda Games Ltd. also substantially detracted from returns. At the sector level, only utilities had a slight negative effect on overall performance. |
Describe recent portfolio activity.
| • | | During the six-month period, the Fund increased its weighting in China Construction Bank Corp. while taking advantage of the stock’s attractive pricing after a period of selling pressure led to its underperformance relative to other banks. The Fund added exposure to Agricultural Bank of China Ltd. given attractive valuation, but remains underweight in banks. Additions were made to some existing holdings on price weakness, including electric train engine manufacturer ZhuZhou CSR Times Electric Co. Ltd., China Pacific Insurance Co. Ltd., China Unicom Hong Kong Ltd. and CNOOC Ltd. A position was initiated in container board manufacturer Nine Dragons Paper Holdings Ltd. on the prospect of a supply shortage in the second half of 2013. |
Describe portfolio positioning at period end.
| • | | The Fund’s main active overweight positions continued to be in the health care and industrials sectors, where Fund management found attractive valuations and long-term growth potential. The Fund remained overweight in materials due to attractive valuations in select stocks in the sector, and underweight in financials even though exposure to banks was increased given their relative valuation. Within financials, the Fund remained underweight in the real estate segment, but continued to favor brokerage firms in light of financial liberalization and reform. |
The views expressed reflect the opinions of BlackRock as of the date of this report and are subject to change based on changes in market, economic or other conditions. These views are not intended to be a forecast of future events and are no guarantee of future results.
| | | | | |
| Ten Largest Holdings | | Percent of
Long-Term
Investments |
China Construction Bank Corp., H Shares | | | | 10 | % |
CNOOC Ltd. | | | | 7 | |
Industrial & Commercial Bank of China, H Shares | | | | 5 | |
China Petroleum & Chemical Corp., H Shares | | | | 5 | |
China Mobile Ltd. | | | | 4 | |
Agricultural Bank of China Ltd., H Shares | | | | 4 | |
ZhuZhou CSR Times Electric Co. Ltd., H Shares | | | | 4 | |
China Pacific Insurance Group Co. Ltd., H Shares | | | | 3 | |
Bank of China Ltd., H Shares | | | | 3 | |
China Unicom Hong Kong Ltd. | | | | 3 | |
| | | | | |
| Sector Allocation | | Percent of
Long-Term
Investments |
Financials | | | | 38 | % |
Energy | | | | 14 | |
Industrials | | | | 12 | |
Materials | | | | 9 | |
Telecommunication Services | | | | 7 | |
Health Care | | | | 5 | |
Consumer Discretionary | | | | 5 | |
Utilities | | | | 4 | |
Information Technology | | | | 4 | |
Consumer Staples | | | | 2 | |
For Fund compliance purposes, the Fund’s sector classifications refer to any one or more of the sector sub-classifications used by one or more widely recognized market indexes or ratings group indexes, and/or as defined by Fund management. These definitions may not apply for purposes of this report, which may combine sector sub-classifications for reporting ease.
| | | | | | | | |
| | | | | | | | |
| | | | | | | | |
6 | | | | BLACKROCK FUNDS | | MARCH 31, 2013 | | |
| | |
Total Return Based on a $10,000 Investment |
| | 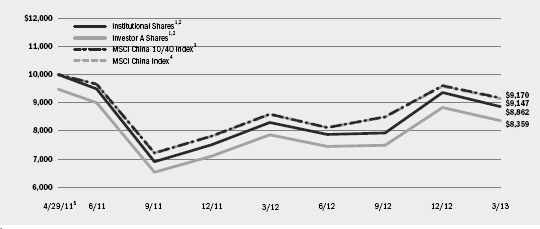 |
| | 1 Assuming maximum sales charges, if any, transaction costs and other operating expenses, including investment advisory fees. Institutional Shares do not have a sales charge. 2 The Fund seeks to achieve its objective by investing at least 80% of its total assets in equity securities of companies domiciled, or exercising the predominant part of their economic activity, in China, including its special administrative regions such as Hong Kong, or in instruments with similar economic characteristics. 3 A free float-adjusted market capitalization index that is designed to measure equity market performance in China, taking into consideration the concentration constraints of the European Union’s UCITS III regulations. 4 An unmanaged free float-adjusted market capitalization index designed to measure equity market performance of China. 5 Commencement of operations. |
| | |
Performance Summary for the Period Ended March 31, 2013 |
| | | | | | | | | | | | | | | | | | | | | | | | | |
| | | | | Average Annual Total Returns6 |
| | | | | 1 Year | | Since Inception7 |
| | | 6-Month
Total Returns | | w/o sales
charge | | w/ sales
charge | | w/o sales
charge | | w/ sales
charge |
Institutional | | | | 11.86 | % | | | | 6.79 | % | | | | N/A | | | | | (6.09 | )% | | | | N/A | |
Investor A | | | | 11.65 | | | | | 6.44 | | | | | 0.87 | % | | | | (6.33 | ) | | | | (8.90 | )% |
Investor C | | | | 11.18 | | | | | 5.84 | | | | | 4.84 | | | | | (6.96 | ) | | | | (6.96 | ) |
MSCI China 10/40 Index | | | | 7.96 | | | | | 6.72 | | | | | N/A | | | | | (4.41 | ) | | | | N/A | |
MSCI China Index | | | | 7.75 | | | | | 6.60 | | | | | N/A | | | | | (4.53 | ) | | | | N/A | |
| | 6 | Assuming maximum sales charges, if any. Average annual total returns with and without sales charges reflect reductions for distribution and service fees. See “About Fund Performance” on page 12 for a detailed description of share classes, including any related sales charges and fees. |
| | 7 | The Fund commenced operations on April 29, 2011. |
| | | N/A - Not applicable as share class and index do not have a sales charge. |
| | | Past performance is not indicative of future results. |
| | | | | | | | | | | | | | | | | | | | | | | | | | | | | | | | | | | | | | | | |
| | | Actual | | | | Hypothetical9 | | |
| | | Beginning
Account Value
October 1, 2012 | | Ending
Account Value
March 31, 2013 | | Expenses Paid
During the Period8 | | | | Beginning
Account Value
October 1, 2012 | | Ending
Account Value
March 31, 2013 | | Expenses Paid
During the Period8 | | Annualized
Expense
Ratio |
Institutional | | | $ | 1,000.00 | | | | $ | 1,118.60 | | | | $ | 8.72 | | | | | | $ | 1,000.00 | | | | $ | 1,016.70 | | | | $ | 8.30 | | | | | 1.65 | % |
Investor A | | | $ | 1,000.00 | | | | $ | 1,116.50 | | | | $ | 10.03 | | | | | | $ | 1,000.00 | | | | $ | 1,015.46 | | | | $ | 9.55 | | | | | 1.90 | % |
Investor C | | | $ | 1,000.00 | | | | $ | 1,111.80 | | | | $ | 13.85 | | | | | | $ | 1,000.00 | | | | $ | 1,011.82 | | | | $ | 13.19 | | | | | 2.63 | % |
| | 8 | For each class of the Fund, expenses are equal to the annualized expense ratio for the class, multiplied by the average account value over the period, multiplied by 182/365 (to reflect the one-half year period shown). |
| | 9 | Hypothetical 5% annual return before expenses is calculated by pro rating the number of days in the most recent fiscal half year divided by 365. |
| | | See “Disclosure of Expenses” on page 13 for further information on how expenses were calculated. |
| | | | | | | | |
| | | | | | | | |
| | | | | | | | |
| | | | BLACKROCK FUNDS | | MARCH 31, 2013 | | 7 |
| | |
| | |
| | |
| Fund Summary as of March 31, 2013 | | BlackRock Energy & Resources Portfolio |
| | |
BlackRock Energy & Resources Portfolio’s (the “Fund”) investment objective is to provide long-term growth of capital.
|
Portfolio Management Commentary |
How did the Fund perform?
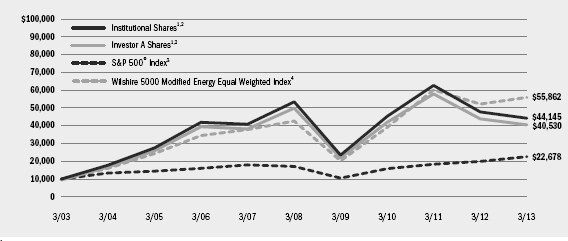
| • | | For the six-month period ended March 31, 2013, the Fund underperformed its benchmark, the Wilshire 5000 Modified Energy Equal Weighted Index, as well as the S&P 500® Index. The following discussion of relative performance pertains to the Wilshire 5000 Modified Energy Equal Weighted Index. |
What factors influenced performance?
| • | | Allocation decisions were the key drivers of the Fund’s underperformance relative to the benchmark index. Maintaining a large overweight to oil & gas exploration & production stocks naturally resulted in the Fund’s underweight to other oil & gas segments including equipment & services, drilling, refining & marketing and storage & transportation, all of which generated strong returns during the period. Also detracting from relative performance were the Fund’s positions in miners of precious and base metals not included in the benchmark index composition. Gold and silver prices declined 10% in a rising equity market, resulting in particularly dramatic underperformance among precious metals-related stocks. |
| • | | Conversely, stock selection among oil & gas exploration & production companies contributed positively to Fund performance. Several holdings within this group rallied toward the end of the period as natural gas |
| | prices began to rise. Following a period during which a glut of North American supply and warmer-than-normal winter weather had pressured gas prices, these conditions were finally alleviated, allowing gas prices to rise. Gas-related holdings such as EQT Corp., Range Resources Corp. and Cabot Oil & Gas Corp. generated double-digit gains during the period. Additionally, one of the Fund’s largest holdings, Plains Exploration & Production Co., rose more than 25% following the announcement that the company would be acquired by Freeport-McMoRan Copper & Gold, Inc. |
Describe recent portfolio activity.
| • | | During the six-month period, the Fund reduced its overall number of positions, but made new investments in two oil & gas exploration & production companies offering attractive value, namely Cairn Energy Plc and Noble Energy, Inc. |
Describe portfolio positioning at period end.
| • | | As of period end, the Fund continued to maintain its focus on energy stocks, with roughly equal exposures to oil and natural gas, along with a smaller exposure to coal. Over two-thirds of the Fund’s net assets were invested in exploration & production stocks. As a result, the Fund remained underweight to the refining segment, storage & transportation companies and the oil services space. |
The views expressed reflect the opinions of BlackRock as of the date of this report and are subject to change based on changes in market, economic or other conditions. These views are not intended to be a forecast of future events and are no guarantee of future results.
| | | | | |
| Ten Largest Holdings | | Percent of
Long-Term
Investments |
EQT Corp. | | | | 6 | % |
Plains Exploration & Production Co. | | | | 6 | |
Range Resources Corp. | | | | 6 | |
CONSOL Energy, Inc. | | | | 6 | |
Pioneer Natural Resources Co. | | | | 5 | |
Energy XXI Bermuda Ltd. | | | | 5 | |
Alpha Natural Resources, Inc. | | | | 3 | |
Rosetta Resources, Inc. | | | | 3 | |
Trilogy Energy Corp. | | | | 3 | |
Clayton Williams Energy, Inc. | | | | 3 | |
| | | | | |
| Industry Allocation | | Percent of
Long-Term
Investments |
Oil, Gas & Consumable Fuels | | | | 91 | % |
Energy Equipment & Services | | | | 8 | |
Metals & Mining | | | | 1 | |
For Fund compliance purposes, the Fund’s industry classifications refer to any one or more of the industry sub-classifications used by one or more widely recognized market indexes or ratings group indexes, and/or as defined by Fund management. These definitions may not apply for purposes of this report, which may combine such industry sub-classifications for reporting ease.
| | | | | | | | |
| | | | | | | | |
| | | | | | | | |
8 | | | | BLACKROCK FUNDS | | MARCH 31, 2013 | | |
| | |
| | |
| | |
| | BlackRock Energy & Resources Portfolio |
| | |
| | |
Total Return Based on a $10,000 Investment |
| | 
|
| | 1 Assuming maximum sales charges, if any, transaction costs and other operating expenses, including investment advisory fees. Institutional Shares do not have a sales charge. 2 Under normal market conditions, the Fund invests at least 80% of its total assets in equity securities of global energy and natural resources companies and companies in associated businesses, as well as utilities (such as gas, water, cable, electrical and telecommunications utilities). 3 This unmanaged index covers 500 industrial, utility, transportation and financial companies of the US markets (mostly NYSE issues) representing about 75% of NYSE market capitalization and 30% of NYSE issues. 4 The Wilshire 5000 Modified Energy Equal Weighted Index is a customized index comprised of the energy sector constituents of the Wilshire 5000 (Full Cap) Index which have been equally weighted and the six largest securities and all securities that have a percentage market value below 0.01% have been removed. |
| | |
Performance Summary for the Period Ended March 31, 2013 |
| | | | | | | | | | | | | | | | | | | | | | | | | | | | | | | | | | | |
| | | | | Average Annual Total Returns5 |
| | | | | 1 Year | | 5 Years | | 10 Years |
| | | 6-Month
Total Returns | | w/o sales
charge | | w/ sales
charge | | w/o sales
charge | | w/ sales
charge | | w/o sales
charge | | w/ sales
charge |
Institutional | | | | 4.88 | % | | | | (7.35 | )% | | | | N/A | | | | | (3.69 | )% | | | | N/A | | | | | 16.01 | % | | | | N/A | |
Investor A | | | | 4.70 | | | | | (7.65 | ) | | | | (12.51 | )% | | | | (4.03 | ) | | | | (5.06 | )% | | | | 15.64 | | | | | 15.02 | % |
Investor B | | | | 4.30 | | | | | (8.36 | ) | | | | (12.48 | ) | | | | (4.75 | ) | | | | (4.97 | ) | | | | 14.98 | | | | | 14.98 | |
Investor C | | | | 4.34 | | | | | (8.35 | ) | | | | (9.26 | ) | | | | (4.72 | ) | | | | (4.72 | ) | | | | 14.82 | | | | | 14.82 | |
S&P 500® Index | | | | 10.19 | | | | | 13.96 | | | | | N/A | | | | | 5.81 | | | | | N/A | | | | | 8.53 | | | | | N/A | |
Wilshire 5000 Modified Energy Equal Weighted Index | | | | 9.71 | | | | | 7.33 | | | | | N/A | | | | | 5.61 | | | | | N/A | | | | | 18.77 | | | | | N/A | |
| | 5 | Assuming maximum sales charges, if any. Average annual total returns with and without sales charges reflect reductions for distribution and service fees. See “About Fund Performance” on page 12 for a detailed description of share classes, including any related sales charges and fees. |
| | | N/A - Not applicable as share class and index do not have a sales charge. |
| | | Past performance is not indicative of future results. |
| | | | | | | | | | | | | | | | | | | | | | | | | | | | | | | | | | | |
| | | Actual | | Hypothetical7 | | |
| | | Beginning
Account Value
October 1, 2012 | | Ending
Account Value
March 31, 2013 | | Expenses Paid
During the Period6 | | Beginning
Account Value
October 1, 2012 | | Ending
Account Value
March 31, 2013 | | Expenses Paid
During the Period6 | | Annualized
Expense
Ratio |
Institutional | | | $ | 1,000.00 | | | | $ | 1,048.80 | | | | $ | 5.26 | | | | $ | 1,000.00 | | | | $ | 1,019.80 | | | | $ | 5.19 | | | | | 1.03 | % |
Investor A | | | $ | 1,000.00 | | | | $ | 1,047.00 | | | | $ | 6.84 | | | | $ | 1,000.00 | | | | $ | 1,018.25 | | | | $ | 6.74 | | | | | 1.34 | % |
Investor B | | | $ | 1,000.00 | | | | $ | 1,043.00 | | | | $ | 10.70 | | | | $ | 1,000.00 | | | | $ | 1,014.46 | | | | $ | 10.55 | | | | | 2.10 | % |
Investor C | | | $ | 1,000.00 | | | | $ | 1,043.40 | | | | $ | 10.70 | | | | $ | 1,000.00 | | | | $ | 1,014.46 | | | | $ | 10.55 | | | | | 2.10 | % |
| | 6 | For each class of the Fund, expenses are equal to the annualized expense ratio for the class, multiplied by the average account value over the period, multiplied by 182/365 (to reflect the one-half year period shown). |
| | 7 | Hypothetical 5% annual return before expenses is calculated by pro rating the number of days in the most recent fiscal half year divided by 365. |
| | | See “Disclosure of Expenses” on page 13 for further information on how expenses were calculated. |
| | | | | | | | |
| | | | | | | | |
| | | | | | | | |
| | | | BLACKROCK FUNDS | | MARCH 31, 2013 | | 9 |
| | |
| | |
| | |
| Fund Summary as of March 31, 2013 | | BlackRock World Gold Fund |
| | |
BlackRock World Gold Fund’s (the “Fund”) investment objective is to seek to maximize total return. Total return means the combination of capital appreciation and investment income.
|
Portfolio Management Commentary |
How did the Fund perform?
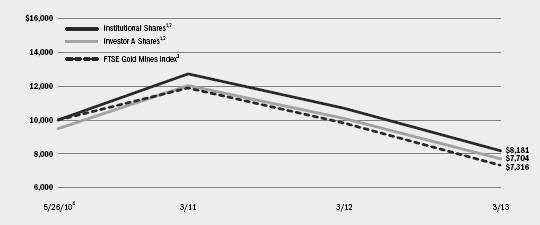
| • | | For the six-month period ended March 31, 2013, the Fund outperformed its benchmark, the FTSE Gold Mines Index. |
What factors influenced performance?
| • | | While both the Fund and its benchmark index generated negative returns for the six-month period, the Fund’s non-gold holdings were key contributors to outperformance. In particular, holdings in silver producers, such as Industrias Penoles SAB de CV, and more diversified producers, including Rio Tinto Plc, delivered stronger performance than the gold segment. |
| • | | The Fund’s underweight exposure to gold miner Cia de Minas Buenaventura SA aided returns. The company delivered a disappointing update from its Chucapaca open-pit mine, a growth development project in southern Peru, suggesting that it may no longer be economic to develop using just open pit mining. The company also reported faster-than-expected grade declines (the amount of metal contained in the ore) guiding the market toward lower production in 2013. An underweight in Osisko Mining Corp., a North American developer, also positively contributed to performance, as the company continued to face challenges to its ability to increase its production as planned at its large, low-grade Malartic mine in Quebec, Canada. |
| • | | During the six-month period, the price of gold has been challenged by strong economic data in the United States which has been supportive of a stronger US dollar. This has contributed to concerns that the Federal Reserve may end its asset purchase program earlier than initially expected. Both of these factors have acted as a headwind for the price of gold. Over this period, gold producers exhibited a high level of sensitivity to the declining gold price. The share price of small-cap development gold producer, Banro Corp., struggled following a disappointing |
| | update at its Nemoya gold development asset operating in the Democratic Republic of Congo and the departure of the company’s CEO. While only a small holding, the Fund’s allocation to Banro Corp. detracted from performance. The Fund’s underweight exposures to large-cap gold producers Barrick Gold Corp., Newmont Mining Corp. and Goldcorp, Inc. hampered returns. In a falling gold price environment, these companies have tended to hold up better than their mid-cap counterparts. |
Describe recent portfolio activity.
| • | | During the six months, the Fund took profits on its position in Fresnillo Plc, a silver and gold producer operating in Mexico, which had delivered strong performance. The proceeds were rotated into gold producers with good development projects and attractive valuations. During the reporting period, a position was initiated in precious metal streaming company Silver Wheaton Corp. and a silver developer operating in Central America. Silver Wheaton Corp. benefits from being able to purchase precious metals at a cost significantly below its current value and is not exposed to cost inflation in the mining industry. As financing risk remains a key focus for resources companies, the Fund has sought to reduce exposure to companies that may have a capital requirement in the near term. With that in mind, the Fund sold several small-cap gold names during the reporting period. |
Describe portfolio positioning at period end.
| • | | At period end, the Fund had approximately 81% of its portfolio invested in gold companies, 14% in silver companies and 1% in platinum names, with the remaining assets allocated to other metals and minerals and cash. |
The views expressed reflect the opinions of BlackRock as of the date of this report and are subject to change based on changes in market, economic or other conditions. These views are not intended to be a forecast of future events and are no guarantee of future results.
| | | | | |
| Ten Largest Holdings | | Percent of
Long-Term
Investments |
Newcrest Mining Ltd. | | | | 8 | % |
Fresnillo Plc | | | | 7 | |
Yamana Gold, Inc. | | | | 7 | |
Eldorado Gold Corp. | | | | 7 | |
Goldcorp, Inc. | | | | 6 | |
Randgold Resources Ltd. - ADR | | | | 5 | |
Kinross Gold Corp. | | | | 4 | |
New Gold, Inc. | | | | 4 | |
Industrias Penoles SAB de CV | | | | 3 | |
Agnico-Eagle Mines Ltd. | | | | 3 | |
| | | | | |
| Geographic Allocation | | Percent of
Long-Term
Investments |
Canada | | | | 49 | % |
Australia | | | | 16 | |
Mexico | | | | 10 | |
United States | | | | 7 | |
Jersey, Channel Islands | | | | 7 | |
South Africa | | | | 5 | |
Peru | | | | 3 | |
United Kingdom | | | | 2 | |
Other1 | | | | 1 | |
1Other includes a 1% or less investment in each of the following countries: Russia, Hong Kong and China.
| | | | | | | | |
| | | | | | | | |
| | | | | | | | |
10 | | | | BLACKROCK FUNDS | | MARCH 31, 2013 | | |
| | |
| | |
| | |
| | BlackRock World Gold Fund |
|
Total Return Based on a $10,000 Investment |
| | 1 | Assuming maximum sales charges, if any, transaction costs and other operating expenses, including investment advisory fees. Institutional Shares do not have a sales charge. |
| | 2 | Under normal circumstances, the Fund will invest at least 80% of its net assets, plus any borrowings for investment purposes, in equity securities of gold-related companies. |
| | 3 | An index designed to reflect the performance of the worldwide market in the shares of companies whose principal activity is the mining of gold. |
| | 4 | Commencement of operations. |
|
Performance Summary for the Period Ended March 31, 2013 |
| | | | | | | | | | | | | | | | | | | | | | | | | |
| | | | | Average Annual Total Returns5 |
| | | | | 1 Year | | Since Inception6 |
| | | 6-Month
Total Returns | | w/o sales
charge | | w/ sales
charge | | w/o sales
charge | | w/ sales
charge |
Institutional | | | | (27.33 | )% | | | | (23.50 | )% | | | | N/A | | | | | (6.81 | )% | | | | N/A | |
Investor A | | | | (27.40 | ) | | | | (23.70 | ) | | | | (27.73 | )% | | | | (7.03 | ) | | | | (8.76 | )% |
Investor C | | | | (27.72 | ) | | | | (24.35 | ) | | | | (25.10 | ) | | | | (7.75 | ) | | | | (7.75 | ) |
FTSE Gold Mines Index | | | | (29.15 | ) | | | | (25.51 | ) | | | | N/A | | | | | (10.39 | ) | | | | N/A | |
| | 5 | Assuming maximum sales charges, if any. Average annual total returns with and without sales charges reflect reductions for distribution and service fees. See “About Fund Performance” on page 12 for a detailed description of share classes, including any related sales charges and fees. |
| | 6 | The Fund commenced operations on May 26, 2010. |
N/A - Not applicable as share class and index do not have a sales charge.
Past performance is not indicative of future results.
| | | | | | | | | | | | | | | | | | | | | | | | | | | | | | | | | | | |
| | | Actual | | Hypothetical8 | | |
| | | Beginning
Account Value
October 1, 2012 | | Ending
Account Value
March 31, 2013 | | Expenses Paid
During the Period7 | | Beginning
Account Value
October 1, 2012 | | Ending Account Value
March 31, 2013 | | Expenses Paid
During the Period7 | | Annualized Expense Ratio |
Institutional | | | $ | 1,000.00 | | | | $ | 726.70 | | | | $ | 5.34 | | | | $ | 1,000.00 | | | | $ | 1,018.75 | | | | $ | 6.24 | | | | | 1.24 | % |
Investor A | | | $ | 1,000.00 | | | | $ | 726.00 | | | | $ | 6.41 | | | | $ | 1,000.00 | | | | $ | 1,017.50 | | | | $ | 7.49 | | | | | 1.49 | % |
Investor C | | | $ | 1,000.00 | | | | $ | 722.80 | | | | $ | 9.75 | | | | $ | 1,000.00 | | | | $ | 1,013.61 | | | | $ | 11.40 | | | | | 2.27 | % |
| | 7 | For each class of the Fund, expenses are equal to the annualized expense ratio for the class, multiplied by the average account value over the period, multiplied by 182/365 (to reflect the one-half year period shown). |
| | 8 | Hypothetical 5% annual return before expenses is calculated by pro rating the number of days in the most recent fiscal half year divided by 365. |
| | | See “Disclosure of Expenses” on page 13 for further information on how expenses were calculated. |
| | | | | | | | |
| | | | | | | | |
| | | | | | | | |
| | | | BLACKROCK FUNDS | | MARCH 31, 2013 | | 11 |
| • | | Institutional Shares are not subject to any sales charge. These shares bear no ongoing distribution or service fees and are available only to eligible investors. |
| • | | Service Shares are not subject to any sales charge (front-end load) or deferred sales charge. These shares are subject to a service fee of 0.25% per year (but no distribution fee). |
| • | | Investor A Shares are subject to a maximum initial sales charge (front-end load) of 5.25% and a service fee of 0.25% per year (but no distribution fee). |
| • | | Investor B Shares are subject to a maximum contingent deferred sales charge (“CDSC”) of 4.50% declining to 0% after six years. In addition, these shares are subject to a distribution fee of 0.75% per year and a service fee of 0.25% per year. These shares automatically convert to Investor A Shares after approximately eight years. (There is no initial sales charge for automatic share conversions.) All returns for periods greater than eight years reflect this conversion. These shares are only available through exchanges and dividend reinvestments by existing shareholders and for purchase by certain employer-sponsored retirement plans. |
| • | | Investor C Shares are subject to a 1.00% CDSC if redeemed within one year of purchase. In addition, these shares are subject to a distribution fee of 0.75% per year and a service fee of 0.25% per year. |
| | Performance information reflects past performance and does not guarantee future results. Current performance may be lower or higher than the |
| | performance data quoted. Refer to www.blackrock.com/funds to obtain performance data current to the most recent month end. Performance results do not reflect the deduction of taxes that a shareholder would pay on fund distributions or the redemption of fund shares. Figures shown in each of the performance tables on the previous pages assume reinvestment of all dividends and distributions, if any, at net asset value (“NAV”) on the ex-dividend date. Investment return and principal value of shares will fluctuate so that shares, when redeemed, may be worth more or less than their original cost. Dividends paid to each class of shares will vary because of the different levels of service, distribution and transfer agency fees applicable to each class, which are deducted from the income available to be paid to shareholders. |
| | Performance for the BlackRock Energy & Resources Portfolio for the periods prior to January 28, 2005 is based on performance of a certain former State Street Research mutual fund that reorganized with BlackRock Energy & Resources Portfolio on that date. |
| | BlackRock Advisors, LLC (the “Manager”), the Funds’ investment advisor, waived and/or reimbursed a portion of each Fund’s expenses. Without such waiver and/or reimbursement, each Fund’s performance would have been lower. The Manager is under no obligation to waive or reimburse or to continue waiving or reimbursing its fees after the applicable termination date. See Note 3 of the Notes to Financial Statements for additional information on waivers and reimbursements. |
| | | | | | | | |
| | | | | | | | |
| | | | | | | | |
12 | | | | BLACKROCK FUNDS | | MARCH 31, 2013 | | |
Shareholders of the Funds may incur the following charges: (a) transactional expenses, such as sales charges; and (b) operating expenses, including investment advisory fees, service and distribution fees, including 12b-1 fees, acquired fund fees and expenses and other Fund expenses. The expense examples on the previous pages (which are based on a hypothetical investment of $1,000 invested on October 1, 2012 and held through March 31, 2013) are intended to assist shareholders both in calculating expenses based on an investment in each Fund and in comparing these expenses with similar costs of investing in other mutual funds.
The expense examples provide information about actual account values and actual expenses. In order to estimate the expenses a shareholder paid during the period covered by this report, shareholders can divide their account value by $1,000 and then multiply the result by the number corresponding to their Fund and share class under the headings entitled “Expenses Paid During the Period.”
The expense examples also provide information about hypothetical account values and hypothetical expenses based on a Fund’s actual expense ratio and an assumed rate of return of 5% per year before expenses. In order to assist shareholders in comparing the ongoing expenses of investing in these Funds and other funds, compare the 5% hypothetical example with the 5% hypothetical examples that appear in other funds’ shareholder reports.
The expenses shown in the expense examples are intended to highlight shareholders’ ongoing costs only and do not reflect any transactional expenses, such as sales charges, if any. Therefore, the hypothetical examples are useful in comparing ongoing expenses only, and will not help shareholders determine the relative total expenses of owning different funds. If these transactional expenses were included, shareholder expenses would have been higher.
Derivative Financial Instruments
The Funds may invest in various derivative financial instruments, including financial futures contracts and foreign currency exchange contracts, as specified in Note 2 of the Notes to Financial Statements, which may constitute forms of economic leverage. Such derivative financial instruments are used to obtain exposure to a security, index and/or market without owning or taking physical custody of securities or to hedge market, equity and/or foreign currency exchange rate risks. Derivative financial instruments involve risks, including the imperfect correlation between the value of a derivative financial instrument and the underlying asset, possible default of the counterparty to the transaction or illiquidity of the derivative financial instrument. The Funds’ ability to use a
derivative financial instrument successfully depends on the investment advisor’s ability to predict pertinent market movements accurately, which cannot be assured. The use of derivative financial instruments may result in losses greater than if they had not been used, may require a Fund to sell or purchase portfolio investments at inopportune times or for distressed values, may limit the amount of appreciation a Fund can realize on an investment, may result in lower dividends paid to shareholders or may cause a Fund to hold an investment that it might otherwise sell. The Funds’ investments in these instruments are discussed in detail in the Notes to Financial Statements.
| | | | | | | | |
| | | | | | | | |
| | | | | | | | |
| | | | BLACKROCK FUNDS | | MARCH 31, 2013 | | 13 |
| | |
| | |
| | |
| Schedule of Investments March 31, 2013 (Unaudited) | | BlackRock All-Cap Energy & Resources Portfolio |
| | (Percentages shown are based on Net Assets) |
| | | | | | | | |
| Common Stocks | | Shares | | | Value | |
| |
Energy Equipment & Services – 14.5% | | | | | | | | |
Atwood Oceanics, Inc. (a)(b) | | | 47,700 | | | $ | 2,506,158 | |
Baker Hughes, Inc. | | | 82,300 | | | | 3,819,543 | |
Basic Energy Services, Inc. (a) | | | 42,964 | | | | 587,318 | |
Core Laboratories NV | | | 48,300 | | | | 6,661,536 | |
Forum Energy Technologies, Inc. (a)(b) | | | 116,000 | | | | 3,336,160 | |
Halliburton Co. | | | 113,200 | | | | 4,574,412 | |
Key Energy Services, Inc. (a) | | | 306,900 | | | | 2,479,752 | |
National Oilwell Varco, Inc. | | | 74,100 | | | | 5,242,575 | |
Schlumberger Ltd. | | | 75,941 | | | | 5,687,221 | |
Seadrill Ltd. | | | 165,000 | | | | 6,005,703 | |
Technip SA | | | 40,900 | | | | 4,194,944 | |
| | | | | | | | |
| | | | | | | 45,095,322 | |
| |
Oil, Gas & Consumable Fuels – 83.0% | | | | | | | | |
Alpha Natural Resources, Inc. (a)(b) | | | 611,019 | | | | 5,016,466 | |
Anadarko Petroleum Corp. | | | 149,600 | | | | 13,082,520 | |
Angle Energy, Inc. (a) | | | 299,400 | | | | 909,413 | |
Apache Corp. | | | 130,830 | | | | 10,094,843 | |
Bill Barrett Corp. (a)(b) | | | 134,800 | | | | 2,732,396 | |
Cairn Energy Plc (a) | | | 730,000 | | | | 3,039,123 | |
Cenovus Energy, Inc. | | | 188,660 | | | | 5,846,573 | |
Chevron Corp. | | | 110,100 | | | | 13,082,082 | |
Cobalt International Energy, Inc. (a) | | | 75,800 | | | | 2,137,560 | |
Concho Resources, Inc. (a)(b) | | | 76,900 | | | | 7,492,367 | |
CONSOL Energy, Inc. | | | 358,130 | | | | 12,051,075 | |
Continental Resources, Inc. (a) | | | 80,200 | | | | 6,971,786 | |
Crescent Point Energy Corp. | | | 230,170 | | | | 8,676,909 | |
Crew Energy, Inc. (a) | | | 223,400 | | | | 1,574,538 | |
DeeThree Exploration Ltd. (a) | | | 422,653 | | | | 2,737,917 | |
Denbury Resources, Inc. (a)(b) | | | 529,690 | | | | 9,878,719 | |
Energy XXI Bermuda Ltd. | | | 287,900 | | | | 7,836,638 | |
EOG Resources, Inc. | | | 141,570 | | | | 18,130,870 | |
EQT Corp. | | | 79,410 | | | | 5,380,027 | |
Exxon Mobil Corp. | | | 68,400 | | | | 6,163,524 | |
Gulfport Energy Corp. (a)(b) | | | 173,800 | | | | 7,965,254 | |
Kodiak Oil & Gas Corp. (a) | | | 436,700 | | | | 3,969,603 | |
Long Run Exploration Ltd. (a) | | | 167,697 | | | | 746,748 | |
| | | | | | | | |
| Common Stocks | | Shares | | | Value | |
| |
Oil, Gas & Consumable Fuels (concluded) | | | | | |
Noble Energy, Inc. | | | 107,900 | | | $ | 12,479,714 | |
Occidental Petroleum Corp. | | | 159,850 | | | | 12,527,445 | |
Peabody Energy Corp. | | | 253,590 | | | | 5,363,429 | |
PetroChina Co. Ltd. - ADR | | | 19,090 | | | | 2,516,444 | |
Pioneer Natural Resources Co. | | | 56,900 | | | | 7,069,825 | |
Plains Exploration & Production Co. (a) | | | 188,610 | | | | 8,953,317 | |
Range Resources Corp. | | | 130,200 | | | | 10,551,408 | |
Rex Energy Corp. (a)(b) | | | 217,800 | | | | 3,589,344 | |
Rosetta Resources, Inc. (a) | | | 118,500 | | | | 5,638,230 | |
Royal Dutch Shell Plc - ADR | | | 95,800 | | | | 6,242,328 | |
Southwestern Energy Co. (a) | | | 86,400 | | | | 3,219,264 | |
Suncor Energy, Inc. | | | 212,980 | | | | 6,391,530 | |
Valero Energy Corp. | | | 81,700 | | | | 3,716,533 | |
Whiting Petroleum Corp. (a) | | | 279,960 | | | | 14,233,166 | |
| | | | | | | | |
| | | | | | | 258,008,928 | |
| |
Total Long-Term Investments (Cost – $241,017,209) – 97.5% | | | | | |
| 303,104,250
|
|
| |
| | | | | | | | |
| | | | | | | | |
| | |
Short-Term Securities | | | | | | | | |
| |
BlackRock Liquidity Funds, TempFund,
Institutional Class, 0.09% (c)(d) | | | 11,981,713 | | | | 11,981,713 | |
| |
| | | Beneficial
Interest
(000) | | | | |
| |
BlackRock Liquidity Series, LLC Money Market Series,
0.23% (c)(d)(e) | | $ | 26,946 | | | | 26,945,615 | |
| |
Total Short-Term Securities (Cost – $38,927,328) – 12.5% | | | | | | | 38,927,328 | |
| |
Total Investments (Cost – $279,944,537) – 110.0% | | | | 342,031,578 | |
Liabilities in Excess of Other Assets – (10.0)% | | | | (31,049,921 | ) |
| | | | | | | | |
Net Assets – 100.0% | | | | | | $ | 310,981,657 | |
| | | | | | | | |
| | | | | | | | |
| To simplify the listings of portfolio holdings in the Schedules of Investments, the names and descriptions of many of the securities have been abbreviated according to the following list: | | ADR | | American Depositary Receipts | | HKD | | Hong Kong Dollar |
| | CAD | | Canadian Dollar | | USD | | US Dollar |
| | GBP | | British Pound | | | | |
| | | | | | | | |
See Notes to Financial Statements. | | | | |
| | | | | | | | |
14 | | | | BLACKROCK FUNDS | | MARCH 31, 2013 | | |
| | |
| | |
| | |
| Schedule of Investments (continued) | | BlackRock All-Cap Energy & Resources Portfolio |
|
Notes to Schedule of Investments |
| | | | | | | | | | | | | | | | | | | | |
(a) | | Non-income producing security. | |
(b) | | Security, or a portion of security, is on loan. | |
(c) | | Investments in issuers considered to be an affiliate of the Fund during the six months ended March 31, 2013, for purposes of Section 2(a)(3) of the Investment Company Act of 1940, as amended, were as follows: | |
| | | |
| | | Affiliate | | Beneficial
Interest Held at
September 30,
2012 | | | Net Activity | | | Shares/
Beneficial
Interest Held at
March 31,
2013 | | | Income | |
| | | |
| | BlackRock Liquidity Funds, TempFund, Institutional Class | | | – | | | | 11,981,713 | | | | 11,981,713 | | | $ | 2,145 | |
| | BlackRock Liquidity Series, LLC Money Market Series | | | $17,312,472 | | | | $ 9,633,143 | | | | $26,945,615 | | | $ | 197,590 | |
| | | |
(d) | | Represents the current yield as of report date. | | | | | | | | | | | | | | | | |
(e) | | Security was purchased with the cash collateral from loaned securities. The Fund may withdraw up to 25% of its investment daily, although the manager of the BlackRock Liquidity Series LLC, Money Market Series, in its sole discretion, may permit an investor to withdraw more than 25% on any one day. | |
| |
• | | For Fund compliance purposes, the Fund’s industry classifications refer to any one or more of the industry sub-classifications used by one or more widely recognized market indexes or ratings group indexes, and/or as defined by Fund management. These definitions may not apply for purposes of this report, which may combine such industry sub-classifications for reporting ease. | |
| |
• | | Foreign currency exchange contracts as of March 31, 2013 were as follows: | |
| | | |
| | | Currency Purchased | | Currency Sold | | Counterparty | | | Settlement
Date | | | Unrealized
Appreciation | |
| | | |
| | | | | |
| | GBP 409,481 | | USD 619,955 | | | State Street Corp. | | | | 4/02/13 | | | | $2,375 | |
| | | |
| |
• | | Fair Value Measurements – Various inputs are used in determining the fair value of investments and derivative financial instruments. These inputs to valuation techniques are categorized into a disclosure hierarchy consisting of three broad levels for financial statement purposes as follows: | |
| | • Level 1 - unadjusted price quotations in active markets/exchanges for identical assets and liabilities that the Fund has the ability to access | |
| | • Level 2 - other observable inputs (including, but not limited to, quoted prices for similar assets or liabilities in markets that are active, quoted prices | |
| | for identical or similar assets or liabilities in markets that are not active, inputs other than quoted prices that are observable for the assets or liabilities (such as interest rates, yield curves, volatilities, prepayment speeds, loss severities, credit risks and default rates) or other market–corroborated inputs) | |
| | • Level 3 - unobservable inputs based on the best information available in the circumstances, to the extent observable inputs are not available | |
| | (including the Fund’s own assumptions used in determining the fair value of investments and derivative financial instruments) | |
| |
| | The hierarchy gives the highest priority to unadjusted quoted prices in active markets for identical assets or liabilities (Level 1 measurements) and the lowest priority to unobservable inputs (Level 3 measurements). Accordingly, the degree of judgment exercised in determining fair value is greatest for instruments categorized in Level 3. The inputs used to measure fair value may fall into different levels of the fair value hierarchy. In such cases, for disclosure purposes, the level in the fair value hierarchy within which the fair value measurement falls in its entirety is determined based on the lowest level input that is significant to the fair value measurement in its entirety. | |
| |
| | Changes in valuation techniques may result in transfers into or out of an assigned level within the disclosure hierarchy. In accordance with the Fund’s policy, transfers between different levels of the fair value disclosure hierarchy are deemed to have occurred as of the beginning of the reporting period. The categorization of a value determined for investments and derivative financial instruments is based on the pricing transparency of the investment and derivative financial instrument and is not necessarily an indication of the risks associated with investing in those securities. For information about the Fund’s policy regarding valuation of investments and derivative financial instruments and other significant accounting policies, please refer to Note 1 of the Notes to Financial Statements. | |
| | | | | | | | |
See Notes to Financial Statements. | | | | |
| | | | | | | | |
| | | | BLACKROCK FUNDS | | MARCH 31, 2013 | | 15 |
| | |
| | |
| | |
| Schedule of Investments (concluded) | | BlackRock All-Cap Energy & Resources Portfolio |
| | |
The following tables summarize the Fund’s investments and derivative financial instruments categorized in the disclosure hierarchy as of March 31, 2013:
| | | | | | | | | | | | | | |
| | | Level 1 | | | Level 2 | | | Level 3 | | Total | |
Assets: | | | | | | | | | | | | | | |
Investments: | | | | | | | | | | | | | | |
Long-Term Investments: | | | | | | | | | | | | | | |
Common Stocks: | | | | | | | | | | | | | | |
Energy Equipment & Services | | $ | 34,894,675 | | | $ | 10,200,647 | | | – | | $ | 45,095,322 | |
Oil, Gas & Consumable Fuels | | | 254,969,805 | | | | 3,039,123 | | | – | | | 258,008,928 | |
Short-Term Securities | | | 11,981,713 | | | | 26,945,615 | | | – | | | 38,927,328 | |
Total | | $ | 301,846,193 | | | $ | 40,185,385 | | | – | | $ | 342,031,578 | |
| | | | | | | | | | | | | | |
| | | Level 1 | | | Level 2 | | | Level 3 | | Total | |
Derivative Financial Instruments1 | | | | | | | | | | | | | | |
Assets: | | | | | | | | | | | | | | |
Foreign currency exchange contracts | | $ | 2,375 | | | | – | | | – | | $ | 2,375 | |
|
| 1 Derivative financial instruments are foreign currency exchange contracts which are valued at the unrealized appreciation/depreciation on the instrument. | |
|
Certain of the Fund’s assets and liabilities are held at carrying amount, which approximates fair value for financial statement purposes. As of March 31, 2013, such assets and liabilities are categorized within the disclosure hierarchy as follows: | |
| | | Level 1 | | | Level 2 | | | Level 3 | | Total | |
Assets: | | | | | | | | | | | | | | |
Foreign currency at value | | $ | 944,228 | | | | – | | | – | | $ | 944,228 | |
Liabilities: | | | | | | | | | | | | | | |
Bank overdraft | | | – | | | $ | (319,620 | ) | | – | | | (319,620 | ) |
Foreign bank overdraft | | | – | | | | (943,776 | ) | | – | | | (943,776 | ) |
Collateral on securities loaned at value | | | – | | | | (26,945,615 | ) | | – | | | (26,945,615 | ) |
Total | | $ | 944,228 | | | $ | (28,209,011 | ) | | – | | $ | (27,264,783 | ) |
There were no transfers between levels during the six months ended March 31, 2013.
| | | | | | | | |
See Notes to Financial Statements. | | | | |
| | | | | | | | |
16 | | | | BLACKROCK FUNDS | | MARCH 31, 2013 | | |
| | | | |
| | | | |
| | | | |
| Schedule of Investments March 31, 2013 (Unaudited) | | BlackRock China Fund | | |
| | (Percentages shown are based on Net Assets) | | |
| | | | | | | | |
| Common Stocks | | Shares | | | Value | |
| |
Aerospace & Defense – 0.9% | | | | | | | | |
AviChina Industry & Technology Co. Ltd., H Shares | | | 72,000 | | | $ | 35,473 | |
| |
Automobiles – 0.8% | | | | | | | | |
Dongfeng Motor Group Co. Ltd., Class H | | | 22,000 | | | | 31,008 | |
| |
Capital Markets – 1.8% | | | | | | | | |
Haitong Securities Co. Ltd., H Shares | | | 51,200 | | | | 70,551 | |
| |
Chemicals – 1.5% | | | | | | | | |
Huabao International Holdings Ltd. | | | 134,000 | | | | 58,201 | |
| |
Commercial Banks – 24.2% | | | | | | | | |
Agricultural Bank of China Ltd., H Shares | | | 296,000 | | | | 142,430 | |
Bank of China Ltd., H Shares | | | 257,000 | | | | 119,559 | |
China CITIC Bank Corp. Ltd., H Shares | | | 120,200 | | | | 72,465 | |
China Construction Bank Corp., H Shares | | | 465,000 | | | | 381,128 | |
China Minsheng Banking Corp. Ltd., H Shares | | | 14,500 | | | | 18,547 | |
Industrial & Commercial Bank of China, H Shares | | | 290,000 | | | | 203,934 | |
| | | | | | | | |
| | | | | | | 938,063 | |
| |
Communications Equipment – 0.3% | | | | | | | | |
ZTE Corp., H Shares | | | 6,800 | | | | 11,796 | |
| |
Construction & Engineering – 1.6% | | | | | | | | |
China Communications Construction Co. Ltd., H Shares | | | 68,000 | | | | 63,493 | |
| |
Construction Materials – 1.8% | | | | | | | | |
China Resources Cement Holdings Ltd. | | | 54,000 | | | | 30,689 | |
China Shanshui Cement Group Ltd. | | | 39,000 | | | | 22,503 | |
TCC International Holdings Ltd. | | | 66,000 | | | | 17,741 | |
| | | | | | | | |
| | | | | | | 70,933 | |
| |
Diversified Telecommunication Services – 3.0% | | | | | |
China Unicom Hong Kong Ltd. | | | 85,327 | | | | 114,977 | |
| |
Electrical Equipment – 5.5% | | | | | | | | |
Dongfang Electric Corp. Ltd., H Shares | | | 12,000 | | | | 19,952 | |
Shanghai Electric Group Co. Ltd., H Shares | | | 58,000 | | | | 22,659 | |
Xinjiang Goldwind Science & Technology Co. Ltd., H Shares | | | 51,610 | | | | 31,080 | |
ZhuZhou CSR Times Electric Co. Ltd., H Shares | | | 49,000 | | | | 139,547 | |
| | | | | | | | |
| | | | | | | 213,238 | |
| |
Food Products – 1.8% | | | | | | | | |
Uni-President China Holdings Ltd. | | | 60,000 | | | | 68,656 | |
| |
Health Care Equipment & Supplies – 1.0% | | | | | | | | |
Mindray Medical International Ltd. - ADR | | | 1,016 | | | | 40,579 | |
| |
Health Care Providers & Services – 2.0% | | | | | | | | |
Sinopharm Group Co. Ltd., H Shares | | | 24,000 | | | | 77,544 | |
| |
Hotels, Restaurants & Leisure – 0.9% | | | | | | | | |
Home Inns & Hotels Management,
Inc. - ADR (a) | | | 355 | | | | 10,575 | |
REXLot Holdings Ltd. | | | 275,000 | | | | 24,135 | |
| | | | | | | | |
| | | | | | | 34,710 | |
| |
Independent Power Producers & Energy Traders – 3.8% | |
China Resources Power Holdings Co. Ltd. | | | 32,000 | | | | 95,843 | |
Datang International Power Generation Co. Ltd., H Shares | | | 116,000 | | | | 51,286 | |
| | | | | | | | |
| | | | | | | 147,129 | |
| |
| | | | | | | | |
| Common Stocks | | Shares | | | Value | |
| |
Insurance – 6.5% | | | | | | | | |
China Life Insurance Co. Ltd., H Shares | | | 31,000 | | | $ | 80,870 | |
China Pacific Insurance Group Co. Ltd., H Shares | | | 37,800 | | | | 124,831 | |
New China Life Insurance Co. Ltd., H Shares | | | 13,912 | | | | 47,566 | |
| | | | | | | | |
| | | | | | | 253,267 | |
| |
Internet Software & Services – 0.8% | | | | | | | | |
SINA Corp. | | | 636 | | | | 30,903 | |
| |
Life Sciences Tools & Services – 2.0% | | | | | | | | |
WuXi PharmaTech Cayman, Inc. - ADR (a) | | | 4,581 | | | | 78,702 | |
| |
Machinery – 0.7% | | | | | | | | |
China Rongsheng Heavy Industries Group Holdings Ltd. | | | 37,000 | | | | 6,032 | |
CSR Corp. Ltd., H Shares | | | 27,860 | | | | 19,854 | |
| | | | | | | | |
| | | | | | | 25,886 | |
| |
Marine – 0.6% | | | | | | | | |
China Shipping Development Co. Ltd., H Shares | | | 46,000 | | | | 22,432 | |
| |
Metals & Mining – 1.8% | | | | | | | | |
Shougang Fushan Resources Group Ltd. | | | 84,000 | | | | 37,572 | |
Zijin Mining Group Co. Ltd., H Shares | | | 94,000 | | | | 31,155 | |
| | | | | | | | |
| | | | | | | 68,727 | |
| |
Oil, Gas & Consumable Fuels – 14.1% | | | | | | | | |
China Coal Energy Co. Ltd., H Shares | | | 65,000 | | | | 58,195 | |
China Petroleum & Chemical Corp., H Shares | | | 156,000 | | | | 182,922 | |
CNOOC Ltd. | | | 133,000 | | | | 255,718 | |
PetroChina Co. Ltd., H Shares | | | 38,000 | | | | 50,035 | |
| | | | | | | | |
| | | | | | | 546,870 | |
| |
Paper & Forest Products – 2.1% | | | | | | | | |
Lee & Man Paper Manufacturing Ltd. | | | 51,000 | | | | 40,086 | |
Nine Dragons Paper Holdings Ltd. | | | 42,000 | | | | 39,660 | |
| | | | | | | | |
| | | | | | | 79,746 | |
| |
Real Estate Management & Development – 4.6% | | | | | |
China Vanke Co. Ltd., B Shares | | | 20,800 | | | | 40,189 | |
Franshion Properties China Ltd. | | | 120,000 | | | | 39,340 | |
Poly Property Group Co. Ltd. (a) | | | 11,000 | | | | 6,988 | |
Shenzhen Investment Ltd. | | | 110,201 | | | | 44,363 | |
Shimao Property Holdings Ltd. | | | 6,500 | | | | 12,531 | |
Shui On Land Ltd. | | | 84,500 | | | | 36,446 | |
| | | | | | | | |
| | | | | | | 179,857 | |
| |
Semiconductors & Semiconductor Equipment – 0.4% | |
Trina Solar Ltd. - ADR (a) | | | 3,996 | | | | 14,506 | |
| |
Software – 2.1% | | | | | | | | |
Kingdee International Software Group
Co. Ltd. (a) | | | 146,000 | | | | 24,150 | |
Kingsoft Corp. Ltd. | | | 35,000 | | | | 32,280 | |
Shanda Games Ltd. - ADR | | | 8,544 | | | | 25,461 | |
| | | | | | | | |
| | | | | | | 81,891 | |
| |
Specialty Retail – 0.7% | | | | | | | | |
GOME Electrical Appliances Holding Ltd. (a) | | | 232,000 | | | | 25,468 | |
| |
Textiles, Apparel & Luxury Goods – 0.7% | | | | | | | | |
Peak Sport Products Co. Ltd. | | | 86,000 | | | | 13,881 | |
| | | | | | | | |
See Notes to Financial Statements. | | | | |
| | | | | | | | |
| | | | BLACKROCK FUNDS | | MARCH 31, 2013 | | 17 |
| | |
| | |
| | |
| Schedule of Investments (continued) | | BlackRock China Fund |
| | (Percentages shown are based on Net Assets) |
| | | | | | | | |
| Common Stocks | | Shares | | | Value | |
| |
Textiles, Apparel & Luxury Goods (concluded) | | | | | | | | |
Ports Design Ltd. | | | 15,500 | | | $ | 12,967 | |
| | | | | | | | |
| | | | | | | 26,848 | |
| |
Transportation Infrastructure – 2.8% | | | | | | | | |
Beijing Capital International Airport Co. Ltd., H Shares | | | 96,000 | | | | 70,078 | |
COSCO Pacific Ltd. | | | 26,000 | | | | 37,642 | |
| | | | | | | | |
| | | | | | | 107,720 | |
| |
Wireless Telecommunication Services – 4.1% | | | | | |
China Mobile Ltd. | | | 14,784 | | | | 156,788 | |
| |
Total Common Stocks – 94.9% | | | | | | | 3,675,962 | |
| |
| | | | | | | | |
Participation Notes (a) | | | | | | | | |
| |
Automobiles – 1.6% | | | | | | | | |
Citigroup Global Markets Holding (SAIC Motor Corp. Ltd.), due 1/20/15 | | | 16,600 | | | | 40,728 | |
Deutsche Bank AG (BYD Co. Ltd.), due 11/10/16 | | | 3,500 | | | | 11,158 | |
Deutsche Bank AG (SAIC Motor Corp. Ltd.), due 7/13/17 | | | 4,200 | | | | 10,305 | |
| | | | | | | | |
| | | | | | | 62,191 | |
| |
Commercial Banks – 0.9% | | | | | | | | |
Citigroup Global Markets Holding (China Merchants Bank Co. Ltd.), due 1/20/15 | | | 17,400 | | | | 34,001 | |
| |
| | | | | | | | |
| Participation Notes (a) | | Shares | | | Value | |
| |
Construction Materials – 0.7% | | | | | | | | |
Citigroup Global Markets Holding (Anhui Conch Cement Co. Ltd.), due 1/20/15 | | | 9,000 | | | $ | 24,648 | |
Deutsche Bank AG (Anhui Conch Cement Co. Ltd.), due 10/10/17 | | | 1,300 | | | | 3,559 | |
| | | | | | | | |
| | | | | | | 28,207 | |
| |
Metals & Mining – 0.9% | | | | | | | | |
Citigroup Global Markets Holding (Baoshan Iron & Steel Co. Ltd.), due 1/20/15 | | | 40,100 | | | | 30,555 | |
UBS AG (Baoshan Iron & Steel Co. Ltd.), due 6/18/13 | | | 6,487 | | | | 4,943 | |
| | | | | | | | |
| | | | | | | 35,498 | |
| |
Total Participation Notes – 4.1% | | | | | | | 159,897 | |
| |
Total Long-Term Investments (Cost – $4,071,517) – 99.0% | | | | | | | 3,835,859 | |
| |
| | | | | | | | |
Short-Term Securities | | | | | | | | |
| |
BlackRock Liquidity Funds, TempFund, Institutional Class, 0.09% (b)(c) | | | 59,987 | | | | 59,987 | |
| |
Total Short-Term Securities (Cost – $59,987) – 1.6% | | | | | | | 59,987 | |
| |
Total Investments (Cost – $4,131,504) – 100.6% | | | | 3,895,846 | |
Liabilities in Excess of Other Assets – (0.6)% | | | | (22,891 | ) |
| | | | | | | | |
Net Assets – 100.0% | | | | | | $ | 3,872,955 | |
| | | | | | | | |
| | | | | | | | | | | | | | |
| Notes to Schedule of Investments |
(a) | | Non-income producing security. |
| (b) | | Investments in issuers considered to be an affiliate of the Fund during the six months ended March 31, 2013, for purposes of Section 2(a)(3) of the Investment Company Act of 1940, as amended, were as follows: |
| | |
| | | Affiliate | | Shares Held at September 30, 2012 | | Net Activity | | Shares Held at
March 31, 2013 | | Income |
| | |
| | BlackRock Liquidity Funds, TempFund, Institutional Class | | 172,872 | | (112,885) | | 59,987 | | $111 |
| | |
| |
(c) | | Represents the current yield as of report date. |
| |
— | | For Fund compliance purposes, the Fund’s industry classifications refer to any one or more of the industry sub classifications used by one or more widely recognized market indexes or ratings group indexes, and/or as defined by Fund management. These definitions may not apply for purposes of this report, which may combine such industry sub-classifications for reporting ease. |
| |
— | | Financial futures contracts as of March 31, 2013 were as follows: |
| | |
| | | Contracts | | Issue | | Exchange | | Expiration | | Notional Value | | Unrealized
Depreciation |
| | |
| | 5 | | FTSE China A50 | | Singapore Exchange | | April 2013 | | $39,850 | | $(2,352) |
| | |
| |
— | | Foreign currency exchange contracts as of March 31, 2013 were as follows: |
| |
| | |
| | | Currency
Purchased | | | | Currency Sold | | | | Counterparty | | Settlement Date | | Unrealized Depreciation |
| | |
| | USD | | 18,559 | | HKD | | 144,102 | | Goldman Sachs Group, Inc. | | 4/03/13 | | $(3) |
| | |
| | | | | | | | |
See Notes to Financial Statements. |
| | | | | | | | |
18 | | | | BLACKROCK FUNDS | | MARCH 31, 2013 | | |
| | |
| | |
| | |
| Schedule of Investments (continued) | | BlackRock China Fund |
| | | | | | | | | | | | |
— | | Fair Value Measurements – Various inputs are used in determining the fair value of investments and derivative financial instruments. These inputs to valuation techniques are categorized into a disclosure hierarchy consisting of three broad levels for financial statement purposes as follows: |
| | |
| | — | | Level 1 - unadjusted price quotations in active markets/exchanges for identical assets and liabilities that the Fund has the ability to access |
| | |
| | — | | Level 2 - other observable inputs (including, but not limited to, quoted prices for similar assets or liabilities in markets that are active, quoted prices for identical or similar assets or liabilities in markets that are not active, inputs other than quoted prices that are observable for the assets or liabilities (such as interest rates, yield curves, volatilities, prepayment speeds, loss severities, credit risks and default rates) or other market–corroborated inputs) |
| | |
| | — | | Level 3 - unobservable inputs based on the best information available in the circumstances, to the extent observable inputs are not available (including the Fund’s own assumptions used in determining the fair value of investments and derivative financial instruments) |
| |
| | The hierarchy gives the highest priority to unadjusted quoted prices in active markets for identical assets or liabilities (Level 1 measurements) and the lowest priority to unobservable inputs (Level 3 measurements). Accordingly, the degree of judgment exercised in determining fair value is greatest for instruments categorized in Level 3. The inputs used to measure fair value may fall into different levels of the fair value hierarchy. In such cases, for disclosure purposes, the level in the fair value hierarchy within which the fair value measurement falls in its entirety is determined based on the lowest level input that is significant to the fair value measurement in its entirety. |
| |
| | Changes in valuation techniques may result in transfers into or out of an assigned level within the disclosure hierarchy. In accordance with the Fund’s policy, transfers between different levels of the fair value disclosure hierarchy are deemed to have occurred as of the beginning of the reporting period. The categorization of a value determined for investments and derivative financial instruments is based on the pricing transparency of the investment and derivative financial instrument and is not necessarily an indication of the risks associated with investing in those securities. For information about the Fund’s policy regarding valuation of investments and derivative financial instruments and other significant accounting policies, please refer to Note 1 of the Notes to Financial Statements. |
| |
| | The following table summarizes the Fund’s investments and derivative financial instruments categorized in the disclosure hierarchy as of March 31, 2013: |
| |
| | |
| | | | | Level 1 | | Level 2 | | Level 3 | | Total |
| | |
| | Assets: | | | | | | | | |
| | Investments: | | | | | | | | |
| | Long-Term Investments: | | | | | | | | |
| | Common Stocks: | | | | | | | | |
| | Aerospace & Defense | | – | | $ 35,473 | | – | | $ 35,473 |
| | Automobiles | | – | | 31,008 | | – | | 31,008 |
| | Capital Markets | | – | | 70,551 | | – | | 70,551 |
| | Chemicals | | – | | 58,201 | | – | | 58,201 |
| | Commercial Banks | | – | | 938,063 | | – | | 938,063 |
| | Communications Equipment | | – | | 11,796 | | – | | 11,796 |
| | Construction & Engineering | | – | | 63,493 | | – | | 63,493 |
| | Construction Materials | | – | | 70,933 | | – | | 70,933 |
| | Diversified Telecommunication Services | | – | | 114,977 | | – | | 114,977 |
| | Electrical Equipment | | – | | 213,238 | | – | | 213,238 |
| | Food Products | | – | | 68,656 | | – | | 68,656 |
| | Health Care Equipment & Supplies | | $ 40,579 | | – | | – | | 40,579 |
| | Health Care Providers & Services | | – | | 77,544 | | – | | 77,544 |
| | Hotels, Restaurants & Leisure | | 10,575 | | 24,135 | | – | | 34,710 |
| | Independent Power Producers & Energy Traders | | – | | 147,129 | | – | | 147,129 |
| | Insurance | | – | | 253,267 | | – | | 253,267 |
| | Internet Software & Services | | 30,903 | | – | | – | | 30,903 |
| | Life Sciences Tools & Services | | 78,702 | | – | | – | | 78,702 |
| | Machinery | | – | | 25,886 | | – | | 25,886 |
| | Marine | | – | | 22,432 | | – | | 22,432 |
| | Metals & Mining | | – | | 68,727 | | – | | 68,727 |
| | Oil, Gas & Consumable Fuels | | – | | 546,870 | | – | | 546,870 |
| | Paper & Forest Products | | – | | 79,746 | | – | | 79,746 |
| | Real Estate Management & Development | | 40,189 | | 139,668 | | – | | 179,857 |
| | Semiconductors & Semiconductor Equipment | | 14,506 | | – | | – | | 14,506 |
| | Software | | 25,461 | | 56,430 | | – | | 81,891 |
| | Specialty Retail | | – | | 25,468 | | – | | 25,468 |
| | Textiles, Apparel & Luxury Goods | | – | | 26,848 | | – | | 26,848 |
| | Transportation Infrastructure | | – | | 107,720 | | – | | 107,720 |
| | Wireless Telecommunication Services | | – | | 156,788 | | – | | 156,788 |
| | | | | | | | |
See Notes to Financial Statements. |
| | | | | | | | |
| | | | BLACKROCK FUNDS | | MARCH 31, 2013 | | 19 |
| | |
| | |
| | |
| Schedule of Investments (concluded) | | BlackRock China Fund |
| | | | | | | | | | | | | | |
| | | Level 1 | | | Level 2 | | | Level 3 | | Total | |
Participation Notes: | | | | | | | | | | | | | | |
Automobiles | | | – | | | $ | 62,191 | | | – | | $ | 62,191 | |
Commercial Banks | | | – | | | | 34,001 | | | – | | | 34,001 | |
Construction Materials | | | – | | | | 28,207 | | | – | | | 28,207 | |
Metals & Mining | | | – | | | | 35,498 | | | – | | | 35,498 | |
Short-Term Securities | | | $ 59,987 | | | | – | | | – | | | 59,987 | |
Total | | | $ 300,902 | | | $ | 3,594,944 | | | – | | $ | 3,895,846 | |
| | | | | | | | | | | | |
| Valuation Inputs | | Level 1 | | | Level 2 | | | Level 3 | | Total | |
Derivative Financial Instruments1 | | | | | | | | | | | | | | |
Liabilities: | | | | | | | | | | | | | | |
Foreign currency exchange contracts | | | $ (3 | ) | | | – | | | – | | $ | (3 | ) |
Equity contracts | | | (2,352 | ) | | | – | | | – | | | (2,352 | ) |
Total | | | $ (2,355 | ) | | | – | | | – | | $ | (2,355 | ) |
|
1 Derivative financial instruments are financial future contracts and foreign currency exchange contracts which are valued at the unrealized appreciation/depreciation on the instrument. | |
|
Certain of the Fund’s assets and liabilities are held at carrying amount, which approximates fair value for financial statement purposes. As of March 31, 2013, such assets and liabilities are categorized within the disclosure hierarchy as follows: | |
| | | Level 1 | | | Level 2 | | | Level 3 | | Total | |
Assets: | | | | | | | | | | | | | | |
Foreign currency at value | | | $ 4,308 | | | | – | | | – | | $ | 4,308 | |
Liabilities: | | | | | | | | | | | | | | |
Bank overdraft | | | – | | | | $ (1,225) | | | – | | | (1,225 | ) |
Total | | | $ 4,308 | | | | $ (1,225) | | | – | | $ | 3,083 | |
Certain foreign securities are fair valued utilizing an external pricing service to reflect any significant market movements between the time the Fund values such foreign securities and the earlier closing of foreign markets. Such fair valuations are categorized as Level 2 in the disclosure hierarchy. On March 29, 2013, US and certain other financial markets were closed, while some foreign markets were open. The Fund was re-priced for financial reporting purposes to reflect, in the valuation, the transactions related to open foreign market activities and were valued at the official closing price on the primary market or exchange on which the securities trade. The re-pricing resulted in the investments being categorized as Level 1. Therefore, these securities, with a value of $25,191, were transferred from Level 2 to Level 1 during the period September 30, 2012 to March 31, 2013.
| | | | | | | | |
See Notes to Financial Statements. | | | | |
| | | | | | | | |
20 | | | | BLACKROCK FUNDS | | MARCH 31, 2013 | | |
| | |
| | |
| | |
| Schedule of Investments March 31, 2013 (Unaudited) | | BlackRock Energy & Resources Portfolio |
| | (Percentages shown are based on Net Assets) |
| | | | | | | | |
| Common Stocks | | Shares | | | Value | |
| |
Commercial Services & Supplies – 0.0% | | | | | |
Republic Resources, Inc. (a) | | | 28,750 | | | $ | – | |
| |
Energy Equipment & Services – 8.1% | | | | | | | | |
Basic Energy Services, Inc. (a) | | | 403,595 | | | | 5,517,144 | |
Diamond Offshore Drilling, Inc. | | | 115,200 | | | | 8,013,312 | |
Essential Energy Services Trust (a) | | | 724,069 | | | | 1,580,097 | |
Halliburton Co. | | | 326,226 | | | | 13,182,793 | |
Lufkin Industries, Inc. | | | 87,668 | | | | 5,820,278 | |
McDermott International, Inc. (a) | | | 547,800 | | | | 6,020,322 | |
Parker Drilling Co. (a) | | | 296,048 | | | | 1,267,085 | |
Poseidon Concepts Corp. | | | 35,081 | | | | 5,255 | |
Schlumberger Ltd. | | | 60,800 | | | | 4,553,312 | |
Transocean Ltd. (a) | | | 84,900 | | | | 4,411,404 | |
Western Energy Services Corp. | | | 463,060 | | | | 3,389,753 | |
Western Energy Services Corp. (Acquired 2/25/10, cost $3,752,521) (a)(b) | | | 1,000,000 | | | | 7,353,448 | |
| | | | | | | | |
| | | | | | | 61,114,203 | |
| |
Machinery – 0.0% | | | | | | | | |
Railpower Technologies Corp. (a) | | | 360,600 | | | | – | |
| |
Metals & Mining – 1.1% | | | | | | | | |
Alexco Resource Corp. (a) | | | 312,380 | | | | 1,030,278 | |
Archipelago Resources Plc (a) | | | 1,759,200 | | | | 1,544,023 | |
Balmoral Resources Ltd. (a) | | | 455,400 | | | | 340,218 | |
Banro Corp. (a) | | | 782,700 | | | | 1,338,738 | |
Crosshair Energy Corp. (a) | | | 109,600 | | | | 10,774 | |
Eastmain Resources, Inc. (a) | | | 2,622,500 | | | | 1,675,636 | |
MAG Silver Corp. (a) | | | 123,593 | | | | 1,171,175 | |
Pilot Gold, Inc. (a) | | | 402,900 | | | | 665,361 | |
Virginia Mines, Inc. (a) | | | 52,105 | | | | 506,043 | |
| | | | | | | | |
| | | | | | | 8,282,246 | |
| |
Oil, Gas & Consumable Fuels – 88.3% | | | | | |
Alpha Natural Resources, Inc. (a) | | | 2,795,589 | | | | 22,951,786 | |
Americas Petrogas, Inc. (a) | | | 3,614,333 | | | | 6,857,036 | |
Anadarko Petroleum Corp. | | | 74,200 | | | | 6,488,790 | |
Angle Energy, Inc. (a) | | | 1,179,100 | | | | 3,581,460 | |
Antares Energy Ltd. (Acquired 6/14/10, cost $5,189,100) (a)(b) | | | 10,000,000 | | | | 5,203,000 | |
Arch Coal, Inc. | | | 1,431,800 | | | | 7,774,674 | |
Aurora Oil & Gas Ltd. (a) | | | 899,000 | | | | 3,358,105 | |
Baytex Energy Corp. | | | 132,948 | | | | 5,563,350 | |
Bellatrix Exploration Ltd. (a) | | | 814,632 | | | | 5,237,092 | |
BPZ Resources, Inc. (a) | | | 307,293 | | | | 697,555 | |
Cabot Oil & Gas Corp. | | | 183,700 | | | | 12,419,957 | |
Cairn Energy Plc (a) | | | 1,800,000 | | | | 7,493,728 | |
Carrizo Oil & Gas, Inc. (a) | | | 274,500 | | | | 7,073,865 | |
Clayton Williams Energy, Inc. (a) | | | 469,321 | | | | 20,523,407 | |
Coastal Energy Co. (a) | | | 1,020,600 | | | | 19,462,931 | |
Cobalt International Energy, Inc. (a) | | | 578,187 | | | | 16,304,873 | |
CONSOL Energy, Inc. | | | 1,350,200 | | | | 45,434,230 | |
Crew Energy, Inc. (a) | | | 1,575,937 | | | | 11,105,387 | |
Crew Energy, Inc. (Acquired 6/24/98 through 10/09/98, cost $183,115) (a)(b) | | | 191,300 | | | | 1,350,220 | |
Crocotta Energy, Inc. (a) | | | 1,708,300 | | | | 5,793,409 | |
| | | | | | | | |
| Common Stocks | | Shares | | | Value | |
| |
Oil, Gas & Consumable Fuels (concluded) | |
DeeThree Exploration Ltd. (a) | | | 947,600 | | | $ | 6,138,488 | |
Denbury Resources, Inc. (a) | | | 66,700 | | | | 1,243,955 | |
Energy XXI Bermuda Ltd. | | | 1,260,480 | | | | 34,310,266 | |
EOG Resources, Inc. | | | 83,900 | | | | 10,745,073 | |
EQT Corp. | | | 698,900 | | | | 47,350,475 | |
Far East Energy Corp. (a) | | | 10,629,462 | | | | 690,915 | |
FX Energy, Inc. (a) | | | 223,238 | | | | 750,080 | |
Greenfields Petroleum Corp. (Acquired 11/03/10, cost $926,522) (b) | | | 110,000 | | | | 421,704 | |
Gulfport Energy Corp. (a) | | | 401,500 | | | | 18,400,745 | |
Ithaca Energy, Inc. (a) | | | 210,000 | | | | 357,122 | |
Kodiak Oil & Gas Corp. (a) | | | 1,015,300 | | | | 9,229,077 | |
Long Run Exploration Ltd. (a) | | | 393,333 | | | | 1,751,498 | |
Longview Energy Co. (Acquired 8/13/04, cost $1,281,000) (a)(b) | | | 85,400 | | | | 1,349,741 | |
Magnum Hunter Resources Corp. (a) | | | 2,017,000 | | | | 8,088,170 | |
Manitok Energy, Inc. (a) | | | 1,563,400 | | | | 4,118,659 | |
Matador Resources Co. (Acquired 10/14/03 through 4/13/06, cost $2,957,155) (a)(b) | | | 513,393 | | | | 4,548,662 | |
McMoRan Exploration Co. (a) | | | 398,300 | | | | 6,512,205 | |
Noble Energy, Inc. | | | 135,000 | | | | 15,614,100 | |
Novus Energy, Inc. (a) | | | 2,679,200 | | | | 2,501,956 | |
NuVista Energy Ltd. (a) | | | 639,800 | | | | 4,087,978 | |
Pace Oil and Gas Ltd. (a)(c) | | | 2,140,170 | | | | 6,058,871 | |
Painted Pony Petroleum Ltd. (a) | | | 916,000 | | | | 9,175,307 | |
Pan Orient Energy Corp. | | | 750,700 | | | | 1,992,421 | |
PDC Energy, Inc. (a) | | | 302,800 | | | | 15,009,796 | |
Peabody Energy Corp. | | | 818,336 | | | | 17,307,806 | |
Penn Virginia Corp. | | | 341,087 | | | | 1,377,991 | |
Pioneer Energy Services Corp. (a) | | | 782,700 | | | | 6,457,275 | |
Pioneer Natural Resources Co. | | | 276,200 | | | | 34,317,850 | |
Plains Exploration & Production Co. (a) | | | 981,725 | | | | 46,602,486 | |
PRD Energy, Inc. (a) | | | 570,500 | | | | 316,851 | |
Range Resources Corp. | | | 561,200 | | | | 45,479,648 | |
Rex Energy Corp. (a) | | | 435,600 | | | | 7,178,688 | |
Rosetta Resources, Inc. (a) | | | 453,400 | | | | 21,572,772 | |
Scorpio Tankers, Inc. (a) | | | 688,300 | | | | 6,139,636 | |
Sonde Resources Corp. (a) | | | 975,460 | | | | 1,287,607 | |
Sonde Resources Corp. (Acquired 1/15/10, cost $3,034,134) (a)(b) | | | 1,200,000 | | | | 1,651,430 | |
Southwestern Energy Co. (a) | | | 354,500 | | | | 13,208,670 | |
Tourmaline Oil Corp. (a) | | | 57,420 | | | | 2,217,102 | |
Triangle Petroleum Corp. (a) | | | 270,100 | | | | 1,782,660 | |
Trilogy Energy Corp. | | | 748,722 | | | | 21,564,489 | |
Trioil Resources Ltd., Class A (a) | | | 634,083 | | | | 1,826,269 | |
Valero Energy Corp. | | | 170,000 | | | | 7,733,300 | |
Yoho Resources, Inc. (a) | | | 1,680,300 | | | | 4,790,003 | |
| | | | | | | | |
| | | | | | | 667,934,652 | |
| |
Total Common Stocks – 97.5% | | | | | | | 737,331,101 | |
| |
| | | | | | | | |
| | | | | | | | |
| | | | | | | | |
See Notes to Financial Statements. | | | | |
| | | | | | | | |
| | | | BLACKROCK FUNDS | | MARCH 31, 2013 | | 21 |
| | |
| | |
| | |
| Schedule of Investments (continued) | | BlackRock Energy & Resources Portfolio |
| | (Percentages shown are based on Net Assets) |
| | | | | | | | |
| Warrants (d) | | Shares | | | Value | |
| |
Oil, Gas & Consumable Fuels – 0.0% | | | | | | | | |
Magnum Hunter Resources Corp. (Issued/ Exercisable 8/29/11, 1 Share for 1 Warrant, Expires 10/14/13, Strike Price USD 10.50) (a) | | | 60,050 | | | | $7,807 | |
| |
Total Long-Term Investments (Cost – $613,775,530) – 97.5% | | | | | | | 737,338,908 | |
| |
| | | | | | | | |
| | | | | | | | |
| | | | | | | | |
| Short-Term Securities | | Shares | | | Value | |
| |
BlackRock Liquidity Funds, TempFund, Institutional Class, 0.09% (e)(f) | | | 13,142,954 | | | | $13,142,954 | |
| |
Total Short-Term Securities (Cost – $13,142,954) – 1.7% | | | | 13,142,954 | |
| |
Total Investments (Cost – $626,918,484) – 99.2% | | | | 750,481,862 | |
Other Assets in Excess of Liabilities – 0.8% | | | | 5,699,185 | |
| | | | | | | | |
Net Assets – 100.0% | | | $ | 756,181,047 | |
| | | | | | | | |
|
Notes to Schedule of Investments |
| | | | | | | | | | | | | | | | | | | | |
(a) | | Non-income producing security. | |
(b) | | Restricted security as to resale. As of report date, the Fund held 2.9% of its net assets, with a current value of $21,878,205 and an original cost of $17,323,547, in these securities. | |
(c) | | Investments in issuers (whereby the Fund held 5% or more of the companies’ outstanding securities) that were considered to be an affiliate during the six months ended March 31, 2013, for purposes of Section 2(a)(3) of the Investment Company Act of 1940, as amended, were as follows: | |
| | | |
| | | Affiliate | | Shares Held at
September 30,
2012 | | | Shares Sold | | Shares Held at
March 31,
2013 | | | Value at
March 31,
2013 | | | Realized Loss | |
| | | |
| | Pace Oil and Gas Ltd.1 | | | 2,391,389 | | | 251,219 | | | 2,642,608 | | | | $6,058,871 | | | | $(1,506,898) | |
| | | |
| | 1No longer an affiliated company as of report date. | | | | | | | | | | | | | | | | | | |
(d) | | Warrants entitle the Fund to purchase a predetermined number of shares of common stock and are non-income producing. The purchase price and number of shares are subject to adjustment under certain conditions until the expiration date of the warrants, if any. | |
(e) | | Investments in issuers considered to be an affiliate of the Fund during the six months ended March 31, 2013, for purposes of Section 2(a)(3) of the Investment Company Act of 1940, as amended, were as follows: | |
| | | |
| | | Affiliate | | | Shares Held at
September 30,
2012 | | Net Activity | | | Shares Held at
March 31,
2013 | | | Income | |
| | | |
| | BlackRock Liquidity Funds, TempFund, Institutional Class | | | — | | | 13,142,954 | | | | 13,142,954 | | | | $2,478 | |
| | | |
(f) | | Representsthe current yield as of report date. | |
| |
— | | For Fund compliance purposes, the Fund’s industry classifications refer to any one or more of the industry sub-classifications used by one or more widely recognized market indexes or ratings group indexes, and/or as defined by Fund management. These definitions may not apply for purposes of this report, which may combine such industry sub-classifications for reporting ease. | |
— | | Foreign currency exchange contracts as of March 31, 2013 were as follows: | |
| | | |
| | | | | | | | | | | | | | | | | | | | | | | | | | | |
Currency Purchased | | | | Currency
Sold | | | | Counterparty | | Settlement
Date | | Unrealized
Appreciation
(Depreciation) |
USD | | | | 740,946 | | | CAD | | | | 753,981 | | | Citigroup, Inc. | | | | 4/01/13 | | | | $ | (212 | ) |
GBP | | | | 1,009,680 | | | USD | | | | 1,528,656 | | | State Street Corp. | | | | 4/02/13 | | | | | 5,856 | |
USD | | | | 957,929 | | | CAD | | | | 973,567 | | | Goldman Sachs Group, Inc. | | | | 4/02/13 | | | | | 919 | |
USD | | | | 1,281,293 | | | CAD | | | | 1,302,880 | | | Goldman Sachs Group, Inc. | | | | 4/03/13 | | | | | 569 | |
Total | | | | | | | | | | | | | | | | | | | | | | $ | 7,132 | |
| | |
— | | Fair Value Measurements – Various inputs are used in determining the fair value of investments and derivative financial instruments. These inputs to valuation techniques are categorized into a disclosure hierarchy consisting of three broad levels for financial statement purposes as follows: |
| | | | |
| | |
| | — | | Level 1 - unadjusted price quotations in active markets/exchanges for identical assets and liabilities that the Fund has the ability to access |
| | |
| | — | | Level 2 - other observable inputs (including, but not limited to, quoted prices for similar assets or liabilities in markets that are active, quoted prices for identical or similar assets or liabilities in markets that are not active, inputs other than quoted prices that are observable for the assets or liabilities (such as interest rates, yield curves, volatilities, prepayment speeds, loss severities, credit risks and default rates) or other market–corroborated inputs) |
| | |
| | — | | Level 3 - unobservable inputs based on the best information available in the circumstances, to the extent observable inputs are not available (including the Fund’s own assumptions used in determining the fair value of investments and derivative financial instruments) |
| | | | | | | | |
| See Notes to Financial Statements. | | | | |
| | | | | | | | |
22 | | | | BLACKROCK FUNDS | | MARCH 31, 2013 | | |
| | |
| | |
| | |
| Schedule of Investments (concluded) | | BlackRock Energy & Resources Portfolio |
| | |
The hierarchy gives the highest priority to unadjusted quoted prices in active markets for identical assets or liabilities (Level 1 measurements) and the lowest priority to unobservable inputs (Level 3 measurements). Accordingly, the degree of judgment exercised in determining fair value is greatest for instruments categorized in Level 3. The inputs used to measure fair value may fall into different levels of the fair value hierarchy. In such cases, for disclosure purposes, the level in the fair value hierarchy within which the fair value measurement falls in its entirety is determined based on the lowest level input that is significant to the fair value measurement in its entirety.
Changes in valuation techniques may result in transfers into or out of an assigned level within the disclosure hierarchy. In accordance with the Fund’s policy, transfers between different levels of the fair value disclosure hierarchy are deemed to have occurred as of the beginning of the reporting period. The categorization of a value determined for investments and derivative financial instruments is based on the pricing transparency of the investment and derivative financial instrument and is not necessarily an indication of the risks associated with investing in those securities. For information about the Fund’s policy regarding valuation of investments and other significant accounting policies, please refer to Note 1 of the Notes to Financial Statements.
The following table summarizes the Fund’s investments and derivative financial instruments categorized in the disclosure hierarchy as of March 31, 2013:
| | | | | | | | | | | | | | |
| | | Level 1 | | | Level 2 | | | Level 3 | | Total | |
| |
Assets: | | | | | | | | | | | | | | |
Investments: | | | | | | | | | | | | | | |
Long-Term Investments: | | | | | | | | | | | | | | |
Common Stocks: | | | | | | | | | | | | | | |
Energy Equipment & Services | | $ | 50,371,002 | | | $ | 10,743,201 | | | – | | $ | 61,114,203 | |
Metals & Mining | | | 8,282,246 | | | | – | | | – | | | 8,282,246 | |
Oil, Gas & Consumable Fuels | | | 633,523,173 | | | | 34,411,479 | | | – | | | 667,934,652 | |
Warrants | | | 7,807 | | | | – | | | – | | | 7,807 | |
Short-Term Securities | | | 13,142,954 | | | | – | | | – | | | 13,142,954 | |
| |
| | | | |
Total | | $ | 705,327,182 | | | $ | 45,154,680 | | | – | | $ | 750,481,862 | |
| | | | | |
| | | | | | | | | | | | | | |
| |
| | | Level 1 | | | Level 2 | | | Level 3 | | Total | |
| |
Derivative Financial Instruments1 | | | | | | | | | | | | | | |
Assets: | | | | | | | | | | | | | | |
Foreign currency exchange contracts | | $ | 7,344 | | | | – | | | – | | $ | 7,344 | |
Liabilities: | | | | | | | | | | | | | | |
Foreign currency exchange contracts | | | (212 | ) | | | – | | | – | | | (212 | ) |
| |
Total | | $ | 7,132 | | | | – | | | – | | $ | 7,132 | |
| | | | |
| 1 | Derivative financial instruments are foreign currency exchange contracts which are valued at the unrealized appreciation/depreciation on the instrument. |
Certain of the Fund’s assets and liabilities are held at carrying amount, which approximates fair value for financial statement purposes. As of March 31, 2013, such assets and liabilities are categorized within the disclosure hierarchy as follows:
| | | | | | | | | | | | | | |
| | | Level 1 | | | Level 2 | | | Level 3 | | Total | |
| |
Derivative Financial Instruments1 | | | | | | | | | | | | | | |
Assets: | | | | | | | | | | | | | | |
Foreign currency at value | | $ | 803 | | | | – | | | – | | $ | 803 | |
Liabilities: | | | | | | | | | | | | | | |
Bank overdraft | | | – | | | $ | (755,926 | ) | | – | | | (755,926 | ) |
| |
Total | | $ | 803 | | | $ | (755,926 | ) | | – | | $ | (755,123 | ) |
| | | | |
There were no transfers between levels during the six months ended March 31, 2013.
| | | | | | | | |
See Notes to Financial Statements. | | | | |
| | | | | | | | |
| | | | BLACKROCK FUNDS | | MARCH 31, 2013 | | 23 |
| | |
| | |
| | |
| Consolidated Schedule of Investments March 31, 2013 (Unaudited) | | BlackRock World Gold Fund |
| | (Percentages shown are based on Net Assets) |
| | | | | | | | |
| Common Stocks | | Shares | | | Value | |
| |
Australia – 15.0% | | | | | | | | |
Aquarius Platinum Ltd. (a) | | | 16,170 | | | $ | 11,769 | |
Beadell Resources Ltd. (a) | | | 127,000 | | | | 120,668 | |
Evolution Mining Ltd. (a) | | | 35,570 | | | | 54,442 | |
Indochine Mining Ltd. (a) | | | 151,560 | | | | 14,667 | |
Medusa Mining Ltd. | | | 7,620 | | | | 34,228 | |
Newcrest Mining Ltd. | | | 33,900 | | | | 709,294 | |
Northern Star Resources Ltd. | | | 39,300 | | | | 42,605 | |
Papillon Resources Ltd. (a) | | | 35,400 | | | | 47,912 | |
Silver Lake Resources Ltd. (a) | | | 88,854 | | | | 195,516 | |
| | | | | | | | |
| | | | | | | 1,231,101 | |
| |
Canada – 50.6% | | | | | | | | |
Agnico-Eagle Mines Ltd. | | | 6,250 | | | | 256,009 | |
Alamos Gold, Inc. | | | 18,000 | | | | 246,830 | |
B2Gold Corp. (a) | | | 23,100 | | | | 70,165 | |
Banro Corp. (a) | | | 40,200 | | | | 68,758 | |
Barrick Gold Corp. | | | 7,280 | | | | 214,032 | |
Belo Sun Mining Corp. (a) | | | 57,600 | | | | 64,547 | |
Centerra Gold, Inc. | | | 10,750 | | | | 63,932 | |
Detour Gold Corp. (a) | | | 5,900 | | | | 113,267 | |
Eldorado Gold Corp. | | | 50,483 | | | | 481,854 | |
Franco-Nevada Corp. | | | 5,220 | | | | 237,935 | |
Goldcorp, Inc. | | | 19,000 | | | | 638,376 | |
IAMGOLD Corp. | | | 9,600 | | | | 69,171 | |
Kinross Gold Corp. | | | 31,000 | | | | 245,002 | |
New Gold, Inc. (a) | | | 38,300 | | | | 347,874 | |
Osisko Mining Corp. (a) | | | 20,303 | | | | 120,345 | |
Romarco Minerals, Inc. (a) | | | 96,000 | | | | 77,381 | |
Silver Wheaton Corp. | | | 7,500 | | | | 234,444 | |
Yamana Gold, Inc. | | | 39,547 | | | | 608,386 | |
| | | | | | | | |
| | | | | | | 4,158,308 | |
| |
China – 0.0% | | | | | | | | |
Real Gold Mining Ltd. (a) | | | 13,000 | | | | – | |
| |
Hong Kong – 0.2% | | | | | | | | |
G-Resources Group Ltd. (a) | | | 306,000 | | | | 16,001 | |
| |
Jersey, Channel Islands – 6.2% | | | | | | | | |
Minera IRL Ltd., London (a) | | | 42,160 | | | | 24,188 | |
Minera IRL Ltd., Toronto (a) | | | 53,900 | | | | 33,909 | |
Randgold Resources Ltd. - ADR | | | 5,220 | | | | 448,816 | |
| | | | | | | | |
| | | | | | | 506,913 | |
| |
Mexico – 7.2% | | | | | | | | |
Fresnillo Plc | | | 14,300 | | | | 295,840 | |
Industrias Penoles SAB de CV | | | 6,110 | | | | 290,981 | |
| | | | | | | | |
| | | | | | | 586,821 | |
| |
Peru – 2.8% | | | | | | | | |
Cia de Minas Buenaventura SA - ADR | | | 3,060 | | | | 79,438 | |
Volcan Cia Minera SAA, Class B | | | 180,000 | | | | 153,591 | |
| | | | | | | | |
| | | | | | | 233,029 | |
| |
| | | | | | | | |
| Common Stocks | | Shares | | | Value | |
| |
Russia – 1.0% | | | | | | | | |
Polymetal International Plc | | | 6,340 | | | $ | 83,744 | |
| |
South Africa – 4.8% | | | | | | | | |
AngloGold Ashanti Ltd. | | | 4,615 | | | | 108,132 | |
Gold Fields Ltd. | | | 9,020 | | | | 69,375 | |
Harmony Gold Mining Co. Ltd. | | | 22,510 | | | | 144,466 | |
Impala Platinum Holdings Ltd. | | | 4,290 | | | | 63,056 | |
Sibanye Gold Ltd. (a) | | | 8,560 | | | | 12,412 | |
| | | | | | | | |
| | | | | | | 397,441 | |
| |
United Kingdom – 1.6% | | | | | | | | |
Archipelago Resources Plc (a) | | | 28,380 | | | | 24,909 | |
Petropavlovsk Plc | | | 8,255 | | | | 28,066 | |
Rio Tinto Plc | | | 1,620 | | | | 76,320 | |
| | | | | | | | |
| | | | | | | 129,295 | |
| |
United States – 4.7% | | | | | | | | |
Freeport-McMoRan Copper & Gold, Inc. | | | 3,100 | | | | 102,610 | |
Newmont Mining Corp. | | | 4,200 | | | | 175,938 | |
Tahoe Resources, Inc. (a) | | | 6,000 | | | | 105,397 | |
| | | | | | | | |
| | | | | | | 383,945 | |
| |
Total Common Stocks – 94.1% | | | | | | | 7,726,598 | |
| |
| | | | | | | | |
| | | | | | | | |
| | | | | | | | |
Investment Companies | | | | | | | | |
| |
Jersey, Channel Islands – 0.9% | | | | | | | | |
ETFS Physical Platinum (a) | | | 500 | | | | 76,040 | |
| |
United States – 3.0% | | | | | | | | |
SPDR Gold Trust (a) | | | 1,600 | | | | 247,120 | |
| |
Total Investment Companies – 3.9% | | | | | | | 323,160 | |
| |
| | | | | | | | |
| | | | | | | | |
| | | | | | | | |
Warrants (b) | | | | | | | | |
| |
Canada – 0.0% | | | | | | | | |
Kinross Gold Corp. (Issued/Exercisable 10/28/10, 1 Share for 1 Warrant, Expires 9/17/14, Strike Price USD 21.30) (a) | | | 757 | | | | 141 | |
| |
Total Long-Term Investments (Cost – $10,117,624) – 98.0% | | | | | | | 8,049,899 | |
| |
| | | | | | | | |
| | | | | | | | |
| | | | | | | | |
Short-Term Securities | | | | | | | | |
| |
BlackRock Liquidity Funds, TempFund, Institutional Class, 0.09% (c)(d) | | | 221,170 | | | | 221,170 | |
| |
Total Short-Term Securities (Cost – $221,170) – 2.7% | | | | | | | 221,170 | |
| |
Total Investments (Cost – $10,338,794) – 100.7% | | | | 8,271,069 | |
Liabilities in Excess of Other Assets – (0.7)% | | | | (54,471 | ) |
| | | | | | | | |
Net Assets – 100.0% | | | | | | $ | 8,216,598 | |
| | | | | | | | |
| | |
Notes to Consolidated Schedule of Investments | | |
| (a) | Non-income producing security. |
| (b) | Warrants entitle the Fund to purchase a predetermined number of shares of common stock and are non-income producing. The purchase price and number of shares are subject to adjustment under certain conditions until the expiration date of the warrants, if any. |
| | | | | | | | |
See Notes to Financial Statements. | | | | |
| | | | | | | | |
24 | | | | BLACKROCK FUNDS | | MARCH 31, 2013 | | |
| | |
| | |
| | |
| Consolidated Schedule of Investments (continued) | | BlackRock World Gold Fund |
| (c) | Investments in issuers considered to be an affiliate of the Fund during the six months ended March 31, 2013, for purposes of Section 2(a)(3) of the Investment Company Act of 1940, as amended, were as follows: |
| | | | | | | | | | |
| Affiliate | | Shares Held at
September 30,
2012 | | Net Activity | | | Shares Held at
March 31, 2013 | | Income |
BlackRock Liquidity Funds, TempFund, Institutional Class | | 430,646 | | | (209,476 | ) | | 221,170 | | $98 |
| (d) | Represents the current yield as of report date. |
| — | | Foreign currency exchange contracts as of March 31, 2013 were as follows: |
| | | | | | | | | | | | | | |
Currency Purchased | | | | Currency Sold | | | | Counterparty | | Settlement Date | | Unrealized
Depreciation | |
CAD | | 25,314 | | USD | | 24,891 | | Deutsche Bank AG | | 4/01/13 | | | $(8) | |
| — | | Fair Value Measurements – Various inputs are used in determining the fair value of investments and derivative financial instruments. These inputs to valuation techniques are categorized into a disclosure hierarchy consisting of three broad levels for financial statement purposes as follows: |
| | — | | Level 1 – unadjusted price quotations in active markets/exchanges for identical assets and liabilities that the Fund has the ability to access |
| | — | | Level 2 – other observable inputs (including, but not limited to, quoted prices for similar assets or liabilities in markets that are active, quoted prices for identical or similar assets or liabilities in markets that are not active, inputs other than quoted prices that are observable for the assets or liabilities (such as interest rates, yield curves, volatilities, prepayment speeds, loss severities, credit risks and default rates) or other market–corroborated inputs) |
| | — | | Level 3 – unobservable inputs based on the best information available in the circumstances, to the extent observable inputs are not available (including the Fund’s own assumptions used in determining the fair value of investments and derivative financial instruments) |
The hierarchy gives the highest priority to unadjusted quoted prices in active markets for identical assets or liabilities (Level 1 measurements) and the lowest priority to unobservable inputs (Level 3 measurements). Accordingly, the degree of judgment exercised in determining fair value is greatest for instruments categorized in Level 3. The inputs used to measure fair value may fall into different levels of the fair value hierarchy. In such cases, for disclosure purposes, the level in the fair value hierarchy within which the fair value measurement falls in its entirety is determined based on the lowest level input that is significant to the fair value measurement in its entirety.
Changes in valuation techniques may result in transfers into or out of an assigned level within the disclosure hierarchy. In accordance with the Fund’s policy, transfers between different levels of the fair value disclosure hierarchy are deemed to have occurred as of the beginning of the reporting period. The categorization of a value determined for investments and derivative financial instruments is based on the pricing transparency of the investment and derivative financial instrument and is not necessarily an indication of the risks associated with investing in those securities. For information about the Fund’s policy regarding valuation of investments and derivative financial instruments and other significant accounting policies, please refer to Note 1 of the Notes to Financial Statements.
| | | | | | | | |
See Notes to Financial Statements. | | | | |
| | | | | | | | |
| | | | BLACKROCK FUNDS | | MARCH 31, 2013 | | 25 |
| | |
| | |
| | |
Consolidated Schedule of Investments (concluded) | | BlackRock World Gold Fund |
The following tables summarize the Fund’s investments and derivative financial instruments categorized in the disclosure hierarchy as of March 31, 2013:
| | | | | | | | | | | | | | | | | | | | |
| | | Level 1 | | Level 2 | | Level 3 | | Total |
Assets: | | | | | | | | | | | | | | | | | | | | |
Investments: | | | | | | | | | | | | | | | | | | | | |
Long-Term Investments: | | | | | | | | | | | | | | | | | | | | |
Common Stocks: | | | | | | | | | | | | | | | | | | | | |
Australia | | | | $ 14,667 | | | | | $ 1,216,434 | | | | | – | | | | | $ 1,231,101 | |
Canada | | | | 4,158,308 | | | | | – | | | | | – | | | | | 4,158,308 | |
Hong Kong | | | | – | | | | | 16,001 | | | | | – | | | | | 16,001 | |
Jersey, Channel Islands | | | | 506,913 | | | | | – | | | | | – | | | | | 506,913 | |
Mexico | | | | 290,981 | | | | | 295,840 | | | | | – | | | | | 586,821 | |
Peru | | | | 233,029 | | | | | – | | | | | – | | | | | 233,029 | |
Russia | | | | – | | | | | 83,744 | | | | | – | | | | | 83,744 | |
South Africa | | | | 12,412 | | | | | 385,029 | | | | | – | | | | | 397,441 | |
United Kingdom | | | | 24,909 | | | | | 104,386 | | | | | – | | | | | 129,295 | |
United States | | | | 383,945 | | | | | – | | | | | – | | | | | 383,945 | |
Investment Companies | | | | 323,160 | | | | | – | | | | | – | | | | | 323,160 | |
Warrants | | | | 141 | | | | | – | | | | | – | | | | | 141 | |
Short-Term Securities | | | | 221,170 | | | | | – | | | | | – | | | | | 221,170 | |
| | | | |
Total | | | | $ 6,169,635 | | | | | $ 2,101,434 | | | | | – | | | | | $ 8,271,069 | |
| | | | | | | | | | | | | | | | | | | | |
| | | Level 1 | | Level 2 | | Level 3 | | Total |
Derivative Financial Instruments1 | | | | | | | | | | | | | | | | | | | | |
Liabilities: | | | | | | | | | | | | | | | | | | | | |
Foreign currency exchange contracts | | | | $(8) | | | | | – | | | | | – | | | | | $ (8) | |
1 Derivative financial instruments are foreign currency exchange contracts which are valued at the unrealized appreciation/depreciation on the instrument.
Certain of the Fund’s assets are held at carrying amount, which approximates fair value for financial statement purposes. As of March 31, 2013, such assets are categorized within the disclosure hierarchy as follows:
| | | | | | | | | | | | | | | | | | | | |
| | | Level 1 | | Level 2 | | Level 3 | | Total |
Assets: | | | | | | | | | | | | | | | | | | | | |
Cash | | | | $ 2,514 | | | | | – | | | | | – | | | | | $ 2,514 | |
Foreign currency at value | | | | 2,576 | | | | | – | | | | | – | | | | | 2,576 | |
Total | | | | $ 5,090 | | | | | – | | | | | – | | | | | $ 5,090 | |
There were no transfers between levels during the six months ended March 31, 2013.
| | | | | | | | |
See Notes to Financial Statements. | | | | |
| | | | | | | | |
26 | | | | BLACKROCK FUNDS | | MARCH 31, 2013 | | |
| | |
| | |
| | |
| Statements of Assets and Liabilities | | |
| | | | | | | | | | | | | | | | |
| March 31, 2013 (Unaudited) | | BlackRock All-Cap Energy &
Resources
Portfolio | | | BlackRock
China Fund | | | BlackRock
Energy &
Resources
Portfolio | | | BlackRock
World Gold
Fund1 | |
Assets | | | | | | | | | | | | | | | | |
Investments at value – unaffiliated2,3 | | $ | 303,104,250 | | | $ | 3,835,859 | | | $ | 737,338,908 | | | $ | 8,049,899 | |
Investments at value – affiliated4 | | | 38,927,328 | | | | 59,987 | | | | 13,142,954 | | | | 221,170 | |
Cash | | | – | | | | – | | | | – | | | | 2,514 | |
Foreign currency at value5 | | | 944,228 | | | | 4,308 | | | | 803 | | | | 2,576 | |
Investments sold receivable | | | 438,418 | | | | 21,374 | | | | 11,846,766 | | | | – | |
Unrealized appreciation on foreign currency exchange contracts | | | 2,375 | | | | – | | | | 7,344 | | | | – | |
Capital shares sold receivable | | | 293,848 | | | | – | | | | 427,971 | | | | 8,618 | |
Dividends receivable – unaffiliated | | | 184,441 | | | | 608 | | | | 211,279 | | | | 8,949 | |
Dividends receivable – affiliated | | | 695 | | | | 15 | | | | 1,062 | | | | 16 | |
Securities lending income receivable – affiliated | | | 6,277 | | | | – | | | | – | | | | – | |
Receivable from Manager | | | 1,171 | | | | 6,016 | | | | 591 | | | | 3,511 | |
Prepaid expenses | | | 59,472 | | | | 30,844 | | | | 46,770 | | | | 13,002 | |
| | | | |
Total assets | | | 343,962,503 | | | | 3,959,011 | | | | 763,024,448 | | | | 8,310,255 | |
| | | | |
| | | | | | | | | | | | | | | | |
Liabilities | | | | | | | | | | | | | | | | |
Bank overdraft | | | 319,620 | | | | 1,225 | | | | 755,926 | | | | – | |
Foreign bank overdraft6 | | | 943,776 | | | | – | | | | – | | | | – | |
Collateral on securities loaned at value | | | 26,945,615 | | | | – | | | | – | | | | – | |
Variation margin payable | | | – | | | | 1,504 | | | | – | | | | – | |
Investments purchased payable | | | 622,330 | | | | 2,812 | | | | 1,534,512 | | | | 24,884 | |
Unrealized depreciation on foreign currency exchange contracts | | | – | | | | 3 | | | | 212 | | | | 8 | |
Capital shares redeemed payable | | | 3,423,407 | | | | – | | | | 3,045,940 | | | | 4,744 | |
Transfer agent fees payable | | | 235,627 | | | | 133 | | | | 472,103 | | | | 4,940 | |
Investment advisory fees payable | | | 222,492 | | | | – | | | | 508,206 | | | | – | |
Service and distribution fees payable | | | 97,741 | | | | 346 | | | | 206,082 | | | | 2,742 | |
Custodian fees payable | | | 59,392 | | | | 15,026 | | | | 117,149 | | | | 18,733 | |
Professional fees payable | | | 31,843 | | | | 50,394 | | | | 40,685 | | | | 29,687 | |
Other affiliates payable | | | 28,792 | | | | – | | | | 81,691 | | | | – | |
Printing fees payable | | | 27,535 | | | | 3,698 | | | | 42,814 | | | | 1,563 | |
Pricing fees payable | | | 6,537 | | | | 7,391 | | | | 6,345 | | | | 3,240 | |
Officer’s and Trustees’ fees payable | | | 5,775 | | | | 922 | | | | 8,109 | | | | 970 | |
Other accrued expenses payable | | | 10,364 | | | | 2,602 | | | | 23,627 | | | | 2,146 | |
| | | | |
Total liabilities | | | 32,980,846 | | | | 86,056 | | | | 6,843,401 | | | | 93,657 | |
| | | | |
Net Assets | | $ | 310,981,657 | | | $ | 3,872,955 | | | $ | 756,181,047 | | | $ | 8,216,598 | |
| | | | |
| | | | | | | | | | | | | | | | |
Net Assets Consist of | | | | | | | | | | | | | | | | |
Paid-in capital | | $ | 361,560,116 | | | $ | 4,362,162 | | | $ | 817,540,354 | | | $ | 11,742,727 | |
Accumulated net investment loss | | | (96,013 | ) | | | (27,281 | ) | | | (27,846,338 | ) | | | (232,088 | ) |
Accumulated net realized loss | | | (112,574,793 | ) | | | (223,918 | ) | | | (157,076,017 | ) | | | (1,226,341 | ) |
Net unrealized appreciation/depreciation | | | 62,092,347 | | | | (238,008 | ) | | | 123,563,048 | | | | (2,067,700 | ) |
| | | | |
Net Assets | | $ | 310,981,657 | | | $ | 3,872,955 | | | $ | 756,181,047 | | | $ | 8,216,598 | |
| | | | |
| | | | |
1 Consolidated Statement of Assets and Liabilities | | | | | | | | | | | | | | | | |
2 Investments at cost – unaffiliated | | $ | 241,017,209 | | | $ | 4,071,517 | | | $ | 613,775,530 | | | $ | 10,117,624 | |
3 Securities loaned at value | | $ | 25,838,154 | | | | – | | | | – | | | | – | |
4 Investments at cost – affiliated | | $ | 38,927,328 | | | $ | 59,987 | | | $ | 13,142,954 | | | $ | 221,170 | |
5 Foreign currency at cost | | $ | 933,123 | | | $ | 4,301 | | | $ | 777 | | | $ | 2,581 | |
6 Foreign bank overdraft at cost | | $ | 937,412 | | | | – | | | | – | | | | – | |
| | | | | | | | |
See Notes to Financial Statements. | | | | |
| | | | | | | | |
| | | | BLACKROCK FUNDS | | MARCH 31, 2013 | | 27 |
| | |
| | |
| | |
| Statements of Assets and Liabilities (concluded) | | |
| | |
| | | | | | | | | | | | | | | | |
| March 31, 2013 (Unaudited) | | BlackRock
All-Cap Energy &
Resources
Portfolio | | | BlackRock
China
Fund | | | BlackRock
Energy &
Resources
Portfolio | | | BlackRock
World Gold
Fund1 | |
| |
Net Asset Value | | | | | | | | | | | | | | | | |
| |
Institutional | | | | | | | | | | | | | | | | |
Net assets | | $ | 113,128,234 | | | $ | 2,651,828 | | | $ | 157,697,627 | | | $ | 2,769,449 | |
| | | | |
Shares outstanding2 | | | 8,134,726 | | | | 308,487 | | | | 4,578,756 | | | | 352,350 | |
| | | | |
Net asset value | | $ | 13.91 | | | $ | 8.60 | | | $ | 34.44 | | | $ | 7.86 | |
| | | | |
| | | | |
Service | | | | | | | | | | | | | | | | |
Net assets | | $ | 2,877,203 | | | | – | | | | – | | | | – | |
| | | | |
Shares outstanding2 | | | 212,221 | | | | – | | | | – | | | | – | |
| | | | |
Net asset value | | $ | 13.56 | | | | – | | | | – | | | | – | |
| | | | |
| | | | |
Investor A | | | | | | | | | | | | | | | | |
Net assets | | $ | 109,278,773 | | | $ | 1,078,892 | | | $ | 475,989,031 | | | $ | 2,915,461 | |
| | | | |
Shares outstanding2 | | | 8,067,182 | | | | 125,947 | | | | 15,901,076 | | | | 371,837 | |
| | | | |
Net asset value | | $ | 13.55 | | | $ | 8.57 | | | $ | 29.93 | | | $ | 7.84 | |
| | | | |
| | | | |
Investor B | | | | | | | | | | | | | | | | |
Net assets | | $ | 12,589,810 | | | | – | | | $ | 5,578,828 | | | | – | |
| | | | |
Shares outstanding2 | | | 977,017 | | | | – | | | | 254,237 | | | | – | |
| | | | |
Net asset value | | $ | 12.89 | | | | – | | | $ | 21.94 | | | | – | |
| | | | |
| | | | |
Investor C | | | | | | | | | | | | | | | | |
Net assets | | $ | 73,107,637 | | | $ | 142,235 | | | $ | 116,915,561 | | | $ | 2,531,688 | |
| | | | |
Shares outstanding2 | | | 5,662,919 | | | | 16,635 | | | | 5,375,401 | | | | 328,321 | |
| | | | |
Net asset value | | $ | 12.91 | | | $ | 8.55 | | | $ | 21.75 | | | $ | 7.71 | |
| | | | |
1 Consolidated Statement of Assets and Liabilities.
2 Unlimited number of shares authorized, $0.001 par value.
| | | | | | | | |
See Notes to Financial Statements. | | | | |
| | | | | | | | |
28 | | | | BLACKROCK FUNDS | | MARCH 31, 2013 | | |
| | | | | | | | | | | | | | | | |
Six Months Ended March 31, 2013 (Unaudited) | | BlackRock
All-Cap Energy &
Resources
Portfolio | | | BlackRock
China
Fund | | | BlackRock
Energy & Resources
Portfolio | | | BlackRock
World Gold
Fund1 | |
Investment Income | | | | | | | | | | | | | | | | |
Dividends – unaffiliated | | $ | 2,571,498 | | | $ | 4,480 | | | $ | 2,568,748 | | | $ | 48,997 | |
Dividends – affiliated | | | 2,145 | | | | 111 | | | | 2,478 | | | | 98 | |
Foreign taxes withheld | | | (151,631 | ) | | | (199 | ) | | | (108,565 | ) | | | (3,875 | ) |
Securities lending – affiliated | | | 197,590 | | | | – | | | | – | | | | – | |
Total income | | | 2,619,602 | | | | 4,392 | | | | 2,462,661 | | | | 45,220 | |
| | | | | | | | | | | | | | | | |
Expenses | | | | | | | | | | | | | | | | |
Investment advisory | | | 1,506,939 | | | | 18,437 | | | | 3,086,692 | | | | 36,237 | |
Service and distribution – class specific | | | 615,810 | | | | 1,092 | | | | 1,281,639 | | | | 19,025 | |
Transfer agent – class specific | | | 303,166 | | | | 767 | | | | 762,260 | | | | 9,383 | |
Administration | | | 150,682 | | | | 1,383 | | | | 292,445 | | | | 3,624 | |
Administration – class specific | | | 50,366 | | | | 455 | | | | 102,602 | | | | 1,208 | |
Registration | | | 32,711 | | | | 18,259 | | | | 41,894 | | | | 18,515 | |
Custodian | | | 15,975 | | | | 2,798 | | | | 31,644 | | | | 2,848 | |
Printing | | | 20,344 | | | | 7,566 | | | | 34,041 | | | | 1,670 | |
Professional | | | 31,771 | | | | 48,051 | | | | 36,737 | | | | 31,588 | |
Officer and Trustees | | | 8,061 | | | | 1,529 | | | | 13,385 | | | | 1,635 | |
Pricing | | | 2,801 | | | | 11,086 | | | | 9,517 | | | | 4,860 | |
Miscellaneous | | | 15,743 | | | | 5,596 | | | | 18,541 | | | | 4,928 | |
Recoupment of past waived fees – class specific | | | 11,745 | | | | – | | | | 22,008 | | | | – | |
Total expenses | | | 2,766,114 | | | | 117,019 | | | | 5,733,405 | | | | 135,521 | |
Less fees waived by Manager | | | (1,537 | ) | | | (18,437 | ) | | | (1,633 | ) | | | (36,237 | ) |
Less administration fees waived | | | – | | | | (1,383 | ) | | | – | | | | (3,145 | ) |
Less administration fees waived – class specific | | | (30,063 | ) | | | (445 | ) | | | (3,795 | ) | | | (1,206 | ) |
Less transfer agent fees waived – class specific | | | (4,496 | ) | | | (87 | ) | | | (776 | ) | | | (860 | ) |
Less transfer agent fees reimbursed – class specific | | | (14,811 | ) | | | (609 | ) | | | (5,683 | ) | | | (7,954 | ) |
Less expenses reimbursed by Manager | | | – | | | | (64,385 | ) | | | – | | | | (6,714 | ) |
Less fees paid indirectly | | | (58 | ) | | | – | | | | (112 | ) | | | (6 | ) |
Total expenses after fees waived, reimbursed and paid indirectly | | | 2,715,149 | | | | 31,673 | | | | 5,721,406 | | | | 79,399 | |
Net investment loss | | | (95,547 | ) | | | (27,281 | ) | | | (3,258,745 | ) | | | (34,179 | ) |
| | | | | | | | | | | | | | | | |
Realized and Unrealized Gain (Loss) | | | | | | | | | | | | | | | | |
Net realized gain (loss) from: | | | | | | | | | | | | | | | | |
Investments – unaffiliated | | | 30,461,577 | | | | (60,162 | ) | | | (89,443,002 | ) | | | (483,429 | ) |
Investments – affiliated | | | – | | | | – | | | | (1,506,898 | ) | | | – | |
Financial futures contracts | | | – | | | | (1,205 | ) | | | – | | | | – | |
Foreign currency transactions | | | (21,511 | ) | | | (42 | ) | | | 51,346 | | | | (1,607 | ) |
| | | 30,440,066 | | | | (61,409 | ) | | | (90,898,554 | ) | | | (485,034 | ) |
Net change in unrealized appreciation/depreciation on: | | | | | | | | | | | | | | | | |
Investments – unaffiliated | | | (22,961,562 | ) | | | 317,016 | | | | 128,719,592 | | | | (2,541,512 | ) |
Investments – affiliated | | | – | | | | – | | | | 1,440,176 | | | | – | |
Financial futures contracts | | | – | | | | (2,352 | ) | | | – | | | | – | |
Foreign currency translations | | | 4,321 | | | | (46 | ) | | | (10,704 | ) | | | 57 | |
| | | (22,957,241 | ) | | | 314,618 | | | | 130,149,064 | | | | (2,541,455 | ) |
Total realized and unrealized gain | | | 7,482,825 | | | | 253,209 | | | | 39,250,510 | | | | (3,026,489 | ) |
Net Increase (Decrease) in Net Assets Resulting from Operations | | $ | 7,387,278 | | | $ | 225,928 | | | $ | 35,991,765 | | | $ | (3,060,668 | ) |
| 1 | Consolidated Statement of Operations |
| | | | | | | | |
See Notes to Financial Statements. | | | | |
| | | | | | | | |
| | | | BLACKROCK FUNDS | | MARCH 31, 2013 | | 29 |
| | |
| | |
| | |
| Statements of Changes in Net Assets | | |
| | | | | | | | | | | | | | | | | | |
| | | BlackRock All-Cap Energy & Resources Portfolio | | | | | BlackRock China Fund | |
Increase (Decrease) in Net Assets: | | Six Months
Ended March 31, 2013 (Unaudited) | | | Year Ended
September 30,
2012 | | | | | Six Months
Ended
March 31,
2013
(Unaudited) | | | Year Ended
September 30,
2012 | |
Operations | | | | | | | | | | | | | | | | | | |
Net investment income (loss) | | $ | (95,547 | ) | | $ | 208,804 | | | | | $ | (27,281 | ) | | $ | 40,427 | |
Net realized gain (loss) | | | 30,440,066 | | | | (38,223,657 | ) | | | | | (61,409 | ) | | | (141,285 | ) |
Net change in unrealized appreciation/depreciation | | | (22,957,241 | ) | | | 101,126,606 | | | | | | 314,618 | | | | 407,591 | |
Net increase in net assets resulting from operations | | | 7,387,278 | | | | 63,111,753 | | | | | | 225,928 | | | | 306,733 | |
| | | | | | | | | | | | | | | | | | |
Dividends to Shareholders From | | | | | | | | | | | | | | | | | | |
Net investment income: | | | | | | | | | | | | | | | | | | |
Institutional | | | (50,085 | ) | | | – | | | | | | (35,294 | ) | | | (36,656 | )1 |
Investor A | | | – | | | | – | | | | | | (5,061 | ) | | | (1,275 | )1 |
Investor C | | | – | | | | – | | | | | | (126 | ) | | | (364 | )1 |
Decrease in net assets resulting from dividends to shareholders | | | (50,085 | ) | | | – | | | | | | (40,481 | ) | | | (38,295 | ) |
| | | | | | | | | | | | | | | | | | |
Capital Share Transactions | | | | | | | | | | | | | | | | | | |
Net increase (decrease) in net assets derived from capital share transactions | | | (211,538,890 | ) | | | (258,335,389 | ) | | | | | 944,417 | | | | 356,594 | |
| | | | | | | | | | | | | | | | | | |
Net Assets | | | | | | | | | | | | | | | | | | |
Total increase (decrease) in net assets | | | (204,201,697 | ) | | | (195,223,636 | ) | | | | | 1,129,864 | | | | 625,032 | |
Beginning of period | | | 515,183,354 | | | | 710,406,990 | | | | | | 2,743,091 | | | | 2,118,059 | |
End of period | | $ | 310,981,657 | | | $ | 515,183,354 | | | | | $ | 3,872,955 | | | $ | 2,743,091 | |
Undistributed (accumulated) net investment income (loss) | | $ | (96,013 | ) | | $ | 49,619 | | | | | $ | (27,281 | ) | | $ | 40,481 | |
| 1 | Dividends are determined in accordance with federal income tax regulations. |
| | | | | | | | |
See Notes to Financial Statements. | | | | |
| | | | | | | | |
30 | | | | BLACKROCK FUNDS | | MARCH 31, 2013 | | |
| | |
| | |
| | |
| Statements of Changes in Net Assets (concluded) | | |
| | |
| | | | | | | | | | | | | | | | |
| | | BlackRock
Energy &
Resources
Portfolio | | | BlackRock
World
Gold
Fund1 | |
| Increase (Decrease) in Net Assets: | | Six Months
Ended March 31, 2013 (Unaudited) | | | Year Ended
September 30,
2012 | | | Six Months
Ended
March 31,
2013
(Unaudited) | | | Year Ended
September 30,
2012 | |
| |
Operations | | | | | | | | | | | | | | | | |
| |
Net investment loss | | $ | (3,258,745 | ) | | $ | (8,859,199 | ) | | $ | (34,179 | ) | | $ | (39,958 | ) |
Net realized loss | | | (90,898,554 | ) | | | (50,752,110 | ) | | | (485,034 | ) | | | (545,989 | ) |
Net change in unrealized appreciation/depreciation | | | 130,149,064 | | | | 142,276,398 | | | | (2,541,455 | ) | | | 574,129 | |
| | | | | | | | |
Net increase (decrease) in net assets resulting from operations | | | 35,991,765 | | | | 82,665,089 | | | | (3,060,668 | ) | | | (11,818 | ) |
| | | | | | | | |
| | | | | | | | | | | | | | | | |
| |
Dividends and Distributions to Shareholders From | | | | | | | | | | | | | |
| |
Net investment income: | | | | | | | | | | | | | | | | |
Institutional | | | (195,831 | ) | | | (358,563 | )2 | | | (53,185 | ) | | | (6,994 | )2 |
Investor A | | | (591,844 | ) | | | (291,121 | )2 | | | (41,304 | ) | | | – | |
Investor B | | | (10,822 | ) | | | (171,849 | )2 | | | – | | | | – | |
Investor C | | | (201,151 | ) | | | (211,831 | )2 | | | (29,761 | ) | | | – | |
Tax return of capital: | | | | | | | | | | | | | | | | |
Institutional | | | – | | | | (6,600,181 | )2 | | | – | | | | – | |
Investor A | | | – | | | | (5,894,323 | )2 | | | – | | | | – | |
Investor B | | | – | | | | (4,038,547 | )2 | | | – | | | | – | |
Investor C | | | – | | | | (4,747,110 | )2 | | | – | | | | – | |
Net realized gain: | | | | | | | | | | | | | | | | |
Institutional | | | – | | | | (6,605,013 | )2 | | | – | | | | – | |
Investor A | | | – | | | | (15,831,909 | )2 | | | – | | | | – | |
Investor B | | | – | | | | (545,981 | )2 | | | – | | | | – | |
Investor C | | | – | | | | (5,160,871 | )2 | | | – | | | | – | |
| | | | | | | | |
Decrease in net assets resulting from dividends and distributions to shareholders | | | (999,648 | ) | | | (50,457,299 | ) | | | (124,250 | ) | | | (6,994 | ) |
| | | | | | | | |
| | | | | | | | | | | | | | | | |
| |
Capital Share Transactions | | | | | | | | | | | | | | | | |
| |
Net increase (decrease) in net assets derived from capital share transactions | | | (180,425,292 | ) | | | (231,662,545 | ) | | | (89,608 | ) | | | 1,109,386 | |
| | | | | | | | |
| | | | | | | | | | | | | | | | |
| |
Net Assets | | | | | | | | | | | | | | | | |
| |
Total increase (decrease) in net assets | | | (145,433,175 | ) | | | (199,454,755 | ) | | | (3,274,526 | ) | | | 1,090,574 | |
Beginning of period | | | 901,614,222 | | | | 1,101,068,977 | | | | 11,491,124 | | | | 10,400,550 | |
| | | | | | | | |
End of period | | $ | 756,181,047 | | | $ | 901,614,222 | | | $ | 8,216,598 | | | $ | 11,491,124 | |
| | | | | | | | |
Accumulated net investment loss | | $ | (27,846,338 | ) | | $ | (23,587,945 | ) | | $ | (232,088 | ) | | $ | (73,659 | ) |
| | | | | | | | |
| 1 | Consolidated Statements of Changes in Net Assets. |
| 2 | Dividends and distributions are determined in accordance with federal income tax regulations. |
| | | | | | | | |
See Notes to Financial Statements. | | | | |
| | | | | | | | |
| | | | BLACKROCK FUNDS | | MARCH 31, 2013 | | 31 |
| | |
| | |
| | |
| Financial Highlights | | BlackRock All-Cap Energy & Resources Portfolio |
| | |
| | | | | | | | | | | | | | | | | | | | | | | | | | | | | | | | | | | | | | | | | | | | | | | | | | |
| | | Institutional | | | | | Service | |
| | | Six Months
Ended March 31,
2013 (Unaudited) | | | Year Ended September 30, | | | | | Six Months
Ended March 31,
2013 (Unaudited) | | | Year Ended September 30, | |
| | | | 2012 | | | 2011 | | | 2010 | | | 2009 | | | 2008 | | | | | | 2012 | | | 2011 | | | 2010 | | | 2009 | | | 2008 | |
Per Share Operating Performance | |
Net asset value, beginning of period | | | $ 13.51 | | | $ | 12.14 | | | $ | 13.76 | | | $ | 12.46 | | | $ | 16.20 | | | $ | 19.40 | | | | | | $ 13.20 | | | $ | 11.90 | | | $ | 13.49 | | | $ | 12.24 | | | $ | 16.01 | | | $ | 19.19 | |
Net investment income (loss)1 | | | 0.02 | | | | 0.05 | | | | 0.01 | | | | 0.02 | | | | 0.02 | | | | 0.24 | | | | | | (0.00 | )2 | | | 0.00 | 3 | | | (0.05 | ) | | | (0.03 | ) | | | (0.03 | ) | | | 0.12 | |
Net realized and unrealized gain (loss) | | | 0.38 | | | | 1.32 | | | | (1.51 | )4 | | | 1.38 | 4 | | | (2.14 | )4 | | | (2.90 | )4 | | | | | 0.36 | | | | 1.30 | | | | (1.47 | )4 | | | 1.35 | 4 | | | (2.12 | )4 | | | (2.83 | )4 |
Net increase (decrease) from investment operations | | | 0.40 | | | | 1.37 | | | | (1.50 | ) | | | 1.40 | | | | (2.12 | ) | | | (2.66 | ) | | | | | 0.36 | | | | 1.30 | | | | (1.52 | ) | | | 1.32 | | | | (2.15 | ) | | | (2.71 | ) |
Dividends and distributions from: | | | | | | | | | | | | | | | | | | | | | | | | | | | | | | | | | | | | | | | | | | | | | | | | | | |
Net investment income | | | (0.00 | )2 | | | – | | | | (0.12 | )5 | | | (0.10 | )5 | | | – | | | | (0.23 | )5 | | | | | – | | | | – | | | | (0.07 | )5 | | | (0.07 | )5 | | | – | | | | (0.16 | )5 |
Net realized gain | | | – | | | | – | | | | – | | | | – | | | | (1.62 | )5 | | | (0.31 | )5 | | | | | – | | | | – | | | | – | | | | – | | | | (1.62 | )5 | | | (0.31 | )5 |
Total dividends and distributions | | | – | | | | – | | | | (0.12 | ) | | | (0.10 | ) | | | (1.62 | ) | | | (0.54 | ) | | | | | – | | | | – | | | | (0.07 | ) | | | (0.07 | ) | | | (1.62 | ) | | | (0.47 | ) |
Net asset value, end of period | | | $ 13.91 | | | $ | 13.51 | | | $ | 12.14 | | | $ | 13.76 | | | $ | 12.46 | | | $ | 16.20 | | | | | | $ 13.56 | | | $ | 13.20 | | | $ | 11.90 | | | $ | 13.49 | | | $ | 12.24 | | | $ | 16.01 | |
| | | | | | | | | | | | | | | | | | | | | | | | | | | | | | | | | | | | | | | | | | | | | | | | | | | |
Total Investment Return6 | |
| | | | | | | | | | | | | |
Based on net asset value | | | 2.99% | 7 | | | 11.29% | | | | (11.10)% | 8 | | | 11.32% | 8 | | | (7.53)% | 8 | | | (14.25)% | 8 | | | | | 2.73% | 7 | | | 10.93% | | | | (11.36)% | 8 | | | 10.79% | 8 | | | (7.85)% | 8 | | | (14.59)% | 8 |
| | | | | | | | | | | | | | | | | | | | | | | | | | | | | | | | | | | | | | | | | | | | | | | | | | | |
Ratios to Average Net Assets | |
| | | | | | | | | | | | | |
Total expenses | | | 0.98% | 9 | | | 0.95% | | | | 0.93% | | | | 0.94% | | | | 0.98% | | | | 0.89% | | | | | | 1.34% | 9 | | | 1.29% | | | | 1.27% | | | | 1.34% | | | | 1.54% | | | | 1.25% | |
Total expenses excluding recoupment of past waived fees | | | 0.98% | 9 | | | 0.95% | | | | 0.91% | | | | 0.93% | | | | 0.97% | | | | 0.89% | | | | | | 1.34% | 9 | | | 1.29% | | | | 1.24% | | | | 1.27% | | | | 1.47% | | | | 1.25% | |
Total expenses after fees waived, reimbursed and paid indirectly | | | 0.96% | 9 | | | 0.94% | | | | 0.93% | | | | 0.93% | | | | 0.93% | | | | 0.89% | | | | | | 1.34% | 9 | | | 1.29% | | | | 1.26% | | | | 1.34% | | | | 1.35% | | | | 1.25% | |
| | | | | | | | | | | | | |
Net investment income (loss) | | | 0.36% | 9 | | | 0.34% | | | | 0.03% | | | | 0.16% | | | | 0.17% | | | | 1.14% | | | | | | (0.05)% | 9 | | | 0.00% | | | | (0.30)% | | | | (0.25)% | | | | (0.26)% | | | | 0.56% | |
| | | | | | | | | | | | | | | | | | | | | | | | | | | | | | | | | | | | | | | | | | | | | | | | | | | |
Supplemental Data | |
Net assets, end of period (000) | | | $113,128 | | | $ | 272,779 | | | $ | 400,269 | | | $ | 420,071 | | | $ | 328,434 | | | $ | 510,804 | | | | | | $ 2,877 | | | $ | 3,828 | | | $ | 4,816 | | | $ | 4,231 | | | $ | 3,426 | | | $ | 4,836 | |
Portfolio turnover | | | 6% | | | | 19% | | | | 22% | | | | 38% | | | | 22% | | | | 38% | | | | | | 6% | | | | 19% | | | | 22% | | | | 38% | | | | 22% | | | | 38% | |
| | 1 | Based on average shares outstanding. |
| | 2 | Amount is greater than $(0.005) per share. |
| | 3 | Amount is less than $0.005 per share. |
| | 4 | Includes redemption fees, which are less than $0.005 per share. |
| | 5 | Dividends and distributions are determined in accordance with federal income tax regulations. |
| | 6 | Where applicable, total investment returns exclude the effects of any sales charges and include the reinvestment of dividends and distributions. |
| | 7 | Aggregate total investment return. |
| | 8 | Redemption fee of 2.00% is reflected in total return calculations. There was no impact to the return. |
| | | | | | | | |
See Notes to Financial Statements. | | | | |
| | | | | | | | |
32 | | | | BLACKROCK FUNDS | | MARCH 31, 2013 | | |
| | |
| | |
| | |
| Financial Highlights (continued) | | BlackRock All-Cap Energy & Resources Portfolio |
| | |
| | | | | | | | | | | | | | | | | | | | | | | | | | | | | | | | | | | | | | | | | | | | | | | | | | |
| | | Investor A | | | | | Investor B | |
| | | Six Months Ended March 31, 2013 (Unaudited) | | | Year Ended September 30, | | | | | Six Months Ended March 31, 2013 (Unaudited) | | | Year Ended September 30, | |
| | | | 2012 | | | 2011 | | | 2010 | | | 2009 | | | 2008 | | | | | | 2012 | | | 2011 | | | 2010 | | | 2009 | | | 2008 | |
Per Share Operating Performance | |
Net asset value, beginning of period | | | $ 13.19 | | | $ | 11.90 | | | $ | 13.50 | | | $ | 12.24 | | | $ | 16.01 | | | $ | 19.18 | | | | | | $ 12.59 | | | $ | 11.45 | | | $ | 13.03 | | | $ | 11.84 | | | $ | 15.68 | | | $ | 18.82 | |
Net investment income (loss)1 | | | (0.01 | ) | | | (0.01 | ) | | | (0.06 | ) | | | (0.03 | ) | | | (0.02 | ) | | | 0.17 | | | | | | (0.05 | ) | | | (0.11 | ) | | | (0.18 | ) | | | (0.13 | ) | | | (0.09 | ) | | | 0.01 | |
Net realized and unrealized gain (loss) | | | 0.37 | | | | 1.30 | | | | (1.47 | )2 | | | 1.35 | 2 | | | (2.13 | )2 | | | (2.87 | )2 | | | | | 0.35 | | | | 1.25 | | | | (1.40 | )2 | | | 1.32 | 2 | | | (2.13 | )2 | | | (2.81 | )2 |
Net increase (decrease) from investment operations | | | 0.36 | | | | 1.29 | | | | (1.53 | ) | | | 1.32 | | | | (2.15 | ) | | | (2.70 | ) | | | | | 0.30 | | | | 1.14 | | | | (1.58 | ) | | | 1.19 | | | | (2.22 | ) | | | (2.80 | ) |
Dividends and distributions from: | | | | | | | | | | | | | | | | | | | | | | | | | | | | | | | | | | | | | | | | | | | | | | | | | | |
Net investment income | | | – | | | | – | | | | (0.07 | )3 | | | (0.06 | )3 | | | – | | | | (0.16 | )3 | | | | | – | | | | – | | | | – | | | | – | | | | – | | | | (0.03 | )3 |
Net realized gain | | | – | | | | – | | | | – | | | | – | | | | (1.62 | )3 | | | (0.31 | )3 | | | | | – | | | | – | | | | – | | | | – | | | | (1.62 | )3 | | | (0.31 | )3 |
Total dividends and distributions | | | – | | | | – | | | | (0.07 | ) | | | (0.06 | ) | | | (1.62 | ) | | | (0.47 | ) | | | | | – | | | | – | | | | – | | | | – | | | | (1.62 | ) | | | (0.34 | ) |
Net asset value, end of period | | | $ 13.55 | | | $ | 13.19 | | | $ | 11.90 | | | $ | 13.50 | | | $ | 12.24 | | | $ | 16.01 | | | | | | $ 12.89 | | | $ | 12.59 | | | $ | 11.45 | | | $ | 13.03 | | | $ | 11.84 | | | $ | 15.68 | |
| | | | | | | | | | | | | | | | | | | | | | | | | | | | | | | | | | | | | | | | | | | | | | | | | | | |
Total Investment Return4 | |
| | | | | | | | | | | | | |
Based on net asset value | | | 2.73% | 5 | | | 10.84% | | | | (11.46)% | 6 | | | 10.84% | 6 | | | (7.85)% | 6 | | | (14.55)% | 6 | | | | | 2.38% | 5 | | | 9.96% | | | | (12.13)% | 6 | | | 10.05% | 6 | | | (8.56)% | 6 | | | (15.23)% | 6 |
| | | | | | | | | | | | | | | | | | | | | | | | | | | | | | | | | | | | | | | | | | | | | | | | | | | |
Ratios to Average Net Assets | |
| | | | | | | | | | | | | |
Total expenses | | | 1.39% | 7 | | | 1.35% | | | | 1.35% | | | | 1.34% | | | | 1.48% | | | | 1.27% | | | | | | 2.27% | 7 | | | 2.20% | | | | 2.11% | | | | 2.17% | | | | 2.35% | | | | 2.09% | |
Total expenses excluding recoupment of past waived fees | | | 1.38% | 7 | | | 1.35% | | | | 1.28% | | | | 1.32% | | | | 1.45% | | | | 1.27% | | | | | | 2.26% | 7 | | | 2.19% | | | | 2.09% | | | | 2.16% | | | | 2.33% | | | | 2.09% | |
Total expenses after fees waived, reimbursed and paid indirectly | | | 1.38% | 7 | | | 1.34% | | | | 1.34% | | | | 1.34% | | | | 1.34% | | | | 1.26% | | | | | | 2.10% | 7 | | | 2.10% | | | | 2.10% | | | | 2.10% | | | | 2.06% | | | | 2.04% | |
| | | | | | | | | | | | | |
Net investment income (loss) | | | (0.09)% | 7 | | | (0.09)% | | | | (0.38)% | | | | (0.25)% | | | | (0.25)% | | | | 0.81% | | | | | | (0.81)% | 7 | | | (0.83)% | | | | (1.15)% | | | | (1.03)% | | | | (0.95)% | | | | 0.06% | |
| | | | | | | | | | | | | | | | | | | | | | | | | | | | | | | | | | | | | | | | | | | | | | | | | | | |
Supplemental Data | |
Net assets, end of period (000) | | | $109,279 | | | $ | 137,765 | | | $ | 187,017 | | | $ | 207,523 | | | $ | 178,364 | | | $ | 267,422 | | | | | | $ 12,590 | | | $ | 15,162 | | | $ | 18,872 | | | $ | 27,113 | | | $ | 30,873 | | | $ | 42,399 | |
Portfolio turnover | | | 6% | | | | 19% | | | | 22% | | | | 38% | | | | 22% | | | | 38% | | | | | | 6% | | | | 19% | | | | 22% | | | | 38% | | | | 22% | | | | 38% | |
| | 1 | Based on average shares outstanding. |
| | 2 | Includes redemption fees, which are less than $0.005 per share. |
| | 3 | Dividends and distributions are determined in accordance with federal income tax regulations. |
| | 4 | Where applicable, total investment returns exclude the effects of any sales charges and include the reinvestment of dividends and distributions. |
| | 5 | Aggregate total investment return. |
| | 6 | Redemption fee of 2.00% is reflected in total return calculations. There was no impact to the return. |
| | | | | | | | |
See Notes to Financial Statements. | | | | |
| | | | | | | | |
| | | | BLACKROCK FUNDS | | MARCH 31, 2013 | | 33 |
| | |
| | |
| | |
| Financial Highlights (concluded) | | BlackRock All-Cap Energy & Resources Portfolio |
| | |
| | | | | | | | | | | | | | | | | | | | | | | | |
| | | Investor C | |
| | | Six Months
Ended March 31, 2013 (Unaudited) | | | Year Ended September 30, | |
| | | | 2012 | | | 2011 | | | 2010 | | | 2009 | | | 2008 | |
Per Share Operating Performance | | | | | | | | | | | | | | | | | | | | | | | | |
Net asset value, beginning of period | | $ | 12.62 | | | $ | 11.47 | | | $ | 13.04 | | | $ | 11.85 | | | $ | 15.69 | | | $ | 18.84 | |
Net investment income (loss)1 | | | (0.05 | ) | | | (0.10 | ) | | | (0.17 | ) | | | (0.13 | ) | | | (0.09 | ) | | | 0.02 | |
Net realized and unrealized gain (loss) | | | 0.34 | | | | 1.25 | | | | (1.40 | )2 | | | 1.32 | 2 | | | (2.13 | )2 | | | (2.82 | )2 |
Net increase (decrease) from investment operations | | | 0.29 | | | | 1.15 | | | | (1.57 | ) | | | 1.19 | | | | (2.22 | ) | | | (2.80 | ) |
Dividends and distributions from: | | | | | | | | | | | | | | | | | | | | | | | | |
Net investment income | | | – | | | | – | | | | – | | | | – | | | | – | | | | (0.04 | )3 |
Net realized gain | | | – | | | | – | | | | – | | | | – | | | | (1.62 | )3 | | | (0.31 | )3 |
Total dividends and distributions | | | – | | | | – | | | | – | | | | – | | | | (1.62 | ) | | | (0.35 | ) |
Net asset value, end of period | | $ | 12.91 | | | $ | 12.62 | | | $ | 11.47 | | | $ | 13.04 | | | $ | 11.85 | | | $ | 15.69 | |
| | | | | | | | | | | | | | | | | | | | | | | | |
Total Investment Return4 | | | | | | | | | | | | | | | | | | | | | | | | |
| | | | | | |
Based on net asset value | | | 2.30% | 5 | | | 10.03% | | | | (12.04)% | 6 | | | 10.04% | 6 | | | (8.54)% | 6 | | | (15.21)% | 6 |
| | | | | | | | | | | | | | | | | | | | | | | | |
Ratios to Average Net Assets | | | | | | | | | | | | | | | | | | | | | | | | |
| | | | | | |
Total expenses | | | 2.13% | 7 | | | 2.08% | | | | 2.05% | | | | 2.08% | | | | 2.23% | | | | 2.02% | |
| | | | | | |
Total expenses excluding recoupment of past waived fees | | | 2.12% | 7 | | | 2.08% | | | | 2.03% | | | | 2.08% | | | | 2.21% | | | | 2.02% | |
| | | | | | |
Total expenses after fees waived, reimbursed and paid indirectly | | | 2.10% | 7 | | | 2.07% | | | | 2.04% | | | | 2.08% | | | | 2.05% | | | | 2.01% | |
| | | | | | |
Net investment income (loss) | | | (0.82)% | 7 | | | (0.79)% | | | | (1.08)% | | | | (1.00)% | | | | (0.95)% | | | | 0.08% | |
| | | | | | | | | | | | | | | | | | | | | | | | |
Supplemental Data | | | | | | | | | | | | | | | | | | | | | | | | |
Net assets, end of period (000) | | $ | 73,108 | | | $ | 85,649 | | | $ | 99,433 | | | $ | 116,401 | | | $ | 113,347 | | | $ | 153,512 | |
Portfolio turnover | | | 6% | | | | 19% | | | | 22% | | | | 38% | | | | 22% | | | | 38% | |
| | 1 | Based on average shares outstanding. |
| | 2 | Includes redemption fees, which are less than $0.005 per share. |
| | 3 | Dividends and distributions are determined in accordance with federal income tax regulations. |
| | 4 | Where applicable, total investment returns exclude the effects of any sales charges and include the reinvestment of dividends and distributions. |
| | 5 | Aggregate total investment return. |
| | 6 | Redemption fee of 2.00% is reflected in total return calculations. There was no impact to the return. |
| | | | | | | | |
| See Notes to Financial Statements. | | | | |
| | | | | | | | |
34 | | | | BLACKROCK FUNDS | | MARCH 31, 2013 | | |
| | |
| | |
| | |
| Financial Highlights | | BlackRock China Fund |
| | |
| | | | | | | | | | | | | | | | | | | | | | | | | | | | | | | | | | | | | | | | |
| | | Institutional | | | | | Investor A | | | | | Investor C | |
| | | Six Months
Ended
March 31,
2013
(Unaudited) | | | Year Ended
September 30,
2012 | | | Period April 29,
20111 to
September 30,
2011 | | | | | Six Months
Ended
March 31,
2013
(Unaudited) | | | Year Ended
September 30,
2012 | | | Period April 29,
20111 to
September 30,
2011 | | | | | Six Months
Ended
March 31,
2013
(Unaudited) | | | Year Ended
September 30,
2012 | | | Period April 29,
20111 to
September 30,
2011 | |
Per Share Operating Performance | | | | | | | | | | | | | | | | | | | | | | | |
Net asset value, beginning of period | | | $ 7.79 | | | | $ 6.90 | | | | $ 10.00 | | | | | | $ 7.77 | | | | $ 6.89 | | | | $ 10.00 | | | | | | $ 7.72 | | | | $ 6.87 | | | | $ 10.00 | |
Net investment income (loss)2 | | | (0.06 | ) | | | 0.12 | | | | 0.13 | | | | | | (0.08 | ) | | | 0.18 | | | | 0.09 | | | | | | (0.11 | ) | | | 0.05 | | | | 0.09 | |
Net realized and unrealized gain (loss) | | | 0.99 | | | | 0.89 | | | | (3.23 | ) | | | | | 0.99 | | | | 0.82 | | | | (3.20 | ) | | | | | 0.97 | | | | 0.90 | | | | (3.22 | ) |
Net increase (decrease) from investment operations | | | 0.93 | | | | 1.01 | | | | (3.10 | ) | | | | | 0.91 | | | | 1.00 | | | | (3.11 | ) | | | | | 0.86 | | | | 0.95 | | | | (3.13 | ) |
Dividends from net investment income | | | (0.12 | ) | | | (0.12 | )3 | | | – | | | | | | (0.11 | ) | | | (0.12 | )3 | | | – | | | | | | (0.03 | ) | | | (0.10 | )3 | | | – | |
Net asset value, end of period | | | $ 8.60 | | | | $ 7.79 | | | | $ 6.90 | | | | | | $ 8.57 | | | | $ 7.77 | | | | $ 6.89 | | | | | | $ 8.55 | | | | $ 7.72 | | | | $ 6.87 | |
| | | | | | | | | | | | | | | | | | | | | | | | | | | | | | | | | | | | | | | | |
Total Investment Return | |
Based on net asset value | | | 11.86% | 4 | | | 14.82% | | | | (31.00)% | 4 | | | | | 11.65% | 4 | | | 14.64% | | | | (31.10)% | 4 | | | | | 11.18% | 4 | | | 13.95% | | | | (31.30)% | 4 |
| | | | | | | | | | | | | | | | | | | | | | | | | | | | | | | | | | | | | | | | |
Ratios to Average Net Assets | |
Total expenses | | | 6.34% | 5 | | | 13.05% | | | | 9.67% | 5,6 | | | | | 6.28% | 5 | | | 14.41% | | | | 12.18% | 5,6 | | | | | 7.01% | 5 | | | 14.94% | | | | 11.73% | 5,6 |
Total expenses after fees waived and reimbursed | | | 1.65% | 5 | | | 1.65% | | | | 1.65% | 5 | | | | | 1.90% | 5 | | | 1.90% | | | | 1.90% | 5 | | | | | 2.63% | 5 | | | 2.65% | | | | 2.65% | 5 |
Net investment income (loss) | | | (1.41)% | 5 | | | 1.55% | | | | 3.39% | 5 | | | | | (1.70)% | 5 | | | 2.24% | | | | 2.47% | 5 | | | | | (2.43)% | 5 | | | 0.60% | | | | 2.30% | 5 |
| | | | | | | | | | | | | | | | | | | | | | | | | | | | | | | | | | | | | | | | |
Supplemental Data | |
Net assets, end of period (000) | | | $ 2,652 | | | | $ 2,355 | | | | $ 2,049 | | | | | | $ 1,079 | | | | $ 360 | | | | $ 51 | | | | | | $ 142 | | | | $ 28 | | | | $ 19 | |
Portfolio turnover | | | 32% | | | | 40% | | | | 14% | | | | | | 32% | | | | 40% | | | | 14% | | | | | | 32% | | | | 40% | | | | 14% | |
| | 1 | Commencement of operations. |
| | 2 | Based on average shares outstanding. |
| | 3 | Dividends are determined in accordance with federal income tax regulations. |
| | 4 | Aggregate total investment return. |
| | 6 | Organization costs were not annualized in the calculation of the expense ratios. If these expenses were annualized, the total expenses for Institutional, Investor A and Investor C would have been 13.81%, 18.86% and 16.54%, respectively. |
| | | | | | | | |
| See Notes to Financial Statements. | | | | |
| | | | | | | | |
| | | | BLACKROCK FUNDS | | MARCH 31, 2013 | | 35 |
| | |
| | |
| | |
| Financial Highlights | | BlackRock Energy & Resources Portfolio |
| | |
| | | | | | | | | | | | | | | | | | | | | | | | | | | | | | | | | | | | | | | | | | | | | | | | | | |
| | | Institutional | | | | | Investor A | |
| | | Six Months Ended March 31, 2013 (Unaudited) | | | | | | | | | | | | | | | | | | | | Six Months Ended March 31, 2013 (Unaudited) | | | | | | | | | | | | | | | | |
| | | | | | | | | | | | | | | | | | | | | | | | | | | | | | | | | | | |
| | | | Year Ended September 30, | | | | | | Year Ended September 30, | |
| | | | | | | | | | | | | | | | | | | | | | | | | | | | | | | | | | | |
| | | | 2012 | | | 2011 | | | 2010 | | | 2009 | | | 2008 | | | | | | 2012 | | | 2011 | | | 2010 | | | 2009 | | | 2008 | |
Per Share Operating Performance | |
Net asset value, beginning of period | | $ | 32.87 | | | $ | 31.70 | | | $ | 34.98 | | | $ | 32.61 | | | $ | 51.31 | | | $ | 63.42 | | | | | $ | 28.62 | | | $ | 27.73 | | | $ | 30.63 | | | $ | 28.67 | | | $ | 47.29 | | | $ | 59.02 | |
Net investment income (loss)1 | | | (0.07 | ) | | | (0.16 | ) | | | (0.08 | ) | | | 0.05 | | | | (0.07 | ) | | | (0.13 | ) | | | | | (0.11 | ) | | | (0.24 | ) | | | (0.20 | ) | | | (0.12 | ) | | | (0.13 | ) | | | (0.32 | ) |
Net realized and unrealized gain (loss) | | | 1.67 | | | | 2.79 | | | | (2.68 | ) | | | 2.31 | | | | (9.60 | ) | | | (2.78 | ) | | | | | 1.45 | | | | 2.46 | | | | (2.34 | ) | | | 2.08 | | | | (9.46 | ) | | | (2.29 | ) |
Net increase (decrease) from investment operations | | | 1.60 | | | | 2.63 | | | | (2.76 | ) | | | 2.36 | | | | (9.67 | ) | | | (2.91 | ) | | | | | 1.34 | | | | 2.22 | | | | (2.54 | ) | | | 1.96 | | | | (9.59 | ) | | | (2.61 | ) |
Dividends and distributions from: | | | | | | | | | | | | | | | | | | | | | | | | | | | | | | | | | | | | | | | | | | | | | | | | | | |
Net investment income | | | (0.03 | ) | | | (0.25 | )2 | | | (0.52 | )2 | | | – | | | | – | | | | (2.01 | )2 | | | | | (0.03 | ) | | | (0.17 | )2 | | | (0.36 | )2 | | | – | | | | – | | | | (1.92 | )2 |
Tax return of capital | | | – | | | | (0.47 | )2 | | | – | | | | – | | | | – | | | | – | | | | | | – | | | | (0.42 | )2 | | | – | | | | – | | | | – | | | | – | |
Net realized gain | | | – | | | | (0.74 | )2 | | | – | | | | – | | | | (9.04 | )2 | | | (7.22 | )2 | | | | | – | | | | (0.74 | )2 | | | – | | | | – | | | | (9.04 | )2 | | | (7.22 | )2 |
Total dividends and distributions | | | (0.03 | ) | | | (1.46 | ) | | | (0.52 | ) | | | – | | | | (9.04 | ) | | | (9.23 | ) | | | | | (0.03 | ) | | | (1.33 | ) | | | (0.36 | ) | | | – | | | | (9.04 | ) | | | (9.14 | ) |
Redemption fees added to paid-in capital | | | – | | | | – | | | | 0.00 | 3 | | | 0.01 | | | | 0.01 | | | | 0.03 | | | | | | – | | | | – | | | | 0.00 | 3 | | | 0.00 | 3 | | | 0.01 | | | | 0.02 | |
Net asset value, end of period | | $ | 34.44 | | | $ | 32.87 | | | $ | 31.70 | | | $ | 34.98 | | | $ | 32.61 | | | $ | 51.31 | | | | | $ | 29.93 | | | $ | 28.62 | | | $ | 27.73 | | | $ | 30.63 | | | $ | 28.67 | | | $ | 47.29 | |
| | | | | | | | | | | | | | | | | | | | | | | | | | | | | | | | | | | | | | | | | | | | | | | | | | | |
Total Investment Return4 | |
| | | | | | | | | | | | | |
Based on net asset value | | | 4.88% | 5 | | | 7.76% | | | | (8.28)% | | | | 7.27% | 6,7 | | | (7.64)% | 8,9 | | | (6.77)% | 7 | | | | | 4.70% | 5 | | | 7.41% | | | | (8.61)% | | | | 6.84% | 10,11 | | | (8.20)% | 7,12 | | | (6.78)% | 9 |
| | | | | | | | | | | | | | | | | | | | | | | | | | | | | | | | | | | | | | | | | | | | | | | | | | | |
Ratios to Average Net Assets | |
| | | | | | | | | | | | | |
Total expenses | | | 1.03% | 13 | | | 0.99% | | | | 0.93% | | | | 0.97% | | | | 1.00% | | | | 0.92% | | | | | | 1.34% | 13 | | | 1.34% | | | | 1.28% | | | | 1.35% | | | | 1.40% | | | | 1.25% | |
Total expenses excluding recoupment of past waived fees | | | 1.03% | 13 | | | 0.99% | | | | 0.93% | | | | 0.97% | | | | 0.98% | | | | 0.92% | | | | | | 1.34% | 13 | | | 1.33% | | | | 1.26% | | | | 1.31% | | | | 1.38% | | | | 1.25% | |
Total expenses after fees waived,reimbursed and paid indirectly | | | 1.03% | 13 | | | 0.99% | | | | 0.92% | | | | 0.97% | | | | 0.99% | | | | 0.92% | | | | | | 1.34% | 13 | | | 1.34% | | | | 1.27% | | | | 1.35% | | | | 1.31% | | | | 1.25% | |
| | | | | | | | | | | | | |
Net investment income (loss) | | | (0.43)% | 13 | | | (0.44)% | | | | (0.18)% | | | | 0.13% | | | | (0.25)% | | | | (0.18)% | | | | | | (0.74)% | 13 | | | (0.77)% | | | | (0.52)% | | | | (0.39)% | | | | (0.55)% | | | | (0.49)% | |
| | | | | | | | | | | | | | | | | | | | | | | | | | | | | | | | | | | | | | | | | | | | | | | | | | | |
Supplemental Data | |
Net assets, end of period (000) | | $ | 157,698 | | | $ | 222,034 | | | $ | 306,403 | | | $ | 274,009 | | | $ | 134,187 | | | $ | 82,147 | | | | | $ | 475,989 | | | $ | 539,085 | | | $ | 632,030 | | | $ | 644,786 | | | $ | 636,437 | | | $ | 689,646 | |
Portfolio turnover | | | 6% | | | | 15% | | | | 40% | | | | 16% | | | | 25% | | | | 32% | | | | | | 6% | | | | 15% | | | | 40% | | | | 16% | | | | 25% | | | | 32% | |
| | 1 | Based on average shares outstanding. |
| | 2 | Dividends and distributions are determined in accordance with federal income tax regulations. |
| | 3 | Amount is less than $0.005 per share. |
| | 4 | Where applicable, total investment returns exclude the effects of any sales charges and include the reinvestment of dividends and distributions. |
| | 5 | Aggregate total investment return. |
| | 6 | Includes proceeds received from a settlement of litigation, which impacted the Fund’s total return. Excluding these proceeds, the Fund’s total return would have been 7.20%. |
| | 7 | Redemption fee of 2.00% is reflected in total return calculations. The impact to the return from redemption fees received during the period was an increase of 0.03%. |
| | 8 | Includes proceeds received from a settlement of litigation, which impacted the Fund’s total return. Excluding these proceeds, the Fund’s total return would have been (7.66)%. |
| | 9 | Redemption fee of 2.00% is reflected in total return calculations. The impact to the return from redemption fees received during the period was an increase of 0.02%. |
| | 10 | Includes proceeds received from a settlement of litigation, which impacted the Fund’s total return. Excluding these proceeds, the Fund’s total return would have been 6.77%. |
| | 11 | Redemption fee of 2.00% is reflected in total return calculations. There was no impact to the return. |
| | 12 | Includes proceeds received from a settlement of litigation, which impacted the Fund’s total return. Excluding these proceeds, the Fund’s total return would have been (8.23)%. |
| | | | | | | | |
See Notes to Financial Statements. | | | | |
| | | | | | | | |
36 | | | | BLACKROCK FUNDS | | MARCH 31, 2013 | | |
| | |
| | |
| | |
| Financial Highlights (concluded) | | BlackRock Energy & Resources Portfolio |
| | |
| | | | | | | | | | | | | | | | | | | | | | | | | | | | | | | | | | | | | | | | | | | | | | | | | | |
| | | Investor B | | | | | Investor C | |
| | | Six Months Ended March 31, 2013 (Unaudited) | | | | | | | | | | | | | | | | | | | | Six Months Ended March 31, 2013 (Unaudited) | | | | | | | | | | | | | | | | |
| | | | | | | | | | | | | | | | | | | | | | | | | | | | | | | | | | | |
| | | | Year Ended September 30, | | | | | | Year Ended September 30, | |
| | | | | | | | | | | | | | | | | | | | | | | | | | | | | | | | | | | |
| | | | 2012 | | | 2011 | | | 2010 | | | 2009 | | | 2008 | | | | | | 2012 | | | 2011 | | | 2010 | | | 2009 | | | 2008 | |
Per Share Operating Performance | |
Net asset value, beginning of period | | | $ 21.07 | | | $ | 20.65 | | | $ | 22.86 | | | $ | 21.56 | | | $ | 39.68 | | | $ | 50.87 | | | | | | $ 20.88 | | | $ | 20.55 | | | $ | 22.81 | | | $ | 21.51 | | | $ | 39.61 | | | $ | 50.84 | |
Net investment loss1 | | | (0.16 | ) | | | (0.36 | ) | | | (0.38 | ) | | | (0.27 | ) | | | (0.22 | ) | | | (0.67 | ) | | | | | (0.16 | ) | | | (0.34 | ) | | | (0.37 | ) | | | (0.24 | ) | | | (0.22 | ) | | | (0.66 | ) |
Net realized and unrealized gain (loss) | | | 1.06 | | | | 1.87 | | | | (1.73 | ) | | | 1.57 | | | | (8.87 | ) | | | (1.81 | ) | | | | | 1.06 | | | | 1.84 | | | | (1.69 | ) | | | 1.54 | | | | (8.85 | ) | | | (1.79 | ) |
Net increase (decrease) from investment operations | | | 0.90 | | | | 1.51 | | | | (2.11 | ) | | | 1.30 | | | | (9.09 | ) | | | (2.48 | ) | | | | | 0.90 | | | | 1.50 | | | | (2.06 | ) | | | 1.30 | | | | (9.07 | ) | | | (2.45 | ) |
Dividends and distributions from: | | | | | | | | | | | | | | | | | | | | | | | | | | | | | | | | | | | | | | | | | | | | | | | | | | |
Net investment income | | | (0.03 | ) | | | (0.06 | )2 | | | (0.10 | )2 | | | – | | | | – | | | | (1.51 | )2 | | | | | (0.03 | ) | | | (0.09 | )2 | | | (0.20 | )2 | | | – | | | | – | | | | (1.58 | )2 |
Tax return of capital | | | – | | | | (0.29 | )2 | | | – | | | | – | | | | – | | | | – | | | | | | – | | | | (0.34 | )2 | | | – | | | | – | | | | – | | | | – | |
Net realized gain | | | – | | | | (0.74 | )2 | | | – | | | | – | | | | (9.04 | )2 | | | (7.22 | )2 | | | | | – | | | | (0.74 | )2 | | | – | | | | – | | | | (9.04 | )2 | | | (7.22 | )2 |
Total dividends and distributions | | | (0.03 | ) | | | (1.09 | ) | | | (0.10 | ) | | | – | | | | (9.04 | ) | | | (8.73 | ) | | | | | (0.03 | ) | | | (1.17 | ) | | | (0.20 | ) | | | – | | | | (9.04 | ) | | | (8.80 | ) |
Redemption fees added to paid-in capital | | | – | | | | – | | | | 0.00 | 3 | | | 0.00 | 3 | | | 0.01 | | | | 0.02 | | | | | | – | | | | – | | | | 0.00 | 3 | | | 0.00 | 3 | | | 0.01 | | | | 0.02 | |
Net asset value, end of period | | | $ 21.94 | | | $ | 21.07 | | | $ | 20.65 | | | $ | 22.86 | | | $ | 21.56 | | | $ | 39.68 | | | | | | $ 21.75 | | | $ | 20.88 | | | $ | 20.55 | | | $ | 22.81 | | | $ | 21.51 | | | $ | 39.61 | |
| | | | | | | | | | | | | | | | | | | | | | | | | | | | | | | | | | | | | | | | | | | | | | | | | | | |
Total Investment Return4 | |
Based on net asset value | | | 4.30% | 5 | | | 6.63% | | | | (9.33)% | | | | 6.03% | 6,7 | | | (8.74)% | 8,9 | | | (7.63)% | 10 | | | | | 4.34%5 | | | | 6.57% | | | | (9.25)% | | | | 6.04% | 7,11 | | | (8.68)% | 9,12 | | | (7.57)% | 10 |
| | | | | | | | | | | | | | | | | | | | | | | | | | | | | | | | | | | | | | | | | | | | | | | | | | | |
Ratios to Average Net Assets | |
Total expenses | | | 2.32% | 13 | | | 2.16% | | | | 2.07% | | | | 2.10% | | | | 2.25% | | | | 2.01% | | | | | | 2.11% | 13 | | | 2.07% | | | | 2.04% | | | | 2.06% | | | | 2.16% | | | | 1.96% | |
Total expenses excluding recoupment of past waived fees | | | 2.31% | 13 | | | 2.16% | | | | 2.03% | | | | 2.10% | | | | 2.23% | | | | 2.01% | | | | | | 2.10% | 13 | | | 2.07% | | | | 1.99% | | | | 2.05% | | | | 2.16% | | | | 1.96% | |
Total expenses after fees waived, reimbursed and paid indirectly | | | 2.10% | 13 | | | 2.10% | | | | 2.07% | | | | 2.09% | | | | 2.05% | | | | 2.00% | | | | | | 2.10% | 13 | | | 2.07% | | | | 2.03% | | | | 2.05% | | | | 2.05% | | | | 1.96% | |
Net investment loss | | | (1.50)% | 13 | | | (1.56)% | | | | (1.31)% | | | | (1.17)% | | | | (1.28)% | | | | (1.24)% | | | | | | (1.50)% | 13 | | | (1.50)% | | | | (1.29)% | | | | (1.07)% | | | | (1.29)% | | | | (1.21)% | |
| | | | | | | | | | | | | | | | | | | | | | | | | | | | | | | | | | | | | | | | | | | | | | | | | | | |
Supplemental Data | |
Net assets, end of period (000) | | | $ 5,579 | | | $ | 7,687 | | | $ | 16,450 | | | $ | 25,633 | | | $ | 34,218 | | | $ | 57,174 | | | | | | $116,916 | | | $ | 132,808 | | | $ | 146,186 | | | $ | 142,490 | | | $ | 129,556 | | | $ | 151,409 | |
Portfolio turnover | | | 6% | | | | 15% | | | | 40% | | | | 16% | | | | 25% | | | | 32% | | | | | | 6% | | | | 15% | | | | 40% | | | | 16% | | | | 25% | | | | 32% | |
| | 1 | Based on average shares outstanding. |
| | 2 | Dividends and distributions are determined in accordance with federal income tax regulations. |
| | 3 | Amount is less than $0.005 per share. |
| | 4 | Where applicable, total investment returns exclude the effects of any sales charges and include the reinvestment of dividends and distributions. |
| | 5 | Aggregate total investment return. |
| | 6 | Includes proceeds received from a settlement of litigation, which impacted the Fund’s total return. Excluding these proceeds, the Fund’s total return would have been 5.94%. |
| | 7 | Redemption fee of 2.00% is reflected in total return calculations. There was no impact to the return. |
| | 8 | Includes proceeds received from a settlement of litigation, which impacted the Fund’s total return. Excluding these proceeds, the Fund’s total return would have been (8.77)%. |
| | 9 | Redemption fee of 2.00% is reflected in total return calculations. The impact to the return from redemption fees received during the period was an increase of 0.04%. |
| | 10 | Redemption fee of 2.00% is reflected in total return calculations. The impact to the return from redemption fees received during the period was an increase of 0.02%. |
| | 11 | Includes proceeds received from a settlement of litigation, which impacted the Fund’s total return. Excluding these proceeds, the Fund’s total return would have been 5.95%. |
| | 12 | Includes proceeds received from a settlement of litigation, which impacted the Fund’s total return. Excluding these proceeds, the Fund’s total return would have been (8.71)%. |
| | | | | | | | |
See Notes to Financial Statements. | | | | |
| | | | | | | | |
| | | | BLACKROCK FUNDS | | MARCH 31, 2013 | | 37 |
| | |
| | |
| |
| Financial Highlights | | BlackRock World Gold Fund |
| | |
| | |
| | | | | | | | | | | | | | | | | | | | | | | | | | | | | | | | | | | | | | | | | | | | | | | | | | | | |
| | | Institutional | | | | | Investor A | | | | | Investor C | |
| | | Six Months
Ended
March 31,
2013 (Unaudited)1 | | | Year Ended
September 30, | | | Period May 26, 20102 to
September 30, | | | | | Six Months
Ended
March 31,
2013 (Unaudited)1 | | | Year Ended
September 30, | | | Period May 26, 20102 to
September 30, | | | | | Six Months
Ended
March 31,
2013 (Unaudited)1 | | | Year Ended
September 30, | | | Period May 26, 20102 to
September 30, 2010 | |
| | | 20121 | | | 20111 | | | 2010 | | | | | | 20121 | | | 20111 | | | 2010 | | | | | | 20121 | | | 20111 | | |
Per Share Operating Performance | | | | | | | | | | | | | | | | | | | |
Net asset value, beginning of period | | | $ 10.99 | | | | $ 11.13 | | | | $ 12.07 | | | | $ 10.00 | | | | | | $ 10.95 | | | | $ 11.10 | | | | $ 12.05 | | | | $ 10.00 | | | | | | $ 10.77 | | | | $ 11.00 | | | | $ 12.02 | | | | $ 10.00 | |
Net investment income (loss)3 | | | (0.01 | ) | | | (0.00 | )4 | | | (0.02 | ) | | | (0.01 | ) | | | | | (0.03 | ) | | | (0.03 | ) | | | (0.04 | ) | | | 0.00 | 5 | | | | | (0.07 | ) | | | (0.11 | ) | | | (0.13 | ) | | | (0.04 | ) |
Net realized and unrealized gain (loss) | | | (2.97 | ) | | | (0.12 | ) | | | (0.63 | )6 | | | 2.08 | 6 | | | | | (2.95 | ) | | | (0.12 | ) | | | (0.62 | )6 | | | 2.05 | 6 | | | | | (2.90 | ) | | | (0.12 | ) | | | (0.62 | )6 | | | 2.06 | 6 |
Net increase (decrease) from investment operations | | | (2.98 | ) | | | (0.12 | ) | | | (0.65 | ) | | | 2.07 | | | | | | (2.98 | ) | | | (0.15 | ) | | | (0.66 | ) | | | 2.05 | | | | | | (2.97 | ) | | | (0.23 | ) | | | (0.75 | ) | | | 2.02 | |
Dividends and distributions from: | | | | | | | | | | | | | | | | | | | | | | | | | | | | | | | | | | | | | | | | | | | | | | | | | | | | |
Net investment income | | | (0.15 | ) | | | (0.02 | )7 | | | (0.13 | )7 | | | – | | | | | | (0.13 | ) | | | – | | | | (0.13 | )7 | | | – | | | | | | (0.09 | ) | | | – | | | | (0.11 | )7 | | | – | |
Tax return of capital | | | – | | | | – | | | | (0.04 | )7 | | | – | | | | | | – | | | | – | | | | (0.04 | )7 | | | – | | | | | | – | | | | – | | | | (0.04 | )7 | | | – | |
Net realized gain | | | – | | | | – | | | | (0.12 | )7 | | | – | | | | | | – | | | | – | | | | (0.12 | )7 | | | – | | | | | | – | | | | – | | | | (0.12 | )7 | | | – | |
Total dividends and distributions | | | (0.15 | ) | | | (0.02 | ) | | | (0.29 | ) | | | – | | | | | | (0.13 | ) | | | – | | | | (0.29 | ) | | | – | | | | | | (0.09 | ) | | | – | | | | (0.27 | ) | | | – | |
Net asset value, end of period | | | $ 7.86 | | | | $ 10.99 | | | | $ 11.13 | | | | $ 12.07 | | | | | | $ 7.84 | | | | $ 10.95 | | | | $ 11.10 | | | | $ 12.05 | | | | | | $ 7.71 | | | | $ 10.77 | | | | $ 11.00 | | | | $ 12.02 | |
| | | | | | | | | | | | | | | | | | | | | | | | | | | | | | | | | | | | | | | | | | | | | | | | | | | | | |
Total Investment Return8 | |
Based on net asset value | | | (27.33)% | 9 | | | (1.11)% | | | | (5.69)% | 10 | | | 20.70% | 9,10 | | | | | (27.40)% | 9 | | | (1.35)% | | | | (5.83)% | 10 | | | 20.50% | 9,10 | | | | | (27.72)% | 9 | | | (2.09)% | | | | (6.57)% | 10 | | | 20.20% | 9,10 |
| | | | | | | | | | | | | | | | | | | | | | | | | | | | | | | | | | | | | | | | | | | | | | | | | | | | | |
Ratios to Average Net Assets | |
Total expenses | | | 2.26% | 11 | | | 2.35% | | | | 4.05% | | | | 5.79% | 11,12 | | | | | 2.78% | 11 | | | 2.86% | | | | 4.45% | | | | 7.16% | 11,12 | | | | | 3.44% | 11 | | | 3.56% | | | | 5.14% | | | | 7.37% | 11,12 |
Total expenses after fees waived and reimbursed | | | 1.24% | 11 | | | 1.24% | | | | 1.24% | | | | 1.24% | 11 | | | | | 1.49% | 11 | | | 1.49% | | | | 1.49% | | | | 1.49% | 11 | | | | | 2.27% | 11 | | | 2.27% | | | | 2.27% | | | | 2.27% | 11 |
Net investment income (loss) | | | (0.30)% | 11 | | | (0.03)% | | | | (0.15)% | | | | (0.39)% | 11 | | | | | (0.58)% | 11 | | | (0.27)% | | | | (0.36)% | | | | 0.07% | 11 | | | | | (1.31)% | 11 | | | (1.05)% | | | | (1.05)% | | | | (1.15)% | 11 |
| | | | | | | | | | | | | | | | | | | | | | | | | | | | | | | | | | | | | | | | | | | | | | | | | | | | | |
Supplemental Data | |
Net assets, end of period (000) | | | $ 2,769 | | | | $ 4,073 | | | | $ 4,432 | | | | $ 3,974 | | | | | | $ 2,915 | | | | $ 4,361 | | | | $ 3,242 | | | | $ 572 | | | | | | $ 2,532 | | | | $ 3,057 | | | | $ 2,726 | | | | $ 132 | |
Portfolio turnover | | | 17% | | | | 23% | | | | 29% | | | | 1% | | | | | | 17% | | | | 23% | | | | 29% | | | | 1% | | | | | | 17% | | | | 23% | | | | 29% | | | | 1% | |
| | 1 | Consolidated Financial Highlights. |
| | 2 | Commencement of operations. |
| | 3 | Based on average shares outstanding. |
| | 4 | Amount is greater than $(0.005) per share. |
| | 5 | Amount is less than $0.005 per share. |
| | 6 | Includes redemption fees, which are less than $0.005 per share. |
| | 7 | Dividends and distributions are determined in accordance with federal income tax regulations. |
| | 8 | Where applicable, total investment returns exclude the effects of any sales charges and include the reinvestment of dividends and distributions. |
| | 9 | Aggregate total investment return. |
| | 10 | Redemption fee of 2.00% is reflected in total return calculations. There was no impact to the return. |
| | 12 | Organization costs were not annualized in the calculation of the expense ratios. If these expenses were annualized, the total expenses for Institutional, Investor A and Investor C would have been 6.17%, 8.00% and 7.94%, respectively. |
| | | | | | | | |
See Notes to Financial Statements. | | | | |
| | | | | | | | |
38 | | | | BLACKROCK FUNDS | | MARCH 31, 2013 | | |
| | |
| | |
| |
| Notes to Financial Statements (Unaudited) | | |
1. Organization and Significant Accounting Policies:
BlackRock FundsSM (the “Trust”) is registered under the Investment Company Act of 1940, as amended (the “1940 Act”), as an open-end management investment company. The Trust is organized as a Massa-chusetts business trust. BlackRock All-Cap Energy & Resources Portfolio (“All-Cap Energy & Resources”), BlackRock China Fund (“China Fund”), BlackRock Energy & Resources Portfolio (“Energy & Resources”) and BlackRock World Gold Fund (“World Gold”) (collectively, the “Funds” or individually, a “Fund”) are each a series of the Trust. The Funds are classified as non-diversified. The Funds’ financial statements are prepared in conformity with accounting principles generally accepted in the United States of America (“US GAAP”), which may require management to make estimates and assumptions that affect the reported amounts of assets and liabilities in the financial statements and the reported amounts of increases and decreases in net assets from operations during the reporting period. Actual results could differ from those estimates. Each Fund offers multiple classes of shares. Institutional Shares are sold without a sales charge and only to certain eligible investors. Service Shares are sold without a sales charge. Investor A Shares are generally sold with a front-end sales charge. Investor B and Investor C Shares may be subject to a CDSC. All classes of shares have identical voting, dividend, liquidation and other rights and the same terms and conditions, except that Service, Investor A, Investor B and Investor C Shares bear certain expenses related to the shareholder servicing of such shares, and Investor B and Investor C Shares also bear certain expenses related to the distribution of such shares. Investor B Shares automatically convert to Investor A Shares after approximately eight years. Investor B Shares are only available through exchanges and dividend reinvestments by existing shareholders and for purchase by certain employer-sponsored retirement plans. Each class has exclusive voting rights with respect to matters relating to its shareholder servicing and distribution expenditures (except that Investor B shareholders may vote on material changes to the Investor A distribution and service plan).
The following is a summary of significant accounting policies followed by the Funds:
Basis of Consolidation: The accompanying consolidated financial statements of World Gold include the accounts of BlackRock Cayman World Gold Fund 1, Ltd. (the “Subsidiary”), which is a wholly owned subsidiary of World Gold and primarily invests in commodity-related instruments. The Subsidiary enables World Gold to hold these commodity-related instruments and satisfy Regulated Investment Company (“RIC”) tax requirements. World Gold may invest up to 25% of its total assets in the Subsidiary. Intercompany accounts and transactions, if any, have been eliminated. The Subsidiary is subject to the same investment policies and restrictions that apply to World Gold.
Valuation: US GAAP defines fair value as the price the Funds would receive to sell an asset or pay to transfer a liability in an orderly transaction between market participants at the measurement date. The Funds determine the fair values of their financial instruments at market value
using independent dealers or pricing services under policies approved by the Board of Trustees of the Trust (the “Board”). The BlackRock Global Valuation Methodologies Committee (the “Global Valuation Committee”) is the committee formed by management to develop global pricing policies and procedures and to provide oversight of the pricing function for the Funds for all financial instruments.
Equity investments traded on a recognized securities exchange or the NASDAQ Global Market System (“NASDAQ”) are valued at the last reported sale price that day or the NASDAQ official closing price, if applicable. For equity investments traded on more than one exchange, the last reported sale price on the exchange where the stock is primarily traded is used. Equity investments traded on a recognized exchange for which there were no sales on that day are valued at the last available bid price. If no bid price is available, the prior day’s price will be used, unless it is determined that such prior day’s price no longer reflects the fair value of the security. Financial futures contracts traded on exchanges are valued at their last sale price. Investments in open-end registered investment companies are valued at NAV each business day.
The Funds value their investments in BlackRock Liquidity Series, LLC Money Market Series (the “Money Market Series”) at fair value, which is ordinarily based upon their pro rata ownership in the underlying fund’s net assets. The Money Market Series seeks current income consistent with maintaining liquidity and preserving capital. Although the Money Market Series is not registered under the 1940 Act, its investments will follow the parameters of investments by a money market fund that is subject to Rule 2a-7 under the 1940 Act. Each Fund may withdraw up to 25% of its investment daily, although the manager of the Money Market Series, in its sole discretion, may permit an investor to withdraw more than 25% on any one day.
Securities and other assets and liabilities denominated in foreign currencies are translated into US dollars using exchange rates determined as of the close of business on the New York Stock Exchange (“NYSE”). Foreign currency exchange contracts are valued at the mean between the bid and ask prices and are determined as of the close of business on the NYSE. Interpolated values are derived when the settlement date of the contract is an interim date for which quotations are not available.
In the event that application of these methods of valuation results in a price for an investment that is deemed not to be representative of the market value of such investment, or if a price is not available, the investment will be valued by the Global Valuation Committee, or its delegate, in accordance with a policy approved by the Board as reflecting fair value (“Fair Value Assets”). When determining the price for Fair Value Assets, the Global Valuation Committee, or its delegate, seeks to determine the price that each Fund might reasonably expect to receive from the current sale of that asset in an arm’s-length transaction. Fair value determinations shall be based upon all available factors that the Global Valuation Committee, or its delegate, deem relevant consistent with the principles of fair value measurement which include the market approach, income approach and/or in the case of recent investments, the cost approach, as appropriate. A market approach generally consists of
| | | | | | | | |
| | | | | | | | |
| | | | | | | | |
| | | | BLACKROCK FUNDS | | MARCH 31, 2013 | | 39 |
| | |
| | |
| | |
| Notes to Financial Statements (continued) | | |
using comparable market transactions. The income approach generally is used to discount future cash flows to present value and adjusted for liquidity as appropriate. These factors include but are not limited to: (i) attributes specific to the investment or asset; (ii) the principal market for the investment or asset; (iii) the customary participants in the principal market for the investment or asset; (iv) data assumptions by market participants for the investment or asset, if reasonably available; (v) quoted prices for similar investments or assets in active markets; and (vi) other factors, such as future cash flows, interest rates, yield curves, volatilities, prepayment speeds, loss severities, credit risks, recovery rates, liquidation amounts and/or default rates. Due to the inherent uncertainty of valuations of such investments, the fair values may differ from the values that would have been used had an active market existed. The Global Valuation Committee, or its delegate, employs various methods for calibrating valuation approaches for investments where an active market does not exist, including regular due diligence of the Trust’s pricing vendors, a regular review of key inputs and assumptions, transactional back-testing or disposition analysis to compare unrealized gains and losses to realized gains and losses, reviews of missing or stale prices and large movements in market values and reviews of any market related activity. The pricing of all Fair Value Assets is subsequently reported to the Board or a committee thereof on a quarterly basis.
Generally, trading in foreign instruments is substantially completed each day at various times prior to the close of business on the NYSE. Occasionally, events affecting the values of such instruments may occur between the foreign market close and the close of business on the NYSE that may not be reflected in the computation of each Fund’s net assets. If events (for example, a company announcement, market volatility or a natural disaster) occur during such periods that are expected to affect the value of such instruments materially, those instruments may be Fair Value Assets and valued at their fair value, as determined in good faith by the Global Valuation Committee using a pricing service and/or policies approved by the Board. Each business day, the Funds use a pricing service to assist with the valuation of certain foreign exchange-traded equity securities and foreign exchange-traded and over-the-counter (“OTC”) options (the “Systematic Fair Value Price”). Using current market factors, the Systematic Fair Value Price is designed to value such foreign securities and foreign options at fair value as of the close of business on the NYSE, which follows the close of the local markets.
Foreign Currency: The Funds’ books and records are maintained in US dollars. Purchases and sales of investment securities are recorded at the rates of exchange prevailing on the respective date of such transactions. Generally, when the US dollar rises in value against a foreign currency, the Funds’ investments denominated in that currency will lose value because that currency is worth fewer US dollars; the opposite effect occurs if the US dollar falls in relative value.
The Funds do not isolate the portion of the results of operations arising as a result of changes in the foreign exchange rates from the changes in the market prices of investments held or sold for financial reporting purposes. Accordingly, the effects of changes in foreign currency exchange
rates on investments are not segregated on the Statements of Operations from the effects of changes in market prices of those investments but are included as a component of net realized and unrealized gain (loss) from investments. The Funds report realized currency gains (losses) on foreign currency related transactions as components of net realized gain (loss) for financial reporting purposes, whereas such components are treated as ordinary income for federal income tax purposes.
Participation Notes: China Fund may invest in participation notes (“P-Notes”). P-Notes are promissory notes issued by banks or broker-dealers that are designed to offer China Fund a return measured by the change in the value of the underlying security or basket of securities (the “underlying security”) while not holding the actual shares of the underlying security. P-Notes are typically used to allow China Fund to gain exposure to securities traded in foreign markets that may be restricted due to country-specific regulations. When the P-Note matures, the issuer will pay to, or receive from, China Fund the difference between the value of the underlying security at the time of the purchase and the underlying security’s value at maturity of the P-Notes. Income received on P-Notes is recorded by China Fund as dividend income in the Statements of Operations. An investment in a P-Note involves additional risks beyond the risks normally associated with a direct investment in the underlying security. While the holder of a P-Note is entitled to receive from the bank or broker-dealer any dividends paid by the underlying security, the holder is not entitled to the same rights (e.g., voting rights) as a direct owner of the underlying security. P-Notes are considered general unsecured contractual obligations of the bank or broker-dealer. China Fund must rely on the creditworthiness of the issuer for its investment returns on the P-Notes and has no rights against the issuer of the underlying security. A P-Note may be more volatile and less liquid than other investments held by China Fund since the P-Note generally is dependent on the liquidity in the local trading market for the underlying security.
Segregation and Collateralization: In cases in which the 1940 Act and the interpretive positions of the Securities and Exchange Commission (“SEC”) require that each Fund either deliver collateral or segregate assets in connection with certain investments (e.g., financial futures contracts and foreign currency exchange contracts), each Fund will, consistent with SEC rules and/or certain interpretive letters issued by the SEC, segregate collateral or designate on its books and records cash or liquid securities having a market value at least equal to the amount that would otherwise be required to be physically segregated. Furthermore, based on requirements and agreements with certain exchanges and third party broker-dealers, a Fund engaging in such transactions may have requirements to deliver/deposit securities to/with an exchange or broker-dealer as collateral for certain investments.
Investment Transactions and Investment Income: For financial reporting purposes, investment transactions are recorded on the dates the transactions are entered into (the trade dates). Realized gains and losses on investment transactions are determined on the identified cost basis. Dividend income is recorded on the ex-dividend dates. Dividends from foreign securities where the ex-dividend date may have passed are subsequently recorded when the Funds are informed of the ex-dividend
| | | | | | | | |
| | | | | | | | |
| | | | | | | | |
40 | | | | BLACKROCK FUNDS | | MARCH 31, 2013 | | |
| | |
| | |
| | |
| Notes to Financial Statements (continued) | | |
| | |
date. Under the applicable foreign tax laws, a withholding tax at various rates may be imposed on capital gains, dividends and interest. Income, expenses and realized and unrealized gains and losses are allocated daily to each class based on its relative net assets.
Dividends and Distributions: Dividends and distributions paid by the Funds are recorded on the ex-dividend dates. The portion of distributions that exceeds a Fund’s current and accumulated earnings and profits, which are measured on a tax basis, will constitute a nontaxable return of capital. Distributions in excess of a Fund’s taxable income and net capital gains, but not in excess of a Fund’s earnings and profits, will be taxable to shareholders as ordinary income and will not constitute a non-taxable return of capital. Capital losses carried forward from years beginning before 2011 do not reduce earnings and profits, even if such carried forward losses offset current year realized gains. The character and timing of dividends and distributions are determined in accordance with federal income tax regulations, which may differ from US GAAP.
Securities Lending: The Funds may lend securities to approved borrowers, such as banks, brokers and other financial institutions. The borrower pledges cash, securities issued or guaranteed by the US government or irrevocable letters of credit issued by a bank as collateral. The initial collateral received by the Funds has a value of at least 102% of the current value of the loaned securities for securities traded on US exchanges and a value of at least 105% for all other securities. The collateral is maintained thereafter in an amount equal to at least 100% of the current market value of the loaned securities. The market value of the loaned securities is determined at the close of business of the Funds and any additional required collateral is delivered to the Funds on the next business day. Securities lending income, as disclosed in the Statements of Operations, represents the income earned from the investment of the cash collateral, net of rebates paid to, or fees paid by, borrowers and less the fees paid to the securities lending agent. During the term of the loan, the Funds earn dividend or interest income on the securities loaned but do not receive interest income on the securities received as collateral. Loans of securities are terminable at any time and the borrower, after notice, is required to return borrowed securities within the standard time period for settlement of securities transactions. The risks of securities lending include the risk that the borrower may not provide additional collateral when required or may not return the securities when due. To mitigate this risk the Funds benefit from a borrower default indemnity provided by BlackRock, Inc. (“BlackRock”). BlackRock’s indemnity allows for full
replacement of securities lent. The Funds also could suffer a loss if the value of an investment purchased with cash collateral falls below the market value of loaned securities or if the value of an investment purchased with cash collateral falls below the value of the original cash collateral received. During the six months ended March 31, 2013, any securities on loan were collateralized by cash.
Income Taxes: It is the Funds’ policy to comply with the requirements of the Internal Revenue Code of 1986, as amended, applicable to RICs and to distribute substantially all of their taxable income to their shareholders. Therefore, no federal income tax provision is required.
The Funds file US federal and various state and local tax returns. No income tax returns are currently under examination. The statute of limitations on All-Cap Energy & Resources’ and Energy & Resources’ US federal tax returns remains open for each of the four years ended Sep-tember 30, 2012. The statute of limitations on World Gold’s US federal tax returns remain open for the period ended September 30, 2010, and the years ended September 30, 2011 and September 30, 2012. The statute of limitations on China Fund’s US federal tax returns remain open for the period ended September 30, 2011 and the year ended September 30, 2012. The statutes of limitations on each Fund’s state and local tax returns may remain open for an additional year depending upon the jurisdiction. Management does not believe there are any uncertain tax positions that require recognition of a tax liability.
During the six months ended March 31, 2013, China Fund invested in certain Chinese securities “A-shares” available only to local Chinese investors and Qualified Foreign Institutional Investors (“QFIIs”) through P-Notes. China Fund gained access to the A-share market through various unaffiliated QFIIs. Based upon its current interpretation of tax rules in China, China Fund records an estimated deferred tax liability for realized and unrealized gains on certain P-Notes sold during, or held at the end of, the reporting period.
Recent Accounting Standards: In December 2011, the Financial Accounting Standards Board (the “FASB”) issued guidance that will expand current disclosure requirements on the offsetting of certain assets and liabilities. The new disclosures will be required for investments and derivative financial instruments subject to master netting or similar agreements which are eligible for offset in the Statements of Assets and Liabilities and will require an entity to disclose both gross and net information about such investments and transactions in the financial statements. In January 2013, the FASB issued guidance that clarifies which investments and transactions are subject to the offsetting disclosure requirements. The scope of the disclosure requirements for offsetting will be limited to derivative instruments, repurchase agreements and reverse repurchase agreements, and securities borrowing and securities lending transactions. The guidance is effective for financial statements with fiscal years beginning on or after January 1, 2013, and interim periods within those fiscal years. Management is evaluating the impact of this guidance on the Funds’ financial statement disclosures.
| | | | | | | | |
| | | | | | | | |
| | | | | | | | |
| | | | BLACKROCK FUNDS | | MARCH 31, 2013 | | 41 |
| | |
| | |
| | |
| Notes to Financial Statements (continued) | | |
| | |
Other: Expenses directly related to a Fund or its classes are charged to that Fund or class. Other operating expenses shared by several funds are pro rated among those funds on the basis of relative net assets or other appropriate methods. Expenses directly related to the Funds and other shared expenses pro rated to the Funds are allocated daily to each class based on its relative net assets or other appropriate methods.
The Funds have an arrangement with the custodian whereby fees may be reduced by credits earned on uninvested cash balances, which, if applicable, are shown as fees paid indirectly in the Statements of Operations. The custodian imposes fees on overdrawn cash balances, which can be offset by accumulated credits earned or may result in additional custody charges.
2. Derivative Financial Instruments:
The Funds engage in various portfolio investment strategies using derivative contracts both to increase the returns of the Funds and/or to economically hedge, or protect, their exposure to certain risks such as equity risk or foreign currency exchange rate risk. These contracts may be transacted on an exchange or OTC.
Losses may arise if the value of the contract decreases due to an unfavorable change in the market rates or values of the underlying instrument or if the counterparty does not perform under the contract. The Funds’ maximum risk of loss from counterparty credit risk on OTC derivatives is generally the aggregate unrealized gain netted against any collateral pledged by the counterparty. Counterparty risk related to exchange-traded financial futures contracts is deemed to be minimal due to the protection against defaults provided by the exchange on which these contracts trade.
The Funds may mitigate counterparty risk by procuring collateral and through netting provisions included within an International Swaps and Derivatives Association, Inc. master agreement (“ISDA Master Agreement”) implemented between a Fund and each of its respective counterparties. An ISDA Master Agreement allows each Fund to offset with each separate counterparty certain derivative financial instrument’s payables and/or receivables with collateral held. The amount of collateral moved to/from applicable counterparties is generally based upon minimum transfer amounts of up to $500,000. To the extent amounts due to the Funds from their counterparties are not fully collateralized contractually or otherwise, the Funds bear the risk of loss from counterparty non-performance. See Note 1 “Segregation and Collateralization” for information with respect to collateral practices. In addition, the Funds manage counterparty risk by entering into agreements only with counterparties that they believe have the financial resources to honor their obligations and by monitoring the financial stability of those counterparties.
Certain ISDA Master Agreements allow counterparties to OTC derivatives to terminate derivative contracts prior to maturity in the event the Funds’ net assets decline by a stated percentage or the Funds fail to meet the
terms of their ISDA Master Agreements, which would cause the Funds to accelerate payment of any net liability owed to the counterparty.
Financial Futures Contracts: China Fund purchases and/or sells financial futures contracts to gain exposure to, or economically hedge against, changes in the value of equity securities (equity risk). Financial futures contracts are agreements between China Fund and a counterparty to buy or sell a specific quantity of an underlying instrument at a specified price and at a specified date. Depending on the terms of the particular contract, financial futures contracts are settled either through physical delivery of the underlying instrument on the settlement date or by payment of a cash settlement amount on the settlement date. Pursuant to the contract, China Fund agrees to receive from or pay to the broker an amount of cash equal to the daily fluctuation in value of the contract. Such receipts or payments are known as variation margin and are recorded by China Fund as unrealized appreciation or depreciation. When the contract is closed, China Fund records a realized gain or loss equal to the difference between the value of the contract at the time it was opened and the value at the time it was closed. The use of financial futures contracts involves the risk of an imperfect correlation in the movements in the price of financial futures contracts and the underlying assets.
Foreign Currency Exchange Contracts: The Funds enter into foreign currency exchange contracts as an economic hedge against either specific transactions or portfolio instruments or to obtain exposure to foreign currencies (foreign currency exchange rate risk). A foreign currency exchange contract is an agreement between two parties to buy and sell a currency at a set exchange rate on a future date. Foreign currency exchange contracts, when used by the Funds, help to manage the overall exposure to the currencies in which some of the investments held by the Funds are denominated. The contract is marked-to-market daily and the change in market value is recorded by the Funds as an unrealized gain or loss. When the contract is closed, the Funds record a realized gain or loss equal to the difference between the value at the time it was opened and the value at the time it was closed. The use of foreign currency exchange contracts involves the risk that the value of a foreign currency exchange contract changes unfavorably due to movements in the value of the referenced foreign currencies and the risk that the counterparty to the contract does not perform its obligations under the agreement.
Derivative Financial Instruments Categorized by Risk Exposure:
| | | | | | |
| Fair Values of Derivative Financial Instruments as of March 31, 2013 |
| Asset Derivatives |
| | | Statements of Assets and
Liabilities Location | | All-Cap Energy & Resources | | Energy &
Resources |
Foreign currency exchange contracts | | Unrealized appreciation on foreign currency exchange contracts | | $2,375 | | $7,344 |
| | | | | | | | |
| | | | | | | | |
| | | | | | | | |
42 | | | | BLACKROCK FUNDS | | MARCH 31, 2013 | | |
| | |
| | |
| | |
| Notes to Financial Statements (continued) | | |
| | | | | | | | | | | | | | |
| | | Liability Derivatives | |
| | | Statements of Assets and
Liabilities Location | | China
Fund | | | Energy &
Resources | | | World
Gold | |
Foreign currency exchange contracts | | Unrealized depreciation on foreign currency exchange contracts | | $ | 3 | | | $ | 212 | | | $ | 8 | |
Equity contracts | | Net unrealized appreciation/ depreciation1 | | | 2,352 | | | | – | | | | – | |
Total | | | | $ | 2,355 | | | $ | 212 | | | $ | 8 | |
| | | | | | | | | | | | | | |
| | 1 | Includes cumulative appreciation/depreciation on financial futures contracts as reported in the Schedules of Investments. Only current day’s variation margin is reported within the Statements of Assets and Liabilities. |
| | | | | | | | | | | | | | | | |
The Effect of Derivative Financial Instruments in the Statements of
Operations Six Months Ended March 31, 2013 | |
| Net Realized Gain (Loss) From | |
| | | All-Cap
Energy &
Resources | | | China
Fund | | | Energy &
Resources | | | World
Gold | |
Foreign currency exchange contracts: | | | | | | | | | | | | | | | | |
Foreign currency transactions | | $ | 11,471 | | | $ | (191 | ) | | $ | (54,987 | ) | | $ | 2,987 | |
Equity contracts: | | | | | | | | | | | | | | | | |
Financial futures contracts | | | – | | | | (1,205 | ) | | | – | | | | – | |
Total | | $ | 11,471 | | | $ | (1,396 | ) | | $ | (54,987 | ) | | $ | 2,987 | |
| | | | | | | | | | | | | | | | |
| | | | | | | | | | | | | | | | |
| Net Change in Unrealized Appreciation/Depreciation on | |
| | | All-Cap
Energy &
Resources | | | China
Fund | | | Energy &
Resources | | | World
Gold | |
Foreign currency exchange contracts: | | | | | | | | | | | | | | | | |
Foreign currency translations | | $ | 1,934 | | | $ | (3 | ) | | $ | 844 | | | $ | (8 | ) |
Equity contracts: | | | | | | | | | | | | | | | | |
Financial futures contracts | | | – | | | | (2,352 | ) | | | – | | | | – | |
Total | | $ | 1,934 | | | $ | (2,355 | ) | | $ | 844 | | | $ | (8 | ) |
| | | | | | | | | | | | | | | | |
For the six months ended March 31, 2013, the average quarterly balances of outstanding derivative financial instruments were as follows:
| | | | | | | | | | | | | | | | |
| | | All-Cap
Energy &
Resources | | | China
Fund | | | Energy &
Resources | | | World
Gold | |
Financial futures contracts: | | | | | | | | | | | | | | | | |
Average number of contracts purchased | | | – | | | | 3 | | | | – | | | | – | |
Average notional value of contracts purchased | | | – | | | $ | 1,182 | | | | – | | | | – | |
Foreign currency exchange contracts: | | | | | | | | | | | | | | | | |
Average number of contracts - US dollars purchased | | | 1 | | | | 1 | | | | 1 | | | | 2 | |
Average number of contracts - US dollars sold | | | 1 | | | | – | | | | 1 | | | | 1 | |
Average US dollar amounts purchased | | $ | 111,574 | | | $ | 9,280 | | | $ | 370,473 | | | $ | 70,219 | |
Average US dollar amounts sold | | $ | 309,978 | | | | – | | | $ | 764,328 | | | $ | 12,446 | |
3. Investment Advisory Agreement and Other Transactions with Affiliates:
The PNC Financial Services Group, Inc. (“PNC”) is the largest stockholder and an affiliate, for 1940 Act purposes, of BlackRock.
The Trust, on behalf of the Funds, entered into an Investment Advisory Agreement with the Manager, the Funds’ investment advisor, an indirect, wholly owned subsidiary of BlackRock, to provide investment advisory and administration services. The Manager is responsible for the management of each Fund’s portfolio and provides the necessary personnel, facilities, equipment and certain other services necessary to the operations of each Fund. For such services, each Fund, except China Fund, pays the Manager a monthly fee based on a percentage of each Fund’s average daily net assets at the following annual rates:
| | | | | |
| Average Daily Net Assets | | Investment Advisory Fee |
First $1 Billion | | | | 0.750 | % |
$1 Billion - $2 Billion | | | | 0.700 | % |
$2 Billion - $3 Billion | | | | 0.675 | % |
Greater than $3 Billion | | | | 0.650 | % |
China Fund pays the Manager a monthly fee based on a percentage of its average daily net assets at the following annual rates:
| | | | | |
| Average Daily Net Assets | | Investment
Advisory Fee |
First $1 Billion | | | | 1.00 | % |
$1 Billion - $3 Billion | | | | 0.94 | % |
$3 Billion - $5 Billion | | | | 0.90 | % |
$5 Billion - $10 Billion | | | | 0.87 | % |
Greater than $10 Billion | | | | 0.85 | % |
The Manager voluntarily agreed to waive its investment advisory fees by the amount of investment advisory fees each Fund pays to the Manager indirectly through its investment in affiliated money market funds. However, the Manager does not waive its investment advisory fees by the amount of investment advisory fees paid in connection with each Fund’s investment in other affiliated investment companies, if any. These amounts are included in fees waived by Manager in the Statements of Operations. For the six months ended March 31, 2013, the amounts waived were as follows:
| | | | |
All-Cap Energy & Resources | | $ | 1,537 | |
China Fund | | $ | 70 | |
Energy & Resources | | $ | 1,633 | |
World Gold | | $ | 77 | |
For World Gold, the Manager provides investment management and other services to the Subsidiary. The Manager does not receive separate compensation from the Subsidiary for providing investment management or administrative services. However, World Gold pays the Manager based on World Gold’s net assets which include the assets of the Subsidiary.
The Manager entered into separate sub-advisory agreements with BlackRock International Limited (“BIL”), an affiliate of the Manager, to serve as sub-advisor for all Funds except for the China Fund and with BlackRock (Hong Kong) Limited (“BHK”) to serve as sub-advisor for the China Fund. The Manager pays BIL and BHK, respectively, for services they provide, a monthly fee that is a percentage of the investment advisory fees paid by such Funds to the Manager.
| | | | | | | | |
| | | | | | | | |
| | | | | | | | |
| | | | BLACKROCK FUNDS | | MARCH 31, 2013 | | 43 |
| | |
| | |
| | |
| Notes to Financial Statements (continued) | | |
The Trust, on behalf of the Funds, entered into a Distribution Agreement and Distribution and Service Plan with BlackRock Investments, LLC (“BRIL”), an affiliate of the Manager. Pursuant to the Distribution and Service Plan and in accordance with Rule 12b-1 under the 1940 Act, the Funds pay BRIL ongoing service and distribution fees. The fees are accrued daily and paid monthly at annual rates based upon the average daily net assets of the shares of each Fund as follows:
| | | | | | |
| | | Service
Fee | | | Distribution
Fee |
Service | | | 0.25% | | | N/A |
Investor A | | | 0.25% | | | N/A |
Investor B | | | 0.25% | | | 0.75% |
Investor C | | | 0.25% | | | 0.75% |
Pursuant to sub-agreements with BRIL, broker-dealers and BRIL provide shareholder servicing and distribution services to each Fund. The ongoing service and/or distribution fee compensates BRIL and each broker-dealer for providing shareholder servicing and/or distribution related services to Service, Investor A, Investor B and Investor C shareholders.
For the six months ended March 31, 2013, the following table shows the class specific service and distribution fees borne directly by each class of each Fund:
| | | | | | | | | | | | | | | | |
| | | All-Cap Energy & Resources | | | China Fund | | | Energy &
Resources | | | World
Gold | |
Service | | | $ 4,060 | | | | – | | | | – | | | | – | |
Investor A | | | 156,133 | | | $ | 772 | | | $ | 628,356 | | | $ | 4,147 | |
Investor B | | | 68,310 | | | | – | | | | 32,259 | | | | – | |
Investor C | | | 387,307 | | | | 320 | | | | 621,024 | | | | 14,878 | |
Total | | | $615,810 | | | $ | 1,092 | | | $ | 1,281,639 | | | $ | 19,025 | |
Pursuant to written agreements, certain financial intermediaries, some of which may be affiliates, provide the Funds with sub-accounting, recordkeeping, sub-transfer agency and other administrative services with respect to sub-accounts they service. For these services, these entities receive an asset based fee or annual fee per shareholder account, which will vary depending on share class and/or net assets. For the six months ended March 31, 2013, the Funds paid the following to affiliates in return for these services, which are included in transfer agent – class specific in the Statements of Operations:
| | | | |
| | | All-Cap
Energy &
Resources | | Energy &
Resources |
Institutional | | $118 | | $3,525 |
Investor A | | – | | 71 |
Investor C | | 24 | | – |
Total | | $142 | | $3,596 |
The Manager maintains a call center, which is responsible for providing certain shareholder services to the Funds, such as responding to shareholder inquiries and processing transactions based upon instructions
from shareholders with respect to the subscription and redemption of Fund shares. For the six months ended March 31, 2013, each Fund reimbursed the Manager the following amounts for costs incurred in running the call center, which are included in transfer agent – class specific in the Statements of Operations:
| | | | | | | | | | | | | | | | |
| | | All-Cap
Energy &
Resources | | | China
Fund | | | Energy &
Resources | | | World
Gold | |
Institutional | | | $ 1,652 | | | | $26 | | | | $ 1,128 | | | | $ 34 | |
Service | | | 153 | | | | – | | | | – | | | | – | |
Investor A | | | 6,274 | | | | 44 | | | | 15,939 | | | | 536 | |
Investor B | | | 1,362 | | | | – | | | | 776 | | | | – | |
Investor C | | | 2,204 | | | | 19 | | | | 3,971 | | | | 290 | |
Total | | | $11,645 | | | | $89 | | | | $21,814 | | | | $860 | |
For the six months ended March 31, 2013, the following table shows the class specific transfer agent fees borne directly by each class of each Fund:
| | | | | | | | | | | | | | | | |
| | | All-Cap
Energy &
Resources | | | China
Fund | | | Energy &
Resources | | | World
Gold | |
Institutional | | | $ 63,302 | | | | $196 | | | | $132,867 | | | | $ 742 | |
Service | | | 2,813 | | | | – | | | | – | | | | – | |
Investor A | | | 133,655 | | | | 404 | | | | 486,823 | | | | 5,350 | |
Investor B | | | 23,714 | | | | – | | | | 13,896 | | | | – | |
Investor C | | | 79,682 | | | | 167 | | | | 128,674 | | | | 3,291 | |
Total | | | $303,166 | | | | $767 | | | | $762,260 | | | | $9,383 | |
BNY Mellon Investment Servicing (US) Inc. (“BNYMIS”) and the Manager act as co-administrators for the Funds. For these services, the co-administrators receive an administration fee computed daily and payable monthly to each administrator pursuant to separate fee arrangements, based on a percentage of the average daily net assets of each Fund. The combined administration fee, which is shown as administration in the Statements of Operations, is paid at the following annual rates:
| | |
| Average Daily Net Assets | | Administration Fee |
First $500 Million | | 0.075% |
$500 Million - $1 Billion | | 0.065% |
Greater than $1 Billion | | 0.055% |
In addition, each of the share classes is charged an administration fee, which is shown as administration – class specific in the Statements of Operations, based on the following percentages of average daily net assets of each respective class:
| | |
| Average Daily Net Assets | | Administration Fee – Class Specific |
First $500 Million | | 0.025% |
$500 Million - $1 Billion | | 0.015% |
Greater than $1 Billion | | 0.005% |
In addition, BNYMIS and the Manager may have, at their discretion, voluntarily waived all or any portion of their administration fees for a Fund
| | | | | | | | |
| | | | | | | | |
| | | | | | | | |
44 | | | | BLACKROCK FUNDS | | MARCH 31, 2013 | | |
| | |
| | |
| | |
| Notes to Financial Statements (continued) | | |
| | |
or a share class which is included in administration fees waived and administration fees waived – class specific in the Statements of Operations. For the six months ended March 31, 2013, the Funds paid the following to the Manager in return for these services, which are included in administration, administration – class specific, administration fees waived and administration fees waived – class specific in the Statements of Operations:
| | | | |
Administration Fees | | | | |
All-Cap Energy & Resources | | $ | 114,022 | |
China | | $ | 10 | |
Energy & Resources | | $ | 283,194 | |
World Gold | | $ | 2 | |
For the six months ended March 31, 2013, the following table shows the class specific administration fees borne directly by each class of each Fund:
| | | | | | | | | | | | | | | | |
| | | All-Cap
Energy & Resources | | | China
Fund | | | Energy & Resources | | | World
Gold | |
Institutional | | | $22,941 | | | | $370 | | | | $23,881 | | | | $422 | |
Service | | | 406 | | | | – | | | | – | | | | – | |
Investor A | | | 15,613 | | | | 77 | | | | 62,365 | | | | 414 | |
Investor B | | | 1,712 | | | | – | | | | 815 | | | | – | |
Investor C | | | 9,694 | | | | 8 | | | | 15,541 | | | | 372 | |
| | | | | | | | | | | | | | | | |
Total | | | $50,366 | | | | $455 | | | | $102,602 | | | | $1,208 | |
| | | | | | | | | | | | | | | | |
The Manager contractually agreed to waive and/or reimburse fees or expenses, excluding interest expense, dividend expense, income tax expense, acquired fund fees and expenses and certain other fund expenses, which constitute extraordinary expenses not incurred in the ordinary course of the Funds’ business, in order to limit expenses. The expense limitations as a percentage of average daily net assets are as follows:
| | | | | | | | | | | | | | | | | | | | |
| | | All-Cap
Energy &
Resources | | China
Fund | | Energy &
Resources | | World
Gold |
BlackRock | | | | 0.92 | %1 | | | | N/A | | | | | N/A | | | | | N/A | |
Institutional | | | | 0.96 | % | | | | 1.65 | % | | | | 1.07 | % | | | | 1.24 | % |
Service | | | | 1.38 | % | | | | N/A | | | | | 1.38 | %1 | | | | N/A | |
Investor A | | | | 1.38 | % | | | | 1.90 | % | | | | 1.38 | % | | | | 1.49 | % |
Investor B | | | | 2.10 | % | | | | N/A | | | | | 2.10 | % | | | | N/A | |
Investor C | | | | 2.10 | % | | | | 2.65 | % | | | | 2.10 | % | | | | 2.27 | % |
Class R | | | | 1.83 | %1 | | | | N/A | | | | | 1.94 | %1 | | | | N/A | |
| 1 | There were no shares outstanding as of March 31, 2013. |
The Manager has agreed not to reduce or discontinue this contractual waiver or reimbursement prior to February 1, 2014 unless approved by the Board, including a majority of the Independent Trustees.
These amounts waived or reimbursed are included in fees waived by Manager and expenses reimbursed by Manager, and shown as administration fees waived, administration fees waived – class specific, transfer agent fees waived – class specific, transfer agent fees reimbursed – class specific and expenses reimbursed by Manager, respectively, in the
Statements of Operations. For the six months ended March 31, 2013, the Manager waived $18,367 and $36,160 of investment advisory fees for China Fund and World Gold, respectively, which are included in fees waived by Manager. The Manager reimbursed expenses of $64,385 and $6,714 for China Fund and World Gold, respectively, which are shown as expenses reimbursed by Manager. Class specific expense waivers or reimbursements are as follows:
| | | | | | | | | | | | | | | | |
Administration Fees Waived | |
| | | All-Cap
Energy &
Resources | | | China
Fund | | | Energy &
Resources | | | World
Gold | |
Institutional | | | $14,414 | | | | $360 | | | | – | | | | $ 420 | |
Service | | | 12 | | | | – | | | | | | | | – | |
Investor A | | | 6,551 | | | | 77 | | | | – | | | | 414 | |
Investor B | | | 1,599 | | | | – | | | | $ 757 | | | | – | |
Investor C | | | 7,487 | | | | 8 | | | | 3,038 | | | | 372 | |
| | | | | | | | | | | | | | | | |
Total | | | $30,063 | | | | $445 | | | | $3,795 | | | | $1,206 | |
| | | | | | | | | | | | | | | | |
Transfer Agent Fees Waived | |
| | | All-Cap
Energy &
Resources | | | China
Fund | | | Energy &
Resources | | | World
Gold | |
Institutional | | | $1,025 | | | | $25 | | | | – | | | | $ 34 | |
Investor A | | | 993 | | | | 44 | | | | – | | | | 536 | |
Investor B | | | 1,362 | | | | – | | | | $776 | | | | – | |
Investor C | | | 1,116 | | | | 18 | | | | – | | | | 290 | |
| | | | | | | | | | | | | | | | |
Total | | | $4,496 | | | | $87 | | | | $776 | | | | $860 | |
| | | | | | | | | | | | | | | | |
Transfer Agent Fees Reimbursed | |
| | | All-Cap
Energy &
Resources | | | China
Fund | | | Energy &
Resources | | | World
Gold | |
Institutional | | | $ 4,796 | | | | $135 | | | | – | | | | $ 671 | |
Investor A | | | 106 | | | | 336 | | | | – | | | | 4,787 | |
Investor B | | | 8,288 | | | | – | | | | $5,683 | | | | – | |
Investor C | | | 1,621 | | | | 138 | | | | – | | | | 2,496 | |
| | | | | | | | | | | | | | | | |
Total | | | $14,811 | | | | $609 | | | | $5,683 | | | | $7,954 | |
| | | | | | | | | | | | | | | | |
If during a Fund’s fiscal year the operating expenses of a share class, that at any time during the prior two fiscal years received a waiver or reimbursement from the Manager, are less than the expense limit for that share class, the Manager is entitled to be reimbursed by such share class up to the lesser of (a) the amount of fees waived or expenses reimbursed during those prior two fiscal years under the agreement and (b) the amount by which the expense limit for that share class exceeds the operating expenses of the share class for the current fiscal year, provided that: (1) the Fund of which the share class is a part has more than $50 million in assets for the fiscal year and (2) the Manager or an affiliate continues to serve as the Fund’s investment advisor or administrator. In the event the expense limit for a share class is changed subsequent to a fiscal year in which the Manager becomes entitled to reimbursement for fees waived or reimbursed, the amount available to reimburse the Manager shall be calculated by reference to the expense limit for that share class in effect at the time the Manager became entitled to receive such reimbursement, rather than the subsequently changed expense limit for that share class.
| | | | | | | | |
| | | | | | | | |
| | | | | | | | |
| | | | BLACKROCK FUNDS | | MARCH 31, 2013 | | 45 |
| | |
| | |
| | |
| Notes to Financial Statements (continued) | | |
| | |
For the six months ended March 31, 2013, the Manager recouped the following Fund level and class specific waivers and/or reimbursements previously recorded by the Funds:
| | | | | | | | |
| | | All-Cap
Energy &
Resources | | | Energy &
Resources | |
Institutional | | $ | 255 | | | $ | 3,266 | |
Service | | | 25 | | | | – | |
Investor A | | | 8,441 | | | | 15,204 | |
Investor B | | | 317 | | | | 362 | |
Investor C | | | 2,707 | | | | 3,176 | |
Total | | $ | 11,745 | | | $ | 22,008 | |
On March 31, 2013, the Fund level and class specific waivers and/or reimbursements subject to possible future recoupment under the expense limitation agreement are as follows:
| | | | | | | | | | | | |
| |
| | | Expiring September 30, | |
| |
| | | 2013 | | | 2014 | | | 2015 | |
| |
All-Cap Energy & Resources | | | | | | | | | | | | |
Institutional | | | – | | | $ | 14,384 | | | $ | 20,235 | |
Service | | | – | | | | – | | | $ | 12 | |
Investor A | | | – | | | $ | 8,325 | | | $ | 7,650 | |
Investor B | | $ | 1,244 | | | $ | 17,006 | | | $ | 11,249 | |
Investor C | | | – | | | | – | | | $ | 10,224 | |
China Fund | | | | | | | | | | | | |
Fund Level | | $ | 138,786 | | | $ | 291,902 | | | $ | 84,135 | |
Institutional | | $ | 296 | | | $ | 741 | | | $ | 520 | |
Investor A | | $ | 76 | | | $ | 592 | | | $ | 457 | |
Investor C | | $ | 46 | | | $ | 235 | | | $ | 164 | |
Energy & Resources | | | | | | | | | | | | |
Investor B | | | – | | | $ | 8,328 | | | $ | 7,216 | |
Investor C | | | – | | | $ | 2,680 | | | $ | 3,038 | |
World Gold | | | | | | | | | | | | |
Fund Level | | $ | 241,112 | | | $ | 105,132 | | | $ | 46,019 | |
Institutional | | $ | 3,977 | | | $ | 3,834 | | | $ | 1,125 | |
Investor A | | $ | 5,626 | | | $ | 11,562 | | | $ | 5,737 | |
Investor C | | $ | 2,560 | | | $ | 7,401 | | | $ | 3,158 | |
| |
For the six months ended March 31, 2013, affiliates earned underwriting discounts, direct commissions and dealer concessions on sales of each Fund’s Investor A Shares as follows:
| | | | |
| |
All-Cap Energy & Resources | | $ | 4,208 | |
China Fund | | $ | 870 | |
Energy & Resources | | $ | 10,776 | |
World Gold | | $ | 1,075 | |
| |
For the six months ended March 31, 2013, affiliates received CDSCs as follows:
| | | | | | | | | | | | |
| |
| | | Investor A | | | Investor B | | | Investor C | |
| |
All-Cap Energy & Resources | | | $ 36 | | | $ | 5,270 | | | $ | 2,381 | |
China Fund | | | – | | | | – | | | $ | 40 | |
Energy & Resources | | | $5,485 | | | $ | 7,168 | | | $ | 6,741 | |
World Gold | | | – | | | | – | | | $ | 105 | |
| |
The Funds received an exemptive order from the SEC permitting them, among other things, to pay an affiliated securities lending agent a fee
based on a share of the income derived from the securities lending activities and have retained BlackRock Investment Management, LLC (“BIM”) as the securities lending agent. BIM may, on behalf of the Funds, invest cash collateral received by a Fund for such loans in a private investment company managed by the Manager or in registered money market funds advised by the Manager or its affiliates. The market value of securities on loan and the value of the related collateral, if applicable, is shown in the Statements of Assets and Liabilities as securities loaned at value and collateral on securities loaned at value, respectively. The cash collateral invested by BIM, if any, is disclosed in the Schedules of Investments. Securities lending income is equal to the total of income earned from the reinvestment of cash collateral, net of rebates paid to, or fees paid by, borrowers of securities. The Funds retain 65% of securities lending income and pay a fee to BIM equal to 35% of such income. The Funds benefit from a borrower default indemnity provided by BlackRock. As securities lending agent, BIM bears all operational costs directly related to securities lending as well as the cost of borrower default indemnification. BIM does not receive any fees for managing the cash collateral. The share of income earned by the Funds is shown as securities lending – affiliated – net in the Statements of Operations. For the six months ended March 31, 2013, BIM received $109,320 in securities lending agent fees related to securities lending activities forAll-Cap Energy & Resouces.
Certain officers and/or trustees of the Trust are officers and/or directors of BlackRock or its affiliates. The Funds reimburse the Manager for a portion of the compensation paid to the Trust’s Chief Compliance Officer, which is included in officer and trustees in the Statements of Operations.
4. Investments:
Purchases and sales of investments excluding short-term securities for the six months ended March 31, 2013, were as follows:
| | | | | | | | |
| |
| | | Purchases | | | Sales | |
| |
All-Cap Energy & Resources | | $ | 24,629,123 | | | $ | 244,537,352 | |
China Fund | | $ | 2,129,601 | | | $ | 1,101,344 | |
Energy & Resources | | $ | 50,176,512 | | | $ | 255,575,408 | |
World Gold | | $ | 1,594,684 | | | $ | 1,653,277 | |
| |
5. Income Tax Information:
As of September 30, 2012, the Funds had capital loss carryforwards available to offset future realized capital gains through the indicated expiration dates as follows:
| | | | | | | | | | | | |
| Expires September 30, | | All-Cap Energy &
Resources | | | China
Fund | | | World
Gold | |
| |
2018 | | $ | 101,763,569 | | | | – | | | | – | |
No expiration date1 | | | 2,783,988 | | | $ | 29,499 | | | $ | 14,009 | |
| |
Total | | $ | 104,547,557 | | | $ | 29,499 | | | $ | 14,009 | |
| | | | |
| | 1Must | be utilized prior to losses subject to expiration. |
| | | | | | | | |
| | | | | | | | |
| | | | | | | | |
46 | | | | BLACKROCK FUNDS | | MARCH 31, 2013 | | |
| | |
| | |
| | |
| Notes to Financial Statements (continued) | | |
| | |
As of March 31, 2013, gross unrealized appreciation and gross unrealized depreciation based on cost for federal income tax purposes were as follows:
| | | | | | | | |
| | | All-Cap Energy &
Resources | | China Fund | | Energy & Resources | | World Gold |
Tax cost | | $281,990,144 | | $4,141,591 | | $ 642,700,123 | | $10,696,887 |
Gross unrealized appreciation | | $ 87,061,580 | | $ 257,266 | | $ 228,906,175 | | $ 378,552 |
Gross unrealized depreciation | | (27,020,146) | | (503,011) | | (121,124,436) | | (2,804,370) |
Net unrealized appreciation (depreciation) | | $ 60,041,434 | | $ (245,745) | | $ 107,781,739 | | $ (2,425,818) |
6. Borrowings:
The Trust, on behalf of the Funds, along with certain other funds managed by the Manager and its affiliates, is a party to a $ 500 million credit agreement with a group of lenders. The Funds may borrow under the credit agreement to fund shareholder redemptions. Effective November 2011 to November 2012, the credit agreement had the following terms: a commitment fee of 0.065% per annum based on the Funds’ pro rata share of the unused portion of the credit agreement and interest at a rate equal to the higher of (a) the one-month LIBOR plus 0.80% per annum or (b) the Fed Funds rate plus 0.80% per annum on amounts borrowed. In addition, the Funds paid administration and arrangement fees which were allocated to the Funds based on their net assets as of October 31, 2011. The credit agreement, which expired in November 2012, was renewed with the same terms until November 2013. Effective November 2012 to November 2013, the credit agreement has the following terms: a commitment fee of 0.065% per annum based on the Funds’ pro rata share of the unused portion of the credit agreement and interest at a rate equal to the higher of (a) the one-month LIBOR plus 0.80% per annum or (b) the Fed Funds rate plus 0.80% per annum on amounts borrowed. In addition, the Funds paid administration and arrangement fees which were allocated to the Funds based on their net assets as of October 31, 2012. The Funds did not borrow under the credit agreement during the six months ended March 31, 2013.
7. Concentration, Market and Credit Risk:
In the normal course of business, the Funds invest in securities and enter into transactions where risks exist due to fluctuations in the market (market risk) or failure of the issuer of a security to meet all its obligations (issuer credit risk). The value of securities held by the Funds may decline in response to certain events, including those directly involving the issuers whose securities are owned by the Funds; conditions affecting the general economy; overall market changes; local, regional or global political, social or economic instability; and currency and interest rate and price fluctuations. Similar to issuer credit risk, the Funds may be exposed to counterparty credit risk, or the risk that an entity with which the Funds have unsettled or open transactions may fail to or be unable to perform on its commitments. The Funds manage counterparty credit risk by entering into transactions only with counterparties that they
believe have the financial resources to honor their obligations and by monitoring the financial stability of those counterparties. Financial assets, which potentially expose the Funds to market, issuer and counterparty credit risks, consist principally of financial instruments and receivables due from counterparties. The extent of the Funds’ exposure to market, issuer and counterparty credit risks with respect to these financial assets is generally approximated by their value recorded in the Statements of Assets and Liabilities, less any collateral held by the Funds.
As of March 31, 2013, All-Cap Energy & Resources and Energy & Resources invested a significant portion of their assets in securities in the energy sector. Changes in economic conditions affecting the energy sector would have a greater impact on All-Cap Energy & Resources and Energy & Resources and could affect the value, income and/or liquidity of positions in such securities.
As of March 31, 2013, China Fund invested a significant portion of its assets in securities in the financial sector. Changes in economic conditions affecting the financial sector would have a greater impact on China Fund and could affect the value, income and/or liquidity of positions in such securities.
As of March 31, 2013, World Gold invested a significant portion of its assets in securities in the materials sector. Changes in economic conditions affecting the materials sector would have a greater impact on World Gold and could affect the value, income and/or liquidity of positions in such securities.
China Fund invests a substantial amount of its assets in issuers located in a single country or a limited number of countries. When China Fund concentrates its investments in this manner, it assumes the risk that economic, political and social conditions in those countries may have a significant impact on its investment performance. Foreign issuers may not be subject to the same uniform accounting, auditing and financial reporting standards and practices as used in the United States. Foreign securities markets may also be less liquid, more volatile, and less subject to governmental supervision not typically associated with investing in US securities. Please see the Schedule of Investments for concentrations in specific countries.
| | | | | | | | |
| | | | | | | | |
| | | | | | | | |
| | | | BLACKROCK FUNDS | | MARCH 31, 2013 | | 47 |
| | |
| | |
| | |
| Notes to Financial Statements (continued) | | |
As of March 31, 2013, the Funds listed below had the following geographic allocations:
| | | | | | | | | | |
| Geographic Allocations | | All-Cap
Energy &
Resources | | Energy &
Resources |
United States | | | | 79 | % | | | | 71 | % |
Canada | | | | 9 | | | | | 17 | |
Bermuda | | | | 3 | | | | | 5 | |
United Kingdom | | | | 3 | | | | | 4 | |
Netherlands | | | | 2 | | | | | – | |
Norway | | | | 2 | | | | | – | |
France | | | | 1 | | | | | – | |
China | | | | 1 | | | | | – | |
Australia | | | | – | | | | | 1 | |
Monaco | | | | – | | | | | 1 | |
Switzerland | | | | – | | | | | 1 | |
8. Capital Share Transactions:
Transactions in capital shares for each class were as follows:
| | | | | | | | | | | | | | | | | | |
| | | Six Months Ended March 31, 2013 | | | | | Year Ended September 30, 2012 | |
| All-Cap Energy & Resources | | Shares | | | Amount | | | | | Shares | | | Amount | |
Institutional | | | | | | | | | | | | | | | | | | |
Shares sold | | | 404,743 | | | $ | 5,456,610 | | | | | | 6,021,802 | | | $ | 83,251,404 | |
Shares issued in reinvestment of dividends | | | 3,624 | | | | 48,053 | | | | | | – | | | | – | |
Shares redeemed | | | (12,458,147 | ) | | | (167,720,953 | ) | | | | | (18,802,388 | ) | | | (242,281,654 | ) |
Net decrease | | | (12,049,780 | ) | | $ | (162,216,290 | ) | | | | | (12,780,586 | ) | | $ | (159,030,250 | ) |
| | | | | | | | | | | | | | | | | | |
Service | | | | | | | | | | | | | | | | | | |
Shares sold | | | 3,910 | | | $ | 52,129 | | | | | | 107,092 | | | $ | 1,381,337 | |
Shares redeemed | | | (81,687 | ) | | | (1,075,130 | ) | | | | | (221,743 | ) | | | (2,873,058 | ) |
Net decrease | | | (77,777 | ) | | $ | (1,023,001 | ) | | | | | (114,651 | ) | | $ | (1,491,721 | ) |
| | | | | | | | | | | | | | | | | | |
Investor A | | | | | | | | | | | | | | | | | | |
Shares sold and automatic conversion of shares | | | 366,362 | | | $ | 4,845,392 | | | | | | 1,973,148 | | | $ | 26,338,644 | |
Shares redeemed | | | (2,744,760 | ) | | | (36,257,575 | ) | | | | | (7,240,590 | ) | | | (95,126,674 | ) |
Net decrease | | | (2,378,398 | ) | | $ | (31,412,183 | ) | | | | | (5,267,442 | ) | | $ | (68,788,030 | ) |
| | | | | | | | | | | | | | | | | | |
Investor B | | | | | | | | | | | | | | | | | | |
Shares sold | | | 545 | | | $ | 7,030 | | | | | | 11,986 | | | $ | 162,367 | |
Shares redeemed and automatic conversion of shares | | | (227,580 | ) | | | (2,847,255 | ) | | | | | (456,318 | ) | | | (5,851,269 | ) |
Net decrease | | | (227,035 | ) | | $ | (2,840,225 | ) | | | | | (444,332 | ) | | $ | (5,688,902 | ) |
| | | | | | | | |
| | | | | | | | |
| | | | | | | | |
48 | | | | BLACKROCK FUNDS | | MARCH 31, 2013 | | |
| | |
| | |
| | |
| Notes to Financial Statements (continued) | | |
| | |
| | | | | | | | | | | | | | | | | | |
| | | Six Months Ended
March 31, 2013 | | | | | Year Ended
September 30, 2012 | |
| All-Cap Energy & Resources (concluded) | | Shares | | | Amount | | | | | Shares | | | Amount | |
Investor C | | | | | | | | | | | | | | | | | | |
Shares sold | | | 150,969 | | | $ | 1,882,004 | | | | | | 489,037 | | | $ | 6,267,104 | |
Shares redeemed | | | (1,276,819 | ) | | | (15,929,195 | ) | | | | | (2,371,287 | ) | | | (29,603,590 | ) |
| | | | | | | | | | |
Net decrease | | | (1,125,850 | ) | | $ | (14,047,191 | ) | | | | | (1,882,250 | ) | | $ | (23,336,486 | ) |
Total Net Decrease | | | (15,858,840 | ) | | $ | (211,538,890 | ) | | | | | (20,489,261 | ) | | $ | (258,335,389 | ) |
| | | | | | | | | | |
| | | | | |
China Fund | | | | | | | | | | | | | | | | | | |
Institutional | | | | | | | | | | | | | | | | | | |
Shares sold | | | 130,743 | | | $ | 1,214,766 | | | | | | 7,111 | | | $ | 56,492 | |
Shares issued in reinvestment of dividends | | | 83 | | | | 736 | | | | | | 59 | | | | 425 | |
Shares redeemed | | | (124,517 | ) | | | (1,132,045 | ) | | | | | (2,135 | ) | | | (16,076 | ) |
| | | | | | | | | | |
Net increase | | | 6,309 | | | $ | 83,457 | | | | | | 5,035 | | | $ | 40,841 | |
| | | | | | | | | | |
| | | | | | | | | | | | | | | | | | |
Investor A | | | | | | | | | | | | | | | | | | |
Shares sold | | | 96,946 | | | $ | 892,095 | | | | | | 49,821 | | | $ | 396,058 | |
Shares issued in reinvestment of dividends | | | 392 | | | | 3,443 | | | | | | 89 | | | | 642 | |
Shares redeemed | | | (17,690 | ) | | | (156,350 | ) | | | | | (10,947 | ) | | | (87,891 | ) |
| | | | | | | | | | |
Net increase | | | 79,648 | | | $ | 739,188 | | | | | | 38,963 | | | $ | 308,809 | |
| | | | | | | | | | |
| | | | | | | | | | | | | | | | | | |
Investor C | | | | | | | | | | | | | | | | | | |
Shares sold | | | 13,822 | | | $ | 129,052 | | | | | | 2,158 | | | $ | 16,980 | |
Shares issued in reinvestment of dividends | | | 7 | | | | 58 | | | | | | 23 | | | | 163 | |
Shares redeemed | | | (828 | ) | | | (7,338 | ) | | | | | (1,274 | ) | | | (10,199 | ) |
| | | | | | | | | | |
Net increase | | | 13,001 | | | $ | 121,772 | | | | | | 907 | | | $ | 6,944 | |
Total Net Increase | | | 98,958 | | | $ | 944,417 | | | | | | 44,905 | | | $ | 356,594 | |
| | | | | | | | | | |
| | | | | |
Energy & Resources | | | | | | | | | | | | | | | | | | |
Institutional | | | | | | | | | | | | | | | | | | |
Shares sold | | | 471,149 | | | $ | 15,675,633 | | | | | | 3,727,042 | | | $ | 130,938,030 | |
Shares issued in reinvestment of dividends and distributions | | | 4,497 | | | | 146,688 | | | | | | 310,297 | | | | 11,564,803 | |
Shares redeemed | | | (2,651,039 | ) | | | (88,331,968 | ) | | | | | (6,948,143 | ) | | | (230,519,659 | ) |
| | | | | | | | | | |
Net decrease | | | (2,175,393 | ) | | $ | (72,509,647 | ) | | | | | (2,910,804 | ) | | $ | (88,016,826 | ) |
| | | | | | | | | | |
| | | | | | | | | | | | | | | | | | |
Investor A | | | | | | | | | | | | | | | | | | |
Shares sold and automatic conversion of shares | | | 1,197,561 | | | $ | 34,855,376 | | | | | | 4,955,288 | | | $ | 153,944,975 | |
Shares issued in reinvestment of dividends and distributions | | | 20,430 | | | | 579,797 | | | | | | 850,674 | | | | 27,672,619 | |
Shares redeemed | | | (4,152,137 | ) | | | (120,273,231 | ) | | | | | (9,761,088 | ) | | | (299,587,019 | ) |
| | | | | | | | | | |
Net decrease | | | (2,934,146 | ) | | $ | (84,838,058 | ) | | | | | (3,955,126 | ) | | $ | (117,969,425 | ) |
| | | | | | | | | | |
| | | | | | | | | | | | | | | | | | |
Investor B | | | | | | | | | | | | | | | | | | |
Shares sold | | | 2,172 | | | $ | 44,853 | | | | | | 7,431 | | | $ | 174,873 | |
Shares issued in reinvestment of dividends and distributions | | | 502 | | | | 10,444 | | | | | | 32,306 | | | | 778,304 | |
Shares redeemed and automatic conversion of shares | | | (113,284 | ) | | | (2,400,320 | ) | | | | | (471,455 | ) | | | (10,887,816 | ) |
| | | | | | | | | | |
Net decrease | | | (110,610 | ) | | $ | (2,345,023 | ) | | | | | (431,718 | ) | | $ | (9,934,639 | ) |
| | | | | | | | | | |
| | | | | | | | |
| | | | | | | | |
| | | | | | | | |
| | | | BLACKROCK FUNDS | | MARCH 31, 2013 | | 49 |
| | |
| | |
| | |
| Notes to Financial Statements (concluded) | | |
| | |
| | | | | | | | | | | | | | | | | | |
| | | Six Months Ended
March 31, 2013 | | | | | Year Ended
September 30, 2012 | |
| Energy & Resources (concluded) | | Shares | | | Amount | | | | | Shares | | | Amount | |
Investor C | | | | | | | | | | | | | | | | | | |
Shares sold | | | 271,588 | | | $ | 5,759,086 | | | | | | 987,159 | | | $ | 22,563,689 | |
Shares issued in reinvestment of dividends and distributions | | | 9,346 | | | | 193,162 | | | | | | 325,305 | | | | 7,768,854 | |
Shares redeemed | | | (1,264,788 | ) | | | (26,684,812 | ) | | | | | (2,068,360 | ) | | | (46,074,198 | ) |
| | | | | | | | | | |
Net decrease | | | (983,854 | ) | | $ | (20,732,564 | ) | | | | | (755,896 | ) | | $ | (15,741,655 | ) |
Total Net Decrease | | | (6,204,003 | ) | | $ | (180,425,292 | ) | | | | | (8,053,544 | ) | | $ | (231,662,545 | ) |
| | | | | | | | | | |
| | | | | |
World Gold | | | | | | | | | | | | | | | | | | |
Institutional | | | | | | | | | | | | | | | | | | |
Shares sold | | | 18,365 | | | | $ 165,422 | | | | | | 71,385 | | | | $ 766,827 | |
Shares issued in reinvestment of dividends and distributions | | | 780 | | | | 7,337 | | | | | | 159 | | | | 1,794 | |
Shares redeemed | | | (37,315 | ) | | | (357,725 | ) | | | | | (99,325 | ) | | | (1,028,979 | ) |
| | | | | | | | | | |
Net decrease | | | (18,170 | ) | | | $(184,966 | ) | | | | | (27,781 | ) | | | $ (260,358 | ) |
| | | | | | | | | | |
| | | | | | | | | | | | | | | | | | |
Investor A | | | | | | | | | | | | | | | | | | |
Shares sold | | | 209,733 | | | | $ 1,828,222 | | | | | | 289,517 | | | | $ 3,002,707 | |
Shares issued in reinvestment of dividends and distributions | | | 4,366 | | | | 40,957 | | | | | | – | | | | – | |
Shares redeemed | | | (240,406 | ) | | | (2,241,910 | ) | | | | | (183,509 | ) | | | (1,968,590 | ) |
| | | | | | | | | | |
Net increase (decrease) | | | (26,307 | ) | | | $ (372,731 | ) | | | | | 106,008 | | | | $ 1,034,117 | |
| | | | | | | | | | |
| | | | | | | | | | | | | | | | | | |
Investor C | | | | | | | | | | | | | | | | | | |
Shares sold | | | 101,186 | | | | $ 962,916 | | | | | | 141,587 | | | | $ 1,492,993 | |
Shares issued in reinvestment of dividends and distributions | | | 3,162 | | | | 29,244 | | | | | | – | | | | – | |
Shares redeemed | | | (59,955 | ) | | | (524,071 | ) | | | | | (105,463 | ) | | | (1,157,366 | ) |
| | | | | | | | | | |
Net increase | | | 44,393 | | | | $ 468,089 | | | | | | 36,124 | | | | $335,627 | |
Total Net Increase (Decrease) | | | (84 | ) | | | $ (89,608 | ) | | | | | 114,351 | | | | $ 1,109,386 | |
| | | | | | | | | | |
At March 31, 2013, shares owned by affiliates for China Fund and World Gold were as follows:
| | | | | | | | |
| Shares | | China
Fund | | | World
Gold | |
Institutional | | | 296,000 | | | | 296,000 | |
Investor A | | | 2,000 | | | | 2,000 | |
Investor C | | | 2,000 | | | | 2,000 | |
9. Subsequent Events:
Management’s evaluation of the impact of all subsequent events on the Funds’ financial statements was completed through the date the financial statements were issued and the following item was noted:
Effective April 25, 2013, the credit agreement was terminated and a new agreement was entered into. The Funds became a party to a 364-day, $800 million credit agreement, which expires in April 2014. Excluding commitments designated for a certain individual fund, the Funds can borrow up to an aggregate commitment amount of $500 million, subject to asset coverage and other limitations as specified in the agreement. The credit agreement has the following terms: a fee of 0.065% per annum on unused commitment amounts and interest at a rate equal to the higher of (a) the one-month LIBOR plus 0.80% per annum or (b) the Fed Funds rate plus 0.80% per annum on amounts borrowed.
| | | | | | | | |
| | | | | | | | |
| | | | | | | | |
50 | | | | BLACKROCK FUNDS | | MARCH 31, 2013 | | |
Officers and Trustees
Ronald W. Forbes, Co-Chairman of the Board and Trustee
Rodney D. Johnson, Co-Chairman of the Board and Trustee
Paul L. Audet, Trustee
David O. Beim, Trustee
Henry Gabbay, Trustee
Dr. Matina S. Horner, Trustee
Herbert I. London, Trustee
Ian A. MacKinnon, Trustee
Cynthia A. Montgomery, Trustee
Joseph P. Platt, Trustee
Robert C. Robb, Jr., Trustee
Toby Rosenblatt, Trustee
Kenneth L. Urish, Trustee
Frederick W. Winter, Trustee
John M. Perlowski, President and Chief Executive Officer
Richard Hoerner, CFA, Vice President
Brendan Kyne, Vice President
Christopher Stavrakos, CFA, Vice President
Neal Andrews, Chief Financial Officer
Jay Fife, Treasurer
Brian Kindelan, Chief Compliance Officer and Anti-Money Laundering Officer
Benjamin Archibald, Secretary
Investment Advisor and Co-Administrator
BlackRock Advisors, LLC
Wilmington, DE 19809
Sub-Advisor
BlackRock International Limited1
Edinburgh, Scotland EH3 8JB
BlackRock (Hong Kong) Limited2
Hong Kong, China
Accounting Agent, Co-Administrator and Transfer Agent
BNY Mellon Investment Servicing (US) Inc.
Wilmington, DE 19809
Custodian
The Bank of New York Mellon
New York, NY 10286
Distributor
BlackRock Investments, LLC
New York, NY 10022
Legal Counsel
Sidley Austin LLP
New York, NY 10019
Independent Registered Public Accounting Firm
Deloitte & Touche LLP
Philadelphia, PA 19103
Address of the Trust
100 Bellevue Parkway
Wilmington, DE 19809
| 1 | For All-Cap Energy & Resources, Energy & Resources and World Gold Fund. |
| | | | | | | | |
| | | | | | | | |
| | | | | | | | |
| | | | BLACKROCK FUNDS | | MARCH 31, 2013 | | 51 |
Additional Information
Electronic Delivery
Electronic copies of most financial reports and prospectuses are available on the Funds’ website or shareholders can sign up for e-mail notifications of quarterly statements, annual and semi-annual reports and prospectuses by enrolling in the Funds’ electronic delivery program.
To enroll:
Shareholders Who Hold Accounts with Investment Advisors, Banks or Brokerages:
Please contact your financial advisor. Please note that not all investment advisors, banks or brokerages may offer this service.
Shareholders Who Hold Accounts Directly With BlackRock:
| 1) | Access the BlackRock website at http://www.blackrock.com/ edelivery |
| 2) | Select “eDelivery” under the “More Information” section |
Householding
The Funds will mail only one copy of shareholder documents, including prospectuses, annual and semi-annual reports and proxy statements, to shareholders with multiple accounts at the same address. This practice is commonly called “householding” and is intended to reduce expenses and eliminate duplicate mailings of shareholder documents. Mailings of your shareholder documents may be householded indefinitely unless you instruct us otherwise. If you do not want the mailing of these documents to be combined with those for other members of your household, please call the Funds at (800) 441-7762.
Availability of Quarterly Schedule of Investments
The Funds file their complete schedule of portfolio holdings with the SEC for the first and third quarters of each fiscal year on Form N-Q. The Funds’ Forms N-Q are available on the SEC’s website at http:// www.sec.gov and may also be reviewed and copied at the SEC’s Public Reference Room in Washington, D.C. Information on how to access documents on the SEC’s website without charge may be obtained by calling (800) SEC-0330. The Funds’
Forms N-Q may also be obtained upon request and without charge by calling (800) 441-7762.
Availability of Proxy Voting Policies and Procedures
A description of the policies and procedures that the Funds use to determine how to vote proxies relating to portfolio securities is available (1) without charge, upon request, by calling (800) 441-7762; (2) at http://www.blackrock.com; and (3) on the SEC’s website at http://www.sec.gov.
Availability of Proxy Voting Record
Information about how the Funds voted proxies relating to
securities held in the Funds’ portfolios during the most
recent 12-month period ended June 30 is available upon
request and without charge (1) at http://www.blackrock.com
or by calling (800) 441-7762 and (2) on the SEC’s website at http://www.sec.gov.
Account Information
Call us at (800) 441-7762 from 8:00 AM to 6:00 PM EST on any business day to get information about your account balances, recent transactions and share prices. You can also reach us on the Web at
http:// www.blackrock.com/funds.
Automatic Investment Plans
Investor Class shareholders who want to invest regularly can arrange to have $50 or more automatically deducted from their checking or savings account and invested in any of the BlackRock funds.
Systematic Withdrawal Plan
Investor Class shareholders can establish a systematic withdrawal plan and receive periodic payments of $50 or more from their BlackRock funds, as long as their account balance is at least $10,000.
Retirement Plans
Shareholders may make investments in conjunction with Traditional, Rollover, Roth, Coverdell, Simple IRAs, SEP IRAs and 403(b) Plans.
| | | | | | | | |
| | | | | | | | |
| | | | | | | | |
52 | | | | BLACKROCK FUNDS | | MARCH 31, 2013 | | |
| | |
| | |
| | |
| Additional Information (concluded) | | |
| | |
|
BlackRock Privacy Principles |
BlackRock is committed to maintaining the privacy of its current and former fund investors and individual clients (collectively, “Clients”) and to safeguarding their non-public personal information. The following information is provided to help you understand what personal information BlackRock collects, how we protect that information and why in certain cases we share such information with select parties.
If you are located in a jurisdiction where specific laws, rules or regulations require BlackRock to provide you with additional or different privacy-related rights beyond what is set forth below, then BlackRock will comply with those specific laws, rules or regulations.
BlackRock obtains or verifies personal non-public information from and about you from different sources, including the following: (i) information we receive from you or, if applicable, your financial intermediary, on applications, forms or other documents; (ii) information about your transactions with us, our affiliates, or others; (iii) information we receive from a consumer reporting agency; and (iv) from visits to our websites.
BlackRock does not sell or disclose to non-affiliated third parties any non-public personal information about its Clients, except as permitted by law or as is necessary to respond to regulatory requests or to service Client accounts. These non-affiliated third parties are required to protect the confidentiality and security of this information and to use it only for its intended purpose.
We may share information with our affiliates to service your account or to provide you with information about other BlackRock products or services that may be of interest to you. In addition, BlackRock restricts access to non-public personal information about its Clients to those BlackRock employees with a legitimate business need for the information. BlackRock maintains physical, electronic and procedural safeguards that are designed to protect the non-public personal information of its Clients, including procedures relating to the proper storage and disposal of such information.
| | | | | | | | |
| | | | | | | | |
| | | | | | | | |
| | | | BLACKROCK FUNDS | | MARCH 31, 2013 | | 53 |
| | |
| | |
| | |
| A World-Class Mutual Fund Family | | |
BlackRock offers a diverse lineup of open-end mutual funds crossing all investment styles and managed by experts in equity, fixed income and tax-exempt investing.
| | | | |
Equity Funds | | | | |
| | |
| BlackRock ACWI ex-US Index Fund | | BlackRock Global Dividend Income Portfolio | | BlackRock Mid-Cap Growth Equity Portfolio |
| BlackRock All-Cap Energy & Resources Portfolio | | BlackRock Global Long/Short Equity Fund | | BlackRock Mid-Cap Value Opportunities Fund |
| BlackRock Basic Value Fund | | BlackRock Global Opportunities Portfolio | | BlackRock Natural Resources Trust |
| BlackRock Capital Appreciation Fund | | BlackRock Global SmallCap Fund | | BlackRock Pacific Fund |
| BlackRock China Fund | | BlackRock Health Sciences Opportunities Portfolio | | BlackRock Real Estate Securities Fund |
| BlackRock Commodity Strategies Fund | | BlackRock India Fund | | BlackRock Russell 1000 Index Fund |
| BlackRock Disciplined Small Cap Core Fund | | BlackRock International Fund | | BlackRock Science & Technology |
BlackRock Emerging Markets Fund | | BlackRock International Index Fund | | Opportunities Portfolio |
| BlackRock Emerging Markets Long/Short | | BlackRock International Opportunities Portfolio | | BlackRock Small Cap Growth Equity Portfolio |
Equity Fund | | BlackRock Large Cap Core Fund | | BlackRock Small Cap Growth Fund II |
| BlackRock Energy & Resources Portfolio | | BlackRock Large Cap Core Plus Fund | | BlackRock Small Cap Index Fund |
| BlackRock Equity Dividend Fund | | BlackRock Large Cap Growth Fund | | BlackRock S&P 500 Stock Fund |
| BlackRock EuroFund | | BlackRock Large Cap Value Fund | | BlackRock U.S. Opportunities Portfolio |
| BlackRock Flexible Equity Fund | | BlackRock Latin America Fund | | BlackRock Value Opportunities Fund |
BlackRock Focus Growth Fund | | BlackRock Long-Horizon Equity Fund | | BlackRock World Gold Fund |
Taxable Fixed Income Funds | | | | |
| | |
| BlackRock Bond Index Fund | | BlackRock Inflation Protected Bond Portfolio | | BlackRock Strategic Income |
| BlackRock Core Bond Portfolio | | BlackRock International Bond Portfolio | | Opportunities Portfolio |
| BlackRock CoreAlpha Bond Fund | | BlackRock Long Duration Bond Portfolio | | BlackRock Total Return Fund |
| BlackRock Emerging Market Local Debt Portfolio | | BlackRock Low Duration Bond Portfolio | | BlackRock U.S. Government Bond Portfolio |
| BlackRock Floating Rate Income Portfolio | | BlackRock Secured Credit Portfolio | | BlackRock U.S. Mortgage Portfolio |
| BlackRock Global Long/Short Credit Fund | | BlackRock Short Obligations Fund | | BlackRock Ultra-Short Obligations Fund |
| BlackRock GNMA Portfolio | | BlackRock Short-Term Treasury Fund | | BlackRock World Income Fund |
BlackRock High Yield Bond Portfolio | | | | |
Municipal Fixed Income Funds | | | | |
| | |
| BlackRock California Municipal Bond Fund | | BlackRock National Municipal Fund | | BlackRock Pennsylvania Municipal Bond Fund |
| BlackRock High Yield Municipal Fund | | BlackRock New Jersey Municipal Bond Fund | | BlackRock Short-Term Municipal Fund |
BlackRock Intermediate Municipal Fund | | BlackRock New York Municipal Bond Fund | | |
Mixed Asset Funds | | | | |
| | |
| BlackRock Balanced Capital Fund | | LifePath Active Portfolios | | LifePath Index Portfolios |
| BlackRock Emerging Market Allocation Portfolio | | 2015 2040 | | Retirement 2040 |
| BlackRock Global Allocation Fund | | 2020 2045 | | 2020 2045 |
| BlackRock Managed Volatility Portfolio | | 2025 2050 | | 2025 2050 |
| BlackRock Multi-Asset Income Portfolio | | 2030 2055 | | 2030 2055 |
| BlackRock Multi-Asset Real Return Fund | | 2035 | | 2035 |
| BlackRock Strategic Risk Allocation Fund | | | | |
| BlackRock Prepared Portfolios | | LifePath Portfolios Retirement 2040 | | |
Conservative Prepared Portfolio | | 2020 2045 | | |
Moderate Prepared Portfolio | | 2025 2050 | | |
Growth Prepared Portfolio | | 2030 2055 | | |
Aggressive Growth Prepared Portfolio | | 2035 | | |
BlackRock mutual funds are currently distributed by BlackRock Investments, LLC. You should consider the investment objectives, risks, charges and expenses of the funds under consideration carefully before investing. Each fund’s prospectus contains this and other information and is available at www.blackrock.com or by calling (800) 441-7762 or from your financial advisor. The prospectus should be read carefully before investing.
| | | | | | | | |
| | | | | | | | |
54 | | | | BLACKROCK FUNDS | | MARCH 31, 2013 | | |
Table of Contents
| | | | | | |
| | | | |
| | | | | | | |
| 2 | | BLACKROCK FUNDS | | MARCH 31, 2013 | | |
Despite continued global headwinds, risk assets (such as equities) have generated strong performance as investors sought meaningful yields in the ongoing low-interest-rate environment. About this time one year ago, concerns about Europe’s debt crisis dominated the markets as political instability in Greece and severe deficit and liquidity problems in Spain raised the specter of a full-blown euro collapse. Investors were also discouraged by gloomy economic reports from various parts of the world, particularly in China. As the outlook for the global economy worsened, however, investors grew increasingly optimistic that the world’s largest central banks would intervene to stimulate growth. This theme, along with the European Central Bank’s (“ECB’s”) firm commitment to preserve the euro currency bloc, drove most asset classes higher through the summer of 2012. In early September, the ECB announced it would purchase unlimited amounts of short term sovereign bonds to support the region’s debt-laden countries. Days later, the US Federal Reserve announced its own much-anticipated stimulus package.
Although financial markets world-wide were buoyed by these aggressive policy actions, risk assets weakened in the fall of 2012. Global trade began to slow as many European countries fell into recession and growth continued to decelerate in China. In the United States, stocks slid on lackluster corporate earnings and volatility rose in advance of the US Presidential election. In the post-election environment, investors grew increasingly concerned over the “fiscal cliff,” the automatic tax increases and spending cuts that had been scheduled to take effect at the beginning of 2013. There was widespread fear that the fiscal cliff would push the United States into recession unless politicians could agree upon alternate measures to reduce the nation’s deficit. Worries that bipartisan gridlock would preclude a timely budget deal triggered high levels of volatility in financial markets around the world in the months leading up to the last day of the year. Ultimately, the worst of the fiscal cliff was averted with a last-minute tax deal, although the postponement of decisions relating to spending cuts and the debt ceiling left some lingering uncertainty.
Investors shook off the nerve-wracking finale to 2012 and the New Year began with a powerful relief rally in risk assets. Money that had been pulled to the sidelines amid year-end tax-rate uncertainty poured back into the markets in January. Key indicators signaling modest but broad-based improvements in the world’s major economies underpinned the rally. Underlying this aura of comfort was the absence of negative headlines out of Europe. Against this backdrop, global equities surged through January while rising US Treasury yields pressured high quality fixed income assets (as prices move in the opposite direction as yields).
However, bond markets regained strength in February when economic momentum slowed and investors toned down their risk appetite. US stocks continued to rise, but at a more moderate pace. Uncertainty about how long the Federal Reserve would maintain its monetary easing bias drove high levels of volatility later in the month, but these fears abated as the budget sequester (automatic spending cuts scheduled to take effect March 1) began to appear imminent and was deemed likely to deter any near-term changes in the central bank’s policy stance. Improving labor market data and rising home prices pushed US stocks higher at the end of the period, with major indices reaching new all-time highs. Outside the United States, equity prices weakened in the final two months of the period due to a resurgence of macro risk out of Europe. Italy’s February presidential election ended in a stalemate, further propagating the ongoing theme of political instability in the eurozone. In March, a severe banking crisis in Cyprus underscored the fragility of the broader European banking system.
For the 6- and 12-month periods ended March 31, 2013, US and international stocks and high yield bonds posted strong gains, while emerging market equities lagged as the pace of global growth failed to impress investors. US Treasury yields were highly volatile over the past 12 months. While remaining relatively low from a historical standpoint, yields began inching higher in the later part of the period, pressuring Treasuries and investment-grade bonds. Tax-exempt municipal bonds, however, benefited from favorable supply-and-demand dynamics. Near-zero short term interest rates continued to keep yields on money market securities near their all-time lows.
Markets have always been unpredictable, but that does not mean investors can delay taking action. At BlackRock, we believe it’s time for a different approach to investing. One that seeks out more opportunities in more places across a broader array of investments in a portfolio designed to move freely as the markets move up and down. People everywhere are asking, “So what do I do with my money?” Visit www.blackrock.com for answers.
Sincerely,

Rob Kapito
President, BlackRock Advisors, LLC

“Despite continued global headwinds, risk assets (such as equities) have generated strong performance as investors sought meaningful yields in the ongoing low-interest-rate environment.”
Rob Kapito
President, BlackRock Advisors, LLC
Total Returns as of March 31, 2013
| | | | |
| | | 6-month | | 12-month |
US large cap equities (S&P 500® Index) | | 10.19% | | 13.96% |
US small cap equities (Russell 2000® Index) | | 14.48 | | 16.30 |
International equities (MSCI Europe, Australasia, Far East Index) | | 12.04 | | 11.25 |
Emerging market equities (MSCI Emerging Markets Index) | | 3.87 | | 1.96 |
3-month Treasury bill (BofA Merrill Lynch 3-Month US Treasury Bill Index) | | 0.06 | | 0.12 |
US Treasury securities (BofA Merrill Lynch 10- Year US Treasury Index) | | (0.55) | | 6.19 |
US investment grade bonds (Barclays US Aggregate Bond Index) | | 0.09 | | 3.77 |
Tax-exempt municipal bonds (S&P Municipal Bond Index) | | 1.26 | | 5.82 |
US high yield bonds (Barclays US Corporate High Yield 2% Issuer Capped Index) | | 6.28 | | 13.08 |
Past performance is no guarantee of future results. Index performance is shown for illustrative purposes only. You cannot invest directly in an index.
| | | | | | |
| | | | | | | |
| | THIS PAGE NOT PART OF YOUR FUND REPORT | | | | 3 |
| | |
| | |
Fund Summary as of March 31, 2013 | | BlackRock Flexible Equity Fund |
BlackRock Flexible Equity Fund’s (the “Fund”) investment objective is to seek to achieve long-term total return.
|
| Portfolio Management Commentary |
How did the Fund perform?
| — | | For the six-month period ended March 31, 2013, the Fund underperformed its benchmark, the S&P 500® Index. |
What factors influenced performance?
| — | | The Fund’s holdings within the materials sector hurt results relative to the benchmark index. Exposure to gold and gold miners was the leading detractor as gold prices declined 10% in a rising equity market. In this environment, gold producers posted significant losses, including the Fund’s holding in Osisko Mining Corp. Also in the materials sector, the Fund’s position in CF Industries Holdings, Inc. had a negative impact on performance as the stock posted a double-digit decline for the period. While CF Industries remains one of the most cost-advantaged global producers of fertilizers due to low natural gas prices in the United States, concerns about global growth coupled with strong supplies of low-priced fertilizer from Chinese producers pressured the stock during the period. |
| — | | Contributing positively to performance was the Fund’s exposure to oil refinery stocks as this segment benefited from the dynamics of US versus global oil prices during the period. In particular, Phillips 66, PBF Energy, Inc. and HollyFrontier Corp. were among the strongest-performing stocks in the Fund. In the information technology (“IT”) sector, the Fund’s purchase of Yahoo!, Inc. had a positive impact on returns as the stock price rose nearly 40% since the time of purchase, driven largely by investors’ increasing comfort with the company’s restructuring efforts. Also within IT, the Fund’s well-timed trades of Apple, Inc., which led to a significant underweight in the stock, was a key driver of relative return comparisons. Lastly, the Fund’s emphasis on high-quality franchises was |
| | | beneficial in the rising equity market. Holdings such as Bayerische Motoren Werke AG, Comcast Corp. and Visa, Inc. contributed positively to relative performance during the period. |
Describe recent portfolio activity.
| — | | During the six-month period, the Fund initiated a sizeable position in insurer American International Group, Inc. which was trading at attractive valuations and poised to benefit from the company’s internal restructuring. Within IT, the Fund invested in Yahoo!, Inc. and SAIC, Inc. given a positive outlook for each of these companies as they restructure under new corporate leadership. These additions were funded primarily through a reduction in the Fund’s exposure to gold and gold producers, as well as sales of companies which had reached their price targets such as Bed Bath & Beyond, Inc. and International Business Machines Corp. In addition, the Fund sold its stake in Apple, Inc. given concerns about the sustainability of the company’s market share and its overall growth rate. While the Fund took a loss on this position, it did so well before the stock posted much larger declines during the period. |
Describe portfolio positioning at period end.
| — | | The Fund’s holdings continued to emphasize Fund management’s highest-conviction investment ideas and compelling risk-return dynamics. Relative to the S&P 500® Index, the Fund ended the period with sector overweights in energy, IT and financials, and underweights in consumer staples and utilities. The Fund established this pro-growth sector positioning through stocks where downside risks appeared limited. The Fund also used exposure to cash and gold as a means of managing risk in the portfolio. |
The views expressed reflect the opinions of BlackRock as of the date of this report and are subject to change based on changes in market, economic or other conditions. These views are not intended to be a forecast of future events and are no guarantee of future results.
| | | | | |
| Ten Largest Holdings | | Percent of Long-Term Investments |
Japan Airlines Co. Ltd. | | | | 8 | % |
Google, Inc., Class A | | | | 7 | |
Berkshire Hathaway, Inc., Class B | | | | 6 | |
American International Group, Inc. | | | | 5 | |
Vodafone Group Plc - ADR | | | | 5 | |
PBF Energy, Inc. | | | | 5 | |
Phillips 66 | | | | 5 | |
Visa, Inc., Class A | | | | 5 | |
HollyFrontier Corp. | | | | 5 | |
Yahoo!, Inc. | | | | 4 | |
| | | | | |
| Sector Allocation | | Percent of Long-Term Investments |
Information Technology | | | | 23 | % |
Energy | | | | 20 | |
Financials | | | | 18 | |
Consumer Discretionary | | | | 13 | |
Industrials | | | | 7 | |
Health Care | | | | 7 | |
Telecommunication Services | | | | 5 | |
Investment Companies | | | | 5 | |
Materials | | | | 2 | |
For Fund compliance purposes, the Fund’s sector classifications refer to any one or more of the sector sub-classifications used by one or more widely recognized market indexes or ratings group indexes, and/or as defined by Fund management. These definitions may not apply for purposes of this report, which may combine sector sub-classifications for reporting ease.
| | | | | | |
| | | | | | | |
| 4 | | BLACKROCK FUNDS | | MARCH 31, 2013 | | |
| | |
| | |
| | BlackRock Flexible Equity Fund |
|
| Total Return Based on a $10,000 Investment |
|
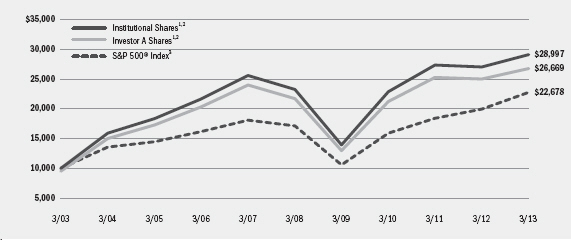 |
1 Assuming maximum sales charges, if any, transaction costs and other operating expenses, including investment advisory fees. Institutional Shares do not have a sales charge. 2 The Fund normally invests at least 80% of its net assets (plus any borrowings for investment purposes) in equity securities and equity-like securities and instruments with similar economic characteristics. The Fund primarily invests in securities issued by North American companies. 3 This unmanaged index covers 500 industrial, utility, transportation and financial companies of the US markets (mostly New York Stock Exchange (“NYSE”) issues) representing about 75% of NYSE market capitalization and 30% of NYSE issues. |
|
| Performance Summary for the Period Ended March 31, 2013 |
| | | | | | | | | | | | | | | | | | | | | | | | | | | | | | | | | | | |
| | | | | Average Annual Total Returns4 |
| | | | | 1 Year | | 5 Years | | 10 Years |
| | | 6-Month Total Returns | | w/o sales charge | | w/sales charge | | w/o sales charge | | w/sales charge | | w/o sales charge | | w/sales charge |
Institutional | | | | 6.26 | % | | | | 7.54 | % | | | | N/A | | | | | 4.60 | % | | | | N/A | | | | | 11.23 | % | | | | N/A | |
Service | | | | 6.04 | | | | | 7.17 | | | | | N/A | | | | | 4.29 | | | | | N/A | | | | | 10.91 | | | | | N/A | |
Investor A | | | | 6.02 | | | | | 7.08 | | | | | 1.42 | % | | | | 4.28 | | | | | 3.17 | % | | | | 10.90 | | | | | 10.31 | % |
Investor B | | | | 5.65 | | | | | 6.33 | | | | | 1.83 | | | | | 3.48 | | | | | 3.13 | | | | | 10.26 | | | | | 10.26 | |
Investor C | | | | 5.59 | | | | | 6.27 | | | | | 5.27 | | | | | 3.47 | | | | | 3.47 | | | | | 10.07 | | | | | 10.07 | |
Class R | | | | 5.81 | | | | | 6.76 | | | | | N/A | | | | | 4.14 | | | | | N/A | | | | | 10.92 | | | | | N/A | |
| | | | | | | | | | | | | | | | | | | | | | | | | | | | | | | | | | | |
S&P 500® Index | | | | 10.19 | | | | | 13.96 | | | | | N/A | | | | | 5.81 | | | | | N/A | | | | | 8.53 | | | | | N/A | |
| | 4 | Assuming maximum sales charges, if any. Average annual total returns with and without sales charges reflect reductions for distribution and service fees. See “About Fund Performance” on page 10 for a detailed description of share classes, including any related sales charges and fees. |
| | | N/A - Not applicable as share class and index do not have a sales charge. |
| | | Past performance is not indicative of future results. |
| | | | | | | | | | | | | | | | | | | | | | | | | | | | | | | | | | | |
| | | Actual | | Hypothetical6 | | |
| | | Beginning
Account Value
October 1, 2012 | | Ending
Account Value
March 31, 2013 | | Expenses Paid
During the Period5 | | Beginning
Account Value
October 1, 2012 | | Ending
Account Value
March 31, 2013 | | Expenses Paid
During the Period5 | | Annualized
Expense
Ratio |
Institutional | | | $ | 1,000.00 | | | | $ | 1,062.60 | | | | $ | 4.99 | | | | $ | 1,000.00 | | | | $ | 1,020.09 | | | | $ | 4.89 | | | | | 0.97 | % |
Service | | | $ | 1,000.00 | | | | $ | 1,060.40 | | | | $ | 6.63 | | | | $ | 1,000.00 | | | | $ | 1,018.50 | | | | $ | 6.49 | | | | | 1.29 | % |
Investor A | | | $ | 1,000.00 | | | | $ | 1,060.20 | | | | $ | 6.63 | | | | $ | 1,000.00 | | | | $ | 1,018.50 | | | | $ | 6.49 | | | | | 1.29 | % |
Investor B | | | $ | 1,000.00 | | | | $ | 1,056.50 | | | | $ | 10.56 | | | | $ | 1,000.00 | | | | $ | 1,014.66 | | | | $ | 10.35 | | | | | 2.06 | % |
Investor C | | | $ | 1,000.00 | | | | $ | 1,055.90 | | | | $ | 10.56 | | | | $ | 1,000.00 | | | | $ | 1,014.66 | | | | $ | 10.35 | | | | | 2.06 | % |
Class R | | | $ | 1,000.00 | | | | $ | 1,058.10 | | | | $ | 8.47 | | | | $ | 1,000.00 | | | | $ | 1,016.70 | | | | $ | 8.30 | | | | | 1.65 | % |
| | 5 | For each class of the Fund, expenses are equal to the annualized expense ratio for the class, multiplied by the average account value over the period, multiplied by 182/365 (to reflect the one-half year period shown). |
| | 6 | Hypothetical 5% annual return before expenses is calculated by pro rating the number of days in the most recent fiscal half year divided by 365. |
| | | See “Disclosure of Expenses” on page 10 for further information on how expenses were calculated. |
| | | | | | |
| | | | | | | |
| | BLACKROCK FUNDS | | MARCH 31, 2013 | | 5 |
| | |
| | |
Fund Summary as of March 31, 2013 | | BlackRock Mid-Cap Growth Equity Portfolio |
BlackRock Mid-Cap Growth Equity Portfolio’s (the “Fund”) investment objective is long-term capital appreciation.
|
| Portfolio Management Commentary |
How did the Fund perform?
| — | | For the six-month period ended March 31, 2013, the Fund underperformed its benchmark, the Russell Midcap® Growth Index. |
What factors influenced performance?
| — | | Relative to the benchmark index, negative performance in the consumer discretionary and health care sectors overshadowed positive results in information technology (“IT”) and energy. |
| — | | The Fund’s positioning in consumer discretionary was the largest detractor from performance, due primarily to an underweight in the internet & catalog retail industry, which surged during the period. Not owning benchmark index constituent Netflix, Inc. had the most significant negative impact as shares more than tripled in value during the period. A position in online travel retailer Expedia, Inc. also hurt relative returns; however, the Fund continues to hold the stock as Fund management believes Expedia, Inc.’s valuation significantly underestimates the company’s near-term growth potential. In the health care sector, underperformance came mostly from stock selection within the pharmaceuticals industry. A position in ViroPharma, Inc., which is not represented in the benchmark index, had a negative impact on returns as shares fell on concerns about the potential long-term competitive threats for the company’s leading drug offering. Other detractors in the industry included Jazz Pharmaceuticals Plc and Endo Health Solutions, Inc. Also hindering returns was selection within the health care technology segment, where a non-benchmark position in Allscripts Healthcare Solutions, Inc. hurt results due to poorly received changes in the company’s restructuring plans. |
| — | | Conversely, stock selection had a positive impact on performance in the IT sector, with notable strength in the software industry. The Fund’s position in non-benchmark constituent TiVo, Inc. proved most advantageous. The Fund has since eliminated TiVo, Inc. |
| | | as the stock reached Fund management’s price target. At the same time, the Fund’s lack of exposure to Red Hat, Inc. and underweight in TIBCO Software, Inc. proved beneficial as both benchmark constituents performed poorly. In the energy sector, strong performance came from the Fund’s position in Cabot Oil & Gas Corp., which surged during the period on rising natural gas prices and better-than-expected production growth. Plains Exploration & Production Co. was another notable contributor as shares posted a substantial gain after the company announced it would be acquired by mining giant Freeport-McMoRan Copper & Gold, Inc. at an attractive premium. |
Describe recent portfolio activity.
| — | | During the six-month period, the Fund significantly increased exposure to the consumer discretionary and industrials sectors. Notable additions in media (Sirius XM Radio, Inc., Starz — Liberty Capital and Madison Square Garden, Inc.), specialty retail (CarMax, Inc., Under Armour, Inc. and VF Corp.) and internet & catalog retail (Expedia, Inc.) helped move the Fund to an overweight in consumer discretionary by period end. Additions to industrials included Colfax Corp., Clean Harbors, Inc. and Roper Industries, Inc. The Fund substantially reduced its allocations to the health care sector, as well as IT and materials. |
Describe portfolio positioning at period end.
| — | | As of period end, the Fund’s largest overweight relative to the Russell Midcap Growth® Index was consumer discretionary, followed by IT and energy. The most notable underweight was in consumer staples. The consumer discretionary overweight reflects Fund management’s favorable view on media stocks, which are currently trading at lower valuations relative to traditional consumer staples companies, but offer attractive growth and pricing power, and are led by management teams committed to returning cash to shareholders. |
The views expressed reflect the opinions of BlackRock as of the date of this report and are subject to change based on changes in market, economic or other conditions. These views are not intended to be a forecast of future events and are no guarantee of future results.
| | | | | |
| Ten Largest Holdings | | Percent of
Long-Term
Investments |
Liberty Global, Inc., Class A | | | | 3 | % |
Sirius XM Radio, Inc. | | | | 3 | |
SBA Communications Corp., Class A | | | | 2 | |
Splunk, Inc. | | | | 2 | |
Oceaneering International, Inc. | | | | 2 | |
Linkedin Corp., Class A | | | | 2 | |
CarMax, Inc. | | | | 2 | |
Gartner, Inc. | | | | 2 | |
DSW, Inc., Class A | | | | 2 | |
Mead Johnson Nutrition Co. | | | | 2 | |
| | | | | |
| Sector Allocation | | Percent of
Long-Term
Investments |
Consumer Discretionary | | | | 28 | % |
Information Technology | | | | 18 | |
Industrials | | | | 15 | |
Health Care | | | | 11 | |
Financials | | | | 8 | |
Energy | | | | 7 | |
Materials | | | | 5 | |
Consumer Staples | | | | 5 | |
Telecommunication Services | | | | 3 | |
For Fund compliance purposes, the Fund’s sector classifications refer to any one or more of the sector sub-classifications used by one or more widely recognized market indexes or ratings group indexes, and/or as defined by Fund management. These definitions may not apply for purposes of this report, which may combine sector sub-classifications for reporting ease.
| | | | | | |
| | | | | | | |
| 6 | | BLACKROCK FUNDS | | MARCH 31, 2013 | | |
| | |
| | |
| | BlackRock Mid-Cap Growth Equity Portfolio |
|
| Total Return Based on a $10,000 Investment |
|
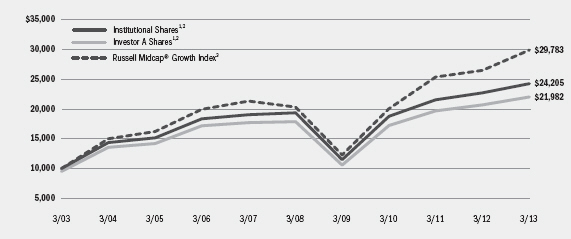 |
1 Assuming maximum sales charges, if any, transaction costs and other operating expenses, including investment advisory fees. Institutional Shares do not have a sales charge. 2 The Fund normally invests at least 80% of its net assets in equity securities issued by US mid-capitalization companies, which Fund management believes have above-average earnings growth potential. 3 An index that consists of the bottom 800 securities of the Russell 1000® Index with greater-than-average growth orientation as ranked by total market capitalization. Securities in this index generally have higher price-to-book and price-to-earnings ratios, lower dividend yields and higher forecasted growth values. |
|
| Performance Summary for the Period Ended March 31, 2013 |
| | | | | | | | | | | | | | | | | | | | | | | | | | | | | | | | | | | |
| | | | | Average Annual Total Returns4 |
| | | | | 1 Year | | 5 Years | | 10 Years |
| | | 6-Month Total Returns | | w/o sales charge | | w/sales charge | | w/o sales charge | | w/sales charge | | w/o sales charge | | w/sales charge |
Institutional | | | | 11.64 | % | | | | 6.91 | % | | | | N/A | | | | | 4.65 | % | | | | N/A | | | | | 9.24 | % | | | | N/A | |
Service | | | | 11.36 | | | | | 6.36 | | | | | N/A | | | | | 4.26 | | | | | N/A | | | | | 8.86 | | | | | N/A | |
Investor A | | | | 11.47 | | | | | 6.56 | | | | | 0.95 | % | | | | 4.26 | | | | | 3.15 | % | | | | 8.77 | | | | | 8.19 | % |
Investor B | | | | 11.07 | | | | | 5.85 | | | | | 1.35 | | | | | 3.47 | | | | | 3.11 | | | | | 8.12 | | | | | 8.12 | |
Investor C | | | | 11.07 | | | | | 5.76 | | | | | 4.76 | | | | | 3.47 | | | | | 3.47 | | | | | 7.96 | | | | | 7.96 | |
Class R | | | | 11.36 | | | | | 6.36 | | | | | N/A | | | | | 4.12 | | | | | N/A | | | | | 8.69 | | | | | N/A | |
| | | | | | | | | | | | | | | | | | | | | | | | | | | | | | | | | | | |
Russell Midcap® Growth Index | | | | 13.39 | | | | | 12.76 | | | | | N/A | | | | | 7.98 | | | | | N/A | | | | | 11.53 | | | | | N/A | |
| | 4 | Assuming maximum sales charges, if any. Average annual total returns with and without sales charges reflect reductions for distribution and service fees. See “About Fund Performance” on page 10 for a detailed description of share classes, including any related sales charges and fees. |
| | | N/A - Not applicable as share class and index do not have a sales charge. |
| | | Past performance is not indicative of future results. |
| | | | | | | | | | | | | | | | | | | | | | | | | | | | | | | | | | | |
| | | Actual | | Hypothetical6 | | |
| | | Beginning
Account Value
October 1, 2012 | | Ending
Account Value
March 31, 2013 | | Expenses Paid
During the Period5 | | Beginning
Account Value
October 1, 2012 | | Ending
Account Value
March 31, 2013 | | Expenses Paid
During the Period5 | | Annualized
Expense
Ratio |
Institutional | | | $ | 1,000.00 | | | | $ | 1,116.40 | | | | $ | 5.86 | | | | $ | 1,000.00 | | | | $ | 1,019.40 | | | | $ | 5.59 | | | | | 1.11 | % |
Service | | | $ | 1,000.00 | | | | $ | 1,113.60 | | | | $ | 8.33 | | | | $ | 1,000.00 | | | | $ | 1,017.05 | | | | $ | 7.95 | | | | | 1.58 | % |
Investor A | | | $ | 1,000.00 | | | | $ | 1,114.70 | | | | $ | 7.33 | | | | $ | 1,000.00 | | | | $ | 1,018.00 | | | | $ | 6.99 | | | | | 1.39 | % |
Investor B | | | $ | 1,000.00 | | | | $ | 1,110.70 | | | | $ | 11.37 | | | | $ | 1,000.00 | | | | $ | 1,014.16 | | | | $ | 10.85 | | | | | 2.16 | % |
Investor C | | | $ | 1,000.00 | | | | $ | 1,110.70 | | | | $ | 11.37 | | | | $ | 1,000.00 | | | | $ | 1,014.16 | | | | $ | 10.85 | | | | | 2.16 | % |
Class R | | | $ | 1,000.00 | | | | $ | 1,113.60 | | | | $ | 8.69 | | | | $ | 1,000.00 | | | | $ | 1,016.70 | | | | $ | 8.30 | | | | | 1.65 | % |
| | 5 | For each class of the Fund, expenses are equal to the annualized expense ratio for the class, multiplied by the average account value over the period, multiplied by 182/365 (to reflect the one-half year period shown). |
| | 6 | Hypothetical 5% annual return before expenses is calculated by pro rating the number of days in the most recent fiscal half year divided by 365. |
| | | See “Disclosure of Expenses” on page 10 for further information on how expenses were calculated. |
| | | | | | |
| | | | | | | |
| | BLACKROCK FUNDS | | MARCH 31, 2013 | | 7 |
| | |
| | |
Fund Summary as of March 31, 2013 | | BlackRock Small Cap Growth Equity Portfolio |
BlackRock Small Cap Growth Equity Portfolio’s (the “Fund”) investment objective is long-term capital appreciation.
On February 21, 2013, the Board of Trustees of BlackRock FundsSM approved a change to the Fund’s investment objective from “to seek long-term capital appreciation” to “to seek long-term capital growth.” In addition, the Fund will invest at least 80% of its assets in equity securities of small cap companies and at least 80% of its net assets in securities or instruments of issuers located in the United States. These changes will be effective on May 1, 2013.
|
| Portfolio Management Commentary |
How did the Fund perform?
| — | | For the six-month period ended March 31, 2013, the Fund underperformed its benchmark, the Russell 2000 Growth® Index. |
What factors influenced performance?
| — | | Relative to the benchmark index, stock selection within health care was the most significant detractor from the Fund’s performance, while an overweight to the sector also had a negative impact. A position in Allscripts Healthcare Solutions, Inc. hurt returns as its share price sunk after the company announced it was no longer pursuing strategic alternatives for its business. In the pharmaceuticals industry, the Fund held ViroPharma, Inc., which moved lower on concerns about potential long-term competitive threats for the company’s leading drug offering. A holding in Gentium SpA also declined after the company announced it was unlikely to receive approval for its flagship drug offering in Europe. Also detracting from relative performance for the period was stock selection in the consumer staples sector, where Annie’s, Inc. shares dipped after the company released a disappointing report on top-line growth. |
| — | | Contributing positively to performance during the period was stock selection within the information technology (“IT”) and energy sectors. Within |
| | | IT, the Fund’s positions in NIC, Inc. and CoStar Group, Inc. were stand-out performers as both stocks jumped higher on strong financial results. A holding in TiVo, Inc. also posted a double-digit return as the company continued to grow its international subscriber base while leveraging its intellectual property. In the energy sector, shares of natural gas terminal provider Cheniere Energy, Inc. moved up significantly given an increasingly positive outlook for the company’s potential in liquefied natural gas exports. |
Describe recent portfolio activity.
| — | | The Fund reduced its overall weighting in the consumer discretionary and health care sectors, while increasing exposure to IT where Fund management found attractive risk/reward opportunities. |
Describe portfolio positioning at period end.
| — | | At period end, the Fund’s largest sector overweight relative to the Russell 2000 Growth® Index was IT, while its most significant underweight was financials. In general, sector allocations are a function of the Fund’s bottom-up stock selection process, and therefore a result of where Fund management identifies opportunities in individual companies within the small cap growth universe. |
The views expressed reflect the opinions of BlackRock as of the date of this report and are subject to change based on changes in market, economic or other conditions. These views are not intended to be a forecast of future events and are no guarantee of future results.
| | | | | |
| Ten Largest Holdings | | Percent of Long-Term Investments |
ExlService Holdings, Inc. | | | | 4 | % |
Elan Corp. Plc - ADR | | | | 4 | |
TiVo, Inc. | | | | 3 | |
Cubist Pharmaceuticals, Inc. | | | | 3 | |
Gentium SpA - ADR | | | | 2 | |
QLIK Technologies, Inc. | | | | 2 | |
CoStar Group, Inc. | | | | 2 | |
NIC, Inc. | | | | 2 | |
PROS Holdings, Inc. | | | | 2 | |
Cheniere Energy, Inc. | | | | 2 | |
| | | | | |
| | | Percent of |
| Sector Allocation | | Long-Term Investments |
Information Technology | | | | 30 | % |
Health Care | | | | 24 | |
Industrials | | | | 16 | |
Consumer Discretionary | | | | 11 | |
Energy | | | | 8 | |
Materials | | | | 4 | |
Consumer Staples | | | | 2 | |
Telecommunication Services | | | | 2 | |
Financials | | | | 2 | |
Industrial | | | | 1 | |
For Fund compliance purposes, the Fund’s sector classifications refer to any one or more of the sector sub-classifications used by one or more widely recognized market indexes or ratings group indexes, and/or as defined by Fund management. These definitions may not apply for purposes of this report, which may combine sector sub-classifications for reporting ease.
| | | | | | |
| | | | | | | |
| 8 | | BLACKROCK FUNDS | | MARCH 31, 2013 | | |
| | |
| | |
| | BlackRock Small Cap Growth Equity Portfolio |
|
| Total Return Based on a $10,000 Investment |
|
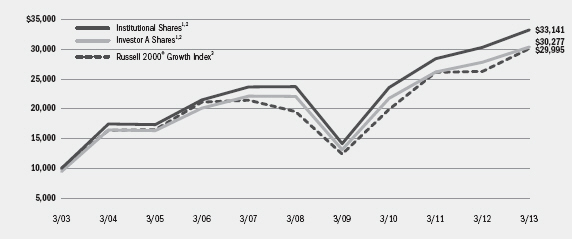 |
1 Assuming maximum sales charges, if any, transaction costs and other operating expenses, including investment advisory fees. Institutional Shares do not have a sales charge. 2 The Fund normally invests at least 80% of its net assets in equity securities issued by US small capitalization companies (market capitalizations between approximately $53 million and $3.771 billion as of June 30, 2012), which Fund management believes offer superior prospects for growth. 3 An index that contains those securities with greater-than-average growth orientations, generally having higher price-to-value ratios and higher forecasted growth values. |
|
| Performance Summary for the Period Ended March 31, 2013 |
| | | | | | | | | | | | | | | | | | | | | | | | | | | | | | | | | | | |
| | | | | Average Annual Total Returns4 |
| | | | | 1 Year | | 5 Years | | 10 Years |
| | | 6-Month Total Returns | | w/o sales charge | | w/sales
charge | | w/o sales charge | | w/sales charge | | w/o sales charge | | w/sales charge |
Institutional | | | | 11.46 | % | | | | 9.61 | % | | | | N/A | | | | | 7.00 | % | | | | N/A | | | | | 12.73 | % | | | | N/A | |
Service | | | | 11.25 | | | | | 9.24 | | | | | N/A | | | | | 6.70 | | | | | N/A | | | | | 12.43 | | | | | N/A | |
Investor A | | | | 11.23 | | | | | 9.20 | | | | | 3.48 | % | | | | 6.57 | | | | | 5.43 | % | | | | 12.32 | | | | | 11.71 | % |
Investor B | | | | 10.77 | | | | | 8.19 | | | | | 3.91 | | | | | 5.65 | | | | | 5.33 | | | | | 11.56 | | | | | 11.56 | |
Investor C | | | | 10.76 | | | | | 8.27 | | | | | 7.33 | | | | | 5.64 | | | | | 5.64 | | | | | 11.37 | | | | | 11.37 | |
| | | | | | | | | | | | | | | | | | | | | | | | | | | | | | | | | | | |
Russell 2000® Growth Index | | | | 13.72 | | | | | 14.52 | | | | | N/A | | | | | 9.04 | | | | | N/A | | | | | 11.61 | | | | | N/A | |
| | 4 | Assuming maximum sales charges, if any. Average annual total returns with and without sales charges reflect reductions for distribution and service fees. See “About Fund Performance” on page 10 for a detailed description of share classes, including any related sales charges and fees. |
| | | N/A - Not applicable as share class and index do not have a sales charge. |
| | | Past performance is not indicative of future results. |
| | | | | | | | | | | | | | | | | | | | | | | | | | | | | | | | | | | |
| | | Actual | | Hypothetical6 | | |
| | | Beginning
Account Value
October 1, 2012 | | Ending
Account Value
March 31, 2013 | | Expenses Paid
During the Period5 | | Beginning
Account Value
October 1, 2012 | | Ending
Account Value
March 31, 2013 | | Expenses Paid
During the Period5 | | Annualized
Expense
Ratio |
Institutional | | | $ | 1,000.00 | | | | $ | 1,114.60 | | | | $ | 4.27 | | | | $ | 1,000.00 | | | | $ | 1,020.89 | | | | $ | 4.08 | | | | | 0.81 | % |
Service | | | $ | 1,000.00 | | | | $ | 1,112.50 | | | | $ | 5.90 | | | | $ | 1,000.00 | | | | $ | 1,019.35 | | | | $ | 5.64 | | | | | 1.12 | % |
Investor A | | | $ | 1,000.00 | | | | $ | 1,112.30 | | | | $ | 6.06 | | | | $ | 1,000.00 | | | | $ | 1,019.20 | | | | $ | 5.79 | | | | | 1.15 | % |
Investor B | | | $ | 1,000.00 | | | | $ | 1,107.70 | | | | $ | 10.72 | | | | $ | 1,000.00 | | | | $ | 1,014.76 | | | | $ | 10.25 | | | | | 2.04 | % |
Investor C | | | $ | 1,000.00 | | | | $ | 1,107.60 | | | | $ | 10.40 | | | | $ | 1,000.00 | | | | $ | 1,015.06 | | | | $ | 9.95 | | | | | 1.98 | % |
| | 5 | For each class of the Fund, expenses are equal to the annualized expense ratio for the class, multiplied by the average account value over the period, multiplied by 182/365 (to reflect the one-half year period shown). |
| | 6 | Hypothetical 5% annual return before expenses is calculated by pro rating the number of days in the most recent fiscal half year divided by 365. |
| | | See “Disclosure of Expenses” on page 10 for further information on how expenses were calculated. |
| | | | | | |
| | | | | | | |
| | BLACKROCK FUNDS | | MARCH 31, 2013 | | 9 |
About Fund Performance
| • | | Institutional Shares are not subject to any sales charge. These shares bear no ongoing distribution or service fees and are available only to eligible investors. |
| • | | Service Shares are not subject to any sales charge (front-end load) or deferred sales charge. These shares are subject to a service fee of 0.25% per year (but no distribution fee). |
| • | | Investor A Shares are subject to a maximum initial sales charge (front-end load) of 5.25% and a service fee of 0.25% per year (but no distribution fee). |
| • | | Investor B Shares are subject to a maximum contingent deferred sales charge (“CDSC”) of 4.50% declining to 0% after six years. In addition, these shares are subject to a distribution fee of 0.75% per year and a service fee of 0.25% per year. These shares automatically convert to Investor A Shares after approximately eight years. (There is no initial sales charge for automatic share conversions.) All returns for periods greater than eight years reflect this conversion. These shares are only available through exchanges and dividend reinvestments by existing shareholders and for purchase by certain employer-sponsored retirement plans. |
| • | | Investor C Shares are subject to a 1.00% CDSC if redeemed within one year of purchase. In addition, these shares are subject to a distribution fee of 0.75% per year and a service fee of 0.25% per year. |
| • | | Class R Shares are not subject to any sales charge. These shares are subject to a distribution fee of 0.25% per year and a service fee of 0.25% per year. These shares are available only to certain employer-sponsored retirement plans. Prior to October 2, 2006, Class R performance results of BlackRock Mid-Cap Growth Equity Portfolio are those of Institutional Shares (which have no distribution or service fees) restated to reflect Class R Share fees. Prior to July 30, 2010, Class R performance |
results of BlackRock Flexible Equity Fund are those of Institutional Shares (which have no distribution or service fees) restated to reflect Class R Share fees.
Performance information reflects past performance and does not guarantee future results. Current performance may be lower or higher than the performance data quoted. Refer to www.blackrock.com/funds to obtain performance data current to the most recent month-end. Performance results do not reflect the deduction of taxes that a shareholder would pay on fund distributions or the redemption of fund shares. Figures shown in each of the performance tables on the previous pages assume reinvestment of all dividends and distributions, if any, at net asset value (“NAV”) on the ex-dividend date. Investment return and principal value of shares will fluctuate so that shares, when redeemed, may be worth more or less than their original cost. Dividends paid to each class of shares will vary because of the different levels of service, distribution and transfer agency fees applicable to each class, which are deducted from the income available to be paid to shareholders.
Performance for BlackRock Flexible Equity Fund for the periods prior to January 31, 2005 is based on performance of a certain former State Street Research mutual fund that reorganized with BlackRock Flexible Equity Fund on that date.
BlackRock Advisors, LLC (the “Manager”), the Funds’ investment advisor, waived and/or reimbursed a portion of each Fund’s expenses. Without such waiver and/or reimbursement, each Fund’s performance would have been lower. The Manager is under no obligation to waive or reimburse or to continue waiving or reimbursing its fees after the applicable termination date. See Note 3 of the Notes to Financial Statements for additional information on waivers and reimbursements.
Disclosure of Expenses
Shareholders of these Funds may incur the following charges: (a) transactional expenses, such as sales charges; and (b) operating expenses, including investment advisory fees, service and distribution fees, including 12b-1 fees, acquired fund fees and expenses and other Fund expenses. The expense examples on the previous pages (which are based on a hypothetical investment of $1,000 invested on October 1, 2012 and held through March 31, 2013) are intended to assist shareholders both in calculating expenses based on an investment in each Fund and in comparing these expenses with similar costs of investing in other mutual funds.
The expense examples provide information about actual account values and actual expenses. In order to estimate the expenses a shareholder paid during the period covered by this report, shareholders can divide their account value by $1,000 and then multiply the result by the number corresponding to their Fund and share class under the headings entitled “Expenses Paid During the Period.”
The expense examples also provide information about hypothetical account values and hypothetical expenses based on a Fund’s actual expense ratio and an assumed rate of return of 5% per year before expenses. In order to assist shareholders in comparing the ongoing expenses of investing in these Funds and other funds, compare the 5% hypothetical examples with the 5% hypothetical examples that appear in other funds’ shareholder reports.
The expenses shown in the expense examples are intended to highlight shareholders’ ongoing costs only and do not reflect any transactional expenses, such as sales charges, if any. Therefore, the hypothetical examples are useful in comparing ongoing expenses only, and will not help shareholders determine the relative total expenses of owning different funds. If these transactional expenses were included, shareholder expenses would have been higher.
| | | | | | |
| | | | |
| | | | | | | |
| 10 | | BLACKROCK FUNDS | | MARCH 31, 2013 | | |
Derivative Financial Instruments
The Funds may invest in various derivative financial instruments, including financial futures contracts, foreign currency exchange contracts and options, as specified in Note 2 of the Notes to Financial Statements, which may constitute forms of economic leverage. Such derivative financial instruments are used to obtain exposure to a security, index and/or market without owning or taking physical custody of securities or to hedge market, equity and/or foreign currency exchange rate risks. Derivative financial instruments involve risks, including the imperfect correlation between the value of a derivative financial instrument and the underlying asset, possible default of the counterparty to the transaction or illiquidity of the derivative financial instrument. The Funds’ ability to
use a derivative financial instrument successfully depends on the investment advisor’s ability to predict pertinent market movements accurately, which cannot be assured. The use of derivative financial instruments may result in losses greater than if they had not been used, may require a Fund to sell or purchase portfolio investments at inopportune times or for distressed values, may limit the amount of appreciation a Fund can realize on an investment, may result in lower dividends paid to shareholders or may cause a Fund to hold an investment that it might otherwise sell. The Funds’ investments in these instruments are discussed in detail in the Notes to Financial Statements.
| | | | | | |
| | | | |
| | | | | | | |
| | BLACKROCK FUNDS | | MARCH 31, 2013 | | 11 |
| | |
| | |
Consolidated Schedule of Investments March 31, 2013 (Unaudited) | | BlackRock Flexible Equity Fund (Percentages shown are based on Net Assets) |
| | | | | | | | |
| Common Stocks | | Shares | | | Value | |
| |
Airlines — 7.3% | | | | | | | | |
Japan Airlines Co. Ltd. | | | 1,159,300 | | | $ | 53,792,111 | |
| |
Automobiles — 3.5% | | | | | | | | |
Bayerische Motoren Werke AG | | | 234,900 | | | | 20,327,008 | |
General Motors Co. (a) | | | 106,900 | | | | 2,973,958 | |
Renault SA | | | 33,900 | | | | 2,126,723 | |
| | | | | | | | |
| | | | | | | 25,427,689 | |
| |
Capital Markets — 0.9% | | | | | | | | |
Freedom Pay, Inc. (a) | | | 43,051 | | | | — | |
The Goldman Sachs Group, Inc. | | | 28,400 | | | | 4,179,060 | |
Morgan Stanley | | | 107,100 | | | | 2,354,058 | |
| | | | | | | | |
| | | | | | | 6,533,118 | |
| |
Chemicals — 1.8% | | | | | | | | |
CF Industries Holdings, Inc. | | | 68,800 | | | | 13,097,456 | |
| |
Communications Equipment — 2.6% | | | | | |
QUALCOMM, Inc. | | | 286,900 | | | | 19,207,955 | |
| |
Computers & Peripherals — 0.8% | | | | | | | | |
Fusion-io, Inc. (a) | | | 377,300 | | | | 6,176,401 | |
| |
Diversified Financial Services — 2.1% | | | | | |
Citigroup, Inc. | | | 51,500 | | | | 2,278,360 | |
JPMorgan Chase & Co. | | | 277,200 | | | | 13,155,912 | |
| | | | | | | | |
| | | | | | | 15,434,272 | |
| |
Health Care Equipment & Supplies — 1.1% | | | | | |
Baxter International, Inc. | | | 113,600 | | | | 8,251,904 | |
| |
Health Care Providers & Services — 1.5% | | | | | |
UnitedHealth Group, Inc. | | | 196,600 | | | | 11,247,486 | |
| |
Insurance — 10.8% | | | | | | | | |
American International Group, Inc. (a) | | | 996,900 | | | | 38,699,658 | |
Berkshire Hathaway, Inc., Class B (a) | | | 389,500 | | | | 40,585,900 | |
| | | | | | | | |
| | | | | | | 79,285,558 | |
| |
Internet Software & Services — 10.5% | | | | | |
Google, Inc., Class A (a) | | | 58,900 | | | | 46,768,367 | |
Yahoo!, Inc. (a) | | | 1,309,200 | | | | 30,805,476 | |
| | | | | | | | |
| | | | | | | 77,573,843 | |
| |
IT Services — 7.9% | | | | | | | | |
SAIC, Inc. | | | 1,664,800 | | | | 22,558,040 | |
Visa, Inc., Class A | | | 210,700 | | | | 35,785,288 | |
| | | | | | | | |
| | | | | | | 58,343,328 | |
| |
Media — 8.8% | | | | | | | | |
Comcast Corp., Class A (b) | | | 690,600 | | | | 29,012,106 | |
DIRECTV (a) | | | 285,600 | | | | 16,167,816 | |
Liberty Global, Inc., Class A (a) | | | 261,800 | | | | 19,216,120 | |
| | | | | | | | |
| | | | | | | 64,396,042 | |
| |
Oil, Gas & Consumable Fuels — 19.2% | | | | | |
EQT Corp. | | | 141,770 | | | | 9,604,918 | |
HollyFrontier Corp. (b) | | | 632,400 | | | | 32,536,980 | |
PBF Energy, Inc. | | | 1,000,000 | | | | 37,170,000 | |
Phillips 66 (b) | | | 512,500 | | | | 35,859,625 | |
| | | | | | | | |
| Common Stocks | | Shares | | | Value | |
| |
Oil, Gas & Consumable Fuels (concluded) | | | | | |
Suncor Energy, Inc. | | | 862,991 | | | $ | 25,898,360 | |
| | | | | | | | |
| | | | | | | 141,069,883 | |
| |
Pharmaceuticals — 3.8% | | | | | | | | |
Merck & Co., Inc. | | | 384,000 | | | | 16,984,320 | |
Pfizer, Inc. | | | 380,500 | | | | 10,981,230 | |
| | | | | | | | |
| | | | | | | 27,965,550 | |
| |
Real Estate Investment Trusts (REITs) — 3.9% | | | | | |
Annaly Capital Management, Inc. | | | 1,807,700 | | | | 28,724,353 | |
| |
Wireless Telecommunication Services — 5.1% | | | | | |
Vodafone Group Plc - ADR | | | 1,313,700 | | | | 37,322,217 | |
| |
| Total Common Stocks — 91.6% | | | | | 673,849,166 | |
| |
| | | | | | | | |
| | | | | | | | |
| | |
| Investment Companies | | | | | | |
| |
iShares Gold Trust (a)(c) | | | 1,325,500 | | | | 20,571,760 | |
Sprott Physical Gold Trust (a) | | | 1,089,500 | | | | 14,740,935 | |
| |
| Total Investment Companies — 4.8% | | | | | 35,312,695 | |
| |
| | | | | | | | |
| | | | | | | | |
| | |
| Participation Notes (a) | | | | | | |
| |
Airlines — 1.2% | | | | | | | | |
Morgan Stanley Capital Services, Inc. (Japan Airlines Co. Ltd.), due 9/30/13 | | | 198,100 | | | | 9,223,493 | |
| |
Total Long-Term Investments (Cost — $621,264,016) — 97.6% | | | | | 718,385,354 | |
| |
| | | | | | | | |
| | | | | | | | |
| | |
| Short-Term Securities | | | | | | |
| |
BlackRock Liquidity Funds, TempFund,
Institutional Class, 0.09% (c)(d) | | | 23,394,268 | | | | 23,394,268 | |
| |
Total Short-Term Securities (Cost — $23,394,268) — 3.2% | | | | | 23,394,268 | |
| |
| | | | | | | | |
| | | | | | | | |
To simplify the listings of portfolio holdings in the Schedules of Investments, the names and descriptions of many of the securities have been abbreviated according to the following list:
| | | | | | |
| ADR | | American Depositary Receipts | | JPY | | Japanese Yen |
| EUR | | Euro | | USD | | US Dollar |
| | | | | | |
See Notes to Financial Statements. | | | | |
| | | | | | | |
| 12 | | BLACKROCK FUNDS | | MARCH 31, 2013 | | |
| | |
| | |
Consolidated Schedule of Investments (continued) | | BlackRock Flexible Equity Fund (Percentages shown are based on Net Assets) |
| | | | |
| Options Purchased | | Value | |
| |
(Cost — $ 371,880) — 0.0% | | | $ 108,300 | |
| |
Total Investments Before Options Written | | | | |
(Cost — $ 645,030,164) — 100.8% | | | 741,887,922 | |
| |
| | | | |
| | | | |
| | | | |
| Options Written | | Value | |
| |
(Premiums Received — $ 119,348) — (0.0)% | | | $ (129,970 | ) |
| |
Total Investments Net of Options Written —100.8% | | | 741,757,952 | |
Liabilities in Excess of Other Assets — (0.8)% | | | (6,069,634 | ) |
| | | | |
Net Assets — 100.0% | | | $735,688,318 | |
| | | | |
|
| Notes to Consolidated Schedule of Investments |
| (a) | Non-income producing security. |
| (b) | All or a portion of security has been pledged/segregated as collateral in connection with outstanding options written. |
| (c) | Investments in issuers considered to be an affiliate of the Fund during the six months ended March 31, 2013, for purposes of Section 2(a)(3) of the Investment Company Act of 1940, as amended, were as follows: |
| | | | | | | | | | | | | | | | | | | | | | | | |
| Affiliate | | Shares
Held at
September 30,
2012 | | | Net
Activity | | | Shares
Held at
March 31,
2013 | | | Value at
March 31,
2013 | | | Income | | | Realized
Loss | |
| |
BlackRock Liquidity Funds, TempFund, Institutional Class | | | 24,089,179 | | | | (694,911 | ) | | | 23,394,268 | | | $ | 23,394,268 | | | $ | 9,340 | | | | — | |
iShares Gold Trust | | | 1,589,200 | | | | (263,700 | ) | | | 1,325,500 | | | $ | 20,571,760 | | | | — | | | $ | (36,155 | ) |
| |
| (d) | Represents the current yield as of report date. |
| • | For Fund compliance purposes, the Fund’s industry classifications refer to any one or more of the industry sub-classifications used by one or more widely recognized market indexes or ratings group indexes and/or as defined by Fund management. These definitions may not apply for purposes of this report, which may combine such industry sub-classifications for reporting ease. |
| • | Financial futures contracts as of March 31, 2013 were as follows: |
| | | | | | | | | | | | | | |
Contracts
Sold | | Issue | | Exchange | | Expiration | | Notional
Value | | Unrealized
Depreciation | |
| |
| (124) | | E-Mini Russell 2000® Futures | | Intercontinental Exchange | | June 2013 | | USD | | 11,766,360 | | | $(101,208) | |
| (290) | | E-Mini S&P 500® Futures | | Chicago Mercantile | | June 2013 | | USD | | 22,659,150 | | | (268,113) | |
| |
| Total | | | | | | | | | | | | | $(369,321) | |
| | | | | | | | | | | | | | |
| • | Foreign currency exchange contracts as of March 31, 2013 were as follows: |
| | | | | | | | | | | | | | | | | | | | |
Currency
Purchased | | | | | Currency
Sold | | | | | Counterparty | | Settlement
Date | | | Unrealized
Appreciation
(Depreciation) | |
| |
JPY | | | 313,075,000 | | | USD | | | 3,394,974 | | | Royal Bank of Scotland Plc | | | 4/17/13 | | | | $ (68,733 | ) |
USD | | | 782,118 | | | EUR | | | 604,000 | | | Bank of New York Mellon Corp. | | | 4/17/13 | | | | 7,779 | |
USD | | | 1,472,781 | | | EUR | | | 1,137,000 | | | Citigroup Inc. | | | 4/17/13 | | | | 15,126 | |
USD | | | 19,146,860 | | | EUR | | | 14,626,866 | | | Deutsche Bank AG | | | 4/17/13 | | | | 394,949 | |
USD | | | 30,078,312 | | | JPY | | | 2,811,116,000 | | | BNP Paribas SA | | | 4/17/13 | | | | 211,829 | |
USD | | | 4,330,879 | | | JPY | | | 400,000,000 | | | Deutsche Bank AG | | | 4/17/13 | | | | 81,110 | |
USD | | | 3,626,126 | | | JPY | | | 345,845,000 | | | JPMorgan Chase & Co. | | | 4/17/13 | | | | (48,278 | ) |
USD | | | 10,762,156 | | | JPY | | | 1,006,310,000 | | | Royal Bank of Scotland Plc | | | 4/17/13 | | | | 70,694 | |
USD | | | 8,317,719 | | | JPY | | | 775,233,000 | | | Royal Bank of Scotland Plc | | | 4/17/13 | | | | 81,316 | |
USD | | | 12,822,327 | | | JPY | | | 1,113,744,800 | | | Royal Bank of Scotland Plc | | | 4/17/13 | | | | 989,432 | |
| |
Total | | | | | | | | | | | | | | | | | | | $1,735,224 | |
| | | | | | | | | | | | | | | | | | | | |
| | | | | | |
See Notes to Financial Statements. | | | | |
| | | | | | | |
| | BLACKROCK FUNDS | | MARCH 31, 2013 | | 13 |
| | |
| | |
Consolidated Schedule of Investments (continued) | | BlackRock Flexible Equity Fund |
| — | | Exchange-traded options purchased as of March 31, 2013 were as follows: |
| | | | | | | | | | | | | | | | | | | | |
| Description | | Put/
Call | | | Strike
Price | | | Expiration
Date | | Contracts | | Market
Value | |
| |
| | | | | | |
Goodyear Tire & Rubber Co. | | | Put | | | | USD | | | | 13.00 | | | 4/20/13 | | 1,805 | | $ | 108,300 | |
| |
| — | | Exchange-traded options written as of March 31, 2013 were as follows: |
| | | | | | | | | | | | | | | | | | | | |
| Description | | Put/
Call | | | Strike Price | | | Expiration
Date | | Contracts | | Market
Value | |
| |
Comcast Corp., Class A | | | Call | | | | USD | | | | 39.00 | | | 4/20/13 | | 81 | | $ | (24,260 | ) |
Comcast Corp., Class A | | | Call | | | | USD | | | | 43.00 | | | 5/18/13 | | 1,705 | | | (105,710 | ) |
| |
Total | | | | | | | | | | | | | | | | | | $ | (129,970 | ) |
| | | | | | | | | | | | | | | | | | | | |
| — | | Fair Value Measurements — Various inputs are used in determining the fair value of investments and derivative financial instruments. These inputs to valuation techniques are categorized into a disclosure hierarchy consisting of three broad levels for financial statement purposes as follows: |
| | — | | Level 1 – unadjusted price quotations in active markets/exchanges for identical assets and liabilities that the Fund has the ability to access |
| | — | | Level 2 – other observable inputs (including, but not limited to, quoted prices for similar assets or liabilities in markets that are active, quoted prices for identical or similar assets or liabilities in markets that are not active, inputs other than quoted prices that are observable for the assets or liabilities (such as interest rates, yield curves, vola- tilities, prepayment speeds, loss severities, credit risks and default rates) or other market–corroborated inputs) |
| | — | | Level 3 – unobservable inputs based on the best information available in the circumstances, to the extent observable inputs are not available (including the Fund’s own assumptions used in determining the fair value of investments and derivative financial instruments) |
The hierarchy gives the highest priority to unadjusted quoted prices in active markets for identical assets or liabilities (Level 1 measurements) and the lowest priority to unobservable inputs (Level 3 measurements). Accordingly, the degree of judgment exercised in determining fair value is greatest for instruments categorized in Level 3. The inputs used to measure fair value may fall into different levels of the fair value hierarchy. In such cases, for disclosure purposes, the level in the fair value hierarchy within which the fair value measurement falls in its entirety is determined based on the lowest level input that is significant to the fair value measurement in its entirety.
Changes in valuation techniques may result in transfers into or out of an assigned level within the disclosure hierarchy. In accordance with the Fund’s policy, transfers between different levels of the fair value disclosure hierarchy are deemed to have occurred as of the beginning of the reporting period. The categorization of a value determined for investments and derivative financial instruments is based on the pricing transparency of the investment and derivative financial instrument and is not necessarily an indication of the risks associated with investing in those securities. For information about the Fund’s policy regarding valuation of investments and derivative financial instruments and other significant accounting policies, please refer to Note 1 of the Notes to Financial Statements.
The following tables summarize the Fund’s investments and derivative financial instruments categorized in the disclosure hierarchy as of March 31, 2013:
| | | | | | | | | | | | | | |
| | | Level 1 | | | Level 2 | | | Level 3 | | Total | |
Assets: | | | | | | | | | | | | | | |
Investments: | | | | | | | | | | | | | | |
Long-Term Investments: | | | | | | | | | | | | | | |
Common Stocks: | | | | | | | | | | | | | | |
Airlines | | | — | | | $ | 53,792,111 | | | — | | $ | 53,792,111 | |
Automobiles | | $ | 2,973,958 | | | | 22,453,731 | | | — | | | 25,427,689 | |
Capital Markets | | | 6,533,118 | | | | — | | | — | | | 6,533,118 | |
Chemicals | | | 13,097,456 | | | | — | | | — | | | 13,097,456 | |
Communications Equipment | | | 19,207,955 | | | | — | | | — | | | 19,207,955 | |
Computers & Peripherals | | | 6,176,401 | | | | — | | | — | | | 6,176,401 | |
Diversified Financial Services | | | 15,434,272 | | | | — | | | — | | | 15,434,272 | |
Health Care Equipment & Supplies | | | 8,251,904 | | | | — | | | — | | | 8,251,904 | |
Health Care Providers & Services | | | 11,247,486 | | | | — | | | — | | | 11,247,486 | |
Insurance | | | 79,285,558 | | | | — | | | — | | | 79,285,558 | |
Internet Software & Services | | | 77,573,843 | | | | — | | | — | | | 77,573,843 | |
IT Services | | | 58,343,328 | | | | — | | | — | | | 58,343,328 | |
Media | | | 64,396,042 | | | | — | | | — | | | 64,396,042 | |
Oil, Gas & Consumable Fuels | | | 141,069,883 | | | | — | | | — | | | 141,069,883 | |
Pharmaceuticals | | | 27,965,550 | | | | — | | | — | | | 27,965,550 | |
Real Estate Investment Trusts (REITs) | | | 28,724,353 | | | | — | | | — | | | 28,724,353 | |
Wireless Telecommunication Services | | | 37,322,217 | | | | — | | | — | | | 37,322,217 | |
| | | | | | |
See Notes to Financial Statements. | | | | |
| | | | | | | |
| 14 | | BLACKROCK FUNDS | | MARCH 31, 2013 | | |
| | |
| | |
Consolidated Schedule of Investments (concluded) | | BlackRock Flexible Equity Fund |
| | | | | | | | | | | | | | | | | | |
|
| | | | | Level 1 | | | Level 2 | | | Level 3 | | Total | | | |
|
Investment Companies | | | | $ | 35,312,695 | | | | — | | | — | | $ | 35,312,695 | | | |
Participation Notes: | | | | | | | | | | | | | | | | | | |
Airlines | | | | | — | | | | 9,223,493 | | | — | | | 9,223,493 | | | |
Short-Term Securities | | | | | 23,394,268 | | | | — | | | — | | | 23,394,268 | | | |
Options Purchased: | | | | | | | | | | | | | | | | | | |
Equity Contracts | | | | | 108,300 | | | | — | | | — | | | 108,300 | | | |
|
Total | | | | $ | 656,418,587 | | | $ | 85,469,335 | | | — | | $ | 741,887,922 | | | |
| | |
| | | | | | | | | | | | | | | | | | |
|
| | | | | Level 1 | | | Level 2 | | | Level 3 | | Total | | | |
|
Derivative Financial Instruments1 | | | | | | | | | | | | | | | | | | |
Assets: | | | | | | | | | | | | | | | | | | |
Foreign currency exchange contracts | | | | | — | | | $ | 1,852,235 | | | — | | $ | 1,852,235 | | | |
Liabilities: | | | | | | | | | | | | | | | | | | |
Equity contracts | | | | $ | (499,291 | ) | | | — | | | — | | | (499,291 | ) | | |
Foreign currency exchange contracts | | | | | — | | | | (117,011 | ) | | — | | | (117,011 | ) | | |
|
Total | | | | $ | (499,291 | ) | | $ | 1,735,224 | | | — | | $ | 1,235,933 | | | |
| | |
| 1 | Derivative financial instruments are financial futures contracts, foreign currency exchange contracts and options written. Financial futures contracts and foreign currency exchange contracts are valued at the unrealized appreciation/depreciation on the instrument and options written are shown at value. |
Certain of the Fund’s assets and liabilities are held at carrying amount, which approximates fair value for financial statement purposes. As of March 31, 2013, such assets and liabilities are categorized within the disclosure hierarchy as follows:
| | | | | | | | | | | | | | | | | | |
|
| | | | | Level 1 | | | Level 2 | | | Level 3 | | Total | | | |
|
Assets: | | | | | | | | | | | | | | | | | | |
Cash pledged as collateral for financial futures contracts | | | | $ | 1,813,000 | | | | — | | | — | | $ | 1,813,000 | | | |
Foreign currency at value | | | | | 3,915 | | | | — | | | — | | | 3,915 | | | |
Liabilities: | | | | | | | | | | | | | | | | | | |
Bank overdraft | | | | | — | | | | $ (635,227 | ) | | — | | | (635,227 | ) | | |
|
Total | | | | $ | 1,816,915 | | | | $ (635,227 | ) | | — | | $ | 1,181,688 | | | |
| | |
There were no transfers between levels during the six months ended March 31, 2013.
| | | | | | |
See Notes to Financial Statements. | | | | |
| | | | | | | |
| | BLACKROCK FUNDS | | MARCH 31, 2013 | | 15 |
| | |
| | |
Schedule of Investments March 31, 2013 (Unaudited) | | BlackRock Mid-Cap Growth Equity Portfolio (Percentages shown are based on Net Assets) |
| | | | | | | | |
| Common Stocks | | Shares | | | Value | |
| |
Aerospace & Defense — 1.7% | | | | | | | | |
TransDigm Group, Inc. | | | 32,300 | | | $ | 4,939,316 | |
| |
Biotechnology — 2.4% | | | | | | | | |
Medivation, Inc. (a) | | | 55,600 | | | | 2,600,412 | |
United Therapeutics Corp. (a) | | | 72,028 | | | | 4,384,344 | |
| | | | | | | | |
| | | | | | | 6,984,756 | |
| |
Capital Markets — 2.0% | | | | | | | | |
Affiliated Managers Group, Inc. (a)(b) | | | 19,600 | | | | 3,009,972 | |
T. Rowe Price Group, Inc. | | | 39,857 | | | | 2,984,094 | |
| | | | | | | | |
| | | | | | | 5,994,066 | |
| |
Chemicals — 3.6% | | | | | | | | |
CF Industries Holdings, Inc. | | | 9,300 | | | | 1,770,441 | |
Ecolab, Inc. | | | 33,600 | | | | 2,694,048 | |
PPG Industries, Inc. | | | 25,300 | | | | 3,388,682 | |
Westlake Chemical Corp. | | | 31,800 | | | | 2,973,300 | |
| | | | | | | | |
| | | | | | | 10,826,471 | |
| |
Commercial Banks — 1.6% | | | | | | | | |
First Republic Bank | | | 76,543 | | | | 2,956,091 | |
SVB Financial Group (a)(b) | | | 26,100 | | | | 1,851,534 | |
| | | | | | | | |
| | | | | | | 4,807,625 | |
| |
Commercial Services & Supplies — 1.3% | |
Clean Harbors, Inc. (a)(b) | | | 68,000 | | | | 3,950,120 | |
| |
Construction & Engineering — 1.4% | | | | | | | | |
Quanta Services, Inc. (a) | | | 147,500 | | | | 4,215,550 | |
| |
Construction Materials — 1.4% | | | | | | | | |
Eagle Materials, Inc. | | | 63,545 | | | | 4,234,003 | |
| |
Diversified Financial Services — 2.7% | | | | | |
IntercontinentalExchange, Inc. (a) | | | 26,100 | | | | 4,256,127 | |
Moody’s Corp. | | | 69,387 | | | | 3,699,715 | |
| | | | | | | | |
| | | | | | | 7,955,842 | |
| |
Electrical Equipment — 4.9% | | | | | | | | |
Acuity Brands, Inc. | | | 31,000 | | | | 2,149,850 | |
AMETEK, Inc. | | | 122,575 | | | | 5,314,852 | |
Roper Industries, Inc. | | | 29,300 | | | | 3,730,183 | |
Sensata Technologies Holding NV (a) | | | 101,909 | | | | 3,349,749 | |
| | | | | | | | |
| | | | | | | 14,544,634 | |
| |
Energy Equipment & Services — 3.8% | |
FMC Technologies, Inc. (a) | | | 86,520 | | | | 4,705,823 | |
Oceaneering International, Inc. | | | 100,906 | | | | 6,701,167 | |
| | | | | | | | |
| | | | | | | 11,406,990 | |
| |
Food & Staples Retailing — 1.5% | |
Whole Foods Market, Inc. | | | 50,517 | | | | 4,382,350 | |
| |
Food Products — 1.8% | | | | | | | | |
Mead Johnson Nutrition Co. | | | 70,886 | | | | 5,490,121 | |
| |
Health Care Equipment & Supplies — 2.4% | |
ArthroCare Corp. (a) | | | 81,573 | | | | 2,835,477 | |
Intuitive Surgical, Inc. (a) | | | 8,955 | | | | 4,398,606 | |
| | | | | | | | |
| | | | | | | 7,234,083 | |
| |
Health Care Providers & Services — 1.6% | |
Catamaran Corp. (a) | | | 87,000 | | | | 4,613,610 | |
| |
Health Care Technology — 0.8% | | | | | | | | |
Athenahealth, Inc. (a)(b) | | | 22,978 | | | | 2,229,785 | |
| |
| | | | | | | | |
| Common Stocks | | Shares | | | Value | |
| |
Hotels, Restaurants & Leisure — 2.8% | |
Bally Technologies, Inc. (a)(b) | | | 88,828 | | | $ | 4,616,391 | |
Bloomin’ Brands, Inc. (a) | | | 213,581 | | | | 3,816,692 | |
| | | | | | | | |
| | | | | | | 8,433,083 | |
| |
Household Products — 1.2% | | | | | | | | |
Church & Dwight Co., Inc. | | | 56,600 | | | | 3,658,058 | |
| |
Internet & Catalog Retail — 1.8% | | | | | | | | |
Expedia, Inc. | | | 89,789 | | | | 5,388,238 | |
| |
Internet Software & Services — 7.3% | |
CoStar Group, Inc. (a)(b) | | | 28,572 | | | | 3,127,491 | |
Linkedin Corp., Class A (a) | | | 37,056 | | | | 6,524,079 | |
MercadoLibre, Inc. (b) | | | 50,647 | | | | 4,890,474 | |
Yandex NV (a) | | | 208,800 | | | | 4,827,456 | |
Yelp, Inc. (a)(b) | | | 95,400 | | | | 2,261,934 | |
| | | | | | | | |
| | | | | | | 21,631,434 | |
| |
IT Services — 5.6% | | | | | | | | |
Alliance Data Systems Corp. (a) | | | 23,346 | | | | 3,779,484 | |
Gartner, Inc. (a)(b) | | | 110,742 | | | | 6,025,472 | |
MAXIMUS, Inc. | | | 54,973 | | | | 4,396,191 | |
Teradata Corp. (a) | | | 41,288 | | | | 2,415,761 | |
| | | | | | | | |
| | | | | | | 16,616,908 | |
| |
Machinery — 3.2% | | | | | | | | |
CNH Global NV | | | 43,700 | | | | 1,805,684 | |
Colfax Corp. (a) | | | 92,044 | | | | 4,283,728 | |
Pentair Ltd. | | | 67,500 | | | | 3,560,625 | |
| | | | | | | | |
| | | | | | | 9,650,037 | |
| |
Media — 12.1% | | | | | | | | |
AMC Networks, Inc., Class A (a) | | | 49,600 | | | | 3,133,728 | |
DISH Network Corp., Class A | | | 78,273 | | | | 2,966,547 | |
Liberty Global, Inc., Class A (a) | | | 127,100 | | | | 9,329,140 | |
Madison Square Garden, Inc., Class A (a) | | | 73,800 | | | | 4,250,880 | |
Sirius XM Radio, Inc. | | | 2,757,895 | | | | 8,494,317 | |
Starz - Liberty Capital (a) | | | 221,665 | | | | 4,909,880 | |
Viacom, Inc., Class B | | | 47,400 | | | | 2,918,418 | |
| | | | | | | | |
| | | | | | | 36,002,910 | |
| |
Oil, Gas & Consumable Fuels — 3.6% | |
Cabot Oil & Gas Corp. | | | 69,000 | | | | 4,665,090 | |
Plains Exploration & Production Co. (a) | | | 59,700 | | | | 2,833,959 | |
Range Resources Corp. | | | 39,700 | | | | 3,217,288 | |
| | | | | | | | |
| | | | | | | 10,716,337 | |
| |
Pharmaceuticals — 4.3% | | | | | | | | |
Auxilium Pharmaceuticals, Inc. (a) | | | 209,934 | | | | 3,627,659 | |
Jazz Pharmaceuticals Plc (a) | | | 74,582 | | | | 4,169,880 | |
Questcor Pharmaceuticals, Inc. | | | 65,300 | | | | 2,124,862 | |
Zoetis, Inc. (a) | | | 84,600 | | | | 2,825,640 | |
| | | | | | | | |
| | | | | | | 12,748,041 | |
| |
Professional Services — 1.6% | | | | | | | | |
IHS, Inc., Class A (a) | | | 15,500 | | | | 1,623,160 | |
Verisk Analytics, Inc., Class A (a) | | | 49,877 | | | | 3,073,919 | |
| | | | | | | | |
| | | | | | | 4,697,079 | |
| |
Real Estate Investment Trusts (REITs) — 0.8% | |
Strategic Hotels & Resorts, Inc. (a)(b) | | | 299,300 | | | | 2,499,155 | |
| |
| | | | | | |
See Notes to Financial Statements. | | | | |
| | | | | | | |
| 16 | | BLACKROCK FUNDS | | MARCH 31, 2013 | | |
| | |
| | |
Schedule of Investments (continued) | | BlackRock Mid-Cap Growth Equity Portfolio (Percentages shown are based on Net Assets) |
| | | | | | | | |
| Common Stocks | | Shares | | | Value | |
| |
Real Estate Management & Development — 0.9% | |
Realogy Holdings Corp. (a) | | | 52,800 | | | $ | 2,578,752 | |
| |
Software — 5.4% | | | | | | | | |
Citrix Systems, Inc. (a) | | | 40,200 | | | | 2,900,832 | |
QLIK Technologies, Inc. (a)(b) | | | 129,000 | | | | 3,332,070 | |
Splunk, Inc. (a) | | | 170,386 | | | | 6,820,552 | |
TIBCO Software, Inc. (a) | | | 149,937 | | | | 3,031,726 | |
| | | | | | | | |
| | | | | | | 16,085,180 | |
| |
Specialty Retail — 5.5% | | | | | | | | |
CarMax, Inc. (a) | | | 147,189 | | | | 6,137,781 | |
DSW, Inc., Class A | | | 87,300 | | | | 5,569,740 | |
Ross Stores, Inc. | | | 74,819 | | | | 4,535,528 | |
| | | | | | | | |
| | | | | | | 16,243,049 | |
| |
Textiles, Apparel & Luxury Goods — 5.4% | |
Michael Kors Holdings Ltd. (a) | | | 67,900 | | | | 3,856,041 | |
PVH Corp. | | | 30,400 | | | | 3,247,024 | |
Under Armour, Inc., Class A (a) | | | 105,200 | | | | 5,386,240 | |
VF Corp. | | | 21,800 | | | | 3,656,950 | |
| | | | | | | | |
| | | | | | | 16,146,255 | |
| |
Trading Companies & Distributors — 1.2% | |
United Rentals, Inc. (a) | | | 66,976 | | | | 3,681,671 | |
| |
Wireless Telecommunication Services — 2.5% | |
SBA Communications Corp., Class A (a) | | | 101,037 | | | | 7,276,685 | |
| |
Total Common Stocks — 100.1% | | | | | | | 297,862,194 | |
| |
| | | | | | | | |
| | | | | | | | |
| | | | | | | | |
| Common Stocks | | Shares | | | Value | |
| |
Pharmaceuticals — 0.0% | |
Alexza Pharmaceuticals, Inc.
(Issued/Exercisable 5/06/11, 1 Share for 1 Warrant, Expires 5/06/16, Strike Price USD 17.70) | | | 81,252 | | | | — | |
| |
Total Long-Term Investments (Cost — $262,037,462) — 100.1% | | | | | | | 297,862,194 | |
| |
| | | | | | | | |
| | | | | | | | |
| | | Beneficial Interest (000) | | | | |
| |
BlackRock Liquidity Series, LLC Money Market Series, 0.23% (d)(e)(f) | | $ | 26,234 | | | | 26,233,677 | |
| |
Total Short-Term Securities (Cost — $26,233,677) — 8.8% | | | | | | | 26,233,677 | |
| |
Total Investments (Cost — $288,271,139) — 108.9% | | | | 324,095,871 | |
Liabilities in Excess of Other Assets — (8.9)% | | | | (26,414,728 | ) |
| | | | | | | | |
Net Assets — 100.0% | | | | | | $ | 297,681,143 | |
| | | | | | | | |
|
| Notes to Schedule of Investments |
| (a) | Non-income producing security. |
| (b) | Security, or a portion of security, is on loan. |
| (c) | Warrants entitle the Fund to purchase a predetermined number of shares of common stock and are non-income producing. The purchase price and number of shares are sub- ject to adjustment under certain conditions until the expiration date of the warrants, if any. |
| (d) | Investments in issuers considered to be an affiliate of the Fund during the six months ended March 31, 2013, for purposes of Section 2(a)(3) of the Investment Company Act of 1940, as amended, were as follows: |
| | | | | | | | | | | | | | | | | | | | | | | | |
| Affiliate | | Shares/
Beneficial
Interest Held at
September 30,
2012 | | | Net Activity | | | Beneficial
Interest Held at March 31,
2013 | | | Value at
March 31,
2013 | | | Income | | | Realized
Loss | |
| |
BlackRock Liquidity Funds, TempFund, Institutional Class | | | 1,508,065 | | | | (1,508,065 | ) | | | — | | | | — | | | $ | 1,895 | | | | — | |
BlackRock Liquidity Series, LLC Money Market Series | | $ | 34,116,584 | | | $ | (7,882,907 | ) | | $ | 26,233,677 | | | $ | 26,233,677 | | | $ | 84,537 | | | | — | |
iShares Cohen & Steers Realty Majors Index Fund | | | 21,100 | | | | (21,100 | ) | | | — | | | | — | | | | — | | | $ | (33,071 | ) |
| |
| (e) | Represents the current yield as of report date. |
| (f) | Security was purchased with the cash collateral from loaned securities. The Fund may withdraw up to 25% of its investment daily, although the manager of the BlackRock Liquidity Series LLC, Money Market Series, in its sole discretion, may permit an investor to withdraw more than 25% on any one day. |
| — | | For Fund compliance purposes, the Fund’s industry classifications refer to any one or more of the industry sub-classifications used by one or more widely recognized market indexes or ratings group indexes, and/or as defined by Fund management. These definitions may not apply for purposes of this report, which may combine such industry sub-classifications for reporting ease. |
| | | | | | |
See Notes to Financial Statements. | | | | |
| | | | | | | |
| | BLACKROCK FUNDS | | MARCH 31, 2013 | | 17 |
| | |
| | |
Schedule of Investments (concluded) | | BlackRock Mid-Cap Growth Equity Portfolio |
| — | | Fair Value Measurements — Various inputs are used in determining the fair value of investments. These inputs to valuation techniques are categorized into a disclosure hierarchy consisting of three broad levels for financial statement purposes as follows: |
| | — | | Level 1 – unadjusted price quotations in active markets/exchanges for identical assets and liabilities that the Fund has the ability to access |
| | — | | Level 2 – other observable inputs (including, but not limited to, quoted prices for similar assets or liabilities in markets that are active, quoted prices for identical or similar assets or liabilities in markets that are not active, inputs other than quoted prices that are observable for the assets or liabilities (such as interest rates, yield curves, volatilities, prepayment speeds, loss severities, credit risks and default rates) or other market–corroborated inputs) |
| | — | | Level 3 – unobservable inputs based on the best information available in the circumstances, to the extent observable inputs are not available (including the Fund’s own assumptions used in determining the fair value of investments) |
The hierarchy gives the highest priority to unadjusted quoted prices in active markets for identical assets or liabilities (Level 1 measurements) and the lowest priority to unobservable inputs (Level 3 measurements). Accordingly, the degree of judgment exercised in determining fair value is greatest for instruments categorized in Level 3. The inputs used to measure fair value may fall into different levels of the fair value hierarchy. In such cases, for disclosure purposes, the level in the fair value hierarchy within which the fair value measurement falls in its entirety is determined based on the lowest level input that is significant to the fair value measurement in its entirety.
Changes in valuation techniques may result in transfers into or out of an assigned level within the disclosure hierarchy. In accordance with the Fund’s policy, transfers between different levels of the fair value disclosure hierarchy are deemed to have occurred as of the beginning of the reporting period. The categorization of a value determined for investments is based on the pricing transparency of the investment and is not necessarily an indication of the risks associated with investing in those securities. For information about the Fund’s policy regarding valuation of investments and other significant accounting policies, please refer to Note 1 of the Notes to Financial Statements.
The following table summarizes the Fund’s investments categorized in the disclosure hierarchy as of March 31, 2013:
| | | | | | | | | | | | | | | | | | | | | | |
| | | | | Level 1 | | | | | Level 2 | | | | | Level 3 | | | | Total | |
Assets: | | | | | | | | | | | | | | | | | | | | | | |
Investments: | | | | | | | | | | | | | | | | | | | | | | |
Long-Term Investments: | | | | | | | | | | | | | | | | | | | | | | |
Common Stocks1 | | | | $ | 297,862,194 | | | | | | — | | | | | — | | | | $ | 297,862,194 | |
Short-Term Securities | | | | | — | | | | | $ | 26,233,677 | | | | | — | | | | | 26,233,677 | |
Total | | | | $ | 297,862,194 | | | | | $ | 26,233,677 | | | | | — | | | | $ | 324,095,871 | |
|
1 See above Schedule of Investments for values in each industry. Certain of the Fund’s liabilities are held at carrying amount, which approximates fair value for financial statement purposes. As of March 31, 2013, such liabilities are categorized within the disclosure hierarchy as follows: | |
| | | | | Level 1 | | | | | Level 2 | | | | | Level 3 | | | | Total | |
Liabilities: | | | | | | | | | | | | | | | | | | | | | | |
Bank overdraft | | | | | — | | | | | $ | 153,805 | | | | | — | | | | $ | 153,805 | |
Collateral on securities loaned at value | | | | | — | | | | | | 26,233,677 | | | | | — | | | | | 26,233,677 | |
Total | | | | | — | | | | | $ | 26,387,482 | | | | | — | | | | $ | 26,387,482 | |
There were no transfers between levels during the six months ended March 31, 2013.
| | | | | | |
See Notes to Financial Statements. | | | | |
| | | | | | | |
| 18 | | BLACKROCK FUNDS | | MARCH 31, 2013 | | |
| | |
| | |
Schedule of Investments March 31, 2013 (Unaudited) | | BlackRock Small Cap Growth Equity Portfolio (Percentages shown are based on Net Assets) |
| | | | | | | | |
| Common Stocks | | Shares | | | Value | |
| |
Aerospace & Defense — 4.1% | |
Hexcel Corp. (a)(b) | | | 491,500 | | | $ | 14,258,415 | |
Orbital Sciences Corp. (a)(b) | | | 1,396,785 | | | | 23,312,342 | |
TransDigm Group, Inc. | | | 141,900 | | | | 21,699,348 | |
| | | | | | | | |
| | | | | | | 59,270,105 | |
| |
Airlines — 1.2% | |
US Airways Group, Inc. (a)(b) | | | 1,022,900 | | | | 17,358,613 | |
| |
Auto Components — 1.8% | |
Dana Holding Corp. | | | 999,552 | | | | 17,822,012 | |
Tenneco, Inc. (a)(b) | | | 196,000 | | | | 7,704,760 | |
| | | | | | | | |
| | | | | | | 25,526,772 | |
| |
Biotechnology — 12.8% | |
Achillion Pharmaceuticals, Inc. (a)(b) | | | 1,416,114 | | | | 12,376,836 | |
BioSpecifics Technologies Corp. (a)(c) | | | 763,967 | | | | 13,025,637 | |
Cubist Pharmaceuticals, Inc. (a) | | | 801,720 | | | | 37,536,530 | |
Elan Corp. Plc - ADR (a) | | | 4,312,475 | | | | 50,887,205 | |
Gentium SpA - ADR (a)(b)(c) | | | 3,864,466 | | | | 31,843,200 | |
Keryx Biopharmaceuticals, Inc. (a)(b) | | | 3,480,091 | | | | 24,499,841 | |
Novavax, Inc. (a) | | �� | 2,063,800 | | | | 4,705,464 | |
Sunesis Pharmaceuticals, Inc. (a) | | | 1,859,011 | | | | 10,168,790 | |
| | | | | | | | |
| | | | | | | 185,043,503 | |
| |
Building Products — 1.0% | |
Trex Co., Inc. (a)(b) | | | 293,494 | | | | 14,434,035 | |
| |
Capital Markets — 1.3% | |
Walter Investment Management Corp. (a) | | | 182,800 | | | | 6,809,300 | |
WisdomTree Investments, Inc. (a) | | | 1,230,400 | | | | 12,796,160 | |
| | | | | | | | |
| | | | | | | 19,605,460 | |
| |
Chemicals — 1.8% | |
Axiall Corp. | | | 293,000 | | | | 18,212,880 | |
Chemtura Corp. (a) | | | 339,900 | | | | 7,345,239 | |
| | | | | | | | |
| | | | | | | 25,558,119 | |
| |
Communications Equipment — 2.8% | |
Ciena Corp. (a)(b) | | | 1,336,400 | | | | 21,395,764 | |
Ixia (a)(b) | | | 875,595 | | | | 18,947,876 | |
| | | | | | | | |
| | | | | | | 40,343,640 | |
| |
Construction & Engineering — 1.5% | |
Granite Construction, Inc. | | | 201,500 | | | | 6,415,760 | |
Quanta Services, Inc. (a) | | | 549,800 | | | | 15,713,284 | |
| | | | | | | | |
| | | | | | | 22,129,044 | |
| |
Consumer Finance — 0.3% | |
Portfolio Recovery Associates, Inc. (a)(b) | | | 37,600 | | | | 4,772,192 | |
| |
Diversified Consumer Services — 1.0% | |
Bright Horizons Family Solutions, Inc. (a) | | | 424,200 | | | | 14,333,718 | |
| |
Diversified Telecommunication Services — 2.3% | |
Cbeyond, Inc. (a)(b)(c) | | | 3,225,865 | | | | 23,968,177 | |
InContact, Inc. (a)(b) | | | 1,106,949 | | | | 8,955,217 | |
| | | | | | | | |
| | | | | | | 32,923,394 | |
| |
Electrical Equipment — 0.8% | |
Thermon Group Holdings, Inc. (a)(b) | | | 543,400 | | | | 12,068,914 | |
| |
Energy Equipment & Services — 1.1% | |
Dresser-Rand Group, Inc. (a)(b) | | | 255,600 | | | | 15,760,296 | |
| |
| | | | | | | | |
| Common Stocks | | Shares | | | Value | |
| |
Food & Staples Retailing — 0.5% | |
United Natural Foods, Inc. (a) | | | 149,100 | | | $ | 7,335,720 | |
| |
Food Products — 1.8% | |
Annie’s, Inc. (a) | | | 385,156 | | | | 14,736,069 | |
The Hain Celestial Group, Inc. (a) | | | 194,900 | | | | 11,904,492 | |
| | | | | | | | |
| | | | | | | 26,640,561 | |
| |
Health Care Equipment & Supplies — 4.6% | |
Accuray, Inc. (a)(b) | | | 547,641 | | | | 2,541,054 | |
ArthroCare Corp. (a) | | | 731,643 | | | | 25,431,911 | |
GenMark Diagnostics, Inc. (a) | | | 668,726 | | | | 8,639,940 | |
Haemonetics Corp. (a)(b) | | | 557,500 | | | | 23,225,450 | |
Volcano Corp. (a) | | | 337,400 | | | | 7,510,524 | |
| | | | | | | | |
| | | | | | | 67,348,879 | |
| |
Health Care Providers & Services — 2.0% | |
Air Methods Corp. | | | 526,610 | | | | 25,403,666 | |
Amedisys, Inc. (a)(b) | | | 302,266 | | | | 3,361,198 | |
| | | | | | | | |
| | | | | | | 28,764,864 | |
| |
Hotels, Restaurants & Leisure — 1.0% | |
Bloomin’ Brands, Inc. (a) | | | 327,454 | | | | 5,851,603 | |
Brinker International, Inc. | | | 220,243 | | | | 8,292,149 | |
| | | | | | | | |
| | | | | | | 14,143,752 | |
| |
Household Durables — 0.5% | |
MDC Holdings, Inc. | | | 78,500 | | | | 2,877,025 | |
TRI Pointe Homes, Inc. (a) | | | 210,000 | | | | 4,231,500 | |
| | | | | | | | |
| | | | | | | 7,108,525 | |
| |
Internet Software & Services — 4.0% | |
CoStar Group, Inc. (a)(b) | | | 264,333 | | | | 28,933,890 | |
Market Leader Inc. (a) | | | 21,441 | | | | 192,111 | |
NIC, Inc. | | | 1,474,527 | | | | 28,251,937 | |
| | | | | | | | |
| | | | | | | 57,377,938 | |
| |
IT Services — 7.2% | |
EPAM Systems, Inc. (a) | | | 363,677 | | | | 8,448,217 | |
ExlService Holdings, Inc. (a)(c) | | | 1,673,891 | | | | 55,037,536 | |
Global Cash Access Holdings, Inc. (a)(b) | | | 924,391 | | | | 6,516,957 | |
MAXIMUS, Inc. | | | 189,393 | | | | 15,145,758 | |
WEX, Inc. (a) | | | 113,500 | | | | 8,909,750 | |
WNS Holdings Ltd.—ADR (a) | | | 688,001 | | | | 10,141,135 | |
| | | | | | | | |
| | | | | | | 104,199,353 | |
| |
Leisure Equipment & Products — 0.5% | |
Brunswick Corp. | | | 201,500 | | | | 6,895,330 | |
| |
Machinery — 3.6% | |
EnPro Industries, Inc. (a) | | | 84,500 | | | | 4,323,865 | |
Luxfer Holdings Plc - ADR | | | 855,697 | | | | 13,254,747 | |
RBC Bearings, Inc. (a) | | | 109,400 | | | | 5,531,264 | |
Trimas Corp. (a) | | | 568,900 | | | | 18,472,183 | |
Wabash National Corp. (a)(b) | | | 1,021,605 | | | | 10,379,507 | |
| | | | | | | | |
| | | | | | | 51,961,566 | |
| |
Media — 1.6% | |
National CineMedia, Inc. | | | 1,426,463 | | | | 22,509,586 | |
| |
Metals & Mining — 1.1% | |
Globe Specialty Metals, Inc. | | | 1,190,127 | | | | 16,566,568 | |
| |
Oil, Gas & Consumable Fuels — 6.8% | |
Bonanza Creek Energy, Inc. (a) | | | 417,500 | | | | 16,144,725 | |
| |
| | | | | | |
See Notes to Financial Statements. | | | | |
| | | | | | | |
| | BLACKROCK FUNDS | | MARCH 31, 2013 | | 19 |
| | |
| | |
Schedule of Investments (continued) | | BlackRock Small Cap Growth Equity Portfolio (Percentages shown are based on Net Assets) |
| | | | | | | | |
| Common Stocks | | Shares | | | Value | |
| |
Oil, Gas & Consumable Fuels (concluded) | |
Cheniere Energy, Inc. (a)(b) | | | 969,300 | | | $ | 27,140,400 | |
Energy XXI Bermuda Ltd. | | | 575,648 | | | | 15,669,139 | |
Gulfport Energy Corp. (a) | | | 366,800 | | | | 16,810,444 | |
Kodiak Oil & Gas Corp. (a)(b) | | | 786,400 | | | | 7,148,376 | |
Magnum Hunter Resources Corp. (a)(b) | | | 1,918,331 | | | | 7,692,507 | |
Oasis Petroleum, Inc. (a)(b) | | | 224,900 | | | | 8,561,943 | |
| | | | | | | | |
| | | | | | | 99,167,534 | |
| |
Paper & Forest Products — 0.9% | |
KapStone Paper and Packaging Corp. | | | 449,363 | | | | 12,492,291 | |
| |
Pharmaceuticals — 4.1% | |
Jazz Pharmaceuticals Plc (a) | | | 184,146 | | | | 10,295,603 | |
Optimer Pharmaceuticals, Inc. (a) | | | 1,750,364 | | | | 20,829,332 | |
ViroPharma, Inc. (a)(b) | | | 865,677 | | | | 21,780,433 | |
Warner Chilcott Plc, Class A | | | 527,091 | | | | 7,142,083 | |
| | | | | | | | |
| | | | | | | 60,047,451 | |
| |
Professional Services — 2.3% | |
On Assignment, Inc. (a)(b) | | | 676,417 | | | | 17,120,114 | |
Wageworks, Inc. (a) | | | 635,542 | | | | 15,907,616 | |
| | | | | | | | |
| | | | | | | 33,027,730 | |
| |
Semiconductors & Semiconductor Equipment — 2.2% | |
Microsemi Corp. (a)(b) | | | 890,350 | | | | 20,629,409 | |
Semtech Corp. (a)(b) | | | 312,857 | | | | 11,072,009 | |
| | | | | | | | |
| | | | | | | 31,701,418 | |
| |
Software — 13.6% | |
Fleetmatics Group Plc (a) | | | 294,200 | | | | 7,134,350 | |
Fortinet, Inc. (a) | | | 530,300 | | | | 12,557,504 | |
Gateway Industries, Inc. (a) | | | 1,317,638 | | | | 579,761 | |
MicroStrategy, Inc., Class A (a) | | | 162,900 | | | | 16,465,932 | |
PROS Holdings, Inc. (a) | | | 1,011,689 | | | | 27,487,590 | |
QLIK Technologies, Inc. (a)(b) | | | 1,124,241 | | | | 29,039,145 | |
Sourcefire, Inc. (a)(b) | | | 296,400 | | | | 17,555,772 | |
TIBCO Software, Inc. (a) | | | 566,900 | | | | 11,462,718 | |
TiVo, Inc. (a) | | | 3,899,473 | | | | 48,314,470 | |
Tyler Technologies, Inc. (a) | | | 248,825 | | | | 15,243,020 | |
Ultimate Software Group, Inc. (a)(b) | | | 110,024 | | | | 11,460,100 | |
| | | | | | | | |
| | | | | | | 197,300,362 | |
| |
Specialty Retail — 2.4% | |
Aeropostale, Inc. (a)(b) | | | 552,400 | | | | 7,512,640 | |
Conn’s Inc. (a) | | | 277,463 | | | | 9,960,922 | |
Lumber Liquidators Holdings, Inc. (a) | | | 146,080 | | | | 10,257,738 | |
Pier 1 Imports, Inc. | | | 331,400 | | | | 7,622,200 | |
| | | | | | | | |
| | | | | | | 35,353,500 | |
| |
| | | | | | | | |
| Common Stocks | | Shares | | | Value | |
| |
Textiles, Apparel & Luxury Goods — 1.7% | |
G-III Apparel Group Ltd. (a)(b) | | | 448,043 | | | $ | 17,971,005 | |
Tumi Holdings, Inc. (a)(b) | | | 322,000 | | | | 6,742,680 | |
| | | | | | | | |
| | | | | | | 24,713,685 | |
| |
Thrifts & Mortgage Finance — 0.1% | |
Radian Group, Inc. | | | 148,800 | | | | 1,593,648 | |
| |
Trading Companies & Distributors — 1.8% | |
Beacon Roofing Supply, Inc. (a)(b) | | | 301,700 | | | | 11,663,722 | |
United Rentals, Inc. (a)(b) | | | 271,700 | | | | 14,935,349 | |
| | | | | | | | |
| | | | | | | 26,599,071 | |
| |
Total Common Stocks — 98.1% | | | | | | | 1,421,977,137 | |
| |
| | | | | | | | |
| | | | | | | | |
|
Warrants (d) | |
| |
Pharmaceuticals — 0.0% | |
Alexza Pharmaceuticals, Inc. (Issued/Exercisable 5/06/11, 1 Share for 1 Warrant, Expires 5/06/16, Strike Price USD 17.70) | | | 1,000,249 | | | | — | |
| |
Total Long-Term Investments | | | | | |
(Cost — $1,117,717,297) — 98.1% | | | | 1,421,977,137 | |
| | | | | | | | |
| | | | | | | | |
|
Short-Term Securities | |
| |
BlackRock Liquidity Funds, TempFund, Institutional Class, 0.09% (e)(f) | | | 44,511,020 | | | | 44,511,020 | |
| |
| | | Beneficial
Interest
(000) | | | | |
| |
BlackRock Liquidity Series, LLC Money Market Series,
0.23% (e)(f)(g) | | $ | 270,659 | | | | 270,659,026 | |
| |
Total Short-Term Securities | | | | | | | | |
(Cost — $315,170,046) — 21.7% | | | | | | | 315,170,046 | |
| |
| | | | | | | | |
| | | | | | | | |
| | |
| Options Purchased | | | | | | |
| |
(Cost — $3,553,098) — 0.1% | | | | 1,918,600 | |
| |
Total Investments
(Cost — $1,436,440,441) — 119.9% | | | | 1,739,065,783 | |
Liabilities in Excess of Other Assets — (19.9)% | | | | (288,652,263 | ) |
| | | | | | | | |
Net Assets — 100.0% | | | $ | 1,450,413,520 | |
| | | | | | | | |
| | | | | | |
See Notes to Financial Statements. | | | | |
| | | | | | | |
| 20 | | BLACKROCK FUNDS | | MARCH 31, 2013 | | |
| | |
| | |
Schedule of Investments (continued) | | BlackRock Small Cap Growth Equity Portfolio |
|
| Notes to Schedule of Investments |
| (a) | Non-income producing security. |
| (b) | Security, or a portion of security, is on loan. |
| (c) | Investments in issuers (whereby the Fund held 5% or more of the companies’ outstanding securities) that were considered to be an affiliate during the six months ended March 31, 2013, for purposes of Section 2(a)(3) of the Investment Company Act of 1940, as amended, were as follows: |
| | | | | | | | | | | | | | | | | | | | | | | | |
| Affiliate | | Shares Held
at
September 30,
2012 | | | Shares
Purchased | | | Shares
Sold | | | Shares
Held at
March 31,
2013 | | | Value at
March 31,
2013 | | | Realized
Gain | |
BioSpecifics Technologies Corp. | | | 763,967 | | | | — | | | | — | | | | 763,967 | | | $ | 13,025,637 | | | | — | |
Caribou Coffee Co., Inc.1 | | | 1,864,201 | | | | 2,900 | | | | 1,867,101 | | | | — | | | | — | | | $ | 3,584,940 | |
Cbeyond, Inc. | | | 3,027,373 | | | | 198,492 | | | | — | | | | 3,225,865 | | | $ | 23,968,177 | | | | — | |
Epocrates, Inc.1 | | | 2,728,045 | | | | 396,934 | | | | 3,124,979 | | | | — | | | | — | | | $ | 10,624,049 | |
ExlService Holdings, Inc. | | | 1,618,510 | | | | 91,394 | | | | 36,013 | | | | 1,673,891 | | | $ | 55,037,536 | | | $ | 116,477 | |
Gentium SpA - ADR | | | 3,168,551 | | | | 695,915 | | | | — | | | | 3,864,466 | | | $ | 31,843,200 | | | | — | |
1 No longer an affiliated company or held by the Fund as of report date.
| (d) | Warrants entitle the Fund to purchase a predetermined number of shares of common stock and are non-income producing. The purchase price and number of shares are subject to adjustment under certain conditions until the expiration date of the warrants, if any. |
| (e) | Represents the current yield as of report date. |
| (f) | Investments in issuers considered to be an affiliate of the Fund during the six months ended March 31, 2013, for purposes of Section 2(a)(3) of the Investment Company Act of 1940, as amended, were as follows: |
| | | | | | | | | | | | | | | | |
| Affiliate | | Shares/
Beneficial
Interest Held at
September 30,
2012 | | | Net Activity | | | Shares/
Beneficial
Interest Held at
March 31,
2013 | | | Income | |
BlackRock Liquidity Funds, TempFund, Institutional Class | | | 10,896,648 | | | | 33,614,372 | | | | 44,511,020 | | | $ | 14,343 | |
BlackRock Liquidity Series, LLC Money Market Series | | $ | 282,712,568 | | | $ | (12,053,542 | ) | | $ | 270,659,026 | | | $ | 407,944 | |
| (g) | Security was purchased with the cash collateral from loaned securities. The Fund may withdraw up to 25% of its investment daily, although the manager of the BlackRock Liquidity Series LLC, Money Market Series, in its sole discretion, may permit an investor to withdraw more than 25% on any one day. |
| — | | For Fund compliance purposes, the Fund’s industry classifications refer to any one or more of the industry sub-classifications used by one or more widely recognized market indexes or ratings group indexes, and/or as defined by Fund management. These definitions may not apply for purposes of this report, which may combine such industry sub-classifications for reporting ease. |
| — | | Exchange-traded options purchased as of March 31, 2013 were as follows: |
| | | | | | | | | | | | | | | | | | | | | | | | |
| Description | | Put/
Call | | | | | | Strike
Price | | | Expiration
Date | | | Contracts | | | Market
Value | |
Russell 2000 Index | | | Put | | | | USD | | | | 875.00 | | | | 6/22/13 | | | | 1,810 | | | $ | 1,918,600 | |
| — | | Fair Value Measurements – Various inputs are used in determining the fair value of investments. These inputs to valuation techniques are categorized into a disclosure hierarchy consisting of three broad levels for financial statement purposes as follows: |
| | — | | Level 1 - unadjusted price quotations in active markets/exchanges for identical assets and liabilities that the Fund has the ability to access |
| | — | | Level 2 - other observable inputs (including, but not limited to, quoted prices for similar assets or liabilities in markets that are active, quoted prices for identical or similar assets or liabilities in markets that are not active, inputs other than quoted prices that are observable for the assets or liabilities (such as interest rates, yield curves, volatilities, prepayment speeds, loss severities, credit risks and default rates) or other market–corroborated inputs) |
| | — | | Level 3 – unobservable inputs based on the best information available in the circumstances, to the extent observable inputs are not available (including the Fund’s own assumptions used in determining the fair value of investments) |
The hierarchy gives the highest priority to unadjusted quoted prices in active markets for identical assets or liabilities (Level 1 measurements) and the lowest priority to unobservable inputs (Level 3 measurements). Accordingly, the degree of judgment exercised in determining fair value is greatest for instruments categorized in Level 3. The inputs used to measure fair value may fall into different levels of the fair value hierarchy. In such cases, for disclosure purposes, the level in the fair value hierarchy within which the fair value measurement falls in its entirety is determined based on the lowest level input that is significant to the fair value measurement in its entirety.
| | | | | | |
See Notes to Financial Statements. | | | | |
| | | | | | | |
| | BLACKROCK FUNDS | | MARCH 31, 2013 | | 21 |
| | |
| | |
Schedule of Investments (concluded) | | BlackRock Small Cap Growth Equity Portfolio |
Changes in valuation techniques may result in transfers into or out of an assigned level within the disclosure hierarchy. In accordance with the Fund’s policy, transfers between different levels of the fair value disclosure hierarchy are deemed to have occurred as of the beginning of the reporting period. The categorization of a value determined for investments is based on the pricing transparency of the investment and is not necessarily an indication of the risks associated with investing in those securities. For information about the Fund’s policy regarding valuation of investments and other significant accounting policies, please refer to Note 1 of the Notes to Financial Statements.
The following table summarizes the Fund’s investments categorized in the disclosure hierarchy as of March 31, 2013:
| | | | | | | | | | | | | | | | | | | | | | |
| | | | | Level 1 | | | | | Level 2 | | | | | Level 3 | | | | Total | |
Assets: | | | | | | | | | | | | | | | | | | | | | | |
Investments: | | | | | | | | | | | | | | | | | | | | | | |
Long-Term Investments1 | | | | $ | 1,421,977,137 | | | | | | — | | | | | — | | | | $ | 1,421,977,137 | |
Short-Term Securities | | | | | 44,511,020 | | | | | $ | 270,659,026 | | | | | — | | | | | 315,170,046 | |
Options Purchased: | | | | | | | | | | | | | | | | | | | | | | |
Equity Contracts | | | | | 1,918,600 | | | | | | — | | | | | — | | | | | 1,918,600 | |
Total | | | | $ | 1,468,406,757 | | | | | $ | 270,659,026 | | | | | — | | | | $ | 1,739,065,783 | |
1 See above Schedule of Investments for values in each industry. Certain of the Fund’s liabilities are held at carrying amount, which approximates fair value for financial statement purposes. As of March 31, 2013, such liabilities are categorized within the disclosure hierarchy as follows: | |
| | | | | Level 1 | | | | | Level 2 | | | | | Level 3 | | | | Total | |
Liabilities: | | | | | | | | | | | | | | | | | | | | | | |
Bank overdraft | | | | | — | | | | | $ | 1,746,637 | | | | | — | | | | $ | 1,746,637 | |
Collateral on securities loaned at value | | | | | — | | | | | | 270,659,026 | | | | | — | | | | | 270,659,026 | |
Total | | | | | — | | | | | $ | 272,405,663 | | | | | — | | | | $ | 272,405,663 | |
There were no transfers between levels during the six months ended March 31, 2013.
| | | | | | |
See Notes to Financial Statements. | | | | |
| | | | | | | |
| 22 | | BLACKROCK FUNDS | | MARCH 31, 2013 | | |
| | |
| | |
Statements of Assets and Liabilities | | |
| | | | | | | | | | | | |
| March 31, 2013 (Unaudited) | | BlackRock
Flexible Equity Fund1 | | | BlackRock Mid-Cap
Growth Equity
Portfolio | | | BlackRock Small Cap Growth Equity
Portfolio | |
Assets | | | | | | | | | | | | |
Investments at value — unaffiliated2,3 | | $ | 697,921,894 | | | $ | 297,862,194 | | | $ | 1,300,021,187 | |
Investments at value — affiliated4 | | | 43,966,028 | | | | 26,233,677 | | | | 439,044,596 | |
Cash pledged as collateral for financial futures contracts | | | 1,813,000 | | | | — | | | | — | |
Foreign currency at value5 | | | 3,915 | | | | — | | | | — | |
Investments sold receivable | | | 19,837,399 | | | | 13,233,144 | | | | 6,358,643 | |
Unrealized appreciation on foreign currency exchange contracts | | | 1,852,235 | | | | — | | | | — | |
Capital shares sold receivable | | | 211,551 | | | | 220,640 | | | | 1,763,055 | |
Dividends receivable — unaffiliated | | | 3,209,511 | | | | 63,022 | | | | 98,510 | |
Dividends receivable — affiliated | | | 650 | | | | 124 | | | | 3,249 | |
Receivable from Manager | | | 69,496 | | | | 14,580 | | | | — | |
Securities lending income receivable — affiliated | | | — | | | | 858 | | | | 7,721 | |
Prepaid expenses | | | 62,541 | | | | 48,200 | | | | 56,198 | |
| | | |
Total assets | | | 768,948,220 | | | | 337,676,439 | | | | 1,747,353,159 | |
| | | | | | | | | | | | |
Liabilities | | | | | | | | | | | | |
Bank overdraft | | | 635,227 | | | | 153,805 | | | | 1,746,637 | |
Options written at value6 | | | 129,970 | | | | — | | | | — | |
Collateral on securities loaned at value | | | — | | | | 26,233,677 | | | | 270,659,026 | |
Margin variation payable | | | 103,535 | | | | — | | | | — | |
Investments purchased payable | | | 15,714,259 | | | | 12,853,869 | | | | 11,543,773 | |
Unrealized depreciation on foreign currency exchange contracts | | | 117,011 | | | | — | | | | — | |
Capital shares redeemed payable | | | 15,147,567 | | | | 131,919 | | | | 11,354,419 | |
Service and distribution fees payable | | | 216,412 | | | | 78,785 | | | | 108,762 | |
Investment advisory fees payable | | | 512,898 | | | | 203,654 | | | | 656,135 | |
Other affiliates payable | | | 23,767 | | | | 12,512 | | | | 63,677 | |
Officer’s and Trustees’ fees payable | | | 10,424 | | | | 3,267 | | | | 11,564 | |
Other accrued expenses payable | | | 648,832 | | | | 323,808 | | | | 795,646 | |
Total liabilities | | | 33,259,902 | | | | 39,995,296 | | | | 296,939,639 | |
| | | |
Net Assets | | $ | 735,688,318 | | | $ | 297,681,143 | | | $ | 1,450,413,520 | |
| | | | | | | | | | | | |
Net Assets Consist of | | | | | | | | | | | | |
Paid-in capital | | $ | 720,618,130 | | | $ | 232,027,154 | | | $ | 1,120,743,422 | |
Undistributed (accumulated) net investment income (loss) | | | 1,138,504 | | | | 810,776 | | | | (3,793,191 | ) |
Accumulated net realized gain (loss) | | | (84,285,458 | ) | | | 29,018,481 | | | | 30,837,947 | |
Net unrealized appreciation/depreciation | | | 98,217,142 | | | | 35,824,732 | | | | 302,625,342 | |
| | | |
Net Assets | | $ | 735,688,318 | | | $ | 297,681,143 | | | $ | 1,450,413,520 | |
| | | | | | | | | | | | |
1 Consolidated Statement of Assets and Liabilities. | | | | | | | | | | | | |
2 Investments at cost — unaffiliated | | $ | 600,825,562 | | | $ | 262,037,462 | | | $ | 1,017,761,147 | |
3 Securities loaned at value | | | — | | | $ | 25,675,904 | | | $ | 266,021,646 | |
4 Investments at cost — affiliated | | $ | 44,204,602 | | | $ | 26,233,677 | | | $ | 418,679,294 | |
5 Foreign currency at cost | | $ | 3,955 | | | | — | | | | — | |
6 Premiums received | | $ | 119,348 | | | | — | | | | — | |
| | | | | | |
See Notes to Financial Statements. | | | | |
| | | | | | | |
| | BLACKROCK FUNDS | | MARCH 31, 2013 | | 23 |
| | |
| | |
Statements of Assets and Liabilities (concluded) | | |
| | | | | | | | | | | | |
| March 31, 2013 (Unaudited) | | BlackRock
Flexible Equity Fund1 | | | BlackRock Mid-Cap
Growth Equity
Portfolio | | | BlackRock Small Cap Growth Equity
Portfolio | |
Net Asset Value | | | | | | | | | | | | |
Institutional | | | | | | | | | | | | |
Net assets | | $ | 79,398,713 | | | $ | 17,646,671 | | | $ | 1,016,815,373 | |
| | | | |
| | | |
Shares outstanding2 | | | 6,034,867 | | | | 1,163,693 | | | | 38,301,462 | |
| | | | |
| | | |
Net asset value | | $ | 13.16 | | | $ | 15.16 | | | $ | 26.55 | |
| | | | |
| | | |
Service | | | | | | | | | | | | |
Net assets | | $ | 403,463 | | | $ | 2,030,040 | | | $ | 31,184,797 | |
| | | | |
| | | |
Shares outstanding2 | | | 31,121 | | | | 142,710 | | | | 1,259,348 | |
| | | | |
| | | |
Net asset value | | $ | 12.96 | | | $ | 14.22 | | | $ | 24.76 | |
| | | | |
| | | |
Investor A | | | | | | | | | | | | |
Net assets | | $ | 533,107,286 | | | $ | 246,630,377 | | | $ | 371,770,923 | |
| | | | |
| | | |
Shares outstanding2 | | | 41,768,642 | | | | 17,868,816 | | | | 15,605,278 | |
| | | | |
| | | |
Net asset value | | $ | 12.76 | | | $ | 13.80 | | | $ | 23.82 | |
| | | | |
| | | |
Investor B | | | | | | | | | | | | |
Net assets | | $ | 14,494,337 | | | $ | 4,583,610 | | | $ | 1,332,506 | |
| | | | |
| | | |
Shares outstanding2 | | | 1,253,855 | | | | 384,011 | | | | 66,709 | |
| | | | |
| | | |
Net asset value | | $ | 11.56 | | | $ | 11.94 | | | $ | 19.97 | |
| | | | |
| | | |
Investor C | | | | | | | | | | | | |
Net assets | | $ | 106,953,740 | | | $ | 19,679,256 | | | $ | 29,309,921 | |
| | | | |
| | | |
Shares outstanding2 | | | 9,300,069 | | | | 1,647,867 | | | | 1,474,721 | |
| | | | |
| | | |
Net asset value | | $ | 11.50 | | | $ | 11.94 | | | $ | 19.87 | |
| | | | |
| | | |
Class R | | | | | | | | | | | | |
Net assets | | $ | 1,330,779 | | | $ | 7,111,189 | | | | — | |
| | | | |
| | | |
Shares outstanding2 | | | 101,506 | | | | 518,447 | | | | — | |
| | | | |
| | | |
Net asset value | | $ | 13.11 | | | $ | 13.72 | | | | — | |
| | | | |
| | 1 | Consolidated Statement of Assets and Liabilities. |
| | 2 | Unlimited number of shares authorized, $0.001 par value. |
| | | | | | |
See Notes to Financial Statements. | | | | |
| | | | | | | |
| 24 | | BLACKROCK FUNDS | | MARCH 31, 2013 | | |
| | | | | | | | | | | | | | | | |
| Six Months Ended March 31, 2013 (Unaudited) | | BlackRock
Flexible
Equity Fund1 | | | | | BlackRock
Mid-Cap
Growth Equity
Portfolio | | | | | BlackRock
Small Cap
Growth Equity
Portfolio | |
| |
Investment Income | | | | | | | | | | | | | | | | |
| |
Dividends — unaffiliated | | $ | 10,326,138 | | | | | $ | 3,239,932 | | | | | $ | 3,988,139 | |
Foreign taxes withheld | | | (220,793 | ) | | | | | (133,178 | ) | | | | | — | |
Securities lending — affiliated | | | — | | | | | | 84,537 | | | | | | 407,944 | |
Dividends — affiliated | | | 9,340 | | | | | | 1,895 | | | | | | 14,343 | |
| | | | |
Total income | | | 10,114,685 | | | | | | 3,193,186 | | | | | | 4,410,426 | |
| | | | |
| | | | | | | | | | | | | | | | |
| |
Expenses | | | | | | | | | | | | | | | | |
| |
Investment advisory | | | 3,127,700 | | | | | | 1,137,844 | | | | | | 3,667,212 | |
Service and distribution — class specific | | | 1,304,959 | | | | | | 430,599 | | | | | | 610,544 | |
Transfer agent — class specific | | | 973,947 | | | | | | 439,769 | | | | | | 1,266,288 | |
Administration | | | 279,057 | | | | | | 106,673 | | | | | | 450,763 | |
Administration — class specific | | | 95,398 | | | | | | 35,580 | | | | | | 147,183 | |
Professional | | | 51,645 | | | | | | 26,705 | | | | | | 31,098 | |
Registration | | | 39,717 | | | | | | 33,557 | | | | | | 36,307 | |
Custodian | | | 35,956 | | | | | | 12,660 | | | | | | 43,634 | |
Printing | | | 27,068 | | | | | | 17,277 | | | | | | 34,307 | |
Officer and Trustees | | | 14,026 | | | | | | 5,693 | | | | | | 20,985 | |
Miscellaneous | | | 20,273 | | | | | | 12,169 | | | | | | 18,782 | |
Recoupment of past waived fees — class specific | | | 892 | | | | | | 2,192 | | | | | | — | |
| | | | |
Total expenses | | | 5,970,638 | | | | | | 2,260,718 | | | | | | 6,327,103 | |
Less fees waived by Manager | | | (12,040 | ) | | | | | (1,005 | ) | | | | | (9,008 | ) |
Less administration fees waived — class specific | | | (95,262 | ) | | | | | (34,848 | ) | | | | | (220 | ) |
Less transfer agent fees waived — class specific | | | (35,945 | ) | | | | | (37,691 | ) | | | | | (429 | ) |
Less transfer agent fees reimbursed — class specific | | | (481,271 | ) | | | | | (132,246 | ) | | | | | — | |
Less fees paid indirectly | | | (198 | ) | | | | | (222 | ) | | | | | (23 | ) |
| | | | |
Total expenses after fees waived, reimbursed and paid indirectly | | | 5,345,922 | | | | | | 2,054,706 | | | | | | 6,317,423 | |
| | | | |
Net investment income (loss) | | | 4,768,763 | | | | | | 1,138,480 | | | | | | (1,906,997 | ) |
| | | | |
| | | | | | | | | | | | | | | | |
| |
Realized and Unrealized Gain (Loss) | | | | | | | | | | | | | | | | |
| |
Net realized gain (loss) from: | | | | | | | | | | | | | | | | |
Investments — unaffiliated | | | 2,771,163 | | | | | | 35,062,445 | | | | | | 37,730,666 | |
Investments — affiliated | | | (36,155 | ) | | | | | (33,071 | ) | | | | | 14,325,466 | |
Options written | | | 1,234,442 | | | | | | 42,265 | | | | | | 349,137 | |
Financial futures contracts | | | (2,658,118 | ) | | | | | — | | | | | | — | |
Foreign currency transactions | | | 269,106 | | | | | | — | | | | | | — | |
| | | | |
| | | 1,580,438 | | | | | | 35,071,639 | | | | | | 52,405,269 | |
| | | | |
| | | | | |
Net change in unrealized appreciation/depreciation on: | | | | | | | | | | | | | | | | |
Investments — unaffiliated | | | 36,681,765 | | | | | | (5,300,994 | ) | | | | | 122,824,707 | |
Investments — affiliated | | | (2,664,818 | ) | | | | | 14,888 | | | | | | (23,091,140 | ) |
Options written | | | (232,025 | ) | | | | | 57,385 | | | | | | 477,733 | |
Financial futures contracts | | | (885,277 | ) | | | | | — | | | | | | — | |
Foreign currency translations | | | 2,338,580 | | | | | | — | | | | | | — | |
| | | | |
| | | 35,238,225 | | | | | | (5,228,721 | ) | | | | | 100,211,300 | |
| | | | |
Total realized and unrealized gain | | | 36,818,663 | | | | | | 29,842,918 | | | | | | 152,616,569 | |
| | | | |
Net Increase in Net Assets Resulting from Operations | | $ | 41,587,426 | | | | | $ | 30,981,398 | | | | | $ | 150,709,572 | |
| | | | |
1 Consolidated Statement of Operations.
| | | | | | |
See Notes to Financial Statements. | | | | |
| | | | | | | |
| | BLACKROCK FUNDS | | MARCH 31, 2013 | | 25 |
| | |
| | |
Statements of Changes in Net Assets | | |
| | | | | | | | | | | | | | | | | | | | | | | | | | | | |
| | | BlackRock
Flexible
Equity
Fund1 | | BlackRock
Mid-Cap
Growth Equity
Portfolio | | | | | BlackRock
Small Cap
Growth Equity
Portfolio | |
| Increase (Decrease) in Net Assets: | | Six Months
Ended March 31,
2013
(Unaudited) | | | Year Ended
September 30,
2012 | | | | | Six Months
Ended
March 31,
2013
(Unaudited) | | | Year Ended
September 30,
2012 | | | | | Six Months
Ended March 31,
2013
(Unaudited) | | | Year Ended
September 30,
2012 | |
Operations | | | | | | | | | | | | | | | | | | | | | | | | | | | | |
Net investment income (loss) | | $ | 4,768,763 | | | $ | 5,181,014 | | | | | $ | 1,138,480 | | | $ | (334,874 | ) | | | | $ | (1,906,997 | ) | | $ | 613,862 | |
Net realized gain | | | 1,580,438 | | | | 70,505,425 | | | | | | 35,071,639 | | | | 18,432,042 | | | | | | 52,405,269 | | | | 130,752,697 | |
Net change in unrealized appreciation/depreciation | | | 35,238,225 | | | | 166,163,492 | | | | | | (5,228,721 | ) | | | 40,837,780 | | | | | | 100,211,300 | | | | 283,452,122 | |
Net increase in net assets resulting from operations | | | 41,587,426 | | | | 241,849,931 | | | | | | 30,981,398 | | | | 58,934,948 | | | | | | 150,709,572 | | | | 414,818,681 | |
| | | | | | | | | | | | | | | | | | | | | | | | | | | | |
Dividends and Distributions to Shareholders From | | | | | | | | | | | |
Net investment income: | | | | | | | | | | | | | | | | | | | | | | | | | | | | |
Institutional | | | (1,253,277 | ) | | | (1,662,860 | )2 | | | | | — | | | | — | | | | | | (2,500,056 | ) | | | — | |
Service | | | (4,137 | ) | | | (8,174 | )2 | | | | | — | | | | — | | | | | | — | | | | — | |
Investor A | | | (4,742,133 | ) | | | (3,726,374 | )2 | | | | | — | | | | — | | | | | | — | | | | — | |
Investor B | | | (10,767 | ) | | | — | | | | | | — | | | | — | | | | | | — | | | | — | |
Investor C | | | (182,439 | ) | | | — | | | | | | — | | | | — | | | | | | — | | | | — | |
Class R | | | (7,295 | ) | | | (2,690 | )2 | | | | | — | | | | — | | | | | | — | | | | — | |
Net realized gain: | | | | | | | | | | | | | | | | | | | | | | | | | | | | |
Institutional | | | — | | | | — | | | | | | — | | | | — | | | | | | (94,587,297 | ) | | | (25,878,958 | )2 |
Service | | | — | | | | — | | | | | | — | | | | — | | | | | | (3,052,314 | ) | | | (735,003 | )2 |
Investor A | | | — | | | | — | | | | | | — | | | | — | | | | | | (37,128,147 | ) | | | (7,371,034 | )2 |
Investor B | | | — | | | | — | | | | | | — | | | | — | | | | | | (164,432 | ) | | | (60,195 | )2 |
Investor C | | | — | | | | — | | | | | | — | | | | — | | | | | | (3,289,903 | ) | | | (874,865 | )2 |
Decrease in net assets resulting from dividends and distributions to shareholders | | | (6,200,048 | ) | | | (5,400,098 | ) | | | | | — | | | | — | | | | | | (140,722,149 | ) | | | (34,920,055 | ) |
| | | | | | | | | | | | | | | | | | | | | | | | | | | | |
Capital Share Transactions | | | | | | | | | | | | | | | | | | | | | | | | | | | | |
Net increase (decrease) in net assets derived from capital share transactions | | | (192,819,148 | ) | | | (267,769,413 | ) | | | | | (21,999,522 | ) | | | (52,658,613 | ) | | | | | 49,197,052 | | | | (205,244,715 | ) |
| | | | | | | | | | | | | | | | | | | | | | | | | | | | |
Net Assets | | | | | | | | | | | | | | | | | | | | | | | | | | | | |
Total increase (decrease) in net assets | | | (157,431,770 | ) | | | (31,319,580 | ) | | | | | 8,981,876 | | | | 6,276,335 | | | | | | 59,184,475 | | | | 174,653,911 | |
Beginning of period | | | 893,120,088 | | | | 924,439,668 | | | | | | 288,699,267 | | | | 282,422,932 | | | | | | 1,391,229,045 | | | | 1,216,575,134 | |
End of period | | $ | 735,688,318 | | | $ | 893,120,088 | | | | | $ | 297,681,143 | | | $ | 288,699,267 | | | | | $ | 1,450,413,520 | | | $ | 1,391,229,045 | |
Undistributed (accumulated) net investment income (loss) | | $ | 1,138,504 | | | $ | 2,569,789 | | | | | $ | 810,776 | | | $ | (327,704 | ) | | | | $ | (3,793,191 | ) | | $ | 613,862 | |
| | 1 | Consolidated Statement of Changes in Net Assets. |
| | 2 | Dividends and distributions are determined in accordance with federal income tax regulations. |
| | | | | | |
See Notes to Financial Statements. | | | | |
| | | | | | | |
| 26 | | BLACKROCK FUNDS | | MARCH 31, 2013 | | |
| | |
| | |
Financial Highlights | | BlackRock Flexible Equity Fund |
| | | | | | | | | | | | | | | | | | | | | | | | | | | | | | | | | | | | | | | | | | | | | | | | | | |
| | | Institutional | | | | | Service | |
| | | Six Months Ended March 31, 2013 (Unaudited)1 | | | | | | | | | | | | | | | | | | | | Six Months Ended March 31, 2013 (Unaudited)1 | | | | | | | | | | | | | | | | |
| | | | | | | | | | | | | | | | | | | | | | | | | | | | | | | | | | | |
| | | | Year Ended September 30, | | | | | | Year Ended September 30, | |
| | | | | | | | | | | | | | | | | | | | | | | | | | | | | | | | | | | |
| | | | 20121 | | | 2011 | | | 2010 | | | 2009 | | | 2008 | | | | | | 20121 | | | 2011 | | | 2010 | | | 2009 | | | 2008 | |
Per Share Operating Performance | | | | | | | | | | | | | | | | | | | | | |
Net asset value, beginning of period | | $ | 12.53 | | | $ | 9.81 | | | $ | 10.53 | | | $ | 9.34 | | | $ | 9.94 | | | $ | 14.35 | | | | | | $ 12.30 | | | $ | 9.63 | | | $ | 10.33 | | | $ | 9.17 | | | $ | 9.78 | | | $ | 14.14 | |
Net investment income2 | | | 0.10 | | | | 0.10 | | | | 0.12 | | | | 0.10 | | | | 0.08 | | | | 0.10 | | | | | | 0.08 | | | | 0.06 | | | | 0.08 | | | | 0.04 | | | | 0.05 | | | | 0.06 | |
Net realized and unrealized gain (loss) | | | 0.67 | | | | 2.72 | | | | (0.74 | ) | | | 1.16 | | | | (0.61 | ) | | | (2.77 | ) | | | | | 0.66 | | | | 2.68 | | | | (0.73 | ) | | | 1.17 | | | | (0.60 | ) | | | (2.72 | ) |
Net increase (decrease) from investment operations | | | 0.77 | | | | 2.82 | | | | (0.62 | ) | | | 1.26 | | | | (0.53 | ) | | | (2.67 | ) | | | | | 0.74 | | | | 2.74 | | | | (0.65 | ) | | | 1.21 | | | | (0.55 | ) | | | (2.66 | ) |
Dividends and distributions from: | | | | | | | | | | | | | | | | | | | | | | | | | | | | | | | | | | | | | | | | | | | | | | | | | | |
Net investment income | | | (0.14 | ) | | | (0.10 | )3 | | | (0.10 | )3 | | | (0.07 | )3 | | | (0.07 | )3 | | | — | | | | | | (0.08 | )3 | | | (0.07 | )3 | | | (0.05 | )3 | | | (0.05 | )3 | | | (0.06 | )3 | | | — | |
Tax return of capital | | | — | | | | — | | | | — | | | | — | | | | — | | | | (0.02 | )3 | | | | | — | | | | — | | | | — | | | | — | | | | — | | | | (0.02 | )3 |
Net realized gain | | | — | | | | — | | | | — | | | | — | | | | — | | | | (1.72 | )3 | | | | | — | | | | — | | | | — | | | | — | | | | — | | | | (1.68 | )3 |
Total dividends and distributions | | | (0.14 | ) | | | (0.10 | ) | | | (0.10 | ) | | | (0.07 | ) | | | (0.07 | ) | | | (1.74 | ) | | | | | (0.08 | ) | | | (0.07 | ) | | | (0.05 | ) | | | (0.05 | ) | | | (0.06 | ) | | | (1.70 | ) |
Net asset value, end of period | | $ | 13.16 | | | $ | 12.53 | | | $ | 9.81 | | | $ | 10.53 | | | $ | 9.34 | | | $ | 9.94 | | | | | | $ 12.96 | | | $ | 12.30 | | | $ | 9.63 | | | $ | 10.33 | | | $ | 9.17 | | | $ | 9.78 | |
| | | | | | | | | | | | | | | | | | | | | | | | | | | | | | | | | | | | | | | | | | | | | | | | | | |
Total Investment Return4 | | | | | | | | | | | | | | | | | |
Based on net asset value | | | 6.26% | 5 | | | 28.90% | | | | (6.03)%6 | | | | 13.56% | | | | (5.09)% | | | | (20.74)% | | | | | | 6.04% | 5 | | | 28.58% | | | | (6.38)% | 6 | | | 13.20% | | | | (5.36)% | | | | (20.95)% | |
| | | | | | | | | | | | | | | | | | | | | | | | | | | | | | | | | | | | | | | | | | | | | | | | | | |
Ratios to Average Net Assets | | | | | | | | | | | | | | | | | | | | | |
Total expenses | | | 1.20% | 7,8 | | | 1.13% | | | | 1.08% | | | | 1.13% | | | | 1.16% | | | | 1.10% | | | | | | 2.05% | 7,8 | | | 1.95% | | | | 1.49% | | | | 1.31% | | | | 1.32% | | | | 1.25% | |
Total expenses excluding recoupment of past waived fees | | | 1.20% | 7,8 | | | 1.13% | | | | 1.08% | | | | 1.13% | | | | 1.16% | | | | 1.10% | | | | | | 2.05% | 7,8 | | | 1.95% | | | | 1.49% | | | | 1.31% | | | | 1.32% | | | | 1.25% | |
Total expenses after fees waived,reimbursed and paid indirectly | | | 0.97% | 7,8 | | | 0.97% | | | | 0.97% | | | | 0.97% | | | | 0.95% | | | | 0.94% | | | | | | 1.29% | 7,8 | | | 1.29% | | | | 1.29% | | | | 1.27% | | | | 1.26% | | | | 1.23% | |
Net investment income | | | 1.61% | 7,8 | | | 0.89% | | | | 0.98% | | | | 0.99% | | | | 1.00% | | | | 0.82% | | | | | | 1.35% | 7,8 | | | 0.56% | | | | 0.65% | | | | 0.37% | | | | 0.69% | | | | 0.54% | |
| | | | | | | | | | | | | | | | | | | | | | | | | | | | | | | | | | | | | | | | | | | | | | | | | | |
Supplemental Data | | | | | | | | | | | | | | | | | |
Net assets, end of period (000) | | | $ 79,399 | | | $ | 142,963 | | | $ | 195,753 | | | $ | 204,286 | | | $ | 165,710 | | | $ | 141,900 | | | | | | $ 403 | | | $ | 674 | | | $ | 1,025 | | | $ | 737 | | | $ | 2,561 | | | $ | 2,431 | |
Portfolio turnover | | | 53% | | | | 156% | | | | 137% | | | | 123% | | | | 181% | | | | 117% | | | | | | 53% | | | | 156% | | | | 137% | | | | 123% | | | | 181% | | | | 117% | |
| | 1 | Consolidated Financial Highlights. |
| | 2 | Based on average shares outstanding. |
| | 3 | Dividends and distributions are determined in accordance with federal income tax regulations. |
| | 4 | Where applicable, total investment returns exclude the effects of any sales charges and include the reinvestment of dividends and distributions. |
| | 5 | Aggregate total investment return. |
| | 6 | Includes proceeds received from a settlement of litigation, which had no impact on the Fund’s total return. |
| | 7 | Ratios do not include expenses incurred indirectly as a result of investments in underlying funds of approximately 0.03%. |
| | | | | | |
See Notes to Financial Statements. | | | | |
| | | | | | | |
| | BLACKROCK FUNDS | | MARCH 31, 2013 | | 27 |
| | |
| | |
Financial Highlights (continued) | | BlackRock Flexible Equity Fund |
| | | | | | | | | | | | | | | | | | | | | | | | | | | | | | | | | | | | | | | | | | | | | | | | | | |
| | | Investor A | | | | | Investor B | |
| | | Six Months Ended March 31, 2013 (Unaudited)1 | | | | | | | | | | | | | | | | | | | | Six Months Ended March 31, 2013 (Unaudited)1 | | | | | | | | | | | | | | | | |
| | | | Year Ended September 30, | | | | | | Year Ended September 30, | |
| | | | 20121 | | | 2011 | | | 2010 | | | 2009 | | | 2008 | | | | | | 20121 | | | 2011 | | | 2010 | | | 2009 | | | 2008 | |
Per Share Operating Performance | | | | | | | | | | | | | | | | | | | | | | | | | | | | | | | |
Net asset value, beginning of period | | | $ 12.14 | | | $ | 9.50 | | | $ | 10.21 | | | $ | 9.06 | | | $ | 9.66 | | | $ | 14.00 | | | | | | $ 10.95 | | | $ | 8.58 | | | $ | 9.25 | | | $ | 8.23 | | | $ | 8.84 | | | $ | 12.92 | |
Net investment income (loss)2 | | | 0.08 | | | | 0.07 | | | | 0.08 | | | | 0.06 | | | | 0.05 | | | | 0.06 | | | | | | 0.03 | | | | (0.02 | ) | | | (0.01 | ) | | | (0.02 | ) | | | (0.00 | )3 | | | (0.02 | ) |
Net realized and unrealized gain (loss) | | | 0.64 | | | | 2.63 | | | | (0.72 | ) | | | 1.13 | | | | (0.59 | ) | | | (2.70 | ) | | | | | 0.59 | | | | 2.39 | | | | (0.65 | ) | | | 1.04 | | | | (0.56 | ) | | | (2.47 | ) |
Net increase (decrease) from investment operations | | | 0.72 | | | | 2.70 | | | | (0.64 | ) | | | 1.19 | | | | (0.54 | ) | | | (2.64 | ) | | | | | 0.62 | | | | 2.37 | | | | (0.66 | ) | | | 1.02 | | | | (0.56 | ) | | | (2.49 | ) |
Dividends and distributions from: | | | | | | | | | | | | | | | | | | | | | | | | | | | | | | | | | | | | | | | | | | | | | | | | | | |
Net investment income | | | (0.10 | ) | | | (0.06 | )4 | | | (0.07 | )4 | | | (0.04 | )4 | | | (0.06 | )4 | | | — | | | | | | (0.01 | )4 | | | — | | | | (0.01 | )4 | | | — | | | | (0.05 | )4 | | | — | |
Tax return of capital | | | — | | | | — | | | | — | | | | — | | | | — | | | | (0.02 | )4 | | | | | — | | | | — | | | | — | | | | — | | | | — | | | | (1.59 | )4 |
Net realized gain | | | — | | | | — | | | | — | | | | — | | | | — | | | | (1.68 | )4 | | | | | — | | | | — | | | | — | | | | — | | | | — | | | | — | |
Total dividends and distributions | | | (0.10 | ) | | | (0.06 | ) | | | (0.07 | ) | | | (0.04 | ) | | | (0.06 | ) | | | (1.70 | ) | | | | | (0.01 | ) | | | — | | | | (0.01 | ) | | | — | | | | (0.05 | ) | | | (1.59 | ) |
Net asset value, end of period | | | $ 12.76 | | | $ | 12.14 | | | $ | 9.50 | | | $ | 10.21 | | | $ | 9.06 | | | $ | 9.66 | | | | | | $ 11.56 | | | $ | 10.95 | | | $ | 8.58 | | | $ | 9.25 | | | $ | 8.23 | | | $ | 8.84 | |
| | | | | | | | | | | | | | | | | | | | | | | | | | | | | | | | | | | | | | | | | | | | | | | | | | |
Total Investment Return5 | | | | | | | | | | | | | | | | | | | | | | | | | | | | | | | |
Based on net asset value | | | 6.02% | 6 | | | 28.54% | | | | (6.33)% | 7 | | | 13.21% | | | | (5.32)% | | | | (21.04)% | | | | | | 5.65% | 6 | | | 27.62% | | | | (7.17)% | 7 | | | 12.39% | | | | (6.12)% | | | | (21.53)% | |
| | | | | | | | | | | | | | | | | | | | | | | | | | | | | | | | | | | | | | | | | | | | | | | | | | |
Ratios to Average Net Assets | | | | | | | | | | | | | | | | | | | | | |
Total expenses | | | 1.43% | 8,9 | | | 1.40% | | | | 1.37% | | | | 1.40% | | | | 1.51% | | | | 1.43% | | | | | | 2.40% | 8,9 | | | 2.31% | | | | 2.13% | | | | 2.22% | | | | 2.38% | | | | 2.24% | |
Total expenses excluding recoupment of past waived fees | | | 1.43% | 8,9 | | | 1.40% | | | | 1.37% | | | | 1.40% | | | | 1.51% | | | | 1.43% | | | | | | 2.39% | 8,9 | | | 2.30% | | | | 2.12% | | | | 2.20% | | | | 2.38% | | | | 2.24% | |
Total expenses after fees waived, reimbursed and paid indirectly | | | 1.29%8,9 | | | | 1.29% | | | | 1.29% | | | | 1.29% | | | | 1.26% | | | | 1.25% | | | | | | 2.06%8,9 | | | | 2.06% | | | | 2.06% | | | | 2.04% | | | | 2.02% | | | | 2.00% | |
Net investment income (loss) | | | 1.30%8,9 | | | | 0.60% | | | | 0.66% | | | | 0.61% | | | | 0.70% | | | | 0.53% | | | | | | 0.51%8,9 | | | | (0.19)% | | | | (0.10)% | | | | (0.24)% | | | | (0.04)% | | | | (0.21)% | |
| | | | | | | | | | | | | | | | | | | | | | | | | | | | | | | | | | | | | | | | | | | | | | | | | | |
Supplemental Data | | | | | | | | | | | | | | | | | | | | | | | | |
Net assets, end of period (000) | | | $533,107 | | | $ | 615,464 | | | $ | 587,989 | | | $ | 726,666 | | | $ | 395,763 | | | $ | 470,265 | | | | | | $ 14,494 | | | $ | 17,465 | | | $ | 26,233 | | | $ | 42,239 | | | $ | 41,196 | | | $ | 67,656 | |
Portfolio turnover | | | 53% | | | | 156% | | | | 137% | | | | 123% | | | | 181% | | | | 117% | | | | | | 53% | | | | 156% | | | | 137% | | | | 123% | | | | 181% | | | | 117% | |
| | 1 | Consolidated Financial Highlights. |
| | 2 | Based on average shares outstanding. |
| | 3 | Amount is greater than $(0.005) per share. |
| | 4 | Dividends and distributions are determined in accordance with federal income tax regulations. |
| | 5 | Where applicable, total investment returns exclude the effects of any sales charges and include the reinvestment of dividends and distributions. |
| | 6 | Aggregate total investment return. |
| | 7 | Includes proceeds received from a settlement of litigation, which had no impact on the Fund’s total return. |
| | 8 | Ratios do not include expenses incurred indirectly as a result of investments in underlying funds of approximately 0.03%. |
| | | | | | |
See Notes to Financial Statements. | | | | |
| | | | | | | |
| 28 | | BLACKROCK FUNDS | | MARCH 31, 2013 | | |
| | |
| | |
Financial Highlights (concluded) | | BlackRock Flexible Equity Fund |
| | | | | | | | | | | | | | | | | | | | | | | | | | | | | | | | | | | | | | | | | | |
| | | Investor C | | | | | Class R | |
| | | Six Months Ended
March 31,
2013 (Unaudited)1 | | | Year Ended September 30, | | | | | Six Months Ended
March 31,
2013 (Unaudited)1 | | | Year Ended September 30, | | | Period July 30, 20102 to September 30, 2010 | |
| | | | 20121 | | | 2011 | | | 2010 | | | 2009 | | | 2008 | | | | | 20121 | | | 2011 | | |
| |
Per Share Operating Performance | | | | | | | | | | | | | | | | | | | | | | | | | | | | | | | | | | | |
Net asset value, beginning of period | | $ | 10.91 | | | $ | 8.55 | | | $ | 9.22 | | | $ | 8.20 $ | | | | 8.81 | | | $ | 12.90 | | | | | $ | 12.46 | | | $ | 9.75 | | | $ | 10.51 | | | | $ 10.24 | |
Net investment income (loss)3 | | | 0.03 | | | | (0.02 | ) | | | (0.01 | ) | | | (0.01 | ) | | | (0.00 | )4 | | | (0.02 | ) | | | | | 0.06 | | | | 0.03 | | | | 0.04 | | | | 0.00 | 5 |
Net realized and unrealized gain (loss) | | | 0.58 | | | | 2.38 | | | | (0.64 | ) | | | 1.03 | | | | (0.56 | ) | | | (2.47 | ) | | | | | 0.66 | | | | 2.71 | | | | (0.73 | ) | | | 0.27 | |
Net increase (decrease) from investment operations | | | 0.61 | | | | 2.36 | | | | (0.65 | ) | | | 1.02 | | | | (0.56 | ) | | | (2.49 | ) | | | | | 0.72 | | | | 2.74 | | | | (0.69 | ) | | | 0.27 | |
Dividends and distributions from: | | | | | | | | | | | | | | | | | | | | | | | | | | | | | | | | | | | | | | | | | | |
Net investment income | | | (0.02 | ) | | | — | | | | (0.02 | )6 | | | — | | | | (0.05 | )6 | | | — | | | | | | (0.07 | ) | | | (0.03 | )6 | | | (0.07 | )6 | | | — | |
Net realized gain | | | — | | | | — | | | | — | | | | — | | | | — | | | | (1.60 | )6 | | | | | — | | | | — | | | | — | | | | — | |
Total dividends and distributions | | | (0.02 | ) | | | — | | | | (0.02 | ) | | | — | | | | (0.05 | ) | | | (1.60 | ) | | | | | (0.07 | ) | | | (0.03 | ) | | | (0.07 | ) | | | — | |
Net asset value, end of period | | $ | 11.50 | | | $ | 10.91 | | | $ | 8.55 | | | $ | 9.22 | | | $ | 8.20 | | | $ | 8.81 | | | | | $ | 13.11 | | | $ | 12.46 | | | $ | 9.75 | | | | $ 10.51 | |
| | | | | | | | | | | | | | | | | | | | | | | | | | | | | | | | | | | | | | | | | | |
Total Investment Return7 | | | | | | | | | | | | | | | | | | | | | | | | | | | | | | | | | | | | | | | |
Based on net asset value | | | 5.59% | 8 | | | 27.60% | | | | (7.11)% | 9 | | | 12.44% | | | | (6.14)% | | | | (21.56)% | | | | | | 5.81% | 8 | | | 28.13 | % | | | (6.66)% | 9 | | | 13.17% | 8 |
| | | | | | | | | | | | | | | | | | | | | | | | | | | | | | | | | | | | | | | | | | |
Ratios to Average Net Assets | | | | | | | | | | | | | | | | | | | | | | | | | | | | | | | | | | | | | | | |
Total expenses | | | 2.21% | 10,11 | | | 2.18% | | | | 2.16% | | | | 2.22% | | | | 2.39% | | | | 2.20% | | | | | | 1.75% | 10,11 | | | 1.78 | % | | | 1.72 | % | | | 2.21% | 11 |
Total expenses excluding recoupment of past waived fees | | | 2.21% | 10,11 | | | 2.18% | | | | 2.16% | | | | 2.22% | | | | 2.39% | | | | 2.20% | | | | | | 1.75% | 10,11 | | | 1.78 | % | | | 1.70 | % | | | 2.21% | 11 |
Total expenses after fees waived, reimbursed and paid indirectly | | | 2.06% | 10,11 | | | 2.06% | | | | 2.06% | | | | 2.06% | | | | 2.02% | | | | 2.00% | | | | | | 1.65% | 10,11 | | | 1.65 | % | | | 1.65 | % | | | 1.65% | 11 |
Net investment income (loss) | | | 0.53% | 10,11 | | | (0.18)% | | | | (0.11)% | | | | (0.17)% | | | | (0.06)% | | | | (0.22)% | | | | | | 0.93% | 10,11 | | | 0.25 | % | | | 0.31 | % | | | 0.08% | 11 |
| | | | | | | | | | | | | | | | | | | | | | | | | | | | | | | | | | | | | | | | | | |
Supplemental Data | | | | | | | | | | | | | | | | | | | | | | | | | | | | | | | | | | | | | | | | | | |
Net assets, end of period (000) | | $ | 106,954 | | | $ | 115,242 | | | $ | 112,520 | | | $ | 148,923 | | | $ | 92,141 | | | $ | 118,186 | | | | | $ | 1,331 | | | $ | 1,312 | | | $ | 920 | | | | $ 838 | |
Portfolio turnover | | | 53% | | | | 156% | | | | 137% | | | | 123% | | | | 181% | | | | 117% | | | | | | 53% | | | | 156% | | | | 137% | | | | 123% | |
| | 1 | Consolidated Financial Highlights. |
| | 2 | Commencement of operations. |
| | 3 | Based on average shares outstanding. |
| | 4 | Amount is greater than $(0.005) per share. |
| | 5 | Amount is less than $0.005 per share. |
| | 6 | Dividends and distributions are determined in accordance with federal income tax regulations. |
| | 7 | Where applicable, total investment returns exclude the effects of any sales charges and include the reinvestment of dividends and distributions. |
| | 8 | Aggregate total investment return. |
| | 9 | Includes proceeds received from a settlement of litigation, which had no impact on the Fund’s total return. |
| | 10 | Ratios do not include expenses incurred indirectly as a result of investments in underlying funds of approximately 0.03%. |
| | | | | | |
See Notes to Financial Statements. | | | | |
| | | | | | | |
| | BLACKROCK FUNDS | | MARCH 31, 2013 | | 29 |
| | |
| | |
Financial Highlights | | BlackRock Mid-Cap Growth Equity Portfolio |
| | | | | | | | | | | | | | | | | | | | | | | | | | | | | | | | | | | | | | | | | | | | | | | | | | |
| | | Institutional | | | | | Service | |
| | | Six Months Ended March 31, 2013 (Unaudited) | | | | | | | | | | | | | | | | | | | | Six Months Ended March 31, 2013 (Unaudited) | | | | | | | | | | | | | | | | |
| | | | | | | | | | | | | | | | | | | | | | | | | | | | | | | | | | | |
| | | | Year Ended September 30, | | | | | | Year Ended September 30, | |
| | | | | | | | | | | | | | | | | | | | | | | | | | | | | | | | | | | |
| | | | 2012 | | | 2011 | | | 2010 | | | 2009 | | | 2008 | | | | | | 2012 | | | 2011 | | | 2010 | | | 2009 | | | 2008 | |
Per Share Operating Performance | | | | | | | | | | | | | | | | | | | | | | | | | | | | | | | | | | | | | | | | | | | |
Net asset value, beginning of period | | $ | 13.58 | | | $ | 11.10 | | | $ | 11.18 | | | $ | 10.27 | | | $ | 10.33 | | | $ | 13.49 | | | | | $ | 12.77 | | | $ | 10.49 | | | $ | 10.60 | | | $ | 9.78 | | | $ | 9.87 | | | $ | 12.92 | |
Net investment income (loss)1 | | | 0.08 | | | | 0.04 | | | | (0.05 | ) | | | (0.01 | ) | | | (0.04 | ) | | | (0.04 | ) | | | | | 0.04 | | | | (0.01 | ) | | | (0.10 | ) | | | (0.05 | ) | | | (0.06 | ) | | | (0.07 | ) |
Net realized and unrealized gain (loss) | | | 1.50 | | | | 2.44 | | | | (0.03 | ) | | | 0.92 | | | | (0.02 | ) | | | (3.12 | ) | | | | | 1.41 | | | | 2.29 | | | | (0.01 | ) | | | 0.87 | | | | (0.03 | ) | | | (2.98 | ) |
Net increase (decrease) from investment operations | | | 1.58 | | | | 2.48 | | | | (0.08 | ) | | | 0.91 | | | | (0.06 | ) | | | (3.16 | ) | | | | | 1.45 | | | | 2.28 | | | | (0.11 | ) | | | 0.82 | | | | (0.09 | ) | | | (3.05 | ) |
Net asset value, end of period | | $ | 15.16 | | | $ | 13.58 | | | $ | 11.10 | | | $ | 11.18 | | | $ | 10.27 | | | $ | 10.33 | | | | | $ | 14.22 | | | $ | 12.77 | | | $ | 10.49 | | | $ | 10.60 | | | $ | 9.78 | | | $ | 9.87 | |
| | | | | | | | | | | | | | | | | | | | | | | | | | | | | | | | | | | | | | | | | | | | | | | | | | |
Total Investment Return2 | | | | | | | | | | | | | | | | | | | | | | | | | | | | | | | | | | | | | | | | | | | | | | | | | | |
Based on net asset value | | | 11.64% | 3 | | | 22.34% | | | | (0.72)% | 4 | | | 8.86% | 5 | | | (0.58)% | 6 | | | (23.43)% | | | | | | 11.36% | 3 | | | 21.74% | | | | (1.04)% | 7 | | | 8.38% | 8 | | | (0.91)% | 9 | | | (23.61)% | |
| | | | | | | | | | | | | | | | | | | | | | | | | | | | | | | | | | | | | | | | | | | | | | | | | | |
Ratios to Average Net Assets | | | | | | | | | | | | | | | | | | | | | | | | | | | | | | | | | | | | | | | | | | | | | | | | | | |
Total expenses | | | 1.13% | 10 | | | 1.11% | | | | 1.17% | | | | 1.15% | | | | 1.20% | | | | 1.07% | | | | | | 1.76% | 10 | | | 2.29% | | | | 1.87% | | | | 1.63% | | | | 1.65% | | | | 1.29% | |
Total expenses excluding recoupment of past waived fees | | | 1.12% | 10 | | | 1.11% | | | | 1.17% | | | | 1.14% | | | | 1.20% | | | | 1.07% | | | | | | 1.67% | 10 | | | 2.29% | | | | 1.87% | | | | 1.62% | | | | 1.64% | | | | 1.29% | |
Total expenses after fees waived, reimbursed and paid indirectly | | | 1.11% | 10 | | | 1.07% | | | | 1.17% | | | | 1.15% | | | | 1.18% | | | | 1.06% | | | | | | 1.58% | 10 | | | 1.58% | | | | 1.58% | | | | 1.58% | | | | 1.51% | | | | 1.28% | |
Net investment income (loss) | | | 1.12% | 10 | | | 0.27% | | | | (0.38)% | | | | (0.09)% | | | | (0.44)% | | | | (0.33)% | | | | | | 0.65% | 10 | | | (0.06)% | | | | (0.83)% | | | | (0.52)% | | | | (0.76)% | | | | (0.56)% | |
| | | | | | | | | | | | | | | | | | | | | | | | | | | | | | | | | | | | | | | | | | | | | | | | | | |
Supplemental Data | | | | | | | | | | | | | | | | | | | | | | | | | | | | | | | | | | | | | | | | | | | | | | | | | | |
Net assets, end of period (000) | | $ | 17,647 | | | $ | 18,526 | | | $ | 19,348 | | | $ | 24,421 | | | $ | 25,572 | | | $ | 26,468 | | | | | $ | 2,030 | | | $ | 1,865 | | | $ | 714 | | | $ | 330 | | | $ | 360 | | | $ | 459 | |
Portfolio turnover | | | 76% | | | | 88% | | | | 131% | | | | 76% | | | | 53% | | | | 45% | | | | | | 76% | | | | 88% | | | | 131% | | | | 76% | | | | 53% | | | | 45% | |
| | 1 | Based on average shares outstanding. |
| | 2 | Where applicable, total investment returns exclude the effects of any sales charges and include the reinvestment of dividends and distributions. |
| | 3 | Aggregate total investment return. |
| | 4 | Includes proceeds received from a settlement of litigation, which impacted the Fund’s total return. Excluding these proceeds, the Fund’s total return would have been (0.90)%. |
| | 5 | Includes proceeds received from a settlement of litigation, which impacted the Fund’s total return. Excluding these proceeds, the Fund’s total return would have been 8.47%. |
| | 6 | Includes proceeds received from a settlement of litigation, which impacted the Fund’s total return. Excluding these proceeds, the Fund’s total return would have been (0.87)%. |
| | 7 | Includes proceeds received from a settlement of litigation, which impacted the Fund’s total return. Excluding these proceeds, the Fund’s total return would have been (1.23)%. |
| | 8 | Includes proceeds received from a settlement of litigation, which impacted the Fund’s total return. Excluding these proceeds, the Fund’s total return would have been 7.98%. |
| | 9 | Includes proceeds received from a settlement of litigation, which impacted the Fund’s total return. Excluding these proceeds, the Fund’s total return would have been (1.22)%. |
| | | | | | |
See Notes to Financial Statements. | | | | |
| | | | | | | |
| 30 | | BLACKROCK FUNDS | | MARCH 31, 2013 | | |
| | |
| | |
Financial Highlights (continued) | | BlackRock Mid-Cap Growth Equity Portfolio |
| | | | | | | | | | | | | | | | | | | | | | | | | | | | | | | | | | | | | | | | | | | | | | | | | | |
| | | Investor A | | | | | Investor B | |
| | | Six Months Ended March 31, 2013 (Unaudited) | | | | | | | | | | | | | | | | | | | | Six Months Ended March 31, 2013 (Unaudited) | | | | | | | | | | | | | | | | |
| | | | | | | | | | | | | | | | | | | | | | | | | | | | | | | | | | | |
| | | | Year Ended September 30, | | | | | | Year Ended September 30, | |
| | | | | | | | | | | | | | | | | | | | | | | | | | | | | | | | | | | |
| | | | 2012 | | | 2011 | | | 2010 | | | 2009 | | | 2008 | | | | | | 2012 | | | 2011 | | | 2010 | | | 2009 | | | 2008 | |
Per Share Operating Performance | | | | | | | | | | | | | | | | | | | | | | | | | | | | | | | | | | | | | | | | | | | |
Net asset value, beginning of period | | $ | 12.38 | | | $ | 10.15 | | | $ | 10.27 | | | $ | 9.47 | | | $ | 9.56 | | | $ | 12.55 | | | | | $ | 10.75 | | | $ | 8.88 | | | $ | 9.05 | | | $ | 8.42 | | | $ | 8.56 | | | $ | 11.32 | |
Net investment income (loss)1 | | | 0.05 | | | | (0.01 | ) | | | (0.09 | ) | | | (0.05 | ) | | | (0.06 | ) | | | (0.10 | ) | | | | | 0.01 | | | | (0.09 | ) | | | (0.16 | ) | | | (0.12 | ) | | | (0.10 | ) | | | (0.17 | ) |
Net realized and unrealized gain (loss) | | | 1.37 | | | | 2.24 | | | | (0.03 | ) | | | 0.85 | | | | (0.03 | ) | | | (2.89 | ) | | | | | 1.18 | | | | 1.96 | | | | (0.01 | ) | | | 0.75 | | | | (0.04 | ) | | | (2.59 | ) |
Net increase (decrease) from investment operations | | | 1.42 | | | | 2.23 | | | | (0.12 | ) | | | 0.80 | | | | (0.09 | ) | | | (2.99 | ) | | | | | 1.19 | | | | 1.87 | | | | (0.17 | ) | | | 0.63 | | | | (0.14 | ) | | | (2.76 | ) |
Net asset value, end of period | | $ | 13.80 | | | $ | 12.38 | | | $ | 10.15 | | | $ | 10.27 | | | $ | 9.47 | | | $ | 9.56 | | | | | $ | 11.94 | | | $ | 10.75 | | | $ | 8.88 | | | $ | 9.05 | | | $ | 8.42 | | | $ | 8.56 | |
| | | | | | | | | | | | | | | | | | | | | | | | | | | | | | | | | | | | | | | | | | | | | | | | | | |
Total Investment Return2 | | | | | | | | | | | | | | | | | | | | | | | | | | | | | | | | | | | | | | | | | | | |
Based on net asset value | | | 11.47% | 3 | | | 21.97% | | | | (1.17)% | 4 | | | 8.45% | 5 | | | (0.94)% | 6 | | | (23.83)% | | | | | | 11.07% | 3 | | | 21.06% | | | | (1.88)% | 7 | | | 7.48% | 8 | | | (1.64)% | 9 | | | (24.38)% | |
| | | | | | | | | | | | | | | | | | | | | | | | | | | | | | | | | | | | | | | | | | | | | | | | | | |
Ratios to Average Net Assets | | | | | | | | | | | | | | | | | | | | | | | | | | | | | | | | | | | | | | | | | | | |
Total expenses | | | 1.54% | 10 | | | 1.55% | | | | 1.59% | | | | 1.58% | | | | 1.76% | | | | 1.53% | | | | | | 2.65% | 10 | | | 2.59% | | | | 2.43% | | | | 2.48% | | | | 2.73% | | | | 2.45% | |
Total expenses excluding recoupment of past waived fees | | | 1.54% | 10 | | | 1.55% | | | | 1.56% | | | | 1.55% | | | | 1.72% | | | | 1.53% | | | | | | 2.65% | 10 | | | 2.59% | | | | 2.42% | | | | 2.47% | | | | 2.64% | | | | 2.45% | |
Total expenses after fees waived, reimbursed and paid indirectly | | | 1.39% | 10 | | | 1.39% | | | | 1.58% | | | | 1.58% | | | | 1.59% | | | | 1.53% | | | | | | 2.16% | 10 | | | 2.16% | | | | 2.39% | | | | 2.38% | | | | 2.34% | | | | 2.31% | |
Net investment income (loss) | | | 0.85% | 10 | | | (0.06)% | | | | (0.79)% | | | | (0.51)% | | | | (0.85)% | | | | (0.81)% | | | | | | 0.11% | 10 | | | (0.88)% | | | | (1.58)% | | | | (1.36)% | | | | (1.57)% | | | | (1.58)% | |
| | | | | | | | | | | | | | | | | | | | | | | | | | | | | | | | | | | | | | | | | | | | | | | | | | |
Supplemental Data | | | | | | | | | | | | | | | | | | | | | | | | | | | | | | | | | | | | | | | | | | | |
Net assets, end of period (000) | | $ | 246,630 | | | $ | 237,748 | | | $ | 232,924 | | | $ | 180,501 | | | $ | 181,159 | | | $ | 195,980 | | | | | $ | 4,584 | | | $ | 5,123 | | | $ | 7,596 | | | $ | 8,209 | | | $ | 11,978 | | | $ | 19,565 | |
Portfolio turnover | | | 76% | | | | 88% | | | | 131% | | | | 76% | | | | 53% | | | | 45% | | | | | | 76% | | | | 88% | | | | 131% | | | | 76% | | | | 53% | | | | 45% | |
| | 1 | Based on average shares outstanding. |
| | 2 | Where applicable, total investment returns exclude the effects of any sales charges and include the reinvestment of dividends and distributions. |
| | 3 | Aggregate total investment return. |
| | 4 | Includes proceeds received from a settlement of litigation, which impacted the Fund’s total return. Excluding these proceeds, the Fund’s total return would have been (1.36)%. |
| | 5 | Includes proceeds received from a settlement of litigation, which impacted the Fund’s total return. Excluding these proceeds, the Fund’s total return would have been 8.03%. |
| | 6 | Includes proceeds received from a settlement of litigation, which impacted the Fund’s total return. Excluding these proceeds, the Fund’s total return would have been (1.26)%. |
| | 7 | Includes proceeds received from a settlement of litigation, which impacted the Fund’s total return. Excluding these proceeds, the Fund’s total return would have been (2.10)%. |
| | 8 | Includes proceeds received from a settlement of litigation, which impacted the Fund’s total return. Excluding these proceeds, the Fund’s total return would have been 7.01%. |
| | 9 | Includes proceeds received from a settlement of litigation, which impacted the Fund’s total return. Excluding these proceeds, the Fund’s total return would have been (1.99)%. |
| | | | | | |
See Notes to Financial Statements. | | | | |
| | | | | | | |
| | BLACKROCK FUNDS | | MARCH 31, 2013 | | 31 |
| | |
| | |
Financial Highlights (concluded) | | BlackRock Mid-Cap Growth Equity Portfolio |
| | | | | | | | | | | | | | | | | | | | | | | | | | | | | | | | | | | | | | | | | | | | | | | | | | |
| | | Investor C | | | | | Class R | |
| | | Six Months
Ended
March 31,
2013 | | | Year Ended September 30, | | | | | Six Months
Ended
March 31, 2013 | | | Year Ended September 30, | |
| | | (Unaudited) | | | 2012 | | | 2011 | | | 2010 | | | 2009 | | | 2008 | | | | (Unaudited) | | | 2012 | | | 2011 | | | 2010 | | | 2009 | | | 2008 | |
Per Share Operating Performance | |
Net asset value, beginning of period | | $ | 10.75 | | | $ | 8.89 | | | $ | 9.05 | | | $ | 8.41 | | | $ | 8.56 | | | $ | 11.32 | | | | | $ | 12.32 | | | $ | 10.13 | | | $ | 10.25 | | | $ | 9.46 | | | $ | 9.56 | | | $ | 12.55 | |
Net investment income (loss)1 | | | 0.00 | 2 | | | (0.08 | ) | | | (0.16 | ) | | | (0.11 | ) | | | (0.11 | ) | | | (0.16 | ) | | | | | 0.04 | | | | (0.03 | ) | | | (0.10 | ) | | | (0.04 | ) | | | (0.07 | ) | | | (0.10 | ) |
Net realized and unrealized gain (loss) | | | 1.19 | | | | 1.94 | | | | (0.00 | )3 | | | 0.75 | | | | (0.04 | ) | | | (2.60 | ) | | | | | 1.36 | | | | 2.22 | | | | (0.02 | ) | | | 0.83 | | | | (0.03 | ) | | | (2.89 | ) |
Net increase (decrease) from investment operations | | | 1.19 | | | | 1.86 | | | | (0.16 | ) | | | 0.64 | | | | (0.15 | ) | | | (2.76 | ) | | | | | 1.40 | | | | 2.19 | | | | (0.12 | ) | | | 0.79 | | | | (0.10 | ) | | | (2.99 | ) |
Net asset value, end of period | | $ | 11.94 | | | $ | 10.75 | | | $ | 8.89 | | | $ | 9.05 | | | $ | 8.41 | | | $ | 8.56 | | | | | $ | 13.72 | | | $ | 12.32 | | | $ | 10.13 | | | $ | 10.25 | | | $ | 9.46 | | | $ | 9.56 | |
| | | | | | | | | | | | | | | | | | | | | | | | | | | | | | | | | | | | | | | | | | | | | | | | | | |
Total Investment Return4 | |
Based on net asset value | | | 11.07% | 5 | | | 20.92% | | | | (1.77)% | 6 | | | 7.61% | 7 | | | (1.75)%8 | | | | (24.38)% | | | | | | 11.36% | 5 | | | 21.62% | | | | (1.17)% | 9 | | | 8.35% | 10 | | | (1.05)% | 11 | | | (23.83)% | |
| | | | | | | | | | | | | | | | | | | | | | | | | | | | | | | | | | | | | | | | | | | | | | | | | | |
Ratios to Average Net Assets | |
Total expenses | | | 2.26% | 12 | | | 2.31% | | | | 2.34% | | | | 2.33% | | | | 2.46% | | | | 2.25% | | | | | | 1.80% | 12 | | | 1.84% | | | | 1.91% | | | | 1.97% | | | | 2.04% | | | | 1.73% | |
Total expenses excluding recoupment of past waived fees | | | 2.26% | 12 | | | 2.31% | | | | 2.31% | | | | 2.30% | | | | 2.44% | | | | 2.25% | | | | | | 1.80% | 12 | | | 1.84% | | | | 1.91% | | | | 1.97% | | | | 2.04% | | | | 1.73% | |
Total expenses after fees waived, reimbursed and paid indirectly | | | 2.16% | 12 | | | 2.16% | | | | 2.33% | | | | 2.33% | | | | 2.34% | | | | 2.25% | | | | | | 1.65% | 12 | | | 1.65% | | | | 1.65% | | | | 1.65% | | | | 1.63% | | | | 1.58% | |
Net investment income (loss) | | | 0.09% | 12 | | | (0.81)% | | | | (1.54)% | | | | (1.26)% | | | | (1.59)% | | | | (1.53)% | | | | | | 0.60% | 12 | | | (0.28)% | | | | (0.84)% | | | | (0.44)% | | | | (0.89)% | | | | (0.82)% | |
| | | | | | | | | | | | | | | | | | | | | | | | | | | | | | | | | | | | | | | | | | | | | | | | | | |
Supplemental Data | |
Net assets, end of period (000) | | $ | 19,679 | | | $ | 18,774 | | | $ | 16,615 | | | $ | 12,578 | | | $ | 12,418 | | | $ | 13,964 | | | | | $ | 7,111 | | | $ | 6,663 | | | $ | 5,227 | | | $ | 4,138 | | | $ | 2,323 | | | $ | 723 | |
Portfolio turnover | | | 76% | | | | 88% | | | | 131% | | | | 76% | | | | 53% | | | | 45% | | | | | | 76% | | | | 88% | | | | 131% | | | | 76% | | | | 53% | | | | 45% | |
| | 1 | Based on average shares outstanding. |
| | 2 | Amount is less than $0.005 per share. |
| | 3 | Amount is greater than $(0.005) per share. |
| | 4 | Where applicable, total investment returns exclude the effects of any sales charges and include the reinvestment of dividends and distributions. |
| | 5 | Aggregate total investment return. |
| | 6 | Includes proceeds received from a settlement of litigation, which impacted the Fund’s total return. Excluding these proceeds, the Fund’s total return would have been (1.99)%. |
| | 7 | Includes proceeds received from a settlement of litigation, which impacted the Fund’s total return. Excluding these proceeds, the Fund’s total return would have been 7.13%. |
| | 8 | Includes proceeds received from a settlement of litigation, which impacted the Fund’s total return. Excluding these proceeds, the Fund’s total return would have been (2.10)%. |
| | 9 | Includes proceeds received from a settlement of litigation, which impacted the Fund’s total return. Excluding these proceeds, the Fund’s total return would have been (1.37)%. |
| | 10 | Includes proceeds received from a settlement of litigation, which impacted the Fund’s total return. Excluding these proceeds, the Fund’s total return would have been 7.93%. |
| | 11 | Includes proceeds received from a settlement of litigation, which impacted the Fund’s total return. Excluding these proceeds, the Fund’s total return would have been (1.36)%. |
| | | | | | |
See Notes to Financial Statements. | | | | |
| | | | | | | |
| 32 | | BLACKROCK FUNDS | | MARCH 31, 2013 | | |
| | |
| | |
Financial Highlights | | BlackRock Small Cap Growth Equity Portfolio |
| | | | | | | | | | | | | | | | | | | | | | | | | | | | | | | | | | | | | | | | | | | | | | | | | | |
| | | Institutional | | | | | Service | |
| | | Six Months
Ended
March 31,
2013 | | | Year Ended September 30, | | | | | Six Months
Ended
March 31,
2013 | | | Year Ended September 30, | |
| | | (Unaudited) | | | 2012 | | | 2011 | | | 2010 | | | 2009 | | | 2008 | | | | | (Unaudited) | | | 2012 | | | 2011 | | | 2010 | | | 2009 | | | 2008 | |
Per Share Operating Performance | |
Net asset value, beginning of period | | $ | 26.67 | | | $ | 20.09 | | | $ | 20.42 | | | $ | 18.66 | | | $ | 20.33 | | | $ | 23.71 | | | | | $ | 25.01 | | | $ | 18.93 | | | $ | 19.29 | | | $ | 17.67 | | | $ | 19.30 | | | $ | 22.58 | |
Net investment income (loss)1 | | | (0.02 | ) | | | 0.04 | | | | (0.13 | ) | | | (0.12 | ) | | | (0.07 | ) | | | 0.03 | | | | | | (0.05 | ) | | | (0.04 | ) | | | (0.18 | ) | | | (0.16 | ) | | | (0.10 | ) | | | (0.03 | ) |
Net realized and unrealized gain (loss) | | | 2.62 | | | | 7.14 | | | | (0.20 | )2 | | | 1.88 | 2 | | | (1.60 | )2 | | | (3.41 | )2 | | | | | 2.43 | | | | 6.72 | | | | (0.18 | )2 | | | 1.78 | 2 | | | (1.53 | )2 | | | (3.25 | )2 |
Net increase (decrease) from investment operations | | | 2.60 | | | | 7.18 | | | | (0.33 | ) | | | 1.76 | | | | (1.67 | ) | | | (3.38 | ) | | | | | 2.38 | | | | 6.68 | | | | (0.36 | ) | | | 1.62 | | | | (1.63 | ) | | | (3.28 | ) |
Dividends and distributions from: | | | | | | | | | | | | | | | | | | | | | | | | | | | | | | | | | | | | | | | | | | | | | | | | | | |
Net investment income | | | (0.07 | ) | | | — | | | | — | | | | — | | | | — | | | | — | | | | | | — | | | | — | | | | — | | | | — | | | | — | | | | — | |
Net realized gain | | | (2.65 | ) | | | (0.60 | )3 | | | — | | | | — | | | | — | | | | — | | | | | | (2.63 | ) | | | (0.60 | )3 | | | — | | | | — | | | | — | | | | — | |
Total dividends and distributions | | | (2.72 | ) | | | (0.60 | ) | | | — | | | | — | | | | — | | | | — | | | | | | (2.63 | ) | | | (0.60 | ) | | | — | | | | — | | | | — | | | | — | |
Net asset value, end of period | | $ | 26.55 | | | $ | 26.67 | | | $ | 20.09 | | | $ | 20.42 | | | $ | 18.66 | | | $ | 20.33 | | | | | $ | 24.76 | | | $ | 25.01 | | | $ | 18.93 | | | $ | 19.29 | | | $ | 17.67 | | | $ | 19.30 | |
| | | | | | | | | | | | | | | | | | | | | | | | | | | | | | | | | | | | | | | | | | | | | | | | | | |
Total Investment Return4 | |
Based on net asset value | | | 11.46% | 5 | | | 36.16% | | | | (1.62)% | 6,7 | | | 9.43% | 7 | | | (8.22)% | 7,8 | | | (14.26)% | 7 | | | | | 11.25% | 5 | | | 35.72% | | | | (1.87)% | 6,7 | | | 9.17% | 7 | | | (8.45)% | 7,9 | | | (14.53)% | 7 |
| | | | | | | | | | | | | | | | | | | | | | | | | | | | | | | | | | | | | | | | | | | | | | | | | | |
Ratios to Average Net Assets | |
Total expenses | | | 0.81% | 10 | | | 0.82% | | | | 0.80% | | | | 0.83% | | | | 0.88% | | | | 0.77% | | | | | | 1.13% | 10 | | | 1.20% | | | | 1.07% | | | | 1.10% | | | | 1.15% | | | | 1.07% | |
Total expenses excluding recoupment of past waived fees | | | 0.81% | 10 | | | 0.82% | | | | 0.80% | | | | 0.83% | | | | 0.88% | | | | 0.77% | | | | | | 1.13% | 10 | | | 1.20% | | | | 1.07% | | | | 1.10% | | | | 1.14% | | | | 1.07% | |
Total expenses after fees waived, reimbursed and paid indirectly | | | 0.81% | 10 | | | 0.82% | | | | 0.80% | | | | 0.83% | | | | 0.88% | | | | 0.77% | | | | | | 1.12% | 10 | | | 1.17% | | | | 1.07% | | | | 1.10% | | | | 1.11% | | | | 1.07% | |
Net investment income (loss) | | | (0.17)% | 10 | | | 0.15% | | | | (0.55)% | | | | (0.59)% | | | | (0.48)% | | | | 0.15% | | | | | | (0.46)% | 10 | | | (0.15)% | | | | (0.81)% | | | | (0.86)% | | | | (0.70)% | | | | (0.14)% | |
| | | | | | | | | | | | | | | | | | | | | | | | | | | | | | | | | | | | | | | | | | | | | | | | | | |
Supplemental Data | |
Net assets, end of period (000) | | $ | 1,016,815 | | | $ | 979,582 | | | $ | 931,857 | | | $ | 806,461 | | | $ | 855,375 | | | $ | 699,761 | | | | | $ | 31,185 | | | $ | 29,281 | | | $ | 23,683 | | | $ | 47,917 | | | $ | 43,932 | | | $ | 40,514 | |
Portfolio turnover | | | 57% | | | | 147% | | | | 141% | | | | 128% | | | | 82% | | | | 81% | | | | | | 57% | | | | 147% | | | | 141% | | | | 128% | | | | 82% | | | | 81% | |
| | 1 | Based on average shares outstanding. |
| | 2 | Includes redemption fees, which are less than $0.005 per share. |
| | 3 | Dividends and distributions are determined in accordance with federal income tax regulations. |
| | 4 | Where applicable, total investment returns exclude the effects of any sales charges and include the reinvestment of dividends and distributions. |
| | 5 | Aggregate total investment return. |
| | 6 | Includes proceeds received from a settlement of litigation, which had no impact on the Fund’s total return. |
| | 7 | Redemption fee of 2.00% is reflected in total return calculations. There was no impact to the return. |
| | 8 | Includes proceeds received from a settlement of litigation, which impacted the Fund’s total return. Excluding these proceeds, the Fund’s total return would have been (8.26)%. |
| | 9 | Includes proceeds received from a settlement of litigation, which impacted the Fund’s total return. Excluding these proceeds, the Fund’s total return would have been (8.50)%. |
| | | | | | |
See Notes to Financial Statements. | | | | |
| | | | | | | |
| | BLACKROCK FUNDS | | MARCH 31, 2013 | | 33 |
| | |
| | |
Financial Highlights (continued) | | BlackRock Small Cap Growth Equity Portfolio |
| | | | | | | | | | | | | | | | | | | | | | | | | | | | | | | | | | | | | | | | | | | | | | | | | | |
| | | Investor A | | | | | Investor B | |
| | | Six Months
Ended
March 31,
2013 | | | Year Ended September 30, | | | | | Six Months
Ended
March 31,
2013 | | | Year Ended September 30, | |
| | | (Unaudited) | | | 2012 | | | 2011 | | | 2010 | | | 2009 | | | 2008 | | | | | (Unaudited) | | | 2012 | | | 2011 | | | 2010 | | | 2009 | | | 2008 | |
Per Share Operating Performance | |
Net asset value, beginning of period | | $ | 24.17 | | | $ | 18.31 | | | $ | 18.69 | | | $ | 17.14 | | | $ | 18.76 | | | $ | 21.97 | | | | | $ | 20.50 | | | $ | 15.75 | | | $ | 16.20 | | | $ | 15.00 | | | $ | 16.56 | | | $ | 19.57 | |
Net investment loss1 | | | (0.06 | ) | | | (0.04 | ) | | | (0.21 | ) | | | (0.18 | ) | | | (0.13 | ) | | | (0.05 | ) | | | | | (0.13 | ) | | | (0.21 | ) | | | (0.32 | ) | | | (0.30 | ) | | | (0.21 | ) | | | (0.21 | ) |
Net realized and unrealized gain (loss) | | | 2.34 | | | | 6.50 | | | | (0.17 | )2 | | | 1.73 | 2 | | | (1.49 | )2 | | | (3.16 | )2 | | | | | 1.96 | | | | 5.56 | | | | (0.13 | )2 | | | 1.50 | 2 | | | (1.35 | )2 | | | (2.80 | )2 |
Net increase (decrease) from investment operations | | | 2.28 | | | | 6.46 | | | | (0.38 | ) | | | 1.55 | | | | (1.62 | ) | | | (3.21 | ) | | | | | 1.83 | | | | 5.35 | | | | (0.45 | ) | | | 1.20 | | | | (1.56 | ) | | | (3.01 | ) |
Distributions from net realized gain | | | (2.63 | ) | | | (0.60 | )3 | | | — | | | | — | | | | — | | | | — | | | | | | (2.36 | ) | | | (0.60 | )3 | | | — | | | | — | | | | — | | | | — | |
Net asset value, end of period | | $ | 23.82 | | | $ | 24.17 | | | $ | 18.31 | | | $ | 18.69 | | | $ | 17.14 | | | $ | 18.76 | | | | | $ | 19.97 | | | $ | 20.50 | | | $ | 15.75 | | | $ | 16.20 | | | $ | 15.00 | | | $ | 16.56 | |
| | | | | | | | | | | | | | | | | | | | | | | | | | | | | | | | | | | | | | | | | | | | | | | | | | |
Total Investment Return4 | |
Based on net asset value | | | 11.23% | 5 | | | 35.73% | | | | (2.03)% | 6,7 | | | 9.04% | 7 | | | (8.64)% | 7,8 | | | (14.61)% | 7 | | | | | 10.77% | 5 | | | 34.46% | | | | (2.78)% | 6,7 | | | 8.00% | 7 | | | (9.42)% | 7,9 | | | (15.38)% | 7 |
| | | | | | | | | | | | | | | | | | | | | | | | | | | | | | | | | | | | | | | | | | | | | | | | | | |
Ratios to Average Net Assets | |
Total expenses | | | 1.15% | 10 | | | 1.17% | | | | 1.18% | | | | 1.22% | | | | 1.33% | | | | 1.16% | | | | | | 2.04% | 10 | | | 2.07% | | | | 1.96% | | | | 2.19% | | | | 2.30% | | | | 2.08% | |
Total expenses excluding recoupment of past waived fees | | | 1.15% | 10 | | | 1.17% | | | | 1.18% | | | | 1.22% | | | | 1.33% | | | | 1.16% | | | | | | 2.04% | 10 | | | 2.07% | | | | 1.96% | | | | 2.07% | | | | 2.20% | | | | 2.08% | |
Total expenses after fees waived, reimbursed and paid indirectly | | | 1.15% | 10 | | | 1.17% | | | | 1.18% | | | | 1.22% | | | | 1.33% | | | | 1.16% | | | | | | 2.04% | 10 | | | 2.07% | | | | 1.96% | | | | 2.19% | | | | 2.20% | | | | 2.08% | |
Net investment loss | | | (0.49)% | 10 | | | (0.18)% | | | | (0.94)% | | | | (0.98)% | | | | (0.92)% | | | | (0.22)% | | | | | | (1.35)% | 10 | | | (1.12)% | | | | (1.72)% | | | | (1.94)% | | | | (1.72)% | | | | (1.11)% | |
Supplemental Data | |
Net assets, end of period (000) | | $ | 371,771 | | | $ | 352,073 | | | $ | 235,400 | | | $ | 269,080 | | | $ | 240,361 | | | $ | 211,065 | | | | | $ | 1,333 | | | $ | 1,506 | | | $ | 1,687 | | | $ | 2,369 | | | $ | 3,327 | | | $ | 5,721 | |
Portfolio turnover | | | 57% | | | | 147% | | | | 141% | | | | 128% | | | | 82% | | | | 81% | | | | | | 57% | | | | 147% | | | | 141% | | | | 128% | | | | 82% | | | | 81% | |
| | 1 | Based on average shares outstanding. |
| | 2 | Includes redemption fees, which are less than $0.005 per share. |
| | 3 | Distributions are determined in accordance with federal income tax regulations. |
| | 4 | Where applicable, total investment returns exclude the effects of any sales charges and include the reinvestment of dividends and distributions. |
| | 5 | Aggregate total investment return. |
| | 6 | Includes proceeds received from a settlement of litigation, which had no impact on the Fund’s total return. |
| | 7 | Redemption fee of 2.00% is reflected in total return calculations. There was no impact to the return. |
| | 8 | Includes proceeds received from a settlement of litigation, which impacted the Fund’s total return. Excluding these proceeds, the Fund’s total return would have been (8.69)%. |
| | 9 | Includes proceeds received from a settlement of litigation, which impacted the Fund’s total return. Excluding these proceeds, the Fund’s total return would have been (9.48)%. |
| | | | | | |
See Notes to Financial Statements. | | | | |
| | | | | | | |
| 34 | | BLACKROCK FUNDS | | MARCH 31, 2013 | | |
| | |
| | |
Financial Highlights (concluded) | | BlackRock Small Cap Growth Equity Portfolio |
| | | | | | | | | | | | | | | | | | | | | | | | |
| | | Investor C | |
| | | Six Months Ended March 31, 2013 (Unaudited) | | | Year Ended September 30, | |
| | | | 2012 | | | 2011 | | | 2010 | | | 2009 | | | 2008 | |
Per Share Operating Performance | | | | | | | | | | | | | | | | | | | | | | | | |
Net asset value, beginning of period | | $ | 20.50 | | | $ | 15.73 | | | $ | 16.19 | | | $ | 14.99 | | | $ | 16.56 | | | $ | 19.57 | |
Net investment loss1 | | | (0.13 | ) | | | (0.19 | ) | | | (0.35 | ) | | | (0.30 | ) | | | (0.22 | ) | | | (0.21 | ) |
Net realized and unrealized gain (loss) | | | 1.94 | | | | 5.56 | | | | (0.11 | )2 | | | 1.50 | 2 | | | (1.35 | )2 | | | (2.80 | )2 |
Net increase (decrease) from investment operations | | | 1.81 | | | | 5.37 | | | | (0.46 | ) | | | 1.20 | | | | (1.57 | ) | | | (3.01 | ) |
Distributions from net realized gain | | | (2.44 | ) | | | (0.60 | )3 | | | — | | | | — | | | | — | | | | — | |
Net asset value, end of period | | $ | 19.87 | | | $ | 20.50 | | | $ | 15.73 | | | $ | 16.19 | | | $ | 14.99 | | | $ | 16.56 | |
| | | | | | | | | | | | | | | | | | | | | | | | |
Total Investment Return4 | | | | | | | | | | | | | | | | | | | | | | | | |
Based on net asset value | | | 10.76% | 5 | | | 34.63% | | | | (2.84)% | 6,7 | | | 8.01% | 7 | | | (9.48)% | 7,8 | | | (15.38)% | 7 |
| | | | | | | | | | | | | | | | | | | | | | | | |
Ratios to Average Net Assets | | | | | | | | | | | | | | | | | | | | | | | | |
Total expenses | | | 1.98% | 9 | | | 1.99% | | | | 2.08% | | | | 2.19% | | | | 2.31% | | | | 2.08% | |
Total expenses excluding recoupment of past waived fees | | | 1.98% | 9 | | | 1.99% | | | | 2.05% | | | | 2.13% | | | | 2.29% | | | | 2.08% | |
Total expenses after fees waived, reimbursed and paid indirectly | | | 1.98% | 9 | | | 1.99% | | | | 2.07% | | | | 2.16% | | | | 2.22% | | | | 2.08% | |
Net investment loss | | | (1.32)% | 9 | | | (0.99)% | | | | (1.83)% | | | | (1.92)% | | | | (1.81)% | | | | (1.14)% | |
| | | | | | | | | | | | | | | | | | | | | | | | |
Supplemental Data | | | | | | | | | | | | | | | | | | | | | | | | |
Net assets, end of period (000) | | $ | 29,310 | | | $ | 28,787 | | | $ | 23,947 | | | $ | 33,219 | | | $ | 25,915 | | | $ | 24,405 | |
Portfolio turnover | | | 57% | | | | 147% | | | | 141% | | | | 128% | | | | 82% | | | | 81% | |
| | 1 | Based on average shares outstanding. |
| | 2 | Includes redemption fees, which are less than $0.005 per share. |
| | 3 | Distributions are determined in accordance with federal income tax regulations. |
| | 4 | Where applicable, total investment returns exclude the effects of any sales charges and include the reinvestment of dividends and distributions. |
| | 5 | Aggregate total investment return. |
| | 6 | Includes proceeds received from a settlement of litigation, which had no impact on the Fund’s total return. |
| | 7 | Redemption fee of 2.00% is reflected in total return calculations. There was no impact to the return. |
| | 8 | Includes proceeds received from a settlement of litigation, which impacted the Fund’s total return. Excluding these proceeds, the Fund’s total return would have been (9.54)%. |
| | | | | | |
See Notes to Financial Statements. | | | | |
| | | | | | | |
| | BLACKROCK FUNDS | | MARCH 31, 2013 | | 35 |
| | |
| | |
Notes to Financial Statements (Unaudited) | | |
1. Organization and Significant Accounting Policies:
BlackRock FundsSM (the “Trust”) is registered under the Investment Company Act of 1940, as amended (the “1940 Act”), as an open-end management investment company. The Trust is organized as a Massa-chusetts business trust. BlackRock Flexible Equity Fund (“Flexible Equity”), BlackRock Mid-Cap Growth Equity Portfolio (“Mid-Cap Growth Equity”) and BlackRock Small Cap Growth Equity Portfolio (“Small Cap Growth Equity”) (collectively, the “Funds” or individually, a “Fund”) are each a series of the Trust. The Funds are classified as diversified. The Funds’ financial statements are prepared in conformity with accounting principles generally accepted in the United States of America (“US GAAP”), which may require management to make estimates and assumptions that affect the reported amounts of assets and liabilities in the financial statements and the reported amounts of increases and decreases in net assets from operations during the reporting period. Actual results could differ from those estimates. Each Fund offers multiple classes of shares. Institutional Shares are sold without a sales charge and only to certain eligible investors. Service Shares are sold without a sales charge. Investor A Shares are generally sold with a front-end sales charge. Investor B and Investor C Shares may be subject to a CDSC. Class R Shares are sold without a sales charge and only to certain employer-sponsored retirement plans. All classes of shares have identical voting, dividend, liquidation and other rights and the same terms and conditions, except that Service, Investor A, Investor B, Investor C and Class R Shares bear certain expenses related to the shareholder servicing of such shares, and Investor B, Investor C and Class R Shares also bear certain expenses related to the distribution of such shares. Investor B Shares automatically convert to Investor A Shares after approximately eight years. Investor B Shares are only available through exchanges and dividend reinvestments by existing shareholders and for purchase by certain employer-sponsored retirement plans. Each class has exclusive voting rights with respect to matters relating to its shareholder servicing and distribution expenditures (except that Investor B shareholders may vote on material changes to the Investor A distribution and service plan).
On February 21, 2013, the Board of Trustees of BlackRock FundsSM approved a change to the Fund’s investment objective from “to seek long-term capital appreciation” to “to seek long-term capital growth.” In addition, the Fund will invest at least 80% of its assets in equity securities of small cap companies and at least 80% of its net assets in securities or instruments of issuers located in the United States. These changes will be effective on May 1, 2013.
The following is a summary of significant accounting policies followed by the Funds:
Basis of Consolidation: The accompanying consolidated financial statements of Flexible Equity include the accounts of BlackRock Flexible Equity Fund Subsidiary, Ltd. (the “Subsidiary”), which is a wholly owned subsidiary of Flexible Equity, and primarily invests in commodity-related instruments. The Subsidiary enables Flexible Equity to hold these
commodity-related instruments and satisfy Regulated Investment Company (“RIC”) tax requirements. Flexible Equity may invest up to 25% of its total assets in the Subsidiary. Intercompany accounts and transactions, if any, have been eliminated. The Subsidiary is subject to the same investment policies and restrictions that apply to Flexible Equity.
Valuation: US GAAP defines fair value as the price the Funds would receive to sell an asset or pay to transfer a liability in an orderly transaction between market participants at the measurement date. The Funds determine the fair values of their financial instruments at market value using independent dealers or pricing services under policies approved by the Board of Trustees of the Trust (the “Board”). The BlackRock Global Valuation Methodologies Committee (the “Global Valuation Committee”) is the committee formed by management to develop global pricing policies and procedures and to provide oversight of the pricing function for the Funds for all financial instruments.
Equity investments traded on a recognized securities exchange or the NASDAQ Global Market System (“NASDAQ”) are valued at the last reported sale price that day or the NASDAQ official closing price, if applicable. For equity investments traded on more than one exchange, the last reported sale price on the exchange where the stock is primarily traded is used. Equity investments traded on a recognized exchange for which there were no sales on that day are valued at the last available bid (long positions) or ask (short positions) price. If no bid price is available, the prior day’s price will be used, unless it is determined that such prior day’s price no longer reflects the fair value of the security. Financial futures contracts traded on exchanges are valued at their last sale price. Investments in open-end registered investment companies are valued at NAV each business day.
The Funds value their investments in BlackRock Liquidity Series, LLC Money Market Series (the “Money Market Series”) at fair value, which is ordinarily based upon their pro rata ownership in the underlying fund’s net assets. The Money Market Series seeks current income consistent with maintaining liquidity and preserving capital. Although the Money Market Series is not registered under the 1940 Act, its investments will follow the parameters of investments by a money market fund that is subject to Rule 2a-7 under the 1940 Act. Each Fund may withdraw up to 25% of its investment daily, although the manager of the Money Market Series, in its sole discretion, may permit an investor to withdraw more than 25% on any one day.
Securities and other assets and liabilities denominated in foreign currencies are translated into US dollars using exchange rates determined as of the close of business on the New York Stock Exchange (“NYSE”). Foreign currency exchange contracts are valued at the mean between the bid and ask prices and are determined as of the close of business on the NYSE. Interpolated values are derived when the settlement date of the contract is an interim date for which quotations are not available.
Exchange-traded options are valued at the mean between the last bid and ask prices at the close of the options market in which the options
| | | | | | |
| | | | |
| | | | | | | |
| 36 | | BLACKROCK FUNDS | | MARCH 31, 2013 | | |
| | |
| | |
Notes to Financial Statements (continued) | | |
trade. An exchange-traded option for which there is no mean price is valued at the last bid (long positions) or ask (short positions) price. If no bid or ask price is available, the prior day’s price will be used, unless it is determined that the prior day’s price no longer reflects the fair value of the option. Over-the-counter (“OTC”) options are valued by an independent pricing service using a mathematical model, which incorporates a number of market data factors, such as the trades and prices of the underlying instruments.
In the event that application of these methods of valuation results in a price for an investment that is deemed not to be representative of the market value of such investment, or if a price is not available, the investment will be valued by the Global Valuation Committee, or its delegate, in accordance with a policy approved by the Board as reflecting fair value (“Fair Value Assets”). When determining the price for Fair Value Assets, the Global Valuation Committee, or its delegate, seeks to determine the price that each Fund might reasonably expect to receive from the current sale of that asset in an arm’s-length transaction. Fair value determinations shall be based upon all available factors that the Global Valuation Committee, or its delegate, deem relevant consistent with the principles of fair value measurement which include the market approach, income approach and/or in the case of recent investments, the cost approach, as appropriate. A market approach generally consists of using comparable market transactions. The income approach generally is used to discount future cash flows to present value and adjusted for liquidity, as appropriate. These factors include but are not limited to: (i) attributes specific to the investment or asset; (ii) the principal market for the investment or asset; (iii) the customary participants in the principal market for the investment or asset; (iv) data assumptions by market participants for the investment or asset, if reasonably available; (v) quoted prices for similar investments or assets in active markets; and (vi) other factors, such as future cash flows, interest rates, yield curves, volatilities, prepayment speeds, loss severities, credit risks, recovery rates, liquidation amounts and/or default rates. Due to the inherent uncertainty of valuations of such investments, the fair values may differ from the values that would have been used had an active market existed. The Global Valuation Committee, or its delegate, employs various methods for calibrating valuation approaches for investments where an active market does not exist, including regular due diligence of the Fund’s pricing vendors, a regular review of key inputs and assumptions, transactional back-testing or disposition analysis to compare unrealized gains and losses to realized gains and losses, reviews of missing or stale prices and large movements in market values and reviews of any market related activity. The pricing of all Fair Value Assets is subsequently reported to the Board or a committee thereof on a quarterly basis.
Generally, trading in foreign instruments is substantially completed each day at various times prior to the close of business on the NYSE. Occasionally, events affecting the values of such instruments may occur between the foreign market close and the close of business on the NYSE that may not be reflected in the computation of each Fund’s net assets. If events (for example, a company announcement, market volatility or a natural disaster) occur during such periods that are expected to affect the value
of such instruments materially, those instruments may be Fair Value Assets and valued at their fair value, as determined in good faith by the Global Valuation Committee using a pricing service and/or policies approved by the Board. Each business day, the Funds use a pricing service to assist with the valuation of certain foreign exchange-traded equity securities and foreign exchange-traded and OTC options (the “Systematic Fair Value Price”). Using current market factors, the Systematic Fair Value Price is designed to value such foreign securities and foreign options at fair value as of the close of business on the NYSE, which follows the close of the local markets.
Foreign Currency: The Funds’ books and records are maintained in US dollars. Purchases and sales of investment securities are recorded at the rates of exchange prevailing on the respective date of such transactions. Generally, when the US dollar rises in value against a foreign currency, the Funds’ investments denominated in that currency will lose value because that currency is worth fewer US dollars; the opposite effect occurs if the US dollar falls in relative value.
The Funds do not isolate the portion of the results of operations arising as a result of changes in the foreign exchange rates from the changes in the market prices of investments held or sold for financial reporting purposes. Accordingly, the effects of changes in foreign currency exchange rates on investments are not segregated on the Statements of Operations from the effects of changes in market prices of those investments, but are included as a component of net realized and unrealized gain (loss) from investments. The Funds report realized currency gains (losses) on foreign currency related transactions as components of net realized gain (loss) for financial reporting purposes, whereas such components are treated as ordinary income for federal income tax purposes.
Participation Notes: Flexible Equity may invest in participation notes (“P-Notes”). P-Notes are promissory notes issued by banks or broker-dealers that are designed to offer Flexible Equity a return measured by the change in the value of the underlying security or basket of securities (the“underlying security”) while not holding the actual shares of the underlying security. P-Notes are typically used to allow Flexible Equity to gain exposure to securities traded in foreign markets that may be restricted due to country-specific regulations. When the P-Note matures, the issuer will pay to, or receive from, Flexible Equity the difference between the value of the underlying security at the time of the purchase and the underlying security’s value at maturity of the P-Notes. Income received on P-Notes is recorded by Flexible Equity as dividend income in the Statements of Operations. An investment in a P-Note involves additional risks beyond the risks normally associated with a direct investment in the underlying security. While the holder of a P-Note is entitled to receive from the bank or broker-dealer any dividends paid by the underlying security, the holder is not entitled to the same rights (e.g., voting rights) as a direct owner of the underlying security. P-Notes are considered general unsecured contractual obligations of the bank or broker-dealer. Flexible Equity must rely on the creditworthiness of the issuer for its investment returns on the P-Notes and has no rights against the issuer of the underlying security. A P-Note may be more volatile and less
| | | | | | |
| | | | |
| | | | | | | |
| | BLACKROCK FUNDS | | MARCH 31, 2013 | | 37 |
| | |
| | |
Notes to Financial Statements (continued) | | |
liquid than other investments held by Flexible Equity since the P-Note generally is dependent on the liquidity in the local trading market for the underlying security.
Segregation and Collateralization: In cases in which the 1940 Act and the interpretive positions of the Securities and Exchange Commission (“SEC”) require that each Fund either deliver collateral or segregate assets in connection with certain investments (e.g., financial futures contracts, foreign currency exchange contracts and options written), each Fund will, consistent with SEC rules and/or certain interpretive letters issued by the SEC, segregate collateral or designate on its books and records cash or liquid securities having a market value at least equal to the amount that would otherwise be required to be physically segregated. Furthermore, based on requirements and agreements with certain exchanges and third party broker-dealers, a Fund engaging in such transactions may have requirements to deliver/deposit securities to/with an exchange or broker-dealer as collateral for certain investments.
Investment Transactions and Investment Income: For financial reporting purposes, investment transactions are recorded on the dates the transactions are entered into (the trade dates). Realized gains and losses on investment transactions are determined on the identified cost basis. Dividend income is recorded on the ex-dividend dates. Dividends from foreign securities where the ex-dividend date may have passed are subsequently recorded when the Funds are informed of the ex-dividend date. Under the applicable foreign tax laws, a withholding tax at various rates may be imposed on capital gains, dividends and interest. Upon notification from issuers, some of the dividend income received from a real estate investment trust may be redesignated as a reduction of cost of the related investment and/or realized gain. Income and realized and unrealized gains and losses are allocated daily to each class based on its relative net assets.
Dividends and Distributions: Dividends and distributions paid by the Funds are recorded on the ex-dividend dates. The portion of distributions that exceeds a Fund’s current and accumulated earnings and profits, which are measured on a tax basis, will constitute a nontaxable return of capital. Distributions in excess of a Fund’s taxable income and net capital gains, but not in excess of a Fund’s earnings and profits, will be taxable to shareholders as ordinary income and will not constitute a non-taxable return of capital. Capital losses carried forward from years beginning before 2011 do not reduce earnings and profits, even if such carried forward losses offset current year realized gains. The character and timing of dividends and distributions are determined in accordance with federal income tax regulations, which may differ from US GAAP.
Securities Lending: The Funds may lend securities to approved borrowers, such as banks, brokers and other financial institutions. The borrower pledges cash, securities issued or guaranteed by the US government or irrevocable letters of credit issued by a bank as collateral. The initial collateral received by the Funds has a value of at least 102% of the current value of the loaned securities for securities traded on U.S.
exchanges and a value of at least 105% for all other securities. The collateral is maintained thereafter in an amount equal to at least 100% of the current market value of the loaned securities. The market value of the loaned securities is determined at the close of business of the Funds and any additional required collateral is delivered to the Funds on the next business day. Securities lending income, as disclosed in the Statements of Operations, represents the income earned from the investment of the cash collateral, net of rebates paid to, or fees paid by, borrowers and less the fees paid to the securities lending agent. During the term of the loan, the Funds earn dividend or interest income on the securities loaned but do not receive dividend or interest income on the securities received as collateral. Loans of securities are terminable at any time and the borrower, after notice, is required to return borrowed securities within the standard time period for settlement of securities transactions. The risks of securities lending include the risk that the borrower may not provide additional collateral when required or may not return the securities when due. To mitigate this risk the Funds benefit from a borrower default indemnity provided by BlackRock, Inc. (“BlackRock”). BlackRock’s indemnity allows for full replacement of securities lent. The Funds also could suffer a loss if the value of an investment purchased with cash collateral falls below the market value of loaned securities or if the value of an investment purchased with cash collateral falls below the value of the original cash collateral received. During the six months ended March 31, 2013, any securities on loan were collateralized by cash.
Income Taxes: It is the Funds’ policy to comply with the requirements of the Internal Revenue Code of 1986, as amended, applicable to regulated investment companies and to distribute substantially all of their taxable income to their shareholders. Therefore, no federal income tax provision is required.
The Funds file US federal and various state and local tax returns. No income tax returns are currently under examination. The statute of limitations on the Funds’ US federal tax returns remains open for each of the four periods ended September 30, 2012. The statutes of limitations on each Fund’s state and local tax returns may remain open for an additional year depending upon the jurisdiction. Management does not believe there are any uncertain tax positions that require recognition of a tax liability.
Recent Accounting Standards: In December 2011, the Financial Accounting Standards Board (the “FASB”) issued guidance that will expand current disclosure requirements on the offsetting of certain assets and liabilities. The new disclosures will be required for investments and derivative financial instruments subject to master netting or similar agreements which are eligible for offset in the Statements of Assets and Liabilities and will require an entity to disclose both gross and net information about such investments and transactions in the financial statements. In January 2013, the FASB issued guidance that clarifies which investments and transactions are subject to the offsetting disclosure requirements. The scope of the disclosure requirements for
| | | | | | |
| | | | |
| | | | | | | |
| 38 | | BLACKROCK FUNDS | | MARCH 31, 2013 | | |
| | |
| | |
Notes to Financial Statements (continued) | | |
offsetting will be limited to derivative instruments, repurchase agreements and reverse repurchase agreements, and securities borrowing and securities lending transactions. The guidance is effective for financial statements with fiscal years beginning on or after January 1, 2013, and interim periods within those fiscal years. Management is evaluating the impact of this guidance on the Funds’ financial statement disclosures.
Other: Expenses directly related to a Fund or its classes are charged to that Fund or class. Other operating expenses shared by several funds are pro rated among those funds on the basis of relative net assets or other appropriate methods. Expenses directly related to the Funds and other shared expenses pro rated to the Funds are allocated daily to each class based on its relative net assets or other appropriate methods.
The Funds have an arrangement with the custodian whereby fees may be reduced by credits earned on uninvested cash balances, which, if applicable, are shown as fees paid indirectly in the Statements of Operations. The custodian imposes fees on overdrawn cash balances, which can be offset by accumulated credits earned or may result in additional custody charges.
2. Derivative Financial Instruments:
The Funds engage in various portfolio investment strategies using derivative contracts both to increase the returns of the Funds and/or to economically hedge, or protect, their exposure to certain risks such as equity risk or foreign currency exchange rate risk. These contracts may be transacted on an exchange or OTC.
Losses may arise if the value of the contract decreases due to an unfavorable change in the market rates or values of the underlying instrument or if the counterparty does not perform under the contract. The Funds’ maximum risk of loss from counterparty credit risk on OTC derivatives is generally the aggregate unrealized gain netted against any collateral pledged by the counterparty. For OTC options purchased, the Funds bear the risk of loss in the amount of the premiums paid plus the positive change in market values net of any collateral received on the options should the counterparty fail to perform under the contracts. Options written by the Funds do not give rise to counterparty credit risk, as options written obligate the Funds and not the counterparty to perform. Counterparty risk related to exchange-traded financial futures contracts and options is deemed to be minimal due to the protection against defaults provided by the exchange on which these contracts trade.
The Funds may mitigate counterparty risk by procuring collateral and through netting provisions included within an International Swaps and Derivatives Association, Inc. master agreement (“ISDA Master Agreement”) implemented between a Fund and each of its respective counterparties. An ISDA Master Agreement allows each Fund to offset with each separate counterparty certain derivative financial instrument’s payables and/or receivables with collateral held. The amount of collateral moved to/from applicable counterparties is generally based upon minimum transfer amounts of up to $500,000. To the extent amounts due to the Funds from their counterparties are not fully collateralized
contractually or otherwise, the Funds bear the risk of loss from counterparty non-performance. See Note 1 “Segregation and Collateralization” for information with respect to collateral practices. In addition, the Funds manage counterparty risk by entering into agreements only with counterparties that they believe have the financial resources to honor their obligations and by monitoring the financial stability of those counterparties.
Certain ISDA Master Agreements allow counterparties to OTC derivatives to terminate derivative contracts prior to maturity in the event the Funds’ net assets decline by a stated percentage or the Funds fail to meet the terms of their ISDA Master Agreements, which would cause the Funds to accelerate payment of any net liability owed to the counterparty.
Financial Futures Contracts: Flexible Equity purchases and/or sells financial futures contracts and options on financial future contracts to gain exposure to, or economically hedge against, changes in the value of equity securities (equity risk). Financial futures contracts are agreements between Flexible Equity and a counterparty to buy or sell a specific quantity of an underlying instrument at a specified price and at a specified date. Depending on the terms of the particular contract, financial futures contracts are settled either through physical delivery of the underlying instrument on the settlement date or by payment of a cash settlement amount on the settlement date. Pursuant to the contract, Flexible Equity agrees to receive from or pay to the broker an amount of cash equal to the daily fluctuation in value of the contract. Such receipts or payments are known as variation margin and are recorded by Flexible Equity as unrealized appreciation or depreciation. When the contract is closed, Flexible Equity records a realized gain or loss equal to the difference between the value of the contract at the time it was opened and the value at the time it was closed. The use of financial futures contracts involves the risk of an imperfect correlation in the movements in the price of financial futures contracts and the underlying assets.
Foreign Currency Exchange Contracts: Flexible Equity enters into foreign currency exchange contracts as an economic hedge against either specific transactions or portfolio instruments or to obtain exposure to foreign currencies (foreign currency exchange rate risk). A foreign currency exchange contract is an agreement between two parties to buy and sell a currency at a set exchange rate on a future date. Foreign currency exchange contracts, when used by Flexible Equity, help to manage the overall exposure to the currencies in which some of the investments held by Flexible Equity are denominated. The contract is marked-to-market daily and the change in market value is recorded by Flexible Equity as an unrealized gain or loss. When the contract is closed, Flexible Equity records a realized gain or loss equal to the difference between the value at the time it was opened and the value at the time it was closed. The use of foreign currency exchange contracts involves the risk that the value of a foreign currency exchange contract changes unfavorably due to movements in the value of the referenced foreign currencies and the risk that a counterparty to the contract does not perform its obligations under the agreement.
| | | | | | |
| | | | | | | |
| | BLACKROCK FUNDS | | MARCH 31, 2013 | | 39 |
| | |
| | |
Notes to Financial Statements (continued) | | |
Options: The Funds purchase and write call and put options to increase or decrease their exposure to underlying instruments (including equity risk) and/or, in the case of options written, to generate gains from options premiums. A call option gives the purchaser (holder) of the option the right (but not the obligation) to buy, and obligates the seller (writer) to sell (when the option is exercised), the underlying instrument at the exercise or strike price at any time or at a specified time during the option period. A put option gives the holder the right to sell and obligates the writer to buy the underlying instrument at the exercise or strike price at any time or at a specified time during the option period. When a Fund purchases (writes) an option, an amount equal to the premium paid (received) by a Fund is reflected as an asset (liability). The amount of the asset (liability) is subsequently marked-to-market to reflect the current market value of the option purchased (written). When an instrument is purchased or sold through an exercise of an option, the related premium paid (or received) is added to (or deducted from) the basis of
the instrument acquired or deducted from (or added to) the proceeds of the instrument sold. When an option expires (or a Fund enters into a closing transaction), a Fund realizes a gain or loss on the option to the extent of the premiums received or paid (or gain or loss to the extent the cost of the closing transaction exceeds the premiums received or paid). When a Fund writes a call option, such option is “covered,” meaning that a Fund holds the underlying instrument subject to being called by the option counterparty. When a Fund writes a put option, such option is covered by cash in an amount sufficient to cover the obligation.
In purchasing and writing options, the Funds bear the risk of an unfavorable change in the value of the underlying instrument or the risk that the Funds may not be able to enter into a closing transaction due to an illiquid market. Exercise of a written option could result in the Funds purchasing or selling a security at a price different from the current market value.
| | | | | | | | |
| Derivative Financial Instruments Categorized by Risk Exposure: |
| Fair Values of Derivative Financial Instruments as of March 31, 2013 |
| Asset Derivatives |
| | | | | Flexible Equity | | | | Small Cap Growth Equity |
| | | Statements of Assets and Liabilities Location | | Value | | | | |
Foreign currency exchange contracts | | Unrealized appreciation on foreign currency exchange contracts | | $1,852,235 | | | | — |
Equity contracts | | Investments at value — unaffiliated1 | | 108,300 | | | | $1,918,600 |
Total | | | | $1,960,535 | | | | $1,918,600 |
|
| Liability Derivatives |
| | | | | | | | | Flexible Equity |
| | | Statements of Assets and Liabilities Location | | | | | | Value |
Foreign currency exchange contracts | | Unrealized depreciation on foreign currency exchange contracts | | | | | | $117,011 |
Equity contracts | | Options written at value; Net unrealized appreciation/ depreciation2 | | | | | | 499,291 |
Total | | | | | | | | $616,302 |
| | 1 | Includes options purchased at value as reported in the Schedule of Investments. |
| | 2 | Includes cumulative appreciation/depreciation on financial futures contracts as reported in the Schedule of Investments. Only current day’s variation margin is reported within the Statements of Assets and Liabilities. |
| | | | | | |
| | | | | | | |
| 40 | | BLACKROCK FUNDS | | MARCH 31, 2013 | | |
| | |
| | |
Notes to Financial Statements (continued) | | |
| | | | | | | | | | | | |
The Effect of Derivative Financial Instruments in the Statements of
Operations Six Months Ended March 31, 2013 | |
| | | Net Realized Gain (Loss) From | |
| | | Flexible
Equity | | | Mid-Cap
Growth
Equity | | | Small Cap
Growth
Equity | |
Foreign currency exchange contracts: | | | | | | | | | | | | |
Foreign currency transactions | | $ | 229,012 | | | | — | | | | — | |
Equity contracts: | | | | | | | | | | | | |
Financial futures contracts | | | (2,658,118 | ) | | | — | | | | — | |
Options3 | | | (442,268 | ) | | $ | 42,265 | | | $ | 300,046 | |
Total | | $ | (2,871,374 | ) | | $ | 42,265 | | | $ | 300,046 | |
| | | | | | | | | | | | |
| | | Net Change in Unrealized Appreciation/Depreciation on | |
| | | Flexible
Equity | | | Mid-Cap
Growth
Equity | | | Small Cap
Growth
Equity | |
Foreign currency exchange contracts: | | | | | | | | | | | | |
Foreign currency
translations | | $ | 1,735,224 | | | | — | | | | — | |
Equity contracts: | | | | | | | | | | | | |
Financial futures contracts | | | (885,277 | ) | | | — | | | | — | |
Options3 | | | (179,514 | ) | | $ | 57,385 | | | $ | (1,156,765 | ) |
Total | | $ | 670,433 | | | $ | 57,385 | | | $ | (1,156,765 | ) |
| | 3 | Options purchased are included in the net realized gain (loss) from investments — unaffiliated and net change in unrealized appreciation/ depreciation on investments — unaffiliated. |
For the six months ended March 31, 2013, the average quarterly balances of outstanding derivative financial instruments were as follows:
| | | | | | | | |
| | | Flexible
Equity | | | Small Cap
Growth
Equity | |
Financial futures contracts: | | | | | | | | |
Average number of contracts sold | | | 414 | | | | — | |
Average notional value of contracts sold | | $ | 32,757,400 | | | | — | |
Foreign currency exchange contracts: | | | | | | | | |
Average number of contracts - US dollars purchased . | | | 7 | | | | — | |
Average number of contracts - US dollars sold | | | 2 | | | | — | |
Average US dollar amounts purchased | | $ | 72,449,185 | | | | — | |
Average US dollar amounts sold | | $ | 12,058,314 | | | | — | |
Options: | | | | | | | | |
Average number of option contracts purchased | | | 2 | | | | 1 | |
Average number of option contracts written | | | 3 | | | | — | |
Average notional value of option contracts purchased | | $ | 2,856,500 | | | $ | 79,187,500 | |
Average notional value of option contracts written | | $ | 20,000,950 | | | | — | |
3. Investment Advisory Agreement and Other Transactions with Affiliates:
The PNC Financial Services Group, Inc. (“PNC”) is the largest stockholder and an affiliate, for 1940 Act purposes, of BlackRock.
The Trust, on behalf of the Funds, entered into an Investment Advisory Agreement with BlackRock Advisors, LLC (the “Manager”), the Funds’ investment advisor, an indirect, wholly owned subsidiary of BlackRock, to provide investment advisory and administration services. The Manager is responsible for the management of each Fund’s portfolio and provides
the necessary personnel, facilities, equipment and certain other services necessary to the operations of each Fund. For such services, each Fund pays the Manager a monthly fee based on a percentage of each Fund’s average daily net assets at the following annual rates:
| | | | |
| | | Flexible Equity and
Mid-Cap Growth Equity | | Small Cap
Growth
Equity |
| Average Daily Net Assets | | Investment
Advisory Fee | | Investment
Advisory Fee |
First $1 Billion | | 0.800% | | 0.550% |
$1 Billion - $2 Billion | | 0.700% | | 0.500% |
$2 Billion - $3 Billion | | 0.650% | | 0.475% |
Greater than $3 Billion | | 0.625% | | 0.450% |
The Manager voluntarily agreed to waive its investment advisory fees by the amount of investment advisory fees each Fund pays to the Manager indirectly through its investment in affiliated money market funds. However, the Manager does not waive its investment advisory fees by the amount of investment advisory fees paid in connection with each Fund’s investment in other affiliated investment companies, if any. These amounts are included in fees waived by Manager in the Statements of Operations. For the six months ended March 31, 2013, the amounts waived were as follows:
| | | | |
Flexible Equity | | $ | 7,855 | |
Mid-Cap Growth Equity | | $ | 1,005 | |
Small Cap Growth Equity | | $ | 9,008 | |
The Manager provides investment management and other services to the Subsidiary. The Manager does not receive separate compensation from the Subsidiary for providing investment management or administrative services. However, Flexible Equity pays the Manager based on Flexible Equity’s net assets which includes the assets of the Subsidiary.
The Trust, on behalf of the Funds, entered into a Distribution Agreement and Distribution and Service Plan with BlackRock Investments, LLC (“BRIL”), an affiliate of the Manager. Pursuant to the Distribution and Service Plan and in accordance with Rule 12b-1 under the 1940 Act, the Funds pay BRIL ongoing service and distribution fees. The fees are accrued daily and paid monthly at annual rates based upon the average daily net assets of the shares of each Fund as follows:
| | | | | | |
| | | Service
Fee | | Distribution
Fee | |
Service | | 0.25% | | | — | |
Investor A | | 0.25% | | | — | |
Investor B | | 0.25% | | | 0.75 | % |
Investor C | | 0.25% | | | 0.75 | % |
Class R | | 0.25% | | | 0.25 | % |
Pursuant to sub-agreements with BRIL, broker-dealers and BRIL provide shareholder servicing and distribution services to each Fund. The ongoing service and/or distribution fee compensates BRIL and each broker-dealer for providing shareholder servicing and/or distribution related services to Service, Investor A, Investor B, Investor C and Class R shareholders.
| | | | | | |
| | | | | | | |
| | BLACKROCK FUNDS | | MARCH 31, 2013 | | 41 |
| | |
| | |
Notes to Financial Statements (continued) | | |
For the six months ended March 31, 2013, the following table shows the class specific service and distribution fees borne directly by each class of each Fund:
| | | | | | | | | | | | |
| | | Flexible
Equity | | | Mid-Cap
Growth
Equity | | | Small Cap
Growth
Equity | |
Service | | $ | 684 | | | $ | 2,377 | | | $ | 36,016 | |
Investor A | | | 685,283 | | | | 294,380 | | | | 429,565 | |
Investor B | | | 75,293 | | | | 23,513 | | | | 6,839 | |
Investor C | | | 540,441 | | | | 93,653 | | | | 138,124 | |
Class R | | | 3,258 | | | | 16,676 | | | | — | |
Total | | $ | 1,304,959 | | | $ | 430,599 | | | $ | 610,544 | |
Pursuant to written agreements, certain financial intermediaries, some of which may be affiliates, provide the Funds with sub-accounting, recordkeeping, sub-transfer agency and other administrative services with respect to sub-accounts they service. For these services, these entities receive an asset based fee or an annual fee per shareholder account, which will vary depending on share class and/or net assets. For the six months ended March 31, 2013, the Funds paid the following to the affiliates in return for these services, which are included in transfer agent — class specific in the Statements of Operations:
| | | | |
Flexible Equity | | $ | 3,334 | |
Mid-Cap Growth Equity | | $ | 3,403 | |
Small Cap Growth Equity | | $ | 99,090 | |
The Manager maintains a call center, which is responsible for providing certain shareholder services to the Funds, such as responding to shareholder inquiries and processing transactions based upon instructions from shareholders with respect to the subscription and redemption of Fund shares. For the six months ended March 31, 2013, each Fund reimbursed the Manager the following amounts for costs incurred in running the call center, which are included in transfer agent — class specific in the Statements of Operations:
| | | | | | | | | | | | |
| | | Flexible
Equity | | | Mid-Cap
Growth
Equity | | | Small Cap
Growth
Equity | |
Institutional | | | $ 1,130 | | | | $ 499 | | | | $ 2,353 | |
Service | | | 274 | | | | 647 | | | | 1,900 | |
Investor A | | | 29,125 | | | | 35,310 | | | | 5,036 | |
Investor B | | | $ 2,379 | | | | $ 1,501 | | | | $80 | |
Investor C | | | 3,003 | | | | — | | | | 766 | |
Class R | | | 35 | | | | 107 | | | | — | |
Total | | | $35,946 | | | | $38,064 | | | | $10,135 | |
For the six months ended March 31, 2013, the following table shows the class specific transfer agent fees borne directly by each class of each Fund:
| | | | | | | | | | | | |
| | | Flexible
Equity | | | Mid-Cap
Growth
Equity | | | Small Cap
Growth
Equity | |
Institutional | | $ | 138,177 | | | $ | 11,909 | | | $ | 770,803 | |
| | | | | | | | | | | | |
| | | Flexible
Equity | | | Mid-Cap
Growth
Equity | | | Small Cap
Growth
Equity | |
Service | | | 2,312 | | | | 4,212 | | | | 31,855 | |
Investor A | | | 654,912 | | | | 370,000 | | | | 416,016 | |
Investor B | | | 36,098 | | | | 15,846 | | | | 2,637 | |
Investor C | | | 140,489 | | | | 26,957 | | | | 44,977 | |
Class R | | | 1,959 | | | | 10,845 | | | | — | |
Total | | $ | 973,947 | | | $ | 439,769 | | | $ | 1,266,288 | |
BNY Mellon Investment Servicing (US) Inc. (“BNYMIS”) and the Manager act as co-administrators for the Funds. For these services, the co-administrators receive an administration fee computed daily and payable monthly to each administrator pursuant to separate fee arrangements, based on a percentage of the average daily net assets of each Fund. The combined administration fee, which is shown as administration in the Statements of Operations, is paid at the following annual rates:
| | |
| Average Daily Net Assets | | Administration Fee |
First $500 Million | | 0.075% |
$500 Million - $1 Billion | | 0.065% |
Greater than $1 Billion | | 0.055% |
In addition, each of the share classes is charged an administration fee, which is shown as administration-class specific in the Statements of Operations, based on the following percentages of average daily net assets of each respective class:
| | |
| Average Daily Net Assets | | Administration Fee — Class Specific |
First $500 Million | | 0.025% |
$500 Million - $1 Billion | | 0.015% |
Greater than $1 Billion | | 0.005% |
In addition, BNYMIS and the Manager may have, at their discretion, voluntarily waived all or any portion of their administration fees for a Fund or a share class which are included in administration fees waived and administration fees waived — class specific in the Statements of Operations. For the six months ended March 31, 2013, the Funds paid the following to the Manager in return for these services, which are included in administration, administration — class specific, administration fees waived and administration fees waived — class specific in the Statements of Operations:
| | | | |
Flexible Equity | | $ | 197,441 | |
Mid-Cap Growth Equity | | $ | 72,227 | |
Small Cap Growth Equity | | $ | 469,718 | |
For the six months ended March 31, 2013, the following table shows the class specific administration fees borne directly by each class of each Fund:
| | | | | | | | | | | | |
| | | Flexible
Equity | | | Mid-Cap
Growth
Equity | | | Small Cap
Growth
Equity | |
Institutional | | $ | 13,672 | | | $ | 2,141 | | | $ | 97,001 | |
| | | | | | |
| | | | |
| | | | | | | |
| 42 | | BLACKROCK FUNDS | | MARCH 31, 2013 | | |
| | |
| | |
Notes to Financial Statements (continued) | | |
| | | | | | | | | | | | |
| | | Flexible
Equity | | | Mid-Cap
Growth
Equity | | | Small Cap
Growth
Equity | |
Service | | | 68 | | | | 238 | | | | 3,602 | |
Investor A | | | 66,049 | | | | 29,438 | | | | 42,956 | |
Investor B | | | 1,935 | | | | 588 | | | | 171 | |
Investor C | | | 13,511 | | | | 2,341 | | | | 3,453 | |
Class R | | | 163 | | | | 834 | | | | — | |
Total | | $ | 95,398 | | | $ | 35,580 | | | $ | 147,183 | |
The Manager contractually or voluntarily agreed to waive and/or reimburse fees or expenses, excluding interest expense, dividend expense, income tax expense, acquired fund fees and expenses and certain other fund expenses, which constitute extraordinary expenses not incurred in the ordinary course of the Funds’ business, in order to limit expenses. The expense limitations as a percentage of average daily net assets are as follows:
| | | | | | | | |
| | | Flexible
Equity | | Mid-Cap
Growth
Equity | | Small Cap Growth Equity |
| | | Contractual1 | | Contractual2 | | Contractual2 | | Voluntary3 |
| | | | | | | | |
Institutional | | 0.97% | | 1.11% | | 1.02% | | — |
Service | | 1.29% | | 1.58% | | 1.29% | | 1.18% |
Investor A | | 1.29% | | 1.39% | | 1.50% | | — |
Investor B | | 2.06% | | 2.16% | | 2.28% | | — |
Investor C | | 2.06% | | 2.16% | | 2.28% | | — |
Class R | | 1.65%4 | | 1.65% | | 1.72%5 | | — |
| 1 | The Manager has agreed not to reduce or discontinue this contractual waiver or reimbursement prior to February 1, 2014, except for Class R Shares which is prior to February 1, 2023, unless approved by the Board, including a majority of the independent Trustees. |
| 2 | The Manager has agreed not to reduce or discontinue this contractual waiver or reimbursement prior to February 1, 2014 unless approved by the Board, including a majority of the independent Trustees. |
| 3 | The voluntary waiver or reimbursement may be reduced or discontinued at any time. |
| 4 | On August 1 of each year, the waiver agreement will renew automatically for an additional one year so that the agreement will have a perpetual ten year term. |
| 5 | There were no shares outstanding as of March 31, 2013. |
These amounts waived or reimbursed are included in fees waived by Manager, and shown as administration fees waived — class specific, transfer agent fees waived — class specific and transfer agent fees reimbursed — class specific, respectively, in the Statements of Operations. For the six months ended March 31, 2013, the Manager waived $4,185 of investment advisory fees for Flexible Equity, which is included in fees waived by Manager. Class specific expense waivers or reimbursements are as follows:
| | | | | | | | | | |
Administration Fees Waived | | | | | | | |
| | | Flexible
Equity | | | Mid-Cap
Growth
Equity | | | Small Cap
Growth
Equity |
Institutional | | $ | 13,671 | | | $ | 1,529 | | | — |
Service | | | 68 | | | | 118 | | | $220 |
Investor A | | | 66,049 | | | | 29,438 | | | — |
Investor B | | | 1,803 | | | | 588 | | | — |
Investor C | | | 13,511 | | | | 2,341 | | | — |
| | | | | | | | | | | | |
Administration Fees Waived | | | | | | | | | |
| | | Flexible
Equity | | | Mid-Cap
Growth
Equity | | | Small Cap
Growth
Equity | |
Class R | | | 160 | | | | 834 | | | | — | |
Total | | | $95,262 | | | | $34,848 | | | | $220 | |
| | | | | | | | | | | | |
Transfer Agent Fees Waived | | | | | | | | | |
| | | Flexible
Equity | | | Mid-Cap
Growth
Equity | | | Small Cap
Growth
Equity | |
Institutional | | | $ 1,130 | | | | $ 125 | | | | — | |
Service | | | 274 | | | | 647 | | | | $429 | |
Investor A | | | 29,125 | | | | 35,311 | | | | — | |
Investor B | | | 2,379 | | | | 1,501 | | | | — | |
Investor C | | | 3,003 | | | | — | | | | — | |
Class R | | | 34 | | | | 107 | | | | — | |
Total | | | $35,945 | | | | $37,691 | | | | $429 | |
| | | | | | | | | | | | |
Transfer Agent Fees Reimbursed | | | | | | | | | |
| | | | | | Flexible
Equity | | | Mid-Cap
Growth
Equity | |
Institutional | | | | | | $ | 107,507 | | | | $ 103 | |
Service | | | | | | | 1,704 | | | | 936 | |
Investor A | | | | | | | 288,624 | | | | 110,297 | |
Investor B | | | | | | | 21,627 | | | | 9,430 | |
Investor C | | | | | | | 61,399 | | | | 7,411 | |
Class R | | | | | | | 410 | | | | 4,069 | |
Total | | | | | | $ | 481,271 | | | | $132,246 | |
If during a Fund’s fiscal year the operating expenses of a share class, that at any time during the prior two fiscal years received a waiver or reimbursement from the Manager, are less than the expense limit for that share class, the Manager is entitled to be reimbursed by such share class up to the lesser of (a) the amount of fees waived or expenses reimbursed during those prior two fiscal years under the agreement and (b) the amount by which the expense limit for that share class exceeds the operating expenses of the share class for the current fiscal year, provided that: (1) the Fund, of which the share class is a part has more than $50 million in assets for the fiscal year and (2) the Manager or an affiliate continues to serve as the Fund’s investment advisor or administrator. In the event the expense limit for a share class is changed subsequent to a fiscal year in which the Manager becomes entitled to reimbursement for fees waived or reimbursed, the amount available to reimburse the Manager shall be calculated by reference to the expense limit for that share class in effect at the time the Manager became entitled to receive such reimbursement, rather than the subsequently changed expense limit for that share class.
For the six months ended March 31, 2013, the Manager recouped the following Fund level and class specific waivers previously recorded by the Funds:
| | | | | | |
| | | | |
| | | | | | | |
| | BLACKROCK FUNDS | | MARCH 31, 2013 | | 43 |
| | |
| | |
Notes to Financial Statements (continued) | | |
| | | | | | | | |
| | | Flexible
Equity | | | Mid-Cap
Growth
Equity | |
Institutional | | | — | | | | $1,330 | |
Service | | | — | | | | 862 | |
Investor B | | | $892 | | | | — | |
Total | | | $892 | | | | $2,192 | |
On March 31, 2013, the Fund level and class specific waivers and/or reimbursements subject to possible future recoupment under the expense limitation agreement are as follows:
| | | | | | | | | | | | |
| | | Expiring September 30, | |
| | | 2013 | | | 2014 | | | 2015 | |
Flexible Equity | | | | | | | | | | | | |
Fund Level | | | — | | | $ | 3,058 | | | $ | 4,185 | |
Institutional | | $ | 265,774 | | | $ | 286,798 | | | $ | 122,309 | |
Service | | $ | 2,029 | | | $ | 7,949 | | | $ | 2,047 | |
Investor A | | $ | 608,861 | | | $ | 668,091 | | | $ | 383,796 | |
Investor B | | $ | 25,904 | | | $ | 57,761 | | | $ | 25,809 | |
Investor C | | $ | 157,034 | | | $ | 140,462 | | | $ | 77,914 | |
R Shares | | $ | 699 | | | $ | 1,419 | | | $ | 604 | |
Mid Cap Growth Equity | | | | | | | | | | | | |
Institutional | | | — | | | $ | 7,449 | | | $ | 1,758 | |
Service | | $ | 898 | | | $ | 8,735 | | | $ | 1,701 | |
Investor A | | $ | 30,167 | | | $ | 397,816 | | | $ | 175,045 | |
Investor B | | $ | 3,414 | | | $ | 28,651 | | | $ | 11,519 | |
Investor C | | $ | 1,118 | | | $ | 28,468 | | | $ | 9,752 | |
R Shares | | $ | 10,486 | | | $ | 11,748 | | | $ | 5,010 | |
For the six months ended March 31, 2013, affiliates earned underwriting discounts, direct commissions and dealer concessions on sales of each Fund’s Investor A Shares as follows:
| | | | |
Flexible Equity | | $ | 5,079 | |
Mid-Cap Growth Equity | | $ | 3,117 | |
Small Cap Growth Equity | | $ | 6,793 | |
For the six months ended March 31, 2013, affiliates received CDSCs as follows:
| | | | | | |
| | | Investor A | | Investor B | | Investor C |
Flexible Equity | | $727 | | $4,084 | | $1,276 |
Mid-Cap Growth Equity | | $ 36 | | $1,957 | | $1,551 |
Small Cap Growth Equity | | — | | $ 32 | | $ 908 |
The Funds received an exemptive order from the SEC permitting them, among other things, to pay an affiliated securities lending agent a fee based on a share of the income derived from the securities lending activities and have retained BlackRock Investment Management, LLC (“BIM”) as the securities lending agent. BIM may, on behalf of the Funds, invest cash collateral received by a Fund for such loans in a private investment company managed by the Manager or in registered money market funds advised by the Manager or its affiliates. The market value of securities on loan and the value of the related collateral, if applicable, is shown in the Statements of Assets and Liabilities as securities loaned at value and collateral on securities loaned at value, respectively. The cash collateral invested by BIM, if any, is disclosed in the Schedules of
Investments. Securities lending income is equal to the total of income earned from the reinvestment of cash collateral, net of rebates paid to, or fees paid by, borrowers of securities. The Funds retain 65% of securities lending income and pay a fee to BIM equal to 35% of such income. The Funds benefit from a borrower default indemnity provided by BlackRock. As securities lending agent, BIM bears all operational costs directly related to securities lending as well as the cost of borrower default indemnification. BIM does not receive any fees for managing the cash collateral. The share of income earned by the Funds is shown as securities lending — affiliated in the Statements of Operations. For the six months ended March 31, 2013, BIM received $273,597 in securities lending agent fees related to securities lending activities for the Funds.
Certain officers and/or trustees of the Trust are officers and/or directors of BlackRock or its affiliates. The Funds reimburse the Manager for a portion of the compensation paid to the Trust’s Chief Compliance Officer, which is included in Officer and Trustees in the Statements of Operations.
4. Investments:
Purchases and sales of investments, excluding short-term securities, for the six months ended March 31, 2013, were as follows:
| | | | | | | | |
| | | Purchases | | | Sales | |
Flexible Equity | | $ | 401,190,454 | | | $ | 593,494,058 | |
Mid-Cap Growth Equity | | $ | 216,669,090 | | | $ | 233,084,562 | |
Small Cap Growth Equity | | $ | 775,301,189 | | | $ | 878,433,592 | |
Transactions in options written for the six months ended March 31, 2013, were as follows:
| | | | | | | | |
| Flexible Equity | |
| | | Calls | |
| | | Contracts | | | Premiums
Received | |
Outstanding options, beginning of period | | | 4,620 | | | $ | 595,443 | |
Options written | | | 45,095 | | | | 5,360,978 | |
Options exercised | | | (5,343 | ) | | | (822,420 | ) |
Options expired | | | (10,315 | ) | | | (1,101,202 | ) |
Options closed | | | (32,271 | ) | | | (3,913,451 | ) |
Outstanding options, end of period | | | 1,786 | | | $ | 119,348 | |
|
| Mid-Cap Growth Equity | |
| | | Calls | |
| | | Contracts | | | Premiums
Received | |
Outstanding options, beginning of period | | | 325 | | | $ | 42,265 | |
Options expired | | | (325 | ) | | | (42,265 | ) |
Outstanding options, end of period | | | — | | | | — | |
| | | | | | |
| | | | |
| | | | | | | |
| 44 | | BLACKROCK FUNDS | | MARCH 31, 2013 | | |
| | |
|
Notes to Financial Statements (continued) | | |
| | | | | | | | |
| Small Cap Growth Equity | |
| | | Calls | |
| | | Contracts | | | Premiums
Received | |
Outstanding options, beginning of period | | | 2,598 | | | $ | 349,137 | |
Options expired | | | (2,598) | | | | (349,137 | ) |
Outstanding options, end of period | | | — | | | | — | |
5. Income Tax Information:
As of September 30, 2012, the Funds had capital loss carryforwards available to offset future realized capital gains through the indicated expiration dates:
| | | | | | | | |
| Expires September 30, | | Flexible
Equity | | | Mid-Cap
Growth
Equity | |
2017 | | | — | | | $ | 3,364,529 | |
2018 | | $ | 84,814,594 | | | | 169,281 | |
Total | | $ | 84,814,594 | | | $ | 3,533,810 | |
As of March 31, 2013, gross unrealized appreciation and gross unrealized depreciation based on cost for federal income tax purposes were as follows:
| | | | | | | | | | | | |
| | | Flexible Equity | | | Mid-Cap
Growth Equity | | | Small Cap Growth Equity | |
Tax cost | | $ | 645,758,988 | | | $ | 290,568,741 | | | $ | 1,448,258,884 | |
Gross unrealized appreciation | | $ | 104,268,189 | | | $ | 35,390,791 | | | $ | 323,513,129 | |
Gross unrealized depreciation | | | (8,139,255 | ) | | | (1,863,661 | ) | | | (32,706,230 | ) |
Net unrealized appreciation | | $ | 96,128,934 | | | $ | 33,527,130 | | | $ | 290,806,899 | |
6. Borrowings:
The Trust, on behalf of the Funds, along with certain other funds managed by the Manager and its affiliates, is a party to a $500 million credit agreement with a group of lenders. The Funds may borrow under the credit agreement to fund shareholder redemptions. Effective November 2011 to November 2012, the credit agreement had the following terms: a commitment fee of 0.065% per annum based on the Fund’s pro rata share of the unused portion of the credit agreement and interest at a rate equal to the higher of (a) the one-month London Interbank Offered Rate (“LIBOR”) plus 0.80% per annum or (b) the Fed Funds rate plus 0.80% per annum on amounts borrowed. In addition, the Fund paid administration and arrangement fees which were allocated to the Fund based on its net assets as of October 31, 2011. The credit agreement, which expired in November 2012, was renewed until November 2013. Effective November 2012 to November 2013, the credit agreement had the following terms: a commitment fee of 0.065% per annum based on the Funds’ pro rata share of the unused portion of the credit agreement and interest at a rate equal to the higher of (a) the one-month London Interbank Offered Rate (“LIBOR”) plus 0.80% per annum or (b) the Fed
Funds rate plus 0.80% per annum on amounts borrowed. In addition, the Funds paid administration and arrangement fees which were allocated to the Funds based on their net assets as of October��31, 2012. The Funds did not borrow under the credit agreement during the six months ended March 31, 2013.
7. Concentration, Market and Credit Risk:
In the normal course of business, the Funds invest in securities and enter into transactions where risks exist due to fluctuations in the market (market risk) or failure of the issuer of a security to meet all its obligations (issuer credit risk). The value of securities held by the Funds may decline in response to certain events, including those directly involving the issuers whose securities are owned by the Funds; conditions affecting the general economy; overall market changes; local, regional or global political, social or economic instability; and currency and interest rate and price fluctuations. Similar to issuer credit risk, the Funds may be exposed to counterparty credit risk, or the risk that an entity with which the Funds have unsettled or open transactions may fail to or be unable to perform on its commitments. The Funds manage counterparty credit risk by entering into transactions only with counterparties that they believe have the financial resources to honor their obligations and by monitoring the financial stability of those counterparties. Financial assets, which potentially expose the Funds to market, issuer and counterparty credit risks, consist principally of financial instruments and receivables due from counterparties. The extent of the Funds’ exposure to market, issuer and counterparty credit risks with respect to these financial assets is generally approximated by their value recorded in the Statements of Assets and Liabilities, less any collateral held by the Funds.
As of March 31, 2013, Flexible Equity invested a significant portion of its assets in securities in the information technology and energy sectors. Mid-Cap Growth Equity invested a significant portion of its assets in securities in the consumer discretionary sector. Small Cap Growth Equity invested a significant portion of its assets in securities in the information technology and health care sectors. Changes in economic conditions affecting the information technology, energy, consumer discretionary and health care sectors would have a greater impact on the Funds and could affect the value, income and/or liquidity of positions in such securities.
| | | | | | |
| | | | |
| | | | | | | |
| | BLACKROCK FUNDS | | MARCH 31, 2013 | | 45 |
| | |
| | |
Notes to Financial Statements (continued) | | |
8. Capital Share Transactions:
Transactions in capital shares for each class were as follows:
| | | | | | | | | | | | | | | | | | |
| | | Six Months Ended March 31, 2013 | | | | | Year Ended September 30, 2012 | |
| Flexible Equity | | Shares | | | Amount | | | | | Shares | | | Amount | |
Institutional | | | | | | | | | | | | | | | | | | |
Shares sold | | | 883,852 | | | $ | 11,014,270 | | | | | | 3,731,617 | | | $ | 43,003,310 | |
Shares issued in reinvestment of dividends | | | 78,980 | | | | 961,390 | | | | | | 137,628 | | | | 1,496,015 | |
Shares redeemed | | | (6,333,327 | ) | | | (79,352,556 | ) | | | | | (12,425,386 | ) | | | (143,027,218 | ) |
Net decrease | | | (5,370,495 | ) | | $ | (67,376,896 | ) | | | | | (8,556,141 | ) | | $ | (98,527,893 | ) |
| | | | | |
| | | | | | | | | | | | | | | | | | |
Service | | | | | | | | | | | | | | | | | | |
Shares sold | | | 1,997 | | | $ | 24,724 | | | | | | 25,128 | | | $ | 283,156 | |
Shares issued in reinvestment of dividends | | | 344 | | | | 4,137 | | | | | | 670 | | | | 7,167 | |
Shares redeemed | | | (25,976 | ) | | | (317,516 | ) | | | | | (77,438 | ) | | | (902,601 | ) |
Net decrease | | | (23,635 | ) | | $ | (288,655 | ) | | | | | (51,640 | ) | | $ | (612,278 | ) |
| | | | | |
| | | | | | | | | | | | | | | | | | |
Investor A | | | | | | | | | | | | | | | | | | |
Shares sold and automatic conversion of shares | | | 1,785,796 | | | $ | 21,590,149 | | | | | | 5,688,063 | | | $ | 64,366,809 | |
Shares issued in reinvestment of dividends | | | 392,256 | | | | 4,639,297 | | | | | | 341,640 | | | | 3,604,318 | |
Shares redeemed | | | (11,100,845 | ) | | | (133,804,153 | ) | | | | | (17,231,026 | ) | | | (195,319,007 | ) |
Net decrease | | | (8,922,793 | ) | | $ | (107,574,707 | ) | | | | | (11,201,323 | ) | | $ | (127,347,880 | ) |
| | | | | |
| | | | | | | | | | | | | | | | | | |
Investor B | | | | | | | | | | | | | | | | | | |
Shares sold | | | 6,639 | | | $ | 72,628 | | | | | | 11,389 | | | $ | 116,032 | |
Shares issued in reinvestment of dividends | | | 964 | | | | 10,535 | | | | | | — | | | | — | |
Shares redeemed and automatic conversion of shares | | | (348,513 | ) | | | (3,800,954 | ) | | | | | (1,472,614 | ) | | | (15,063,208 | ) |
Net decrease | | | (340,910 | ) | | $ | (3,717,791 | ) | | | | | (1,461,225 | ) | | $ | (14,947,176 | ) |
| | | | | |
| | | | | | | | | | | | | | | | | | |
Investor C | | | | | | | | | | | | | | | | | | |
Shares sold | | | 214,169 | | | $ | 2,344,567 | | | | | | 589,178 | | | $ | 6,007,610 | |
Shares issued in reinvestment of dividends | | | 16,337 | | | | 175,633 | | | | | | — | | | | — | |
Shares redeemed | | | (1,497,634 | ) | | | (16,329,945 | ) | | | | | (3,183,829 | ) | | | (32,459,585 | ) |
Net decrease | | | (1,267,128 | ) | | $ | (13,809,745 | ) | | | | | (2,594,651 | ) | | $ | (26,451,975 | ) |
| | | | | |
| | | | | | | | | | | | | | | | | | |
Class R | | | | | | | | | | | | | | | | | | |
Shares sold | | | — | | | | — | | | | | | 32,938 | | | $ | 379,797 | |
Shares issued in reinvestment of dividends | | | 14,486 | | | $ | 179,045 | | | | | | 207 | | | | 2,690 | |
Shares redeemed | | | (18,326 | ) | | | (230,399 | ) | | | | | (22,155 | ) | | | (264,698 | ) |
Net increase (decrease) | | | (3,840 | ) | | $ | (51,354 | ) | | | | | 10,990 | | | $ | 117,789 | |
Total Net Decrease | | | (15,928,801 | ) | | $ | (192,819,148 | ) | | | | | (23,853,990 | ) | | $ | (267,769,413 | ) |
| | | | | | |
| | | | | | | |
| 46 | | BLACKROCK FUNDS | | MARCH 31, 2013 | | |
| | |
| | |
Notes to Financial Statements (continued) | | |
| | | | | | | | | | | | | | | | | | |
| ) | | Six Months Ended March 31, 2013 | | | | | Year Ended September 30, 2012 | |
| Mid-Cap Growth Equity | | Shares | | | Amount | | | | | Shares | | | Amount | |
Institutional | | | | | | | | | | | | | | | | | | |
Shares sold | | | 56,856 | | | $ | 797,488 | | | | | | 327,408 | | | $ | 4,337,692 | |
Shares redeemed | | | (257,217 | ) | | | (3,429,856 | ) | | | | | (706,323 | ) | | | (9,219,532 | ) |
Net decrease | | | (200,361 | ) | | $ | (2,632,368 | ) | | | | | (378,915 | ) | | $ | (4,881,840 | ) |
| | | | | |
| | | | | | | | | | | | | | | | | | |
Service | | | | | | | | | | | | | | | | | | |
Shares sold | | | 12,629 | | | $ | 165,103 | | | | | | 99,437 | | | $ | 1,219,125 | |
Shares redeemed | | | (16,004 | ) | | | (210,489 | ) | | | | | (21,433 | ) | | | (270,418 | ) |
Net increase (decrease) | | | (3,375 | ) | | $ | (45,386 | ) | | | | | 78,004 | | | $ | 948,707 | |
| | | | | |
| | | | | | | | | | | | | | | | | | |
Investor A | | | | | | | | | | | | | | | | | | |
Shares sold and automatic conversion of shares | | | 427,144 | | | $ | 5,511,486 | | | | | | 1,630,591 | | | $ | 19,744,816 | |
Shares redeemed | | | (1,764,507 | ) | | | (22,453,127 | ) | | | | | (5,369,160 | ) | | | (63,675,315 | ) |
Net decrease | | | (1,337,363 | ) | | $ | (16,941,641 | ) | | | | | (3,738,569 | ) | | $ | (43,930,499 | ) |
| | | | | |
| | | | | | | | | | | | | | | | | | |
Investor B | | | | | | | | | | | | | | | | | | |
Shares sold | | | 1,019 | | | $ | 11,676 | | | | | | 6,933 | | | $ | 73,402 | |
Shares redeemed and automatic conversion of shares | | | (93,715 | ) | | | (1,033,483 | ) | | | | | (385,746 | ) | | | (4,009,480 | ) |
Net decrease | | | (92,696 | ) | | $ | (1,021,807 | ) | | | | | (378,813 | ) | | $ | (3,936,078 | ) |
| | | | | |
| | | | | | | | | | | | | | | | | | |
Investor C | | | | | | | | | | | | | | | | | | |
Shares sold | | | 94,642 | | | $ | 1,046,948 | | | | | | 260,985 | | | $ | 2,700,519 | |
Shares redeemed | | | (192,899 | ) | | | (2,130,781 | ) | | | | | (384,665 | ) | | | (4,022,564 | ) |
Net decrease | | | (98,257 | ) | | $ | (1,083,833 | ) | | | | | (123,680 | ) | | $ | (1,322,045 | ) |
| | | | | |
Class R | | | | | | | | | | | | | | | | | | |
Shares sold | | | 90,293 | | | $ | 1,141,271 | | | | | | 231,657 | | | $ | 2,894,192 | |
Shares redeemed | | | (112,762 | ) | | | (1,415,758 | ) | | | | | (206,773 | ) | | | (2,431,050 | ) |
Net increase (decrease) | | | (22,469 | ) | | $ | (274,487 | ) | | | | | 24,884 | | | $ | 463,142 | |
Total Net Decrease | | | (1,754,791 | ) | | $ | (21,999,522 | ) | | | | | (4,517,089 | ) | | $ | (52,658,613 | ) |
| | | | | | | | | | | | | | | | | | |
Small Cap Growth Equity | | | | | | | | | | | | | | | | | | |
Institutional | | | | | | | | | | | | | | | | | | |
Shares sold | | | 7,679,756 | | | $ | 188,665,055 | | | | | | 10,380,832 | | | $ | 255,861,999 | |
Shares issued in reinvestment of dividends and distributions | | | 4,121,612 | | | | 93,766,649 | | | | | | 1,043,023 | | | | 24,469,310 | |
Shares redeemed | | | (10,226,844 | ) | | | (255,716,369 | ) | | | | | (21,082,184 | ) | | | (515,675,445 | ) |
Net increase (decrease) | | | 1,574,524 | | | $ | 26,715,335 | | | | | | (9,658,329 | ) | | $ | (235,344,136 | ) |
| | | | | |
| | | | | | | | | | | | | | | | | | |
Service | | | | | | | | | | | | | | | | | | |
Shares sold | | | 140,842 | | | $ | 3,323,617 | | | | | | 429,327 | | | $ | 9,882,370 | |
Shares issued in reinvestment of distributions | | | 138,883 | | | | 2,949,869 | | | | | | 28,033 | | | | 618,413 | |
Shares redeemed | | | (191,352 | ) | | | (4,434,347 | ) | | | | | (537,530 | ) | | | (12,325,813 | ) |
Net increase (decrease) | | | 88,373 | | | $ | 1,839,139 | | | | | | (80,170 | ) | | $ | (1,825,030 | ) |
| | | | | | |
| | | | | | | |
| | BLACKROCK FUNDS | | MARCH 31, 2013 | | 47 |
| | |
| | |
Notes to Financial Statements (concluded) | | |
| | | | | | | | | | | | | | | | | | |
| | | Six Months Ended March 31, 2013 | | | | | Year Ended September 30, 2012 | |
| Small Cap Growth Equity (concluded) | | Shares | | | Amount | | | | | Shares | | | Amount | |
Investor A | | | | | | | | | | | | | | | | | | |
Shares sold and automatic conversion of shares | | | 1,584,057 | | | | $35,765,767 | | | | | | 8,081,405 | | | | $177,169,628 | |
Shares issued in reinvestment of distributions | | | 1,800,128 | | | | 36,794,609 | | | | | | 338,833 | | | | 7,223,937 | |
Shares redeemed | | | (2,347,650 | ) | | | (52,743,235 | ) | | | | | (6,705,533 | ) | | | (149,679,475 | ) |
Net increase | | | 1,036,535 | | | | $19,817,141 | | | | | | 1,714,705 | | | | $ 34,714,090 | |
| | | | | |
| | | | | | | | | | | | | | | | | | |
Investor B | | | | | | | | | | | | | | | | | | |
Shares sold | | | 1,497 | | | | $ 28,609 | | | | | | 4,595 | | | | $ 85,311 | |
Shares issued in reinvestment of distributions | | | 9,190 | | | | 157,884 | | | | | | 3,114 | | | | 56,765 | |
Shares redeemed and automatic conversion of shares | | | (17,431 | ) | | | (330,274) | | | | | | (41,356 | ) | | | (784,360) | |
Net decrease | | | (6,744 | ) | | | $(143,781) | | | | | | (33,647 | ) | | | $(642,284) | |
| | | | | |
| | | | | | | | | | | | | | | | | | |
Investor C | | | | | | | | | | | | | | | | | | |
Shares sold | | | 150,771 | | | | $ 2,868,602 | | | | | | 269,675 | | | | $ 5,203,324 | |
Shares issued in reinvestment of distributions | | | 185,401 | | | | 3,168,491 | | | | | | 45,987 | | | | 837,427 | |
Shares redeemed | | | (266,002 | ) | | | (5,067,875 | ) | | | | | (433,308 | ) | | | (8,188,106) | |
Net increase (decrease) | | | 70,170 | | | | $ 969,218 | | | | | | (117,646 | ) | | | $ (2,147,355) | |
Total Net Increase (Decrease) | | | 2,762,858 | | | | $49,197,052 | | | | | | (8,175,087 | ) | | | $(205,244,715) | |
9. Subsequent Events:
Management’s evaluation of the impact of all subsequent events on the Funds’ financial statements was completed through the date the financial statements were issued and the following item was noted:
Effective April 25, 2013, the credit agreement was terminated and a new agreement was entered into. The Funds became a party to a 364-day, $800 million credit agreement, which expires in April 2014. Excluding commitments designated for a certain individual fund, the Funds can borrow up to an aggregate commitment amount of $500 million, subject to asset coverage and other limitations as specified in the agreement. The credit agreement has the following terms: a fee of 0.065% per annum on unused commitment amounts and interest at a rate equal to the higher of (a) the one-month LIBOR plus 0.80% per annum or (b) the Fed Funds rate plus 0.80% per annum on amounts borrowed.
| | | | | | |
| | | | |
| | | | | | | |
| 48 | | BLACKROCK FUNDS | | MARCH 31, 2013 | | |
Ronald W. Forbes, Co-Chairman of the Board and Trustee
Rodney D. Johnson, Co-Chairman of the Board and Trustee
Paul L. Audet, Trustee
David O. Beim, Trustee
Henry Gabbay, Trustee
Dr. Matina S. Horner, Trustee
Herbert I. London, Trustee
Ian A. MacKinnon, Trustee
Cynthia A. Montgomery, Trustee
Joseph P . Platt, Trustee
Robert C. Robb, Jr., Trustee
Toby Rosenblatt, Trustee
Kenneth L. Urish, Trustee
Frederick W. Winter, Trustee
John M. Perlowski, President and Chief Executive Officer
Richard Hoerner, CFA, Vice President
Brendan Kyne, Vice President
Christopher Stavrakos, CFA, Vice President
Neal Andrews, Chief Financial Officer
Jay Fife, Treasurer
Brian Kindelan, Chief Compliance Officer and Anti-Money Laundering Officer
Benjamin Archibald, Secretary
Investment Advisor and Co-Administrator
BlackRock Advisors, LLC
Wilmington, DE 19809
Accounting Agent, Co-Administrator and Transfer Agent
BNY Mellon Investment Servicing (US) Inc.
Wilmington, DE 19809
Custodian
The Bank of New York Mellon
New York, NY 10286
Distributor
BlackRock Investments, LLC
New York, NY 10022
Legal Counsel
Sidley Austin LLP
New York, NY 10019
Independent Registered Public Accounting Firm
Deloitte & Touche LLP
Philadelphia, PA 19103
Address of the Trust
100 Bellevue Parkway
Wilmington, DE 19809
| | | | | | |
| | | | | | | |
| | BLACKROCK FUNDS | | MARCH 31, 2013 | | 49 |
Electronic Delivery
Electronic copies of most financial reports and prospectuses are available on the Funds’ website or shareholders can sign up for e-mail notifications of quarterly statements, annual and semi-annual reports and prospectuses by enrolling in the Funds’ electronic delivery program.
To enroll:
Shareholders Who Hold Accounts with Investment Advisors, Banks or Brokerages:
Please contact your financial advisor. Please note that not all investment advisors, banks or brokerages may offer this service.
Shareholders Who Hold Accounts Directly with BlackRock:
| 1) | Access the BlackRock website at http://www.blackrock.com/ edelivery |
| 2) | Select “eDelivery” under the “More Information” section |
Householding
The Funds will mail only one copy of shareholder documents, including prospectuses, annual and semi-annual reports and proxy statements, to shareholders with multiple accounts at the same address. This practice is commonly called “householding” and is intended to reduce expenses and eliminate duplicate mailings of shareholder documents. Mailings of your shareholder documents may be householded indefinitely unless you instruct us otherwise. If you do not want the mailing of these documents to be combined with those for other members of your household, please contact the Funds at (800) 441-7762.
Availability of Quarterly Schedule of Investments
The Funds file their complete schedule of portfolio holdings with the SEC for the first and third quarters of each fiscal year on Form N-Q. The Funds’ Forms N-Q are available on the SEC’s website at http:// www.sec.gov and may also be reviewed and copied at the SEC’s Public Reference Room in Washington, D.C. Information on how to access documents on the SEC’s website without charge may be obtained by calling (800) SEC-0330. The Funds’ Forms N-Q may also be obtained upon request and without charge by calling (800) 441-7762.
Availability of Proxy Voting Policies and Procedures
A description of the policies and procedures that the Funds use to determine how to vote proxies relating to portfolio securities is available (1) without charge, upon request, by calling (800) 441-7762; (2) at http://www.blackrock.com; and (3) on the SEC’s website at http:// www.sec.gov.
Availability of Proxy Voting Record
Information about how the Funds voted proxies relating to securities held in the Funds’ portfolios during the most recent 12-month period ended June 30 is available upon request and without charge (1) at http://www.blackrock.com or by calling (800) 441-7762 and (2) on the SEC’s website at http://www.sec.gov.
Account Information
Call us at (800) 441-7762 from 8:00 AM to 6:00 PM EST on any business day to get information about your account balances, recent transactions and share prices. You can also reach us on the Web at http:// www.blackrock.com/funds.
Automatic Investment Plans
Investor Class shareholders who want to invest regularly can arrange to have $50 or more automatically deducted from their checking or savings account and invested in any of the BlackRock funds.
Systematic Withdrawal Plan
Investor Class shareholders can establish a systematic withdrawal plan and receive periodic payments of $50 or more from their BlackRock funds, as long as their account balance is at least $10,000.
Retirement Plans
Shareholders may make investments in conjunction with Traditional, Rollover, Roth, Coverdell, Simple IRAs, SEP IRAs and 403(b) Plans.
| | | | | | |
| | | | | | | |
| 50 | | BLACKROCK FUNDS | | MARCH 31, 2013 | | |
| | |
| | |
Additional Information (concluded) | | |
|
| BlackRock Privacy Principles |
BlackRock is committed to maintaining the privacy of its current and former fund investors and individual clients (collectively, “Clients”) and to safeguarding their non-public personal information. The following information is provided to help you understand what personal information BlackRock collects, how we protect that information and why in certain cases we share such information with select parties.
If you are located in a jurisdiction where specific laws, rules or regulations require BlackRock to provide you with additional or different privacy-related rights beyond what is set forth below, then BlackRock will comply with those specific laws, rules or regulations.
BlackRock obtains or verifies personal non-public information from and about you from different sources, including the following: (i) information we receive from you or, if applicable, your financial intermediary, on applications, forms or other documents; (ii) information about your transactions with us, our affiliates, or others; (iii) information we receive from a consumer reporting agency; and (iv) from visits to our websites.
BlackRock does not sell or disclose to non-affiliated third parties any non-public personal information about its Clients, except as permitted by law or as is necessary to respond to regulatory requests or to service Client accounts. These non-affiliated third parties are required to protect the confidentiality and security of this information and to use it only for its intended purpose.
We may share information with our affiliates to service your account or to provide you with information about other BlackRock products or services that may be of interest to you. In addition, BlackRock restricts access to non-public personal information about its Clients to those BlackRock employees with a legitimate business need for the information. BlackRock maintains physical, electronic and procedural safeguards that are designed to protect the non-public personal information of its Clients, including procedures relating to the proper storage and disposal of such information.
| | | | | | |
| | | | | | | |
| | BLACKROCK FUNDS | | MARCH 31, 2013 | | 51 |
| | |
| | |
A World-Class Mutual Fund Family | | |
BlackRock offers a diverse lineup of open-end mutual funds crossing all investment styles and managed by experts in equity, fixed income and tax-exempt investing.
| | | | |
Equity Funds | | | | |
BlackRock ACWI ex-US Index Fund | | BlackRock Global Long/Short Equity Fund | | BlackRock Mid-Cap Value Opportunities Fund |
BlackRock All-Cap Energy & Resources Portfolio | | BlackRock Global Opportunities Portfolio | | BlackRock Natural Resources Trust |
BlackRock Basic Value Fund | | BlackRock Global SmallCap Fund | | BlackRock Pacific Fund |
BlackRock Capital Appreciation Fund | | BlackRock Health Sciences Opportunities Portfolio | | BlackRock Real Estate Securities Fund |
BlackRock China Fund | | BlackRock India Fund | | BlackRock Russell 1000 Index Fund |
BlackRock Commodity Strategies Fund | | BlackRock International Fund | | BlackRock Science & Technology |
BlackRock Disciplined Small Cap Core Fund | | BlackRock International Index Fund | | Opportunities Portfolio |
BlackRock Emerging Markets Fund | | BlackRock International Opportunities Portfolio | | BlackRock Small Cap Growth Equity Portfolio |
BlackRock Emerging Markets Long/Short
Equity Fund | | BlackRock Large Cap Core Fund BlackRock Large Cap Core Plus Fund | | BlackRock Small Cap Growth Fund II BlackRock Small Cap Index Fund |
BlackRock Energy & Resources Portfolio | | BlackRock Large Cap Growth Fund | | BlackRock S&P 500 Stock Fund |
BlackRock Equity Dividend Fund | | BlackRock Large Cap Value Fund | | BlackRock U.S. Opportunities Portfolio |
BlackRock EuroFund | | BlackRock Latin America Fund | | BlackRock Value Opportunities Fund |
BlackRock Flexible Equity Fund | | BlackRock Long-Horizon Equity Fund | | BlackRock World Gold Fund |
BlackRock Focus Growth Fund | | BlackRock Mid-Cap Growth Equity Portfolio | | |
BlackRock Global Dividend Income Portfolio | | | | |
| | | | |
Taxable Fixed Income Funds | | | | |
BlackRock Bond Index Fund | | BlackRock High Yield Bond Portfolio | | BlackRock Strategic Income |
BlackRock Core Bond Portfolio | | BlackRock Inflation Protected Bond Portfolio | | Opportunities Portfolio |
BlackRock CoreAlpha Bond Fund | | BlackRock International Bond Portfolio | | BlackRock Total Return Fund |
BlackRock Emerging Market Local Debt Portfolio | | BlackRock Long Duration Bond Portfolio | | BlackRock U.S. Government Bond Portfolio |
BlackRock Floating Rate Income Portfolio | | BlackRock Low Duration Bond Portfolio | | BlackRock U.S. Mortgage Portfolio |
BlackRock Global Long/Short Credit Fund | | BlackRock Secured Credit Portfolio | | BlackRock Ultra-Short Obligations Fund |
BlackRock GNMA Portfolio | | BlackRock Short Obligations Fund | | BlackRock World Income Fund |
| | BlackRock Short-Term Treasury Fund | | |
| | | | |
Municipal Fixed Income Funds | | | | |
BlackRock California Municipal Bond Fund | | BlackRock National Municipal Fund | | BlackRock Pennsylvania Municipal Bond Fund |
BlackRock High Yield Municipal Fund | | BlackRock New Jersey Municipal Bond Fund | | BlackRock Short-Term Municipal Fund |
BlackRock Intermediate Municipal Fund | | BlackRock New York Municipal Bond Fund | | |
| | | | |
| | | | | | | | | | | | | | |
Mixed Asset Funds | | | | | | | | | | | | | | |
BlackRock Balanced Capital Fund | | LifePath Active Portfolios | | LifePath Index Portfolios |
BlackRock Emerging Market Allocation Portfolio | | 2015 | | 2040 | | | | Retirement | | | 2040 | | | |
BlackRock Global Allocation Fund | | 2020 | | 2045 | | | | 2020 | | | 2045 | | | |
BlackRock Managed Volatility Portfolio | | 2025 | | 2050 | | | | 2025 | | | 2050 | | | |
BlackRock Multi-Asset Income Portfolio | | 2030 | | 2055 | | | | 2030 | | | 2055 | | | |
BlackRock Multi-Asset Real Return Fund | | 2035 | | | | | | 2035 | | | | | | |
BlackRock Strategic Risk Allocation Fund | | | | | | | | | | | | | | |
| | | | | |
| | LifePath Portfolios | | | | | | | | | | |
BlackRock Prepared Portfolios | | Retirement | | 2040 | | | | | | | | | | |
Conservative Prepared Portfolio | | 2020 | | 2045 | | | | | | | | | | |
Moderate Prepared Portfolio | | 2025 | | 2050 | | | | | | | | | | |
Growth Prepared Portfolio | | 2030 | | 2055 | | | | | | | | | | |
Aggressive Growth Prepared Portfolio | | 2035 | | | | | | | | | | | | |
BlackRock mutual funds are currently distributed by BlackRock Investments, LLC. You should consider the investment objectives, risks, charges and expenses of the funds under consideration carefully before investing. Each fund’s prospectus contains this and other information and is available at www.blackrock.com or by calling (800) 441-7762 or from your financial advisor. The prospectus should be read carefully before investing.
| | | | | | |
| | | | | | | |
52 | | BLACKROCK FUNDS | | MARCH 31, 2013 | | |

Table of Contents
| | | | |
| | | | | MARCH 31, 2013 |
| 2 | | BLACKROCK FUNDS | |
Dear Shareholder
Despite continued global headwinds, risk assets (such as equities) have generated strong performance as investors sought meaningful yields in the ongoing low-interest-rate environment. About this time one year ago, concerns about Europe’s debt crisis dominated the markets as political instability in Greece and severe deficit and liquidity problems in Spain raised the specter of a full-blown euro collapse. Investors were also discouraged by gloomy economic reports from various parts of the world, particularly in China. As the outlook for the global economy worsened, however, investors grew increasingly optimistic that the world’s largest central banks would intervene to stimulate growth. This theme, along with the European Central Bank’s (“ECB’s”) firm commitment to preserve the euro currency bloc, drove most asset classes higher through the summer of 2012. In early September, the ECB announced it would purchase unlimited amounts of short term sovereign bonds to support the region’s debt-laden countries. Days later, the US Federal Reserve announced its own much-anticipated stimulus package.
Although financial markets world-wide were buoyed by these aggressive policy actions, risk assets weakened in the fall of 2012. Global trade began to slow as many European countries fell into recession and growth continued to decelerate in China. In the United States, stocks slid on lackluster corporate earnings and volatility rose in advance of the US Presidential election. In the post-election environment, investors grew increasingly concerned over the “fiscal cliff,” the automatic tax increases and spending cuts that had been scheduled to take effect at the beginning of 2013. There was widespread fear that the fiscal cliff would push the United States into recession unless politicians could agree upon alternate measures to reduce the nation’s deficit. Worries that bipartisan gridlock would preclude a timely budget deal triggered high levels of volatility in financial markets around the world in the months leading up to the last day of the year. Ultimately, the worst of the fiscal cliff was averted with a last-minute tax deal, although the postponement of decisions relating to spending cuts and the debt ceiling left some lingering uncertainty.
Investors shook off the nerve-wracking finale to 2012 and the New Year began with a powerful relief rally in risk assets. Money that had been pulled to the sidelines amid year-end tax-rate uncertainty poured back into the markets in January. Key indicators signaling modest but broad-based improvements in the world’s major economies underpinned the rally. Underlying this aura of comfort was the absence of negative headlines out of Europe. Against this backdrop, global equities surged through January while rising US Treasury yields pressured high quality fixed income assets (as prices move in the opposite direction as yields).
However, bond markets regained strength in February when economic momentum slowed and investors toned down their risk appetite. US stocks continued to rise, but at a more moderate pace. Uncertainty about how long the Federal Reserve would maintain its monetary easing bias drove high levels of volatility later in the month, but these fears abated as the budget sequester (automatic spending cuts scheduled to take effect March 1) began to appear imminent and was deemed likely to deter any near-term changes in the central bank’s policy stance. Improving labor market data and rising home prices pushed US stocks higher at the end of the period, with major indices reaching new all-time highs. Outside the United States, equity prices weakened in the final two months of the period due to a resurgence of macro risk out of Europe. Italy’s February presidential election ended in a stalemate, further propagating the ongoing theme of political instability in the eurozone. In March, a severe banking crisis in Cyprus underscored the fragility of the broader European banking system.
For the 6- and 12-month periods ended March 31, 2013, US and international stocks and high yield bonds posted strong gains, while emerging market equities lagged as the pace of global growth failed to impress investors. US Treasury yields were highly volatile over the past 12 months. While remaining relatively low from a historical standpoint, yields began inching higher in the later part of the period, pressuring Treasuries and investment-grade bonds. Tax-exempt municipal bonds, however, benefited from favorable supply-and-demand dynamics. Near-zero short term interest rates continued to keep yields on money market securities near their all-time lows.
Markets have always been unpredictable, but that does not mean investors can delay taking action. At BlackRock, we believe it’s time for a different approach to investing. One that seeks out more opportunities in more places across a broader array of investments in a portfolio designed to move freely as the markets move up and down. People everywhere are asking, “So what do I do with my money?” Visit www.blackrock.com for answers.
Sincerely,

Rob Kapito
President, BlackRock Advisors, LLC

“Despite continued global headwinds, risk assets (such as equities) have generated strong performance as investors sought meaningful yields in the ongoing low-interest-rate environment.”
Rob Kapito
President, BlackRock Advisors, LLC
Total Returns as of March 31, 2013
| | | | | | | | | | |
| | | 6-month | | 12-month |
US large cap equities | | 10.19% | | 13.96% |
(S&P 500® Index) | | | | |
US small cap equities | | 14.48 | | 16.30 |
(Russell 2000® Index) | | | | |
International equities | | 12.04 | | 11.25 |
(MSCI Europe, Australasia, | | | | |
Far East Index) | | | | |
Emerging market | | 3.87 | | 1.96 |
equities (MSCI Emerging | | | | |
Markets Index) | | | | |
3-month Treasury bill | | 0.06 | | 0.12 |
(BofA Merrill Lynch | | | | |
3-Month US Treasury | | | | |
Bill Index) | | | | |
US Treasury securities | | (0.55) | | 6.19 |
(BofA Merrill Lynch 10- | | | | |
Year US Treasury Index) | | | | |
US investment grade | | 0.09 | | 3.77 |
bonds (Barclays US | | | | |
Aggregate Bond Index) | | | | |
Tax-exempt municipal | | 1.26 | | 5.82 |
bonds (S&P Municipal | | | | |
Bond Index) | | | | |
US high yield bonds | | 6.28 | | 13.08 |
(Barclays US Corporate | | | | |
High Yield 2% Issuer | | | | |
Capped Index) | | | | |
Past performance is no guarantee of future results. Index performance is shown for illustrative purposes only. You cannot invest directly in an index.
| | | | | | |
| | | | | | | |
| | THIS PAGE NOT PART OF YOUR FUND REPORT | | | 3 |
| | |
| Fund Summary as of March 31, 2013 | | BlackRock Global Opportunities Portfolio |
BlackRock Global Opportunities Portfolio’s (the “Fund”) investment objective is to provide long-term capital appreciation.
|
|
Portfolio Management Commentary |
|
How did the Fund perform?
| — | | US and certain other financial markets were closed on March 29, 2013, while some foreign financial markets were open. The Fund was re-priced for financial reporting purposes to reflect, in the valuation, the transactions related to foreign market activities. For the six-month period ended March 31, 2013, the Fund outperformed its benchmark, the MSCI All Country World Index (“ACWI”). |
What factors influenced performance?
| — | | The Fund’s outperformance was driven by good stock selection in nine of the ten benchmark index sectors while, from a geographic perspective, positions in the United States and emerging Asia enhanced results. Stock selection in industrials was the largest relative contributor. Several capital goods holdings such as United Rentals, Inc., Eaton Corp. and Hino Motors Ltd. delivered stand-out performance, as did German airliner Deutsche Lufthansa AG and US car rental operator Hertz Global Holdings, Inc. Cost savings associated with massive industry restructuring and consolidation since the onset of the financial crisis have resulted in better operating and profitability measures for many of these now higher quality businesses. Other factors that drove positive relative performance included overweights to packaged foods & meats in consumer staples and large-cap pharmaceuticals and biotechnology holdings in the health care sector. These segments performed well as strong cash flow attributes, and pipeline innovation in the case of biotechnology, attracted investors seeking income and growth in the low interest rate environment. |
| — | | Energy was among the weaker sectors in the benchmark index and the only sector where the Fund’s positioning detracted from performance. Exposure to the offshore oil & gas drilling and services segments had a negative impact on results amid declining prices for these commodities. |
While there have been several factors at play, a combination of a stronger US dollar and more moderate economic data out of China are commonly cited for the recent commodity price weakness. On a regional basis, stock selection in Europe and developed Asia ex-Japan detracted from the Fund’s performance. Most notably, while eurozone instability has persisted for an extended period of time, the conditions of the latest bailout package for Cyprus added to pressures on the Fund’s euro-centric positions.
Describe recent portfolio activity.
| — | | During the six-month period, the Fund pared back its US equity exposure to a slight underweight versus the benchmark index, with most of the selling within information technology, telecommunication services and utilities. The proceeds were rotated into stock-specific growth ideas in emerging Asia as well as more defensive stocks within health care and consumer staples in core Europe. The Fund also added to Japanese equities while hedging exposure to the yen through the use of currency forward contracts. |
Describe portfolio positioning at period end.
| — | | At period end, the Fund’s holdings reflected a preference for well-capitalized businesses with the ability to consistently grow and generate cash flow in excess of their cost of capital. These companies, more often than not, have re-invested in their businesses, restructured, and are now among the lowest cost producers in their respective industries and hold significant market share. The Fund’s regional positioning was consistent with the view that economies around the world continue to recover. The Fund maintained a bias toward globally oriented companies domiciled in the United States and Europe, while reflecting optimism for Japan and general caution with respect to emerging markets. |
The views expressed reflect the opinions of BlackRock as of the date of this report and are subject to change based on changes in market, economic or other conditions. These views are not intended to be a forecast of future events and are no guarantee of future results.
| | |
| Ten Largest Holdings | | Percent of Long-Term Investments |
|
Bank of America Corp. | | 2% |
Svenska Cellulosa AB, B Shares | | 1 |
Roche Holding AG | | 1 |
AIA Group Ltd. | | 1 |
Pfizer, Inc. | | 1 |
esure Group Plc | | 1 |
Bristol-Myers Squibb Co. | | 1 |
Citigroup, Inc. | | 1 |
China Construction Bank Corp., H Shares | | 1 |
Eni SpA | | 1 |
|
| | |
| Geographic Allocation | | Percent of Long-Term Investments |
|
United States | | 47% |
United Kingdom | | 13 |
Switzerland | | 9 |
Japan | | 7 |
France | | 4 |
Indonesia | | 3 |
Germany | | 3 |
Sweden | | 2 |
Italy | | 2 |
Other1 | | 10 |
|
| | 1 | Other includes a 1% or less investment in each of the following countries: Mexico, Hong Kong, Ireland, China, Belgium, India, Cyprus, Thailand, Spain, Tawain, Canada, Argentina and Australia. |
| | | | |
| | | | | |
| 4 | | BLACKROCK FUNDS | | MARCH 31, 2013 |
BlackRock Global Opportunities Portfolio
|
|
Total Return Based on a $10,000 Investment |
|
|
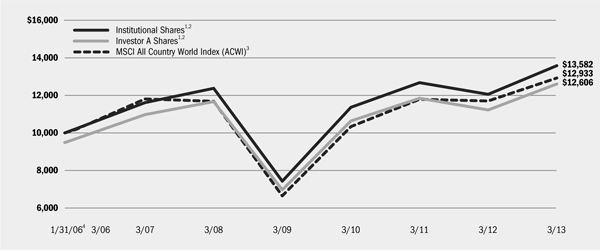
1 Assuming maximum sales charges, if any, transaction costs and other operating expenses, including investment advisory fees. Institutional Shares do not have a sales charge. 2 Under normal market conditions, the Fund invests at least 75% of its total assets in global equity securities of any market capitalization, selected for their above-average return potential. The Fund may invest up to 25% of its total assets in stocks of issuers in emerging market countries. The Fund may also invest up to 25% of its total assets in global fixed income securities, including emerging market debt. 3 A free float-adjusted market capitalization weighted index that is designed to measure the equity market performance of developed and emerging markets. The MSCI All Country World Index consists of 45 country indices comprising 24 developed and 21 emerging market country indices. 4 Commencement of operations. |
|
|
Performance Summary for the Period Ended March 31, 2013 |
|
| | | | | | | | | | | | | | | | | | | | | | | | | | | | |
| | | | | | Average Annual Total Returns5 | |
| | | | | | 1 Year | | | 5 Years | | | Since Inception6 | |
| | | 6-Month
Total Returns | | | w/o sales
charge | | | w/sales
charge | | | w/o sales
charge | | | w/sales
charge | | | w/o sales
charge | | | w/sales
charge | |
Institutional | | | 12.46% | | | | 12.66% | | | | N/A | | | | 1.87% | | | | N/A | | | | 4.37% | | | | N/A | |
Investor A | | | 12.24 | | | | 12.34 | | | | 6.44% | | | | 1.57 | | | | 0.49% | | | | 4.06 | | | | 3.29% | |
Investor B | | | 11.74 | | | | 11.43 | | | | 6.93 | | | | 0.79 | | | | 0.40 | | | | 3.29 | | | | 3.29 | |
Investor C | | | 11.80 | | | | 11.49 | | | | 10.49 | | | | 0.78 | | | | 0.78 | | | | 3.29 | | | | 3.29 | |
Class R | | | 12.09 | | | | 11.99 | | | | N/A | | | | 1.21 | | | | N/A | | | | 3.69 | | | | N/A | |
| | | | | | | | | | | | | | | | | | | | | | | | | | | | |
MSCI All Country World Index (ACWI) | | | 9.57 | | | | 10.55 | | | | N/A | | | | 2.06 | | | | N/A | | | | 3.65 | | | | N/A | |
| | 5 | Assuming maximum sales charges, if any. Average annual total returns with and without sales charges reflect reductions for distribution and service fees. See “About Fund Performance” on page 14 for a detailed description of share classes, including any related sales charges and fees. |
| | 6 | The Fund commenced operations on January 31, 2006. |
N/A - Not applicable as share class and index do not have a sales charge.
Past performance is not indicative of future results.
| | | | | | | | | | | | | | | | | | | | | | | | | | | | | | | | | | | |
| | | Actual | | Hypothetical8 | | |
| | | Beginning
Account Value
October 1, 2012 | | Ending
Account Value
March 31, 2013 | | Expenses Paid
During the Period7 | | Beginning
Account Value
October 1, 2012 | | Ending
Account Value
March 31, 2013 | | Expenses Paid
During the Period7 | | Annualized
Expense
Ratio |
Institutional | | | $ | 1,000.00 | | | | $ | 1,124.60 | | | | $ | 5.61 | | | | $ | 1,000.00 | | | | $ | 1,019.65 | | | | $ | 5.34 | | | | | 1.06 | % |
Investor A | | | $ | 1,000.00 | | | | $ | 1,122.40 | | | | $ | 7.04 | | | | $ | 1,000.00 | | | | $ | 1,018.30 | | | | $ | 6.69 | | | | | 1.33 | % |
Investor B | | | $ | 1,000.00 | | | | $ | 1,117.40 | | | | $ | 11.51 | | | | $ | 1,000.00 | | | | $ | 1,014.06 | | | | $ | 10.95 | | | | | 2.18 | % |
Investor C | | | $ | 1,000.00 | | | | $ | 1,118.00 | | | | $ | 11.30 | | | | $ | 1,000.00 | | | | $ | 1,014.26 | | | | $ | 10.75 | | | | | 2.14 | % |
Class R | | | $ | 1,000.00 | | | | $ | 1,120.90 | | | | $ | 9.09 | | | | $ | 1,000.00 | | | | $ | 1,016.36 | | | | $ | 8.65 | | | | | 1.72 | % |
| | 7 | For each class of the Fund, expenses are equal to the annualized expense ratio for the class, multiplied by the average account value over the period, multiplied by 182/365 (to reflect the one-half year period shown). |
| | 8 | Hypothetical 5% annual return before expenses is calculated by pro rating the number of days in the most recent fiscal half year divided by 365. |
See “Disclosure of Expenses” on page 15 for further information on how expenses were calculated.
| | | | | | |
| | | | | MARCH 31, 2013 | | |
| | BLACKROCK FUNDS | | | 5 |
| | |
| Fund Summary as of March 31, 2013 | | BlackRock Health Sciences Opportunities Portfolio |
BlackRock Health Sciences Opportunities Portfolio’s (the “Fund”) investment objective is to provide long-term growth of capital.
|
|
Portfolio Management Commentary |
|
How did the Fund perform?
| — | | For the six-month period ended March 31, 2013, the Fund outperformed its benchmark, the Russell 3000® Health Care Index, and the broad-market S&P 500® Index. The following discussion of relative performance pertains to the Russell 3000® Health Care Index. |
What factors influenced performance?
| — | | The Fund outperformed the benchmark index due to positive stock selection in the health care equipment & supplies, pharmaceuticals and health care providers & services industries. The Fund’s overweight allocation and stock selection in biotechnology was also beneficial to relative performance. |
| — | | Detracting from performance was the Fund’s overweight in health care supplies as this sub-industry lagged the benchmark return during the period. In the health care facilities sub-industry, a lack of exposure to several strong-performing hospital stocks hindered results. Lastly, a few positions in biotechnology detracted from returns due to stock-specific events. |
Describe recent portfolio activity.
| — | | During the first half of the six-month period, the Fund took profits on several biotechnology holdings that had experienced strong price appreciation. These proceeds were invested in several pharmaceutical companies selected for their fundamental merits and attractive valuations. In the |
| | | latter half of the period, exposure to the health care providers & services industry decreased slightly as a result of the Fund reducing its allocation to managed health care stocks amid policy uncertainty. These proceeds were invested in biotechnology names. |
Describe portfolio positioning at period end.
| — | | As of period end, the Fund continued to maintain a focus on innovative companies that seek to satisfy an unmet health care need or enhance current products or services. As a result, the Fund continued to be most heavily weighted toward the biotechnology and pharmaceuticals industries. Additionally, the Fund maintained exposure to companies deemed likely to benefit from the implementation of health care reform legislation. |
| — | | Overall, Fund management remains constructive on the health care sector. Policy uncertainty has diminished as the implementation of health care reform legislation has been slated for 2014. Furthermore, the new legislation is expected to benefit health care companies by creating increased consumer demand. Additionally, innovation has been improving, particularly in pharmaceutical and biotechnology industries, which enhances the long-term growth outlook for those stocks. Valuations in the health care sector generally remain attractive despite recent strong performance. |
The views expressed reflect the opinions of BlackRock as of the date of this report and are subject to change based on changes in market, economic or other conditions. These views are not intended to be a forecast of future events and are no guarantee of future results.
| | | | | |
| Ten Largest Holdings | | Percent of Long-Term Investments |
Pfizer, Inc. | | | | 5% | |
Gilead Sciences, Inc. | | | | 5 | |
Johnson & Johnson | | | | 4 | |
Roche Holding AG | | | | 4 | |
Celgene Corp. | | | | 4 | |
Novartis AG, Registered Shares | | | | 4 | |
Amgen, Inc. | | | | 4 | |
Bristol-Myers Squibb Co. | | | | 3 | |
Eli Lilly & Co. | | | | 3 | |
Sanofi | | | | 3 | |
| | | | | |
| Industry Allocation | | Percent of Long-Term Investments |
Pharmaceuticals | | | | 38% | |
Biotechnology | | | | 24 | |
Health Care Equipment & Supplies | | | | 15 | |
Health Care Providers & Services | | | | 14 | |
Life Sciences Tools & Services | | | | 5 | |
Other1 | | | | 4 | |
| | 1 | Other includes a 1% or less investment in each of the following industries: Food & Staples Retailing, Health Care Technology, Diversified Consumer Services and Industrial Conglomerates. |
For Fund compliance purposes, the Fund’s industry classifications refer to any one or more of the industry sub-classifications used by one or more widely recognized market indexes or ratings group indexes, and/or as defined by Fund management. These definitions may not apply for purposes of this report, which may combine such industry sub-classifications for reporting ease.
| | | | |
| | | | | |
| 6 | | BLACKROCK FUNDS | | MARCH 31, 2013 |
BlackRock Health Sciences Opportunities Portfolio
|
|
Total Return Based on a $10,000 Investment |
|
|
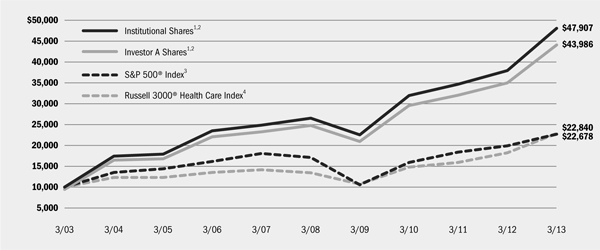
1 Assuming maximum sales charges, if any, transaction costs and other operating expenses, including investment advisory fees. Institutional Shares do not have a sales charge. 2 Under normal market conditions, the Fund invests at least 80% of its total assets in equity securities of companies in health sciences and related industries. 3 This unmanaged index covers 500 industrial, utility, transportation and financial companies of the US markets (mostly New York Stock Exchange (“NYSE”) issues) representing about 75% of NYSE market capitalization and 30% of NYSE issues. 4 This unmanaged index is representative of companies involved in medical services or health care in the Russell 3000® Index, which is comprised of the 3,000 largest US companies as determined by total market capitalization. |
|
|
Performance Summary for the Period Ended March 31, 2013 |
|
| | | | | | | | | | | | | | | | | | | | | | | | | | | | |
| | | | | | Average Annual Total Returns5 | |
| | | | | | 1 Year | | | 5 Years | | | 10 Years | |
| | | 6-Month
Total Returns | | | w/o sales
charge | | | w/sales
charge | | | w/o sales
charge | | | w/sales
charge | | | w/o sales
charge | | | w/sales
charge | |
Institutional | | | 17.92% | | | | 26.54% | | | | N/A | | | | 12.60% | | | | N/A | | | | 16.96% | | | | N/A | |
Service | | | 17.74 | | | | 26.16 | | | | N/A | | | | 12.23 | | | | N/A | | | | 16.62 | | | | N/A | |
Investor A | | | 17.78 | | | | 26.17 | | | | 19.55% | | | | 12.24 | | | | 11.04% | | | | 16.59 | | | | 15.97% | |
Investor B | | | 17.29 | | | | 25.17 | | | | 20.67 | | | | 11.36 | | | | 11.10 | | | | 15.87 | | | | 15.87 | |
Investor C | | | 17.30 | | | | 25.26 | | | | 24.26 | | | | 11.44 | | | | 11.44 | | | | 15.76 | | | | 15.76 | |
Class R | | | 17.53 | | | | 25.68 | | | | N/A | | | | 11.75 | | | | N/A | | | | 16.05 | | | | N/A | |
| | | | | | | | | | | | | | | | | | | | | | | | | | | | |
S&P 500® Index | | | 10.19 | | | | 13.96 | | | | N/A | | | | 5.81 | | | | N/A | | | | 8.53 | | | | N/A | |
Russell 3000® Health Care Index | | | 15.13 | | | | 25.35 | | | | N/A | | | | 11.19 | | | | N/A | | | | 8.61 | | | | N/A | |
| | 5 | Assuming maximum sales charges, if any. Average annual total returns with and without sales charges reflect reductions for distribution and service fees. See “About Fund Performance” on page 14 for a detailed description of share classes, including any related sales charges and fees. |
N/A - Not applicable as share class and index do not have a sales charge.
Past performance is not indicative of future results.
| | | | | | | | | | | | | | | | | | | | | | | | | | | | | | | | | | | |
| | | Actual | | Hypothetical7 | | |
| | | Beginning
Account Value
October 1, 2012 | | Ending
Account Value
March 31, 2013 | | Expenses Paid
During the Period6 | | Beginning
Account Value
October 1, 2012 | | Ending
Account Value
March 31, 2013 | | Expenses Paid
During the Period6 | | Annualized
Expense
Ratio |
Institutional | | | $ | 1,000.00 | | | | $ | 1,179.20 | | | | $ | 5.16 | | | | $ | 1,000.00 | | | | $ | 1,020.19 | | | | $ | 4.78 | | | | | 0.95 | % |
Service | | | $ | 1,000.00 | | | | $ | 1,177.40 | | | | $ | 6.73 | | | | $ | 1,000.00 | | | | $ | 1,018.75 | | | | $ | 6.24 | | | | | 1.24 | % |
Investor A | | | $ | 1,000.00 | | | | $ | 1,177.80 | | | | $ | 6.73 | | | | $ | 1,000.00 | | | | $ | 1,018.75 | | | | $ | 6.24 | | | | | 1.24 | % |
Investor B | | | $ | 1,000.00 | | | | $ | 1,172.90 | | | | $ | 11.11 | | | | $ | 1,000.00 | | | | $ | 1,014.71 | | | | $ | 10.30 | | | | | 2.05 | % |
Investor C | | | $ | 1,000.00 | | | | $ | 1,173.00 | | | | $ | 10.67 | | | | $ | 1,000.00 | | | | $ | 1,015.11 | | | | $ | 9.90 | | | | | 1.97 | % |
Class R | | | $ | 1,000.00 | | | | $ | 1,175.30 | | | | $ | 8.79 | | | | $ | 1,000.00 | | | | $ | 1,016.85 | | | | $ | 8.15 | | | | | 1.62 | % |
| | 6 | For each class of the Fund, expenses are equal to the annualized expense ratio for the class, multiplied by the average account value over the period, multiplied by 182/365 (to reflect the one-half year period shown). |
| | 7 | Hypothetical 5% annual return before expenses is calculated by pro rating the number of days in the most recent fiscal half year divided by 365. See “Disclosure of Expenses” on page 15 for further information on how expenses were calculated. |
| | | | | | |
| | | | | MARCH 31, 2013 | | |
| | BLACKROCK FUNDS | | | 7 |
| | |
| Fund Summary as of March 31, 2013 | | BlackRock International Opportunities Portfolio |
BlackRock International Opportunities Portfolio’s (the “Fund”) investment objective is to seek long-term capital appreciation.
|
|
Portfolio Management Commentary |
|
How did the Fund perform?
| — | | US and certain other financial markets were closed on March 29, 2013, while some foreign financial markets were open. The Fund was re-priced for financial reporting purposes to reflect, in the valuation, the transactions related to foreign market activities. For the six-month period ended March 31, 2013, the Fund outperformed its benchmark, the MSCI All Country World Index (“ACWI”) Ex-US. |
What factors influenced performance?
| — | | The Fund’s outperformance was driven by good stock selection in seven of the ten benchmark index sectors while, from a geographic perspective, positions in emerging Asia and developed Europe enhanced results. Stock selection in consumer discretionary was the largest relative contributor to the Fund’s outperformance and was driven by the Fund’s exposure to companies that benefit from the growth of the emerging market consumer as well as holdings in Japanese carmakers Toyota Motor Corp. and Honda Motor Co. Ltd. While the outcome remains far from certain, Japan has clearly been taking bold steps in an attempt to reinvigorate its domestic economy, leading to a re-pricing of local assets as well as shares of export-oriented companies. Other factors that drove positive relative performance included the pharmaceuticals and household products industries and asset management companies sub-industry. These segments performed well as strong cash flow attributes, and larger cash inflows for asset managers, attracted investors seeking income and growth in the low interest rate environment. |
| — | | The largest detractor from Fund performance was positioning within the materials sector. Exposures to gold miners and industrial-related metals had a negative impact on results due to price reversals in the underlying commodities after multi-year runs of considerable pricing strength. While there have been several factors at play, a combination of a stronger US |
| | | dollar and more moderate economic data out of China are commonly cited for the recent price weakness. Also in materials, the Fund’s holdings in the construction materials and metal & glass containers segments lagged the benchmark index during the period. |
Describe recent portfolio activity.
| — | | During the six-month period, the Fund increased its allocation to developed Europe, with the largest additions centered on globally oriented businesses domiciled in Switzerland. The Fund also added to Japanese equities, while hedging exposure to the yen through the use of currency forward contracts. These purchases were funded primarily from reduced exposures to the Fund’s more cyclical holdings in Australia, Canada and the emerging markets. |
Describe portfolio positioning at period end.
| — | | At period end, the Fund’s holdings reflected a preference for well-capitalized businesses with the ability to consistently grow and generate cash flow in excess of their cost of capital. These companies, more often than not, have re-invested in their businesses, restructured, and are now among the lowest cost producers in their respective industries and hold significant market share. The Fund’s regional positioning was consistent with the view that economies around the world continue to recover. The Fund maintained a bias toward globally oriented companies domiciled in Europe, while reflecting optimism for Japan and general caution with respect to emerging markets. |
The views expressed reflect the opinions of BlackRock as of the date of this report and are subject to change based on changes in market, economic or other conditions. These views are not intended to be a forecast of future events and are no guarantee of future results.
| | | | | |
| Ten Largest Holdings | | Percent of Long-Term Investments |
Roche Holding AG | | | | 4% | |
Sanofi | | | | 3 | |
Novartis AG, Registered Shares | | | | 2 | |
Nestle SA | | | | 2 | |
Syngenta AG, Registered Shares | | | | 2 | |
Swiss Re AG | | | | 2 | |
Barclays Plc - ADR | | | | 2 | |
ORIX Corp. | | | | 2 | |
Glencore International Plc | | | | 2 | |
AIA Group Ltd. | | | | 2 | |
| | | | | |
| Geographic Allocation | | Percent of Long-Term Investments |
Switzerland | | | | 21% | |
United Kingdom | | | | 21 | |
Japan | | | | 13 | |
Germany | | | | 8 | |
France | | | | 6 | |
Hong Kong | | | | 5 | |
Italy | | | | 3 | |
Netherlands | | | | 3 | |
Belgium | | | | 3 | |
Ireland | | | | 3 | |
Sweden | | | | 2 | |
Indonesia | | | | 2 | |
Mexico | | | | 2 | |
Other1 | | | | 8 | |
| | 1 | Other includes a 1% or less investment in each of the following countries: Cyprus, Finland, China, Thailand, United States, Taiwan, India, Australia, Spain, Canada and Malaysia. |
| | | | |
| | | | | |
| 8 | | BLACKROCK FUNDS | | MARCH 31, 2013 |
BlackRock International Opportunities Portfolio
|
|
Total Return Based on a $10,000 Investment |
|
|
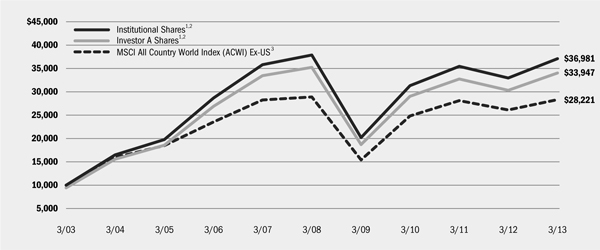
1 Assuming maximum sales charges, if any, transaction costs and other operating expenses, including investment advisory fees. Institutional Shares do not have a sales charge. 2 Under normal market conditions, the Fund invests at least 80% of its net assets in equity securities issued by foreign companies of any market capitalization. The Fund may invest up to 40% of its net assets in stocks of issuers in emerging market countries. 3 This market capitalization weighted index is designed to provide a broad measure of stock performance throughout the world, with the exception of US-based companies. The index includes both developed and emerging markets. |
|
|
Performance Summary for the Period Ended March 31, 2013 |
|
| | | | | | | | | | | | | | | | | | | | | | | | | | | | |
| | | | | | Average Annual Total Returns4 | |
| | | | | | 1 Year | | | 5 Years | | | 10 Years | |
| | | 6-Month
Total Returns | | | w/o sales
charge | | | w/sales
charge | | | w/o sales
charge | | | w/sales
charge | | | w/o sales
charge | | | w/sales
charge | |
Institutional | | | 11.60% | | | | 12.66% | | | | N/A | | | | (0.42)% | | | | N/A | | | | 13.97% | | | | N/A | |
Service | | | 11.28 | | | | 12.02 | | | | N/A | | | | (0.82) | | | | N/A | | | | 13.57 | | | | N/A | |
Investor A | | | 11.45 | | | | 12.31 | | | | 6.43% | | | | (0.70) | | | | (1.76)% | | | | 13.61 | | | | 13.00% | |
Investor B | | | 10.95 | | | | 11.29 | | | | 6.79 | | | | (1.49) | | | | (1.88) | | | | 12.91 | | | | 12.91 | |
Investor C | | | 11.00 | | | | 11.42 | | | | 10.42 | | | | (1.46) | | | | (1.46) | | | | 12.75 | | | | 12.75 | |
| | | | | | | | | | | | | | | | | | | | | | | | | | | | |
MSCI All Country World Index (ACWI) Ex-US | | | 9.20 | | | | 8.36 | | | | N/A | | | | (0.39) | | | | N/A | | | | 10.93 | | | | N/A | |
| | 4 | Assuming maximum sales charges, if any. Average annual total returns with and without sales charges reflect reductions for distribution and service fees. See “About Fund Performance” on page 14 for a detailed description of share classes, including any related sales charges and fees. |
N/A - Not applicable as share class and index do not have a sales charge.
Past performance is not indicative of future results.
| | | | | | | | | | | | | | |
| | | Actual | | Hypothetical6 | | |
| | | Beginning
Account Value
October 1, 2012 | | Ending
Account Value
March 31, 2013 | | Expenses Paid
During the Period5 | | Beginning
Account Value
October 1, 2012 | | Ending
Account Value
March 31, 2013 | | Expenses Paid
During the Period5 | | Annualized
Expense
Ratio |
Institutional | | $1,000.00 | | $1,116.00 | | $ 6.54 | | $1,000.00 | | $1,018.75 | | $ 6.24 | | 1.24% |
Service | | $1,000.00 | | $1,112.80 | | $ 9.48 | | $1,000.00 | | $1,015.96 | | $ 9.05 | | 1.80% |
Investor A | | $1,000.00 | | $1,114.50 | | $ 8.12 | | $1,000.00 | | $1,017.25 | | $ 7.75 | | 1.54% |
Investor B | | $1,000.00 | | $1,109.50 | | $12.83 | | $1,000.00 | | $1,012.76 | | $12.24 | | 2.44% |
Investor C | | $1,000.00 | | $1,110.00 | | $12.26 | | $1,000.00 | | $1,013.31 | | $11.70 | | 2.33% |
| | 5 | For each class of the Fund, expenses are equal to the annualized expense ratio for the class, multiplied by the average account value over the period, multiplied by 182/365 (to reflect the one-half year period shown). |
| | 6 | Hypothetical 5% annual return before expenses is calculated by pro rating the number of days in the most recent fiscal half year divided by 365. |
See “Disclosure of Expenses” on page 15 for further information on how expenses were calculated.
| | | | | | |
| | | | | MARCH 31, 2013 | | |
| | BLACKROCK FUNDS | | | 9 |
| | |
| Fund Summary as of March 31, 2013 | | BlackRock Science & Technology Opportunities Portfolio |
BlackRock Science & Technology Opportunities Portfolio’s (the “Fund”) investment objective is to provide long-term capital appreciation.
|
|
Portfolio Management Commentary |
|
How did the Fund perform?
| — | | For the six-month period ended March 31, 2013, the Fund underperformed its benchmark, the NYSE Arca Tech 100 IndexSM. |
What factors influenced performance?
| — | | The largest detractor from relative performance was the Fund’s underweight allocation to health care versus the benchmark index as returns in the health care sector more than doubled that of information technology (“IT”) during the period. Stock selection within IT also hurt performance. In computer & peripherals, the Fund held an overweight position in Apple, Inc., which declined as the company missed its sales estimates and investors became increasingly worried about the company’s longer-term growth potential and profit margins. Within application software, the Fund’s holdings that are most dependent on corporate enterprise spending were the biggest detractors. Stock selection within internet software & services also hindered performance, although the Fund maintains its conviction for the more consumer-centric internet stocks, such as Google, Inc. and eBay, Inc. |
| — | | Positive performance in the Fund came from stock selection within the IT Services space, where positions in Accenture Plc and Cognizant Technology Solutions Corp., neither of which is represented in the benchmark index composition, delivered good results as investors were attracted to these companies’ solutions-oriented businesses in a world full of greater |
| | | regulatory and legislative complexities. An overweight allocation to the data processing & outsourced services sub-industry also had a positive impact. Particularly helpful were holdings in Visa, Inc. and MasterCard, Inc., which continue to benefit from the secular shift from cash-based to electronic-based payment transactions. |
Describe recent portfolio activity.
| — | | During the six-month period, the Fund increased exposure to larger, more established software companies with attractive cash flow metrics, such as Oracle Corp., Google, Inc. and International Business Machines Corp. Funding for these additions was sourced from reductions primarily within the technology hardware & equipment industry group, including the further reduction of the Fund’s position in Apple, Inc. |
Describe portfolio positioning at period end.
| — | | At period end, the Fund remained overweight in the IT sector relative to the NYSE Arca Tech 100 IndexSM, and underweight in health care. Within IT, the Fund’s positioning was biased toward particular themes including improvements in the latest mobile networking technology, “big data” growth (i.e., mega-sized data sets), secular growth in the payments industry and, more generally, an improving global economy. Within the semiconductor sub-industry specifically, the Fund favored names that are more product story-based versus cyclical analog technology names. |
The views expressed reflect the opinions of BlackRock as of the date of this report and are subject to change based on changes in market, economic or other conditions. These views are not intended to be a forecast of future events and are no guarantee of future results.
| | | | | |
| Ten Largest Holdings | | Percent of Long-Term Investments |
Apple, Inc. | | | | 6% | |
Cisco Systems, Inc. | | | | 6 | |
QUALCOMM, Inc. | | | | 5 | |
Google, Inc., Class A | | | | 5 | |
Salesforce.com, Inc. | | | | 4 | |
International Business Machines Corp. | | | | 3 | |
eBay, Inc. | | | | 3 | |
Visa, Inc., Class A | | | | 3 | |
Oracle Corp. | | | | 3 | |
Xilinx, Inc. | | | | 3 | |
| | | | | |
| Industry Allocation | | Percent of Long-Term Investments |
Semiconductors & Semiconductor Equipment | | | | 20% | |
Software | | | | 20 | |
IT Services | | | | 17 | |
Internet Software & Services | | | | 13 | |
Communications Equipment | | | | 12 | |
Computers & Peripherals | | | | 8 | |
Internet & Catalog Retail | | | | 5 | |
Electronic Equipment, Instruments & Components | | | | 3 | |
Biotechnology | | | | 2 | |
For Fund compliance purposes, the Fund’s industry classifications refer to any one or more of the industry sub-classifications used by one or more widely recognized market indexes or ratings group indexes, and/or as defined by Fund management. These definitions may not apply for purposes of this report, which may combine such industry sub-classifications for reporting ease.
| | | | |
| | | | | |
| 10 | | BLACKROCK FUNDS | | MARCH 31, 2013 |
BlackRock Science & Technology Opportunities Portfolio
|
|
Total Return Based on a $10,000 Investment |
|
|
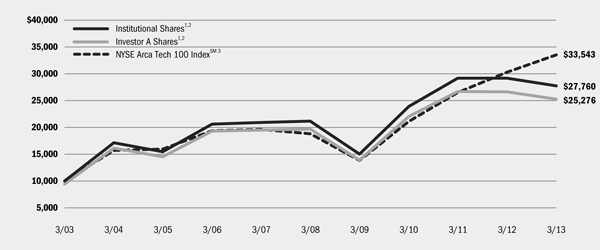
1 Assuming maximum sales charges, if any, transaction costs and other operating expenses, including investment advisory fees. Institutional Shares do not have a sales charge. 2 Under normal market conditions, the Fund invests at least 80% of its net assets in equity securities issued by US and non-US science and technology companies in all market capitalization ranges selected for their rapid and sustainable growth potential from the development, advancement and use of science and/or technology. The Fund may invest up to 25% of its net assets in emerging market countries. 3 A price-weighted index comprised of common stocks and ADRs of technology-related companies listed on US exchanges. Modeled as a multi-industry technology index, the objective of the NYSE Arca Tech 100 Index is to provide a benchmark for measuring the performance of companies using technology innovation across a broad spectrum of industries. |
|
|
Performance Summary for the Period Ended March 31, 2013 |
|
| | | | | | | | | | | | | | | | | | | | | | | | | | | | |
| | | | | | Average Annual Total Returns4 | |
| | | | | | 1 Year | | | 5 Years | | | 10 Years | |
| | | 6-Month
Total Returns | | | w/o sales
charge | | | w/sales
charge | | | w/o sales
charge | | | w/sales
charge | | | w/o sales
charge | | | w/sales
charge | |
Institutional | | | 1.50% | | | | (4.87)% | | | | N/A | | | | 5.54% | | | | N/A | | | | 10.75% | | | | N/A | |
Service | | | 1.35 | | | | (5.04) | | | | N/A | | | | 5.28 | | | | N/A | | | | 10.43 | | | | N/A | |
Investor A | | | 1.26 | | | | (5.12) | | | | (10.08) | % | | | 5.13 | | | | 3.99% | | | | 10.31 | | | | 9.72% | |
Investor B | | | 0.93 | | | | (5.86) | | | | (10.09) | | | | 4.25 | | | | 3.91 | | | | 9.60 | | | | 9.60 | |
Investor C | | | 0.93 | | | | (5.97) | | | | (6.91) | | | | 4.23 | | | | 4.23 | | | | 9.39 | | | | 9.39 | |
Class R | | | 1.13 | | | | (5.47) | | | | N/A | | | | 4.81 | | | | N/A | | | | 9.94 | | | | N/A | |
| | | | | | | | | | | | | | | | | | | | | | | | | | | | |
NYSE Arca Tech 100 IndexSM | | | 11.53 | | | | 10.72 | | | | N/A | | | | 12.28 | | | | N/A | | | | 12.87 | | | | N/A | |
| | 4 | Assuming maximum sales charges, if any. Average annual total returns with and without sales charges reflect reductions for distribution and service fees. See “About Fund Performance” on page 14 for a detailed description of share classes, including any related sales charges and fees. |
N/A - Not applicable as share class and index do not have a sales charge.
Past performance is not indicative of future results.
| | | | | | | | | | | | | | | | | | | | | | | | | | | | | | | | | | | |
| | | Actual | | Hypothetical6 | | |
| | | Beginning
Account Value
October 1, 2012 | | Ending
Account Value
March 31, 2013 | | Expenses Paid
During the Period5 | | Beginning
Account Value
October 1, 2012 | | Ending
Account Value
March 31, 2013 | | Expenses Paid
During the Period5 | | Annualized
Expense
Ratio |
Institutional | �� | | $ | 1,000.00 | | | | $ | 1,015.00 | | | | $ | 6.98 | | | | $ | 1,000.00 | | | | $ | 1,018.00 | | | | $ | 6.99 | | | | | 1.39 | % |
Service | | | $ | 1,000.00 | | | | $ | 1,013.50 | | | | $ | 7.88 | | | | $ | 1,000.00 | | | | $ | 1,017.10 | | | | $ | 7.90 | | | | | 1.57 | % |
Investor A | | | $ | 1,000.00 | | | | $ | 1,012.60 | | | | $ | 8.78 | | | | $ | 1,000.00 | | | | $ | 1,016.21 | | | | $ | 8.80 | | | | | 1.75 | % |
Investor B | | | $ | 1,000.00 | | | | $ | 1,009.30 | | | | $ | 12.72 | | | | $ | 1,000.00 | | | | $ | 1,012.27 | | | | $ | 12.74 | | | | | 2.54 | % |
Investor C | | | $ | 1,000.00 | | | | $ | 1,009.30 | | | | $ | 13.17 | | | | $ | 1,000.00 | | | | $ | 1,011.82 | | | | $ | 13.19 | | | | | 2.63 | % |
Class R | | | $ | 1,000.00 | | | | $ | 1,011.30 | | | | $ | 9.93 | | | | $ | 1,000.00 | | | | $ | 1,015.06 | | | | $ | 9.95 | | | | | 1.98 | % |
| | 5 | For each class of the Fund, expenses are equal to the annualized expense ratio for the class, multiplied by the average account value over the period, multiplied by 182/365 (to reflect the one-half year period shown). |
| | 6 | Hypothetical 5% annual return before expenses is calculated by pro rating the number of days in the most recent fiscal half year divided by 365. |
See “Disclosure of Expenses” on page 15 for further information on how expenses were calculated.
| | | | | | |
| | | | | MARCH 31, 2013 | | |
| | BLACKROCK FUNDS | | | 11 |
| | |
| Fund Summary as of March 31, 2013 | | BlackRock U.S. Opportunities Portfolio |
BlackRock U.S. Opportunities Portfolio’s (the “Fund”) investment objective is to provide long-term capital appreciation.
|
|
Portfolio Management Commentary |
|
How did the Fund perform?
| — | | For the six-month period ended March 31, 2013, the Fund generated a positive double-digit return, but underperformed its benchmark, the Russell Midcap® Index. |
What factors influenced performance?
| — | | The Fund benefited from its positioning in the materials sector, where its commodity chemicals and paper products holdings delivered strong performance. Specifically, overweight positions in Axiall Corp. and Eastman Chemical Co. (commodity chemicals) and International Paper Co. (paper products) had a positive impact on returns as each of these stocks appreciated more than 20% during the period, driven by the continual recovery of their end markets and improving profit margins. The Fund’s investments in the industrials sector also contributed positively, most notably within railroads and trucking. Cost savings associated with massive industry restructuring and consolidation since the onset of the financial crisis have resulted in higher quality players in each of these industries, which has translated to better operating and profitability measures for companies like Kansas City Southern (railroads) and Hertz Global Holdings, Inc. (trucking). |
| — | | The Fund’s underperformance relative to the benchmark was largely attributable to stock selection in the consumer discretionary and information technology (“IT”) sectors. The Fund’s consumer discretionary holdings were the largest drag on a relative basis. After a strong finish to |
| | | 2012, the Fund’s higher quality retail growth stocks gave back some of their gains in the first three months of 2013 as investors preferred the more value-oriented retail names. In IT, stock selection was weakest in systems software, communications equipment and semiconductor equipment. The stocks owned in these particular groups continued to be hampered by the cautious tone of corporate technology officers regarding spending on software and IT equipment maintenance. |
Describe recent portfolio activity.
| — | | During the six-month period, the Fund reduced its allocations to consumer discretionary, financials and the more defensive health care and utilities sectors. The proceeds were used to increase exposures to industrials and materials, with an emphasis on chemicals, housing and transportation-related names, where valuations remain attractive despite their recent strong performance. |
Describe portfolio positioning at period end.
| — | | At period end, the Fund’s holdings reflected a preference for well-capitalized businesses with the ability to grow consistently and generate cash flow in excess of their cost of capital. These companies, more often than not, have re-invested in their businesses, restructured, and are now among the lowest cost producers in their respective industries and hold significant market share. The Fund’s overall positioning was consistent with the view that economies around the world continue to recover. |
The views expressed reflect the opinions of BlackRock as of the date of this report and are subject to change based on changes in market, economic or other conditions. These views are not intended to be a forecast of future events and are no guarantee of future results.
| | | | | |
| Ten Largest Holdings | | Percent of Long-Term Investments |
Triumph Group, Inc. | | | | 2% | |
SBA Communications Corp., Class A | | | | 2 | |
Ingersoll-Rand Plc | | | | 2 | |
Brown & Brown, Inc. | | | | 1 | |
Concho Resources, Inc. | | | | 1 | |
Invesco Ltd. | | | | 1 | |
Axiall Corp. | | | | 1 | |
AON Plc | | | | 1 | |
Cabot Oil & Gas Corp. | | | | 1 | |
Eastman Chemical Co. | | | | 1 | |
| | | | | |
| Sector Allocation | | Percent of Long-Term Investments |
Information Technology | | | | 17% | |
Financials | | | | 17 | |
Consumer Discretionary | | | | 15 | |
Industrials | | | | 15 | |
Health Care | | | | 10 | |
Energy | | | | 9 | |
Materials | | | | 8 | |
Consumer Staples | | | | 5 | |
Telecommunication Services | | | | 2 | |
Utilities | | | | 2 | |
For Fund compliance purposes, the Fund’s sector classifications refer to any one or more of the sector sub-classifications used by one or more widely recognized market indexes or ratings group indexes, and/or as defined by Fund management. These definitions may not apply for purposes of this report, which may combine sector sub-classifications for reporting ease.
| | | | |
| | | | | |
| 12 | | BLACKROCK FUNDS | | MARCH 31, 2013 |
BlackRock U.S. Opportunities Portfolio
|
|
Total Return Based on a $10,000 Investment |
|
|
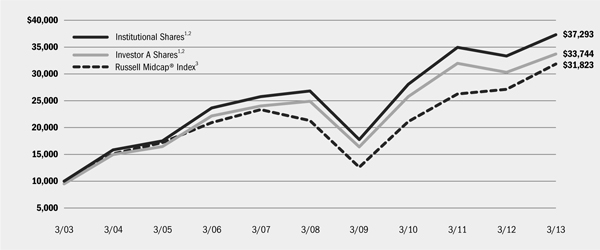 |
1 Assuming maximum sales charges, if any, transaction costs and other operating expenses, including investment advisory fees. Institutional Shares do not have a sales charge. |
2 Under normal market conditions, the Fund invests at least 80% of its net assets in equity securities issued by US emerging capitalization companies with relatively attractive earnings growth potential and valuation. |
3 This market index measures the performance of the mid-cap segment of the US equities universe. It is a subset of the Russell 1000® Index including approximately 800 of the smallest securities based on a combination of their market cap and current index membership. The Russell Midcap® Index represents approximately 31% of the total market capitalization of the Russell 1000® companies. |
|
|
Performance Summary for the Period Ended March 31, 2013 |
|
| | | | | | | | | | | | | | | | | | | | | | | | | | | | | | | | | | | |
| | | | | Average Annual Total Returns4 |
| | | | | 1 Year | | 5 Years | | 10 Years |
| | | 6-Month Total Returns | | w/o sales charge | | w/sales charge | | w/o sales charge | | w/sales charge | | w/o sales charge | | w/sales charge |
Institutional | | | | 14.84 | % | | | | 11.95 | % | | | | N/A | | | | | 6.80 | % | | | | N/A | | | | | 14.07 | % | | | | N/A | |
Service | | | | 14.56 | | | | | 11.39 | | | | | N/A | | | | | 6.30 | | | | | N/A | | | | | 13.59 | | | | | N/A | |
Investor A | | | | 14.55 | | | | | 11.43 | | | | | 5.59 | % | | | | 6.27 | | | | | 5.13 | % | | | | 13.54 | | | | | 12.93 | % |
Investor B | | | | 14.10 | | | | | 10.54 | | | | | 6.04 | | | | | 5.46 | | | | | 5.14 | | | | | 12.86 | | | | | 12.86 | |
Investor C | | | | 14.11 | | | | | 10.59 | | | | | 9.59 | | | | | 5.49 | | | | | 5.49 | | | | | 12.71 | | | | | 12.71 | |
Russell Midcap® Index | | | | 16.21 | | | | | 17.30 | | | | | N/A | | | | | 8.37 | | | | | N/A | | | | | 12.27 | | | | | N/A | |
| | 4 | Assuming maximum sales charges, if any. Average annual total returns with and without sales charges reflect reductions for distribution and service fees. See “About Fund Performance” on page 14 for a detailed description of share classes, including any related sales charges and fees. |
N/A - Not applicable as share class and index do not have a sales charge.
Past performance is not indicative of future results.
| | | | | | | | | | | | | | | | | | | | | | | | | | | | | | | | | | | |
| | | Actual | | Hypothetical6 | | |
| | | Beginning Account Value October 1, 2012 | | Ending Account Value March 31, 2013 | | Expenses Paid During the Period5 | | Beginning Account Value October 1, 2012 | | Ending Account Value March 31, 2013 | | Expenses Paid During the Period5 | | Annualized Expense Ratio |
Institutional | | | | $1,000.00 | | | | | $1,148.40 | | | | $ | 5.52 | | | | | $1,000.00 | | | | | $1,019.80 | | | | $ | 5.19 | | | | | 1.03 | % |
Service | | | | $1,000.00 | | | | | $1,145.60 | | | | $ | 8.24 | | | | | $1,000.00 | | | | | $1,017.25 | | | | $ | 7.75 | | | | | 1.54 | % |
Investor A | | | | $1,000.00 | | | | | $1,145.50 | | | | $ | 8.29 | | | | | $1,000.00 | | | | | $1,017.20 | | | | $ | 7.80 | | | | | 1.55 | % |
Investor B | | | | $1,000.00 | | | | | $1,141.00 | | | | $ | 12.38 | | | | | $1,000.00 | | | | | $1,013.36 | | | | $ | 11.65 | | | | | 2.32 | % |
Investor C | | | | $1,000.00 | | | | | $1,141.10 | | | | $ | 12.12 | | | | | $1,000.00 | | | | | $1,013.61 | | | | $ | 11.40 | | | | | 2.27 | % |
| | 5 | For each class of the Fund, expenses are equal to the annualized expense ratio for the class, multiplied by the average account value over the period, multiplied by 182/365 (to reflect the one-half year period shown). |
| | 6 | Hypothetical 5% annual return before expenses is calculated by pro rating the number of days in the most recent fiscal half year divided by 365. |
See “Disclosure of Expenses” on page 15 for further information on how expenses were calculated.
| | | | | | |
| | | | | MARCH 31, 2013 | | |
| | BLACKROCK FUNDS | | | 13 |
About Fund Performance
| — | | Institutional Shares are not subject to any sales charge. These shares bear no ongoing distribution or service fees and are available only to eligible investors. |
| — | | Service Shares are not subject to any sales charge (front-end load) or deferred sales charge. These shares are subject to a service fee of 0.25% per year (but no distribution fee). Prior to January 28, 2005, the performance results of Service Shares of the BlackRock Health Sciences Opportunities Portfolio (“Health Sciences Opportunities”) are those of Investor A Shares restated to reflect Service Share fees. |
| — | | Investor A Shares are subject to a maximum initial sales charge (front-end load) of 5.25% and a service fee of 0.25% per year (but no distribution fee). |
| — | | Investor B Shares are subject to a maximum contingent deferred sales charge (“CDSC”) of 4.50% declining to 0% after six years. In addition, these shares are subject to a distribution fee of 0.75% per year and a service fee of 0.25% per year. These shares automatically convert to Investor A Shares after approximately eight years. (There is no initial sales charge for automatic share conversions.) All returns for periods greater than eight years reflect this conversion. These shares are only available through exchanges and dividend reinvestments by existing shareholders and for purchase by certain employer-sponsored retirement plans. |
| — | | Investor C Shares are subject to a 1.00% CDSC if redeemed within one year of purchase. In addition, these shares are subject to a distribution fee of 0.75% per year and a service fee of 0.25% per year. |
| — | | Class R Shares are not subject to any sales charge. These shares are subject to a distribution fee of 0.25% per year and a service fee of 0.25% per year. These shares are available only to certain employer-sponsored retirement plans. Prior to September 8, 2008, the performance results of Class R Shares of BlackRock Science & Technology Opportunities Portfolio are those of Institutional Shares (which have no |
| | | distribution or service fees) restated to reflect Class R Share fees. Prior to September 12, 2011, the performance results of Class R Shares of BlackRock Global Opportunities Portfolio and Health Sciences Opportunities are those of the applicable Funds’ Institutional Shares (which have no distribution or service fees) restated to reflect Class R Share fees. |
Performance information reflects past performance and does not guarantee future results. Current performance may be lower or higher than the performance data quoted. Refer to www.blackrock.com/funds to obtain performance data current to the most recent month-end. Performance results do not reflect the deduction of taxes that a shareholder would pay on fund distributions or the redemption of fund shares. Figures shown in each of the performance tables on the previous pages assume reinvestment of all dividends and distributions, if any, at net asset value (“NAV”) on the ex-dividend date. Investment return and principal value of shares will fluctuate so that shares, when redeemed, may be worth more or less than their original cost. Dividends paid to each class of shares will vary because of the different levels of service, distribution and transfer agency fees applicable to each class, which are deducted from the income available to be paid to shareholders.
Performance for Health Sciences Opportunities for the periods prior to January 28, 2005 is based on performance of a certain former State Street Research mutual fund that reorganized with Health Sciences Opportunities on that date.
BlackRock Advisors, LLC (the “Manager”), the Funds’ investment advisor, waived and/or reimbursed a portion of each Fund’s expenses. Without such waiver and/or reimbursement, each Fund’s performance would have been lower. The Manager is under no obligation to waive or reimburse or to continue waiving or reimbursing its fees after the applicable termination date. See Note 3 of the Notes to Financial Statements for additional information on waivers and reimbursements.
| | | | |
| | | | | |
| 14 | | BLACKROCK FUNDS | | MARCH 31, 2013 |
Disclosure of Expenses
Shareholders of the Funds may incur the following charges: (a) transactional expenses, such as sales charges; and (b) operating expenses, including investment advisory fees, service and distribution fees, including 12b-1 fees, acquired fund fees and expenses and other Fund expenses. The expense examples on the previous pages (which are based on a hypothetical investment of $1,000 invested on October 1, 2012 and held through March 31, 2013) are intended to assist shareholders both in calculating expenses based on an investment in each Fund and in comparing these expenses with similar costs of investing in other mutual funds.
The expense examples provide information about actual account values and actual expenses. In order to estimate the expenses a shareholder paid during the period covered by this report, shareholders can divide their account value by $1,000 and then multiply the result by the number corresponding to their Fund and share class under the headings entitled “Expenses Paid During the Period.”
The expense examples also provide information about hypothetical account values and hypothetical expenses based on a Fund’s actual expense ratio and an assumed rate of return of 5% per year before expenses. In order to assist shareholders in comparing the ongoing expenses of investing in these Funds and other funds, compare the 5% hypothetical example with the 5% hypothetical examples that appear in other funds’ shareholder reports.
The expenses shown in the expense examples are intended to highlight shareholders’ ongoing costs only and do not reflect any transactional expenses, such as sales charges, if any. Therefore, the hypothetical examples are useful in comparing ongoing expenses only, and will not help shareholders determine the relative total expenses of owning different funds. If these transactional expenses were included, shareholder expenses would have been higher.
Derivative Financial Instruments
The Funds may invest in various derivative financial instruments, including financial futures contracts, foreign currency exchange contracts and options, as specified in Note 2 of the Notes to Financial Statements, which may constitute forms of economic leverage. Such derivative financial instruments are used to obtain exposure to a security, index and/or market without owning or taking physical custody of securities or to hedge market, equity and/or foreign currency exchange rate risks. Derivative financial instruments involve risks, including the imperfect correlation between the value of a derivative financial instrument and the underlying asset, possible default of the counterparty to the transaction or illiquidity of the derivative financial instrument. The Funds’ ability to
use a derivative financial instrument successfully depends on the investment advisor’s ability to predict pertinent market movements accurately, which cannot be assured. The use of derivative financial instruments may result in losses greater than if they had not been used, may require a Fund to sell or purchase portfolio investments at inopportune times or for distressed values, may limit the amount of appreciation a Fund can realize on an investment, may result in lower dividends paid to shareholders or may cause a Fund to hold an investment that it might otherwise sell. The Funds’ investments in these instruments are discussed in detail in the Notes to Financial Statements.
| | | | | | |
| | | | | MARCH 31, 2013 | | |
| | BLACKROCK FUNDS | | | 15 |
| | | | |
| Schedule of Investments March 31, 2013 (Unaudited) | | | BlackRock Global Opportunities Portfolio | |
| | | (Percentages shown are based on Net Assets) | |
| | | | | | | | |
| Common Stocks | | Shares | | | Value | |
| |
Argentina – 0.4% | | | | | | | | |
Arcos Dorados Holdings, Inc. | | | 94,000 | | | $ | 1,240,800 | |
| |
Australia – 0.2% | | | | | | | | |
CSL Ltd. | | | 11,484 | | | | 709,469 | |
| |
Belgium – 1.1% | | | | | | | | |
Anheuser-Busch InBev NV | | | 37,178 | | | | 3,695,996 | |
| |
Canada – 0.4% | | | | | | | | |
Detour Gold Corp. (a) | | | 67,500 | | | | 1,295,857 | |
| |
China – 1.1% | | | | | | | | |
China Construction Bank Corp., H Shares | | | 4,637,800 | | | | 3,801,277 | |
| |
Cyprus – 0.8% | | | | | | | | |
Eurasia Drilling Co. Ltd. - GDR | | | 73,300 | | | | 2,602,150 | |
| |
France – 4.5% | | | | | | | | |
AXA SA | | | 149,500 | | | | 2,583,459 | |
BNP Paribas SA | | | 43,280 | | | | 2,225,266 | |
Danone SA | | | 36,000 | | | | 2,506,538 | |
LVMH Moet Hennessy Louis Vuitton SA | | | 9,300 | | | | 1,597,769 | |
Sanofi | | | 26,400 | | | | 2,692,308 | |
Technip SA | | | 15,800 | | | | 1,620,541 | |
Valeo SA | | | 29,700 | | | | 1,609,198 | |
| | | | | | | | |
| | | | | | | 14,835,079 | |
| |
Germany – 2.7% | | | | | | | | |
Deutsche Lufthansa AG, Registered Shares | | | 127,600 | | | | 2,495,673 | |
GSW Immobilien AG | | | 15,300 | | | | 605,833 | |
SAP AG - ADR | | | 39,600 | | | | 3,189,384 | |
Volkswagen AG, Preference Shares | | | 13,700 | | | | 2,728,552 | |
| | | | | | | | |
| | |
| | | | | | | 9,019,442 | |
| |
Hong Kong – 1.3% | | | | | | | | |
AIA Group Ltd. | | | 1,015,100 | | | | 4,462,630 | |
| |
India – 1.0% | | | | | | | | |
ICICI Bank Ltd. | | | 82,700 | | | | 1,609,252 | |
Jubilant Foodworks Ltd. (a) | | | 74,016 | | | | 1,703,815 | |
| | | | | | | | |
| | |
| | | | | | | 3,313,067 | |
| |
Indonesia – 3.3% | | | | | | | | |
Alam Sutera Realty Tbk PT | | | 14,937,000 | | | | 1,647,624 | |
Bank Mandiri Perseo Tbk PT | | | 2,836,500 | | | | 2,924,329 | |
Global Mediacom Tbk PT | | | 9,188,500 | | | | 2,200,465 | |
Matahari Department Store Tbk PT (a) | | | 2,787,700 | | | | 3,149,943 | |
Tower Bersama Infrastructure Tbk PT (a) | | | 1,964,800 | | | | 1,222,584 | |
| | | | | | | | |
| | |
| | | | | | | 11,144,945 | |
| |
Ireland – 1.3% | | | | | | | | |
Eaton Corp. Plc | | | 27,400 | | | | 1,678,250 | |
Ingersoll-Rand Plc | | | 45,800 | | | | 2,519,458 | |
| | | | | | | | |
| | |
| | | | | | | 4,197,708 | |
| |
Italy – 1.6% | | | | | | | | |
Eni SpA | | | 166,100 | | | | 3,718,567 | |
| | | | | | | | |
| Common Stocks | | Shares | | | Value | |
| |
Italy (concluded) | | | | | | | | |
Saipem SpA | | | 55,500 | | | $ | 1,705,744 | |
| | | | | | | | |
| | |
| | | | | | | 5,424,311 | |
| |
Japan – 6.6% | | | | | | | | |
Dena Co. Ltd. | | | 32,300 | | | | 876,264 | |
Hino Motors Ltd. | | | 214,000 | | | | 2,294,967 | |
Honda Motor Co. Ltd. | | | 89,600 | | | | 3,382,119 | |
ITOCHU Corp. | | | 221,300 | | | | 2,657,574 | |
ORIX Corp. | | | 241,000 | | | | 3,047,685 | |
Softbank Corp. | | | 74,300 | | | | 3,423,890 | |
Tokio Marine Holdings, Inc. | | | 95,800 | | | | 2,695,583 | |
Toyota Motor Corp. | | | 40,900 | | | | 2,110,575 | |
Yahoo! Japan Corp. | | | 3,510 | | | | 1,613,750 | |
| | | | | | | | |
| | |
| | | | | | | 22,102,407 | |
| |
Mexico – 1.4% | | | | | | | | |
Fomento Economico Mexicano SAB de CV - ADR | | | 18,300 | | | | 2,077,050 | |
Grupo Mexico SAB de CV, Series B | | | 606,900 | | | | 2,458,927 | |
| | | | | | | | |
| | |
| | | | | | | 4,535,977 | |
| |
Spain – 0.7% | | | | | | | | |
Iberdrola SA | | | 481,257 | | | | 2,249,727 | |
| |
Sweden – 1.6% | | | | | | | | |
Electrolux AB, Series B | | | 18,058 | | | | 459,669 | |
Svenska Cellulosa AB, B Shares | | | 184,438 | | | | 4,755,204 | |
Volvo AB, B Shares | | | 16,855 | | | | 245,739 | |
| | | | | | | | |
| | |
| | | | | | | 5,460,612 | |
| |
Switzerland – 8.4% | | | | | | | | |
Cie Financiere Richemont SA, Class A | | | 33,659 | | | | 2,650,869 | |
GAM Holding AG | | | 136,800 | | | | 2,318,187 | |
Glencore International Plc | | | 651,700 | | | | 3,536,925 | |
Nestle SA | | | 47,000 | | | | 3,402,682 | |
Novartis AG, Registered Shares | | | 46,600 | | | | 3,322,323 | |
Partners Group Holding AG | | | 12,400 | | | | 3,063,256 | |
Roche Holding AG | | | 19,300 | | | | 4,500,699 | |
Transocean Ltd. (a) | | | 42,900 | | | | 2,229,084 | |
UBS AG, Registered Shares | | | 194,200 | | | | 2,987,200 | |
| | | | | | | | |
| | |
| | | | | | | 28,011,225 | |
| |
Taiwan – 0.6% | | | | | | | | |
MediaTek, Inc. | | | 174,000 | | | | 1,995,239 | |
| |
Thailand – 0.7% | | | | | | | | |
Bangkok Bank Pcl | | | 312,500 | | | | 2,424,385 | |
| |
United Kingdom – 12.3% | | | | | | | | |
Afren Plc (a) | | | 734,900 | | | | 1,588,783 | |
APR Energy Plc | | | 114,875 | | | | 1,472,959 | |
Aveva Group Plc | | | 47,800 | | | | 1,648,636 | |
Babcock International Group Plc | | | 60,800 | | | | 1,007,047 | |
Barclays Plc | | | 704,600 | | | | 3,135,674 | |
| | | | | | | | |
| To simplify the listings of portfolio holdings in the Schedules of Investments, the names and descriptions of many of the securities have been abbreviated according to the following list: | | ADR | | American Depositary Receipts | | HKD | | Hong Kong Dollar |
| | AUD | | Australian Dollar | | JPY | | Japanese Yen |
| | CAD | | Canadian Dollar | | MXN | | Mexican Peso |
| | CHF | | Swiss Franc | | NOK | | Norwegian Krone |
| | DKK | | Danish Krone | | SEK | | Swedish Krona |
| | EUR | | Euro | | SGD | | Singapore Dollar |
| | GBP | | British Pound | | USD | | US Dollar |
| | GDR | | Global Depositary Receipts | | ZAR | | South African Rand |
See Notes to Financial Statements.
| | | | |
| | | | | |
| 16 | | BLACKROCK FUNDS | | MARCH 31, 2013 |
| | |
| Schedule of Investments (continued) | | BlackRock Global Opportunities Portfolio (Percentages shown are based on Net Assets) |
| | | | | | | | |
| Common Stocks | | Shares | | | Value | |
| |
United Kingdom (concluded) | | | | | | | | |
BG Group Plc | | | 187,900 | | | $ | 3,234,138 | |
British American Tobacco Plc | | | 58,200 | | | | 3,121,550 | |
Crest Nicholson Holdings Plc (a) | | | 399,500 | | | | 1,789,604 | |
Diageo Plc | | | 79,600 | | | | 2,508,818 | |
esure Group Plc (a) | | | 896,796 | | | | 4,088,852 | |
HSBC Holdings Plc | | | 261,983 | | | | 2,795,893 | |
National Grid Plc | | | 269,600 | | | | 3,133,410 | |
SABMiller Plc | | | 51,500 | | | | 2,717,033 | |
Tullow Oil Plc | | | 153,000 | | | | 2,864,783 | |
Unilever Plc | | | 79,200 | | | | 3,350,706 | |
Vodafone Group Plc - ADR | | | 95,300 | | | | 2,707,473 | |
| | | | | | | | |
| | |
| | | | | | | 41,165,359 | |
| |
United States – 46.0% | | | | | | | | |
AbbVie, Inc. | | | 41,300 | | | | 1,684,214 | |
Adobe Systems, Inc. (a) | | | 61,200 | | | | 2,662,812 | |
Air Products & Chemicals, Inc. | | | 17,500 | | | | 1,524,600 | |
Amgen, Inc. | | | 17,900 | | | | 1,834,929 | |
Apple, Inc. | | | 3,000 | | | | 1,327,890 | |
Axiall Corp. | | | 26,700 | | | | 1,659,672 | |
Bank of America Corp. | | | 430,200 | | | | 5,239,836 | |
Baxter International, Inc. | | | 24,300 | | | | 1,765,152 | |
Becton Dickinson & Co. | | | 26,400 | | | | 2,524,104 | |
The Boeing Co. | | | 29,400 | | | | 2,523,990 | |
Bristol-Myers Squibb Co. | | | 98,300 | | | | 4,048,977 | |
Cabot Oil & Gas Corp. | | | 40,900 | | | | 2,765,249 | |
Cameron International Corp. (a) | | | 41,100 | | | | 2,679,720 | |
Celgene Corp. (a) | | | 28,492 | | | | 3,302,508 | |
Cisco Systems, Inc. | | | 115,400 | | | | 2,413,014 | |
Citigroup, Inc. | | | 88,060 | | | | 3,895,774 | |
Comcast Corp., Class A | | | 76,300 | | | | 3,205,363 | |
Crown Holdings, Inc. (a) | | | 49,300 | | | | 2,051,373 | |
CSX Corp. | | | 106,800 | | | | 2,630,484 | |
DIRECTV (a) | | | 30,700 | | | | 1,737,927 | |
Eastman Chemical Co. | | | 42,000 | | | | 2,934,540 | |
eBay, Inc. (a) | | | 62,300 | | | | 3,377,906 | |
Eli Lilly & Co. | | | 56,200 | | | | 3,191,598 | |
Exxon Mobil Corp. | | | 25,400 | | | | 2,288,794 | |
Facebook, Inc., Class A (a) | | | 80,300 | | | | 2,054,074 | |
FedEx Corp. | | | 26,100 | | | | 2,563,020 | |
Gilead Sciences, Inc. (a) | | | 69,000 | | | | 3,376,170 | |
Google, Inc., Class A (a) | | | 4,050 | | | | 3,215,822 | |
The Hain Celestial Group, Inc. (a) | | | 40,158 | | | | 2,452,851 | |
HCA Holdings, Inc. | | | 35,800 | | | | 1,454,554 | |
Hertz Global Holdings, Inc. (a) | | | 138,300 | | | | 3,078,558 | |
| | | | | | | | |
| Common Stocks | | Shares | | | Value | |
| |
United States (concluded) | | | | | | | | |
International Business Machines Corp. | | | 10,400 | | | $ | 2,218,320 | |
International Paper Co. | | | 53,300 | | | | 2,482,714 | |
JPMorgan Chase & Co. | | | 75,800 | | | | 3,597,468 | |
Kennedy-Wilson Holdings, Inc. | | | 108,800 | | | | 1,687,488 | |
Kraft Foods Group, Inc. | | | 56,166 | | | | 2,894,234 | |
Las Vegas Sands Corp. | | | 40,700 | | | | 2,293,445 | |
Liberty Global, Inc., Class A (a) | | | 38,800 | | | | 2,847,920 | |
Lowe’s Cos., Inc. | | | 65,700 | | | | 2,491,344 | |
Mondelez International, Inc., Class A | | | 116,600 | | | | 3,569,126 | |
Monsanto Co. | | | 33,800 | | | | 3,570,294 | |
Oasis Petroleum, Inc. (a) | | | 55,500 | | | | 2,112,885 | |
Oracle Corp. | | | 87,800 | | | | 2,839,452 | |
Owens Corning (a) | | | 78,500 | | | | 3,095,255 | |
Pfizer, Inc. | | | 148,000 | | | | 4,271,280 | |
Roper Industries, Inc. | | | 26,500 | | | | 3,373,715 | |
Rowan Cos. Plc, Class A (a) | | | 80,400 | | | | 2,842,944 | |
SanDisk Corp. (a) | | | 56,062 | | | | 3,083,410 | |
Smithfield Foods, Inc. (a) | | | 74,100 | | | | 1,962,168 | |
Time Warner, Inc. | | | 55,600 | | | | 3,203,672 | |
United Rentals, Inc. (a) | | | 49,325 | | | | 2,711,395 | |
Universal Health Services, Inc., Class B | | | 22,600 | | | | 1,443,462 | |
Visa, Inc., Class A | | | 20,600 | | | | 3,498,704 | |
Weyerhaeuser Co. | | | 80,814 | | | | 2,535,943 | |
Whirlpool Corp. | | | 23,700 | | | | 2,807,502 | |
WisdomTree Investments, Inc. (a) | | | 190,020 | | | | 1,976,208 | |
Xilinx, Inc. | | | 68,100 | | | | 2,599,377 | |
| | | | | | | | |
| | |
| | | | | | | 153,475,200 | |
| |
Total Long-Term Investments | | | | | | | | |
(Cost – $272,834,891) – 98.0% | | | | | | | 327,162,862 | |
| |
| | | | | | | | |
| | | | | | | | |
| | |
Short-Term Securities | | | | | | | | |
| |
BlackRock Liquidity Funds, TempFund, Institutional Class, 0.09% (b)(c) | | | 3,338,253 | | | | 3,338,253 | |
| |
| | |
Total Short-Term Securities | | | | | | | | |
(Cost – $3,338,253) – 1.0% | | | | | | | 3,338,253 | |
| |
Total Investments (Cost – $276,173,144) – 99.0% | | | | 330,501,115 | |
Other Assets Less Liabilities – 1.0% | | | | | | | 3,230,678 | |
| | | | | | | | |
Net Assets – 100.0% | | | | | | $ | 333,731,793 | |
| | | | | | | | |
|
|
Notes to Schedule of Investments |
|
| (a) | Non-income producing security. |
| (b) | Represents the current yield as of report date. |
| (c) | Investments in issuers considered to be an affiliate of the Fund during the six months ended March 31, 2013, for purposes of Section 2(a)(3) of the Investment Company Act of 1940, as amended, were as follows: |
| | | | | | | | | | | | | | | | | | | | | | |
|
| Affiliate | | Shares Held at September 30, 2012 | | | | | Net Activity | | | Shares Held at March 31, 2013 | | | | | Income | | | |
|
| | | | | | | |
BlackRock Liquidity Funds, TempFund, Institutional Class | | | 1,615,812 | | | | | | 1,722,441 | | | | 3,338,253 | | | | | | $1,602 | | | |
|
See Notes to Financial Statements.
| | | | | | |
| | | | | MARCH 31, 2013 | | |
| | BLACKROCK FUNDS | | | 17 |
| | |
| Schedule of Investments (continued) | | BlackRock Global Opportunities Portfolio |
| — | | Foreign currency exchange contracts as of March 31, 2013 were as follows: |
| | | | | | | | | | | | | | | | | | | | | | | | |
| |
Currency Purchased | | | | | | | Currency Sold | | | | | Counterparty | | Settlement Date | | | | | Unrealized Appreciation (Depreciation) | |
| |
CHF | | | 670,215 | | | | | USD | | | 703,631 | | | UBS AG | | | 4/02/13 | | | | | $ | 2,602 | |
GBP | | | 4,000 | | | | | USD | | | 6,057 | | | Deutsche Bank AG | | | 4/02/13 | | | | | | 22 | |
GBP | | | 12,696 | | | | | USD | | | 19,262 | | | Citigroup, Inc. | | | 4/03/13 | | | | | | 33 | |
USD | | | 69,231 | | | | | CHF | | | 65,718 | | | Bank of America Corp. | | | 4/03/13 | | | | | | (19 | ) |
USD | | | 2,887,057 | | | | | EUR | | | 2,251,924 | | | UBS AG | | | 4/03/13 | | | | | | 541 | |
AUD | | | 5,387,874 | | | | | USD | | | 5,616,180 | | | BNP Paribas SA | | | 4/17/13 | | | | | | (14,931 | ) |
AUD | | | 1,725,444 | | | | | USD | | | 1,809,796 | | | UBS AG | | | 4/17/13 | | | | | | (16,019 | ) |
AUD | | | 2,424,943 | | | | | USD | | | 2,474,909 | | | UBS AG | | | 4/17/13 | | | | | | 46,068 | |
CAD | | | 1,716,000 | | | | | USD | | | 1,725,447 | | | Goldman Sachs Group, Inc. | | | 4/17/13 | | | | | | (36,946 | ) |
CAD | | | 67,923 | | | | | USD | | | 65,779 | | | Goldman Sachs Group, Inc. | | | 4/17/13 | | | | | | 1,056 | |
CAD | | | 10,507,000 | | | | | USD | | | 10,624,518 | | | Royal Bank of Scotland Group Plc | | | 4/17/13 | | | | | | (285,893 | ) |
CHF | | | 205,983 | | | | | USD | | | 219,185 | | | Bank of America Corp. | | | 4/17/13 | | | | | | (2,145 | ) |
CHF | | | 65,718 | | | | | USD | | | 69,242 | | | Bank of America Corp. | | | 4/17/13 | | | | | | 4 | |
CHF | | | 365,475 | | | | | USD | | | 389,675 | | | Citigroup, Inc. | | | 4/17/13 | | | | | | (4,583 | ) |
CHF | | | 209,182 | | | | | USD | | | 222,485 | | | Citigroup, Inc. | | | 4/17/13 | | | | | | (2,075 | ) |
CHF | | | 52,176 | | | | | USD | | | 55,507 | | | Citigroup, Inc. | | | 4/17/13 | | | | | | (531 | ) |
CHF | | | 646,011 | | | | | USD | | | 703,270 | | | Credit Suisse Group AG | | | 4/17/13 | | | | | | (22,585 | ) |
CHF | | | 131,876 | | | | | USD | | | 139,156 | | | Goldman Sachs Group, Inc. | | | 4/17/13 | | | | | | (202 | ) |
CHF | | | 88,384 | | | | | USD | | | 92,803 | | | Royal Bank of Scotland Group Plc | | | 4/17/13 | | | | | | 325 | |
CHF | | | 162,000 | | | | | USD | | | 170,848 | | | Westpac Banking Corp. | | | 4/17/13 | | | | | | (153 | ) |
DKK | | | 8,120,583 | | | | | USD | | | 1,426,175 | | | Deutsche Bank AG | | | 4/17/13 | | | | | | (29,629 | ) |
EUR | | | 1,679,169 | | | | | USD | | | 2,253,085 | | | Citigroup, Inc. | | | 4/17/13 | | | | | | (100,360 | ) |
EUR | | | 1,520,000 | | | | | USD | | | 2,026,206 | | | Citigroup, Inc. | | | 4/17/13 | | | | | | (77,538 | ) |
EUR | | | 717,396 | | | | | USD | | | 955,791 | | | Citigroup, Inc. | | | 4/17/13 | | | | | | (36,076 | ) |
EUR | | | 5,755,000 | | | | | USD | | | 7,821,045 | | | Deutsche Bank AG | | | 4/17/13 | | | | | | (443,029 | ) |
EUR | | | 2,251,924 | | | | | USD | | | 2,887,336 | | | UBS AG | | | 4/17/13 | | | | | | (328 | ) |
GBP | | | 1,168,945 | | | | | USD | | | 1,831,473 | | | Citigroup, Inc. | | | 4/17/13 | | | | | | (55,509 | ) |
GBP | | | 2,030,904 | | | | | USD | | | 3,104,917 | | | Citigroup, Inc. | | | 4/17/13 | | | | | | (19,390 | ) |
GBP | | | 43,389 | | | | | USD | | | 65,462 | | | Citigroup, Inc. | | | 4/17/13 | | | | | | 459 | |
GBP | | | 476,634 | | | | | USD | | | 753,103 | | | Deutsche Bank AG | | | 4/17/13 | | | | | | (28,959 | ) |
GBP | | | 1,138,835 | | | | | USD | | | 1,711,277 | | | Northern Trust Co. | | | 4/17/13 | | | | | | 18,940 | |
GBP | | | 41,527 | | | | | USD | | | 65,845 | | | Royal Bank of Scotland Group Plc | | | 4/17/13 | | | | | | (2,754 | ) |
HKD | | | 2,791,435 | | | | | USD | | | 360,042 | | | Citigroup, Inc. | | | 4/17/13 | | | | | | (401 | ) |
HKD | | | 11,070,000 | | | | �� | USD | | | 1,428,481 | | | Royal Bank of Scotland Group Plc | | | 4/17/13 | | | | | | (2,250 | ) |
HKD | | | 30,589,666 | | | | | USD | | | 3,941,858 | | | UBS AG | | | 4/17/13 | | | | | | (763 | ) |
JPY | | | 46,656,785 | | | | | USD | | | 496,156 | | | Bank of New York Mellon Corp. | | | 4/17/13 | | | | | | (455 | ) |
MXN | | | 12,154,000 | | | | | USD | | | 942,409 | | | Citigroup, Inc. | | | 4/17/13 | | | | | | 39,733 | |
NOK | | | 8,139,000 | | | | | USD | | | 1,447,141 | | | BNP Paribas SA | | | 4/17/13 | | | | | | (54,756 | ) |
NOK | | | 11,029,000 | | | | | USD | | | 1,998,623 | | | UBS AG | | | 4/17/13 | | | | | | (111,829 | ) |
SEK | | | 25,246,316 | | | | | USD | | | 3,882,197 | | | Bank of New York Mellon Corp. | | | 4/17/13 | | | | | | (9,720 | ) |
SEK | | | 2,304,728 | | | | | USD | | | 360,129 | | | Citigroup, Inc. | | | 4/17/13 | | | | | | (6,611 | ) |
SEK | | | 2,778,505 | | | | | USD | | | 430,865 | | | UBS AG | | | 4/17/13 | | | | | | (4,677 | ) |
SGD | | | 2,518,000 | | | | | USD | | | 2,047,211 | | | Citigroup, Inc. | | | 4/17/13 | | | | | | (17,047 | ) |
USD | | | 840,633 | | | | | CHF | | | 795,000 | | | Barclays Bank Plc | | | 4/17/13 | | | | | | 2,962 | |
USD | | | 179,219 | | | | | CHF | | | 170,246 | | | BNP Paribas SA | | | 4/17/13 | | | | | | (164 | ) |
USD | | | 774,930 | | | | | CHF | | | 710,645 | | | Goldman Sachs Group, Inc. | | | 4/17/13 | | | | | | 26,141 | |
USD | | | 3,967,027 | | | | | CHF | | | 3,661,530 | | | Goldman Sachs Group, Inc. | | | 4/17/13 | | | | | | 108,967 | |
USD | | | 351,019 | | | | | CHF | | | 325,281 | | | Royal Bank of Scotland Group Plc | | | 4/17/13 | | | | | | 8,279 | |
USD | | | 703,743 | | | | | CHF | | | 670,215 | | | UBS AG | | | 4/17/13 | | | | | | (2,445 | ) |
See Notes to Financial Statements.
| | | | |
| | | | | |
| 18 | | BLACKROCK FUNDS | | MARCH 31, 2013 |
| | |
| Schedule of Investments (continued) | | BlackRock Global Opportunities Portfolio |
| — | | Foreign currency exchange contracts as of March 31, 2013 were as follows: (concluded) |
| | | | | | | | | | | | | | | | | | | | | | | | |
| |
Currency Purchased | | | | | | | Currency Sold | | | | | Counterparty | | Settlement
Date | | | | | Unrealized Appreciation (Depreciation) | |
| |
USD | | | 895,537 | | | | | CHF | | | 845,771 | | | UBS AG | | | 4/17/13 | | | | | | $ 4,370 | |
USD | | | 1,311,020 | | | | | CHF | | | 1,216,849 | | | UBS AG | | | 4/17/13 | | | | | | 28,857 | |
USD | | | 2,424,791 | | | | | CHF | | | 2,247,340 | | | UBS AG | | | 4/17/13 | | | | | | 56,827 | |
USD | | | 2,209,163 | | | | | CHF | | | 2,030,000 | | | UBS AG | | | 4/17/13 | | | | | | 70,205 | |
USD | | | 144,428 | | | | | EUR | | | 108,000 | | | BNP Paribas SA | | | 4/17/13 | | | | | | 5,970 | |
USD | | | 164,346 | | | | | EUR | | | 121,000 | | | BNP Paribas SA | | | 4/17/13 | | | | | | 9,222 | |
USD | | | 2,352,168 | | | | | EUR | | | 1,795,000 | | | BNP Paribas SA | | | 4/17/13 | | | | | | 50,945 | |
USD | | | 340,389 | | | | | EUR | | | 260,000 | | | Citigroup, Inc. | | | 4/17/13 | | | | | | 7,064 | |
USD | | | 430,211 | | | | | EUR | | | 319,000 | | | Citigroup, Inc. | | | 4/17/13 | | | | | | 21,247 | |
USD | | | 221,498 | | | | | EUR | | | 166,000 | | | Credit Suisse Group AG | | | 4/17/13 | | | | | | 8,683 | |
USD | | | 1,724,839 | | | | | EUR | | | 1,328,660 | | | Deutsche Bank AG | | | 4/17/13 | | | | | | 21,472 | |
USD | | | 11,444,686 | | | | | EUR | | | 8,742,942 | | | Deutsche Bank AG | | | 4/17/13 | | | | | | 236,073 | |
USD | | | 844,774 | | | | | EUR | | | 640,999 | | | Royal Bank of Scotland Group Plc | | | 4/17/13 | | | | | | 23,001 | |
USD | | | 2,614,953 | | | | | GBP | | | 1,721,000 | | | Bank of America Corp. | | | 4/17/13 | | | | | | 259 | |
USD | | | 1,175,778 | | | | | GBP | | | 757,000 | | | BNP Paribas SA | | | 4/17/13 | | | | | | 25,678 | |
USD | | | 1,114,395 | | | | | GBP | | | 697,000 | | | BNP Paribas SA | | | 4/17/13 | | | | | | 55,452 | |
USD | | | 1,841,438 | | | | | GBP | | | 1,141,000 | | | BNP Paribas SA | | | 4/17/13 | | | | | | 107,931 | |
USD | | | 2,108,898 | | | | | GBP | | | 1,316,645 | | | BNP Paribas SA | | | 4/17/13 | | | | | | 108,536 | |
USD | | | 1,001,770 | | | | | GBP | | | 660,000 | | | Citigroup, Inc. | | | 4/17/13 | | | | | | (959 | ) |
USD | | | 145,377 | | | | | GBP | | | 96,000 | | | Citigroup, Inc. | | | 4/17/13 | | | | | | (475 | ) |
USD | | | 19,261 | | | | | GBP | | | 12,696 | | | Citigroup, Inc. | | | 4/17/13 | | | | | | (28 | ) |
USD | | | 2,133,589 | | | | | GBP | | | 1,347,596 | | | Citigroup, Inc. | | | 4/17/13 | | | | | | 86,204 | |
USD | | | 1,530,915 | | | | | GBP | | | 965,000 | | | Deutsche Bank AG | | | 4/17/13 | | | | | | 64,802 | |
USD | | | 1,349,161 | | | | | GBP | | | 840,390 | | | Royal Bank of Scotland Group Plc | | | 4/17/13 | | | | | | 72,367 | |
USD | | | 1,961,339 | | | | | GBP | | | 1,222,000 | | | Royal Bank of Scotland Group Plc | | | 4/17/13 | | | | | | 104,770 | |
USD | | | 6,423,384 | | | | | GBP | | | 4,100,000 | | | UBS AG | | | 4/17/13 | | | | | | 194,306 | |
USD | | | 2,116,924 | | | | | HKD | | | 16,405,000 | | | Deutsche Bank AG | | | 4/17/13 | | | | | | 3,346 | |
USD | | | 44,649 | | | | | JPY | | | 4,135,000 | | | Credit Suisse Group AG | | | 4/17/13 | | | | | | 717 | |
USD | | | 268,919 | | | | | JPY | | | 24,546,980 | | | Credit Suisse Group AG | | | 4/17/13 | | | | | | 8,122 | |
USD | | | 3,666,695 | | | | | JPY | | | 342,385,000 | | | Credit Suisse Group AG | | | 4/17/13 | | | | | | 29,053 | |
USD | | | 2,903,380 | | | | | JPY | | | 265,060,000 | | | Deutsche Bank AG | | | 4/17/13 | | | | | | 87,271 | |
USD | | | 467,977 | | | | | JPY | | | 42,116,660 | | | Royal Bank of Scotland Group Plc | | | 4/17/13 | | | | | | 20,512 | |
USD | | | 1,540,938 | | | | | JPY | | | 133,845,600 | | | Royal Bank of Scotland Group Plc | | | 4/17/13 | | | | | | 118,906 | |
USD | | | 2,189,792 | | | | | NOK | | | 12,324,000 | | | Citigroup, Inc. | | | 4/17/13 | | | | | | 81,456 | |
USD | | | 5,234,688 | | | | | SEK | | | 34,534,000 | | | Royal Bank of Scotland Group Plc | | | 4/17/13 | | | | | | (62,406 | ) |
ZAR | | | 27,525,000 | | | | | USD | | | 3,071,092 | | | UBS AG | | | 4/17/13 | | | | | | (85,799 | ) |
| |
| | | | | | | | |
Total | | | | | | | | | | | | | | | | | | | | | | | $429,317 | |
| | | | | | | | | | | | | | | | | | | | | | | | |
| — | | Fair Value Measurements – Various inputs are used in determining the fair value of investments and derivative financial instruments. These inputs to valuation techniques are categorized into a disclosure hierarchy consisting of three broad levels for financial statement purposes as follows: |
| | — | | Level 1 - unadjusted price quotations in active markets/exchanges for identical assets and liabilities that the Fund has the ability to access |
| | — | | Level 2 - other observable inputs (including, but not limited to, quoted prices for similar assets or liabilities in markets that are active, quoted prices for identical or similar assets or liabilities in markets that are not active, inputs other than quoted prices that are observable for the assets or liabilities (such as interest rates, yield curves, volatilities, prepayment speeds, loss severities, credit risks and default rates) or other market-corroborated inputs) |
| | — | | Level 3 - unobservable inputs based on the best information available in the circumstances, to the extent observable inputs are not available (including the Fund’s own assumptions used in determining the fair value of investments and derivative financial instruments) |
The hierarchy gives the highest priority to unadjusted quoted prices in active markets for identical assets or liabilities (Level 1 measurements) and the lowest priority to unobservable inputs (Level 3 measurements). Accordingly, the degree of judgment exercised in determining fair value is greatest for instruments categorized in Level 3. The inputs used to measure fair value may fall into different levels of the fair value hierarchy. In such cases, for disclosure purposes, the level in the fair value hierarchy within which the fair value measurement falls in its entirety is determined based on the lowest level input that is significant to the fair value measurement in its entirety.
See Notes to Financial Statements.
| | | | | | |
| | | | | MARCH 31, 2013 | | |
| | BLACKROCK FUNDS | | | 19 |
| | |
| Schedule of Investments (concluded) | | BlackRock Global Opportunities Portfolio |
Changes in valuation techniques may result in transfers into or out of an assigned level within the disclosure hierarchy. In accordance with the Fund’s policy, transfers between different levels of the fair value disclosure hierarchy are deemed to have occurred as of the beginning of the reporting period. The categorization of a value determined for investments and derivative financial instruments is based on the pricing transparency of the investment and derivative financial instrument and is not necessarily an indication of the risks associated with investing in those securities. For information about the Fund’s policy regarding valuation of investments and derivative financial instruments and other significant accounting policies, please refer to Note 1 of the Notes to Financial Statements.
The following tables summarize the Fund’s investments and derivative financial instruments categorized in the disclosure hierarchy as of March 31, 2013:
| | | | | | | | | | | | | | | | | | | | | | |
|
| | | Level 1 | | | | | Level 2 | | | | | Level 3 | | | | Total | | | |
|
Assets: | | | | | | | | | | | | | | | | | | | | | | |
Investments: | | | | | | | | | | | | | | | | | | | | | | |
Long-Term Investments: | | | | | | | | | | | | | | | | | | | | | | |
Common Stocks: | | | | | | | | | | | | | | | | | | | | | | |
Argentina | | | $ 1,240,800 | | | | | | – | | | | | – | | | | | $ 1,240,800 | | | |
Australia | | | – | | | | | | $ 709,469 | | | | | – | | | | | 709,469 | | | |
Belgium | | | – | | | | | | 3,695,996 | | | | | – | | | | | 3,695,996 | | | |
Canada | | | 1,295,857 | | | | | | – | | | | | – | | | | | 1,295,857 | | | |
China | | | – | | | | | | 3,801,277 | | | | | – | | | | | 3,801,277 | | | |
Cyprus | | | 2,602,150 | | | | | | – | | | | | – | | | | | 2,602,150 | | | |
France | | | – | | | | | | 14,835,079 | | | | | – | | | | | 14,835,079 | | | |
Germany | | | 3,189,384 | | | | | | 5,830,058 | | | | | – | | | | | 9,019,442 | | | |
Hong Kong | | | – | | | | | | 4,462,630 | | | | | – | | | | | 4,462,630 | | | |
India | | | – | | | | | | 3,313,067 | | | | | – | | | | | 3,313,067 | | | |
Indonesia | | | 3,149,943 | | | | | | 7,995,002 | | | | | – | | | | | 11,144,945 | | | |
Ireland | | | 4,197,708 | | | | | | – | | | | | – | | | | | 4,197,708 | | | |
Italy | | | – | | | | | | 5,424,311 | | | | | – | | | | | 5,424,311 | | | |
Japan | | | 22,102,407 | | | | | | – | | | | | – | | | | | 22,102,407 | | | |
Mexico | | | 4,535,977 | | | | | | – | | | | | – | | | | | 4,535,977 | | | |
Spain | | | – | | | | | | 2,249,727 | | | | | – | | | | | 2,249,727 | | | |
Sweden | | | – | | | | | | 5,460,612 | | | | | – | | | | | 5,460,612 | | | |
Switzerland | | | 2,229,084 | | | | | | 25,782,141 | | | | | – | | | | | 28,011,225 | | | |
Taiwan | | | 1,995,239 | | | | | | – | | | | | – | | | | | 1,995,239 | | | |
Thailand | | | 2,424,385 | | | | | | – | | | | | – | | | | | 2,424,385 | | | |
United Kingdom | | | 8,585,929 | | | | | | 32,579,430 | | | | | – | | | | | 41,165,359 | | | |
United States | | | 153,475,200 | | | | | | – | | | | | – | | | | | 153,475,200 | | | |
Short-Term Securities | | | 3,338,253 | | | | | | – | | | | | – | | | | | 3,338,253 | | | |
|
| | | | | | | | |
Total | | | $214,362,316 | | | | | | $116,138,799 | | | | | – | | | | | $330,501,115 | | | |
| | | |
| | | | | | | | | | | | | | | | | | | | | | |
|
| | | Level 1 | | | | | Level 2 | | | | | Level 3 | | | | Total | | | |
|
Derivative Financial Instruments1 | | | | | | | | | | | | | | | | | | | | | | |
Assets: | | | | | | | | | | | | | | | | | | | | | | |
Foreign currency exchange contracts | | | $ 3,198 | | | | | | $ 1,966,558 | | | | | – | | | | | $ 1,969,756 | | | |
Liabilities: | | | | | | | | | | | | | | | | | | | | | | |
Foreign currency exchange contracts | | | (19 | ) | | | | | (1,540,420 | ) | | | | – | | | | | (1,540,439 | ) | | |
|
| | | | | | | | |
Total | | | $ 3,179 | | | | | | $ 426,138 | | | | | – | | | | | $ 429,317 | | | |
| | | |
| 1 Derivative financial instruments are foreign currency exchange contracts which are valued at the unrealized appreciation/depreciation on the instrument. |
Certain of the Fund’s assets are held at carrying amount, which approximates fair value for financial statement purposes. As of March 31, 2013, such assets are categorized within the disclosure hierarchy as follows: |
| | | | | | | | | | | | | | | | | | | | | | |
|
| | | Level 1 | | | | | Level 2 | | | | | Level 3 | | | | Total | | | |
|
Assets: | | | | | | | | | | | | | | | | | | | | | | |
Cash | | | $ 74,911 | | | | | | – | | | | | – | | | | | $ 74,911 | | | |
Foreign currency at value | | | 291,298 | | | | | | – | | | | | – | | | | | 291,298 | | | |
|
| | | | | | | | |
Total | | | $ 366,209 | | | | | | – | | | | | – | | | | | $366,209 | | | |
| | | |
Certain foreign securities are fair valued utilizing an external pricing service to reflect any significant market movements between the time the Fund values such foreign securities and the earlier closing of foreign markets. Such fair valuations are categorized as Level 2 in the disclosure hierarchy. On March 29, 2013, US and certain other financial markets were closed, while some foreign markets were open. The Fund was re-priced for financial reporting purposes to reflect, in the valuation, the transactions related to open foreign market activities and were valued at the official closing price on the primary market or exchange on which the securities trade. The re-pricing resulted in the investments being categorized as Level 1. Therefore, these securities, with a value of $12,680,540, were transferred from Level 2 to Level 1 during the period September 30, 2012 to March 31, 2013.
See Notes to Financial Statements.
| | | | |
| | | | | |
| 20 | | BLACKROCK FUNDS | | MARCH 31, 2013 |
| | | | |
| Schedule of Investments March 31, 2013 (Unaudited) | | | BlackRock Health Sciences Opportunities Portfolio | |
| | | (Percentages shown are based on Net Assets) | |
| | | | | | | | |
| Common Stocks | | Shares | | | Value | |
| |
Biotechnology – 24.2% | | | | | | | | |
3SBio, Inc. - ADR (a) | | | 174,071 | | | $ | 2,645,880 | |
ACADIA Pharmaceuticals, Inc. (a) | | | 1,347,400 | | | | 10,698,356 | |
Acorda Therapeutics, Inc. (a)(b) | | | 609,800 | | | | 19,531,894 | |
Alexion Pharmaceuticals, Inc. (a)(b) | | | 124,701 | | | | 11,489,950 | |
Alnylam Pharmaceuticals, Inc. (a) | | | 614,861 | | | | 14,984,163 | |
Amgen, Inc. | | | 826,910 | | | | 84,766,544 | |
Biogen Idec, Inc. (a) | | | 63,100 | | | | 12,172,621 | |
BioMarin Pharmaceutical, Inc. (a) | | | 277,400 | | | | 17,270,924 | |
Celgene Corp. (a) | | | 796,652 | | | | 92,339,933 | |
Celldex Therapeutics, Inc. (a)(b) | | | 1,063,700 | | | | 12,317,646 | |
Cepheid, Inc. (a) | | | 185,400 | | | | 7,113,798 | |
ChemoCentryx, Inc. (a) | | | 145,639 | | | | 2,012,731 | |
CSL Ltd. | | | 152,153 | | | | 9,399,851 | |
Dyax Corp. (a) | | | 532,844 | | | | 2,323,200 | |
Exelixis, Inc. (a)(b) | | | 635,000 | | | | 2,933,700 | |
Genmab A/S (a) | | | 249,453 | | | | 5,770,955 | |
Gilead Sciences, Inc. (a)(b) | | | 2,201,356 | | | | 107,712,349 | |
Infinity Pharmaceuticals, Inc. (a)(b) | | | 516,400 | | | | 25,029,908 | |
InterMune, Inc. (a) | | | 585,700 | | | | 5,300,585 | |
Ironwood Pharmaceuticals, Inc. (a)(b) | | | 689,600 | | | | 12,612,784 | |
Isis Pharmaceuticals, Inc. (a) | | | 312,067 | | | | 5,286,415 | |
Momenta Pharmaceuticals, Inc. (a) | | | 360,800 | | | | 4,813,072 | |
Onyx Pharmaceuticals, Inc. (a) | | | 200,400 | | | | 17,807,544 | |
Protalix BioTherapeutics, Inc. (a)(b) | | | 973,526 | | | | 5,344,658 | |
Puma Biotechnology, Inc. (a) | | | 271,500 | | | | 9,065,385 | |
Seattle Genetics, Inc. (a) | | | 1,149,500 | | | | 40,818,745 | |
Synageva BioPharma Corp. (a)(b) | | | 230,497 | | | | 12,658,895 | |
Ultragenyx Pharmaceutical, Inc. (Acquired 12/18/12, cost $3,351,658) (a)(c) | | | 1,210,247 | | | | 3,351,658 | |
Verastem, Inc. (a) | | | 140,740 | | | | 1,353,919 | |
Vertex Pharmaceuticals, Inc. (a)(b) | | | 388,870 | | | | 21,380,073 | |
| | | | | | | | |
| | |
| | | | | | | 580,308,136 | |
| |
Diversified Consumer Services – 0.8% | | | | | | | | |
Service Corp. International | | | 1,071,500 | | | | 17,926,195 | |
| |
Food & Staples Retailing – 1.1% | | | | | | | | |
Brazil Pharma SA | | | 1,445,900 | | | | 10,084,182 | |
CVS Caremark Corp. | | | 295,400 | | | | 16,244,046 | |
| | | | | | | | |
| | |
| | | | | | | 26,328,228 | |
| |
Health Care Equipment & Supplies – 15.2% | | | | | |
Baxter International, Inc. | | | 409,200 | | | | 29,724,288 | |
Becton Dickinson & Co. | | | 364,400 | | | | 34,840,284 | |
Boston Scientific Corp. (a) | | | 2,535,300 | | | | 19,800,693 | |
CareFusion Corp. (a) | | | 782,500 | | | | 27,379,675 | |
Coloplast A/S, Class B | | | 240,200 | | | | 12,943,022 | |
The Cooper Cos., Inc. | | | 290,400 | | | | 31,328,352 | |
Covidien Plc | | | 555,800 | | | | 37,705,472 | |
DENTSPLY International, Inc. | | | 652,300 | | | | 27,670,566 | |
Given Imaging Ltd. (a) | | | 228,469 | | | | 3,735,468 | |
Medtronic, Inc. | | | 507,200 | | | | 23,818,112 | |
Sirona Dental Systems, Inc. (a) | | | 453,500 | | | | 33,436,555 | |
Stryker Corp. | | | 753,900 | | | | 49,184,436 | |
Teleflex, Inc. | | | 235,300 | | | | 19,885,203 | |
Thoratec Corp. (a) | | | 359,800 | | | | 13,492,500 | |
| | | | | | | | |
| | |
| | | | | | | 364,944,626 | |
| |
Health Care Providers & Services – 13.4% | | | | | |
Aetna, Inc. | | | 236,423 | | | | 12,085,944 | |
AmerisourceBergen Corp. (d) | | | 464,200 | | | | 23,883,090 | |
Brookdale Senior Living, Inc. (a) | | | 681,100 | | | | 18,989,068 | |
Capital Senior Living Corp. (a) | | | 560,687 | | | | 14,818,957 | |
Cardinal Health, Inc. (d) | | | 369,345 | | | | 15,372,139 | |
| | | | | | | | |
| Common Stocks | | Shares | | | Value | |
| |
Health Care Providers & Services (concluded) | | | | | |
Catamaran Corp. (a) | | | 674,600 | | | $ | 35,774,038 | |
CIGNA Corp. | | | 191,000 | | | | 11,912,670 | |
Express Scripts Holding Co. (a) | | | 410,747 | | | | 23,679,565 | |
HCA Holdings, Inc. | | | 818,000 | | | | 33,235,340 | |
McKesson Corp. | | | 242,700 | | | | 26,201,892 | |
Team Health Holdings, Inc. (a) | | | 329,651 | | | | 11,992,703 | |
UnitedHealth Group, Inc. | | | 682,482 | | | | 39,044,795 | |
Universal Health Services, Inc., Class B | | | 856,200 | | | | 54,685,494 | |
| | | | | | | | |
| | |
| | | | | | | 321,675,695 | |
| |
Health Care Technology – 0.8% | | | | | | | | |
Cerner Corp. (a)(b) | | | 197,100 | | | | 18,675,225 | |
| |
Industrial Conglomerates – 0.6% | | | | | | | | |
Koninklijke Philips Electronics NV | | | 493,674 | | | | 14,605,756 | |
| |
Life Sciences Tools & Services – 5.3% | | | | | | | | |
ICON Plc (a) | | | 701,600 | | | | 22,654,664 | |
Illumina, Inc. (a) | | | 331,400 | | | | 17,895,600 | |
Life Technologies Corp. (a) | | | 73,800 | | | | 4,769,694 | |
Mettler-Toledo International, Inc. (a) | | | 44,506 | | | | 9,489,569 | |
Morphosys AG (a) | | | 85,600 | | | | 3,505,169 | |
Thermo Fisher Scientific, Inc. | | | 463,000 | | | | 35,414,870 | |
Waters Corp. (a)(b) | | | 362,575 | | | | 34,049,418 | |
| | | | | | | | |
| | |
| | | | | | | 127,778,984 | |
| |
Pharmaceuticals – 37.2% | | | | | | | | |
AbbVie, Inc. | | | 1,417,700 | | | | 57,813,806 | |
Actavis, Inc. (a) | | | 77,100 | | | | 7,101,681 | |
Allergan, Inc. | | | 503,800 | | | | 56,239,194 | |
Bayer AG, Registered Shares | | | 178,700 | | | | 18,467,201 | |
Bristol-Myers Squibb Co. | | | 1,901,900 | | | | 78,339,261 | |
Eli Lilly & Co. | | | 1,377,800 | | | | 78,245,262 | |
Johnson & Johnson | | | 1,248,700 | | | | 101,806,511 | |
Merck & Co., Inc. | | | 681,200 | | | | 30,129,476 | |
Mylan, Inc. (a) | | | 466,100 | | | | 13,488,934 | |
Novartis AG, Registered Shares | | | 1,231,500 | | | | 87,799,168 | |
Ono Pharmaceutical Co. Ltd. | | | 121,400 | | | | 7,386,091 | |
Pfizer, Inc. | | | 4,018,040 | | | | 115,960,634 | |
Roche Holding AG | | | 408,600 | | | | 95,284,232 | |
Sanofi | | | 687,800 | | | | 70,142,788 | |
Takeda Pharmaceutical Co. Ltd. | | | 268,200 | | | | 14,324,124 | |
Teva Pharmaceutical Industries Ltd. - ADR | | | 436,200 | | | | 17,308,416 | |
Valeant Pharmaceuticals International, Inc. (a) | | | 342,700 | | | | 25,709,354 | |
Zoetis, Inc. (a) | | | 477,900 | | | | 15,961,860 | |
| | | | | | | | |
| | |
| | | | | | | 891,507,993 | |
| |
Total Long-Term Investments | | | | | | | | |
(Cost – $ 1,791,784,916) – 98.6% | | | | | | | 2,363,750,838 | |
| |
| | | | | | | | |
| | | | | | | | |
| | |
| Short-Term Securities | | | | | | |
| |
BlackRock Liquidity Funds, TempFund, Institutional Class, 0.09% (e)(f) | | | 28,103,991 | | | | 28,103,991 | |
| |
| | |
| | | Beneficial
Interest
(000) | | | | |
| |
BlackRock Liquidity Series, LLC Money Market Series, 0.23% (e)(f)(g) | | | $ 148,972 | | | | 148,972,154 | |
| |
| | |
Total Short-Term Securities | | | | | | | | |
(Cost – $ 177,076,145) – 7.4% | | | | | | | 177,076,145 | |
| |
See Notes to Financial Statements.
| | | | | | |
| | | | | MARCH 31, 2013 | | |
| | BLACKROCK FUNDS | | | 21 |
| | |
| Schedule of Investments (continued) | | BlackRock Health Sciences Opportunities Portfolio (Percentages shown are based on Net Assets) |
| | | | |
| | | Value | |
| |
Total Investments Before Options Written | | | | |
(Cost – $1,968,861,061) – 106.0% | | $ | 2,540,826,983 | |
| |
| | | | |
| | | | |
| |
| Options Written | | | |
| |
(Premiums Received – $ 170,116) – (0.0)% | | | (93,752 | ) |
| |
| | | | |
| | | Value | |
| |
Total Investments Net of Options Written – 106.0% | | $ | 2,540,733,231 | |
Liabilities in Excess of Other Assets – (6.0)% | | | (143,316,413 | ) |
| | | | |
Net Assets – 100.0% | | $ | 2,397,416,818 | |
| | | | |
|
|
Notes to Schedule of Investments |
|
| (a) | Non-income producing security. |
| (b) | Security, or a portion of security, is on loan. |
| (c) | Restricted security as to resale. As of report date, the Fund held 0.1% of its net assets, with a current value of $3,351,658 and an original cost of $3,351,658, in this security. |
| (d) | All or a portion of security has been pledged/segregated as collateral in connection with outstanding options written. |
| (e) | Represents the current yield as of report date. |
| (f) | Investments in issuers considered to be an affiliate of the Fund during the six months ended March 31, 2013, for purposes of Section 2(a)(3) of the Investment Company Act of 1940, as amended, were as follows: |
| | | | | | | | | | | | | | | | | | | | | | |
| |
| Affiliate | | Shares/ Beneficial Interest Held at September 30, 2012 | | | | | Net Activity | | | | | Shares/ Beneficial Interest Held at March 31, 2013 | | | | | Income | |
| |
BlackRock Liquidity Funds, TempFund, Institutional Class | | | 62,805,555 | | | | | | (34,701,564 | ) | | | | | 28,103,991 | | | | | | $ 26,393 | |
BlackRock Liquidity Series LLC, Money Market Series | | | $176,438,673 | | | | | | $(27,466,519 | ) | | | | | $148,972,154 | | | | | | $147,001 | |
| |
| (g) | Security was purchased with the cash collateral from loaned securities. The Fund may withdraw up to 25% of its investment daily, although the manager of the BlackRock Liquidity Series LLC, Money Market Series, in its sole discretion, may permit an investor to withdraw more than 25% on any one day. |
| — | | For Fund compliance purposes, the Fund’s industry classifications refer to any one or more of the industry sub-classifications used by one or more widely recognized market indexes or ratings group indexes, and/or as defined by Fund management. These definitions may not apply for purposes of this report, which may combine such industry sub-classifications for reporting ease. |
| — | | Exchange-traded options written as of March 31, 2013 were as follows: |
| | | | | | | | | | | | | | | | | | | | | | | | | | | | |
| |
| Description | | Put/ Call | | | | | Strike Price | | | | | Expiration Date | | | | | Contracts | | | | | Market Value | |
| |
AmerisourceBergen Corp. | | | Call | | | | | | $52 | | | | | | 4/20/13 | | | | | | 692 | | | | | | $(47,927 | ) |
Cardinal Health, Inc. | | | Call | | | | | | $43 | | | | | | 4/20/13 | | | | | | 1,833 | | | | | | (45,825 | ) |
| |
Total | | | | | | | | | | | | | | | | | | | | | | | | | | | $(93,752 | ) |
| | | | | | | | | | | | | | | | | | | | | | | | | | | | |
| — | | Foreign currency exchange contracts as of March 31, 2013 were as follows: |
| | | | | | | | | | | | | | | | | | | | | | | | |
| |
Currency Purchased | | | | | | | Currency
Sold | | | | | Counterparty | | Settlement Date | | | | | Unrealized Appreciation (Depreciation) | |
| |
JPY | | | 96,953,000 | | | | | USD | | | 1,028,488 | | | Citigroup, Inc. | | | 4/01/13 | | | | | | $ 955 | |
JPY | | | 6,497,000 | | | | | USD | | | 68,927 | | | Citigroup, Inc. | | | 4/02/13 | | | | | | 58 | |
CHF | | | 539,620 | | | | | USD | | | 569,159 | | | Citigroup, Inc. | | | 4/03/13 | | | | | | (540 | ) |
EUR | | | 256,035 | | | | | USD | | | 328,390 | | | Citigroup, Inc. | | | 4/03/13 | | | | | | (205 | ) |
AUD | | | 7,157,192 | | | | | USD | | | 7,304,666 | | | UBS AG | | | 4/17/13 | | | | | | 135,970 | |
CHF | | | 1,589,634 | | | | | USD | | | 1,691,130 | | | Citigroup, Inc. | | | 4/17/13 | | | | | | (16,174 | ) |
CHF | | | 1,822,616 | | | | | USD | | | 1,913,747 | | | Royal Bank of Scotland Group Plc | | | 4/17/13 | | | | | | 6,697 | |
DKK | | | 876,393 | | | | | USD | | | 156,568 | | | Royal Bank of Scotland Group Plc | | | 4/17/13 | | | | | | (5,849 | ) |
DKK | | | 42,098 | | | | | USD | | | 7,369 | | | Royal Bank of Scotland Group Plc | | | 4/17/13 | | | | | | (129 | ) |
EUR | | | 13,572,699 | | | | | USD | | | 18,211,658 | | | Citigroup, Inc. | | | 4/17/13 | | | | | | (811,208 | ) |
JPY | | | 256,330,000 | | | | | USD | | | 2,714,808 | | | HSBC Holdings Plc | | | 4/17/13 | | | | | | 6,895 | |
USD | | | 11,100,291 | | | | | AUD | | | 10,647,782 | | | Royal Bank of Scotland Group Plc | | | 4/17/13 | | | | | | 30,828 | |
USD | | | 13,529,432 | | | | | CHF | | | 12,795,000 | | | Barclays Bank Plc | | | 4/17/13 | | | | | | 47,671 | |
USD | | | 1,545,766 | | | | | CHF | | | 1,468,368 | | | BNP Paribas SA | | | 4/17/13 | | | | | | (1,415 | ) |
See Notes to Financial Statements.
| | | | |
| | | | | |
| 22 | | BLACKROCK FUNDS | | MARCH 31, 2013 |
| | |
| Schedule of Investments (continued) | | BlackRock Health Sciences Opportunities Portfolio |
| — | | Foreign currency exchange contracts as of March 31, 2013 were as follows: (concluded) |
| | | | | | | | | | | | | | | | | | | | | | | | |
| |
Currency Purchased | | | | | | | Currency Sold | | | | | Counterparty | | Settlement
Date | | | | | Unrealized
Appreciation
(Depreciation) | |
| |
USD | | | 9,180,642 | | | | | CHF | | | 8,715,000 | | | Citigroup, Inc. | | | 4/17/13 | | | | | | $ (2,128 | ) |
USD | | | 569,234 | | | | | CHF | | | 539,620 | | | Citigroup, Inc. | | | 4/17/13 | | | | | | 651 | |
USD | | | 2,236,551 | | | | | CHF | | | 2,063,525 | | | Deutsche Bank AG | | | 4/17/13 | | | | | | 62,268 | |
USD | | | 127,404,637 | | | | | CHF | | | 117,593,333 | | | Goldman Sachs Group, Inc. | | | 4/17/13 | | | | | | 3,499,580 | |
USD | | | 2,148,000 | | | | | CHF | | | 2,028,386 | | | Royal Bank of Scotland Group Plc | | | 4/17/13 | | | | | | 10,742 | |
USD | | | 2,053,803 | | | | | CHF | | | 1,938,006 | | | Royal Bank of Scotland Group Plc | | | 4/17/13 | | | | | | 11,777 | |
USD | | | 4,485,776 | | | | | CHF | | | 4,231,674 | | | Royal Bank of Scotland Group Plc | | | 4/17/13 | | | | | | 26,970 | |
USD | | | 4,769,540 | | | | | CHF | | | 4,427,025 | | | Royal Bank of Scotland Group Plc | | | 4/17/13 | | | | | | 104,898 | |
USD | | | 670,893 | | | | | CHF | | | 632,695 | | | UBS AG | | | 4/17/13 | | | | | | 4,238 | |
USD | | | 3,406,556 | | | | | CHF | | | 3,224,469 | | | UBS AG | | | 4/17/13 | | | | | | 9,017 | |
USD | | | 5,058,240 | | | | | CHF | | | 4,714,224 | | | UBS AG | | | 4/17/13 | | | | | | 90,984 | |
USD | | | 2,956,467 | | | | | CHF | | | 2,711,984 | | | UBS AG | | | 4/17/13 | | | | | | 98,919 | |
USD | | | 6,056,154 | | | | | CHF | | | 5,565,000 | | | UBS AG | | | 4/17/13 | | | | | | 192,457 | |
USD | | | 366,138 | | | | | DKK | | | 2,047,220 | | | Deutsche Bank AG | | | 4/17/13 | | | | | | 14,065 | |
USD | | | 5,041,517 | | | | | DKK | | | 28,182,195 | | | Deutsche Bank AG | | | 4/17/13 | | | | | | 194,855 | |
USD | | | 5,144,888 | | | | | DKK | | | 28,769,319 | | | Deutsche Bank AG | | | 4/17/13 | | | | | | 197,255 | |
USD | | | 160,694 | | | | | DKK | | | 924,569 | | | Royal Bank of Scotland Group Plc | | | 4/17/13 | | | | | | 1,691 | |
USD | | | 250,369 | | | | | DKK | | | 1,432,865 | | | Royal Bank of Scotland Group Plc | | | 4/17/13 | | | | | | 3,951 | |
USD | | | 259,947 | | | | | DKK | | | 1,487,943 | | | Royal Bank of Scotland Group Plc | | | 4/17/13 | | | | | | 4,056 | |
USD | | | 843,985 | | | | | DKK | | | 4,679,581 | | | Royal Bank of Scotland Group Plc | | | 4/17/13 | | | | | | 39,209 | |
USD | | | 328,416 | | | | | EUR | | | 256,035 | | | Citigroup, Inc. | | | 4/17/13 | | | | | | 174 | |
USD | | | 402,150 | | | | | EUR | | | 312,068 | | | Citigroup, Inc. | | | 4/17/13 | | | | | | 2,074 | |
USD | | | 323,756 | | | | | EUR | | | 250,109 | | | Citigroup, Inc. | | | 4/17/13 | | | | | | 3,111 | |
USD | | | 733,152 | | | | | EUR | | | 566,000 | | | Citigroup, Inc. | | | 4/17/13 | | | | | | 7,530 | |
USD | | | 433,596 | | | | | EUR | | | 324,573 | | | Citigroup, Inc. | | | 4/17/13 | | | | | | 17,487 | |
USD | | | 1,003,226 | | | | | EUR | | | 766,000 | | | Citigroup, Inc. | | | 4/17/13 | | | | | | 21,200 | |
USD | | | 1,622,821 | | | | | EUR | | | 1,245,274 | | | Citigroup, Inc. | | | 4/17/13 | | | | | | 26,357 | |
USD | | | 2,134,160 | | | | | EUR | | | 1,637,994 | | | Citigroup, Inc. | | | 4/17/13 | | | | | | 34,222 | |
USD | | | 5,697,485 | | | | | EUR | | | 4,400,000 | | | Citigroup, Inc. | | | 4/17/13 | | | | | | 56,604 | |
USD | | | 2,648,023 | | | | | EUR | | | 2,043,720 | | | Deutsche Bank AG | | | 4/17/13 | | | | | | 27,937 | |
USD | | | 4,972,297 | | | | | EUR | | | 3,796,000 | | | Deutsche Bank AG | | | 4/17/13 | | | | | | 105,755 | |
USD | | | 98,670,840 | | | | | EUR | | | 75,377,641 | | | Deutsche Bank AG | | | 4/17/13 | | | | | | 2,035,316 | |
USD | | | 2,787,294 | | | | | EUR | | | 2,093,000 | | | Royal Bank of Scotland Group Plc | | | 4/17/13 | | | | | | 104,030 | |
USD | | | 1,544,739 | | | | | JPY | | | 146,373,000 | | | Barclays Bank Plc | | | 4/17/13 | | | | | | (10,389 | ) |
USD | | | 175,051 | | | | | JPY | | | 16,621,728 | | | Citigroup, Inc. | | | 4/17/13 | | | | | | (1,546 | ) |
USD | | | 1,028,591 | | | | | JPY | | | 96,953,000 | | | Citigroup, Inc. | | | 4/17/13 | | | | | | (1,479 | ) |
USD | | | 461,274 | | | | | JPY | | | 42,998,989 | | | Citigroup, Inc. | | | 4/17/13 | | | | | | 4,435 | |
USD | | | 272,610 | | | | | JPY | | | 26,127,494 | | | Deutsche Bank AG | | | 4/17/13 | | | | | | (4,979 | ) |
USD | | | 2,715,162 | | | | | JPY | | | 256,330,000 | | | Royal Bank of Canada | | | 4/17/13 | | | | | | (8,196 | ) |
USD | | | 161,762 | | | | | JPY | | | 15,540,000 | | | Royal Bank of Scotland Group Plc | | | 4/17/13 | | | | | | (3,342 | ) |
USD | | | 2,046,624 | | | | | JPY | | | 192,742,000 | | | Royal Bank of Scotland Group Plc | | | 4/17/13 | | | | | | (1,149 | ) |
USD | | | 353,409 | | | | | JPY | | | 33,045,000 | | | Royal Bank of Scotland Group Plc | | | 4/17/13 | | | | | | 2,325 | |
USD | | | 856,713 | | | | | JPY | | | 77,967,044 | | | Royal Bank of Scotland Group Plc | | | 4/17/13 | | | | | | 28,358 | |
USD | | | 4,927,895 | | | | | JPY | | | 443,497,265 | | | Royal Bank of Scotland Group Plc | | | 4/17/13 | | | | | | 215,993 | |
USD | | | 5,245,328 | | | | | JPY | | | 463,975,000 | | | Royal Bank of Scotland Group Plc | | | 4/17/13 | | | | | | 315,862 | |
USD | | | 853,764 | | | | | JPY | | | 78,428,000 | | | UBS AG | | | 4/17/13 | | | | | | 20,512 | |
| |
| | | | | | | | |
Total | | | | | | | | | | | | | | | | | | | | | | | $6,957,211 | |
| | | | | | | | | | | | | | | | | | | | | | | | |
See Notes to Financial Statements.
| | | | | | |
| | | | | MARCH 31, 2013 | | |
| | BLACKROCK FUNDS | | | 23 |
| | |
| Schedule of Investments (continued) | | BlackRock Health Sciences Opportunities Portfolio |
| — | | Fair Value Measurements – Various inputs are used in determining the fair value of investments and derivative financial instruments. These inputs to valuation techniques are categorized into a disclosure hierarchy consisting of three broad levels for financial statement purposes as follows: |
| | — | | Level 1 - unadjusted price quotations in active markets/exchanges for identical assets and liabilities that the Fund has the ability to access |
| | — | | Level 2 - other observable inputs (including, but not limited to, quoted prices for similar assets or liabilities in markets that are active, quoted prices for identical or similar assets or liabilities in markets that are not active, inputs other than quoted prices that are observable for the assets or liabilities (such as interest rates, yield curves, volatilities, prepayment speeds, loss severities, credit risks and default rates) or other market-corroborated inputs) |
| | — | | Level 3 - unobservable inputs based on the best information available in the circumstances, to the extent observable inputs are not available (including the Fund’s own assumptions used in determining the fair value of investments and derivative financial instruments) |
The hierarchy gives the highest priority to unadjusted quoted prices in active markets for identical assets or liabilities (Level 1 measurements) and the lowest priority to unobservable inputs (Level 3 measurements). Accordingly, the degree of judgment exercised in determining fair value is greatest for instruments categorized in Level 3. The inputs used to measure fair value may fall into different levels of the fair value hierarchy. In such cases, for disclosure purposes, the level in the fair value hierarchy within which the fair value measurement falls in its entirety is determined based on the lowest level input that is significant to the fair value measurement in its entirety.
Changes in valuation techniques may result in transfers into or out of an assigned level within the disclosure hierarchy. In accordance with the Fund’s policy, transfers between different levels of the fair value disclosure hierarchy are deemed to have occurred as of the beginning of the reporting period. The categorization of a value determined for investments and derivative financial instruments is based on the pricing transparency of the investment and derivative financial instrument and is not necessarily an indication of the risks associated with investing in those securities. For information about the Fund’s policy regarding valuation of investments and derivative financial instruments and other significant accounting policies, please refer to Note 1 of the Notes to Financial Statements.
The following tables summarize the Fund’s investments and derivative financial instruments categorized in the disclosure hierarchy as of March 31, 2013:
| | | | | | | | | | | | | | | | | | | | | | | | |
|
| | | Level 1 | | | | | Level 2 | | | | | Level 3 | | | | | Total | | | |
|
Assets: | | | | | | | | | | | | | | | | | | | | | | | | |
Investments: | | | | | | | | | | | | | | | | | | | | | | | | |
Long-Term Investments: | | | | | | | | | | | | | | | | | | | | | | | | |
Common Stocks: | | | | | | | | | | | | | | | | | | | | | | | | |
Biotechnology | | | $ 561,785,672 | | | | | | $ 15,170,806 | | | | | | $ 3,351,658 | | | | | | $ 580,308,136 | | | |
Diversified Consumer Services | | | 17,926,195 | | | | | | – | | | | | | – | | | | | | 17,926,195 | | | |
Food & Staples Retailing | | | 26,328,228 | | | | | | – | | | | | | – | | | | | | 26,328,228 | | | |
Health Care Equipment & Supplies | | | 352,001,604 | | | | | | 12,943,022 | | | | | | – | | | | | | 364,944,626 | | | |
Health Care Providers & Services | | | 321,675,695 | | | | | | – | | | | | | – | | | | | | 321,675,695 | | | |
Health Care Technology | | | 18,675,225 | | | | | | – | | | | | | – | | | | | | 18,675,225 | | | |
Industrial Conglomerates | | | – | | | | | | 14,605,756 | | | | | | – | | | | | | 14,605,756 | | | |
Life Sciences Tools & Services | | | 124,273,815 | | | | | | 3,505,169 | | | | | | – | | | | | | 127,778,984 | | | |
Pharmaceuticals | | | 619,814,604 | | | | | | 271,693,389 | | | | | | – | | | | | | 891,507,993 | | | |
Short-Term Securities | | | 28,103,991 | | | | | | 148,972,154 | | | | | | – | | | | | | 177,076,145 | | | |
|
| | | | | | | | |
Total | | | $2,070,585,029 | | | | | | $466,890,296 | | | | | | $ 3,351,658 | | | | | | $2,540,826,983 | | | |
| | | |
| | | | | | | | | | | | | | | | | | | | | | | | |
|
| | | Level 1 | | | | | Level 2 | | | | | Level 3 | | | | | Total | | | |
|
Derivative Financial Instruments1 | | | | | | | | | | | | | | | | | | | | | | | | |
Assets: | | | | | | | | | | | | | | | | | | | | | | | | |
Foreign currency exchange contracts | | | $ 7,909 | | | | | | $ 7,818,031 | | | | | | – | | | | | | $ 7,825,940 | | | |
Liabilities: | | | | | | | | | | | | | | | | | | | | | | | | |
Equity contracts | | | (93,752 | ) | | | | | – | | | | | | – | | | | | | (93,752 | ) | | |
Foreign currency exchange contracts | | | (745 | ) | | | | | (867,984 | ) | | | | | – | | | | | | (868,729 | ) | | |
|
| | | | | | | | |
Total | | | $ (86,588 | ) | | | | | $ 6,950,047 | | | | | | – | | | | | | $ 6,863,459 | | | |
| | | |
1 Derivative financial instruments are foreign currency exchange contracts and options. Foreign currency exchange contracts are valued at the unrealized appreciation/depreciation on the instrument and options are shown at value. |
Certain of the Fund’s assets and liabilities are held at carrying amount, which approximates fair value for financial statement purposes. As of March 31, 2013, such assets and liabilities are categorized within the disclosure hierarchy as follows: |
| | | | | | | | | | | | | | | | | | | | | | | | |
|
| | | Level 1 | | | | | Level 2 | | | | | Level 3 | | | | | Total | | | |
|
Assets: | | | | | | | | | | | | | | | | | | | | | | | | |
Cash | | | $ 884,738 | | | | | | – | | | | | | – | | | | | | $ 884,738 | | | |
Foreign currency at value | | | 4,209 | | | | | | – | | | | | | – | | | | | | 4,209 | | | |
Liabilities: | | | | | | | | | | | | | | | | | | | | | | | | |
Foreign bank overdraft | | | – | | | | | | $ (1,554,397 | ) | | | | | – | | | | | | (1,554,397 | ) | | |
Collateral on securities loaned at value | | | – | | | | | | (148,972,154 | ) | | | | | – | | | | | | (148,972,154 | ) | | |
|
| | | | | | | | |
Total | | | $ 888,947 | | | | | | $(150,526,551 | ) | | | | | – | | | | | | $(149,637,604 | ) | | |
| | | |
See Notes to Financial Statements.
| | | | |
| | | | | |
| 24 | | BLACKROCK FUNDS | | MARCH 31, 2013 |
| | |
| Schedule of Investments (concluded) | | BlackRock Health Sciences Opportunities Portfolio |
There were no transfers between levels during the six months ended March 31, 2013.
Certain of the Fund’s investments are categorized as Level 3 and were valued utilizing transaction prices from recent transactions or third party pricing information without adjustment. Such valuations are based on unobservable inputs. A significant change in the unobservable inputs could result in a significantly lower or higher value in such Level 3 investments.
See Notes to Financial Statements.
| | | | | | |
| | | | | MARCH 31, 2013 | | |
| | BLACKROCK FUNDS | | | 25 |
| | |
| Schedule of Investments March 31, 2013 (Unaudited) | | BlackRock International Opportunities Portfolio (Percentages shown are based on Net Assets) |
| | | | | | | | |
| Common Stocks | | Shares | | | Value | |
| |
Australia – 0.6% | | | | | | | | |
CSL Ltd. | | | 180,451 | | | $ | 11,148,071 | |
| |
Belgium – 2.8% | | | | | | | | |
Ageas | | | 295,600 | | | | 10,032,618 | |
Anheuser-Busch InBev NV | | | 189,779 | | | | 18,866,601 | |
KBC Groep NV | | | 577,166 | | | | 20,011,948 | |
| | | | | | | | |
| | |
| | | | | | | 48,911,167 | |
| |
Canada – 0.4% | | | | | | | | |
Gildan Activewear, Inc. | | | 179,800 | | | | 7,163,368 | |
| |
China – 0.8% | | | | | | | | |
Tencent Holdings Ltd. | | | 464,500 | | | | 14,855,226 | |
| |
Cyprus – 0.9% | | | | | | | | |
Eurasia Drilling Co. Ltd. - GDR | | | 445,200 | | | | 15,804,600 | |
| |
Finland – 0.9% | | | | | | | | |
Konecranes Oyj | | | 469,400 | | | | 15,535,929 | |
| |
France – 5.8% | | | | | | | | |
Publicis Groupe SA | | | 176,200 | | | | 11,825,832 | |
Rexel SA | | | 842,494 | | | | 18,395,317 | |
Safran SA | | | 194,400 | | | | 8,675,963 | |
Sanofi | | | 442,500 | | | | 45,126,758 | |
Technip SA | | | 82,000 | | | | 8,410,402 | |
Valeo SA | | | 155,900 | | | | 8,446,933 | |
| | | | | | | | |
| | |
| | | | | | | 100,881,205 | |
| |
Germany – 8.0% | | | | | | | | |
BASF SE | | | 148,400 | | | | 13,029,388 | |
Bayer AG, Registered Shares | | | 172,500 | | | | 17,826,481 | |
Brenntag AG | | | 30,200 | | | | 4,722,101 | |
Deutsche Lufthansa AG, Registered Shares | | | 866,300 | | | | 16,943,585 | |
Deutsche Wohnen AG | | | 985,000 | | | | 17,918,271 | |
Gerry Weber International AG | | | 275,088 | | | | 12,027,940 | |
LEG Immobilien AG (a) | | | 172,500 | | | | 9,242,419 | |
Linde AG | | | 49,500 | | | | 9,220,378 | |
SAP AG | | | 108,600 | | | | 8,734,054 | |
SAP AG - ADR | | | 212,000 | | | | 17,074,480 | |
Volkswagen AG, Preference Shares | | | 71,200 | | | | 14,180,506 | |
| | | | | | | | |
| | |
| | | | | | | 140,919,603 | |
| |
Hong Kong – 5.3% | | | | | | | | |
AIA Group Ltd. | | | 6,970,100 | | | | 30,642,277 | |
Cheung Kong Holdings Ltd. | | | 981,000 | | | | 14,531,198 | |
Jardine Matheson Holdings Ltd. | | | 205,600 | | | | 13,158,400 | |
Melco Crown Entertainment Ltd. - ADR (a)(b) | | | 654,000 | | | | 15,264,360 | |
Wharf Holdings Ltd. | | | 2,179,400 | | | | 19,488,594 | |
| | | | | | | | |
| | |
| | | | | | | 93,084,829 | |
| |
India – 0.7% | | | | | | | | |
Jubilant Foodworks Ltd. (a) | | | 528,056 | | | | 12,155,612 | |
| |
Indonesia – 2.3% | | | | | | | | |
Global Mediacom Tbk PT | | | 31,933,500 | | | | 7,647,446 | |
Indofood Sukses Makmur Tbk PT | | | 12,961,200 | | | | 9,932,778 | |
Matahari Department Store Tbk PT (a) | | | 14,667,700 | | | | 16,573,672 | |
Tower Bersama Infrastructure Tbk PT (a) | | | 8,655,000 | | | | 5,385,519 | |
| | | | | | | | |
| | |
| | | | | | | 39,539,415 | |
| |
Ireland – 2.5% | | | | | | | | |
Accenture Plc, Class A | | | 156,900 | | | | 11,919,693 | |
DCC Plc | | | 777,053 | | | | 26,848,834 | |
Kingspan Group Plc | | | 469,179 | | | | 5,707,251 | |
| | | | | | | | |
| | |
| | | | | | | 44,475,778 | |
| |
Italy – 2.9% | | | | | | | | |
Banca Generali SpA | | | 454,900 | | | | 8,659,098 | |
| | | | | | | | |
| Common Stocks | | Shares | | | Value | |
| |
Italy (concluded) | | | | | | | | |
Eni SpA | | | 1,314,200 | | | $ | 29,421,674 | |
Saipem SpA | | | 439,900 | | | | 13,519,943 | |
| | | | | | | | |
| | |
| | | | | | | 51,600,715 | |
| |
Japan – 13.1% | | | | | | | | |
Honda Motor Co. Ltd. | | | 789,200 | | | | 29,789,828 | |
Hulic Co. Ltd | | | 1,667,500 | | | | 13,686,319 | |
ITOCHU Corp. | | | 1,008,700 | | | | 12,113,397 | |
JGC Corp. | | | 395,000 | | | | 9,977,755 | |
Kubota Corp. | | | 597,100 | | | | 8,482,903 | |
Nabtesco Corp. | | | 469,800 | | | | 9,652,400 | |
Nippon Paper Group, Inc. (b) | | | 539,800 | | | | 8,402,810 | |
ORIX Corp. | | | 2,811,000 | | | | 35,547,898 | |
Softbank Corp. | | | 569,500 | | | | 26,243,682 | |
Sumitomo Mitsui Financial Group, Inc. | | | 429,600 | | | | 17,219,580 | |
Tokio Marine Holdings, Inc. | | | 283,600 | | | | 7,979,826 | |
Toyota Motor Corp. | | | 484,900 | | | | 25,022,446 | |
Unipres Corp. | | | 393,400 | | | | 8,997,490 | |
Yahoo! Japan Corp. | | | 36,401 | | | | 16,735,648 | |
| | | | | | | | |
| | |
| | | | | | | 229,851,982 | |
| |
Malaysia – 0.4% | | | | | | | | |
Astro Malaysia Holdings Bhd | | | 6,906,600 | | | | 6,295,369 | |
| |
Mexico – 1.5% | | | | | | | | |
Fomento Economico Mexicano SAB de CV -
ADR | | | 149,600 | | | | 16,979,600 | |
Grupo Mexico SAB de CV, Series B | | | 2,397,500 | | | | 9,713,753 | |
| | | | | | | | |
| | |
| | | | | | | 26,693,353 | |
| |
Netherlands – 2.9% | | | | | | | | |
Aalberts Industries NV | | | 241,905 | | | | 5,416,463 | |
ASML Holding NV | | | 267,686 | | | | 18,029,523 | |
NXP Semiconductor NV (a) | | | 282,300 | | | | 8,542,398 | |
Ziggo NV | | | 535,700 | | | | 18,848,100 | |
| | | | | | | | |
| | |
| | | | | | | 50,836,484 | |
| |
Spain – 0.4% | | | | | | | | |
Duro Felguera SA | | | 1,101,600 | | | | 7,538,028 | |
| |
Sweden – 2.3% | | | | | | | | |
Electrolux AB, Series B | | | 386,463 | | | | 9,837,476 | |
Svenska Cellulosa AB, B Shares | | | 1,112,922 | | | | 28,693,497 | |
Volvo AB, B Shares | | | 108,865 | | | | 1,587,207 | |
| | | | | | | | |
| | |
| | | | | | | 40,118,180 | |
| |
Switzerland – 21.1% | | | | | | | | |
Cie Financiere Richemont SA, Class A | | | 205,100 | | | | 16,152,983 | |
GAM Holding AG | | | 1,381,600 | | | | 23,412,333 | |
Glencore International Plc (b) | | | 6,104,200 | | | | 33,128,889 | |
Holcim Ltd. | | | 226,792 | | | | 18,120,968 | |
Nestle SA | | | 555,000 | | | | 40,180,609 | |
Novartis AG, Registered Shares | | | 579,600 | | | | 41,322,288 | |
Partners Group Holding AG | | | 62,700 | | | | 15,489,206 | |
Roche Holding AG | | | 304,000 | | | | 70,891,842 | |
Swiss Re AG | | | 459,225 | | | | 37,412,051 | |
Syngenta AG, Registered Shares | | | 91,700 | | | | 38,384,748 | |
Transocean Ltd. (a) | | | 310,100 | | | | 16,112,796 | |
UBS AG, Registered Shares | | | 1,230,700 | | | | 18,930,723 | |
| | | | | | | | |
| | |
| | | | | | | 369,539,436 | |
| |
Taiwan – 0.7% | | | | | | | | |
MediaTek, Inc. | | | 1,073,400 | | | | 12,308,560 | |
| |
Thailand – 0.8% | | | | | | | | |
Bangkok Bank Pcl | | | 1,169,200 | | | | 9,070,690 | |
See Notes to Financial Statements.
| | | | |
| | | | | |
| 26 | | BLACKROCK FUNDS | | MARCH 31, 2013 |
| | |
| Schedule of Investments (continued) | | BlackRock International Opportunities Portfolio (Percentages shown are based on Net Assets) |
| | | | | | | | |
| Common Stocks | | Shares | | | Value | |
| |
Thailand (concluded) | | | | | | | | |
Charoen Pokphand Foods Pcl | | | 4,874,700 | | | $ | 5,497,782 | |
| | | | | | | | |
| | |
| | | | | | | 14,568,472 | |
| |
United Kingdom – 21.0% | | | | | | | | |
Aberdeen Asset Management Plc | | | 3,008,884 | | | | 19,667,635 | |
APR Energy Plc | | | 1,465,079 | | | | 18,785,645 | |
Aveva Group Plc | | | 238,652 | | | | 8,231,176 | |
Babcock International Group Plc | | | 1,107,700 | | | | 18,347,134 | |
Barclays Plc - ADR | | | 2,037,300 | | | | 36,182,448 | |
BG Group Plc | | | 983,400 | | | | 16,926,295 | |
British American Tobacco Plc | | | 462,100 | | | | 24,784,681 | |
Crest Nicholson Holdings Plc (a) | | | 5,436,200 | | | | 24,352,059 | |
Diageo Plc | | | 849,400 | | | | 26,771,229 | |
DS Smith Plc | | | 2,503,600 | | | | 8,350,310 | |
esure Group Plc (a) | | | 5,391,068 | | | | 24,580,035 | |
Hargreaves Lansdown Plc | | | 713,645 | | | | 9,438,040 | |
HSBC Holdings Plc | | | 1,112,499 | | | | 11,872,632 | |
Inchcape Plc | | | 915,220 | | | | 7,009,488 | |
Intertek Group Plc | | | 424,700 | | | | 21,950,339 | |
Jardine Lloyd Thompson Group Plc | | | 634,700 | | | | 8,218,942 | |
Rexam Plc | | | 3,036,260 | | | | 24,386,687 | |
Rotork Plc | | | 400,806 | | | | 17,717,180 | |
| | | | | | | | |
| Common Stocks | | Shares | | | Value | |
| |
United Kingdom (concluded) | | | | | | | | |
SABMiller Plc | | | 264,200 | | | $ | 13,938,645 | |
Tullow Oil Plc | | | 793,900 | | | | 14,865,040 | |
Unilever Plc | | | 261,800 | | | | 11,075,945 | |
| | | | | | | | |
| | |
| | | | | | | 367,451,585 | |
| |
United States – 0.8% | | | | | | | | |
Sirona Dental Systems, Inc. (a) | | | 186,600 | | | | 13,758,018 | |
| |
Total Long-Term Investments (Cost – $1,478,570,673) – 98.9% | | | | | | | 1,735,034,985 | |
| |
| | | | | | | | |
| | | | | | | | |
| | | Beneficial
Interest
(000) | | | | |
| |
BlackRock Liquidity Series, LLC Money Market Series, 0.23% (c)(d)(e) | | $ | 20,610 | | | | 20,609,972 | |
| |
Total Short-Term Securities (Cost – $20,609,972) – 1.2% | | | | 20,609,972 | |
| |
Total Investments (Cost – $1,499,180,645) – 100.1% | | | | 1,755,644,957 | |
Liabilities in Excess of Other Assets – (0.1)% | | | | (2,026,097 | ) |
| | | | | | | | |
Net Assets – 100.0% | | | | | | $ | 1,753,618,860 | |
| | | | | | | | |
|
|
Notes to Schedule of Investments |
|
| (a) | Non-income producing security. |
| (b) | Security, or a portion of security, is on loan. |
| (c) | Security was purchased with the cash collateral from loaned securities. The Fund may withdraw up to 25% of its investment daily, although the manager of the BlackRock Liquidity Series LLC, Money Market Series, in its sole discretion, may permit an investor to withdraw more than 25% on any one day. |
| (d) | Investments in issuers considered to be an affiliate of the Fund during the six months ended March 31, 2013, for purposes of Section 2(a)(3) of the Investment Company Act of 1940, as amended, were as follows: |
| | | | | | | | | | | | | | | | |
| |
| Affiliate | | Shares/
Beneficial
Interest Held at
September 30,
2012 | | | Net Activity | | | Shares/
Beneficial
Interest
Held at
March 31,
2013 | | | Income | |
| |
BlackRock Liquidity Funds, TempFund, Institutional Class | | | 5,622,104 | | | | (5,622,104 | ) | | | – | | | $ | 4,430 | |
BlackRock Liquidity Series LLC, Money Market Series | | | $4,115,755 | | | $ | 16,494,217 | | | $ | 20,609,972 | | | $ | 15,264 | |
| |
| (e) | Represents the current yield as of report date. |
| — | | Foreign currency exchange contracts as of March 31, 2013 were as follows: |
| | | | | | | | | | | | | | | | | | | | |
| |
Currency Purchased | | | | | Currency
Sold | | | | | Counterparty | | Settlement
Date | | | Unrealized
Appreciation
(Depreciation) | |
| |
| CHF | | | 20,741,817 | | | USD | | | 21,775,957 | | | UBS AG | | | 4/02/13 | | | | $ 80,541 | |
| EUR | | | 7,828,000 | | | USD | | | 10,025,264 | | | Bank of America Corp. | | | 4/02/13 | | | | 8,666 | |
| EUR | | | 1,948,264 | | | USD | | | 2,498,473 | | | Bank of New York Mellon Corp. | | | 4/02/13 | | | | (1,188 | ) |
| GBP | | | 23,000 | | | USD | | | 34,827 | | | Deutsche Bank AG | | | 4/02/13 | | | | 128 | |
| USD | | | 3,520,517 | | | JPY | | | 331,141,216 | | | Deutsche Bank AG | | | 4/02/13 | | | | 4,471 | |
| USD | | | 18,866,217 | | | SEK | | | 122,802,530 | | | Citigroup, Inc. | | | 4/02/13 | | | | 47,637 | |
| EUR | | | 12,032,711 | | | USD | | | 15,433,155 | | | Citigroup, Inc. | | | 4/03/13 | | | | (9,626 | ) |
| EUR | | | 12,032,711 | | | USD | | | 15,433,155 | | | Citigroup, Inc. | | | 4/03/13 | | | | (9,626 | ) |
| GBP | | | 445,893 | | | USD | | | 676,509 | | | Citigroup, Inc. | | | 4/03/13 | | | | 1,159 | |
| USD | | | 3,732,261 | | | CHF | | | 3,544,454 | | | Bank of America Corp. | | | 4/03/13 | | | | (2,674 | ) |
| USD | | | 1,406,907 | | | JPY | | | 132,370,000 | | | Morgan Stanley | | | 4/03/13 | | | | 1,407 | |
| USD | | | 8,640,653 | | | EUR | | | 6,743,356 | | | Deutsche Bank AG | | | 4/04/13 | | | | (2,980 | ) |
| AUD | | | 75,095,116 | | | USD | | | 78,277,196 | | | BNP Paribas SA | | | 4/17/13 | | | | (208,111 | ) |
| AUD | | | 997,043 | | | USD | | | 1,019,228 | | | Citigroup, Inc. | | | 4/17/13 | | | | 17,300 | |
See Notes to Financial Statements.
| | | | | | |
| | | | | MARCH 31, 2013 | | |
| | BLACKROCK FUNDS | | | 27 |
| | |
| Schedule of Investments (continued) | | BlackRock International Opportunities Portfolio |
| — | | Foreign currency exchange contracts as of March 31, 2013 were as follows: (continued) |
| | | | | | | | | | | | | | | | | | | | |
| |
Currency Purchased | | | | | Currency
Sold | | | | | Counterparty | | Settlement
Date | | | Unrealized
Appreciation
(Depreciation) | |
| |
| AUD | | | 19,567,000 | | | USD | | | 20,529,736 | | | Goldman Sachs Group, Inc. | | | 4/17/13 | | | | $ (187,830 | ) |
| AUD | | | 130,569 | | | USD | | | 136,952 | | | UBS AG | | | 4/17/13 | | | | (1,212 | ) |
| CAD | | | 93,000 | | | USD | | | 93,473 | | | BNP Paribas SA | | | 4/17/13 | | | | (1,963 | ) |
| CAD | | | 463,000 | | | USD | | | 448,991 | | | Citigroup, Inc. | | | 4/17/13 | | | | 6,589 | |
| CAD | | | 135,134,000 | | | USD | | | 136,645,435 | | | Royal Bank of Scotland Group Plc | | | 4/17/13 | | | | (3,676,960 | ) |
| CHF | | | 729,178 | | | USD | | | 775,912 | | | Bank of America Corp. | | | 4/17/13 | | | | (7,595 | ) |
| CHF | | | 3,544,454 | | | USD | | | 3,732,796 | | | Bank of America Corp. | | | 4/17/13 | | | | 1,904 | |
| CHF | | | 2,323,507 | | | USD | | | 2,439,170 | | | Bank of America Corp. | | | 4/17/13 | | | | 9,049 | |
| CHF | | | 5,002,414 | | | USD | | | 5,496,983 | | | BNP Paribas SA | | | 4/17/13 | | | | (226,069 | ) |
| CHF | | | 1,203,201 | | | USD | | | 1,304,212 | | | BNP Paribas SA | | | 4/17/13 | | | | (36,430 | ) |
| CHF | | | 6,729,000 | | | USD | | | 7,075,390 | | | BNP Paribas SA | | | 4/17/13 | | | | 14,784 | |
| CHF | | | 3,513,830 | | | USD | | | 3,871,738 | | | Citigroup, Inc. | | | 4/17/13 | | | | (169,305 | ) |
| CHF | | | 1,293,860 | | | USD | | | 1,379,532 | | | Citigroup, Inc. | | | 4/17/13 | | | | (16,225 | ) |
| CHF | | | 931,264 | | | USD | | | 991,328 | | | Citigroup, Inc. | | | 4/17/13 | | | | (10,079 | ) |
| CHF | | | 740,537 | | | USD | | | 787,631 | | | Citigroup, Inc. | | | 4/17/13 | | | | (7,346 | ) |
| CHF | | | 501,573 | | | USD | | | 533,597 | | | Citigroup, Inc. | | | 4/17/13 | | | | (5,103 | ) |
| CHF | | | 707,478 | | | USD | | | 749,605 | | | Citigroup, Inc. | | | 4/17/13 | | | | (4,154 | ) |
| CHF | | | 3,340,835 | | | USD | | | 3,623,076 | | | Deutsche Bank AG | | | 4/17/13 | | | | (102,925 | ) |
| CHF | | | 8,331,000 | | | USD | | | 9,182,563 | | | Royal Bank of Scotland Group Plc | | | 4/17/13 | | | | (404,404 | ) |
| CHF | | | 988,464 | | | USD | | | 1,037,887 | | | Royal Bank of Scotland Group Plc | | | 4/17/13 | | | | 3,632 | |
| CHF | | | 5,887,572 | | | USD | | | 6,377,566 | | | UBS AG | | | 4/17/13 | | | | (173,984 | ) |
| CHF | | | 576,000 | | | USD | | | 607,460 | | | Westpac Banking Corp. | | | 4/17/13 | | | | (544 | ) |
| DKK | | | 50,994,542 | | | USD | | | 8,955,899 | | | Deutsche Bank AG | | | 4/17/13 | | | | (186,061 | ) |
| EUR | | | 11,742,318 | | | USD | | | 15,246,590 | | | Bank of America Corp. | | | 4/17/13 | | | | (192,722 | ) |
| EUR | | | 5,275,000 | | | USD | | | 7,152,067 | | | Barclays Bank Plc | | | 4/17/13 | | | | (389,419 | ) |
| EUR | | | 6,796,000 | | | USD | | | 9,235,988 | | | BNP Paribas SA | | | 4/17/13 | | | | (523,391 | ) |
| EUR | | | 13,711,000 | | | USD | | | 18,342,713 | | | Citigroup, Inc. | | | 4/17/13 | | | | (764,959 | ) |
| EUR | | | 15,282,000 | | | USD | | | 20,033,938 | | | Citigroup, Inc. | | | 4/17/13 | | | | (442,133 | ) |
| EUR | | | 6,063,012 | | | USD | | | 8,135,265 | | | Citigroup, Inc. | | | 4/17/13 | | | | (362,372 | ) |
| EUR | | | 6,725,000 | | | USD | | | 8,957,801 | | | Citigroup, Inc. | | | 4/17/13 | | | | (336,227 | ) |
| EUR | | | 2,313,582 | | | USD | | | 3,087,306 | | | Citigroup, Inc. | | | 4/17/13 | | | | (121,252 | ) |
| EUR | | | 1,201,672 | | | USD | | | 1,600,995 | | | Citigroup, Inc. | | | 4/17/13 | | | | (60,429 | ) |
| EUR | | | 1,143,000 | | | USD | | | 1,523,116 | | | Citigroup, Inc. | | | 4/17/13 | | | | (57,769 | ) |
| EUR | | | 4,460,000 | | | USD | | | 6,061,140 | | | Deutsche Bank AG | | | 4/17/13 | | | | (343,338 | ) |
| EUR | | | 6,743,356 | | | USD | | | 8,641,361 | | | Deutsche Bank AG | | | 4/17/13 | | | | 3,746 | |
| EUR | | | 3,329,656 | | | USD | | | 4,311,691 | | | Goldman Sachs Group, Inc. | | | 4/17/13 | | | | (43,011 | ) |
| EUR | | | 23,000,000 | | | USD | | | 29,852,850 | | | Morgan Stanley | | | 4/17/13 | | | | (366,427 | ) |
| EUR | | | 1,496,224 | | | USD | | | 1,994,119 | | | UBS AG | | | 4/17/13 | | | | (75,933 | ) |
| GBP | | | 3,100,000 | | | USD | | | 4,981,554 | | | BNP Paribas SA | | | 4/17/13 | | | | (271,764 | ) |
| GBP | | | 2,614,000 | | | USD | | | 4,044,376 | | | BNP Paribas SA | | | 4/17/13 | | | | (72,959 | ) |
| GBP | | | 5,201,189 | | | USD | | | 8,149,088 | | | Citigroup, Inc. | | | 4/17/13 | | | | (246,987 | ) |
| GBP | | | 383,000 | | | USD | | | 605,883 | | | Citigroup, Inc. | | | 4/17/13 | | | | (23,996 | ) |
| GBP | | | 184,399 | | | USD | | | 291,924 | | | Citigroup, Inc. | | | 4/17/13 | | | | (11,769 | ) |
| GBP | | | 1,043,203 | | | USD | | | 1,594,885 | | | Citigroup, Inc. | | | 4/17/13 | | | | (9,960 | ) |
| GBP | | | 150,000 | | | USD | | | 227,460 | | | Citigroup, Inc. | | | 4/17/13 | | | | 433 | |
| GBP | | | 5,704,000 | | | USD | | | 8,644,036 | | | Citigroup, Inc. | | | 4/17/13 | | | | 21,979 | |
| GBP | | | 7,782,000 | | | USD | | | 11,720,167 | | | Citigroup, Inc. | | | 4/17/13 | | | | 102,927 | |
| GBP | | | 3,924,000 | | | USD | | | 6,192,692 | | | Deutsche Bank AG | | | 4/17/13 | | | | (231,009 | ) |
| GBP | | | 11,799,233 | | | USD | | | 18,042,585 | | | Deutsche Bank AG | | | 4/17/13 | | | | (116,160 | ) |
See Notes to Financial Statements.
| | | | |
| | | | | |
| 28 | | BLACKROCK FUNDS | | MARCH 31, 2013 |
| | |
| Schedule of Investments (continued) | | BlackRock International Opportunities Portfolio |
| — | | Foreign currency exchange contracts as of March 31, 2013 were as follows: (continued) |
| | | | | | | | | | | | | | | | | | | | |
| |
Currency Purchased | | | | | Currency
Sold | | | | | Counterparty | | Settlement
Date | | | Unrealized
Appreciation
(Depreciation) | |
| |
| GBP | | | 5,664,000 | | | USD | | | 8,803,074 | | | Goldman Sachs Group, Inc. | | | 4/17/13 | | | | $ (197,831 | ) |
| GBP | | | 911,000 | | | USD | | | 1,379,886 | | | Goldman Sachs Group, Inc. | | | 4/17/13 | | | | 4,184 | |
| GBP | | | 1,721,305 | | | USD | | | 2,583,111 | | | Goldman Sachs Group, Inc. | | | 4/17/13 | | | | 32,046 | |
| GBP | | | 5,446,254 | | | USD | | | 8,099,642 | | | JPMorgan Chase & Co. | | | 4/17/13 | | | | 174,783 | |
| GBP | | | 5,346,699 | | | USD | | | 8,034,249 | | | Northern Trust Co. | | | 4/17/13 | | | | 88,923 | |
| GBP | | | 22,883,598 | | | USD | | | 36,291,212 | | | Royal Bank of Scotland Group Plc | | | 4/17/13 | | | | (1,524,453 | ) |
| GBP | | | 242,791 | | | USD | | | 384,969 | | | Royal Bank of Scotland Group Plc | | | 4/17/13 | | | | (16,099 | ) |
| HKD | | | 27,995,000 | | | USD | | | 3,610,993 | | | Citigroup, Inc. | | | 4/17/13 | | | | (4,187 | ) |
| HKD | | | 27,386,310 | | | USD | | | 3,531,094 | | | Citigroup, Inc. | | | 4/17/13 | | | | (2,711 | ) |
| HKD | | | 9,678,281 | | | USD | | | 1,248,980 | | | Citigroup, Inc. | | | 4/17/13 | | | | (2,055 | ) |
| HKD | | | 14,297,000 | | | USD | | | 1,843,642 | | | Citigroup, Inc. | | | 4/17/13 | | | | (1,652 | ) |
| HKD | | | 161,020,000 | | | USD | | | 20,746,645 | | | Citigroup, Inc. | | | 4/17/13 | | | | (1,234 | ) |
| HKD | | | 3,399,162 | | | USD | | | 438,427 | | | Citigroup, Inc. | | | 4/17/13 | | | | (488 | ) |
| HKD | | | 246,293,000 | | | USD | | | 31,781,821 | | | Royal Bank of Scotland Group Plc | | | 4/17/13 | | | | (50,052 | ) |
| HKD | | | 6,489,000 | | | USD | | | 836,586 | | | Royal Bank of Scotland Group Plc | | | 4/17/13 | | | | (559 | ) |
| JPY | | | 2,678,200,893 | | | USD | | | 28,480,440 | | | Bank of New York Mellon Corp. | | | 4/17/13 | | | | (26,103 | ) |
| JPY | | | 281,546,000 | | | USD | | | 3,184,560 | | | BNP Paribas SA | | | 4/17/13 | | | | (193,297 | ) |
| JPY | | | 414,147,793 | | | USD | | | 4,623,883 | | | Citigroup, Inc. | | | 4/17/13 | | | | (223,802 | ) |
| JPY | | | 235,603,000 | | | USD | | | 2,650,314 | | | Citigroup, Inc. | | | 4/17/13 | | | | (147,169 | ) |
| JPY | | | 172,889,000 | | | USD | | | 1,922,052 | | | Citigroup, Inc. | | | 4/17/13 | | | | (85,207 | ) |
| JPY | | | 1,696,230,880 | | | USD | | | 18,190,846 | | | Deutsche Bank AG | | | 4/17/13 | | | | (169,373 | ) |
| JPY | | | 241,656,829 | | | USD | | | 2,728,520 | | | Deutsche Bank AG | | | 4/17/13 | | | | (161,056 | ) |
| JPY | | | 331,141,216 | | | USD | | | 3,520,861 | | | Deutsche Bank AG | | | 4/17/13 | | | | (2,677 | ) |
| JPY | | | 257,593,000 | | | USD | | | 2,728,133 | | | Goldman Sachs Group, Inc. | | | 4/17/13 | | | | 8,644 | |
| JPY | | | 355,335,000 | | | USD | | | 3,745,897 | | | Goldman Sachs Group, Inc. | | | 4/17/13 | | | | 29,332 | |
| JPY | | | 132,370,000 | | | USD | | | 1,407,030 | | | Morgan Stanley | | | 4/17/13 | | | | (675 | ) |
| JPY | | | 1,746,051,000 | | | USD | | | 18,680,456 | | | Royal Bank of Scotland Group Plc | | | 4/17/13 | | | | (129,673 | ) |
| MXN | | | 3,016,898 | | | USD | | | 235,957 | | | Citigroup, Inc. | | | 4/17/13 | | | | 7,833 | |
| MXN | | | 15,037,000 | | | USD | | | 1,179,768 | | | Citigroup, Inc. | | | 4/17/13 | | | | 35,345 | |
| MXN | | | 32,280,607 | | | USD | | | 2,522,782 | | | Citigroup, Inc. | | | 4/17/13 | | | | 85,756 | |
| MXN | | | 159,609,000 | | | USD | | | 12,375,928 | | | Citigroup, Inc. | | | 4/17/13 | | | | 521,787 | |
| MXN | | | 3,924,000 | | | USD | | | 305,774 | | | Deutsche Bank AG | | | 4/17/13 | | | | 11,318 | |
| MXN | | | 2,678,000 | | | USD | | | 209,220 | | | Royal Bank of Scotland Group Plc | | | 4/17/13 | | | | 7,184 | |
| MXN | | | 7,333,000 | | | USD | | | 571,433 | | | Royal Bank of Scotland Group Plc | | | 4/17/13 | | | | 21,134 | |
| MXN | | | 2,219,490 | | | USD | | | 174,363 | | | UBS AG | | | 4/17/13 | | | | 4,989 | |
| NOK | | | 47,787,742 | | | USD | | | 8,566,104 | | | BNP Paribas SA | | | 4/17/13 | | | | (390,783 | ) |
| NOK | | | 5,505,000 | | | USD | | | 978,767 | | | BNP Paribas SA | | | 4/17/13 | | | | (36,995 | ) |
| NOK | | | 30,489,464 | | | USD | | | 5,435,908 | | | Citigroup, Inc. | | | 4/17/13 | | | | (219,902 | ) |
| NOK | | | 27,930,000 | | | USD | | | 5,005,223 | | | Goldman Sachs Group, Inc. | | | 4/17/13 | | | | (227,079 | ) |
| NOK | | | 4,703,000 | | | USD | | | 849,393 | | | Royal Bank of Scotland Group Plc | | | 4/17/13 | | | | (44,824 | ) |
| NOK | | | 3,178,000 | | | USD | | | 568,022 | | | Royal Bank of Scotland Group Plc | | | 4/17/13 | | | | (24,344 | ) |
| NOK | | | 1,523,395 | | | USD | | | 272,659 | | | UBS AG | | | 4/17/13 | | | | (12,043 | ) |
| SEK | | | 57,576,000 | | | USD | | | 9,094,319 | | | BNP Paribas SA | | | 4/17/13 | | | | (262,863 | ) |
| SEK | | | 14,481,000 | | | USD | | | 2,279,109 | | | BNP Paribas SA | | | 4/17/13 | | | | (57,900 | ) |
| SEK | | | 11,258,000 | | | USD | | | 1,764,294 | | | Citigroup, Inc. | | | 4/17/13 | | | | (37,454 | ) |
| SEK | | | 122,802,530 | | | USD | | | 18,860,489 | | | Citigroup, Inc. | | | 4/17/13 | | | | (24,079 | ) |
| SEK | | | 10,734,245 | | | USD | | | 1,684,836 | | | Goldman Sachs Group, Inc. | | | 4/17/13 | | | | (38,334 | ) |
| SEK | | | 99,027,000 | | | USD | | | 15,184,944 | | | Goldman Sachs Group, Inc. | | | 4/17/13 | | | | 4,590 | |
| SEK | | | 7,408,000 | | | USD | | | 1,145,910 | | | Royal Bank of Scotland Group Plc | | | 4/17/13 | | | | (10,689 | ) |
See Notes to Financial Statements.
| | | | | | |
| | | | | MARCH 31, 2013 | | |
| | BLACKROCK FUNDS | | | 29 |
| | |
| Schedule of Investments (continued) | | BlackRock International Opportunities Portfolio |
| — | | Foreign currency exchange contracts as of March 31, 2013 were as follows: (continued) |
| | | | | | | | | | | | | | | | | | | | |
| |
Currency Purchased | | | | | Currency
Sold | | | | | Counterparty | | Settlement
Date | | | Unrealized
Appreciation
(Depreciation) | |
| |
| SGD | | | 10,163,000 | | | USD | | | 8,262,830 | | | Citigroup, Inc. | | | 4/17/13 | | | | $ (68,805 | ) |
| SGD | | | 6,445,500 | | | USD | | | 5,244,717 | | | Citigroup, Inc. | | | 4/17/13 | | | | (47,965 | ) |
| SGD | | | 157,796 | | | USD | | | 128,735 | | | Citigroup, Inc. | | | 4/17/13 | | | | (1,511 | ) |
| SGD | | | 6,283,565 | | | USD | | | 5,111,482 | | | Credit Suisse Group AG | | | 4/17/13 | | | | (45,292 | ) |
| USD | | | 7,314,385 | | | CAD | | | 7,485,000 | | | Barclays Bank Plc | | | 4/17/13 | | | | (50,668 | ) |
| USD | | | 12,450,884 | | | CHF | | | 11,775,000 | | | Barclays Bank Plc | | | 4/17/13 | | | | 43,871 | |
| USD | | | 3,507,061 | | | CHF | | | 3,265,000 | | | BNP Paribas SA | | | 4/17/13 | | | | 66,815 | |
| USD | | | 5,330,356 | | | CHF | | | 5,060,000 | | | Citigroup, Inc. | | | 4/17/13 | | | | (1,236 | ) |
| USD | | | 15,527,262 | | | CHF | | | 14,674,070 | | | Citigroup, Inc. | | | 4/17/13 | | | | 65,574 | |
| USD | | | 7,499,305 | | | CHF | | | 6,948,226 | | | Citigroup, Inc. | | | 4/17/13 | | | | 178,139 | |
| USD | | | 162,184,384 | | | CHF | | | 149,694,727 | | | Goldman Sachs Group, Inc. | | | 4/17/13 | | | | 4,454,918 | |
| USD | | | 3,800,267 | | | CHF | | | 3,521,620 | | | Royal Bank of Scotland Group Plc | | | 4/17/13 | | | | 89,627 | |
| USD | | | 21,779,433 | | | CHF | | | 20,741,817 | | | UBS AG | | | 4/17/13 | | | | (75,684 | ) |
| USD | | | 4,088,241 | | | CHF | | | 3,810,196 | | | UBS AG | | | 4/17/13 | | | | 73,536 | |
| USD | | | 14,194,187 | | | CHF | | | 13,174,619 | | | UBS AG | | | 4/17/13 | | | | 312,432 | |
| USD | | | 18,239,199 | | | CHF | | | 16,760,000 | | | UBS AG | | | 4/17/13 | | | | 579,620 | |
| USD | | | 10,026,244 | | | EUR | | | 7,828,000 | | | Bank of America Corp. | | | 4/17/13 | | | | (9,396 | ) |
| USD | | | 2,137,875 | | | EUR | | | 1,651,000 | | | Bank of New York Mellon Corp. | | | 4/17/13 | | | | 21,263 | |
| USD | | | 638,734 | | | EUR | | | 479,458 | | | BNP Paribas SA | | | 4/17/13 | | | | 24,060 | |
| USD | | | 4,349,838 | | | EUR | | | 3,365,000 | | | BNP Paribas SA | | | 4/17/13 | | | | 35,846 | |
| USD | | | 918,722 | | | EUR | | | 687,000 | | | BNP Paribas SA | | | 4/17/13 | | | | 37,976 | |
| USD | | | 4,649,299 | | | EUR | | | 3,548,000 | | | BNP Paribas SA | | | 4/17/13 | | | | 100,698 | |
| USD | | | 4,328,666 | | | EUR | | | 3,242,434 | | | BNP Paribas SA | | | 4/17/13 | | | | 171,806 | |
| USD | | | 4,355,586 | | | EUR | | | 3,252,000 | | | BNP Paribas SA | | | 4/17/13 | | | | 186,462 | |
| USD | | | 40,462 | | | EUR | | | 31,258 | | | Citigroup, Inc. | | | 4/17/13 | | | | 389 | |
| USD | | | 381,469 | | | EUR | | | 296,019 | | | Citigroup, Inc. | | | 4/17/13 | | | | 1,967 | |
| USD | | | 15,434,335 | | | EUR | | | 12,032,711 | | | Citigroup, Inc. | | | 4/17/13 | | | | 8,178 | |
| USD | | | 15,433,155 | | | EUR | | | 12,032,711 | | | Citigroup, Inc. | | | 4/17/13 | | | | 9,626 | |
| USD | | | 204,991 | | | EUR | | | 152,000 | | | Citigroup, Inc. | | | 4/17/13 | | | | 10,124 | |
| USD | | | 1,396,357 | | | EUR | | | 1,078,000 | | | Citigroup, Inc. | | | 4/17/13 | | | | 14,341 | |
| USD | | | 395,433 | | | EUR | | | 297,071 | | | Citigroup, Inc. | | | 4/17/13 | | | | 14,583 | |
| USD | | | 643,699 | | | EUR | | | 483,430 | | | Citigroup, Inc. | | | 4/17/13 | | | | 23,933 | |
| USD | | | 665,937 | | | EUR | | | 495,000 | | | Citigroup, Inc. | | | 4/17/13 | | | | 31,338 | |
| USD | | | 1,389,012 | | | EUR | | | 1,041,000 | | | Citigroup, Inc. | | | 4/17/13 | | | | 54,430 | |
| USD | | | 6,087,582 | | | EUR | | | 4,701,398 | | | Citigroup, Inc. | | | 4/17/13 | | | | 60,303 | |
| USD | | | 3,077,903 | | | EUR | | | 2,351,000 | | | Citigroup, Inc. | | | 4/17/13 | | | | 63,878 | |
| USD | | | 1,765,212 | | | EUR | | | 1,326,260 | | | Citigroup, Inc. | | | 4/17/13 | | | | 64,923 | |
| USD | | | 2,160,025 | | | EUR | | | 1,615,000 | | | Citigroup, Inc. | | | 4/17/13 | | | | 89,566 | |
| USD | | | 7,309,206 | | | EUR | | | 5,619,000 | | | Citigroup, Inc. | | | 4/17/13 | | | | 105,545 | |
| USD | | | 2,902,443 | | | EUR | | | 2,172,331 | | | Citigroup, Inc. | | | 4/17/13 | | | | 117,474 | |
| USD | | | 3,058,777 | | | EUR | | | 2,292,271 | | | Citigroup, Inc. | | | 4/17/13 | | | | 120,043 | |
| USD | | | 2,904,954 | | | EUR | | | 2,140,000 | | | Citigroup, Inc. | | | 4/17/13 | | | | 161,434 | |
| USD | | | 4,433,983 | | | EUR | | | 3,319,108 | | | Citigroup, Inc. | | | 4/17/13 | | | | 178,826 | |
| USD | | | 4,398,622 | | | EUR | | | 3,250,000 | | | Citigroup, Inc. | | | 4/17/13 | | | | 232,062 | |
| USD | | | 72,351,153 | | | EUR | | | 55,271,236 | | | Deutsche Bank AG | | | 4/17/13 | | | | 1,492,411 | |
| USD | | | 902,908 | | | EUR | | | 678,000 | | | Royal Bank of Scotland Group Plc | | | 4/17/13 | | | | 33,699 | |
| USD | | | 9,644,677 | | | EUR | | | 7,262,000 | | | Royal Bank of Scotland Group Plc | | | 4/17/13 | | | | 334,659 | |
| USD | | | 13,845,649 | | | EUR | | | 10,505,826 | | | Royal Bank of Scotland Group Plc | | | 4/17/13 | | | | 376,987 | |
| USD | | | 10,532,610 | | | EUR | | | 7,792,000 | | | Royal Bank of Scotland Group Plc | | | 4/17/13 | | | | 543,123 | |
See Notes to Financial Statements.
| | | | |
| | | | | |
| 30 | | BLACKROCK FUNDS | | MARCH 31, 2013 |
| | |
| Schedule of Investments (continued) | | BlackRock International Opportunities Portfolio |
| — | | Foreign currency exchange contracts as of March 31, 2013 were as follows: (continued) |
| | | | | | | | | | | | | | | | | | | | |
| |
Currency Purchased | | | | | Currency
Sold | | | | | Counterparty | | Settlement
Date | | | Unrealized
Appreciation
(Depreciation) | |
| |
| USD | | | 26,960,763 | | | EUR | | | 20,185,802 | | | UBS AG | | | 4/17/13 | | | | $1,082,193 | |
| USD | | | 20,127,995 | | | GBP | | | 13,247,000 | | | Bank of America Corp. | | | 4/17/13 | | | | 1,996 | |
| USD | | | 1,193,842 | | | GBP | | | 761,000 | | | BNP Paribas SA | | | 4/17/13 | | | | 37,664 | |
| USD | | | 3,080,877 | | | GBP | | | 1,951,000 | | | BNP Paribas SA | | | 4/17/13 | | | | 116,747 | |
| USD | | | 3,791,158 | | | GBP | | | 2,405,000 | | | BNP Paribas SA | | | 4/17/13 | | | | 137,272 | |
| USD | | | 6,058,024 | | | GBP | | | 3,789,000 | | | BNP Paribas SA | | | 4/17/13 | | | | 301,444 | |
| USD | | | 15,061,458 | | | GBP | | | 9,697,000 | | | BNP Paribas SA | | | 4/17/13 | | | | 328,929 | |
| USD | | | 13,992,348 | | | GBP | | | 8,670,000 | | | BNP Paribas SA | | | 4/17/13 | | | | 820,127 | |
| USD | | | 16,035,388 | | | GBP | | | 10,011,349 | | | BNP Paribas SA | | | 4/17/13 | | | | 825,273 | |
| USD | | | 31,558,817 | | | GBP | | | 21,155,000 | | | Citigroup, Inc. | | | 4/17/13 | | | | (581,705 | ) |
| USD | | | 973,720 | | | GBP | | | 643,000 | | | Citigroup, Inc. | | | 4/17/13 | | | | (3,182 | ) |
| USD | | | 2,807,993 | | | GBP | | | 1,850,000 | | | Citigroup, Inc. | | | 4/17/13 | | | | (2,689 | ) |
| USD | | | 676,446 | | | GBP | | | 445,893 | | | Citigroup, Inc. | | | 4/17/13 | | | | (994 | ) |
| USD | | | 1,598,491 | | | GBP | | | 1,045,000 | | | Citigroup, Inc. | | | 4/17/13 | | | | 10,835 | |
| USD | | | 574,444 | | | GBP | | | 364,672 | | | Citigroup, Inc. | | | 4/17/13 | | | | 20,402 | |
| USD | | | 8,796,094 | | | GBP | | | 5,770,000 | | | Citigroup, Inc. | | | 4/17/13 | | | | 29,806 | |
| USD | | | 1,979,539 | | | GBP | | | 1,272,000 | | | Citigroup, Inc. | | | 4/17/13 | | | | 47,005 | |
| USD | | | 1,298,267 | | | GBP | | | 818,389 | | | Citigroup, Inc. | | | 4/17/13 | | | | 54,899 | |
| USD | | | 2,888,759 | | | GBP | | | 1,830,000 | | | Citigroup, Inc. | | | 4/17/13 | | | | 108,464 | |
| USD | | | 6,113,240 | | | GBP | | | 3,887,000 | | | Citigroup, Inc. | | | 4/17/13 | | | | 207,771 | |
| USD | | | 9,287,962 | | | GBP | | | 5,817,320 | | | Deutsche Bank AG | | | 4/17/13 | | | | 449,782 | |
| USD | | | 23,598,295 | | | GBP | | | 14,875,000 | | | Deutsche Bank AG | | | 4/17/13 | | | | 998,896 | |
| USD | | | 7,381,016 | | | GBP | | | 4,597,621 | | | Royal Bank of Scotland Group Plc | | | 4/17/13 | | | | 395,909 | |
| USD | | | 43,733,694 | | | GBP | | | 27,248,000 | | | Royal Bank of Scotland Group Plc | | | 4/17/13 | | | | 2,336,154 | |
| USD | | | 3,419,361 | | | GBP | | | 2,141,225 | | | UBS AG | | | 4/17/13 | | | | 166,225 | |
| USD | | | 32,774,925 | | | GBP | | | 20,920,000 | | | UBS AG | | | 4/17/13 | | | | 991,434 | |
| USD | | | 1,118,047 | | | HKD | | | 8,670,000 | | | BNP Paribas SA | | | 4/17/13 | | | | 1,026 | |
| USD | | | 14,199,072 | | | HKD | | | 110,035,000 | | | Deutsche Bank AG | | | 4/17/13 | | | | 22,440 | |
| USD | | | 7,008,743 | | | HKD | | | 54,361,000 | | | Royal Bank of Scotland Group Plc | | | 4/17/13 | | | | 5,009 | |
| USD | | | 4,148,662 | | | JPY | | | 385,000,000 | | | BNP Paribas SA | | | 4/17/13 | | | | 58,260 | |
| USD | | | 7,532,728 | | | JPY | | | 715,695,000 | | | Citigroup, Inc. | | | 4/17/13 | | | | (71,118 | ) |
| USD | | | 2,435,352 | | | JPY | | | 234,029,759 | | | Citigroup, Inc. | | | 4/17/13 | | | | (51,079 | ) |
| USD | | | 1,075,821 | | | JPY | | | 100,760,000 | | | Citigroup, Inc. | | | 4/17/13 | | | | 5,304 | |
| USD | | | 1,184,964 | | | JPY | | | 109,394,000 | | | Citigroup, Inc. | | | 4/17/13 | | | | 22,716 | |
| USD | | | 1,435,053 | | | JPY | | | 130,620,000 | | | Citigroup, Inc. | | | 4/17/13 | | | | 47,291 | |
| USD | | | 6,698,236 | | | JPY | | | 620,327,000 | | | Credit Suisse Group AG | | | 4/17/13 | | | | 107,620 | |
| USD | | | 34,227,729 | | | JPY | | | 3,124,313,905 | | | Credit Suisse Group AG | | | 4/17/13 | | | | 1,033,699 | |
| USD | | | 17,039,091 | | | JPY | | | 1,555,560,000 | | | Deutsche Bank AG | | | 4/17/13 | | | | 512,165 | |
| USD | | | 3,427,965 | | | JPY | | | 329,315,000 | | | Royal Bank of Scotland Group Plc | | | 4/17/13 | | | | (70,817 | ) |
| USD | | | 3,557,686 | | | JPY | | | 332,576,775 | | | Royal Bank of Scotland Group Plc | | | 4/17/13 | | | | 24,250 | |
| USD | | | 4,541,905 | | | JPY | | | 424,684,000 | | | Royal Bank of Scotland Group Plc | | | 4/17/13 | | | | 29,883 | |
| USD | | | 2,120,286 | | | JPY | | | 196,683,000 | | | Royal Bank of Scotland Group Plc | | | 4/17/13 | | | | 30,642 | |
| USD | | | 4,310,831 | | | JPY | | | 402,626,000 | | | Royal Bank of Scotland Group Plc | | | 4/17/13 | | | | 33,162 | |
| USD | | | 4,259,616 | | | JPY | | | 397,498,000 | | | Royal Bank of Scotland Group Plc | | | 4/17/13 | | | | 36,430 | |
| USD | | | 43,539,289 | | | JPY | | | 3,781,813,900 | | | Royal Bank of Scotland Group Plc | | | 4/17/13 | | | | 3,359,702 | |
| USD | | | 6,426,159 | | | JPY | | | 590,316,000 | | | UBS AG | | | 4/17/13 | | | | 154,393 | |
| USD | | | 575,330 | | | MXN | | | 7,333,000 | | | Citigroup, Inc. | | | 4/17/13 | | | | (17,236 | ) |
| USD | | | 6,395,778 | | | NOK | | | 35,995,000 | | | Citigroup, Inc. | | | 4/17/13 | | | | 237,909 | |
| USD | | | 48,880,531 | | | SEK | | | 322,472,000 | | | Royal Bank of Scotland Group Plc | | | 4/17/13 | | | | (582,740 | ) |
See Notes to Financial Statements.
| | | | | | |
| | | | | MARCH 31, 2013 | | |
| | BLACKROCK FUNDS | | | 31 |
| | |
| Schedule of Investments (continued) | | BlackRock International Opportunities Portfolio |
| — | | Foreign currency exchange contracts as of March 31, 2013 were as follows: (concluded) |
| | | | | | | | | | | | | | | | | | | | |
| |
Currency Purchased | | | | | Currency
Sold | | | | | Counterparty | | Settlement
Date | | | Unrealized
Appreciation
(Depreciation) | |
| |
| ZAR | | | 88,410,000 | | | USD | | | 10,173,942 | | | Citigroup, Inc. | | | 4/17/13 | | | | $ (585,213 | ) |
| ZAR | | | 187,285,000 | | | USD | | | 20,896,257 | | | UBS AG | | | 4/17/13 | | | | (583,791 | ) |
| |
| | | | | | |
| Total | | | | | | | | | | | | | | | | | | | $9,446,670 | |
| | | | | | | | | | | | | | | | | | | | |
| — | | Fair Value Measurements – Various inputs are used in determining the fair value of investments and derivative financial instruments. These inputs to valuation techniques are categorized into a disclosure hierarchy consisting of three broad levels for financial statement purposes as follows: |
| | — | | Level 1 - unadjusted price quotations in active markets/exchanges for identical assets and liabilities that the Fund has the ability to access |
| | — | | Level 2 - other observable inputs (including, but not limited to, quoted prices for similar assets or liabilities in markets that are active, quoted prices for identical or similar assets or liabilities in markets that are not active, inputs other than quoted prices that are observable for the assets or liabilities (such as interest rates, yield curves, volatilities, prepayment speeds, loss severities, credit risks and default rates) or other market-corroborated inputs) |
| | — | | Level 3 - unobservable inputs based on the best information available in the circumstances, to the extent observable inputs are not available (including the Fund’s own assumptions used in determining the fair value of investments and derivative financial instruments) |
The hierarchy gives the highest priority to unadjusted quoted prices in active markets for identical assets or liabilities (Level 1 measurements) and the lowest priority to unobservable inputs (Level 3 measurements). Accordingly, the degree of judgment exercised in determining fair value is greatest for instruments categorized in Level 3. The inputs used to measure fair value may fall into different levels of the fair value hierarchy. In such cases, for disclosure purposes, the level in the fair value hierarchy within which the fair value measurement falls in its entirety is determined based on the lowest level input that is significant to the fair value measurement in its entirety.
Changes in valuation techniques may result in transfers into or out of an assigned level within the disclosure hierarchy. In accordance with the Fund’s policy, transfers between different levels of the fair value disclosure hierarchy are deemed to have occurred as of the beginning of the reporting period. The categorization of a value determined for investments and derivative financial instruments is based on the pricing transparency of the investment and derivative financial instrument and is not necessarily an indication of the risks associated with investing in those securities. For information about the Fund’s policy regarding valuation of investments and derivative financial instruments and other significant accounting policies, please refer to Note 1 of the Notes to Financial Statements.
The following tables summarize the Fund’s investments and derivative financial instruments categorized in the disclosure hierarchy as of March 31, 2013:
| | | | | | | | | | | | | | | | |
| |
| | | Level 1 | | | Level 2 | | | Level 3 | | | Total | |
| |
Assets: | | | | | | | | | | | | | | | | |
Investments: | | | | | | | | | | | | | | | | |
Long-Term Investments: | | | | | | | | | | | | | | | | |
Common Stocks: | | | | | | | | | | | | | | | | |
Australia | | | – | | | | $ 11,148,071 | | | | – | | | | $ 11,148,071 | |
Belgium | | | – | | | | 48,911,167 | | | | – | | | | 48,911,167 | |
Canada | | | $ 7,163,368 | | | | – | | | | – | | | | 7,163,368 | |
China | | | – | | | | 14,855,226 | | | | – | | | | 14,855,226 | |
Cyprus | | | 15,804,600 | | | | – | | | | – | | | | 15,804,600 | |
Finland | | | – | | | | 15,535,929 | | | | – | | | | 15,535,929 | |
France | | | – | | | | 100,881,205 | | | | – | | | | 100,881,205 | |
Germany | | | 26,316,899 | | | | 114,602,704 | | | | – | | | | 140,919,603 | |
Hong Kong | | | 28,422,760 | | | | 64,662,069 | | | | – | | | | 93,084,829 | |
India | | | – | | | | 12,155,612 | | | | – | | | | 12,155,612 | |
Indonesia | | | 16,573,672 | | | | 22,965,743 | | | | – | | | | 39,539,415 | |
Ireland | | | 11,919,693 | | | | 32,556,085 | | | | – | | | | 44,475,778 | |
Italy | | | – | | | | 51,600,715 | | | | – | | | | 51,600,715 | |
Japan | | | 221,449,172 | | | | 8,402,810 | | | | – | | | | 229,851,982 | |
Malaysia | | | 6,295,369 | | | | – | | | | – | | | | 6,295,369 | |
Mexico | | | 26,693,353 | | | | – | | | | – | | | | 26,693,353 | |
Netherlands | | | 8,542,398 | | | | 42,294,086 | | | | – | | | | 50,836,484 | |
Spain | | | – | | | | 7,538,028 | | | | – | | | | 7,538,028 | |
Sweden | | | – | | | | 40,118,180 | | | | – | | | | 40,118,180 | |
Switzerland | | | 16,112,796 | | | | 353,426,640 | | | | – | | | | 369,539,436 | |
Taiwan | | | 12,308,560 | | | | – | | | | – | | | | 12,308,560 | |
Thailand | | | 14,568,472 | | | | – | | | | – | | | | 14,568,472 | |
United Kingdom | | | 85,114,542 | | | | 282,337,043 | | | | – | | | | 367,451,585 | |
United States | | | 13,758,018 | | | | – | | | | – | | | | 13,758,018 | |
Short-Term Securities | | | – | | | | 20,609,972 | | | | – | | | | 20,609,972 | |
| |
| | | | |
Total | | | $511,043,672 | | | | $1,244,601,285 | | | | – | | | | $1,755,644,957 | |
| | | | |
See Notes to Financial Statements.
| | | | |
| | | | | |
| 32 | | BLACKROCK FUNDS | | MARCH 31, 2013 |
| | |
| Schedule of Investments (concluded) | | BlackRock International Opportunities Portfolio |
| | | | | | | | | | | | | | | | |
| |
| | | Level 1 | | | Level 2 | | | Level 3 | | | Total | |
| |
Derivative Financial Instruments1 | | | | | | | | | | | | | | | | |
Assets: | | | | | | | | | | | | | | | | |
Foreign currency exchange contracts | | | $ 144,009 | | | | $ 26,997,804 | | | | – | | | | $ 27,141,813 | |
Liabilities: | | | | | | | | | | | | | | | | |
Foreign currency exchange contracts | | | (26,094) | | | | (17,669,049) | | | | – | | | | (17,695,143) | |
| |
Total | | | $ 117,915 | | | | $ 9,328,755 | | | | – | | | | $ 9,446,670 | |
| | | | |
1 Derivative financial instruments are foreign currency exchange contracts which are valued at the unrealized appreciation/depreciation on the instrument. | |
|
Certain of the Fund’s assets and liabilities are held at carrying amount, which approximates fair value for financial statement purposes. As of March 31, 2013, such assets and liabilities are categorized within the disclosure hierarchy as follows: | |
| |
| | | Level 1 | | | Level 2 | | | Level 3 | | | Total | |
| |
Assets: | | | | | | | | | | | | | | | | |
Cash | | | $ 18,204,499 | | | | – | | | | – | | | | $ 18,204,499 | |
Foreign currency at value | | | 23,981,543 | | | | – | | | | – | | | | 23,981,543 | |
Liabilities: | | | | | | | | | | | | | | | | |
Collateral on securities loaned at value | | | – | | | | $ (20,609,972) | | | | – | | | | (20,609,972) | |
| |
Total | | | $ 42,186,042 | | | | $ (20,609,972) | | | | – | | | | $ 21,576,070 | |
| | | | |
As of September 30, 2012, the Fund did not utilize the external pricing service model adjustments as significant market movements did not occur on other certain securities. As of March 31, 2013, there were securities with a value of $18,785,645 that were systematically fair valued due to significant market movements. Therefore, these securities were transferred from Level 1 to Level 2 during the period September 30, 2012 to March 31, 2013.
In addition, certain foreign securities are fair valued utilizing an external pricing service to reflect any significant market movements between the time the Fund values such foreign securities and the earlier closing of foreign markets. Such fair valuations are categorized as Level 2 in the disclosure hierarchy. On March 29, 2013, US and certain other financial markets were closed, while some foreign markets were open. The Fund was re-priced for financial reporting purposes to reflect, in the valuation, the transactions related to open foreign market activities and were valued at the official closing price on the primary market or exchange on which the securities trade. The re-pricing resulted in the investments being categorized as Level 1. Therefore, these securities, with a value of $18,785,645, were transferred from Level 2 to Level 1 during the period September 30, 2012 to March 31, 2013.
See Notes to Financial Statements.
| | | | | | |
| | | | | MARCH 31, 2013 | | |
| | BLACKROCK FUNDS | | | 33 |
| | |
| Schedule of Investments March 31, 2013 (Unaudited) | | BlackRock Science & Technology Opportunities Portfolio (Percentages shown are based on Net Assets) |
| | | | | | | | |
| Common Stocks | | Shares | | | Value | |
| |
Biotechnology – 2.3% | | | | | | | | |
Celgene Corp. (a) | | | 14,200 | | | $ | 1,645,922 | |
Gilead Sciences, Inc. (a)(b) | | | 37,500 | | | | 1,834,875 | |
| | | | | | | | |
| | |
| | | | | | | 3,480,797 | |
| |
Communications Equipment – 11.9% | |
Cisco Systems, Inc. | | | 406,503 | | | | 8,499,978 | |
Ixia (a) | | | 49,800 | | | | 1,077,672 | |
Palo Alto Networks, Inc. (a) | | | 16,500 | | | | 933,900 | |
QUALCOMM, Inc. | | | 108,995 | | | | 7,297,215 | |
| | | | | | | | |
| | |
| | | | | | | 17,808,765 | |
| |
Computers & Peripherals – 8.3% | |
Apple, Inc. | | | 20,247 | | | | 8,961,930 | |
EMC Corp. (a) | | | 63,299 | | | | 1,512,213 | |
SanDisk Corp. (a) | | | 36,330 | | | | 1,998,150 | |
| | | | | | | | |
| | |
| | | | | | | 12,472,293 | |
| |
Electronic Equipment, Instruments & Components – 2.5% | |
Amphenol Corp., Class A | | | 13,600 | | | | 1,015,240 | |
Avnet, Inc. (a) | | | 26,300 | | | | 952,060 | |
Fabrinet (a) | | | 71,000 | | | | 1,037,310 | |
Molex, Inc. | | | 27,500 | | | | 805,200 | |
| | | | | | | | |
| | |
| | | | | | | 3,809,810 | |
| |
Internet & Catalog Retail – 5.4% | |
Amazon.com, Inc. (a) | | | 12,400 | | | | 3,304,476 | |
Expedia, Inc. | | | 22,400 | | | | 1,344,224 | |
priceline.com, Inc. (a) | | | 4,990 | | | | 3,432,771 | |
| | | | | | | | |
| | |
| | | | | | | 8,081,471 | |
| |
Internet Software & Services – 12.7% | |
Akamai Technologies, Inc. (a)(b) | | | 27,100 | | | | 956,359 | |
Dena Co. Ltd. | | | 25,800 | | | | 699,926 | |
E2open, Inc. (a) | | | 27,568 | | | | 549,706 | |
eBay, Inc. (a) | | | 92,000 | | | | 4,988,240 | |
Facebook, Inc., Class A (a) | | | 91,100 | | | | 2,330,338 | |
Google, Inc., Class A (a) | | | 9,025 | | | | 7,166,121 | |
Marin Software, Inc. (a) | | | 11,230 | | | | 184,509 | |
Rackspace Hosting, Inc. (a)(b) | | | 3,600 | | | | 181,728 | |
Tencent Holdings Ltd. | | | 38,000 | | | | 1,215,282 | |
Xoom Corp. (a) | | | 32,400 | | | | 740,016 | |
| | | | | | | | |
| | |
| | | | | | | 19,012,225 | |
| |
IT Services – 16.5% | |
Accenture Plc, Class A | | | 39,400 | | | | 2,993,218 | |
Alliance Data Systems Corp. (a) | | | 20,300 | | | | 3,286,367 | |
Cognizant Technology Solutions Corp., | | | | | | | | |
Class A (a) | | | 38,050 | | | | 2,915,011 | |
EPAM Systems, Inc. (a) | | | 19,700 | | | | 457,631 | |
Fidelity National Information Services, Inc. | | | 36,738 | | | | 1,455,559 | |
International Business Machines Corp. | | | 24,800 | | | | 5,289,840 | |
Jack Henry & Associates, Inc. | | | 19,831 | | | | 916,390 | |
Mastercard, Inc., Class A | | | 4,600 | | | | 2,489,198 | |
Visa, Inc., Class A | | | 24,100 | | | | 4,093,144 | |
WNS Holdings Ltd. - ADR (a) | | | 54,600 | | | | 804,804 | |
| | | | | | | | |
| | |
| | | | | | | 24,701,162 | |
| |
Semiconductors & Semiconductor Equipment – 20.2% | |
Analog Devices, Inc. | | | 33,400 | | | | 1,552,766 | |
ASML Holding NV | | | 25,601 | | | | 1,724,310 | |
Avago Technologies Ltd. | | | 68,699 | | | | 2,467,668 | |
Broadcom Corp., Class A | | | 113,400 | | | | 3,931,578 | |
Fairchild Semiconductor International, Inc. (a) | | | 183,642 | | | | 2,596,698 | |
Intel Corp. | | | 37,200 | | | | 812,820 | |
KLA-Tencor Corp. | | | 16,585 | | | | 874,693 | |
Lam Research Corp. (a) | | | 17,747 | | | | 735,791 | |
Linear Technology Corp. | | | 86,741 | | | | 3,328,252 | |
| | | | | | | | |
| Common Stocks | | Shares | | | Value | |
| |
Semiconductors & Semiconductor Equipment (concluded) | |
Maxim Integrated Products, Inc. | | | 91,500 | | | $ | 2,987,475 | |
MediaTek, Inc. | | | 102,000 | | | | 1,169,623 | |
NXP Semiconductor NV (a) | | | 77,365 | | | | 2,341,065 | |
Samsung Electronics Co. Ltd. | | | 575 | | | | 790,053 | |
Teradyne, Inc. (a)(b) | | | 69,900 | | | | 1,133,778 | |
Xilinx, Inc. | | | 103,400 | | | | 3,946,778 | |
| | | | | | | | |
| | |
| | | | | | | 30,393,348 | |
| |
Software – 19.7% | | | | | | | | |
ACI Worldwide, Inc. (a)(b) | | | 16,900 | | | | 825,734 | |
Adobe Systems, Inc. (a) | | | 42,700 | | | | 1,857,877 | |
Autodesk, Inc. (a) | | | 44,135 | | | | 1,820,127 | |
BMC Software, Inc. (a) | | | 27,345 | | | | 1,266,894 | |
Citrix Systems, Inc. (a) | | | 21,991 | | | | 1,586,870 | |
CommVault Systems, Inc. (a)(b) | | | 17,918 | | | | 1,468,918 | |
Concur Technologies, Inc. (a) | | | 25,790 | | | | 1,770,741 | |
Intuit, Inc. | | | 45,000 | | | | 2,954,250 | |
Microsoft Corp. | | | 123,717 | | | | 3,539,543 | |
Oracle Corp. | | | 124,100 | | | | 4,013,394 | |
Salesforce.com, Inc. (a) | | | 31,900 | | | | 5,704,677 | |
SAP AG - ADR | | | 18,500 | | | | 1,489,990 | |
ServiceNow, Inc. (a) | | | 3,500 | | | | 126,700 | |
Silver Spring Networks, Inc. (a) | | | 25,000 | | | | 433,250 | |
TIBCO Software, Inc. (a) | | | 37,167 | | | | 751,517 | |
| | | | | | | | |
| | |
| | | | | | | 29,610,482 | |
| |
Total Long-Term Investments (Cost – $124,700,114) – 99.5% | | | | | | | 149,370,353 | |
| |
| | | | | | | | |
| | | | | | | | |
| | |
| Short-Term Securities | | | | | | |
| |
BlackRock Liquidity Funds, TempFund,
Institutional Class, 0.09% (c)(d) | | | 1,801,418 | | | | 1,801,418 | |
| |
| | | Beneficial
Interest (000) | | | | |
| |
BlackRock Liquidity Series, LLC Money Market Series, 0.23% (c)(d)(e) | | $ | 6,186 | | | | 6,185,873 | |
| |
Total Short-Term Securities (Cost – $7,987,291) – 5.3% | | | | 7,987,291 | |
| |
Total Investments (Cost – $132,687,405) – 104.8% | | | | 157,357,644 | |
Liabilities in Excess of Other Assets – (4.8)% | | | | (7,275,746 | ) |
| | | | | | | | |
Net Assets – 100.0% | | | | | | $ | 150,081,898 | |
| | | | | | | | |
See Notes to Financial Statements.
| | | | |
| | | | | |
| 34 | | BLACKROCK FUNDS | | MARCH 31, 2013 |
| | |
| Schedule of Investments (continued) | | BlackRock Science & Technology Opportunities Portfolio |
|
|
Notes to Schedule of Investments |
|
| (a) | Non-income producing security. |
| (b) | Security, or a portion of security, is on loan. |
| (c) | Investments in issuers considered to be an affiliate of the Fund during the six months ended March 31, 2013, for purposes of Section 2(a)(3) of the Investment Company Act of 1940, as amended, were as follows: |
| | | | | | | | | | | | | | | | |
| |
| Affiliate | | Shares/
Beneficial
Interest Held at
September 30,
2012 | | | Net Activity | | | Shares/
Beneficial
Interest Held at
March 31,
2013 | | | Income | |
| |
BlackRock Liquidity Funds, TempFund, Institutional Class | | | 5,845,906 | | | | (4,044,488 | ) | | | 1,801,418 | | | | $1,738 | |
BlackRock Liquidity Series LLC, Money Market Series | | | $17,744,216 | | | $ | (11,558,343 | ) | | $ | 6,185,873 | | | | $7,463 | |
| |
| (d) | Represents the current yield as of report date. |
| (e) | Security was purchased with the cash collateral from loaned securities. The Fund may withdraw up to 25% of its investment daily, although the manager of the BlackRock Liquidity Series LLC, Money Market Series, in its sole discretion, may permit an investor to withdraw more than 25% on any one day. |
| — | | For Fund compliance purposes, the Fund’s industry classifications refer to any one or more of the industry sub-classifications used by one or more widely recognized market indexes or ratings group indexes and/or as defined by Fund management. These definitions may not apply for purposes of this report, which may combine such industry sub-classifications for reporting ease. |
| — | | Foreign currency exchange contracts as of March 31, 2013 were as follows: |
| | | | | | | | | | | | | | | | | | | | |
| |
Currency Purchased | | | | | Currency
Sold | | | | | Counterparty | | Settlement
Date | | | Unrealized
Appreciation
(Depreciation) | |
| |
| EUR | | | 695,170 | | | USD | | | 932,769 | | | Citigroup, Inc. | | | 4/17/13 | | | | $(41,549 | ) |
| USD | | | 2,446,645 | | | EUR | | | 1,869,066 | | | Deutsche Bank AG | | | 4/17/13 | | | | 50,468 | |
| USD | | | 1,069,133 | | | HKD | | | 8,284,000 | | | UBS AG | | | 4/17/13 | | | | 1,844 | |
| USD | | | 749,651 | | | JPY | | | 68,937,000 | | | Royal Bank of Scotland Group Plc | | | 4/17/13 | | | | 17,235 | |
| |
| | | | | | |
| Total | | | | | | | | | | | | | | | | | | | $ 27,998 | |
| | | | | | | | | | | | | | | | | | | | |
| — | | Fair Value Measurements – Various inputs are used in determining the fair value of investments and derivative financial instruments. These inputs to valuation techniques are categorized into a disclosure hierarchy consisting of three broad levels for financial statement purposes as follows: |
| | — | | Level 1 - unadjusted price quotations in active markets/exchanges for identical assets and liabilities that the Fund has the ability to access |
| | — | | Level 2 - other observable inputs (including, but not limited to, quoted prices for similar assets or liabilities in markets that are active, quoted prices for identical or similar assets or liabilities in markets that are not active, inputs other than quoted prices that are observable for the assets or liabilities (such as interest rates, yield curves, volatilities, prepayment speeds, loss severities, credit risks and default rates) or other market-corroborated inputs) |
| | — | | Level 3 - unobservable inputs based on the best information available in the circumstances, to the extent observable inputs are not available (including the Fund’s own assumptions used in determining the fair value of investments and derivative financial instruments) |
The hierarchy gives the highest priority to unadjusted quoted prices in active markets for identical assets or liabilities (Level 1 measurements) and the lowest priority to unobservable inputs (Level 3 measurements). Accordingly, the degree of judgment exercised in determining fair value is greatest for instruments categorized in Level 3. The inputs used to measure fair value may fall into different levels of the fair value hierarchy. In such cases, for disclosure purposes, the level in the fair value hierarchy within which the fair value measurement falls in its entirety is determined based on the lowest level input that is significant to the fair value measurement in its entirety.
Changes in valuation techniques may result in transfers into or out of an assigned level within the disclosure hierarchy. In accordance with the Fund’s policy, transfers between different levels of the fair value disclosure hierarchy are deemed to have occurred as of the beginning of the reporting period. The categorization of a value determined for investments and derivative financial instruments is based on the pricing transparency of the investment and derivative financial instrument and is not necessarily an indication of the risks associated with investing in those securities. For information about the Fund’s policy regarding valuation of investments and derivative financial instruments and other significant accounting policies, please refer to Note 1 of the Notes to Financial Statements.
See Notes to Financial Statements.
| | | | | | |
| | | | | MARCH 31, 2013 | | |
| | BLACKROCK FUNDS | | | 35 |
| | |
| Schedule of Investments (concluded) | | BlackRock Science & Technology Opportunities Portfolio |
The following tables summarize the Fund’s investments and derivative financial instruments categorized in the disclosure hierarchy as of March 31, 2013:
| | | | | | | | | | | | | | |
| |
| | | Level 1 | | | Level 2 | | | Level 3 | | Total | |
| |
Assets: | | | | | | | | | | | | | | |
Investments: | | | | | | | | | | | | | | |
Long-Term Investments: | | | | | | | | | | | | | | |
Common Stocks: | | | | | | | | | | | | | | |
Biotechnology | | | $ 3,480,797 | | | | – | | | – | | | $ 3,480,797 | |
Communications Equipment | | | 17,808,765 | | | | – | | | – | | | 17,808,765 | |
Computers & Peripherals | | | 12,472,293 | | | | – | | | – | | | 12,472,293 | |
Electronic Equipment, Instruments & Components | | | 3,809,810 | | | | – | | | – | | | 3,809,810 | |
Internet & Catalog Retail | | | 8,081,471 | | | | – | | | – | | | 8,081,471 | |
Internet Software & Services | | | 17,796,943 | | | | $ 1,215,282 | | | – | | | 19,012,225 | |
IT Services | | | 24,701,162 | | | | – | | | – | | | 24,701,162 | |
Semiconductors & Semiconductor Equipment | | | 28,669,038 | | | | 1,724,310 | | | – | | | 30,393,348 | |
Software | | | 29,610,482 | | | | – | | | – | | | 29,610,482 | |
Short-Term Securities | | | 1,801,418 | | | | 6,185,873 | | | – | | | 7,987,291 | |
| |
| | | | |
Total | | | $148,232,179 | | | | $ 9,125,465 | | | – | | | $157,357,644 | |
| | | | |
| | | | | | | | | | | | | | |
| |
| | | Level 1 | | | Level 2 | | | Level 3 | | Total | |
| |
Derivative Financial Instruments1 | | | | | | | | | | | | | | |
Assets: | | | | | | | | | | | | | | |
Foreign currency exchange contracts | | | – | | | | $ 69,547 | | | – | | | $ 69,547 | |
Liabilities: | | | | | | | | | | | | | | |
Foreign currency exchange contracts | | | – | | | | (41,549) | | | – | | | (41,549) | |
| |
Total | | | – | | | | $ 27,998 | | | – | | | $ 27,998 | |
| | | | |
|
1 Derivative financial instruments are foreign currency exchange contracts which are valued at the unrealized appreciation/depreciation on the instrument. | |
|
Certain of the Fund’s assets and liabilities are held at carrying amount, which approximates fair value for financial statement purposes. As of March 31, 2013, such assets and liabilities are categorized within the disclosure hierarchy as follows: | |
| |
| | | Level 1 | | | Level 2 | | | Level 3 | | Total | |
| |
Assets: | | | | | | | | | | | | | | |
Foreign currency at value | | | $ 198 | | | | – | | | – | | | $ 198 | |
Liabilities: | | | | | | | | | | | | | | |
Bank overdraft | | | – | | | | $ (35,143) | | | – | | | (35,143) | |
Collateral on securities loaned at value | | | – | | | | (6,185,873) | | | – | | | (6,185,873) | |
| |
Total | | | $ 198 | | | | $ (6,221,016) | | | – | | | $ (6,220,818) | |
| | | | |
There were no transfers between levels during the six months ended March 31, 2013.
See Notes to Financial Statements.
| | | | |
| | | | | |
| 36 | | BLACKROCK FUNDS | | MARCH 31, 2013 |
| | |
| Schedule of Investments March 31, 2013 (Unaudited) | | BlackRock U.S. Opportunities Portfolio |
| | | (Percentages shown are based on Net Assets) |
| | | | | | | | |
| Common Stocks | | Shares | | | Value | |
| |
Aerospace & Defense – 1.8% | | | | | | | | |
Triumph Group, Inc. | | | 468,600 | | | $ | 36,785,100 | |
| |
Auto Components – 1.2% | | | | | | | | |
The Goodyear Tire & Rubber Co. (a) | | | 1,074,800 | | | | 13,553,228 | |
Lear Corp. | | | 199,400 | | | | 10,941,078 | |
| | | | | | | | |
| | |
| | | | | | | 24,494,306 | |
| |
Automobiles – 0.4% | | | | | | | | |
Tesla Motors, Inc. (a)(b) | | | 208,800 | | | | 7,911,432 | |
| |
Beverages – 0.8% | | | | | | | | |
Brown-Forman Corp., Class B | | | 215,400 | | | | 15,379,560 | |
| |
Biotechnology – 1.3% | | | | | | | | |
Onyx Pharmaceuticals, Inc. (a) | | | 89,800 | | | | 7,979,628 | |
Seattle Genetics, Inc. (a)(b) | | | 520,900 | | | | 18,497,159 | |
| | | | | | | | |
| | |
| | | | | | | 26,476,787 | |
| |
Building Products – 1.3% | | | | | | | | |
Owens Corning (a) | | | 406,119 | | | | 16,013,272 | |
USG Corp. (a)(b) | | | 371,650 | | | | 9,826,426 | |
| | | | | | | | |
| | |
| | | | | | | 25,839,698 | |
| |
Capital Markets – 2.2% | | | | | | | | |
Invesco Ltd. | | | 986,400 | | | | 28,566,144 | |
WisdomTree Investments, Inc. (a) | | | 1,482,600 | | | | 15,419,040 | |
| | | | | | | | |
| | |
| | | | | | | 43,985,184 | |
| |
Chemicals – 4.2% | | | | | | | | |
Axiall Corp. | | | 456,500 | | | | 28,376,040 | |
Cytec Industries, Inc. | | | 253,744 | | | | 18,797,356 | |
Eastman Chemical Co. | | | 376,700 | | | | 26,320,029 | |
The Valspar Corp. | | | 192,400 | | | | 11,976,900 | |
| | | | | | | | |
| | |
| | | | | | | 85,470,325 | |
| |
Commercial Banks – 2.8% | | | | | | | | |
BankUnited, Inc. | | | 941,300 | | | | 24,116,106 | |
Capital Bank Financial Corp., Class A (a)(b) | | | 178,300 | | | | 3,059,628 | |
Regions Financial Corp. | | | 1,962,700 | | | | 16,074,513 | |
SunTrust Banks, Inc. | | | 486,600 | | | | 14,018,946 | |
| | | | | | | | |
| | |
| | | | | | | 57,269,193 | |
| |
Computers & Peripherals – 0.7% | | | | | | | | |
Seagate Technology Plc | | | 359,700 | | | | 13,150,632 | |
| |
Containers & Packaging – 2.4% | | | | | | | | |
Crown Holdings, Inc. (a) | | | 619,500 | | | | 25,777,395 | |
Owens-Illinois, Inc. (a) | | | 868,400 | | | | 23,142,860 | |
| | | | | | | | |
| | |
| | | | | | | 48,920,255 | |
| |
Diversified Financial Services – 0.8% | | | | | | | | |
Artisan Partners Asset Management, Inc. (a) | | | 94,000 | | | | 3,708,300 | |
CBOE Holdings, Inc. | | | 331,000 | | | | 12,227,140 | |
| | | | | | | | |
| | |
| | | | | | | 15,935,440 | |
| |
Electric Utilities – 0.7% | | | | | | | | |
Xcel Energy, Inc. | | | 447,500 | | | | 13,290,750 | |
| |
Electrical Equipment – 2.8% | | | | | | | | |
Acuity Brands, Inc. | | | 339,700 | | | | 23,558,195 | |
Eaton Corp. Plc | | | 213,200 | | | | 13,058,500 | |
Roper Industries, Inc. | | | 158,800 | | | | 20,216,828 | |
| | | | | | | | |
| | |
| | | | | | | 56,833,523 | |
| |
Electronic Equipment, Instruments & Components – 1.6% | |
Amphenol Corp., Class A | | | 234,500 | | | | 17,505,425 | |
Avnet, Inc. (a) | | | 386,000 | | | | 13,973,200 | |
| | | | | | | | |
| | |
| | | | | | | 31,478,625 | |
| |
Energy Equipment & Services – 3.0% | | | | | |
Cameron International Corp. (a) | | | 334,300 | | | | 21,796,360 | |
| | | | | | | | |
| Common Stocks | | Shares | | | Value | |
| |
Energy Equipment & Services (concluded) | | | | | |
Geospace Technologies Corp. (a) | | | 144,900 | | | $ | 15,637,608 | |
Rowan Cos. Plc, Class A (a) | | | 638,200 | | | | 22,566,752 | |
| | | | | | | | |
| | |
| | | | | | | 60,000,720 | |
| |
Food Products – 3.9% | | | | | | | | |
Annie’s, Inc. (a)(b) | | | 261,200 | | | | 9,993,512 | |
The Hain Celestial Group, Inc. (a)(b) | | | 297,441 | | | | 18,167,696 | |
Post Holdings, Inc. (a) | | | 203,268 | | | | 8,726,295 | |
Snyders-Lance, Inc. | | | 286,600 | | | | 7,239,516 | |
TreeHouse Foods, Inc. (a) | | | 275,100 | | | | 17,922,765 | |
Tyson Foods, Inc., Class A | | | 652,800 | | | | 16,202,496 | �� |
| | | | | | | | |
| | |
| | | | | | | 78,252,280 | |
| |
Health Care Equipment & Supplies – 3.2% | | | | | |
Boston Scientific Corp. (a) | | | 1,038,800 | | | | 8,113,028 | |
CareFusion Corp. (a) | | | 434,600 | | | | 15,206,654 | |
The Cooper Cos., Inc. | | | 120,400 | | | | 12,988,752 | |
DENTSPLY International, Inc. | | | 139,000 | | | | 5,896,380 | |
Sirona Dental Systems, Inc. (a) | | | 153,500 | | | | 11,317,555 | |
Teleflex, Inc. | | | 124,400 | | | | 10,513,044 | |
| | | | | | | | |
| | |
| | | | | | | 64,035,413 | |
| |
Health Care Providers & Services – 3.2% | | | | | |
AmerisourceBergen Corp. | | | 288,800 | | | | 14,858,760 | |
Catamaran Corp. (a) | | | 266,700 | | | | 14,143,101 | |
HCA Holdings, Inc. | | | 430,000 | | | | 17,470,900 | |
Universal Health Services, Inc., Class B | | | 270,100 | | | | 17,251,287 | |
| | | | | | | | |
| | |
| | | | | | | 63,724,048 | |
| |
Household Durables – 3.9% | | | | | | | | |
Jarden Corp. (a) | | | 523,200 | | | | 22,419,120 | |
PulteGroup, Inc. (a)(b) | | | 754,868 | | | | 15,278,528 | |
Toll Brothers, Inc. (a) | | | 511,170 | | | | 17,502,461 | |
Tupperware Brands Corp. | | | 152,100 | | | | 12,432,654 | |
Whirlpool Corp. | | | 90,600 | | | | 10,732,476 | |
| | | | | | | | |
| | |
| | | | | | | 78,365,239 | |
| |
Household Products – 0.5% | | | | | | | | |
Spectrum Brands Holdings, Inc. | | | 181,900 | | | | 10,293,721 | |
| |
Insurance – 4.9% | | | | | | | | |
AON Plc | | | 458,400 | | | | 28,191,600 | |
Brown & Brown, Inc. | | | 896,300 | | | | 28,717,452 | |
Fidelity National Financial, Inc., Class A | | | 730,100 | | | | 18,420,423 | |
Reinsurance Group of America, Inc. | | | 224,500 | | | | 13,395,915 | |
Validus Holdings Ltd. | | | 288,800 | | | | 10,792,456 | |
| | | | | | | | |
| | |
| | | | | | | 99,517,846 | |
| |
Internet & Catalog Retail – 0.7% | | | | | | | | |
Expedia, Inc. | | | 247,000 | | | | 14,822,470 | |
| |
Internet Software & Services – 1.1% | | | | | |
Akamai Technologies, Inc. (a)(b) | | | 357,700 | | | | 12,623,233 | |
Marin Software, Inc. (a) | | | 119,900 | | | | 1,969,957 | |
OpenTable, Inc. (a) | | | 107,560 | | | | 6,774,129 | |
| | | | | | | | |
| | |
| | | | | | | 21,367,319 | |
| |
IT Services – 2.7% | | | | | | | | |
Alliance Data Systems Corp. (a) | | | 150,600 | | | | 24,380,634 | |
Fidelity National Information Services, Inc. | | | 417,700 | | | | 16,549,274 | |
Fiserv, Inc. (a)(b) | | | 163,205 | | | | 14,334,295 | |
| | | | | | | | |
| | |
| | | | | | | 55,264,203 | |
| |
Life Sciences Tools & Services – 1.8% | | | | | |
Mettler-Toledo International, Inc. (a) | | | 18,700 | | | | 3,987,214 | |
Thermo Fisher Scientific, Inc. | | | 241,100 | | | | 18,441,739 | |
Waters Corp. (a)(b) | | | 142,800 | | | | 13,410,348 | |
| | | | | | | | |
| | |
| | | | | | | 35,839,301 | |
| |
See Notes to Financial Statements.
| | | | | | |
| | | | | MARCH 31, 2013 | | |
| | BLACKROCK FUNDS | | | 37 |
| | |
| Schedule of Investments (continued) | | BlackRock U.S. Opportunities Portfolio (Percentages shown are based on Net Assets) |
| | | | | | | | |
| Common Stocks | | Shares | | | Value | |
| |
Machinery – 3.5% | | | | | | | | |
Actuant Corp., Class A | | | 540,900 | | | $ | 16,562,358 | |
Ingersoll-Rand Plc | | | 615,800 | | | | 33,875,158 | |
Snap-On, Inc. | | | 253,700 | | | | 20,980,990 | |
| | | | | | | | |
| | |
| | | | | | | 71,418,506 | |
| |
Marine – 0.3% | | | | | | | | |
Diana Shipping, Inc. (a) | | | 492,700 | | | | 5,252,182 | |
| |
Media – 1.5% | | | | | | | | |
The Interpublic Group of Cos., Inc. | | | 954,100 | | | | 12,431,923 | |
Liberty Global, Inc., Class A (a) | | | 238,500 | | | | 17,505,900 | |
| | | | | | | | |
| | |
| | | | | | | 29,937,823 | |
| |
Multiline Retail – 1.5% | | | | | | | | |
Dollar Tree, Inc. (a) | | | 301,746 | | | | 14,613,559 | |
Nordstrom, Inc. | | | 290,600 | | | | 16,049,838 | |
| | | | | | | | |
| | |
| | | | | | | 30,663,397 | |
| |
Multi-Utilities – 1.4% | | | | | | | | |
Alliant Energy Corp. | | | 290,100 | | | | 14,557,218 | |
Sempra Energy | | | 159,800 | | | | 12,774,412 | |
| | | | | | | | |
| | |
| | | | | | | 27,331,630 | |
| |
Oil, Gas & Consumable Fuels – 5.0% | | | | | | | | |
Cabot Oil & Gas Corp. | | | 392,700 | | | | 26,550,447 | |
Concho Resources, Inc. (a)(b) | | | 294,700 | | | | 28,712,621 | |
Kosmos Energy Ltd. (a) | | | 785,100 | | | | 8,871,630 | |
Oasis Petroleum, Inc. (a)(b) | | | 521,800 | | | | 19,864,926 | |
Pioneer Natural Resources Co. | | | 142,260 | | | | 17,675,805 | |
| | | | | | | | |
| | |
| | | | | | | 101,675,429 | |
| |
Paper & Forest Products – 1.3% | | | | | | | | |
International Paper Co. | | | 560,900 | | | | 26,126,722 | |
| |
Professional Services – 1.3% | | | | | | | | |
Equifax, Inc. | | | 450,700 | | | | 25,955,813 | |
| |
Real Estate Investment Trusts (REITs) – 3.8% | | | | | |
Health Care REIT, Inc. (b) | | | 211,900 | | | | 14,390,129 | |
Hospitality Properties Trust (b) | | | 812,800 | | | | 22,303,232 | |
RLJ Lodging Trust | | | 992,400 | | | | 22,587,024 | |
Weyerhaeuser Co. | | | 563,793 | | | | 17,691,824 | |
| | | | | | | | |
| | |
| | | | | | | 76,972,209 | |
| |
Real Estate Management & Development – 1.1% | |
CBRE Group, Inc., Class A (a) | | | 861,943 | | | | 21,764,061 | |
| |
Road & Rail – 1.7% | | | | | | | | |
Hertz Global Holdings, Inc. (a)(b) | | | 790,946 | | | | 17,606,458 | |
Kansas City Southern | | | 155,700 | | | | 17,267,130 | |
| | | | | | | | |
| | |
| | | | | | | 34,873,588 | |
| |
Semiconductors & Semiconductor Equipment – 6.7% | |
Analog Devices, Inc. | | | 308,300 | | | | 14,332,867 | |
Avago Technologies Ltd. | | | 421,508 | | | | 15,140,568 | |
Cavium, Inc. (a)(b) | | | 350,469 | | | | 13,601,702 | |
Fairchild Semiconductor International, Inc. (a) | | | 549,752 | | | | 7,773,493 | |
| | | | | | | | |
| Common Stocks | | Shares | | | Value | |
| |
Semiconductors & Semiconductor Equipment (concluded) | |
|
Linear Technology Corp. | | | 462,200 | | | $ | 17,734,614 | |
Maxim Integrated Products, Inc. | | | 669,500 | | | | 21,859,175 | |
NXP Semiconductor NV (a) | | | 329,900 | | | | 9,982,774 | |
Teradyne, Inc. (a)(b) | | | 898,700 | | | | 14,576,914 | |
Xilinx, Inc. | | | 510,100 | | | | 19,470,517 | |
| | | | | | | | |
| | |
| | | | | | | 134,472,624 | |
| |
Software – 3.0% | | | | | | | | |
ANSYS, Inc. (a) | | | 36,079 | | | | 2,937,552 | |
Autodesk, Inc. (a) | | | 493,500 | | | | 20,351,940 | |
Citrix Systems, Inc. (a) | | | 227,700 | | | | 16,430,832 | |
Splunk, Inc. (a) | | | 528,800 | | | | 21,167,864 | |
| | | | | | | | |
| | |
| | | | | | | 60,888,188 | |
| |
Specialty Retail – 3.1% | | | | | | | | |
American Eagle Outfitters, Inc. | | | 626,700 | | | | 11,719,290 | |
Genesco, Inc. (a)(b) | | | 217,500 | | | | 13,069,575 | |
L Brands, Inc. | | | 301,600 | | | | 13,469,456 | |
O’Reilly Automotive, Inc. (a) | | | 186,100 | | | | 19,084,555 | |
Select Comfort Corp. (a)(b) | | | 309,700 | | | | 6,122,769 | |
| | | | | | | | |
| | |
| | | | | | | 63,465,645 | |
| |
Textiles, Apparel & Luxury Goods – 2.2% | |
PVH Corp. | | | 204,500 | | | | 21,842,645 | |
VF Corp. | | | 140,400 | | | | 23,552,100 | |
| | | | | | | | |
| | |
| | | | | | | 45,394,745 | |
| |
Trading Companies & Distributors – 1.0% | |
United Rentals, Inc. (a)(b) | | | 379,897 | | | | 20,882,938 | |
| |
Wireless Telecommunication Services – 2.2% | |
SBA Communications Corp., Class A (a)(b) | | | 488,700 | | | | 35,196,174 | |
Sprint Nextel Corp. (a) | | | 1,457,300 | | | | 9,049,833 | |
| | | | | | | | |
| | |
| | | | | | | 44,246,007 | |
| |
Total Long-Term Investments | | | | | |
(Cost – $1,482,711,831) – 94.5% | | | | 1,906,024,877 | |
| |
| | | | | |
| | | | | | | | |
| | |
| Short-Term Securities | | | | | | |
| |
BlackRock Liquidity Funds, TempFund, | | | | | |
Institutional Class, 0.09% (c)(d) | | | 64,712,604 | | | | 64,712,604 | |
| |
| | | Beneficial
Interest
(000) | | | | |
| |
BlackRock Liquidity Series, LLC Money Market Series, 0.23% (c)(d)(e) | | | $ 183,428 | | | | 183,427,829 | |
| |
Total Short-Term Securities (Cost – $248,140,433) – 12.3% | | | | 248,140,433 | |
| |
Total Investments (Cost – $1,730,852,264) – 106.8% | | | | 2,154,165,310 | |
Liabilities in Excess of Other Assets – (6.8)% | | | | (137,693,716 | ) |
| | | | | | | | |
Net Assets – 100.0% | | | $ | 2,016,471,594 | |
| | | | | | | | |
|
|
Notes to Schedule of Investments |
|
| (a) | Non-income producing security. |
| (b) | Security, or a portion of security, is on loan. |
See Notes to Financial Statements.
| | | | |
| | | | | |
| 38 | | BLACKROCK FUNDS | | MARCH 31, 2013 |
| | |
| Schedule of Investments (continued) | | BlackRock U.S. Opportunities Portfolio |
| (c) | Investments in issuers considered to be an affiliate of the Fund during the six months ended March 31, 2013, for purposes of Section 2(a)(3) of the Investment Company Act of 1940, as amended, were as follows: |
| | | | | | | | | | | | | | |
|
| Affiliate | | Shares/
Beneficial
Interest
Held at
September 30,
2012 | | | Net
Activity | | | Shares/
Beneficial
Interest
Held at
March 31,
2013 | | | Income |
|
| | | | |
BlackRock Liquidity Funds, TempFund, Institutional Class | | | – | | | | 64,712,604 | | | | 64,712,604 | | | $14,550 |
| | | | |
BlackRock Liquidity Series LLC, Money Market Series | | $ | 327,377,250 | | | $ | (143,949,421 | ) | | $ | 183,427,829 | | | $1,269,232 |
|
| (d) | Represents the current yield as of report date. |
| (e) | Security was purchased with the cash collateral from loaned securities. The Fund may withdraw up to 25% of its investment daily, although the manager of the BlackRock Liquidity Series LLC, Money Market Series, in its sole discretion, may permit an investor to withdraw more than 25% on any one day. |
| — | | Financial futures contracts as of March 31, 2013 were as follows: |
| | | | | | | | | | | | |
| |
Contracts
Purchased | | Issue | | Exchange | | Expiration | | Notional
Value | | Unrealized
Appreciation | |
| |
575 | | E-Mini S&P Mid Cap 400 Futures | | Chicago Mercantile | | June 2013 | | $66,182,500 | | | $430,528 | |
| |
| — | | For Fund compliance purposes, the Fund’s industry classifications refer to any one or more of the industry sub-classifications used by one or more widely recognized market indexes or ratings group indexes and/or as defined by Fund management. These definitions may not apply for purposes of this report, which may combine such industry sub-classifications for reporting ease. |
| — | | Fair Value Measurements – Various inputs are used in determining the fair value of investments and derivative financial instruments. These inputs to valuation techniques are categorized into a disclosure hierarchy consisting of three broad levels for financial statement purposes as follows: |
| | — | | Level 1 - unadjusted price quotations in active markets/exchanges for identical assets and liabilities that the Fund has the ability to access |
| | — | | Level 2 - other observable inputs (including, but not limited to, quoted prices for similar assets or liabilities in markets that are active, quoted prices for identical or similar assets or liabilities in markets that are not active, inputs other than quoted prices that are observable for the assets or liabilities (such as interest rates, yield curves, volatilities, prepayment speeds, loss severities, credit risks and default rates) or other market-corroborated inputs) |
| | — | | Level 3 - unobservable inputs based on the best information available in the circumstances, to the extent observable inputs are not available (including the Fund’s own assumptions used in determining the fair value of investments and derivative financial instruments) |
The hierarchy gives the highest priority to unadjusted quoted prices in active markets for identical assets or liabilities (Level 1 measurements) and the lowest priority to unobservable inputs (Level 3 measurements). Accordingly, the degree of judgment exercised in determining fair value is greatest for instruments categorized in Level 3. The inputs used to measure fair value may fall into different levels of the fair value hierarchy. In such cases, for disclosure purposes, the level in the fair value hierarchy within which the fair value measurement falls in its entirety is determined based on the lowest level input that is significant to the fair value measurement in its entirety.
Changes in valuation techniques may result in transfers into or out of an assigned level within the disclosure hierarchy. In accordance with the Fund’s policy, transfers between different levels of the fair value disclosure hierarchy are deemed to have occurred as of the beginning of the reporting period. The categorization of a value determined for investments and derivative financial instruments is based on the pricing transparency of the investment and derivative financial instruments and is not necessarily an indication of the risks associated with investing in those securities. For information about the Fund’s policy regarding valuation of investments and derivative financial instruments and other significant accounting policies, please refer to Note 1 of the Notes to Financial Statements.
The following table summarizes the Fund’s investments and derivative financial instruments categorized in the disclosure hierarchy as of March 31, 2013:
| | | | | | | | | | | | | | |
| |
| | | Level 1 | | | Level 2 | | | Level 3 | | Total | |
| |
Assets: | | | | | | | | | | | | | | |
Investments: | | | | | | | | | | | | | | |
Long-Term Investments1 | | | $1,906,024,877 | | | | – | | | – | | $ | 1,906,024,877 | |
Short-Term Securities | | | 64,712,604 | | | $ | 183,427,829 | | | – | | | 248,140,433 | |
| |
| | | | |
Total | | | $1,970,737,481 | | | $ | 183,427,829 | | | – | | $ | 2,154,165,310 | |
| | | | |
1 See above Schedule of Investments for values in each industry. | |
| |
| Valuation Inputs | | Level 1 | | | Level 2 | | | Level 3 | | Total | |
| |
Derivative Financial Instruments2 | | | | | | | | | | | | | | |
Assets: | | | | | | | | | | | | | | |
Equity contracts | | $ | 430,528 | | | | – | | | – | | $ | 430,528 | |
| |
2 Derivative financial instruments are financial futures contracts which are valued at the unrealized appreciation/depreciation on the instrument. | |
See Notes to Financial Statements.
| | | | | | |
| | | | | MARCH 31, 2013 | | |
| | BLACKROCK FUNDS | | | 39 |
| | |
| Schedule of Investments (concluded) | | BlackRock U.S. Opportunities Portfolio |
Certain of the Fund’s liabilities are held at carrying amount, which approximates fair value for financial statement purposes. As of March 31, 2013, such liabilities are categorized within the disclosure hierarchy as follows:
| | | | | | | | | | | | |
| |
| | | Level 1 | | Level 2 | | | Level 3 | | Total | |
| |
Liabilities: | | | | | | | | | | | | |
Bank overdraft | | – | | $ | (856,312 | ) | | – | | $ | (856,312) | |
Collateral on securities loaned at value | | – | | | (183,427,829 | ) | | – | | | (183,427,829) | |
| |
Total | | – | | $ | (184,284,141 | ) | | – | | $ | (184,284,141) | |
| | | |
There were no transfers between levels during the six months ended March 31, 2013.
See Notes to Financial Statements.
| | | | |
| | | | | |
| 40 | | BLACKROCK FUNDS | | MARCH 31, 2013 |
Statements of Assets and Liabilities
| | | | | | | | | | | | | | | | | | | | |
March 31, 2013 (Unaudited) | | BlackRock
Global
Opportunities
Portfolio | | | BlackRock
Health
Sciences
Opportunities
Portfolio | | | BlackRock
International
Opportunities
Portfolio | | | BlackRock
Science
& Technology
Opportunities
Portfolio | | | BlackRock
U.S.
Opportunities
Portfolio | |
| |
Assets | | | | | | | | | | | | | | | | | | | | |
| |
Investments at value – unaffiliated1,2 | | $ | 327,162,862 | | | $ | 2,363,750,838 | | | $ | 1,735,034,985 | | | $ | 149,370,353 | | | $ | 1,906,024,877 | |
Investments at value – affiliated3 | | | 3,338,253 | | | | 177,076,145 | | | | 20,609,972 | | | | 7,987,291 | | | | 248,140,433 | |
Cash | | | 74,911 | | | | 884,738 | | | | 18,204,499 | | | | – | | | | – | |
Foreign currency at value4 | | | 291,298 | | | | 4,209 | | | | 23,981,543 | | | | 198 | | | | – | |
Investments sold receivable | | | 7,972,049 | | | | 24,650,815 | | | | 54,694,399 | | | | – | | | | 101,437,670 | |
Unrealized appreciation on foreign currency exchange contracts | | | 1,969,756 | | | | 7,819,044 | | | | 27,141,813 | | | | 69,547 | | | | – | |
Variation margin receivable | | | – | | | | – | | | | – | | | | – | | | | 430,528 | |
Capital shares sold receivable | | | 162,416 | | | | 7,634,019 | | | | 1,904,865 | | | | 76,027 | | | | 5,299,390 | |
Dividends receivable – unaffiliated | | | 639,971 | | | | 3,509,868 | | | | 7,461,856 | | | | 56,114 | | | | 1,244,046 | |
Dividends receivable – affiliated | | | 357 | | | | 3,623 | | | | 327 | | | | 135 | | | | 2,054 | |
Receivable from Manager | | | 33,164 | | | | – | | | | – | | | | 889 | | | | 189,222 | |
Securities lending income receivable – affiliated | | | – | | | | 23,588 | | | | 8,465 | | | | 435 | | | | 99,173 | |
Prepaid expenses | | | 38,454 | | | | 100,712 | | | | 71,120 | | | | 51,657 | | | | 77,978 | |
| | | | |
Total assets | | | 341,683,491 | | | | 2,585,457,599 | | | | 1,889,113,844 | | | | 157,612,646 | | | | 2,262,945,371 | |
| | | | |
|
| |
Liabilities | | | | | | | | | | | | | | | | | | | | |
| |
Bank overdraft | | | – | | | | – | | | | – | | | | 35,143 | | | | 856,312 | |
Foreign bank overdraft5 | | | – | | | | 1,554,397 | | | | – | | | | – | | | | – | |
Options written at value6 | | | – | | | | 93,752 | | | | – | | | | – | | | | – | |
Collateral on securities loaned at value | | | – | | | | 148,972,154 | | | | 20,609,972 | | | | 6,185,873 | | | | 183,427,829 | |
Investments purchased payable | | | 5,257,791 | | | | 29,023,943 | | | | 90,041,686 | | | | – | | | | 52,822,831 | |
Unrealized depreciation on foreign currency exchange contracts | | | 1,540,439 | | | | 861,833 | | | | 17,695,143 | | | | 41,549 | | | | – | |
Capital shares redeemed payable | | | 445,120 | | | | 4,178,333 | | | | 3,834,421 | | | | 853,564 | | | | 5,155,571 | |
Investment advisory fees payable | | | 254,563 | | | | 1,404,382 | | | | 1,499,372 | | | | 119,909 | | | | 1,608,970 | |
Service and distribution fees payable | | | 105,624 | | | | 681,840 | | | | 294,634 | | | | 44,052 | | | | 335,182 | |
Other affiliates payable | | | 19,588 | | | | 194,551 | | | | 173,219 | | | | 18,399 | | | | 240,317 | |
Officer’s and Trustees’ fees payable | | | 3,015 | | | | 15,290 | | | | 11,849 | | | | 2,509 | | | | 26,203 | |
Other accrued expenses payable | | | 325,558 | | | | 1,060,306 | | | | 1,334,688 | | | | 229,750 | | | | 2,000,562 | |
| | | | |
Total liabilities | | | 7,951,698 | | | | 188,040,781 | | | | 135,494,984 | | | | 7,530,748 | | | | 246,473,777 | |
| | | | |
Net Assets | | $ | 333,731,793 | | | $ | 2,397,416,818 | | | $ | 1,753,618,860 | | | $ | 150,081,898 | | | $ | 2,016,471,594 | |
| | | | |
|
| |
Net Assets Consist of | | | | | | | | | | | | | | | | | | | | |
| |
Paid-in capital | | $ | 433,650,190 | | | $ | 1,721,514,719 | | | $ | 1,597,516,490 | | | $ | 179,512,970 | | | $ | 1,388,406,305 | |
Undistributed (distributions in excess of) net investment income (loss) | | | 627,778 | | | | 11,616,581 | | | | 3,404,344 | | | | (1,496,593 | ) | | | (3,700,839) | |
Accumulated net realized gain (loss) | | | (155,312,822 | ) | | | 85,278,112 | | | | (113,228,264 | ) | | | (52,632,252 | ) | | | 208,022,554 | |
Net unrealized appreciation/depreciation | | | 54,766,647 | | | | 579,007,406 | | | | 265,926,290 | | | | 24,697,773 | | | | 423,743,574 | |
| | | | |
Net Assets | | $ | 333,731,793 | | | $ | 2,397,416,818 | | | $ | 1,753,618,860 | | | $ | 150,081,898 | | | $ | 2,016,471,594 | |
| | | | |
| | | | | |
1 Investments at cost – unaffiliated | | $ | 272,834,891 | | | $ | 1,791,784,916 | | | $ | 1,478,570,673 | | | $ | 124,700,114 | | | $ | 1,482,711,831 | |
2 Securities loaned at value | | | – | | | $ | 147,798,736 | | | $ | 19,717,922 | | | $ | 6,041,399 | | | $ | 178,949,754 | |
3 Investments at cost – affiliated | | $ | 3,338,253 | | | $ | 177,076,145 | | | $ | 20,609,972 | | | $ | 7,987,291 | | | $ | 248,140,433 | |
4 Foreign currency at cost | | $ | 288,179 | | | $ | 4,489 | | | $ | 24,012,469 | | | $ | 177 | | | | – | |
5 Foreign bank overdraft at cost | | | – | | | $ | 1,544,722 | | | | – | | | | – | | | | – | |
6 Premiums received | | | – | | | $ | 170,116 | | | | – | | | | – | | | | – | |
See Notes to Financial Statements.
| | | | | | |
| | | | | MARCH 31, 2013 | | |
| | BLACKROCK FUNDS | | | 41 |
Statements of Assets and Liabilities (concluded)
| | | | | | | | | | | | | | | | | | | | |
March 31, 2013 (Unaudited) | | BlackRock
Global
Opportunities
Portfolio | | | BlackRock
Health Sciences
Opportunities
Portfolio | | | BlackRock
International
Opportunities
Portfolio | | | BlackRock
Science
& Technology
Opportunities
Portfolio | | | BlackRock U.S. Opportunities
Portfolio | |
| |
Net Asset Value | | | | | | | | | | | | | | | | | | | | |
| |
Institutional | | | | | | | | | | | | | | | | | | | | |
Net assets | | $ | 60,933,576 | | | $ | 586,461,528 | | | $ | 832,528,797 | | | $ | 30,030,221 | | | $ | 1,087,723,044 | |
| | | | |
| | | | | |
Shares outstanding1 | | | 4,943,628 | | | | 15,420,725 | | | | 23,107,131 | | | | 2,954,487 | | | | 26,833,937 | |
| | | | |
| | | | | |
Net asset value | | $ | 12.33 | | | $ | 38.03 | | | $ | 36.03 | | | $ | 10.16 | | | $ | 40.54 | |
| | | | |
| | | | | |
Service | | | | | | | | | | | | | | | | | | | | |
Net assets | | | – | | | $ | 18,312,957 | | | $ | 41,655,613 | | | $ | 842,402 | | | $ | 161,265,003 | |
| | | | |
| | | | | |
Shares outstanding1 | | | – | | | | 494,802 | | | | 1,197,963 | | | | 86,035 | | | | 4,161,872 | |
| | | | |
| | | | | |
Net asset value | | | – | | | $ | 37.01 | | | $ | 34.77 | | | $ | 9.79 | | | $ | 38.75 | |
| | | | |
| | | | | |
Investor A | | | | | | | | | | | | | | | | | | | | |
Net assets | | $ | 198,908,067 | | | $ | 1,270,444,957 | | | $ | 723,023,785 | | | $ | 87,361,419 | | | $ | 548,644,452 | |
| | | | |
| | | | | |
Shares outstanding1 | | | 16,247,262 | | | | 34,412,341 | | | | 21,008,091 | | | | 9,068,879 | | | | 14,314,660 | |
| | | | |
| | | | | |
Net asset value | | $ | 12.24 | | | $ | 36.92 | | | $ | 34.42 | | | $ | 9.63 | | | $ | 38.33 | |
| | | | |
| | | | | |
Investor B | | | | | | | | | | | | | | | | | | | | |
Net assets | | $ | 5,077,015 | | | $ | 41,259,053 | | | $ | 8,470,494 | | | $ | 2,217,582 | | | $ | 12,931,312 | |
| | | | |
| | | | | |
Shares outstanding1 | | | 423,107 | | | | 1,196,651 | | | | 263,204 | | | | 255,598 | | | | 378,449 | |
| | | | |
| | | | | |
Net asset value | | $ | 12.00 | | | $ | 34.48 | | | $ | 32.18 | | | $ | 8.68 | | | $ | 34.17 | |
| | | | |
| | | | | |
Investor C | | | | | | | | | | | | | | | | | | | | |
Net assets | | $ | 53,930,749 | | | $ | 461,727,948 | | | $ | 147,940,172 | | | $ | 25,474,723 | | | $ | 205,907,783 | |
| | | | |
| | | | | |
Shares outstanding1 | | | 4,514,285 | | | | 13,473,137 | | | | 4,644,818 | | | | 2,942,484 | | | | 6,018,566 | |
| | | | |
| | | | | |
Net asset value | | $ | 11.95 | | | $ | 34.27 | | | $ | 31.85 | | | $ | 8.66 | | | $ | 34.21 | |
| | | | |
| | | | | |
Class R | | | | | | | | | | | | | | | | | | | | |
Net assets | | $ | 14,882,386 | | | $ | 19,210,375 | | | | – | | | $ | 4,155,551 | | | | – | |
| | | | |
| | | | | |
Shares outstanding1 | | | 1,217,100 | | | | 523,210 | | | | – | | | | 421,693 | | | | – | |
| | | | |
| | | | | |
Net asset value | | $ | 12.23 | | | $ | 36.72 | | | | – | | | $ | 9.85 | | | | – | |
| | | | |
1 Unlimited number of shares authorized, $0.001 par value.
See Notes to Financial Statements.
| | | | |
| | | | | |
| 42 | | BLACKROCK FUNDS | | MARCH 31, 2013 |
Statements of Operations
| | | | | | | | | | | | | | | | | | | | |
Six Months Ended March 31, 2013 (Unaudited) | | BlackRock
Global
Opportunities
Portfolio | | | BlackRock
Health
Sciences
Opportunities
Portfolio | | | BlackRock
International
Opportunities
Portfolio | | | BlackRock
Science &
Technology
Opportunities
Portfolio | | | BlackRock
U.S.
Opportunities
Portfolio | |
| |
Investment Income | | | | | | | | | | | | | | | | | | | | |
| |
Dividends – unaffiliated | | $ | 2,886,347 | | | $ | 18,277,121 | | | $ | 16,313,394 | | | $ | 812,677 | | | $ | 14,103,394 | |
Foreign taxes withheld | | | (66,384 | ) | | | (893,578 | ) | | | (821,013 | ) | | | (2,102 | ) | | | – | |
Interest | | | 722 | | | | 789 | | | | 149 | | | | 28 | | | | 3,439 | |
Securities lending – affiliated | | | – | | | | 147,001 | | | | 15,264 | | | | 7,463 | | | | 1,269,232 | |
| | | | |
Total income | | | 2,820,685 | | | | 17,531,333 | | | | 15,507,794 | | | | 818,066 | | | | 15,376,065 | |
| | | | |
|
| |
Expenses | | | | | | | | | | | | | | | | | | | | |
| |
Investment advisory | | | 1,448,919 | | | | 7,405,809 | | | | 8,476,948 | | | | 702,884 | | | | 11,054,102 | |
Service and distribution – class specific | | | 569,683 | | | | 3,601,283 | | | | 1,729,281 | | | | 266,686 | | | | 1,999,435 | |
Transfer agent – class specific | | | 275,368 | | | | 1,509,273 | | | | 1,503,070 | | | | 304,077 | | | | 2,224,712 | |
Administration | | | 120,743 | | | | 637,919 | | | | 551,131 | | | | 58,574 | | | | 641,232 | |
Administration – class specific | | | 40,294 | | | | 221,984 | | | | 190,088 | | | | 19,550 | | | | 216,939 | |
Professional | | | 38,084 | | | | 31,701 | | | | 42,343 | | | | 27,166 | | | | 37,515 | |
Custodian | | | 34,955 | | | | 66,341 | | | | 111,663 | | | | 14,398 | | | | 51,440 | |
Registration | | | 33,104 | | | | 58,349 | | | | 46,427 | | | | 37,609 | | | | 62,918 | |
Printing | | | 13,733 | | | | 55,046 | | | | 48,064 | | | | 5,014 | | | | 52,314 | |
Officer and Trustees | | | 6,111 | | | | 30,081 | | | | 26,011 | | | | 3,975 | | | | 33,928 | |
Miscellaneous | | | 19,999 | | | | 33,307 | | | | 40,738 | | | | 11,606 | | | | 30,195 | |
Recoupment of past waived fees | | | – | | | | – | | | | – | | | | 150 | | | | – | |
Recoupment of past waived fees – class specific | | | 538 | | | | 1,274 | | | | 34,739 | | | | 2,896 | | | | 1,654 | |
| | | | |
Total expenses | | | 2,601,531 | | | | 13,652,367 | | | | 12,800,503 | | | | 1,454,585 | | | | 16,406,384 | |
Less fees waived by Manager | | | (15,131 | ) | | | (18,752 | ) | | | (3,029 | ) | | | (874 | ) | | | (1,355,740) | |
Less administration fees waived – class specific | | | (38,662 | ) | | | – | | | | (278 | ) | | | (3,612 | ) | | | (103,741) | |
Less transfer agent fees waived – class specific | | | (5,696 | ) | | | – | | | | (8 | ) | | | (2,296 | ) | | | (248) | |
Less transfer agent fees reimbursed – class specific | | | (211,402 | ) | | | – | | | | – | | | | (12,251 | ) | | | (1,125,287) | |
Less fees paid indirectly | | | (30 | ) | | | (164 | ) | | | (78 | ) | | | (42 | ) | | | (121) | |
| | | | |
Total expenses after fees waived, reimbursed and paid indirectly | | | 2,330,610 | | | | 13,633,451 | | | | 12,797,110 | | | | 1,435,510 | | | | 13,821,247 | |
| | | | |
Net investment income (loss) | | | 490,075 | | | | 3,897,882 | | | | 2,710,684 | | | | (617,444 | ) | | | 1,554,818 | |
| | | | |
|
| |
Realized and Unrealized Gain (Loss) | | | | | | | | | | | | | | | | | | | | |
| |
Net realized gain (loss) from: | | | | | | | | | | | | | | | | | | | | |
Investments | | | 16,669,179 | 1 | | | 154,049,934 | | | | 91,951,077 | | | | 882,980 | | | | 269,814,147 | |
Options written | | | – | | | | 475,505 | | | | – | | | | – | | | | – | |
Foreign currency transactions | | | (1,589,340 | ) | | | (11,412,072 | ) | | | (14,955,043 | ) | | | (283,443 | ) | | | (196,612) | |
| | | | |
| | | 15,079,839 | | | | 143,113,367 | | | | 76,996,034 | | | | 599,537 | | | | 269,617,535 | |
| | | | |
Net change in unrealized appreciation/depreciation | | | | | | | | | | | | | | | | | | | | |
on: | | | | | | | | | | | | | | | | | | | | |
Investments | | | 20,637,660 | | | | 186,365,719 | | | | 92,489,935 | | | | 869,992 | | | | 1,705,383 | |
Options written | | | – | | | | 76,364 | | | | – | | | | – | | | | – | |
Financial futures contracts | | | – | | | | – | | | | – | | | | – | | | | 430,528 | |
Foreign currency translations | | | 843,148 | | | | 14,997,258 | | | | 16,204,022 | | | | 242,188 | | | | 199,777 | |
| | | | |
| | | 21,480,808 | | | | 201,439,341 | | | | 108,693,957 | | | | 1,112,180 | | | | 2,335,688 | |
| | | | |
Total realized and unrealized gain | | | 36,560,647 | | | | 344,552,708 | | | | 185,689,991 | | | | 1,711,717 | | | | 271,953,223 | |
| | | | |
Net Increase in Net Assets Resulting from | | | | | | | | | | | | | | | | | | | | |
Operations | | $ | 37,050,722 | | | $ | 348,450,590 | | | $ | 188,400,675 | | | $ | 1,094,273 | | | $ | 273,508,041 | |
| | | | |
1 Net of $(3,344) foreign capital gain tax.
See Notes to Financial Statements.
| | | | | | |
| | | | | MARCH 31, 2013 | | |
| | BLACKROCK FUNDS | | | 43 |
Statements of Changes in Net Assets
| | | | | | | | | | | | | | | | | | |
| | | BlackRock
Global Opportunities
Portfolio | | | | | BlackRock
Health Sciences
Opportunities
Portfolio | |
Increase (Decrease) in Net Assets: | | Six Months
Ended
March 31,
2013
(Unaudited) | | | Year Ended
September 30,
2012 | | | | | Six Months
Ended
March 31,
2013
(Unaudited) | | | Year Ended
September 30,
2012 | |
| |
Operations | | | | | | | | | | | | | | | | | | |
| |
Net investment income | | $ | 490,075 | | | $ | 3,268,886 | | | | | $ | 3,897,882 | | | $ | 1,273,319 | |
Net realized gain (loss) | | | 15,079,839 | | | | (14,765,031 | ) | | | | | 143,113,367 | | | | 101,616,114 | |
Net change in unrealized appreciation/depreciation | | | 21,480,808 | | | | 73,417,514 | | | | | | 201,439,341 | | | | 306,983,456 | |
| | | | | | | | | | |
Net increase in net assets resulting from operations | | | 37,050,722 | | | | 61,921,369 | | | | | | 348,450,590 | | | | 409,872,889 | |
| | | | | | | | | | |
|
| |
Dividends and Distributions to Shareholders From | | | | | | | | | | | | | | | | | | |
| |
Net investment income: | | | | | | | | | | | | | | | | | | |
Institutional | | | (718,206 | ) | | | (118,127 | )1 | | | | | (2,499,090 | ) | | | – | |
Service | | | – | | | | – | | | | | | (44,478 | ) | | | – | |
Investor A | | | (1,967,914 | ) | | | (283,735 | )1 | | | | | (3,119,552 | ) | | | – | |
Investor B | | | (4,918 | ) | | | – | | | | | | – | | | | – | |
Investor C | | | (104,581 | ) | | | – | | | | | | – | | | | – | |
Class R | | | (104,371 | ) | | | (4,925 | )1 | | | | | (348,317 | ) | | | – | |
Net realized gain: | | | | | | | | | | | | | | | | | | |
Institutional | | | – | | | | – | | | | | | (30,594,431 | ) | | | (18,534,663) | 1 |
Service | | | – | | | | – | | | | | | (1,018,612 | ) | | | (758,372) | 1 |
Investor A | | | – | | | | – | | | | | | (67,678,578 | ) | | | (44,254,751) | 1 |
Investor B | | | – | | | | – | | | | | | (2,559,474 | ) | | | (2,120,280) | 1 |
Investor C | | | – | | | | – | | | | | | (26,230,695 | ) | | | (15,906,640) | 1 |
Class R | | | – | | | | – | | | | | | (669,065 | ) | | | (527,704) | 1 |
| | | | | | | | | | |
Decrease in net assets resulting from dividends and distributions to | | | | | | | | | | | | | | | | | | |
shareholders | | | (2,899,990 | ) | | | (406,787 | ) | | | | | (134,762,292 | ) | | | (82,102,410) | |
| | | | | | | | | | |
|
| |
Capital Share Transactions | | | | | | | | | | | | | | | | | | |
| |
Net increase (decrease) in net assets derived from capital share | | | | | | | | | | | | | | | | | | |
transactions | | | (25,276,027 | ) | | | (86,077,748 | ) | | | | | 237,210,032 | | | | 34,317,071 | |
| | | | | | | | | | |
|
| |
Net Assets | | | | | | | | | | | | | | | | | | |
| |
Total increase (decrease) in net assets | | | 8,874,705 | | | | (24,563,166 | ) | | | | | 450,898,330 | | | | 362,087,550 | |
Beginning of period | | | 324,857,088 | | | | 349,420,254 | | | | | | 1,946,518,488 | | | | 1,584,430,938 | |
| | | | | | | | | | |
End of period | | $ | 333,731,793 | | | $ | 324,857,088 | | | | | $ | 2,397,416,818 | | | $ | 1,946,518,488 | |
| | | | | | | | | | |
Undistributed net investment income | | $ | 627,778 | | | $ | 3,037,693 | | | | | $ | 11,616,581 | | | $ | 13,730,136 | |
| | | | | | | | | | |
| | 1 | Dividends and distributions are determined in accordance with federal income tax regulations. |
See Notes to Financial Statements.
| | | | |
| | | | | |
| 44 | | BLACKROCK FUNDS | | MARCH 31, 2013 |
Statements of Changes in Net Assets (concluded)
| | | | | | | | | | | | | | | | | | | | | | | | |
| | | BlackRock
International
Opportunities
Portfolio | | | BlackRock
Science &
Technology
Opportunities
Portfolio | | | BlackRock
U.S. Opportunities
Portfolio | |
Increase (Decrease) in Net Assets: | | Six Months
Ended
March 31,
2013
(Unaudited) | | | Year Ended
September 30,
2012 | | | Six Months
Ended
March 31,
2013
(Unaudited) | | | Year Ended
September 30,
2012 | | | Six Months
Ended March 31,
2013
(Unaudited) | | | Year Ended
September 30,
2012 | |
| |
Operations | | | | | | | | | | | | | | | | | | | | | | | | |
| |
Net investment income (loss) | | $ | 2,710,684 | | | $ | 28,229,234 | | | $ | (617,444 | ) $ | | | (1,925,328 | ) | | $ | 1,554,818 | | | $ | 7,510,396 | |
Net realized gain (loss) | | | 76,996,034 | | | | (103,786,228 | ) | | | 599,537 | | | | 11,547,274 | | | | 269,617,535 | | | | (5,377,254) | |
Net change in unrealized
appreciation/depreciation | | | 108,693,957 | | | | 354,862,697 | | | | 1,112,180 | | | | 17,016,090 | | | | 2,335,688 | | | | 600,566,926 | |
| | | | | | | | | | | | |
Net increase in net assets
resulting from operations | | | 188,400,675 | | | | 279,305,703 | | | | 1,094,273 | | | | 26,638,036 | | | | 273,508,041 | | | | 602,700,068 | |
| | | | | | | | | | | | |
|
| |
Dividends and Distributions to Shareholders From | | | | | | | | | | | | | | | | | |
| |
Net investment income: | | | | | | | | | | | | | | | | | | | | | | | | |
Institutional | | | (13,286,367 | ) | | | (16,930,123 | )1 | | | – | | | | – | | | | (10,774,061 | ) | | | – | |
Service | | | (559,333 | ) | | | (747,975 | )1 | | | – | | | | – | | | | (397,297 | ) | | | – | |
Investor A | | | (10,010,465 | ) | | | (13,129,458 | )1 | | | – | | | | – | | | | (828,656 | ) | | | – | |
Investor B | | | (51,463 | ) | | | (122,493 | )1 | | | – | | | | – | | | | – | | | | – | |
Investor C | | | (1,092,382 | ) | | | (1,570,033 | )1 | | | – | | | | – | | | | – | | | | – | |
Net realized gain: | | | | | | | | | | | | | | | | | | | | | | | | |
Institutional | | | – | | | | – | | | | – | | | | – | | | | (25,442,679 | ) | | | (200,665,343) | 1 |
Service | | | – | | | | – | | | | – | | | | – | | | | (3,450,902 | ) | | | (20,074,027) | 1 |
Investor A | | | – | | | | – | | | | – | | | | – | | | | (12,518,844 | ) | | | (94,447,430) | 1 |
Investor B | | | – | | | | – | | | | – | | | | – | | | | (304,395 | ) | | | (1,740,672) | 1 |
Investor C | | | – | | | | – | | | | – | | | | – | | | | (5,116,563 | ) | | | (31,519,270) | 1 |
| | | | | | | | | | | | |
Decrease in net assets resulting
from dividends and
distributions to shareholders | | | (25,000,010 | ) | | | (32,500,082 | ) | | | – | | | | – | | | | (58,833,397 | ) | | | (348,446,742) | |
| | | | | | | | | | | | |
|
| |
Capital Share Transactions | | | | | | | | | | | | | | | | | | | | | | | | |
| |
Net decrease in net assets derived
from capital share transactions | | | (107,752,492 | ) | | | (277,626,222 | ) | | | (25,961,762 | ) | | | (27,451,915 | ) | | | (502,596,837 | ) | | | (1,224,644,158) | |
| | | | | | | | | | | | |
|
| |
Net Assets | | | | | | | | | | | | | | | | | | | | | | | | |
| |
Total increase (decrease) in net
assets | | | 55,648,173 | | | | (360,820,601 | ) | | | (24,867,489 | ) | | | (813,879 | ) | | | (287,922,193 | ) | | | (970,390,832) | |
Beginning of period | | | 1,697,970,687 | | | | 1,728,791,288 | | | | 174,949,387 | | | | 175,763,266 | | | | 2,304,393,787 | | | | 3,274,784,619 | |
| | | | | | | | | | | | |
End of period | | $ | 1,753,618,860 | | | $ | 1,697,970,687 | | | $ | 150,081,898 | | | $ | 174,949,387 | | | $ | 2,016,471,594 | | | $ | 2,304,393,787 | |
| | | | | | | | | | | | |
Undistributed (distributions in
excess of) net investment
income (loss) | | $ | 3,404,344 | | | $ | 25,693,670 | | | $ | (1,496,593 | ) | | $ | (879,149 | ) | | $ | (3,700,839 | ) | | $ | 6,744,357 | |
| | | | | | | | | | | | |
| | 1 | Dividends and distributions are determined in accordance with federal income tax regulations. |
See Notes to Financial Statements.
| | | | | | |
| | | | | MARCH 31, 2013 | | |
| | BLACKROCK FUNDS | | | 45 |
| | |
| Financial Highlights | | BlackRock Global Opportunities Portfolio |
| | | | | | | | | | | | | | | | | | | | | | | | |
| | | Institutional | |
| | | Six Months Ended March 31, 2013 | | | Year Ended September 30, | |
| | |
| | |
| | |
| | | (Unaudited) | | | 2012 | | | 2011 | | | 2010 | | | 2009 | | | 2008 | |
| |
Per Share Operating Performance | | | | | | | | | | | | | | | | | | | | | | | | |
| |
Net asset value, beginning of period | | $ | 11.11 | | | $ | 9.32 | | | $ | 10.52 | | | $ | 10.13 | | | $ | 9.96 | | | $ | 13.31 | |
| | | | |
Net investment income1 | | | 0.04 | | | | 0.14 | | | | 0.08 | | | | 0.06 | | | | 0.06 | | | | 0.09 | |
Net realized and unrealized gain (loss) | | | 1.33 | | | | 1.67 | | | | (1.20 | )2 | | | 0.48 | 2 | | | 0.12 | 2 | | | (2.77)2 | |
| | | | |
Net increase (decrease) from investment operations | | | 1.37 | | | | 1.81 | | | | (1.12 | ) | | | 0.54 | | | | 0.18 | | | | (2.68) | |
| | | | |
Dividends and distributions from: | | | | | | | | | | | | | | | | | | | | | | | | |
Net investment income | | | (0.15) | | | | (0.02 | )3 | | | (0.08 | )3 | | | (0.15 | )3 | | | (0.01 | )3 | | | (0.17)3 | |
Net realized gain | | | – | | | | – | | | | – | | | | – | | | | – | | | | (0.50)3 | |
| | | | |
Total dividends and distributions | | | (0.15) | | | | (0.02 | ) | | | (0.08 | ) | | | (0.15 | ) | | | (0.01 | ) | | | (0.67) | |
| | | | |
Net asset value, end of period | | $ | 12.33 | | | $ | 11.11 | | | $ | 9.32 | | | $ | 10.52 | | | $ | 10.13 | | | $ | 9.96 | |
| | | | |
|
| |
Total Investment Return4 | | | | | | | | | | | | | | | | | | | | | | | | |
| |
Based on net asset value | | | 12.46%5 | | | | 19.45% | | | | (10.81)% | 6 | | | 5.32% | 6 | | | 1.78% | 6 | | | (21.16)%6 | |
| | | | |
|
| |
Ratios to Average Net Assets | | | | | | | | | | | | | | | | | | | | | | | | |
| |
Total expenses | | | 1.24%7 | | | | 1.25% | | | | 1.53% | | | | 1.43% | | | | 1.50% | | | | 1.33% | |
| | | | |
Total expenses excluding recoupment of past waived fees | | | 1.24%7 | | | | 1.25% | | | | 1.52% | | | | 1.42% | | | | 1.49% | | | | 1.33% | |
| | | | |
Total expenses after fees waived, reimbursed and paid indirectly | | | 1.06%7 | | | | 1.06% | | | | 1.34% | | | | 1.37% | | | | 1.36% | | | | 1.32% | |
| | | | |
Net investment income | | | 0.69%7 | | | | 1.35% | | | | 0.68% | | | | 0.64% | | | | 0.70% | | | | 0.77% | |
| | | | |
|
| |
Supplemental Data | | | | | | | | | | | | | | | | | | | | | | | | |
| |
Net assets, end of period (000) | | $ | 60,934 | | | $ | 54,448 | | | $ | 58,793 | | | $ | 21,699 | | | $ | 16,971 | | | $ | 36,625 | |
| | | | |
Portfolio turnover | | | 66% | | | | 122% | | | | 137% | | | | 146% | | | | 190% | | | | 181% | |
| | | | |
| | 1 | Based on average shares outstanding. |
| | 2 | Includes redemption fees, which are less than $0.005 per share. |
| | 3 | Dividends and distributions are determined in accordance with federal income tax regulations. |
| | 4 | Where applicable, total investment returns exclude the effects of any sales charges and include the reinvestment of dividends and distributions. |
| | 5 | Aggregate total investment return. |
| | 6 | Redemption fee of 2.00% is reflected in total return calculations. There was no impact to the return. |
See Notes to Financial Statements.
| | | | |
| | | | | |
| 46 | | BLACKROCK FUNDS | | MARCH 31, 2013 |
| | |
| Financial Highlights (continued) | | BlackRock Global Opportunities Portfolio |
| | | | | | | | | | | | | | | | | | | | | | | | | | | | | | | | | | | | | | | | | | | | | | | | |
| | | Investor A | | | Investor B | |
| | | Six Months Ended March 31, 2013 | | | Year Ended September 30, | | | Six Months Ended March 31, 2013 | | | Year Ended September 30, | |
| | | | |
| | | | |
| | | | | |
| | | (Unaudited) | | | 2012 | | | 2011 | | | 2010 | | | 2009 | | | 2008 | | | (Unaudited) | | | 2012 | | | 2011 | | | 2010 | | | 2009 | | | 2008 | |
| |
Per Share Operating Performance | | | | | | | | | | | | | | | | | | | | | | | | | | | | | | | | | | | | | |
| |
Net asset value, beginning of period | | $ | 11.02 | | | $ | 9.26 | | | $ | 10.45 | | | $ | 10.08 | | | $ | 9.92 | | | $ | 13.27 | | | $ | 10.75 | | | $ | 9.10 | | | $ | 10.31 | | | $ | 9.93 | | | $ | 9.83 | | | $ | 13.16 | |
| | | | | | | | |
Net investment income (loss)1 | | | 0.02 | | | | 0.11 | | | | 0.05 | | | | 0.03 | | | | 0.04 | | | | 0.06 | | | | (0.02 | ) | | | 0.02 | | | | (0.04 | ) | | | (0.04 | ) | | | (0.02 | ) | | | (0.04) | |
Net realized and unrealized gain (loss) | | | 1.32 | | | | 1.66 | | | | (1.20 | )2 | | | 0.46 | 2 | | | 0.12 | 2 | | | (2.77) | 2 | | | 1.28 | | | | 1.63 | | | | (1.17 | )2 | | | 0.45 | 2 | | | 0.12 | 2 | | | (2.76)2 | |
| | | | | | | | |
Net increase (decrease) from investment operations | | | 1.34 | | | | 1.77 | | | | (1.15 | ) | | | 0.49 | | | | 0.16 | | | | (2.71) | | | | 1.26 | | | | 1.65 | | | | (1.21 | ) | | | 0.41 | | | | 0.10 | | | | (2.80) | |
| | | | | | | | |
Dividends and distributions from: | | | | | | | | | | | | | | | | | | | | | | | | | | | | | | | | | | | | | | | | | | | | | | | | |
Net investment income | | | (0.12) | | | | (0.01 | )3 | | | (0.04 | )3 | | | (0.12 | )3 | | | – | | | | (0.14) | 3 | | | (0.01 | ) | | | – | | | | – | | | | (0.03 | )3 | | | – | | | | (0.03)3 | |
Net realized gain | | | – | | | | – | | | | – | | | | – | | | | – | | | | (0.50) | 3 | | | – | | | | – | | | | – | | | | – | | | | – | | | | (0.50)3 | |
| | | | | | | | |
Total dividends and distributions | | | (0.12) | | | | (0.01 | ) | | | (0.04 | ) | | | (0.12 | ) | | | – | | | | (0.64) | | | | (0.01 | ) | | | – | | | | – | | | | (0.03 | ) | | | – | | | | (0.53) | |
| | | | | | | | |
Net asset value, end of period | | $ | 12.24 | | | $ | 11.02 | | | $ | 9.26 | | | $ | 10.45 | | | $ | 10.08 | | | $ | 9.92 | | | $ | 12.00 | | | $ | 10.75 | | | $ | 9.10 | | | $ | 10.31 | | | $ | 9.93 | | | $ | 9.83 | |
| | | | | | | | |
|
| |
Total Investment Return4 | | | | | | | | | | | | | | | | | | | | | | | | | | | | | | | | | | | | | | | | | | | | | | | | |
| |
Based on net asset value | | | 12.24%5 | | | | 19.16% | | | | (11.11)% | 6 | | | 4.92% | 6 | | | 1.61% | 6 | | | (21.44)%6 | | | | 11.74% | 5 | | | 18.13% | | | | (11.74)% | 6 | | | 4.09% | 6 | | | 1.02% | 6 | | | (22.13)%6 | |
| | | | | | | | |
|
| |
Ratios to Average Net Assets | | | | | | | | | | | | | | | | | | | | | | | | | | | | | | | | | | | | | | | | | | | | | | | | |
| |
Total expenses | | | 1.51%7 | | | | 1.52% | | | | 1.76% | | | | 1.72% | | | | 1.81% | | | | 1.60% | | | | 2.20% | 7 | | | 2.21% | | | | 2.56% | | | | 2.45% | | | | 2.65% | | | | 2.37% | |
| | | | | | | | |
Total expenses excluding recoupment of past waived fees | | | 1.51%7 | | | | 1.52% | | | | 1.74% | | | | 1.70% | | | | 1.80% | | | | 1.60% | | | | 2.20% | 7 | | | 2.20% | | | | 2.53% | | | | 2.45% | | | | 2.63% | | | | 2.37% | |
| | | | | | | | |
Total expenses after fees waived, reimbursed and paid indirectly | | | 1.33%7 | | | | 1.33% | | | | 1.61% | | | | 1.67% | | | | 1.66% | | | | 1.60% | | | | 2.18% | 7 | | | 2.18% | | | | 2.42% | | | | 2.43% | | | | 2.42% | | | | 2.36% | |
| | | | | | | | |
Net investment income (loss) | | | 0.42%7 | | | | 1.06% | | | | 0.42% | | | | 0.32% | | | | 0.49% | | | | 0.49% | | | | (0.43)% | 7 | | | 0.21% | | | | (0.39)% | | | | (0.44)% | | | | (0.25)% | | | | (0.30)% | |
| | | | | | | | |
|
| |
Supplemental Data | | | | | | | | | | | | | | | | | | | | | | | | | | | | | | | | | | | | | | | | | | | | | | | | |
| |
Net assets, end of period (000) | | $ | 198,908 | | | $ | 195,961 | | | $ | 210,299 | | | $ | 39,280 | | | $ | 45,110 | | | $ | 37,529 | | | $ | 5,077 | | | $ | 5,412 | | | $ | 6,750 | | | $ | 3,617 | | | $ | 4,351 | | | $ | 5,665 | |
| | | | | | | | |
Portfolio turnover | | | 66% | | | | 122% | | | | 137% | | | | 146% | | | | 190% | | | | 181% | | | | 66% | | | | 122% | | | | 137% | | | | 146% | | | | 190% | | | | 181% | |
| | | | | | | | |
| | 1 | Based on average shares outstanding. |
| | 2 | Includes redemption fees, which are less than $0.005 per share. |
| | 3 | Dividends and distributions are determined in accordance with federal income tax regulations. |
| | 4 | Where applicable, total investment returns exclude the effects of any sales charges and include the reinvestment of dividends and distributions. |
| | 5 | Aggregate total investment return. |
| | 6 | Redemption fee of 2.00% is reflected in total return calculations. There was no impact to the return. |
See Notes to Financial Statements.
| | | | | | |
| | | | | MARCH 31, 2013 | | |
| | BLACKROCK FUNDS | | | 47 |
| | |
| Financial Highlights (concluded) | | BlackRock Global Opportunities Portfolio |
| | | | | | | | | | | | | | | | | | | | | | | | | | | | | | | | | | | | |
| | | Investor C | | | Class R | |
| | | Six Months
Ended
March 31,
2013 | | | Year Ended September 30, | | | Six Months
Ended
March 31,
2013 | | | Year Ended
September 30, | | | Period
September 12, 20111 to | |
| | | | | | |
| | | | | | |
| | | | | | |
| | | (Unaudited) | | | 2012 | | | 2011 | | | 2010 | | | 2009 | | | 2008 | | | (Unaudited) | | | 2012 | | | September 30, 2011 | |
| |
Per Share Operating Performance | | | | | | | | | | | | | | | | | | | | | | | | | | | | | | | | | |
| |
Net asset value, beginning of period | | $ | 10.71 | | | $ | 9.06 | | | $ | 10.27 | | | $ | 9.91 | | | $ | 9.82 | | | $ | 13.16 | | | $ | 10.99 | | | $ | 9.26 | | | $ | 9.76 | |
| | | | | | | | |
Net investment income (loss)2 | | | (0.02) | | | | 0.03 | | | | (0.04 | ) | | | (0.04 | ) | | | (0.02 | ) | | | (0.03) | | | | 0.003 | | | | 0.08 | | | | 0.003 | |
Net realized and unrealized gain (loss) | | | 1.28 | | | | 1.62 | | | | (1.17 | )4 | | | 0.45 | 4 | | | 0.11 | 4 | | | (2.77)4 | | | | 1.32 | | | | 1.65 | | | | (0.50)4 | |
| | | | | | | | |
Net increase (decrease) from investment operations | | | 1.26 | | | | 1.65 | | | | (1.21 | ) | | | 0.41 | | | | 0.09 | | | | (2.80) | | | | 1.32 | | | | 1.73 | | | | (0.50) | |
| | | | | | | | |
Dividends and distributions from: | | | | | | | | | | | | | | | | | | | | | | | | | | | | | | | | | | | | |
Net investment income | | | (0.02) | | | | – | | | | – | | | | (0.05 | )5 | | | – | | | | (0.04)5 | | | | (0.08) | | | | (0.00 | )5,6 | | | – | |
Net realized gain | | | – | | | | – | | | | – | | | | – | | | | – | | | | (0.50)5 | | | | – | | | | – | | | | – | |
| | | | | | | | |
Total dividends and distributions | | | (0.02) | | | | – | | | | – | | | | (0.05 | ) | | | – | | | | (0.54) | | | | (0.08) | | | | – | | | | – | |
| | | | | | | | |
Net asset value, end of period | | $ | 11.95 | | | $ | 10.71 | | | $ | 9.06 | | | $ | 10.27 | | | $ | 9.91 | | | $ | 9.82 | | | $ | 12.23 | | | $ | 10.99 | | | $ | 9.26 | |
| | | | | | | | |
|
| |
Total Investment Return7 | | | | | | | | | | | | | | | | | | | | | | | | | | | | | | | | | | | | |
| |
Based on net asset value | | | 11.80%8 | | | | 18.21% | | | | (11.78)% | 9 | | | 4.13% | 9 | | | 0.92% | 9 | | | (22.14)%9 | | | | 12.09%8 | | | | 18.72% | | | | (4.83)%8,9 | |
| | | | | | | | |
|
| |
Ratios to Average Net Assets | | | | | | | | | | | | | | | | | | | | | | | | | | | | | | | | | | | | |
| |
Total expenses | | | 2.31%10 | | | | 2.32% | | | | 2.59% | | | | 2.49% | | | | 2.62% | | | | 2.38% | | | | 1.74%10 | | | | 1.80% | | | | 1.98%10 | |
| | | | | | | | |
Total expenses excluding recoupment of past waived fees | | | 2.31%10 | | | | 2.32% | | | | 2.57% | | | | 2.49% | | | | 2.62% | | | | 2.38% | | | | 1.74%10 | | | | 1.79% | | | | 1.98%10 | |
| | | | | | | | |
Total expenses after fees waived, reimbursed and paid indirectly | | | 2.14%10 | | | | 2.14% | | | | 2.42% | | | | 2.44% | | | | 2.42% | | | | 2.37% | | | | 1.72%10 | | | | 1.65% | | | | 1.72%10 | |
| | | | | | | | |
Net investment income (loss) | | | (0.39)%10 | | | | 0.26% | | | | (0.38)% | | | | (0.40)% | | | | (0.26)% | | | | (0.26)% | | | | 0.03%10 | | | | 0.74% | | | | 0.23%10 | |
| | | | | | | | |
|
| |
Supplemental Data | | | | | | | | | | | | | | | | | | | | | | | | | | | | | | | | | | | | |
| |
Net assets, end of period (000) | | $ | 53,931 | | | $ | 54,332 | | | $ | 58,687 | | | $ | 19,554 | | | $ | 16,348 | | | $ | 18,074 | | | $ | 14,882 | | | $ | 14,704 | | | $ | 14,891 | |
| | | | | | | | |
Portfolio turnover | | | 66% | | | | 122% | | | | 137% | | | | 146% | | | | 190% | | | | 181% | | | | 66% | | | | 122% | | | | 137% | |
| | | | | | | | |
| | 1 | Commencement of operations. |
| | 2 | Based on average shares outstanding. |
| | 3 | Amount is less than $0.005 per share. |
| | 4 | Includes redemption fees, which are less than $0.005 per share. |
| | 5 | Dividends and distributions are determined in accordance with federal income tax regulations. |
| | 6 | Amount is greater than $(0.005) per share. |
| | 7 | Where applicable, total investment returns exclude the effects of any sales charges and include the reinvestment of dividends and distributions. |
| | 8 | Aggregate total investment return. |
| | 9 | Redemption fee of 2.00% is reflected in total return calculations. There was no impact to the return. |
See Notes to Financial Statements.
| | | | |
| | | | | |
| 48 | | BLACKROCK FUNDS | | MARCH 31, 2013 |
| | |
| Financial Highlights | | BlackRock Health Sciences Opportunities Portfolio |
| | | | | | | | | | | | | | | | | | | | | | | | | | | | | | | | | | | | | | | | | | | | | | | | |
| | | Institutional | | | Service | |
| | | Six Months Ended March 31, 2013 | | | Year Ended September 30, | | | Six Months Ended March 31, 2013 | | | Year Ended September 30, | |
| | | (Unaudited) | | | 2012 | | | 2011 | | | 2010 | | | 2009 | | | 2008 | | | (Unaudited) | | | 2012 | | | 2011 | | | 2010 | | | 2009 | | | 2008 | |
| |
Per Share Operating Performance | | | | | | | | | | | | | | | | | | | | | | | | | | | | | | | | | |
| |
Net asset value, beginning of period | | | $ 34.62 | | | | $ 28.77 | | | | $ 28.92 | | | | $ 26.29 | | | | $ 28.77 | | | | $ 30.41 | | | | $ 33.72 | | | | $ 28.05 | | | | $ 28.22 | | | | $ 25.74 | | | | $ 28.20 | | | | $ 29.85 | |
| | | | | | | | |
Net investment income (loss)1 | | | 0.13 | | | | 0.15 | | | | 0.02 | | | | 0.06 | | | | 0.08 | | | | 0.08 | | | | 0.08 | | | | 0.05 | | | | (0.07 | ) | | | (0.03 | ) | | | 0.01 | | | | (0.02) | |
Net realized and unrealized gain (loss) | | | 5.68 | | | | 7.26 | | | | 1.23 | 2 | | | 2.57 | 2 | | | (0.14 | )2 | | | (0.49)2 | | | | 5.53 | | | | 7.10 | | | | 1.19 | 2 | | | 2.51 | 2 | | | (0.14 | )2 | | | (0.49)2 | |
| | | | | | | | |
Net increase (decrease) from investment operations | | | 5.81 | | | | 7.41 | | | | 1.25 | | | | 2.63 | | | | (0.06 | ) | | | (0.41) | | | | 5.61 | | | | 7.15 | | | | 1.12 | | | | 2.48 | | | | (0.13 | ) | | | (0.51) | |
| | | | | | | | |
Dividends and distributions from: | | | | | | | | | | | | | | | | | | | | | | | | | | | | | | | | | | | | | | | | | | | | | | | | |
Net investment income | | | (0.18 | ) | | | – | | | | (0.05 | )3 | | | – | | | | – | | | | – | | | | (0.10 | ) | | | – | | | | – | | | | – | | | | – | | | | – | |
Net realized gain | | | (2.22 | ) | | | (1.56 | )3 | | | (1.35 | )3 | | | – | | | | (2.42 | )3 | | | (1.23)3 | | | | (2.22 | ) | | | (1.48 | )3 | | | (1.29 | )3 | | | – | | | | (2.33 | )3 | | | (1.14)3 | |
| | | | | | | | |
Total dividends and distributions | | | (2.40 | ) | | | (1.56 | ) | | | (1.40 | ) | | | – | | | | (2.42 | ) | | | (1.23) | | | | (2.32 | ) | | | (1.48 | ) | | | (1.29 | ) | | | – | | | | (2.33 | ) | | | (1.14) | |
| | | | | | | | |
Net asset value, end of period | | | $ 38.03 | | | | $ 34.62 | | | | $ 28.77 | | | | $ 28.92 | | | | $ 26.29 | | | | $ 28.77 | | | | $ 37.01 | | | | $ 33.72 | | | | $ 28.05 | | | | $ 28.22 | | | | $ 25.74 | | | | $ 28.20 | |
| | | | | | | | |
|
| |
Total Investment Return4 | | | | | | | | | | | | | | | | | | | | | | | | | | | | | | | | | | | | | | | | | |
| |
Based on net asset value | | | 17.92% | 5 | | | 27.06% | | | | 4.41% | 6 | | | 10.00% | 6,7 | | | 1.91% | 6 | | | (1.64)%6 | | | | 17.74% | 5 | | | 26.73% | | | | 4.04% | 6 | | | 9.64% | 6,7 | | | 1.59% | 6 | | | (1.98)%6 | |
| | | | | | | | |
|
| |
Ratios to Average Net Assets | | | | | | | | | | | | | | | | | | | | | | | | | | | | | | | | | |
| |
Total expenses | | | 0.95% | 8 | | | 0.98% | | | | 1.00% | | | | 1.00% | | | | 1.03% | | | | 1.00% | | | | 1.24% | 8 | | | 1.28% | | | | 1.32% | | | | 1.33% | | | | 1.37% | | | | 1.35% | |
| | | | | | | | |
Total expenses excluding recoupment of past waived fees | | | 0.95% | 8 | | | 0.98% | | | | 1.00% | | | | 1.00% | | | | 1.03% | | | | 1.00% | | | | 1.24% | 8 | | | 1.28% | | | | 1.31% | | | | 1.33% | | | | 1.35% | | | | 1.35% | |
| | | | | | | | |
Total expenses after fees waived, reimbursed and paid indirectly | | | 0.95% | 8 | | | 0.98% | | | | 1.00% | | | | 1.00% | | | | 1.03% | | | | 1.00% | | | | 1.24% | 8 | | | 1.28% | | | | 1.31% | | | | 1.32% | | | | 1.36% | | | | 1.35% | |
| | | | | | | | |
Net investment income (loss) | | | 0.77% | 8 | | | 0.47% | | | | 0.07% | | | | 0.21% | | | | 0.36% | | | | 0.28% | | | | 0.46% | 8 | | | 0.18% | | | | (0.24)% | | | | (0.12)% | | | | 0.03% | | | | (0.06)% | |
| | | | | | | | |
|
| |
Supplemental Data | | | | | | | | | | | | | | | | | | | | | | | | | | | | | | | | | | | | | | | | | | | | | |
| |
Net assets, end of period (000) | | | $586,462 | | | | $473,193 | | | | $362,292 | | | | $232,697 | | | | $171,607 | | | | $185,933 | | | | $ 18,313 | | | | $ 14,921 | | | | $ 13,478 | | | | $ 11,704 | | | | $ 8,110 | | | | $ 5,764 | |
| | | | | | | | |
Portfolio turnover | | | 57% | | | | 135% | | | | 135% | | | | 184% | | | | 153% | | | | 91% | | | | 57% | | | | 135% | | | | 135% | | | | 184% | | | | 153% | | | | 91% | |
| | | | | | | | |
| | 1 | Based on average shares outstanding. |
| | 2 | Includes redemption fees, which are less than $0.005 per share. |
| | 3 | Dividends and distributions are determined in accordance with federal income tax regulations. |
| | 4 | Where applicable, total investment returns exclude the effects of any sales charges and include the reinvestment of dividends and distributions. |
| | 5 | Aggregate total investment return. |
| | 6 | Redemption fee of 2.00% is reflected in total return calculations. There was no impact to the return. |
| | 7 | Includes proceeds received from a settlement of litigation, which had no impact on the Fund’s total return. |
See Notes to Financial Statements.
| | | | | | |
| | | | | MARCH 31, 2013 | | |
| | BLACKROCK FUNDS | | | 49 |
| | |
| Financial Highlights (continued) | | BlackRock Health Sciences Opportunities Portfolio |
| | | | | | | | | | | | | | | | | | | | | | | | | | | | | | | | | | | | | | | | | | | | | | | | |
| | | Investor A | | | Investor B | |
| | | Six Months Ended March 31, 2013 | | | Year Ended September 30, | | | Six Months Ended March 31, 2013 | | | Year Ended September 30, | |
| | | (Unaudited) | | | 2012 | | | 2011 | | | 2010 | | | 2009 | | | 2008 | | | (Unaudited) | | | 2012 | | | 2011 | | | 2010 | | | 2009 | | | 2008 | |
| |
Per Share Operating Performance | | | | | | | | | | | | | | | | | | | | | | | | | | | | | | | | | |
| |
Net asset value, beginning of
period | | | $ 33.64 | | | | $ 28.00 | | | | $ 28.18 | | | | $ 25.69 | | | | $ 28.14 | | | | $ 29.77 | | | | $ 31.46 | | | | $ 26.26 | | | | $ 26.39 | | | | $ 24.25 | | | | $ 26.73 | | | | $ 28.28 | |
| | | | | | | | |
Net investment income
(loss)1 | | | 0.08 | | | | 0.05 | | | | (0.07 | ) | | | (0.03 | ) | | | 0.01 | | | | (0.02) | | | | (0.06 | ) | | | (0.17 | ) | | | (0.28 | ) | | | (0.23 | ) | | | (0.17 | ) | | | (0.23) | |
Net realized and unrealized
gain (loss) | | | 5.52 | | | | 7.07 | | | | 1.19 | 2 | | | 2.52 | 2 | | | (0.15 | )2 | | | (0.49)2 | | | | 5.17 | | | | 6.63 | | | | 1.14 | 2 | | | 2.37 | 2 | | | (0.16 | )2 | | | (0.49)2 | |
| | | | | | | | |
Net increase (decrease) from
investment operations | | | 5.60 | | | | 7.12 | | | | 1.12 | | | | 2.49 | | | | (0.14 | ) | | | (0.51) | | | | 5.11 | | | | 6.46 | | | | 0.86 | | | | 2.14 | | | | (0.33 | ) | | | (0.72) | |
| | | | | | | | |
Dividends and distributions from: | | | | | | | | | | | | | | | | | | | | | | | | | | | | | | | | | | | | | | | | | | | | | | | | |
Net investment income | | | (0.10 | ) | | | – | | | | – | | | | – | | | | – | | | | – | | | | – | | | | – | | | | – | | | | – | | | | – | | | | – | |
Net realized gain | | | (2.22 | ) | | | (1.48 | )3 | | | (1.30 | )3 | | | – | | | | (2.31 | )3 | | | (1.12)3 | | | | (2.09 | ) | | | (1.26 | )3 | | | (0.99 | )3 | | | – | | | | (2.15 | )3 | | | (0.83)3 | |
| | | | | | | | |
Total dividends and
distributions | | | (2.32 | ) | | | (1.48 | ) | | | (1.30 | ) | | | – | | | | (2.31 | ) | | | (1.12) | | | | (2.09 | ) | | | (1.26 | ) | | | (0.99 | ) | | | – | | | | (2.15 | ) | | | (0.83) | |
| | | | | | | | |
Net asset value, end of period | | | $ 36.92 | | | | $ 33.64 | | | | $ 28.00 | | | | $ 28.18 | | | | $ 25.69 | | | | $ 28.14 | | | | $ 34.48 | | | | $ 31.46 | | | | $ 26.26 | | | | $ 26.39 | | | | $ 24.25 | | | | $ 26.73 | |
| | | | | | | | |
|
| |
Total Investment Return4 | | | | | | | | | | | | | | | | | | | | | | | | | | | | | | | | | |
| |
Based on net asset value | | | 17.78% | 5 | | | 26.68% | | | | 4.03% | 6 | | | 9.69% | 6,7 | | | 1.57% | 6 | | | (1.97)%6 | | | | 17.29% | 5 | | | 25.70% | | | | 3.27% | 6 | | | 8.82% | 6,7 | | | 0.73% | 6 | | | (2.78)%6 | |
| | | | | | | | |
|
| |
Ratios to Average Net Assets | | | | | | | | | | | | | | | | | | | | | | | | | | | | | | | | | |
| |
Total expenses | | | 1.24% | 8 | | | 1.29% | | | | 1.31% | | | | 1.31% | | | | 1.37% | | | | 1.35% | | | | 2.05% | 8 | | | 2.07% | | | | 2.06% | | | | 2.10% | | | | 2.20% | | | | 2.14% | |
| | | | | | | | |
Total expenses excluding
recoupment of past waived
fees | | | 1.24% | 8 | | | 1.29% | | | | 1.31% | | | | 1.31% | | | | 1.37% | | | | 1.35% | | | | 2.05% | 8 | | | 2.07% | | | | 2.06% | | | | 2.10% | | | | 2.17% | | | | 2.14% | |
| | | | | | | | |
Total expenses after fees
waived, reimbursed and
paid indirectly | | | 1.24% | 8 | | | 1.28% | | | | 1.31% | | | | 1.31% | | | | 1.37% | | | | 1.35% | | | | 2.05% | 8 | | | 2.07% | | | | 2.06% | | | | 2.09% | | | | 2.20% | | | | 2.14% | |
| | | | | | | | |
Net investment income (loss) | | | 0.47% | 8 | | | 0.17% | | | | (0.24)% | | | | (0.11)% | | | | 0.02% | | | | (0.06)% | | | | (0.36)% | 8 | | | (0.59)% | | | | (0.99)% | | | | (0.88)% | | | | (0.80)% | | | | (0.85)% | |
| | | | | | | | |
|
| |
Supplemental Data | | | | | | | | | | | | | | | | | | | | | | | | | | | | | | | | | |
| |
Net assets, end of period
(000) | | | $1,270,445 | | | | $1,018,429 | | | | $825,046 | | | | $682,857 | | | | $478,273 | | | | $564,943 | | | | $ 41,259 | | | | $ 40,452 | | | | $ 46,180 | | | | $ 47,855 | | | | $ 57,835 | | | | $ 80,269 | |
| | | | | | | | |
Portfolio turnover | | | 57% | | | | 135% | | | | 135% | | | | 184% | | | | 153% | | | | 91% | | | | 57% | | | | 135% | | | | 135% | | | | 184% | | | | 153% | | | | 91% | |
| | | | | | | | |
| | 1 | Based on average shares outstanding. |
| | 2 | Includes redemption fees, which are less than $0.005 per share. |
| | 3 | Distributions are determined in accordance with federal income tax regulations. |
| | 4 | Where applicable, total investment returns exclude the effects of any sales charges and include the reinvestment of dividends and distributions. |
| | 5 | Aggregate total investment return. |
| | 6 | Redemption fee of 2.00% is reflected in total return calculations. There was no impact to the return. |
| | 7 | Includes proceeds received from a settlement of litigation, which had no impact on the Fund’s total return. |
See Notes to Financial Statements.
| | | | |
| | | | | |
| 50 | | BLACKROCK FUNDS | | MARCH 31, 2013 |
| | |
| Financial Highlights (concluded) | | BlackRock Health Sciences Opportunities Portfolio |
| | | | | | | | | | | | | | | | | | | | | | | | | | | | | | | | | | | | |
| | | Investor C | | | Class R | |
| | | Six Months
Ended | | | Year Ended September 30, | | | Six Months Ended | | | | | | | |
| | | March 31, | | | | | | | | | | | | | | | | | | March 31, | | | Year Ended | | | Period | |
| | | 2013 | | | | | | | | | | | | | | | | | | 2013 | | | September 30, | | | September 12, 20111 to | |
| | | (Unaudited) | | | 2012 | | | 2011 | | | 2010 | | | 2009 | | | 2008 | | | (Unaudited) | | | 2012 | | | September 30, 2011 | |
| |
Per Share Operating Performance | | | | | | | | | | | | | | | | | | | | | |
| |
Net asset value, beginning of
period | | | $ 31.34 | | | | $ 26.18 | | | | $ 26.37 | | | | $ 24.22 | | | | $ 26.70 | | | | $ 28.27 | | | | $ 33.46 | | | | $ 28.00 | | | | $ 28.19 | |
| | | | | | | | |
Net investment income
(loss)2 | | | (0.04 | ) | | | (0.16 | ) | | | (0.27 | ) | | | (0.21 | ) | | | (0.15 | ) | | | (0.21) | | | | 0.02 | | | | (0.07 | ) | | | (0.01) | |
Net realized and unrealized
gain (loss) | | | 5.12 | | | | 6.62 | | | | 1.14 | 3 | | | 2.36 | 3 | | | (0.16 | )3 | | | (0.47)3 | | | | 5.48 | | | | 7.05 | | | | (0.18)3 | |
| | | | | | | | |
Net increase (decrease) from
investment operations | | | 5.08 | | | | 6.46 | | | | 0.87 | | | | 2.15 | | | | (0.31 | ) | | | (0.68) | | | | 5.50 | | | | 6.98 | | | | (0.19) | |
| | | | | | | | |
Dividends and distributions from: | | | | | | | | | | | | | | | | | | | | | | | | | | | | | | | | | | | | |
Net investment income | | | – | | | | – | | | | – | | | | – | | | | – | | | | – | | | | (0.02 | ) | | | – | | | | – | |
Net realized gain | | | (2.15 | ) | | | (1.30 | )4 | | | (1.06 | )4 | | | – | | | | (2.17 | )4 | | | (0.89)4 | | | | (2.22 | ) | | | (1.52 | )4 | | | – | |
| | | | | | | | |
Total dividends and
distributions | | | (2.15 | ) | | | – | | | | – | | | | – | | | | – | | | | – | | | | (2.24 | ) | | | (1.52 | ) | | | – | |
| | | | | | | | |
Net asset value, end of period | | | $ 34.27 | | | | $ 31.34 | | | | $ 26.18 | | | | $ 26.37 | | | | $ 24.22 | | | | $ 26.70 | | | | $ 36.72 | | | | $ 33.46 | | | | $ 28.00 | |
| | | | | | | | |
|
| |
Total Investment Return5 | | | | | | | | | | | | | | | | | | | | | | | | | | | | | |
| |
Based on net asset value | | | 17.30% | 6 | | | 25.80% | | | | 3.32% | 7 | | | 8.88% | 7,8 | | | 0.81%7 | | | | (2.66)%7 | | | | 17.53% | 6 | | | 26.17% | | | | (0.64)%6,7 | |
| | | | | | | | |
|
| |
Ratios to Average Net Assets | | | | | | | | | | | | | | | | | | | | | |
| |
Total expenses | | | 1.98% | 9 | | | 2.01% | | | | 2.02% | | | | 2.04% | | | | 2.09% | | | | 2.05% | | | | 1.62% | 9 | | | 1.70% | | | | 1.75%9 | |
| | | | | | | | |
Total expenses excluding
recoupment of past waived
fees | | | 1.98% | 9 | | | 2.01% | | | | 2.02% | | | | 2.04% | | | | 2.09% | | | | 2.05% | | | | 1.60% | 9 | | | 1.70% | | | | 1.75%9 | |
| | | | | | | | |
Total expenses after fees
waived, reimbursed and
paid indirectly | | | 1.97% | 9 | | | 2.01% | | | | 2.02% | | | | 2.04% | | | | 2.09% | | | | 2.05% | | | | 1.62% | 9 | | | 1.68% | | | | 1.75%9 | |
| | | | | | | | |
Net investment income (loss) | | | (0.27)% | 9 | | | (0.55)% | | | | (0.95)% | | | | (0.83)% | | | | (0.70)% | | | | (0.76)% | | | | 0.10% | 9 | | | (0.24)% | | | | (0.82)%9 | |
| | | | | | | | |
|
| |
Supplemental Data | | | | | | | | | | | | | | | | | | | | | |
| |
Net assets, end of period
(000) | | | $461,728 | | | | $384,910 | | | | $327,855 | | | | $285,428 | | | | $255,340 | | | | $305,015 | | | | $ 19,210 | | | | $ 14,613 | | | | $ 9,580 | |
| | | | | | | | |
Portfolio turnover | | | 57% | | | | 135% | | | | 135% | | | | 184% | | | | 153% | | | | 91% | | | | 57% | | | | 135% | | | | 135% | |
| | | | | | | | |
| | 1 | Commencement of operations. |
| | 2 | Based on average shares outstanding. |
| | 3 | Includes redemption fees, which are less than $0.005 per share. |
| | 4 | Distributions are determined in accordance with federal income tax regulations. |
| | 5 | Where applicable, total investment returns exclude the effects of any sales charges and include the reinvestment of dividends and distributions. |
| | 6 | Aggregate total investment return. |
| | 7 | Redemption fee of 2.00% is reflected in total return calculations. There was no impact to the return. |
| | 8 | Includes proceeds received from a settlement of litigation, which had no impact on the Fund’s total return. |
See Notes to Financial Statements.
| | | | | | |
| | | | | MARCH 31, 2013 | | |
| | BLACKROCK FUNDS | | | 51 |
| | |
| Financial Highlights | | BlackRock International Opportunities Portfolio |
| | | | | | | | | | | | | | | | | | | | | | | | | | | | | | | | | | | | | | | | | | | | | | | | |
| | | Institutional | | | Service | |
| | | Six Months
Ended
March 31,
2013 | | | Year Ended September 30, | | | Six Months
Ended
March 31,
2013 | | | Year Ended September 30, | |
| | | (Unaudited) | | | 2012 | | | 2011 | | | 2010 | | | 2009 | | | 2008 | | | (Unaudited) | | | 2012 | | | 2011 | | | 2010 | | | 2009 | | | 2008 | |
| |
Per Share Operating Performance | | | | | | | | | | | | | | | | | | | | | | | | | | | | | | | | | |
| |
Net asset value, beginning of
period | | | $ 32.82 | | | | $ 28.37 | | | | $ 32.76 | | | | $ 31.36 | | | | $ 29.44 | | | | $ 51.08 | | | | $ 31.62 | | | | $ 27.34 | | | | $ 31.58 | | | | $ 30.26 | | | | $ 28.36 | | | | $ 49.52 | |
| | | | | | | | |
Net investment income
(loss)1 | | | 0.09 | | | | 0.56 | | | | 0.49 | | | | 0.28 | | | | 0.34 | | | | 0.47 | | | | (0.01 | ) | | | 0.39 | | | | 0.34 | | | | 0.16 | | | | 0.27 | | | | 0.28 | |
Net realized and unrealized
gain (loss) | | | 3.68 | | | | 4.49 | | | | (4.52 | )2 | | | 1.58 | 2 | | | 1.68 | 2 | | | (13.66) | 2 | | | 3.55 | | | | 4.33 | | | | (4.37 | )2 | | | 1.53 | 2 | | | 1.63 | 2 | | | (13.14)2 | |
| | | | | | | | |
Net increase (decrease) from
investment operations | | | 3.77 | | | | 5.05 | | | | (4.03 | ) | | | 1.86 | | | | 2.02 | | | | (13.19) | | | | 3.54 | | | | 4.72 | | | | (4.03 | ) | | | 1.69 | | | | 1.90 | | | | (12.86) | |
| | | | | | | | |
Dividends and distributions
from: | | | | | | | | | | | | | | | | | | | | | | | | | | | | | | | | | | | | | | | | | | | | | | | | |
Net investment income | | | (0.56 | ) | | | (0.60 | )3 | | | (0.36 | )3 | | | (0.46 | )3 | | | (0.10 | )3 | | | (1.21) | 3 | | | (0.39 | ) | | | (0.44 | )3 | | | (0.21 | )3 | | | (0.37 | )3 | | | – | | | | (1.06)3 | |
Net realized gain | | | – | | | | – | | | | – | | | | – | | | | – | | | | (7.24) | 3 | | | – | | | | – | | | | – | | | | – | | | | – | | | | (7.24)3 | |
| | | | | | | | |
Total dividends and
distributions | | | (0.56 | ) | | | (0.60 | ) | | | (0.36 | ) | | | (0.46 | ) | | | (0.10 | ) | | | (8.45) | | | | (0.39 | ) | | | (0.44 | ) | | | (0.21 | ) | | | (0.37 | ) | | | – | | | | (8.30) | |
| | | | | | | | |
Net asset value, end of period | | | $ 36.03 | | | | $ 32.82 | | | | $ 28.37 | | | | $ 32.76 | | | | $ 31.36 | | | | $ 29.44 | | | | $ 34.77 | | | | $ 31.62 | | | | $ 27.34 | | | | $ 31.58 | | | | $ 30.26 | | | | $ 28.36 | |
| | | | | | | | |
|
| |
Total Investment Return4 | | | | | | | | | | | | | | | | | | | | | | | | | | | | | | | | | | | | | | | | | |
| |
Based on net asset value | | | 11.60% | 5 | | | 18.08% | | | | (12.50)% | 6 | | | 5.99% | 6 | | | 6.99% | 6 | | | (30.87)%6 | ,7 | | | 11.28% | 5 | | | 17.48% | | | | (12.88)% | 6 | | | 5.63% | 6 | | | 6.70% | 6 | | | (31.10)%6,7 | |
| | | | | | | | |
|
| |
Ratios to Average Net Assets | | | | | | | | | | | | | | | | | | | | | | | | | | | | | | | | | |
| |
Total expenses | | | 1.24% | 8 | | | 1.29% | | | | 1.26% | | | | 1.35% | | | | 1.45% | | | | 1.25% | | | | 1.80% | 8 | | | 1.90% | | | | 1.66% | | | | 1.72% | | | | 1.75% | | | | 1.58% | |
| | | | | | | | |
Total expenses excluding
recoupment of past waived
fees | | | 1.24% | 8 | | | 1.29% | | | | 1.26% | | | | 1.34% | | | | 1.45% | | | | 1.25% | | | | 1.65% | 8 | | | 1.90% | | | | 1.66% | | | | 1.69% | | | | 1.73% | | | | 1.58% | |
| | | | | | | | |
Total expenses after fees
waived, reimbursed and
paid indirectly | | | 1.24% | 8 | | | 1.29% | | | | 1.26% | | | | 1.35% | | | | 1.43% | | | | 1.25% | | | | 1.80% | 8 | | | 1.80% | | | | 1.65% | | | | 1.72% | | | | 1.70% | | | | 1.58% | |
| | | | | | | | |
Net investment income (loss) | | | 0.55% | 8 | | | 1.83% | | | | 1.41% | | | | 0.91% | | | | 1.36% | | | | 1.18% | | | | (0.05)% | 8 | | | 1.31% | | | | 1.02% | | | | 0.53% | | | | 1.13% | | | | 0.72% | |
| | | | | | | | |
|
| |
Supplemental Data | | | | | | | | | | | | | | | | | | | | | | | | | | | | | | | | | | | | | | | | | | | | | |
| |
Net assets, end of period
(000) | | | $832,529 | | | | $798,205 | | | | $792,695 | | | | $802,167 | | | | $673,420 | | | | $ 450,605 | | | | $ 41,656 | | | | $ 47,598 | | | | $ 47,846 | | | | $70,365 | | | | $83,093 | | | | $ 64,368 | |
| | | | | | | | |
Portfolio turnover | | | 82% | | | | 99% | | | | 116% | | | | 116% | | | | 143% | | | | 138% | | | | 82% | | | | 99% | | | | 116% | | | | 116% | | | | 143% | | | | 138% | |
| | | | | | | | |
| | 1 | Based on average shares outstanding. |
| | 2 | Includes redemption fees, which are less than $0.005 per share. |
| | 3 | Dividends and distributions are determined in accordance with federal income tax regulations. |
| | 4 | Where applicable, total investment returns exclude the effects of any sales charges and include the reinvestment of dividends and distributions. |
| | 5 | Aggregate total investment return. |
| | 6 | Redemption fee of 2.00% is reflected in total return calculations. There was no impact to the return. |
| | 7 | Payment from affiliate of $112,880 received by the Fund is reflected in total return calculations. There was no impact to the return. |
See Notes to Financial Statements.
| | | | |
| | | | | |
| 52 | | BLACKROCK FUNDS | | MARCH 31, 2013 |
| | |
| Financial Highlights (continued) | | BlackRock International Opportunities Portfolio |
| | | | | | | | | | | | | | | | | | | | | | | | | | | | | | | | | | | | | | | | | | | | | | | | |
| | | Investor A | | | Investor B | |
| | | Six Months Ended March 31, 2013 | | | Year Ended September 30, | | | Six Months Ended March 31, 2013 | | | Year Ended September 30, | |
| | | (Unaudited) | | | 2012 | | | 2011 | | | 2010 | | | 2009 | | | 2008 | | | (Unaudited) | | | 2012 | | | 2011 | | | 2010 | | | 2009 | | | 2008 | |
| |
Per Share Operating Performance | | | | | | | | | | | | | | | | | | | | | | | | | | | | | | | | | |
| |
Net asset value, beginning of
period | | | $ 31.33 | | | | $ 27.10 | | | | $ 31.33 | | | | $ 30.02 | | | | $ 28.14 | | | | $ 49.19 | | | | $ 29.15 | | | | $ 25.18 | | | | $ 29.10 | | | | $ 27.83 | | | | $ 26.29 | | | | $ 46.43 | |
| | | | | | | | |
Net investment income
(loss)1 | | | 0.04 | | | | 0.45 | | | | 0.39 | | | | 0.21 | | | | 0.27 | | | | 0.33 | | | | (0.11 | ) | | | 0.16 | | | | 0.10 | | | | (0.05 | ) | | | 0.09 | | | | (0.06) | |
Net realized and unrealized
gain (loss) | | | 3.52 | | | | 4.30 | | | | (4.34 | )2 | | | 1.50 | 2 | | | 1.62 | 2 | | | (13.09) | 2 | | | 3.29 | | | | 4.03 | | | | (4.01 | )2 | | | 1.42 | 2 | | | 1.45 | 2 | | | (12.16)2 | |
| | | | | | | | |
Net increase (decrease) from
investment operations | | | 3.56 | | | | 4.75 | | | | (3.95 | ) | | | 1.71 | | | | 1.89 | | | | (12.76) | | | | 3.18 | | | | 4.19 | | | | (3.91 | ) | | | 1.37 | | | | 1.54 | | | | (12.22) | |
| | | | | | | | |
Dividends and distributions from: | | | | | | | | | | | | | | | | | | | | | | | | | | | | | | | | | | | | | | | | | | | | | | | | |
Net investment income | | | (0.47 | ) | | | (0.52 | )3 | | | (0.28 | )3 | | | (0.40 | )3 | | | (0.01 | )3 | | | (1.05) | 3 | | | (0.15 | ) | | | (0.22 | )3 | | | (0.01 | )3 | | | (0.10 | )3 | | | – | | | | (0.68)3 | |
Net realized gain | | | – | | | | – | | | | – | | | | – | | | | – | | | | (7.24) | 3 | | | – | | | | – | | | | – | | | | – | | | | – | | | | (7.24)3 | |
| | | | | | | | |
Total dividends and
distributions | | | (0.47 | ) | | | (0.52 | ) | | | (0.28 | ) | | | (0.40 | ) | | | (0.01 | ) | | | (8.29) | | | | (0.15 | ) | | | (0.22 | ) | | | (0.01 | ) | | | (0.10 | ) | | | – | | | | (7.92) | |
| | | | | | | | |
Net asset value, end of period | | | $ 34.42 | | | | $ 31.33 | | | | $ 27.10 | | | | $ 31.33 | | | | $ 30.02 | | | | $ 28.14 | | | | $ 32.18 | | | | $ 29.15 | | | | $ 25.18 | | | | $ 29.10 | | | | $ 27.83 | | | | $ 26.29 | |
| | | | | | | | |
|
| |
Total Investment Return4 | | | | | | | | | | | | | | | | | | | | | | | | | | | | | | | | | | | | | | | | | |
| |
Based on net asset value | | | 11.45% | 5 | | | 17.74% | | | | (12.77)% | 6 | | | 5.73% | 6 | | | 6.73% | 6 | | | (31.09)%6 | ,7 | | | 10.95% | 5 | | | 16.72% | | | | (13.45)% | 6 | | | 4.92% | 6 | | | 5.86% | 6 | | | (31.63)%6,7 | |
| | | | | | | | |
|
| |
Ratios to Average Net Assets | | | | | | | | | | | | | | | | | | | | | | | | | | | | | | | | | |
| |
Total expenses | | | 1.54% | 8 | | | 1.57% | | | | 1.54% | | | | 1.59% | | | | 1.68% | | | | 1.58% | | | | 2.44% | 8 | | | 2.41% | | | | 2.32% | | | | 2.38% | | | | 2.49% | | | | 2.35% | |
| | | | | | | | |
Total expenses excluding
recoupment of past waived
fees | | | 1.54% | 8 | | | 1.57% | | | | 1.54% | | | | 1.59% | | | | 1.68% | | | | 1.58% | | | | 2.44% | 8 | | | 2.41% | | | | 2.32% | | | | 2.38% | | | | 2.49% | | | | 2.35% | |
| | | | | | | | |
Total expenses after fees
waived, reimbursed and
paid indirectly | | | 1.54% | 8 | | | 1.57% | | | | 1.53% | | | | 1.59% | | | | 1.68% | | | | 1.58% | | | | 2.44% | 8 | | | 2.41% | | | | 2.32% | | | | 2.38% | | | | 2.49% | | | | 2.35% | |
| | | | | | | | |
Net investment income (loss) | | | 0.25% | 8 | | | 1.52% | | | | 1.16% | | | | 0.72% | | | | 1.15% | | | | 0.87% | | | | (0.73)% | 8 | | | 0.60% | | | | 0.34% | | | | (0.18)% | | | | 0.41% | | | | (0.15)% | |
| | | | | | | | |
|
| |
Supplemental Data | | | | | | | | | | | | | | | | | | | | | | | | | | | | | | | | | | | | | | | | | | | | | |
| |
Net assets, end of period
(000) | | | $723,024 | | | | $692,445 | | | | $ 703,201 | | | | $794,034 | | | | $604,283 | | | | $ 482,526 | | | | $ 8,470 | | | | $ 10,813 | | | | $ 15,568 | | | | $ 25,080 | | | | $33,094 | | | | $ 42,927 | |
| | | | | | | | |
Portfolio turnover | | | 82% | | | | 99% | | | | 116% | | | | 116% | | | | 143% | | | | 138% | | | | 82% | | | | 99% | | | | 116% | | | | 116% | | | | 143% | | | | 138% | |
| | | | | | | | |
| | 1 | Based on average shares outstanding. |
| | 2 | Includes redemption fees, which are less than $0.005 per share. |
| | 3 | Dividends and distributions are determined in accordance with federal income tax regulations. |
| | 4 | Where applicable, total investment returns exclude the effects of any sales charges and include the reinvestment of dividends and distributions. |
| | 5 | Aggregate total investment return. |
| | 6 | Redemption fee of 2.00% is reflected in total return calculations. There was no impact to the return. |
| | 7 | Payment from affiliate of $112,880 received by the Fund is reflected in total return calculations. There was no impact to the return. |
See Notes to Financial Statements.
| | | | | | |
| | | | | MARCH 31, 2013 | | |
| | BLACKROCK FUNDS | | | 53 |
| | |
| Financial Highlights (concluded) | | BlackRock International Opportunities Portfolio |
| | | | | | | | | | | | | | | | | | | | | | | | |
| | | Investor C | |
| | | Six Months Ended March 31, 2013 | | | Year Ended September 30, | |
| | | (Unaudited) | | | 2012 | | | 2011 | | | 2010 | | | 2009 | | | 2008 | |
| |
Per Share Operating Performance | | | | | | | | | |
| |
Net asset value, beginning of period | | | $ 28.91 | | | | $ 24.98 | | | | $ 28.92 | | | | $ 27.74 | | | | $ 26.21 | | | | $ 46.34 | |
| | | | |
Net investment income (loss)1 | | | (0.08 | ) | | | 0.20 | | | | 0.11 | | | | (0.02 | ) | | | 0.08 | | | | 0.03 | |
Net realized and unrealized gain (loss) | | | 3.24 | | | | 3.98 | | | | (3.98 | )2 | | | 1.39 | 2 | | | 1.45 | 2 | | | (12.20)2 | |
| | | | |
Net increase (decrease) from investment operations | | | 3.16 | | | | 4.18 | | | | (3.87 | ) | | | 1.37 | | | | 1.53 | | | | (12.17) | |
| | | | |
Dividends and distributions from: | | | | | | | | | | | | | | | | | | | | | | | | |
Net investment income | | | (0.22 | ) | | | (0.25 | )3 | | | (0.07 | )3 | | | (0.19 | )3 | | | – | | | | (0.72)3 | |
Net realized gain | | | – | | | | – | | | | – | | | | – | | | | – | | | | (7.24)3 | |
| | | | |
Total dividends and distributions | | | (0.22 | ) | | | (0.25 | ) | | | (0.07 | ) | | | (0.19 | ) | | | – | | | | (7.96) | |
| | | | |
Net asset value, end of period | | | $ 31.85 | | | | $ 28.91 | | | | $ 24.98 | | | | $ 28.92 | | | | $ 27.74 | | | | $ 26.21 | |
| | | | |
|
| |
Total Investment Return4 | | | | | | | | | | | | | | | | | |
| |
Based on net asset value | | | 11.00% | 5 | | | 16.83% | | | | (13.44)% | 6 | | | 4.95% | 6 | | | 5.84% | 6 | | | (31.61)%6,7 | |
| | | | |
|
| |
Ratios to Average Net Assets | | | | | | | | | |
| |
Total expenses | | | 2.33% | 8 | | | 2.34% | | | | 2.31% | | | | 2.36% | | | | 2.49% | | | | 2.32% | |
| | | | |
Total expenses excluding recoupment of past waived fees | | | 2.33% | 8 | | | 2.34% | | | | 2.31% | | | | 2.36% | | | | 2.49% | | | | 2.32% | |
| | | | |
Total expenses after fees waived, reimbursed and paid indirectly | | | 2.33% | 8 | | | 2.34% | | | | 2.31% | | | | 2.36% | | | | 2.48% | | | | 2.32% | |
| | | | |
Net investment income (loss) | | | (0.54)% | 8 | | | 0.73% | | | | 0.37% | | | | (0.06)% | | | | 0.38% | | | | 0.08% | |
| | | | |
|
| |
Supplemental Data | | | | | | | | | | | | | | | | | | | | | |
| |
Net assets, end of period (000) | | | $147,940 | | | | $148,910 | | | | $ 169,481 | | | | $224,958 | | | | $187,246 | | | | $ 194,068 | |
| | | | |
Portfolio turnover | | | 82% | | | | 99% | | | | 116% | | | | 116% | | | | 143% | | | | 138% | |
| | | | |
| | 1 | Based on average shares outstanding. |
| | 2 | Includes redemption fees, which are less than $0.005 per share. |
| | 3 | Dividends and distributions are determined in accordance with federal income tax regulations. |
| | 4 | Where applicable, total investment returns exclude the effects of any sales charges and include the reinvestment of dividends and distributions. |
| | 5 | Aggregate total investment return. |
| | 6 | Redemption fee of 2.00% is reflected in total return calculations. There was no impact to the return. |
| | 7 | Payment from affiliate of $112,880 received by the Fund is reflected in total return calculations. There was no impact to the return. |
See Notes to Financial Statements.
| | | | |
| | | | | |
| 54 | | BLACKROCK FUNDS | | MARCH 31, 2013 |
| | |
| Financial Highlights | | BlackRock Science & Technology Opportunities Portfolio |
| | | | | | | | | | | | | | | | | | | | | | | | | | | | | | | | | | | | | | | | | | | | | | | | |
| | | Institutional | | | Service | |
| | | Six Months Ended March 31, 2013 | | | Year Ended September 30, | | | Six Months Ended March 31, 2013 | | | Year Ended September 30, | |
| | | (Unaudited) | | | 2012 | | | 2011 | | | 2010 | | | 2009 | | | 2008 | | | (Unaudited) | | | 2012 | | | 2011 | | | 2010 | | | 2009 | | | 2008 | |
| |
Per Share Operating Performance | | | | | | | | | | | | | | | | | | | | | | | | | | | | | | | | | |
| |
Net asset value, beginning of
period | | | $ 10.01 | | | | $ 8.61 | | | | $ 9.02 | | | | $ 7.79 | | | | $ 6.98 | | | | $ 9.03 | | | | $ 9.66 | | | | $ 8.32 | | | | $ 8.72 | | | | $ 7.56 | | | | $ 6.80 | | | | $ 8.83 | |
| | | | | | | | |
Net investment loss1 | | | (0.02 | ) | | | (0.06 | ) | | | (0.06 | ) | | | (0.05 | ) | | | (0.02 | ) | | | (0.05) | | | | (0.03 | ) | | | (0.08 | ) | | | (0.07 | ) | | | (0.08 | ) | | | (0.04 | ) | | | (0.06) | |
Net realized and unrealized
gain (loss) | | | 0.17 | | | | 1.46 | | | | (0.35 | )2 | | | 1.28 | 2 | | | 0.83 | 2 | | | (2.00) | 2 | | | 0.16 | | | | 1.42 | | | | (0.33 | )2 | | | 1.24 | 2 | | | 0.80 | 2 | | | (1.97)2 | |
| | | | | | | | |
Net increase (decrease) from
investment operations | | | 0.15 | | | | 1.40 | | | | (0.41 | ) | | | 1.23 | | | | 0.81 | | | | (2.05) | | | | 0.13 | | | | 1.34 | | | | (0.40 | ) | | | 1.16 | | | | 0.76 | | | | (2.03) | |
| | | | | | | | |
Net asset value, end of period | | | $ 10.16 | | | | $ 10.01 | | | | $ 8.61 | | | | $ 9.02 | | | | $ 7.79 | | | | $ 6.98 | | | | $ 9.79 | | | | $ 9.66 | | | | $ 8.32 | | | | $ 8.72 | | | | $ 7.56 | | | | $ 6.80 | |
| | | | | | | | |
|
| |
Total Investment Return3 | | | | | | | | | | | | | | | | | | | | | | | | | | | | | | | | | |
| |
Based on net asset value | | | 1.50% | 4 | | | 16.26% | | | | (4.55)% | 5 | | | 15.79% | 5,6 | | | 11.60% | 5,7 | | | (22.70)%5 | | | | 1.35% | 4 | | | 16.11% | | | | (4.59)% | 5 | | | 15.34% | 5,8 | | | 11.18% | 5,9 | | | (22.99)%5 | |
| |
Ratios to Average Net Assets | | | | | | | | | | | | | | | | | | | | | | | | | | | | | | | | | |
| |
Total expenses | | | 1.51% | 10 | | | 1.45% | | | | 1.46% | | | | 1.55% | | | | 1.90% | | | | 1.70% | | | | 1.57% | 10 | | | 1.57% | | | | 1.55% | | | | 1.76% | | | | 1.96% | | | | 2.01% | |
| | | | | | | | |
Total expenses excluding
recoupment of past waived
fees | | | 1.51% | 10 | | | 1.44% | | | | 1.46% | | | | 1.55% | | | | 1.90% | | | | 1.70% | | | | 1.57% | 10 | | | 1.56% | | | | 1.54% | | | | 1.67% | | | | 1.96% | | | | 2.01% | |
| | | | | | | | |
Total expenses after fees
waived, reimbursed and
paid indirectly | | | 1.39% | 10 | | | 1.39% | | | | 1.39% | | | | 1.39% | | | | 1.36% | | | | 1.35% | | | | 1.57% | 10 | | | 1.57% | | | | 1.53% | | | | 1.74% | | | | 1.75% | | | | 1.73% | |
| | | | | | | | |
Net investment loss | | | (0.36)% | 10 | | | (0.63)% | | | | (0.60)% | | | | (0.59)% | | | | (0.27)% | | | | (0.55)% | | | | (0.55)% | 10 | | | (0.81)% | | | | (0.74)% | | | | (0.94)% | | | | (0.71)% | | | | (0.75)% | |
| | | | | | | | |
|
| |
Supplemental Data | | | | | | | | | | | | | | | | | | | | | | | | | | | | | | | | | |
| |
Net assets, end of period
(000) | | | $ 30,030 | | | | $ 34,022 | | | | $ 33,982 | | | | $ 33,135 | | | | $ 27,013 | | | | $ 42,886 | | | | $ 842 | | | | $ 944 | | | | $ 851 | | | | $ 659 | | | | $ 193 | | | | $ 106 | |
| | | | | | | | |
Portfolio turnover | | | 29% | | | | 320% | | | | 103% | | | | 97% | | | | 158% | | | | 89% | | | | 29% | | | | 320% | | | | 103% | | | | 97% | | | | 158% | | | | 89% | |
| | | | | | | | |
| | 1 | Based on average shares outstanding. |
| | 2 | Includes redemption fees, which are less than $0.005 per share. |
| | 3 | Where applicable, total investment returns exclude the effects of any sales charges and include the reinvestment of dividends and distributions. |
| | 4 | Aggregate total investment return. |
| | 5 | Redemption fee of 2.00% is reflected in total return calculations. There was no impact to the return. |
| | 6 | Includes proceeds received from a settlement of litigation, which impacted the Fund’s total return. Excluding these proceeds, the Fund’s total return would have been 15.53%. |
| | 7 | Includes proceeds received from a settlement of litigation, which impacted the Fund’s total return. Excluding these proceeds, the Fund’s total return would have been 9.03%. |
| | 8 | Includes proceeds received from a settlement of litigation, which impacted the Fund’s total return. Excluding these proceeds, the Fund’s total return would have been 15.08%. |
| | 9 | Includes proceeds received from a settlement of litigation, which impacted the Fund’s total return. Excluding these proceeds, the Fund’s total return would have been 8.53%. |
See Notes to Financial Statements.
| | | | | | |
| | | | | MARCH 31, 2013 | | |
| | BLACKROCK FUNDS | | | 55 |
| | |
| Financial Highlights (continued) | | BlackRock Science & Technology Opportunities Portfolio |
| | | | | | | | | | | | | | | | | | | | | | | | | | | | | | | | | | | | | | | | | | | | | | | | |
| | | Investor A | | | Investor B | |
| |
| Six Months
Ended March 31, 2013 |
| | | Year Ended September 30, | | |
| Six Months
Ended March 31, 2013 |
| | | Year Ended September 30, | |
| | | (Unaudited) | | | 2012 | | | 2011 | | | 2010 | | | 2009 | | | 2008 | | | (Unaudited) | | | 2012 | | | 2011 | | | 2010 | | | 2009 | | | 2008 | |
| |
Per Share Operating Performance | | | | | | | | | | | | | | | | | | | | | | | | | | | | | | | | | |
| |
Net asset value, beginning of
period | | | $ 9.51 | | | | $ 8.21 | | | | $ 8.62 | | | | $ 7.48 | | | | $ 6.73 | | | | $ 8.74 | | | | $ 8.60 | | | | $ 7.48 | | | | $ 7.93 | | | | $ 6.94 | | | | $ 6.30 | | | | $ 8.26 | |
| | | | | | | | |
Net investment loss1 | | | (0.03 | ) | | | (0.09 | ) | | | (0.09 | ) | | | (0.08 | ) | | | (0.04 | ) | | | (0.06) | | | | (0.06 | ) | | | (0.15 | ) | | | (0.16 | ) | | | (0.14 | ) | | | (0.08 | ) | | | (0.13) | |
Net realized and unrealized
gain (loss) | | | 0.15 | | | | 1.39 | | | | (0.32 | )2 | | | 1.22 | 2 | | | 0.79 | 2 | | | (1.95) | 2 | | | 0.14 | | | | 1.27 | | | | (0.29 | )2 | | | 1.13 | 2 | | | 0.72 | 2 | | | (1.83)2 | |
| | | | | | | | |
Net increase (decrease) from
investment operations | | | 0.12 | | | | 1.30 | | | | (0.41 | ) | | | 1.14 | | | | 0.75 | | | | (2.01) | | | | 0.08 | | | | 1.12 | | | | (0.45 | ) | | | 0.99 | | | | 0.64 | | | | (1.96) | |
| | | | | | | | |
Net asset value, end of period | | | $ 9.63 | | | | $ 9.51 | | | | $ 8.21 | | | | $ 8.62 | | | | $ 7.48 | | | | $ 6.73 | | | | $ 8.68 | | | | $ 8.60 | | | | $ 7.48 | | | | $ 7.93 | | | | $ 6.94 | | | | $ 6.30 | |
| | | | | | | | |
|
| |
Total Investment Return3 | | | | | | | | | | | | | | | | | | | | | | | | | | | | | | | | | |
| |
Based on net asset value | | | 1.26% | 4 | | | 15.84% | | | | (4.76)% | 5 | | | 15.24% | 5,6 | | | 11.14% | 5,7 | | | (23.00)%5 | | | | 0.93% | 4 | | | 14.97% | | | | (5.68)% | 5 | | | 14.27% | 5,8 | | | 10.16% | 5,9 | | | (23.73)%5 | |
| | | | | | | | |
|
| |
Ratios to Average Net Assets | | | | | | | | | | | | | | | | | | | | | | | | | | | | | | | | | |
| |
Total expenses | | | 1.75% | 10 | | | 1.72% | | | | 1.79% | | | | 1.82% | | | | 2.24% | | | | 2.04% | | | | 2.54% | 10 | | | 2.52% | | | | 2.67% | | | | 2.70% | | | | 3.13% | | | | 2.96% | |
| | | | | | | | |
Total expenses excluding
recoupment of past waived
fees | | | 1.74% | 10 | | | 1.70% | | | | 1.71% | | | | 1.81% | | | | 2.24% | | | | 2.04% | | | | 2.54% | 10 | | | 2.52% | | | | 2.44% | | | | 2.65% | | | | 3.00% | | | | 2.96% | |
| | | | | | | | |
Total expenses after fees
waived, reimbursed and
paid indirectly | | | 1.75% | 10 | | | 1.71% | | | | 1.78% | | | | 1.79% | | | | 1.77% | | | | 1.75% | | | | 2.54% | 10 | | | 2.52% | | | | 2.66% | | | | 2.69% | | | | 2.65% | | | | 2.65% | |
| | | | | | | | |
Net investment loss | | | (0.69)% | 10 | | | (0.95)% | | | | (0.98)% | | | | (0.99)% | | | | (0.68)% | | | | (0.77)% | | | | (1.50)% | 10 | | | (1.76)% | | | | (1.87)% | | | | (1.90)% | | | | (1.53)% | | | | (1.70)% | |
| | | | | | | | |
|
| |
Supplemental Data | | | | | | | | | | | | | | | | | | | | | | | | | | | | | | | | | |
| |
Net assets, end of period
(000) | | | $ 87,361 | | | | $106,466 | | | | $106,632 | | | | $105,577 | | | | $ 83,734 | | | | $ 72,659 | | | | $ 2,218 | | | | $ 2,645 | | | | $ 3,130 | | | | $ 4,390 | | | | $ 6,538 | | | | $ 11,473 | |
| | | | | | | | |
Portfolio turnover | | | 29% | | | | 320% | | | | 103% | | | | 97% | | | | 158% | | | | 89% | | | | 29% | | | | 320% | | | | 103% | | | | 97% | | | | 158% | | | | 89% | |
| | | | | | | | |
| | 1 | Based on average shares outstanding. |
| | 2 | Includes redemption fees, which are less than $0.005 per share. |
| | 3 | Where applicable, total investment returns exclude the effects of any sales charges and include the reinvestment of dividends and distributions. |
| | 4 | Aggregate total investment return. |
| | 5 | Redemption fee of 2.00% is reflected in total return calculations. There was no impact to the return. |
| | 6 | Includes proceeds received from a settlement of litigation, which impacted the Fund’s total return. Excluding these proceeds, the Fund’s total return would have been 14.97%. |
| | 7 | Includes proceeds received from a settlement of litigation, which impacted the Fund’s total return. Excluding these proceeds, the Fund’s total return would have been 8.47%. |
| | 8 | Includes proceeds received from a settlement of litigation, which impacted the Fund’s total return. Excluding these proceeds, the Fund’s total return would have been 13.98%. |
| | 9 | Includes proceeds received from a settlement of litigation, which impacted the Fund’s total return. Excluding these proceeds, the Fund’s total return would have been 7.30%. |
See Notes to Financial Statements.
| | | | |
| | | | | |
| 56 | | BLACKROCK FUNDS | | MARCH 31, 2013 |
| | |
| Financial Highlights (concluded) | | BlackRock Science & Technology Opportunities Portfolio |
| | | | | | | | | | | | | | | | | | | | | | | | | | | | | | | | | | | | | | | | | | | | | | | | |
| | | Investor C | | | Class R | |
| | | Six Months
Ended
March 31, | | | | | | Six Months
Ended
March 31, | | | | | | Period | |
| | | 2013 | | | Year Ended September 30, | | | 2013 | | | Year Ended September 30, | | | September 8, 20081 to | |
| | | (Unaudited) | | | 2012 | | | 2011 | | | 2010 | | | 2009 | | | 2008 | | | (Unaudited) | | | 2012 | | | 2011 | | | 2010 | | | 2009 | | | September 30, 2008 | |
| |
Per Share Operating Performance | | | | | | | | | | | | | | | | | | | | | | | | | | | | | | | | | |
| |
Net asset value, beginning of period | | | $ 8.58 | | | | $ 7.47 | | | | $ 7.92 | | | | $ 6.94 | | | | $ 6.29 | | | | $ 8.25 | | | | $ 9.74 | | | | $ 8.43 | | | | $ 8.88 | | | | $ 7.72 | | | | $ 6.97 | | | | $ 7.38 | |
| | | | | | | | |
Net investment loss2 | | | (0.07 | ) | | | (0.15 | ) | | | (0.16 | ) | | | (0.14 | ) | | | (0.09 | ) | | | (0.13) | | | | (0.05 | ) | | | (0.12 | ) | | | (0.12 | ) | | | (0.11 | ) | | | (0.06 | ) | | | (0.01) | |
Net realized and unrealized gain (loss) | | | 0.15 | | | | 1.26 | | | | (0.29 | )3 | | | 1.12 | 3 | | | 0.74 | 3 | | | (1.83) | 3 | | | 0.16 | | | | 1.43 | | | | (0.33 | )3 | | | 1.27 | 3 | | | 0.81 | 3 | | | (0.40)3 | |
| | | | | | | | |
Net increase (decrease) from investment operations | | | 0.08 | | | | 1.11 | | | | (0.45 | ) | | | 0.98 | | | | 0.65 | | | | (1.96) | | | | 0.11 | | | | 1.31 | | | | (0.45 | ) | | | 1.16 | | | | 0.75 | | | | (0.41) | |
| | | | | | | | |
Net asset value, end of period | | | $ 8.66 | | | | $ 8.58 | | | | $ 7.47 | | | | $ 7.92 | | | | $ 6.94 | | | | $ 6.29 | | | | $ 9.85 | | | | $ 9.74 | | | | $ 8.43 | | | | $ 8.88 | | | | $ 7.72 | | | | $ 6.97 | |
| | | | | | | | |
|
| |
Total Investment Return4 | | | | | | | | | | | | | | | | | | | | | | | | | | | | | | | | | |
| |
Based on net asset value | | | 0.93% | 5 | | | 14.86% | | | | (5.68 | )%6 | | | 14.12% | 6,7 | | | 10.33% | 6,8 | | | (23.76)% | 6 | | | 1.13% | 5 | | | 15.54% | | | | (5.07 | )%6 | | | 15.03% | 6,9 | | | 10.76% | 6,10 | | | (5.56)%5,6 | |
| | | | | | | | |
|
| |
Ratios to Average Net Assets | | | | | | | | | | | | | | | | | | | | | | | | | | | | | | | | | |
| |
Total expenses | | | 2.63% | 11 | | | 2.60% | | | | 2.68% | | | | 2.73% | | | | 3.23% | | | | 2.73% | | | | 1.98% | 11 | | | 2.00% | | | | 2.00% | | | | 2.10% | | | | 2.42% | | | | 2.36%11 | |
| | | | | | | | |
Total expenses excluding recoupment of past waived fees | | | 2.62% | 11 | | | 2.59% | | | | 2.59% | | | | 2.73% | | | | 3.23% | | | | 2.73% | | | | 1.98% | 11 | | | 1.99% | | | | 2.00% | | | | 2.10% | | | | 2.42% | | | | 2.36%11 | |
| | | | | | | | |
Total expenses after fees waived, reimbursed and paid indirectly | | | 2.63% | 11 | | | 2.60% | | | | 2.67% | | | | 2.71% | | | | 2.68% | | | | 2.62% | | | | 1.98% | 11 | | | 1.99% | | | | 2.00% | | | | 2.09% | | | | 2.13% | | | | 2.13%11 | |
| | | | | | | | |
Net investment loss | | | (1.61)% | 11 | | | (1.84)% | | | | (1.88)% | | | | (1.92)% | | | | (1.59)% | | | | (1.67)% | | | | (0.95)% | 11 | | | (1.23)% | | | | (1.21)% | | | | (1.29)% | | | | (1.04)% | | | | (1.49)%11 | |
| | | | | | | | |
|
| |
Supplemental Data | | | | | | | | | | | | | | | | | | | | | | | | | | | | | | | | | |
| |
Net assets, end of period (000) | | | $ 25,475 | | | | $ 26,543 | | | | $ 27,651 | | | | $ 27,053 | | | | $ 22,575 | | | | $ 22,003 | | | | $ 4,156 | | | | $ 4,329 | | | | $ 3,518 | | | | $ 2,961 | | | | $ 1,904 | | | | $ 1,362 | |
| | | | | | | | |
Portfolio turnover | | | 29% | | | | 320% | | | | 103% | | | | 97% | | | | 158% | | | | 89% | | | | 29% | | | | 320% | | | | 103% | | | | 97% | | | | 158% | | | | 89% | |
| | | | | | | | |
| | 1 | Commencement of operations. |
| | 2 | Based on average shares outstanding. |
| | 3 | Includes redemption fees, which are less than $0.005 per share. |
| | 4 | Where applicable, total investment returns exclude the effects of any sales charges and include the reinvestment of dividends and distributions. |
| | 5 | Aggregate total investment return. |
| | 6 | Redemption fee of 2.00% is reflected in total return calculations. There was no impact to the return. |
| | 7 | Includes proceeds received from a settlement of litigation, which impacted the Fund’s total return. Excluding these proceeds, the Fund’s total return would have been 13.83%. |
| | 8 | Includes proceeds received from a settlement of litigation, which impacted the Fund’s total return. Excluding these proceeds, the Fund’s total return would have been 7.47%. |
| | 9 | Includes proceeds received from a settlement of litigation, which impacted the Fund’s total return. Excluding these proceeds, the Fund’s total return would have been 14.77%. |
| | 10 | Includes proceeds received from a settlement of litigation, which impacted the Fund’s total return. Excluding these proceeds, the Fund’s total return would have been 8.18%. |
See Notes to Financial Statements.
| | | | | | |
| | | | | MARCH 31, 2013 | | |
| | BLACKROCK FUNDS | | | 57 |
| | |
| Financial Highlights | | BlackRock U.S. Opportunities Portfolio |
| | | | | | | | | | | | | | | | | | | | | | | | | | | | | | | | | | | | | | | | | | | | | | | | |
| | | Institutional | | | Service | |
| | | Six Months Ended March 31, 2013 | | | Year Ended September 30, | | | Six Months Ended March 31, 2013 | | | Year Ended September 30, | |
| | | (Unaudited) | | | 2012 | | | 2011 | | | 2010 | | | 2009 | | | 2008 | | | (Unaudited) | | | 2012 | | | 2011 | | | 2010 | | | 2009 | | | 2008 | |
| |
Per Share Operating Performance | | | | | | | | | | | | | | | | | | | | | | | | | | | | | | | | | |
| |
Net asset value, beginning of
period | | | $ 36.42 | | | | $ 33.86 | | | | $ 36.94 | | | | $ 32.20 | | | | $ 31.69 | | | | $ 37.05 | | | | $ 34.71 | | | | $ 32.44 | | | | $ 35.40 | | | | $ 30.93 | | | | $ 30.58 | | | | $ 35.89 | |
| | | | | | | | |
Net investment income
(loss)1 | | | 0.09 | | | | 0.19 | | | | 0.05 | | | | 0.04 | | | | 0.09 | | | | 0.09 | | | | (0.02 | ) | | | 0.02 | | | | (0.12 | ) | | | (0.11 | ) | | | (0.01 | ) | | | (0.06) | |
Net realized and unrealized
gain (loss) | | | 5.15 | | | | 6.31 | | | | (2.44 | )2 | | | 4.77 | 2 | | | 0.42 | 2 | | | (5.45) | 2 | | | 4.94 | | | | (6.03 | ) | | | (2.34 | )2 | | | 4.58 | 2 | | | 0.35 | 2 | | | (5.25)2 | |
| | | | | | | | |
Net increase (decrease) from
investment operations | | | 5.24 | | | | 6.50 | | | | (2.39 | ) | | | 4.81 | | | | 0.51 | | | | (5.36) | | | | 4.92 | | | | 6.05 | | | | (2.46 | ) | | | 4.47 | | | | 0.34 | | | | (5.31) | |
| | | | | | | | |
Dividends and distributions from: | | | | | | | | | | | | | | | | | | | | | | | | | | | | | | | | | | | | | | | | | | | | | | | | |
Net investment income | | | (0.33 | ) | | | – | | | | – | | | | (0.07 | )3 | | | (0.01 | )3 | | | – | | | | (0.09 | ) | | | – | | | | – | | | | – | | | | – | | | | – | |
Net realized gains | | | (0.79 | ) | | | (3.94 | )3 | | | (0.69 | )3 | | | – | | | | – | | | | – | | | | (0.79 | ) | | | (3.78 | )3 | | | (0.50 | )3 | | | – | | | | – | | | | – | |
| | | | | | | | |
Total dividends and
distributions | | | (1.12 | ) | | | (3.94 | ) | | | (0.69 | ) | | | (0.07 | ) | | | (0.01 | ) | | | – | | | | (0.88 | ) | | | (3.78 | ) | | | (0.50 | ) | | | – | | | | – | | | | – | |
| | | | | | | | |
Redemption fees added to
paid-in capital | | | – | | | | – | | | | 0.00 | 4 | | | 0.00 | 4 | | | 0.01 | | | | 0.004 | | | | – | | | | – | | | | 0.00 | 4 | | | 0.00 | 4 | | | 0.01 | | | | 0.004 | |
| | | | | | | | |
Net asset value, end of period | | | $ 40.54 | | | | $ 36.42 | | | | $ 33.86 | | | | $ 36.94 | | | | $ 32.20 | | | | $ 31.69 | | | | $ 38.75 | | | | $ 34.71 | | | | $ 32.44 | | | | $ 35.40 | | | | $ 30.93 | | | | $ 30.58 | |
| | | | | | | | |
|
| |
Total Investment Return5 | | | | | | | | | | | | | | | | | | | | | | | | | | | | | | | | | |
| |
Based on net asset value | | | 14.84% | 6 | | | 20.40% | | | | (6.75)% | 7 | | | 14.96% | 7,8 | | | 1.63% | 9 | | | (14.47)%7 | | | | 14.56% | 6 | | | 19.80% | | | | (7.16)% | 7 | | | 14.45% | 7,8 | | | 1.14%9 | | | | (14.80)%7 | |
| | | | | | | | |
|
| |
Ratios to Average Net Assets | | | | | | | | | | | | | | | | | | | | | | | | | | | | | | | | | |
| |
Total expenses | | | 1.38% | 10 | | | 1.30% | | | | 1.36% | | | | 1.30% | | | | 1.40% | | | | 1.42% | | | | 1.67% | 10 | | | 1.62% | | | | 1.57% | | | | 1.60% | | | | 1.71% | | | | 1.68% | |
| | | | | | | | |
Total expenses excluding
recoupment of past waived
fees | | | 1.38% | 10 | | | 1.30% | | | | 1.36% | | | | 1.30% | | | | 1.40% | | | | 1.42% | | | | 1.67% | 10 | | | 1.62% | | | | 1.57% | | | | 1.60% | | | | 1.70% | | | | 1.68% | |
| | | | | | | | |
Total expenses after fees
waived, reimbursed and
paid indirectly | | | 1.03% | 10 | | | 1.03% | | | | 1.03% | | | | 1.03% | | | | 1.01% | | | | 1.00% | | | | 1.54% | 10 | | | 1.51% | | | | 1.46% | | | | 1.48% | | | | 1.49% | | | | 1.43% | |
| | | | | | | | |
Net investment income (loss) | | | 0.48% | 10 | | | 0.52% | | | | 0.12% | | | | 0.13% | | | | 0.36% | | | | 0.26% | | | | (0.09)% | 10 | | | 0.05% | | | | (0.30)% | | | | (0.34)% | | | | (0.06)% | | | | (0.17)% | |
| | | | | | | | |
|
| |
Supplemental Data | | | | | | | | | | | | | | | | | | | | | | | | | | | | | | | | | |
| |
Net assets, end of period
(000) | | | $1,087,723 | | | | $1,294,928 | | | | $1,905,254 | | | | $1,588,509 | | | | $890,264 | | | | $298,166 | | | | $161,265 | | | | $159,939 | | | | $183,604 | | | | $235,926 | | | | $191,318 | | | | $ 109,679 | |
| | | | | | | | |
Portfolio turnover | | | 45% | | | | 106% | | | | 120% | | | | 123% | | | | 166% | | | | 164% | | | | 45% | | | | 106% | | | | 120% | | | | 123% | | | | 166% | | | | 164% | |
| | | | | | | | |
| | 1 | Based on average shares outstanding. |
| | 2 | Includes redemption fees, which are less than $0.005 per share. |
| | 3 | Dividends and distributions are determined in accordance with federal income tax regulations. |
| | 4 | Amount is less than $0.005 per share. |
| | 5 | Where applicable, total investment returns exclude the effects of any sales charges and include the reinvestment of dividends and distributions. |
| | 6 | Aggregate total investment return. |
| | 7 | Redemption fee of 2.00% is reflected in total return calculations. There was no impact to the return. |
| | 8 | Includes proceeds received from a settlement of litigation, which had no impact on the Fund’s total return. |
| | 9 | Redemption fee of 2.00% is reflected in total return calculations. The impact to the return from redemption fees received during the period was an increase of 0.03%. |
See Notes to Financial Statements.
| | | | |
| | | | | |
| 58 | | BLACKROCK FUNDS | | MARCH 31, 2013 |
| | |
| Financial Highlights (continued) | | BlackRock U.S. Opportunities Portfolio |
| | | | | | | | | | | | | | | | | | | | | | | | | | | | | | | | | | | | | | | | | | | | | | | | |
| | | Investor A | | | Investor B | |
| | | Six Months Ended March 31, 2013 | | | Year Ended September 30, | | | Six Months Ended March 31, 2013 | | | Year Ended September 30, | |
| | | (Unaudited) | | | 2012 | | | 2011 | | | 2010 | | | 2009 | | | 2008 | | | (Unaudited) | | | 2012 | | | 2011 | | | 2010 | | | 2009 | | | 2008 | |
| |
Per Share Operating Performance | | | | | | | | | | | | | | | | | | | | | | | | | | | | | | | | | |
| |
Net asset value, beginning of
period | | | $ 34.30 | | | | $ 32.08 | | | | $ 35.02 | | | | $ 30.61 | | | | $ 30.29 | | | | $ 35.57 | | | | $ 30.72 | | | | $ 29.11 | | | | $ 31.96 | | | | $ 28.16 | | | | $ 28.06 | | | | $ 33.20 | |
| | | | | | | | |
Net investment income
(loss)1 | | | (0.01 | ) | | | 0.01 | | | | (0.13 | ) | | | (0.12 | ) | | | (0.04 | ) | | | (0.08) | | | | (0.14 | ) | | | (0.23 | ) | | | (0.40 | ) | | | (0.35 | ) | | | (0.17 | ) | | | (0.31) | |
Net realized and unrealized
gain (loss) | | | 4.88 | | | | 5.97 | | | | (2.31 | )2 | | | 4.53 | 2 | | | 0.35 | 2 | | | (5.20) | 2 | | | 4.36 | | | | 5.39 | | | | (2.06 | )2 | | | 4.15 | 2 | | | 0.26 | 2 | | | (4.83)2 | |
| | | | | | | | |
Net increase (decrease) from
investment operations | | | 4.87 | | | | 5.98 | | | | (2.44 | ) | | | 4.41 | | | | 0.31 | | | | (5.28) | | | | 4.22 | | | | 5.16 | | | | (2.46 | ) | | | 3.80 | | | | 0.09 | | | | (5.14) | |
| | | | | | | | |
Dividends and distributions from: | | | | | | | | | | | | | | | | | | | | | | | | | | | | | | | | | | | | | | | | | | | | | | | | |
Net investment income | | | (0.05 | ) | | | – | | | | – | | | | – | | | | – | | | | – | | | | – | | | | – | | | | – | | | | – | | | | – | | | | – | |
Net realized gains | | | (0.79 | ) | | | (3.76 | )3 | | | (0.50 | )3 | | | – | | | | – | | | | – | | | | (0.77 | ) | | | (3.55 | )3 | | | (0.39 | )3 | | | – | | | | – | | | | – | |
| | | | | | | | |
Total dividends and
distributions | | | (0.84 | ) | | | (3.76 | ) | | | (0.50 | ) | | | – | | | | – | | | | – | | | | (0.77 | ) | | | (3.55 | ) | | | (0.39 | ) | | | – | | | | – | | | | – | |
| | | | | | | | |
Redemption fees added to
paid-in capital | | | – | | | | – | | | | 0.00 | 4 | | | 0.00 | 4 | | | 0.01 | | | | 0.004 | | | | – | | | | – | | | | 0.00 | 4 | | | 0.00 | 4 | | | 0.01 | | | | 0.004 | |
| | | | | | | | |
Net asset value, end of period | | | $ 38.33 | | | | $ 34.30 | | | | $ 32.08 | | | | $ 35.02 | | | | $ 30.61 | | | | $ 30.29 | | | | $ 34.17 | | | | $ 30.72 | | | | $ 29.11 | | | | $ 31.96 | | | | $ 28.16 | | | | $ 28.06 | |
| | | | | | | | |
|
| |
Total Investment Return5 | | | | | | | | | | | | | | | | | | | | | | | | | | | | | | | | | |
| |
Based on net asset value | | | 14.55% | 6 | | | 19.82% | | | | (7.19)% | 7 | | | 14.41% | 7,8 | | | 1.06% | 9 | | | (14.84)%7 | | | | 14.10% | 6 | | | 18.87% | | | | (7.90)% | 7 | | | 13.49% | 7,8 | | | 0.36% | 9 | | | (15.48)%7 | |
| | | | | | | | |
|
| |
Ratios to Average Net Assets | | | | | | | | | | | | | | | | | | | | | | | | | | | | | | | | | |
| |
Total expenses | | | 1.68% | 10 | | | 1.62% | | | | 1.59% | | | | 1.64% | | | | 1.76% | | | | 1.73% | | | | 2.47% | 10 | | | 2.42% | | | | 2.39% | | | | 2.44% | | | | 2.59% | | | | 2.56% | |
| | | | | | | | |
Total expenses excluding
recoupment of past waived
fees | | | 1.68% | 10 | | | 1.62% | | | | 1.59% | | | | 1.64% | | | | 1.75% | | | | 1.73% | | | | 2.46% | 10 | | | 2.42% | | | | 2.37% | | | | 2.44% | | | | 2.59% | | | | 2.56% | |
| | | | | | | | |
Total expenses after fees
waived, reimbursed and
paid indirectly | | | 1.55% | 10 | | | 1.51% | | | | 1.49% | | | | 1.51% | | | | 1.56% | | | | 1.48% | | | | 2.32% | 10 | | | 2.30% | | | | 2.28% | | | | 2.30% | | | | 2.27% | | | | 2.22% | |
| | | | | | | | |
Net investment income (loss) | | | (0.08)% | 10 | | | 0.03% | | | | (0.34)% | | | | (0.37)% | | | | (0.15)% | | | | (0.22)% | | | | (0.87)% | 10 | | | (0.74)% | | | | (1.12)% | | | | (1.18)% | | | | (0.77)% | | | | (0.95)% | |
| | | | | | | | |
|
| |
Supplemental Data | | | | | | | | | | | | | | | | | | | | | | | | | | | | | | | | | |
| |
Net assets, end of period
(000) | | | $548,644 | | | | $610,343 | | | | $888,293 | | | | $1,158,626 | | | | $855,127 | | | | $ 495,656 | | | | $ 12,931 | | | | $ 12,833 | | | | $ 15,047 | | | | $ 20,255 | | | | $ 21,849 | | | | $ 20,998 | |
| | | | | | | | |
Portfolio turnover | | | 45% | | | | 106% | | | | 120% | | | | 123% | | | | 166% | | | | 164% | | | | 45% | | | | 106% | | | | 120% | | | | 123% | | | | 166% | | | | 164% | |
| | | | | | | | |
| | 1 | Based on average shares outstanding. |
| | 2 | Includes redemption fees, which are less than $0.005 per share. |
| | 3 | Distributions are determined in accordance with federal income tax regulations. |
| | 4 | Amount is less than $0.005 per share. |
| | 5 | Where applicable, total investment returns exclude the effects of any sales charges and include the reinvestment of dividends and distributions. |
| | 6 | Aggregate total investment return. |
| | 7 | Redemption fee of 2.00% is reflected in total return calculations. There was no impact to the return. |
| | 8 | Includes proceeds received from a settlement of litigation, which had no impact on the Fund’s total return. |
| | 9 | Redemption fee of 2.00% is reflected in total return calculations. The impact to the return from redemption fees received during the period was an increase of 0.04%. |
See Notes to Financial Statements.
| | | | | | |
| | | | | MARCH 31, 2013 | | |
| | BLACKROCK FUNDS | | | 59 |
| | |
| Financial Highlights (concluded) | | BlackRock U.S. Opportunities Portfolio |
| | | | | | | | | | | | | | | | | | | | | | | | |
| | | Investor C | |
| | | Six Months | | | | | | | | | | | | | | | | |
| | | Ended | | | | | | | | | | | | | | | | |
| | | March 31, | | | | | | | | | | | | | | | | |
| | | 2013 | | | Year Ended September 30, | |
| | | (Unaudited) | | | 2012 | | | 2011 | | | 2010 | | | 2009 | | | 2008 | |
| |
Per Share Operating Performance | | | | | | | | | | | | | | | | | | | | | | | | |
| |
Net asset value, beginning of period | | | $ 30.75 | | | | $ 29.11 | | | | $ 31.95 | | | | $ 28.14 | | | | $ 28.04 | | | | $ 33.18 | |
| | | | |
Net investment loss1 | | | (0.13) | | | | (0.21) | | | | (0.38) | | | | (0.33) | | | | (0.19) | | | | (0.30) | |
Net realized and unrealized gain (loss) | | | 4.36 | | | | 5.39 | | | | (2.07)2 | | | | 4.142 | | | | 0.282 | | | | (4.84)2 | |
| | | | |
Net increase (decrease) from investment operations | | | 4.23 | | | | 5.18 | | | | (2.45) | | | | 3.81 | | | | 0.09 | | | | (5.14) | |
| | | | |
Distributions from net realized gains | | | (0.77) | | | | (3.54) | 3 | | | (0.39)3 | | | | – | | | | – | | | | – | |
| | | | |
Redemption fees added to paid-in capital | | | – | | | | – | | | | 0.004 | | | | 0.004 | | | | 0.01 | | | | 0.004 | |
| | | | |
Net asset value, end of period | | | $ 34.21 | | | | $ 30.75 | | | | $ 29.11 | | | | $ 31.95 | | | | $ 28.14 | | | | $ 28.04 | |
| | | | |
|
| |
Total Investment Return5 | | | | | | | | | | | | | | | | | | | | | | | | |
| |
Based on net asset value | | | 14.11%6 | | | | 18.94% | | | | (7.87)%7 | | | | 13.54%7,8 | | | | 0.36%9 | | | | (15.49)%7 | |
| | | | |
|
| |
Ratios to Average Net Assets | | | | | | | | | | | | | | | | | | | | | | | | |
| |
Total expenses | | | 2.41%10 | | | | 2.35% | | | | 2.34% | | | | 2.39% | | | | 2.52% | | | | 2.46% | |
| | | | |
Total expenses excluding recoupment of past waived fees | | | 2.41%10 | | | | 2.35% | | | | 2.33% | | | | 2.38% | | | | 2.52% | | | | 2.46% | |
| | | | |
Total expenses after fees waived, reimbursed and paid indirectly | | | 2.27%10 | | | | 2.25% | | | | 2.24% | | | | 2.27% | | | | 2.28% | | | | 2.21% | |
| | | | |
Net investment loss | | | (0.80)%10 | | | | (0.69)% | | | | (1.08)% | | | | (1.12)% | | | | (0.85)% | | | | (0.95)% | |
| | | | |
|
| |
Supplemental Data | | | | | | | | | | | | | | | | | | | | | | | | |
| |
Net assets, end of period (000) | | | $205,908 | | | | $226,350 | | | | $282,586 | | | | $334,958 | | | | $238,819 | | | | $145,626 | |
| | | | |
Portfolio turnover | | | 45% | | | | 106% | | | | 120% | | | | 123% | | | | 166% | | | | 164% | |
| | | | |
| | 1 | Based on average shares outstanding. |
| | 2 | Includes redemption fees, which are less than $0.005 per share. |
| | 3 | Distributions are determined in accordance with federal income tax regulations. |
| | 4 | Amount is less than $0.005 per share. |
| | 5 | Where applicable, total investment returns exclude the effects of any sales charges and include the reinvestment of dividends and distributions. |
| | 6 | Aggregate total investment return. |
| | 7 | Redemption fee of 2.00% is reflected in total return calculations. There was no impact to the return. |
| | 8 | Includes proceeds received from a settlement of litigation, which had no impact on the Fund’s total return. |
| | 9 | Redemption fee of 2.00% is reflected in total return calculations. The impact to the return from redemption fees received during the period was an increase of 0.04%. |
See Notes to Financial Statements.
| | | | |
| | | | | |
| 60 | | BLACKROCK FUNDS | | MARCH 31, 2013 |
Notes to Financial Statements (Unaudited)
1. Organization and Significant Accounting Policies:
BlackRock FundsSM (the “Trust”) is registered under the Investment Company Act of 1940, as amended (the “1940 Act”), as an open-end management investment company. The Trust is organized as a Massachusetts business trust. BlackRock Global Opportunities Portfolio (“Global Opportunities”), BlackRock Health Sciences Opportunities Portfolio (“Health Sciences Opportunities”), BlackRock International Opportunities Portfolio (“International Opportunities”), BlackRock Science & Technology Opportunities Portfolio (“Science & Technology Opportunities”) and BlackRock U.S. Opportunities Portfolio (“U.S. Opportunities”) (collectively, the “Funds” or individually, a “Fund”) are each a series of the Trust. Each of the Funds, except Health Sciences Opportunities, is classified as diversified. The Funds’ financial statements are prepared in conformity with accounting principles generally accepted in the United States of America (“US GAAP”), which may require management to make estimates and assumptions that affect the reported amounts of assets and liabilities in the financial statements and the reported amounts of increases and decreases in net assets from operations during the reporting period. Actual results could differ from those estimates. Each Fund offers multiple classes of shares. Institutional Shares are sold without a sales charge and only to certain eligible investors. Service Shares are sold without a sales charge. Investor A Shares are generally sold with a front-end sales charge. Investor B and Investor C Shares may be subject to a CDSC. Class R Shares are sold without a sales charge and only to certain employer-sponsored retirement plans. All classes of shares have identical voting, dividend, liquidation and other rights and the same terms and conditions, except that Service, Investor A, Investor B, Investor C and Class R Shares bear certain expenses related to the shareholder servicing of such shares, and Investor B, Investor C and Class R Shares also bear certain expenses related to the distribution of such shares. Investor B Shares automatically convert to Investor A Shares after approximately eight years. Investor B Shares are only available through exchanges and dividend reinvestments by existing shareholders and for purchase by certain employer-sponsored retirement plans. Each class has exclusive voting rights with respect to matters relating to its shareholder servicing and distribution expenditures (except that Investor B shareholders may vote on material changes to the Investor A distribution and service plan).
The following is a summary of significant accounting policies followed by the Funds:
Valuation: US GAAP defines fair value as the price the Funds would receive to sell an asset or pay to transfer a liability in an orderly transaction between market participants at the measurement date. The Funds determine the fair values of their financial instruments at market value using independent dealers or pricing services under policies approved by the Board of Trustees of the Trust (the “Board”). The BlackRock Global Valuation Methodologies Committee (the “Global Valuation Committee”) is the committee formed by management to develop global pricing policies and procedures and to provide oversight of the pricing function for the Funds for all financial instruments.
Equity investments traded on a recognized securities exchange or the NASDAQ Global Market System (“NASDAQ”) are valued at the last reported sale price that day or the NASDAQ official closing price, if
applicable. For equity investments traded on more than one exchange, the last reported sale price on the exchange where the stock is primarily traded is used. Equity investments traded on a recognized exchange for which there were no sales on that day are valued at the last available bid price. If no bid price is available, the prior day’s price will be used, unless it is determined that such prior day’s price no longer reflects the fair value of the security. Financial futures contracts traded on exchanges are valued at their last sale price. Investments in open-end registered investment companies are valued at NAV each business day.
The Funds value their investments in BlackRock Liquidity Series, LLC Money Market Series (the “Money Market Series”) at fair value, which is ordinarily based upon their pro rata ownership in the underlying fund’s net assets. The Money Market Series seeks current income consistent with maintaining liquidity and preserving capital. Although the Money Market Series is not registered under the 1940 Act, its investments will follow the parameters of investments by a money market fund that is subject to Rule 2a-7 under the 1940 Act. Each Fund may withdraw up to 25% of its investment daily, although the manager of the Money Market Series, in its sole discretion, may permit an investor to withdraw more than 25% on any one day.
Securities and other assets and liabilities denominated in foreign currencies are translated into US dollars using exchange rates determined as of the close of business on the New York Stock Exchange (“NYSE”). Foreign currency exchange contracts are valued at the mean between the bid and ask prices and are determined as of the close of business on the NYSE. Interpolated values are derived when the settlement date of the contract is an interim date for which quotations are not available.
Exchange-traded options are valued at the mean between the last bid and ask prices at the close of the options market in which the options trade. An exchange-traded option for which there is no mean price is valued at the last bid (long positions) or ask (short positions) price. If no bid or ask price is available, the prior day’s price will be used, unless it is determined that the prior day’s price no longer reflects the fair value of the option. Over-the-counter (“OTC”) options are valued by an independent pricing service using a mathematical model, which incorporates a number of market data factors, such as the trades and prices of the underlying instruments.
In the event that application of these methods of valuation results in a price for an investment that is deemed not to be representative of the market value of such investment, or if a price is not available, the investment will be valued by the Global Valuation Committee, or its delegate, in accordance with a policy approved by the Board as reflecting fair value (“Fair Value Assets”). When determining the price for Fair Value Assets, the Global Valuation Committee, or its delegate, seeks to determine the price that each Fund might reasonably expect to receive from the current sale of that asset in an arm’s-length transaction. Fair value determinations shall be based upon all available factors that the Global Valuation Committee, or its delegate, deem relevant consistent with the principles of fair value measurement which include the market approach, income approach and/or in the case of recent investments, the cost approach, as appropriate. A market approach generally consists of using comparable market transactions. The income approach generally is used
| | | | | | |
| | | | | MARCH 31, 2013 | | |
| | BLACKROCK FUNDS | | | 61 |
Notes to Financial Statements (continued)
to discount future cash flows to present value and adjusted for liquidity as appropriate. These factors include but are not limited to: (i) attributes specific to the investment or asset; (ii) the principal market for the investment or asset; (iii) the customary participants in the principal market for the investment or asset; (iv) data assumptions by market participants for the investment or asset, if reasonably available; (v) quoted prices for similar investments or assets in active markets; and (vi) other factors, such as future cash flows, interest rates, yield curves, volatilities, prepayment speeds, loss severities, credit risks, recovery rates, liquidation amounts and/or default rates. Due to the inherent uncertainty of valuations of such investments, the fair values may differ from the values that would have been used had an active market existed. The Global Valuation Committee, or its delegate, employs various methods for calibrating valuation approaches for investments where an active market does not exist, including regular due diligence of the Trust’s pricing vendors, a regular review of key inputs and assumptions, transactional back-testing or disposition analysis to compare unrealized gains and losses to realized gains and losses, reviews of missing or stale prices and large movements in market values and reviews of any market related activity. The pricing of all Fair Value Assets is subsequently reported to the Board or a committee thereof on a quarterly basis.
Generally, trading in foreign instruments is substantially completed each day at various times prior to the close of business on the NYSE. Occasionally, events affecting the values of such instruments may occur between the foreign market close and the close of business on the NYSE that may not be reflected in the computation of each Fund’s net assets. If events (for example, a company announcement, market volatility or a natural disaster) occur during such periods that are expected to affect the value of such instruments materially, those instruments may be Fair Value Assets and valued at their fair value, as determined in good faith by the Global Valuation Committee using a pricing service and/or policies approved by the Board. Each business day, the Funds use a pricing service to assist with the valuation of certain foreign exchange-traded equity securities and foreign exchange-traded and OTC options (the “Systematic Fair Value Price”). Using current market factors, the Systematic Fair Value Price is designed to value such foreign securities and foreign options at fair value as of the close of business on the NYSE, which follows the close of the local markets.
Foreign Currency: The Funds’ books and records are maintained in US dollars. Purchases and sales of investment securities are recorded at the rates of exchange prevailing on the respective date of such transactions. Generally, when the US dollar rises in value against a foreign currency, the Funds’ investments denominated in that currency will lose value because that currency is worth fewer US dollars; the opposite effect occurs if the US dollar falls in relative value.
The Funds do not isolate the portion of the results of operations arising as a result of changes in the foreign exchange rates from the changes in the market prices of investments held or sold for financial reporting purposes. Accordingly, the effects of changes in foreign currency exchange rates on investments are not segregated on the Statements of Operations from the effects of changes in market prices of those investments, but are included as a component of net realized and unrealized gain (loss) from investments. The Funds report realized currency gains
(losses) on foreign currency related transactions as components of net realized gain (loss) for financial reporting purposes, whereas such components are treated as ordinary income for federal income tax purposes.
Segregation and Collateralization: In cases in which the 1940 Act and the interpretive positions of the Securities and Exchange Commission (“SEC”) require that each Fund either delivers collateral or segregate assets in connection with certain investments (e.g., financial futures contracts, foreign currency exchange contracts and options written), each Fund will, consistent with SEC rules and/or certain interpretive letters issued by the SEC, segregate collateral or designate on its books and records cash or liquid securities having a market value at least equal to the amount that would otherwise be required to be physically segregated. Furthermore, based on requirements and agreements with certain exchanges and third party broker-dealers, a Fund engaging in such transactions may have requirements to deliver/deposit securities to/with an exchange or broker-dealer as collateral for certain investments.
Investment Transactions and Investment Income: For financial reporting purposes, investment transactions are recorded on the dates the transactions are entered into (the trade dates). Realized gains and losses on investment transactions are determined on the identified cost basis. Dividend income is recorded on the ex-dividend dates. Dividends from foreign securities where the ex-dividend date may have passed are subsequently recorded when the Funds are informed of the ex-dividend date. Under the applicable foreign tax laws, a withholding tax at various rates may be imposed on capital gains, dividends and interest. Upon notification from issuers, some of the dividend income received from a real estate investment trust may be redesignated as a reduction of cost of the related investment and/or realized gain. Income, expenses and realized and unrealized gains and losses are allocated daily to each class based on its relative net assets.
Dividends and Distributions: Dividends and distributions paid by the Funds are recorded on the ex-dividend dates. The portion of distributions that exceeds a Fund’s current and accumulated earnings and profits, which are measured on a tax basis, will constitute a nontaxable return of capital. Distributions in excess of a Fund’s taxable income and net capital gains, but not in excess of a Fund’s earnings and profits, will be taxable to shareholders as ordinary income and will not constitute a non-taxable return of capital. Capital losses carried forward from years beginning before 2011 do not reduce earnings and profits, even if such carried forward losses offset current year realized gains. The character and timing of dividends and distributions are determined in accordance with federal income tax regulations, which may differ from US GAAP.
Securities Lending: The Funds may lend securities to approved borrowers, such as banks, brokers and other financial institutions. The borrower pledges cash, securities issued or guaranteed by the US government or irrevocable letters of credit issued by a bank as collateral. The initial collateral received by the Funds has a value of at least 102% of the current value of the loaned securities for securities traded on US exchanges and a value of at least 105% for all other securities. The collateral is maintained thereafter in an amount equal to at least 100% of the current market value of the loaned securities. The market value of the
| | | | |
| | | | | MARCH 31, 2013 |
| 62 | | BLACKROCK FUNDS | |
Notes to Financial Statements (continued)
loaned securities is determined at the close of business of the Funds and any additional required collateral is delivered to the Funds on the next business day. Securities lending income, as disclosed in the Statements of Operations, represents the income earned from the investment of the cash collateral, net of rebates paid to, or fees paid by, borrowers and less the fees paid to the securities lending agent. During the term of the loan, the Funds earn dividend or interest income on the securities loaned but do not receive interest income on the securities received as collateral. Loans of securities are terminable at any time and the borrower, after notice, is required to return borrowed securities within the standard time period for settlement of securities transactions. The risks of securities lending include the risk that the borrower may not provide additional collateral when required or may not return the securities when due. To mitigate this risk, the Funds benefit from a borrower default indemnity provided by BlackRock, Inc. (“BlackRock”). BlackRock’s indemnity allows for full replacement of securities lent. The Funds also could suffer a loss if the value of an investment purchased with cash collateral falls below the market value of loaned securities or if the value of an investment purchased with cash collateral falls below the value of the original cash collateral received. During the six months ended March 31, 2013, any securities on loan were collateralized by cash.
Income Taxes: It is the Funds’ policy to comply with the requirements of the Internal Revenue Code of 1986, as amended, applicable to regulated investment companies and to distribute substantially all of their taxable income to their shareholders. Therefore, no federal income tax provision is required.
The Funds file US federal and various state and local tax returns. No income tax returns are currently under examination. The statute of limitations on the Funds’ US federal tax returns remains open for each of the four years ended September 30, 2012. The statutes of limitations on each Fund’s state and local tax returns may remain open for an additional year depending upon the jurisdiction. Management does not believe there are any uncertain tax positions that require recognition of a tax liability.
Recent Accounting Standards: In December 2011, the Financial Accounting Standards Board (the “FASB”) issued guidance that will expand current disclosure requirements on the offsetting of certain assets and liabilities. The new disclosures will be required for investments and derivative financial instruments subject to master netting or similar agreements which are eligible for offset in the Statements of Assets and Liabilities and will require an entity to disclose both gross and net information about such investments and transactions in the financial statements. In January 2013, the FASB issued guidance that clarifies which investments and transactions are subject to the offsetting disclosure requirements. The scope of the disclosure requirements for offsetting will be limited to derivative instruments, repurchase agreements and reverse repurchase agreements, and securities borrowing and securities lending transactions. The guidance is effective for financial statements with fiscal years beginning on or after January 1, 2013, and interim periods within those fiscal years. Management is evaluating the impact of this guidance on the Funds’ financial statement disclosures.
Other: Expenses directly related to a Fund or its classes are charged to that Fund or class. Other operating expenses shared by several funds are pro rated among those funds on the basis of relative net assets or other appropriate methods. Expenses directly related to the Funds and other shared expenses pro rated to the Funds are allocated daily to each class based on its relative net assets or other appropriate methods.
The Funds have an arrangement with the custodian whereby fees may be reduced by credits earned on uninvested cash balances, which, if applicable, are shown as fees paid indirectly in the Statements of Operations. The custodian imposes fees on overdrawn cash balances, which can be offset by accumulated credits earned or may result in additional custody charges.
2. Derivative Financial Instruments:
The Funds engage in various portfolio investment strategies using derivative contracts both to increase the returns of the Funds and/or to economically hedge, or protect, their exposure to certain risks such as equity risk or foreign currency exchange rate risk. These contracts may be transacted on an exchange or OTC.
Losses may arise if the value of the contract decreases due to an unfavorable change in the market rates or values of the underlying instrument or if the counterparty does not perform under the contract. The Funds’ maximum risk of loss from counterparty credit risk on OTC derivatives is generally the aggregate unrealized gain netted against any collateral pledged by the counterparty. For OTC options purchased, the Funds bear the risk of loss in the amount of the premiums paid plus the positive change in market values net of any collateral received on the options should the counterparty fail to perform under the contracts. Options written by the Funds do not give rise to counterparty credit risk, as options written obligate the Funds and not the counterparty to perform. Counterparty risk related to exchange-traded financial futures contracts and options is deemed to be minimal due to the protection against defaults provided by the exchange on which these contracts trade.
The Funds may mitigate counterparty risk by procuring collateral and through netting provisions included within an International Swaps and Derivatives Association, Inc. master agreement (“ISDA Master Agreement”) implemented between a Fund and each of its respective counterparties. The ISDA Master Agreement allows each Fund to offset with each separate counterparty certain derivative financial instrument’s payables and/or receivables with collateral held. The amount of collateral moved to/from applicable counterparties is generally based upon minimum transfer amounts of up to $500,000. To the extent amounts due to the Funds from their counterparties are not fully collateralized contractually or otherwise, the Funds bear the risk of loss from counterparty non-performance. See Note 1 “Segregation and Collateralization” for information with respect to collateral practices. In addition, the Funds manage counterparty risk by entering into agreements only with counterparties that they believe have the financial resources to honor their obligations and by monitoring the financial stability of those counterparties.
Certain ISDA Master Agreements allow counterparties to OTC derivatives to terminate derivative contracts prior to maturity in the event the Funds’
| | | | | | |
| | | | | MARCH 31, 2013 | | 63 |
| | BLACKROCK FUNDS | | |
Notes to Financial Statements (continued)
net assets decline by a stated percentage or the Funds fail to meet the terms of their ISDA Master Agreements, which would cause the Funds to accelerate payment of any net liability owed to the counterparty.
Financial Futures Contracts: Certain Funds purchase and/or sell financial futures contracts to gain exposure to, or economically hedge against, changes in the value of equity securities (equity risk). Financial futures contracts are agreements between the Fund and a counterparty to buy or sell a specific quantity of an underlying instrument at a specified price and at a specified date. Depending on the terms of the particular contract, financial futures contracts are settled either through physical delivery of the underlying instrument on the settlement date or by payment of a cash settlement amount on the settlement date. Pursuant to the contract, the Funds agree to receive from or pay to the broker an amount of cash equal to the daily fluctuation in value of the contract. Such receipts or payments are known as variation margin and are recorded by the Funds as unrealized appreciation or depreciation. When the contract is closed, the Funds record a realized gain or loss equal to the difference between the value of the contract at the time it was opened and the value at the time it was closed. The use of financial futures contracts involves the risk of an imperfect correlation in the movements in the price of financial futures contracts and the underlying assets.
Foreign Currency Exchange Contracts: The Funds enter into foreign currency exchange contracts as an economic hedge against either specific transactions or portfolio instruments or to obtain exposure to foreign currencies (foreign currency exchange rate risk). A foreign currency exchange contract is an agreement between two parties to buy and sell a currency at a set exchange rate on a future date. Foreign currency exchange contracts, when used by the Funds, help to manage the overall exposure to the currencies in which some of the investments held by the Funds are denominated. The contract is marked-to-market daily and the change in market value is recorded by the Funds as an unrealized gain or loss. When the contract is closed, the Funds record a realized gain or loss equal to the difference between the value at the time it was opened and the value at the time it was closed. The use of foreign currency exchange contracts involves the risk that the value of a foreign currency exchange contract changes unfavorably due to movements in the value of the referenced foreign currencies and the risk that a counterparty to the contract does not perform its obligations under the agreement.
Options: Certain Funds purchase and write call and put options to increase or decrease their exposure to underlying instruments (including equity risk) and/or, in the case of options written, to generate gains from options premiums. A call option gives the purchaser (holder) of the option the right (but not the obligation) to buy, and obligates the seller (writer) to sell (when the option is exercised), the underlying instrument at the exercise or strike price at any time or at a specified time during the option period. A put option gives the holder the right to sell and obligates the writer to buy the underlying instrument at the exercise or strike price at any time or at a specified time during the option period. When a Fund purchases (writes) an option, an amount equal to the premium paid (received) by a Fund is reflected as an asset (liability). The amount of the asset (liability) is subsequently marked-to-market to reflect the current market value of the option purchased (written). When an instrument is purchased or sold through an exercise of an option, the related premium paid (or received) is added to (or deducted from) the basis of the instrument acquired or deducted from (or added to) the proceeds of the instrument sold. When an option expires (or a Fund enters into a closing transaction), a Fund realizes a gain or loss on the option to the extent of the premiums received or paid (or gain or loss to the extent the cost of the closing transaction exceeds the premiums received or paid). When a Fund writes a call option, such option is “covered,” meaning that a Fund holds the underlying instrument subject to being called by the option counterparty. When a Fund writes a put option, such option is covered by cash in an amount sufficient to cover the obligation.
In purchasing and writing options, a Fund bears the risk of an unfavorable change in the value of the underlying instrument or the risk that a Fund may not be able to enter into a closing transaction due to an illiquid market. Exercise of a option written could result in a Fund purchasing or selling a security at a price different from the current market value.
| | | | |
| | | | | MARCH 31, 2013 |
| 64 | | BLACKROCK FUNDS | |
Notes to Financial Statements (continued)
Derivative Financial Instruments Categorized by Risk Exposure:
| | | | | | | | | | | | | | | | | | | | | | | | | | | |
| Fair Values of Derivative Financial Instruments as of March 31, 2013 |
| | | Asset Derivatives |
| | | | | Global
Opportunities | | Health Sciences
Opportunities | | International
Opportunities | | Science & Technology
Opportunities | | U.S.
Opportunities |
| | | Statements of Assets and Liabilities Location | | | | | | Value | | | | |
Foreign currency exchange contracts | | Unrealized appreciation on foreign currency exchange contracts | | | $ | 1,969,756 | | | | $ | 7,819,044 | | | | $ | 27,141,813 | | | | $ | 69,547 | | | | | – | |
Equity contracts | | Net unrealized appreciation/ depreciation1 | | | | – | | | | | – | | | | | – | | | | | – | | | | $ | 430,528 | |
Total | | | | | $ | 1,969,756 | | | | $ | 7,819,044 | | | | $ | 27,141,813 | | | | $ | 69,547 | | | | $ | 430,528 | |
| | 1 | Includes cumulative appreciation/depreciation on financial futures contracts as reported in the Schedules of Investments. Only current day’s variation margin is reported within the Statements of Assets and Liabilities. |
| | | | | | | | | | | | | | | | | | |
| |
| | | Liability Derivatives | |
| |
| | | | | Global
Opportunities | | | Health Sciences
Opportunities | | | International
Opportunities | | | Science & Technology
Opportunities | |
| | | |
| | | Statements of Assets and Liabilities Location | | | | | Value | | | | |
| |
Foreign currency exchange contracts | | Unrealized depreciation on foreign currency exchange contracts | | | $1,540,439 | | | | $861,833 | | | | $17,695,143 | | | | $41,549 | |
Equity contracts: | | | | | | | | | | | | | | | | | | |
Options | | Options written at value | | | – | | | | 93,752 | | | | – | | | | – | |
| | | |
Total | | | | | $1,540,439 | | | | $955,585 | | | | $17,695,143 | | | | $41,549 | |
| | | | | | |
| | | | | | | | | | | | | | | | | | | | |
| |
| The Effect of Derivative Financial Instruments in the Statements of Operations | |
| Six Months Ended March 31, 2013 | |
| |
| | | Net Realized Gain (Loss) From | |
| |
| | | Global
Opportunities | | | Health Sciences
Opportunities | | | International
Opportunities | | | Science & Technology
Opportunities | | | U.S.
Opportunities | |
| |
Foreign currency exchange contracts: | | | | | | | | | | | | | | | | | | | | |
Foreign currency transactions | | | $(1,563,917) | | | | $(11,733,588) | | | | $(16,733,551) | | | | $(267,441) | | | | $(196,612) | |
Equity contracts: | | | | | | | | | | | | | | | | | | | | |
Options | | | – | | | | 475,505 | | | | – | | | | – | | | | – | |
| | | | |
Total | | | $(1,563,917) | | | | $(11,258,083) | | | | $(16,733,551) | | | | $(267,441) | | | | $(196,612) | |
| | | | |
|
| |
|
| |
| | | Net Change in Unrealized Appreciation/Depreciation on | |
| |
| | | Global
Opportunities | | | Health Sciences
Opportunities | | | International
Opportunities | | | Science & Technology
Opportunities | | | U.S.
Opportunities | |
| |
Foreign currency exchange contracts: | | | | | | | | | | | | | | | | | | | | |
Foreign currency translations | | | $823,866 | | | | $15,033,549 | | | | $16,123,334 | | | | $242,619 | | | | $199,777 | |
Equity contracts: | | | | | | | | | | | | | | | | | | | | |
Financial futures contracts | | | – | | | | – | | | | – | | | | – | | | | 430,528 | |
Options | | | – | | | | 76,364 | | | | – | | | | – | | | | – | |
| | | | |
Total | | | $823,866 | | | | $15,109,913 | | | | $16,123,334 | | | | $242,619 | | | | $630,305 | |
| | | | |
For the six months ended March 31, 2013, the average quarterly balances of outstanding derivative financial instruments were as follows:
| | | | | | | | | | | | | | | | | | | | |
| |
| | | Global
Opportunities | | | Health Sciences
Opportunities | | | International
Opportunities | | | Science & Technology
Opportunities | | | U.S.
Opportunities | |
| |
Financial futures contracts: | | | | | | | | | | | | | | | | | | | | |
Average number of contracts purchased | | | – | | | | – | | | | – | | | | – | | | | 288 | |
Average notional value of contracts purchased | | | – | | | | – | | | | – | | | | – | | | | $33,091,250 | |
Foreign currency exchange contracts: | | | | | | | | | | | | | | | | | | | | |
Average number of contracts - US dollars purchased | | | 45 | | | | 34 | | | | 88 | | | | 3 | | | | – | |
Average number of contracts - US dollars sold | | | 42 | | | | 9 | | | | 100 | | | | 1 | | | | – | |
Average US dollar amounts purchased | | | $76,026,599 | | | | $301,734,051 | | | | $902,940,792 | | | | $4,162,699 | | | | – | |
Average US dollar amounts sold | | | $71,705,421 | | | | $ 31,033,629 | | | | $821,542,151 | | | | $ 730,962 | | | | – | |
Options: | | | | | | | | | | | | | | | | | | | | |
Average number of option contracts written | | | – | | | | 1,263 | | | | – | | | | – | | | | – | |
Average notional value of option contracts written | | | – | | | | $ 5,740,150 | | | | – | | | | – | | | | – | |
| |
| | | | | | |
| | | | | MARCH 31, 2013 | | 65 |
| | BLACKROCK FUNDS | | |
Notes to Financial Statements (continued)
3. Investment Advisory Agreement and Other Transactions with Affiliates:
The PNC Financial Services Group, Inc. (“PNC”) is the largest stockholder and an affiliate, for 1940 Act purposes, of BlackRock.
The Trust, on behalf of the Funds, entered into an Investment Advisory Agreement with the Manager, the Funds’ investment advisor, an indirect, wholly owned subsidiary of BlackRock, to provide investment advisory and administration services. The Manager is responsible for the management of each Fund’s portfolio and provides the necessary personnel, facilities, equipment and certain other services necessary to the operations of each Fund. For such services, each Fund pays the Manager a monthly fee based on a percentage of each Fund’s average daily net assets at the following annual rates:
| | | | | | | | | | | | | | |
| | | First $1 Billion | | | | $1 Billion - $2 Billion | | | | $2 Billion - $3 Billion | | | | Greater Than $3 Billion |
Global Opportunities and Science & Technology Opportunities | | 0.900% | | | | 0.850% | | | | 0.800% | | | | 0.750% |
Health Sciences Opportunities | | 0.750% | | | | 0.700% | | | | 0.675% | | | | 0.650% |
International Opportunities | | 1.000% | | | | 0.950% | | | | 0.900% | | | | 0.850% |
U.S. Opportunities | | 1.100% | | | | 1.050% | | | | 1.025% | | | | 1.000% |
The Manager voluntarily agreed to waive its investment advisory fees by the amount of investment advisory fees each Fund pays to the Manager indirectly through its investment in affiliated money market funds. However, the Manager does not waive its investment advisory fees by the amount of investment advisory fees paid in connection with each Fund’s investment in other affiliated investment companies, if any. These amounts are included in fees waived by Manager in the Statements of Operations. For the six months ended March 31, 2013, the amounts waived were as follows:
| | | | |
Global Opportunities | | $ | 982 | |
Health Sciences Opportunities | | $ | 18,752 | |
International Opportunities | | $ | 3,029 | |
Science & Technology Opportunities | | $ | 874 | |
U.S. Opportunities | | $ | 8,696 | |
The Manager entered into separate sub-advisory agreements with BlackRock Financial Management, Inc. (“BFM”), an affiliate of the Manager, to serve as sub-advisor for a portion of the assets of Global Opportunities, and with BlackRock International Limited (“BIL”), an affiliate of the Manager, to serve as sub-advisor for International Opportunities. The Manager pays BFM and BIL, for services they provide, a monthly fee that is a percentage of the investment advisory fees paid by the applicable Fund to the Manager.
The Trust, on behalf of the Funds, entered into a Distribution Agreement and Distribution and Service Plan with BlackRock Investments, LLC (“BRIL”), an affiliate of the Manager. Pursuant to the Distribution and Service Plan and in accordance with Rule 12b-1 under the 1940 Act, the Funds pay BRIL ongoing service and distribution fees. The fees are accrued daily and paid monthly at annual rates based upon the average daily net assets of the shares of each Fund as follows:
| | | | | | | | | | |
| | | Service
Fee | | Distribution
Fee |
Service | | | | 0.25 | % | | | | N/A | |
Investor A | | | | 0.25 | % | | | | N/A | |
Investor B | | | | 0.25 | % | | | | 0.75 | % |
Investor C | | | | 0.25 | % | | | | 0.75 | % |
Class R | | | | 0.25 | % | | | | 0.25 | % |
Pursuant to sub-agreements with BRIL, broker-dealers and BRIL provide shareholder servicing and distribution services to each Fund. The ongoing service and/or distribution fee compensates BRIL and each broker-dealer for providing shareholder servicing and/or distribution related services to Service, Investor A, Investor B, Investor C and Class R shareholders.
For the six months ended March 31, 2013, the following table shows the class specific service and distribution fees borne directly by each class of each Fund:
| | | | | | | | | | | | | | | | | | | | | | | | |
| |
| | | Service | | | | Investor A | | | | Investor B | | | | Investor C | | | | Class R | | | | Total | |
| |
Global Opportunities | | | – | | | | $ 241,398 | | | | $ 25,741 | | | | $ 266,060 | | | | $36,484 | | | | $ 569,683 | |
Health Sciences Opportunities | | | $ 19,802 | | | | $1,348,652 | | | | $196,171 | | | | $1,996,628 | | | | $40,030 | | | | $3,601,283 | |
International Opportunities | | | $ 58,703 | | | | $ 884,507 | | | | $ 49,129 | | | | $ 736,942 | | | | – | | | | $1,729,281 | |
Science & Technology Opportunities | | | $ 1,116 | | | | $ 116,466 | | | | $ 11,845 | | | | $ 127,177 | | | | $10,082 | | | | $ 266,686 | |
U.S. Opportunities | | | $195,872 | | | | $ 695,032 | | | | $ 62,355 | | | | $1,046,176 | | | | – | | | | $1,999,435 | |
| |
| | | | |
| | | | | MARCH 31, 2013 |
| 66 | | BLACKROCK FUNDS | |
Notes to Financial Statements (continued)
Pursuant to written agreements, certain financial intermediaries, some of which may be affiliates, provide the Funds with sub-accounting, recordkeeping, sub-transfer agency and other administrative services with respect to sub-accounts they service. For these services, these entities receive an asset based fee or an annual fee per shareholder account, which will vary depending on share class and/or net assets. For the six months ended March 31, 2013, the Funds paid the following to the affiliates in return for these services, which are included in transfer agent –class specific in the Statements of Operations:
| | | | | | | | | | | | | | | | | | | | |
| |
| | | Institutional | | | | Service | | | | Investor A | | | | Investor C | | | | Total | |
| | | | |
| | | | | |
Health Sciences Opportunities | | | – | | | | $ 78 | | | | $ 90 | | | | – | | | | $ 168 | |
International Opportunities | | | $205,022 | | | | $4,800 | | | | $6,417 | | | | – | | | | $216,239 | |
Science & Technology Opportunities | | | $ 3 | | | | – | | | | $1,625 | | | | – | | | | $ 1,628 | |
U.S. Opportunities | | | $ 73,641 | | | | $ 54 | | | | $1,965 | | | | $11 | | | | $ 75,671 | |
| |
The Manager maintains a call center, which is responsible for providing certain shareholder services to the Funds, such as responding to shareholder inquiries and processing transactions based upon instructions from shareholders with respect to the subscription and redemption of Fund shares. For the six months ended March 31, 2013, each Fund reimbursed the Manager the following amounts for costs incurred in running the call center, which are included in transfer agent – class specific in the Statements of Operations:
| | | | | | | | | | | | | | | | | | | | | | | | | | | | |
| |
| | | Institutional | | | | Service | | | | Investor A | | | | Investor B | | | | Investor C | | | | Class R | | | | Total | |
| |
Global Opportunities | | | $1,132 | | | | – | | | | $ 3,596 | | | | $ 319 | | | | $ 923 | | | | $158 | | | | $ 6,128 | |
Health Sciences Opportunities | | | $5,258 | | | | $ 248 | | | | $25,469 | | | | $1,893 | | | | $6,867 | | | | $453 | | | | $40,188 | |
International Opportunities | | | $2,935 | | | | $4,995 | | | | $10,014 | | | | $ 536 | | | | $3,940 | | | | – | | | | $22,420 | |
Science & Technology
Opportunities | | | $2,371 | | | | $ 54 | | | | $ 4,151 | | | | – | | | | $1,204 | | | | $174 | | | | $ 7,954 | |
U.S. Opportunities | | | – | | | | $ 774 | | | | $10,868 | | | | $ 611 | | | | $5,602 | | | | – | | | | $17,855 | |
| |
For the six months ended March 31, 2013, the following table shows the class specific transfer agent fees borne directly by each class of each Fund:
| | | | | | | | | | | | | | | | | | | | | | | | | | | | |
| |
| | | Institutional | | | | Service | | | | Investor A | | | | Investor B | | | | Investor C | | | | Class R | | | | Total | |
| |
Global Opportunities | | | $ 41,002 | | | | – | | | | $162,649 | | | | $ 2,631 | | | | $ 58,400 | | | | $10,686 | | | | $ 275,368 | |
Health Sciences Opportunities | | | $ 282,038 | | | | $ 12,362 | | | | $873,208 | | | | $41,559 | | | | $278,702 | | | | $21,404 | | | | $1,509,273 | |
International Opportunities | | | $ 575,691 | | | | $ 70,075 | | | | $676,071 | | | | $16,431 | | | | $164,802 | | | | – | | | | $1,503,070 | |
Science & Technology
Opportunities | | | $ 57,866 | | | | $ 852 | | | | $170,204 | | | | $ 4,914 | | | | $ 63,154 | | | | $ 7,087 | | | | $ 304,077 | |
U.S. Opportunities | | | $1,125,260 | | | | $184,433 | | | | $675,125 | | | | $16,738 | | | | $223,156 | | | | – | | | | $2,224,712 | |
| |
BNY Mellon Investment Servicing (US) Inc. (“BNYMIS”) and the Manager act as co-administrators for the Funds. For these services, the co-administrators receive an administration fee computed daily and payable monthly to each administrator pursuant to separate fee arrangements, based on a percentage of the average daily net assets of each Fund. The combined administration fee, which is shown as administration in the Statements of Operations, is paid at the following annual rates:
| | |
| Average Daily Net Assets | | Administration Fee |
First $500 Million | | 0.075% |
$500 Million - $1 Billion | | 0.065% |
Greater than $1 Billion | | 0.055% |
In addition, each of the share classes is charged an administration fee, which is shown as administration – class specific in the Statements of Operations, based on the following percentages of average daily net assets of each respective class:
| | |
| Average Daily Net Assets | | Administration Fee – Class Specific |
First $500 Million | | 0.025% |
$500 Million - $1 Billion | | 0.015% |
Greater than $1 Billion | | 0.005% |
| | | | | | |
| | | | | MARCH 31, 2013 | | 67 |
| | BLACKROCK FUNDS | | |
Notes to Financial Statements (continued)
In addition, BNYMIS and the Manager may have, at their discretion, voluntarily waived all or any portion of their administration fees for a Fund or a share class which are included in administration fees waived and administration fees waived – class specific in the Statements of Operations. For the six months ended March 31, 2013, the Funds paid the following to the Manager in return for these services, which are included in administration, administration – class specific, administration fees waived and administration fees waived – class specific in the Statements of Operations:
| | | | |
| Administration Fees | | | | |
Global Opportunities | | $ | 75,395 | |
Health Sciences Opportunities | | $ | 622,221 | |
International Opportunities | | $ | 534,819 | |
Science & Technology Opportunities | | $ | 48,255 | |
U.S. Opportunities | | $ | 581,401 | |
For the six months ended March 31, 2013, the following table shows class specific administration fees borne directly by each class of each Fund:
| | | | | | | | | | | | | | | | | | | | | | | | | | |
| |
| | Institutional | | | Service | | | | Investor A | | | | Investor B | | | | Investor C | | | | Class R | | | | Total | |
| |
Global Opportunities | | $ 7,034 | | | – | | | | $ 24,140 | | | | $ 644 | | | | $ 6,651 | | | | $1,825 | | | | $ 40,294 | |
Health Sciences Opportunities | | $ 61,447 | | | $ 1,980 | | | | $101,735 | | | | $4,904 | | | | $49,916 | | | | $2,002 | | | | $221,984 | |
International Opportunities | | $ 86,542 | | | $ 5,870 | | | | $ 78,002 | | | | $1,233 | | | | $18,441 | | | | – | | | | $190,088 | |
Science & Technology Opportunities | | $ 3,811 | | | $ 112 | | | | $ 11,647 | | | | $ 297 | | | | $ 3,179 | | | | $ 504 | | | | $ 19,550 | |
U.S. Opportunities | | $103,005 | | | $19,587 | | | | $ 66,634 | | | | $1,559 | | | | $26,154 | | | | – | | | | $216,939 | |
| |
The Manager contractually agreed to waive and/or reimburse fees or expenses, excluding interest expense, dividend expense, income tax expense, acquired fund fees and expenses and certain other fund expenses, which constitute extraordinary expenses not incurred in the ordinary course of the Funds’ business, in order to limit expenses. The expense limitations as a percentage of average daily net assets are as follows:
| | | | | | | | | | | | | | |
| | | Global
Opportunities | | | Health Sciences
Opportunities | | International
Opportunities2 | | Science & Technology
Opportunities2 | | | U.S.
Opportunities2 |
Institutional | | | 1.06%1 | | | N/A | | 1.49% | | | 1.39% | | | 1.03% |
Service | | | 1.70%2,3 | | | N/A | | 1.80% | | | 1.78% | | | 1.65% |
Investor A | | | 1.33%1 | | | N/A | | 1.98% | | | 1.80% | | | 1.65% |
Investor B | | | 2.18%1 | | | N/A | | 2.75% | | | 2.73% | | | 2.32% |
Investor C | | | 2.14%1 | | | N/A | | 2.75% | | | 2.73% | | | 2.32% |
Class R | | | 1.72%1 | | | 1.81%2,3 | | 2.18%3 | | | 2.57% | | | 2.39%3 |
| 1 | The Manager has agreed not to reduce or discontinue this contractual waiver or reimbursement prior to February 1, 2015 unless approved by the Board, including a majority of the Independent Trustees. |
| 2 | The Manager has agreed not to reduce or discontinue this contractual waiver or reimbursement prior to February 1, 2014 unless approved by the Board, including a majority of the Independent Trustees. |
| 3 | There were no shares outstanding as of March 31, 2013. |
These amounts waived are included in fees waived by Manager, and shown as administration fees waived – class specific, transfer agent fees waived – class specific and transfer agent fees reimbursed – class specific, respectively, in the Statements of Operations. For the six months ended March 31, 2013, the amounts included in fees waived by Manager were as follows:
| | | | |
Global Opportunities | | $ | 14,149 | |
U.S. Opportunities | | $ | 1,347,044 | |
Class specific expense waivers and reimbursements are as follows:
| | | | | | | | | | | | | | | | | | | | | | | | | | | | |
| |
| Administration Fees Waived | | | | | | | | | | | | | | | | | | | | | | | | | | | | |
| |
| | | Institutional | | | | Service | | | | Investor A | | | | Investor B | | | | Investor C | | | | Class R | | | | Total | |
| |
Global Opportunities | | | $ 7,034 | | | | – | | | | $24,140 | | | | $303 | | | | $6,651 | | | | $534 | | | | $ 38,662 | |
International Opportunities | | | – | | | | $278 | | | | – | | | | – | | | | – | | | | – | | | | $ 278 | |
Science & Technology Opportunities | | | $ 3,556 | | | | – | | | | $ 56 | | | | – | | | | – | | | | – | | | | $ 3,612 | |
U.S. Opportunities | | | $103,005 | | | | – | | | | – | | | | $736 | | | | – | | | | – | | | | $103,741 | |
| |
| Transfer Agent Fees Waived | | | | | | | | | | | | | | | | | | | | | | | | | | | | |
| |
| | | Institutional | | | | Service | | | | Investor A | | | | Investor B | | | | Investor C | | | | Class R | | | | Total | |
| |
Global Opportunities | | | $1,132 | | | | – | | | | $3,596 | | | | $ 7 | | | | $923 | | | | $38 | | | | $5,696 | |
International Opportunities | | | – | | | | $8 | | | | – | | | | – | | | | – | | | | – | | | | $ 8 | |
Science & Technology Opportunities | | | $2,296 | | | | – | | | | – | | | | – | | | | – | | | | | | | | $2,296 | |
U.S. Opportunities | | | – | | | | – | | | | – | | | | $248 | | | | – | | | | – | | | | $ 248 | |
| |
| | | | |
| | | | | MARCH 31, 2013 |
| 68 | | BLACKROCK FUNDS | |
Notes to Financial Statements (continued)
| | | | | | | | | | | | | | | | | | | | | | | | | | | | | | | | | | |
| |
| Transfer Agent Fees Reimbursed | | | | | | | | | | | | | | | | | | | | | | | | | | | | |
| |
| | | Institutional | | | | | Investor A | | | | | Investor B | | | | | Investor C | | | | | Class R | | | | | Total | |
| |
Global Opportunities | | | $ 38,810 | | | | | | $136,425 | | | | | | – | | | | | | $35,750 | | | | | | $417 | | | | | | $ 211,402 | |
Science & Technology Opportunities | | | $ 12,251 | | | | | | – | | | | | | – | | | | | | – | | | | | | – | | | | | | $ 12,251 | |
U.S. Opportunities | | | $1,125,217 | | | | | | – | | | | | | $70 | | | | | | – | | | | | | – | | | | | | $1,125,287 | |
| |
|
| |
If during a Fund’s fiscal year the operating expenses of a share class, that at any time during the prior two fiscal years received a waiver or reimbursement from the Manager, are less than the expense limit for that share class, the Manager is entitled to be reimbursed by such share class up to the lesser of (a) the amount of fees waived or expenses reimbursed during those prior two fiscal years under the agreement and (b) the amount by which the expense limit for that share class exceeds the operating expenses of the share class for the current fiscal year, provided that: (1) the Fund of which the share class is a part has more than $50 million in assets for the fiscal year and (2) the Manager or an affiliate continues to serve as the Fund’s investment advisor or administrator. In the event the expense limit for a share class is changed subsequent to a fiscal year in which the Manager becomes entitled to reimbursement for fees waived or reimbursed, the amount available to reimburse the Manager shall be calculated by reference to the expense limit for that share class in effect at the time the Manager became entitled to receive such reimbursement, rather than the subsequently changed expense limit for that share class.
For the six months ended March 31, 2013, the Manager recouped the following Fund level and class specific waivers and/or reimbursements previously recorded by the Funds:
| | | | | | | | | | | | | | | | | | | | | | | | | | | | | | | | |
| |
| | | Fund Level | | | Institutional | | | Service | | | Investor A | | | Investor B | | | Investor C | | | Class R | | | Total | |
| |
Global Opportunities | | | – | | | | – | | | | – | | | | – | | | | $141 | | | | – | | | | $ 397 | | | | $ 538 | |
Health Sciences Opportunities | | | – | | | | – | | | | – | | | | – | | | | – | | | | – | | | | $1,274 | | | | $ 1,274 | |
International Opportunities | | | – | | | | – | | | | $34,739 | | | | – | | | | – | | | | – | | | | – | | | | $34,739 | |
Science & Technology Opportunities | | | $150 | | | | $314 | | | | $ 17 | | | | $2,147 | | | | – | | | | $399 | | | | $ 19 | | | | $ 3,046 | |
U.S. Opportunities | | | – | | | | – | | | | – | | | | $ 969 | | | | $685 | | | | – | | | | – | | | | $ 1,654 | |
| |
On March 31, 2013, the Fund level and class specific waivers and/or reimbursements subject to possible future recoupment under the expense limitation agreement are as follows:
| | | | | | | | | | | | |
| |
| | | | | | Expiring September 30, | | | | |
| |
| | | 2013 | | | 2014 | | | 2015 | |
| |
Global Opportunities | | | | | | | | | | | | |
Fund Level | | | $ 100,404 | | | | $ 31,642 | | | | $ 14,149 | |
Institutional | | | $ 19,725 | | | | $ 103,049 | | | | $ 46,976 | |
Investor A | | | $ 29,036 | | | | $ 371,480 | | | | $ 164,161 | |
Investor B | | | $ 721 | | | | $ 938 | | | | $ 310 | |
Investor C | | | $ 14,452 | | | | $ 98,285 | | | | $ 43,324 | |
Class R | | | – | | | | $ 20,355 | | | | $ 989 | |
International Opportunities | | | | | | | | | | | | |
Service | | | – | | | | $ 15,440 | | | | $ 286 | |
Science & Technology Opportunities | | | | | | | | | | | | |
Institutional | | | $ 26,657 | | | | $ 20,414 | | | | $ 18,103 | |
Investor A | | | – | | | | – | | | | $ 56 | |
U.S. Opportunities | | | | | | | | | | | | |
Fund Level | | | $4,233,236 | | | | $3,190,512 | | | | $1,347,044 | |
Institutional | | | $5,170,146 | | | | $2,763,643 | | | | $1,228,222 | |
Investor B | | | – | | | | $ 1,217 | | | | $ 1,054 | |
| |
For the six months ended March 31, 2013, affiliates earned underwriting discounts, direct commissions and dealer concessions on sales of each Fund’s Investor A Shares as follows:
| | | | |
| |
Global Opportunities | | $ | 2,313 | |
Health Sciences Opportunities | | $ | 146,405 | |
International Opportunities | | $ | 16,084 | |
Science & Technology Opportunities | | $ | 2,773 | |
U.S. Opportunities | | $ | 2,497 | |
| |
| | | | | | |
| | | | | MARCH 31, 2013 | | 69 |
| | BLACKROCK FUNDS | | |
Notes to Financial Statements (continued)
For the six months ended March 31, 2013, affiliates received CDSCs as follows:
| | | | | | | | |
|
| | | Investor A | | | Investor B | | Investor C |
|
Global Opportunities | | | - | | | $4,906 | | $ 1,163 |
Health Sciences Opportunities | | | $1,162 | | | $7,068 | | $16,215 |
International Opportunities | | | $1,450 | | | $5,139 | | $ 5,006 |
Science & Technology Opportunities | | | $ 492 | | | $ 897 | | $ 482 |
U.S. Opportunities | | | $1,238 | | | $7,892 | | $ 4,362 |
|
The Funds received an exemptive order from the SEC permitting them, among other things, to pay an affiliated securities lending agent a fee based on a share of the income derived from the securities lending activities and have retained BlackRock Investment Management, LLC (“BIM”) as the securities lending agent. BIM may, on behalf of the Funds, invest cash collateral received by a Fund for such loans in a private investment company managed by the Manager or in registered money market funds advised by the Manager or its affiliates. The market value of securities on loan and the value of the related collateral, if applicable, is shown in the Statements of Assets and Liabilities as securities loaned at value and collateral on securities loaned at value, respectively. The cash collateral invested by BIM, if any, is disclosed in the Schedules of Investments. Securities lending income is equal to the total of income earned from the reinvestment of cash collateral, net of rebates paid to, or fees paid by, borrowers of securities. The Funds retain 65% of securities lending income and pay a fee to BIM equal to 35% of such income. The Funds benefit from a borrower default indemnity provided by BlackRock. As securities lending agent, BIM bears all operational costs directly related to securities lending as well as the cost of borrower default indemnification. BIM does not receive any fees for managing the cash collateral. The share of income earned by the Funds is shown as securities lending – affiliated – net in the Statements of Operations. For the six months ended March 31, 2013, BIM received these amounts in securities lending agent fees related to securities lending activities as follows:
| | | | |
| |
Global Opportunities | | $ | 3,807 | |
Health Sciences Opportunities | | $ | 76,136 | |
International Opportunities | | $ | 8,172 | |
U.S. Opportunities | | $ | 666,747 | |
| |
Certain officers and/or trustees of the Trust are officers and/or directors of BlackRock or its affiliates. The Funds reimburse the Manager for a portion of the compensation paid to the Trust’s Chief Compliance Officer which is included in officer and trustees in the Statements of Operations.
4. Investments:
Purchases and sales of investments excluding short-term securities for the six months ended March 31, 2013, were as follows:
| | | | | | | | |
| |
| | | Purchases | | | | Sales | |
| |
Global Opportunities | | $ 210,580,572 | | | | | $ 243,220,362 | |
Health Sciences Opportunities | | $1,233,780,430 | | | | | $1,139,616,795 | |
International Opportunities | | $1,421,415,935 | | | | | $1,539,622,453 | |
Science & Technology Opportunities | | $ 44,735,977 | | | | | $ 66,987,062 | |
U.S. Opportunities | | $ 930,403,212 | | | | | $1,582,219,422 | |
| |
Transactions in options written for the six months ended March 31, 2013, were as follows:
| | | | | | | | | | | | | | | | |
| |
| | | Health Sciences Opportunities | |
| |
| | | Calls | | | Puts | |
| | | Contracts | | | Premiums
Received | | | Contracts | | | Premiums
Received | |
Outstanding options, beginning of period | | | – | | | | – | | | | – | | | | – | |
Options written | | | 6,364 | | | $ | 590,913 | | | | 428 | | | $ | 54,708 | |
Options expired | | | (3,839) | | | | (420,797 | ) | | | (428) | | | | (54,708 | ) |
| | | | | | | | | | | | | | | | |
Outstanding options, end of period | | | 2,525 | | | $ | 170,116 | | | | – | | | | – | |
| | | | |
| | | | |
| | | | | MARCH 31, 2013 |
| 70 | | BLACKROCK FUNDS | |
Notes to Financial Statements (continued)
5. Income Tax Information:
As of September 30, 2012, the Funds had capital loss carryforwards available to offset future realized capital gains through the indicated expiration dates as follows:
| | | | | | | | | | | | | | | | |
| |
| Expires | | Global Opportunities | | | International
Opportunities | | | Science &
Technology
Opportunities | | | U.S.
Opportunities | |
| |
2015 | | | – | | | | – | | | | $42,234,550 | | | | – | |
2017 | | | $ 37,763,900 | | | | $10,669,404 | | | | 4,448,928 | | | | – | |
2018 | | | 113,289,251 | | | | 63,081,604 | | | | – | | | | – | |
2019 | | | 3,120,805 | | | | – | | | | 783,208 | | | | – | |
No expiration date1 | | | 3,697,632 | | | | 13,085,795 | | | | – | | | | $4,845,999 | |
| |
Total | | | $157,871,588 | | | | $86,836,803 | | | | $47,466,686 | | | | $4,845,999 | |
| | | | |
| | 1 | Must be utilized prior to losses subject to expiration. |
As of March 31, 2013, gross unrealized appreciation and gross unrealized depreciation based on cost for federal income tax purposes were as follows:
| | | | | | | | | | | | | | | | | | | | | | |
| |
| | | | | Global
Opportunities | | | Health
Sciences
Opportunities | | | International
Opportunities | | | Science &
Technology
Opportunities | | | U.S.
Opportunities | |
| |
Tax cost | | | | | $277,484,080 | | | $ | 1,978,719,525 | | | $ | 1,502,716,603 | | | | $135,848,560 | | | $ | 1,741,661,312 | |
| | | |
Gross unrealized appreciation | | | | | $ 56,621,444 | | | $ | 565,688,227 | | | $ | 271,219,169 | | | | $ 22,633,982 | | | $ | 419,159,470 | |
Gross unrealized depreciation | | | | | (3,604,409 | ) | | | (3,580,769 | ) | | | (18,290,815 | ) | | | (1,124,898 | ) | | | (6,655,472 | ) |
| | | |
Net unrealized appreciation | | | | | $ 53,017,035 | | | $ | 562,107,458 | | | $ | 252,928,354 | | | | $ 21,509,084 | | | $ | 412,503,998 | |
| | | |
| | | | | | | | | | | | | | | | | | |
| |
6. Borrowings:
The Trust, on behalf of the Funds, along with certain other funds managed by the Manager and its affiliates, is a party to a $500 million credit agreement with a group of lenders. The Funds may borrow under the credit agreement to fund shareholder redemptions. Effective November 2011 to November 2012, the credit agreement had the following terms: a commitment fee of 0.065% per annum based on the Funds’ pro rata share of the unused portion of the credit agreement and interest at a rate equal to the higher of (a) the one-month London Interbank Offered Rate (“LIBOR”) plus 0.80% per annum or (b) the Fed Funds rate plus 0.80% per annum on amounts borrowed. In addition, the Funds paid administration and arrangement fees which were allocated to the Funds based on their net assets as of October 31, 2011. The credit agreement, which expired in November 2012, was renewed with the same terms until November 2013. Effective November 2012 to November 2013, the credit agreement has the following terms: a commitment fee of 0.065% per annum based on the Funds’ pro rata share of the unused portion of the credit agreement and interest at a rate equal to the higher of (a) the one-month LIBOR plus 0.80% per annum or (b) the Fed Funds rate plus 0.80% per annum on amounts borrowed. In addition, the Funds paid administration and arrangement fees which were allocated to the Funds based on their net assets as of October 31, 2012. The Funds did not borrow under the credit agreement during the six months ended March 31, 2013.
7. Concentration, Market and Credit Risk:
In the normal course of business, the Funds invest in securities and enter into transactions where risks exist due to fluctuations in the market (market risk) or failure of the issuer of a security to meet all its obligations (issuer credit risk). The value of securities held by the Funds may decline in response to certain events, including those directly involving the issuers whose securities are owned by the Funds; conditions affecting
the general economy; overall market changes; local, regional or global political, social or economic instability; and currency and interest rate and price fluctuations. Similar to issuer credit risk, the Funds may be exposed to counterparty credit risk, or the risk that an entity with which the Funds have unsettled or open transactions may fail to or be unable to perform on its commitments. The Funds manage counterparty credit risk by entering into transactions only with counterparties that they believe have the financial resources to honor their obligations and by monitoring the financial stability of those counterparties. Financial assets, which potentially expose the Funds to market, issuer and counterparty credit risks, consist principally of financial instruments and receivables due from counterparties. The extent of the Funds’ exposure to market, issuer and counterparty credit risks with respect to these financial assets is generally approximated by their value recorded in the Statements of Assets and Liabilities, less any collateral held by the Funds.
Global Opportunities and International Opportunities invest a significant portion of their assets in securities of issuers located in Europe or with significant exposure to European issuers or countries. The European financial markets have recently experienced volatility and adverse trends due to concerns about economic downturns in, or rising government debt levels of several European countries, including Greece, Ireland, Italy, Portugal and Spain. As of March 31, 2013, these events have adversely affected the exchange rate of the euro and may continue to spread to other countries in Europe, including countries that do not use the euro. These events may affect the value and liquidity of certain of Global Opportunities’ and International Opportunities’ investments.
As of March 31, 2013, Health Sciences Opportunities invested a significant portion of its assets in securities in the health care sector. Changes in economic conditions affecting the health care sector would have a greater impact on Health Sciences Opportunities and could affect the value, income and/or liquidity of positions in such securities.
| | | | | | |
| | | | | MARCH 31, 2013 | | |
| | BLACKROCK FUNDS | | | 71 |
Notes to Financial Statements (continued)
As of March 31, 2013, Science & Technology Opportunities invested a significant portion of its assets in securities in the information technology sector. Changes in economic conditions affecting the information technology sector would have a greater impact on Science & Technology Opportunities and could affect the value, income and/or liquidity of positions in such securities.
As of March 31, 2013, Global Opportunities invested a substantial amount of its assets in issuers located in a single country or a limited number of countries. When the Fund concentrates its investments in this manner, it assumes the risk that economic, political and social conditions in those countries may have a significant impact on its investment performance.
As of March 31, 2013, the Funds had the following industry classifications:
| | | | | | | | | | |
| Industry | | Global
Opportunities | | International
Opportunities |
Pharmaceuticals | | | | 7 | % | | | | 10 | % |
Food Products | | | | 6 | | | | | – | |
Commercial Banks | | | | 6 | | | | | 5 | |
Oil, Gas & Consumable Fuels | | | | 6 | | | | | – | |
Diversified Financial Services | | | | 5 | | | | | – | |
Capital Markets | | | | – | | | | | 6 | |
Insurance | | | | – | | | | | 6 | |
Other1 | | | | 70 | | | | | 73 | |
| | 1 | All other industries held were each less than 5% of long-term investments. |
8. Capital Share Transactions:
Transactions in capital shares for each class were as follows:
| | | | | | | | | | | | | | | | | | |
| | | Six Months Ended March 31, 2013 | | | | | Year Ended September 30, 2012 | |
| Global Opportunities | | Shares | | | Amount | | | | | Shares | | | Amount | |
Institutional | | | | | | | | | | | | | | |
Shares sold | | | 592,609 | | | | $ 6,895,395 | | | | | | 659,854 | | | | 6,821,248 | |
Shares issued in reinvestment of dividends | | | 25,716 | | | | 287,006 | | | | | | 10,082 | | | | 100,322 | |
Shares redeemed | | | (574,303 | ) | | | (6,578,243 | ) | | | | | (2,080,293 | ) | | | (21,759,629 | ) |
Net increase (decrease) | | | 44,022 | | | | $ 604,158 | | | | | | (1,410,357 | ) | | $ | (14,838,059 | ) |
| | | | | |
| | | | | | | | | | | | | | | | | | | |
Investor A | | | | | | | | | | | | | | |
Shares sold and automatic conversion of shares | | | 441,561 | | | $ | 5,113,168 | | | | | | 1,051,328 | | | | 10,896,990 | |
Shares issued in reinvestment of dividends | | | 151,938 | | | | 1,686,369 | | | | | | 24,774 | | | | 245,035 | |
Shares redeemed | | | (2,125,351 | ) | | | (24,211,736 | ) | | | | | (6,009,025 | ) | | | (62,842,202 | ) |
Net decrease | | | (1,531,852 | ) | | $ | (17,412,199 | ) | | | | | (4,932,923 | ) | | $ | (51,700,177 | ) |
| | | | | |
| | | | | | | | | | | | | | | | | | | |
Investor B | | | | | | | | | | | | | | |
Shares sold | | | 4,767 | | | | $ 54,183 | | | | | | 4,073 | | | | 41,775 | |
Shares issued in reinvestment of dividends | | | 393 | | | | 4,291 | | | | | | – | | | | – | |
Shares redeemed and automatic conversion of shares | | | (85,659 | ) | | | (954,408 | ) | | | | | (242,558 | ) | | | (2,470,508 | ) |
Net decrease | | | (80,499 | ) | | | $(895,934 | ) | | | | | (238,485 | ) | | | $(2,428,733 | ) |
| | | | | |
| | | | | | | | | | | | | | | | | | | |
Investor C | | | | | | | | | | | | | | |
Shares sold | | | 115,016 | | | | $ 1,294,663 | | | | | | 236,712 | | | | 2,385,713 | |
Shares issued in reinvestment of dividends | | | 8,422 | | | | 91,454 | | | | | | – | | | | – | |
Shares redeemed | | | (683,214 | ) | | | (7,587,911 | ) | | | | | (1,641,578 | ) | | | (16,620,299 | ) |
Net decrease | | | (559,776 | ) | | | $(6,201,794 | ) | | | | | (1,404,866 | ) | | $ | (14,234,586 | ) |
| | | | | |
| | | | | | | | | | | | | | | | | | | |
Class R | | | | | | | | | | | | | | |
Shares sold | | | 101,454 | | | $ | 1,176,158 | | | | | | 397,248 | | | | 4,083,085 | |
Shares issued in reinvestment of dividends | | | 37,846 | | | | 422,279 | | | | | | 497 | | | | 4,914 | |
Shares redeemed | | | (259,676 | ) | | | (2,968,695 | ) | | | | | (668,193 | ) | | | (6,964,192 | ) |
Net decrease | | | (120,376 | ) | | $ | (1,370,258 | ) | | | | | (270,448 | ) | | $ | (2,876,193 | ) |
Total Net Decrease | | | (2,248,481 | ) | | $ | (25,276,027 | ) | | | | | (8,257,079 | ) | | $ | (86,077,748 | ) |
| | | | |
| | | | |
| 72 | | BLACKROCK FUNDS | | MARCH 31, 2013 |
Notes to Financial Statements (continued)
| | | | | | | | | | | | | | | | | | |
| | | Six Months Ended March 31, 2013 | | | | | Year Ended September 30, 2012 | |
| Health Sciences Opportunities | | Shares | | | Amount | | | | | Shares | | | Amount | |
Institutional | | | | | | | | | | | | | | |
Shares sold | | | 3,936,045 | | | $ | 136,733,368 | | | | | | 4,090,410 | | | | 127,693,569 | |
Shares issued in reinvestment of dividends and distributions | | | 947,294 | | | | 31,014,483 | | | | | | 616,409 | | | | 17,222,456 | |
Shares redeemed | | | (3,131,329 | ) | | | (106,037,845 | ) | | | | | (3,632,124 | ) | | | (111,317,797 | ) |
Net increase | | | 1,752,010 | | | $ | 61,710,006 | | | | | | 1,074,695 | | | $ | 33,598,228 | |
| | | | | |
| | | | | | | | | | | | | | | | | | | |
Service | | | | | | | | | | | | | | |
Shares sold | | | 99,964 | | | | $ 3,382,064 | | | | | | 181,882 | | | | $ 5,430,122 | |
Shares issued in reinvestment of distributions | | | 32,876 | | | | 1,048,425 | | | | | | 27,004 | | | | 736,672 | |
Shares redeemed | | | (80,568 | ) | | | (2,692,291 | ) | | | | | (246,784 | ) | | | (7,450,005 | ) |
Net increase (decrease) | | | 52,272 | | | | $ 1,738,198 | | | | | | (37,898 | ) | | | $(1,283,211 | ) |
| | | | | |
| | | | | | | | | | | | | | | | | | | |
Investor A | | | | | | | | | | | | | | |
Shares sold and automatic conversion of shares | | | 6,166,620 | | | $ | 208,716,272 | | | | | | 9,035,781 | | | | 273,713,590 | |
Shares issued in reinvestment of distributions | | | 2,174,190 | | | | 69,160,977 | | | | | | 1,553,813 | | | | 42,294,790 | |
Shares redeemed | | | (4,198,624 | ) | | | (140,378,302 | ) | | | | | (9,782,340 | ) | | | (295,306,792 | ) |
Net increase | | | 4,142,186 | | | $ | 137,498,947 | | | | | | 807,254 | | | $ | 20,701,588 | |
| | | | | |
| | | | | | | | | | | | | | | | | | | |
Investor B | | | | | | | | | | | | | | |
Shares sold | | | 17,501 | | | | $ 554,297 | | | | | | 37,810 | | | | 1,085,412 | |
Shares issued in reinvestment of distributions | | | 81,715 | | | | 2,433,479 | | | | | | 78,735 | | | | 2,017,206 | |
Shares redeemed and automatic conversion of shares | | | (188,295 | ) | | | (5,896,463 | ) | | | | | (589,171 | ) | | | (16,746,030 | ) |
Net decrease | | | (89,079 | ) | | | $(2,908,687 | ) | | | | | (472,626 | ) | | | $(13,643,412 | ) |
| | | | | |
| | | | | | | | | | | | | | | | | | | |
Investor C | | | | | | | | | | | | | | |
Shares sold | | | 1,596,298 | | | | $ 50,302,123 | | | | | | 1,661,256 | | | | 47,475,233 | |
Shares issued in reinvestment of distributions | | | 835,814 | | | | 24,731,781 | | | | | | 581,778 | | | | 14,834,985 | |
Shares redeemed | | | (1,242,593 | ) | | | (38,723,560 | ) | | | | | (2,481,520 | ) | | | (70,172,461 | ) |
Net increase (decrease) | | | 1,189,519 | | | | $ 36,310,344 | | | | | | (238,486 | ) | | | $ (7,862,243 | ) |
| | | | | |
| | | | | | | | | | | | | | | | | | | |
Class R | | | | | | | | | | | | | | |
Shares sold | | | 148,455 | | | | $ 4,990,563 | | | | | | 268,557 | | | | 8,196,982 | |
Shares issued in reinvestment of distributions | | | 32,123 | | | | 1,017,311 | | | | | | 19,428 | | | | 527,655 | |
Shares redeemed | | | (94,142 | ) | | | (3,146,650 | ) | | | | | (193,362 | ) | | | (5,918,516 | ) |
Net increase | | | 86,436 | | | | $ 2,861,224 | | | | | | 94,623 | | | | $ 2,806,121 | |
Total Net Increase | | | 7,133,344 | | | | $237,210,032 | | | | | | 1,227,562 | | | | $34,317,071 | |
| | | | | | |
| | | | | MARCH 31, 2013 | | |
| | BLACKROCK FUNDS | | | 73 |
Notes to Financial Statements (continued)
| | | | | | | | | | | | | | | | | | |
| | | Six Months Ended March 31, 2013 | | | | | Year Ended September 30, 2012 | |
| International Opportunities | | Shares | | | Amount | | | | | Shares | | | Amount | |
Institutional | | | | | | | | | | | | | | |
Shares sold | | | 3,152,851 | | | $ | 108,231,579 | | | | | | 8,183,030 | | | $ | 253,867,271 | |
Shares issued in reinvestment of dividends | | | 348,371 | | | | 11,715,714 | | | | | | 491,173 | | | | 14,312,818 | |
Shares redeemed | | | (4,717,555 | ) | | | (162,659,384 | ) | | | | | (12,293,903 | ) | | | (373,392,042 | ) |
Net decrease | | | (1,216,333 | ) | | $ | (42,712,091 | ) | | | | | (3,619,700 | ) | | $ | (105,211,953 | ) |
| | | | | |
| | | | | | | | | | | | | | | | | | | |
Service | | | | | | | | | | | | | | |
Shares sold | | | 84,241 | | | | $ 2,808,767 | | | | | | 236,182 | | | | $ 7,089,386 | |
Shares issued in reinvestment of dividends | | | 17,109 | | | | 556,385 | | | | | | 26,176 | | | | 737,899 | |
Shares redeemed | | | (408,741 | ) | | | (13,847,274 | ) | | | | | (507,051 | ) | | | (15,060,123 | ) |
Net decrease | | | (307,391 | ) | | | $(10,482,122 | ) | | | | | (244,693 | ) | | | $ (7,232,838 | ) |
| | | | | |
| | | | | | | | | | | | | | | | | | | |
Investor A | | | | | | | | | | | | | | |
Shares sold and automatic conversion of shares | | | 2,016,217 | | | $ | 66,341,856 | | | | | | 5,470,759 | | | $ | 161,089,624 | |
Shares issued in reinvestment of dividends | | | 305,190 | | | | 9,814,892 | | | | | | 458,334 | | | | 12,782,955 | |
Shares redeemed | | | (3,414,411 | ) | | | (112,154,909 | ) | | | | | (9,773,567 | ) | | | (287,807,724 | ) |
Net decrease | | | (1,093,004 | ) | | $ | (35,998,161 | ) | | | | | (3,844,474 | ) | | $ | (113,935,145 | ) |
| | | | | |
| | | | | | | | | | | | | | | | | | | |
Investor B | | | | | | | | | | | | | | |
Shares sold | | | 2,703 | | | | $ 40,266 | | | | | | 4,121 | | | | $ 114,065 | |
Shares issued in reinvestment of dividends | | | 1,613 | | | | 48,633 | | | | | | 4,391 | | | | 114,745 | |
Shares redeemed and automatic conversion of shares | | | (112,004 | ) | | | (3,284,088 | ) | | | | | (255,913 | ) | | | (7,017,833 | ) |
Net decrease | | | (107,688 | ) | | | $(3,195,189 | ) | | | | | (247,401 | ) | | | $(6,789,023 | ) |
| | | | | |
| | | | | | | | | | | | | | | | | | | |
Investor C | | | | | | | | | | | | | | |
Shares sold | | | 228,420 | | | $ | 7,031,457 | | | | | | 520,362 | | | $ | 14,183,899 | |
Shares issued in reinvestment of dividends | | | 34,280 | | | | 1,022,570 | | | | | | 56,675 | | | | 1,467,326 | |
Shares redeemed | | | (768,782 | ) | | | (23,418,956 | ) | | | | | (2,210,793 | ) | | | (60,108,488 | ) |
Net decrease | | | (506,082 | ) | | $ | (15,364,929 | ) | | | | | (1,633,756 | ) | | $ | (44,457,263 | ) |
Total Net Decrease | | | (3,230,498 | ) | | $ | (107,752,492 | ) | | | | | (9,590,024 | ) | | $ | (277,626,222 | ) |
| | | | |
| | | | | MARCH 31, 2013 |
| 74 | | BLACKROCK FUNDS | |
Notes to Financial Statements (continued)
| | | | | | | | | | | | | | | | | | |
| | | Six Months Ended March 31, 2013 | | | | | Year Ended September 30, 2012 | |
| Science & Technology Opportunities | | Shares | | | Amount | | | | | Shares | | | Amount | |
Institutional | | | | | | | | | | | | | | |
Shares sold | | | 297,960 | | | | $ 2,929,782 | | | | | | 770,288 | | | | $ 7,490,369 | |
Shares redeemed | | | (741,033 | ) | | | (7,254,507 | ) | | | | | (1,317,474 | ) | | | (12,874,187 | ) |
Net decrease | | | (443,073 | ) | | | $(4,324,725 | ) | | | | | (547,186 | ) | | | $ (5,383,818 | ) |
| | | | | |
| | | | | | | | | | | | | | | | | | | |
Service | | | | | | | | | | | | | | |
Shares sold | | | 8,118 | | | | $ 77,856 | | | | | | 22,926 | | | | $ 217,472 | |
Shares redeemed | | | (19,885 | ) | | | (191,504 | ) | | | | | (27,413 | ) | | | (258,161 | ) |
Net decrease | | | (11,767 | ) | | | $(113,648 | ) | | | | | (4,487 | ) | | | $ (40,689 | ) |
| | | | | |
| | | | | | | | | | | | | | | | | | | |
Investor A | | | | | | | | | | | | | | |
Shares sold and automatic conversion of shares | | | 518,103 | | | $ | 4,838,623 | | | | | | 1,304,226 | | | | $ 12,178,654 | |
Shares redeemed | | | (2,646,477 | ) | | | (24,430,291 | ) | | | | | (3,101,152 | ) | | | (28,528,060 | ) |
Net decrease | | | (2,128,374 | ) | | $ | (19,591,668 | ) | | | | | (1,796,926 | ) | | | $(16,349,406 | ) |
| | | | | |
| | | | | | | | | | | | | | | | | | | |
Investor B | | | | | | | | | | | | | | |
Shares sold | | | 3,950 | | | | $ 33,343 | | | | | | 21,447 | | | | $ 181,555 | |
Shares redeemed and automatic conversion of shares | | | (56,025 | ) | | | (474,636 | ) | | | | | (132,305 | ) | | | (1,110,087 | ) |
Net decrease | | | (52,075 | ) | | | $(441,293 | ) | | | | | (110,858 | ) | | | $ (928,532 | ) |
| | | | | |
| | | | | | | | | | | | | | | | | | | |
Investor C | | | | | | | | | | | | | | |
Shares sold | | | 288,831 | | | | $ 2,407,879 | | �� | | | | 414,850 | | | | $ 3,505,554 | |
Shares redeemed | | | (439,056 | ) | | | (3,689,588 | ) | | | | | (1,022,280 | ) | | | (8,536,404 | ) |
Net decrease | | | (150,225 | ) | | | $(1,281,709 | ) | | | | | (607,430 | ) | | | $(5,030,850 | ) |
| | | | | |
| | | | | | | | | | | | | | | | | | | |
Class R | | | | | | | | | | | | | | |
Shares sold | | | 97,203 | | | $ | 927,609 | | | | | | 206,367 | | | | $ 1,973,361 | |
Shares redeemed | | | (120,106 | ) | | | (1,136,328 | ) | | | | | (179,136 | ) | | | (1,691,981 | ) |
Net increase (decrease) | | | (22,903 | ) | | $ | (208,719 | ) | | | | | 27,231 | | | | $281,380 | |
Total Net Decrease | | | (2,808,417 | ) | | $ | (25,961,762 | ) | | | | | (3,039,656 | ) | | | $(27,451,915 | ) |
| | | | | | |
| | | | | MARCH 31, 2013 | | |
| | BLACKROCK FUNDS | | | 75 |
Notes to Financial Statements (concluded)
| | | | | | | | | | | | | | | | | | |
| | | Six Months Ended March 31, 2013 | | | | | Year Ended September 30, 2012 | |
| U.S. Opportunities | | Shares | | | Amount | | | | | Shares | | | Amount | |
Institutional | | | | | | | | | | | | | | |
Shares sold | | | 2,730,750 | | | $ | 103,318,984 | | | | | | 11,527,723 | | | $ | 408,516,164 | |
Shares issued in reinvestment of distributions | | | 938,471 | | | | 33,306,300 | | | | | | 4,597,296 | | | | 151,572,873 | |
Shares redeemed | | | (12,395,031 | ) | | | (457,189,162 | ) | | | | | (36,842,007 | ) | | | (1,329,556,797 | ) |
Net decrease | | | (8,725,810 | ) | | $ | (320,563,878 | ) | | | | | (20,716,988 | ) | | $ | (769,467,760 | ) |
| | | | | |
| | | | | | | | | | | | | | | | | | | |
Service | | | | | | | | | | | | | | |
Shares sold | | | 36,517 | | | | $ 1,311,093 | | | | | | 77,821 | | | | $ 2,634,021 | |
Shares issued in reinvestment of distributions | | | 112,947 | | | | 3,836,813 | | | | | | 633,064 | | | | 19,966,853 | |
Shares redeemed | | | (596,107 | ) | | | (21,249,124 | ) | | | | | (1,762,370 | ) | | | (60,181,040 | ) |
Net decrease | | | (446,643 | ) | | | $(16,101,218 | ) | | | | | (1,051,485 | ) | | | $(37,580,166 | ) |
| | | | | |
| | | | | | | | | | | | | | | | | | | |
Investor A | | | | | | | | | | | | | | |
Shares sold and automatic conversion of shares | | | 773,434 | | | $ | 27,480,146 | | | | | | 2,223,701 | | | | $ 75,106,543 | |
Shares issued in reinvestment of distributions | | | 391,967 | | | | 13,174,024 | | | | | | 2,846,386 | | | | 88,721,884 | |
Shares redeemed | | | (4,644,428 | ) | | | (163,119,425 | ) | | | | | (14,966,382 | ) | | | (503,894,800 | ) |
Net decrease | | | (3,479,027 | ) | | $ | (122,465,255 | ) | | | | | (9,896,295 | ) | | | $(340,066,373 | ) |
| | | | | |
| | | | | | | | | | | | | | | | | | | |
Investor B | | | | | | | | | | | | | | |
Shares sold | | | 1,069 | | | | $ 33,860 | | | | | | 2,090 | | | | $ 64,052 | |
Shares issued in reinvestment of distributions | | | 9,882 | | | | 296,795 | | | | | | 59,433 | | | | 1,669,467 | |
Shares redeemed and automatic conversion of shares | | | (50,272 | ) | | | (1,569,110 | ) | | | | | (160,728 | ) | | | (4,877,153 | ) |
Net decrease | | | (39,321 | ) | | | $(1,238,455 | ) | | | | | (99,205 | ) | | | $(3,143,634 | ) |
| | | | | |
| | | | | | | | | | | | | | | | | | | |
Investor C | | | | | | | | | | | | | | |
Shares sold | | | 132,699 | | | $ | 4,197,037 | | | | | | 309,834 | | | $ | 9,436,396 | |
Shares issued in reinvestment of distributions | | | 164,304 | | | | 4,938,957 | | | | | | 1,073,324 | | | | 30,171,224 | |
Shares redeemed | | | (1,639,698 | ) | | | (51,364,025 | ) | | | | | (3,730,187 | ) | | | (113,993,845 | ) |
Net decrease | | | (1,342,695 | ) | | $ | (42,228,031 | ) | | | | | (2,347,029 | ) | | $ | (74,386,225 | ) |
Total Net Decrease | | | (14,033,496 | ) | | $ | (502,596,837 | ) | | | | | (34,111,002 | ) | | $ | (1,224,644,158 | ) |
Prior to April 1, 2011, there was a 2% redemption fee on shares redeemed or exchanged that have been held 30 days or less. The redemption fees were collected and retained by the Funds for the benefit of the remaining shareholders. The redemption fees were recorded as a credit to paid-in capital. Effective April 1, 2011, the redemption fee was terminated and is no longer charged by the Funds.
9. Subsequent Events:
Management’s evaluation of the impact of all subsequent events on the Funds’ financial statements was completed through the date the financial statements were issued and the following item was noted:
Effective April 25, 2013, the credit agreement was terminated and a new agreement was entered into. The Funds became a party to a 364-day, $800 million credit agreement, which expires in April 2014. Excluding commitments designated for a certain individual fund, the Funds can borrow up to an aggregate commitment amount of $500 million, subject to asset coverage and other limitations as specified in the agreement. The credit agreement has the following terms: a fee of 0.065% per annum on unused commitment amounts and interest at a rate equal to the higher of (a) the one-month LIBOR plus 0.80% per annum or (b) the Fed Funds rate plus 0.80% per annum on amounts borrowed.
| | | | |
| | | | | MARCH 31, 2013 |
| 76 | | BLACKROCK FUNDS | |
Officers and Trustees
| | |
Ronald W. Forbes, Co-Chairman of the Board and Trustee Rodney D. Johnson, Co-Chairman of the Board and Trustee Paul L. Audet, Trustee David O. Beim, Trustee Henry Gabbay, Trustee Dr. Matina S. Horner, Trustee Herbert I. London, Trustee Ian A. MacKinnon, Trustee Cynthia A. Montgomery, Trustee Joseph P. Platt, Trustee Robert C. Robb, Jr., Trustee Toby Rosenblatt, Trustee Kenneth L. Urish, Trustee Frederick W. Winter, Trustee John M. Perlowski, President and Chief Executive Officer Richard Hoerner, CFA, Vice President Brendan Kyne, Vice President Christopher Stavrakos, CFA, Vice President Neal Andrews, Chief Financial Officer Jay Fife, Treasurer Brian Kindelan, Chief Compliance Officer and Anti-Money Laundering Officer Benjamin Archibald, Secretary | | Investment Advisor and Co-Administrator BlackRock Advisors, LLC Wilmington, DE 19809 Sub-Advisors BlackRock Financial Management, Inc.1 New York, NY 10055 BlackRock International Limited2 Edinburgh, Scotland EH3 8JB Accounting Agent, Co-Administrator and Transfer Agent BNY Mellon Investment Servicing (US) Inc. Wilmington, DE 19809 Custodian The Bank of New York Mellon New York, NY 10286 Distributor BlackRock Investments, LLC New York, NY 10022 Legal Counsel Sidley Austin LLP New York, NY 10019 Independent Registered Public Accounting Firm Deloitte & Touche LLP Philadelphia, PA 19103 Address of the Trust 100 Bellevue Parkway Wilmington, DE 19809 1 For Global Opportunities. 2 For International Opportunities. |
| | | | | | |
| | | | | MARCH 31, 2013 | | |
| | BLACKROCK FUNDS | | | 77 |
Additional Information
Electronic Delivery
Electronic copies of most financial reports and prospectuses are available on the Funds’ website or shareholders can sign up for e-mail notifications of quarterly statements, annual and semi-annual reports and prospectuses by enrolling in the Funds’ electronic delivery program.
To enroll:
Shareholders Who Hold Accounts with Investment Advisors, Banks or Brokerages:
Please contact your financial advisor. Please note that not all investment advisors, banks or brokerages may offer this service.
Shareholders Who Hold Accounts Directly With BlackRock:
| 1) | Access the BlackRock website at http://www.blackrock.com/edelivery |
| 2) | Select “eDelivery” under the “More Information” section |
Householding
The Funds will mail only one copy of shareholder documents, including prospectuses, annual and semi-annual reports and proxy statements, to shareholders with multiple accounts at the same address. This practice is commonly called “householding” and is intended to reduce expenses and eliminate duplicate mailings of shareholder documents. Mailings of your shareholder documents may be householded indefinitely unless you instruct us otherwise. If you do not want the mailing of these documents to be combined with those for other members of your household, please call the Funds at (800) 441-7762.
Availability of Quarterly Schedule of Investments
The Funds file their complete schedule of portfolio holdings with the SEC for the first and third quarters of each fiscal year on Form N-Q. The Funds’ Forms N-Q are available on the SEC’s website at http:// www.sec.gov and may also be reviewed and copied at the SEC’s Public Reference Room in Washington, D.C. Information on how to access documents on the SEC’s website without charge may be obtained by calling (800) SEC-0330. The Funds’ Forms N-Q may also be obtained upon request and without charge by calling (800) 441-7762.
Availability of Proxy Voting Policies and Procedures
A description of the policies and procedures that the Funds use to determine how to vote proxies relating to portfolio securities is available (1) without charge, upon request by calling (800) 441-7762; (2) at http://www.blackrock.com; and (3) on the SEC’s website at http:// www.sec.gov.
Availability of Proxy Voting Record
Information about how the Funds voted proxies relating to securities held in the Funds’ portfolios during the most recent 12-month period ended June 30 is available upon request, and without charge (1) at http://www.blackrock.com or by calling (800) 441-7762 and (2) on the SEC’s website at http://www.sec.gov.
Account Information
Call us at (800) 441-7762 from 8:00 AM to 6:00 PM EST on any business day to get information about your account balances, recent transactions and share prices. You can also reach us on the Web at http:// www.blackrock.com/funds.
Automatic Investment Plans
Investor Class shareholders who want to invest regularly can arrange to have $50 or more automatically deducted from their checking or savings account and invested in any of the BlackRock funds.
Systematic Withdrawal Plan
Investor Class shareholders can establish a systematic withdrawal plan and receive periodic payments of $50 or more from their BlackRock funds, as long as their account balance is at least $10,000.
Retirement Plans
Shareholders may make investments in conjunction with Traditional, Rollover, Roth, Coverdell, Simple IRAs, SEP IRAs and 403(b) Plans.
| | | | |
| | | | | |
| 78 | | BLACKROCK FUNDS | | MARCH 31, 2013 |
Additional Information (concluded)
| | |
|
BlackRock Privacy Principles | | |
|
BlackRock is committed to maintaining the privacy of its current and former fund investors and individual clients (collectively, “Clients”) and to safeguarding their non-public personal information. The following information is provided to help you understand what personal information BlackRock collects, how we protect that information and why in certain cases we share such information with select parties.
If you are located in a jurisdiction where specific laws, rules or regulations require BlackRock to provide you with additional or different privacy-related rights beyond what is set forth below, then BlackRock will comply with those specific laws, rules or regulations.
BlackRock obtains or verifies personal non-public information from and about you from different sources, including the following: (i) information we receive from you or, if applicable, your financial intermediary, on applications, forms or other documents; (ii) information about your transactions with us, our affiliates, or others; (iii) information we receive from a consumer reporting agency; and (iv) from visits to our websites.
BlackRock does not sell or disclose to non-affiliated third parties any non-public personal information about its Clients, except as permitted by law or as is necessary to respond to regulatory requests or to service Client accounts. These non-affiliated third parties are required to protect the confidentiality and security of this information and to use it only for its intended purpose.
We may share information with our affiliates to service your account or to provide you with information about other BlackRock products or services that may be of interest to you. In addition, BlackRock restricts access to non-public personal information about its Clients to those BlackRock employees with a legitimate business need for the information. BlackRock maintains physical, electronic and procedural safeguards that are designed to protect the non-public personal information of its Clients, including procedures relating to the proper storage and disposal of such information.
| | | | | | |
| | | | | MARCH 31, 2013 | | |
| | BLACKROCK FUNDS | | | 79 |
A World-Class Mutual Fund Family
BlackRock offers a diverse lineup of open-end mutual funds crossing all investment styles and managed by experts in equity, fixed income and tax-exempt investing.
| | | | |
|
Equity Funds | | | | |
|
BlackRock ACWI ex-US Index Fund | | BlackRock Global Dividend Income Portfolio | | BlackRock Mid-Cap Growth Equity Portfolio |
BlackRock All-Cap Energy & Resources Portfolio | | BlackRock Global Long/Short Equity Fund | | BlackRock Mid-Cap Value Opportunities Fund |
BlackRock Basic Value Fund | | BlackRock Global Opportunities Portfolio | | BlackRock Natural Resources Trust |
BlackRock Capital Appreciation Fund | | BlackRock Global SmallCap Fund | | BlackRock Pacific Fund |
BlackRock China Fund | | BlackRock Health Sciences Opportunities Portfolio | | BlackRock Real Estate Securities Fund |
BlackRock Commodity Strategies Fund | | BlackRock India Fund | | BlackRock Russell 1000 Index Fund |
BlackRock Disciplined Small Cap Core Fund | | BlackRock International Fund | | BlackRock Science & Technology |
BlackRock Emerging Markets Fund | | BlackRock International Index Fund | | Opportunities Portfolio |
BlackRock Emerging Markets Long/Short | | BlackRock International Opportunities Portfolio | | BlackRock Small Cap Growth Equity Portfolio |
Equity Fund | | BlackRock Large Cap Core Fund | | BlackRock Small Cap Growth Fund II |
BlackRock Energy & Resources Portfolio | | BlackRock Large Cap Core Plus Fund | | BlackRock Small Cap Index Fund |
BlackRock Equity Dividend Fund | | BlackRock Large Cap Growth Fund | | BlackRock S&P 500 Stock Fund |
BlackRock EuroFund | | BlackRock Large Cap Value Fund | | BlackRock U.S. Opportunities Portfolio |
BlackRock Flexible Equity Fund | | BlackRock Latin America Fund | | BlackRock Value Opportunities Fund |
BlackRock Focus Growth Fund | | BlackRock Long-Horizon Equity Fund | | BlackRock World Gold Fund |
| | | | |
|
Taxable Fixed Income Funds | | | | |
|
BlackRock Bond Index Fund | | BlackRock Inflation Protected Bond Portfolio | | BlackRock Strategic Income |
BlackRock Core Bond Portfolio | | BlackRock International Bond Portfolio | | Opportunities Portfolio |
BlackRock CoreAlpha Bond Fund | | BlackRock Long Duration Bond Portfolio | | BlackRock Total Return Fund |
BlackRock Emerging Market Local Debt Portfolio | | BlackRock Low Duration Bond Portfolio | | BlackRock U.S. Government Bond Portfolio |
BlackRock Floating Rate Income Portfolio | | BlackRock Secured Credit Portfolio | | BlackRock U.S. Mortgage Portfolio |
BlackRock Global Long/Short Credit Fund | | BlackRock Short Obligations Fund | | BlackRock Ultra-Short Obligations Fund |
BlackRock GNMA Portfolio | | BlackRock Short-Term Treasury Fund | | BlackRock World Income Fund |
BlackRock High Yield Bond Portfolio | | | | |
| | | | |
|
Municipal Fixed Income Funds | | | | |
|
BlackRock California Municipal Bond Fund | | BlackRock National Municipal Fund | | BlackRock Pennsylvania Municipal Bond Fund |
BlackRock High Yield Municipal Fund | | BlackRock New Jersey Municipal Bond Fund | | BlackRock Short-Term Municipal Fund |
BlackRock Intermediate Municipal Fund | | BlackRock New York Municipal Bond Fund | | |
| | | | |
| | | | | | | | | | | | |
BlackRock Balanced Capital Fund | | LifePath Active Portfolios | | | | LifePath Index Portfolios | | |
| BlackRock Emerging Market Allocation Portfolio | | 2015 | | 2040 | | | | Retirement | | 2040 | | |
| BlackRock Global Allocation Fund | | 2020 | | 2045 | | | | 2020 | | 2045 | | |
| BlackRock Managed Volatility Portfolio | | 2025 | | 2050 | | | | 2025 | | 2050 | | |
| BlackRock Multi-Asset Income Portfolio | | 2030 | | 2055 | | | | 2030 | | 2055 | | |
| BlackRock Multi-Asset Real Return Fund | | 2035 | | | | | | 2035 | | | | |
| BlackRock Strategic Risk Allocation Fund | | | | | | | | | | | | |
| | | | | |
| BlackRock Prepared Portfolios | | LifePath Portfolios | | | | | | | | |
Conservative Prepared Portfolio | | Retirement | | 2040 | | | | | | | | |
Moderate Prepared Portfolio | | 2020 | | 2045 | | | | | | | | |
Growth Prepared Portfolio | | 2025 | | 2050 | | | | | | | | |
Aggressive Growth Prepared Portfolio | | 2030 | | 2055 | | | | | | | | |
| | 2035 | | | | | | | | | | |
BlackRock mutual funds are currently distributed by BlackRock Investments, LLC. You should consider the investment objectives, risks, charges and expenses of the funds under consideration carefully before investing. Each fund’s prospectus contains this and other information and is available at www.blackrock.com or by calling (800) 441-7762 or from your financial advisor. The prospectus should be read carefully before investing.
| | | | |
| | | | | |
| 80 | | BLACKROCK FUNDS | | MARCH 31, 2013 |

Table of Contents
| | | | |
| | | | | MARCH 31, 2013 |
| 2 | | BLACKROCK MANAGED VOLATILITY PORTFOLIO | |
Dear Shareholder
Despite continued global headwinds, risk assets (such as equities) have generated strong performance as investors sought meaningful yields in the ongoing low-interest-rate environment. About this time one year ago, concerns about Europe’s debt crisis dominated the markets as political instability in Greece and severe deficit and liquidity problems in Spain raised the specter of a full-blown euro collapse. Investors were also discouraged by gloomy economic reports from various parts of the world, particularly in China. As the outlook for the global economy worsened, however, investors grew increasingly optimistic that the world’s largest central banks would intervene to stimulate growth. This theme, along with the European Central Bank’s (“ECB’s”) firm commitment to preserve the euro currency bloc, drove most asset classes higher through the summer of 2012. In early September, the ECB announced it would purchase unlimited amounts of short term sovereign bonds to support the region’s debt-laden countries. Days later, the US Federal Reserve announced its own much-anticipated stimulus package.
Although financial markets world-wide were buoyed by these aggressive policy actions, risk assets weakened in the fall of 2012. Global trade began to slow as many European countries fell into recession and growth continued to decelerate in China. In the United States, stocks slid on lackluster corporate earnings and volatility rose in advance of the US Presidential election. In the post-election environment, investors grew increasingly concerned over the “fiscal cliff,” the automatic tax increases and spending cuts that had been scheduled to take effect at the beginning of 2013. There was widespread fear that the fiscal cliff would push the United States into recession unless politicians could agree upon alternate measures to reduce the nation’s deficit. Worries that bipartisan gridlock would preclude a timely budget deal triggered high levels of volatility in financial markets around the world in the months leading up to the last day of the year. Ultimately, the worst of the fiscal cliff was averted with a last-minute tax deal, although the postponement of decisions relating to spending cuts and the debt ceiling left some lingering uncertainty.
Investors shook off the nerve-wracking finale to 2012 and the New Year began with a powerful relief rally in risk assets. Money that had been pulled to the sidelines amid year-end tax-rate uncertainty poured back into the markets in January. Key indicators signaling modest but broad-based improvements in the world’s major economies underpinned the rally. Underlying this aura of comfort was the absence of negative headlines out of Europe. Against this backdrop, global equities surged through January while rising US Treasury yields pressured high quality fixed income assets (as prices move in the opposite direction as yields).
However, bond markets regained strength in February when economic momentum slowed and investors toned down their risk appetite. US stocks continued to rise, but at a more moderate pace. Uncertainty about how long the Federal Reserve would maintain its monetary easing bias drove high levels of volatility later in the month, but these fears abated as the budget sequester (automatic spending cuts scheduled to take effect March 1) began to appear imminent and was deemed likely to deter any near-term changes in the central bank’s policy stance. Improving labor market data and rising home prices pushed US stocks higher at the end of the period, with major indices reaching new all-time highs. Outside the United States, equity prices weakened in the final two months of the period due to a resurgence of macro risk out of Europe. Italy’s February presidential election ended in a stalemate, further propagating the ongoing theme of political instability in the eurozone. In March, a severe banking crisis in Cyprus underscored the fragility of the broader European banking system.
For the 6- and 12-month periods ended March 31, 2013, US and international stocks and high yield bonds posted strong gains, while emerging market equities lagged as the pace of global growth failed to impress investors. US Treasury yields were highly volatile over the past 12 months. While remaining relatively low from a historical standpoint, yields began inching higher in the later part of the period, pressuring Treasuries and investment-grade bonds. Tax-exempt municipal bonds, however, benefited from favorable supply-and-demand dynamics. Near-zero short term interest rates continued to keep yields on money market securities near their all-time lows.
Markets have always been unpredictable, but that does not mean investors can delay taking action. At BlackRock, we believe it’s time for a different approach to investing. One that seeks out more opportunities in more places across a broader array of investments in a portfolio designed to move freely as the markets move up and down. People everywhere are asking, “So what do I do with my money?” Visit www.blackrock.com for answers.
|
| Sincerely, |
|
 |
Rob Kapito |
| President, BlackRock Advisors, LLC |

“Despite continued global headwinds, risk assets (such as equities) have generated strong performance as investors sought meaningful yields in the ongoing low-interest-rate environment.”
Rob Kapito
President, BlackRock Advisors, LLC
Total Returns as of March 31, 2013
| | | | | | | | |
| | | 6-month | | | 12-month | |
US large cap equities (S&P 500® Index) | | | 10.19% | | | | 13.96% | |
US small cap equities (Russell 2000® Index) | | | 14.48 | | | | 16.30 | |
International equities (MSCI Europe, Australasia, Far East Index) | | | 12.04 | | | | 11.25 | |
Emerging market equities (MSCI Emerging Markets Index) | | | 3.87 | | | | 1.96 | |
3-month Treasury bill (BofA Merrill Lynch 3-Month US Treasury Bill Index) | | | 0.06 | | | | 0.12 | |
US Treasury securities (BofA Merrill Lynch 10- Year US Treasury Index) | | | (0.55) | | | | 6.19 | |
US investment grade bonds (Barclays US Aggregate Bond Index) | | | 0.09 | | | | 3.77 | |
Tax-exempt municipal bonds (S&P Municipal Bond Index) | | | 1.26 | | | | 5.82 | |
US high yield bonds (Barclays US Corporate High Yield 2% Issuer Capped Index) | | | 6.28 | | | | 13.08 | |
Past performance is no guarantee of future results. Index performance is shown for illustrative purposes only. You cannot invest directly in an index.
| | | | | | |
| | | | | | |
| | THIS PAGE NOT PART OF YOUR FUND REPORT | | | | 3 |
Fund Summary as of March 31, 2013
BlackRock Managed Volatility Portfolio’s (the “Fund”) investment objective is to seek total return.
|
Portfolio Management Commentary |
How did the Fund perform?
| — | | For the six-month period ended March 31, 2013, the Fund underperformed its reference benchmark (60% MSCI All Country World Index (“MSCI ACWI”)/40% Citigroup World Government Bond Index (hedged into USD) (“Citigroup WGBI (hedged into USD)”). Individually, the Fund underperformed the MSCI ACWI and outperformed the Citigroup WGBI (hedged into USD). The following discussion of relative performance pertains to the Fund’s reference benchmark. |
What factors influenced performance?
| — | | Despite a number of headwinds during the period, risk assets generally rallied worldwide, with most major equity markets posting strong gains. Relative to its reference benchmark, the Fund’s underweight to equities in favor of cash detracted from performance. Within the Fund’s equity allocation, overweight exposure to emerging markets had a negative impact on results. Disappointing economic data in the larger developing countries and macro risks stemming from Europe’s debt crisis caused emerging market equities to significantly underperform developed-market equities. Within US equities, an overweight to information technology (“IT”) hurt performance as the sector lagged the broader US equity market for the period. |
| — | | Conversely, tactical positioning within the Fund’s equity segment contributed positively to performance. Within US stocks, sector biases towards financials, industrials and health care had a positive impact on returns as these sectors outperformed the broader US equity market during the period. Outside the United States, an overweight to Japanese equities boosted results as the Bank of Japan’s aggressive stance toward monetary stimulus drove a strong rally in the local equity market. |
| — | | Within fixed income, the Fund’s overweight to credit sectors drove positive returns during the period. An allocation to high yield credit, which is not represented in the reference benchmark, was particularly beneficial as the sector outperformed core fixed income amid strong demand from investors seeking income in the low interest rate environment. |
| — | | The Fund uses derivatives as part of its investment strategy. During the period, the use of foreign currency exchange contracts had a positive impact on performance. The Fund used derivatives to gain equity exposures in Germany and Japan. Exposure to Japan was additive to overall performance as its equity market moved sharply higher for the period. German equities, however, lagged broader international equities, largely due to the outperformance in Japan. In US equities, a tactical overweight to IT funded by reducing broad US equity exposure through the use of |
| | derivatives had a negative impact as the broader US market outperformed the IT sector. |
Describe recent portfolio activity.
| — | | From a broad asset allocation perspective, the Fund decreased its equity position in favor of cash and cash equivalents early in the period as a means of reducing overall portfolio volatility amid rising macro risks in the United States and abroad. As the period drew to a close and it appeared that accommodative monetary policy would keep interest rates low for the near-term, the Fund rotated away from cash into investment grade credit in order to increase return potential while still maintaining a relatively low risk profile. |
| — | | Within equities, the Fund reduced exposure to emerging markets given deteriorating growth prospects in the larger developing countries and continued underperformance relative to developed equity markets. Additionally, the Fund closed a tactical overweight to industrials on the back of strong performance in the sector during the period. The Fund initiated equity positions in Japan, Germany and Mexico, and added to sector exposures in health care, IT and financials. |
Describe portfolio positioning at period end.
| — | | Relative to the reference benchmark, the Fund ended the period underweight in equities and overweight in fixed income, while continuing to hold an allocation to cash and cash equivalents. Within its equity allocation, the Fund was overweight in the United States, with sector overweights in health care, financials and IT. Within international equities, the Fund was overweight in Germany as Fund management continued to find stability and security in the country’s rate of growth. In addition, the Fund moved to an overweight in Mexican equities based on the likelihood that strong industry fundamentals combined with favorable governance and policy direction can drive outperformance in Mexico relative to other emerging markets. |
| — | | The Fund’s fixed income allocation continues to reflect a preference for credit sectors over core fixed income. While spreads have compressed, Fund management continues to find yields in credit sectors attractive relative to the risks considering expectations for interest rates to remain low into 2015, historically low default rates and strong corporate balance sheets. With respect to cash, the Fund’s allocation naturally detracts from performance relative to the reference benchmark when financial markets are rising, however, holding cash enhances the ability of the Fund to manage portfolio volatility during periods of heightened uncertainty. |
The views expressed reflect the opinions of BlackRock as of the date of this report and are subject to change based on changes in market, economic or other conditions. These views are not intended to be a forecast of future events and are no guarantee of future results.
| | | | | |
| Ten Largest Holdings | | Percent of
Long-Term
Investments |
iShares Barclays 1-3 Year Credit Bond Fund | | | | 7 | % |
Health Care Select Sector SPDR Fund | | | | 6 | |
Financial Select Sector SPDR Fund | | | | 6 | |
Technology Select Sector SPDR Fund | | | | 6 | |
Government of Japan | | | | 5 | |
iShares MSCI Mexico Capped Investable Market Index Fund | | | | 5 | |
iShares iBoxx $ High Yield Corporate Bond Fund | | | | 4 | |
Vanguard MSCI Emerging Markets ETF | | | | 4 | |
iShares MSCI USA Minimum Volatility Index Fund | | | | 2 | |
iShares MSCI EAFE Minimum Volatility Index Fund | | | | 2 | |
| | | | | |
| Portfolio Composition | | Percent of
Long-Term
Investments |
Investment Companies | | | | 45 | % |
Common Stocks | | | | 23 | |
Foreign Government Obligations | | | | 14 | |
Corporate Bonds | | | | 9 | |
U.S. Government Sponsored Agency Securities | | | | 5 | |
Foreign Agency Obligations | | | | 3 | |
U.S. Treasury Obligations | | | | 1 | |
| | | | |
| | | | | MARCH 31, 2013 |
| 4 | | BLACKROCK MANAGED VOLATILITY PORTFOLIO | |
|
Total Return Based on a $10,000 Investment |
| | |
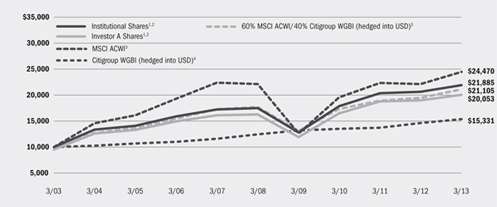 | | 1 Assuming maximum sales charges, if any, transaction costs and other operating expenses, including investment advisory fees. Institutional Shares do not have a sales charge. 2 The Fund uses an asset allocation strategy, investing varying percentages of its portfolio in three major categories: stocks, bonds and money market instruments. 3 This is a free float-adjusted market capitalization weighted index designed to measure the equity market performance of developed and emerging markets. 4 A market capitalization weighted bond index consisting of government bond markets of 23 countries including the United States. |
| |
| |
| |
| | 5 | This customized weighted index is comprised of the returns of the MSCI All Country World Index (60%) and Citigroup WGBI (hedged into USD) (40%). |
|
Performance Summary for the Period Ended March 31, 2013 |
| | | | | | | | | | | | | | | | | | | | | | | | | | | | | | | | | | |
| | | | | | Average Annual Total Returns6 | | | |
| | | | | | 1 Year | | | | | 5 Years | | | | | 10 Years | | | |
| | | 6-Month
Total Returns | | | w/o sales
charge | | | w/sales
charge | | | | | w/o sales
charge | | | w/sales
charge | | | | | w/o sales
charge | | | w/sales
charge | | | |
Institutional | | | 5.58% | | | | 6.03% | | | | N/A | | | | | | 4.62% | | | | N/A | | | | | | 8.15% | | | | N/A | | | |
Service | | | 5.51 | | | | 5.74 | | | | N/A | | | | | | 4.36 | | | | N/A | | | | | | 7.87 | | | | N/A | | | |
Investor A | | | 5.49 | | | | 5.72 | | | | 0.20% | | | | | | 4.29 | | | | 3.17% | | | | | | 7.78 | | | | 7.21% | | | |
Investor B | | | 5.02 | | | | 4.82 | | | | 0.32 | | | | | | 3.42 | | | | 3.06 | | | | | | 7.12 | | | | 7.12 | | | |
Investor C | | | 5.09 | | | | 5.00 | | | | 4.00 | | | | | | 3.55 | | | | 3.55 | | | | | | 7.02 | | | | 7.02 | | | |
60% MSCI All Country World Index/40% Citigroup WGBI (hedged into USD) | | | 6.39 | | | | 8.45 | | | | N/A | | | | | | 3.60 | | | | N/A | | | | | | 7.76 | | | | N/A | | | |
MSCI All Country World Index | | | 9.57 | | | | 10.55 | | | | N/A | | | | | | 2.06 | | | | N/A | | | | | | 9.36 | | | | N/A | | | |
Citigroup WGBI (hedged into USD) | | | 1.69 | | | | 4.76 | | | | N/A | | | | | | 4.32 | | | | N/A | | | | | | 4.37 | | | | N/A | | | |
| | 6 | Assuming maximum sales charges, if any. Average annual total returns with and without sales charges reflect reductions for distribution and service fees. See “About Fund Performance” on page 6 for a detailed description of share classes, including any related sales charges and fees. |
N/A - Not applicable as share class and index do not have a sales charge.
Past performance is not indicative of future results.
| | | | | | | | | | | | | | | | | | | | | | | | | | | | | | | | | | | | | |
| | | Actual | | Hypothetical8 | | | | |
| | | Beginning
Account Value
October 1, 2012 | | Ending
Account Value
March 31, 2013 | | Expenses Paid
During the Period7 | | Beginning
Account Value
October 1, 2012 | | Ending
Account Value
March 31, 2013 | | Expenses Paid
During the Period7 | | | | Annualized
Expense Ratio |
Institutional | | | | $1,000.00 | | | | | $1,055.80 | | | | | $ 4.56 | | | | | $1,000.00 | | | | | $1,020.49 | | | | | $ 4.48 | | | | | | | 0.89 | % |
Service | | | | $1,000.00 | | | | | $1,055.10 | | | | | $ 5.99 | | | | | $1,000.00 | | | | | $1,019.10 | | | | | $ 5.89 | | | | | | | 1.17 | % |
Investor A | | | | $1,000.00 | | | | | $1,054.90 | | | | | $ 5.74 | | | | | $1,000.00 | | | | | $1,019.35 | | | | | $ 5.64 | | | | | | | 1.12 | % |
Investor B | | | | $1,000.00 | | | | | $1,050.20 | | | | | $10.38 | | | | | $1,000.00 | | | | | $1,014.81 | | | | | $10.20 | | | | | | | 2.03 | % |
Investor C | | | | $1,000.00 | | | | | $1,050.90 | | | | | $ 9.41 | | | | | $1,000.00 | | | | | $1,015.76 | | | | | $ 9.25 | | | | | | | 1.84 | % |
| | 7 | For each class of the Fund, expenses are equal to the annualized expense ratio for the class, multiplied by the average account value over the period, multiplied by 182/365 (to reflect the one-half year period shown). |
| | 8 | Hypothetical 5% annual return before expenses is calculated by pro rating the number of days in the most recent fiscal half year divided by 365. |
See “Disclosure of Expenses” on page 6 for further information on how expenses were calculated.
| | | | | | |
| | | | | MARCH 31, 2013 | | 5 |
| | BLACKROCK MANAGED VOLATILITY PORTFOLIO | | |
About Fund Performance
| — | | Institutional Shares are not subject to any sales charge. These shares bear no ongoing distribution or service fees and are available only to eligible investors. |
| — | | Service Shares are not subject to any sales charge (front-end load) or deferred sales charge. These shares are subject to a service fee of 0.25% per year (but no distribution fee). Prior to January 28, 2005, Service Shares performance results are those of Institutional Shares (which have no distribution or service fees) restated to reflect Service Share fees. |
| — | | Investor A Shares are subject to a maximum initial sales charge (front-end load) of 5.25% and a service fee of 0.25% per year (but no distribution fee). |
| — | | Investor B Shares are subject to a maximum contingent deferred sales charge (“CDSC”) of 4.50% declining to 0% after six years. In addition, these shares are subject to a distribution fee of 0.75% per year and a service fee of 0.25% per year. These shares automatically convert to Investor A Shares after approximately eight years. (There is no initial sales charge for automatic share conversions.) All returns for periods greater than eight years reflect this conversion. These shares are only available through exchanges and dividend reinvestments by existing shareholders and for purchase by certain employer-sponsored retirement plans. |
| — | | Investor C Shares are subject to a 1.00% CDSC if redeemed within one year of purchase. In addition, these shares are subject to a distribution fee of 0.75% per year and a service fee of 0.25% per year. |
Performance information reflects past performance and does not guarantee future results. Current performance may be lower or higher than the performance data quoted. Refer to www.blackrock.com/funds to obtain performance data current to the most recent month end. Performance results do not reflect the deduction of taxes that a shareholder would pay on fund distributions or the redemption of fund shares. Figures shown in the performance table on the previous page assume reinvestment of all dividends and distributions, if any, at net asset value (“NAV”) on the ex-dividend date. Investment return and principal value of shares will fluctuate so that shares, when redeemed, may be worth more or less than their original cost. Dividends paid to each class of shares will vary because of the different levels of service, distribution and transfer agency fees applicable to each class, which are deducted from the income available to be paid to shareholders.
Performance for the Fund for periods prior to January 28, 2005 is based on performance of a certain former State Street Research mutual fund that reorganized with the Fund on that date.
BlackRock Advisors, LLC (the “Manager”), the Fund’s investment advisor, waived and/or reimbursed a portion of the Fund’s expenses. Without such waiver and/or reimbursement, the Fund’s performance would have been lower. The Manager is under no obligation to waive or reimburse or to continue waiving or reimbursing its fees after the applicable termination date. See Note 3 of the Notes to Financial Statements for additional information on waivers and reimbursements.
Disclosure of Expenses
Shareholders of the Fund may incur the following charges: (a) transactional expenses, such as sales charges; and (b) operating expenses, including investment advisory fees, service and distribution fees, including 12b-1 fees, acquired fund fees and expenses and other Fund expenses. The expense example on the previous page (which is based on a hypothetical investment of $1,000 invested on October 1, 2012 and held through March 31, 2013) is intended to assist shareholders both in calculating expenses based on an investment in the Fund and in comparing these expenses with similar costs of investing in other mutual funds.
The expense example provides information about actual account values and actual expenses. In order to estimate the expenses a shareholder paid during the period covered by this report, shareholders can divide their account value by $1,000 and then multiply the result by the number corresponding to their share class under the heading entitled “Expenses Paid During the Period.”
The expense example also provides information about hypothetical account values and hypothetical expenses based on the Fund’s actual expense ratio and an assumed rate of return of 5% per year before expenses. In order to assist shareholders in comparing the ongoing expenses of investing in the Fund and other funds, compare the 5% hypothetical example with the 5% hypothetical examples that appear in other funds’ shareholder reports.
The expenses shown in the expense example are intended to highlight shareholders’ ongoing costs only and do not reflect any transactional expenses, such as sales charges, if any. Therefore, the hypothetical example is useful in comparing ongoing expenses only, and will not help shareholders determine the relative total expenses of owning different funds. If these transactional expenses were included, shareholder expenses would have been higher.
| | | | |
| | | | | MARCH 31, 2013 |
| 6 | | BLACKROCK MANAGED VOLATILITY PORTFOLIO | |
Derivative Financial Instruments
The Fund may invest in various derivative financial instruments, including financial futures contracts, foreign currency exchange contracts, options and swaps, as specified in Note 2 of the Notes to Financial Statements, which may constitute forms of economic leverage. Such derivative financial instruments are used to obtain exposure to a security, index and/ or market without owning or taking physical custody of securities or to hedge market, equity, credit, interest rate and/or foreign currency exchange rate risks. Derivative financial instruments involve risks, including the imperfect correlation between the value of a derivative financial instrument and the underlying asset, possible default of the counterparty to the transaction or illiquidity of the derivative financial instrument. The
Fund’s ability to use a derivative financial instrument successfully depends on the investment advisor’s ability to predict pertinent market movements accurately, which cannot be assured. The use of derivative financial instruments may result in losses greater than if they had not been used, may require the Fund to sell or purchase portfolio investments at inopportune times or for distressed values, may limit the amount of appreciation the Fund can realize on an investment, may result in lower dividends paid to shareholders or may cause the Fund to hold an investment that it might otherwise sell. The Fund’s investments in these instruments are discussed in detail in the Notes to Financial Statements.
| | | | | | |
| | | | | MARCH 31, 2013 | | 7 |
| | BLACKROCK MANAGED VOLATILITY PORTFOLIO | | |
| | |
|
Schedule of Investments March 31, 2013 (Unaudited) | | (Percentages shown are based on Net Assets) |
| | | | | | | | | | | | |
| Asset-Backed Securities | | | | | Par
(000) | | | Value | |
| |
Amortizing Residential Collateral Trust, Series 2002-BC5, Class M2, 2.00%, 7/25/32 (a) | | | USD | | | | 11 | | | $ | 6,115 | |
Home Equity Asset Trust, Series 2007-2, Class 2A1, 0.31%, 7/25/37 (a) | | | | | | | 16 | | | | 16,023 | |
Knollwood CDO Ltd., Series 2004-1A, Class C, 3.51%, 1/10/39 (a)(b) | | | | | | | 129 | | | | 1 | |
Santander Drive Auto Receivables Trust: | | | | | | | | | | | | |
Series 2010-B, Class B, 2.10%, 9/15/14 (b) | | | | | | | 166 | | | | 166,505 | |
Series 2011-S1A, Class B, 1.48%, 5/15/17 (b) | | | | | | | 104 | | | | 103,978 | |
Series 2011-S1A, Class D, 3.10%, 5/15/17 (b) | | | | | | | 81 | | | | 81,325 | |
| |
Total Asset-Backed Securities – 0.1% | | | | | | | | 373,947 | |
| |
| |
Common Stocks | | | | | Shares | | | | |
| |
Aerospace & Defense – 0.3% | | | | | | | | | | | | |
B/E Aerospace, Inc. (c) | | | | | | | 3,865 | | | | 233,021 | |
The Boeing Co. | | | | | | | 11,951 | | | | 1,025,993 | |
Northrop Grumman Corp. | | | | | | | 4,244 | | | | 297,717 | |
Spirit AeroSystems Holdings, Inc., Class A (c) | | | | 14,370 | | | | 272,886 | |
| | | | | | | | | | | | |
| | | | | | | | | | | 1,829,617 | |
| |
Air Freight & Logistics – 0.2% | | | | | | | | | | | | |
Expeditors International of Washington, Inc. | | | | | | | 7,623 | | | | 272,217 | |
United Parcel Service, Inc., Class B | | | | | | | 6,465 | | | | 555,343 | |
| | | | | | | | | | | | |
| | | | | | | | | | | 827,560 | |
| |
Auto Components – 0.1% | | | | | | | | | | | | |
Lear Corp. | | | | | | | 13,085 | | | | 717,974 | |
| |
Automobiles – 0.1% | | | | | | | | | | | | |
Hyundai Motor Co. | | | | | | | 3,973 | | | | 800,785 | |
| |
Beverages – 0.9% | | | | | | | | | | | | |
Anheuser-Busch InBev NV | | | | | | | 27,999 | | | | 2,783,479 | |
Beam, Inc. | | | | | | | 12,398 | | | | 787,769 | |
The Coca-Cola Co. | | | | | | | 1,848 | | | | 74,733 | |
| | | | | | | | |
Common Stocks | | Shares | | | Value | |
| |
Beverages (concluded) | | | | | | | | |
Coca-Cola Enterprises, Inc. | | | 162 | | | $ | 5,981 | |
Monster Beverage Corp. (c) | | | 806 | | | | 38,479 | |
Pernod-Ricard SA | | | 8,243 | | | | 1,027,348 | |
| | | | | | | | |
| | | | | | | 4,717,789 | |
| |
Biotechnology – 0.4% | | | | | | | | |
Alexion Pharmaceuticals, Inc. (c) | | | 1,204 | | | | 110,937 | |
Amgen, Inc. | | | 11,311 | | | | 1,159,491 | |
Biogen Idec, Inc. (c) | | | 2,885 | | | | 556,545 | |
Celgene Corp. (c) | | | 160 | | | | 18,546 | |
Myriad Genetics, Inc. (c) | | | 11,951 | | | | 303,555 | |
| | | | | | | | |
| | | | | | | 2,149,074 | |
| |
Building Products – 0.3% | | | | | | | | |
Assa Abloy AB, Class B | | | 37,563 | | | | 1,533,473 | |
| |
Capital Markets – 0.2% | | | | | | | | |
Credit Suisse Group AG | | | 42,487 | | | | 1,117,792 | |
Franklin Resources, Inc. | | | 1,201 | | | | 181,123 | |
Invesco Ltd. | | | 426 | | | | 12,337 | |
LPL Financial Holdings, Inc. | | | 1,918 | | | | 61,836 | |
| | | | | | | | |
| | | | | | | 1,373,088 | |
| |
Chemicals – 0.5% | | | | | | | | |
CF Industries Holdings, Inc. | | | 419 | | | | 79,765 | |
Cytec Industries, Inc. | | | 424 | | | | 31,410 | |
Eastman Chemical Co. | | | 2,981 | | | | 208,282 | |
Linde AG | | | 5,150 | | | | 959,292 | |
LyondellBasell Industries NV, Class A | | | 8,926 | | | | 564,927 | |
Monsanto Co. | | | 7,086 | | | | 748,494 | |
The Valspar Corp. | | | 2,158 | | | | 134,335 | |
| | | | | | | | |
| | | | | | | 2,726,505 | |
| |
Commercial Banks – 1.1% | | | | | | | | |
Bank Rakyat Indonesia Persero Tbk PT | | | 705,500 | | | | 636,520 | |
BB&T Corp. | | | 3,401 | | | | 106,757 | |
BNP Paribas SA | | | 9,775 | | | | 502,587 | |
BOK Financial Corp. | | | 1,559 | | | | 97,126 | |
CIT Group, Inc. (c) | | | 9,931 | | | | 431,800 | |
First Citizens BancShares, Inc., Class A | | | 881 | | | | 160,959 | |
| | | | | | | | |
Portfolio Abbreviations |
To simplify the listings of portfolio holdings in the Schedule of Investments, the names and descriptions of many of the securities have been abbreviated according to the following list: | | ADR | | American Depositary Receipts | | LIBOR | | London Interbank Offered Rate |
| | AUD | | Australian Dollar | | MXN | | Mexican Peso |
| | BRL | | Brazilian Real | | MYR | | Malaysian Ringgit |
| | CAD | | Canadian Dollar | | NOK | | Norwegian Krone |
| | CDO | | Collateralized Debt Obligation | | NZD | | New Zealand Dollar |
| | CLP | | Chilean Peso | | PHP | | Philippine Peso |
| | COP | | Colombian Peso | | PLN | | Polish Zloty |
| | CZK | | Czech Koruna | | RON | | Romanian Leu |
| | DKK | | Danish Krone | | RUB | | Russian Ruble |
| | ETF | | Exchange Traded Fund | | SEK | | Swedish Krona |
| | EUR | | Euro | | SGD | | Singapore Dollar |
| | EURIBOR FEDL01 | | Euro Interbank Offered Rate US OverNight Federal Funds | | SPDR | | Standard & Poor’s Depositary Receipts |
| | GBP HUF IDR ILS INR JPY KRW | | Effective Rate British Pound Hungarian Forint Indonesian Rupiah Israeli Shekel Indian Rupee Japanese Yen South Korean Won | | STIBOR | | Stockholm Interbank Offered Rate |
| | | | TBA | | To-Be-Announced |
| | | | THB | | Thai Baht |
| | | | TRY | | Turkish Lira |
| | | | TWD | | Taiwan Dollar |
| | | | USD | | US Dollar |
| | | | ZAR | | South African Rand |
| | | | | | |
See Notes to Financial Statements.
| | | | |
| | | | | MARCH 31, 2013 |
| 8 | | BLACKROCK MANAGED VOLATILITY PORTFOLIO | |
| | |
| Schedule of Investments (continued) | | (Percentages shown are based on Net Assets) |
| | | | | | | | |
| Common Stocks | | Shares | | | Value | |
| |
Commercial Banks (concluded) | | | | | | | | |
First Republic Bank | | | 15,055 | | | $ | 581,424 | |
HSBC Holdings Plc | | | 77,492 | | | | 826,998 | |
ICICI Bank Ltd. - ADR | | | 11,021 | | | | 472,801 | |
Mitsubishi UFJ Financial Group, Inc. | | | 176,900 | | | | 1,048,101 | |
Sberbank of Russia - ADR | | | 74,125 | | | | 945,094 | |
U.S. Bancorp | | | 3,793 | | | | 128,696 | |
Wells Fargo & Co. | | | 8,114 | | | | 300,137 | |
| | | | | | | | |
| | | | | | | 6,239,000 | |
| |
Commercial Services & Supplies — 0.1% | | | | | | | | |
The ADT Corp. | | | 16,167 | | | | 791,213 | |
| |
Communications Equipment — 0.2% | | | | | | | | |
Cisco Systems, Inc. | | | 20,936 | | | | 437,772 | |
QUALCOMM, Inc. | | | 10,265 | | | | 687,242 | |
| | | | | | | | |
| | | | | | | 1,125,014 | |
| |
Computers & Peripherals — 0.6% | | | | | | | | |
Apple, Inc. | | | 6,595 | | | | 2,919,145 | |
Dell, Inc. | | | 7,652 | | | | 109,653 | |
Western Digital Corp. | | | 7,017 | | | | 352,815 | |
| | | | | | | | |
| | | | | | | 3,381,613 | |
| |
Consumer Finance — 0.1% | | | | | | | | |
Capital One Financial Corp. | | | 14,857 | | | | 816,392 | |
| |
Containers & Packaging — 0.1% | | | | | | | | |
Ball Corp. | | | 3,991 | | | | 189,892 | |
Crown Holdings, Inc. (c) | | | 1,526 | | | | 63,497 | |
Greif, Inc., Class A | | | 3,065 | | | | 164,345 | |
| | | | | | | | |
| | | | | | | 417,734 | |
| |
Diversified Consumer Services — 0.1% | | | | | | | | |
Apollo Group, Inc., Class A (c) | | | 530 | | | | 9,217 | |
Service Corp. International | | | 29,811 | | | | 498,738 | |
| | | | | | | | |
| | | | | | | 507,955 | |
| |
Diversified Financial Services — 0.7% | | | | | | | | |
Citigroup, Inc. | | | 27,516 | | | | 1,217,308 | |
JPMorgan Chase & Co. | | | 35,656 | | | | 1,692,234 | |
The McGraw-Hill Cos., Inc. | | | 6,789 | | | | 353,571 | |
Moody’s Corp. | | | 5,915 | | | | 315,388 | |
NYSE Euronext | | | 1,289 | | | | 49,807 | |
| | | | | | | | |
| | | | | | | 3,628,308 | |
| |
Diversified Telecommunication Services — 0.2% | | | | | | | | |
AT&T Inc. | | | 8,774 | | | | 321,918 | |
Verizon Communications, Inc. | | | 10,307 | | | | 506,589 | |
| | | | | | | | |
| | | | | | | 828,507 | |
| |
Electric Utilities — 0.1% | | | | | | | | |
Duke Energy Corp. | | | 640 | | | | 46,458 | |
Xcel Energy, Inc. | | | 15,214 | | | | 451,856 | |
| | | | | | | | |
| | | | | | | 498,314 | |
| |
Electrical Equipment — 0.0% | | | | | | | | |
Sensata Technologies Holding NV (c) | | | 5,888 | | | | 193,539 | |
| |
Electronic Equipment, Instruments & Components — 0.1% | | | | | | | | |
Corning, Inc. | | | 19,482 | | | | 259,695 | |
Ingram Micro, Inc., Class A (c) | | | 983 | | | | 19,345 | |
Tech Data Corp. (c) | | | 264 | | | | 12,041 | |
| | | | | | | | |
| | | | | | | 291,081 | |
| |
| | | | | | | | |
| Common Stocks | | Shares | | | Value | |
| |
Energy Equipment & Services — 0.2% | | | | | | | | |
National Oilwell Varco, Inc. | | | 9,160 | | | $ | 648,070 | |
Schlumberger Ltd. | | | 3,497 | | | | 261,890 | |
| | | | | | | | |
| | | | | | | 909,960 | |
| |
Food & Staples Retailing — 0.3% | | | | | | | | |
Costco Wholesale Corp. | | | 6,534 | | | | 693,323 | |
CVS Caremark Corp. | | | 19,843 | | | | 1,091,167 | |
Whole Foods Market, Inc. | | | 543 | | | | 47,105 | |
| | | | | | | | |
| | | | | | | 1,831,595 | |
| |
Food Products — 0.8% | | | | | | | | |
H.J. Heinz Co. | | | 1,684 | | | | 121,703 | |
Ingredion, Inc. | | | 2,942 | | | | 212,765 | |
Mead Johnson Nutrition Co. | | | 10,680 | | | | 827,166 | |
Mondelez International, Inc., Class A | | | 8,410 | | | | 257,430 | |
Nestle SA | | | 31,236 | | | | 2,261,408 | |
Want Want China Holdings Ltd. | | | 560,000 | | | | 862,561 | |
| | | | | | | | |
| | | | | | | 4,543,033 | |
| |
Health Care Equipment & Supplies — 0.2% | |
Abbott Laboratories | | | 14,411 | | | | 508,997 | |
Baxter International, Inc. | | | 5,205 | | | | 378,091 | |
Thoratec Corp. (c) | | | 1,752 | | | | 65,700 | |
| | | | | | | | |
| | | | | | | 952,788 | |
| |
Health Care Providers & Services — 0.4% | |
Cardinal Health, Inc. | | | 2,809 | | | | 116,911 | |
Catamaran Corp. (c) | | | 4,790 | | | | 254,014 | |
Coventry Health Care, Inc. | | | 708 | | | | 33,297 | |
Express Scripts Holding Co. (c) | | | 13,410 | | | | 773,087 | |
HCA Holdings, Inc. | | | 9,093 | | | | 369,449 | |
Humana, Inc. | | | 6,167 | | | | 426,201 | |
UnitedHealth Group, Inc. | | | 3,274 | | | | 187,306 | |
| | | | | | | | |
| | | | | | | 2,160,265 | |
| |
Hotels, Restaurants & Leisure — 0.2% | | | | | | | | |
Starbucks Corp. | | | 15,015 | | | | 855,254 | |
| |
Household Durables — 0.1% | | | | | | | | |
NVR, Inc. (c) | | | 502 | | | | 542,215 | |
| |
Household Products — 0.1% | | | | | | | | |
The Procter & Gamble Co. | | | 6,524 | | | | 502,739 | |
| |
Independent Power Producers & Energy Traders — 0.1% | | | | | | | | |
AES Corp. | | | 16,855 | | | | 211,867 | |
NRG Energy, Inc. | | | 9,344 | | | | 247,523 | |
| | | | | | | | |
| | | | | | | 459,390 | |
| |
Industrial Conglomerates — 0.1% | | | | | | | | |
General Electric Co. | | | 23,108 | | | | 534,257 | |
| |
Insurance — 0.9% | | | | | | | | |
ACE Ltd. | | | 9,255 | | | | 823,417 | |
Allied World Assurance Co. Holdings Ltd. | | | 2,271 | | | | 210,567 | |
American International Group, Inc. (c) | | | 8,181 | | | | 317,586 | |
Berkshire Hathaway, Inc., Class B (c) | | | 2,502 | | | | 260,708 | |
China Life Insurance Co. Ltd., H Shares | | | 151,000 | | | | 393,916 | |
Marsh & McLennan Cos., Inc. | | | 22,587 | | | | 857,628 | |
Prudential Financial, Inc. | | | 2,453 | | | | 144,703 | |
Reinsurance Group of America, Inc. | | | 7,287 | | | | 434,815 | |
Zurich Insurance Group AG | | | 4,960 | | | | 1,385,020 | |
| | | | | | | | |
| | | | | | | 4,828,360 | |
| |
See Notes to Financial Statements.
| | | | | | |
| | | | | MARCH 31, 2013 | | 9 |
| | BLACKROCK MANAGED VOLATILITY PORTFOLIO | | |
| | |
| Schedule of Investments (continued) | | (Percentages shown are based on Net Assets) |
| | | | | | | | |
| Common Stocks | | Shares | | | Value | |
| |
Internet & Catalog Retail – 0.3% | |
Liberty Ventures, Series A (c) | | | 3,137 | | | $ | 237,094 | |
priceline.com, Inc. (c) | | | 1,323 | | | | 910,131 | |
TripAdvisor, Inc. (c) | | | 4,627 | | | | 243,010 | |
| | | | | | | | |
| | | | | | | 1,390,235 | |
| |
Internet Software & Services – 0.8% | |
eBay, Inc. (c) | | | 644 | | | | 34,918 | |
Google, Inc., Class A (c) | | | 2,244 | | | | 1,781,803 | |
IAC/InterActiveCorp. | | | 4,904 | | | | 219,111 | |
Marin Software, Inc. (c) | | | 136 | | | | 2,234 | |
MercadoLibre, Inc. (d) | | | 14,000 | | | | 1,351,840 | |
VeriSign, Inc. (c) | | | 7,084 | | | | 334,932 | |
Yandex NV (c) | | | 20,467 | | | | 473,197 | |
| | | | | | | | |
| | | | | | | 4,198,035 | |
| |
IT Services – 0.5% | |
Computer Sciences Corp. | | | 655 | | | | 32,246 | |
CoreLogic, Inc. (c) | | | 19,734 | | | | 510,321 | |
Fidelity National Information Services, Inc. | | | 7,536 | | | | 298,576 | |
International Business Machines Corp. | | | 2,050 | | | | 437,265 | |
Lender Processing Services, Inc. | | | 3,511 | | | | 89,390 | |
Mastercard, Inc., Class A | | | 1,579 | | | | 854,444 | |
Total System Services, Inc. | | | 14,931 | | | | 369,990 | |
| | | | | | | | |
| | | | | | | 2,592,232 | |
| |
Life Sciences Tools & Services – 0.1% | |
Agilent Technologies, Inc. | | | 10,472 | | | | 439,510 | |
| |
Machinery – 0.7% | |
Atlas Copco AB, A Shares | | | 42,952 | | | | 1,220,441 | |
Cummins, Inc. | | | 6,472 | | | | 749,522 | |
FANUC Corp. | | | 6,800 | | | | 1,046,209 | |
Ingersoll-Rand Plc | | | 222 | | | | 12,212 | |
Railpower Technologies Corp. (c) | | | 17,600 | | | | 1,038 | |
Snap-On, Inc. | | | 486 | | | | 40,192 | |
WABCO Holdings, Inc. (c) | | | 4,203 | | | | 296,690 | |
Wabtec Corp. | | | 5,174 | | | | 528,317 | |
Xylem, Inc. | | | 7,787 | | | | 214,610 | |
| | | | | | | | |
| | | | | | | 4,109,231 | |
| |
Media – 1.5% | |
AMC Networks, Inc., Class A (c) | | | 8,334 | | | | 526,542 | |
British Sky Broadcasting Group Plc | | | 162,163 | | | | 2,180,117 | |
CBS Corp., Class B | | | 19,194 | | | | 896,168 | |
Comcast Corp., Class A | | | 10,289 | | | | 432,241 | |
DIRECTV (c) | | | 13,388 | | | | 757,895 | |
ITV Plc | | | 672,626 | | | | 1,326,537 | |
Lamar Advertising Co., Class A (c) | | | 785 | | | | 38,159 | |
Liberty Global, Inc., Class A (c) | | | 19,714 | | | | 1,447,008 | |
Time Warner, Inc. | | | 8,804 | | | | 507,287 | |
| | | | | | | | |
| | | | | | | 8,111,954 | |
| |
Metals & Mining – 0.4% | |
POSCO | | | 1,420 | | | | 416,538 | |
Rio Tinto Plc | | | 32,225 | | | | 1,518,163 | |
| | | | | | | | |
| | | | | | | 1,934,701 | |
| |
Multiline Retail – 0.0% | |
Dollar Tree, Inc. (c) | | | 5,156 | | | | 249,705 | |
| |
Multi-Utilities – 0.0% | |
Ameren Corp. | | | 3,792 | | | | 132,796 | |
| |
| | | | | | | | |
| Common Stocks | | Shares | | | Value | |
| |
Oil, Gas & Consumable Fuels – 1.4% | |
Anadarko Petroleum Corp. | | | 978 | | | $ | 85,526 | |
Apache Corp. | | | 5,415 | | | | 417,821 | |
Chevron Corp. | | | 10,897 | | | | 1,294,782 | |
ConocoPhillips | | | 18,652 | | | | 1,120,985 | |
EQT Corp. | | | 4,334 | | | | 293,629 | |
Exxon Mobil Corp. | | | 31,900 | | | | 2,874,509 | |
Longview Energy Co. (Acquired 8/13/04, cost $48,000) (c)(e) | | | 3,200 | | | | 51,844 | |
Marathon Petroleum Corp. | | | 4,942 | | | | 442,803 | |
Matador Resources Co. (Acquired 4/13/06, cost $8,451) (c)(e) | | | 939 | | | | 8,320 | |
Royal Dutch Shell Plc, B Shares | | | 33,546 | | | | 1,115,832 | |
| | | | | | | | |
| | | | | | | 7,706,051 | |
| |
Paper & Forest Products – 0.1% | |
Ainsworth Lumber Co. Ltd. (b)(c) | | | 26,991 | | | | 107,694 | |
Ainsworth Lumber Co. Ltd. (c) | | | 19,432 | | | | 77,854 | |
Boise Cascade Co. (c) | | | 300 | | | | 10,182 | |
Domtar Corp. | | | 4,293 | | | | 333,223 | |
| | | | | | | | |
| | | | | | | 528,953 | |
| |
Personal Products – 0.1% | |
The Estee Lauder Cos., Inc., Class A | | | 8,397 | | | | 537,660 | |
| |
Pharmaceuticals – 1.5% | |
AbbVie, Inc. | | | 26,937 | | | | 1,098,491 | |
Actavis, Inc. (c) | | | 5,099 | | | | 469,669 | |
Allergan, Inc. | | | 6,602 | | | | 736,981 | |
Johnson & Johnson | | | 5,667 | | | | 462,030 | |
Merck & Co., Inc. | | | 10,326 | | | | 456,719 | |
Pfizer, Inc. | | | 14,364 | | | | 414,545 | |
Roche Holding AG | | | 11,372 | | | | 2,651,915 | |
Sanofi-Aventis SA | | | 19,556 | | | | 1,987,052 | |
Zoetis, Inc. (c) | | | 2,089 | | | | 69,773 | |
| | | | | | | | |
| | | | | | | 8,347,175 | |
| |
Professional Services – 0.1% | |
Equifax, Inc. | | | 4,442 | | | | 255,815 | |
Nielsen Holdings NV | | | 10,517 | | | | 376,719 | |
| | | | | | | | |
| | | | | | | 632,534 | |
| |
Real Estate Investment Trusts (REITs) – 0.3% | |
American Tower Corp. | | | 10,922 | | | | 840,120 | |
CommonWealth REIT | | | 2,935 | | | | 65,861 | |
Federal Realty Investment Trust | | | 2,008 | | | | 216,944 | |
HCP, Inc. | | | 2,973 | | | | 148,234 | |
Potlatch Corp. | | | 4,876 | | | | 223,613 | |
Prologis, Inc. | | | 189 | | | | 7,556 | |
Weyerhaeuser Co. | | | 5,807 | | | | 182,224 | |
| | | | | | | | |
| | | | | | | 1,684,552 | |
| |
Real Estate Management & Development – 0.0% | |
Alexander & Baldwin, Inc. (c) | | | 5,086 | | | | 181,825 | |
| |
Road & Rail – 0.2% | | | | | | | | |
Union Pacific Corp. | | | 7,806 | | | | 1,111,652 | |
| |
Semiconductors & Semiconductor Equipment – 0.7% | |
ASML Holding NV | | | 13,720 | | | | 924,087 | |
Avago Technologies Ltd. | | | 10,290 | | | | 369,617 | |
First Solar, Inc. (c) | | | 2,237 | | | | 60,310 | |
Intel Corp. | | | 4,860 | | | | 106,191 | |
KLA-Tencor Corp. | | | 108 | | | | 5,696 | |
See Notes to Financial Statements.
| | | | |
| | | | | MARCH 31, 2013 |
| 10 | | BLACKROCK MANAGED VOLATILITY PORTFOLIO | |
| | |
| Schedule of Investments (continued) | | (Percentages shown are based on Net Assets) |
| | | | | | | | |
Common Stocks | | Shares | | | Value | |
| |
Semiconductors & Semiconductor Equipment (concluded) | |
Maxim Integrated Products, Inc. | | | 9,766 | | | $ | 318,860 | |
NXP Semiconductor NV (c) | | | 7,683 | | | | 232,488 | |
Samsung Electronics Co. Ltd. | | | 892 | | | | 1,225,612 | |
Skyworks Solutions, Inc. (c) | | | 812 | | | | 17,888 | |
Veeco Instruments, Inc. (c) | | | 20,734 | | | | 794,734 | |
| | | | | | | | |
| | | | | | | 4,055,483 | |
| |
Software – 0.5% | | | | | | | | |
Autodesk, Inc. (c) | | | 11,860 | | | | 489,106 | |
Fair Isaac Corp. | | | 193 | | | | 8,818 | |
Microsoft Corp. | | | 65,725 | | | | 1,880,392 | |
Oracle Corp. | | | 2,028 | | | | 65,586 | |
Silver Spring Networks, Inc. (c) | | | 167 | | | | 2,894 | |
Synopsys, Inc. (c) | | | 4,574 | | | | 164,115 | |
| | | | | | | | |
| | | | | | | 2,610,911 | |
| |
Specialty Retail – 0.7% | |
The Home Depot, Inc. | | | 9,955 | | | | 694,660 | |
Kingfisher Plc | | | 283,856 | | | | 1,244,523 | |
Ross Stores, Inc. | | | 13,623 | | | | 825,826 | |
TJX Cos., Inc. | | | 19,558 | | | | 914,337 | |
| | | | | | | | |
| | | | | | | 3,679,346 | |
| |
Textiles, Apparel & Luxury Goods – 0.3% | |
Coach, Inc. | | | 10,460 | | | | 522,895 | |
Michael Kors Holdings Ltd. (c) | | | 3,773 | | | | 214,269 | |
The Swatch Group AG | | | 1,277 | | | | 744,724 | |
| | | | | | | | |
| | | | | | | 1,481,888 | |
| |
Thrifts & Mortgage Finance – 0.1% | |
LIC Housing Finance Ltd. | | | 109,577 | | | | 454,642 | |
| |
Tobacco – 1.1% | | | | | | | | |
Imperial Tobacco Group Plc | | | 72,444 | | | | 2,534,333 | |
Japan Tobacco, Inc. | | | 52,300 | | | | 1,665,959 | |
Lorillard, Inc. | | | 12,901 | | | | 520,555 | |
Philip Morris International, Inc. | | | 16,787 | | | | 1,556,323 | |
| | | | | | | | |
| | | | | | | 6,277,170 | |
| |
Trading Companies & Distributors – 0.0% | |
MRC Global, Inc. (c) | | | 4,235 | | | | 139,459 | |
W.W. Grainger, Inc. | | | 242 | | | | 54,445 | |
| | | | | | | | |
| | | | | | | 193,904 | |
| |
Water Utilities – 0.1% | | | | | | | | |
American Water Works Co., Inc. | | | 18,170 | | | | 752,965 | |
| |
Wireless Telecommunication Services – 0.7% | |
Crown Castle International Corp. (c) | | | 11,994 | | | | 835,262 | |
Telephone & Data Systems, Inc. | | | 9,763 | | | | 205,706 | |
Vodafone Group Plc | | | 955,365 | | | | 2,711,647 | |
| | | | | | | | |
| | | | | | | 3,752,615 | |
| |
Total Common Stocks – 22.0% | | | | | | | 120,662,116 | |
|
| |
| |
| | |
| Corporate Bonds | | Par (000) | | | | |
| |
Aerospace & Defense – 0.0% | | | | | | | | |
Thales SA, 2.25%, 3/19/21 | | EUR | 200 | | | | 258,554 | |
| |
| | | | | | | | |
| Corporate Bonds | | Par (000) | | | Value | |
| |
Automobiles – 0.1% | | | | | | | | |
Ford Motor Co., 4.75%, 1/15/43 | | USD | 250 | | | $ | 232,676 | |
Volkswagen International Finance NV, 2.00%, 1/14/20 | | EUR | 400 | | | | 521,253 | |
| | | | | | | | |
| | | | | | | 753,929 | |
| |
Beverages – 0.0% | | | | | | | | |
SABMiller Holdings, Inc., 4.95%, 1/15/42 (b) | | USD | 200 | | | | 220,630 | |
| |
Capital Markets – 0.4% | | | | | | | | |
The Goldman Sachs Group, Inc., 5.75%, 1/24/22 | | | 700 | | | | 813,907 | |
Jefferies Group LLC, 5.13%, 1/20/23 | | | 350 | | | | 370,572 | |
Morgan Stanley, 3.75%, 2/25/23 | | | 650 | | | | 657,011 | |
Prosegur Cia de Seguridad SA, 2.75%, 4/02/18 | | EUR | 200 | | | | 255,544 | |
| | | | | | | | |
| | | | | | | 2,097,034 | |
| |
Chemicals – 0.2% | | | | | | | | |
Brenntag Finance BV, 5.50%, 7/19/18 | | | 400 | | | | 579,963 | |
INEOS Finance Plc, 7.50%, 5/01/20 | | USD | 150 | | | | 163,313 | |
INEOS Group Holdings SA, 7.88%, 2/15/16 | | EUR | 200 | | | | 258,283 | |
| | | | | | | | |
| | | | | | | 1,001,559 | |
| |
Commercial Banks – 2.8% | | | | | | | | |
Abbey National Treasury Services Plc, 4.25%, 4/12/22 | | | 500 | | | | 761,337 | |
Asian Development Bank, 2.35%, 6/21/27 | | JPY | 20,000 | | | | 252,151 | |
Banco Bilbao Vizcaya Argentaria SA, 3.50%, 12/05/17 | | EUR | 500 | | | | 657,347 | |
Banco de Sabadell SA, 3.38%, 1/23/18 | | | 200 | | | | 257,203 | |
Banco Popolare SC, 3.75%, 1/28/16 | | | 250 | | | | 310,035 | |
Bankinter SA, 3.88%, 10/30/15 | | | 300 | | | | 396,360 | |
Barclays Bank Plc, 4.13%, 3/15/16 | | | 400 | | | | 558,043 | |
BBVA Senior Finance SAU, 3.75%, 1/17/18 | | | 200 | | | | 252,570 | |
BNP Paribas SA: | | | | | | | | |
2.88%, 11/27/17 | | | 600 | | | | 810,423 | |
2.50%, 8/23/19 | | | 200 | | | | 260,356 | |
Canadian Imperial Bank of Commerce, 2.60%, 7/02/15 (b) | | USD | 290 | | | | 303,282 | |
Carrefour Banque SA, 2.88%, 9/25/15 | | EUR | 200 | | | | 267,281 | |
Danske Bank A/S, 3.88%, 5/18/16 | | | 500 | | | | 688,543 | |
European Investment Bank, 2.15%, 1/18/27 | | JPY | 20,000 | | | | 238,022 | |
HSBC Bank Brasil SA - Banco Multiplo, 4.00%, 5/11/16 (b) | | USD | 680 | | | | 706,350 | |
HSBC Holdings Plc, 6.10%, 1/14/42 | | | 150 | | | | 190,223 | |
Hypo Alpe-Adria-Bank International AG, 2.38%, 12/13/22 | | EUR | 1,500 | | | | 1,944,938 | |
ING Bank NV: | | | | | | | | |
3.38%, 1/11/18 | | | 250 | | | | 355,415 | |
2.63%, 12/05/22 (b) | | USD | 500 | | | | 497,370 | |
Intesa Sanpaolo SpA: | | | | | | | | |
4.38%, 10/15/19 | | EUR | 400 | | | | 506,582 | |
3.38%, 1/24/25 | | | 200 | | | | 258,166 | |
KBC Internationale Financieringsmaatschappij NV, 4.50%, 3/27/17 | | | 500 | | | | 710,304 | |
Lloyds TSB Bank Plc: | | | | | | | | |
6.50%, 3/24/20 | | | 300 | | | | 424,681 | |
4.00%, 9/29/21 | | | 250 | | | | 374,641 | |
Société Générale SA, 2.38%, 2/28/18 | | | 600 | | | | 786,500 | |
Société Générale SFH, 2.88%, 3/14/19 | | | 500 | | | | 694,991 | |
SpareBank 1 SR Bank ASA, 2.13%, 2/03/20 | | | 150 | | | | 191,308 | |
Sumitomo Mitsui Banking Corp., 4.85%, 3/01/22 | | USD | 200 | | | | 219,373 | |
Swedbank AB, 3.00%, 12/05/22 (a) | | EUR | 250 | | | | 327,932 | |
See Notes to Financial Statements.
| | | | | | |
| | | | | MARCH 31, 2013 | | 11 |
| | BLACKROCK MANAGED VOLATILITY PORTFOLIO | | |
| | |
| Schedule of Investments (continued) | | (Percentages shown are based on Net Assets) |
| | | | | | | | | | | | |
| Corporate Bonds | | | | | Par
(000) | | | Value | |
| |
Commercial Banks (concluded) | |
Turkiye Garanti Bankasi AS, 5.25%, 9/13/22 | | | USD | | | | 300 | | | $ | 312,375 | |
Wells Fargo & Co., 3.50%, 3/08/22 | | | | | | | 540 | | | | 567,539 | |
| | | | | | | | | | | | |
| | | | | | | | | | | 15,081,641 | |
| |
Commercial Services & Supplies – 0.2% | |
Cegedim SA, 6.75%, 4/01/20 | | | EUR | | | | 200 | | | | 253,412 | |
Edenred SA, 3.63%, 10/06/17 | | | | | | | 600 | | | | 831,197 | |
La Financiere Atalian SA, 7.25%, 1/15/20 | | | | | | | 100 | | | | 130,359 | |
| | | | | | | | | | | | |
| | | | | | | | | | | 1,214,968 | |
| |
Diversified Financial Services – 1.0% | |
Bank of America Corp., 5.70%, 1/24/22 | | | USD | | | | 600 | | | | 702,805 | |
Banque PSA Finance SA, 0.63%, 4/08/16 | | | EUR | | | | 1,200 | | | | 1,538,735 | |
Citigroup, Inc.: | | | | | | | | | | | | |
5.00%, 9/15/14 | | | USD | | | | 140 | | | | 147,004 | |
4.59%, 12/15/15 | | | | | | | 700 | | | | 758,778 | |
JPMorgan Chase Bank, NA, 6.00%, 10/01/17 | | | | | | | 445 | | | | 524,187 | |
Nationwide Building Society: | | | | | | | | | | | | |
3.13%, 4/03/17 | | | EUR | | | | 500 | | | | 685,219 | |
4.13%, 3/20/23 (a) | | | | | | | 150 | | | | 190,477 | |
Old Mutual Plc, 7.13%, 10/19/16 | | | GBP | | | | 200 | | | | 349,390 | |
RCI Banque SA, 2.88%, 1/22/18 | | | EUR | | | | 350 | | | | 451,646 | |
| | | | | | | | | | | | |
| | | | | | | | | | | 5,348,241 | |
| |
Diversified Telecommunication Services – 0.2% | |
Bharti Airtel International Netherlands BV, 5.13%, 3/11/23 | | | USD | | | | 300 | | | | 301,200 | |
Iliad SA, 4.88%, 6/01/16 | | | EUR | | | | 300 | | | | 412,665 | |
Verizon Communications, Inc.: | | | | | | | | | | | | |
3.50%, 11/01/21 | | | USD | | | | 240 | | | | 249,400 | |
6.40%, 2/15/38 | | | | | | | 200 | | | | 240,554 | |
| | | | | | | | | | | | |
| | | | | | | | | | | 1,203,819 | |
| |
Electric Utilities – 0.5% | | | | | | | | | | | | |
Alabama Power Co., 3.95%, 6/01/21 | | | | | | | 220 | | | | 245,322 | |
Duke Energy Carolinas LLC, 4.25%, 12/15/41 | | | | | | | 185 | | | | 189,647 | |
EDP Finance BV, 5.75%, 9/21/17 | | | EUR | | | | 300 | | | | 412,419 | |
Energa Finance AB, 3.25%, 3/19/20 | | | | | | | 300 | | | | 395,548 | |
ESB Finance Ltd., 6.25%, 9/11/17 | | | | | | | 200 | | | | 297,702 | |
Georgia Power Co., 3.00%, 4/15/16 | | | USD | | | | 390 | | | | 415,613 | |
MidAmerican Energy Holdings Co., 6.50%, 9/15/37 | | | | | | | 150 | | | | 194,736 | |
PacifiCorp, 6.25%, 10/15/37 | | | | | | | 100 | | | | 133,439 | |
Perusahaan Listrik Negara PT, 5.25%, 10/24/42 | | | | | | | 200 | | | | 189,500 | |
| | | | | | | | | | | | |
| | | | | | | | | | | 2,473,926 | |
| |
Energy Equipment & Services – 0.0% | |
ENCE Energia y Celulosa SA, 7.25%, 2/15/20 | | | EUR | | | | 150 | | | | 194,770 | |
| |
Food & Staples Retailing – 0.1% | | | | | | | | | | | | |
Casino Guichard Perrachon SA: | | | | | | | | | | | | |
3.16%, 8/06/19 | | | | | | | 200 | | | | 270,786 | |
3.31%, 1/25/23 | | | | | | | 100 | | | | 132,596 | |
| | | | | | | | | | | | |
| | | | | | | | | | | 403,382 | |
| |
Food Products – 0.1% | | | | | | | | | | | | |
Barry Callebaut Services NV, 5.38%, 6/15/21 | | | | | | | 500 | | | | 712,179 | |
| |
Gas Utilities – 0.1% | | | | | | | | | | | | |
Gas Natural Finance BV, 3.88%, 1/17/23 | | | | | | | 100 | | | | 128,205 | |
KeySpan Gas East Corp., 5.82%, 4/01/41 (b) | | | USD | | | | 185 | | | | 231,193 | |
| | | | | | | | | | | | |
| | | | | | | | | | | 359,398 | |
| |
| | | | | | | | | | | | |
| Corporate Bonds | | | | | Par
(000) | | | Value | |
| |
Health Care Equipment & Supplies – 0.1% | |
Covidien International Finance SA, 3.20%, 6/15/22 | | | USD | | | | 500 | | | $ | 521,519 | |
| |
Hotels, Restaurants & Leisure – 0.2% | |
William Hill Plc, 7.13%, 11/11/16 | | | GBP | | | | 350 | | | | 593,900 | |
Wyndham Worldwide Corp.: | | | | | | | | | | | | |
4.25%, 3/01/22 | | | USD | | | | 330 | | | | 345,616 | |
4.00%, 3/01/23 | | | | | | | 200 | | | | 200,654 | |
| | | | | | | | | | | | |
| | | | | | | | | | | 1,140,170 | |
| |
Household Durables – 0.1% | | | | | | | | | | | | |
NVR, Inc., 3.95%, 9/15/22 | | | | | | | 550 | | | | 564,581 | |
| |
Household Products – 0.0% | | | | | | | | | | | | |
Zobele Holding SpA, 7.88%, 2/01/18 | | | EUR | | | | 100 | | | | 132,346 | |
| |
Industrial Conglomerates – 0.1% | | | | | | | | | | | | |
Smiths Group Plc, 4.13%, 5/05/17 | | | | | | | 500 | | | | 703,417 | |
| |
Insurance – 0.3% | | | | | | | | | | | | |
AIA Group Ltd., 3.13%, 3/13/23 | | | USD | | | | 600 | | | | 591,743 | |
Allianz Finance II BV, 5.75%, 7/08/41 (a) | | | EUR | | | | 100 | | | | 142,923 | |
Aviva Plc, 6.13%, 11/14/36 (a) | | | GBP | | | | 100 | | | | 154,319 | |
AXA SA, 5.25%, 4/16/40 (a) | | | EUR | | | | 200 | | | | 264,919 | |
Hannover Finance Luxembourg SA, 5.00%, 6/30/43 (a) | | | | | | | 100 | | | | 136,481 | |
Talanx AG, 3.13%, 2/13/23 | | | | | | | 100 | | | | 133,946 | |
| | | | | | | | | | | | |
| | | | | | | | | | | 1,424,331 | |
| |
IT Services – 0.1% | | | | | | | | | | | | |
Cerved Technologies SpA, 6.38%, 1/15/20 | | | | | | | 100 | | | | 126,283 | |
Computer Sciences Corp., 4.45%, 9/15/22 | | | USD | | | | 300 | | | | 318,071 | |
| | | | | | | | | | | | |
| | | | | | | | | | | 444,354 | |
| |
Leisure Equipment & Products – 0.0% | |
Mattel, Inc., 5.45%, 11/01/41 | | | | | | | 200 | | | | 217,966 | |
| |
Life Sciences Tools & Services – 0.0% | |
Life Technologies Corp., 6.00%, 3/01/20 | | | | | | | 230 | | | | 258,047 | |
| |
Media – 0.3% | | | | | | | | | | | | |
Arqiva Broadcast Finance Plc, 9.50%, 3/31/20 | | | GBP | | | | 125 | | | | 196,624 | |
British Sky Broadcasting Group Plc, 3.13%, 11/26/22 (b) | | | USD | | | | 500 | | | | 498,583 | |
Cyfrowy Polsat Finance AB, 7.13%, 5/20/18 | | | EUR | | | | 300 | | | | 416,265 | |
Time Warner Cable, Inc., 4.50%, 9/15/42 | | | USD | | | | 6 | | | | 5,454 | |
Unitymedia Hessen GmbH & Co. KG/Unitymedia NRW GmbH, 5.50%, 9/15/22 | | | EUR | | | | 100 | | | | 127,337 | |
Wolters Kluwer NV, 2.88%, 3/21/23 | | | | | | | 100 | | | | 130,842 | |
| | | | | | | | | | | | |
| | | | | | | | | | | 1,375,105 | |
| |
Metals & Mining – 0.1% | | | | | | | | | | | | |
Rio Tinto Finance USA Plc, 3.50%, 3/22/22 | | | USD | | | | 400 | | | | 411,525 | |
| |
Multi-Utilities – 0.1% | | | | | | | | | | | | |
Centrica Plc, 6.38%, 3/10/22 | | | GBP | | | | 100 | | | | 193,592 | |
Dominion Resources, Inc., 1.95%, 8/15/16 | | | USD | | | | 305 | | | | 314,527 | |
| | | | | | | | | | | | |
| | | | | | | | | | | 508,119 | |
| |
Oil, Gas & Consumable Fuels – 0.2% | |
Enterprise Products Operating LLC: | | | | | | | | | | | | |
6.13%, 10/15/39 | | | | | | | 125 | | | | 146,974 | |
Series L, 6.30%, 9/15/17 | | | | | | | 250 | | | | 300,452 | |
Kinder Morgan Energy Partners LP: | | | | | | | | | | | | |
5.95%, 2/15/18 | | | | | | | 225 | | | | 268,259 | |
5.00%, 8/15/42 | | | | | | | 150 | | | | 152,063 | |
See Notes to Financial Statements.
| | | | |
| | | | | MARCH 31, 2013 |
| 12 | | BLACKROCK MANAGED VOLATILITY PORTFOLIO | |
| | |
| Schedule of Investments (continued) | | (Percentages shown are based on Net Assets) |
| | | | | | | | | | | | |
| Corporate Bonds | | | | | Par
(000) | | | Value | |
| |
Oil, Gas & Consumable Fuels (concluded) | |
Rosneft Oil Co. via Rosneft International Finance Ltd., 4.20%, 3/06/22 | | | USD | | | | 300 | | | $ | 297,375 | |
| | | | | | | | | | | | |
| | | | | | | | | | | 1,165,123 | |
| |
Paper & Forest Products – 0.2% | |
Mondi Finance Plc, 3.38%, 9/28/20 | | | EUR | | | | 700 | | | | 922,261 | |
| |
Pharmaceuticals – 0.0% | |
Zoetis, Inc., 3.25%, 2/01/23 (b) | | | USD | | | | 100 | | | | 101,408 | |
| |
Professional Services – 0.1% | |
Experian Finance Plc, 4.75%, 11/23/18 | | | GBP | | | | 400 | | | | 690,208 | |
| |
Real Estate Investment Trusts (REITs) – 0.2% | |
Goodman Funding Pty Ltd., 6.38%, 4/15/21 (b) | | | USD | | | | 400 | | | | 462,959 | |
Unibail-Rodamco SE, 2.38%, 2/25/21 | | | EUR | | | | 350 | | | | 459,374 | |
Ventas Realty LP/Ventas Capital Corp., 4.75%, 6/01/21 | | | USD | | | | 135 | | | | 150,031 | |
| | | | | | | | | | | | |
| | | | | | | | | | | 1,072,364 | |
| |
Real Estate Management & Development – 0.0% | |
WEA Finance LLC, 4.63%, 5/10/21 (b) | | | | | | | 150 | | | | 167,311 | |
| |
Road & Rail – 0.2% | |
Burlington Northern Santa Fe LLC, 5.75%, 5/01/40 | | | | | | | 150 | | | | 179,705 | |
National Express Group Plc, 6.63%, 6/17/20 | | | GBP | | | | 400 | | | | 719,938 | |
| | | | | | | | | | | | |
| | | | | | | | | | | 899,643 | |
| |
Semiconductors & Semiconductor Equipment – 0.1% | |
TSMC Global Ltd., 1.63%, 4/03/18 (b) | | | USD | | | | 500 | | | | 498,330 | |
| |
Specialty Retail – 0.1% | | | | | | | | | | | | |
Dixons Retail Plc, 8.75%, 9/15/17 | | | GBP | | | | 150 | | | | 249,855 | |
O’Reilly Automotive, Inc., 3.80%, 9/01/22 | | | USD | | | | 500 | | | | 520,879 | |
| | | | | | | | | | | | |
| | | | | | | | | | | 770,734 | |
| |
Textiles, Apparel & Luxury Goods – 0.2% | |
LVMH Moet Hennessy Louis Vuitton SA, 1.63%, 6/29/17 (b) | | | | | | | 800 | | | | 809,194 | |
| |
Trading Companies & Distributors – 0.0% | |
Rexel SA, 5.13%, 6/15/20 | | | EUR | | | | 100 | | | | 130,103 | |
| |
Wireless Telecommunication Services – 0.4% | |
Crown Castle Towers LLC, 6.11%, 1/15/40 (b) | | | USD | | | | 500 | | | | 611,698 | |
Global Switch Holdings Ltd., 5.50%, 4/18/18 | | | EUR | | | | 300 | | | | 436,737 | |
SK Telecom Co. Ltd., 2.13%, 5/01/18 (b) | | | USD | | | | 950 | | | | 953,184 | |
Telefonica Emisiones SAU, 4.71%, 1/20/20 | | | EUR | | | | 100 | | | | 135,979 | |
Telstra Corp. Ltd., 2.50%, 9/15/23 | | | | | | | 150 | | | | 194,295 | |
| | | | | | | | | | | | |
| | | | | | | | | | | 2,331,893 | |
| |
Total Corporate Bonds – 8.8% | | | | | | | | | | | 48,584,082 | |
| |
| |
Foreign Agency Obligations | |
| |
European Financial Stability Facility: | | | | | | | | | | | | |
1.63%, 9/15/17 | | | | | | | 2,000 | | | | 2,645,097 | |
1.50%, 1/22/20 | | | | | | | 1,250 | | | | 1,608,085 | |
Hydro-Quebec, 8.40%, 1/15/22 | | | USD | | | | 405 | | | | 578,206 | |
Kreditanstalt fuer Wiederaufbau: | | | | | | | | | | | | |
1.38%, 7/15/13 | | | | | | | 350 | | | | 351,015 | |
0.50%, 7/25/16 | | | EUR | | | | 2,200 | | | | 2,832,382 | |
| | | | | | | | | | | | |
| Foreign Agency Obligations | | | | | Par
(000) | | | Value | |
| |
Petrobras International Finance Co., 3.88%, 1/27/16 | | | USD | | | | 345 | | | $ | 361,038 | |
Province of British Columbia, 4.80%, 6/15/21 | | | CAD | | | | 350 | | | | 402,502 | |
Province of Manitoba: | | | | | | | | | | | | |
4.30%, 3/01/16 | | | | | | | 200 | | | | 213,284 | |
1.75%, 5/30/19 | | | USD | | | | 490 | | | | 497,044 | |
Province of Ontario: | | | | | | | | | | | | |
4.30%, 3/08/17 | | | CAD | | | | 600 | | | | 648,859 | |
6.20%, 6/02/31 | | | | | | | 400 | | | | 537,623 | |
Province of Quebec: | | | | | | | | | | | | |
4.50%, 12/01/19 | | | | | | | 600 | | | | 670,605 | |
5.00%, 12/01/41 | | | | | | | 150 | | | | 174,272 | |
| |
Total Foreign Agency Obligations – 2.1% | | | | 11,520,012 | |
| |
| |
Foreign Government Obligations | | | | | | | | | | | | |
| |
Australia – 0.4% | | | | | | | | | | | | |
Commonwealth of Australia, 4.75%, 6/15/16 | | | AUD | | | | 1,100 | | | | 1,210,112 | |
New South Wales Treasury Corp., 6.00%, 2/01/18 | | | | | | | 400 | | | | 459,273 | |
Queensland Treasury Corp., 6.25%, 2/21/20 | | | | | | | 400 | | | | 466,942 | |
Treasury Corp. of Victoria, 6.00%, 6/15/20 | | | | | | | 250 | | | | 293,560 | |
| | | | | | | | | | | | |
| | | | | | | | | | | 2,429,887 | |
| |
Austria – 0.3% | | | | | | | | | | | | |
Republic of Austria, 3.40%, 11/22/22 | | | EUR | | | | 990 | | | | 1,460,588 | |
| |
Belgium – 0.4% | | | | | | | | | | | | |
European Union, 2.50%, 11/04/27 | | | | | | | 1,000 | | | | 1,305,670 | |
Kingdom of Belgium, 2.25%, 6/22/23 | | | | | | | 850 | | | | 1,090,786 | |
| | | | | | | | | | | | |
| | | | | | | | | | | 2,396,456 | |
| |
Canada – 0.3% | | | | | | | | | | | | |
Canada Housing Trust No. 1: | | | | | | | | | | | | |
2.75%, 9/15/14 (b) | | | CAD | | | | 400 | | | | 402,756 | |
2.75%, 6/15/16 (b) | | | | | | | 400 | | | | 410,931 | |
3.35%, 12/15/20 (b) | | | | | | | 250 | | | | 269,181 | |
Government of Canada: | | | | | | | | | | | | |
8.00%, 6/01/27 | | | | | | | 300 | | | | 505,836 | |
4.00%, 6/01/41 | | | | | | | 300 | | | | 310,012 | |
| | | | | | | | | | | | |
| | | | | | | | | | | 1,898,716 | |
| |
Czech Republic – 0.0% | | | | | | | | | | | | |
Czech Republic, 3.85%, 9/29/21 | | | CZK | | | | 4,300 | | | | 248,838 | |
| |
Denmark – 0.3% | | | | | | | | | | | | |
Kingdom of Denmark, 4.00%, 11/15/19 | | | DKK | | | | 3,500 | | | | 731,283 | |
Kommunekredit, 1.13%, 3/15/18 | | | USD | | | | 1,100 | | | | 1,093,085 | |
| | | | | | | | | | | | |
| | | | | | | | | | | 1,824,368 | |
| |
Finland – 0.2% | | | | | | | | | | | | |
Republic of Finland, 1.50%, 9/15/22 | | | EUR | | | | 800 | | | | 1,031,021 | |
| |
France – 0.2% | | | | | | | | | | | | |
Republic of France, 3.25%, 5/25/45 | | | | | | | 867 | | | | 1,117,233 | |
| |
Germany – 1.2% | | | | | | | | | | | | |
Federal Republic of Germany: | | | | | | | | | | | | |
2.25%, 9/04/21 | | | | | | | 3,000 | | | | 4,236,262 | |
1.75%, 7/04/22 | | | | | | | 150 | | | | 202,043 | |
3.25%, 7/04/42 | | | | | | | 670 | | | | 1,056,647 | |
2.50%, 7/04/44 | | | | | | | 600 | | | | 817,693 | |
| | | | | | | | | | | | |
| | | | | | | | | | | 6,312,645 | |
| |
See Notes to Financial Statements.
| | | | | | |
| | | | | MARCH 31, 2013 | | 13 |
| | BLACKROCK MANAGED VOLATILITY PORTFOLIO | | |
| | |
| Schedule of Investments (continued) | | (Percentages shown are based on Net Assets) |
| | | | | | | | |
| Foreign Government Obligations | | Par (000) | | | Value | |
| |
Ireland – 0.2% | | | | | | | | |
Republic of Ireland: | | | | | | | | |
5.50%, 10/18/17 | | EUR | 250 | | | $ | 354,524 | |
3.90%, 3/20/23 | | | 800 | | | | 994,153 | |
| | | | | | | | |
| | | | | | | 1,348,677 | |
| |
Israel – 0.1% | | | | | | | | |
State of Israel, 4.25%, 8/31/16 | | ILS | 1,000 | | | | 291,635 | |
| |
Italy – 1.3% | | | | | | | | |
Buoni Poliennali Del Tesoro: | | | | | | | | |
3.75%, 8/01/15 | | EUR | 1,000 | | | | 1,317,562 | |
3.00%, 11/01/15 | | | 1,600 | | | | 2,075,544 | |
4.50%, 2/01/18 | | | 1,050 | | | | 1,401,166 | |
5.50%, 11/01/22 | | | 1,100 | | | | 1,497,610 | |
4.75%, 9/01/28 | | | 460 | | | | 579,560 | |
| | | | | | | | |
| | | | | | | 6,871,442 | |
| |
Japan – 5.2% | | | | | | | | |
Development Bank of Japan (20 Year), 1.05%, 6/20/23 | | JPY | 50,000 | | | | 554,472 | |
Government of Japan (5 Year): | | | | | | | | |
Series 83, 0.90%, 6/20/14 | | | 240,000 | | | | 2,574,220 | |
Series 89, 0.40%, 6/20/15 | | | 430,000 | | | | 4,599,411 | |
Series 105, 0.20%, 6/20/17 | | | 195,000 | | | | 2,076,742 | |
Government of Japan (10 Year): | | | | | | | | |
Series 300, 1.50%, 3/20/19 | | | 620,000 | | | | 7,085,103 | |
Series 323, 0.90%, 6/20/22 | | | 290,000 | | | | 3,183,968 | |
Government of Japan (20 Year): | | | | | | | | |
Series 94, 2.10%, 3/20/27 | | | 215,000 | | | | 2,627,751 | |
Series 137, 1.70%, 6/20/32 | | | 205,000 | | | | 2,303,584 | |
Government of Japan (30 Year): | | | | | | | | |
Series 26, 2.40%, 3/20/37 | | | 100,000 | | | | 1,260,541 | |
Series 36, 2.00%, 3/20/42 | | | 75,000 | | | | 878,943 | |
Government of Japan (40 Year), Series 5, 2.00%, 3/20/52 | | | 24,000 | | | | 279,357 | |
Japan Finance Organization for Municipalities, 2.00%, 5/09/16 | | | 100,000 | | | | 1,126,791 | |
| | | | | | | | |
| | | | | | | 28,550,883 | |
| |
Malaysia – 0.1% | | | | | | | | |
Federation of Malaysia, 3.58%, 9/28/18 | | MYR | 1,200 | | | | 393,905 | |
| |
Mexico – 0.2% | | | | | | | | |
United Mexican States: | | | | | | | | |
6.50%, 6/09/22 | | MXN | 7,500 | | | | 678,022 | |
8.30%, 8/15/31 | | USD | 194 | | | | 294,395 | |
| | | | | | | | |
| | | | | | | 972,417 | |
| |
Netherlands – 0.5% | | | | | | | | |
Kingdom of the Netherlands, 1.75%, 7/15/23 | | EUR | 2,070 | | | | 2,648,608 | |
| |
New Zealand – 0.0% | | | | | | | | |
New Zealand, 5.00%, 3/15/19 | | NZD | 300 | | | | 277,577 | |
| |
Norway – 0.0% | | | | | | | | |
Kingdom of Norway, 2.00%, 5/24/23 | | NOK | 800 | | | | 134,857 | |
| |
Peru – 0.1% | | | | | | | | |
Republic of Peru, 6.55%, 3/14/37 | | USD | 215 | | | | 291,325 | |
| |
Poland – 0.1% | | | | | | | | |
Republic of Poland: | | | | | | | | |
5.13%, 4/21/21 | | | 200 | | | | 231,000 | |
5.00%, 3/23/22 | | | 250 | | | | 285,607 | |
| | | | | | | | |
| | | | | | | 516,607 | |
| |
| | | | | | | | |
| Foreign Government Obligations | | Par (000) | | | Value | |
| |
Russia – 0.0% | | | | | | | | |
Russian Federation, 7.50%, 3/31/30 (f) | | USD | 186 | | | $ | 230,407 | |
| |
Singapore – 0.1% | | | | | | | | |
Republic of Singapore, 2.25%, 6/01/21 | | SGD | 350 | | | | 301,505 | |
| |
South Africa – 0.1% | | | | | | | | |
Republic of South Africa: | | | | | | | | |
5.50%, 3/09/20 | | USD | 100 | | | | 114,250 | |
7.00%, 2/28/31 | | ZAR | 3,000 | | | | 297,050 | |
| | | | | | | | |
| | | | | | | 411,300 | |
| |
Spain – 0.3% | | | | | | | | |
Kingdom of Spain, 5.85%, 1/31/22 | | EUR | 1,200 | | | | 1,631,219 | |
| |
Sweden – 0.2% | | | | | | | | |
Kingdom of Sweden, 3.75%, 8/12/17 | | SEK | 6,000 | | | | 1,018,248 | |
| |
Thailand – 0.1% | | | | | | | | |
Kingdom of Thailand, 3.45%, 3/08/19 | | THB | 13,500 | | | | 466,224 | |
| |
United Kingdom – 1.3% | | | | | | | | |
United Kingdom Gilt: | | | | | | | | |
2.75%, 1/22/15 | | GBP | 900 | | | | 1,430,370 | |
1.75%, 1/22/17 | | | 600 | | | | 956,307 | |
3.75%, 9/07/19 | | | 550 | | | | 976,746 | |
5.00%, 3/07/25 | | | 400 | | | | 797,147 | |
4.25%, 6/07/32 | | | 600 | | | | 1,116,351 | |
4.50%, 12/07/42 | | | 1,000 | | | | 1,928,383 | |
4.25%, 12/07/55 | | | 100 | | | | 187,770 | |
| | | | | | | | |
| | | | | | | 7,393,074 | |
| |
Total Foreign Government
Obligations – 13.2% | | | | 72,469,662 | |
| |
| |
| |
Investment Companies | | Shares | | | | |
| |
Financial Select Sector SPDR Fund | | | 1,708,064 | | | | 31,069,684 | |
Health Care Select Sector SPDR Fund | | | 689,223 | | | | 31,669,797 | |
iShares Barclays 1-3 Year Credit Bond Fund (g) | | | 355,770 | | | | 37,547,966 | |
iShares iBoxx $ High Yield Corporate Bond Fund (g) | | | 245,498 | | | | 23,162,736 | |
iShares MSCI EAFE Minimum Volatility Index Fund (g) | | | 204,600 | | | | 12,230,988 | |
iShares MSCI Emerging Markets Minimum Volatility Index Fund (g) | | | 193,100 | | | | 11,748,204 | |
iShares MSCI Mexico Capped Investable Market Index Fund (g) | | | 313,278 | | | | 23,367,406 | |
iShares MSCI USA Minimum Volatility Index Fund (g) | | | 374,900 | | | | 12,281,724 | |
Technology Select Sector SPDR Fund | | | 1,011,752 | | | | 30,625,733 | |
Vanguard MSCI Emerging Markets ETF | | | 509,851 | | | | 21,867,509 | |
| |
Total Investment Companies – 42.9% | | | | 235,571,747 | |
| |
| |
| |
Non-Agency Mortgage-Backed
Securities | | Par (000) | | | | |
| |
Commercial Mortgage-Backed Securities – 0.2% | |
Banc of America Commercial Mortgage Trust, Series 2007-1, Class AMFX, 5.48%, 1/15/49 (a) | | USD | 30 | | | | 32,979 | |
COBALT CMBS Commercial Mortgage Trust, Series 2006-C1, Class A4, 5.22%, 8/15/48 | | | 330 | | | | 368,257 | |
Greenwich Capital Commercial Funding Corp., Series 2006-GG7, Class AJ, 5.87%, 7/10/38 (a) | | | 170 | | | | 170,489 | |
See Notes to Financial Statements.
| | | | |
| | | | | MARCH 31, 2013 |
| 14 | | BLACKROCK MANAGED VOLATILITY PORTFOLIO | |
| | |
| Schedule of Investments (continued) | | (Percentages shown are based on Net Assets) |
| | | | | | | | |
| Non-Agency Mortgage-Backed Securities | | Par (000) | | | Value | |
| |
Commercial Mortgage-Backed Securities (concluded) | |
JPMorgan Chase Commercial Mortgage Securities Trust, Series 2006-CB14, Class AM, 5.45%, 12/12/44 (a) | | | USD 180 | | | | $ 194,147 | |
LB-UBS Commercial Mortgage Trust, Series 2007-C1, Class AM, 5.46%, 2/15/40 | | | 165 | | | | 186,198 | |
| |
Total Non-Agency Mortgage-Backed
Securities – 0.2% | | | | 952,070 | |
| |
|
| |
U.S. Government Sponsored Agency Securities | |
| |
Agency Obligations – 1.0% | | | | | | | | |
Fannie Mae: | | | | | | | | |
0.38%, 3/16/15 | | | 2,000 | | | | 2,002,704 | |
6.63%, 11/15/30 | | | 200 | | | | 297,781 | |
Federal Home Loan Bank, 5.63%, 6/13/16 | | | 890 | | | | 1,030,337 | |
Freddie Mac: | | | | | | | | |
1.00%, 7/30/14 | | | 1,000 | | | | 1,010,526 | |
5.25%, 4/18/16 | | | 760 | | | | 870,429 | |
Small Business Administration Participation Certificates, Series 1997-20F, Class 1, 7.20%, 6/01/17 | | | 94 | | | | 102,633 | |
Tennessee Valley Authority, 5.25%, 9/15/39 | | | 145 | | | | 185,010 | |
| | | | | | | | |
| | | | | | | 5,499,420 | |
| |
Mortgage-Backed Securities – 3.5% | |
Fannie Mae Mortgage-Backed Securities: | | | | | |
2.50%, 4/01/28 (h) | | | 800 | | | | 829,875 | |
3.00%, 4/01/43 (h) | | | 1,600 | | | | 1,650,250 | |
3.50%, 4/01/28-4/01/43 (h) | | | 3,200 | | | | 3,382,453 | |
4.00%, 4/01/28 (h) | | | 450 | | | | 481,412 | |
4.50%, 4/01/43 (h) | | | 450 | | | | 484,805 | |
5.00%, 4/01/43 (h) | | | 350 | | | | 379,148 | |
5.50%, 4/01/43 (h) | | | 300 | | | | 327,187 | |
6.00%, 4/01/43 (h) | | | 900 | | | | 985,781 | |
6.50%, 4/01/43 (h) | | | 250 | | | | 277,969 | |
7.50%, 10/01/25 | | | – | (i) | | | 1 | |
Freddie Mac Mortgage-Backed Securities: | | | | | |
3.00%, 4/01/28 (h) | | | 750 | | | | 785,977 | |
4.00%, 4/01/43 (h) | | | 1,150 | | | | 1,222,234 | |
4.50%, 4/01/28-4/01/43 (h) | | | 1,200 | | | | 1,279,845 | |
5.00%, 4/01/43 (h) | | | 950 | | | | 1,021,695 | |
5.50%, 4/01/43 (h) | | | 300 | | | | 324,879 | |
6.00%, 4/01/43 (h) | | | 300 | | | | 327,504 | |
Ginnie Mae Mortgage-Backed Securities: | | | | | |
4.00%, 4/15/43 (h) | | | 1,400 | �� | | | 1,525,836 | |
4.50%, 4/15/43 (h) | | | 1,600 | | | | 1,749,250 | |
| | | | | | | | |
U.S. Government Sponsored Agency
Securities | | Par (000) | | | Value | |
| |
Mortgage-Backed Securities (concluded) | |
5.00%, 4/15/43 (h) | | | USD 1,000 | | | $ | 1,087,500 | |
5.50%, 4/15/43 (h) | | | 850 | | | | 930,352 | |
| | | | | | | | |
| | | | | | | 19,053,953 | |
| |
Total U.S. Government Sponsored Agency
Securities – 4.5% | | | | 24,553,373 | |
| |
|
| |
U.S. Treasury Obligations | | | | | | |
| |
| | |
U.S. Treasury Bonds: | | | | | | | | |
5.25%, 11/15/28 | | | 500 | | | | 677,422 | |
5.38%, 2/15/31 | | | 700 | | | | 973,766 | |
5.00%, 5/15/37 | | | 170 | | | | 231,492 | |
4.38%, 5/15/41 | | | 350 | | | | 439,086 | |
3.00%, 5/15/42 | | | 1,338 | | | | 1,309,985 | |
U.S. Treasury Notes, 0.25%, 4/30/14 | | | 570 | | | | 570,423 | |
| |
Total U.S. Treasury Obligations – 0.8% | | | | 4,202,174 | |
| |
Total Long-Term Investments (Cost – $486,850,000) – 94.6% | | | | | | | 518,889,183 | |
| |
|
| |
Short-Term Securities | | Shares | | | | |
| |
BlackRock Liquidity Funds, TempFund, Institutional Class, 0.09% (g)(j) | | | 34,703,090 | | | | 34,703,090 | |
| |
| | | Beneficial
Interest (000) | | | | |
| |
BlackRock Liquidity Series, LLC Money Market Series, 0.23% (g)(j)(k) | | | USD 682 | | | | 681,615 | |
| |
Total Short-Term Securities (Cost – $35,384,705) – 6.5% | | | | | | | 35,384,705 | |
| |
Total Investments before Options Written (Cost – $522,234,705) – 101.1% | | | | 554,273,888 | |
| |
|
| |
Options Written | |
| |
(Premiums Received – $ 82,934) – (0.0)% | | | | (80,719 | ) |
| |
| | | | | | | | |
Total Investments Net of Options Written –101.1% | | | | 554,193,169 | |
| |
Liabilities in Excess of Other Assets – (1.1)% | | | | (5,853,641 | ) |
| | | | | | | | |
Net Assets – 100.0% | | | $ | 548,339,528 | |
| | | | | | | | |
|
Notes to Schedule of Investments |
| (a) | Variable rate security. Rate shown is as of report date. |
| (b) | Security exempt from registration pursuant to Rule 144A under the Securities Act of 1933, as amended. These securities may be resold in transactions exempt from registration to qualified institutional investors. |
| (c) | Non-income producing security. |
| (d) | Security, or a portion of security, is on loan. |
| (e) | Restricted security as to resale. As of report date, the Fund held 0.01% of its net assets, with a current value of $60,164 and an original cost of $56,451, in these securities. |
| (f) | Represents a step-up bond that pays an initial coupon rate for the first period and then a higher coupon rate for the following periods. Rate shown is as of report date. |
See Notes to Financial Statements.
| | | | | | |
| | | | | MARCH 31, 2013 | | 15 |
| | BLACKROCK MANAGED VOLATILITY PORTFOLIO | | |
Schedule of Investments (continued)
| (g) | Investments in issuers considered to be an affiliate of the Fund during the six months ended March 31, 2013, for purposes of Section 2(a)(3) of the Investment Company Act of 1940, as amended, were as follows: |
| | | | | | | | | | | | | | | | | | | | | | | | |
| |
| Affiliate | | Shares/ Beneficial Interest Held at
September 30,
2012 | | | Net Activity | | | Shares/ Beneficial Interest Held at March 31,
2013 | | | Value at
March 31,
2013 | | | Income | | | Realized
Gain | |
| |
BlackRock Liquidity Funds, TempFund, Institutional Class | | | 97,232,371 | | | | (62,529,281 | ) | | | 34,703,090 | | | $ | 34,703,090 | | | $ | 31,870 | | | | $446 | |
BlackRock Liquidity Series, LLC Money Market Series | | | $ 2,629,449 | | | $ | (1,947,834 | ) | | $ | 681,615 | | | $ | 681,615 | | | $ | 9,904 | | | | – | |
iShares Barclays 1-3 Year Credit Bond Fund | | | – | | | | 355,770 | | | | 355,770 | | | $ | 37,547,966 | | | $ | 57,516 | | | | – | |
iShares iBoxx $ High Yield Corporate Bond Fund | | | 245,498 | | | | – | | | | 245,498 | | | $ | 23,162,736 | | | $ | 735,252 | | | | – | |
iShares MSCI EAFE Minimum Volatility Index Fund | | | – | | | | 204,600 | | | | 204,600 | | | $ | 12,230,988 | | | $ | 102,380 | | | | – | |
iShares MSCI Emerging Markets Minimum Volatility Index Fund | | | – | | | | 193,100 | | | | 193,100 | | | $ | 11,748,204 | | | $ | 74,241 | | | | – | |
iShares MSCI Mexico Capped Investable Market Index Fund | | | – | | | | 313,278 | | | | 313,278 | | | $ | 23,367,406 | | | | – | | | | – | |
iShares MSCI USA Minimum Volatility Index Fund | | | – | | | | 374,900 | | | | 374,900 | | | $ | 12,281,724 | | | $ | 124,740 | | | | – | |
| |
| (h) | Represents or includes a TBA transaction. Unsettled TBA transactions as of March 31, 2013 were as follows: |
| | | | | | | | | | |
| | | |
| Counterparty | | Value | | | Unrealized
Appreciation
(Depreciation) | | |
| | |
Barclays Plc | | | $3,959,447 | | | | $ (225 | ) | |
Deutsche Bank AG | | | $6,347,031 | | | | $ 7,789 | | |
Goldman Sachs Group, Inc. | | | $4,036,647 | | | | $ 3,631 | | |
JPMorgan Chase & Co. | | | $2,793,453 | | | | $ 969 | | |
Morgan Stanley | | | $ 829,875 | | | | $ 281 | | |
Wells Fargo & Co. | | | $1,087,500 | | | | $(3,594 | ) | |
| | |
| (i) | Par is less than $500. |
| (j) | Represents the current yield as of report date. |
| (k) | Security was purchased with the cash collateral from loaned securities. The Fund may withdraw up to 25% of its investment daily, although the manager of the BlackRock Liquidity Series LLC, Money Market Series, in its sole discretion, may permit an investor to withdraw more than 25% on any one day. |
| — | | For Fund compliance purposes, the Fund’s industry classifications refer to any one or more of the industry sub-classifications used by one or more widely recognized market indexes or ratings group indexes and/or as defined by Fund management. These definitions may not apply for purposes of this report, which may combine such industry sub-classifications for reporting ease. |
| — | | Financial futures contracts as of March 31, 2013 were as follows: |
| | | | | | | | | | | | | | | | | | | | |
| |
Contracts Purchased/(Sold) | | Issue | | Exchange | | Expiration | | | Notional Value | | | Unrealized
Appreciation
(Depreciation) | |
| |
4 | | Canada Bond (10 Year) | | Montreal Mercantile | | | June 2013 | | | | USD | | | | 530,896 | | | | $ 4,525 | |
108 | | DAX Index Futures | | Eurex | | | June 2013 | | | | USD | | | | 26,996,439 | | | | (595,044 | ) |
800 | | Euro STOXX 50 | | Eurex | | | June 2013 | | | | USD | | | | 26,189,738 | | | | (826,908 | ) |
32 | | Euro-Schatz | | Eurex | | | June 2013 | | | | USD | | | | 4,545,570 | | | | 6,600 | |
3 | | Ultra Treasury Bonds | | Chicago Board of Trade | | | June 2013 | | | | USD | | | | 472,781 | | | | 11,910 | |
59 | | U.S. Treasury Notes (2 Year) | | Chicago Board of Trade | | | June 2013 | | | | USD | | | | 13,006,734 | | | | 94 | |
47 | | U.S. Treasury Notes (5 Year) | | Chicago Board of Trade | | | June 2013 | | | | USD | | | | 5,830,570 | | | | (3,829 | ) |
206 | | U.S. Treasury Notes (10 Year) | | Chicago Board of Trade | | | June 2013 | | | | USD | | | | 27,188,781 | | | | 119,611 | |
| | Euro-Bund 8.5 to 10.5-Year | | | | | | | | | | | | | | | | | | |
| | Bond Futures Call Options, | | | | | | | | | | | | | | | | | | |
(7) | | Strike Price EUR 143.50 | | Eurex | | | April 2013 | | | | USD | | | | (21,803 | ) | | | (9,733 | ) |
| | Euro-Bund 8.5 to 10.5-Year | | | | | | | | | | | | | | | | | | |
| | Bond Futures Put Options, | | | | | | | | | | | | | | | | | | |
(7) | | Strike Price EUR 143.50 | | Eurex | | | April 2013 | | | | USD | | | | (4,711 | ) | | | 1,272 | |
| | Euro-Bund 8.5 to 10.5-Year | | | | | | | | | | | | | | | | | | |
| | Bond Futures Call Options, | | | | | | | | | | | | | | | | | | |
(6) | | Strike Price EUR 145.50 | | Eurex | | | April 2013 | | | | USD | | | | (9,614 | ) | | | (154 | ) |
See Notes to Financial Statements.
| | | | |
| | | | | MARCH 31, 2013 |
| 16 | | BLACKROCK MANAGED VOLATILITY PORTFOLIO | |
Schedule of Investments (continued)
| — | | Financial futures contracts as of March 31, 2013 were as follows: (concluded) |
| | | | | | | | | | | | | | |
| |
Contracts Purchased/(Sold) | | Issue | | Exchange | | Expiration | | Notional Value | | | Unrealized
Appreciation
(Depreciation) | |
| |
| | Euro-Bund 8.5 to 10.5-Year | | | | | | | | | | | | |
| | Bond Futures Put Options, | | | | | | | | | | | | |
(6) | | Strike Price EUR 145.50 | | Eurex | | April 2013 | | | USD (9,690) | | | | $ 77 | |
(564) | | E-Mini S&P 500® Futures | | Chicago Mercantile | | June 2013 | | | USD (44,069,550) | | | | (455,560 | ) |
(4) | | Euro-Bobl | | Eurex | | June 2013 | | | USD (649,719) | | | | (4,687 | ) |
(57) | | Euro-Bund | | Eurex | | June 2013 | | | USD (10,629,878) | | | | (12,946 | ) |
(6) | | Gilt British | | London | | June 2013 | | | USD (1,083,131) | | | | (9,670 | ) |
(5) | | Japan Bond (10 Year) | | Tokyo | | June 2013 | | | USD (7,743,682) | | | | (33,651 | ) |
| |
Total | | | | | | | | | | | | | $(1,808,093 | ) |
| | | | | | | | | | | | | | |
| — | | Foreign currency exchange contracts as of March 31, 2013 were as follows: |
| | | | | | | | | | | | | | | | | | | | |
| |
Currency
Purchased | | | | | Currency
Sold | | | | | Counterparty | | Settlement
Date | | | Unrealized
Appreciation
(Depreciation) | |
| |
| BRL | | | 70,000 | | | USD | | | 35,719 | | | BNP Paribas SA | | | 4/02/13 | | | | $ (1,102 | ) |
| BRL | | | 370,000 | | | USD | | | 183,732 | | | BNP Paribas SA | | | 4/02/13 | | | | (718 | ) |
| BRL | | | 30,000 | | | USD | | | 14,902 | | | BNP Paribas SA | | | 4/02/13 | | | | (67 | ) |
| BRL | | | 30,000 | | | USD | | | 14,897 | | | BNP Paribas SA | | | 4/02/13 | | | | (58 | ) |
| BRL | | | 120,000 | | | USD | | | 60,514 | | | Goldman Sachs Group, Inc. | | | 4/02/13 | | | | (1,172 | ) |
| BRL | | | 360,000 | | | USD | | | 178,767 | | | Goldman Sachs Group, Inc. | | | 4/02/13 | | | | (699 | ) |
| BRL | | | 180,000 | | | USD | | | 89,383 | | | Goldman Sachs Group, Inc. | | | 4/02/13 | | | | (349 | ) |
| BRL | | | 510,000 | | | USD | | | 258,686 | | | HSBC Holdings Plc | | | 4/02/13 | | | | (6,481 | ) |
| BRL | | | 495,000 | | | USD | | | 250,190 | | | HSBC Holdings Plc | | | 4/02/13 | | | | (5,402 | ) |
| BRL | | | 170,000 | | | USD | | | 84,418 | | | HSBC Holdings Plc | | | 4/02/13 | | | | (330 | ) |
| BRL | | | 2,199,000 | | | USD | | | 1,092,128 | | | JPMorgan Chase & Co. | | | 4/02/13 | | | | (4,679 | ) |
| BRL | | | 2,189,000 | | | USD | | | 1,087,000 | | | JPMorgan Chase & Co. | | | 4/02/13 | | | | (4,248 | ) |
| BRL | | | 215,000 | | | USD | | | 108,679 | | | JPMorgan Chase & Co. | | | 4/02/13 | | | | (2,357 | ) |
| BRL | | | 360,000 | | | USD | | | 181,497 | | | Morgan Stanley | | | 4/02/13 | | | | (3,470 | ) |
| BRL | | | 690,000 | | | USD | | | 342,636 | | | Morgan Stanley | | | 4/02/13 | | | | (1,339 | ) |
| BRL | | | 60,000 | | | USD | | | 29,794 | | | Morgan Stanley | | | 4/02/13 | | | | (116 | ) |
| BRL | | | 40,000 | | | USD | | | 20,156 | | | UBS AG | | | 4/02/13 | | | | (375 | ) |
| BRL | | | 20,000 | | | USD | | | 10,165 | | | UBS AG | | | 4/02/13 | | | | (274 | ) |
| BRL | | | 10,000 | | | USD | | | 5,074 | | | UBS AG | | | 4/02/13 | | | | (128 | ) |
| BRL | | | 20,000 | | | USD | | | 9,931 | | | UBS AG | | | 4/02/13 | | | | (39 | ) |
| USD | | | 14,897 | | | BRL | | | 30,000 | | | BNP Paribas SA | | | 4/02/13 | | | | 58 | |
| USD | | | 14,902 | | | BRL | | | 30,000 | | | BNP Paribas SA | | | 4/02/13 | | | | 67 | |
| USD | | | 34,760 | | | BRL | | | 70,000 | | | BNP Paribas SA | | | 4/02/13 | | | | 136 | |
| USD | | | 186,539 | | | BRL | | | 370,000 | | | BNP Paribas SA | | | 4/02/13 | | | | 3,567 | |
| USD | | | 59,589 | | | BRL | | | 120,000 | | | Goldman Sachs Group, Inc. | | | 4/02/13 | | | | 233 | |
| USD | | | 90,772 | | | BRL | | | 180,000 | | | Goldman Sachs Group, Inc. | | | 4/02/13 | | | | 1,758 | |
| USD | | | 180,135 | | | BRL | | | 360,000 | | | Goldman Sachs Group, Inc. | | | 4/02/13 | | | | 2,108 | |
| USD | | | 245,804 | | | BRL | | | 495,000 | | | HSBC Holdings Plc | | | 4/02/13 | | | | 960 | |
| USD | | | 253,253 | | | BRL | | | 510,000 | | | HSBC Holdings Plc | | | 4/02/13 | | | | 990 | |
| USD | | | 86,106 | | | BRL | | | 170,000 | | | HSBC Holdings Plc | | | 4/02/13 | | | | 2,038 | |
| USD | | | 106,763 | | | BRL | | | 215,000 | | | JPMorgan Chase & Co. | | | 4/02/13 | | | | 417 | |
| USD | | | 1,091,965 | | | BRL | | | 2,199,000 | | | JPMorgan Chase & Co. | | | 4/02/13 | | | | 4,267 | |
| USD | | | 1,107,513 | | | BRL | | | 2,189,000 | | | JPMorgan Chase & Co. | | | 4/02/13 | | | | 25,009 | |
See Notes to Financial Statements.
| | | | | | |
| | | | | MARCH 31, 2013 | | 17 |
| | BLACKROCK MANAGED VOLATILITY PORTFOLIO | | |
Schedule of Investments (continued)
| — | | Foreign currency exchange contracts as of March 31, 2013 were as follows: (continued) |
| | | | | | | | | | | | | | | | | | | | |
| |
Currency
Purchased | | | | | Currency
Sold | | | | | Counterparty | | Settlement
Date | | | Unrealized
Appreciation
(Depreciation) | |
| |
| USD | | | 30,250 | | | BRL | | | 60,000 | | | Morgan Stanley | | | 4/02/13 | | | | $ 578 | |
| USD | | | 178,767 | | | BRL | | | 360,000 | | | Morgan Stanley | | | 4/02/13 | | | | 699 | |
| USD | | | 342,262 | | | BRL | | | 690,000 | | | Morgan Stanley | | | 4/02/13 | | | | 1,043 | |
| USD | | | 4,966 | | | BRL | | | 10,000 | | | UBS AG | | | 4/02/13 | | | | 19 | |
| USD | | | 9,931 | | | BRL | | | 20,000 | | | UBS AG | | | 4/02/13 | | | | 39 | |
| USD | | | 19,863 | | | BRL | | | 40,000 | | | UBS AG | | | 4/02/13 | | | | 78 | |
| USD | | | 10,264 | | | BRL | | | 20,000 | | | UBS AG | | | 4/02/13 | | | | 373 | |
| USD | | | 35,115 | | | CZK | | | 703,870 | | | State Street Corp. | | | 4/02/13 | | | | 54 | |
| USD | | | 115,752 | | | CZK | | | 2,337,282 | | | Goldman Sachs Group, Inc. | | | 4/03/13 | | | | (674 | ) |
| AUD | | | 775,000 | | | USD | | | 807,738 | | | Deutsche Bank AG | | | 4/04/13 | | | | (1,268 | ) |
| AUD | | | 775,000 | | | USD | | | 807,871 | | | HSBC Holdings Plc | | | 4/04/13 | | | | (1,401 | ) |
| AUD | | | 800,000 | | | USD | | | 833,920 | | | UBS AG | | | 4/04/13 | | | | (1,435 | ) |
| CAD | | | 4,490,000 | | | USD | | | 4,408,305 | | | Royal Bank of Canada | | | 4/04/13 | | | | 10,975 | |
| CZK | | | 4,700,000 | | | USD | | | 232,368 | | | Royal Bank of Scotland Group Plc | | | 4/04/13 | | | | 1,381 | |
| DKK | | | 4,400,000 | | | USD | | | 753,650 | | | BNP Paribas SA | | | 4/04/13 | | | | 2,906 | |
| EUR | | | 15,100,000 | | | USD | | | 19,281,447 | | | Deutsche Bank AG | | | 4/04/13 | | | | 75,418 | |
| EUR | | | 15,100,000 | | | USD | | | 19,281,900 | | | HSBC Holdings Plc | | | 4/04/13 | | | | 74,965 | |
| EUR | | | 15,560,000 | | | USD | | | 19,867,630 | | | UBS AG | | | 4/04/13 | | | | 78,914 | |
| GBP | | | 2,450,000 | | | USD | | | 3,700,193 | | | Deutsche Bank AG | | | 4/04/13 | | | | 22,331 | |
| GBP | | | 2,455,000 | | | USD | | | 3,707,988 | | | HSBC Holdings Plc | | | 4/04/13 | | �� | | 22,134 | |
| GBP | | | 2,530,000 | | | USD | | | 3,821,287 | | | UBS AG | | | 4/04/13 | | | | 22,790 | |
| ILS | | | 395,000 | | | USD | | | 108,326 | | | Deutsche Bank AG | | | 4/04/13 | | | | 237 | |
| ILS | | | 395,000 | | | USD | | | 108,248 | | | HSBC Holdings Plc | | | 4/04/13 | | | | 315 | |
| ILS | | | 410,000 | | | USD | | | 112,469 | | | UBS AG | | | 4/04/13 | | | | 216 | |
| JPY | | | 2,728,000,000 | | | USD | | | 28,934,166 | | | UBS AG | | | 4/04/13 | | | | 46,809 | |
| MXN | | | 8,500,000 | | | USD | | | 684,947 | | | JPMorgan Chase & Co. | | | 4/04/13 | | | | 2,773 | |
| NOK | | | 280,000 | | | USD | | | 47,847 | | | Deutsche Bank AG | | | 4/04/13 | | | | 79 | |
| NOK | | | 280,000 | | | USD | | | 47,839 | | | HSBC Holdings Plc | | | 4/04/13 | | | | 86 | |
| NOK | | | 290,000 | | | USD | | | 49,564 | | | UBS AG | | | 4/04/13 | | | | 73 | |
| NZD | | | 115,000 | | | USD | | | 96,036 | | | Deutsche Bank AG | | | 4/04/13 | | | | 140 | |
| NZD | | | 115,000 | | | USD | | | 96,040 | | | HSBC Holdings Plc | | | 4/04/13 | | | | 136 | |
| NZD | | | 120,000 | | | USD | | | 100,208 | | | UBS AG | | | 4/04/13 | | | | 149 | |
| SEK | | | 2,475,000 | | | USD | | | 380,039 | | | Deutsche Bank AG | | | 4/04/13 | | | | (295 | ) |
| SEK | | | 2,475,000 | | | USD | | | 380,109 | | | HSBC Holdings Plc | | | 4/04/13 | | | | (366 | ) |
| SEK | | | 2,550,000 | | | USD | | | 391,629 | | | UBS AG | | | 4/04/13 | | | | (378 | ) |
| SGD | | | 135,000 | | | USD | | | 108,523 | | | Deutsche Bank AG | | | 4/04/13 | | | | 319 | |
| SGD | | | 130,000 | | | USD | | | 104,492 | | | HSBC Holdings Plc | | | 4/04/13 | | | | 319 | |
| SGD | | | 135,000 | | | USD | | | 108,528 | | | UBS AG | | | 4/04/13 | | | | 314 | |
| THB | | | 13,500,000 | | | USD | | | 460,356 | | | HSBC Holdings Plc | | | 4/04/13 | | | | 427 | |
| USD | | | 789,502 | | | AUD | | | 776,000 | | | Deutsche Bank AG | | | 4/04/13 | | | | (18,008 | ) |
| USD | | | 813,130 | | | AUD | | | 799,000 | | | Royal Bank of Scotland Group Plc | | | 4/04/13 | | | | (18,315 | ) |
| USD | | | 788,710 | | | AUD | | | 775,000 | | | UBS AG | | | 4/04/13 | | | | (17,760 | ) |
| USD | | | 1,441,864 | | | CAD | | | 1,482,000 | | | Deutsche Bank AG | | | 4/04/13 | | | | (16,793 | ) |
| USD | | | 1,485,012 | | | CAD | | | 1,526,000 | | | Royal Bank of Scotland Group Plc | | | 4/04/13 | | | | (16,953 | ) |
| USD | | | 1,442,652 | | | CAD | | | 1,482,000 | | | UBS AG | | | 4/04/13 | | | | (16,006 | ) |
See Notes to Financial Statements.
| | | | |
| | | | | MARCH 31, 2013 |
| 18 | | BLACKROCK MANAGED VOLATILITY PORTFOLIO | |
Schedule of Investments (continued)
| — | | Foreign currency exchange contracts as of March 31, 2013 were as follows: (continued) |
| | | | | | | | | | | | | | | | | | | | |
| |
Currency Purchased | | | | | Currency
Sold | | | | | Counterparty | | Settlement
Date | | | Unrealized
Appreciation
(Depreciation) | |
| |
| USD | | | 79,247 | | | CZK | | | 1,551,000 | | | Deutsche Bank AG | | | 4/04/13 | | | | $ 2,110 | |
| USD | | | 81,691 | | | CZK | | | 1,598,000 | | | Royal Bank of Scotland Group Plc | | | 4/04/13 | | | | 2,217 | |
| USD | | | 79,273 | | | CZK | | | 1,551,000 | | | UBS AG | | | 4/04/13 | | | | 2,135 | |
| USD | | | 255,051 | | | DKK | | | 1,452,000 | | | Deutsche Bank AG | | | 4/04/13 | | | | 5,387 | |
| USD | | | 262,996 | | | DKK | | | 1,496,000 | | | Royal Bank of Scotland Group Plc | | | 4/04/13 | | | | 5,767 | |
| USD | | | 255,279 | | | DKK | | | 1,452,000 | | | UBS AG | | | 4/04/13 | | | | 5,616 | |
| USD | | | 19,775,031 | | | EUR | | | 15,101,000 | | | Deutsche Bank AG | | | 4/04/13 | | | | 416,884 | |
| USD | | | 20,377,728 | | | EUR | | | 15,558,000 | | | Royal Bank of Scotland Group Plc | | | 4/04/13 | | | | 433,748 | |
| USD | | | 19,776,345 | | | EUR | | | 15,101,000 | | | UBS AG | | | 4/04/13 | | | | 418,198 | |
| USD | | | 3,574,452 | | | GBP | | | 2,355,000 | | | Deutsche Bank AG | | | 4/04/13 | | | | (3,730 | ) |
| USD | | | 303,563 | | | GBP | | | 200,000 | | | Deutsche Bank AG | | | 4/04/13 | | | | (317 | ) |
| USD | | | 151,768 | | | GBP | | | 100,000 | | | HSBC Holdings Plc | | | 4/04/13 | | | | (172 | ) |
| USD | | | 3,680,573 | | | GBP | | | 2,425,000 | | | Royal Bank of Scotland Group Plc | | | 4/04/13 | | | | (3,967 | ) |
| USD | | | 3,571,781 | | | GBP | | | 2,355,000 | | | UBS AG | | | 4/04/13 | | | | (6,400 | ) |
| USD | | | 106,226 | | | ILS | | | 396,000 | | | Deutsche Bank AG | | | 4/04/13 | | | | (2,612 | ) |
| USD | | | 109,540 | | | ILS | | | 408,000 | | | Royal Bank of Scotland Group Plc | | | 4/04/13 | | | | (2,596 | ) |
| USD | | | 106,400 | | | ILS | | | 396,000 | | | UBS AG | | | 4/04/13 | | | | (2,438 | ) |
| USD | | | 144,279 | | | JPY | | | 13,200,000 | | | Deutsche Bank AG | | | 4/04/13 | | | | 4,048 | |
| USD | | | 9,623,378 | | | JPY | | | 880,440,000 | | | Deutsche Bank AG | | | 4/04/13 | | | | 270,002 | |
| USD | | | 216,819 | | | JPY | | | 20,000,000 | | | JPMorgan Chase & Co. | | | 4/04/13 | | | | 4,349 | |
| USD | | | 148,588 | | | JPY | | | 13,600,000 | | | Royal Bank of Scotland Group Plc | | | 4/04/13 | | | | 4,108 | |
| USD | | | 9,910,793 | | | JPY | | | 907,120,000 | | | Royal Bank of Scotland Group Plc | | | 4/04/13 | | | | 273,981 | |
| USD | | | 144,228 | | | JPY | | | 13,200,000 | | | UBS AG | | | 4/04/13 | | | | 3,998 | |
| USD | | | 9,620,749 | | | JPY | | | 880,440,000 | | | UBS AG | | | 4/04/13 | | | | 267,373 | |
| USD | | | 217,440 | | | MXN | | | 2,805,000 | | | Deutsche Bank AG | | | 4/04/13 | | | | (9,507 | ) |
| USD | | | 223,990 | | | MXN | | | 2,890,000 | | | Royal Bank of Scotland Group Plc | | | 4/04/13 | | | | (9,834 | ) |
| USD | | | 217,435 | | | MXN | | | 2,805,000 | | | UBS AG | | | 4/04/13 | | | | (9,513 | ) |
| USD | | | 49,237 | | | NOK | | | 281,000 | | | Deutsche Bank AG | | | 4/04/13 | | | | 1,140 | |
| USD | | | 50,667 | | | NOK | | | 289,000 | | | Royal Bank of Scotland Group Plc | | | 4/04/13 | | | | 1,200 | |
| USD | | | 49,089 | | | NOK | | | 280,000 | | | UBS AG | | | 4/04/13 | | | | 1,163 | |
| USD | | | 287,876 | | | NZD | | | 350,000 | | | HSBC Holdings Plc | | | 4/04/13 | | | | (4,833 | ) |
| USD | | | 383,942 | | | SEK | | | 2,475,000 | | | Deutsche Bank AG | | | 4/04/13 | | | | 4,199 | |
| USD | | | 395,866 | | | SEK | | | 2,550,000 | | | Royal Bank of Scotland Group Plc | | | 4/04/13 | | | | 4,615 | |
| USD | | | 384,429 | | | SEK | | | 2,475,000 | | | UBS AG | | | 4/04/13 | | | | 4,686 | |
| USD | | | 106,605 | | | SGD | | | 132,000 | | | Deutsche Bank AG | | | 4/04/13 | | | | 182 | |
| USD | | | 109,834 | | | SGD | | | 136,000 | | | Royal Bank of Scotland Group Plc | | | 4/04/13 | | | | 186 | |
| USD | | | 106,624 | | | SGD | | | 132,000 | | | UBS AG | | | 4/04/13 | | | | 201 | |
| USD | | | 451,596 | | | THB | | | 13,500,000 | | | HSBC Holdings Plc | | | 4/04/13 | | | | (9,187 | ) |
| USD | | | 110,938 | | | ZAR | | | 990,000 | | | Deutsche Bank AG | | | 4/04/13 | | | | 3,376 | |
| USD | | | 114,358 | | | ZAR | | | 1,020,000 | | | Royal Bank of Scotland Group Plc | | | 4/04/13 | | | | 3,536 | |
| USD | | | 111,072 | | | ZAR | | | 990,000 | | | UBS AG | | | 4/04/13 | | | | 3,511 | |
| ZAR | | | 3,000,000 | | | USD | | | 323,097 | | | UBS AG | | | 4/04/13 | | | | 2,848 | |
| USD | | | 392,542 | | | MYR | | | 1,200,000 | | | UBS AG | | | 4/12/13 | | | | 5,429 | |
| AUD | | | 1,786,000 | | | USD | | | 1,869,763 | | | JPMorgan Chase & Co. | | | 4/18/13 | | | | (13,171 | ) |
| USD | | | 1,864,346 | | | AUD | | | 1,786,000 | | | Goldman Sachs Group, Inc. | | | 4/18/13 | | | | 7,754 | |
See Notes to Financial Statements.
| | | | | | |
| | | | | MARCH 31, 2013 | | 19 |
| | BLACKROCK MANAGED VOLATILITY PORTFOLIO | | |
Schedule of Investments (continued)
| — | | Foreign currency exchange contracts as of March 31, 2013 were as follows: (continued) |
| | | | | | | | | | | | | | | | | | | | |
| |
Currency Purchased | | | | | Currency
Sold | | | | | Counterparty | | Settlement
Date | | | Unrealized
Appreciation
(Depreciation) | |
| |
| BRL | | | 220,000 | | | USD | | | 109,208 | | | Bank of America Corp. | | | 5/03/13 | | | | $ (779 | ) |
| USD | | | 316,597 | | | BRL | | | 640,000 | | | HSBC Holdings Plc | | | 5/03/13 | | | | 1,167 | |
| USD | | | 1,088,344 | | | BRL | | | 2,199,000 | | | JPMorgan Chase & Co. | | | 5/03/13 | | | | 4,549 | |
| USD | | | 9,860 | | | BRL | | | 20,000 | | | UBS AG | | | 5/03/13 | | | | 2 | |
| USD | | | 248,201 | | | BRL | | | 500,000 | | | UBS AG | | | 5/03/13 | | | | 1,771 | |
| USD | | | 805,764 | | | AUD | | | 775,000 | | | Deutsche Bank AG | | | 5/07/13 | | | | 1,301 | |
| USD | | | 805,883 | | | AUD | | | 775,000 | | | HSBC Holdings Plc | | | 5/07/13 | | | | 1,420 | |
| USD | | | 831,868 | | | AUD | | | 800,000 | | | UBS AG | | | 5/07/13 | | | | 1,455 | |
| USD | | | 4,405,010 | | | CAD | | | 4,490,000 | | | Royal Bank of Canada | | | 5/07/13 | | | | (10,991 | ) |
| USD | | | 232,409 | | | CZK | | | 4,700,000 | | | Royal Bank of Scotland Group Plc | | | 5/07/13 | | | | (1,398 | ) |
| USD | | | 753,994 | | | DKK | | | 4,400,000 | | | BNP Paribas SA | | | 5/07/13 | | | | (2,920 | ) |
| USD | | | 475,215 | | | EUR | | | 370,000 | | | Citigroup, Inc. | | | 5/07/13 | | | | 802 | |
| USD | | | 19,286,082 | | | EUR | | | 15,100,000 | | | Deutsche Bank AG | | | 5/07/13 | | | | (75,076 | ) |
| USD | | | 19,286,626 | | | EUR | | | 15,100,000 | | | HSBC Holdings Plc | | | 5/07/13 | | | | (74,533 | ) |
| USD | | | 19,872,454 | | | EUR | | | 15,560,000 | | | UBS AG | | | 5/07/13 | | | | (78,515 | ) |
| USD | | | 151,815 | | | GBP | | | 100,000 | | | Citigroup, Inc. | | | 5/07/13 | | | | (97 | ) |
| USD | | | 3,699,495 | | | GBP | | | 2,450,000 | | | Deutsche Bank AG | | | 5/07/13 | | | | (22,353 | ) |
| USD | | | 3,707,303 | | | GBP | | | 2,455,000 | | | HSBC Holdings Plc | | | 5/07/13 | | | | (22,141 | ) |
| USD | | | 3,820,566 | | | GBP | | | 2,530,000 | | | UBS AG | | | 5/07/13 | | | | (22,812 | ) |
| USD | | | 108,195 | | | ILS | | | 395,000 | | | Deutsche Bank AG | | | 5/07/13 | | | | (228 | ) |
| USD | | | 108,117 | | | ILS | | | 395,000 | | | HSBC Holdings Plc | | | 5/07/13 | | | | (307 | ) |
| USD | | | 112,335 | | | ILS | | | 410,000 | | | UBS AG | | | 5/07/13 | | | | (206 | ) |
| USD | | | 319,151 | | | JPY | | | 30,000,000 | | | Citigroup, Inc. | | | 5/07/13 | | | | 373 | |
| USD | | | 28,940,213 | | | JPY | | | 2,728,000,000 | | | UBS AG | | | 5/07/13 | | | | (47,317 | ) |
| USD | | | 682,782 | | | MXN | | | 8,500,000 | | | JPMorgan Chase & Co. | | | 5/07/13 | | | | (2,740 | ) |
| USD | | | 47,784 | | | NOK | | | 280,000 | | | Deutsche Bank AG | | | 5/07/13 | | | | (79 | ) |
| USD | | | 47,777 | | | NOK | | | 280,000 | | | HSBC Holdings Plc | | | 5/07/13 | | | | (86 | ) |
| USD | | | 49,499 | | | NOK | | | 290,000 | | | UBS AG | | | 5/07/13 | | | | (73 | ) |
| USD | | | 95,821 | | | NZD | | | 115,000 | | | Deutsche Bank AG | | | 5/07/13 | | | | (140 | ) |
| USD | | | 95,826 | | | NZD | | | 115,000 | | | HSBC Holdings Plc | | | 5/07/13 | | | | (135 | ) |
| USD | | | 99,985 | | | NZD | | | 120,000 | | | UBS AG | | | 5/07/13 | | | | (148 | ) |
| USD | | | 379,762 | | | SEK | | | 2,475,000 | | | Deutsche Bank AG | | | 5/07/13 | | | | 292 | |
| USD | | | 379,835 | | | SEK | | | 2,475,000 | | | HSBC Holdings Plc | | | 5/07/13 | | | | 364 | |
| USD | | | 391,344 | | | SEK | | | 2,550,000 | | | UBS AG | | | 5/07/13 | | | | 375 | |
| USD | | | 108,521 | | | SGD | | | 135,000 | | | Deutsche Bank AG | | | 5/07/13 | | | | (329 | ) |
| USD | | | 104,495 | | | SGD | | | 130,000 | | | HSBC Holdings Plc | | | 5/07/13 | | | | (324 | ) |
| USD | | | 108,531 | | | SGD | | | 135,000 | | | UBS AG | | | 5/07/13 | | | | (320 | ) |
| USD | | | 459,676 | | | THB | | | 13,500,000 | | | HSBC Holdings Plc | | | 5/07/13 | | | | (149 | ) |
| USD | | | 321,652 | | | ZAR | | | 3,000,000 | | | UBS AG | | | 5/07/13 | | | | (2,828 | ) |
| CLP | | | 631,200,000 | | | USD | | | 1,316,371 | | | Bank of America Corp. | | | 6/04/13 | | | | 9,308 | |
| CLP | | | 4,200,000 | | | USD | | | 8,814 | | | Credit Suisse Group AG | | | 6/04/13 | | | | 7 | |
| CLP | | | 13,200,000 | | | USD | | | 27,503 | | | Credit Suisse Group AG | | | 6/04/13 | | | | 220 | |
| CLP | | | 59,100,000 | | | USD | | | 123,498 | | | Credit Suisse Group AG | | | 6/04/13 | | | | 627 | |
| COP | | | 318,150,000 | | | USD | | | 175,289 | | | Bank of America Corp. | | | 6/04/13 | | | | (2,041 | ) |
| COP | | | 318,150,000 | | | USD | | | 175,299 | | | BNP Paribas SA | | | 6/04/13 | | | | (2,051 | ) |
See Notes to Financial Statements.
| | | | |
| | | | | MARCH 31, 2013 |
| 20 | | BLACKROCK MANAGED VOLATILITY PORTFOLIO | |
Schedule of Investments (continued)
| — | | Foreign currency exchange contracts as of March 31, 2013 were as follows: (continued) |
| | | | | | | | | | | | | | | | | | | | |
| |
Currency Purchased | | | | | Currency
Sold | | | | | Counterparty | | Settlement
Date | | | Unrealized
Appreciation
(Depreciation) | |
| |
| COP | | | 261,700,000 | | | USD | | | 143,673 | | | BNP Paribas SA | | | 6/04/13 | | | | $ (1,164 | ) |
| COP | | | 620,300,000 | | | USD | | | 341,105 | | | Credit Suisse Group AG | | | 6/04/13 | | | | (3,322 | ) |
| COP | | | 34,500,000 | | | USD | | | 18,770 | | | Credit Suisse Group AG | | | 6/04/13 | | | | 17 | |
| CZK | | | 2,370,000 | | | USD | | | 120,877 | | | Bank of America Corp. | | | 6/04/13 | | | | (2,955 | ) |
| CZK | | | 3,310,000 | | | USD | | | 167,317 | | | Bank of America Corp. | | | 6/04/13 | | | | (2,625 | ) |
| CZK | | | 820,000 | | | USD | | | 41,114 | | | Bank of America Corp. | | | 6/04/13 | | | | (314 | ) |
| CZK | | | 100,000 | | | USD | | | 5,069 | | | BNP Paribas SA | | | 6/04/13 | | | | (94 | ) |
| CZK | | | 1,530,000 | | | USD | | | 77,828 | | | Goldman Sachs Group, Inc. | | | 6/04/13 | | | | (1,702 | ) |
| CZK | | | 1,670,000 | | | USD | | | 84,786 | | | Goldman Sachs Group, Inc. | | | 6/04/13 | | | | (1,694 | ) |
| CZK | | | 3,140,000 | | | USD | | | 159,095 | | | HSBC Holdings Plc | | | 6/04/13 | | | | (2,861 | ) |
| CZK | | | 2,560,000 | | | USD | | | 130,064 | | | HSBC Holdings Plc | | | 6/04/13 | | | | (2,689 | ) |
| CZK | | | 1,390,000 | | | USD | | | 71,053 | | | HSBC Holdings Plc | | | 6/04/13 | | | | (1,892 | ) |
| CZK | | | 2,240,000 | | | USD | | | 113,569 | | | JPMorgan Chase & Co. | | | 6/04/13 | | | | (2,115 | ) |
| CZK | | | 1,480,000 | | | USD | | | 74,989 | | | JPMorgan Chase & Co. | | | 6/04/13 | | | | (1,350 | ) |
| CZK | | | 1,720,000 | | | USD | | | 86,948 | | | Royal Bank of Scotland Group Plc | | | 6/04/13 | | | | (1,368 | ) |
| CZK | | | 840,000 | | | USD | | | 42,177 | | | Royal Bank of Scotland Group Plc | | | 6/04/13 | | | | (382 | ) |
| CZK | | | 2,370,000 | | | USD | | | 120,657 | | | State Street Corp. | | | 6/04/13 | | | | (2,736 | ) |
| CZK | | | 160,000 | | | USD | | | 8,202 | | | UBS AG | | | 6/04/13 | | | | (241 | ) |
| HUF | | | 3,900,000 | | | USD | | | 16,603 | | | BNP Paribas SA | | | 6/04/13 | | | | (308 | ) |
| HUF | | | 78,470,000 | | | USD | | | 349,906 | | | Deutsche Bank AG | | | 6/04/13 | | | | (22,044 | ) |
| HUF | | | 29,600,000 | | | USD | | | 131,990 | | | Deutsche Bank AG | | | 6/04/13 | | | | (8,315 | ) |
| HUF | | | 16,700,000 | | | USD | | | 70,328 | | | HSBC Holdings Plc | | | 6/04/13 | | | | (552 | ) |
| HUF | | | 5,500,000 | | | USD | | | 22,934 | | | HSBC Holdings Plc | | | 6/04/13 | | | | 46 | |
| HUF | | | 42,800,000 | | | USD | | | 178,555 | | | HSBC Holdings Plc | | | 6/04/13 | | | | 272 | |
| HUF | | | 4,900,000 | | | USD | | | 21,303 | | | JPMorgan Chase & Co. | | | 6/04/13 | | | | (830 | ) |
| IDR | | | 1,187,700,000 | | | USD | | | 121,516 | | | HSBC Holdings Plc | | | 6/04/13 | | | | (375 | ) |
| ILS | | | 150,000 | | | USD | | | 40,643 | | | Barclays Plc | | | 6/04/13 | | | | 491 | |
| ILS | | | 890,000 | | | USD | | | 242,712 | | | Morgan Stanley | | | 6/04/13 | | | | 1,346 | |
| INR | | | 3,400,000 | | | USD | | | 61,628 | | | BNP Paribas SA | | | 6/04/13 | | | | 41 | |
| INR | | | 3,200,000 | | | USD | | | 57,399 | | | Credit Suisse Group AG | | | 6/04/13 | | | | 642 | |
| INR | | | 2,975,000 | | | USD | | | 54,278 | | | Deutsche Bank AG | | | 6/04/13 | | | | (319 | ) |
| INR | | | 6,400,000 | | | USD | | | 116,385 | | | Deutsche Bank AG | | | 6/04/13 | | | | (303 | ) |
| INR | | | 700,000 | | | USD | | | 12,696 | | | Deutsche Bank AG | | | 6/04/13 | | | | – | |
| INR | | | 1,200,000 | | | USD | | | 21,719 | | | Deutsche Bank AG | | | 6/04/13 | | | | 46 | |
| INR | | | 4,900,000 | | | USD | | | 88,664 | | | Deutsche Bank AG | | | 6/04/13 | | | | 211 | |
| INR | | | 11,100,000 | | | USD | | | 200,978 | | | Deutsche Bank AG | | | 6/04/13 | | | | 351 | |
| INR | | | 3,100,000 | | | USD | | | 55,556 | | | Goldman Sachs Group, Inc. | | | 6/04/13 | | | | 671 | |
| INR | | | 5,525,000 | | | USD | | | 100,628 | | | HSBC Holdings Plc | | | 6/04/13 | | | | (417 | ) |
| INR | | | 2,600,000 | | | USD | | | 47,324 | | | HSBC Holdings Plc | | | 6/04/13 | | | | (166 | ) |
| INR | | | 11,600,000 | | | USD | | | 210,145 | | | Royal Bank of Scotland Group Plc | | | 6/04/13 | | | | 253 | |
| INR | | | 50,900,000 | | | USD | | | 927,867 | | | UBS AG | | | 6/04/13 | | | | (4,656 | ) |
| INR | | | 5,600,000 | | | USD | | | 101,911 | | | UBS AG | | | 6/04/13 | | | | (340 | ) |
| INR | | | 4,900,000 | | | USD | | | 87,500 | | | UBS AG | | | 6/04/13 | | | | 1,375 | |
| INR | | | 12,700,000 | | | USD | | | 227,528 | | | UBS AG | | | 6/04/13 | | | | 2,821 | |
| KRW | | | 159,150,000 | | | USD | | | 142,454 | | | Credit Suisse Group AG | | | 6/04/13 | | | | 51 | |
See Notes to Financial Statements.
| | | | | | |
| | | | | MARCH 31, 2013 | | 21 |
| | BLACKROCK MANAGED VOLATILITY PORTFOLIO | | |
Schedule of Investments (continued)
| — | | Foreign currency exchange contracts as of March 31, 2013 were as follows: (continued) |
| | | | | | | | | | | | | | | | | | | | |
| |
Currency Purchased | | | | | Currency
Sold | | | | | Counterparty | | Settlement
Date | | | Unrealized
Appreciation
(Depreciation) | |
| |
| KRW | | | 210,500,000 | | | USD | | | 192,501 | | | Deutsche Bank AG | | | 6/04/13 | | | | $ (4,016 | ) |
| KRW | | | 167,300,000 | | | USD | | | 152,995 | | | Deutsche Bank AG | | | 6/04/13 | | | | (3,192 | ) |
| KRW | | | 159,150,000 | | | USD | | | 142,480 | | | Goldman Sachs Group, Inc. | | | 6/04/13 | | | | 25 | |
| KRW | | | 293,400,000 | | | USD | | | 268,681 | | | HSBC Holdings Plc | | | 6/04/13 | | | | (5,966 | ) |
| KRW | | | 166,600,000 | | | USD | | | 152,466 | | | HSBC Holdings Plc | | | 6/04/13 | | | | (3,290 | ) |
| KRW | | | 187,500,000 | | | USD | | | 171,155 | | | HSBC Holdings Plc | | | 6/04/13 | | | | (3,264 | ) |
| KRW | | | 73,200,000 | | | USD | | | 66,597 | | | HSBC Holdings Plc | | | 6/04/13 | | | | (1,053 | ) |
| KRW | | | 22,000,000 | | | USD | | | 19,680 | | | HSBC Holdings Plc | | | 6/04/13 | | | | 19 | |
| KRW | | | 17,400,000 | | | USD | | | 15,484 | | | HSBC Holdings Plc | | | 6/04/13 | | | | 96 | |
| KRW | | | 23,100,000 | | | USD | | | 20,627 | | | JPMorgan Chase & Co. | | | 6/04/13 | | | | 57 | |
| KRW | | | 77,700,000 | | | USD | | | 70,836 | | | Morgan Stanley | | | 6/04/13 | | | | (1,262 | ) |
| KRW | | | 53,500,000 | | | USD | | | 48,522 | | | UBS AG | | | 6/04/13 | | | | (617 | ) |
| MXN | | | 110,000 | | | USD | | | 8,666 | | | Bank of America Corp. | | | 6/04/13 | | | | 182 | |
| MXN | | | 605,000 | | | USD | | | 48,279 | | | Bank of America Corp. | | | 6/04/13 | | | | 382 | |
| MXN | | | 1,340,000 | | | USD | | | 107,277 | | | Bank of America Corp. | | | 6/04/13 | | | | 502 | |
| MXN | | | 930,000 | | | USD | | | 74,282 | | | Bank of America Corp. | | | 6/04/13 | | | | 519 | |
| MXN | | | 520,000 | | | USD | | | 41,970 | | | BNP Paribas SA | | | 6/04/13 | | | | (145 | ) |
| MXN | | | 1,535,000 | | | USD | | | 122,762 | | | Credit Suisse Group AG | | | 6/04/13 | | | | 702 | |
| MXN | | | 1,210,000 | | | USD | | | 97,301 | | | Goldman Sachs Group, Inc. | | | 6/04/13 | | | | 22 | |
| MXN | | | 2,550,000 | | | USD | | | 203,764 | | | Goldman Sachs Group, Inc. | | | 6/04/13 | | | | 1,338 | |
| MXN | | | 1,296,000 | | | USD | | | 101,053 | | | Goldman Sachs Group, Inc. | | | 6/04/13 | | | | 3,187 | |
| MXN | | | 9,203,000 | | | USD | | | 717,583 | | | Goldman Sachs Group, Inc. | | | 6/04/13 | | | | 22,634 | |
| MXN | | | 1,285,000 | | | USD | | | 102,693 | | | Morgan Stanley | | | 6/04/13 | | | | 662 | |
| MXN | | | 1,860,000 | | | USD | | | 148,101 | | | Morgan Stanley | | | 6/04/13 | | | | 1,503 | |
| MXN | | | 2,040,000 | | | USD | | | 162,233 | | | Morgan Stanley | | | 6/04/13 | | | | 1,848 | |
| MXN | | | 1,510,000 | | | USD | | | 121,251 | | | State Street Corp. | | | 6/04/13 | | | | 201 | |
| MXN | | | 2,070,000 | | | USD | | | 166,025 | | | UBS AG | | | 6/04/13 | | | | 469 | |
| MXN | | | 1,285,000 | | | USD | | | 102,837 | | | UBS AG | | | 6/04/13 | | | | 518 | |
| MYR | | | 2,660,000 | | | USD | | | 853,713 | | | Barclays Plc | | | 6/04/13 | | | | 1,239 | |
| MYR | | | 30,000 | | | USD | | | 9,623 | | | Deutsche Bank AG | | | 6/04/13 | | | | 19 | |
| MYR | | | 10,000 | | | USD | | | 3,216 | | | HSBC Holdings Plc | | | 6/04/13 | | | | (2 | ) |
| PHP | | | 200,000 | | | USD | | | 4,916 | | | Barclays Plc | | | 6/04/13 | | | | (13 | ) |
| PHP | | | 700,000 | | | USD | | | 17,186 | | | HSBC Holdings Plc | | | 6/04/13 | | | | (23 | ) |
| PLN | | | 240,000 | | | USD | | | 74,830 | | | Barclays Plc | | | 6/04/13 | | | | (1,541 | ) |
| PLN | | | 250,000 | | | USD | | | 78,239 | | | BNP Paribas SA | | | 6/04/13 | | | | (1,895 | ) |
| PLN | | | 75,000 | | | USD | | | 23,472 | | | BNP Paribas SA | | | 6/04/13 | | | | (569 | ) |
| PLN | | | 520,000 | | | USD | | | 158,021 | | | Credit Suisse Group AG | | | 6/04/13 | | | | 773 | |
| PLN | | | 500,000 | | | USD | | | 155,729 | | | Deutsche Bank AG | | | 6/04/13 | | | | (3,042 | ) |
| PLN | | | 315,000 | | | USD | | | 98,317 | | | Deutsche Bank AG | | | 6/04/13 | | | | (2,124 | ) |
| PLN | | | 590,000 | | | USD | | | 184,635 | | | HSBC Holdings Plc | | | 6/04/13 | | | | (4,464 | ) |
| PLN | | | 370,000 | | | USD | | | 115,397 | | | HSBC Holdings Plc | | | 6/04/13 | | | | (2,409 | ) |
| PLN | | | 315,000 | | | USD | | | 98,150 | | | HSBC Holdings Plc | | | 6/04/13 | | | | (1,958 | ) |
| PLN | | | 175,000 | | | USD | | | 54,765 | | | HSBC Holdings Plc | | | 6/04/13 | | | | (1,324 | ) |
| PLN | | | 140,000 | | | USD | | | 43,873 | | | HSBC Holdings Plc | | | 6/04/13 | | | | (1,121 | ) |
| PLN | | | 110,000 | | | USD | | | 34,472 | | | HSBC Holdings Plc | | | 6/04/13 | | | | (881 | ) |
See Notes to Financial Statements.
| | | | |
| | | | | MARCH 31, 2013 |
| 22 | | BLACKROCK MANAGED VOLATILITY PORTFOLIO | |
Schedule of Investments (continued)
| — | | Foreign currency exchange contracts as of March 31, 2013 were as follows: (continued) |
| | | | | | | | | | | | | | | | | | | | |
| |
Currency Purchased | | | | | Currency
Sold | | | | | Counterparty | | Settlement
Date | | | Unrealized
Appreciation
(Depreciation) | |
| |
| PLN | | | 130,000 | | | USD | | | 40,499 | | | HSBC Holdings Plc | | | 6/04/13 | | | | $ (800 | ) |
| PLN | | | 40,000 | | | USD | | | 12,453 | | | JPMorgan Chase & Co. | | | 6/04/13 | | | | (238 | ) |
| PLN | | | 70,000 | | | USD | | | 21,727 | | | Royal Bank of Scotland Group Plc | | | 6/04/13 | | | | (351 | ) |
| RON | | | 100,000 | | | USD | | | 29,546 | | | Bank of America Corp. | | | 6/04/13 | | | | (776 | ) |
| RON | | | 1,040,000 | | | USD | | | 311,116 | | | HSBC Holdings Plc | | | 6/04/13 | | | | (11,901 | ) |
| RON | | | 90,000 | | | USD | | | 26,049 | | | HSBC Holdings Plc | | | 6/04/13 | | | | (155 | ) |
| RON | | | 290,000 | | | USD | | | 85,875 | | | JPMorgan Chase & Co. | | | 6/04/13 | | | | (2,440 | ) |
| RUB | | | 28,960,000 | | | USD | | | 939,467 | | | Bank of America Corp. | | | 6/04/13 | | | | (18,889 | ) |
| RUB | | | 10,360,000 | | | USD | | | 336,080 | | | Bank of America Corp. | | | 6/04/13 | | | | (6,757 | ) |
| RUB | | | 8,400,000 | | | USD | | | 268,392 | | | Credit Suisse Group AG | | | 6/04/13 | | | | (1,374 | ) |
| RUB | | | 1,600,000 | | | USD | | | 51,257 | | | Goldman Sachs Group, Inc. | | | 6/04/13 | | | | (397 | ) |
| RUB | | | 3,200,000 | | | USD | | | 102,745 | | | Morgan Stanley | | | 6/04/13 | | | | (1,024 | ) |
| RUB | | | 600,000 | | | USD | | | 19,192 | | | Morgan Stanley | | | 6/04/13 | | | | (120 | ) |
| RUB | | | 7,400,000 | | | USD | | | 236,497 | | | Royal Bank of Scotland Group Plc | | | 6/04/13 | | | | (1,267 | ) |
| RUB | | | 5,200,000 | | | USD | | | 166,560 | | | UBS AG | | | 6/04/13 | | | | (1,263 | ) |
| RUB | | | 6,300,000 | | | USD | | | 201,310 | | | UBS AG | | | 6/04/13 | | | | (1,046 | ) |
| SGD | | | 300,000 | | | USD | | | 242,160 | | | Bank of America Corp. | | | 6/04/13 | | | | (251 | ) |
| SGD | | | 160,000 | | | USD | | | 128,890 | | | BNP Paribas SA | | | 6/04/13 | | | | 128 | |
| SGD | | | 60,000 | | | USD | | | 48,274 | | | Credit Suisse Group AG | | | 6/04/13 | | | | 108 | |
| SGD | | | 150,000 | | | USD | | | 120,525 | | | Deutsche Bank AG | | | 6/04/13 | | | | 430 | |
| SGD | | | 620,000 | | | USD | | | 500,067 | | | Goldman Sachs Group, Inc. | | | 6/04/13 | | | | (121 | ) |
| SGD | | | 110,000 | | | USD | | | 88,377 | | | Goldman Sachs Group, Inc. | | | 6/04/13 | | | | 323 | |
| SGD | | | 650,000 | | | USD | | | 523,628 | | | Goldman Sachs Group, Inc. | | | 6/04/13 | | | | 508 | |
| SGD | | | 70,000 | | | USD | | | 56,198 | | | HSBC Holdings Plc | | | 6/04/13 | | | | 247 | |
| SGD | | | 110,000 | | | USD | | | 88,397 | | | HSBC Holdings Plc | | | 6/04/13 | | | | 303 | |
| SGD | | | 270,000 | | | USD | | | 216,523 | | | HSBC Holdings Plc | | | 6/04/13 | | | | 1,195 | |
| SGD | | | 180,000 | | | USD | | | 145,306 | | | JPMorgan Chase & Co. | | | 6/04/13 | | | | (161 | ) |
| SGD | | | 50,000 | | | USD | | | 40,363 | | | JPMorgan Chase & Co. | | | 6/04/13 | | | | (45 | ) |
| SGD | | | 50,000 | | | USD | | | 40,131 | | | UBS AG | | | 6/04/13 | | | | 187 | |
| SGD | | | 110,000 | | | USD | | | 87,958 | | | UBS AG | | | 6/04/13 | | | | 742 | |
| THB | | | 12,570,000 | | | USD | | | 419,629 | | | Deutsche Bank AG | | | 6/04/13 | | | | 7,780 | |
| THB | | | 1,740,000 | | | USD | | | 58,144 | | | HSBC Holdings Plc | | | 6/04/13 | | | | 1,020 | |
| THB | | | 2,130,000 | | | USD | | | 71,092 | | | HSBC Holdings Plc | | | 6/04/13 | | | | 1,333 | |
| TRY | | | 80,000 | | | USD | | | 43,898 | | | BNP Paribas SA | | | 6/04/13 | | | | (68 | ) |
| TRY | | | 280,000 | | | USD | | | 152,739 | | | Credit Suisse Group AG | | | 6/04/13 | | | | 666 | |
| TRY | | | 210,000 | | | USD | | | 115,639 | | | Deutsche Bank AG | | | 6/04/13 | | | | (585 | ) |
| TRY | | | 70,000 | | | USD | | | 38,077 | | | Deutsche Bank AG | | | 6/04/13 | | | | 274 | |
| TRY | | | 80,000 | | | USD | | | 43,513 | | | Deutsche Bank AG | | | 6/04/13 | | | | 317 | |
| TRY | | | 340,000 | | | USD | | | 185,757 | | | HSBC Holdings Plc | | | 6/04/13 | | | | 521 | |
| TRY | | | 70,000 | | | USD | | | 38,470 | | | JPMorgan Chase & Co. | | | 6/04/13 | | | | (119 | ) |
| TRY | | | 60,000 | | | USD | | | 32,974 | | | JPMorgan Chase & Co. | | | 6/04/13 | | | | (102 | ) |
| TRY | | | 50,000 | | | USD | | | 27,306 | | | JPMorgan Chase & Co. | | | 6/04/13 | | | | 88 | |
| TRY | | | 220,000 | | | USD | | | 121,105 | | | Morgan Stanley | | | 6/04/13 | | | | (573 | ) |
| TRY | | | 50,000 | | | USD | | | 27,576 | | | Royal Bank of Scotland Group Plc | | | 6/04/13 | | | | (182 | ) |
| TRY | | | 70,000 | | | USD | | | 38,354 | | | Royal Bank of Scotland Group Plc | | | 6/04/13 | | | | (3 | ) |
See Notes to Financial Statements.
| | | | | | |
| | | | | MARCH 31, 2013 | | 23 |
| | BLACKROCK MANAGED VOLATILITY PORTFOLIO | | |
Schedule of Investments (continued)
| — | | Foreign currency exchange contracts as of March 31, 2013 were as follows: (continued) |
| | | | | | | | | | | | | | | | | | | | |
| |
Currency Purchased | | | | | Currency
Sold | | | | | Counterparty | | Settlement
Date | | | Unrealized
Appreciation
(Depreciation) | |
| |
| TRY | | | 90,000 | | | USD | | | 49,057 | | | Royal Bank of Scotland Group Plc | | | 6/04/13 | | | | $ 252 | |
| TRY | | | 120,000 | | | USD | | | 65,446 | | | Royal Bank of Scotland Group Plc | | | 6/04/13 | | | | 299 | |
| TRY | | | 170,000 | | | USD | | | 92,759 | | | Royal Bank of Scotland Group Plc | | | 6/04/13 | | | | 379 | |
| TRY | | | 240,000 | | | USD | | | 130,954 | | | Royal Bank of Scotland Group Plc | | | 6/04/13 | | | | 536 | |
| TRY | | | 530,000 | | | USD | | | 288,890 | | | Royal Bank of Scotland Group Plc | | | 6/04/13 | | | | 1,484 | |
| TWD | | | 9,900,000 | | | USD | | | 334,403 | | | Bank of America Corp. | | | 6/04/13 | | | | (2,860 | ) |
| TWD | | | 10,250,000 | | | USD | | | 346,518 | | | BNP Paribas SA | | | 6/04/13 | | | | (3,254 | ) |
| TWD | | | 5,620,000 | | | USD | | | 189,833 | | | Deutsche Bank AG | | | 6/04/13 | | | | (1,624 | ) |
| TWD | | | 1,040,000 | | | USD | | | 34,847 | | | Goldman Sachs Group, Inc. | | | 6/04/13 | | | | (18 | ) |
| TWD | | | 10,000 | | | USD | | | 336 | | | HSBC Holdings Plc | | | 6/04/13 | | | | (1 | ) |
| TWD | | | 1,180,000 | | | USD | | | 39,910 | | | UBS AG | | | 6/04/13 | | | | (393 | ) |
| USD | | | 143,276 | | | CLP | | | 68,400,000 | | | Credit Suisse Group AG | | | 6/04/13 | | | | (381 | ) |
| USD | | | 16,978 | | | CLP | | | 8,100,000 | | | Credit Suisse Group AG | | | 6/04/13 | | | | (34 | ) |
| USD | | | 66,360 | | | CLP | | | 31,700,000 | | | UBS AG | | | 6/04/13 | | | | (218 | ) |
| USD | | | 36,790 | | | COP | | | 67,400,000 | | | Bank of America Corp. | | | 6/04/13 | | | | 88 | |
| USD | | | 542,306 | | | COP | | | 987,675,000 | | | Credit Suisse Group AG | | | 6/04/13 | | | | 4,469 | |
| USD | | | 47,516 | | | CZK | | | 940,000 | | | Bank of America Corp. | | | 6/04/13 | | | | 746 | |
| USD | | | 72,934 | | | CZK | | | 1,430,000 | | | Bank of America Corp. | | | 6/04/13 | | | | 1,783 | |
| USD | | | 200,381 | | | CZK | | | 4,040,000 | | | HSBC Holdings Plc | | | 6/04/13 | | | | (633 | ) |
| USD | | | 28,166 | | | CZK | | | 560,000 | | | HSBC Holdings Plc | | | 6/04/13 | | | | 303 | |
| USD | | | 247,859 | | | CZK | | | 4,755,000 | | | HSBC Holdings Plc | | | 6/04/13 | | | | 11,270 | |
| USD | | | 1,204,110 | | | CZK | | | 23,100,000 | | | HSBC Holdings Plc | | | 6/04/13 | | | | 54,748 | |
| USD | | | 1,504 | | | CZK | | | 30,000 | | | Royal Bank of Scotland Group Plc | | | 6/04/13 | | | | 12 | |
| USD | | | 97,785 | | | CZK | | | 1,950,000 | | | Royal Bank of Scotland Group Plc | | | 6/04/13 | | | | 761 | |
| USD | | | 146,113 | | | CZK | | | 2,910,000 | | | Royal Bank of Scotland Group Plc | | | 6/04/13 | | | | 1,323 | |
| USD | | | 72,802 | | | CZK | | | 1,430,000 | | | State Street Corp. | | | 6/04/13 | | | | 1,651 | |
| USD | | | 58,954 | | | CZK | | | 1,150,000 | | | UBS AG | | | 6/04/13 | | | | 1,735 | |
| USD | | | 8,821 | | | HUF | | | 2,100,000 | | | Bank of America Corp. | | | 6/04/13 | | | | 47 | |
| USD | | | 48,313 | | | HUF | | | 11,000,000 | | | Bank of America Corp. | | | 6/04/13 | | | | 2,353 | |
| USD | | | 70,501 | | | HUF | | | 16,290,000 | | | Bank of America Corp. | | | 6/04/13 | | | | 2,438 | |
| USD | | | 96,245 | | | HUF | | | 22,300,000 | | | Bank of America Corp. | | | 6/04/13 | | | | 3,071 | |
| USD | | | 97,962 | | | HUF | | | 22,635,000 | | | Bank of America Corp. | | | 6/04/13 | | | | 3,388 | |
| USD | | | 159,874 | | | HUF | | | 36,400,000 | | | Bank of America Corp. | | | 6/04/13 | | | | 7,787 | |
| USD | | | 199,924 | | | HUF | | | 46,100,000 | | | Barclays Plc | | | 6/04/13 | | | | 7,310 | |
| USD | | | 44,937 | | | HUF | | | 10,600,000 | | | BNP Paribas SA | | | 6/04/13 | | | | 648 | |
| USD | | | 88,603 | | | HUF | | | 20,900,000 | | | BNP Paribas SA | | | 6/04/13 | | | | 1,278 | |
| USD | | | 3,776 | | | HUF | | | 900,000 | | | Deutsche Bank AG | | | 6/04/13 | | | | 16 | |
| USD | | | 2,089 | | | HUF | | | 500,000 | | | HSBC Holdings Plc | | | 6/04/13 | | | | – | |
| USD | | | 85,969 | | | HUF | | | 19,910,000 | | | HSBC Holdings Plc | | | 6/04/13 | | | | 2,781 | |
| USD | | | 119,454 | | | HUF | | | 27,665,000 | | | HSBC Holdings Plc | | | 6/04/13 | | | | 3,864 | |
| USD | | | 89,261 | | | HUF | | | 20,400,000 | | | HSBC Holdings Plc | | | 6/04/13 | | | | 4,026 | |
| USD | | | 106,084 | | | HUF | | | 24,340,000 | | | HSBC Holdings Plc | | | 6/04/13 | | | | 4,387 | |
| USD | | | 130,281 | | | HUF | | | 29,830,000 | | | HSBC Holdings Plc | | | 6/04/13 | | | | 5,646 | |
| USD | | | 87,164 | | | HUF | | | 20,030,000 | | | Royal Bank of Scotland Group Plc | | | 6/04/13 | | | | 3,475 | |
| USD | | | 76,741 | | | IDR | | | 756,900,000 | | | Goldman Sachs Group, Inc. | | | 6/04/13 | | | | (460 | ) |
See Notes to Financial Statements.
| | | | |
| | | | | MARCH 31, 2013 |
| 24 | | BLACKROCK MANAGED VOLATILITY PORTFOLIO | |
Schedule of Investments (continued)
| — | | Foreign currency exchange contracts as of March 31, 2013 were as follows: (continued) |
| | | | | | | | | | | | | | | | | | | | |
| |
Currency Purchased | | | | | Currency
Sold | | | | | Counterparty | | Settlement
Date | | | Unrealized
Appreciation
(Depreciation) | |
| |
| USD | | | 50,518 | | | IDR | | | 497,800,000 | | | HSBC Holdings Plc | | | 6/04/13 | | | | $ (256 | ) |
| USD | | | 99,328 | | | IDR | | | 974,900,000 | | | HSBC Holdings Plc | | | 6/04/13 | | | | (109 | ) |
| USD | | | 21,832 | | | IDR | | | 212,800,000 | | | HSBC Holdings Plc | | | 6/04/13 | | | | 128 | |
| USD | | | 53,436 | | | ILS | | | 200,000 | | | Deutsche Bank AG | | | 6/04/13 | | | | (1,409 | ) |
| USD | | | 34,732 | | | ILS | | | 130,000 | | | Morgan Stanley | | | 6/04/13 | | | | (917 | ) |
| USD | | | 512,162 | | | ILS | | | 1,910,000 | | | UBS AG | | | 6/04/13 | | | | (11,604 | ) |
| USD | | | 76,128 | | | INR | | | 4,200,000 | | | BNP Paribas SA | | | 6/04/13 | | | | (50 | ) |
| USD | | | 52,679 | | | INR | | | 2,900,000 | | | BNP Paribas SA | | | 6/04/13 | | | | 80 | |
| USD | | | 69,955 | | | INR | | | 3,900,000 | | | Credit Suisse Group AG | | | 6/04/13 | | | | (782 | ) |
| USD | | | 32,415 | | | INR | | | 1,800,000 | | | Deutsche Bank AG | | | 6/04/13 | | | | (233 | ) |
| USD | | | 114,068 | | | INR | | | 6,300,000 | | | Deutsche Bank AG | | | 6/04/13 | | | | (199 | ) |
| USD | | | 41,588 | | | INR | | | 2,300,000 | | | Deutsche Bank AG | | | 6/04/13 | | | | (129 | ) |
| USD | | | 50,660 | | | INR | | | 2,800,000 | | | Deutsche Bank AG | | | 6/04/13 | | | | (125 | ) |
| USD | | | 18,100 | | | INR | | | 1,000,000 | | | Deutsche Bank AG | | | 6/04/13 | | | | (38 | ) |
| USD | | | 121,487 | | | INR | | | 6,700,000 | | | Deutsche Bank AG | | | 6/04/13 | | | | (36 | ) |
| USD | | | 12,706 | | | INR | | | 700,000 | | | Deutsche Bank AG | | | 6/04/13 | | | | 10 | |
| USD | | | 12,785 | | | INR | | | 700,000 | | | Deutsche Bank AG | | | 6/04/13 | | | | 89 | |
| USD | | | 74,559 | | | INR | | | 4,100,000 | | | Deutsche Bank AG | | | 6/04/13 | | | | 194 | |
| USD | | | 30,943 | | | INR | | | 1,700,000 | | | HSBC Holdings Plc | | | 6/04/13 | | | | 109 | |
| USD | | | 880,562 | | | INR | | | 48,305,000 | | | UBS AG | | | 6/04/13 | | | | 4,419 | |
| USD | | | 59,086 | | | KRW | | | 66,200,000 | | | Deutsche Bank AG | | | 6/04/13 | | | | (190 | ) |
| USD | | | 55,736 | | | KRW | | | 62,190,000 | | | Deutsche Bank AG | | | 6/04/13 | | | | 50 | |
| USD | | | 13,585 | | | KRW | | | 14,800,000 | | | Deutsche Bank AG | | | 6/04/13 | | | | 333 | |
| USD | | | 183,529 | | | KRW | | | 203,580,000 | | | Deutsche Bank AG | | | 6/04/13 | | | | 1,241 | |
| USD | | | 38,715 | | | KRW | | | 43,100,000 | | | Goldman Sachs Group, Inc. | | | 6/04/13 | | | | 123 | |
| USD | | | 80,534 | | | KRW | | | 90,500,000 | | | HSBC Holdings Plc | | | 6/04/13 | | | | (501 | ) |
| USD | | | 85,763 | | | KRW | | | 95,900,000 | | | HSBC Holdings Plc | | | 6/04/13 | | | | (108 | ) |
| USD | | | 104,027 | | | KRW | | | 116,240,000 | | | HSBC Holdings Plc | | | 6/04/13 | | | | (56 | ) |
| USD | | | 28,369 | | | KRW | | | 31,700,000 | | | HSBC Holdings Plc | | | 6/04/13 | | | | (15 | ) |
| USD | | | 10,821 | | | KRW | | | 12,100,000 | | | HSBC Holdings Plc | | | 6/04/13 | | | | (14 | ) |
| USD | | | 20,504 | | | KRW | | | 22,800,000 | | | HSBC Holdings Plc | | | 6/04/13 | | | | 88 | |
| USD | | | 9,917 | | | KRW | | | 10,900,000 | | | HSBC Holdings Plc | | | 6/04/13 | | | | 157 | |
| USD | | | 33,314 | | | KRW | | | 36,500,000 | | | HSBC Holdings Plc | | | 6/04/13 | | | | 631 | |
| USD | | | 189,982 | | | KRW | | | 211,450,000 | | | HSBC Holdings Plc | | | 6/04/13 | | | | 646 | |
| USD | | | 376,851 | | | KRW | | | 412,200,000 | | | HSBC Holdings Plc | | | 6/04/13 | | | | 7,761 | |
| USD | | | 627,400 | | | KRW | | | 686,250,000 | | | HSBC Holdings Plc | | | 6/04/13 | | | | 12,921 | |
| USD | | | 189,522 | | | KRW | | | 211,450,000 | | | Morgan Stanley | | | 6/04/13 | | | | 187 | |
| USD | | | 100,466 | | | KRW | | | 112,170,000 | | | Royal Bank of Scotland Group Plc | | | 6/04/13 | | | | 27 | |
| USD | | | 224,567 | | | KRW | | | 248,820,000 | | | Royal Bank of Scotland Group Plc | | | 6/04/13 | | | | 1,770 | |
| USD | | | 14,927 | | | KRW | | | 16,300,000 | | | UBS AG | | | 6/04/13 | | | | 332 | |
| USD | | | 226,699 | | | MXN | | | 2,920,000 | | | Bank of America Corp. | | | 6/04/13 | | | | (8,162 | ) |
| USD | | | 168,535 | | | MXN | | | 2,185,000 | | | Bank of America Corp. | | | 6/04/13 | | | | (7,210 | ) |
| USD | | | 98,086 | | | MXN | | | 1,275,000 | | | Bank of America Corp. | | | 6/04/13 | | | | (4,465 | ) |
| USD | | | 26,926 | | | MXN | | | 350,000 | | | Bank of America Corp. | | | 6/04/13 | | | | (1,226 | ) |
| USD | | | 89,665 | | | MXN | | | 1,120,000 | | | Bank of America Corp. | | | 6/04/13 | | | | (419 | ) |
See Notes to Financial Statements.
| | | | | | |
| | | | | MARCH 31, 2013 | | 25 |
| | BLACKROCK MANAGED VOLATILITY PORTFOLIO | | |
Schedule of Investments (continued)
| — | | Foreign currency exchange contracts as of March 31, 2013 were as follows: (continued) |
| | | | | | | | | | | | | | | | | | | | |
| |
Currency Purchased | | | | | Currency
Sold | | | | | Counterparty | | Settlement
Date | | | Unrealized
Appreciation
(Depreciation) | |
| |
| USD | | | 40,900 | | | MXN | | | 510,000 | | | Credit Suisse Group AG | | | 6/04/13 | | | | $ (120 | ) |
| USD | | | 168,055 | | | MXN | | | 2,185,000 | | | Goldman Sachs Group, Inc. | | | 6/04/13 | | | | (7,689 | ) |
| USD | | | 185,027 | | | MXN | | | 2,390,000 | | | Goldman Sachs Group, Inc. | | | 6/04/13 | | | | (7,205 | ) |
| USD | | | 98,023 | | | MXN | | | 1,275,000 | | | Goldman Sachs Group, Inc. | | | 6/04/13 | | | | (4,528 | ) |
| USD | | | 26,908 | | | MXN | | | 350,000 | | | Goldman Sachs Group, Inc. | | | 6/04/13 | | | | (1,243 | ) |
| USD | | | 20,908 | | | MXN | | | 260,000 | | | Goldman Sachs Group, Inc. | | | 6/04/13 | | | | (5 | ) |
| USD | | | 3,119 | | | MXN | | | 40,000 | | | HSBC Holdings Plc | | | 6/04/13 | | | | (98 | ) |
| USD | | | 206,210 | | | MXN | | | 2,650,000 | | | Morgan Stanley | | | 6/04/13 | | | | (6,935 | ) |
| USD | | | 368,660 | | | MXN | | | 4,630,000 | | | Morgan Stanley | | | 6/04/13 | | | | (3,741 | ) |
| USD | | | 148,380 | | | MXN | | | 1,850,000 | | | UBS AG | | | 6/04/13 | | | | (420 | ) |
| USD | | | 159,185 | | | MYR | | | 500,000 | | | Deutsche Bank AG | | | 6/04/13 | | | | (1,520 | ) |
| USD | | | 176,000 | | | MYR | | | 550,000 | | | Deutsche Bank AG | | | 6/04/13 | | | | (776 | ) |
| USD | | | 28,846 | | | MYR | | | 90,000 | | | Deutsche Bank AG | | | 6/04/13 | | | | (81 | ) |
| USD | | | 7,356 | | | PHP | | | 300,000 | | | Deutsche Bank AG | | | 6/04/13 | | | | – | |
| USD | | | 7,349 | | | PHP | | | 300,000 | | | HSBC Holdings Plc | | | 6/04/13 | | | | (6 | ) |
| USD | | | 839,281 | | | PHP | | | 34,100,000 | | | HSBC Holdings Plc | | | 6/04/13 | | | | 3,190 | |
| USD | | | 18,700 | | | PLN | | | 60,000 | | | Bank of America Corp. | | | 6/04/13 | | | | 378 | |
| USD | | | 3,115 | | | PLN | | | 10,000 | | | Deutsche Bank AG | | | 6/04/13 | | | | 61 | |
| USD | | | 132,268 | | | PLN | | | 430,000 | | | Deutsche Bank AG | | | 6/04/13 | | | | 957 | |
| USD | | | 83,254 | | | PLN | | | 270,000 | | | Goldman Sachs Group, Inc. | | | 6/04/13 | | | | 803 | |
| USD | | | 48,908 | | | PLN | | | 160,000 | | | HSBC Holdings Plc | | | 6/04/13 | | | | 48 | |
| USD | | | 9,353 | | | PLN | | | 30,000 | | | HSBC Holdings Plc | | | 6/04/13 | | | | 192 | |
| USD | | | 46,055 | | | PLN | | | 150,000 | | | JPMorgan Chase & Co. | | | 6/04/13 | | | | 249 | |
| USD | | | 43,155 | | | PLN | | | 140,000 | | | JPMorgan Chase & Co. | | | 6/04/13 | | | | 403 | |
| USD | | | 37,153 | | | PLN | | | 120,000 | | | JPMorgan Chase & Co. | | | 6/04/13 | | | | 508 | |
| USD | | | 28,052 | | | PLN | | | 90,000 | | | JPMorgan Chase & Co. | | | 6/04/13 | | | | 569 | |
| USD | | | 61,650 | | | PLN | | | 200,000 | | | JPMorgan Chase & Co. | | | 6/04/13 | | | | 576 | |
| USD | | | 113,601 | | | PLN | | | 370,000 | | | JPMorgan Chase & Co. | | | 6/04/13 | | | | 613 | |
| USD | | | 28,629 | | | PLN | | | 90,000 | | | JPMorgan Chase & Co. | | | 6/04/13 | | | | 1,145 | |
| USD | | | 50,106 | | | PLN | | | 160,000 | | | JPMorgan Chase & Co. | | | 6/04/13 | | | | 1,246 | |
| USD | | | 578,878 | | | PLN | | | 1,819,820 | | | JPMorgan Chase & Co. | | | 6/04/13 | | | | 23,153 | |
| USD | | | 62,078 | | | PLN | | | 200,000 | | | Royal Bank of Scotland Group Plc | | | 6/04/13 | | | | 1,003 | |
| USD | | | 119,446 | | | RON | | | 410,000 | | | Royal Bank of Scotland Group Plc | | | 6/04/13 | | | | 1,486 | |
| USD | | | 27,320 | | | RUB | | | 850,000 | | | Credit Suisse Group AG | | | 6/04/13 | | | | 300 | |
| USD | | | 41,814 | | | RUB | | | 1,300,000 | | | Credit Suisse Group AG | | | 6/04/13 | | | | 490 | |
| USD | | | 64,226 | | | RUB | | | 2,000,000 | | | Credit Suisse Group AG | | | 6/04/13 | | | | 650 | |
| USD | | | 296,556 | | | RUB | | | 9,300,000 | | | Credit Suisse Group AG | | | 6/04/13 | | | | 929 | |
| USD | | | 86,845 | | | RUB | | | 2,700,000 | | | Credit Suisse Group AG | | | 6/04/13 | | | | 1,017 | |
| USD | | | 189,772 | | | RUB | | | 5,900,000 | | | Credit Suisse Group AG | | | 6/04/13 | | | | 2,223 | |
| USD | | | 149,261 | | | RUB | | | 4,645,000 | | | Deutsche Bank AG | | | 6/04/13 | | | | 1,606 | |
| USD | | | 27,226 | | | RUB | | | 850,000 | | | Goldman Sachs Group, Inc. | | | 6/04/13 | | | | 206 | |
| USD | | | 28,967 | | | RUB | | | 900,000 | | | Goldman Sachs Group, Inc. | | | 6/04/13 | | | | 358 | |
| USD | | | 54,777 | | | RUB | | | 1,700,000 | | | Goldman Sachs Group, Inc. | | | 6/04/13 | | | | 737 | |
| USD | | | 157,157 | | | RUB | | | 4,900,000 | | | Goldman Sachs Group, Inc. | | | 6/04/13 | | | | 1,396 | |
| USD | | | 143,625 | | | RUB | | | 4,475,000 | | | HSBC Holdings Plc | | | 6/04/13 | | | | 1,374 | |
See Notes to Financial Statements.
| | | | |
| | | | | MARCH 31, 2013 |
| 26 | | BLACKROCK MANAGED VOLATILITY PORTFOLIO | |
Schedule of Investments (continued)
| — | | Foreign currency exchange contracts as of March 31, 2013 were as follows: (continued) |
| | | | | | | | | | | | | | | | | | | | |
| |
Currency Purchased | | | | | Currency
Sold | | | | | Counterparty | | Settlement
Date | | | Unrealized
Appreciation
(Depreciation) | |
| |
| USD | | | 70,502 | | | RUB | | | 2,200,000 | | | JPMorgan Chase & Co. | | | 6/04/13 | | | | $ 568 | |
| USD | | | 124,561 | | | RUB | | | 3,900,000 | | | Morgan Stanley | | | 6/04/13 | | | | 588 | |
| USD | | | 99,439 | | | RUB | | | 3,100,000 | | | Morgan Stanley | | | 6/04/13 | | | | 896 | |
| USD | | | 156,913 | | | RUB | | | 4,900,000 | | | Morgan Stanley | | | 6/04/13 | | | | 1,152 | |
| USD | | | 177,276 | | | RUB | | | 5,500,000 | | | Morgan Stanley | | | 6/04/13 | | | | 2,443 | |
| USD | | | 115,320 | | | RUB | | | 3,600,000 | | | UBS AG | | | 6/04/13 | | | | 883 | |
| USD | | | 137,732 | | | RUB | | | 4,300,000 | | | UBS AG | | | 6/04/13 | | | | 1,044 | |
| USD | | | 111,709 | | | RUB | | | 3,480,000 | | | UBS AG | | | 6/04/13 | | | | 1,087 | |
| USD | | | 48,009 | | | SGD | | | 60,000 | | | BNP Paribas SA | | | 6/04/13 | | | | (373 | ) |
| USD | | | 16,011 | | | SGD | | | 20,000 | | | BNP Paribas SA | | | 6/04/13 | | | | (116 | ) |
| USD | | | 192,467 | | | SGD | | | 240,000 | | | Credit Suisse Group AG | | | 6/04/13 | | | | (1,060 | ) |
| USD | | | 24,137 | | | SGD | | | 30,000 | | | Credit Suisse Group AG | | | 6/04/13 | | | | (54 | ) |
| USD | | | 40,033 | | | SGD | | | 50,000 | | | Deutsche Bank AG | | | 6/04/13 | | | | (285 | ) |
| USD | | | 136,018 | | | SGD | | | 170,000 | | | Goldman Sachs Group, Inc. | | | 6/04/13 | | | | (1,064 | ) |
| USD | | | 80,086 | | | SGD | | | 100,000 | | | Goldman Sachs Group, Inc. | | | 6/04/13 | | | | (551 | ) |
| USD | | | 80,121 | | | SGD | | | 100,000 | | | Goldman Sachs Group, Inc. | | | 6/04/13 | | | | (515 | ) |
| USD | | | 56,007 | | | SGD | | | 70,000 | | | Goldman Sachs Group, Inc. | | | 6/04/13 | | | | (438 | ) |
| USD | | | 64,097 | | | SGD | | | 80,000 | | | Goldman Sachs Group, Inc. | | | 6/04/13 | | | | (412 | ) |
| USD | | | 419,073 | | | SGD | | | 519,068 | | | HSBC Holdings Plc | | | 6/04/13 | | | | 516 | |
| USD | | | 645,885 | | | SGD | | | 800,000 | | | HSBC Holdings Plc | | | 6/04/13 | | | | 795 | |
| USD | | | 79,999 | | | SGD | | | 100,000 | | | State Street Corp. | | | 6/04/13 | | | | (637 | ) |
| USD | | | 311,852 | | | SGD | | | 390,000 | | | UBS AG | | | 6/04/13 | | | | (2,630 | ) |
| USD | | | 255,778 | | | SGD | | | 320,000 | | | UBS AG | | | 6/04/13 | | | | (2,258 | ) |
| USD | | | 191,877 | | | SGD | | | 240,000 | | | UBS AG | | | 6/04/13 | | | | (1,650 | ) |
| USD | | | 160,440 | | | SGD | | | 200,000 | | | UBS AG | | | 6/04/13 | | | | (833 | ) |
| USD | | | 72,236 | | | SGD | | | 90,000 | | | UBS AG | | | 6/04/13 | | | | (337 | ) |
| USD | | | 68,725 | | | THB | | | 2,020,000 | | | Deutsche Bank AG | | | 6/04/13 | | | | 40 | |
| USD | | | 168,327 | | | THB | | | 4,950,000 | | | UBS AG | | | 6/04/13 | | | | 16 | |
| USD | | | 550,116 | | | TRY | | | 1,000,000 | | | BNP Paribas SA | | | 6/04/13 | | | | 2,240 | |
| USD | | | 865,486 | | | TRY | | | 1,573,280 | | | BNP Paribas SA | | | 6/04/13 | | | | 3,524 | |
| USD | | | 291,939 | | | TRY | | | 530,000 | | | Credit Suisse Group AG | | | 6/04/13 | | | | 1,565 | |
| USD | | | 92,464 | | | TRY | | | 170,000 | | | Deutsche Bank AG | | | 6/04/13 | | | | (675 | ) |
| USD | | | 10,924 | | | TRY | | | 20,000 | | | Deutsche Bank AG | | | 6/04/13 | | | | (33 | ) |
| USD | | | 21,831 | | | TRY | | | 40,000 | | | Royal Bank of Scotland Group Plc | | | 6/04/13 | | | | (84 | ) |
| USD | | | 38,962 | | | ZAR | | | 365,000 | | | Bank of America Corp. | | | 6/04/13 | | | | (364 | ) |
| USD | | | 38,964 | | | ZAR | | | 365,000 | | | Bank of America Corp. | | | 6/04/13 | | | | (362 | ) |
| USD | | | 18,159 | | | ZAR | | | 170,000 | | | Bank of America Corp. | | | 6/04/13 | | | | (157 | ) |
| USD | | | 10,787 | | | ZAR | | | 100,000 | | | Bank of America Corp. | | | 6/04/13 | | | | 13 | |
| USD | | | 20,078 | | | ZAR | | | 180,000 | | | Bank of America Corp. | | | 6/04/13 | | | | 684 | |
| USD | | | 66,062 | | | ZAR | | | 590,000 | | | BNP Paribas SA | | | 6/04/13 | | | | 2,495 | |
| USD | | | 81,841 | | | ZAR | | | 750,000 | | | Credit Suisse Group AG | | | 6/04/13 | | | | 1,035 | |
| USD | | | 81,829 | | | ZAR | | | 750,000 | | | Deutsche Bank AG | | | 6/04/13 | | | | 1,023 | |
| USD | | | 20,292 | | | ZAR | | | 190,000 | | | JPMorgan Chase & Co. | | | 6/04/13 | | | | (179 | ) |
| USD | | | 143,243 | | | ZAR | | | 1,310,000 | | | Morgan Stanley | | | 6/04/13 | | | | 2,102 | |
| USD | | | 144,896 | | | ZAR | | | 1,350,000 | | | UBS AG | | | 6/04/13 | | | | (555 | ) |
See Notes to Financial Statements.
| | | | | | |
| | | | | MARCH 31, 2013 | | 27 |
| | BLACKROCK MANAGED VOLATILITY PORTFOLIO | | |
Schedule of Investments (continued)
| — | | Foreign currency exchange contracts as of March 31, 2013 were as follows: (continued) |
| | | | | | | | | | | | | | | | | | | | |
| |
Currency
Purchased | | | | | Currency
Sold | | | | | Counterparty | | Settlement
Date | | | Unrealized
Appreciation
(Depreciation) | |
| |
| USD | | | 158,609 | | | ZAR | | | 1,460,000 | | | UBS AG | | | 6/04/13 | | | | $ 1,307 | |
| ZAR | | | 180,000 | | | USD | | | 19,417 | | | Bank of America Corp. | | | 6/04/13 | | | | (24 | ) |
| ZAR | | | 270,000 | | | USD | | | 30,232 | | | BNP Paribas SA | | | 6/04/13 | | | | (1,142 | ) |
| ZAR | | | 210,000 | | | USD | | | 22,944 | | | BNP Paribas SA | | | 6/04/13 | | | | (318 | ) |
| ZAR | | | 380,000 | | | USD | | | 40,759 | | | BNP Paribas SA | | | 6/04/13 | | | | 183 | |
| ZAR | | | 330,000 | | | USD | | | 36,010 | | | Credit Suisse Group AG | | | 6/04/13 | | | | (455 | ) |
| ZAR | | | 40,000 | | | USD | | | 4,266 | | | Credit Suisse Group AG | | | 6/04/13 | | | | 44 | |
| ZAR | | | 510,000 | | | USD | | | 54,392 | | | Credit Suisse Group AG | | | 6/04/13 | | | | 556 | |
| ZAR | | | 330,000 | | | USD | | | 36,005 | | | Deutsche Bank AG | | | 6/04/13 | | | | (450 | ) |
| ZAR | | | 190,000 | | | USD | | | 20,148 | | | JPMorgan Chase & Co. | | | 6/04/13 | | | | 323 | |
| ZAR | | | 270,000 | | | USD | | | 28,631 | | | JPMorgan Chase & Co. | | | 6/04/13 | | | | 459 | |
| ZAR | | | 400,000 | | | USD | | | 42,417 | | | JPMorgan Chase & Co. | | | 6/04/13 | | | | 680 | |
| ZAR | | | 345,000 | | | USD | | | 37,265 | | | Morgan Stanley | | | 6/04/13 | | | | (95 | ) |
| ZAR | | | 110,000 | | | USD | | | 11,856 | | | Morgan Stanley | | | 6/04/13 | | | | (4 | ) |
| ZAR | | | 200,000 | | | USD | | | 21,251 | | | Morgan Stanley | | | 6/04/13 | | | | 297 | |
| ZAR | | | 290,000 | | | USD | | | 30,814 | | | Morgan Stanley | | | 6/04/13 | | | | 431 | |
| ZAR | | | 430,000 | | | USD | | | 45,689 | | | Morgan Stanley | | | 6/04/13 | | | | 639 | |
| ZAR | | | 5,170,000 | | | USD | | | 579,450 | | | Royal Bank of Scotland Group Plc | | | 6/04/13 | | | | (22,428 | ) |
| ZAR | | | 180,000 | | | USD | | | 20,174 | | | Royal Bank of Scotland Group Plc | | | 6/04/13 | | | | (781 | ) |
| ZAR | | | 140,000 | | | USD | | | 14,849 | | | State Street Corp. | | | 6/04/13 | | | | 235 | |
| ZAR | | | 200,000 | | | USD | | | 21,212 | | | State Street Corp. | | | 6/04/13 | | | | 336 | |
| ZAR | | | 300,000 | | | USD | | | 31,818 | | | State Street Corp. | | | 6/04/13 | | | | 504 | |
| ZAR | | | 290,000 | | | USD | | | 31,459 | | | UBS AG | | | 6/04/13 | | | | (214 | ) |
| ZAR | | | 295,000 | | | USD | | | 31,875 | | | UBS AG | | | 6/04/13 | | | | (91 | ) |
| AUD | | | 433,000 | | | USD | | | 447,635 | | | Bank of America Corp. | | | 6/12/13 | | | | 586 | |
| AUD | | | 466,000 | | | USD | | | 477,049 | | | Bank of America Corp. | | | 6/12/13 | | | | 5,332 | |
| AUD | | | 979,000 | | | USD | | | 1,002,212 | | | Bank of America Corp. | | | 6/12/13 | | | | 11,202 | |
| AUD | | | 187,000 | | | USD | | | 192,562 | | | Royal Bank of Canada | | | 6/12/13 | | | | 1,012 | |
| AUD | | | 215,000 | | | USD | | | 222,329 | | | State Street Corp. | | | 6/12/13 | | | | 228 | |
| AUD | | | 189,000 | | | USD | | | 196,682 | | | Westpac Banking Corp. | | | 6/12/13 | | | | (1,039 | ) |
| CAD | | | 983,000 | | | USD | | | 954,791 | | | Deutsche Bank AG | | | 6/12/13 | | | | 11,189 | |
| CAD | | | 1,145,000 | | | USD | | | 1,112,142 | | | Deutsche Bank AG | | | 6/12/13 | | | | 13,033 | |
| CAD | | | 352,000 | | | USD | | | 343,607 | | | JPMorgan Chase & Co. | | | 6/12/13 | | | | 2,298 | |
| CAD | | | 227,000 | | | USD | | | 221,626 | | | Royal Bank of Scotland Group Plc | | | 6/12/13 | | | | 1,444 | |
| EUR | | | 437,000 | | | USD | | | 568,996 | | | Bank of America Corp. | | | 6/12/13 | | | | (8,520 | ) |
| EUR | | | 295,000 | | | USD | | | 384,105 | | | Bank of America Corp. | | | 6/12/13 | | | | (5,751 | ) |
| EUR | | | 255,000 | | | USD | | | 330,145 | | | HSBC Holdings Plc | | | 6/12/13 | | | | (3,094 | ) |
| EUR | | | 251,000 | | | USD | | | 325,243 | | | Royal Bank of Canada | | | 6/12/13 | | | | (3,322 | ) |
| EUR | | | 764,000 | | | USD | | | 990,129 | | | State Street Corp. | | | 6/12/13 | | | | (10,257 | ) |
| GBP | | | 225,000 | | | USD | | | 340,799 | | | Bank of America Corp. | | | 6/12/13 | | | | 941 | |
| GBP | | | 224,000 | | | USD | | | 339,647 | | | Deutsche Bank AG | | | 6/12/13 | | | | 574 | |
| JPY | | | 26,200,000 | | | USD | | | 277,272 | | | Goldman Sachs Group, Inc. | | | 6/12/13 | | | | 1,202 | |
| JPY | | | 46,700,000 | | | USD | | | 494,222 | | | Goldman Sachs Group, Inc. | | | 6/12/13 | | | | 2,142 | |
| JPY | | | 2,200,000 | | | USD | | | 23,384 | | | HSBC Holdings Plc | | | 6/12/13 | | | | – | |
| JPY | | | 18,500,000 | | | USD | | | 196,601 | | | HSBC Holdings Plc | | | 6/12/13 | | | | 31 | |
See Notes to Financial Statements.
| | | | |
| | | | | MARCH 31, 2013 |
| 28 | | BLACKROCK MANAGED VOLATILITY PORTFOLIO | |
Schedule of Investments (continued)
| — | | Foreign currency exchange contracts as of March 31, 2013 were as follows: (continued) |
| | | | | | | | | | | | | | | | | | | | |
| |
Currency
Purchased | | | | | Currency
Sold | | | | | Counterparty | | Settlement
Date | | | Unrealized
Appreciation
(Depreciation) | |
| |
| JPY | | | 1,000,000 | | | USD | | | 10,608 | | | Westpac Banking Corp. | | | 6/12/13 | | | | $ 20 | |
| NZD | | | 344,000 | | | USD | | | 284,443 | | | UBS AG | | | 6/12/13 | | | | 1,906 | |
| NZD | | | 232,000 | | | USD | | | 190,444 | | | UBS AG | | | 6/12/13 | | | | 2,675 | |
| NZD | | | 806,000 | | | USD | | | 661,629 | | | UBS AG | | | 6/12/13 | | | | 9,294 | |
| NZD | | | 146,000 | | | USD | | | 119,700 | | | Westpac Banking Corp. | | | 6/12/13 | | | | 1,832 | |
| SEK | | | 241,000 | | | USD | | | 36,943 | | | HSBC Holdings Plc | | | 6/12/13 | | | | (21 | ) |
| SEK | | | 3,910,000 | | | USD | | | 606,277 | | | JPMorgan Chase & Co. | | | 6/12/13 | | | | (7,242 | ) |
| SEK | | | 1,630,000 | | | USD | | | 252,745 | | | JPMorgan Chase & Co. | | | 6/12/13 | | | | (3,019 | ) |
| SEK | | | 7,942,000 | | | USD | | | 1,230,428 | | | Royal Bank of Scotland Group Plc | | | 6/12/13 | | | | (13,668 | ) |
| SEK | | | 3,308,000 | | | USD | | | 512,498 | | | Royal Bank of Scotland Group Plc | | | 6/12/13 | | | | (5,693 | ) |
| SEK | | | 418,000 | | | USD | | | 64,393 | | | Royal Bank of Scotland Group Plc | | | 6/12/13 | | | | (353 | ) |
| SEK | | | 367,000 | | | USD | | | 56,536 | | | Royal Bank of Scotland Group Plc | | | 6/12/13 | | | | (310 | ) |
| USD | | | 195,388 | | | AUD | | | 189,000 | | | Bank of America Corp. | | | 6/12/13 | | | | (256 | ) |
| USD | | | 335,100 | | | AUD | | | 325,000 | | | Deutsche Bank AG | | | 6/12/13 | | | | (1,324 | ) |
| USD | | | 306,230 | | | AUD | | | 297,000 | | | Deutsche Bank AG | | | 6/12/13 | | | | (1,210 | ) |
| USD | | | 164,784 | | | AUD | | | 160,000 | | | HSBC Holdings Plc | | | 6/12/13 | | | | (840 | ) |
| USD | | | 149,336 | | | AUD | | | 145,000 | | | HSBC Holdings Plc | | | 6/12/13 | | | | (762 | ) |
| USD | | | 221,344 | | | AUD | | | 215,000 | | | JPMorgan Chase & Co. | | | 6/12/13 | | | | (1,214 | ) |
| USD | | | 69,565 | | | AUD | | | 67,000 | | | Royal Bank of Canada | | | 6/12/13 | | | | 210 | |
| USD | | | 195,744 | | | AUD | | | 188,000 | | | Royal Bank of Canada | | | 6/12/13 | | | | 1,135 | |
| USD | | | 454,360 | | | AUD | | | 441,000 | | | Westpac Banking Corp. | | | 6/12/13 | | | | (2,142 | ) |
| USD | | | 284,361 | | | AUD | | | 276,000 | | | Westpac Banking Corp. | | | 6/12/13 | | | | (1,341 | ) |
| USD | | | 78,049 | | | AUD | | | 75,000 | | | Westpac Banking Corp. | | | 6/12/13 | | | | 412 | |
| USD | | | 221,366 | | | CAD | | | 227,000 | | | BNP Paribas SA | | | 6/12/13 | | | | (1,703 | ) |
| USD | | | 570,783 | | | CAD | | | 585,000 | | | Royal Bank of Canada | | | 6/12/13 | | | | (4,088 | ) |
| USD | | | 358,899 | | | CAD | | | 368,000 | | | Royal Bank of Canada | | | 6/12/13 | | | | (2,729 | ) |
| USD | | | 326,860 | | | CAD | | | 335,000 | | | Royal Bank of Canada | | | 6/12/13 | | | | (2,340 | ) |
| USD | | | 263,310 | | | CAD | | | 270,000 | | | Royal Bank of Canada | | | 6/12/13 | | | | (2,015 | ) |
| USD | | | 229,940 | | | CAD | | | 236,000 | | | Royal Bank of Canada | | | 6/12/13 | | | | (1,973 | ) |
| USD | | | 126,779 | | | CAD | | | 130,000 | | | Royal Bank of Canada | | | 6/12/13 | | | | (970 | ) |
| USD | | | 63,420 | | | CAD | | | 65,000 | | | Royal Bank of Canada | | | 6/12/13 | | | | (454 | ) |
| USD | | | 222,285 | | | EUR | | | 172,000 | | | BNP Paribas SA | | | 6/12/13 | | | | 1,685 | |
| USD | | | 548,146 | | | EUR | | | 424,000 | | | BNP Paribas SA | | | 6/12/13 | | | | 4,343 | |
| USD | | | 57,563 | | | EUR | | | 45,000 | | | HSBC Holdings Plc | | | 6/12/13 | | | | (152 | ) |
| USD | | | 436,270 | | | EUR | | | 338,000 | | | HSBC Holdings Plc | | | 6/12/13 | | | | 2,767 | |
| USD | | | 121,545 | | | EUR | | | 94,000 | | | Royal Bank of Canada | | | 6/12/13 | | | | 985 | |
| USD | | | 553,472 | | | EUR | | | 430,000 | | | Royal Bank of Scotland Group Plc | | | 6/12/13 | | | | 1,974 | |
| USD | | | 222,081 | | | EUR | | | 172,000 | | | State Street Corp. | | | 6/12/13 | | | | 1,482 | |
| USD | | | 576,063 | | | EUR | | | 444,500 | | | State Street Corp. | | | 6/12/13 | | | | 5,968 | |
| USD | | | 1,330,837 | | | GBP | | | 892,000 | | | Bank of America Corp. | | | 6/12/13 | | | | (23,971 | ) |
| USD | | | 522,190 | | | GBP | | | 350,000 | | | Bank of America Corp. | | | 6/12/13 | | | | (9,406 | ) |
| USD | | | 608,848 | | | GBP | | | 404,000 | | | BNP Paribas SA | | | 6/12/13 | | | | (4,765 | ) |
| USD | | | 198,939 | | | GBP | | | 132,000 | | | HSBC Holdings Plc | | | 6/12/13 | | | | (1,548 | ) |
| USD | | | 337,154 | | | GBP | | | 223,000 | | | State Street Corp. | | | 6/12/13 | | | | (1,548 | ) |
| USD | | | 332,505 | | | GBP | | | 220,000 | | | Westpac Banking Corp. | | | 6/12/13 | | | | (1,640 | ) |
See Notes to Financial Statements.
| | | | | | |
| | | | | MARCH 31, 2013 | | 29 |
| | BLACKROCK MANAGED VOLATILITY PORTFOLIO | | |
Schedule of Investments (continued)
— Foreign currency exchange contracts as of March 31, 2013 were as follows: (continued)
| | | | | | | | | | | | | | | | | | | | |
| |
Currency
Purchased | | | | | Currency
Sold | | | | | Counterparty | | Settlement
Date | | | Unrealized
Appreciation
(Depreciation) | |
| |
| |
| |
| USD | | | 166,640 | | | JPY | | | 16,000,000 | | | BNP Paribas SA | | | 6/12/13 | | | | $ (3,420 | ) |
| USD | | | 334,924 | | | JPY | | | 31,700,000 | | | BNP Paribas SA | | | 6/12/13 | | | | (2,009 | ) |
| USD | | | 89,934 | | | JPY | | | 8,500,000 | | | BNP Paribas SA | | | 6/12/13 | | | | (410 | ) |
| USD | | | 109,670 | | | JPY | | | 10,500,000 | | | HSBC Holdings Plc | | | 6/12/13 | | | | (1,932 | ) |
| USD | | | 162,427 | | | JPY | | | 15,600,000 | | | UBS AG | | | 6/12/13 | | | | (3,382 | ) |
| USD | | | 144,790 | | | JPY | | | 13,800,000 | | | Westpac Banking Corp. | | | 6/12/13 | | | | (1,888 | ) |
| USD | | | 32,538 | | | NOK | | | 191,000 | | | HSBC Holdings Plc | | | 6/12/13 | | | | (65 | ) |
| USD | | | 630,283 | | | NOK | | | 3,635,000 | | | Royal Bank of Scotland Group Plc | | | 6/12/13 | | | | 9,802 | |
| USD | | | 650,050 | | | NOK | | | 3,749,000 | | | Royal Bank of Scotland Group Plc | | | 6/12/13 | | | | 10,109 | |
| USD | | | 110,660 | | | NZD | | | 135,000 | | | Bank of America Corp. | | | 6/12/13 | | | | (1,716 | ) |
| USD | | | 226,098 | | | NZD | | | 276,000 | | | Royal Bank of Scotland Group Plc | | | 6/12/13 | | | | (3,648 | ) |
| USD | | | 109,694 | | | NZD | | | 135,000 | | | Royal Bank of Scotland Group Plc | | | 6/12/13 | | | | (2,682 | ) |
| USD | | | 298,130 | | | SEK | | | 1,920,000 | | | JPMorgan Chase & Co. | | | 6/12/13 | | | | 3,975 | |
| USD | | | 891,594 | | | SEK | | | 5,742,000 | | | JPMorgan Chase & Co. | | | 6/12/13 | | | | 11,887 | |
| |
| Total | | | | | | | | | | | | | | | | | | | $1,994,564 | |
| | | | | | | | | | | | | | | | | | | | |
| — | | Exchange-traded options written as of March 31, 2013 were as follows: |
| | | | | | | | | | | | | | | | | | | | | | | | |
| |
| Description | | Put/
Call | | Strike Price | | | | | Expiration
Date | | | | Contracts | | Market
Value | |
| |
| |
| |
| U.S. Treasury Notes (10 Year) | | Call | | USD | | | 131.50 | | | | | 4/26/13 | | | | 29 | | | | | | | $(24,922 | ) |
| U.S. Treasury Notes (10 Year) | | Call | | USD | | | 131.50 | | | | | 5/24/13 | | | | 25 | | | | | | | (28,516 | ) |
| U.S. Treasury Notes (10 Year) | | Put | | USD | | | 131.50 | | | | | 4/26/13 | | | | 29 | | | | | | | (10,875 | ) |
| U.S. Treasury Notes (10 Year) | | Put | | USD | | | 131.50 | | | | | 5/24/13 | | | | 25 | | | | | | | (16,406 | ) |
| |
| Total | | | | | | | | | | | | | | | | | | | | | | | $(80,719 | ) |
| | | | | | | | | | | | | | | | | | | | | | | | |
| — | | Credit default swaps - sold protection outstanding as of March 31, 2013 were as follows: |
| | | | | | | | | | | | | | | | | | | | | | | | | | |
| |
| Index | | Receive
Fixed
Rate | | | Counterparty | | Expiration
Date | | | | Credit
Rating1 | | | | Notional
Amount
(000)2 | | | Unrealized
Depreciation | |
| |
| |
| |
iTraxx Europe Crossover Series 19 Version 1 | | | 5.00% | | | Credit Suisse Group AG | | 6/20/18 | | | | B+ | | | | | EUR | | | | 610 | | | | $ (5,276 | ) |
iTraxx Europe Crossover Series 19 Version 1 | | | 5.00% | | | Credit Suisse Group AG | | 6/20/18 | | | | B+ | | | | | EUR | | | | 610 | | | | (6,044 | ) |
iTraxx Europe Crossover Series 19 Version 1 | | | 5.00% | | | Deutsche Bank AG | | 6/20/18 | | | | B+ | | | | | EUR | | | | 650 | | | | (8,376 | ) |
iTraxx Europe Crossover Series 19 Version 1 | | | 5.00% | | | Société Générale | | 6/20/18 | | | | B+ | | | | | EUR | | | | 630 | | | | (5,185 | ) |
| |
Total | | | | | | | | | | | | | | | | | | | | | | | | | $(24,881 | ) |
| | | | | | | | | | | | | | | | | | | | | | | | | | |
| | 1 | Using Standard & Poor’s rating of the underlying securities of the index. |
| | 2 | The maximum potential amount the Fund may pay should a negative credit event take place as defined under the terms of the agreement. |
| — | | Interest rate swaps outstanding as of March 31, 2013 were as follows: |
| | | | | | | | | | | | | | | | |
| |
Fixed Rate | | Floating Rate | | Counterparty | | Expiration
Date | | Notional Amount (000) | | | Unrealized
Appreciation
(Depreciation) | |
| |
| |
| |
| 0.94%1 | | 1-day STIBOR | | Royal Bank of Scotland Group Plc | | 10/30/13 | | SEK | | | 87,590 | | | | $(22,774 | ) |
| 0.14%1 | | 1-day FEDL01 | | Royal Bank of Scotland Group Plc | | 6/12/14 | | USD | | | 6,610 | | | | (957 | ) |
| 0.19%2 | | 1-day FEDL01 | | Citigroup, Inc. | | 9/20/14 | | USD | | | 10,890 | | | | (2,235 | ) |
| 0.20%2 | | 1-day FEDL01 | | Royal Bank of Scotland Group Plc | | 10/15/14 | | USD | | | 9,484 | | | | (2,547 | ) |
| 0.27%2 | | 1-day FEDL01 | | JPMorgan Chase & Co. | | 1/30/15 | | USD | | | 12,270 | | | | (7,096 | ) |
See Notes to Financial Statements.
| | | | |
| | | | | MARCH 31, 2013 |
| 30 | | BLACKROCK MANAGED VOLATILITY PORTFOLIO | |
Schedule of Investments (continued)
| — | | Interest rate swaps outstanding as of March 31, 2013 were as follows: (concluded) |
| | | | | | | | | | | | | | | | | | | | |
| |
Fixed Rate | | Floating Rate | | Counterparty | | Expiration
Date | | | | Notional
Amount (000) | | | | Unrealized
Appreciation
(Depreciation) | |
| |
1.46%2 | | 3-month LIBOR | | Citigroup, Inc. | | 2/15/20 | | | | | USD | | | 3,140 | | | | | – | |
1.46%2 | | 3-month LIBOR | | Deutsche Bank AG | | 2/15/20 | | | | | USD | | | 12,300 | | | | | $ 12,802 | |
1.44%2 | | 3-month LIBOR | | Deutsche Bank AG | | 2/15/20 | | | | | USD | | | 780 | | | | | 1,760 | |
1.60%2 | | 3-month LIBOR | | Deutsche Bank AG | | 2/15/20 | | | | | USD | | | 470 | | | | | (3,996 | ) |
1.63%2 | | 6-month EURIBOR | | Deutsche Bank AG | | 1/04/22 | | | | | EUR | | | 1,600 | | | | | (12,947 | ) |
2.30%1 | | 6-month GBP LIBOR | | Royal Bank of Scotland Group Plc | | 3/07/25 | | | | | GBP | | | 310 | | | | | 4,184 | |
| |
Total | | | | | | | | | | | | | | | | | | | $(33,806 | ) |
| | | | | | | | | | | | | | | | | | | | |
1 Fund pays the floating rate and receives the fixed rate.
2 Fund pays the fixed rate and receives the floating rate.
| — | | Fair Value Measurements – Various inputs are used in determining the fair value of investments and derivative financial instruments. These inputs to valuation techniques are categorized into a disclosure hierarchy consisting of three broad levels for financial statement purposes as follows: |
| | — | | Level 1 – unadjusted price quotations in active markets/exchanges for identical assets and liabilities that the Fund has the ability to access |
| | — | | Level 2 – other observable inputs (including, but not limited to, quoted prices for similar assets or liabilities in markets that are active, quoted prices for identical or similar assets or liabilities in markets that are not active, inputs other than quoted prices that are observable for the assets or liabilities (such as interest rates, yield curves, volatilities, prepayment speeds, loss severities, credit risks and default rates) or other market–corroborated inputs) |
| | — | | Level 3 – unobservable inputs based on the best information available in the circumstances, to the extent observable inputs are not available (including the Fund’s own assumptions used in determining the fair value of investments and derivative financial instruments) |
The hierarchy gives the highest priority to unadjusted quoted prices in active markets for identical assets or liabilities (Level 1 measurements) and the lowest priority to unobservable inputs (Level 3 measurements). Accordingly, the degree of judgment exercised in determining fair value is greatest for instruments categorized in Level 3. The inputs used to measure fair value may fall into different levels of the fair value hierarchy. In such cases, for disclosure purposes, the level in the fair value hierarchy within which the fair value measurement falls in its entirety is determined based on the lowest level input that is significant to the fair value measurement in its entirety.
Changes in valuation techniques may result in transfers into or out of an assigned level within the disclosure hierarchy. In accordance with the Fund’s policy, transfers between different levels of the fair value disclosure hierarchy are deemed to have occurred as of the beginning of the reporting period. The categorization of a value determined for investments and derivative financial instruments is based on the pricing transparency of the investment and derivative financial instrument and is not necessarily an indication of the risks associated with investing in those securities. For information about the Fund’s policy regarding valuation of investments and derivative financial instruments and other significant accounting policies, please refer to Note 1 of the Notes to Financial Statements.
The following tables summarize the Fund’s investments and derivative financial instruments categorized in the disclosure hierarchy as of March 31, 2013:
| | | | | | | | | | | | | | | | |
| |
| | | Level 1 | | | Level 2 | | | Level 3 | | | Total | |
| |
Assets: | | | | | | | | | | | | | | | | |
Investments: | | | | | | | | | | | | | | | | |
Long-Term Investments: | | | | | | | | | | | | | | | | |
Asset-Backed Securities | | | – | | | | $ 373,947 | | | | – | | | | $ 373,947 | |
Common Stocks | | | $ 87,605,705 | | | | 33,055,373 | | | | $ 1,038 | | | | 120,662,116 | |
Corporate Bonds | | | – | | | | 48,584,082 | | | | – | | | | 48,584,082 | |
Foreign Agency Obligations | | | – | | | | 11,520,012 | | | | – | | | | 11,520,012 | |
Foreign Government Obligations | | | – | | | | 72,469,662 | | | | – | | | | 72,469,662 | |
Investment Companies | | | 235,571,747 | | | | – | | | | – | | | | 235,571,747 | |
Non-Agency Mortgage-Backed Securities | | | – | | | | 952,070 | | | | – | | | | 952,070 | |
U.S. Government Sponsored Agency Securities | | | – | | | | 24,553,373 | | | | – | | | | 24,553,373 | |
U.S. Treasury Obligations | | | – | | | | 4,202,174 | | | | – | | | | 4,202,174 | |
Short-Term Securities | | | 34,703,090 | | | | 681,615 | | | | – | | | | 35,384,705 | |
| |
Total | | | $357,880,542 | | | | $196,392,308 | | | | $ 1,038 | | | | $554,273,888 | |
| | | | |
See Notes to Financial Statements.
| | | | | | |
| | | | | MARCH 31, 2013 | | 31 |
| | BLACKROCK MANAGED VOLATILITY PORTFOLIO | | |
Schedule of Investments (concluded)
| | | | | | | | | | | | | | |
| |
| | | Level 1 | | | Level 2 | | | Level 3 | | Total | |
| |
Derivative Financial Instruments1 | | | | | | | | | | | | | | |
Assets: | | | | | | | | | | | | | | |
Foreign currency exchange contracts | | | $ 7,950 | | | | $ 3,018,322 | | | – | | | $ 3,026,272 | |
Interest rate contracts | | | 144,089 | | | | 18,746 | | | – | | | 162,835 | |
Liabilities: | | | | | | | | | | | | | | |
Credit contracts | | | – | | | | (24,881) | | | – | | | (24,881) | |
Equity contracts | | | (1,877,512) | | | | – | | | – | | | (1,877,512) | |
Foreign currency exchange contracts | | | (8,570) | | | | (1,023,138) | | | – | | | (1,031,708) | |
Interest rate contracts | | | (155,389) | | | | (52,552) | | | – | | | (207,941) | |
| |
Total | | | $ (1,889,432) | | | | $ 1,936,497 | | | – | | | $ 47,065 | |
| | | | |
1 Derivative financial instruments are swaps, financial futures contracts, foreign currency exchange contracts and options written. Swaps, financial futures contracts and foreign currency exchange contracts are valued at the unrealized appreciation/depreciation on the instrument and options written are shown at value. | |
Certain of the Fund’s assets and liabilities are held at carrying amount, which approximates fair value for financial statement purposes. As of March 31, 2013, such assets and liabilities are categorized within the disclosure hierarchy as follows: | |
| |
| | | Level 1 | | | Level 2 | | | Level 3 | | Total | |
| |
Assets: | | | | | | | | | | | | | | |
Cash | | | $ 373,156 | | | | – | | | – | | | $ 373,156 | |
Cash pledged as collateral for financial futures contracts | | | 7,814,000 | | | | – | | | – | | | 7,814,000 | |
Foreign currency at value | | | 4,907,017 | | | | – | | | – | | | 4,907,017 | |
Liabilities: | | | | | | | | | | | | | | |
Collateral on securities loaned at value | | | – | | | | $ (681,615) | | | – | | | (681,615) | |
| |
Total | | | $ 13,094,173 | | | | $ (681,615) | | | – | | | $ 12,412,558 | |
| | | | |
There were no transfers between levels during the six months ended March 31, 2013.
Certain of the Fund’s investments and derivative financial instruments that are categorized as Level 3 were valued utilizing transaction prices or third party pricing information without adjustment. Such valuations are based on unobservable inputs. A significant change in third party information input could result in a significantly lower or higher value of such Level 3 investments and derivative financial instruments.
See Notes to Financial Statements.
| | | | |
| | | | | MARCH 31, 2013 |
| 32 | | BLACKROCK MANAGED VOLATILITY PORTFOLIO | |
Statement of Assets and Liabilities
March 31, 2013 (Unaudited)
| | | | |
| |
Assets | | | | |
| |
Investments at value – unaffiliated (including securities loaned at value of $672,058) (cost – $370,873,604) | | $ | 398,550,159 | |
Investments at value – affiliated (cost – $151,361,101) | | | 155,723,729 | |
Cash | | | 373,156 | |
Cash pledged as collateral for financial futures contracts | | | 7,814,000 | |
Foreign currency at value (cost – $4,871,229) | | | 4,907,017 | |
Variation margin receivable | | | 77,131 | |
Investments sold receivable | | | 5,592,318 | |
Swap premiums paid | | | 32,799 | |
Unrealized appreciation on foreign currency exchange contracts | | | 3,026,272 | |
Unrealized appreciation on swaps | | | 18,746 | |
Capital shares sold receivable | | | 340,958 | |
Interest receivable | | | 1,285,660 | |
Dividends receivable – unaffiliated | | | 350,477 | |
Dividends receivable – affiliated | | | 4,313 | |
Securities lending income receivable – affiliated | | | 482 | |
Receivable from Manager | | | 85 | |
Prepaid expenses | | | 47,042 | |
Other assets | | | 87,511 | |
| | | | |
Total assets | | | 578,231,855 | |
| | | | |
|
| |
| |
Liabilities | | | | |
| |
Collateral on securities loaned at value | | | 681,615 | |
Variation margin payable | | | 203,906 | |
Investments purchased payable | | | 25,949,978 | |
Unrealized depreciation on foreign currency exchange contracts | | | 1,031,708 | |
Options written at value (premiums received – $82,934) | | | 80,719 | |
Unrealized depreciation on swaps | | | 77,433 | |
Capital shares redeemed payable | | | 740,056 | |
Investment advisory fees payable | | | 254,061 | |
Service and distribution fees payable | | | 166,905 | |
Other affiliates payable | | | 87,421 | |
Officer’s and Trustees’ fees payable | | | 5,586 | |
Other accrued expenses payable | | | 612,939 | |
| | | | |
Total liabilities | | | 29,892,327 | |
| | | | |
Net Assets | | $ | 548,339,528 | |
| | | | |
|
| |
| |
Net Assets Consist of | | | | |
| |
Paid-in capital | | $ | 482,855,375 | |
Undistributed net investment income | | | 531,198 | |
Accumulated net realized gain | | | 32,660,934 | |
Net unrealized appreciation/depreciation | | | 32,292,021 | |
| | | | |
Net Assets | | $ | 548,339,528 | |
| | | | |
|
| |
| |
Net Asset Value | | | | |
| |
Institutional – Based on net assets of $60,008,586 and 3,880,549 shares outstanding, unlimited number of shares authorized, $0.001 par value | | $ | 15.46 | |
| | | | |
Service – Based on net assets of $1,949,820 and 126,481 shares outstanding, unlimited number of shares authorized, $0.001 par value | | $ | 15.42 | |
| | | | |
Investor A – Based on net assets of $385,642,597 and 25,024,275 shares outstanding, unlimited number of shares authorized, $0.001 par value | | $ | 15.41 | |
| | | | |
Investor B – Based on net assets of $16,019,904 and 1,050,741 shares outstanding, unlimited number of shares authorized, $0.001 par value | | $ | 15.25 | |
| | | | |
Investor C – Based on net assets of $84,718,621 and 5,595,854 shares outstanding, unlimited number of shares authorized, $0.001 par value | | $ | 15.14 | |
| | | | |
See Notes to Financial Statements.
| | | | | | |
| | | | | MARCH 31, 2013 | | 33 |
| | BLACKROCK MANAGED VOLATILITY PORTFOLIO | | |
Statement of Operations
Six Months Ended March 31, 2013 (Unaudited)
| | | | |
| |
Investment Income | | | | |
| |
Interest | | $ | 2,093,020 | |
Dividends – unaffiliated | | | 3,194,485 | |
Foreign taxes withheld | | | (13,099) | |
Dividends – affiliated | | | 1,125,999 | |
Securities lending – affiliated | | | 9,904 | |
| | | | |
Total income | | | 6,410,309 | |
| | | | |
|
| |
| |
Expenses | | | | |
| |
Investment advisory | | | 1,511,753 | |
Service and distribution – class specific | | | 998,904 | |
Transfer agent – class specific | | | 453,471 | |
Administration | | | 203,593 | |
Professional | | | 110,447 | |
Administration – class specific | | | 68,767 | |
Printing | | | 50,643 | |
Custodian | | | 47,752 | |
Registration | | | 34,275 | |
Officer and Trustees | | | 9,589 | |
Miscellaneous | | | 49,580 | |
Recoupment of past waived fees – class specific | | | 11,786 | |
| | | | |
Total expenses | | | 3,550,560 | |
Less fees waived by Manager | | | (154,711) | |
Less administration fees waived – class specific | | | (15) | |
Less transfer agent fees waived – class specific | | | (4) | |
Less transfer agent fees reimbursed – class specific | | | (6) | |
Less fees paid indirectly | | | (181) | |
| | | | |
Total expenses after fees waived, reimbursed and paid indirectly | | | 3,395,643 | |
| | | | |
Net investment income | | | 3,014,666 | |
| | | | |
|
| |
| |
Realized and Unrealized Gain (Loss) | | | | |
| |
Net realized gain (loss) from: | | | | |
Investments – unaffiliated | | | 31,863,265 | |
Capital gain distributions received from affiliated investment companies | | | 446 | |
Options written | | | 303,503 | |
Financial futures contracts | | | (1,623,978) | |
Swaps | | | 81,423 | |
Foreign currency transactions | | | 4,151,709 | |
| | | | |
| | | 34,776,368 | |
| | | | |
Net change in unrealized appreciation/depreciation on: | | | | |
Investments – unaffiliated | | | (16,936,966) | |
Investments – affiliated | | | 4,137,532 | |
Options written | | | 2,215 | |
Financial futures contracts | | | 263,318 | |
Swaps | | | (39,266) | |
Foreign currency translations | | | 3,938,056 | |
| | | | |
| | | (8,635,111) | |
| | | | |
Total realized and unrealized gain | | | 26,141,257 | |
| | | | |
Net Increase in Net Assets Resulting from Operations | | $ | 29,155,923 | |
| | | | |
See Notes to Financial Statements.
| | | | |
| | | | | MARCH 31, 2013 |
| 34 | | BLACKROCK MANAGED VOLATILITY PORTFOLIO | |
Statements of Changes in Net Assets
| | | | | | | | |
Increase (Decrease) in Net Assets: | | Six Months
Ended March 31, 2013
(Unaudited) | | | Year Ended
September 30,
2012 | |
| |
Operations | | | | | | | | |
| |
Net investment income | | $ | 3,014,666 | | | $ | 6,374,853 | |
Net realized gain | | | 34,776,368 | | | | 25,501,855 | |
Net change in unrealized appreciation/depreciation | | | (8,635,111) | | | | 36,300,459 | |
| | | | |
Net increase in net assets resulting from operations | | | 29,155,923 | | | | 68,177,167 | |
| | | | |
|
| |
| |
Dividends and Distributions to Shareholders From | | | | | | | | |
| |
Net investment income: | | | | | | | | |
Institutional | | | (621,166) | | | | (728,212) | 1 |
Service | | | (16,132) | | | | (25,629) | 1 |
Investor A | | | (3,237,718) | | | | (5,876,499) | 1 |
Investor B | | | (15,863) | | | | (233,044) | 1 |
Investor C | | | (271,036) | | | | (927,535) | 1 |
Net realized gain: | | | | | | | | |
Institutional | | | (2,193,125) | | | | (878,568) | 1 |
Service | | | (70,315) | | | | (35,473) | 1 |
Investor A | | | (14,426,688) | | | | (8,053,732) | 1 |
Investor B | | | (670,450) | | | | (650,345) | 1 |
Investor C | | | (3,215,648) | | | | (1,802,237) | 1 |
| | | | |
Decrease in net assets resulting from dividends and distributions to shareholders | | | (24,738,141) | | | | (19,211,274) | |
| | | | |
|
| |
| |
Capital Share Transactions | | | | | | | | |
| |
Net decrease in net assets derived from capital share transactions | | | (13,267,656) | | | | (17,866,421) | |
| | | | |
|
| |
| |
Net Assets | | | | | | | | |
| |
Total increase (decrease) in net assets | | | (8,849,874) | | | | 31,099,472 | |
Beginning of period | | | 557,189,402 | | | | 526,089,930 | |
| | | | |
End of period | | $ | 548,339,528 | | | $ | 557,189,402 | |
| | | | |
Undistributed net investment income | | $ | 531,198 | | | $ | 1,678,447 | |
| | | | |
1 Dividends and distributions are determined in accordance with federal tax regulations.
See Notes to Financial Statements.
| | | | | | |
| | | | | MARCH 31, 2013 | | 35 |
| | BLACKROCK MANAGED VOLATILITY PORTFOLIO | | |
Financial Highlights
| | | | | | | | | | | | | | | | | | | | | | | | | | | | | | | | | | | | | | | | | | | | | | | | |
| | | Institutional | | | Service | |
| | | | | | | | |
| | | Six Months Ended March 31, 2013 (Unaudited) | | | Year Ended September 30, | | | Six Months Ended March 31, 2013 (Unaudited) | | | Year Ended September 30, | |
| | | | |
| | | | |
| | | | |
| | | 2012 | | | 2011 | | | 2010 | | | 2009 | | | 2008 | | | | 2012 | | | 2011 | | | 2010 | | | 2009 | | | 2008 | |
| |
Per Share Operating Performance | | | | | | | | | | | | | | | | | | | | | | | | | | | | | | | | | | | | | | | | | |
| |
Net asset value, beginning of period | | | $ 15.37 | | | | $ 14.03 | | | | $ 14.31 | | | | $ 13.28 | | | | $ 12.96 | | | | $ 17.07 | | | | $ 15.31 | | | | $ 13.99 | | | | $ 14.27 | | | | $ 13.24 | | | | $ 12.93 | | | | $ 17.03 | |
| | | | | | | | |
Net investment income1 | | | 0.11 | | | | 0.23 | | | | 0.29 | | | | 0.29 | | | | 0.27 | | | | 0.33 | | | | 0.09 | | | | 0.19 | | | | 0.25 | | | | 0.25 | | | | 0.24 | | | | 0.30 | |
Net realized and unrealized gain (loss) | | | 0.72 | | | | 1.68 | | | | (0.26) | | | | 1.02 | | | | 0.45 | | | | (2.76) | | | | 0.73 | | | | 1.67 | | | | (0.26) | | | | 1.03 | | | | 0.44 | | | | (2.76) | |
| | | | | | | | |
Net increase (decrease) from investment operations | | | 0.83 | | | | 1.91 | | | | 0.03 | | | | 1.31 | | | | 0.72 | | | | (2.43) | | | | 0.82 | | | | 1.86 | | | | (0.01) | | | | 1.28 | | | | 0.68 | | | | (2.46) | |
| | | | | | | | |
Dividends and distributions from: | | | | | | | | | | | | | | | | | | | | | | | | | | | | | | | | | | | | | | | | | | | | | | | | |
Net investment income | | | (0.16) | | | | (0.26) | 2 | | | (0.31) | 2 | | | (0.28) | 2 | | | (0.21) | 2 | | | (0.38) | 2 | | | (0.13) | | | | (0.23) | 2 | | | (0.27) | 2 | | | (0.25) | 2 | | | (0.18) | 2 | | | (0.34)2 | |
Net realized gain | | | (0.58) | | | | (0.31) | 2 | | | – | | | | – | | | | (0.19) | 2 | | | (1.30) | 2 | | | (0.58) | | | | (0.31) | 2 | | | – | | | | – | | | | (0.19) | 2 | | | (1.30)2 | |
| | | | | | | | |
Total dividends and distributions | | | (0.74) | | | | (0.57) | | | | (0.31) | | | | (0.28) | | | | (0.40) | | | | (1.68) | | | | (0.71) | | | | (0.54) | | | | (0.27) | | | | (0.25) | | | | (0.37) | | | | (1.64) | |
| | | | | | | | |
Net asset value, end of period | | | $ 15.46 | | | | $ 15.37 | | | | $ 14.03 | | | | $ 14.31 | | | | $ 13.28 | | | | $ 12.96 | | | | $ 15.42 | | | | $ 15.31 | | | | $ 13.99 | | | | $ 14.27 | | | | $ 13.24 | | | | $ 12.93 | |
| | | | | | | | |
|
| |
Total Investment Return3 | | | | | | | | | | | | | | | | | | | | | | | | | | | | | | | | | | | | | | | | | |
| |
Based on net asset value | | | 5.58% | 4 | | | 13.89% | | | | 0.06% | | | | 9.99% | | | | 6.15% | 5 | | | (15.81)% | | | | 5.51% | 4 | | | 13.53% | | | | (0.21)% | | | | 9.74% | | | | 5.83% | 6 | | | (16.00)% | |
| | | | | | | | |
|
| |
Ratios to Average Net Assets | | | | | | | | | | | | | | | | | | | | | | | | | | | | | | | | | | | | | | | | | |
| |
Total expenses | | | 0.94% | 7,8 | | | 0.95% | 9 | | | 0.94% | | | | 0.95% | | | | 0.95% | | | | 0.94% | | | | 1.23% | 7,8 | | | 1.27% | 9 | | | 1.24% | | | | 1.27% | | | | 1.18% | | | | 1.11% | |
| | | | | | | | |
Total expenses excluding recoupment of past waived fees | | | 0.90% | 7,8 | | | 0.91% | 9 | | | 0.94% | | | | 0.95% | | | | 0.95% | | | | 0.94% | | | | 1.21% | 7,8 | | | 1.27% | 9 | | | 1.24% | | | | 1.27% | | | | 1.15% | | | | 1.11% | |
| | | | | | | | |
Total expenses after fees waived, reimbursed and paid indirectly | | | 0.89% | 7,8 | | | 0.90% | 9 | | | 0.90% | | | | 0.91% | | | | 0.88% | | | | 0.89% | | | | 1.17% | 7,8 | | | 1.18% | 9 | | | 1.18% | | | | 1.19% | | | | 1.14% | | | | 1.11% | |
| | | | | | | | |
Total expenses after fees waived, reimbursed and paid indirectly and excluding interest expense | | | 0.89% | 7,8 | | | 0.89% | 9 | | | 0.89% | | | | 0.89% | | | | 0.88% | | | | 0.85% | | | | 1.17% | 7,8 | | | 1.17% | 9 | | | 1.17% | | | | 1.17% | | | | 1.14% | | | | 1.07% | |
| | | | | | | | |
Net investment income | | | 1.44% | 7,8 | | | 1.59% | 9 | | | 1.91% | | | | 2.09% | | | | 2.43% | | | | 2.20% | | | | 1.16% | 7,8 | | | 1.30% | 9 | | | 1.63% | | | | 1.80% | | | | 2.17% | | | | 1.96% | |
| | | | | | | | |
|
| |
Supplemental Data | | | | | | | | | | | | | | | | | | | | | | | | | | | | | | | | | | | | | | | | | | | | | | | | |
| |
Net assets, end of period (000) | | | $60,009 | | | | $ 59,041 | | | | $ 40,259 | | | | $ 39,083 | | | | $ 29,127 | | | | $ 23,083 | | | | $ 1,950 | | | | $ 1,915 | | | | $ 1,676 | | | | $ 1,652 | | | | $ 1,472 | | | | $ 1,552 | |
| | | | | | | | |
Portfolio turnover | | | 86% | | | | 324%10 | | | | 401%11 | | | | 400%12 | | | | 354%13 | | | | 391% | 14 | | | 86% | | | | 324%10 | | | | 401%11 | | | | 400%12 | | | | 354%13 | | | | 391%14 | |
| | | | | | | | |
| | 1 | | Based on average shares outstanding. |
| | 2 | | Dividends and distributions are determined in accordance with federal income tax regulations. |
| | 3 | | Where applicable, total investment returns exclude the effects of any sales charges and include the reinvestment of dividends and distributions. |
| | 4 | | Aggregate total investment return. |
| | 5 | | Includes proceeds received from a settlement of litigation, which impacted the Fund’s total return. Excluding these proceeds, the Fund’s total return would have been 5.92%. |
| | 6 | | Includes proceeds received from a settlement of litigation, which impacted the Fund’s total return. Excluding these proceeds, the Fund’s total return would have been 5.60%. |
| | 7 | | Ratios do not include expenses incurred indirectly as a result of investments in underlying funds of approximately 0.09%. |
| | 9 | | Ratios do not include expenses incurred indirectly as a result of investments in underlying funds of approximately 0.05%. |
| | 10 | | Includes mortgage dollar roll transactions; excluding these transactions the portfolio turnover would have been 254%. |
| | 11 | | Includes mortgage dollar roll transactions; excluding these transactions the portfolio turnover would have been 236%. |
| | 12 | | Includes mortgage dollar roll transactions; excluding these transactions the portfolio turnover would have been 302%. |
| | 13 | | Includes mortgage dollar roll transactions; excluding these transactions the portfolio turnover would have been 227%. |
| | 14 | | Includes TBA transactions; excluding these transactions the portfolio turnover would have been 121%. |
See Notes to Financial Statements.
| | | | |
| | | | | MARCH 31, 2013 |
| 36 | | BLACKROCK MANAGED VOLATILITY PORTFOLIO | |
Financial Highlights (continued)
| | | | | | | | | | | | | | | | | | | | | | | | | | | | | | | | | | | | | | | | | | | | | | | | |
| | | Investor A | | | Investor B | |
| | | | | | | | |
| | | Six Months Ended March 31, 2013 (Unaudited) | | | Year Ended September 30, | | | Six Months Ended March 31, 2013 (Unaudited) | | | Year Ended September 30, | |
| | | | |
| | | | |
| | | | |
| | | 2012 | | | 2011 | | | 2010 | | | 2009 | | | 2008 | | | | 2012 | | | 2011 | | | 2010 | | | 2009 | | | 2008 | |
| |
Per Share Operating Performance | | | | | | | | | | | | | | | | | | | | | | | | | | | | | | | | | | | | | | | | | |
| |
Net asset value, beginning of period | | | $ 15.30 | | | | $ 13.98 | | | | $ 14.26 | | | | $ 13.23 | | | | $ 12.92 | | | | $ 17.01 | | | | $ 15.10 | | | | $ 13.83 | | | | $ 14.10 | | | | $ 13.08 | | | | $ 12.75 | | | | $ 16.83 | |
| | | | | | | | |
Net investment income1 | | | 0.09 | | | | 0.19 | | | | 0.25 | | | | 0.24 | | | | 0.23 | | | | 0.28 | | | | 0.02 | | | | 0.06 | | | | 0.13 | | | | 0.12 | | | | 0.14 | | | | 0.16 | |
Net realized and unrealized gain (loss) | | | 0.73 | | | | 1.66 | | | | (0.26 | ) | | | 1.03 | | | | 0.43 | | | | (2.75) | | | | 0.71 | | | | 1.65 | | | | (0.26 | ) | | | 1.03 | | | | 0.43 | | | | (2.75) | |
| | | | | | | | |
Net increase (decrease) from investment operations | | | 0.82 | | | | 1.85 | | | | (0.01 | ) | | | 1.27 | | | | 0.66 | | | | (2.47) | | | | 0.73 | | | | 1.71 | | | | (0.13 | ) | | | 1.15 | | | | 0.57 | | | | (2.59) | |
| | | | | | | | |
Dividends and distributions from: | | | | | | | | | | | | | | | | | | | | | | | | | | | | | | | | | | | | | | | | | | | | | | | | |
Net investment income | | | (0.13 | ) | | | (0.22 | )2 | | | (0.27 | )2 | | | (0.24 | )2 | | | (0.16 | )2 | | | (0.32) | 2 | | | (0.01 | ) | | | (0.13 | )2 | | | (0.14 | )2 | | | (0.13 | )2 | | | (0.05 | )2 | | | (0.19)2 | |
Net realized gain | | | (0.58 | ) | | | (0.31 | )2 | | | – | | | | – | | | | (0.19 | )2 | | | (1.30) | 2 | | | (0.57 | ) | | | (0.31 | )2 | | | – | | | | – | | | | (0.19 | )2 | | | (1.30)2 | |
| | | | | | | | |
Total dividends and distributions | | | (0.71 | ) | | | (0.53 | ) | | | (0.27 | ) | | | (0.24 | ) | | | (0.35 | ) | | | (1.62) | | | | (0.58 | ) | | | (0.44 | ) | | | (0.14 | ) | | | (0.13 | ) | | | (0.24 | ) | | | (1.49) | |
| | | | | | | | |
Net asset value, end of period | | | $ 15.41 | | | | $ 15.30 | | | | $ 13.98 | | | | $ 14.26 | | | | $ 13.23 | | | | $ 12.92 | | | | $ 15.25 | | | | $ 15.10 | | | | $ 13.83 | | | | $ 14.10 | | | | $ 13.08 | | | | $ 12.75 | |
| | | | | | | | |
|
| |
Total Investment Return3 | | | | | | | | | | | | | | | | | | | | | | | | | | | | | | | | | | | | | | | | | |
| |
Based on net asset value | | | 5.49% | 4 | | | 13.51% | | | | (0.23)% | | | | 9.70% | | | | 5.66% | 5 | | | (16.05)% | | | | 5.02% | 4 | | | 12.60% | | | | (1.01)% | | | | 8.78% | | | | 4.93% | 6 | | | (16.89)% | |
| | | | | | | | |
|
| |
Ratios to Average Net Assets | | | | | | | | | | | | | | | | | | | | | | | | | | | | | | | | | | | | | | | | | |
| |
Total expenses | | | 1.18% | 7,8 | | | 1.23% | 9 | | | 1.20% | | | | 1.23% | | | | 1.27% | | | | 1.24% | | | | 2.09% | 7,8 | | | 2.08% | 9 | | | 2.00% | | | | 2.04% | | | | 2.07% | | | | 2.02% | |
| | | | | | | | |
Total expenses excluding recoupment of past waived fees | | | 1.18% | 7,8 | | | 1.23% | 9 | | | 1.20% | | | | 1.22% | | | | 1.27% | | | | 1.24% | | | | 2.09% | 7,8 | | | 2.08% | 9 | | | 2.00% | | | | 2.02% | | | | 2.06% | | | | 2.02% | |
| | | | | | | | |
Total expenses after fees waived, reimbursed and paid indirectly | | | 1.12% | 7,8 | | | 1.20% | 9 | | | 1.20% | | | | 1.22% | | | | 1.26% | | | | 1.24% | | | | 2.03% | 7,8 | | | 2.06% | 9 | | | 2.00% | | | | 2.04% | | | | 2.04% | | | | 2.02% | |
| | | | | | | | |
Total expenses after fees waived, reimbursed and paid indirectly and excluding interest expense | | | 1.12% | 7,8 | | | 1.19% | 9 | | | 1.19% | | | | 1.20% | | | | 1.26% | | | | 1.20% | | | | 2.03% | 7,8 | | | 2.05% | 9 | | | 1.98% | | | | 2.02% | | | | 2.04% | | | | 1.97% | |
| | | | | | | | |
Net investment income | | | 1.21% | 7,8 | | | 1.28% | 9 | | | 1.61% | | | | 1.75% | | | | 2.04% | | | | 1.84% | | | | 0.30% | 7,8 | | | 0.45% | 9 | | | 0.84% | | | | 0.91% | | | | 1.27% | | | | 1.06% | |
| | | | | | | | |
|
| |
Supplemental Data | | | | | | | | | | | | | | | | | | | | | | | | | | | | | | | | | | | | | | | | | |
| |
Net assets, end of period (000) | | | $385,643 | | | | $390,209 | | | | $370,916 | | | | $385,511 | | | | $361,751 | | | | $390,051 | | | | $16,020 | | | | $ 19,077 | | | | $ 31,595 | | | | $49,315 | | | | $69,934 | | | | $ 97,710 | |
| | | | | | | | |
Portfolio turnover | | | 86% | | | | 324% | 10 | | | 401% | 11 | | | 400% | 12 | | | 354% | 13 | | | 391% | 14 | | | 86% | | | | 324% | 10 | | | 401% | 11 | | | 400% | 12 | | | 354% | 13 | | | 391%14 | |
| | | | | | | | |
| | 1 | | Based on average shares outstanding. |
| | 2 | | Dividends and distributions are determined in accordance with federal income tax regulations. |
| | 3 | | Where applicable, total investment returns exclude the effects of any sales charges and include the reinvestment of dividends and distributions. |
| | 4 | | Aggregate total investment return. |
| | 5 | | Includes proceeds received from a settlement of litigation, which impacted the Fund’s total return. Excluding these proceeds, the Fund’s total return would have been 5.42%. |
| | 6 | | Includes proceeds received from a settlement of litigation, which impacted the Fund’s total return. Excluding these proceeds, the Fund’s total return would have been 4.69%. |
| | 7 | | Ratios do not include expenses incurred indirectly as a result of investments in underlying funds of approximately 0.09%. |
| | 9 | | Ratios do not include expenses incurred indirectly as a result of investments in underlying funds of approximately 0.05%. |
| | 10 | | Includes mortgage dollar roll transactions; excluding these transactions the portfolio turnover would have been 254%. |
| | 11 | | Includes mortgage dollar roll transactions; excluding these transactions the portfolio turnover would have been 236%. |
| | 12 | | Includes mortgage dollar roll transactions; excluding these transactions the portfolio turnover would have been 302%. |
| | 13 | | Includes mortgage dollar roll transactions; excluding these transactions the portfolio turnover would have been 227%. |
| | 14 | | Includes TBA transactions; excluding these transactions the portfolio turnover would have been 121%. |
See Notes to Financial Statements.
| | | | | | |
| | | | | MARCH 31, 2013 | | 37 |
| | BLACKROCK MANAGED VOLATILITY PORTFOLIO | | |
Financial Highlights (concluded)
| | | | | | | | | | | | | | | | | | | | | | | | |
| | | Investor C | |
| | | | |
| | | Six Months Ended March 31, 2013 | | | Year Ended September 30, | |
| | |
| | |
| | |
| | (Unaudited) | | | 2012 | | | 2011 | | | 2010 | | | 2009 | | | 2008 | |
| |
Per Share Operating Performance | | | | | | | | | | | | | | | | | | | | | | | | |
| |
Net asset value, beginning of period | | $ | 15.02 | | | $ | 13.76 | | | $ | 14.04 | | | $ | 13.04 | | | $ | 12.73 | | | $ | 16.78 | |
| | | | |
Net investment income1 | | | 0.04 | | | | 0.08 | | | | 0.13 | | | | 0.14 | | | | 0.15 | | | | 0.17 | |
Net realized and unrealized gain (loss) | | | 0.71 | | | | 1.64 | | | | (0.25 | ) | | | 1.02 | | | | 0.43 | | | | (2.71) | |
| | | | |
Net increase (decrease) from investment operations | | | 0.75 | | | | 1.72 | | | | (0.12 | ) | | | 1.16 | | | | 0.58 | | | | (2.54) | |
| | | | |
Dividends and distributions from: | | | | | | | | | | | | | | | | | | | | | | | | |
Net investment income | | | (0.05 | ) | | | (0.15 | )2 | | | (0.16 | )2 | | | (0.16 | )2 | | | (0.08 | )2 | | | (0.21)2 | |
Net realized gain | | | (0.58 | ) | | | (0.31 | )2 | | | – | | | | – | | | | (0.19 | )2 | | | (1.30)2 | |
| | | | |
Total dividends and distributions | | | (0.63 | ) | | | (0.46 | ) | | | (0.16 | ) | | | (0.16 | ) | | | (0.27 | ) | | | (1.51) | |
| | | | |
Net asset value, end of period | | $ | 15.14 | | | $ | 15.02 | | | $ | 13.76 | | | $ | 14.04 | | | $ | 13.04 | | | $ | 12.73 | |
| | | | |
|
| |
Total Investment Return3 | | | | | | | | | | | | | | | | | | | | | | | | |
| |
Based on net asset value | | | 5.09% | 4 | | | 12.75% | | | | (0.94)% | | | | 8.86% | | | | 4.99% | 5 | | | (16.66)% | |
| | | | |
|
| |
Ratios to Average Net Assets | | | | | | | | | | | | | | | | | | | | | | | | |
| |
Total expenses | | | 1.89% | 6,7 | | | 1.93% | 8 | | | 1.93% | | | | 1.94% | | | | 1.98% | | | | 1.94% | |
| | | | |
Total expenses excluding recoupment of past waived fees | | | 1.89% | 6,7 | | | 1.93% | 8 | | | 1.93% | | | | 1.94% | | | | 1.97% | | | | 1.94% | |
| | | | |
Total expenses after fees waived, reimbursed and paid indirectly | | | 1.84% | 6,7 | | | 1.90% | 8 | | | 1.93% | | | | 1.94% | | | | 1.98% | | | | 1.94% | |
| | | | |
Total expenses after fees waived, reimbursed and paid indirectly and excluding interest expense | | | 1.84% | 6,7 | | | 1.90% | 8 | | | 1.92% | | | | 1.92% | | | | 1.98% | | | | 1.90% | |
| | | | |
Net investment income | | | 0.49% | 6,7 | | | 0.58% | 8 | | | 0.89% | | | | 1.05% | | | | 1.32% | | | | 1.14% | |
| | | | |
|
| |
Supplemental Data | | | | | | | | | | | | | | | | | | | | | | | | |
| |
Net assets, end of period (000) | | $ | 84,719 | | | $ | 86,947 | | | $ | 81,644 | | | $ | 84,367 | | | $ | 72,063 | | | $ | 69,584 | |
| | | | |
Portfolio turnover | | | 86% | | | | 324% | 9 | | | 401% | 10 | | | 400% | 11 | | | 354% | 12 | | | 391%13 | |
| | | | |
| | 1 | | Based on average shares outstanding. |
| | 2 | | Dividends and distributions are determined in accordance with federal income tax regulations. |
| | 3 | | Where applicable, total investment returns exclude the effects of any sales charges and include the reinvestment of dividends and distributions. |
| | 4 | | Aggregate total investment return. |
| | 5 | | Includes proceeds received from a settlement of litigation, which impacted the Fund’s total return. Excluding these proceeds, the Fund’s total return would have been 4.75%. |
| | 6 | | Ratios do not include expenses incurred indirectly as a result of investments in underlying funds of approximately 0.09%. |
| | 8 | | Ratios do not include expenses incurred indirectly as a result of investments in underlying funds of approximately 0.05%. |
| | 9 | | Includes mortgage dollar roll transactions; excluding these transactions the portfolio turnover would have been 254%. |
| | 10 | | Includes mortgage dollar roll transactions; excluding these transactions the portfolio turnover would have been 236%. |
| | 11 | | Includes mortgage dollar roll transactions; excluding these transactions the portfolio turnover would have been 302%. |
| | 12 | | Includes mortgage dollar roll transactions; excluding these transactions the portfolio turnover would have been 227%. |
| | 13 | | Includes TBA transactions; excluding these transactions the portfolio turnover would have been 121%. |
See Notes to Financial Statements.
| | | | |
| | | | | MARCH 31, 2013 |
| 38 | | BLACKROCK MANAGED VOLATILITY PORTFOLIO | |
Notes to Financial Statements (Unaudited)
1. Organization and Significant Accounting Policies:
BlackRock FundsSM (the “Trust”) is registered under the Investment Company Act of 1940, as amended (the “1940 Act”), as an open-end management investment company. The Trust is organized as a Massachusetts business trust. These financial statements relate to one series of the Trust, BlackRock Managed Volatility Portfolio (the “Fund”). The Fund is classified as diversified. The Fund’s financial statements are prepared in conformity with accounting principles generally accepted in the United States of America (“US GAAP”), which may require management to make estimates and assumptions that affect the reported amounts of assets and liabilities in the financial statements and the reported amounts of increases and decreases in net assets from operations during the reporting period. Actual results could differ from those estimates. The Fund offers multiple classes of shares. Institutional Shares are sold without a sales charge and only to certain eligible investors. Service Shares are sold without a sales charge. Investor A Shares are generally sold with a front-end sales charge. Investor B and Investor C Shares may be subject to a CDSC. All classes of shares have identical voting, dividend, liquidation and other rights and the same terms and conditions, except that Service, Investor A, Investor B and Investor C Shares bear certain expenses related to the shareholder servicing of such shares, and Investor B and Investor C Shares also bear certain expenses related to the distribution of such shares. Investor B Shares automatically convert to Investor A Shares after approximately eight years. Investor B Shares are only available through exchanges and dividend reinvestments by existing shareholders and for purchase by certain employer-sponsored retirement plans. Each class has exclusive voting rights with respect to matters relating to its shareholder servicing and distribution expenditures (except that Investor B shareholders may vote on material changes to the Investor A distribution and service plan).
The following is a summary of significant accounting policies followed by the Fund:
Valuation: US GAAP defines fair value as the price the Fund would receive to sell an asset or pay to transfer a liability in an orderly transaction between market participants at the measurement date. The Fund determines the fair values of its financial instruments at market value using independent dealers or pricing services under policies approved by the Board of Trustees of the Trust (the “Board”). The BlackRock Global Valuation Methodologies Committee (the “Global Valuation Committee”) is the committee formed by management to develop global pricing policies and procedures and to provide oversight of the pricing function for the Fund for all financial instruments.
Equity investments traded on a recognized securities exchange or the NASDAQ Global Market System (“NASDAQ”) are valued at the last reported sale price that day or the NASDAQ official closing price, if applicable. For equity investments traded on more than one exchange, the last reported sale price on the exchange where the stock is primarily traded is used. Equity investments traded on a recognized exchange for which there were no sales on that day are valued at the last available bid
price. If no bid price is available, the prior day’s price will be used, unless it is determined that such prior day’s price no longer reflects the fair value of the security.
The Fund values its bond investments on the basis of last available bid prices or current market quotations provided by dealers or pricing services. In determining the value of a particular investment, pricing services may use certain information with respect to transactions in such investments, quotations from dealers, pricing matrixes, market transactions in comparable investments, various relationships observed in the market between investments and calculated yield measures. Asset-backed and mortgage-backed securities are valued by independent pricing services using models that consider estimated cash flows of each tranche of the security, establish a benchmark yield and develop an estimated tranche specific spread to the benchmark yield based on the unique attributes of the tranche. Financial futures contracts traded on exchanges are valued at their last sale price. To-be-announced (“TBA”) commitments are valued on the basis of last available bid prices or current market quotations provided by pricing services. Swap agreements are valued utilizing quotes received daily by the Fund’s pricing service or through brokers, which are derived using daily swap curves and models that incorporate a number of market data factors, such as discounted cash flows, trades and values of the underlying reference instruments. Investments in open-end registered investment companies are valued at NAV each business day.
The Fund values its investment in BlackRock Liquidity Series, LLC Money Market Series (the “Money Market Series”) at fair value, which is ordinarily based upon its pro rata ownership in the underlying fund’s net assets. The Money Market Series seeks current income consistent with maintaining liquidity and preserving capital. Although the Money Market Series is not registered under the 1940 Act, its investments will follow the parameters of investments by a money market fund that is subject to Rule 2a-7 under the 1940 Act. The Fund may withdraw up to 25% of its investment daily, although the manager of the Money Market Series, in its sole discretion, may permit an investor to withdraw more than 25% on any one day.
Securities and other assets and liabilities denominated in foreign currencies are translated into US dollars using exchange rates determined as of the close of business on the New York Stock Exchange (“NYSE”). Foreign currency exchange contracts are valued at the mean between the bid and ask prices and are determined as of the close of business on the NYSE. Interpolated values are derived when the settlement date of the contract is an interim date for which quotations are not available.
Exchange-traded options are valued at the mean between the last bid and ask prices at the close of the options market in which the options trade. An exchange-traded option for which there is no mean price is valued at the last bid (long positions) or ask (short positions) price. If no bid or ask price is available, the prior day’s price will be used, unless it is determined that the prior day’s price no longer reflects the fair value of the option. Over-the-counter (“OTC”) options and swaptions are valued
| | | | | | |
| | | | | MARCH 31, 2013 | | 39 |
| | BLACKROCK MANAGED VOLATILITY PORTFOLIO | | |
Notes to Financial Statements (continued)
by an independent pricing service using a mathematical model, which incorporates a number of market data factors, such as the trades and prices of the underlying instruments.
In the event that application of these methods of valuation results in a price for an investment that is deemed not to be representative of the market value of such investment, or if a price is not available, the investment will be valued by the Global Valuation Committee, or its delegate, in accordance with a policy approved by the Board as reflecting fair value (“Fair Value Assets”). When determining the price for Fair Value Assets, the Global Valuation Committee, or its delegate, seeks to determine the price that the Fund might reasonably expect to receive from the current sale of that asset in an arm’s-length transaction. Fair value determinations shall be based upon all available factors that the Global Valuation Committee, or its delegate, deem relevant consistent with the principles of fair value measurement which include the market approach, income approach and/or in the case of recent investments, the cost approach, as appropriate. A market approach generally consists of using comparable market transactions. The income approach generally is used to discount future cash flows to present value and adjusted for liquidity as appropriate. These factors include but are not limited to: (i) attributes specific to the investment or asset; (ii) the principal market for the investment or asset; (iii) the customary participants in the principal market for the investment or asset; (iv) data assumptions by market participants for the investment or asset, if reasonably available; (v) quoted prices for similar investments or assets in active markets; and (vi) other factors, such as future cash flows, interest rates, yield curves, volatilities, prepayment speeds, loss severities, credit risks, recovery rates, liquidation amounts and/or default rates. Due to the inherent uncertainty of valuations of such investments, the fair values may differ from the values that would have been used had an active market existed. The Global Valuation Committee, or its delegate, employs various methods for calibrating valuation approaches for investments where an active market does not exist, including regular due diligence of the Trust’s pricing vendors, a regular review of key inputs and assumptions, transactional back-testing or disposition analysis to compare unrealized gains and losses to realized gains and losses, reviews of missing or stale prices and large movements in market values and reviews of any market related activity. The pricing of all Fair Value Assets is subsequently reported to the Board or a committee thereof on a quarterly basis.
Generally, trading in foreign instruments is substantially completed each day at various times prior to the close of business on the NYSE. Occasionally, events affecting the values of such instruments may occur between the foreign market close and the close of business on the NYSE that may not be reflected in the computation of the Fund’s net assets. If events (for example, a company announcement, market volatility or a natural disaster) occur during such periods that are expected to affect the value of such instruments materially, those instruments may be Fair Value Assets and valued at their fair value, as determined in good faith by the Global Valuation Committee using a pricing service and/or policies approved by the Board. Each business day, the Fund uses a pricing service to assist with the valuation of certain foreign exchange-traded equity
securities and foreign exchange-traded and OTC options (the “Systematic Fair Value Price”). Using current market factors, the Systematic Fair Value Price is designed to value such foreign securities and foreign options at fair value as of the close of business on the NYSE, which follows the close of the local markets.
Foreign Currency: The Fund’s books and records are maintained in US dollars. Purchases and sales of investment securities are recorded at the rates of exchange prevailing on the respective date of such transactions. Generally, when the US dollar rises in value against a foreign currency, the Fund’s investments denominated in that currency will lose value because that currency is worth fewer US dollars; the opposite effect occurs if the US dollar falls in relative value.
The Fund does not isolate the portion of the results of operations arising as a result of changes in the foreign exchange rates from the changes in the market prices of investments held or sold for financial reporting purposes. Accordingly, the effects of changes in foreign currency exchange rates on investments are not segregated on the Statement of Operations from the effects of changes in market prices of those investments but are included as a component of net realized and unrealized gain (loss) from investments. The Fund reports realized currency gains (losses) on foreign currency related transactions as components of net realized gain (loss) for financial reporting purposes, whereas such components are treated as ordinary income for federal income tax purposes.
Asset-Backed and Mortgage-Backed Securities: The Fund may invest in asset-backed securities. Asset-backed securities are generally issued as pass-through certificates, which represent undivided fractional ownership interests in an underlying pool of assets, or as debt instruments, which are also known as collateralized obligations, and are generally issued as the debt of a special purpose entity organized solely for the purpose of owning such assets and issuing such debt. Asset-backed securities are often backed by a pool of assets representing the obligations of a number of different parties. The yield characteristics of certain asset-backed securities may differ from traditional debt securities. One such major difference is that all or a principal part of the obligations may be prepaid at any time because the underlying assets (i.e., loans) may be prepaid at any time. As a result, a decrease in interest rates in the market may result in increases in the level of prepayments as borrowers, particularly mortgagors, refinance and repay their loans. An increased prepayment rate with respect to an asset-backed security subject to such a prepayment feature will have the effect of shortening the maturity of the security. In addition, the Fund may have to subsequently reinvest the proceeds at lower interest rates. If the Fund has purchased such an asset-backed security at a premium, a faster than anticipated prepayment rate could result in a loss of principal to the extent of the premium paid.
The Fund may purchase certain mortgage pass-through securities. There are a number of important differences among the agencies and instrumentalities of the US government that issue mortgage-related securities and among the securities that they issue. For example, mortgage-related
| | | | |
| | | | | MARCH 31, 2013 |
| 40 | | BLACKROCK MANAGED VOLATILITY PORTFOLIO | |
Notes to Financial Statements (continued)
securities guaranteed by Ginnie Mae are guaranteed as to the timely payment of principal and interest by Ginnie Mae and such guarantee is backed by the full faith and credit of the United States. However, mortgage-related securities issued by Freddie Mac and Fannie Mae, including Freddie Mac and Fannie Mae guaranteed mortgage pass-through certificates, which are solely the obligations of Freddie Mac and Fannie Mae, are not backed by or entitled to the full faith and credit of the United States but are supported by the right of the issuer to borrow from the Treasury.
Collateralized Debt Obligations: The Fund may invest in collateralized debt obligations (“CDOs”), which include collateralized bond obligations (“CBOs”) and collateralized loan obligations (“CLOs”). CBOs and CLOs are types of asset-backed securities. A CDO is an entity which is backed by a diversified pool of debt securities (CBOs) or syndicated bank loans (CLOs). The cash flows of the CDO can be split into multiple segments, called “tranches,” which will vary in risk profile and yield. The riskiest segment is the subordinated or “equity” tranche. This tranche bears the greatest risk of defaults from the underlying assets in the CDO and serves to protect the other, more senior, tranches from default in all but the most severe circumstances. Since it is shielded from defaults by the more junior tranches, a “senior” tranche will typically have higher credit ratings and lower yields than their underlying securities, and often receive investment grade ratings from one or more of the nationally recognized rating agencies. Despite the protection from the more junior tranches, senior tranches can experience substantial losses due to actual defaults, increased sensitivity to future defaults and the disappearance of one or more protecting tranches as a result of changes in the credit profile of the underlying pool of assets.
Multiple Class Pass-Through Securities: The Fund may invest in multiple class pass-through securities, including collateralized mortgage obligations (“CMOs”) and commercial mortgage-backed securities. These multiple class securities may be issued by Ginnie Mae, US government agencies or instrumentalities or by trusts formed by private originators of, or investors in, mortgage loans. In general, CMOs are debt obligations of a legal entity that are collateralized by, and multiple class pass-through securities represent direct ownership interests in, a pool of residential or commercial mortgage loans or mortgage pass-through securities (the “Mortgage Assets”), the payments on which are used to make payments on the CMOs or multiple pass-through securities. Classes of CMOs include interest only (“IOs”), principal only (“POs”), planned amortization classes and targeted amortization classes. IOs and POs are stripped mortgage-backed securities representing interests in a pool of mortgages, the cash flow from which has been separated into interest and principal components. IOs receive the interest portion of the cash flow while POs receive the principal portion. IOs and POs can be extremely volatile in response to changes in interest rates. As interest rates rise and fall, the value of IOs tends to move in the same direction as interest rates. POs perform best when prepayments on the underlying mortgages rise since this increases the rate at which the principal is returned and the yield to maturity on the PO. When payments on mortgages underlying a PO are slower than anticipated, the life of the PO is
lengthened and the yield to maturity is reduced. If the underlying Mortgage Assets experience greater than anticipated pre-payments of principal, the Fund may not fully recoup its initial investments in IOs.
Forward Commitments and When-Issued Delayed Delivery Securities: The Fund may purchase securities on a when-issued basis and may purchase or sell securities on a forward commitment basis. Settlement of such transactions normally occurs within a month or more after the purchase or sale commitment is made. The Fund may purchase securities under such conditions with the intention of actually acquiring them, but may enter into a separate agreement to sell the securities before the settlement date. Since the value of securities purchased may fluctuate prior to settlement, the Fund may be required to pay more at settlement than the security is worth. In addition, the Fund is not entitled to any of the interest earned prior to settlement. When purchasing a security on a delayed delivery basis, the Fund assumes the rights and risks of ownership of the security, including the risk of price and yield fluctuations. In the event of default by the counterparty, the Fund’s maximum amount of loss is the unrealized appreciation of unsettled when-issued transactions, which is shown in the Schedule of Investments.
Segregation and Collateralization: In cases in which the 1940 Act and the interpretive positions of the Securities and Exchange Commission (“SEC”) require that the Fund either deliver collateral or segregate assets in connection with certain investments (e.g., financial futures contracts, foreign currency exchange contracts, swaps and options written), the Fund will, consistent with SEC rules and/or certain interpretive letters issued by the SEC, segregate collateral or designate on its books and records cash or liquid securities having a market value at least equal to the amount that would otherwise be required to be physically segregated. Furthermore, based on requirements and agreements with certain exchanges and third party broker-dealers, the Fund engaging in such transactions may have requirements to deliver/deposit securities to/with an exchange or broker-dealer as collateral for certain investments.
Investment Transactions and Investment Income: For financial reporting purposes, investment transactions are recorded on the dates the transactions are entered into (the trade dates). Realized gains and losses on investment transactions are determined on the identified cost basis. Dividend income is recorded on the ex-dividend dates. Dividends from foreign securities where the ex-dividend date may have passed are subsequently recorded when the Fund is informed of the ex-dividend date. Under the applicable foreign tax laws, a withholding tax at various rates may be imposed on capital gains, dividends and interest. Upon notification from issuers, some of the dividend income received from a real estate investment trust may be redesignated as a reduction of cost of the related investment and/or realized gain. Interest income, including amortization and accretion of premiums and discounts on debt securities, is recognized on the accrual basis. Income and realized and unrealized gains and losses are allocated daily to each class based on its relative net assets.
| | | | | | |
| | | | | MARCH 31, 2013 | | 41 |
| | BLACKROCK MANAGED VOLATILITY PORTFOLIO | | |
Notes to Financial Statements (continued)
Dividends and Distributions: Dividends and distributions paid by the Fund are recorded on the ex-dividend dates. The portion of distributions that exceeds the Fund’s current and accumulated earnings and profits, which are measured on a tax basis, will constitute a nontaxable return of capital. Distributions in excess of the Fund’s taxable income and net capital gains, but not in excess of the Fund’s earnings and profits, will be taxable to shareholders as ordinary income and will not constitute a nontaxable return of capital. The character and timing of dividends and distributions are determined in accordance with federal income tax regulations, which may differ from US GAAP.
Securities Lending: The Fund may lend securities to approved borrowers, such as banks, brokers and other financial institutions. The borrower pledges cash, securities issued or guaranteed by the US government or irrevocable letters of credit issued by a bank as collateral. The initial collateral received by the Fund has a value of at least 102% of the current value of the loaned securities for securities traded on US exchanges and a value of at least 105% for all other securities. The collateral is maintained thereafter in an amount equal to at least 100% of the current market value of the loaned securities. The market value of the loaned securities is determined at the close of business of the Fund and any additional required collateral is delivered to the Fund on the next business day. Securities lending income, as disclosed in the Statement of Operations, represents the income earned from the investment of the cash collateral, net of rebates paid to, or fees paid by, borrowers and less the fees paid to the securities lending agent. During the term of the loan, the Fund earns dividend or interest income on the securities loaned but does not receive interest income on the securities received as collateral. Loans of securities are terminable at any time and the borrower, after notice, is required to return borrowed securities within the standard time period for settlement of securities transactions. The risks of securities lending include the risk that the borrower may not provide additional collateral when required or may not return the securities when due. To mitigate this risk the Fund benefits from a borrower default indemnity provided by BlackRock, Inc. (“BlackRock”). BlackRock’s indemnity allows for full replacement of securities lent. The Fund also could suffer a loss if the value of an investment purchased with cash collateral falls below the market value of loaned securities or if the value of an investment purchased with cash collateral falls below the value of the original cash collateral received. During the six months ended March 31, 2013, any securities on loan were collateralized by cash.
Income Taxes: It is the Fund’s policy to comply with the requirements of the Internal Revenue Code of 1986, as amended, applicable to regulated investment companies and to distribute substantially all of its taxable income to its shareholders. Therefore, no federal income tax provision is required.
The Fund files US federal and various state and local tax returns. No income tax returns are currently under examination. The statute of limitations on the Fund’s US federal tax returns remains open for each of the four years ended September 30, 2012. The statutes of limitations on the Fund’s state and local tax returns may remain open for an additional
year depending upon the jurisdiction. Management does not believe there are any uncertain tax positions that require recognition of a tax liability.
Recent Accounting Standards: In December 2011, the Financial Accounting Standards Board (the “FASB”) issued guidance that will expand current disclosure requirements on the offsetting of certain assets and liabilities. The new disclosures will be required for investments and derivative financial instruments subject to master netting or similar agreements which are eligible for offset in the Statement of Assets and Liabilities and will require an entity to disclose both gross and net information about such investments and transactions in the financial statements. In January 2013, the FASB issued guidance that clarifies which investments and transactions are subject to the offsetting disclosure requirements. The scope of the disclosure requirements for offsetting will be limited to derivative instruments, repurchase agreements and reverse repurchase agreements, and securities borrowing and securities lending transactions. The guidance is effective for financial statements with fiscal years beginning on or after January 1, 2013, and interim periods within those fiscal years. Management is evaluating the impact of this guidance on the Fund’s financial statement disclosures.
Other: Expenses directly related to the Fund or its classes are charged to the Fund or class. Other operating expenses shared by several funds are pro rated among those funds on the basis of relative net assets or other appropriate methods. Expenses directly related to the Fund and other shared expenses pro rated to the Fund are allocated daily to each class based on its relative net assets or other appropriate methods.
The Fund has an arrangement with the custodian whereby fees may be reduced by credits earned on uninvested cash balances, which, if applicable, are shown as fees paid indirectly in the Statement of Operations. The custodian imposes fees on overdrawn cash balances, which can be offset by accumulated credits earned or may result in additional custody charges.
2. Derivative Financial Instruments:
The Fund engages in various portfolio investment strategies using derivative contracts both to increase the returns of the Fund and/or to economically hedge, or protect, its exposure to certain risks such as credit risk, equity risk, interest rate risk or foreign currency exchange rate risk. These contracts may be transacted on an exchange or OTC.
Losses may arise if the value of the contract decreases due to an unfavorable change in the market rates or values of the underlying instrument or if the counterparty does not perform under the contract. The Fund’s maximum risk of loss from counterparty credit risk on OTC derivatives is generally the aggregate unrealized gain netted against any collateral pledged by the counterparty. For OTC options purchased, the Fund bears the risk of loss in the amount of the premiums paid plus the positive change in market values net of any collateral received on the options should the counterparty fail to perform under the contracts. Options written by the
| | | | |
| | | | | MARCH 31, 2013 |
| 42 | | BLACKROCK MANAGED VOLATILITY PORTFOLIO | |
Notes to Financial Statements (continued)
Fund do not give rise to counterparty credit risk, as options written obligate the Fund and not the counterparty to perform. Counterparty risk related to exchange-traded financial futures contracts and options and centrally cleared swaps is deemed to be minimal due to the protection against defaults provided by the exchange on which these contracts trade.
The Fund may mitigate counterparty risk by procuring collateral and through netting provisions included within an International Swaps and Derivatives Association, Inc. master agreement (“ISDA Master Agreement”) implemented between the Fund and each of its respective counterparties. An ISDA Master Agreement allows the Fund to offset with each separate counterparty certain derivative financial instrument’s payables and/or receivables with collateral held. The amount of collateral moved to/from applicable counterparties is generally based upon minimum transfer amounts of up to $500,000. To the extent amounts due to the Fund from its counterparties are not fully collateralized contractually or otherwise, the Fund bears the risk of loss from counterparty non-performance. See Note 1 “Segregation and Collateralization” for information with respect to collateral practices. In addition, the Fund manages counterparty risk by entering into agreements only with counterparties that it believes have the financial resources to honor their obligations and by monitoring the financial stability of those counterparties.
Certain ISDA Master Agreements allow counterparties to OTC derivatives to terminate derivative contracts prior to maturity in the event the Fund’s net assets decline by a stated percentage or the Fund fails to meet the terms of its ISDA Master Agreements, which would cause the Fund to accelerate payment of any net liability owed to the counterparty.
Financial Futures Contracts: The Fund purchases and/or sells financial futures contracts and options on financial futures contracts to gain exposure to, or economically hedge against, changes in the value of equity securities (equity risk), interest rates (interest rate risk) or foreign currencies (foreign currency exchange rate risk). Financial futures contracts are agreements between the Fund and a counterparty to buy or sell a specific quantity of an underlying instrument at a specified price and at a specified date. Depending on the terms of the particular contract, financial futures contracts are settled either through physical delivery of the underlying instrument on the settlement date or by payment of a cash settlement amount on the settlement date. Pursuant to the contract, the Fund agrees to receive from or pay to the broker an amount of cash equal to the daily fluctuation in value of the contract. Such receipts or payments are known as variation margin and are recorded by the Fund as unrealized appreciation or depreciation. When the contract is closed, the Fund records a realized gain or loss equal to the difference between the value of the contract at the time it was opened and the value at the time it was closed. The use of financial futures contracts involves the risk of an imperfect correlation in the movements in the price of financial futures contracts, interest or foreign currency exchange rates and the underlying assets.
Foreign Currency Exchange Contracts: The Fund enters into foreign currency exchange contracts as an economic hedge against either specific transactions or portfolio instruments or to obtain exposure to foreign currencies (foreign currency exchange rate risk). A foreign currency exchange contract is an agreement between two parties to buy and sell a currency at a set exchange rate on a future date. Foreign currency exchange contracts, when used by the Fund, help to manage the overall exposure to the currencies in which some of the investments held by the Fund are denominated. The contract is marked-to-market daily and the change in market value is recorded by the Fund as an unrealized gain or loss. When the contract is closed, the Fund records a realized gain or loss equal to the difference between the value at the time it was opened and the value at the time it was closed. The use of foreign currency exchange contracts involves the risk that the value of a foreign currency exchange contract changes unfavorably due to movements in the value of the referenced foreign currencies and the risk that the counterparty to the contract does not perform its obligations under the agreement.
Options: The Fund purchases and writes call and put options to increase or decrease its exposure to underlying instruments (including equity risk and interest rate risk) and/or, in the case of options written, to generate gains from options premiums. A call option gives the purchaser (holder) of the option the right (but not the obligation) to buy, and obligates the seller (writer) to sell (when the option is exercised), the underlying instrument at the exercise or strike price at any time or at a specified time during the option period. A put option gives the holder the right to sell and obligates the writer to buy the underlying instrument at the exercise or strike price at any time or at a specified time during the option period. When the Fund purchases (writes) an option, an amount equal to the premium paid (received) by the Fund is reflected as an asset (liability). The amount of the asset (liability) is subsequently marked-to-market to reflect the current market value of the option purchased (written). When an instrument is purchased or sold through an exercise of an option, the related premium paid (or received) is added to (or deducted from) the basis of the instrument acquired or deducted from (or added to) the proceeds of the instrument sold. When an option expires (or the Fund enters into a closing transaction), the Fund realizes a gain or loss on the option to the extent of the premiums received or paid (or gain or loss to the extent the cost of the closing transaction exceeds the premiums received or paid). When the Fund writes a call option, such option is “covered,” meaning that the Fund holds the underlying instrument subject to being called by the option counterparty. When the Fund writes a put option, such option is covered by cash in an amount sufficient to cover the obligation.
In purchasing and writing options, the Fund bears the risk of an unfavorable change in the value of the underlying instrument or the risk that the Fund may not be able to enter into a closing transaction due to an illiquid market. Exercise of a written option could result in the Fund purchasing or selling a security at a price different from the current market value.
| | | | | | |
| | | | | MARCH 31, 2013 | | 43 |
| | BLACKROCK MANAGED VOLATILITY PORTFOLIO | | |
Notes to Financial Statements (continued)
Swaps: The Fund enters into swap agreements, in which the Fund and a counterparty agree either to make periodic net payments on a specified notional amount or a net payment upon termination. These payments received or made by the Fund are recorded in the Statement of Operations as realized gains or losses, respectively. Any upfront fees paid are recorded as assets and any upfront fees received are recorded as liabilities and are shown as swap premiums paid and swap premiums received, respectively in the Statement of Assets and Liabilities and amortized over the term of the swap. Swap agreements are privately negotiated in the OTC market and may be entered into as a bilateral contract or centrally cleared (“centrally cleared swaps”). In a centrally cleared swap, immediately following execution of the swap agreement, the swap agreement is novated to a central counterparty (the “CCP”) and the Fund faces the CCP through a future commission merchant. Unlike a bilateral swap agreement, for centrally cleared swaps, the Fund has no credit exposure to the counterparty as the CCP stands between the Fund and the counterparty. Swaps are marked-to-market daily and changes in value are recorded as unrealized appreciation (depreciation). The daily change in valuation of centrally cleared swaps, if any, is recorded as a receivable or payable for variation margin in the Statement of Assets and Liabilities. When the swap is terminated, the Fund will record a realized gain or loss equal to the difference between the proceeds from (or cost of) the closing transaction and the Fund’s basis in the contract, if any. Generally, the basis of the contracts is the premium received or paid. Swap transactions involve, to varying degrees, elements of interest rate, credit and market risk in excess of the amounts recognized in the Statement of Assets and Liabilities. Such risks involve the possibility that there will be no liquid market for these agreements, that the counterparty to the agreements may default on its obligation to perform or disagree as to the meaning of the contractual terms in the agreements, and that there may be unfavorable changes in interest rates and/or market values associated with these transactions.
| — | | Credit default swaps – The Fund enters into credit default swaps to manage its exposure to the market or certain sectors of the market, to reduce its risk exposure to defaults of corporate and/or sovereign issuers or to create exposure to corporate and/or sovereign issuers to which it is not otherwise exposed (credit risk). The Fund may either buy or sell (write) credit default swaps on single-name issuers (corporate or sovereign), a combination or basket of single-name issuers or traded indexes. Credit default swaps on single-name issuers are agreements in which the protection buyer pays fixed periodic payments to the seller in consideration for a guarantee from the seller to make a specific payment should a negative credit event take place with respect to the referenced entity (e.g., bankruptcy, failure to pay, obligation accelerators, repudiation, moratorium or restructuring). Credit default swaps on traded indexes are agreements in which the buyer pays fixed periodic payments to the seller in consideration for a guarantee from the seller to make a specific payment should a write-down, principal or interest shortfall or default of all or individual underlying securities included in the index occurs. As a buyer, if an underlying credit event occurs, the Fund will either receive from the seller an amount equal to the notional amount of the swap and |
| | | deliver the referenced security or underlying securities comprising the index or receive a net settlement of cash equal to the notional amount of the swap less the recovery value of the security or underlying securities comprising the index. As a seller (writer), if an underlying credit event occurs, the Fund will either pay the buyer an amount equal to the notional amount of the swap and take delivery of the referenced security or underlying securities comprising the index or pay a net settlement of cash equal to the notional amount of the swap less the recovery value of the security or underlying securities comprising the index. |
| — | | Interest rate swaps – The Fund enters into interest rate swaps to gain or reduce exposure to interest rates or to manage duration, the yield curve or interest rate risk by economically hedging the value of the fixed rate bonds which may decrease when interest rates rise (interest rate risk). Interest rate swaps are agreements in which one party pays a stream of interest payments, either fixed or floating rate, for another party’s stream of interest payments, either fixed or floating, on the same notional amount for a specified period of time. Interest rate floors, which are a type of interest rate swap, are agreements in which one party agrees to make payments to the other party to the extent that interest rates fall below a specified rate or floor in return for a premium. In more complex swaps, the notional principal amount may decline (or amortize) over time. |
Derivative Financial Instruments Categorized by Risk Exposure:
| | | | | | |
| |
| Fair Values of Derivative Financial Instruments as of March 31, 2013 | |
| |
| Asset Derivatives | |
| |
| | | Statement of Assets and
Liabilities Location | | Value | |
| |
Interest rate contracts | | Net unrealized appreciation/depreciation1 ; Unrealized appreciation on swaps | | $ | 162,835 | |
Foreign currency exchange contracts | | Unrealized appreciation on foreign currency exchange contracts | | | 3,026,272 | |
Credit contracts | | Swap premiums paid | | | 32,799 | |
| | | | | | |
Total | | | | $ | 3,221,906 | |
| | | | | | |
|
| |
| |
| Liability Derivatives | |
| |
| | | Statement of Assets and
Liabilities Location | | Value | |
| |
Interest rate contracts | | Net unrealized appreciation/depreciation1 ; Unrealized depreciation on swaps; Options written at value | | $ | 207,941 | |
Foreign currency exchange contracts | | Unrealized depreciation on foreign currency exchange contracts | | | 1,031,708 | |
Credit contracts | | Unrealized depreciation on swaps | | | 24,881 | |
Equity contracts | | Net unrealized appreciation/depreciation1 | | | 1,877,512 | |
| | | | | | |
Total | | | | $ | 3,142,042 | |
| | | | | | |
| | 1 | Includes cumulative appreciation/depreciation on financial futures contracts and centrally cleared swaps as reported in the Schedule of Investments. Only current day’s variation margin is reported within the Statement of Assets and Liabilities. |
| | | | |
| | | | | MARCH 31, 2013 |
| 44 | | BLACKROCK MANAGED VOLATILITY PORTFOLIO | |
Notes to Financial Statements (continued)
| | |
|
The Effect of Derivative Financial Instruments in the Statement of
Operations Six Months Ended March 31, 2013 |
|
| Net Realized Gain (Loss) From |
|
| | | | |
Interest rate contracts: | | | | |
Financial futures contracts | | $ | (239,922 | ) |
Swaps | | | (75,824 | ) |
Options2 | | | 42,995 | |
Foreign currency exchange contracts: | | | | |
Financial futures contracts | | | 138,187 | |
Foreign currency transactions | | | 3,332,820 | |
Credit contracts: | | | | |
Swaps | | | 96,569 | |
Equity contracts: | | | | |
Financial futures contracts | | | (1,522,243 | ) |
Options2 | | | (679,280 | ) |
Other contracts: | | | | |
Swaps | | | 60,678 | |
| | | | |
Total | | $ | 1,153,980 | |
| | | | |
|
| |
| | | | |
|
| |
| Net Change in Unrealized Appreciation/Depreciation on | |
| |
Interest rate contracts: | | | | |
Financial futures contracts | | $ | 65,288 | |
Swaps | | | (6,760 | ) |
Options2 | | | 2,215 | |
Foreign currency exchange contracts: | | | | |
Financial futures contracts | | | (36,103 | ) |
Foreign currency translations | | | 3,931,803 | |
Credit contracts: | | | | |
Swaps | | | (32,506 | ) |
Equity contracts: | | | | |
Financial futures contracts | | | 234,133 | |
| | | | |
Total | | $ | 4,158,070 | |
| | | | |
|
| |
| | 2 | Options purchased are included in the net realized gain (loss) from investments and net change in unrealized appreciation/depreciation on investments. |
| | |
For the six months ended March 31, 2013, the average quarterly balances of outstanding derivative financial instruments were as follows: |
| | | | |
| |
Financial futures contracts: | | | | |
Average number of contracts purchased | | | 1,251 | |
Average number of contracts sold | | | 785 | |
Average notional value of contracts purchased | | $ | 97,205,420 | |
Average notional value of contracts sold | | $ | 67,813,479 | |
Foreign currency exchange contracts: | | | | |
Average number of contracts - US dollars purchased | | | 295 | |
Average number of contracts - US dollars sold | | | 251 | |
Average US dollar amounts purchased | | $ | 268,075,046 | |
Average US dollar amounts sold | | $ | 154,103,794 | |
Options: | | | | |
Average number of option contracts purchased | | | 198 | |
Average number of option contracts written | | | 110 | |
Average notional value of option contracts purchased | | $ | 26,730,000 | |
Average notional value of option contracts written | | $ | 14,549,000 | |
Credit default swaps: | | | | |
Average number of contracts - sell protection | | | 3 | |
Average notional value - sell protection | | $ | 3,384,193 | |
Interest rate swaps: | | | | |
Average number of contracts - pays fixed rate | | | 8 | |
Average number of contracts - receives fixed rate | | | 5 | |
Average notional value - pays fixed rate | | $ | 45,031,273 | |
Average notional value - receives fixed rate | | $ | 28,300,043 | |
| | | | |
| |
3. Investment Advisory Agreement and Other Transactions with Affiliates:
The PNC Financial Services Group, Inc. (“PNC”) is the largest stockholder and an affiliate, for 1940 Act purposes, of BlackRock.
The Trust, on behalf of the Fund, entered into an Investment Advisory Agreement with the Manager, the Fund’s investment advisor, an indirect, wholly owned subsidiary of BlackRock, to provide investment advisory and administration services. The Manager is responsible for the management of the Fund’s portfolio and provides the necessary personnel, facilities, equipment and certain other services necessary to the operations of the Fund. For such services, the Fund pays the Manager a monthly fee based on a percentage of the Fund’s average daily net assets at the following annual rates:
| | | | |
| |
| Average Daily Net Assets | | Investment
Advisory Fee | |
| |
First $1 Billion | | | 0.550% | |
$1 Billion - $2 Billion | | | 0.500% | |
$2 Billion - $3 Billion | | | 0.475% | |
Greater than $3 Billion | | | 0.450% | |
| |
The Manager voluntarily agreed to waive its investment advisory fees by the amount of investment advisory fees the Fund pays to the Manager indirectly through its investment in affiliated money market funds. In addition, BlackRock has contractually agreed to waive the management fee on assets estimated to be attributed to the Fund’s investments in other equity and fixed-income mutual funds managed by BlackRock or its affiliates, if any. These amounts are included in fees waived by Manager in the Statement of Operations. For the six months ended March 31, 2013, the amount waived was $17,279.
The Manager entered into separate sub-advisory agreements with BlackRock Financial Management, Inc. (“BFM”), BlackRock International Limited (“BIL”), BlackRock (Hong Kong) Limited (“BHK”) and BlackRock (Singapore) Limited (“BRS”), each an affiliate of the Manager. The Manager pays BFM, BIL, BHK and BRS, for services it provides, a monthly fee that is a percentage of the investment advisory fees paid by the Fund to the Manager.
The Trust, on behalf of the Fund, entered into a Distribution Agreement and Distribution and Service Plan with BlackRock Investments, LLC (“BRIL”), an affiliate of the Manager. Pursuant to the Distribution and Service Plan and in accordance with Rule 12b-1 under the 1940 Act, the Fund pays BRIL ongoing service and distribution fees. The fees are accrued daily and paid monthly at annual rates based upon the average daily net assets of the shares of the Fund as follows:
| | | | |
|
| | | Service Fee | | Distribution Fee |
|
Service | | 0.25% | | N/A |
Investor A | | 0.25% | | N/A |
Investor B | | 0.25% | | 0.75% |
Investor C | | 0.25% | | 0.75% |
|
| | | | | | |
| | | | | MARCH 31, 2013 | | 45 |
| | BLACKROCK MANAGED VOLATILITY PORTFOLIO | | |
Notes to Financial Statements (continued)
Pursuant to sub-agreements with BRIL, broker-dealers and BRIL provide shareholder servicing and distribution services to the Fund. The ongoing service and/or distribution fee compensates BRIL and each broker-dealer for providing shareholder servicing and/or distribution related services to Service, Investor A, Investor B and Investor C shareholders.
For the six months ended March 31, 2013, the following table shows the class specific service and distribution fees borne directly by each class of the Fund:
| | | | |
| |
Service | | $ | 2,384 | |
Investor A | | | 482,809 | |
Investor B | | | 86,878 | |
Investor C | | | 426,833 | |
| |
Total | | $ | 998,904 | |
| | | | |
Pursuant to written agreements, certain financial intermediaries, some of which may be affiliates, provide the Fund with sub-accounting, recordkeeping, sub-transfer agency and other administrative services with respect to sub-accounts they service. For these services, these entities receive an asset based fee or an annual fee per shareholder account, which will vary depending on share class and/or net assets. For the six months ended March 31, 2013, the Fund paid $12,517 to affiliates in return for these services, which is included in transfer agent – class specific in the Statement of Operations.
The Manager maintains a call center, which is responsible for providing certain shareholder services to the Fund, such as responding to shareholder inquiries and processing transactions based upon instructions from shareholders with respect to the subscription and redemption of Fund shares. For the six months ended March 31, 2013, the Fund reimbursed the Manager the following amounts for costs incurred in running the call center, which are included in transfer agent – class specific in the Statement of Operations:
| | | | |
| |
Institutional | | $ | 464 | |
Service | | | 62 | |
Investor A | | | 28,232 | |
Investor B | | | 2,375 | |
Investor C | | | 1,932 | |
| |
Total | | $ | 33,065 | |
| | | | |
For the six months ended March 31, 2013, the following table shows the class specific transfer agent fees borne directly by each class of the Fund:
| | | | |
| |
Institutional | | $ | 42,434 | |
Service | | | 1,952 | |
Investor A | | | 324,159 | |
Investor B | | | 28,855 | |
Investor C | | | 56,071 | |
| |
Total | | $ | 453,471 | |
| | | | |
BNY Mellon Investment Servicing (US) Inc. (“BNYMIS”) and the Manager act as co-administrators for the Fund. For these services, the co-administrators receive an administration fee computed daily and payable monthly to each administrator pursuant to separate fee arrangements, based on a percentage of the average daily net assets of
the Fund. The combined administration fee, which is shown as administration in the Statement of Operations, is paid at the following annual rates:
| | |
|
| Average Daily Net Assets | | Administration Fee |
|
First $500 Million | | 0.075% |
$500 Million - $1 Billion | | 0.065% |
Greater than $1 Billion | | 0.055% |
|
In addition, each of the share classes is charged an administration fee, which is shown as administration – class specific in the Statement of Operations, based on the following percentages of average daily net assets of each respective class:
| | |
|
| Average Daily Net Assets | | Administration Fee – Class Specific |
|
First $500 Million | | 0.025% |
$500 Million - $1 Billion | | 0.015% |
Greater than $1 Billion | | 0.005% |
|
In addition, BNYMIS and the Manager may have, at their discretion, voluntarily waived all or any portion of their administration fees for the Fund or a share class which is included in administration fees waived – class specific in the Statement of Operations. For the six months ended March 31, 2013, the Fund paid $194,794 to the Manager in return for these services, which is included in administration, administration – class specific and administration fees waived – class specific in the Statement of Operations.
For the six months ended March 31, 2013, the following table shows the class specific administration fees borne directly by each class of the Fund:
| | | | |
| |
Institutional | | $ | 7,397 | |
Service | | | 238 | |
Investor A | | | 48,281 | |
Investor B | | | 2,180 | |
Investor C | | | 10,671 | |
| |
Total | | $ | 68,767 | |
| | | | |
The Manager contractually agreed to waive and/or reimburse fees or expenses, excluding interest expense, dividend expense, income tax expense, acquired fund fees and expenses and certain other fund expenses, which constitute extraordinary expenses not incurred in the ordinary course of the Fund’s business, in order to limit expenses. The expense limitations as a percentage of average daily net assets are as follows:
| | | | |
| |
Institutional | | | 0.89% | |
Service | | | 1.17% | |
Investor A | | | 1.37% | |
Investor B | | | 2.14% | |
Investor C | | | 2.14% | |
Investor R1 | | | 1.81% | |
| |
| | 1 | There were no shares outstanding as of March 31, 2013. |
| | | | |
| | | | | MARCH 31, 2013 |
| 46 | | BLACKROCK MANAGED VOLATILITY PORTFOLIO | |
Notes to Financial Statements (continued)
The Manager has agreed not to reduce or discontinue this contractual waiver or reimbursement prior to February 1, 2014 unless approved by the Board, including a majority of the Independent Trustees. In addition, BlackRock has contractually agreed to waive 0.05% of its management fee until June 1, 2013.
These amounts waived or reimbursed are included in fees waived by Manager, and shown as administration fees waived – class specific, transfer agent fees waived – class specific and transfer agent fees reimbursed – class specific, respectively, in the Statement of Operations. For the six months ended March 31, 2013, the amount included in fees waived by Manager was $137,432. Class specific expense waivers or reimbursements are as follows:
| | |
|
| | | Service |
|
Administration Fees Waived | | $ 15 |
Transfer Agent Fees Waived | | $ 4 |
Transfer Agent Fees Reimbursed | | $ 6 |
|
If during the Fund’s fiscal year the operating expenses of a share class, that at any time during the prior two fiscal years received a waiver or reimbursement from the Manager, are less than the expense limit for that share class, the Manager is entitled to be reimbursed by such share class up to the lesser of (a) the amount of fees waived or expenses reimbursed during those prior two fiscal years under the agreement and (b) the amount by which the expense limit for that share class exceeds the operating expenses of the share class for the current fiscal year, provided that: (1) the Fund has more than $50 million in assets for the fiscal year and (2) the Manager or an affiliate continues to serve as the Fund’s investment advisor or administrator. In the event the expense limit for a share class is changed subsequent to a fiscal year in which the Manager becomes entitled to reimbursement for fees waived or reimbursed, the amount available to reimburse the Manager shall be calculated by reference to the expense limit for that share class in effect at the time the Manager became entitled to receive such reimbursement, rather than the subsequently changed expense limit for that share class.
For the six months ended March 31, 2013, the Manager recouped waivers previously recorded of $11,661 and $125 for Institutional Shares and Service Shares, respectively.
On March 31, 2013, the waivers and/or reimbursements subject to possible future recoupment under the expense limitation agreement is $849 for Service Shares, expiring September 30, 2013, $5,915 and $1,126 for Institutional Shares and Service Shares, respectively, expiring September 30, 2014 and $25 for Service Shares, expiring September 30, 2015.
For the six months ended March 31, 2013, affiliates earned underwriting discounts, direct commissions and dealer concessions on sales of the Fund’s Investor A Shares of $7,257.
For the six months ended March 31, 2013, affiliates received CDSCs relating to transactions in Investor A, Investor B, and Investor C Shares of $268, $6,434 and $4,146, respectively.
The Fund received an exemptive order from the SEC permitting it, among other things, to pay an affiliated securities lending agent a fee based on a share of the income derived from the securities lending activities and has retained BlackRock Investment Management, LLC (“BIM”) as the securities lending agent. BIM may, on behalf of the Fund, invest cash collateral received by the Fund for such loans in a private investment company managed by the Manager or in registered money market funds advised by the Manager or its affiliates. The market value of securities on loan and the value of the related collateral, if applicable, is shown in the Statement of Assets and Liabilities as securities loaned at value and collateral on securities loaned at value, respectively. The cash collateral invested by BIM, if any, is disclosed in the Schedule of Investments. Securities lending income is equal to the total of income earned from the reinvestment of cash collateral, net of rebates paid to, or fees paid by, borrowers of securities. The Fund retains 65% of securities lending income and pays a fee to BIM equal to 35% of such income. The Fund benefits from a borrower default indemnity provided by BlackRock. As securities lending agent, BIM bears all operational costs directly related to securities lending as well as the cost of borrower default indemnification. BIM does not receive any fees for managing the cash collateral. The share of income earned by the Fund is shown as securities lending – affiliated in the Statement of Operations. For the six months ended March 31, 2013, BIM received $5,645 in securities lending agent fees related to securities lending activities for the Fund.
Certain officers and/or trustees of the Trust are officers and/or directors of BlackRock or its affiliates. The Fund reimburses the Manager for a portion of the compensation paid to the Trust’s Chief Compliance Officer, which is included in officer and trustees in the Statement of Operations.
4. Investments:
Purchases and sales of investments including paydowns, TBA transactions and excluding short-term securities and US government securities for the six months ended March 31, 2013, were $460,905,311 and $422,999,143, respectively.
Purchases and sales of US government securities for the six months ended March 31, 2013, were $457,531 and $13,454,705, respectively.
| | | | | | |
| | | | | MARCH 31, 2013 | | 47 |
| | BLACKROCK MANAGED VOLATILITY PORTFOLIO | | |
Notes to Financial Statements (continued)
Transactions in options written for the six months ended March 31, 2013, were as follows:
| | | | | | | | | | | | | | | | |
| | | Calls | | | Puts | |
| | | | |
| | | Contracts | | | Premiums
Received | | | Contracts | | | Premiums
Received | |
| | | | | | | | |
Outstanding options, beginning of period | | | – | | | | – | | | | – | | | | – | |
Options written | | | 542 | | | $ | 372,299 | | | | 752 | | | $ | 951,740 | |
Options closed | | | (488) | | | | (328,519) | | | | (698) | | | | (912,586) | |
| | | | | | | | |
Outstanding options, end of period | | | 54 | | | $ | 43,780 | | | | 54 | | | $ | 39,154 | |
| | | | |
5. Income Tax Information:
As of March 31, 2013, gross unrealized appreciation and gross unrealized depreciation based on cost for federal income tax purposes were as follows:
| | | | |
| |
Tax cost | | $ | 523,148,592 | |
| | | | |
Gross unrealized appreciation | | $ | 38,200,594 | |
Gross unrealized depreciation | | | (7,075,298 | ) |
| | | | |
Net unrealized appreciation | | $ | 31,125,296 | |
| | | | |
6. Borrowings:
The Trust, on behalf of the Fund, along with certain other funds managed by the Manager and its affiliates, is a party to a $500 million credit agreement with a group of lenders, which expires in November 2012 and was subsequently renewed until November 2013. The Fund may borrow under the credit agreement to fund shareholder redemptions. Effective November 2011 to November 2012, the credit agreement has the following terms: a commitment fee of 0.065% per annum based on the Fund’s pro rata share of the unused portion of the credit agreement and interest at a rate equal to the higher of (a) the one-month LIBOR plus 0.80% per annum or (b) the Fed Funds rate plus 0.80% per annum on amounts borrowed. In addition, the Fund paid administration and arrangement fees which were allocated to the Fund based on its net assets as of October 31, 2011. The credit agreement, which expired in November 2012, was renewed with the same terms until November 2013. Effective November 2012 to November 2013, the credit agreement has the following terms: a commitment fee of 0.065% per annum based on the Funds’ pro rata share of the unused portion of the credit agreement and interest at a rate equal to the higher of (a) the one-month LIBOR plus 0.80% per annum or (b) the Fed Funds rate plus
0.80% per annum on amounts borrowed. In addition, the Fund paid administration and arrangement fees which were allocated to the Fund based on its net assets as of October 31, 2012. The Fund did not borrow under the credit agreement during the six months ended March 31, 2013.
7. Market and Credit Risk:
In the normal course of business, the Fund invests in securities and enters into transactions where risks exist due to fluctuations in the market (market risk) or failure of the issuer of a security to meet all its obligations (issuer credit risk). The value of securities held by the Fund may decline in response to certain events, including those directly involving the issuers whose securities are owned by the Fund; conditions affecting the general economy; overall market changes; local, regional or global political, social or economic instability; and currency and interest rate and price fluctuations. Similar to issuer credit risk, the Fund may be exposed to counterparty credit risk, or the risk that an entity with which the Fund has unsettled or open transactions may fail to or be unable to perform on its commitments. The Fund manages counterparty credit risk by entering into transactions only with counterparties that it believes have the financial resources to honor their obligations and by monitoring the financial stability of those counterparties. Financial assets, which potentially expose the Fund to market, issuer and counterparty credit risks, consist principally of financial instruments and receivables due from counterparties. The extent of the Fund’s exposure to market, issuer and counterparty credit risks with respect to these financial assets is generally approximated by their value recorded in the Statement of Assets and Liabilities, less any collateral held by the Fund.
| | | | |
| | | | | MARCH 31, 2013 |
| 48 | | BLACKROCK MANAGED VOLATILITY PORTFOLIO | |
Notes to Financial Statements (concluded)
8. Capital Share Transactions:
Transactions in capital shares for each class were as follows:
| | | | | | | | | | | | | | | | | | |
| | | Six Months Ended March 31, 2013 | | | | | Year Ended
September 30, 2012 | |
| | | Shares | | | Amount | | | | | Shares | | | Amount | |
| |
Institutional | | | | | | | | | | | | | | | | | | |
| |
Shares sold | | | 471,884 | | | $ | 7,233,650 | | | | | | 2,777,761 | | | $ | 41,415,695 | |
Shares issued in reinvestment of dividends | | | 177,560 | | | | 2,661,955 | | | | | | 106,201 | | | | 1,528,203 | |
Shares redeemed | | | (610,859) | | | | (9,341,127) | | | | | | (1,910,890) | | | | (28,040,751) | |
| | | | | | | | | | |
Net increase | | | 38,585 | | | $ | 554,478 | | | | | | 973,072 | | | $ | 14,903,147 | |
| | | | | | | | | | |
| | | | | |
| | | | | | | | | | | | | | | | | | |
| |
Service | | | | | | | | | | | | | | | | | | |
| |
Shares sold | | | 2,114 | | | $ | 32,316 | | | | | | 20,096 | | | $ | 295,076 | |
Shares issued in reinvestment of dividends | | | 5,578 | | | | 83,380 | | | | | | 4,020 | | | | 57,632 | |
Shares redeemed | | | (6,302) | | | | (96,202) | | | | | | (18,831) | | | | (276,832) | |
| | | | | | | | | | |
Net increase | | | 1,390 | | | $ | 19,494 | | | | | | 5,285 | | | $ | 75,876 | |
| | | | | | | | | | |
| | | | | | | | | | | | | | | | | | |
| |
Investor A | | | | | | | | | | | | | | | | | | |
| |
Shares sold and automatic conversion of shares | | | 601,149 | | | $ | 9,146,204 | | | | | | 2,348,702 | | | $ | 34,606,617 | |
Shares issued in reinvestment of dividends | | | 1,156,565 | | | | 17,278,480 | | | | | | 940,966 | | | | 13,509,595 | |
Shares redeemed | | | (2,237,862) | | | | (34,057,059) | | | | | | (4,317,341) | | | | (63,760,019) | |
| | | | | | | | | | |
Net decrease | | | (480,148) | | | $ | (7,632,375) | | | | | | (1,027,673) | | | $ | (15,643,807) | |
| | | | | | | | | | |
| | | | | |
| | | | | | | | | | | | | | | | | | |
| |
Investor B | | | | | | | | | | | | | | | | | | |
| |
Shares sold | | | 8,530 | | | $ | 128,855 | | | | | | 22,892 | | | $ | 334,005 | |
Shares issued in reinvestment of dividends | | | 45,317 | | | | 669,151 | | | | | | 60,727 | | | | 858,151 | |
Shares redeemed and automatic conversion of shares | | | (266,848) | | | | (4,009,726) | | | | | | (1,104,122) | | | | (16,180,878) | |
| | | | | | | | | | |
Net decrease | | | (213,001) | | | $ | (3,211,720) | | | | | | (1,020,503) | | | $ | (14,988,722) | |
| | | | | | | | | | |
| | | | | |
| | | | | | | | | | | | | | | | | | |
| |
Investor C | | | | | | | | | | | | | | | | | | |
| |
Shares sold | | | 184,270 | | | $ | 2,754,484 | | | | | | 942,369 | | | $ | 13,631,820 | |
Shares issued in reinvestment of dividends | | | 227,187 | | | | 3,333,430 | | | | | | 183,841 | | | | 2,595,310 | |
Shares redeemed | | | (606,110) | | | | (9,085,447) | | | | | | (1,269,056) | | | | (18,440,045) | |
| | | | | | | | | | |
Net decrease | | | (194,653) | | | $ | (2,997,533) | | | | | | (142,846) | | | $ | (2,212,915) | |
| |
Total Net Decrease | | | (847,827) | | | $ | (13,267,656) | | | | | | (1,212,665) | | | $ | (17,866,421) | |
| | | | | | | | | | |
9. Subsequent Events:
Management’s evaluation of the impact of all subsequent events on the Fund’s financial statements was completed through the date the financial statements were issued and the following item was noted:
Effective April 25, 2013, the credit agreement was terminated and a new agreement was entered into. The Fund became a party to a 364-day, $800 million credit agreement, which expires in April 2014. Excluding commitments designated for a certain individual fund, the Fund can borrow up to an aggregate commitment amount of $500 million, subject to asset coverage and other limitations as specified in the agreement. The credit agreement has the following terms: a fee of 0.065% per annum on unused commitment amounts and interest at a rate equal to the higher of (a) the one-month LIBOR plus 0.80% per annum or (b) the Fed Funds rate plus 0.80% per annum on amounts borrowed.
| | | | | | |
| | | | | MARCH 31, 2013 | | 49 |
| | BLACKROCK MANAGED VOLATILITY PORTFOLIO | | |
Officers and Trustees
Ronald W. Forbes, Co-Chairman of the Board and Trustee
Rodney D. Johnson, Co-Chairman of the Board and Trustee
Paul L. Audet, Trustee
David O. Beim, Trustee
Henry Gabbay, Trustee
Dr. Matina S. Horner, Trustee
Herbert I. London, Trustee
Ian A. MacKinnon, Trustee
Cynthia A. Montgomery, Trustee
Joseph P. Platt, Trustee
Robert C. Robb, Jr., Trustee
Toby Rosenblatt, Trustee
Kenneth L. Urish, Trustee
Frederick W. Winter, Trustee
John M. Perlowski, President and Chief Executive Officer
Richard Hoerner, CFA, Vice President
Brendan Kyne, Vice President
Christopher Stavrakos, CFA, Vice President
Neal Andrews, Chief Financial Officer
Jay Fife, Treasurer
Brian Kindelan, Chief Compliance Officer and Anti-Money Laundering Officer
Benjamin Archibald, Secretary
Investment Advisor and Co-Administrator
BlackRock Advisors, LLC
Wilmington, DE 19809
Sub-Advisors
BlackRock Financial Management, Inc.
New York, NY 10055
BlackRock International Limited
Edinburgh, Scotland EH3 8JB
BlackRock (Hong Kong) Limited
Hong Kong, China
BlackRock (Singapore) Limited
079912 Singapore
Accounting Agent, Co-Administrator and Transfer Agent
BNY Mellon Investment Servicing (US) Inc.
Wilmington, DE 19809
Custodian
The Bank of New York Mellon
New York, NY 10286
Distributor
BlackRock Investments, LLC
New York, NY 10022
Legal Counsel
Sidley Austin LLP
New York, NY 10019
Independent Registered Public Accounting Firm
Deloitte & Touche LLP
Philadelphia, PA 19103
Address of the Trust
100 Bellevue Parkway
Wilmington, DE 19809
| | | | |
| | | | | MARCH 31, 2013 |
| 50 | | BLACKROCK MANAGED VOLATILITY PORTFOLIO | |
Additional Information
Electronic Delivery
Electronic copies of most financial reports and prospectuses are available on the Fund’s websites or shareholders can sign up for e-mail notifications of quarterly statements, annual and semi-annual reports and prospectuses by enrolling in the Fund’s electronic delivery program.
To enroll:
Shareholders Who Hold Accounts with Investment Advisors, Banks or Brokerages:
Please contact your financial advisor. Please note that not all investment advisors, banks or brokerages may offer this service.
Shareholders Who Hold Accounts Directly With BlackRock:
| 1) | Access the BlackRock website at http://www.blackrock.com/edelivery |
| 2) | Select “eDelivery” under the “More Information” section |
Householding
The Fund will mail only one copy of shareholder documents, including prospectuses, annual and semi-annual reports and proxy statements, to shareholders with multiple accounts at the same address. This practice is commonly called “householding” and is intended to reduce expenses and eliminate duplicate mailings of shareholder documents. Mailings of your shareholder documents may be householded indefinitely unless you instruct us otherwise. If you do not want the mailing of these documents to be combined with those for other members of your household, please call the Fund at (800) 441-7762.
Availability of Quarterly Schedule of Investments
The Fund files its complete schedule of portfolio holdings with the SEC for the first and third quarters of each fiscal year on Form N-Q. The Fund’s Forms N-Q are available on the SEC’s website at http:// www.sec.gov and may also be reviewed and copied at the SEC’s Public Reference Room in Washington, D.C. Information on how to access documents on the SEC’s website without charge may be obtained by calling (800) SEC-0330. The Fund’s Forms N-Q may also be obtained upon request and without charge by calling (800) 441-7762.
Availability of Proxy Voting Policies and Procedures
A description of the policies and procedures that the Fund uses to determine how to vote proxies relating to portfolio securities is available (1) without charge, upon request, by calling (800) 441-7762; (2) at http://www.blackrock.com; and (3) on the SEC’s website at http:// www.sec.gov.
Availability of Proxy Voting Record
Information about how the Fund voted proxies relating to securities held in the Fund’s portfolios during the most recent 12-month period ended June 30 is available upon request and without charge (1) at http:// www.blackrock.com or by calling (800) 441-7762 and (2) on the SEC’s website at http://www.sec.gov.
Account Information
Call us at (800) 441-7762 from 8:00 AM to 6:00 PM EST on any business day to get information about your account balances, recent transactions and share prices. You can also reach us on the Web at http:// www.blackrock.com/funds.
Automatic Investment Plans
Investor Class shareholders who want to invest regularly can arrange to have $50 or more automatically deducted from their checking or savings account and invested in any of the BlackRock funds.
Systematic Withdrawal Plan
Investor Class shareholders can establish a systematic withdrawal plan and receive periodic payments of $50 or more from their BlackRock funds, as long as their account balance is at least $10,000.
Retirement Plans
Shareholders may make investments in conjunction with Traditional, Rollover, Roth, Coverdell, Simple IRAs, SEP IRAs and 403(b) Plans.
| | | | | | |
| | | | | MARCH 31, 2013 | | 51 |
| | BLACKROCK MANAGED VOLATILITY PORTFOLIO | | |
Additional Information (concluded)
|
BlackRock Privacy Principles |
BlackRock is committed to maintaining the privacy of its current and former fund investors and individual clients (collectively, “Clients”) and to safeguarding their non-public personal information. The following information is provided to help you understand what personal information BlackRock collects, how we protect that information and why in certain cases we share such information with select parties.
If you are located in a jurisdiction where specific laws, rules or regulations require BlackRock to provide you with additional or different privacy-related rights beyond what is set forth below, then BlackRock will comply with those specific laws, rules or regulations.
BlackRock obtains or verifies personal non-public information from and about you from different sources, including the following: (i) information we receive from you or, if applicable, your financial intermediary, on applications, forms or other documents; (ii) information about your transactions with us, our affiliates, or others; (iii) information we receive from a consumer reporting agency; and (iv) from visits to our websites.
BlackRock does not sell or disclose to non-affiliated third parties any non-public personal information about its Clients, except as permitted by law or as is necessary to respond to regulatory requests or to service Client accounts. These non-affiliated third parties are required to protect the confidentiality and security of this information and to use it only for its intended purpose.
We may share information with our affiliates to service your account or to provide you with information about other BlackRock products or services that may be of interest to you. In addition, BlackRock restricts access to non-public personal information about its Clients to those BlackRock employees with a legitimate business need for the information. BlackRock maintains physical, electronic and procedural safeguards that are designed to protect the non-public personal information of its Clients, including procedures relating to the proper storage and disposal of such information.
| | | | |
| | | | | MARCH 31, 2013 |
| 52 | | BLACKROCK MANAGED VOLATILITY PORTFOLIO | |
A World-Class Mutual Fund Family
BlackRock offers a diverse lineup of open-end mutual funds crossing all investment styles and managed by experts in equity, fixed income and tax-exempt investing.
| | | | |
BlackRock ACWI ex-US Index Fund BlackRock All-Cap Energy & Resources Portfolio BlackRock Basic Value Fund BlackRock Capital Appreciation Fund BlackRock China Fund BlackRock Commodity Strategies Fund BlackRock Disciplined Small Cap Core Fund BlackRock Emerging Markets Fund BlackRock Emerging Markets Long/Short Equity Fund BlackRock Energy & Resources Portfolio BlackRock Equity Dividend Fund BlackRock EuroFund BlackRock Flexible Equity Fund BlackRock Focus Growth Fund | | BlackRock Global Dividend Income Portfolio BlackRock Global Long/Short Equity Fund BlackRock Global Opportunities Portfolio BlackRock Global SmallCap Fund BlackRock Health Sciences Opportunities Portfolio BlackRock India Fund BlackRock International Fund BlackRock International Index Fund BlackRock International Opportunities Portfolio BlackRock Large Cap Core Fund BlackRock Large Cap Core Plus Fund BlackRock Large Cap Growth Fund BlackRock Large Cap Value Fund BlackRock Latin America Fund BlackRock Long-Horizon Equity Fund | | BlackRock Mid-Cap Growth Equity Portfolio BlackRock Mid-Cap Value Opportunities Fund BlackRock Natural Resources Trust BlackRock Pacific Fund BlackRock Real Estate Securities Fund BlackRock Russell 1000 Index Fund BlackRock Science & Technology Opportunities Portfolio BlackRock Small Cap Growth Equity Portfolio BlackRock Small Cap Growth Fund II BlackRock Small Cap Index Fund BlackRock S&P 500 Stock Fund BlackRock U.S. Opportunities Portfolio BlackRock Value Opportunities Fund BlackRock World Gold Fund |
| | |
| | |
| | |
| | |
| | |
| | |
| | |
| | |
| | |
| | |
| | |
| | |
| | |
| | |
| | |
Taxable Fixed Income Funds |
BlackRock Bond Index Fund BlackRock Core Bond Portfolio BlackRock CoreAlpha Bond Fund BlackRock Emerging Market Local Debt Portfolio BlackRock Floating Rate Income Portfolio BlackRock Global Long/Short Credit Fund BlackRock GNMA Portfolio BlackRock High Yield Bond Portfolio | | BlackRock Inflation Protected Bond Portfolio BlackRock International Bond Portfolio BlackRock Long Duration Bond Portfolio BlackRock Low Duration Bond Portfolio BlackRock Secured Credit Portfolio BlackRock Short Obligations Fund BlackRock Short-Term Treasury Fund | | BlackRock Strategic Income Opportunities Portfolio BlackRock Total Return Fund BlackRock U.S. Government Bond Portfolio BlackRock U.S. Mortgage Portfolio BlackRock Ultra-Short Obligations Fund BlackRock World Income Fund |
| | |
| | |
| | |
| | |
| | |
| | |
| | |
Municipal Fixed Income Funds | | | | |
BlackRock California Municipal Bond Fund BlackRock High Yield Municipal Fund BlackRock Intermediate Municipal Fund | | BlackRock National Municipal Fund BlackRock New Jersey Municipal Bond Fund BlackRock New York Municipal Bond Fund | | BlackRock Pennsylvania Municipal Bond Fund BlackRock Short-Term Municipal Fund |
| | |
| | |
Mixed Asset Funds |
BlackRock Balanced Capital Fund | | LifePath Active Portfolios | | LifePath Index Portfolios |
BlackRock Emerging Market Allocation Portfolio | | 2015 2040 | | Retirement 2040 |
BlackRock Global Allocation Fund | | 2020 2045 | | 2020 2045 |
BlackRock Managed Volatility Portfolio | | 2025 2050 | | 2025 2050 |
BlackRock Multi-Asset Income Portfolio | | 2030 2055 | | 2030 2055 |
BlackRock Multi-Asset Real Return Fund | | 2035 | | 2035 |
BlackRock Strategic Risk Allocation Fund | | | | |
| | LifePath Portfolios |
BlackRock Prepared Portfolios | | Retirement 2040 | | |
Conservative Prepared Portfolio | | 2020 2045 | | |
Moderate Prepared Portfolio | | 2025 2050 | | |
Growth Prepared Portfolio | | 2030 2055 | | |
Aggressive Growth Prepared Portfolio | | 2035 | | |
BlackRock mutual funds are currently distributed by BlackRock Investments, LLC. You should consider the investment objectives, risks, charges and expenses of the funds under consideration carefully before investing. Each fund’s prospectus contains this and other information and is available at www.blackrock.com or by calling (800) 441-7762 or from your financial advisor. The prospectus should be read carefully before investing.
| | | | | | |
| | | | | MARCH 31, 2013 | | 53 |
| | BLACKROCK MANAGED VOLATILITY PORTFOLIO | | |
| Item 2 | – Code of Ethics – Not Applicable to this semi-annual report |
| Item 3 | – Audit Committee Financial Expert – Not Applicable to this semi-annual report |
| Item 4 | – Principal Accountant Fees and Services – Not Applicable to this semi-annual report |
| Item 5 | – Audit Committee of Listed Registrants – Not Applicable |
| | (a) The registrant’s Schedule of Investments is included as part of the Report to Stockholders filed under |
| | (b) Not Applicable due to no such divestments during the semi-annual period covered since the previous |
| Item 7 | – Disclosure of Proxy Voting Policies and Procedures for Closed-End Management Investment Companies – |
| Item 8 | – Portfolio Managers of Closed-End Management Investment Companies – Not Applicable |
| Item 9 | – Purchases of Equity Securities by Closed-End Management Investment Company and Affiliated |
| | Purchasers – Not Applicable |
| Item 10 | – Submission of Matters to a Vote of Security Holders – There have been no material changes to these |
| Item 11 | – Controls and Procedures |
| | (a) – The registrant’s principal executive and principal financial officers, or persons performing similar functions, have concluded that the registrant’s disclosure controls and procedures (as defined in Rule 30a-3(c) under the Investment Company Act of 1940, as amended (the “1940 Act”)) are effective as of a date within 90 days of the filing of this report based on the evaluation of these controls and procedures required by Rule 30a-3(b) under the 1940 Act and Rule 15d-15(b) under the Securities Exchange Act of 1934, as amended. |
| | (b) – There were no changes in the registrant’s internal control over financial reporting (as defined in Rule 30a-3(d) under the 1940 Act) that occurred during the second fiscal quarter of the period covered by this report that have materially affected, or are reasonably likely to materially affect, the registrant’s internal control over financial reporting. |
| Item 12 | – Exhibits attached hereto |
(a)(1) – Code of Ethics – Not Applicable to this semi-annual report
(a)(2) – Certifications – Attached hereto
(a)(3) – Not Applicable
(b) – Certifications – Attached hereto
2
Pursuant to the requirements of the Securities Exchange Act of 1934 and the Investment Company Act of 1940, the registrant has duly caused this report to be signed on its behalf by the undersigned, thereunto duly authorized.
| | |
BlackRock Funds |
| |
| By: | | /s/ John M. Perlowski |
John M. Perlowski |
Chief Executive Officer (principal executive officer) of |
BlackRock Funds |
Date: June 3, 2013
Pursuant to the requirements of the Securities Exchange Act of 1934 and the Investment Company Act of 1940, this report has been signed below by the following persons on behalf of the registrant and in the capacities and on the dates indicated.
| | |
| By: | | /s/ John M. Perlowski |
John M. Perlowski |
Chief Executive Officer (principal executive officer) of |
BlackRock Funds |
Date: June 3, 2013
| | |
| By: | | /s/ Neal J. Andrews |
Neal J. Andrews |
Chief Financial Officer (principal financial officer) of |
BlackRock Funds |
Date: June 3, 2013
3