UNITED STATES
SECURITIES AND EXCHANGE COMMISSION
Washington, D.C. 20549
FORM N-CSR
CERTIFIED SHAREHOLDER REPORT OF REGISTERED MANAGEMENT INVESTMENT COMPANIES
Investment Company Act file number 811-05742
Name of Fund: BlackRock Funds
BlackRock Real Estate Securities Fund
Fund Address: 100 Bellevue Parkway, Wilmington, DE 19809
Name and address of agent for service: John M. Perlowski, Chief Executive Officer, BlackRock Funds, 55 East 52nd Street, New York, NY 10055
Registrant’s telephone number, including area code: (800) 441-7762
Date of fiscal year end: 01/31/2014
Date of reporting period: 07/31/2013
Item 1 – Report to Stockholders
JULY 31, 2013
| | | | |
SEMI-ANNUAL REPORT (UNAUDITED) | | | | BLACKROCK® |
| | | | |
| | BlackRock Real Estate Securities Fund | | of BlackRock FundsSM |
| | |
| Not FDIC Insured ¡ May Lose Value ¡ No Bank Guarantee | | |
| | | | | | |
| 2 | | BLACKROCK REAL ESTATE SECURITIES FUND | | JULY 31, 2013 | | |
One year ago, risk assets (such as equities) were on the rise as weakening global economic data spurred increasing optimism that the world’s largest central banks would intervene to stimulate growth. This much-anticipated monetary policy easing ultimately came in September when the European Central Bank (“ECB”) and the US Federal Reserve announced their plans for increasing global liquidity. Although financial markets worldwide were buoyed by these aggressive policy actions, risk assets weakened later in the fall of 2012. Global trade slowed as many European countries fell into recession and growth continued to decelerate in China. In the United States, investors became increasingly concerned about the “fiscal cliff” of tax increases and spending cuts that had been scheduled to take effect at the beginning of 2013. High levels of global market volatility persisted through year-end due to fears that bipartisan gridlock would preclude a timely resolution, putting the US economy at high risk for recession. As 2013 began, the worst of the fiscal cliff was averted with a last-minute tax deal.
Investors shook off the nerve-wracking finale to 2012 and the New Year started with a powerful relief rally. Money that had been pulled to the sidelines amid year-end tax-rate uncertainty poured back into the markets in January. Key indicators signaling modest but broad-based improvements in the world’s major economies helped propel the rally. Underlying this aura of comfort was the absence of negative headlines from Europe. Global equities surged, while rising US Treasury yields pressured high quality fixed income assets. (Bond prices move in the opposite direction of yields.)
However, February brought a slowdown in global economic momentum and the pace of the rally moderated. In the months that followed, US equities outperformed international markets, as the US economic recovery showed greater stability compared to most other regions. Slow, but positive, growth in the United States was sufficient to support corporate earnings, while uncomfortably high unemployment reinforced investors’ expectations that the US Federal Reserve would keep interest rates low. International markets experienced higher levels of volatility as political instability in Italy and a severe banking crisis in Cyprus reminded investors that the eurozone was still vulnerable to a number of macro risks, while a poor outlook for European economies also dampened sentiment. Emerging markets significantly lagged the rest of the world as growth in these economies (particularly China and Brazil) fell short of expectations.
After peaking in late May, financial markets broadly sold off due to concerns about the US Federal Reserve reducing monetary stimulus. Volatility picked up considerably as investors abruptly retreated from risk assets and a sharp and dramatic rise in US Treasury yields resulted in tumbling prices for higher-quality fixed income investments. The downswing bottomed out in late June as a more dovish tone from the US central bank served to quell the volatility in interest rates, while improving economic data and a positive outlook for corporate earnings helped the markets regain strength in July, with major US equity indices regularly hitting new record highs.
Despite the swings in the markets in the second quarter, most risk asset classes generated positive returns for the 6- and 12-month periods ended July 31, 2013. US equities were particularly strong. International equities also performed well, although political and economic uncertainty in Europe resulted in less impressive gains for the last six months. Emerging markets suffered the impact of slowing growth and concerns about a shrinking global money supply. Extreme levels of interest rate volatility in the final months of the period resulted in poor performance for fixed income markets, especially US Treasury bonds and other higher quality sectors such as tax-exempt municipals and investment grade corporate bonds. The high yield sector performed relatively better as demand continued to be supported by investors’ ongoing search for income in the low-rate environment. Short-term interest rates remained near zero, keeping yields on money market securities near historical lows.
Market conditions remain volatile, and investors still face a number of uncertainties in the current environment. At BlackRock, we believe investors need to think globally and extend their scope across a broader array of asset classes and be prepared to move freely as market conditions change over time. We encourage you to talk with your financial advisor and visit www.blackrock.com for further insight about investing in today’s world.
Sincerely,

Rob Kapito
President, BlackRock Advisors, LLC

“Despite the swings in the markets in the second quarter, most risk asset classes generated positive returns for the 6- and 12-month periods ended July 31, 2013.”
Rob Kapito
President, BlackRock Advisors, LLC
| | | | | | | | |
Total Returns as of July 31, 2013 | |
| | | 6-month | | | 12-month | |
US large cap equities
(S&P 500® Index) | | | 13.73 | % | | | 25.00 | % |
US small cap equities
(Russell 2000® Index) | | | 16.66 | | | | 34.76 | |
International equities
(MSCI Europe, Australasia, Far East Index) | | | 4.11 | | | | 23.48 | |
Emerging market equities
(MSCI Emerging Markets Index) | | | (9.87 | ) | | | 1.95 | |
3-month Treasury bill
(BofA Merrill Lynch
3-Month US Treasury
Bill Index) | | | 0.05 | | | | 0.11 | |
US Treasury securities
(BofA Merrill Lynch
10- Year US Treasury
Index) | | | (3.71 | ) | | | (6.50 | ) |
US investment grade
bonds (Barclays US
Aggregate Bond Index) | | | (1.62 | ) | | | (1.91 | ) |
Tax-exempt municipal bonds (S&P Municipal Bond Index) | | | (4.11 | ) | | | (1.99 | ) |
US high yield bonds
(Barclays US Corporate
High Yield 2%
Issuer Capped Index | | | 1.97 | | | | 9.49 | |
|
Past performance is no guarantee of future results. Index performance is shown for illustrative purposes only. You cannot invest directly in an index. | |
| | | | | | |
| | | THIS PAGE NOT PART OF YOUR FUND REPORT | | | | 3 |
| | |
| Fund Summary as of July 31, 2013 | | |
BlackRock Real Estate Securities Fund’s (the “Fund”) investment objective is to seek total return comprised of long-term growth of capital and dividend income.
|
| Portfolio Management Commentary |
How did the Fund perform?
| Ÿ | | For the six-month period ended July 31, 2013, the Fund underperformed its benchmark, the FTSE EPRA/NAREIT United States Index. |
What factors influenced performance?
| Ÿ | | The Fund underperformed the benchmark index due to stock selection in the lodging and residential segments. Investments in cell towers, which are not represented in the benchmark index, also had a negative impact on results for the period. |
| Ÿ | | Positive performance during the period was derived from stock selection within the industrial, health care and retail segments. |
Describe recent portfolio activity.
| Ÿ | | During the six-month period, the Fund closed its underweight in health care, bringing its exposure closer to the benchmark index weighting. Within health care, the Fund drastically reduced its position in Ventas, Inc. and redeployed most of that capital into Health Care REIT, Inc. In the |
| | | self storage space, the Fund moved from a slight overweight to an under- weight. The Fund sold its slightly overweight position in Public Storage and invested most of the proceeds in Extra Space Storage, Inc. |
Describe portfolio positioning at period end.
| Ÿ | | As of period end, the Fund’s positioning remained overweight in larger, higher quality stocks as Fund management finds the greatest value in that area. From an industry perspective, the Fund’s allocation to retail represented only a slight overweight relative to the benchmark index; however, within the industry, the Fund held a meaningful overweight in regional malls and underweight in shopping centers. Elsewhere, the Fund held notable underweights to the triple net lease and diversified indus- tries. The Fund also continued to maintain a non-benchmark position in a cell tower company. |
The views expressed reflect the opinions of BlackRock as of the date of this report and are subject to change based on changes in market, economic or other conditions. These views are not intended to be a forecast of future events and are no guarantee of future results.
| | | | |
| |
| Ten Largest Holdings | | Percent of
Long-Term Investments | |
Simon Property Group, Inc. | | | 13 | % |
Boston Properties, Inc. | | | 6 | |
HCP, Inc. | | | 6 | |
Equity Residential | | | 5 | |
Health Care REIT, Inc. | | | 5 | |
Prologis, Inc. | | | 5 | |
General Growth Properties, Inc. | | | 4 | |
AvalonBay Communities, Inc. | | | 4 | |
Extra Space Storage, Inc. | | | 4 | |
DDR Corp. | | | 3 | |
| | | | |
| |
| Industry Allocation | | Percent of
Long-Term Investments | |
Retail | | | 25 | % |
Residential | | | 18 | |
Health Care | | | 15 | |
Office | | | 10 | |
Industrial | | | 9 | |
Lodging | | | 7 | |
Self Storage | | | 5 | |
Specialty | | | 4 | |
Diversified | | | 3 | |
Other | | | 2 | |
Triple Net Lease | | | 2 | |
For Fund compliance purposes, the Fund’s industry classifications refer to any one or more of the industry sub-classifications used by one or more widely recognized market indexes or ratings group indexes, and/or as defined by Fund management. These definitions may not apply for purposes of this report, which may combine such industry sub-classifications for reporting ease.
| | | | | | |
| 4 | | BLACKROCK REAL ESTATE SECURITIES FUND | | JULY 31, 2013 | | |
|
| Total Return Based on a $10,000 Investment |
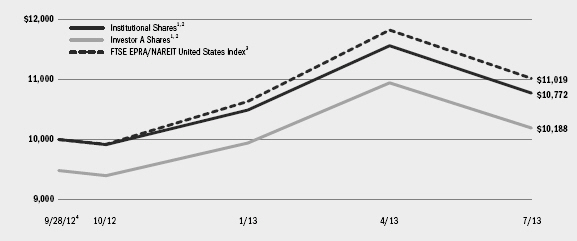
| | 1 | Assuming maximum sales charges, if any, transaction costs and other operating expenses, including investment advisory fees and administration fees, if any. Institutional Shares do not have a sales charge. |
| | 2 | Under normal conditions, the Fund invests at least 80% of its net assets plus any borrowings for investment purposes (measured at the time of purchase) in a portfolio of equity investments in issuers that are primarily engaged in or related to the real estate industry inside the United States. |
| | 3 | A subset of the EPRA/NAREIT Global Index and the EPRA/NAREIT North America Index containing publicly quoted real estate companies that meet the EPRA Ground Rules. |
| | 4 | Commencement of operations. |
| | | | | | | | | | | | |
| Performance Summary for the Period Ended July 31, 2013 | |
| | | | | | Total Returns5 | |
| | | | | | Since Inception6 | |
| | | 6-Month Total Returns | | | w/o sales charge | | | w/ sales charge | |
Institutional | | | 2.68 | % | | | 7.72 | % | | | N/A | |
Investor A | | | 2.51 | | | | 7.49 | | | | 1.88 | % |
Investor C | | | 2.14 | | | | 6.81 | | | | 5.81 | |
FTSE EPRA/NAREIT United States Index | | | 3.61 | | | | 10.19 | | | | N/A | |
| | 5 | Assuming maximum sales charges, if any. Aggregate total returns with and without sales charges reflect reductions for distribution and service fees. See “About Fund Performance” on page 6 for a detailed description of share classes, including any related sales charges and fees. |
| | 6 | The Fund commenced operations on September 28, 2012. |
| | | N/A—Not applicable as share class and index do not have a sales charge. |
| | | Past performance is not indicative of future results. |
| | | | | | | | | | | | | | |
| Expense Example |
| | | Actual | | Hypothetical8 | | |
| | | Beginning Account Value
February 1, 2013 | | Ending Account Value July 31, 2013 | | Expenses Paid
During the Period7 | | Beginning Account Value
February 1, 2013 | | Ending Account Value July 31, 2013 | | Expenses Paid
During the Period7 | | Annualized Expense Ratio |
Institutional | | $1,000.00 | | $1,026.80 | | $5.38 | | $1,000.00 | | $1,019.49 | | $5.36 | | 1.07% |
Investor A | | $1,000.00 | | $1,025.10 | | $6.58 | | $1,000.00 | | $1,018.30 | | $6.56 | | 1.31% |
Investor C | | $1,000.00 | | $1,021.40 | | $10.32 | | $1,000.00 | | $1,014.58 | | $10.29 | | 2.06% |
| | 7 | For each class of the Fund, expenses are equal to the annualized expense ratio for the class, multiplied by the average account value over the period, multiplied by 181/365 (to reflect the one-half year period shown). |
| | 8 | Hypothetical 5% annual return before expenses is calculated by pro rating the number of days in the most recent half year divided by 365. See “Disclosure of Expenses” on page 6 for further information on how expenses were calculated. |
| | | | | | |
| | | BLACKROCK REAL ESTATE SECURITIES FUND | | JULY 31, 2013 | | 5 |
| Ÿ | | Institutional Shares are not subject to any sales charge. These shares bear no ongoing distribution or service fees and are available only to certain eligible investors. |
| Ÿ | | Investor A Shares are subject to a maximum initial sales charge (front-end load) of 5.25% and a service fee of 0.25% per year (but no distribution fee). |
| Ÿ | | Investor C Shares are subject to a 1.00% contingent deferred sales charge (“CDSC”) if redeemed within one year of purchase. In addition, these shares are subject to a distribution fee of 0.75% per year and a service fee of 0.25% per year. |
Performance information reflects past performance and does not guarantee future results. Current performance may be lower or higher than the performance data quoted. Refer to www.blackrock.com/funds to obtain performance data current to the most recent month end. Performance results do not reflect the deduction of taxes that a shareholder
would pay on Fund distributions or the redemption of Fund shares. Figures shown in the performance table on the previous page assume reinvestment of all dividends and distributions, if any, at net asset value (“NAV”) on the ex-dividend dates. Investment return and principal value of shares will fluctuate so that shares, when redeemed, may be worth more or less than their original cost. Dividends paid to each class of shares will vary because of the different levels of service, distribution and transfer agency fees applicable to each class, which are deducted from the income available to be paid to shareholders.
BlackRock Advisors, LLC (the “Manager”), the Fund’s investment advisor, waived and/or reimbursed a portion of the Fund’s expenses. Without such waiver and/or reimbursement, the Fund’s performance would have been lower. The Manager is under no obligation to waive or reimburse or to continue waiving or reimbursing its fees after the applicable termination date. See Note 4 of the Notes to Financial Statements for additional information on waivers and reimbursements.
Shareholders of the Fund may incur the following charges: (a) transactional expenses, such as sales charges; and (b) operating expenses, including investment advisory fees, service and distribution fees, including 12b-1 fees, acquired fund fees and expenses and other Fund expenses. The expense example on the previous page (which is based on a hypothetical investment of $1,000 invested on February 1, 2013 and held through July 31, 2013) is intended to assist shareholders both in calculating expenses based on an investment in the Fund and in comparing these expenses with similar costs of investing in other mutual funds.
The expense example provides information about actual account values and actual expenses. In order to estimate the expenses a shareholder paid during the period covered by this report, shareholders can divide their account value by $1,000 and then multiply the result by the number corresponding to their share class under the heading entitled “Expenses Paid During the Period.”
The expense example also provides information about hypothetical account values and hypothetical expenses based on the Fund’s actual expense ratio and an assumed rate of return of 5% per year before expenses. In order to assist shareholders in comparing the ongoing expenses of investing in the Fund and other funds, compare the 5% hypothetical example with the 5% hypothetical examples that appear in other funds’ shareholder reports.
The expenses shown in the expense example are intended to highlight shareholders’ ongoing costs only and do not reflect any transactional expenses, such as sales charges, if any. Therefore, the hypothetical example is useful in comparing ongoing expenses only, and will not help shareholders determine the relative total expenses of owning different funds. If these transactional expenses were included, shareholder expenses would have been higher.
| | | | | | |
| 6 | | BLACKROCK REAL ESTATE SECURITIES FUND | | JULY 31, 2013 | | |
| | | | |
| Schedule of Investments July 31, 2013 (Unaudited) | | | (Percentages shown are based on Net Assets) | |
| | | | |
| | | | | | | | |
| Common Stocks | | Shares | | | Value | |
Diversified — 3.1% | | | | | | | | |
American Assets Trust, Inc. | | | 1,096 | | | $ | 35,510 | |
Vornado Realty Trust | | | 2,186 | | | | 185,395 | |
| | | | | | | | |
| | | | | | | | 220,905 | |
Health Care — 15.0% | | | | | | | | |
HCP, Inc. | | | 8,832 | | | | 387,460 | |
Health Care REIT, Inc. | | | 5,655 | | | | 364,691 | |
Healthcare Trust of America, Inc. | | | 6,324 | | | | 69,248 | |
Sabra Health Care REIT, Inc. | | | 4,577 | | | | 120,100 | |
Ventas, Inc. | | | 1,952 | | | | 128,324 | |
| | | | | | | | |
| | | | | | | | 1,069,823 | |
Industrial — 8.4% | | | | | | | | |
Duke Realty Corp. | | | 10,498 | | | | 172,902 | |
EastGroup Properties, Inc. | | | 1,628 | | | | 100,708 | |
Prologis, Inc. | | | 8,527 | | | | 327,096 | |
| | | | | | | | |
| | | | | | | | 600,706 | |
Lodging — 6.5% | | | | | | | | |
LaSalle Hotel Properties | | | 5,726 | | | | 154,258 | |
Pebblebrook Hotel Trust | | | 5,600 | | | | 149,240 | |
Starwood Hotels & Resorts Worldwide, Inc. | | | 2,430 | | | | 160,745 | |
| | | | | | | | |
| | | | | | | | 464,243 | |
Office — 10.2% | | | | | | | | |
Boston Properties, Inc. | | | 4,143 | | | | 443,094 | |
Highwoods Properties, Inc. | | | 2,939 | | | | 106,627 | |
SL Green Realty Corp. | | | 1,931 | | | | 175,045 | |
| | | | | | | | |
| | | | | | | | 724,766 | |
Other — 2.0% | | | | | | | | |
American Tower Corp. | | | 1,976 | | | | 139,881 | |
Residential — 17.6% | | | | | | | | |
American Campus Communities, Inc. | | | 2,502 | | | | 96,102 | |
AvalonBay Communities, Inc. | | | 2,159 | | | | 292,199 | |
Camden Property Trust | | | 2,364 | | | | 166,757 | |
Equity Residential | | | 6,592 | | | | 369,152 | |
Essex Property Trust, Inc. | | | 1,107 | | | | 178,548 | |
Home Properties, Inc. | | | 2,405 | | | | 153,463 | |
| | | | | | | | |
| | | | | | | | 1,256,221 | |
| | | | | | | | |
| Common Stocks | | Shares | | | Value | |
Retail — 24.7% | | | | | | | | |
Acadia Realty Trust | | | 2,129 | | | $ | 54,886 | |
CBL & Associates Properties, Inc. | | | 6,189 | | | | 140,923 | |
DDR Corp. | | | 11,678 | | | | 199,460 | |
Federal Realty Investment Trust | | | 1,417 | | | | 149,253 | |
General Growth Properties, Inc. | | | 14,167 | | | | 293,824 | |
Simon Property Group, Inc. | | | 5,795 | | | | 927,548 | |
| | | | | | | | |
| | | | | | | | 1,765,894 | |
Self Storage — 5.1% | | | | | | | | |
CubeSmart | | | 7,310 | | | | 118,422 | |
Extra Space Storage, Inc. | | | 5,859 | | | | 246,371 | |
| | | | | | | | |
| | | | | | | | 364,793 | |
Specialty — 3.5% | | | | | | | | |
Alexandria Real Estate Equities, Inc. | | | 1,792 | | | | 122,752 | |
Digital Realty Trust, Inc. | | | 2,363 | | | | 130,650 | |
| | | | | | | | |
| | | | | | | | 253,402 | |
Triple Net Lease — 2.2% | | | | | | | | |
EPR Properties | | | 2,461 | | | | 123,985 | |
Spirit Realty Capital, Inc. | | | 3,770 | | | | 34,416 | |
| | | | | | | | |
| | | | | | | | 158,401 | |
Total Long-Term Investments (Cost — $6,950,074) — 98.3% | | | | 7,019,035 | |
| | | | | | | | |
| Short-Term Securities | | | | | | |
BlackRock Liquidity Funds, TempFund,
Institutional Class, 0.04% (a)(b) | | | 92,628 | | | | 92,628 | |
Total Short-Term Securities (Cost — $92,628) — 1.3% | | | | | | | 92,628 | |
Total Investments (Cost — $7,042,702) — 99.6% | | | | | | | 7,111,663 | |
Other Assets Less Liabilities — 0.4% | | | | | | | 27,436 | |
| | | | | | | | |
Net Assets — 100.0% | | | | | | $ | 7,139,099 | |
| | | | | | | | |
|
| Notes to Schedule of Investments |
| (a) | Represents the current yield as of report date. |
| (b) | Investments in issuers considered to be an affiliate of the Fund during the six months ended July 31, 2013, for purposes of Section 2(a)(3) of the Investment Company Act of 1940, as amended, were as follows: |
| | | | | | | | | | | | | | | | |
| Affiliate | | Shares Held at January 31, 2013 | | | Net
Activity | | | Shares Held at July 31, 2013 | | | Income | |
BlackRock Liquidity Funds, TempFund, Institutional Class | | | 325,300 | | | | (232,672 | ) | | | 92,628 | | | $ | 29 | |
| REIT | Real Estate Investment Trust |
See Notes to Financial Statements.
| | | | | | |
| | | BLACKROCK REAL ESTATE SECURITIES FUND | | JULY 31, 2013 | | 7 |
| | |
| Schedule of Investments (concluded) | | |
| Ÿ | | For Fund compliance purposes, the Fund’s industry classifications refer to any one or more of the industry sub-classifications used by one or more widely recognized market indexes or ratings group indexes, and/or as defined by Fund management. These definitions may not apply for purposes of this report, which may combine such industry sub-classifications for reporting ease. |
| Ÿ | | Fair Value Measurements — Various inputs are used in determining the fair value of investments. These inputs to valuation techniques are categorized into a disclosure hierarchy consisting of three broad levels for financial statement purposes as follows: |
| | Ÿ | | Level 1 — unadjusted price quotations in active markets/exchanges for identical assets or liabilities that the Fund has the ability to access |
| | Ÿ | | Level 2 — other observable inputs (including, but not limited to, quoted prices for similar assets or liabilities in markets that are active, quoted prices for identical or similar assets or liabilities in markets that are not active, inputs other than quoted prices that are observable for the assets or liabilities (such as interest rates, yield curves, volatilities, prepayment speeds, loss severities, credit risks and default rates) or other market–corroborated inputs) |
| | Ÿ | | Level 3 — unobservable inputs based on the best information available in the circumstances, to the extent observable inputs are not available (including the Fund’s own assumptions used in determining the fair value of investments) |
The hierarchy gives the highest priority to unadjusted quoted prices in active markets for identical assets or liabilities (Level 1 measurements) and the lowest priority to unobservable inputs (Level 3 measurements). Accordingly, the degree of judgment exercised in determining fair value is greatest for instruments categorized in Level 3. The inputs used to measure fair value may fall into different levels of the fair value hierarchy. In such cases, for disclosure purposes, the fair value hierarchy classification is determined based on the lowest level input that is significant to the fair value measurement in its entirety.
Changes in valuation techniques may result in transfers into or out of an assigned level within the disclosure hierarchy. In accordance with the Fund’s policy, transfers between different levels of the fair value disclosure hierarchy are deemed to have occurred as of the beginning of the reporting period. The categorization of a value determined for investments is based on the pricing transparency of the investment and is not necessarily an indication of the risks associated with investing in those securities. For information about the Fund’s policy regarding valuation of investments, please refer to Note 2 of the Notes to Financial Statements.
The following table summarizes the Fund’s investments categorized in the disclosure hierarchy as of July 31, 2013:
| | | | | | | | | | | | | | | | |
| | | Level 1 | | | Level 2 | | | Level 3 | | | Total | |
Assets: | | | | | | | | | | | | | | | | |
Investments: | | | | | | | | | | | | | | | | |
Long-Term Investments1 | | $ | 7,019,035 | | | | — | | | | — | | | $ | 7,019,035 | |
Short-Term Securities | | | 92,628 | | | | — | | | | — | | | | 92,628 | |
Total | | $ | 7,111,663 | | | | — | | | | — | | | $ | 7,111,663 | |
| | | | |
1 See above Schedule of Investments for values in each industry. | |
Certain of the Fund’s assets are held at carrying amount, which approximates fair value for financial statement purposes. As of July 31, 2013, cash of $406 is categorized as Level 1 within the disclosure hierarchy.
There were no transfers between levels during the six months ended July 31, 2013.
See Notes to Financial Statements.
| | | | | | |
| 8 | | BLACKROCK REAL ESTATE SECURITIES FUND | | JULY 31, 2013 | | |
| | |
| Statement of Assets and Liabilities | | |
| | | | |
| July 31, 2013 (Unaudited) | | | |
| | | | |
| Assets | | | | |
Investments at value — unaffiliated (cost — $6,950,074) | | $ | 7,019,035 | |
Investments at value — affiliated (cost — $92,628) | | | 92,628 | |
Cash | | | 406 | |
Investments sold receivable | | | 135,209 | |
Capital shares sold receivable | | | 30,682 | |
Deferred offering costs | | | 24,457 | |
Receivable from Manager | | | 15,914 | |
Dividends receivable — unaffiliated | | | 2,703 | |
Dividends receivable — affiliated | | | 3 | |
Securities lending income receivable — affiliated | | | 3 | |
Prepaid expenses | | | 12,060 | |
| | | | |
Total assets | | | 7,333,100 | |
| | | | |
| | | | |
| Liabilities | | | | |
Investments purchased payable | | | 124,694 | |
Offering costs payable | | | 46,038 | |
Printing fees payable | | | 12,542 | |
Officer’s and Trustees’ fees payable | | | 432 | |
Service and distribution fees payable | | | 425 | |
Other affiliates payable | | | 7 | |
Other accrued expenses payable | | | 9,863 | |
| | | | |
Total liabilities | | | 194,001 | |
| | | | |
Net Assets | | $ | 7,139,099 | |
| | | | |
| | | | |
| Net Assets Consist of | | | | |
Paid-in capital | | $ | 6,862,970 | |
Distributions in excess of net investment income | | | (4,460 | ) |
Accumulated net realized gain | | | 211,628 | |
Net unrealized appreciation/depreciation | | | 68,961 | |
| | | | |
Net Assets | | $ | 7,139,099 | |
| | | | |
| | | | |
| Net Asset Value | | | | |
Institutional — Based on net assets of $5,541,208 and 521,274 shares outstanding, unlimited number of shares authorized, $0.001 par value | | $ | 10.63 | |
| | | | |
Investor A — Based on net assets of $1,388,524 and 130,724 shares outstanding, unlimited number of shares authorized, $0.001 par value | | $ | 10.62 | |
| | | | |
Investor C — Based on net assets of $209,367 and 19,765 shares outstanding, unlimited number of shares authorized, $0.001 par value | | $ | 10.59 | |
| | | | |
See Notes to Financial Statements.
| | | | | | |
| | | BLACKROCK REAL ESTATE SECURITIES FUND | | JULY 31, 2013 | | 9 |
| | | | |
| Six Months Ended July 31, 2013 (Unaudited) | | | |
| | | | |
| Investment Income | | | | |
Dividends — unaffiliated | | $ | 73,379 | |
Dividends — affiliated | | | 29 | |
Securities lending — affiliated — net | | | 3 | |
| | | | |
Total income | | | 73,411 | |
| | | | |
| | | | |
| Expenses | | | | |
Offering | | | 71,386 | |
Professional | | | 25,992 | |
Investment advisory | | | 24,116 | |
Printing | | | 10,366 | |
Registration | | | 3,951 | |
Administration | | | 2,412 | |
Officer and Trustees | | | 1,481 | |
Custodian | | | 1,305 | |
Service — Investor A | | | 951 | |
Service and distribution — Investor C | | | 656 | |
Administration — Institutional | | | 691 | |
Administration — Investor A | | | 95 | |
Administration — Investor C | | | 16 | |
Transfer agent — Institutional | | | 148 | |
Transfer agent — Investor A | | | 341 | |
Transfer agent — Investor C | | | 42 | |
Miscellaneous | | | 6,021 | |
| | | | |
Total expenses | | | 149,970 | |
Less fees waived by Manager | | | (24,116 | ) |
Less administration fees waived | | | (2,412 | ) |
Less administration fees waived — Institutional | | | (666 | ) |
Less administration fees waived — Investor A | | | (94 | ) |
Less administration fees waived — Investor C | | | (15 | ) |
Less transfer agent fees waived — Institutional | | | (28 | ) |
Less transfer agent fees waived — Investor A | | | (6 | ) |
Less transfer agent fees waived — Investor C | | | (4 | ) |
Less transfer agent fees reimbursed — Institutional | | | (58 | ) |
Less transfer agent fees reimbursed — Investor A | | | (309 | ) |
Less transfer agent fees reimbursed — Investor C | | | (32 | ) |
Less expenses reimbursed by Manager | | | (86,271 | ) |
| | | | |
Total expenses after fees waived and reimbursed | | | 35,959 | |
| | | | |
Net investment income | | | 37,452 | |
| | | | |
| | | | |
| Realized and Unrealized Gain (Loss) | | | | |
Net realized gain from investments | | | 180,541 | |
Net change in unrealized appreciation/depreciation on investments | | | (119,122 | ) |
| | | | |
Total realized and unrealized gain | | | 61,419 | |
| | | | |
Net Increase in Net Assets Resulting from Operations | | $ | 98,871 | |
| | | | |
See Notes to Financial Statements.
| | | | | | |
| 10 | | BLACKROCK REAL ESTATE SECURITIES FUND | | JULY 31, 2013 | | |
| | |
| Statements of Changes in Net Assets | | |
| | | | | | | | |
| Increase in Net Assets: | | Six Months
Ended
July 31, 2013
(Unaudited) | | | Period
September 28, 20121 to
January 31, 2013 | |
| | | | | | | | |
| Operations | | | | | | | | |
Net investment income | | $ | 37,452 | | | $ | 22,444 | |
Net realized gain | | | 180,541 | | | | 35,987 | |
Net change in unrealized appreciation/depreciation | | | (119,122 | ) | | | 188,083 | |
| | | | |
Net increase in net assets resulting from operations | | | 98,871 | | | | 246,514 | |
| | | | |
| | | | | | | | |
| Dividends and Distributions to Shareholders From | | | | | | | | |
Net investment income: | | | | | | | | |
Institutional | | | (47,806 | ) | | | (19,110 | )2 |
Investor A | | | (6,217 | ) | | | (90 | )2 |
Investor C | | | (977 | ) | | | (46 | )2 |
Net realized gain: | | | | | | | | |
Institutional | | | — | | | | (4,845 | )2 |
Investor A | | | — | | | | (26 | )2 |
Investor C | | | — | | | | (29 | )2 |
| | | | |
Decrease in net assets resulting from dividends and distributions to shareholders | | | (55,000 | ) | | | (24,146 | ) |
| | | | |
| | | | | | | | |
| Capital Share Transactions | | | | | | | | |
Net increase in net assets derived from capital share transactions | | | 1,441,440 | | | | 5,431,420 | |
| | | | |
| | | | | | | | |
| Net Assets | | | | | | | | |
Total increase in net assets | | | 1,485,311 | | | | 5,653,788 | |
Beginning of period | | | 5,653,788 | | | | — | |
| | | | |
End of period | | $ | 7,139,099 | | | $ | 5,653,788 | |
| | | | |
Undistributed (distributions in excess of) net investment income at end of period | | $ | (4,460 | ) | | $ | 13,088 | |
| | | | |
| | 1 | Commencement of operations. |
| | 2 | Dividends and distributions are determined in accordance with federal income tax regulations. |
See Notes to Financial Statements.
| | | | | | |
| | | BLACKROCK REAL ESTATE SECURITIES FUND | | JULY 31, 2013 | | 11 |
| | | | | | | | | | | | | | | | | | | | | | | | |
| | | Institutional | | | Investor A | | | Investor C | |
| | | Six Months
Ended
July 31, 2013
(Unaudited) | | | Period
September 28, 20121 to January 31,
2013 | | | Six Months
Ended
July 31, 2013
(Unaudited) | | | Period
September 28, 20121 to January 31, 2013 | | | Six Months
Ended
July 31, 2013
(Unaudited) | | | Period
September 28, 20121 to January 31,
2013 | |
| | | | | | | | | | | | | | | | | | | | | | | | |
| Per Share Operating Performance | | | | | | | | | | | | | | | | | | | | | | | | |
Net asset value, beginning of period | | $ | 10.44 | | | $ | 10.00 | | | $ | 10.44 | | | $ | 10.00 | | | $ | 10.43 | | | $ | 10.00 | |
| | | | | | | | | | | | |
Net investment income (loss)2 | | | 0.07 | | | | 0.04 | | | | 0.05 | | | | 0.04 | | | | (0.01 | ) | | | 0.01 | |
Net realized and unrealized gain | | | 0.21 | | | | 0.45 | | | | 0.22 | | | | 0.44 | | | | 0.24 | | | | 0.45 | |
| | | | | | | | | | | | |
Net increase from investment operations | | | 0.28 | | | | 0.49 | | | | 0.27 | | | | 0.48 | | | | 0.23 | | | | 0.46 | |
| | | | | | | | | | | | |
Dividends and distributions from: | | | | | | | | | | | | | | | | | | | | | | | | |
Net investment income | | | (0.09 | ) | | | (0.04 | )3 | | | (0.09 | ) | | | (0.03 | )3 | | | (0.07 | ) | | | (0.02 | )3 |
Net realized gain | | | — | | | | (0.01 | )3 | | | — | | | | (0.01 | )3 | | | — | | | | (0.01 | )3 |
| | | | | | | | | | | | |
Total dividends and distributions | | | (0.09 | ) | | | (0.05 | ) | | | (0.09 | ) | | | (0.04 | ) | | | (0.07 | ) | | | (0.03 | ) |
| | | | | | | | | | | | |
Net asset value, end of period | | $ | 10.63 | | | $ | 10.44 | | | $ | 10.62 | | | $ | 10.44 | | | $ | 10.59 | | | $ | 10.43 | |
| | | | | | | | | | | | |
| | | | | | | | | | | | | | | | | | | | | | | | |
| Total Investment Return4,5 | | | | | | | | | | | | | | | | | | | | | | | | |
Based on net asset value | | | 2.68 | % | | | 4.91 | % | | | 2.51 | % | | | 4.85 | % | | | 2.14 | % | | | 4.57 | % |
| | | | | | | | | | | | |
| | | | | | | | | | | | | | | | | | | | | | | | |
| Ratios to Average Net Assets6 | | | | | | | | | | | | | | | | | | | | | | | | |
Total expenses | | | 4.61 | % | | | 7.77 | %7 | | | 4.89 | % | | | 7.96 | %7 | | | 5.55 | % | | | 8.90 | %7 |
| | | | | | | | | | | | |
Total expenses after fees waived and reimbursed | | | 1.07 | % | | | 1.05 | % | | | 1.31 | % | | | 1.30 | % | | | 2.06 | % | | | 2.05 | % |
| | | | | | | | | | | | |
Net investment income (loss) | | | 1.24 | % | | | 1.32 | % | | | 0.83 | % | | | 1.17 | % | | | (0.17 | )% | | | 0.43 | % |
| | | | | | | | | | | | |
| | | | | | | | | | | | | | | | | | | | | | | | |
| Supplemental Data | | | | | | | | | | | | | | | | | | | | | | | | |
Net assets, end of period (000) | | $ | 5,541 | | | $ | 5,273 | | | $ | 1,389 | | | $ | 357 | | | $ | 209 | | | $ | 24 | |
| | | | | | | | | | | | |
Portfolio turnover | | | 28 | % | | | 25 | % | | | 28 | % | | | 25 | % | | | 28 | % | | | 25 | % |
| | | | | | | | | | | | |
| | 1 | Commencement of operations. |
| | 2 | Based on average shares outstanding. |
| | 3 | Dividends and distributions are determined in accordance with federal income tax regulations. |
| | 4 | Where applicable, total investment returns exclude the effects of any sales charges and assume the reinvestment of dividends and distributions. |
| | 5 | Aggregate total investment return. |
| | 7 | Organization costs were not annualized in the calculation of the expense ratios. If these expenses were annualized, the total expenses for Institutional, Investor A and Inves- tor C would have been 8.36%, 8.55% and 9.48%, respectively. |
See Notes to Financial Statements.
| | | | | | |
| 12 | | BLACKROCK REAL ESTATE SECURITIES FUND | | JULY 31, 2013 | | |
| | |
| Notes to Financial Statements (Unaudited) | | |
1. Organization:
BlackRock FundsSM (the “Trust”) is registered under the Investment Company Act of 1940, as amended (the “1940 Act”), as an open-end management investment company. The Trust is organized as a Massa-chusetts business trust. BlackRock Real Estate Securities Fund (the “Fund”) is a series of the Trust. The Fund is classified as non-diversified. The Fund offers multiple classes of shares. Institutional Shares are sold without a sales charge and only to certain eligible investors. Investor A Shares are generally sold with a front-end sales charge. Investor C Shares may be subject to a CDSC. All classes of shares have identical voting, dividend, liquidation and other rights and the same terms and conditions, except that Investor A and Investor C Shares bear certain expenses related to the shareholder servicing of such shares, and Investor C Shares also bear certain expenses related to the distribution of such shares. Each class has exclusive voting rights with respect to matters relating to its shareholder servicing and distribution expenditures.
2. Significant Accounting Policies:
The Fund’s financial statements are prepared in conformity with accounting principles generally accepted in the United States of America (“US GAAP”), which may require management to make estimates and assumptions that affect the reported amounts of assets and liabilities in the financial statements and the reported amounts of increases and decreases in net assets from operations during the reporting period. Actual results could differ from those estimates. The following is a summary of the significant accounting policies followed by the Fund:
Valuation: US GAAP defines fair value as the price the Fund would receive to sell an asset or pay to transfer a liability in an orderly transaction between market participants at the measurement date. The Fund determines the fair values of its financial instruments at market value using independent dealers or pricing services under policies approved by the Board of Trustees of the Trust (the “Board”). The BlackRock Global Valuation Methodologies Committee (the “Global Valuation Committee”) is the committee formed by management to develop global pricing policies and procedures and to provide oversight of the pricing function for the Fund for all financial instruments.
Equity investments traded on a recognized securities exchange or the NASDAQ Global Market System (“NASDAQ”) are valued at the last reported sale price that day or the NASDAQ official closing price, if applicable. For equity investments traded on more than one exchange, the last reported sale price on the exchange where the stock is primarily traded is used. Equity investments traded on a recognized exchange for which there were no sales on that day are valued at the last available bid price. If no bid price is available, the prior day’s price will be used, unless it is determined that such prior day’s price no longer reflects the fair value of the security. Investments in open-end registered investment companies are valued at NAV each business day.
In the event that application of these methods of valuation results in a price for an investment that is deemed not to be representative of the
market value of such investment, or if a price is not available, the investment will be valued by the Global Valuation Committee, or its delegate, in accordance with a policy approved by the Board as reflecting fair value (“Fair Value Assets”). When determining the price for Fair Value Assets, the Global Valuation Committee, or its delegate, seeks to determine the price that the Fund might reasonably expect to receive from the current sale of that asset in an arm’s-length transaction. Fair value determinations shall be based upon all available factors that the Global Valuation Committee, or its delegate, deem relevant consistent with the principles of fair value measurement which include the market approach, income approach and/or in the case of recent investments, the cost approach, as appropriate. The market approach generally consists of using comparable market transactions. The income approach generally is used to discount future cash flows to present value and is adjusted for liquidity as appropriate. These factors include but are not limited to: (i) attributes specific to the investment or asset; (ii) the principal market for the investment or asset; (iii) the customary participants in the principal market for the investment or asset; (iv) data assumptions by market participants for the investment or asset, if reasonably available; (v) quoted prices for similar investments or assets in active markets; and (vi) other factors, such as future cash flows, interest rates, yield curves, volatilities, prepayment speeds, loss severities, credit risks, recovery rates, liquidation amounts and/or default rates. Due to the inherent uncertainty of valuations of such investments, the fair values may differ from the values that would have been used had an active market existed. The Global Valuation Committee, or its delegate, employs various methods for calibrating valuation approaches for investments where an active market does not exist, including regular due diligence of the Fund’s pricing vendors, a regular review of key inputs and assumptions, transactional back-testing or disposition analysis to compare unrealized gains and losses to realized gains and losses, reviews of missing or stale prices and large movements in market values and reviews of any market related activity. The pricing of all Fair Value Assets is subsequently reported to the Board or a committee thereof on a quarterly basis.
Investment Transactions and Investment Income: For financial reporting purposes, investment transactions are recorded on the dates the transactions are entered into (the trade dates). Realized gains and losses on investment transactions are determined on the identified cost basis. Dividend income is recorded on the ex-dividend dates. Upon notification from issuers, some of the dividend income received from a real estate investment trust may be redesignated as a reduction of cost of the related investment and/or realized gain. Income, expenses and realized and unrealized gains and losses are allocated daily to each class based on its relative net assets.
Dividends and Distributions: Dividends and distributions paid by the Fund are recorded on the ex-dividend dates. The portion of distributions that exceeds the Fund’s current and accumulated earnings and profits, which are measured on a tax basis, will constitute a nontaxable return of capital. Distributions in excess of the Fund’s taxable income and net capital gains, but not in excess of the Fund’s earnings and profits, will be taxable to shareholders as ordinary income and will not constitute a
| | | | | | |
| | | BLACKROCK REAL ESTATE SECURITIES FUND | | JULY 31, 2013 | | 13 |
| | |
| Notes to Financial Statements (continued) | | |
nontaxable return of capital. The character and timing of dividends and distributions are determined in accordance with federal income tax regulations, which may differ from US GAAP.
Income Taxes: It is the Fund’s policy to comply with the requirements of the Internal Revenue Code of 1986, as amended, applicable to regulated investment companies and to distribute substantially all of its taxable income to its shareholders. Therefore, no federal income tax provision is required.
The Fund files US federal and various state and local tax returns. No income tax returns are currently under examination. The statute of limitations on the Fund’s US federal, state and local tax returns remain open for the period ended January 31, 2013. Management does not believe there are any uncertain tax positions that require recognition of a tax liability.
Recent Accounting Standards: In December 2011, the Financial Accounting Standards Board (the “FASB”) issued guidance that will expand current disclosure requirements on the offsetting of certain assets and liabilities. The new disclosures will be required for investments and derivative financial instruments subject to master netting or similar agreements which are eligible for offset in the Statement of Assets and Liabilities and will require an entity to disclose both gross and net information about such investments and transactions in the financial statements. In January 2013, the FASB issued guidance that clarifies which investments and transactions are subject to the offsetting disclosure requirements. The scope of the disclosure requirements for offsetting will be limited to derivative instruments, repurchase agreements and reverse repurchase agreements, and securities borrowing and securities lending transactions. The guidance is effective for financial statements with fiscal years beginning on or after January 1, 2013, and interim periods within those fiscal years. Management is evaluating the impact, if any, of this guidance on the Fund’s financial statement disclosures.
Offering Costs: Offering costs are amortized over a 12-month period beginning with the commencement of operations.
Other: Expenses directly related to the Fund or its classes are charged to the Fund or class. Other operating expenses shared by several funds are pro rated among those funds on the basis of relative net assets or other appropriate methods. Expenses directly related to the Fund and other shared expenses pro rated to the Fund are allocated daily to each class based on its relative net assets or other appropriate methods.
The Fund has an arrangement with the custodian whereby fees may be reduced by credits earned on uninvested cash balances, which, if applicable, are shown as fees paid indirectly in the Statement of Operations. The custodian imposes fees on overdrawn cash balances, which can be offset by accumulated credits earned or may result in additional custody charges.
3. Securities and Other Investments:
Securities Lending: The Fund may lend securities to approved borrowers, such as banks, brokers and other financial institutions. The borrower pledges cash, securities issued or guaranteed by the US government or irrevocable letters of credit issued by a bank as collateral. The initial collateral received by the Fund should have a value of at least 102% of the current value of the loaned securities for securities traded on US exchanges and a value of at least 105% for all other securities. The collateral is maintained thereafter in an amount equal to at least 100% of the current market value of the loaned securities. The market value of the loaned securities is determined at the close of business of the Fund and any additional required collateral is delivered to the Fund on the next business day. Securities lending income, as disclosed in the Statement of Operations, represents the income earned from the investment of the cash collateral, net of rebates paid to, or fees paid by, borrowers and less the fees paid to the securities lending agent. During the term of the loan, the Fund earns dividend or interest income on the securities loaned but does not receive interest income on the securities received as collateral. Loans of securities are terminable at any time and the borrower, after notice, is required to return borrowed securities within the standard time period for settlement of securities transactions.
The market value of securities on loan and the value of the related collateral are shown separately in the Statement of Assets and Liabilities as a component of investments at value, and collateral on securities loaned at value, respectively. The cash collateral invested by the securities lending agent, BlackRock Investment Management, LLC (“BIM”), if any, is disclosed in the Schedule of Investments.
Securities lending transactions are entered into by the Fund under Master Securities Lending Agreements (“MSLA”) which provide the right, in the event of default (including bankruptcy or insolvency) for the nondefaulting party to liquidate the collateral and calculate a net exposure to the defaulting party or request additional collateral. In the event that a borrower defaults, the Fund, as lender, would offset the market value of the collateral received against the market value of the securities loaned. The value of the collateral is typically greater than that of the market value of the securities loaned, leaving the lender with a net amount payable to the defaulting party. However, bankruptcy or insolvency laws of a particular jurisdiction may impose restrictions on or prohibitions against such a right of offset in the event of a MSLA counterparty’s bankruptcy or insolvency. Under the MSLA, the borrower can resell or re-pledge the loaned securities, and the Fund can reinvest cash collateral, or, upon an event of default, resell or re-pledge the collateral.
The risks of securities lending also include the risk that the borrower may not provide additional collateral when required or may not return the securities when due. To mitigate this risk, the Fund benefits from a borrower default indemnity provided by BlackRock, Inc. (“BlackRock”). BlackRock’s indemnity allows for full replacement of securities lent. The Fund also could suffer a loss if the value of an investment purchased
| | | | | | |
| 14 | | BLACKROCK REAL ESTATE SECURITIES FUND | | JULY 31, 2013 | | |
| | |
| Notes to Financial Statements (continued) | | |
with cash collateral falls below the market value of loaned securities or if the value of an investment purchased with cash collateral falls below the value of the original cash collateral received. During the six months ended July 31, 2013, any securities on loan were collateralized by cash.
4. Investment Advisory Agreement and Other Transactions with Affiliates:
The PNC Financial Services Group, Inc. is the largest stockholder and an affiliate, for 1940 Act purposes, of BlackRock.
The Trust, on behalf of the Fund, entered into an Investment Advisory Agreement with the Manager, the Fund’s investment advisor, an indirect, wholly owned subsidiary of BlackRock, to provide investment advisory and administration services. The Manager is responsible for the management of the Fund’s portfolio and provides the necessary personnel, facilities, equipment and certain other services necessary to the operations of the Fund. For such services, the Fund pays the Manager a monthly fee based on a percentage of the Fund’s average daily net assets at the following annual rates:
| | | | |
| Average Daily Net Assets | | Investment Advisory Fee | |
First $1 Billion | | | 0.75 | % |
$1 Billion - $3 Billion | | | 0.71 | % |
$3 Billion - $5 Billion | | | 0.68 | % |
$5 Billion - $10 Billion | | | 0.65 | % |
Greater than $10 Billion | | | 0.64 | % |
The Manager voluntarily agreed to waive its investment advisory fees by the amount of investment advisory fees the Fund pays to the Manager indirectly through its investment in affiliated money market funds. However, the Manager does not waive its investment advisory fees by the amount of investment advisory fees paid in connection with the Fund’s investment in other affiliated investment companies, if any. This amount is included in fees waived by Manager in the Statement of Operations. For the six months ended July 31, 2013, the amount waived was $30.
The Manager entered into a sub-advisory agreement with BlackRock Financial Management, Inc. (“BFM”), an affiliate of the Manager. The Manager pays BFM, for services it provides, a monthly fee that is a percentage of the investment advisory fees paid by the Fund to the Manager.
The Trust, on behalf of the Fund, entered into a Distribution Agreement and a Distribution and Service Plan with BlackRock Investments, LLC (“BRIL”), an affiliate of the Manager. Pursuant to the Distribution and Service Plan and in accordance with Rule 12b-1 under the 1940 Act, the Fund pays BRIL ongoing service and distribution fees. The fees are accrued daily and paid monthly at annual rates based upon the average daily net assets of the shares of the Fund as follows:
| | | | | | | | |
| | | Service Fee | | �� | Distribution Fee | |
Investor A | | | 0.25 | % | | | — | |
Investor C | | | 0.25 | % | | | 0.75 | % |
Pursuant to sub-agreements with BRIL, broker-dealers and BRIL provide shareholder servicing and distribution services to the Fund. The ongoing
service and/or distribution fees compensate BRIL and each broker-dealer for providing shareholder servicing and/or distribution related services to Investor A and Investor C shareholders.
Pursuant to written agreements, certain financial intermediaries, some of which may be affiliates, provide the Fund with sub-accounting, recordkeeping, sub-transfer agency and other administrative services with respect to sub-accounts they service. For these services, these entities receive an asset based fee or an annual fee per shareholder account, which will vary depending on share class and/or net assets.
The Manager maintains a call center, which is responsible for providing certain shareholder services to the Fund, such as responding to shareholder inquiries and processing transactions based upon instructions from shareholders with respect to the subscription and redemption of Fund shares. For the six months ended July 31, 2013, the Fund reimbursed the Manager the following amounts for costs incurred in running the call center, which are included in transfer agent — class specific in the Statement of Operations:
| | | | |
Institutional | | $ | 35 | |
Investor A | | | 6 | |
Investor C | | | 4 | |
| | | | |
Total | | $ | 45 | |
| | | | |
BNY Mellon Investment Servicing (US) Inc. (“BNYMIS”) and the Manager act as co-administrators for the Fund. For these services, the co-administrators receive an administration fee computed daily and payable monthly to each administrator pursuant to separate fee arrangements, based on a percentage of the average daily net assets of the Fund. The combined administration fee, which is shown as administration in the Statement of Operations, is paid at the following annual rates:
| | | | |
| Average Daily Net Assets | | Administration Fee | |
First $500 Million | | | 0.075 | % |
$500 Million - $1 Billion | | | 0.065 | % |
Greater than $1 Billion | | | 0.055 | % |
In addition, each of the share classes is charged an administration fee, which is shown as administration — class specific in the Statement of Operations, based on the following percentages of average daily net assets of each respective class:
| | |
| Average Daily Net Assets | | Administration Fee — Class Specific |
First $500 Million | | 0.025% |
$500 Million - $1 Billion | | 0.015% |
Greater than $1 Billion | | 0.005% |
In addition, BNYMIS and the Manager may have, at their discretion, voluntarily waived all or any portion of their administration fees for the Fund or a share class which are included in administration fees waived — class specific in the Statement of Operations. For the six months ended July 31, 2013, the Manager did not receive administration fees from the Fund.
| | | | | | |
| | | BLACKROCK REAL ESTATE SECURITIES FUND | | JULY 31, 2013 | | 15 |
| | |
| Notes to Financial Statements (continued) | | |
The Manager contractually agreed to waive and/or reimburse fees or expenses, excluding interest expense, dividend expense, income tax expense, acquired fund fees and expenses and certain other Fund expenses, which constitute extraordinary expenses not incurred in the ordinary course of the Fund’s business, in order to limit expenses. The expense limitations as a percentage of average daily net assets are as follows:
| | | | |
Institutional | | | 1.05 | % |
Investor A | | | 1.30 | % |
Investor C | | | 2.05 | % |
The Manager has agreed not to reduce or discontinue this contractual waiver or reimbursement prior to June 1, 2014 unless approved by the Board, including a majority of the independent trustees.
These amounts waived or reimbursed are included in fees waived by Manager, and shown as administration fees waived — class specific, transfer agent fees waived — class specific, transfer agent fees reimbursed — class specific and expenses reimbursed by Manager, respectively, in the Statement of Operations. For the six months ended July 31, 2013, the Manager waived $24,086 of investment advisory fees, which are included in fees waived by Manager.
If during the Fund’s fiscal year the operating expenses of a share class, that at any time during the prior two fiscal years received a waiver or reimbursement from the Manager, are less than the expense limit for that share class, the Manager is entitled to be reimbursed by such share class up to the lesser of (a) the amount of fees waived or expenses reimbursed during those prior two fiscal years under the agreement and (b) the amount by which the expense limit for that share class exceeds the operating expenses of the share class for the current fiscal year, provided that: (1) the Fund, of which the share class is a part, has more than $50 million in assets for the fiscal year and (2) the Manager or an affiliate continues to serve as the Fund’s investment advisor or administrator. In the event the expense limit for a share class is changed subsequent to a fiscal year in which the Manager becomes entitled to reimbursement for fees waived or reimbursed, the amount available to reimburse the Manager shall be calculated by reference to the expense limit for that share class in effect at the time the Manager became entitled to receive such reimbursement, rather than the subsequently changed expense limit for that share class.
On July 31, 2013, the Fund level and class specific waivers and/or reimbursements subject to possible future recoupment under the expense limitation agreement are as follows:
| | | | | | | | |
| | | Expires
January 31, | |
| | | 2015 | | | 2016 | |
Fund Level | | $ | 108,960 | | | $ | 112,768 | |
Institutional | | $ | 513 | | | $ | 752 | |
Investor A | | $ | 86 | | | $ | 409 | |
Investor C | | $ | 41 | | | $ | 51 | |
For the six months ended July 31, 2013, affiliates earned underwriting discounts, direct commissions and dealer concessions on sales of the Fund’s Investor A Shares of $1,104.
For the six months ended July 31, 2013, affiliates received CDSCs as follows:
| | |
| Investor A | | Investor C |
| $4 | | $19 |
The Fund received an exemptive order from the SEC permitting it, among other things, to pay an affiliated securities lending agent a fee based on a share of the income derived from the securities lending activities and has retained BIM as the securities lending agent. BIM may, on behalf of the Fund, invest cash collateral received by the Fund for such loans in a private investment company managed by the Manager or in registered money market funds advised by the Manager or its affiliates. The market value of securities on loan and the value of the related collateral, if applicable, is shown in the Statement of Assets and Liabilities as securities loaned at value and collateral on securities loaned at value, respectively. The cash collateral invested by BIM, if any, is disclosed in the Schedule of Investments. Securities lending income is equal to the total of income earned from the reinvestment of cash collateral, net of rebates paid to, or fees paid by, borrowers of securities. The Fund retains 65% of securities lending income and pays a fee to BIM equal to 35% of such income. The Fund benefits from a borrower default indemnity provided by BlackRock. As securities lending agent, BIM bears all operational costs directly related to securities lending as well as the cost of borrower default indemnification. BIM does not receive any fees for managing the cash collateral. The share of income earned by the Fund is shown as securities lending — affiliated — net in the Statement of Operations. For the six months ended July 31, 2013, BIM received $2 in securities lending agent fees related to securities lending activities for the Fund.
Certain officers and/or trustees of the Trust are officers and/or directors of BlackRock or its affiliates. The Fund reimburses the Manager for a portion of the compensation paid to the Trust’s Chief Compliance Officer, which is included in officer and trustees in the Statement of Operations.
5. Purchases and Sales:
Purchases and sales of investments excluding short-term securities for the six months ended July 31, 2013, were $3,157,565 and $1,787,647, respectively.
6. Income Tax Information:
As of July 31, 2013, gross unrealized appreciation and gross unrealized depreciation based on cost for federal income tax purposes were as follows:
| | | | |
Tax cost | | $ | 7,042,702 | |
| | | | |
Gross unrealized appreciation | | $ | 232,521 | |
Gross unrealized depreciation | | | (163,560 | ) |
| | | | |
Net unrealized appreciation | | $ | 68,961 | |
| | | | |
| | | | | | |
| 16 | | BLACKROCK REAL ESTATE SECURITIES FUND | | JULY 31, 2013 | | |
| | |
| Notes to Financial Statements (continued) | | |
7. Bank Borrowings:
The Trust, on behalf of the Fund, along with certain other funds managed by the Manager and its affiliates (“Participating Funds”), is a party to a 364-day, $800 million credit agreement with a group of lenders, under which the Fund may borrow to fund shareholder redemptions. The agreement expires in April 2014. Excluding commitments designated for a certain individual fund, other Participating Funds, including the Fund, can borrow up to an aggregate commitment amount of $500 million, subject to asset coverage and other limitations as specified in the agreement. The credit agreement has the following terms: a fee of 0.065% per annum on unused commitment amounts and interest at a rate equal to the higher of (a) the one-month LIBOR plus 0.80% per annum or (b) the Fed Funds rate plus 0.80% per annum on amounts borrowed. Participating Funds paid administration and arrangement fees, which, along with commitment fees, were allocated among such funds based upon portions of the aggregate commitment available to them and relative net assets of Participating Funds. The Fund did not borrow under the credit agreement during the six months ended July 31, 2013.
8. Concentration, Market and Credit Risk:
In the normal course of business, the Fund invests in securities and enters into transactions where risks exist due to fluctuations in the market (market risk) or failure of the issuer of a security to meet all its obligations (issuer credit risk). Because the Fund invests in securities of a
smaller number of issuers, it may be more exposed to the risks associated with and developments affecting an individual issuer than a fund that invests more widely. The value of securities held by the Fund may decline in response to certain events, including those directly involving the issuers whose securities are owned by the Fund; conditions affecting the general economy; overall market changes; local, regional or global political, social or economic instability; and currency and interest rate and price fluctuations. Similar to issuer credit risk, the Fund may be exposed to counterparty credit risk, or the risk that an entity with which the Fund has unsettled or open transactions may fail to or be unable to perform on its commitments. The Fund manages counterparty credit risk by entering into transactions only with counterparties that it believes have the financial resources to honor their obligations and by monitoring the financial stability of those counterparties. Financial assets, which potentially expose the Fund to market, issuer and counterparty credit risks, consist principally of financial instruments and receivables due from counterparties. The extent of the Fund’s exposure to market, issuer and counterparty credit risks with respect to these financial assets is generally approximated by their value recorded in the Statement of Assets and Liabilities, less any collateral held by the Fund.
As of July 31, 2013, the Fund invested a significant portion of its assets in REITs. Changes in economic conditions affecting REITs would have a greater impact on the Fund and could affect the value, income and/or liquidity of positions in such securities.
9. Capital Share Transactions:
Transactions in capital shares for each class were as follows:
| | | | | | | | | | | | | | | | | | |
| | | Six Months Ended July 31, 2013 | | | | | Period
September 28, 20121 to January
31, 2013 | |
| | | Shares | | | Amount | | | | | Shares | | | Amount | |
Institutional | | | | | | | | | | | | | | | | | | |
Shares sold | | | 17,157 | | | $ | 195,094 | | | | | | 502,591 | | | $ | 5,027,231 | |
Shares issued in reinvestment of
dividends and distributions | | | 1,363 | | | | 15,128 | | | | | | 2,422 | | | | 23,955 | |
Shares redeemed | | | (2,259 | ) | | | (25,008 | ) | | | | | — | | | | — | |
| | | | | | | | | | |
Net increase | | | 16,261 | | | $ | 185,214 | | | | | | 505,013 | | | $ | 5,051,186 | |
| | | | | | | | | | |
| | | | | | | | | | | | | | | | | | |
Investor A | | | | | | | | | | | | | | | | | | |
Shares sold | | | 108,339 | | | $ | 1,190,797 | | | | | | 34,160 | | | $ | 357,923 | |
Shares issued in reinvestment of
dividends and distributions | | | 549 | | | | 6,091 | | | | | | 12 | | | | 116 | |
Shares redeemed | | | (12,336 | ) | | | (134,021 | ) | | | | | — | | | | — | |
| | | | | | | | | | |
Net increase | | | 96,552 | | | $ | 1,062,867 | | | | | | 34,172 | | | $ | 358,039 | |
| | | | | | | | | | |
| | 1 | Commencement of operations. |
| | | | | | |
| | | BLACKROCK REAL ESTATE SECURITIES FUND | | JULY 31, 2013 | | 17 |
| | |
| Notes to Financial Statements (concluded) | | |
| | | | | | | | | | | | | | | | | | |
| | | Six Months
Ended
July 31, 2013 | | | | | Period
September 28, 20121 to
January 31, 2013 | |
| | | Shares | | | Amount | | | | | Shares | | | Amount | |
| Investor C | | | | | | | | | | | | | | |
Shares sold | | | 26,169 | | | $ | 291,460 | | | | | | 3,251 | | | $ | 32,566 | |
Shares issued in reinvestment of dividends and distributions | | | 77 | | | | 854 | | | | | | 8 | | | | 75 | |
Shares redeemed | | | (8,739 | ) | | | (98,955 | ) | | | | | (1,001 | ) | | | (10,446 | ) |
| | | | | | | | | | |
Net increase | | | 17,507 | | | $ | 193,359 | | | | | | 2,258 | | | $ | 22,195 | |
| | | | | | | | | | |
Total Net Increase | | | 130,320 | | | $ | 1,441,440 | | | | | | 541,443 | | | $ | 5,431,420 | |
| | | | | | | | | | |
| | 1 | Commencement of operations. |
At July 31, 2013, shares owned by affiliates were as follows:
| | | | |
| | | Shares | |
Institutional | | | 499,668 | |
Investor A | | | 2,013 | |
Investor C | | | 2,006 | |
10. Subsequent Events:
Management has evaluated the impact of all subsequent events on the Fund through the date the financial statements were issued and has determined that there were no subsequent events requiring adjustment or additional disclosure in the financial statements.
| | | | | | |
| 18 | | BLACKROCK REAL ESTATE SECURITIES FUND | | JULY 31, 2013 | | |
Ronald W. Forbes, Co-Chairman of the Board and Trustee
Rodney D. Johnson, Co-Chairman of the Board and Trustee
Paul L. Audet, Trustee
David O. Beim, Trustee
Henry Gabbay, Trustee
Dr. Matina S. Horner, Trustee
Herbert I. London, Trustee
Ian A. MacKinnon, Trustee
Cynthia A. Montgomery, Trustee
Joseph P. Platt, Trustee
Robert C. Robb, Jr., Trustee
Toby Rosenblatt, Trustee
Kenneth L. Urish, Trustee
Frederick W. Winter, Trustee
John M. Perlowski, President and Chief Executive Officer
Richard Hoerner, CFA, Vice President
Brendan Kyne, Vice President
Christopher Stavrakos, CFA, Vice President
Neal Andrews, Chief Financial Officer
Jay Fife, Treasurer
Brian Kindelan, Chief Compliance Officer and Anti-Money Laundering Officer
Benjamin Archibald, Secretary
Investment Advisor and Co-Administrator
BlackRock Advisors, LLC
Wilmington, DE 19809
Sub-Advisor
BlackRock Financial Management, Inc.
New York, NY 10055
Accounting Agent, Co-Administrator and Transfer Agent
BNY Mellon Investment Servicing (US) Inc.
Wilmington, DE 19809
Custodian
The Bank of New York Mellon
New York, NY 10286
Distributor
BlackRock Investments, LLC
New York, NY 10022
Legal Counsel
Sidley Austin LLP
New York, NY 10019
Independent Registered Public Accounting Firm
Deloitte & Touche LLP
Philadelphia, PA 19103
Address of the Trust
100 Bellevue Parkway
Wilmington, DE 19809
| | | | | | |
| | | BLACKROCK REAL ESTATE SECURITIES FUND | | JULY 31, 2013 | | 19 |
Electronic Delivery
Electronic copies of most financial reports and prospectuses are available on the Fund’s website or shareholders can sign up for e-mail notifications of quarterly statements, annual and semi-annual reports and prospectuses by enrolling in the Fund’s electronic delivery program.
To enroll:
Shareholders Who Hold Accounts with Investment Advisors, Banks or Brokerages:
Please contact your financial advisor. Please note that not all investment advisors, banks or brokerages may offer this service.
Shareholders Who Hold Accounts Directly With BlackRock:
| 1) | Access the BlackRock website at |
| | http://www.blackrock.com/ edelivery |
| 2) | Select “eDelivery” under the “More Information” section |
Householding
The Fund will mail only one copy of shareholder documents, including prospectuses, annual and semi-annual reports and proxy statements, to shareholders with multiple accounts at the same address. This practice is commonly called “householding” and is intended to reduce expenses and eliminate duplicate mailings of shareholder documents. Mailings of your shareholder documents may be householded indefinitely unless you instruct us otherwise. If you do not want the mailing of these documents to be combined with those for other members of your household, please call the Fund at (800) 441-7762.
Availability of Quarterly Schedule of Investments
The Fund files its complete schedule of portfolio holdings with the SEC for the first and third quarters of each fiscal year on Form N-Q. The Fund’s Forms N-Q are available on the SEC’s website at
http:// www.sec.gov and may also be reviewed and copied at the SEC’s Public Reference Room in Washington, D.C. Information on how to access documents on the SEC’s website without charge may be obtained by calling (800) SEC-0330. The Fund’s Forms N-Q may also be obtained upon request and without charge by calling (800) 441-7762.
Availability of Proxy Voting Policies and Procedures
A description of the policies and procedures that the Fund uses to determine how to vote proxies relating to portfolio securities is available (1) without charge, upon request, by calling (800)
441-7762; (2) at http://www.blackrock.com; and (3) on the SEC’s website at http:// www.sec.gov.
Availability of Proxy Voting Record
Information about how the Fund voted proxies relating to securities held in the Fund’s portfolio during the most recent 12-month period ended June 30 is available upon request and without charge (1) at http:// www.blackrock.com or by calling (800) 441-7762 and (2) on the SEC’s website at http://www.sec.gov.
Account Information
Call us at (800) 441-7762 from 8:00 AM to 6:00 PM EST on any business day to get information about your account balances, recent transactions and share prices. You can also reach us on the Web at http:// www.blackrock.com/funds.
Automatic Investment Plans
Investor Class shareholders who want to invest regularly can arrange to have $50 or more automatically deducted from their checking or savings account and invested in any of the BlackRock funds.
Systematic Withdrawal Plan
Investor Class shareholders can establish a systematic withdrawal plan and receive periodic payments of $50 or more from their BlackRock funds, as long as their account balance is at least $10,000.
Retirement Plans
Shareholders may make investments in conjunction with Traditional, Rollover, Roth, Coverdell, Simple IRAs, SEP IRAs and 403(b) Plans.
| | | | | | |
| 20 | | BLACKROCK REAL ESTATE SECURITIES FUND | | JULY 31, 2013 | | |
| | |
| Additional Information (concluded) | | |
|
| BlackRock Privacy Principles |
BlackRock is committed to maintaining the privacy of its current and former fund investors and individual clients (collectively, “Clients”) and to safeguarding their non-public personal information. The following information is provided to help you understand what personal information BlackRock collects, how we protect that information and why in certain cases we share such information with select parties.
If you are located in a jurisdiction where specific laws, rules or regulations require BlackRock to provide you with additional or different privacy-related rights beyond what is set forth below, then BlackRock will comply with those specific laws, rules or regulations.
BlackRock obtains or verifies personal non-public information from and about you from different sources, including the following: (i) information we receive from you or, if applicable, your financial intermediary, on applications, forms or other documents; (ii) information about your transactions with us, our affiliates, or others; (iii) information we receive from a consumer reporting agency; and (iv) from visits to our websites.
BlackRock does not sell or disclose to non-affiliated third parties any non-public personal information about its Clients, except as permitted by law or as is necessary to respond to regulatory requests or to service Client accounts. These non-affiliated third parties are required to protect the confidentiality and security of this information and to use it only for its intended purpose.
We may share information with our affiliates to service your account or to provide you with information about other BlackRock products or services that may be of interest to you. In addition, BlackRock restricts access to non-public personal information about its Clients to those BlackRock employees with a legitimate business need for the information. BlackRock maintains physical, electronic and procedural safeguards that are designed to protect the non-public personal information of its Clients, including procedures relating to the proper storage and disposal of such information.
| | | | | | |
| | | BLACKROCK REAL ESTATE SECURITIES FUND | | JULY 31, 2013 | | 21 |
| | |
| A World-Class Mutual Fund Family | | |
BlackRock offers a diverse lineup of open-end mutual funds crossing all investment styles and managed by experts in equity, fixed income and tax-exempt investing.
| | | | |
| BlackRock ACWI ex-US Index Fund | | BlackRock Global Dividend Portfolio | | BlackRock Mid-Cap Growth Equity Portfolio |
| BlackRock All-Cap Energy & Resources Portfolio | | BlackRock Global Long/Short Equity Fund | | BlackRock Mid-Cap Value Opportunities Fund |
| BlackRock Basic Value Fund | | BlackRock Global Opportunities Portfolio | | BlackRock Natural Resources Trust |
| BlackRock Capital Appreciation Fund | | BlackRock Global SmallCap Fund | | BlackRock Pacific Fund |
| BlackRock Commodity Strategies Fund | | BlackRock Health Sciences Opportunities Portfolio | | BlackRock Real Estate Securities Fund |
| BlackRock Disciplined Small Cap Core Fund | | BlackRock India Fund | | BlackRock Russell 1000 Index Fund |
| BlackRock Emerging Markets Dividend Fund | | BlackRock International Fund | | BlackRock Science & Technology Opportunities Portfolio |
| BlackRock Emerging Markets Fund | | BlackRock International Index Fund | | BlackRock Small Cap Growth Equity Portfolio |
| BlackRock Emerging Markets Long/Short Equity Fund | | BlackRock International Opportunities Portfolio | | BlackRock Small Cap Growth Fund II |
| BlackRock Energy & Resources Portfolio | | BlackRock Large Cap Core Fund | | BlackRock Small Cap Index Fund |
| BlackRock Equity Dividend Fund | | BlackRock Large Cap Core Plus Fund | | BlackRock S&P 500 Stock Fund |
| BlackRock EuroFund | | BlackRock Large Cap Growth Fund | | BlackRock U.S. Opportunities Portfolio |
| BlackRock Flexible Equity Fund | | BlackRock Large Cap Value Fund | | BlackRock Value Opportunities Fund |
| BlackRock Focus Growth Fund | | BlackRock Latin America Fund | | BlackRock World Gold Fund |
| | BlackRock Long-Horizon Equity Fund | | |
|
| Taxable Fixed Income Funds |
| | | | |
| BlackRock Bond Index Fund | | BlackRock High Yield Bond Portfolio | | BlackRock Short-Term Treasury Fund |
| BlackRock Core Bond Portfolio | | BlackRock Inflation Protected Bond Portfolio | | BlackRock Strategic Income Opportunities Portfolio |
| BlackRock CoreAlpha Bond Fund | | BlackRock International Bond Portfolio | | BlackRock Total Return Fund |
| BlackRock Emerging Market Local Debt Portfolio | | BlackRock Investment Grade Bond Portfolio | | BlackRock U.S. Government Bond Portfolio |
| BlackRock Floating Rate Income Portfolio | | BlackRock Low Duration Bond Portfolio | | BlackRock U.S. Mortgage Portfolio |
| BlackRock Global Long/Short Credit Fund | | BlackRock Secured Credit Portfolio | | BlackRock Ultra-Short Obligations Fund |
| BlackRock GNMA Portfolio | | BlackRock Short Obligations Fund | | BlackRock World Income Fund |
| | | | |
|
| Municipal Fixed Income Funds |
| | | | |
| BlackRock California Municipal Bond Fund | | BlackRock National Municipal Fund | | BlackRock Pennsylvania Municipal Bond Fund |
| BlackRock High Yield Municipal Fund | | BlackRock New Jersey Municipal Bond Fund | | BlackRock Short-Term Municipal Fund |
| BlackRock Intermediate Municipal Fund | | BlackRock New York Municipal Bond Fund | | |
| | | | | | | | | | | | | | |
| BlackRock Balanced Capital Fund | | LifePath Active Portfolios | | LifePath Index Portfolios |
| BlackRock Emerging Market Allocation Portfolio | | 2015 | | | 2040 | | | | | Retirement | | 2040 | | |
| BlackRock Global Allocation Fund | | 2020 | | | 2045 | | | | | 2020 | | 2045 | | |
| BlackRock Managed Volatility Portfolio | | 2025 | | | 2050 | | | | | 2025 | | 2050 | | |
| BlackRock Multi-Asset Income Portfolio | | 2030 | | | 2055 | | | | | 2030 | | 2055 | | |
| BlackRock Multi-Asset Real Return Fund | | 2035 | | | | | | | | 2035 | | | | |
| BlackRock Strategic Risk Allocation Fund | | | | | | | | | | | | | | |
| | | | | | |
| BlackRock Prepared Portfolios | | LifePath Portfolios | | | | | | | | | | | | |
Conservative Prepared Portfolio | | Retirement | | | 2040 | | | | | | | | | |
Moderate Prepared Portfolio | | 2020 | | | 2045 | | | | | | | | | |
Growth Prepared Portfolio | | 2025 | | | 2050 | | | | | | | | | |
Aggressive Growth Prepared Portfolio | | 2030 | | | 2055 | | | | | | | | | |
| | 2035 | | | | | | | | | | | | |
BlackRock mutual funds are currently distributed by BlackRock Investments, LLC. You should consider the investment objectives, risks, charges and expenses of the funds under consideration carefully before investing. Each fund’s prospectus contains this and other information and is available at www.blackrock.com or by calling (800) 441-7762 or from your financial advisor. The prospectus should be read carefully before investing.
| | | | | | |
| 22 | | BLACKROCK FUNDS | | JULY 31, 2013 | | |
| | |
| This report is transmitted to shareholders only. It is not authorized for use as an offer of sale or a solicitation of an offer to buy shares of the Fund unless accompanied or preceded by the Fund’s current prospectus. Past performance results shown in this report should not be considered a representation of future performance. Investment returns and principal value of shares will fluctuate so that shares, when redeemed, may be worth more or less than their original cost. Statements and other information herein are as dated and are subject to change. | |  |
| | |
| REALES-7/13-SAR | |  |
| | |
| |
| Item 2 – | | Code of Ethics – Not Applicable to this semi-annual report |
| |
| Item 3 – | | Audit Committee Financial Expert – Not Applicable to this semi-annual report |
| |
| Item 4 – | | Principal Accountant Fees and Services – Not Applicable to this semi-annual report |
| |
| Item 5 – | | Audit Committee of Listed Registrants – Not Applicable |
| |
| Item 6 – | | Investments |
| | (a) The registrant’s Schedule of Investments is included as part of the Report to Stockholders filed under Item 1 of this Form. |
| | (b) Not Applicable due to no such divestments during the semi-annual period covered since the previous Form N-CSR filing. |
| |
| Item 7 – | | Disclosure of Proxy Voting Policies and Procedures for Closed-End Management Investment Companies – Not Applicable |
| |
| Item 8 – | | Portfolio Managers of Closed-End Management Investment Companies – Not Applicable |
| |
| Item 9 – | | Purchases of Equity Securities by Closed-End Management Investment Company and Affiliated Purchasers – Not Applicable |
| |
| Item 10 – | | Submission of Matters to a Vote of Security Holders –There have been no material changes to these procedures. |
| |
| Item 11 – | | Controls and Procedures |
| |
| | (a) – The registrant’s principal executive and principal financial officers, or persons performing similar functions, have concluded that the registrant’s disclosure controls and procedures (as defined in Rule 30a-3(c) under the Investment Company Act of 1940, as amended (the “1940 Act”)) are effective as of a date within 90 days of the filing of this report based on the evaluation of these controls and procedures required by Rule 30a-3(b) under the 1940 Act and Rule 15d-15(b) under the Securities Exchange Act of 1934, as amended. |
| |
| | (b) – There were no changes in the registrant’s internal control over financial reporting (as defined in Rule 30a-3(d) under the 1940 Act) that occurred during the second fiscal quarter of the period covered by this report that have materially affected, or are reasonably likely to materially affect, the registrant’s internal control over financial reporting. |
| |
| Item 12 – | | Exhibits attached hereto |
| |
| | (a)(1) – Code of Ethics – Not Applicable to this semi-annual report |
| |
| | (a)(2) – Certifications – Attached hereto |
| |
| | (a)(3) – Not Applicable |
| |
| | (b) – Certifications – Attached hereto |
2
Pursuant to the requirements of the Securities Exchange Act of 1934 and the Investment Company Act of 1940, the registrant has duly caused this report to be signed on its behalf by the undersigned, thereunto duly authorized.
| | |
| BlackRock Funds |
| |
| By: | | /s/ John M. Perlowski |
| | John M. Perlowski |
| | Chief Executive Officer (principal executive officer) of |
| | BlackRock Funds |
| |
| Date: | | October 2, 2013 |
Pursuant to the requirements of the Securities Exchange Act of 1934 and the Investment Company Act of 1940, this report has been signed below by the following persons on behalf of the registrant and in the capacities and on the dates indicated.
| | |
| By: | | /s/ John M. Perlowski |
| | John M. Perlowski |
| | Chief Executive Officer (principal executive officer) of |
| | BlackRock Funds |
|
| Date: October 2, 2013 |
| |
| By: | | /s/ Neal J. Andrews |
| | Neal J. Andrews |
| | Chief Financial Officer (principal financial officer) of |
| | BlackRock Funds |
|
| Date: October 2, 2013 |
3