UNITED STATES
SECURITIES AND EXCHANGE COMMISSION
Washington, D.C. 20549
FORM N-CSR
CERTIFIED SHAREHOLDER REPORT OF REGISTERED MANAGEMENT INVESTMENT COMPANIES
Investment Company Act file number: 811-05742
Name of Fund: BlackRock Funds
BlackRock Disciplined Small Cap Core Fund
Fund Address: 100 Bellevue Parkway, Wilmington, DE 19809
Name and address of agent for service: John M. Perlowski, Chief Executive Officer, BlackRock Funds, 55 East 52nd Street, New York, NY 10055
Registrant’s telephone number, including area code: (800) 441-7762
Date of fiscal year end: 05/31/2014
Date of reporting period: 11/30/2013
Item 1 – Report to Stockholders
NOVEMBER 30, 2013
| | | | |
SEMI-ANNUAL REPORT (UNAUDITED) | | | | BLACKROCK® |
| | | | |
| | BlackRock Disciplined Small Cap Core Fund | | of BlackRock FundsSM |
| | | | |
| | BlackRock Small Cap Growth Fund II | | of BlackRock Series, Inc. |
| | |
| Not FDIC Insured ¡ May Lose Value ¡ No Bank Guarantee | | |
| | | | | | |
| 2 | | SEMI-ANNUAL REPORT | | NOVEMBER 30, 2013 | | |
Dear Shareholder
Financial markets ended 2012 with heightened volatility driven by Congressional budget battles and worries about the future of US fiscal policy and its potential effect on economic growth. However, a New Year’s Day tax deal averted the so-called “fiscal cliff,” bringing relief to investors and allowing markets to get off to a strong start in 2013. Money that had been held on the sidelines amid tax-rate uncertainty poured back into the markets in January. Key indicators signaling modest but broad-based improvements in the world’s major economies fostered an aura of comfort for investors. Global equities surged, while rising US Treasury yields pressured high-quality fixed income assets. (Bond prices fall when yields rise.)
Global economic momentum slowed in February, however, and the pace of the rally moderated. In the months that followed, US stocks outperformed international stocks, as the US showed greater stability compared to most other regions. Slow, but positive, growth was sufficient to support corporate earnings, while uncomfortably high unemployment reinforced expectations that the Federal Reserve would continue its accommodative monetary policies. International markets experienced higher levels of volatility given a resurgence of political instability in Italy, a banking crisis in Cyprus and a generally poor outlook for European economies, many of which were mired in recession. Emerging markets significantly lagged the rest of the world as growth in these economies, particularly in China and Brazil, fell short of expectations.
In May, after Fed Chairman Bernanke commented on the possibility of reducing — or “tapering” — the central bank’s asset purchase programs, investors broadly retreated from risk assets as they interpreted his remarks as signaling the imminent end of a program that had greatly supported markets. Investors returned in late June, however, when the Fed’s tone turned more dovish, and improving economic indicators and better corporate earnings helped extend gains through July.
Markets slumped again in August as investors became wary of looming risks. Mixed economic data stoked worries about global growth and uncertainty about when and how much the Fed would scale back on stimulus. Also concerning was the escalation of the revolution in Egypt and the civil war in Syria, events that fueled higher oil prices, an additional headwind for global economic growth.
September was surprisingly positive for investors, thanks to the easing of several of these key risks. Most important, the Fed defied market expectations with its decision to delay tapering. On the geopolitical front, turmoil in Egypt and Syria subsided. In Europe, the re-election of Angela Merkel as Chancellor of Germany was welcomed as a continuation of the status quo. Higher volatility returned in late September when the Treasury Department warned that the US national debt would soon breach its statutory maximum. Political brinksmanship led to a partial government shutdown, roiling global financial markets through the first half of October, but the rally quickly resumed when politicians engineered a compromise to reopen the government and extend the debt ceiling until early 2014. Investors focused on strong corporate earnings, although the results were largely attributable to lower operational costs more than revenue growth. Economic data continued to be mixed and inflation remained low, affording the Fed significant latitude in its monetary policy decisions. Investors found additional reassurance in Fed Chair-to-be Janet Yellen affirming the benefits of maintaining loose liquidity conditions while attempting to bolster economic growth.
Despite the persistence of many uncertainties, global central bank support continued to help drive outperformance in riskier asset classes versus lower-risk investments. Developed market equities generated the highest returns for the six- and 12-month periods ended November 30, with particular strength coming from US small-cap stocks. Emerging markets posted smaller, albeit positive, returns after struggling with slowing growth and weakening currencies in the first half of 2013. Rising interest rates resulted in poor performance for US Treasury bonds and other higher-quality sectors such as tax-exempt municipals and investment grade corporate bonds. High yield bonds, on the other hand, moved higher as income-oriented investors sought meaningful returns in the low-rate environment. Short-term interest rates remained near zero, keeping yields on money market securities near historical lows.
At BlackRock, we believe investors need to think globally and extend their scope across a broader array of asset classes and be prepared to move freely as market conditions change over time. We encourage you to talk with your financial advisor and visit www.blackrock.com for further insight about investing in today’s world.
Sincerely,

Rob Kapito
President, BlackRock Advisors, LLC

“Despite the persistence of many uncertainties, global central bank support continued to help drive outperformance in riskier asset classes versus lower-risk investments.”
Rob Kapito
President, BlackRock Advisors, LLC
| | | | | | | | |
| Total Returns as of November 30, 2013 | |
| | | 6-month | | | 12-month | |
US large cap equities
(S&P 500® Index) | | | 11.91 | % | | | 30.30 | % |
US small cap equities
(Russell 2000® Index) | | | 16.91 | | | | 40.99 | |
International equities
(MSCI Europe, Australasia, Far East Index) | | | 12.07 | | | | 24.84 | |
Emerging market equities
(MSCI Emerging Markets Index) | | | 2.33 | | | | 3.66 | |
3-month Treasury bill
(BofA Merrill Lynch
3-Month US Treasury
Bill Index) | | | 0.03 | | | | 0.08 | |
US Treasury securities
(BofA Merrill Lynch
10- Year US Treasury
Index) | | | (3.70 | ) | | | (6.95 | ) |
US investment grade
bonds (Barclays US
Aggregate Bond Index) | | | (0.56 | ) | | | (1.61 | ) |
Tax-exempt municipal
bonds (S&P Municipal Bond Index) | | | (2.73 | ) | | | (3.57 | ) |
US high yield bonds
(Barclays US Corporate
High Yield 2% Issuer
Capped Index) | | | 2.61 | | | | 8.54 | |
|
| Past performance is no guarantee of future results. Index performance is shown for illustrative purposes only. You cannot invest directly in an index. | |
| | | | | | |
| | | THIS PAGE NOT PART OF YOUR FUND REPORT | | | | 3 |
| | | | |
| Fund Summary as of November 30, 2013 | | | BlackRock Disciplined Small Cap Core Fund | |
BlackRock Disciplined Small Cap Core Fund’s (the “Fund”) investment objective is to seek capital appreciation over the long term.
|
| Portfolio Management Commentary |
How did the Fund perform?
| Ÿ | | For the six-month period ended November 30, 2013, the Fund’s Institutional Shares outperformed the Fund’s benchmark, the Russell 2000® Index, while the Fund’s Investor A Shares performed in line, and the Investor C Shares underperformed the benchmark. |
What factors influenced performance?
| Ÿ | | Stock selection within the industrials, materials and financial sectors contributed positively to the Fund’s performance for the period. Most notably, within industrials, aircraft parts manufacturer AAR Corp. was the Fund’s strongest-performing holding. Despite posting underwhelming earnings and missing revenue expectations during the period, the stock moved higher on the back of numerous new contract wins and the government debt ceiling resolution in October. In the materials sector, paper and packaging company Boise Cascade Co. rallied in September after the Packaging Corp. of America announced its agreement to buy the company. In financials, shares of bank holding company Sterling Financial Corp. jumped after Oregon’s biggest bank Umpqua Holdings Corp. agreed to buy the company. |
| Ÿ | | Conversely, stock selection within consumer discretionary, health care and information technology (“IT”) detracted from the Fund’s performance relative to the benchmark index. Within the consumer discretionary sector, a position in Sears Hometown and Outlet Stores, Inc. was the worst performer due to weak sales numbers. In health care, an underweight position in Alnylam Pharmaceuticals, Inc. detracted from relative results as the stock rallied after reporting positive results in an early trial of a new treatment for heart weakness. Within IT, a position in internet travel agent Travelzoo, Inc. hurt returns after the company’s third-quarter revenue report fell short of analyst estimates. |
Describe recent portfolio activity.
| Ÿ | | During the six-month period, the Fund increased its weighting in the IT sector and decreased exposure to materials. |
Describe portfolio positioning at period end.
| Ÿ | | Relative to the Russell 2000® Index, the Fund ended the period with its most significant sector overweight in IT and underweight in financials. |
The views expressed reflect the opinions of BlackRock as of the date of this report and are subject to change based on changes in market, economic or other conditions. These views are not intended to be a forecast of future events and are no guarantee of future results.
| | |
| Ten Largest Holdings | | Percent of
Long-Term
Investments |
| | | | |
Aspen Technology, Inc. | | | 1 | % |
Manhattan Associates, Inc. | | | 1 | |
Ryder System, Inc. | | | 1 | |
First Citizens BancShares, Inc., Class A | | | 1 | |
VCA Antech, Inc. | | | 1 | |
Avista Corp. | | | 1 | |
Thoratec Corp. | | | 1 | |
John Bean Technologies Corp. | | | 1 | |
CNO Financial Group, Inc. | | | 1 | |
PS Business Parks, Inc. | | | 1 | |
| | |
| Sector Allocation | | Percent of
Long-Term
Investments |
| | | | |
Financials | | | 22 | % |
Information Technology | | | 19 | |
Industrials | | | 16 | |
Consumer Discretionary | | | 14 | |
Health Care | | | 13 | |
Energy | | | 5 | |
Consumer Staples | | | 4 | |
Materials | | | 4 | |
Utilities | | | 2 | |
Telecommunication Services | | | 1 | |
For Fund compliance purposes, the Fund’s sector classifications refer to any one or more of the sector sub-classifications used by one or more widely recognized market indexes or ratings group indexes, and/or as defined by the investment advisor. These definitions may not apply for purposes of this report, which may combine such sector sub-classifications for reporting ease.
| | | | | | |
| 4 | | SEMI-ANNUAL REPORT | | NOVEMBER 30, 2013 | | |
| | | | |
| | | | BlackRock Disciplined Small Cap Core Fund | |
|
| Total Return Based on a $10,000 Investment |
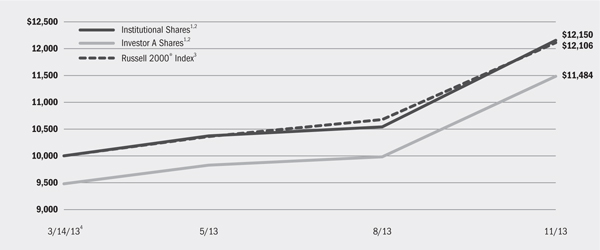
| | 1 | Assuming maximum sales charges, if any, transaction costs and other operating expenses, including investment advisory fees and administration fees, if any. Institutional Shares do not have a sales charge. |
| | 2 | Under normal circumstances, the Fund seeks to invest at least 80% of its net assets plus any borrowings for investment purposes in equity securities or other financial instruments that are components of, or have market capitalizations similar to, the securities included in the Russell 2000® Index. |
| | 3 | An index that measures the performance of approximately 2,000 of the smallest companies in the Russell 3000® Index. |
| | 4 | Commencement of operations. |
| | | | | | | | | | | | |
| Performance Summary for the Period Ended November 30, 2013 | | | | | | | | | | | | |
| | | | | | Aggregate Total Returns5 | |
| | | | | | Since Inception6 | |
| | | 6-Month
Total Returns | | | w/o sales
charge | | | w/ sales
charge | |
Institutional | | | 17.17 | % | | | 21.50 | % | | | N/A | |
Investor A. | | | 16.88 | | | | 21.20 | | | | 14.84 | % |
Investor C | | | 16.52 | | | | 20.60 | | | | 19.60 | % |
Russell 2000® Index | | | 16.91 | | | | 21.06 | | | | N/A | |
| | 5 | Assuming maximum sales charges, if any. Aggregate total returns with and without sales charges reflect reductions for distribution and service fees. See “About Fund Performance” on page 8 for a detailed description of share classes, including any related sales charges and fees. |
| | 6 | The Fund commenced operations on March 14, 2013. |
| | | N/A—Not applicable as share class and index do not have a sales charge. |
| | | Past performance is not indicative of future results. |
| | | | | | | | | | | | | | |
| Expense Example |
| | | Actual | | Hypothetical8 | | |
| | | Beginning
Account Value
June 1, 2013 | | Ending
Account Value
November 30, 2013 | | Expenses Paid
During the Period7 | | Beginning
Account Value
June 1, 2013 | | Ending
Account Value
November 30, 2013 | | Expenses Paid
During the Period7 | | Annualized
Expense Ratio |
Institutional | | $1,000.00 | | $1,171.70 | | $3.87 | | $1,000.00 | | $1,021.51 | | $3.60 | | 0.71% |
Investor A | | $1,000.00 | | $1,168.80 | | $5.22 | | $1,000.00 | | $1,020.26 | | $4.86 | | 0.96% |
Investor C | | $1,000.00 | | $1,165.20 | | $9.28 | | $1,000.00 | | $1,016.50 | | $8.64 | | 1.71% |
| | 7 | For each class of the Fund, expenses are equal to the annualized expense ratio for the class, multiplied by the average account value over the period, multiplied by 183/365 (to reflect the one-half year period shown). |
| | 8 | Hypothetical 5% annual return before expenses is calculated by pro rating the number of days in the most recent half year divided by 365. |
| | | See “Disclosure of Expenses” on page 8 for further information on how expenses were calculated. |
| | | | | | |
| | | SEMI-ANNUAL REPORT | | NOVEMBER 30, 2013 | | 5 |
| | | | |
| Fund Summary as of November 30, 2013 | | | BlackRock Small Cap Growth Fund II | |
BlackRock Small Cap Growth Fund II’s (the “Fund”) investment objective is to seek long-term capital growth. In other words, the Fund tries to choose investments that will increase in value. Current income from dividends and interest will not be an important consideration in selecting portfolio securities.
|
| Portfolio Management Commentary |
How did the Fund perform?
| Ÿ | | For the six-month period ended November 30, 2013, through its investment in BlackRock Master Small Cap Growth Portfolio (the “Master Portfolio”), the Fund outperformed its benchmark, the Russell 2000® Growth Index. |
What factors influenced performance?
| Ÿ | | The Master Portfolio’s positions within the health care and industrials sectors contributed positively to performance. Most notably, in health care, shares of biopharmaceutical company Gentium SpA rocketed higher after the firm’s vascular drug Defibrotide (Defitelio) received a positive opinion from the European Medicines Agency in July. Within industrials, consumer finance company WageWorks, Inc. appreciated significantly over the period after reporting better-than-expected second-quarter earnings and a strong forecast. The announcement of a strategic alliance with benefits provider Ceridian Corp. also helped drive WageWorks, Inc. stock higher during the period. |
| Ÿ | | Conversely, the Master Portfolio’s positions in information technology (“IT”), telecommunication services (“telecom”) and energy detracted from relative returns. In the IT sector, shares of motion picture 3D |
| | | systems company RealD, Inc. fell considerably over the period on the back of waning 3D movie box office sales and negative 3D sales forecasts from industry analysts. In telecom, carrier Cbeyond, Inc. sold off heavily in August after the company reported weak second-quarter earnings and lowered its 2013 revenue forecast. Within energy, shares of refining company Delek US Holdings, Inc. declined substantially after the company announced disappointing earnings in late August and reported weakness in the oil refining market. |
Describe recent portfolio activity.
| Ÿ | | During the six-month period, the Master Portfolio increased its overall weighting in the IT and industrials sectors and decreased its weighting in financials and consumer discretionary. In health care, the Master Portfolio pared down its exposure to Gentium SpA by taking profits on the stock’s very strong performance during the period. |
Describe portfolio positioning at period end.
| Ÿ | | Relative to the Russell 2000® Growth Index, the Master Portfolio ended the period with its largest sector overweights in IT and industrials and its most significant underweights in financials and consumer discretionary. |
The views expressed reflect the opinions of BlackRock as of the date of this report and are subject to change based on changes in market, economic or other conditions. These views are not intended to be a forecast of future events and are no guarantee of future results.
| | | | | | |
| 6 | | SEMI-ANNUAL REPORT | | NOVEMBER 30, 2013 | | |
| | | | |
| | | | BlackRock Small Cap Growth Fund II | |
|
| Total Return Based on a $10,000 Investment |
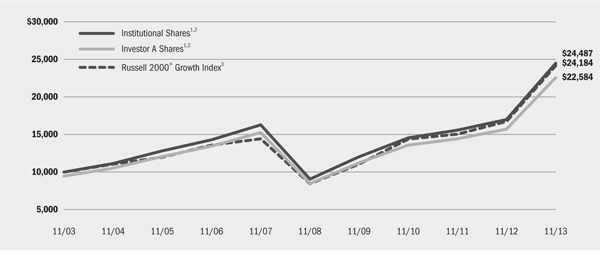
| | 1 | Assuming maximum sales charges, if any, transaction costs and other operating expenses, including administration fees, if any. Institutional Shares do not have a sales charge. |
| | 2 | The Fund invests all of its assets in the Master Portfolio. The Master Portfolio, under normal circumstances, invests at least 80% of its net assets (plus any borrowings for investment purposes) in equity securities of small cap companies and at least 80% of its net assets (plus any borrowings for investment purposes) in securities or instruments of issuers located in the United States. |
| | 3 | The index contains those securities with greater-than-average growth orientations, generally having higher price-to-book and price-to-earnings ratios. |
| | | | | | | | | | | | | | | | | | | | | | | | | | | | |
| Performance Summary for the Period Ended November 30, 2013 | |
| | | | | | Average Annual Total Returns4 | |
| | | | | | 1 Year | | | 5 Years | | | 10 Years | |
| | | 6-Month
Total Returns | | | w/o sales
charge | | | w/ sales
charge | | | w/o sales
charge | | | w/ sales
charge | | | w/o sales
charge | | | w/ sales
charge | |
Institutional | | | 22.39 | % | | | 44.08 | % | | | N/A | | | | 21.92 | % | | | N/A | | | | 9.37 | % | | | N/A | |
Investor A | | | 22.12 | | | | 43.47 | | | | 35.94 | % | | | 21.57 | | | | 20.27 | % | | | 9.07 | | | | 8.49 | % |
Investor B | | | 21.54 | | | | 42.00 | | | | 37.50 | | | | 20.14 | | | | 19.95 | | | | 8.19 | | | | 8.19 | |
Investor C | | | 21.65 | | | | 42.25 | | | | 41.25 | | | | 20.38 | | | | 20.38 | | | | 8.08 | | | | 8.08 | |
Class R | | | 22.07 | | | | 43.22 | | | | N/A | | | | 21.13 | | | | N/A | | | | 8.70 | | | | N/A | |
Russell 2000® Growth Index | | | 18.83 | | | | 44.47 | | | | N/A | | | | 23.38 | | | | N/A | | | | 9.23 | | | | N/A | |
| | 4 | Assuming maximum sales charges, if any. Average annual total returns with and without sales charges reflect reductions for distribution and service fees. See “About Fund Performance” on page 8 for a detailed description of share classes, including any related sales charges and fees. |
| | | N/A—Not applicable as share class and index do not have a sales charge. |
| | | Past performance is not indicative of future results. |
| | | | | | | | | | | | | | |
| Expense Example |
| | | Actual | | Hypothetical6 | | |
| | | Beginning
Account Value
June 1, 2013 | | Ending
Account Value
November 30, 2013 | | Expenses Paid
During the Period5 | | Beginning
Account Value
June 1, 2013 | | Ending
Account Value
November 30, 2013 | | Expenses Paid
During the Period5 | | Annualized Expense Ratio |
Institutional | | $1,000.00 | | $1,223.90 | | $6.19 | | $1,000.00 | | $1,019.50 | | $5.62 | | 1.11% |
Investor A | | $1,000.00 | | $1,221.20 | | $8.58 | | $1,000.00 | | $1,017.35 | | $7.79 | | 1.54% |
Investor B | | $1,000.00 | | $1,215.40 | | $14.50 | | $1,000.00 | | $1,011.98 | | $13.16 | | 2.61% |
Investor C | | $1,000.00 | | $1,216.50 | | $12.84 | | $1,000.00 | | $1,013.49 | | $11.66 | | 2.31% |
Class R | | $1,000.00 | | $1,220.70 | | $9.46 | | $1,000.00 | | $1,016.55 | | $8.59 | | 1.70% |
| | 5 | For each class of the Fund, expenses are equal to the annualized expense ratio for the class, multiplied by the average account value over the period, multiplied by 183/365 (to reflect the one-half year period shown). Because the Fund invests all of its assets in the Master Portfolio, the expense table reflects the net expenses of both the Fund and the Master Portfolio in which it invests. |
| | 6 | Hypothetical 5% annual return before expenses is calculated by pro rating the number of days in the most recent fiscal half year divided by 365. |
| | | See “Disclosure of Expenses” on page 8 for further information on how expenses were calculated. |
| | | | | | |
| | | SEMI-ANNUAL REPORT | | NOVEMBER 30, 2013 | | 7 |
| Ÿ | | Institutional Shares are not subject to any sales charge. These shares bear no ongoing distribution or service fees and are available only to certain eligible investors. |
| Ÿ | | Investor A Shares are subject to a maximum initial sales charge (front- end load) of 5.25% and a service fee of 0.25% per year (but no distribution fee). Certain redemptions of these shares may be subject to a contingent deferred sales charge (“CDSC”) where no initial sales charge was paid at the time of purchase. |
| Ÿ | | Investor B Shares (available only in BlackRock Small Cap Growth Fund II) are subject to a maximum CDSC of 4.50% declining to 0% after six years. In addition, these shares are subject to a distribution fee of 0.75% per year and a service fee of 0.25% per year. These shares automatically convert to Investor A Shares after approximately eight years. (There is no initial sales charge for automatic share conversions.) All returns for periods greater than eight years reflect this conversion. These shares are only available through exchanges and dividend reinvestments by current holders and for purchase by certain employer-sponsored retirement plans. |
| Ÿ | | Investor C Shares are subject to a 1.00% CDSC if redeemed within one year of purchase. In addition, these shares are subject to a distribution fee of 0.75% per year and a service fee of 0.25% per year. |
| Ÿ | | Class R Shares (available only in BlackRock Small Cap Growth Fund II) are not subject to any sales charge. These shares are subject to a distribution fee of 0.25% per year and a service fee of 0.25% per year. These shares are available only to certain employer-sponsored retirement plans. |
Performance information reflects past performance and does not guarantee future results. Current performance may be lower or higher than the performance data quoted. Refer to www.blackrock.com/funds to obtain performance data current to the most recent month end. Performance results do not reflect the deduction of taxes that a shareholder would pay on fund distributions or the redemption of fund shares. Figures shown in each of the performance tables on the previous pages assume reinvestment of all dividends and distributions, if any, at net asset value (“NAV”) on the ex-dividend dates. Investment return and principal value of shares will fluctuate so that shares, when redeemed, may be worth more or less than their original cost. Dividends paid to each class of shares will vary because of the different levels of service, distribution and transfer agency fees applicable to each class, which are deducted from the income available to be paid to shareholders.
BlackRock Advisors, LLC (the “Manager”), BlackRock Disciplined Small Cap Core Fund’s investment advisor, waived and/or reimbursed a portion of the Fund’s expenses. Without such waiver and/or reimbursement, the Fund’s performance would have been lower. The Manager is under no obligation to waive or reimburse or to continue waiving or reimbursing its fees after the applicable termination date. See Note 5 of the Notes to Financial Statements for additional information on waivers and reimbursements.
Shareholders of the Funds may incur the following charges: (a) transactional expenses, such as sales charges and (b) operating expenses, including administration fees, investment advisory fees, service and distribution fees, including 12b-1 fees, acquired fund fees and expenses, and other Fund expenses. The expense examples shown on the previous pages (which are based on a hypothetical investment of $1,000 invested on June 1, 2013 and held through November 30, 2013) are intended to assist shareholders both in calculating expenses based on an investment in each Fund and in comparing these expenses with similar costs of investing in other mutual funds.
The expense examples provide information about actual account values and actual expenses. In order to estimate the expenses a shareholder paid during the period covered by this report, shareholders can divide their account value by $1,000 and then multiply the result by the number corresponding to their Fund and share class under the headings entitled “Expenses Paid During the Period.”
The expense examples also provide information about hypothetical account values and hypothetical expenses based on a Fund’s actual expense ratio and an assumed rate of return of 5% per year before expenses. In order to assist shareholders in comparing the ongoing expenses of investing in these Funds and other funds, compare the 5% hypothetical example with the 5% hypothetical examples that appear in other funds’ shareholder reports.
The expenses shown in the expense examples are intended to highlight shareholders’ ongoing costs only and do not reflect any transactional expenses, such as sales charges, if any. Therefore, the hypothetical examples are useful in comparing ongoing expenses only, and will not help shareholders determine the relative total expenses of owning different funds. If these transactional expenses were included, shareholder expenses would have been higher.
|
| Derivative Financial Instruments |
BlackRock Disciplined Small Cap Core Fund and the Master Portfolio may invest in various derivative financial instruments, including financial futures contracts, as specified in Note 4 of the Fund’s and Master Portfolio’s Notes to Financial Statements, which may constitute forms of economic leverage. Such derivative financial instruments are used to obtain exposure to a security, index and/or market without owning or taking physical custody of securities or to hedge market and/or equity risks. Derivative financial instruments involve risks, including the imperfect correlation between the value of a derivative financial instrument and the underlying asset, possible default of the counterparty to the transaction or illiquidity of the derivative financial instrument. The Fund’s and Master Portfolio’s ability to use a derivative financial instrument successfully
depends on the investment advisor’s ability to predict pertinent market movements accurately, which cannot be assured. The use of derivative financial instruments may result in losses greater than if they had not been used, may require the Fund and Master Portfolio to sell or purchase portfolio investments at inopportune times or for distressed values, may limit the amount of appreciation the Fund and Master Portfolio can realize on an investment, may result in lower dividends paid to shareholders or may cause the Fund and Master Portfolio to hold an investment that it might otherwise sell. The Fund’s and Master Portfolio’s investments in these instruments are discussed in detail in the Fund’s and Master Portfolio’s Notes to Financial Statements.
| | | | | | |
| 8 | | SEMI-ANNUAL REPORT | | NOVEMBER 30, 2013 | | |
| | | | |
| Schedule of Investments November 30, 2013 (Unaudited) | | | BlackRock Disciplined Small Cap Core Fund | |
| | | (Percentages shown are based on Net Assets) | |
| | | | | | | | |
| Common Stocks | | Shares | | | Value | |
Aerospace & Defense — 2.7% | | | | | | | | |
AAR Corp. | | | 1,327 | | | $ | 41,429 | |
Alliant Techsystems, Inc. | | | 33 | | | | 4,001 | |
Ducommun, Inc. (a) | | | 316 | | | | 8,007 | |
Engility Holdings, Inc. (a) | | | 83 | | | | 2,644 | |
Esterline Technologies Corp. (a) | | | 29 | | | | 2,553 | |
Exelis, Inc. | | | 2,656 | | | | 46,932 | |
Spirit Aerosystems Holdings, Inc., Class A (a) | | | 1,245 | | | | 40,637 | |
Taser International, Inc. (a) | | | 1,202 | | | | 20,662 | |
| | | | | | | | |
| | | | | | | | 166,865 | |
Air Freight & Logistics — 0.3% | | | | | | | | |
Pacer International, Inc. (a) | | | 2,004 | | | | 18,196 | |
Airlines — 0.4% | | | | | | | | |
Republic Airways Holdings, Inc. (a) | | | 1,080 | | | | 12,161 | |
SkyWest, Inc. | | | 230 | | | | 3,887 | |
Spirit Airlines, Inc. (a) | | | 215 | | | | 9,862 | |
| | | | | | | | |
| | | | | | | | 25,910 | |
Auto Components — 1.0% | | | | | | | | |
Gentherm, Inc. (a) | | | 459 | | | | 11,089 | |
Stoneridge, Inc. (a) | | | 188 | | | | 2,427 | |
Superior Industries International, Inc. | | | 118 | | | | 2,329 | |
Tower International, Inc. (a) | | | 457 | | | | 9,821 | |
Visteon Corp. (a) | | | 439 | | | | 34,523 | |
| | | | | | | | |
| | | | | | | | 60,189 | |
Biotechnology — 3.5% | | | | | | | | |
Acceleron Pharma, Inc. (a) | | | 473 | | | | 10,297 | |
Acorda Therapeutics, Inc. (a) | | | 165 | | | | 5,744 | |
Aegerion Pharmaceuticals, Inc. (a) | | | 16 | | | | 1,135 | |
Affymax, Inc. (a) | | | 1,377 | | | | 1,170 | |
Agios Pharmaceuticals, Inc. (a) | | | 127 | | | | 2,229 | |
Alkermes PLC | | | 69 | | | | 2,786 | |
Alnylam Pharmaceuticals, Inc. (a) | | | 17 | | | | 1,040 | |
AMAG Pharmaceuticals, Inc. (a) | | | 244 | | | | 5,985 | |
Ambit Biosciences Corp. (a) | | | 67 | | | | 841 | |
Arena Pharmaceuticals, Inc. (a)(b) | | | 813 | | | | 5,301 | |
AVEO Pharmaceuticals, Inc. (a) | | | 569 | | | | 1,206 | |
Bluebird Bio, Inc. (a) | | | 21 | | | | 429 | |
Cellular Dynamics International, Inc. (a) | | | 172 | | | | 2,668 | |
China Biologic Products, Inc. (a) | | | 336 | | | | 9,942 | |
Codexis, Inc. (a) | | | 538 | | | | 807 | |
Cubist Pharmaceuticals, Inc. (a) | | | 127 | | | | 8,701 | |
Emergent Biosolutions, Inc. (a) | | | 646 | | | | 14,503 | |
Enanta Pharmaceuticals, Inc. (a) | | | 193 | | | | 5,217 | |
Enzon Pharmaceuticals, Inc. | | | 6,576 | | | | 10,916 | |
Esperion Therapeutics, Inc. (a) | | | 253 | | | | 3,018 | |
Five Prime Therapeutics, Inc. (a) | | | 74 | | | | 747 | |
Foundation Medicine, Inc. (a) | | | 331 | | | | 8,288 | |
Harvard Apparatus Regenerative Technology, Inc. (a) | | | 381 | | | | 1,932 | |
Insys Therapeutics, Inc. (a) | | | 42 | | | | 1,852 | |
Intrexon Corp. (a) | | | 114 | | | | 2,609 | |
| | | | | | | | |
| Common Stocks | | Shares | | | Value | |
Biotechnology (concluded) | | | | | | | | |
Isis Pharmaceuticals, Inc. (a) | | | 272 | | | $ | 10,543 | |
KaloBios Pharmaceuticals, Inc. (a) | | | 1,363 | | | | 5,779 | |
Ligand Pharmaceuticals, Inc., Class B (a) | | | 76 | | | | 4,232 | |
Maxygen, Inc. (a) | | | 4,024 | | | | 121 | |
Myriad Genetics, Inc. (a)(b) | | | 435 | | | | 12,941 | |
OncoGenex Pharmaceutical, Inc. (a) | | | 110 | | | | 945 | |
OncoMed Pharmaceuticals, Inc. (a)(b) | | | 615 | | | | 8,278 | |
Onconova Therapeutics, Inc. (a) | | | 37 | | | | 543 | |
Ophthotech Corp. (a) | | | 215 | | | | 6,074 | |
PDL BioPharma, Inc. | | | 1,845 | | | | 18,026 | |
Pharmacyclics, Inc. (a) | | | 42 | | | | 5,230 | |
Portola Pharmaceuticals, Inc. (a) | | | 256 | | | | 6,400 | |
Prothena Corp. PLC (a) | | | 65 | | | | 1,835 | |
Puma Biotechnology, Inc. (a) | | | 19 | | | | 946 | |
Receptos, Inc. (a) | | | 50 | | | | 1,157 | |
Regulus Therapeutics, Inc. (a) | | | 317 | | | | 1,994 | �� |
Repligen Corp. (a) | | | 995 | | | | 13,403 | |
Targacept, Inc. (a) | | | 1,089 | | | | 6,262 | |
Tetraphase Pharmaceuticals, Inc. (a) | | | 405 | | | | 4,763 | |
Threshold Pharmaceuticals, Inc. (a) | | | 388 | | | | 1,913 | |
Verastem, Inc. (a) | | | 64 | | | | 677 | |
| | | | | | | | |
| | | | | | | | 221,425 | |
Building Products — 0.7% | | | | | | | | |
A.O. Smith Corp. | | | 73 | | | | 3,953 | |
Apogee Enterprises, Inc. | | | 40 | | | | 1,433 | |
Gibraltar Industries, Inc. (a) | | | 422 | | | | 7,469 | |
Griffon Corp. | | | 337 | | | | 4,334 | |
PGT, Inc. (a) | | | 1,638 | | | | 16,380 | |
Ply Gem Holdings, Inc. (a) | | | 585 | | | | 10,261 | |
| | | | | | | | |
| | | | | | | | 43,830 | |
Capital Markets — 2.1% | | | | | | | | |
Artisan Partners Asset Management, Inc., Class A | | | 175 | | | | 10,801 | |
Calamos Asset Management, Inc., Class A | | | 1,154 | | | | 12,798 | |
Capital Southwest Corp. | | | 984 | | | | 33,761 | |
FBR & Co. (a) | | | 877 | | | | 24,652 | |
Janus Capital Group, Inc. | | | 849 | | | | 9,237 | |
Manning & Napier, Inc. | | | 189 | | | | 3,453 | |
MCG Capital Corp. | | | 4,805 | | | | 23,112 | |
Oppenheimer Holdings, Inc., Class A | | | 192 | | | | 4,460 | |
Walter Investment Management Corp. (a) | | | 195 | | | | 7,435 | |
WisdomTree Investments, Inc. (a) | | | 78 | | | | 1,195 | |
| | | | | | | | |
| | | | | | | | 130,904 | |
Chemicals — 1.5% | | | | | | | | |
American Pacific Corp. (a) | | | 293 | | | | 12,116 | |
Axiall Corp. | | | 318 | | | | 14,405 | |
Ferro Corp. (a) | | | 270 | | | | 3,761 | |
FutureFuel Corp. | | | 2,126 | | | | 35,547 | |
Minerals Technologies, Inc. | | | 171 | | | | 10,157 | |
OM Group, Inc. (a) | | | 339 | | | | 11,167 | |
| ADR | American Depositary Receipts |
See Notes to Financial Statements.
| | | | | | |
| | | SEMI-ANNUAL REPORT | | NOVEMBER 30, 2013 | | 9 |
| | | | |
| Schedule of Investments (continued) | | | BlackRock Disciplined Small Cap Core Fund | |
| | | (Percentages shown are based on Net Assets) | |
| | | | | | | | |
| Common Stocks | | Shares | | | Value | |
Chemicals (concluded) | | | | | | | | |
Yongye International, Inc. (a) | | | 1,140 | | | $ | 7,193 | |
| | | | | | | | |
| | | | | | | | 94,346 | |
Commercial Banks — 6.6% | | | | | | | | |
1st Source Corp. | | | 876 | | | | 27,988 | |
Access National Corp. | | | 658 | | | | 10,370 | |
Ameris Bancorp (a) | | | 91 | | | | 1,863 | |
Associated Banc-Corp. | | | 2,892 | | | | 49,858 | |
BancFirst Corp. | | | 196 | | | | 10,923 | |
Banco Latinoamericano de Comercio Exterior SA | | | 528 | | | | 14,224 | |
Capital Bank Financial Corp., Class A (a) | | | 268 | | | | 6,255 | |
Centerstate Banks, Inc. | | | 170 | | | | 1,795 | |
Central Pacific Financial Corp. | | | 1,148 | | | | 22,822 | |
Century Bancorp, Inc., Class A | | | 61 | | | | 2,142 | |
Chemical Financial Corp. | | | 643 | | | | 20,589 | |
First Citizens BancShares, Inc., Class A | | | 275 | | | | 61,779 | |
First Merchants Corp. | | | 491 | | | | 10,404 | |
FNB Corp. | | | 923 | | | | 11,731 | |
Hanmi Financial Corp. | | | 411 | | | | 8,450 | |
Heritage Oaks Bancorp (a) | | | 141 | | | | 1,127 | |
Home Federal Bancorp, Inc. | | | 83 | | | | 1,268 | |
Independent Bank Group, Inc. | | | 408 | | | | 19,535 | |
MetroCorp Bancshares, Inc. | | | 102 | | | | 1,462 | |
National Bank Holdings Corp., Class A | | | 1,415 | | | | 29,970 | |
Pacific Continental Corp. | | | 293 | | | | 4,231 | |
Seacoast Banking Corp. of Florida (a) | | | 214 | | | | 484 | |
Southside Bancshares, Inc. | | | 312 | | | | 8,911 | |
StellarOne Corp. | | | 73 | | | | 1,841 | |
Sterling Financial Corp. | | | 319 | | | | 10,415 | |
Synovus Financial Corp. | | | 601 | | | | 2,097 | |
Texas Capital Bancshares, Inc. (a) | | | 54 | | | | 3,033 | |
Umpqua Holdings Corp. | | | 1,878 | | | | 34,574 | |
United Community Banks, Inc. (a) | | | 1,788 | | | | 32,810 | |
Wilshire Bancorp, Inc. | | | 114 | | | | 1,205 | |
| | | | | | | | |
| | | | | | | | 414,156 | |
Commercial Services & Supplies — 2.5% | | | | | | | | |
ARC Document Solutions, Inc. (a) | | | 828 | | | | 7,129 | |
Cenveo, Inc. (a) | | | 499 | | | | 1,712 | |
Consolidated Graphics, Inc. (a) | | | 637 | | | | 41,029 | |
Deluxe Corp. | | | 789 | | | | 39,205 | |
G&K Services, Inc., Class A | | | 82 | | | | 4,938 | |
Intersections, Inc. | | | 401 | | | | 3,104 | |
Kimball International, Inc., Class B | | | 299 | | | | 4,452 | |
Metalico, Inc. (a) | | | 1,628 | | | | 2,865 | |
Performant Financial Corp. (a) | | | 880 | | | | 9,231 | |
Viad Corp. | | | 1,381 | | | | 37,287 | |
West Corp. | | | 155 | | | | 3,570 | |
| | | | | | | | |
| | | | | | | | 154,522 | |
Communications Equipment — 1.7% | | | | | | | | |
Alliance Fiber Optic Products, Inc. | | | 304 | | | | 4,484 | |
Anaren, Inc. (a) | | | 43 | | | | 1,199 | |
Aruba Networks, Inc. (a) | | | 800 | | | | 14,272 | |
Aviat Networks, Inc. (a) | | | 3,196 | | | | 8,086 | |
Bel Fuse, Inc., Class B | | | 225 | | | | 5,114 | |
Calix, Inc. (a) | | | 419 | | | | 4,291 | |
Extreme Networks, Inc. (a) | | | 2,724 | | | | 18,932 | |
Finisar Corp. (a) | | | 751 | | | | 15,538 | |
| | | | | | | | |
| Common Stocks | | Shares | | | Value | |
Communications Equipment (concluded) | | | | | | | | |
Ixia (a) | | | 169 | | | $ | 2,195 | |
Ubiquiti Networks, Inc. | | | 739 | | | | 29,117 | |
| | | | | | | | |
| | | | | | | | 103,228 | |
Computers & Peripherals — 0.4% | | | | | | | | |
Avid Technology, Inc. (a) | | | 759 | | | | 6,717 | |
Immersion Corp. (a) | | | 1,158 | | | | 14,197 | |
Violin Memory, Inc. (a) | | | 220 | | | | 759 | |
| | | | | | | | |
| | | | | | | | 21,673 | |
Construction & Engineering — 0.6% | | | | | | | | |
Argan, Inc. | | | 727 | | | | 17,048 | |
MYR Group, Inc. (a) | | | 247 | | | | 6,276 | |
Orion Marine Group, Inc. (a) | | | 118 | | | | 1,401 | |
Pike Electric Corp. | | | 895 | | | | 9,406 | |
Tutor Perini Corp. (a) | | | 190 | | | | 4,653 | |
| | | | | | | | |
| | | | | | | | 38,784 | |
Construction Materials — 0.1% | | | | | | | | |
Headwaters, Inc. (a) | | | 397 | | | | 3,835 | |
Consumer Finance — 0.6% | | | | | | | | |
Nelnet, Inc., Class A | | | 758 | | | | 34,110 | |
Springleaf Holdings, Inc. (a) | | | 183 | | | | 3,858 | |
| | | | | | | | |
| | | | | | | | 37,968 | |
Distributors — 0.0% | | | | | | | | |
Core-Mark Holding Co., Inc. | | | 8 | | | | 591 | |
VOXX International Corp. (a) | | | 111 | | | | 1,980 | |
| | | | | | | | |
| | | | | | | | 2,571 | |
Diversified Consumer Services — 0.9% | | | | | | | | |
Apollo Group, Inc., Class A (a) | | | 682 | | | | 17,930 | |
Capella Education Co. (a) | | | 220 | | | | 14,458 | |
Career Education Corp. (a) | | | 363 | | | | 1,833 | |
Collectors Universe, Inc. | | | 712 | | | | 11,812 | |
LifeLock, Inc. (a) | | | 59 | | | | 1,016 | |
National American University Holdings, Inc. | | | 385 | | | | 1,413 | |
Outerwall, Inc. (a) | | | 15 | | | | 1,026 | |
Steiner Leisure Ltd. | | | 45 | | | | 2,662 | |
Stewart Enterprises, Inc., Class A | | | 270 | | | | 3,578 | |
| | | | | | | | |
| | | | | | | | 55,728 | |
Diversified Financial Services — 0.1% | | | | | | | | |
PHH Corp. (a) | | | 146 | | | | 3,510 | |
PICO Holdings, Inc. (a) | | | 48 | | | | 1,163 | |
| | | | | | | | |
| | | | | | | | 4,673 | |
Diversified Telecommunication Services — 0.9% | | | | | | | | |
Cbeyond, Inc. (a) | | | 400 | | | | 2,220 | |
IDT Corp., Class B | | | 428 | | | | 9,506 | |
Inteliquent, Inc. | | | 1,617 | | | | 18,741 | |
magicJack VocalTec Ltd. (b) | | | 1,291 | | | | 14,808 | |
Premiere Global Services, Inc. (a) | | | 86 | | | | 802 | |
Straight Path Communications, Inc., Class B (a) | | | 136 | | | | 1,074 | |
Vonage Holdings Corp. (a) | | | 1,807 | | | | 5,981 | |
| | | | | | | | |
| | | | | | | | 53,132 | |
Electric Utilities — 0.3% | | | | | | | | |
IDACORP, Inc. | | | 36 | | | | 1,860 | |
See Notes to Financial Statements.
| | | | | | |
| 10 | | SEMI-ANNUAL REPORT | | NOVEMBER 30, 2013 | | |
| | | | |
| Schedule of Investments (continued) | | | BlackRock Disciplined Small Cap Core Fund | |
| | | (Percentages shown are based on Net Assets) | |
| | | | | | | | |
| Common Stocks | | Shares | | | Value | |
Electric Utilities (concluded) | | | | | | | | |
Portland General Electric Co. | | | 601 | | | $ | 17,916 | |
| | | | | | | | |
| | | | | | | | 19,776 | |
Electrical Equipment — 1.9% | | | | | | | | |
EnerSys, Inc. | | | 719 | | | | 51,301 | |
Generac Holdings, Inc. | | | 651 | | | | 34,672 | |
II-VI, Inc. (a) | | | 596 | | | | 9,745 | |
Lihua International, Inc. (a) | | | 3,311 | | | | 18,939 | |
LSI Industries, Inc. | | | 209 | | | | 1,816 | |
| | | | | | | | |
| | | | | | | | 116,473 | |
Electronic Equipment, Instruments & Components — 3.4% | | | | | |
Aeroflex Holding Corp. (a) | | | 980 | | | | 6,615 | |
AVX Corp. | | | 788 | | | | 10,811 | |
Benchmark Electronics, Inc. (a) | | | 2,172 | | | | 49,913 | |
Checkpoint Systems, Inc. (a) | | | 282 | | | | 4,072 | |
Electro Scientific Industries, Inc. | | | 286 | | | | 2,943 | |
Fabrinet | | | 599 | | | | 11,860 | |
FARO Technologies, Inc. (a) | | | 59 | | | | 3,218 | |
Newport Corp. (a) | | | 788 | | | | 13,514 | |
PC Connection, Inc. (a) | | | 205 | | | | 4,455 | |
RealD, Inc. (a) | | | 691 | | | | 6,191 | |
Sanmina Corp. (a) | | | 280 | | | | 4,334 | |
ScanSource, Inc. (a) | | | 90 | | | | 3,779 | |
Tech Data Corp. (a) | | | 995 | | | | 51,581 | |
TTM Technologies, Inc. (a) | | | 134 | | | | 1,300 | |
Vishay Intertechnology, Inc. (a) | | | 2,923 | | | | 37,794 | |
| | | | | | | | |
| | | | | | | | 212,380 | |
Energy Equipment & Services — 1.4% | | | | | | | | |
Bristow Group, Inc. | | | 235 | | | | 18,847 | |
Carbo Ceramics, Inc. | | | 52 | | | | 6,398 | |
Dawson Geophysical Co. (a) | | | 447 | | | | 14,447 | |
Exterran Holdings, Inc. (a) | | | 149 | | | | 4,845 | |
Hornbeck Offshore Services, Inc. (a) | | | 75 | | | | 3,797 | |
ION Geophysical Corp. (a) | | | 924 | | | | 3,567 | |
Matrix Service Co. (a) | | | 82 | | | | 1,820 | |
Parker Drilling Co. (a) | | | 2,121 | | | | 16,820 | |
PHI, Inc. (a) | | | 35 | | | | 1,486 | |
RigNet, Inc. (a) | | | 33 | | | | 1,402 | |
SEACOR Holdings, Inc. | | | 19 | | | | 1,768 | |
Tesco Corp. (a) | | | 58 | | | | 1,037 | |
USA Compression Partners LP | | | 507 | | | | 12,427 | |
| | | | | | | | |
| | | | | | | | 88,661 | |
Food & Staples Retailing — 1.2% | | | | | | | | |
Harris Teeter Supermarkets, Inc. | | | 182 | | | | 8,987 | |
Ingles Markets, Inc., Class A | | | 88 | | | | 2,312 | |
The Pantry, Inc. (a) | | | 1,340 | | | | 19,283 | |
Rite Aid Corp. (a) | | | 5,908 | | | | 34,975 | |
Roundy’s, Inc. | | | 1,060 | | | | 9,233 | |
| | | | | | | | |
| | | | | | | | 74,790 | |
Food Products — 1.9% | | | | | | | | |
Chiquita Brands International, Inc. (a) | | | 1,142 | | | | 12,071 | |
Dean Foods Co. (a) | | | 1,243 | | | | 22,349 | |
Fresh Del Monte Produce, Inc. | | | 563 | | | | 15,770 | |
The Hain Celestial Group, Inc. (a) | | | 8 | | | | 662 | |
John B. Sanfilippo & Son, Inc. | | | 196 | | | | 4,996 | |
Omega Protein Corp. (a) | | | 1,918 | | | | 25,989 | |
Pilgrim’s Pride Corp. (a) | | | 497 | | | | 8,141 | |
Post Holdings, Inc. (a) | | | 179 | | | | 9,066 | |
| | | | | | | | |
| Common Stocks | | Shares | | | Value | |
Food Products (concluded) | | | | | | | | |
Seaboard Corp. | | | 5 | | | $ | 14,125 | |
WhiteWave Foods Co., Class A (a) | | | 270 | | | | 5,743 | |
| | | | | | | | |
| | | | | | | | 118,912 | |
Gas Utilities — 0.7% | | | | | | | | |
New Jersey Resources Corp. | | | 226 | | | | 10,326 | |
Northwest Natural Gas Co. | | | 100 | | | | 4,253 | |
Southwest Gas Corp. | | | 589 | | | | 31,252 | |
| | | | | | | | |
| | | | | | | | 45,831 | |
Health Care Equipment & Supplies — 4.4% | | | | | | | | |
Alere, Inc. (a) | | | 754 | | | | 24,671 | |
Align Technology, Inc. (a) | | | 905 | | | | 49,449 | |
AngioDynamics, Inc. (a) | | | 141 | | | | 2,178 | |
Cutera, Inc. (a) | | | 1,191 | | | | 11,255 | |
Cyberonics, Inc. (a) | | | 418 | | | | 28,725 | |
ICU Medical, Inc. (a) | | | 214 | | | | 14,057 | |
Invacare Corp. | | | 160 | | | | 3,584 | |
LDR Holding Corp. (a) | | | 175 | | | | 3,854 | |
Medical Action Industries, Inc. (a) | | | 1,344 | | | | 11,558 | |
Meridian Bioscience, Inc. | | | 44 | | | | 1,082 | |
Natus Medical, Inc. (a) | | | 161 | | | | 3,708 | |
Orthofix International NV | | | 610 | | | | 13,194 | |
RTI Biologics, Inc. (a) | | | 4,145 | | | | 12,767 | |
SurModics, Inc. (a) | | | 1,039 | | | | 25,061 | |
Symmetry Medical, Inc. (a) | | | 1,184 | | | | 11,615 | |
Thoratec Corp. (a) | | | 1,498 | | | | 58,976 | |
| | | | | | | | |
| | | | | | | | 275,734 | |
Health Care Providers & Services — 2.8% | | | | | | | | |
Alliance HealthCare Services, Inc. (a) | | | 144 | | | | 4,159 | |
AMN Healthcare Services, Inc. (a) | | | 489 | | | | 6,787 | |
Corvel Corp. (a) | | | 321 | | | | 14,859 | |
Cross Country Healthcare, Inc. (a) | | | 1,688 | | | | 12,896 | |
Five Star Quality Care, Inc. (a) | | | 204 | | | | 1,006 | |
Hanger, Inc. (a) | | | 74 | | | | 2,874 | |
HealthSouth Corp. | | | 36 | | | | 1,288 | |
Magellan Health Services, Inc. (a) | | | 50 | | | | 3,060 | |
National Research Corp., Class B | | | 30 | | | | 1,026 | |
PharMerica Corp. (a) | | | 940 | | | | 21,225 | |
The Providence Service Corp. (a) | | | 474 | | | | 12,997 | |
Team Health Holdings, Inc. (a) | | | 174 | | | | 8,131 | |
Triple-S Management Corp., Class B (a) | | | 157 | | | | 3,181 | |
VCA Antech, Inc. (a) | | | 2,059 | | | | 61,667 | |
WellCare Health Plans, Inc. (a) | | | 291 | | | | 21,621 | |
| | | | | | | | |
| | | | | | | | 176,777 | |
Health Care Technology — 0.4% | | | | | | | | |
MedAssets, Inc. (a) | | | 192 | | | | 4,136 | |
Omnicell, Inc. (a) | | | 794 | | | | 19,255 | |
| | | | | | | | |
| | | | | | | | 23,391 | |
Hotels, Restaurants & Leisure — 2.6% | | | | | | | | |
AFC Enterprises, Inc. (a) | | | 111 | | | | 4,838 | |
Bally Technologies, Inc. (a) | | | 372 | | | | 27,740 | |
Bob Evans Farms, Inc. | | | 27 | | | | 1,501 | |
Bravo Brio Restaurant Group, Inc. (a) | | | 18 | | | | 287 | |
Century Casinos, Inc. (a) | | | 217 | | | | 1,157 | |
Diamond Resorts International, Inc. (a) | | | 81 | | | | 1,447 | |
Domino’s Pizza, Inc. | | | 609 | | | | 42,100 | |
Einstein Noah Restaurant Group, Inc. | | | 842 | | | | 13,464 | |
Jack in the Box, Inc. (a) | | | 936 | | | | 44,320 | |
See Notes to Financial Statements.
| | | | | | |
| | | SEMI-ANNUAL REPORT | | NOVEMBER 30, 2013 | | 11 |
| | | | |
| Schedule of Investments (continued) | | | BlackRock Disciplined Small Cap Core Fund | |
| | | (Percentages shown are based on Net Assets) | |
| | | | | | | | |
| Common Stocks | | Shares | | | Value | |
Hotels, Restaurants & Leisure (concluded) | | | | | | | | |
The Marcus Corp. | | | 360 | | | $ | 5,252 | |
Marriott Vacations Worldwide Corp. (a) | | | 20 | | | | 1,045 | |
Multimedia Games Holding Co., Inc. (a) | | | 97 | | | | 2,813 | |
Red Lion Hotels Corp. (a) | | | 252 | | | | 1,386 | |
Ruth’s Hospitality Group, Inc. | | | 472 | | | | 6,787 | |
Speedway Motorsports, Inc. | | | 324 | | | | 6,522 | |
Town Sports International Holdings, Inc. | | | 298 | | | | 4,098 | |
| | | | | | | | |
| | | | | | | | 164,757 | |
Household Durables — 0.5% | | | | | | | | |
The Ryland Group, Inc. | | | 323 | | | | 12,765 | |
TRI Pointe Homes, Inc. (a) | | | 516 | | | | 10,243 | |
Zagg, Inc. (a) | | | 1,827 | | | | 7,746 | |
| | | | | | | | |
| | | | | | | | 30,754 | |
Household Products — 0.5% | | | | | | | | |
Central Garden and Pet Co. (a) | | | 1,060 | | | | 8,236 | |
Central Garden and Pet Co., Class A (a) | | | 190 | | | | 1,486 | |
Harbinger Group, Inc. (a) | | | 1,744 | | | | 20,928 | |
| | | | | | | | |
| | | | | | | | 30,650 | |
Insurance — 1.9% | | | | | | | | |
CNO Financial Group, Inc. | | | 3,287 | | | | 55,616 | |
Crawford & Co., Class B | | | 309 | | | | 3,195 | |
eHealth, Inc. (a) | | | 127 | | | | 5,754 | |
First American Financial Corp. | | | 187 | | | | 4,948 | |
Fortegra Financial Corp. (a) | | | 716 | | | | 5,241 | |
Hallmark Financial Services, Inc. (a) | | | 307 | | | | 2,917 | |
HCI Group, Inc. | | | 21 | | | | 1,046 | |
Horace Mann Educators Corp. | | | 567 | | | | 17,418 | |
National Western Life Insurance Co., Class A | | | 47 | | | | 10,054 | |
Third Point Reinsurance Ltd. | | | 102 | | | | 1,699 | |
Universal Insurance Holdings, Inc. | | | 973 | | | | 12,065 | |
| | | | | | | | |
| | | | | | | | 119,953 | |
Internet & Catalog Retail — 0.6% | | | | | | | | |
Blue Nile, Inc. (a) | | | 58 | | | | 2,671 | |
Orbitz Worldwide, Inc. (a) | | | 919 | | | | 6,359 | |
PetMed Express, Inc. | | | 1,719 | | | | 27,126 | |
RetailMeNot, Inc. (a) | | | 52 | | | | 1,491 | |
zulily, Inc., Class A (a) | | | 45 | | | | 1,575 | |
| | | | | | | | |
| | | | | | | | 39,222 | |
Internet Software & Services — 2.5% | | | | | | | | |
AOL, Inc. (a) | | | 54 | | | | 2,407 | |
Bankrate, Inc. (a) | | | 269 | | | | 5,041 | |
Benefitfocus, Inc. (a) | | | 144 | | | | 6,957 | |
Blucora, Inc. (a) | | | 269 | | | | 7,823 | |
Cvent, Inc. (a) | | | 163 | | | | 5,309 | |
Demand Media, Inc. (a) | | | 1,462 | | | | 8,056 | |
EarthLink, Inc. | | | 3,247 | | | | 17,696 | |
Global Eagle Entertainment, Inc. (a) | | | 466 | | | | 7,153 | |
Gogo, Inc. (a) | | | 219 | | | | 5,841 | |
j2 Global, Inc. | | | 118 | | | | 5,660 | |
Limelight Networks, Inc. (a) | | | 2,310 | | | | 4,735 | |
Marchex, Inc., Class B | | | 752 | | | | 7,054 | |
Monster Worldwide, Inc. (a) | | | 2,916 | | | | 16,417 | |
QuinStreet, Inc. (a) | | | 1,176 | | | | 10,290 | |
Responsys, Inc. (a) | | | 212 | | | | 3,585 | |
Sohu.com, Inc. (a) | | | 79 | | | | 5,324 | |
Spark Networks, Inc. (a) | | | 125 | | | | 700 | |
Synacor, Inc. (a) | | | 375 | | | | 1,050 | |
| | | | | | | | |
| Common Stocks | | Shares | | | Value | |
Internet Software & Services (concluded) | | | | | | | | |
Travelzoo, Inc. (a) | | | 899 | | | $ | 19,311 | |
Tremor Video, Inc. (a) | | | 471 | | | | 2,190 | |
United Online, Inc. (a) | | | 172 | | | | 2,723 | |
ValueClick, Inc. (a) | | | 224 | | | | 4,794 | |
Web.com Group, Inc. (a) | | | 261 | | | | 7,452 | |
| | | | | | | | |
| | | | | | | | 157,568 | |
IT Services — 2.1% | | | | | | | | |
Cardtronics, Inc. (a) | | | 258 | | | | 10,988 | |
CIBER, Inc. (a) | | | 351 | | | | 1,390 | |
Euronet Worldwide, Inc. (a) | | | 39 | | | | 1,890 | |
Global Cash Access Holdings, Inc. (a) | | | 4,595 | | | | 44,801 | |
PRGX Global, Inc. (a) | | | 110 | | | | 724 | |
Science Applications International Corp. | | | 388 | | | | 14,298 | |
Syntel, Inc. | | | 550 | | | | 48,603 | |
VeriFone Systems, Inc. (a) | | | 441 | | | | 11,294 | |
| | | | | | | | |
| | | | | | | | 133,988 | |
Leisure Equipment & Products — 0.1% | | | | | | | | |
Brunswick Corp. | | | 22 | | | | 1,005 | |
Johnson Outdoors, Inc., Class A | | | 82 | | | | 2,348 | |
| | | | | | | | |
| | | | | | | | 3,353 | |
Life Sciences Tools & Services — 0.1% | | | | | | | | |
Harvard Bioscience, Inc. (a) | | | 1,524 | | | | 6,949 | |
Machinery — 2.7% | | | | | | | | |
Ampco-Pittsburgh Corp. | | | 354 | | | | 6,492 | |
Briggs & Stratton Corp. | | | 215 | | | | 4,347 | |
CIRCOR International, Inc. | | | 37 | | | | 2,935 | |
ESCO Technologies, Inc. | | | 112 | | | | 3,815 | |
Federal Signal Corp. (a) | | | 2,096 | | | | 32,760 | |
Global Brass & Copper Holdings, Inc. | | | 895 | | | | 14,767 | |
Greenbrier Cos., Inc. (a) | | | 321 | | | | 10,031 | |
Hyster-Yale Materials Handling, Inc. | | | 113 | | | | 9,420 | |
John Bean Technologies Corp. | | | 1,954 | | | | 57,760 | |
Kadant, Inc. | | | 27 | | | | 1,118 | |
L.B. Foster Co., Class A | | | 45 | | | | 2,109 | |
Lindsay Corp. | | | 123 | | | | 9,396 | |
Lydall, Inc. (a) | | | 385 | | | | 6,865 | |
The Middleby Corp. (a) | | | 6 | | | | 1,325 | |
NN, Inc. | | | 149 | | | | 2,973 | |
Rexnord Corp. (a) | | | 78 | | | | 1,896 | |
Trimas Corp. (a) | | | 56 | | | | 2,048 | |
Xerium Technologies, Inc. (a) | | | 116 | | | | 1,530 | |
| | | | | | | | |
| | | | | | | | 171,587 | |
Marine — 0.4% | | | | | | | | |
Matson, Inc. | | | 861 | | | | 21,551 | |
Media — 2.3% | | | | | | | | |
Crown Media Holdings, Inc., Class A (a) | | | 1,069 | | | | 3,581 | |
CTC Media, Inc. | | | 4,100 | | | | 51,865 | |
Entravision Communications Corp., Class A | | | 185 | | | | 1,223 | |
Harte-Hanks, Inc. | | | 4,311 | | | | 34,316 | |
LIN Media LLC, Class A (a) | | | 44 | | | | 1,150 | |
Live Nation Entertainment, Inc. (a) | | | 1,075 | | | | 19,748 | |
Salem Communications Corp., Class A | | | 352 | | | | 3,164 | |
Starz, Class A (a) | | | 1,034 | | | | 29,242 | |
| | | | | | | | |
| | | | | | | | 144,289 | |
Metals & Mining — 0.7% | | | | | | | | |
Commercial Metals Co. | | | 558 | | | | 10,836 | |
See Notes to Financial Statements.
| | | | | | |
| 12 | | SEMI-ANNUAL REPORT | | NOVEMBER 30, 2013 | | |
| | | | |
| Schedule of Investments (continued) | | | BlackRock Disciplined Small Cap Core Fund | |
| | | (Percentages shown are based on Net Assets) | |
| | | | | | | | |
| Common Stocks | | Shares | | | Value | |
Metals & Mining (concluded) | | | | | | | | |
Gold Reserve, Inc. (a) | | | 2,118 | | | $ | 7,011 | |
Great Northern Iron Ore Properties | | | 59 | | | | 4,347 | |
SunCoke Energy, Inc. (a) | | | 183 | | | | 4,149 | |
United States Steel Corp. | | | 64 | | | | 1,716 | |
US Silica Holdings, Inc. | | | 172 | | | | 5,936 | |
Worthington Industries, Inc. | | | 284 | | | | 11,908 | |
| | | | | | | | |
| | | | | | | | 45,903 | |
Multiline Retail — 0.0% | | | | | | | | |
Big Lots, Inc. (a) | | | 8 | | | | 307 | |
Multi-Utilities — 1.1% | | | | | | | | |
Avista Corp. | | | 2,237 | | | | 60,958 | |
Black Hills Corp. | | | 153 | | | | 7,691 | |
| | | | | | | | |
| | | | | | | | 68,649 | |
Office Electronics — 0.2% | | | | | | | | |
Zebra Technologies Corp., Class A (a) | | | 203 | | | | 10,524 | |
Oil, Gas & Consumable Fuels — 3.7% | | | | | | | | |
Alon USA Energy, Inc. | | | 104 | | | | 1,435 | |
Apco Oil and Gas International, Inc. | | | 109 | | | | 1,715 | |
Berry Petroleum Co., Class A | | | 196 | | | | 9,863 | |
Bonanza Creek Energy, Inc. (a) | | | 141 | | | | 6,468 | |
Callon Petroleum Co. (a) | | | 235 | | | | 1,563 | |
Diamondback Energy, Inc. (a) | | | 248 | | | | 12,336 | |
Evolution Petroleum Corp. | | | 296 | | | | 3,659 | |
Gastar Exploration, Inc. (a) | | | 435 | | | | 2,562 | |
Goodrich Petroleum Corp. (a) | | | 92 | | | | 1,770 | |
Green Plains Renewable Energy, Inc. | | | 746 | | | | 12,891 | |
Kodiak Oil & Gas Corp. (a) | | | 959 | | | | 10,875 | |
L&L Energy, Inc. (a) | | | 300 | | | | 504 | |
LinnCo LLC | | | 146 | | | | 4,552 | |
Matador Resources Co. (a) | | | 429 | | | | 9,348 | |
Midstates Petroleum Co., Inc. (a) | | | 718 | | | | 4,315 | |
Northern Oil and Gas, Inc. (a) | | | 536 | | | | 8,549 | |
Oasis Petroleum, Inc. (a) | | | 584 | | | | 26,940 | |
Penn Virginia Corp. (a) | | | 655 | | | | 7,028 | |
Renewable Energy Group, Inc. (a) | | | 380 | | | | 4,321 | |
REX American Resources Corp. (a) | | | 559 | | | | 18,302 | |
SandRidge Energy, Inc. (a)(b) | | | 388 | | | | 2,169 | |
SemGroup Corp., Class A | | | 16 | | | | 982 | |
Stone Energy Corp. (a) | | | 658 | | | | 21,767 | |
Swift Energy Co. (a) | | | 197 | | | | 2,622 | |
Vaalco Energy, Inc. (a) | | | 2,282 | | | | 13,806 | |
Warren Resources, Inc. (a) | | | 6,791 | | | | 22,071 | |
Western Refining, Inc. | | | 464 | | | | 18,128 | |
| | | | | | | | |
| | | | | | | | 230,541 | |
Paper & Forest Products — 1.3% | | | | | | | | |
Domtar Corp. | | | 200 | | | | 17,102 | |
KapStone Paper and Packaging Corp. (a) | | | 965 | | | | 51,415 | |
PH Glatfelter Co. | | | 379 | | | | 10,608 | |
Resolute Forest Products, Inc. (a) | | | 174 | | | | 2,819 | |
| | | | | | | | |
| | | | | | | | 81,944 | |
Personal Products — 0.3% | | | | | | | | |
Medifast, Inc. (a) | | | 77 | | | | 2,086 | |
USANA Health Sciences, Inc. (a) | | | 256 | | | | 18,716 | |
| | | | | | | | |
| | | | | | | | 20,802 | |
| | | | | | | | |
| Common Stocks | | Shares | | | Value | |
Pharmaceuticals — 1.4% | | | | | | | | |
Aratana Therapeutics, Inc. (a) | | | 100 | | | $ | 1,980 | |
AVANIR Pharmaceuticals, Inc., Class A (a) | | | 293 | | | | 1,301 | |
Cumberland Pharmaceuticals, Inc. (a) | | | 1,851 | | | | 9,218 | |
Impax Laboratories, Inc. (a) | | | 303 | | | | 7,284 | |
Lannett Co., Inc. (a) | | | 680 | | | | 20,087 | |
The Medicines Co. (a) | | | 161 | | | | 5,894 | |
Pain Therapeutics, Inc. | | | 857 | | | | 3,925 | |
Pozen, Inc. (a) | | | 614 | | | | 4,851 | |
Questcor Pharmaceuticals, Inc. | | | 197 | | | | 11,428 | |
Sagent Pharmaceuticals, Inc. (a) | | | 163 | | | | 3,702 | |
Santarus, Inc. (a) | | | 206 | | | | 6,629 | |
Sciclone Pharmaceuticals, Inc. (a) | | | 2,424 | | | | 11,829 | |
ViroPharma, Inc. (a) | | | 6 | | | | 297 | |
| | | | | | | | |
| | | | | | | | 88,425 | |
Professional Services — 1.8% | | | | | | | | |
CRA International, Inc. (a) | | | 305 | | | | 5,633 | |
The Dolan Co. (a) | | | 1,925 | | | | 1,347 | |
ICF International, Inc. (a) | | | 51 | | | | 1,845 | |
Kforce, Inc. | | | 990 | | | | 19,978 | |
Korn/Ferry International (a) | | | 1,713 | | | | 39,673 | |
On Assignment, Inc. (a) | | | 57 | | | | 1,940 | |
Resources Connection, Inc. | | | 1,348 | | | | 19,169 | |
RPX Corp. (a) | | | 1,415 | | | | 23,376 | |
WageWorks, Inc. (a) | | | 25 | | | | 1,433 | |
| | | | | | | | |
| | | | | | | | 114,394 | |
Real Estate Investment Trusts (REITs) — 6.5% | | | | | | | | |
American Assets Trust, Inc. | | | 360 | | | | 11,228 | |
Apollo Residential Mortgage, Inc. | | | 298 | | | | 4,506 | |
Arbor Realty Trust, Inc. | | | 750 | | | | 4,973 | |
Ashford Hospitality Prime, Inc. (a) | | | 122 | | | | 2,496 | |
Ashford Hospitality Trust, Inc. | | | 613 | | | | 5,033 | |
Aviv REIT, Inc. | | | 392 | | | | 10,074 | |
Capstead Mortgage Corp. | | | 422 | | | | 5,077 | |
CBL & Associates Properties, Inc. | | | 2,083 | | | | 37,619 | |
Cedar Realty Trust, Inc. | | | 2,968 | | | | 17,214 | |
Chatham Lodging Trust | | | 300 | | | | 6,177 | |
Chesapeake Lodging Trust | | | 53 | | | | 1,265 | |
CyrusOne, Inc. | | | 434 | | | | 8,867 | |
DuPont Fabros Technology, Inc. | | | 194 | | | | 4,553 | |
EPR Properties | | | 979 | | | | 49,234 | |
Equity Lifestyle Properties, Inc. | | | 891 | | | | 31,631 | |
Equity One, Inc. | | | 1,105 | | | | 24,752 | |
FelCor Lodging Trust, Inc. (a) | | | 1,123 | | | | 8,220 | |
The Geo Group, Inc. | | | 260 | | | | 8,528 | |
Gramercy Property Trust, Inc. (a) | | | 1,052 | | | | 5,660 | |
Highwoods Properties, Inc. | | | 160 | | | | 5,747 | |
Invesco Mortgage Capital, Inc. | | | 135 | | | | 2,039 | |
Investors Real Estate Trust | | | 864 | | | | 7,612 | |
MFA Financial, Inc. | | | 4,150 | | | | 30,253 | |
Monmouth Real Estate Investment Corp., Class A | | | 333 | | | | 3,203 | |
NorthStar Realty Finance Corp. | | | 371 | | | | 3,665 | |
One Liberty Properties, Inc. | | | 201 | | | | 4,143 | |
PS Business Parks, Inc. | | | 686 | | | | 53,728 | |
RLJ Lodging Trust | | | 264 | | | | 6,373 | |
Ryman Hospitality Properties, Inc. | | | 648 | | | | 27,132 | |
Sabra Health Care REIT, Inc. | | | 466 | | | | 12,433 | |
See Notes to Financial Statements.
| | | | | | |
| | | SEMI-ANNUAL REPORT | | NOVEMBER 30, 2013 | | 13 |
| | | | |
| Schedule of Investments (continued) | | | BlackRock Disciplined Small Cap Core Fund | |
| | | (Percentages shown are based on Net Assets) | |
| | | | | | | | |
| Common Stocks | | Shares | | | Value | |
Real Estate Investment Trusts (REITs) (concluded) | | | | | | | | |
Winthrop Realty Trust | | | 161 | | | $ | 1,861 | |
| | | | | | | | |
| | | | | | | | 405,296 | |
Real Estate Management & Development — 0.6% | | | | | | | | |
Altisource Residential Corp. | | | 739 | | | | 20,581 | |
Forestar Group, Inc. (a) | | | 806 | | | | 15,604 | |
Tejon Ranch Co. (a) | | | 55 | | | | 1,962 | |
| | | | | | | | |
| | | | | | | | 38,147 | |
Road & Rail — 1.1% | | | | | | | | |
AMERCO (a) | | | 6 | | | | 1,390 | |
Ryder System, Inc. | | | 899 | | | | 62,786 | |
Swift Transportation Co. (a) | | | 276 | | | | 6,389 | |
| | | | | | | | |
| | | | | | | | 70,565 | |
Semiconductors & Semiconductor Equipment — 3.9% | | | | | | | | |
Advanced Energy Industries, Inc. (a) | | | 727 | | | | 17,317 | |
Alpha & Omega Semiconductor Ltd. | | | 137 | | | | 1,062 | |
Ambarella, Inc. | | | 148 | | | | 3,670 | |
Amkor Technology, Inc. (a) | | | 7,276 | | | | 43,656 | |
Axcelis Technologies, Inc. (a) | | | 547 | | | | 1,220 | |
AXT, Inc. (a) | | | 819 | | | | 1,933 | |
Cirrus Logic, Inc. (a) | | | 643 | | | | 12,976 | |
Inphi Corp. (a) | | | 400 | | | | 5,000 | |
Intermolecular, Inc. (a) | | | 123 | | | | 701 | |
International Rectifier Corp. (a) | | | 374 | | | | 8,954 | |
IXYS Corp. | | | 1,084 | | | | 13,344 | |
Kulicke & Soffa Industries, Inc. (a) | | | 1,361 | | | | 17,176 | |
Magnachip Semiconductor Corp. (a) | | | 1,466 | | | | 29,760 | |
Micrel, Inc. | | | 110 | | | | 1,068 | |
Microsemi Corp. (a) | | | 403 | | | | 9,845 | |
Pericom Semiconductor Corp. (a) | | | 899 | | | | 8,576 | |
RF Micro Devices, Inc. (a) | | | 716 | | | | 3,780 | |
Sigma Designs, Inc. (a) | | | 364 | | | | 2,042 | |
Spansion, Inc., Class A (a) | | | 658 | | | | 8,153 | |
STR Holdings, Inc. (a) | | | 997 | | | | 1,834 | |
Supertex, Inc. | | | 42 | | | | 1,090 | |
Synaptics, Inc. (a) | | | 988 | | | | 49,904 | |
| | | | | | | | |
| | | | | | | | 243,061 | |
Software — 4.2% | | | | | | | | |
Advent Software, Inc. | | | 469 | | | | 16,485 | |
Aspen Technology, Inc. (a) | | | 1,954 | | | | 77,242 | |
AVG Technologies NV | | | 1,038 | | | | 17,937 | |
Digimarc Corp. | | | 238 | | | | 4,458 | |
Ebix, Inc. (b) | | | 114 | | | | 1,588 | |
Manhattan Associates, Inc. (a) | | | 535 | | | | 64,339 | |
Progress Software Corp. (a) | | | 1,033 | | | | 27,209 | |
PTC, Inc. (a) | | | 39 | | | | 1,269 | |
Rosetta Stone, Inc. (a) | | | 192 | | | | 2,208 | |
Rovi Corp. (a) | | | 341 | | | | 6,274 | |
Sapiens International Corp. NV | | | 674 | | | | 4,758 | |
SeaChange International, Inc. (a) | | | 73 | | | | 1,083 | |
SolarWinds, Inc. (a) | | | 114 | | | | 3,812 | |
Telenav, Inc. (a) | | | 2,181 | | | | 15,354 | |
TiVo, Inc. (a) | | | 378 | | | | 4,850 | |
Verint Systems, Inc. (a) | | | 335 | | | | 12,703 | |
| | | | | | | | |
| | | | | | | | 261,569 | |
Specialty Retail — 3.7% | | | | | | | | |
Aaron’s, Inc. (a) | | | 1,474 | | | | 42,215 | |
| | | | | | | | |
| Common Stocks | | Shares | | | Value | |
Specialty Retail (concluded) | | | | | | | | |
ANN, Inc. (a) | | | 485 | | | $ | 17,300 | |
Big 5 Sporting Goods Corp. | | | 538 | | | | 10,018 | |
Build-A-Bear-Workshop, Inc. (a) | | | 240 | | | | 2,225 | |
Chico’s FAS, Inc. | | | 596 | | | | 11,139 | |
The Children’s Place Retail Stores, Inc. (a) | | | 150 | | | | 8,250 | |
Express, Inc. (a) | | | 1,160 | | | | 28,548 | |
Haverty Furniture Cos., Inc. | | | 86 | | | | 2,451 | |
Kirkland’s, Inc. (a) | | | 552 | | | | 14,142 | |
Lumber Liquidators Holdings, Inc. (a) | | | 159 | | | | 16,010 | |
The Men’s Wearhouse, Inc. | | | 193 | | | | 9,866 | |
Murphy USA, Inc. (a) | | | 795 | | | | 35,974 | |
Pacific Sunwear of California, Inc. (a) | | | 629 | | | | 1,830 | |
Rent-A-Center, Inc. | | | 221 | | | | 7,527 | |
Sears Hometown and Outlet Stores, Inc. (a) | | | 523 | | | | 16,726 | |
The Wet Seal, Inc., Class A (a) | | | 2,595 | | | | 8,641 | |
| | | | | | | | |
| | | | | | | | 232,862 | |
Textiles, Apparel & Luxury Goods — 1.7% | | | | | | | | |
Cherokee, Inc. | | | 570 | | | | 8,162 | |
Crocs, Inc. (a) | | | 1,292 | | | | 17,830 | |
Culp, Inc. | | | 227 | | | | 4,592 | |
Deckers Outdoor Corp. (a) | | | 126 | | | | 10,413 | |
Delta Apparel, Inc. (a) | | | 337 | | | | 5,628 | |
Iconix Brand Group, Inc. (a) | | | 321 | | | | 12,737 | |
The Jones Group, Inc. | | | 604 | | | | 8,480 | |
Movado Group, Inc. | | | 466 | | | | 21,212 | |
Perry Ellis International, Inc. | | | 349 | | | | 5,420 | |
Unifi, Inc. (a) | | | 350 | | | | 9,709 | |
Vince Holding Corp. (a) | | | 68 | | | | 1,990 | |
| | | | | | | | |
| | | | | | | | 106,173 | |
Thrifts & Mortgage Finance — 2.6% | | | | | | | | |
Banc of California, Inc. | | | 306 | | | | 3,923 | |
Essent Group Ltd. | | | 140 | | | | 3,044 | |
EverBank Financial Corp. | | | 3,067 | | | | 52,354 | |
Heritage Financial Group, Inc. | | | 520 | | | | 9,188 | |
HomeStreet, Inc. | | | 1,788 | | | | 37,834 | |
Meta Financial Group, Inc. | | | 135 | | | | 5,238 | |
MGIC Investment Corp. (a) | | | 498 | | | | 4,039 | |
Provident Financial Holdings, Inc. | | | 1,394 | | | | 20,520 | |
Radian Group, Inc. | | | 251 | | | | 3,579 | |
Walker & Dunlop, Inc. (a) | | | 1,414 | | | | 22,935 | |
| | | | | | | | |
| | | | | | | | 162,654 | |
Trading Companies & Distributors — 0.5% | | | | | | | | |
Aircastle Ltd. | | | 505 | | | | 9,454 | |
Lawson Products, Inc. (a) | | | 140 | | | | 1,788 | |
MRC Global, Inc. (a) | | | 335 | | | | 10,248 | |
Willis Lease Finance Corp. (a) | | | 394 | | | | 7,187 | |
| | | | | | | | |
| | | | | | | | 28,677 | |
Water Utilities — 0.2% | | | | | | | | |
American States Water Co. | | | 504 | | | | 14,707 | |
Wireless Telecommunication Services — 0.4% | | | | | | | | |
Leap Wireless International, Inc. (a) | | | 198 | | | | 3,289 | |
RingCentral, Inc., Class A (a) | | | 99 | | | | 1,571 | |
See Notes to Financial Statements.
| | | | | | |
| 14 | | SEMI-ANNUAL REPORT | | NOVEMBER 30, 2013 | | |
| | | | |
| Schedule of Investments (continued) | | | BlackRock Disciplined Small Cap Core Fund | |
| | | (Percentages shown are based on Net Assets) | |
| | | | | | | | |
| Common Stocks | | Shares | | | Value | |
Wireless Telecommunication Services (concluded) | | | | | | | | |
Telephone & Data Systems, Inc. | | | 643 | | | $ | 17,882 | |
| | | | | | | | |
| | | | | | | | 22,742 | |
Total Common Stocks — 97.2% | | | | | | | 6,077,223 | |
| | | | | | | | |
| Warrants (c) | | | | | | |
Real Estate Management & Development — 0.0% | | | | | | | | |
Tejon Ranch Co. (Issued/Exercisable 8/07/13, 1 Share for 1 Warrant, Expires 8/31/16, Strike Price $40) | | | 8 | | | | 46 | |
Total Warrants — 0.0% | | | | | | | 46 | |
Total Long-Term Investments (Cost — $5,370,765) — 97.2% | | | | | | | 6,077,269 | |
| | | | | | | | |
| | | | | | | |
| | | | | | | | |
| Short-Term Securities | | Shares | | | Value | |
BlackRock Liquidity Funds, TempFund, Institutional Class, 0.07% (d)(e) | | | 110,760 | | | $ | 110,760 | |
| | | Beneficial
Interest
(000) | | | | |
BlackRock Liquidity Series, LLC, Money Market Series, 0.19% (d)(e)(f) | | $ | 42 | | | | 42,139 | |
Total Short-Term Securities (Cost — $152,899) — 2.4% | | | | | | | 152,899 | |
Total Investments (Cost — $5,523,664) — 99.6% | | | | | | | 6,230,168 | |
Other Assets Less Liabilities — 0.4% | | | | | | | 25,736 | |
| | | | | | | | |
Net Assets — 100.0% | | | | | | $ | 6,255,904 | |
| | | | | | | | |
|
| Notes to Schedule of Investments |
| (a) | Non-income producing security. |
| (b) | Security, or a portion of security, is on loan. |
| (c) | Warrants entitle the Fund to purchase a predetermined number of shares of common stock and are non-income producing. The purchase price and number of shares are subject to adjustment under certain conditions until the expiration date of the warrants, if any. |
| (d) | Investments in issuers considered to be an affiliate of the Fund during the period ended November 30, 2013, for purposes of Section 2(a)(3) of the Investment Company Act of 1940, as amended, were as follows: |
| | | | | | | | | | | | | | | | |
| Affiliate | | Shares Held at
May 31, 2013 | | | Net
Activity | | | Shares/Beneficial Interest Held at
November 30, 2013 | | | Income | |
BlackRock Liquidity Funds, TempFund, Institutional Class | | | 103,573 | | | | 7,187 | | | | 110,760 | | | $ | 24 | |
BlackRock Liquidity Series, LLC, Money Market Series | | | — | | | $ | 42,139 | | | $ | 42,139 | | | $ | 209 | |
| (e) | Represents the current yield as of report date. |
| (f) | Security was purchased with the cash collateral from loaned securities. The Fund may withdraw up to 25% of its investment daily, although the manager of the BlackRock Liquidity Series, LLC, Money Market Series, in its sole discretion, may permit an investor to withdraw more than 25% on any one day. |
| Ÿ | | For Fund compliance purposes, the Fund’s industry classifications refer to any one or more of the industry sub-classifications used by one or more widely recognized market indexes or ratings group indexes, and/or as defined by Fund management. These definitions may not apply for purposes of this report, which may combine such industry sub-classifications for reporting ease. |
| Ÿ | | Financial futures contracts as of November 30, 2013 were as follows: |
| | | | | | | | | | | | | | |
Contracts
Purchased | | Issue | | Exchange | | Expiration | | Notional
Value | | | Unrealized
Appreciation | |
| 1 | | E-Mini Russell 2000 Futures | | Intercontinental Exchange | | December 2013 | | $ | 114,170 | | | $ | 6,977 | |
| Ÿ | | Fair Value Measurements — Various inputs are used in determining the fair value of investments or derivative financial instruments. These inputs to valuation techniques are categorized into a disclosure hierarchy consisting of three broad levels for financial statement purposes as follows: |
| | Ÿ | | Level 1 — unadjusted price quotations in active markets/exchanges for identical assets or liabilities that the Fund has the ability to access |
| | Ÿ | | Level 2 — other observable inputs (including, but not limited to, quoted prices for similar assets or liabilities in markets that are active, quoted prices for identical or similar assets or liabilities in markets that are not active, inputs other than quoted prices that are observable for the assets or liabilities (such as interest rates, yield curves, volatilities, prepayment speeds, loss severities, credit risks and default rates) or other market–corroborated inputs) |
| | Ÿ | | Level 3 — unobservable inputs based on the best information available in the circumstances, to the extent observable inputs are not available (including the Fund’s own assumptions used in determining the fair value of investments and derivative financial instruments) |
See Notes to Financial Statements.
| | | | | | |
| | | SEMI-ANNUAL REPORT | | NOVEMBER 30, 2013 | | 15 |
| | | | |
| Schedule of Investments (concluded) | | | BlackRock Disciplined Small Cap Core Fund | |
The hierarchy gives the highest priority to unadjusted quoted prices in active markets for identical assets or liabilities (Level 1 measurements) and the lowest priority to unobservable inputs (Level 3 measurements). Accordingly, the degree of judgment exercised in determining fair value is greatest for instruments categorized in Level 3. The inputs used to measure fair value may fall into different levels of the fair value hierarchy. In such cases, for disclosure purposes, the fair value hierarchy classification is determined based on the lowest level input that is significant to the fair value measurement in its entirety.
Changes in valuation techniques may result in transfers into or out of an assigned level within the disclosure hierarchy. In accordance with the Fund’s policy, transfers between different levels of the fair value disclosure hierarchy are deemed to have occurred as of the beginning of the reporting period. The categorization of a value determined for investments and derivative financial instruments is based on the pricing transparency of the investment and derivative financial instrument and is not necessarily an indication of the risks associated with investing in those securities. For information about the Fund’s policy regarding valuation of investments and derivative financial instruments, please refer to Note 2 of the Notes to Financial Statements.
The following tables summarize the Fund’s investments and derivative financial instruments categorized in the disclosure hierarchy as of November 30, 2013:
| | | | | | | | | | | | | | | | |
| | | Level 1 | | | Level 2 | | | Level 3 | | | Total | |
Assets: | | | | | | | | | | | | | | | | |
Investments: | | | | | | | | | | | | | | | | |
Long-Term Investments1 | | $ | 6,077,148 | | | | — | | | $ | 121 | | | $ | 6,077,269 | |
Short-Term Securities | | | 110,760 | | | $ | 42,139 | | | | — | | | | 152,899 | |
Total | | $ | 6,187,908 | | | $ | 42,139 | | | $ | 121 | | | $ | 6,230,168 | |
| | | | |
1 See above Schedule of Investments for values in each industry excluding Level 3, Biotechnology, within the table. | | | | | |
| |
| | | | | |
| | | Level 1 | | | Level 2 | | | Level 3 | | | Total | |
Derivative Financial Instruments2 | | | | | | | | | | | | | | | | |
Assets: | | | | | | | | | | | | | | | | |
Equity contracts | | $ | 6,977 | | | | — | | | | — | | | $ | 6,977 | |
2 Derivative financial instruments are financial futures contracts, which are valued at the unrealized appreciation/depreciation on the instrument. | | | | | |
| |
| The carrying amount for certain of the Fund’s assets and/or liabilities approximates fair value for financial statement purposes. As of November 30, 2013, such assets and/or liabilities are categorized within the disclosure hierarchy as follows: | | | | | |
| |
| | | | | |
| | | Level 1 | | | Level 2 | | | Level 3 | | | Total | |
Assets: | | | | | | | | | | | | | | | | |
Cash | | $ | 20,830 | | | | — | | | | — | | | $ | 20,830 | |
Cash pledged for other derivative contracts | | | 5,000 | | | | — | | | | — | | | | 5,000 | |
Liabilities: | | | | | | | | | | | | | | | | |
Collateral on securities loaned at value | | | — | | | $ | (42,139 | ) | | | — | | | | (42,139 | ) |
Total | | $ | 25,830 | | | $ | (42,139 | ) | | | — | | | $ | (16,309 | ) |
| | | | |
| |
| There were no transfers between levels during the period ended November 30, 2013. | | | | | |
See Notes to Financial Statements.
| | | | | | |
| 16 | | SEMI-ANNUAL REPORT | | NOVEMBER 30, 2013 | | |
| | |
| Statements of Assets and Liabilities | | |
| | | | | | | | |
| November 30, 2013 (Unaudited) | | BlackRock
Disciplined Small
Cap Core Fund | | | BlackRock
Small Cap
Growth Fund II | |
| | | | | | | | |
| Assets | | | | | | | | |
Investments at value — unaffiliated (including securities loaned at value of $40,261) (cost — $5,370,765) | | $ | 6,077,269 | | | | — | |
Investments at value — affiliated (cost — $152,899) | | | 152,899 | | | | — | |
Investments at value — Master Portfolio (cost — $211,927,779) | | | — | | | $ | 251,101,736 | |
Cash | | | 20,830 | | | | — | |
Cash pledged for other derivative contracts | | | 5,000 | | | | — | |
Withdrawals receivable from the Master Portfolio | | | — | | | | 279,472 | |
Variation margin receivable on other derivative contracts | | | 120 | | | | — | |
Securities lending income receivable — affiliated | | | 69 | | | | | |
Investments sold receivable | | | 38,862 | | | | — | |
Capital shares sold receivable | | | — | | | | 471,535 | |
Deferred offering costs | | | 41,616 | | | | — | |
Receivable from Manager | | | 20,428 | | | | — | |
Dividends receivable | | | 6,791 | | | | — | |
Prepaid expenses | | | 8,548 | | | | 51,336 | |
| | | | |
Total assets | | | 6,372,432 | | | | 251,904,079 | |
| | | | |
| | | | | | | | |
| Liabilities | | | | | | | | |
Collateral on securities loaned at value | | | 42,139 | | | | — | |
Investments purchased payable | | | 42,476 | | | | — | |
Capital shares redeemed payable | | | — | | | | 751,007 | |
Professional fees payable | | | 23,452 | | | | 30,350 | |
Officer’s and Trustees’ fees payable | | | 1,193 | | | | 65 | |
Service and distribution fees payable | | | 68 | | | | 71,210 | |
Administration fees payable | | | 8 | | | | 40,109 | |
Other affiliates payable | | | — | | | | 3,965 | |
Other accrued expenses payable | | | 7,192 | | | | 119,714 | |
| | | | |
Total liabilities | | | 116,528 | | | | 1,016,420 | |
| | | | |
Net Assets | | $ | 6,255,904 | | | $ | 250,887,659 | |
| | | | |
| | | | | | | | |
| Net Assets Consist of | | | | | | | | |
Paid-in capital | | $ | 5,156,829 | | | $ | 184,609,073 | |
Undistributed net investment income (loss) | | | 44,759 | | | | (369,627 | ) |
Accumulated net realized gain | | | 340,835 | | | | — | |
Accumulated net realized gain allocated from the Master Portfolio | | | — | | | | 27,474,256 | |
Net unrealized appreciation/depreciation | | | 713,481 | | | | — | |
Net unrealized appreciation/depreciation allocated from the Master Portfolio | | | — | | | | 39,173,957 | |
| | | | |
Net Assets | | $ | 6,255,904 | | | $ | 250,887,659 | |
| | | | |
See Notes to Financial Statements.
| | | | | | |
| | | SEMI-ANNUAL REPORT | | NOVEMBER 30, 2013 | | 17 |
| | |
| Statements of Assets and Liabilities (concluded) | | |
| | | | | | | | |
| November 30, 2013 (Unaudited) | | BlackRock
Disciplined Small
Cap Core Fund | | | BlackRock
Small Cap
Growth Fund II | |
| | | | | | | | |
| Net Asset Value | | | | | | | | |
Institutional | | | | | | | | |
Net assets | | $ | 6,084,767 | | | $ | 79,318,209 | |
| | | | |
Shares outstanding | | | 501,005 | 1 | | | 4,913,418 | 2 |
| | | | |
Net asset value | | $ | 12.15 | | | $ | 16.14 | |
| | | | |
| | | | | | | | |
Investor A | | | | | | | | |
Net assets | | $ | 113,748 | | | $ | 87,171,841 | |
| | | | |
Shares outstanding | | | 9,384 | 1 | | | 5,644,896 | 2 |
| | | | |
Net asset value | | $ | 12.12 | | | $ | 15.44 | |
| | | | |
| | | | | | | | |
Investor B | | | | | | | | |
Net assets | | | — | | | $ | 1,928,210 | |
| | | | |
Shares outstanding | | | — | | | | 145,774 | 2 |
| | | | |
Net asset value | | | — | | | $ | 13.23 | |
| | | | |
| | | | | | | | |
Investor C | | | | | | | | |
Net assets | | $ | 57,389 | | | $ | 48,387,893 | |
| | | | |
Shares outstanding | | | 4,760 | 1 | | | 3,668,286 | 2 |
| | | | |
Net asset value | | $ | 12.06 | | | $ | 13.19 | |
| | | | |
| | | | | | | | |
Class R | | | | | | | | |
Net assets | | | — | | | $ | 34,081,506 | |
| | | | |
Shares outstanding | | | — | | | | 2,360,430 | 2 |
| | | | |
Net asset value | | | — | | | $ | 14.44 | |
| | | | |
| | 1 | Unlimited number of shares authorized, $0.001 par value. |
| | 2 | 100 million shares authorized, $0.0001 par value. |
See Notes to Financial Statements.
| | | | | | |
| 18 | | SEMI-ANNUAL REPORT | | NOVEMBER 30, 2013 | | |
| | | | | | | | |
| Six Months Ended November 30, 2013 (Unaudited) | | BlackRock
Disciplined Small
Cap Core Fund | | | BlackRock
Small Cap
Growth Fund II | |
| | | | | | | | |
| Investment Income | | | | | | | | |
Dividends — unaffiliated | | $ | 52,583 | | | | — | |
Securities lending — affiliated — net | | | 209 | | | | — | |
Dividends — affiliated | | | 24 | | | | — | |
Net investment income allocated from the Master Portfolio: | | | | | | | | |
Dividends — unaffiliated | | | — | | | $ | 1,299,082 | |
Securities lending — affiliated — net | | | — | | | | 136,484 | |
Dividends — affiliated | | | — | | | | 1,085 | |
Expenses | | | — | | | | (898,619 | ) |
Fees waived | | | — | | | | 184,446 | |
| | | | |
Total income | | | 52,816 | | | | 722,478 | |
| | | | |
| | | | | | | | |
| Expenses | | | | | | | | |
Offering | | | 72,361 | | | | — | |
Professional | | | 18,741 | | | | 35,057 | |
Custodian | | | 14,843 | | | | — | |
Investment advisory | | | 12,734 | | | | — | |
Registration | | | 3,248 | | | | 33,180 | |
Officer and Trustees | | | 2,127 | | | | 51 | |
Administration | | | 2,122 | | | | 228,070 | |
Printing | | | 1,542 | | | | 23,196 | |
Administration — class specific | | | 706 | | | | — | |
Service and distribution — class specific | | | 325 | | | | 412,634 | |
Transfer agent — class specific | | | 238 | | | | 360,998 | |
Miscellaneous | | | 6,488 | | | | 6,315 | |
| | | | |
Total expenses | | | 135,475 | | | | 1,099,501 | |
Less fees waived and/or reimbursed by Manager | | | (112,044 | ) | | | — | |
Less administration fees waived | | | (2,122 | ) | | | — | |
Less administration fees waived — class specific | | | (668 | ) | | | — | |
Less transfer agent fees reimbursed — class specific | | | (172 | ) | | | — | |
| | | | |
Total expenses after fees waived and/or reimbursed | | | 20,469 | | | | 1,099,501 | |
| | | | |
Net investment income (loss) | | | 32,347 | | | | (377,023 | ) |
| | | | |
| | | | | | | | |
| Realized and Unrealized Gain | | | | | | | | |
Net realized gain from: | | | | | | | | |
Investments | | | 284,239 | | | | — | |
Financial futures contracts | | | 7,348 | | | | — | |
Investments and financial futures contracts allocated from the Master Portfolio | | | — | | | | 29,052,380 | |
| | | | |
| | | 291,587 | | | | 29,052,380 | |
| | | | |
Net change in unrealized appreciation/depreciation on: | | | | | | | | |
Investments | | | 577,399 | | | | — | |
Financial futures contracts | | | 8,149 | | | | — | |
Investments and financial futures contracts allocated from the Master Portfolio | | | — | | | | 17,456,274 | |
| | | | |
| | | 585,548 | | | | 17,456,274 | |
| | | | |
Total realized and unrealized gain | | | 877,135 | | | | 46,508,654 | |
| | | | |
Net Increase in Net Assets Resulting from Operations | | $ | 909,482 | | | $ | 46,131,631 | |
| | | | |
See Notes to Financial Statements.
| | | | | | |
| | | SEMI-ANNUAL REPORT | | NOVEMBER 30, 2013 | | 19 |
| | |
| Statements of Changes in Net Assets | | |
| | | | | | | | | | | | | | | | |
| | | BlackRock
Disciplined Small
Cap Core Fund | | | BlackRock
Small Cap
Growth Fund II | |
| Increase (Decrease) in Net Assets: | | Six Months
Ended
November 30,
2013
(Unaudited) | | | Period
March 14, 20131
to May 31, 2013 | | | Six Months
Ended
November 30,
2013
(Unaudited) | | | Year Ended
May 31, 2013 | |
| | | | | | | | | | | | | | | | |
| Operations | | | | | | | | | | | | | | | | |
Net investment income (loss) | | $ | 32,347 | | | $ | 9,909 | | | $ | (377,023 | ) | | $ | (1,086,377 | ) |
Net realized gain | | | 291,587 | | | | 49,248 | | | | 29,052,380 | | | | 44,216,706 | |
Net change in unrealized appreciation/depreciation | | | 585,548 | | | | 127,933 | | | | 17,456,274 | | | | 14,359,572 | |
| | | | | | | | |
Net increase in net assets resulting from operations | | | 909,482 | | | | 187,090 | | | | 46,131,631 | | | | 57,489,901 | |
| | | | | | | | |
| | | | | | | | | | | | | | | | |
| Distributions to Shareholders From | | | | | | | | | | | | | | | | |
Net realized gain: | | | | | | | | | | | | | | | | |
Institutional | | | — | | | | — | | | | (9,208,667 | ) | | | (7,407,847 | )2 |
Investor A | | | — | | | | — | | | | (10,355,199 | ) | | | (9,704,026 | )2 |
Investor B | | | — | | | | — | | | | (322,716 | ) | | | (570,485 | )2 |
Investor C | | | — | | | | — | | | | (6,888,685 | ) | | | (5,761,986 | )2 |
Class R | | | — | | | | — | | | | (4,494,017 | ) | | | (4,912,014 | )2 |
| | | | | | | | |
Decrease in net assets resulting from distributions to shareholders | | | — | | | | — | | | | (31,269,284 | ) | | | (28,356,358 | ) |
| | | | | | | | |
| | | | | | | | | | | | | | | | |
| Capital Share Transactions | | | | | | | | | | | | | | | | |
Net increase (decrease) in net assets derived from capital share transactions | | | 124,332 | | | | 5,035,000 | | | | 20,110,507 | | | | (29,711,591 | ) |
| | | | | | | | |
| | | | | | | | | | | | | | | | |
| Net Assets | | | | | | | | | | | | | | | | |
Total increase (decrease) in net assets | | | 1,033,814 | | | | 5,222,090 | | | | 34,972,854 | | | | (578,048 | ) |
Beginning of period | | | 5,222,090 | | | | — | | | | 215,914,805 | | | | 216,492,853 | |
| | | | | | | | |
End of period | | $ | 6,255,904 | | | $ | 5,222,090 | | | $ | 250,887,659 | | | $ | 215,914,805 | |
| | | | | | | | |
Undistributed net investment income (loss), end of period | | $ | 44,759 | | | $ | 12,412 | | | $ | (369,627 | ) | | $ | 7,396 | |
| | | | | | | | |
| | 1 | Commencement of operations. |
| | 2 | Determined in accordance with federal income tax regulations. |
See Notes to Financial Statements.
| | | | | | |
| 20 | | SEMI-ANNUAL REPORT | | NOVEMBER 30, 2013 | | |
| | | | |
| Financial Highlights | | | BlackRock Disciplined Small Cap Core Fund | |
| | | | | | | | | | | | | | | | | | | | | | | | |
| | | Institutional | | | Investor A | | | Investor C | |
| | | Six Months
Ended
November 30,
2013
(Unaudited) | | | Period
March 14,
20131 to May 31,
2013 | | | Six Months
Ended
November 30,
2013
(Unaudited) | | | Period
March 14,
20131 to May 31,
2013 | | | Six Months
Ended
November 30,
2013
(Unaudited) | | | Period
March 14,
20131 to May 31,
2013 | |
| | | | | | | | | | | | | | | | | | | | | | | | |
| Per Share Operating Performance | | | | | | | | | | | | | | | | | | | | | | | | |
Net asset value, beginning of period | | $ | 10.37 | | | $ | 10.00 | | | $ | 10.37 | | | $ | 10.00 | | | $ | 10.35 | | | $ | 10.00 | |
| | | | | | | | | | | | |
Net investment income (loss)2 | | | 0.06 | | | | 0.02 | | | | 0.04 | | | | 0.01 | | | | 0.01 | | | | (0.00 | )3 |
Net realized and unrealized gain | | | 1.72 | | | | 0.35 | | | | 1.71 | | | | 0.36 | | | | 1.70 | | | | 0.35 | |
| | | | | | | | | | | | |
Net increase from investment operations | | | 1.78 | | | | 0.37 | | | | 1.75 | | | | 0.37 | | | | 1.71 | | | | 0.35 | |
| | | | | | | | | | | | |
Net asset value, end of period | | $ | 12.15 | | | $ | 10.37 | | | $ | 12.12 | | | $ | 10.37 | | | $ | 12.06 | | | $ | 10.35 | |
| | | | | | | | | | | | |
| | | | | | | | | | | | | | | | | | | | | | | | |
| Total Investment Return4,5 | | | | | | | | | | | | | | | | | | | | | | | | |
Based on net asset value | | | 17.17 | % | | | 3.70 | % | | | 16.88 | % | | | 3.70 | % | | | 16.52 | % | | | 3.50 | % |
| | | | | | | | | | | | |
| | | | | | | | | | | | | | | | | | | | | | | | |
| Ratios to Average Net Assets6 | | | | | | | | | | | | | | | | | | | | | | | | |
Total expenses | | | 4.77 | % | | | 7.68 | %7 | | | 5.15 | % | | | 8.16 | %7 | | | 6.02 | % | | | 8.91 | %7 |
| | | | | | | | | | | | |
Total expenses after fees waived and/or reimbursed | | | 0.71 | %8 | | | 0.70 | % | | | 0.96 | %9 | | | 0.95 | % | | | 1.71 | %10 | | | 1.70 | % |
| | | | | | | | | | | | |
Net investment income (loss) | | | 1.16 | % | | | 0.93 | % | | | 0.80 | % | | | 0.67 | % | | | 0.09 | % | | | (0.08 | )% |
| | | | | | | | | | | | |
| | | | | | | | | | | | | | | | | | | | | | | | |
| Supplemental Data | | | | | | | | | | | | | | | | | | | | | | | | |
Net assets, end of period (000) | | $ | 6,085 | | | $ | 5,181 | | | $ | 114 | | | $ | 21 | | | $ | 57 | | | $ | 21 | |
| | | | | | | | | | | | |
Portfolio turnover | | | 70 | % | | | 67 | % | | | 70 | % | | | 67 | % | | | 70 | % | | | 67 | % |
| | | | | | | | | | | | |
| | 1 | Commencement of operations. |
| | 2 | Based on average shares outstanding. |
| | 3 | Amount is greater than $(0.005) per share. |
| | 4 | Where applicable, excludes the effects of any sale charges and assumes the reinvestment of dividends and distributions. |
| | 5 | Aggregate total investment return. |
| | 7 | Organization costs were not annualized in the calculation of the expense ratios. If these expenses were annualized, the total expenses for Institutional, Investor A and Investor C would have been 8.75%, 9.23% and 9.98%, respectively. |
| | 8 | Includes certain tax expenses. Excluding such tax expenses, total expenses after fees waived and/or reimbursed would have been 0.70%. |
| | 9 | Includes certain tax expenses. Excluding such tax expenses, total expenses after fees waived and/or reimbursed would have been 0.95%. |
| | 10 | Includes certain tax expenses. Excluding such tax expenses, total expenses after fees waived and/or reimbursed would have been 1.70%. |
See Notes to Financial Statements.
| | | | | | |
| | | SEMI-ANNUAL REPORT | | NOVEMBER 30, 2013 | | 21 |
| | | | |
| Financial Highlights | | | BlackRock Small Cap Growth Fund II | |
| | | | | | | | | | | | | | | | | | | | | | | | |
| | | Institutional | |
| | | Six Months
Ended
November 30,
2013 (Unaudited) | | | Year Ended May 31, | |
| | | | 2013 | | | 2012 | | | 2011 | | | 2010 | | | 2009 | |
| Per Share Operating Performance | | | | | | | | | | | | | | | | | | | | | | | | |
Net asset value, beginning of period | | $ | 15.20 | | | $ | 13.22 | | | $ | 15.67 | | | $ | 11.64 | | | $ | 9.27 | | | $ | 14.20 | |
| | | | |
Net investment income (loss)1 | | | 0.01 | | | | (0.01 | ) | | | (0.12 | ) | | | (0.13 | ) | | | (0.11 | ) | | | (0.07 | ) |
Net realized and unrealized gain (loss) | | | 3.05 | | | | 3.72 | | | | (2.03 | ) | | | 4.16 | 2 | | | 2.48 | 2 | | | (4.86 | )2 |
| | | | |
Net increase (decrease) from investment operations | | | 3.06 | | | | 3.71 | | | | (2.15 | ) | | | 4.03 | | | | 2.37 | | | | (4.93 | ) |
| | | | |
Distributions from net realized gain | | | (2.12 | ) | | | (1.73 | )3 | | | (0.30 | )3 | | | — | | | | — | | | | — | |
| | | | |
Net asset value, end of period | | $ | 16.14 | | | $ | 15.20 | | | $ | 13.22 | | | $ | 15.67 | | | $ | 11.64 | | | $ | 9.27 | |
| | | | |
| | | | | | | | | | | | | | | | | | | | | | | | |
| Total Investment Return4 | | | | | | | | | | | | | | | | | | | | | | | | |
Based on net asset value | | | 22.39 | %5 | | | 30.95 | % | | | (13.97 | )% | | | 34.62 | %6 | | | 25.57 | %7 | | | (34.72 | )%6 |
| | | | |
| | | | | | | | | | | | | | | | | | | | | | | | |
| Ratios to Average Net Assets8 | | | | | | | | | | | | | | | | | | | | | | | | |
Total expenses | | | 1.11 | %9 | | | 1.26 | %10 | | | 1.29 | %11 | | | 1.24 | %11 | | | 1.31 | % | | | 1.35 | % |
| | | | |
Net investment income (loss) | | | 0.14 | %9 | | | (0.04 | )% | | | (0.84 | )% | | | (0.99 | )% | | | (1.03 | )% | | | (0.69 | )% |
| | | | |
| | | | | | | | | | | | | | | | | | | | | | | | |
| Supplemental Data | | | | | | | | | | | | | | | | | | | | | | | | |
Net assets, end of period (000) | | $ | 79,318 | | | $ | 65,186 | | | $ | 58,673 | | | $ | 155,169 | | | $ | 106,530 | | | $ | 89,346 | |
| | | | |
Portfolio turnover of the Master Portfolio | | | 79 | % | | | 165 | % | | | 143 | % | | | 127 | % | | | 114 | % | | | 75 | % |
| | | | |
| |
| | | Investor A | |
| | | Six Months
Ended
November 30,
2013 (Unaudited) | | | Year Ended May 31, | |
| | | | 2013 | | | 2012 | | | 2011 | | | 2010 | | | 2009 | |
| Per Share Operating Performance | | | | | | | | | | | | | | | | | | | | | | | | |
Net asset value, beginning of period | | $ | 14.63 | | | $ | 12.81 | | | $ | 15.22 | | | $ | 11.34 | | | $ | 9.06 | | | $ | 13.90 | |
| | | | |
Net investment loss1 | | | (0.02 | ) | | | (0.05 | ) | | | (0.14 | ) | | | (0.16 | ) | | | (0.14 | ) | | | (0.09 | ) |
Net realized and unrealized gain (loss) | | | 2.92 | | | | 3.57 | | | | (1.97 | ) | | | 4.04 | 2 | | | 2.42 | 2 | | | (4.75 | )2 |
| | | | |
Net increase (decrease) from investment operations | | | 2.90 | | | | 3.52 | | | | (2.11 | ) | | | 3.88 | | | | 2.28 | | | | (4.84 | ) |
| | | | |
Distributions from net realized gain | | | (2.09 | ) | | | (1.70 | )3 | | | (0.30 | )3 | | | — | | | | — | | | | — | |
| | | | |
Net asset value, end of period | | $ | 15.44 | | | $ | 14.63 | | | $ | 12.81 | | | $ | 15.22 | | | $ | 11.34 | | | $ | 9.06 | |
| | | | |
| | | | | | | | | | | | | | | | | | | | | | | | |
| Total Investment Return4 | | | | | | | | | | | | | | | | | | | | | | | | |
Based on net asset value | | | 22.12 | %5 | | | 30.45 | % | | | (14.12 | )% | | | 34.22 | %6 | | | 25.17 | %7 | | | (34.82 | )%6 |
| | | | |
| | | | | | | | | | | | | | | | | | | | | | | | |
| Ratios to Average Net Assets8 | | | | | | | | | | | | | | | | | | | | | | | | |
Total expenses | | | 1.54 | %9 | | | 1.62 | %12 | | | 1.57 | %11 | | | 1.53 | %11 | | | 1.57 | % | | | 1.59 | % |
| | | | |
Net investment loss | | | (0.28 | )%9 | | | (0.34 | )% | | | (1.11 | )% | | | (1.28 | )% | | | (1.29 | )% | | | (0.95 | )% |
| | | | |
| | | | | | | | | | | | | | | | | | | | | | | | |
| Supplemental Data | | | | | | | | | | | | | | | | | | | | | | | | |
Net assets, end of period (000) | | $ | 87,172 | | | $ | 73,799 | | | $ | 75,467 | | | $ | 219,005 | | | $ | 184,897 | | | $ | 161,557 | |
| | | | |
Portfolio turnover of the Master Portfolio | | | 79 | % | | | 165 | % | | | 143 | % | | | 127 | % | | | 114 | % | | | 75 | % |
| | | | |
| | 1 | Based on average shares outstanding. |
| | 2 | Includes redemption fees, which are less than $0.005 per share. |
| | 3 | Determined in accordance with federal income tax regulations. |
| | 4 | Where applicable, excludes the effects of any sale charges and assumes the reinvestment of dividends and distributions. |
| | 5 | Aggregate total investment return. |
| | 6 | Includes redemption fees received by the Fund, which had no impact on the Fund’s total return. |
| | 7 | Includes redemption fees received by the Fund, which had an impact of 0.01%. |
| | 8 | Includes the Fund’s share of the Master Portfolio’s allocated net expenses and/or net investment loss. |
| | 10 | Includes the Fund’s share of the Master Portfolio’s allocated fees waived of 0.01%. |
| | 11 | Includes the Fund’s share of the Master Portfolio’s allocated fees waived of less than 0.01%. |
| | 12 | Includes the Fund’s share of the Master Portfolio’s allocated fees waived of 0.02%. |
See Notes to Financial Statements.
| | | | | | |
| 22 | | SEMI-ANNUAL REPORT | | NOVEMBER 30, 2013 | | |
| | | | |
| Financial Highlights (continued) | | | BlackRock Small Cap Growth Fund II | |
| | | | | | | | | | | | | | | | | | | | | | | | |
| | | Investor B | |
| |
| Six Months
Ended
November 30,
2013
(Unaudited) |
| | | Year Ended May 31, | |
| | | | 2013 | | | | 2012 | | | | 2011 | | | | 2010 | | | | 2009 | |
| Per Share Operating Performance | | | | | | | | | | | | | | | | | | | | | | | | |
Net asset value, beginning of period | | $ | 12.79 | | | $ | 11.43 | | | $ | 13.77 | | | $ | 10.38 | | | $ | 8.39 | | | $ | 13.06 | |
| | | | |
Net investment loss1 | | | (0.08 | ) | | | (0.17 | ) | | | (0.27 | ) | | | (0.28 | ) | | | (0.25 | ) | | | (0.21 | ) |
Net realized and unrealized gain (loss) | | | 2.53 | | | | 3.14 | | | | (1.77 | ) | | | 3.67 | 2 | | | 2.24 | 2 | | | (4.46 | )2 |
| | | | |
Net increase (decrease) from investment operations | | | 2.45 | | | | 2.97 | | | | (2.04 | ) | | | 3.39 | | | | 1.99 | | | | (4.67 | ) |
| | | | |
Distributions from net realized gain | | | (2.01 | ) | | | (1.61 | )3 | | | (0.30 | )3 | | | — | | | | — | | | | — | |
| | | | |
Net asset value, end of period | | $ | 13.23 | | | $ | 12.79 | | | $ | 11.43 | | | $ | 13.77 | | | $ | 10.38 | | | $ | 8.39 | |
| | | | |
| | | | | | | | | | | | | | | | | | | | | | | | |
| Total Investment Return4 | | | | | | | | | | | | | | | | | | | | | | | | |
Based on net asset value | | | 21.54 | %5 | | | 28.99 | % | | | (15.12 | )% | | | 32.66 | %6 | | | 23.72 | %7 | | | (35.76 | )%6 |
| | | | |
| | | | | | | | | | | | | | | | | | | | | | | | |
| Ratios to Average Net Assets8 | | | | | | | | | | | | | | | | | | | | | | | | |
Total expenses | | | 2.61 | %9,10 | | | 2.79 | %10 | | | 2.72 | %11 | | | 2.71 | %11 | | | 2.78 | % | | | 2.88 | % |
| | | | |
Net investment loss | | | (1.27 | )%9 | | | (1.50 | )% | | | (2.30 | )% | | | (2.46 | )% | | | (2.50 | )% | | | (2.22 | )% |
| | | | |
| | | | | | | | | | | | | | | | | | | | | | | | |
| Supplemental Data | | | | | | | | | | | | | | | | | | | | | | | | |
Net assets, end of period (000) | | $ | 1,928 | | | $ | 2,350 | | | $ | 4,587 | | | $ | 8,363 | | | $ | 10,713 | | | $ | 12,197 | |
| | | | |
Portfolio turnover of the Master Portfolio | | | 79 | % | | | 165 | % | | | 143 | % | | | 127 | % | | | 114 | % | | | 75 | % |
| | | | |
| |
| | | Investor C | |
| |
| Six Months
Ended
November 30,
2013
(Unaudited) |
| | | Year Ended May 31, | |
| | | | 2013 | | | | 2012 | | | | 2011 | | | | 2010 | | | | 2009 | |
| Per Share Operating Performance | | | | | | | | | | | | | | | | | | | | | | | | |
Net asset value, beginning of period | | $ | 12.79 | | | $ | 11.44 | | | $ | 13.76 | | | $ | 10.35 | | | $ | 8.35 | | | $ | 12.96 | |
| | | | |
Net investment loss1 | | | (0.05 | ) | | | (0.15 | ) | | | (0.25 | ) | | | (0.26 | ) | | | (0.23 | ) | | | (0.18 | ) |
Net realized and unrealized gain (loss) | | | 2.50 | | | | 3.15 | | | | (1.77 | ) | | | 3.67 | 2 | | | 2.23 | 2 | | | (4.43 | )2 |
| | | | |
Net increase (decrease) from investment operations | | | 2.45 | | | | 3.00 | | | | (2.02 | ) | | | 3.41 | | | | 2.00 | | | | (4.61 | ) |
| | | | |
Distributions from net realized gain | | | (2.05 | ) | | | (1.65 | )3 | | | (0.30 | )3 | | | — | | | | — | | | | — | |
| | | | |
Net asset value, end of period | | $ | 13.19 | | | $ | 12.79 | | | $ | 11.44 | | | $ | 13.76 | | | $ | 10.35 | | | $ | 8.35 | |
| | | | |
| | | | | | | | | | | | | | | | | | | | | | | | |
| Total Investment Return4 | | | | | | | | | | | | | | | | | | | | | | | | |
Based on net asset value | | | 21.65 | %5 | | | 29.31 | % | | | (14.98 | )% | | | 32.95 | %6 | | | 23.95 | %7 | | | (35.57 | )%6 |
| | | | |
| | | | | | | | | | | | | | | | | | | | | | | | |
| Ratios to Average Net Assets8 | | | | | | | | | | | | | | | | | | | | | | | | |
Total expenses | | | 2.31 | %9 | | | 2.52 | %12 | | | 2.52 | %11 | | | 2.48 | %11 | | | 2.59 | % | | | 2.66 | % |
| | | | |
Net investment loss | | | (1.05 | )%9 | | | (1.29 | )% | | | (2.10 | )% | | | (2.24 | )% | | | (2.32 | )% | | | (2.01 | )% |
| | | | |
| | | | | | | | | | | | | | | | | | | | | | | | |
| Supplemental Data | | | | | | | | | | | | | | | | | | | | | | | | |
Net assets, end of period (000) | | $ | 48,388 | | | $ | 43,649 | | | $ | 40,529 | | | $ | 62,040 | | | $ | 60,833 | | | $ | 53,668 | |
| | | | |
Portfolio turnover of the Master Portfolio | | | 79 | % | | | 165 | % | | | 143 | % | | | 127 | % | | | 114 | % | | | 75 | % |
| | | | |
| | 1 | Based on average shares outstanding. |
| | 2 | Includes redemption fees, which are less than $0.005 per share. |
| | 3 | Determined in accordance with federal income tax regulations. |
| | 4 | Where applicable, excludes the effects of any sale charges and assumes the reinvestment of dividends and distributions. |
| | 5 | Aggregate total investment return. |
| | 6 | Includes redemption fees received by the Fund, which had no impact on the Fund’s total return. |
| | 7 | Includes redemption fees received by the Fund, which had an impact of 0.01%. |
| | 8 | Includes the Fund’s share of the Master Portfolio’s allocated net expenses and/or net investment loss. |
| | 10 | Includes the Fund’s share of the Master Portfolio’s allocated fees waived of 0.01%. |
| | 11 | Includes the Fund’s share of the Master Portfolio’s allocated fees waived of less than 0.01%. |
| | 12 | Includes the Fund’s share of the Master Portfolio’s allocated fees waived of 0.02%. |
See Notes to Financial Statements.
| | | | | | |
| | | SEMI-ANNUAL REPORT | | NOVEMBER 30, 2013 | | 23 |
| | | | |
| Financial Highlights (concluded) | | | BlackRock Small Cap Growth Fund II | |
| | | | | | | | | | | | | | | | | | | | | | | | |
| | | Class R | |
| |
| Six Months
Ended
November 30,
2013
(Unaudited) |
| | | Year Ended May 31, | |
| | | | 2013 | | | | 2012 | | | | 2011 | | | | 2010 | | | | 2009 | |
| Per Share Operating Performance | | | | | | | | | | | | | | | | | | | | | | | | |
Net asset value, beginning of period | | $ | 13.80 | | | $ | 12.19 | | | $ | 14.55 | | | $ | 10.88 | | | $ | 8.72 | | | $ | 13.46 | |
| | | | |
Net investment loss1 | | | (0.03 | ) | | | (0.08 | ) | | | (0.19 | ) | | | (0.20 | ) | | | (0.17 | ) | | | (0.14 | ) |
Net realized and unrealized gain (loss) | | | 2.75 | | | | 3.38 | | | | (1.87 | ) | | | 3.87 | 2 | | | 2.33 | 2 | | | (4.60 | )2 |
| | | | |
Net increase (decrease) from investment operations | | | 2.72 | | | | 3.30 | | | | (2.06 | ) | | | 3.67 | | | | 2.16 | | | | (4.74 | ) |
| | | | |
Distributions from net realized gain | | | (2.08 | ) | | | (1.69 | )3 | | | (0.30 | )3 | | | — | | | | — | | | | — | |
| | | | |
Net asset value, end of period | | $ | 14.44 | | | $ | 13.80 | | | $ | 12.19 | | | $ | 14.55 | | | $ | 10.88 | | | $ | 8.72 | |
| | | | |
| | | | | | | | | | | | | | | | | | | | | | | | |
| Total Investment Return4 | | | | | | | | | | | | | | | | | | | | | | | | |
Based on net asset value | | | 22.07 | %5 | | | 30.05 | % | | | (14.43 | )% | | | 33.73 | %6 | | | 24.77 | %7 | | | (35.22 | )%6 |
| | | | |
| | | | | | | | | | | | | | | | | | | | | | | | |
| Ratios to Average Net Assets8 | | | | | | | | | | | | | | | | | | | | | | | | |
Total expenses | | | 1.70 | %9 | | | 1.89 | %10 | | | 1.91 | %11 | | | 1.90 | %11 | | | 1.96 | % | | | 2.12 | % |
| | | | |
Net investment loss | | | (0.43 | )%9 | | | (0.60 | )% | | | (1.49 | )% | | | (1.65 | )% | | | (1.69 | )% | | | (1.49 | )% |
| | | | |
| | | | | | | | | | | | | | | | | | | | | | | | |
| Supplemental Data | | | | | | | | | | | | | | | | | | | | | | | | |
Net assets, end of period (000) | | $ | 34,082 | | | $ | 30,932 | | | $ | 37,237 | | | $ | 59,251 | | | $ | 52,704 | | | $ | 39,445 | |
| | | | |
Portfolio turnover of the Master Portfolio. | | | 79 | % | | | 165 | % | | | 143 | % | | | 127 | % | | | 114 | % | | | 75 | % |
| | | | |
| | 1 | Based on average shares outstanding. |
| | 2 | Includes redemption fees, which are less than $0.005 per share. |
| | 3 | Determined in accordance with federal income tax regulations. |
| | 4 | Where applicable, assumes the reinvestment of dividends and distributions. |
| | 5 | Aggregate total investment return. |
| | 6 | Includes redemption fees received by the Fund, which had no impact on the Fund’s total return. |
| | 7 | Includes redemption fees received by the Fund, which had an impact of 0.01%. |
| | 8 | Includes the Fund’s share of the Master Portfolio’s allocated net expenses and/or net investment loss. |
| | 10 | Includes the Fund’s share of the Master Portfolio’s allocated fees waived of 0.01%. |
| | 11 | Includes the Fund’s share of the Master Portfolio’s allocated fees waived of less than 0.01%. |
See Notes to Financial Statements.
| | | | | | |
| 24 | | SEMI-ANNUAL REPORT | | NOVEMBER 30, 2013 | | |
| | |
| Notes to Financial Statements (Unaudited) | | |
1. Organization:
BlackRock Disciplined Small Cap Core Fund (“Disciplined Small Cap Core Fund”), a series of BlackRock FundsSM (the “Trust”), and BlackRock Small Cap Growth Fund II (“Small Cap Growth Fund II”), a series of BlackRock Series, Inc. (the “Corporation”) (collectively, the “Funds” or individually, a “Fund”), are each registered under the Investment Company Act of 1940, as amended (the “1940 Act”), as a diversified, open-end management investment company. The Trust is organized as a Massachusetts business trust. The Corporation is organized as a Maryland corporation. Small Cap Growth Fund II seeks to achieve its investment objective by investing all of its assets in BlackRock Master Small Cap Growth Portfolio (the “Master Portfolio”) of BlackRock Master LLC (the “Master LLC”), an affiliate of Small Cap Growth Fund II, which has the same investment objective and strategies as Small Cap Growth Fund II. The value of Small Cap Growth Fund II’s investment in the Master Portfolio reflects Small Cap Growth Fund II’s proportionate interest in the net assets of the Master Portfolio. The performance of Small Cap Growth Fund II is directly affected by the performance of the Master Portfolio. The percentage of the Master Portfolio owned by Small Cap Growth Fund II at November 30, 2013 was 100%. As such, the financial statements of the Master Portfolio, including the Schedule of Investments, are included elsewhere in this report and should be read in conjunction with Small Cap Growth Fund II’s financial statements.
Each Fund offers multiple classes of shares. Institutional Shares are sold without a sales charge and only to certain eligible investors. Investor A Shares are generally sold with an initial sales charge, but may be subject to a CDSC for certain redemptions where no initial sales charge was paid at the time of purchase. Investor B and Investor C Shares may be subject to a CDSC. Class R Shares are sold without a sales charge and only to certain employer-sponsored retirement plans. All classes of shares have identical voting, dividend, liquidation and other rights and are subject to the same terms and conditions, except that Investor A, Investor B, Investor C and Class R Shares bear certain expenses related to the shareholder servicing of such shares, and Investor B, Investor C and Class R Shares also bear certain expenses related to the distribution of such shares. Investor B Shares automatically convert to Investor A Shares after approximately eight years. Investor B Shares are only available through exchanges and dividend reinvestments by current holders and for purchase by certain employer-sponsored retirement plans. Each class has exclusive voting rights with respect to matters relating to its shareholder servicing and distribution expenditures (except that Investor B shareholders may vote on material changes to the Investor A distribution and service plan).
2. Significant Accounting Policies:
Each Fund’s financial statements are prepared in conformity with accounting principles generally accepted in the United States of America (“US GAAP”), which may require management to make estimates and assumptions that affect the reported amounts of assets and liabilities in the financial statements and the reported amounts of increases and decreases in net assets from operations during the reporting period.
Actual results could differ from those estimates. The following is a summary of significant accounting policies followed by the Funds:
Valuation: US GAAP defines fair value as the price the Funds would receive to sell an asset or pay to transfer a liability in an orderly transaction between market participants at the measurement date. Disciplined Small Cap Core Fund determines the fair values of its financial instruments at market value using independent dealers or pricing services under policies approved by the Board of Trustees of the Trust (the “Board”). The BlackRock Global Valuation Methodologies Committee (the “Global Valuation Committee”) is the committee formed by management to develop global pricing policies and procedures and to provide oversight of the pricing function for Disciplined Small Cap Core Fund for all financial instruments.
Small Cap Growth Fund II’s policy is to fair value its financial instruments at market value. Small Cap Growth Fund II records its investment in the Master Portfolio at fair value based on Small Cap Growth Fund II’s proportionate interest in the net assets of the Master Portfolio. Valuation of securities held by the Master Portfolio is discussed in Note 2 of the Master Portfolio’s Notes to Financial Statements, which are included elsewhere in this report.
Disciplined Small Cap Core Fund’s equity investments traded on a recognized securities exchange or the NASDAQ Stock Market (“NASDAQ”) are valued at the last reported sale price that day or the NASDAQ official closing price, if applicable. For equity investments traded on more than one exchange, the last reported sale price on the exchange where the stock is primarily traded is used. Equity investments traded on a recognized exchange for which there were no sales on that day are valued at the last available bid (long positions) or ask (short positions) price. Financial futures contracts traded on exchanges are valued at their last sale price. Investments in open-end registered investment companies are valued at NAV each business day.
Disciplined Small Cap Core Fund values its investments in BlackRock Liquidity Series, LLC, Money Market Series (the “Money Market Series”) at fair value, which is ordinarily based upon its pro rata ownership in the underlying fund’s net assets. The Money Market Series seeks current income consistent with maintaining liquidity and preserving capital. Although the Money Market Series is not registered under the 1940 Act, its investments will follow the parameters of investments by a money market fund that is subject to Rule 2a-7 under the 1940 Act. Disciplined Small Cap Core Fund may withdraw up to 25% of its investment daily, although the manager of the Money Market Series, in its sole discretion, may permit an investor to withdraw more than 25% on any one day.
In the event that application of these methods of valuation results in a price for an investment that is deemed not to be representative of the market value of such investment, or if a price is not available, the investment will be valued by the Global Valuation Committee, or its delegate, in accordance with a policy approved by the Board as reflecting fair value (“Fair Value Assets”) for Disciplined Small Cap Core Fund. When
| | | | | | |
| | | SEMI-ANNUAL REPORT | | NOVEMBER 30, 2013 | | 25 |
| | |
| Notes to Financial Statements (continued) | | |
determining the price for Fair Value Assets, the Global Valuation Committee, or its delegate, seeks to determine the price that Disciplined Small Cap Core Fund might reasonably expect to receive from the current sale of that asset in an arm’s-length transaction. Fair value determinations shall be based upon all available factors that the Global Valuation Committee, or its delegate, deem relevant consistent with the principles of fair value measurement which include the market approach, income approach and/or in the case of recent investments, the cost approach, as appropriate. The market approach generally consists of using comparable market transactions. The income approach generally is used to discount future cash flows to present value and is adjusted for liquidity as appropriate. These factors include but are not limited to: (i) attributes specific to the investment or asset; (ii) the principal market for the investment or asset; (iii) the customary participants in the principal market for the investment or asset; (iv) data assumptions by market participants for the investment or asset, if reasonably available; (v) quoted prices for similar investments or assets in active markets; and (vi) other factors, such as future cash flows, interest rates, yield curves, volatilities, prepayment speeds, loss severities, credit risks, recovery rates, liquidation amounts and/or default rates. Due to the inherent uncertainty of valuations of such investments, the fair values may differ from the values that would have been used had an active market existed. The Global Valuation Committee, or its delegate, employs various methods for calibrating valuation approaches for investments where an active market does not exist, including regular due diligence of Disciplined Small Cap Core Fund’s pricing vendors, regular reviews of key inputs and assumptions, transactional back-testing or disposition analysis to compare unrealized gains and losses to realized gains and losses, reviews of missing or stale prices and large movements in market values and reviews of any market related activity. The pricing of all Fair Value Assets is subsequently reported to the Board or a committee thereof on a quarterly basis.
Segregation and Collateralization: In cases where the Fund enters into certain investments (e.g., financial futures contracts) that would be “senior securities” for 1940 Act purposes, the Fund may segregate or designate on its books and records cash or liquid securities having a market value at least equal to the amount of the Fund’s future obligations under such investments. Doing so allows the investment to be excluded from treatment as a “senior security.” Furthermore, if required by an exchange or counterparty agreement, the Fund may be required to deliver/deposit cash and/or securities to/with an exchange, or broker-dealer or custodian as collateral for certain investments or obligations.
Investment Transactions and Investment Income: For Disciplined Small Cap Core Fund, for financial reporting purposes, investment transactions are recorded on the dates the transactions are entered into (the trade dates). Realized gains and losses on investment transactions are determined on the identified cost basis. Dividend income is recorded on the ex-dividend dates. Upon notification from issuers, some of the dividend income received from a real estate investment trust may be redesignated as a reduction of cost of the related investment and/or realized gain. Income, expenses and realized and unrealized gains and losses are
allocated daily to each class based on its relative net assets. For Small Cap Growth Fund II, for financial reporting purposes, contributions to and withdrawals from the Master Portfolio are accounted on a trade date basis. Small Cap Growth Fund II records daily its proportionate share of the Master Portfolio’s income, expenses and realized and unrealized gains and losses. In addition, Small Cap Growth Fund II accrues its own expenses. Income, expenses and realized and unrealized gains and losses are allocated daily to each class based on its relative net assets.
Dividends and Distributions: Dividends and distributions paid by the Funds are recorded on the ex-dividend dates. The character and timing of dividends and distributions are determined in accordance with federal income tax regulations, which may differ from US GAAP.
Income Taxes: It is each Fund’s policy to comply with the requirements of the Internal Revenue Code of 1986, as amended, applicable to regulated investment companies and to distribute substantially all of its taxable income to its shareholders. Therefore, no federal income tax provision is required.
Each Fund files US federal and various state and local tax returns. No income tax returns are currently under examination. The statute of limitations on Small Cap Growth Fund II’s US federal tax returns remains open for each of the four years ended May 31, 2013. The statute of limitations on Disciplined Small Cap Core Fund’s US federal, state and local tax returns remain open for the period ended May 31, 2013. The statutes of limitations on Small Cap Growth Fund II’s state and local tax returns may remain open for an additional year depending upon the jurisdiction.
Management has analyzed tax laws and regulations and their application to the Funds’ facts and circumstances and does not believe there are any uncertain tax positions that require recognition of a tax liability.
Offering Costs: Offering costs are amortized over a 12-month period beginning with the commencement of operations.
Other: Expenses directly related to a Fund or its classes are charged to that Fund or class. Other operating expenses shared by several funds are pro rated among those funds on the basis of relative net assets or other appropriate methods. Expenses directly related to a Fund and other shared expenses pro rated to a Fund are allocated daily to each class based on its relative net assets or other appropriate methods.
Disciplined Small Cap Core Fund has an arrangement with the custodian whereby fees may be reduced by credits earned on uninvested cash balances, which, if applicable, are shown as fees paid indirectly in the Statements of Operations. The custodian imposes fees on overdrawn cash balances, which can be offset by accumulated credits earned or may result in additional custody charges.
| | | | | | |
| 26 | | SEMI-ANNUAL REPORT | | NOVEMBER 30, 2013 | | |
| | |
| Notes to Financial Statements (continued) | | |
3. Securities and Other Investments:
Securities Lending: Disciplined Small Cap Core Fund may lend securities to approved borrowers, such as banks, brokers and other financial institutions. The borrower pledges cash, securities issued or guaranteed by the US government or irrevocable letters of credit issued by a bank as collateral. The initial collateral received by Disciplined Small Cap Core Fund should have a value of at least 102% of the current value of the loaned securities for securities traded on US exchanges and a value of at least 105% for all other securities. The collateral is maintained thereafter in an amount equal to at least 100% of the current market value of the loaned securities. The market value of the loaned securities is determined at the close of business of Disciplined Small Cap Core Fund and any additional required collateral is delivered to Disciplined Small Cap Core Fund on the next business day. Securities lending income, as disclosed in the Statements of Operations, represents the income earned from the investment of the cash collateral, net of rebates paid to, or fees paid by, borrowers and less the fees paid to the securities lending agent. During the term of the loan, Disciplined Small Cap Core Fund earns dividend or interest income on the securities loaned but does not receive interest income on the securities received as collateral. Loans of securities are terminable at any time and the borrower, after notice, is required to return borrowed securities within the standard time period for settlement of securities transactions.
The market value of securities on loan and the value of the related collateral are shown separately in the Statements of Assets and Liabilities as a component of investments at value, and collateral on securities loaned at value, respectively. The cash collateral invested by the securities lending agent, BlackRock Investment Management, LLC (“BIM”), if any, is disclosed in the Schedule of Investments.
Securities lending transactions are entered into by Disciplined Small Cap Core Fund under Master Securities Lending Agreements (“MSLA”) which provide the right, in the event of default (including bankruptcy or insolvency) for the non-defaulting party to liquidate the collateral and calculate a net exposure to the defaulting party or request additional collateral. In the event that a borrower defaults, Disciplined Small Cap Core Fund, as lender, would offset the market value of the collateral received against the market value of the securities loaned. The value of the collateral is typically greater than that of the market value of the securities loaned, leaving the lender with a net amount payable to the defaulting party. However, bankruptcy or insolvency laws of a particular jurisdiction may impose restrictions on or prohibitions against such a right of offset in the event of a MSLA counterparty’s bankruptcy or insolvency. Under the MSLA, the borrower can resell or re-pledge the loaned securities, and Disciplined Small Cap Core Fund can reinvest cash collateral, or, upon an event of default, resell or re-pledge the collateral.
The following table is a summary of Disciplined Small Cap Core Fund’s securities lending agreements by counterparty which are subject to offset under a MSLA as of November 30, 2013:
| | | | | | | | | | | | |
| Counterparty | | Securities Loaned
at Value | | | Cash Collateral
Received1 | | | Net Amount | |
Credit Suisse Securities (USA) LLC | | $ | 13,764 | | | $ | (13,764 | ) | | | — | |
JP Morgan Securities LLC | | | 26,497 | | | | (26,497 | ) | | | — | |
| | | | |
Total | | $ | 40,261 | | | $ | (40,261 | ) | | | — | |
| | | | |
| | 1 | Collateral with a value of $42,139 has been received in connection with securities lending transactions. Excess of collateral received from the individual counterparty is not shown for financial reporting purposes. |
The risks of securities lending also include the risk that the borrower may not provide additional collateral when required or may not return the securities when due. To mitigate this risk, Disciplined Small Cap Core Fund benefits from a borrower default indemnity provided by BlackRock, Inc. (“BlackRock”). BlackRock’s indemnity allows for full replacement of the securities lent. Disciplined Small Cap Core Fund also could suffer a loss if the value of an investment purchased with cash collateral falls below the market value of loaned securities or if the value of an investment purchased with cash collateral falls below the value of the original cash collateral received. During the six months ended November 30, 2013, any securities on loan were collateralized by cash.
4. Derivative Financial Instruments:
Disciplined Small Cap Core Fund engages in various portfolio investment strategies using derivative contracts both to increase the returns of Disciplined Small Cap Core Fund and/or to economically hedge its exposure to certain risks such as equity risk. These contracts may be transacted on an exchange or over-the-counter (“OTC”).
Financial Futures Contracts: Disciplined Small Cap Core Fund purchases and/or sells financial futures contracts to gain exposure to, or economically hedge against, changes in the value of equity securities (equity risk). Financial futures contracts are agreements between Disciplined Small Cap Core Fund and a counterparty to buy or sell a specific quantity of an underlying instrument at a specified price and at a specified date. Depending on the terms of the particular contract, financial futures contracts are settled either through physical delivery of the underlying instrument on the settlement date or by payment of a cash settlement amount on the settlement date.
Upon entering into a financial futures contract, Disciplined Small Cap Core Fund is required to deposit initial margin with the broker in the form of cash or securities in an amount that varies depending on a contract’s size and risk profile. The initial margin deposit must then be maintained at an established level over the life of the contract. Securities deposited as initial margin are designated on the Schedule of Investments and cash deposited, if any, is recorded on the Statements of Assets and Liabilities as cash pledged for other derivative contracts. Pursuant to the contract, Disciplined Small Cap Core Fund agrees to receive from or pay to the broker an amount of cash equal to the daily fluctuation in value of the contract. Such receipts or payments are known as variation margin. Variation margin is recorded by Disciplined Small Cap Core Fund as
| | | | | | |
| | | SEMI-ANNUAL REPORT | | NOVEMBER 30, 2013 | | 27 |
| | |
| Notes to Financial Statements (continued) | | |
unrealized appreciation or depreciation and, if applicable, as a receivable or payable for variation margin in the Statements of Assets and Liabilities.
When the contract is closed, Disciplined Small Cap Core Fund records a realized gain or loss equal to the difference between the value of the contract at the time it was opened and the value at the time it was closed. The use of financial futures contracts involves the risk of an imperfect correlation in the movements in the price of financial futures contracts and the underlying assets.
The following is a summary of Disciplined Small Cap Core Fund’s derivative financial instruments categorized by risk exposure:
| | | | | | | | |
| Fair Values of Derivative Financial Instruments as of November 30, 2013 | |
Derivative Assets | |
| | | Statements of Assets and Liabilities Location | | | Value | |
Equity contracts | | | Net unrealized appreciation/depreciation | 1 | | $ | 6,977 | |
| | 1 | Includes cumulative appreciation/depreciation on financial futures contracts as reported in the Schedule of Investments. Only current day’s variation margin is reported within the Statements of Assets and Liabilities. |
| | | | |
The Effect of Derivative Financial Instruments in the Statements of Operations Six Months Ended November 30, 2013 | |
Net Realized Gain From | |
Equity contracts: | | | | |
Financial futures contracts | | $ | 7,348 | |
| | |
| | | | |
Net Change in Unrealized Appreciation/Depreciation on | |
Equity contracts: | | | | |
Financial futures contracts | | $ | 8,149 | |
| | |
For the six months ended November 30, 2013, the average quarterly balances of outstanding derivative financial instruments for Disciplined Small Cap Core were as follows:
| | | | |
Financial futures contracts: | | | | |
Average number of contracts purchased | | | 1 | |
Average notional value of contracts purchased | | $ | 107,590 | |
Counterparty Credit Risk: A derivative contract may suffer a mark to market loss if the value of the contract decreases due to an unfavorable change in the market rates or values of the underlying instrument. Losses can also occur if the counterparty does not perform under the contract.
Disciplined Small Cap Core Fund’s risk of loss from counterparty credit risk on OTC derivatives is generally limited to the aggregate unrealized gain netted against any collateral held by Disciplined Small Cap Core Fund.
With exchange traded futures, there is less counterparty credit risk to Disciplined Small Cap Core Fund since the exchange or clearinghouse, as counterparty to such instrument, guarantees against a possible default. The clearinghouse stands between the buyer and the seller of the contract; therefore, the credit risk is limited to failure of the clearing-house.
While offset rights may exist under applicable law, Disciplined Small Cap Core Fund does not have a contractual right of offset against a clearing broker or clearinghouse in the event of a default (including the bankruptcy or insolvency) of the clearing broker or clearinghouse. Additionally, credit risk exists in exchange traded futures with respect to initial and variation margin that is held in a clearing broker’s customer accounts. While clearing brokers are required to segregate customer margin from their own assets, in the event that a clearing broker becomes insolvent or goes into bankruptcy and at that time there is a shortfall in the aggregate amount of margin held by the clearing broker for all its clients, typically the shortfall would be allocated on a pro rata basis across all the clearing broker’s customers, potentially resulting in losses to Disciplined Small Cap Core Fund.
5. Investment Advisory Agreement and Other Transactions with Affiliates:
The PNC Financial Services Group, Inc. is the largest stockholder and an affiliate, for 1940 Act purposes, of BlackRock.
The Trust, on behalf of Disciplined Small Cap Core Fund, entered into an Investment Advisory Agreement with the Manager, Disciplined Small Cap Core Fund’s investment advisor, an indirect, wholly owned subsidiary of BlackRock, to provide investment advisory and administration services. The Manager is responsible for the management of Disciplined Small Cap Core Fund’s portfolio and provides the necessary personnel, facilities, equipment and certain other services necessary to the operations of Disciplined Small Cap Core Fund. For such services, Disciplined Small Cap Core Fund pays the Manager a monthly fee based on a percentage of Disciplined Small Cap Core Fund’s average daily net assets at the following annual rates:
| | | | |
| Average Daily Net Assets | | Investment
Advisory Fee | |
First $1 Billion | | | 0.45 | % |
$1 Billion - $3 Billion | | | 0.42 | % |
$3 Billion - $5 Billion | | | 0.41 | % |
$5 Billion - $10 Billion | | | 0.39 | % |
Greater than $10 Billion | | | 0.38 | % |
The Manager voluntarily agreed to waive its investment advisory fees by the amount of investment advisory fees Disciplined Small Cap Core Fund pays to the Manager indirectly through its investment in affiliated money market funds. However, the Manager does not waive its investment advisory fees by the amount of investment advisory fees paid in connection with Disciplined Small Cap Core Fund’s investment in other affiliated investment companies, if any. This amount is included in fees waived and/or reimbursed by Manager in the Statements of Operations. For the six months ended November 30, 2013, the amount waived was $42.
For Disciplined Small Cap Core Fund, the Manager entered into a sub-advisory agreement with BlackRock Fund Advisors (“BFA”), an affiliate of the Manager. The Manager pays BFA, for services it provides, a monthly fee that is a percentage of the investment advisory fees paid by Disciplined Small Cap Core Fund to the Manager.
| | | | | | |
| 28 | | SEMI-ANNUAL REPORT | | NOVEMBER 30, 2013 | | |
| | |
| Notes to Financial Statements (continued) | | |
Each Fund entered into a Distribution Agreement and a Distribution and Service Plan or Distribution Plans (referred to herein as the “Distribution Plan”) with BlackRock Investments, LLC (“BRIL”), an affiliate of the Manager/Administrator. Pursuant to the Distribution Plan and in accordance with Rule 12b-1 under the 1940 Act, each Fund pays BRIL ongoing service and distribution fees. The fees are accrued daily and paid monthly at annual rates based upon the average daily net assets of the shares of each Fund as follows:
| | | | | | | | |
| | | Service
Fee | | | Distribution
Fee | |
Investor A | | | 0.25 | % | | | — | |
Investor B | | | 0.25 | % | | | 0.75 | % |
Investor C | | | 0.25 | % | | | 0.75 | % |
Class R | | | 0.25 | % | | | 0.25 | % |
Pursuant to sub-agreements with BRIL, broker-dealers and BRIL provide shareholder servicing and distribution services to each Fund. The ongoing service and/or distribution fee compensates BRIL and each broker-dealer for providing shareholder servicing and/or distribution related services to Investor A, Investor B, Investor C and Class R shareholders.
For the six months ended November 30, 2013, the following table shows the class specific service and distribution fees borne directly by each class of each Fund:
| | | | | | | | | | | | | | | | | | | | |
| | | Investor A | | | Investor B | | | Investor C | | | Class R | | | Total | |
Disciplined Small Cap Core Fund | | $ | 111 | | | | — | | | $ | 214 | | | | — | | | $ | 325 | |
Small Cap Growth Fund II | | $ | 97,736 | | | $ | 10,135 | | | $ | 224,785 | | | $ | 79,978 | | | $ | 412,634 | |
Pursuant to written agreements, certain financial intermediaries, some of which may be affiliates, provide the Funds with sub-accounting, recordkeeping, sub-transfer agency and other administrative services with respect to sub-accounts they service. For these services, these entities receive an asset based fee or an annual fee per shareholder account, which will vary depending on share class and/or net assets.
The Manager/Administrator maintains a call center, which is responsible for providing certain shareholder services to the Funds, such as responding to shareholder inquiries and processing transactions based upon instructions from shareholders with respect to the subscription and redemption of Fund shares. For the six months ended November 30, 2013, Small Cap Growth Fund II reimbursed the Administrator the following amounts for costs incurred in running the call center, which are included in transfer agent — class specific in the Statements of Operations:
| | | | | | | | | | | | | | | | | | | | | | |
| Institutional | | | Investor A | | | Investor B | | | Investor C | | | Class R | | | Total | |
| $ | 324 | | | $ | 730 | | | $ | 68 | | | $ | 528 | | | $ | 718 | | | $ | 2,368 | |
For the six months ended November 30, 2013, the following table shows the class specific transfer agent fees borne directly by each class of each Fund:
| | | | | | | | | | | | | | | | | | | | | | | | |
| | | Institutional | | | Investor A | | | Investor B | | | Investor C | | | Class R | | | Total | |
Disciplined Small Cap Core Fund | | $ | 151 | | | $ | 47 | | | | — | | | $ | 40 | | | | — | | | $ | 238 | |
Small Cap Growth Fund II | | $ | 71,244 | | | $ | 147,503 | | | $ | 7,108 | | | $ | 89,636 | | | $ | 45,507 | | | $ | 360,998 | |
The Corporation, on behalf of Small Cap Growth Fund II, entered into an Administration Agreement with BlackRock Advisors, LLC (the “Administrator”), an indirect, wholly owned subsidiary of BlackRock, to provide administrative services (other than investment advice and related portfolio activities). For such services, Small Cap Growth Fund II pays the Administrator a monthly fee at an annual rate of 0.20% of the average daily value of Small Cap Growth Fund II’s net assets. Small Cap Growth Fund II does not pay an investment advisory fee or investment management fee.
BNY Mellon Investment Servicing (US) Inc. (“BNYMIS”) and the Manager act as co-administrators for Disciplined Small Cap Core Fund. For these services, the co-administrators receive an administration fee computed daily and payable monthly to each administrator pursuant to separate fee arrangements, based on a percentage of the average daily net assets of Disciplined Small Cap Core Fund. The combined administration fee, which is shown as administration in the Statements of Operations, is paid at the following annual rates:
| | | | |
| Average Daily Net Assets | | Administration Fee | |
First $500 Million | | | 0.075 | % |
$500 Million - $1 Billion | | | 0.065 | % |
Greater than $1 Billion | | | 0.055 | % |
In addition, each of Disciplined Small Cap Core Fund’s share classes is charged an administration fee, which is shown as administration — class specific in the Statements of Operations, based on the following percentages of average daily net assets of each respective class:
| | | | |
| Average Daily Net Assets | | Administration Fee
— Class Specific | |
First $500 Million | | | 0.025 | % |
$500 Million - $1 Billion | | | 0.015 | % |
Greater than $1 Billion | | | 0.005 | % |
| | | | | | |
| | | SEMI-ANNUAL REPORT | | NOVEMBER 30, 2013 | | 29 |
| | |
| Notes to Financial Statements (continued) | | |
For the six months ended November 30, 2013, the following table shows the class specific administration fees borne directly by each class of Disciplined Small Cap Core Fund:
| | | | | | | | | | | | | | |
| Institutional | | | Investor A | | | Investor C | | | Total | |
| $ | 691 | | | $ | 10 | | | $ | 5 | | | $ | 706 | |
BNYMIS and the Manager may have, at their discretion, voluntarily waived all or any portion of their administration fees for Disciplined Small Cap Core Fund or a share class, which are included in administration fees waived and administration fees waived — class specific in the Statements of Operations.
With respect to Disciplined Small Cap Core Fund, the Manager contractually agreed to waive and/or reimburse fees or expenses in order to limit expenses, excluding interest expense, dividend expense, income tax expense, acquired fund fees and expenses and certain other fund expenses, which constitute extraordinary expenses not incurred in the ordinary course of Disciplined Small Cap Core Fund’s business. The expense limitations as a percentage of average daily net assets are as follows: 0.70% for Institutional; 0.95% for Investor A and 1.70% for Investor C. The Manager has agreed not to reduce or discontinue this contractual waiver or reimbursement prior to December 1, 2014 unless approved by the Board, including a majority of the independent trustees.
These amounts waived or reimbursed are included in fees waived and/or reimbursed by Manager, and shown as administration fees waived, administration fees waived — class specific and transfer agent fees reimbursed — class specific, respectively, in the Statements of Operations. For the six months ended November 30, 2013, the amount included in fees waived and/or reimbursed by Manager was $112,002 for Disciplined Small Cap Core Fund. Class specific expense waivers and reimbursements are as follows:
| | | | | | | | | | | | | | | | |
| | | Institutional | | | Investor A | | | Investor C | | | Total | |
Administration Fees Waived | | $ | 653 | | | $ | 10 | | | $ | 5 | | | $ | 668 | |
Transfer Agent Fees Reimbursed | | $ | 90 | | | $ | 43 | | | $ | 39 | | | $ | 172 | |
If during Disciplined Small Cap Core Fund’s fiscal year the operating expenses of a share class, that at any time during the prior two fiscal years received a waiver or reimbursement from the Manager, are less than the expense limit for that share class, the Manager is entitled to be reimbursed by such share class up to the lesser of (a) the amount of fees waived or expenses reimbursed during those prior two fiscal years under the agreement and (b) the amount by which the expense limit for that share class exceeds the operating expenses of the share class for the current fiscal year, provided that: (1) Disciplined Small Cap Core Fund has more than $50 million in assets for the fiscal year and (2) the Manager or an affiliate continues to serve as Disciplined Small Cap Core Fund’s investment advisor or administrator. In the event the expense limit for a share class is changed subsequent to a fiscal year in which the Manager becomes entitled to reimbursement for fees waived or reimbursed, the amount available to reimburse the Manager shall be calculated by reference to the expense limit for that share class in effect
at the time the Manager became entitled to receive such reimbursement, rather than the subsequently changed expense limit for that share class.
On November 30, 2013, Disciplined Small Cap Core Fund’s Fund level and class specific waivers and/or reimbursements subject to possible future recoupment under the expense limitation agreement are as follows:
| | | | | | | | |
| | | Expiring May 31, | |
| | | 2015 | | | 2016 | |
Fund Level | | $ | 71,590 | | | $ | 114,124 | |
Institutional | | $ | 252 | | | $ | 742 | |
Investor A | | $ | 11 | | | $ | 54 | |
Investor C | | $ | 11 | | | $ | 44 | |
For the six months ended November 30, 2013, affiliates earned underwriting discounts, direct commissions and dealer concessions on sales of Disciplined Small Cap Core Fund’s Investor A Shares of $3,872 and Small Cap Growth Fund II’s Investor A Shares of $12.
For the six months ended November 30, 2013, affiliates received CDSCs in the amount of $150, $11 and $1,433 for Small Cap Growth Fund II’s Investor A, Investor B and Investor C Shares, respectively.
Disciplined Small Cap Core Fund received an exemptive order from the SEC permitting it, among other things, to pay an affiliated securities lending agent a fee based on a share of the income derived from the securities lending activities and has retained BIM as the securities lending agent. BIM may, on behalf of Disciplined Small Cap Core Fund, invest cash collateral received by Disciplined Small Cap Core Fund for such loans in a private investment company managed by the Manager or in registered money market funds advised by the Manager or its affiliates. The market value of securities on loan and the value of the related collateral, if applicable, is shown in the Statements of Assets and Liabilities as securities loaned at value and collateral on securities loaned at value, respectively. The cash collateral invested by BIM, if any, is disclosed in the Schedule of Investments. Securities lending income is equal to the total of income earned from the reinvestment of cash collateral, net of rebates paid to, or fees paid by, borrowers of securities. Disciplined Small Cap Core Fund retains 65% of securities lending income and pays a fee to BIM equal to 35% of such income. Disciplined Small Cap Core Fund benefits from a borrower default indemnity provided by BlackRock. As securities lending agent, BIM bears all operational costs directly related to securities lending as well as the cost of borrower default indemnification. BIM does not receive any fees for managing the cash collateral. The share of income earned by Disciplined Small Cap Core Fund is shown as securities lending — affiliated — net in the Statements of Operations. For the six months ended November 30, 2013, BIM received $99 in securities lending agent fees related to securities lending activities for Disciplined Small Cap Core Fund.
Certain officers and/or trustees/directors of the Trust/Corporation are officers and/or directors of BlackRock or its affiliates. The Funds reimburse the Manager/Administrator for a portion of the compensation paid to the Trust’s/Corporation’s Chief Compliance Officer, which is included in officer and trustees in the Statements of Operations.
| | | | | | |
| 30 | | SEMI-ANNUAL REPORT | | NOVEMBER 30, 2013 | | |
| | |
| Notes to Financial Statements (continued) | | |
6. Purchases and Sales:
Purchases and sales of investments excluding short-term securities for the six months ended November 30, 2013 were $3,914,370 and $3,814,698, respectively, for Disciplined Small Cap Core Fund.
7. Income Tax Information:
As of November 30, 2013, gross unrealized appreciation and depreciation based on cost for federal income tax purposes for Disciplined Small Cap Core Fund were as follows:
| | | | |
Tax cost | | $ | 5,530,701 | |
| | | | |
Gross unrealized appreciation | | $ | 846,952 | |
Gross unrealized depreciation | | | (147,485 | ) |
| | | | |
Net unrealized appreciation | | $ | 699,467 | |
| | | | |
| | | | | |
8. Bank Borrowings:
The Trust, on behalf of Disciplined Small Cap Core Fund, along with certain other funds managed by the Manager and its affiliates (“Participating Funds”), is a party to a 364-day, $800 million credit agreement with a group of lenders, under which Disciplined Small Cap Core Fund may borrow to fund shareholder redemptions. The agreement expires in April 2014. Excluding commitments designated for a certain individual fund, other Participating Funds, including Disciplined Small Cap Core Fund, can borrow up to an aggregate commitment amount of $500 million, subject to asset coverage and other limitations as specified in the agreement. The credit agreement has the following terms: a fee of 0.065% per annum on unused commitment amounts and interest at a rate equal to the higher of (a) the one-month LIBOR plus 0.80% per annum or (b) the Fed Funds rate plus 0.80% per annum on amounts borrowed. Participating Funds paid administration and arrangement fees, which, along with commitment fees, were allocated among such funds based upon portions of the aggregate commitment available to them and relative net assets of Participating Funds. Disciplined Small Cap Core Fund did not borrow under the credit agreement during the six months ended November 30, 2013.
9. Concentration, Market and Credit Risk:
In the normal course of business, Disciplined Small Cap Core Fund invests in securities and enters into transactions where risks exist due to fluctuations in the market (market risk) or failure of the issuer of a security to meet all its obligations (issuer credit risk). The value of securities held by Disciplined Small Cap Core Fund may decline in response to certain events, including those directly involving the issuers whose securities are owned by Disciplined Small Cap Core Fund; conditions affecting the general economy; overall market changes; local, regional or global political, social or economic instability; and currency and interest rate and price fluctuations. Similar to issuer credit risk, Disciplined Small Cap Core Fund may be exposed to counterparty credit risk, or the risk that an entity with which Disciplined Small Cap Core Fund has unsettled or open transactions may fail to or be unable to perform on its commitments. Disciplined Small Cap Core Fund manages counterparty credit risk by entering into transactions only with counterparties that it believes have the financial resources to honor their obligations and by monitoring the financial stability of those counterparties. Financial assets, which potentially expose Disciplined Small Cap Core Fund to market, issuer and counterparty credit risks, consist principally of financial instruments and receivables due from counterparties. The extent of Disciplined Small Cap Core Fund’s exposure to market, issuer and counterparty credit risks with respect to these financial assets is generally approximated by their value recorded in the Statements of Assets and Liabilities, less any collateral held by Disciplined Small Cap Core Fund.
As of November 30, 2013, Disciplined Small Cap Core Fund invested a significant portion of its assets in securities in the financials sector. Changes in economic conditions affecting the financials sector would have a greater impact on Disciplined Small Cap Core Fund and could affect the value, income and/or liquidity of positions in such securities.
10. Capital Share Transactions:
Transactions in capital shares for each class were as follows:
| | | | | | | | | | | | | | | | | | |
| | | Six Months Ended
November 30, 2013 | | | | | Period
March 14, 20131 to
May 31, 2013 | |
| Disciplined Small Cap Core Fund | | Shares | | | Amount | | | | | Shares | | | Amount | |
Institutional | | | | | | | | | | | | | | | | | | |
Shares sold | | | 1,485 | | | $ | 16,203 | | | | | | 499,521 | | | $ | 4,995,010 | |
Shares redeemed | | | — | | | | — | | | | | | (1 | ) | | | (10 | ) |
| | | | | | | | | | |
Net increase | | | 1,485 | | | $ | 16,203 | | | | | | 499,520 | | | $ | 4,995,000 | |
| | | | | | | | | | |
| | | | | | | | | | | | | | | | | | |
Investor A | | | | | | | | | | | | | | | | | | |
Shares sold | | | 8,047 | | | $ | 85,839 | | | | | | 2,001 | | | $ | 20,010 | |
Shares redeemed | | | (663 | ) | | | (7,710 | ) | | | | | (1 | ) | | | (10 | ) |
| | | | | | | | | | |
Net increase | | | 7,384 | | | $ | 78,129 | | | | | | 2,000 | | | $ | 20,000 | |
| | | | | | | | | | |
| | 1 | Commencement of operations. |
| | | | | | |
| | | SEMI-ANNUAL REPORT | | NOVEMBER 30, 2013 | | 31 |
| | |
| Notes to Financial Statements (continued) | | |
| | | | | | | | | | | | | | | | | | |
| | | Six Months
Ended
November 30, 2013 | | | | | Period
March 14, 20131 to
May 31, 2013 | |
| Disciplined Small Cap Core Fund (concluded) | | Shares | | | Amount | | | | | Shares | | | Amount | |
Investor C | | | | | | | | | | | | | | | | | | |
Shares sold | | | 2,760 | | | $ | 30,000 | | | | | | 2,001 | | | $ | 20,010 | |
Shares redeemed | | | — | | | | — | | | | | | (1 | ) | | | (10 | ) |
| | | | | | | | | | |
Net increase | | | 2,760 | | | $ | 30,000 | | | | | | 2,000 | | | $ | 20,000 | |
| | | | | | | | | | |
Total Net Increase | | | 11,629 | | | $ | 124,332 | | | | | | 503,520 | | | $ | 5,035,000 | |
| | | | | | | | | | |
| | 1 | Commencement of operations. |
| | | | | | | | | | | | | | | | | | |
| | | | | | | | | | | Year Ended
May 31, 2013 | |
| Small Cap Growth Fund II | | Shares | | | Amount | | | | | Shares | | | Amount | |
Institutional | | | | | | | | | | | | | | | | | | |
Shares sold | | | 600,628 | | | $ | 8,949,659 | | | | | | 1,169,129 | | | $ | 16,244,000 | |
Shares issued in reinvestment of distributions | | | 622,754 | | | | 8,662,512 | | | | | | 539,089 | | | | 6,911,438 | |
Shares redeemed | | | (597,730 | ) | | | (8,861,828 | ) | | | | | (1,857,378 | ) | | | (25,535,920 | ) |
| | | | | | | | | | |
Net increase (decrease) | | | 625,652 | | | $ | 8,750,343 | | | | | | (149,160 | ) | | $ | (2,380,482 | ) |
| | | | | | | | | | |
| | | | | | | | | | | | | | | | | | |
Investor A | | | | | | | | | | | | | | | | | | |
Shares sold and automatic conversion of shares | | | 780,490 | | | $ | 11,078,287 | | | | | | 1,536,013 | | | $ | 20,775,563 | |
Shares issued in reinvestment of distributions | | | 736,973 | | | | 9,823,842 | | | | | | 741,051 | | | | 9,168,799 | |
Shares redeemed | | | (916,479 | ) | | | (13,024,822 | ) | | | | | (3,125,461 | ) | | | (42,072,326 | ) |
| | | | | | | | | | |
Net increase (decrease) | | | 600,984 | | | $ | 7,877,307 | | | | | | (848,397 | ) | | $ | (12,127,964 | ) |
| | | | | | | | | | |
| | | | | | | | | | | | | | | | | | |
Investor B | | | | | | | | | | | | | | | | | | |
Shares sold | | | 14,288 | | | $ | 177,416 | | | | | | 66,833 | | | $ | 780,876 | |
Shares issued in reinvestment of distributions | | | 25,586 | | | | 293,216 | | | | | | 48,683 | | | | 530,289 | |
Shares redeemed and automatic conversion of shares | | | (77,749 | ) | | | (959,969 | ) | | | | | (333,148 | ) | | | (3,927,351 | ) |
| | | | | | | | | | |
Net decrease | | | (37,875 | ) | | $ | (489,337 | ) | | | | | (217,632 | ) | | $ | (2,616,186 | ) |
| | | | | | | | | | |
| | | | | | | | | | | | | | | | | | |
Investor C | | | | | | | | | | | | | | | | | | |
Shares sold | | | 253,025 | | | $ | 3,081,248 | | | | | | 403,695 | | | $ | 4,750,362 | |
Shares issued in reinvestment of distributions | | | 529,370 | | | | 6,045,397 | | | | | | 456,125 | | | | 4,970,460 | |
Shares redeemed | | | (526,637 | ) | | | (6,369,262 | ) | | | | | (989,830 | ) | | | (11,624,587 | ) |
| | | | | | | | | | |
Net increase (decrease) | | | 255,758 | | | $ | 2,757,383 | | | | | | (130,010 | ) | | $ | (1,903,765 | ) |
| | | | | | | | | | |
| | | | | | | | | | | | | | | | | | |
Class R | | | | | | | | | | | | | | | | | | |
Shares sold | | | 417,438 | | | $ | 5,591,554 | | | | | | 665,976 | | | $ | 8,426,340 | |
Shares issued in reinvestment of distributions | | | 360,363 | | | | 4,493,723 | | | | | | 419,696 | | | | 4,911,776 | |
Shares redeemed | | | (658,093 | ) | | | (8,870,466 | ) | | | | | (1,900,842 | ) | | | (24,021,310 | ) |
| | | | | | | | | | |
Net increase (decrease) | | | 119,708 | | | $ | 1,214,811 | | | | | | (815,170 | ) | | $ | (10,683,194 | ) |
| | | | | | | | | | |
Total Net Increase (Decrease) | | | 1,564,227 | | | $ | 20,110,507 | | | | | | (2,160,369 | ) | | $ | (29,711,591 | ) |
| | | | | | | | | | |
At November 30, 2013, 496,000 Institutional Shares, 2,000 Investor A Shares and 2,000 Investor C Shares of Disciplined Small Cap Core Fund were owned by affiliates.
| | | | | | |
| 32 | | SEMI-ANNUAL REPORT | | NOVEMBER 30, 2013 | | |
| | |
| Notes to Financial Statements (concluded) | | |
11. Subsequent Events:
Management has evaluated the impact of all subsequent events on the Funds through the date the financial statements were issued and has determined that there were no subsequent events requiring adjustment or additional disclosure in the financial statements.
| | | | | | |
| | | SEMI-ANNUAL REPORT | | NOVEMBER 30 ,2013 | | 33 |
| | | | |
| Master Portfolio Information | | | BlackRock Master Small Cap Growth Portfolio | |
| | |
| Ten Largest Holdings | | Percent of Long-Term Investments |
| | | | |
Aspen Technology, Inc. | | | 3 | % |
Generac Holdings, Inc. | | | 2 | |
KapStone Paper and Packaging Corp. | | | 2 | |
PROS Holdings, Inc. | | | 2 | |
Thoratec Corp. | | | 2 | |
Align Technology, Inc. | | | 2 | |
NIC, Inc. | | | 2 | |
Ubiquiti Networks, Inc. | | | 2 | |
Gentium SpA — ADR | | | 2 | |
Deluxe Corp. | | | 2 | |
| | |
| Sector Allocation | | Percent of Long-Term Investments |
| | | | |
Information Technology | | | 28 | % |
Health Care | | | 19 | |
Industrials | | | 19 | |
Consumer Discretionary | | | 14 | |
Financials | | | 6 | |
Materials | | | 4 | |
Energy | | | 4 | |
Consumer Staples | | | 3 | |
Telecommunication Services | | | 2 | |
Utilities | | | 1 | |
For Master Portfolio compliance purposes, the Master Portfolio’s sector classifications refer to any one or more of the sector sub-classifications used by one or more widely recognized market indexes or ratings group indexes, and/or as defined by Master Portfolio management. These definitions may not apply for purposes of this report, which may combine such sector sub-classifications for reporting ease.
| | | | | | |
| 34 | | SEMI-ANNUAL REPORT | | NOVEMBER 30, 2013 | | |
| | | | |
| Schedule of Investments November 30, 2013 (Unaudited) | | | BlackRock Master Small Cap Growth Portfolio | |
| | | (Percentages shown are based on Net Assets) | |
| | | | | | | | |
| Common Stocks | | Shares | | | Value | |
Aerospace & Defense — 2.3% | | | | | | | | |
Ducommun, Inc. (a) | | | 25,750 | | | $ | 652,505 | |
Exelis, Inc. | | | 1,987 | | | | 35,110 | |
HEICO Corp. | | | 4,158 | | | | 237,339 | |
Spirit Aerosystems Holdings, Inc., Class A (a) | | | 128,023 | | | | 4,178,671 | |
Taser International, Inc. (a) | | | 38,968 | | | | 669,860 | |
| | | | | | | | |
| | | | | | | | 5,773,485 | |
Airlines — 0.5% | | | | | | | | |
Republic Airways Holdings, Inc. (a) | | | 17,266 | | | | 194,415 | |
Spirit Airlines, Inc. (a) | | | 22,987 | | | | 1,054,414 | |
| | | | | | | | |
| | | | | | | | 1,248,829 | |
Auto Components — 2.1% | | | | | | | | |
Gentherm, Inc. (a) | | | 47,958 | | | | 1,158,665 | |
Stoneridge, Inc. (a) | | | 21,152 | | | | 273,072 | |
Tower International, Inc. (a) | | | 69,692 | | | | 1,497,681 | |
Visteon Corp. (a) | | | 30,121 | | | | 2,368,715 | |
| | | | | | | | |
| | | | | | | | 5,298,133 | |
Biotechnology — 6.2% | | | | | | | | |
Acceleron Pharma, Inc. (a) | | | 9,899 | | | | 215,501 | |
Achillion Pharmaceuticals, Inc. (a) | | | 106,623 | | | | 368,916 | |
AMAG Pharmaceuticals, Inc. (a) | | | 4,072 | | | | 99,886 | |
Arena Pharmaceuticals, Inc. (a)(b) | | | 4,026 | | | | 26,250 | |
AVEO Pharmaceuticals, Inc. (a) | | | 33,300 | | | | 70,596 | |
Biospecifics Technologies Corp. (a) | | | 57,316 | | | | 1,271,842 | |
Chimerix, Inc. (a) | | | 5,351 | | | | 85,723 | |
Cytokinetics, Inc. (a) | | | 22,828 | | | | 148,154 | |
Dynavax Technologies Corp. (a) | | | 12,013 | | | | 21,263 | |
Emergent Biosolutions, Inc. (a) | | | 47,517 | | | | 1,066,757 | |
Enzon Pharmaceuticals, Inc. | | | 120,169 | | | | 199,481 | |
Epizyme, Inc. (a) | | | 1,804 | | | | 37,776 | |
Esperion Therapeutics, Inc. (a) | | | 2,585 | | | | 30,839 | |
Five Prime Therapeutics, Inc. (a) | | | 2,424 | | | | 24,482 | |
Foundation Medicine, Inc. (a)(b) | | | 12,230 | | | | 306,239 | |
Galena Biopharma, Inc. (a) | | | 4,914 | | | | 19,754 | |
Gentium SpA — ADR (a) | | | 85,509 | | | | 4,636,298 | |
Harvard Apparatus Regenerative Technology, Inc. (a) | | | 17,936 | | | | 90,936 | |
Insys Therapeutics, Inc. (a) | | | 2,104 | | | | 92,786 | |
Intrexon Corp. (a)(b) | | | 22,193 | | | | 507,998 | |
Isis Pharmaceuticals, Inc. (a) | | | 687 | | | | 26,628 | |
Ligand Pharmaceuticals, Inc., Class B (a) | | | 1,798 | | | | 100,113 | |
Myriad Genetics, Inc. (a)(b) | | | 5,407 | | | | 160,858 | |
OncoGenex Pharmaceutical, Inc. (a) | | | 23,775 | | | | 204,227 | |
OncoMed Pharmaceuticals, Inc. (a)(b) | | | 5,139 | | | | 69,171 | |
Ophthotech Corp. (a) | | | 11,646 | | | | 328,999 | |
OvaScience, Inc. (a) | | | 3,210 | | | | 30,720 | |
PDL BioPharma, Inc. | | | 173,740 | | | | 1,697,440 | |
Portola Pharmaceuticals, Inc. (a) | | | 9,979 | | | | 249,475 | |
Puma Biotechnology, Inc. (a) | | | 1,009 | | | | 50,238 | |
Receptos, Inc. (a) | | | 6,206 | | | | 143,607 | |
Regulus Therapeutics, Inc. (a) | | | 7,799 | | | | 49,056 | |
Repligen Corp. (a)(b) | | | 99,668 | | | | 1,342,528 | |
| | | | | | | | |
| Common Stocks | | Shares | | | Value | |
Biotechnology (concluded) | | | | | | | | |
Sangamo Biosciences, Inc. (a) | | | 8,624 | | | $ | 105,299 | |
Stemline Therapeutics, Inc. (a) | | | 3,051 | | | | 63,034 | |
Sunesis Pharmaceuticals, Inc. (a)(b) | | | 205,145 | | | | 1,035,982 | |
Targacept, Inc. (a) | | | 5,473 | | | | 31,470 | |
Tetraphase Pharmaceuticals, Inc. (a) | | | 16,242 | | | | 191,006 | |
Threshold Pharmaceuticals, Inc. (a) | | | 54,811 | | | | 270,218 | |
Vanda Pharmaceuticals, Inc. (a) | | | 3,763 | | | | 44,178 | |
Verastem, Inc. (a) | | | 11,672 | | | | 123,490 | |
| | | | | | | | |
| | | | | | | | 15,639,214 | |
Building Products — 1.3% | | | | | | | | |
Apogee Enterprises, Inc. | | | 929 | | | | 33,277 | |
Griffon Corp. | | | 20,765 | | | | 267,038 | |
Insteel Industries, Inc. | | | 3,695 | | | | 73,420 | |
PGT, Inc. (a) | | | 177,195 | | | | 1,771,950 | |
Ply Gem Holdings, Inc. (a)(b) | | | 59,257 | | | | 1,039,368 | |
| | | | | | | | |
| | | | | | | | 3,185,053 | |
Capital Markets — 0.6% | | | | | | | | |
Financial Engines, Inc. | | | 6,545 | | | | 443,424 | |
GAMCO Investors, Inc., Class A | | | 2,250 | | | | 189,450 | |
HFF, Inc., Class A (a) | | | 2,513 | | | | 64,383 | |
MCG Capital Corp. | | | 48,440 | | | | 232,996 | |
Westwood Holdings Group, Inc. | | | 4,480 | | | | 256,614 | |
WisdomTree Investments, Inc. (a) | | | 19,933 | | | | 305,374 | |
| | | | | | | | |
| | | | | | | | 1,492,241 | |
Chemicals — 1.2% | | | | | | | | |
American Pacific Corp. (a) | | | 28,120 | | | | 1,162,762 | |
American Vanguard Corp. | | | 15,655 | | | | 449,768 | |
Ferro Corp. (a) | | | 21,123 | | | | 294,243 | |
FutureFuel Corp. | | | 14,972 | | | | 250,332 | |
Landec Corp. (a) | | | 7,771 | | | | 91,232 | |
OM Group, Inc. (a) | | | 18,337 | | | | 604,021 | |
OMNOVA Solutions, Inc. (a) | | | 5,244 | | | | 45,937 | |
| | | | | | | | |
| | | | | | | | 2,898,295 | |
Commercial Banks — 0.2% | | | | | | | | |
1st Source Corp. | | | 832 | | | | 26,582 | |
Access National Corp. | | | 1,546 | | | | 24,365 | |
Ameris Bancorp (a) | | | 499 | | | | 10,215 | |
CommunityOne Bancorp (a) | | | 4,630 | | | | 55,051 | |
First Citizens BancShares, Inc., Class A | | | 598 | | | | 134,341 | |
German American Bancorp, Inc. | | | 1,390 | | | | 41,547 | |
Heritage Oaks Bancorp (a) | | | 3,023 | | | | 24,154 | |
Independent Bank Group, Inc. | | | 1,909 | | | | 91,403 | |
State Bank Financial Corp. | | | 4,382 | | | | 77,036 | |
West Bancorporation, Inc. | | | 3,491 | | | | 56,275 | |
| | | | | | | | |
| | | | | | | | 540,969 | |
Commercial Services & Supplies — 2.6% | | | | | | | | |
Consolidated Graphics, Inc. (a) | | | 10,751 | | | | 692,472 | |
Costa, Inc. (a) | | | 3,509 | | | | 76,847 | |
Deluxe Corp. | | | 92,914 | | | | 4,616,897 | |
| | | | |
| Portfolio Abbreviation |
ADR American Depositary Receipts | | |
See Notes to Financial Statements.
| | | | | | |
| | | SEMI-ANNUAL REPORT | | NOVEMBER 30, 2013 | | 35 |
| | | | |
| Schedule of Investments (continued) | | | BlackRock Master Small Cap Growth Portfolio | |
| | | (Percentages shown are based on Net Assets) | |
| | | | | | | | |
| Common Stocks | | Shares | | | Value | |
Commercial Services & Supplies (concluded) | |
G&K Services, Inc., Class A | | | 6,254 | | | $ | 376,616 | |
Kimball International, Inc., Class B | | | 6,722 | | | | 100,091 | |
Performant Financial Corp. (a) | | | 10,714 | | | | 112,390 | |
Viad Corp. | | | 15,471 | | | | 417,717 | |
West Corp. | | | 4,833 | | | | 111,304 | |
| | | | | | | | |
| | | | | | | | 6,504,334 | |
Communications Equipment — 3.9% | | | | | | | | |
Alliance Fiber Optic Products, Inc. | | | 16,719 | | | | 246,605 | |
Anaren, Inc. (a) | | | 364 | | | | 10,152 | |
Aruba Networks, Inc. (a) | | | 166,942 | | | | 2,978,245 | |
Aviat Networks, Inc. (a) | | | 45,693 | | | | 115,603 | |
Bel Fuse, Inc., Class B | | | 1,539 | | | | 34,981 | |
Calix, Inc. (a) | | | 37,649 | | | | 385,526 | |
Extreme Networks, Inc. (a)(b) | | | 152,705 | | | | 1,061,300 | |
Ixia (a) | | | 12,175 | | | | 158,153 | |
Oplink Communications, Inc. (a) | | | 2,913 | | | | 47,249 | |
ShoreTel, Inc. (a) | | | 2,449 | | | | 19,788 | |
Ubiquiti Networks, Inc. | | | 122,382 | | | | 4,821,851 | |
| | | | | | | | |
| | | | | | | | 9,879,453 | |
Computers & Peripherals — 0.2% | | | | | | | | |
Electronics for Imaging, Inc. (a) | | | 2,090 | | | | 82,764 | |
Immersion Corp. (a) | | | 36,432 | | | | 446,656 | |
Intevac, Inc. (a) | | | 1,900 | | | | 12,578 | |
Violin Memory, Inc. (a) | | | 6,713 | | | | 23,160 | |
| | | | | | | | |
| | | | | | | | 565,158 | |
Construction & Engineering — 0.2% | | | | | | | | |
Comfort Systems USA, Inc. | | | 9,584 | | | | 196,472 | |
Pike Electric Corp. | | | 27,633 | | | | 290,423 | |
| | | | | | | | |
| | | | | | | | 486,895 | |
Construction Materials — 0.0% | | | | | | | | |
Headwaters, Inc. (a) | | | 2,163 | | | | 20,895 | |
Consumer Finance — 0.0% | | | | | | | | |
Credit Acceptance Corp. (a) | | | 209 | | | | 26,992 | |
Distributors — 0.1% | | | | | | | | |
Core-Mark Holding Co., Inc. | | | 3,408 | | | | 251,579 | |
Stock Building Supply Holdings, Inc. (a) | | | 1,865 | | | | 34,148 | |
| | | | | | | | |
| | | | | | | | 285,727 | |
Diversified Consumer Services — 0.6% | | | | | | | | |
Capella Education Co. (a) | | | 3,256 | | | | 213,984 | |
Collectors Universe, Inc. | | | 12,087 | | | | 200,523 | |
Grand Canyon Education, Inc. (a) | | | 872 | | | | 39,711 | |
Hillenbrand, Inc. | | | 8,155 | | | | 229,156 | |
ITT Educational Services, Inc. (a)(b) | | | 618 | | | | 24,096 | |
LifeLock, Inc. (a) | | | 28,504 | | | | 490,839 | |
National American University Holdings, Inc. | | | 2,699 | | | | 9,905 | |
Steiner Leisure Ltd. | | | 518 | | | | 30,645 | |
Stewart Enterprises, Inc., Class A | | | 18,868 | | | | 250,001 | |
| | | | | | | | |
| | | | | | | | 1,488,860 | |
Diversified Telecommunication Services — 1.8% | | | | | | | | |
Cbeyond, Inc. (a) | | | 347,123 | | | | 1,926,533 | |
IDT Corp., Class B | | | 11,806 | | | | 262,211 | |
Inteliquent, Inc. | | | 66,029 | | | | 765,276 | |
magicJack VocalTec Ltd. (b) | | | 102,007 | | | | 1,170,020 | |
Premiere Global Services, Inc. (a) | | | 16,417 | | | | 153,171 | |
PTGi Holding, Inc. | | | 5,585 | | | | 15,135 | |
| | | | | | | | |
| Common Stocks | | Shares | | | Value | |
Diversified Telecommunication Services (concluded) | |
Vonage Holdings Corp. (a) | | | 39,726 | | | $ | 131,493 | |
| | | | | | | | |
| | | | | | | | 4,423,839 | |
Electrical Equipment — 3.0% | | | | | | | | |
EnerSys, Inc. | | | 23,060 | | | | 1,645,331 | |
Generac Holdings, Inc. | | | 106,868 | | | | 5,691,790 | |
Lihua International, Inc. (a) | | | 24,210 | | | | 138,481 | |
| | | | | | | | |
| | | | | | | | 7,475,602 | |
Electronic Equipment, Instruments & Components — 1.1% | |
Aeroflex Holding Corp. (a) | | | 26,554 | | | | 179,239 | |
Coherent, Inc. | | | 3,546 | | | | 244,816 | |
Control4 Corp. (a)(b) | | | 1,956 | | | | 34,171 | |
Electro Scientific Industries, Inc. | | | 6,000 | | | | 61,740 | |
Fabrinet | | | 13,923 | | | | 275,675 | |
FARO Technologies, Inc. (a) | | | 5,803 | | | | 316,496 | |
Methode Electronics, Inc. | | | 3,715 | | | | 107,475 | |
Newport Corp. (a) | | | 17,882 | | | | 306,676 | |
PC Connection, Inc. (a) | | | 1,969 | | | | 42,786 | |
Radisys Corp. (a) | | | 6,288 | | | | 14,085 | |
RealD, Inc. (a) | | | 130,674 | | | | 1,170,839 | |
| | | | | | | | |
| | | | | | | | 2,753,998 | |
Energy Equipment & Services — 0.5% | | | | | | | | |
Dawson Geophysical Co. (a) | | | 4,643 | | | | 150,062 | |
ION Geophysical Corp. (a) | | | 153,096 | | | | 590,951 | |
Matrix Service Co. (a) | | | 4,795 | | | | 106,449 | |
RigNet, Inc. (a) | | | 1,232 | | | | 52,335 | |
SEACOR Holdings, Inc. | | | 2,903 | | | | 270,124 | |
USA Compression Partners LP | | | 2,031 | | | | 49,780 | |
| | | | | | | | |
| | | | | | | | 1,219,701 | |
Food & Staples Retailing — 0.9% | | | | | | | | |
Arden Group, Inc., Class A | | | 2,173 | | | | 282,468 | |
Harris Teeter Supermarkets, Inc. | | | 1,623 | | | | 80,144 | |
Natural Grocers by Vitamin Cottage, Inc. (a) | | | 1,162 | | | | 42,738 | |
The Pantry, Inc. (a) | | | 37,748 | | �� | | 543,194 | |
Rite Aid Corp. (a) | | | 232,592 | | | | 1,376,945 | |
| | | | | | | | |
| | | | | | | | 2,325,489 | |
Food Products — 1.7% | | | | | | | | |
Calavo Growers, Inc. | | | 1,558 | | | | 48,033 | |
Chiquita Brands International, Inc. (a) | | | 14,087 | | | | 148,900 | |
Dean Foods Co. (a) | | | 18,057 | | | | 324,665 | |
Farmer Bros Co. (a) | | | 3,964 | | | | 80,866 | |
The Hain Celestial Group, Inc. (a) | | | 13,038 | | | | 1,078,112 | |
John B. Sanfilippo & Son, Inc. | | | 2,552 | | | | 65,050 | |
Omega Protein Corp. (a) | | | 17,404 | | | | 235,824 | |
Pilgrim’s Pride Corp. (a)(b) | | | 131,804 | | | | 2,158,950 | |
Seaboard Corp. | | | 45 | | | | 127,125 | |
| | | | | | | | |
| | | | | | | | 4,267,525 | |
Health Care Equipment & Supplies — 7.1% | | | | | | | | |
Align Technology, Inc. (a)(b) | | | 91,110 | | | | 4,978,250 | |
Anika Therapeutics, Inc. (a) | | | 2,981 | | | | 102,397 | |
ArthroCare Corp. (a) | | | 85,702 | | | | 3,232,679 | |
AtriCure, Inc. (a) | | | 3,876 | | | | 60,698 | |
Cutera, Inc. (a) | | | 11,469 | | | | 108,382 | |
Cyberonics, Inc. (a) | | | 8,981 | | | | 617,174 | |
ICU Medical, Inc. (a) | | | 24,025 | | | | 1,578,082 | |
LDR Holding Corp. (a) | | | 98 | | | | 2,158 | |
See Notes to Financial Statements.
| | | | | | |
| 36 | | SEMI-ANNUAL REPORT | | NOVEMBER 30, 2013 | | |
| | | | |
| Schedule of Investments (continued) | | | BlackRock Master Small Cap Growth Portfolio | |
| | | (Percentages shown are based on Net Assets) | |
| | | | | | | | |
| Common Stocks | | Shares | | | Value | |
Health Care Equipment & Supplies (concluded) | | | | | | | | |
Medical Action Industries, Inc. (a) | | | 30,059 | | | $ | 258,507 | |
Meridian Bioscience, Inc. | | | 14,276 | | | | 350,904 | |
Natus Medical, Inc. (a) | | | 1,058 | | | | 24,366 | |
RTI Biologics, Inc. (a) | | | 13,732 | | | | 42,295 | |
Solta Medical, Inc. (a) | | | 27 | | | | 54 | |
Spectranetics Corp. (a) | | | 16,666 | | | | 387,651 | |
SurModics, Inc. (a) | | | 45,379 | | | | 1,094,541 | |
Thoratec Corp. (a)(b) | | | 126,735 | | | | 4,989,557 | |
Zeltiq Aesthetics, Inc. (a) | | | 1,002 | | | | 17,575 | |
| | | | | | | | |
| | | | | | | | 17,845,270 | |
Health Care Providers & Services — 1.9% | | | | | | | | |
Alliance HealthCare Services, Inc. (a) | | | 3,043 | | | | 87,882 | |
AMN Healthcare Services, Inc. (a) | | | 59,247 | | | | 822,348 | |
BioTelemetry, Inc. (a) | | | 2,103 | | | | 22,060 | |
Corvel Corp. (a) | | | 20,057 | | | | 928,439 | |
Cross Country Healthcare, Inc. (a) | | | 12,436 | | | | 95,011 | |
Five Star Quality Care, Inc. (a) | | | 17,659 | | | | 87,059 | |
Hanger, Inc. (a) | | | 5,377 | | | | 208,843 | |
HealthSouth Corp. | | | 4,541 | | | | 162,522 | |
PharMerica Corp. (a) | | | 3,075 | | | | 69,434 | |
The Providence Service Corp. (a) | | | 6,466 | | | | 177,298 | |
Team Health Holdings, Inc. (a) | | | 4,155 | | | | 194,163 | |
VCA Antech, Inc. (a) | | | 62,270 | | | | 1,864,987 | |
| | | | | | | | |
| | | | | | | | 4,720,046 | |
Health Care Technology — 0.7% | | | | | | | | |
MedAssets, Inc. (a) | | | 37,669 | | | | 811,390 | |
Merge Healthcare, Inc. (a) | | | 14,406 | | | | 33,710 | |
Omnicell, Inc. (a) | | | 39,147 | | | | 949,315 | |
| | | | | | | | |
| | | | | | | | 1,794,415 | |
Hotels, Restaurants & Leisure — 2.0% | | | | | | | | |
AFC Enterprises, Inc. (a) | | | 33,243 | | | | 1,449,062 | |
Bravo Brio Restaurant Group, Inc. (a) | | | 1 | | | | 16 | |
Del Frisco’s Restaurant Group, Inc. (a) | | | 6,971 | | | | 147,576 | |
Diamond Resorts International, Inc. (a) | | | 2,006 | | | | 35,847 | |
Einstein Noah Restaurant Group, Inc. | | | 7,492 | | | | 119,797 | |
Jack in the Box, Inc. (a) | | | 47,083 | | | | 2,229,380 | |
Monarch Casino & Resort, Inc. (a) | | | 3,044 | | | | 54,031 | |
Multimedia Games Holding Co., Inc. (a) | | | 2,960 | | | | 85,840 | |
Red Lion Hotels Corp. (a) | | | 7,934 | | | | 43,637 | |
Ruth’s Hospitality Group, Inc. | | | 21,391 | | | | 307,603 | |
Speedway Motorsports, Inc. | | | 1 | | | | 20 | |
Vail Resorts, Inc. | | | 8,347 | | | | 632,619 | |
| | | | | | | | |
| | | | | | | | 5,105,428 | |
Household Durables — 0.5% | | | | | | | | |
TRI Pointe Homes, Inc. (a)(b) | | | 40,540 | | | | 804,719 | |
Zagg, Inc. (a) | | | 126,064 | | | | 534,511 | |
| | | | | | | | |
| | | | | | | | 1,339,230 | |
Household Products — 0.1% | | | | | | | | |
WD-40 Co. | | | 2,321 | | | | 174,678 | |
Insurance — 0.9% | | | | | | | | |
Crawford & Co., Class B | | | 4,862 | | | | 50,273 | |
eHealth, Inc. (a)(b) | | | 9,977 | | | | 452,058 | |
Employers Holdings, Inc. | | | 21,655 | | | | 706,819 | |
Fortegra Financial Corp. (a) | | | 8,347 | | | | 61,100 | |
Hallmark Financial Services, Inc. (a) | | | 2,698 | | | | 25,631 | |
HCI Group, Inc. | | | 2,480 | | | | 123,479 | |
Horace Mann Educators Corp. | | | 1,017 | | | | 31,242 | |
| | | | | | | | |
| Common Stocks | | Shares | | | Value | |
Insurance (concluded) | | | | | | | | |
Third Point Reinsurance Ltd. | | | 44,726 | | | $ | 745,135 | |
Universal Insurance Holdings, Inc. | | | 6,313 | | | | 78,281 | |
| | | | | | | | |
| | | | | | | | 2,274,018 | |
Internet & Catalog Retail — 1.1% | | | | | | | | |
1-800-Flowers.com, Inc., Class A (a) | | | 31,842 | | | | 162,076 | |
Blue Nile, Inc. (a) | | | 30,170 | | | | 1,389,630 | |
Geeknet, Inc. (a) | | | 415 | | | | 7,819 | |
HSN, Inc. | | | 2,496 | | | | 143,270 | |
Orbitz Worldwide, Inc. (a) | | | 68,070 | | | | 471,044 | |
Overstock.com, Inc. (a) | | | 4,891 | | | | 136,948 | |
PetMed Express, Inc. | | | 21,931 | | | | 346,071 | |
Valuevision Media, Inc., Class A (a) | | | 10,037 | | | | 57,813 | |
zulily, Inc., Class A (a) | | | 1,811 | | | | 63,367 | |
| | | | | | | | |
| | | | | | | | 2,778,038 | |
Internet Software & Services — 4.7% | | | | | | | | |
Benefitfocus, Inc. (a) | | | 6,237 | | | | 301,309 | |
Blucora, Inc. (a) | | | 18,126 | | | | 527,104 | |
Cvent, Inc. (a) | | | 15,440 | | | | 502,881 | |
EarthLink, Inc. | | | 8 | | | | 44 | |
Envestnet, Inc. (a) | | | 1,428 | | | | 56,763 | |
Global Eagle Entertainment, Inc. (a) | | | 25,759 | | | | 395,401 | |
Gogo, Inc. (a)(b) | | | 42,974 | | | | 1,146,117 | |
j2 Global, Inc. | | | 495 | | | | 23,745 | |
Limelight Networks, Inc. (a) | | | 39,360 | | | | 80,688 | |
Monster Worldwide, Inc. (a) | | | 15 | | | | 84 | |
Move, Inc. (a)(b) | | | 36,044 | | | | 556,880 | |
NIC, Inc. | | | 198,822 | | | | 4,847,280 | |
Perficient, Inc. (a) | | | 11,243 | | | | 243,748 | |
Responsys, Inc. (a)(b) | | | 35,049 | | | | 592,679 | |
Spark Networks, Inc. (a) | | | 15,483 | | | | 86,705 | |
Stamps.com, Inc. (a) | | | 5,007 | | | | 230,672 | |
support.com, Inc. (a) | | | 63,038 | | | | 252,152 | |
Synacor, Inc. (a) | | | 9,528 | | | | 26,678 | |
Travelzoo, Inc. (a) | | | 7,365 | | | | 158,200 | |
Tremor Video, Inc. (a) | | | 11,168 | | | | 51,931 | |
Web.com Group, Inc. (a) | | | 59,348 | | | | 1,694,385 | |
YuMe, Inc. (a) | | | 8,326 | | | | 72,769 | |
| | | | | | | | |
| | | | | | | | 11,848,215 | |
IT Services — 2.8% | | | | | | | | |
Cardtronics, Inc. (a) | | | 54,411 | | | | 2,317,364 | |
Global Cash Access Holdings, Inc. (a) | | | 111,581 | | | | 1,087,915 | |
MAXIMUS, Inc. | | | 2,828 | | | | 128,674 | |
Syntel, Inc. | | | 37,424 | | | | 3,307,159 | |
WNS Holdings Ltd. — ADR (a) | | | 12,225 | | | | 244,745 | |
| | | | | | | | |
| | | | | | | | 7,085,857 | |
Leisure Equipment & Products — 0.7% | | | | | | | | |
Arctic Cat, Inc. | | | 3,969 | | | | 223,336 | |
Brunswick Corp. | | | 32,508 | | | | 1,485,616 | |
| | | | | | | | |
| | | | | | | | 1,708,952 | |
Life Sciences Tools & Services — 0.1% | | | | | | | | |
Harvard Bioscience, Inc. (a) | | | 34,269 | | | | 156,267 | |
NeoGenomics, Inc. (a) | | | 4,246 | | | | 14,861 | |
| | | | | | | | |
| | | | | | | | 171,128 | |
Machinery — 3.0% | | | | | | | | |
CIRCOR International, Inc. | | | 4,845 | | | | 384,354 | |
ESCO Technologies, Inc. | | | 12,562 | | | | 427,862 | |
See Notes to Financial Statements.
| | | | | | |
| | | SEMI-ANNUAL REPORT | | NOVEMBER 30, 2013 | | 37 |
| | | | |
| Schedule of Investments (continued) | | | BlackRock Master Small Cap Growth Portfolio | |
| | | (Percentages shown are based on Net Assets) | |
| | | | | | | | |
| Common Stocks | | Shares | | | Value | |
Machinery (concluded) | | | | | | | | |
Federal Signal Corp. (a)(b) | | | 17,754 | | | $ | 277,495 | |
Global Brass & Copper Holdings, Inc. | | | 38,608 | | | | 637,032 | |
Hyster-Yale Materials Handling, Inc. | | | 9,330 | | | | 777,749 | |
John Bean Technologies Corp. | | | 28,699 | | | | 848,342 | |
Luxfer Holdings PLC — ADR | | | 129,101 | | | | 2,423,226 | |
The Middleby Corp. (a) | | | 873 | | | | 192,793 | |
Trimas Corp. (a) | | | 43,295 | | | | 1,583,731 | |
Xerium Technologies, Inc. (a) | | | 2,502 | | | | 33,001 | |
| | | | | | | | |
| | | | | | | | 7,585,585 | |
Marine — 1.1% | | | | | | | | |
Matson, Inc. | | | 106,338 | | | | 2,661,640 | |
Media — 1.3% | | | | | | | | |
Crown Media Holdings, Inc., Class A (a) | | | 39,577 | | | | 132,583 | |
CTC Media, Inc. | | | 244,625 | | | | 3,094,506 | |
Harte-Hanks, Inc. | | | 11,779 | | | | 93,761 | |
Salem Communications Corp., Class A | | | 6,278 | | | | 56,439 | |
| | | | | | | | |
| | | | | | | | 3,377,289 | |
Metals & Mining — 0.3% | | | | | | | | |
US Silica Holdings, Inc. (b) | | | 3,092 | | | | 106,705 | |
Worthington Industries, Inc. | | | 13,795 | | | | 578,424 | |
| | | | | | | | |
| | | | | | | | 685,129 | |
Multi-Utilities — 0.3% | | | | | | | | |
Avista Corp. | | | 29,187 | | | | 795,346 | |
Oil, Gas & Consumable Fuels — 3.5% | | | | | | | | |
Abraxas Petroleum Corp. (a) | | | 16,709 | | | | 60,152 | |
Apco Oil and Gas International, Inc. | | | 1,222 | | | | 19,222 | |
Berry Petroleum Co., Class A | | | 4,922 | | | | 247,675 | |
Bonanza Creek Energy, Inc. (a) | | | 47,927 | | | | 2,198,411 | |
Callon Petroleum Co. (a) | | | 19,369 | | | | 128,804 | |
Delek US Holdings, Inc. | | | 39,352 | | | | 1,190,792 | |
Diamondback Energy, Inc. (a) | | | 10,693 | | | | 531,870 | |
EPL Oil & Gas, Inc. (a) | | | 2,213 | | | | 63,402 | |
Evolution Petroleum Corp. | | | 1,408 | | | | 17,403 | |
Gastar Exploration, Inc. (a) | | | 12,304 | | | | 72,471 | |
Goodrich Petroleum Corp. (a) | | | 1,189 | | | | 22,876 | |
Hallador Energy Co. | | | 4,461 | | | | 35,287 | |
Kodiak Oil & Gas Corp. (a) | | | 15,555 | | | | 176,394 | |
L&L Energy, Inc. (a)(b) | | | 32,854 | | | | 55,195 | |
Matador Resources Co. (a) | | | 1,063 | | | | 23,163 | |
Northern Oil and Gas, Inc. (a) | | | 8,381 | | | | 133,677 | |
Renewable Energy Group, Inc. (a) | | | 24,906 | | | | 283,181 | |
REX American Resources Corp. (a) | | | 332 | | | | 10,870 | |
SemGroup Corp., Class A | | | 813 | | | | 49,902 | |
Synergy Resources Corp. (a) | | | 3,972 | | | | 37,496 | |
Triangle Petroleum Corp. (a) | | | 28,614 | | | | 303,881 | |
Vaalco Energy, Inc. (a) | | | 37,487 | | | | 226,796 | |
Warren Resources, Inc. (a) | | | 133,473 | | | | 433,787 | |
Western Refining, Inc. | | | 62,224 | | | | 2,431,092 | |
| | | | | | | | |
| | | | | | | | 8,753,799 | |
Paper & Forest Products — 2.6% | | | | | | | | |
Boise Cascade Co. (a) | | | 37,679 | | | | 966,843 | |
Domtar Corp. | | | 671 | | | | 57,377 | |
KapStone Paper and Packaging Corp. (a) | | | 95,775 | | | | 5,102,892 | |
PH Glatfelter Co. | | | 11,780 | | | | 329,722 | |
| | | | | | | | |
| | | | | | | | 6,456,834 | |
| | | | | | | | |
| Common Stocks | | Shares | | | Value | |
Personal Products — 0.2% | | | | | | | | |
USANA Health Sciences, Inc. (a) | | | 6,932 | | | $ | 506,799 | |
Pharmaceuticals — 2.7% | | | | | | | | |
Aratana Therapeutics, Inc. (a) | | | 3,878 | | | | 76,784 | |
Lannett Co., Inc. (a) | | | 39,199 | | | | 1,157,938 | |
The Medicines Co. (a) | | | 90,562 | | | | 3,315,475 | |
Pain Therapeutics, Inc. | | | 17,274 | | �� | | 79,115 | |
Questcor Pharmaceuticals, Inc. | | | 10,711 | | | | 621,345 | |
Sagent Pharmaceuticals, Inc. (a) | | | 6,619 | | | | 150,317 | |
Santarus, Inc. (a) | | | 16,205 | | | | 521,477 | |
Sciclone Pharmaceuticals, Inc. (a) | | | 86,440 | | | | 421,827 | |
ViroPharma, Inc. (a) | | | 9,646 | | | | 477,573 | |
| | | | | | | | |
| | | | | | | | 6,821,851 | |
Professional Services — 2.4% | | | | | | | | |
Barrett Business Services, Inc. | | | 1,128 | | | | 95,339 | |
The Dolan Co. (a) | | | 8,825 | | | | 6,177 | |
Kforce, Inc. | | | 83,016 | | | | 1,675,263 | |
RPX Corp. (a) | | | 118,053 | | | | 1,950,236 | |
WageWorks, Inc. (a)(b) | | | 40,739 | | | | 2,334,345 | |
| | | | | | | | |
| | | | | | | | 6,061,360 | |
Real Estate Investment Trusts (REITs) — 2.6% | | | | | | | | |
Aviv REIT, Inc. | | | 14,530 | | | | 373,421 | |
Cedar Realty Trust, Inc. | | | 92,506 | | | | 536,535 | |
CyrusOne, Inc. | | | 844 | | | | 17,243 | |
DuPont Fabros Technology, Inc. | | | 42,184 | | | | 990,058 | |
The Geo Group, Inc. | | | 7,675 | | | | 251,740 | |
Highwoods Properties, Inc. | | | 9,037 | | | | 324,609 | |
Investors Real Estate Trust | | | 6,852 | | | | 60,366 | |
PS Business Parks, Inc. | | | 29,233 | | | | 2,289,529 | |
Ryman Hospitality Properties | | | 16,161 | | | | 676,661 | |
Sabra Health Care REIT, Inc. | | | 30,666 | | | | 818,169 | |
Saul Centers, Inc. | | | 2,683 | | | | 130,474 | |
| | | | | | | | |
| | | | | | | | 6,468,805 | |
Real Estate Management & Development — 0.5% | | | | | | | | |
Altisource Residential Corp. | | | 14,127 | | | | 393,437 | |
Forestar Group, Inc. (a) | | | 32,222 | | | | 623,818 | |
Tejon Ranch Co. (a) | | | 4,303 | | | | 153,488 | |
| | | | | | | | |
| | | | | | | | 1,170,743 | |
Road & Rail — 1.4% | | | | | | | | |
Ryder System, Inc. | | | 43,322 | | | | 3,025,608 | |
Swift Transportation Co. (a) | | | 15,628 | | | | 361,788 | |
| | | | | | | | |
| | | | | | | | 3,387,396 | |
Semiconductors & Semiconductor Equipment — 5.7% | | | | | | | | |
Advanced Energy Industries, Inc. (a) | | | 108,664 | | | | 2,588,376 | |
Alpha & Omega Semiconductor Ltd. | | | 11,918 | | | | 92,365 | |
Ambarella, Inc. | | | 31,352 | | | | 777,530 | |
Axcelis Technologies, Inc. (a) | | | 8,916 | | | | 19,883 | |
Inphi Corp. (a) | | | 29,710 | | | | 371,375 | |
Intermolecular, Inc. (a)(b) | | | 55,525 | | | | 316,493 | |
M/A-COM Technology Solutions Holdings, Inc. (a) | | | 6,322 | | | | 101,152 | |
Magnachip Semiconductor Corp. (a) | | | 23,653 | | | | 480,156 | |
Micrel, Inc. | | | 76,505 | | | | 742,864 | |
Microsemi Corp. (a) | | | 134,098 | | | | 3,276,014 | |
Pericom Semiconductor Corp. (a) | | | 8,903 | | | | 84,935 | |
RF Micro Devices, Inc. (a) | | | 8,988 | | | | 47,457 | |
See Notes to Financial Statements.
| | | | | | |
| 38 | | SEMI-ANNUAL REPORT | | NOVEMBER 30, 2013 | | |
| | | | |
| Schedule of Investments (continued) | | | BlackRock Master Small Cap Growth Portfolio | |
| | | (Percentages shown are based on Net Assets) | |
| | | | | | | | |
| Common Stocks | | Shares | | | Value | |
Semiconductors & Semiconductor Equipment (concluded) | |
Sigma Designs, Inc. (a) | | | 7,475 | | | $ | 41,935 | |
Silicon Image, Inc. (a) | | | 143,455 | | | | 777,526 | |
Spansion, Inc., Class A (a) | | | 6,006 | | | | 74,414 | |
Synaptics, Inc. (a)(b) | | | 91,115 | | | | 4,602,219 | |
Tessera Technologies, Inc. | | | 1,444 | | | | 28,880 | |
| | | | | | | | |
| | | | | | | | 14,423,574 | |
Software — 8.8% | | | | | | | | |
Advent Software, Inc. | | | 31,040 | | | | 1,091,056 | |
Aspen Technology, Inc. (a) | | | 153,216 | | | | 6,056,628 | |
AVG Technologies NV (b) | | | 122,824 | | | | 2,122,399 | |
Ebix, Inc. (b) | | | 6,575 | | | | 91,590 | |
Manhattan Associates, Inc. (a) | | | 29,473 | | | | 3,544,423 | |
Progress Software Corp. (a) | | | 83,370 | | | | 2,195,966 | |
PROS Holdings, Inc. (a) | | | 131,684 | | | | 5,075,101 | |
QAD, Inc., Class A | | | 10,164 | | | | 173,601 | |
Rosetta Stone, Inc. (a) | | | 40,563 | | | | 466,475 | |
Verint Systems, Inc. (a) | | | 34,711 | | | | 1,316,241 | |
Viggle, Inc. (Acquired 2/11/11, cost $18,142) (c) | | | 302,362 | | | | 78,614 | |
| | | | | | | | |
| | | | | | | | 22,212,094 | |
Specialty Retail — 4.2% | | | | | | | | |
ANN, Inc. (a) | | | 57,787 | | | | 2,061,262 | |
Big 5 Sporting Goods Corp. | | | 76,647 | | | | 1,427,167 | |
Brown Shoe Co., Inc. | | | 3,908 | | | | 100,553 | |
Christopher & Banks Corp. (a) | | | 2,616 | | | | 16,402 | |
Citi Trends, Inc. (a) | | | 2,457 | | | | 40,565 | |
Express, Inc. (a)(b) | | | 53,085 | | | | 1,306,422 | |
Haverty Furniture Cos, Inc. | | | 17,080 | | | | 486,780 | |
Kirkland’s, Inc. (a) | | | 10,260 | | | | 262,861 | |
Lumber Liquidators Holdings, Inc. (a) | | | 14,498 | | | | 1,459,804 | |
Murphy USA, Inc. (a) | | | 24,732 | | | | 1,119,123 | |
Pacific Sunwear of California, Inc. (a) | | | 28,356 | | | | 82,516 | |
Sears Hometown and Outlet Stores, Inc. (a) | | | 52,051 | | | | 1,664,591 | |
The Wet Seal, Inc., Class A (a)(b) | | | 143,302 | | | | 477,196 | |
Winmark Corp. | | | 269 | | | | 23,040 | |
| | | | | | | | |
| | | | | | | | 10,528,282 | |
Textiles, Apparel & Luxury Goods — 0.9% | | | | | | | | |
Cherokee, Inc. | | | 1,003 | | | | 14,363 | |
Culp, Inc. | | | 1,056 | | | | 21,363 | |
Movado Group, Inc. | | | 43,669 | | | | 1,987,813 | |
Perry Ellis International, Inc. | | | 9,867 | | | | 153,234 | |
Vince Holding Corp. (a) | | | 2,727 | | | | 79,819 | |
| | | | | | | | |
| | | | | | | | 2,256,592 | |
Thrifts & Mortgage Finance — 1.4% | | | | | | | | |
Banc of California, Inc. | | | 5,734 | | | | 73,510 | |
Bank Mutual Corp. | | | 4,285 | | | | 29,695 | |
Essent Group Ltd. | | | 5,590 | | | | 121,527 | |
EverBank Financial Corp. | | | 125,475 | | | | 2,141,858 | |
Heritage Financial Group, Inc. | | | 1,543 | | | | 27,265 | |
HomeStreet, Inc. | | | 30,158 | | | | 638,143 | |
MGIC Investment Corp. (a) | | | 23,286 | | | | 188,849 | |
Provident Financial Holdings, Inc. | | | 12,574 | | | | 185,089 | |
Stonegate Mortgage Corp. (a) | | | 1,340 | | | | 22,767 | |
| | | | | | | | |
| | | | | | | | 3,428,703 | |
Trading Companies & Distributors — 0.3% | | | | | | | | |
Aceto Corp. | | | 7,380 | | | | 158,891 | |
Applied Industrial Technologies, Inc. | | | 8,341 | | | | 403,538 | |
| | | | | | | | |
| Common Stocks | | Shares | | | Value | |
Trading Companies & Distributors (concluded) | |
H&E Equipment Services, Inc. (a) | | | 889 | | | $ | 25,363 | |
Houston Wire & Cable Co. | | | 2,640 | | | | 35,640 | |
Kaman Corp. | | | 1,380 | | | | 55,007 | |
MRC Global, Inc. (a) | | | 1,761 | | | | 53,869 | |
Willis Lease Finance Corp. (a) | | | 3,171 | | | | 57,839 | |
| | | | | | | | |
| | | | | | | | 790,147 | |
Water Utilities — 0.5% | | | | | | | | |
American States Water Co. | | | 44,506 | | | | 1,298,685 | |
Wireless Telecommunication Services — 0.0% | | | | | | | | |
Leap Wireless International, Inc. (a) | | | 3,422 | | | | 56,839 | |
Total Common Stocks — 97.3% | | | | 244,373,454 | |
| | | | | | | | |
| Warrants (d) | | | | | | |
Pharmaceuticals — 0.0% | | | | | | | | |
Alexza Pharmaceuticals, Inc. (Issued/Exercisable 5/06/11, 1 Share for 1 Warrant, Expires 5/06/16, Strike Price $17.70) | | | 222,516 | | | | — | |
Real Estate Management & Development — 0.0% | |
Tejon Ranch Co. (Issued/Exercisable 8/07/13,
1 Share for 1 Warrant, Expires 8/31/16,
Strike Price $40) | | | 547 | | | | 3,118 | |
Total Warrants — 0.0% | | | | | | | 3,118 | |
Total Long-Term Investments (Cost — $205,576,316) — 97.3% | | | | 244,376,572 | |
| | | | | | | | |
| Short-Term Securities | | | | | | |
BlackRock Liquidity Funds, TempFund, Institutional Class, 0.07% (e)(f) | | | 6,573,260 | | | | 6,573,260 | |
| | |
| Beneficial
Interest
(000) |
| | | | |
BlackRock Liquidity Series, LLC, Money Market Series, 0.19% (e)(f)(g) | | $ | 14,250 | | | | 14,249,576 | |
Total Short-Term Securities (Cost — $20,822,836) — 8.3% | | | | 20,822,836 | |
Total Investments (Cost — $226,399,152*) — 105.6% | | | | 265,199,408 | |
Liabilities in Excess of Other Assets — (5.6)% | | | | (14,097,672 | ) |
| | | | | | | | |
Net Assets — 100.0% | | | | | | $ | 251,101,736 | |
| | | | | | | | |
See Notes to Financial Statements.
| | | | | | |
| | | SEMI-ANNUAL REPORT | | NOVEMBER 30, 2013 | | 39 |
| | | | |
| Schedule of Investments (continued) | | | BlackRock Master Small Cap Growth Portfolio | |
|
| Notes to Schedule of Investments |
| * | As of November 30, 2013, gross unrealized appreciation and depreciation based on cost for federal income tax purposes were as follows: |
| | | | |
Tax cost | | $ | 227,973,351 | |
| | | | |
Gross unrealized appreciation | | $ | 44,344,812 | |
Gross unrealized depreciation | | | (7,118,755 | ) |
| | | | |
Net unrealized appreciation | | $ | 37,226,057 | |
| | | | |
| (a) | Non-income producing security. |
| (b) | Security, or a portion of security, is on loan. |
| (c) | Restricted security as to resale. As of report date, the Master Portfolio held less than 0.1% of its net assets, with a current value of $105,827 and an original cost of $18,142, in this security. |
| (d) | Warrants entitle the Master Portfolio to purchase a predetermined number of shares of common stock and are non-income producing. The purchase price and number of shares are subject to adjustment under certain conditions until the expiration date of the warrants, if any. |
| (e) | Investments in issuers considered to be an affiliate of the Master Portfolio during the period ended November 30, 2013, for purposes of Section 2(a)(3) of the Investment Company Act of 1940, as amended, were as follows: |
| | | | | | | | | | | | | | | | |
| Affiliate | | Shares/Beneficial Interest Held at May 31, 2013 | | | Net Activity | | | Shares/Beneficial Interest Held at November 30, 2013 | | | Income | |
BlackRock Liquidity Funds, TempFund, Institutional Class | | | 3,189,995 | | | | 3,383,265 | | | | 6,573,260 | | | $ | 1,085 | |
BlackRock Liquidity Series, LLC, Money Market Series | | $ | 15,812,414 | | | $ | (1,562,838 | ) | | $ | 14,249,576 | | | $ | 136,484 | |
| (f) | Represents the current yield as of report date. |
| (g) | Security was purchased with the cash collateral from loaned securities. The Master Portfolio may withdraw up to 25% of its investment daily, although the manager of the BlackRock Liquidity Series, LLC, Money Market Series, in its sole discretion, may permit an investor to withdraw more than 25% on any one day. |
| Ÿ | | For Master Portfolio compliance purposes, the Master Portfolio’s industry classifications refer to any one or more of the industry sub-classifications used by one or more widely recognized market indexes or ratings group indexes, and/or as defined by the investment advisor. These definitions may not apply for purposes of this report, which may combine such industry sub-classifications for reporting ease. |
| Ÿ | | Financial futures contracts as of November 30, 2013 were as follows: |
| | | | | | | | | | | | | | | | | | | | |
Contracts Purchased | | Issue | | Exchange | | Expiration | | | | | Notional
Value | | | | | Unrealized
Appreciation | |
| 63 | | E-Mini Russell 2000 Futures | | Intercontinental Exchange | | | December 2013 | | | | | $ | 7,192,710 | | | | | $ | 373,701 | |
| Ÿ | | Fair Value Measurements — Various inputs are used in determining the fair value of investments or derivative financial instruments. These inputs to valuation techniques are categorized into a disclosure hierarchy consisting of three broad levels for financial statement purposes as follows: |
| | Ÿ | | Level 1 — unadjusted price quotations in active markets/exchanges for identical assets or liabilities that the Master Portfolio has the ability to access |
| | Ÿ | | Level 2 — other observable inputs (including, but not limited to, quoted prices for similar assets or liabilities in markets that are active, quoted prices for identical or similar assets or liabilities in markets that are not active, inputs other than quoted prices that are observable for the assets or liabilities (such as interest rates, yield curves, volatilities, prepayment speeds, loss severities, credit risks and default rates) or other market–corroborated inputs) |
| | Ÿ | | Level 3 — unobservable inputs based on the best information available in the circumstances, to the extent observable inputs are not available (including the Master Portfolio’s own assumptions used in determining the fair value of investments and derivative financial instruments) |
The hierarchy gives the highest priority to unadjusted quoted prices in active markets for identical assets or liabilities (Level 1 measurements) and the lowest priority to unobservable inputs (Level 3 measurements). Accordingly, the degree of judgment exercised in determining fair value is greatest for instruments categorized in Level 3. The inputs used to measure fair value may fall into different levels of the fair value hierarchy. In such cases, for disclosure purposes, the fair value hierarchy classification is determined based on the lowest level input that is significant to the fair value measurement in its entirety.
Changes in valuation techniques may result in transfers into or out of an assigned level within the disclosure hierarchy. In accordance with the Master Portfolio’s policy, transfers between different levels of the fair value disclosure hierarchy are deemed to have occurred as of the beginning of the reporting period. The categorization of a value determined for investments and derivative financial instruments is based on the pricing transparency of the investment and derivative financial instrument and is not necessarily an indication of the risks associated with investing in those securities. For information about the Master Portfolio’s policy regarding valuation of investments and derivative financial instruments, please refer to Note 2 of the Notes to Financial Statements.
See Notes to Financial Statements.
| | | | | | |
| 40 | | SEMI-ANNUAL REPORT | | NOVEMBER 30, 2013 | | |
| | | | |
| Schedule of Investments (concluded) | | | BlackRock Master Small Cap Growth Portfolio | |
The following tables summarize the Master Portfolio’s investments and derivative financial instruments categorized in the disclosure hierarchy as of November 30, 2013:
| | | | | | | | | | | | | | | | | | | | |
| | | Level 1 | | Level 2 | | Level 3 | | Total |
Assets: | | | | | | | | | | | | | | | | | | | | |
Investments: | | | | | | | | | | | | | | | | | | | | |
Long-Term Investments1 | | | $ | 244,297,958 | | | | | — | | | | $ | 78,614 | | | | $ | 244,376,572 | |
Short-Term Securities | | | | 6,573,260 | | | | $ | 14,249,576 | | | | | — | | | | | 20,822,836 | |
Total | | | $ | 250,871,218 | | | | $ | 14,249,576 | | | | $ | 78,614 | | | | $ | 265,199,408 | |
| | | | | |
1 See above Schedule of Investments for values in each industry excluding Level 3, Software, within the table. | |
| | | | | | | | | | | | | | | | | | | | |
| | | Level 1 | | Level 2 | | Level 3 | | Total |
Derivative Financial Instruments2 | | | | | | | | | | | | | | | | | | | | |
Assets: | | | | | | | | | | | | | | | | | | | | |
Equity contracts | | | $ | 373,701 | | | | | — | | | | | — | | | | $ | 373,701 | |
2 Derivative financial instruments are financial futures contracts, which are valued at the unrealized appreciation/depreciation on the instrument. | |
|
| The carrying amount for certain of the Master Portfolio’s assets and/or liabilities approximates fair value for financial statement purposes. As of November 30, 2013, such assets and/or liabilities are categorized within the disclosure hierarchy as follows: | |
| | | | | | | | | | | | | | | | | | | | |
| | | Level 1 | | Level 2 | | Level 3 | | Total |
Assets: | | | | | | | | | | | | | | | | | | | | |
Cash pledged for other derivative contracts | | | $ | 333,000 | | | | | — | | | | | — | | | | $ | 333,000 | |
Liabilities: | | | | | | | | | | | | | | | | | | | | |
Bank overdraft | | | | — | | | | $ | (166,999 | ) | | | | — | | | | | (166,999 | ) |
Collateral on securities loaned at value | | | | — | | | | | (14,249,576 | ) | | | | — | | | | | (14,249,576 | ) |
Total | | | $ | 333,000 | | | | $ | (14,416,575 | ) | | | | — | | | | $ | (14,083,575 | ) |
| | | | | |
There were no transfers between levels during the period ended November 30, 2013.
See Notes to Financial Statements.
| | | | | | |
| | | SEMI-ANNUAL REPORT | | NOVEMBER 30, 2013 | | 41 |
| | | | |
| Statement of Assets and Liabilities | | | BlackRock Master Small Cap Growth Portfolio | |
| | | | |
| November 30, 2013 (Unaudited) | | | |
| | | | |
| Assets | | | | |
Investments at value — unaffiliated (including securities loaned at value of $13,682,573) (cost — $205,576,316) | | $ | 244,376,572 | |
Investments at value — affiliated (cost — $20,822,836) | | | 20,822,836 | |
Cash pledged for other derivative contracts | | | 333,000 | |
Variation margin receivable on other derivative contracts | | | 7,052 | |
Investments sold receivable | | | 1,580,566 | |
Dividends receivable — unaffiliated | | | 229,355 | |
Dividends receivable — affiliated | | | 308 | |
Securities lending income receivable — affiliated | | | 18,822 | |
Prepaid expenses | | | 3,931 | |
| | | | |
Total assets | | | 267,372,442 | |
| | | | |
| | | | |
| Liabilities | | | | |
Bank overdraft | | | 166,999 | |
Collateral on securities loaned at value | | | 14,249,576 | |
Investments purchased payable | | | 1,425,616 | |
Withdrawals payable to investors | | | 279,472 | |
Investment advisory fees payable | | | 108,042 | |
Directors’ fees payable | | | 2,345 | |
Other affiliates payable | | | 398 | |
Other accrued expenses payable | | | 38,258 | |
| | | | |
Total liabilities | | | 16,270,706 | |
| | | | |
Net Assets | | $ | 251,101,736 | |
| | | | |
| | | | |
| Net Assets Consist of | | | | |
Investors’ capital | | $ | 211,927,779 | |
Net unrealized appreciation/depreciation | | | 39,173,957 | |
| | | | |
Net Assets | | $ | 251,101,736 | |
| | | | |
See Notes to Financial Statements.
| | | | | | |
| 42 | | SEMI-ANNUAL REPORT | | NOVEMBER 30, 2013 | | |
| | | | |
| Statement of Operations | | | BlackRock Master Small Cap Growth Portfolio | |
| | | | |
| Six Months Ended November 30, 2013 (Unaudited) | | | |
| | | | |
| Investment Income | | | | |
Dividends — unaffiliated | | $ | 1,299,082 | |
Securities lending — affiliated — net | | | 136,484 | |
Dividends — affiliated | | | 1,085 | |
| | | | |
Total income | | | 1,436,651 | |
| | | | |
| | | | |
| Expenses | | | | |
Investment advisory | | | 799,013 | |
Accounting services | | | 26,776 | |
Professional | | | 25,411 | |
Custodian | | | 33,203 | |
Directors | | | 5,038 | |
Printing | | | 2,412 | |
Miscellaneous | | | 6,766 | |
| | | | |
Total expenses | | | 898,619 | |
Less fees waived by Manager | | | (184,446 | ) |
| | | | |
Total expenses after fees waived | | | 714,173 | |
| | | | |
Net investment income | | | 722,478 | |
| | | | |
| | | | |
| Realized and Unrealized Gain | | | | |
Net realized gain from: | | | | |
Investments | | | 28,556,484 | |
Financial futures contracts | | | 495,896 | |
| | | | |
| | | 29,052,380 | |
| | | | |
Net change in unrealized appreciation/depreciation on: | | | | |
Investments | | | 17,068,573 | |
Financial futures contracts | | | 387,701 | |
| | | | |
| | | 17,456,274 | |
| | | | |
Total realized and unrealized gain | | | 46,508,654 | |
| | | | |
Net Increase in Net Assets Resulting from Operations | | $ | 47,231,132 | |
| | | | |
See Notes to Financial Statements.
| | | | | | |
| | | SEMI-ANNUAL REPORT | | NOVEMBER 30, 2013 | | 43 |
| | | | |
| Statements of Changes in Net Assets | | | BlackRock Master Small Cap Growth Portfolio | |
| | | | | | | | |
| Increase (Decrease) in Net Assets: | | Six Months
Ended
November 30,
2013
(Unaudited) | | | Year Ended
May 31, 2013 | |
| |
| Operations | | | | | | | | |
Net investment income | | $ | 722,478 | | | $ | 1,004,504 | |
Net realized gain | | | 29,052,380 | | | | 44,216,706 | |
Net change in unrealized appreciation/depreciation | | | 17,456,274 | | | | 14,359,572 | |
| | | | |
Net increase in net assets resulting from operations | | | 47,231,132 | | | | 59,580,782 | |
| | | | |
| | | | | | | | |
| Capital Transactions | | | | | | | | |
Proceeds from contributions | | | 28,878,167 | | | | 68,961,000 | |
Value of withdrawals | | | (41,196,673 | ) | | | (129,190,224 | ) |
| | | | |
Net decrease in net assets derived from capital transactions | | | (12,318,506 | ) | | | (60,229,224 | ) |
| | | | |
| | | | | | | | |
| Net Assets | | | | | | | | |
Total increase (decrease) in net assets | | | 34,912,626 | | | | (648,442 | ) |
Beginning of period | | | 216,189,110 | | | | 216,837,552 | |
| | | | |
End of period | | $ | 251,101,736 | | | $ | 216,189,110 | |
| | | | |
| | | | |
| Financial Highlights | | | BlackRock Master Small Cap Growth Portfolio | |
| | | | | | | | | | | | | | | | | | | | | | | | |
| | | Six Months
Ended
November 30, 2013 (Unaudited) | | | Year Ended May 31, | |
| | | | 2013 | | | 2012 | | | 2011 | | | 2010 | | | 2009 | |
| Total Investment Return | | | | | | | | | | | | | | | | | | | | | | | | |
Total investment return | | | 22.65 | %1 | | | 31.47 | % | | | (13.48 | )% | | | 35.13 | % | | | 26.12 | % | | | (34.16 | )% |
| | | | |
| | | | | | | | | | | | | | | | | | | | | | | | |
| Ratios to Average Net Assets | | | | | | | | | | | | | | | | | | | | | | | | |
Total expenses | | | 0.79 | %2 | | | 0.79 | % | | | 0.77 | % | | | 0.76 | % | | | 0.77 | % | | | 0.78 | % |
| | | | |
Total expenses after fees waived | | | 0.63 | %2 | | | 0.77 | % | | | 0.77 | % | | | 0.76 | % | | | 0.77 | % | | | 0.78 | % |
| | | | |
Net investment income (loss) | | | 0.63 | %2 | | | 0.47 | % | | | (0.32 | )% | | | (0.51 | )% | | | (0.50 | )% | | | (0.13 | )% |
| | | | |
| | | | | | | | | | | | | | | | | | | | | | | | |
| Supplemental Data | | | | | | | | | | | | | | | | | | | | | | | | |
Net assets, end of period (000) | | $ | 251,102 | | | $ | 216,189 | | | $ | 216,838 | | | $ | 504,292 | | | $ | 416,087 | | | $ | 356,614 | |
| | | | |
Portfolio turnover | | | 79 | % | | | 165 | % | | | 143 | % | | | 127 | % | | | 114 | % | | | 75 | % |
| | | | |
| | 1 | Aggregate total investment return. |
See Notes to Financial Statements.
| | | | | | |
| 44 | | SEMI-ANNUAL REPORT | | NOVEMBER 30, 2013 | | |
| | | | |
| Notes to Financial Statements (Unaudited) | | | BlackRock Master Small Cap Growth Portfolio | |
1. Organization:
BlackRock Master Small Cap Growth Portfolio (the “Master Portfolio”), a series of BlackRock Master LLC (the “Master LLC”), is registered under the Investment Company Act of 1940, as amended (the “1940 Act”), as a diversified, open-end management investment company. The Master LLC is organized as a Delaware limited liability company. The Limited Liability Company Agreement of the Master LLC permits the Board of Directors of the Master LLC (the “Board”) to issue non-transferable interests in the Master LLC, subject to certain limitations.
2. Significant Accounting Policies:
The Master Portfolio’s financial statements are prepared in conformity with accounting principles generally accepted in the United States of America (“US GAAP”), which may require management to make estimates and assumptions that affect the reported amounts of assets and liabilities in the financial statements and the reported amounts of increases and decreases in net assets from operations during the reporting period. Actual results could differ from those estimates. The following is a summary of significant accounting policies followed by the Master Portfolio:
Valuation: US GAAP defines fair value as the price the Master Portfolio would receive to sell an asset or pay to transfer a liability in an orderly transaction between market participants at the measurement date. The Master Portfolio determines the fair values of its financial instruments at market value using independent dealers or pricing services under policies approved by the Board. The BlackRock Global Valuation Methodologies Committee (the “Global Valuation Committee”) is the committee formed by management to develop global pricing policies and procedures and to provide oversight of the pricing function for the Master Portfolio for all financial instruments.
Equity investments traded on a recognized securities exchange or the NASDAQ Stock Market (“NASDAQ”) are valued at the last reported sale price that day or the NASDAQ official closing price, if applicable. For equity investments traded on more than one exchange, the last reported sale price on the exchange where the stock is primarily traded is used. Equity investments traded on a recognized exchange for which there were no sales on that day are valued at the last available bid (long positions) or ask (short positions) price. Financial futures contracts traded on exchanges are valued at their last sale price. Investments in open-end registered investment companies are valued at NAV each business day.
The Master Portfolio values its investment in BlackRock Liquidity Series, LLC, Money Market Series (the “Money Market Series”) at fair value, which is ordinarily based upon its pro rata ownership in the underlying fund’s net assets. The Money Market Series seeks current income consistent with maintaining liquidity and preserving capital. Although the Money Market Series is not registered under the 1940 Act, its investments will follow the parameters of investments by a money market fund that is subject to Rule 2a-7 under the 1940 Act. The Master Portfolio may withdraw up to 25% of its investment daily, although the manager of
the Money Market Series, in its sole discretion, may permit an investor to withdraw more than 25% on any one day.
In the event that application of these methods of valuation results in a price for an investment that is deemed not to be representative of the market value of such investment, or if a price is not available, the investment will be valued by the Global Valuation Committee, or its delegate, in accordance with a policy approved by the Board as reflecting fair value (“Fair Value Assets”). When determining the price for Fair Value Assets, the Global Valuation Committee, or its delegate, seeks to determine the price that the Master Portfolio might reasonably expect to receive from the current sale of that asset in an arm’s-length transaction. Fair value determinations shall be based upon all available factors that the Global Valuation Committee, or its delegate, deem relevant consistent with the principles of fair value measurement which include the market approach, income approach and/or in the case of recent investments, the cost approach, as appropriate. The market approach generally consists of using comparable market transactions. The income approach generally is used to discount future cash flows to present value and is adjusted for liquidity as appropriate. These factors include but are not limited to (i) attributes specific to the investment or asset; (ii) the principal market for the investment or asset; (iii) the customary participants in the principal market for the investment or asset; (iv) data assumptions by market participants for the investment or asset, if reasonably available; (v) quoted prices for similar investments or assets in active markets; and (vi) other factors, such as future cash flows, interest rates, yield curves, volatilities, prepayment speeds, loss severities, credit risks, recovery rates, liquidation amounts and/or default rates. Due to the inherent uncertainty of valuations of such investments, the fair values may differ from the values that would have been used had an active market existed. The Global Valuation Committee, or its delegate, employs various methods for calibrating valuation approaches for investments where an active market does not exist, including regular due diligence of the Master Portfolio’s pricing vendors, regular reviews of key inputs and assumptions, transactional back-testing or disposition analysis to compare unrealized gains and losses to realized gains and losses, reviews of missing or stale prices and large movements in market values and reviews of any market related activity. The pricing of all Fair Value Assets is subsequently reported to the Board or a committee thereof on a quarterly basis.
Segregation and Collateralization: In cases where the Fund enters into certain investments (e.g., financial futures contracts) that would be “senior securities” for 1940 Act purposes, the Fund may segregate or designate on its books and records cash or liquid securities having a market value at least equal to the amount of the Fund’s future obligations under such investments. Doing so allows the investment to be excluded from treatment as a “senior security.” Furthermore, if required by an exchange or counterparty agreement, the Fund may be required to deliver/deposit cash and/or securities to/with an exchange, or broker-dealer or custodian as collateral for certain investments or obligations.
| | | | | | |
| | | SEMI-ANNUAL REPORT | | NOVEMBER 30, 2013 | | 45 |
| | | | |
| Notes to Financial Statements (continued) | | | BlackRock Master Small Cap Growth Portfolio | |
Investment Transactions and Investment Income: For financial reporting purposes, investment transactions are recorded on the dates the transactions are entered into (the trade dates). Realized gains and losses on investment transactions are determined on the identified cost basis. Dividend income is recorded on the ex-dividend dates. Upon notification from issuers, some of the dividend income received from a real estate investment trust may be redesignated as a reduction of cost of the related investment and/or realized gain.
Income Taxes: The Master Portfolio is disregarded as an entity separate from its owner for tax purposes. As such, the owner of the Master Portfolio is treated as the owner of the net assets, income, expenses and realized and unrealized gains and losses of the Master Portfolio. Therefore, no federal tax provision is required. It is intended that the Master Portfolio’s assets will be managed so the owner of the Master Portfolio can satisfy the requirements of Subchapter M of the Internal Revenue Code of 1986, as amended.
Other: Expenses directly related to the Master Portfolio are charged to the Master Portfolio. Other operating expenses shared by several funds are pro rated among those funds on the basis of relative net assets or other appropriate methods.
The Master Portfolio has an arrangement with the custodian whereby fees may be reduced by credits earned on uninvested cash balances, which, if applicable, are shown as fees paid indirectly in the Statement of Operations. The custodian imposes fees on overdrawn cash balances, which can be offset by accumulated credits earned or may result in additional custody charges.
3. Securities and Other Investments:
Securities Lending: The Master Portfolio may lend securities to approved borrowers, such as banks, brokers and other financial institutions. The borrower pledges cash, securities issued or guaranteed by the US government or irrevocable letters of credit issued by a bank as collateral. The initial collateral received by the Master Portfolio should have a value of at least 102% of the current value of the loaned securities for securities traded on US exchanges and a value of at least 105% for all other securities. The collateral is maintained thereafter in an amount equal to at least 100% of the current market value of the loaned securities. The market value of the loaned securities is determined at the close of business of the Master Portfolio and any additional required collateral is delivered to the Master Portfolio on the next business day. Securities lending income, as disclosed in the Statement of Operations, represents the income earned from the investment of the cash collateral, net of rebates paid to, or fees paid by, borrowers and less the fees paid to the securities lending agent. During the term of the loan, the Master Portfolio earns dividend or interest income on the securities loaned but does not receive interest income on the securities received as collateral. Loans of securities are terminable at any time and the borrower, after notice, is required to return borrowed securities within the standard time period for settlement of securities transactions.
The market value of securities on loan and the value of the related collateral are shown separately in the Statement of Assets and Liabilities as a component of investments at value, and collateral on securities loaned at value, respectively. The cash collateral invested by the securities lending agent, BlackRock Investment Management, LLC (“BIM”), if any, is disclosed in the Schedule of Investments.
Securities lending transactions are entered into by the Master Portfolio under Master Securities Lending Agreements (“MSLA”) which provide the right, in the event of default (including bankruptcy or insolvency) for the non-defaulting party to liquidate the collateral and calculate a net exposure to the defaulting party or request additional collateral. In the event that a borrower defaults, the Master Portfolio, as lender, would offset the market value of the collateral received against the market value of the securities loaned. The value of the collateral is typically greater than that of the market value of the securities loaned, leaving the lender with a net amount payable to the defaulting party. However, bankruptcy or insolvency laws of a particular jurisdiction may impose restrictions on or prohibitions against such a right of offset in the event of a MSLA counterparty’s bankruptcy or insolvency. Under the MSLA, the borrower can resell or re-pledge the loaned securities, and the Master Portfolio can reinvest cash collateral, or, upon an event of default, resell or re-pledge the collateral.
The following table is a summary of the Master Portfolio’s securities lending agreements by counterparty which are subject to offset under a MSLA as of November 30, 2013:
| | | | | | | | | | | | |
| Counterparty | | Securities Loaned
at Value | | | Cash Collateral
Received1 | | | Net Amount | |
Credit Suisse Securities (USA) LLC | | $ | 1,196,892 | | | $ | (1,196,892 | ) | | | — | |
Deutsche Bank AG | | | 53,340 | | | | (53,340 | ) | | | — | |
Goldman Sachs & Co. | | | 1,371,312 | | | | (1,371,312 | ) | | | — | |
JP Morgan Securities LLC | | | 2,004,258 | | | | (2,004,258 | ) | | | — | |
Merrill Lynch, Pierce, Fenner & Smith Inc. | | | 155,213 | | | | (155,213 | ) | | | — | |
Morgan Stanley | | | 5,154,354 | | | | (5,154,354 | ) | | | — | |
UBS Securities LLC | | | 3,747,204 | | | | (3,747,204 | ) | | | — | |
| | | | |
Total | | $ | 13,682,573 | | | $ | (13,682,573 | ) | | | — | |
| | | | |
| | 1 | Collateral with a value of $14,249,576 has been received in connection with securities lending transactions. Excess of collateral received from the individual counterparty is not shown for financial reporting purposes. |
The risks of securities lending also include the risk that the borrower may not provide additional collateral when required or may not return the securities when due. To mitigate this risk, the Master Portfolio benefits from a borrower default indemnity provided by BlackRock, Inc. (“BlackRock”). BlackRock’s indemnity allows for full replacement of the securities lent. The Master Portfolio also could suffer a loss if the value of an investment purchased with cash collateral falls below the market value of loaned securities or if the value of an investment purchased with cash collateral falls below the value of the original cash collateral received. During the six months ended November 30, 2013, any securities on loan were collateralized by cash.
| | | | | | |
| 46 | | SEMI-ANNUAL REPORT | | NOVEMBER 30, 2013 | | |
| | | | |
| Notes to Financial Statements (continued) | | | BlackRock Master Small Cap Growth Portfolio | |
4. Derivative Financial Instruments:
The Master Portfolio engages in various portfolio investment strategies using derivative contracts both to increase the returns of the Master Portfolio and/or to economically hedge its exposure to certain risks such as equity risk. These contracts may be transacted on an exchange or OTC.
Financial Futures Contracts: The Master Portfolio purchases and/or sells financial futures contracts to gain exposure to, or economically hedge against, changes in the value of equity securities (equity risk). Financial futures contracts are agreements between the Master Portfolio and a counterparty to buy or sell a specific quantity of an underlying instrument at a specified price and at a specified date. Depending on the terms of the particular contract, financial futures contracts are settled either through physical delivery of the underlying instrument on the settlement date or by payment of a cash settlement amount on the settlement date.
Upon entering into a financial futures contract, the Master Portfolio is required to deposit initial margin with the broker in the form of cash or securities in an amount that varies depending on a contract’s size and risk profile. The initial margin deposit must then be maintained at an established level over the life of the contract. Securities deposited as initial margin are designated on the Schedule of Investments and cash deposited, if any, is recorded on the Statement of Assets and Liabilities as cash pledged for other derivative contracts. Pursuant to the contract, the Master Portfolio agrees to receive from or pay to the broker an amount of cash equal to the daily fluctuation in value of the contract. Such receipts or payments are known as variation margin. Variation margin is recorded by the Master Portfolio as unrealized appreciation or depreciation and, if applicable, as a receivable or payable for variation margin in the Statement of Assets and Liabilities.
When the contract is closed, the Master Portfolio records a realized gain or loss equal to the difference between the value of the contract at the time it was opened and the value at the time it was closed. The use of financial futures contracts involves the risk of an imperfect correlation in the movements in the price of financial futures contracts and the underlying assets.
The following is a summary of the Master Portfolio’s derivative financial instruments categorized by risk exposure:
| | | | | | |
Fair Values of Derivative Financial Instruments as of November 30, 2013 | |
Derivative Assets | |
| | | Statement of Assets and Liabilities Location | | | Value | |
Equity contracts | | Net unrealized appreciation/depreciation1 | | $ | 373,701 | |
| | | |
| | 1 | Includes cumulative appreciation/depreciation on financial futures contracts as reported in the Schedule of Investments. Only current day’s variation margin is reported within the Statement of Assets and Liabilities. |
| | | | |
The Effect of Derivative Financial Instruments in the Statement of Operations Six Months Ended November 30, 2013 | |
Net Realized Gain From | |
Equity contracts: | | | | |
Financial futures contracts | | $ | 495,896 | |
| |
| |
Net Change in Unrealized Appreciation/Depreciation on | |
Equity contracts: | | | | |
Financial futures contracts | | $ | 387,701 | |
| |
For the six months ended November 30, 2013, the average quarterly balances of outstanding derivative financial instruments were as follows:
| | | | |
Financial futures contracts: | | | | |
Average number of contracts purchased | | | 60 | |
Average notional value of contracts purchased | | $ | 6,424,635 | |
Counterparty Credit Risk: A derivative contract may suffer a mark to market loss if the value of the contract decreases due to an unfavorable change in the market rates or values of the underlying instrument. Losses can also occur if the counterparty does not perform under the contract.
The Master Portfolio’s risk of loss from counterparty credit risk on OTC derivatives is generally limited to the aggregate unrealized gain netted against any collateral held by the Master Portfolio.
With exchange traded futures, there is less counterparty credit risk to the Master Portfolio since the exchange or clearinghouse, as counterparty to such instruments, guarantees against a possible default. The clearing-house stands between the buyer and the seller of the contract; therefore, the credit risk is limited to failure of the clearinghouse. While offset rights may exist under applicable law, the Master Portfolio does not have a contractual right of offset against a clearing broker or clearinghouse in the event of a default (including the bankruptcy or insolvency) of the clearing broker or clearinghouse. Additionally, credit risk exists in exchange traded futures with respect to initial and variation margin that is held in a clearing broker’s customer accounts. While clearing brokers are required to segregate customer margin from their own assets, in the event that a clearing broker becomes insolvent or goes into bankruptcy and at that time there is a shortfall in the aggregate amount of margin held by the clearing broker for all its clients, typically the shortfall would be allocated on a pro rata basis across all the clearing broker’s customers, potentially resulting in losses to the Master Portfolio.
5. Investment Advisory Agreement and Other Transactions with Affiliates:
The PNC Financial Services Group, Inc. is the largest stockholder and an affiliate, for 1940 Act purposes, of BlackRock.
The Master LLC, on behalf of the Master Portfolio, entered into an Investment Advisory Agreement with BlackRock Advisors, LLC (the “Manager”), the Master Portfolio’s investment advisor, an indirect, wholly owned subsidiary of BlackRock, to provide investment advisory and administration services. The Manager is responsible for the management of the Master
| | | | | | |
| | | SEMI-ANNUAL REPORT | | NOVEMBER 30, 2013 | | 47 |
| | | | |
| Notes to Financial Statements (continued) | | | BlackRock Master Small Cap Growth Portfolio | |
Portfolio’s portfolio and provides the necessary personnel, facilities, equipment and certain other services necessary to the operations of the Master Portfolio. For such services, the Master Portfolio pays the Manager a monthly fee based on a percentage of the Master Portfolio’s average daily net assets at the following annual rates:
| | | | |
| Average Daily Net Assets | | Investment
Advisory Fee | |
First $1 Billion | | | 0.70 | % |
$1 Billion - $3 Billion | | | 0.66 | % |
$3 Billion - $5 Billion | | | 0.63 | % |
$5 Billion - $10 Billion | | | 0.61 | % |
Greater than $10 Billion | | | 0.60 | % |
The Manager entered into a contractual agreement to waive 0.16% of the advisory fee payable as a percentage of the Master Portfolio’s average daily net assets until October 1, 2014. The contractual agreement may be terminated upon 90 days’ notice by a majority of the independent directors of the Master LLC or by a vote of a majority of the outstanding voting securities of the Master Portfolio. For the six months ended November 30, 2013, the Manager waived $182,632 of investment advisory fees, which is included in fees waived by Manager in the Statement of Operations.
The Manager voluntarily agreed to waive its investment advisory fees by the amount of investment advisory fees the Master Portfolio pays to the Manager indirectly through its investment in affiliated money market funds. However, the Manager does not waive its investment advisory fees by the amount of investment advisory fees paid in connection with the Master Portfolio’s investment in other affiliated investment companies, if any. This amount is included in fees waived by Manager in the Statement of Operations. For the six months ended November 30, 2013, the amount waived was $1,814.
The Manager entered into a sub-advisory agreement with BlackRock Capital Management, Inc. (“BCM”), an affiliate of the Manager. The Manager pays BCM, for services it provides, a monthly fee that is a percentage of the investment advisory fees paid by the Master Portfolio to the Manager.
For the six months ended November 30, 2013, the Master Portfolio reimbursed the Manager $1,026 for certain accounting services, which is included in accounting services in the Statement of Operations.
The Master Portfolio received an exemptive order from the SEC permitting it, among other things, to pay an affiliated securities lending agent a fee based on a share of the income derived from the securities lending activities and has retained BIM as the securities lending agent. BIM may, on behalf of the Master Portfolio, invest cash collateral received by the Master Portfolio for such loans in a private investment company managed by the Manager or in registered money market funds advised by the Manager or its affiliates. The market value of securities on loan and the value of the related collateral, if applicable, is shown in the Statement of Assets and Liabilities as securities loaned at value and collateral on securities loaned at value, respectively. The cash collateral invested by
BIM, if any, is disclosed in the Schedule of Investments. Securities lending income is equal to the total of income earned from the reinvestment of cash collateral, net of rebates paid to, or fees paid by, borrowers of securities. The Master Portfolio retains 65% of securities lending income and pays a fee to BIM equal to 35% of such income. The Master Portfolio benefits from a borrower default indemnity provided by BlackRock. As securities lending agent, BIM bears all operational costs directly related to securities lending as well as the cost of borrower default indemnification. BIM does not receive any fees for managing the cash collateral. The share of income earned by the Master Portfolio is shown as securities lending — affiliated — net in the Statement of Operations. For the six months ended November 30, 2013, BIM received $73,491 in securities lending agent fees related to securities lending activities for the Master Portfolio.
Certain officers and/or directors of the Master LLC are officers and/or directors of BlackRock or its affiliates.
6. Purchases and Sales:
Purchases and sales of investments excluding short-term securities for the six months ended November 30, 2013 were $172,330,781 and $188,326,526, respectively.
7. Bank Borrowings:
The Master Portfolio, along with certain other funds managed by the Manager and its affiliates (“Participating Funds”), is a party to a 364-day, $800 million credit agreement with a group of lenders, under which the Master Portfolio may borrow to fund shareholder redemptions. The agreement expires in April 2014. Excluding commitments designated for a certain individual fund, other Participating Funds, including the Master Portfolio, can borrow up to an aggregate commitment amount of $500 million, subject to asset coverage and other limitations as specified in the agreement. The credit agreement has the following terms: a fee of 0.065% per annum on unused commitment amounts and interest at a rate equal to the higher of (a) the one-month LIBOR plus 0.80% per annum or (b) the Fed Funds rate plus 0.80% per annum on amounts borrowed. Participating Funds paid administration and arrangement fees, which, along with commitment fees, were allocated among such funds based upon portions of the aggregate commitment available to them and relative net assets of Participating Funds. The Master Portfolio did not borrow under the credit agreement during the six months ended November 30, 2013.
8. Concentration, Market and Credit Risk:
In the normal course of business, the Master Portfolio invests in securities and enters into transactions where risks exist due to fluctuations in the market (market risk) or failure of the issuer of a security to meet all its obligations (issuer credit risk). The value of securities held by the Master Portfolio may decline in response to certain events, including those directly involving the issuers whose securities are owned by the
| | | | | | |
| 48 | | SEMI-ANNUAL REPORT | | NOVEMBER 30, 2013 | | |
| | | | |
| Notes to Financial Statements (concluded) | | | BlackRock Master Small Cap Growth Portfolio | |
Master Portfolio; conditions affecting the general economy; overall market changes; local, regional or global political, social or economic instability; and currency and interest rate and price fluctuations. Similar to issuer credit risk, the Master Portfolio may be exposed to counterparty credit risk, or the risk that an entity with which the Master Portfolio has unsettled or open transactions may fail to or be unable to perform on its commitments. The Master Portfolio manages counterparty credit risk by entering into transactions only with counterparties that it believes have the financial resources to honor their obligations and by monitoring the financial stability of those counterparties. Financial assets, which potentially expose the Master Portfolio to market, issuer and counterparty credit risks, consist principally of financial instruments and receivables due from counterparties. The extent of the Master Portfolio’s exposure to market, issuer and counterparty credit risks with respect to these financial assets is generally approximated by their value recorded in the Statement of Assets and Liabilities, less any collateral held by the Master Portfolio.
As of November 30, 2013, the Master Portfolio invested a significant portion of its assets in securities in the information technology sector. Changes in economic conditions affecting the information technology sector would have a greater impact on the Master Portfolio and could affect the value, income and/or liquidity of positions in such securities.
9. Subsequent Events:
Management has evaluated the impact of all subsequent events on the Master Portfolio through the date the financial statements were issued and has determined that there were no subsequent events requiring adjustment or additional disclosure in the financial statements.
| | | | | | |
| | | SEMI-ANNUAL REPORT | | NOVEMBER 30, 2013 | | 49 |
| | |
| Officers and Directors/Trustees | | |
Ronald W. Forbes, Co-Chairman of the Board and Director/Trustee
Rodney D. Johnson, Co-Chairman of the Board and Director/Trustee
Paul L. Audet, Director/Trustee
David O. Beim, Director/Trustee
Henry Gabbay, Director/Trustee
Dr. Matina S. Horner, Director/Trustee
Herbert I. London, Director/Trustee
Ian A. MacKinnon, Director/Trustee
Cynthia A. Montgomery, Director/Trustee
Joseph P. Platt, Director/Trustee
Robert C. Robb, Jr., Director/Trustee
Toby Rosenblatt, Director/Trustee
Kenneth L. Urish, Director/Trustee
Frederick W. Winter, Director/Trustee
John M. Perlowski, President and Chief Executive Officer
Richard Hoerner, CFA, Vice President
Brendan Kyne, Vice President
Christopher Stavrakos, CFA, Vice President
Neal Andrews, Chief Financial Officer
Jay Fife, Treasurer
Brian Kindelan, Chief Compliance Officer and Anti-Money Laundering Officer
Benjamin Archibald, Secretary
Investment Advisor and Co-Administrator
BlackRock Advisors, LLC1
Wilmington, DE 19809
Sub-Advisor
BlackRock Capital Management, Inc.2
New York, NY 10055
BlackRock Fund Advisors3
San Francisco, CA 94105
Accounting Agent and Transfer Agent
BNY Mellon Investment Servicing (US) Inc.
Wilmington, DE 19809
Custodians
Brown Brothers Harriman & Co.2
Boston, MA 02109
The Bank of New York Mellon3
New York, NY 10286
Distributor
BlackRock Investments, LLC
New York, NY 10022
Legal Counsel
Sidley Austin LLP
New York, NY 10019
Independent Registered Public Accounting Firm
Deloitte & Touche LLP
Philadelphia, PA 19103
Address of the Fund/Trust
100 Bellevue Parkway
Wilmington, DE 19809
| | 1 | Co-Administrator for BlackRock Disciplined Small Cap Core Fund. |
| | 2 | For BlackRock Master Small Cap Growth Portfolio. |
| | 3 | For BlackRock Disciplined Small Cap Core Fund. |
| | | | | | |
| 50 | | SEMI-ANNUAL REPORT | | NOVEMBER 30, 2013 | | |
Electronic Delivery
Electronic copies of most financial reports and prospectuses are available on the Funds’ website or shareholders can sign up for e-mail notifications of quarterly statements, annual and semi-annual reports and prospectuses by enrolling in the Funds’ electronic delivery program.
To enroll:
Shareholders Who Hold Accounts with Investment Advisors, Banks or Brokerages:
Please contact your financial advisor. Please note that not all investment advisors, banks or brokerages may offer this service.
Shareholders Who Hold Accounts Directly with BlackRock:
| 1) | Access the BlackRock website at |
| | http://www.blackrock.com/edelivery |
| 2) | Select “eDelivery” under the “More Information” section |
Householding
The Funds will mail only one copy of shareholder documents, including prospectuses, annual and semi-annual reports and proxy statements, to shareholders with multiple accounts at the same address. This practice is commonly called “householding” and is intended to reduce expenses and eliminate duplicate mailings of shareholder documents. Mailings of your shareholder documents may be householded indefinitely unless you instruct us otherwise. If you do not want the mailing of these documents to be combined with those for other members of your household, please call the Funds at (800) 441-7762.
Availability of Quarterly Schedule of Investments
The Funds/Master Portfolio files their complete schedule of portfolio holdings with the SEC for the first and third quarters of each fiscal year on Form N-Q. The Funds’/Master Portfolio’s Forms N-Q are available on the SEC’s website at http://www.sec.gov and may also be reviewed and copied at the SEC’s Public Reference Room in Washington, DC. Information on how to access documents on the SEC’s website without charge may be obtained by calling (800) SEC-0330. The Funds’/Master Portfolio’s Forms N-Q may also be obtained upon request and without charge by calling (800) 441-7762.
Availability of Proxy Voting Policies and Procedures
A description of the policies and procedures that the Funds/Master Portfolio use to determine how to vote proxies relating to portfolio securities is available (1) without charge, upon request, by calling (800) 441-7762; (2) at http://www.blackrock.com; and (3) on the SEC’s website at http://www.sec.gov.
Availability of Proxy Voting Record
Information about how the Funds/Master Portfolio voted proxies relating to securities held in the Fund’s/Master Portfolio’s portfolios during the most recent 12-month period ended June 30 is available upon request and without charge (1) at http://www.blackrock.com or by calling (800) 441-7762 and (2) on the SEC’s website at http://www.sec.gov.
Account Information
Call us at (800) 441-7762 from 8:00 AM to 6:00 PM EST on any business day to get information about your account balances, recent transactions and share prices. You can also reach us on the Web at http://www.blackrock.com/funds.
Automatic Investment Plans
Investor Class shareholders who want to invest regularly can arrange to have $50 or more automatically deducted from their checking or savings account and invested in any of the BlackRock funds.
Systematic Withdrawal Plans
Investor Class shareholders can establish a systematic withdrawal plan and receive periodic payments of $50 or more from their BlackRock funds, as long as their account balance is at least $10,000.
Retirement Plans
Shareholders may make investments in conjunction with Traditional, Rollover, Roth, Coverdell, Simple IRAs, SEP IRAs and 403(b) Plans.
| | | | | | |
| | | SEMI-ANNUAL REPORT | | NOVEMBER��30, 2013 | | 51 |
| | |
| Additional Information (concluded) | | |
|
| BlackRock Privacy Principles |
BlackRock is committed to maintaining the privacy of its current and former fund investors and individual clients (collectively, “Clients”) and to safeguarding their non-public personal information. The following information is provided to help you understand what personal information BlackRock collects, how we protect that information and why in certain cases we share such information with select parties.
If you are located in a jurisdiction where specific laws, rules or regulations require BlackRock to provide you with additional or different privacy-related rights beyond what is set forth below, then BlackRock will comply with those specific laws, rules or regulations.
BlackRock obtains or verifies personal non-public information from and about you from different sources, including the following: (i) information we receive from you or, if applicable, your financial intermediary, on applications, forms or other documents; (ii) information about your transactions with us, our affiliates, or others; (iii) information we receive from a consumer reporting agency; and (iv) from visits to our websites.
BlackRock does not sell or disclose to non-affiliated third parties any non-public personal information about its Clients, except as permitted by law or as is necessary to respond to regulatory requests or to service Client accounts. These non-affiliated third parties are required to protect the confidentiality and security of this information and to use it only for its intended purpose.
We may share information with our affiliates to service your account or to provide you with information about other BlackRock products or services that may be of interest to you. In addition, BlackRock restricts access to non-public personal information about its Clients to those BlackRock employees with a legitimate business need for the information. BlackRock maintains physical, electronic and procedural safeguards that are designed to protect the non-public personal information of its Clients, including procedures relating to the proper storage and disposal of such information.
| | | | | | |
| 52 | | SEMI-ANNUAL REPORT | | NOVEMBER 30, 2013 | | |
| | |
| A World-Class Mutual Fund Family | | |
BlackRock offers a diverse lineup of open-end mutual funds crossing all investment styles and managed by experts in equity, fixed income and tax-exempt investing.
BlackRock ACWI ex-US Index Fund
BlackRock All-Cap Energy & Resources Portfolio
BlackRock Basic Value Fund
BlackRock Capital Appreciation Fund
BlackRock Commodity Strategies Fund
BlackRock Disciplined Small Cap Core Fund
BlackRock Emerging Markets Dividend Fund
BlackRock Emerging Markets Fund
BlackRock Emerging Markets Long/Short Equity Fund
BlackRock Energy & Resources Portfolio
BlackRock Equity Dividend Fund
BlackRock EuroFund
BlackRock Flexible Equity Fund
BlackRock Focus Growth Fund
BlackRock Global Dividend Portfolio
BlackRock Global Long/Short Equity Fund
BlackRock Global Opportunities Portfolio
BlackRock Global SmallCap Fund
BlackRock Health Sciences Opportunities Portfolio
BlackRock International Fund
BlackRock International Index Fund
BlackRock International Opportunities Portfolio
BlackRock Large Cap Core Fund
BlackRock Large Cap Core Plus Fund
BlackRock Large Cap Growth Fund
BlackRock Large Cap Value Fund
BlackRock Latin America Fund
BlackRock Long-Horizon Equity Fund
BlackRock Mid-Cap Growth Equity Portfolio
BlackRock Mid-Cap Value Opportunities Fund
BlackRock Natural Resources Trust
BlackRock Pacific Fund
BlackRock Real Estate Securities Fund
BlackRock Russell 1000 Index Fund
BlackRock Science & Technology Opportunities Portfolio
BlackRock Small Cap Growth Equity Portfolio
BlackRock Small Cap Growth Fund II
BlackRock Small Cap Index Fund
BlackRock S&P 500 Stock Fund
BlackRock U.S. Opportunities Portfolio
BlackRock Value Opportunities Fund
|
| Taxable Fixed Income Funds |
BlackRock Bond Index Fund
BlackRock Core Bond Portfolio
BlackRock CoreAlpha Bond Fund
BlackRock Emerging Markets Flexible Dynamic Bond Portfolio
BlackRock Floating Rate Income Portfolio
BlackRock Global Long/Short Credit Fund
BlackRock GNMA Portfolio
BlackRock High Yield Bond Portfolio
BlackRock Inflation Protected Bond Portfolio
BlackRock International Bond Portfolio
BlackRock Investment Grade Bond Portfolio
BlackRock Low Duration Bond Portfolio
BlackRock Secured Credit Portfolio
BlackRock Short Obligations Fund
BlackRock Short-Term Treasury Fund
BlackRock Strategic Income Opportunities Portfolio
BlackRock Total Return Fund
BlackRock U.S. Government Bond Portfolio
BlackRock U.S. Mortgage Portfolio
BlackRock Ultra-Short Obligations Fund
BlackRock World Income Fund
|
| Municipal Fixed Income Funds |
BlackRock California Municipal Bond Fund
BlackRock High Yield Municipal Fund
BlackRock National Municipal FundBlackRock
BlackRock New Jersey Municipal Bond Fund
BlackRock New York Municipal Bond Fund
BlackRock Pennsylvania Municipal Bond Fund
BlackRock Short-Term Municipal Fund
BlackRock Strategic Municipal Opportunities Fund
| | | | | | | | | | | | | | |
| BlackRock Balanced Capital Fund | | LifePath Active Portfolios | | LifePath Index Portfolios |
| BlackRock Emerging Market Allocation Portfolio | | 2015 | | | 2040 | | | | | Retirement | | 2040 | | |
| BlackRock Global Allocation Fund | | 2020 | | | 2045 | | | | | 2020 | | 2045 | | |
| BlackRock Managed Volatility Portfolio | | 2025 | | | 2050 | | | | | 2025 | | 2050 | | |
| BlackRock Multi-Asset Income Portfolio | | 2030 | | | 2055 | | | | | 2030 | | 2055 | | |
| BlackRock Multi-Asset Real Return Fund | | 2035 | | | | | | | | 2035 | | | | |
| BlackRock Strategic Risk Allocation Fund | | | | | | | | | | | | | | |
| | | | | | |
| BlackRock Prepared Portfolios | | LifePath Portfolios | | | | | | | | | | | | |
Conservative Prepared Portfolio | | Retirement | | | 2040 | | | | | | | | | |
Moderate Prepared Portfolio | | 2020 | | | 2045 | | | | | | | | | |
Growth Prepared Portfolio | | 2025 | | | 2050 | | | | | | | | | |
Aggressive Growth Prepared Portfolio | | 2030 | | | 2055 | | | | | | | | | |
| | 2035 | | | | | | | | | | | | |
BlackRock mutual funds are currently distributed by BlackRock Investments, LLC. You should consider the investment objectives, risks, charges and expenses of the funds under consideration carefully before investing. Each fund’s prospectus contains this and other information and is available at www.blackrock.com or by calling (800) 441-7762 or from your financial advisor. The prospectus should be read carefully before investing.
| | | | | | |
| | | SEMI-ANNUAL REPORT | | NOVEMBER 30, 2013 | | 53 |
| | |
| This report is transmitted to shareholders only. It is not authorized for use as an offer of sale or a solicitation of an offer to buy shares of a Fund unless accompanied or preceded by that Fund’s current prospectus. Past performance results shown in this report should not be considered a representation of future performance. Investment returns and principal value of shares will fluctuate so that shares, when redeemed, may be worth more or less than their original cost. Statements and other information herein are as dated and are subject to change. | |  |
| | |
| SC2-11/13-SAR | |  |
| | |
| |
| Item 2 – | | Code of Ethics – Not Applicable to this semi-annual report |
| |
| Item 3 – | | Audit Committee Financial Expert – Not Applicable to this semi-annual report |
| |
| Item 4 – | | Principal Accountant Fees and Services – Not Applicable to this semi-annual report |
| |
| Item 5 – | | Audit Committee of Listed Registrants – Not Applicable |
| |
| Item 6 – | | Investments |
| | (a) The registrant’s Schedule of Investments is included as part of the Report to Stockholders filed under Item 1 of this Form. |
| | (b) Not Applicable due to no such divestments during the semi-annual period covered since the previous Form N-CSR filing. |
| |
| Item 7 – | | Disclosure of Proxy Voting Policies and Procedures for Closed-End Management Investment Companies – Not Applicable |
| |
| Item 8 – | | Portfolio Managers of Closed-End Management Investment Companies – Not Applicable |
| |
| Item 9 – | | Purchases of Equity Securities by Closed-End Management Investment Company and Affiliated Purchasers – Not Applicable |
| |
| Item 10 – | | Submission of Matters to a Vote of Security Holders –There have been no material changes to these procedures. |
| |
| Item 11 – | | Controls and Procedures |
| |
| | (a) – The registrant’s principal executive and principal financial officers, or persons performing similar functions, have concluded that the registrant’s disclosure controls and procedures (as defined in Rule 30a-3(c) under the Investment Company Act of 1940, as amended (the “1940 Act”)) are effective as of a date within 90 days of the filing of this report based on the evaluation of these controls and procedures required by Rule 30a-3(b) under the 1940 Act and Rule 15d-15(b) under the Securities Exchange Act of 1934, as amended. |
| |
| | (b) – There were no changes in the registrant’s internal control over financial reporting (as defined in Rule 30a-3(d) under the 1940 Act) that occurred during the second fiscal quarter of the period covered by this report that have materially affected, or are reasonably likely to materially affect, the registrant’s internal control over financial reporting. |
| |
| Item 12 – | | Exhibits attached hereto |
| |
| | (a)(1) – Code of Ethics – Not Applicable to this semi-annual report |
| |
| | (a)(2) – Certifications – Attached hereto |
| |
| | (a)(3) – Not Applicable |
| |
| | (b) – Certifications – Attached hereto |
2
Pursuant to the requirements of the Securities Exchange Act of 1934 and the Investment Company Act of 1940, the registrant has duly caused this report to be signed on its behalf by the undersigned, thereunto duly authorized.
| | |
| BlackRock Funds |
| |
| By: | | /s/ John M. Perlowski |
| | John M. Perlowski |
| | Chief Executive Officer (principal executive officer) of |
| | BlackRock Funds |
|
| Date: February 3, 2014 |
Pursuant to the requirements of the Securities Exchange Act of 1934 and the Investment Company Act of 1940, this report has been signed below by the following persons on behalf of the registrant and in the capacities and on the dates indicated.
| | |
| By: | | /s/ John M. Perlowski |
| | John M. Perlowski |
| | Chief Executive Officer (principal executive officer) of |
| | BlackRock Funds |
|
| Date: February 3, 2014 |
| |
| By: | | /s/ Neal J. Andrews |
| | Neal J. Andrews |
| | Chief Financial Officer (principal financial officer) of |
| | BlackRock Funds |
|
| Date: February 3, 2014 |
3