UNITED STATES
SECURITIES AND EXCHANGE COMMISSION
Washington, D.C. 20549
FORM N-CSR
CERTIFIED SHAREHOLDER REPORT OF REGISTERED MANAGEMENT INVESTMENT COMPANIES
Investment Company Act file number: 811-05742
Name of Fund: BlackRock Funds
BlackRock Commodity Strategies Fund
BlackRock Global Long/Short Credit Fund
BlackRock Multi-Asset Real Return Fund
BlackRock Short Obligations Fund
BlackRock Short-Term Treasury Fund
BlackRock Strategic Risk Allocation Fund
BlackRock Ultra-Short Obligations Fund
Fund Address: 100 Bellevue Parkway, Wilmington, DE 19809
Name and address of agent for service: John M. Perlowski, Chief Executive Officer, BlackRock Funds, 55 East 52nd Street, New York, NY 10055
Registrant’s telephone number, including area code: (800) 441-7762
Date of fiscal year end: 07/31/2014
Date of reporting period: 01/31/2014
Item 1 – Report to Stockholders
JANUARY 31, 2014
| | | | |
SEMI-ANNUAL REPORT (UNAUDITED) | | | | BLACKROCK® |
BlackRock FundsSM
„ BlackRock Commodity Strategies Fund
„ BlackRock Global Long/Short Credit Fund
| | |
| Not FDIC Insured ¡ May Lose Value ¡ No Bank Guarantee | | |
| | | | | | |
| 2 | | BLACKROCK FUNDS | | JANUARY 31, 2014 | | |
Dear Shareholder
One year ago, US financial markets were improving despite a sluggish global economy, as loose monetary policy beckoned investors to take on more risk in their portfolios. Slow but positive growth in the US was sufficient to support corporate earnings, while uncomfortably high unemployment reinforced expectations that the Federal Reserve would continue its aggressive monetary stimulus programs. International markets were not as fruitful in the earlier part of the year given uneven growth rates and more direct exposure to macro risks such as the resurgence of political instability in Italy, the banking crisis in Cyprus and a generally poor outlook for European economies. Additionally, emerging markets significantly lagged the rest of the world due to slowing growth and structural imbalances.
Global financial markets were rattled in May when Fed Chairman Bernanke mentioned the possibility of reducing (or “tapering”) the central bank’s asset purchase programs — comments that were widely misinterpreted as signaling an end to the Fed’s zero-interest-rate policy. US Treasury yields rose sharply, triggering a steep sell-off across fixed income markets. (Bond prices move in the opposite direction of yields.) Equity prices also suffered as investors feared the implications of a potential end of a program that had greatly supported the markets. Markets rebounded in late June, however, when the Fed’s tone turned more dovish, and improving economic indicators and better corporate earnings helped extend gains through most of the summer.
The fall was a surprisingly positive period for most asset classes after the Fed defied market expectations with its decision to delay tapering. Higher volatility returned in late September when the US Treasury Department warned that the national debt would soon breach its statutory maximum. The ensuing political brinksmanship led to a partial government shutdown, roiling global financial markets through the first half of October, but equities and other so-called “risk assets” resumed their rally when politicians engineered a compromise to reopen the government and extend the debt ceiling, at least temporarily.
The remainder of 2013 was generally positive for stock markets in the developed world, although investors continued to grapple with uncertainty about when and how much the Fed would scale back on stimulus. When the long-awaited taper announcement ultimately came in mid-December, the Fed reduced the amount of its monthly asset purchases but at the same time extended its time horizon for maintaining low short-term interest rates. Markets reacted positively, as this move signaled the Fed’s perception of real improvement in the economy and investors were finally relieved from the tenacious anxiety that had gripped them for quite some time.
Investors’ risk appetite diminished in the new year. Heightened volatility in emerging markets and mixed US economic data caused global equities to weaken in January while bond markets found renewed strength. While tighter global liquidity was an ongoing headwind for developing countries, financial troubles in Argentina and Turkey launched a sharp sell-off in a number of emerging market currencies. Unexpectedly poor economic data out of China added to the turmoil. In the US, most indicators continued to signal a strengthening economy; however, stagnant wage growth raised concerns about the sustainability of the overall positive momentum. US stocks underperformed other developed equity markets as a number of disappointing corporate earnings reports prompted investors to take advantage of lower valuations abroad.
While accommodative monetary policy was the main driver behind positive market performance over the period, it was also the primary cause of volatility and uncertainty. Developed market stocks were the strongest performers for the six- and 12-month periods ended January 31. In contrast, emerging markets were weighed down by uneven growth, high debt levels and severe currency weakness. Rising interest rates pressured US Treasury bonds and other high-quality fixed income sectors, including tax-exempt municipals and investment grade corporate bonds. High yield bonds, to the contrary, benefited from income-oriented investors’ search for yield in the low-rate environment. Short-term interest rates remained near zero, keeping yields on money market securities near historical lows.
At BlackRock, we believe investors need to think globally and extend their scope across a broader array of asset classes and be prepared to move freely as market conditions change over time. We encourage you to talk with your financial advisor and visit www.blackrock.com for further insight about investing in today’s world.
Sincerely,

Rob Kapito
President, BlackRock Advisors, LLC

“While accommodative monetary policy was the main driver behind positive market performance over the period, it was also the primary cause of volatility and uncertainty.”
Rob Kapito
President, BlackRock Advisors, LLC
| | | | | | | | |
| Total Returns as of January 31, 2014 | |
| | | 6-month | | | 12-month | |
US large cap equities
(S&P 500® Index) | | | 6.85 | % | | | 21.52 | % |
US small cap equities
(Russell 2000® Index) | | | 8.88 | | | | 27.03 | |
International equities
(MSCI Europe, Australasia,
Far East Index) | | | 7.51 | | | | 11.93 | |
Emerging market equities
(MSCI Emerging Markets
Index) | | | (0.33 | ) | | | (10.17 | ) |
3-month Treasury bill
(BofA Merrill Lynch
3-Month US Treasury
Bill Index) | | | 0.03 | | | | 0.08 | |
US Treasury securities
(BofA Merrill Lynch
10- Year US Treasury
Index) | | | 0.77 | | | | (2.97 | ) |
US investment grade
bonds (Barclays US
Aggregate Bond Index) | | | 1.78 | | | | 0.12 | |
Tax-exempt municipal
bonds (S&P Municipal
Bond Index) | | | 3.13 | | | | (1.10 | ) |
US high yield bonds
(Barclays US Corporate
High Yield 2% Issuer
Capped Index) | | | 4.70 | | | | 6.76 | |
|
| Past performance is no guarantee of future results. Index performance is shown for illustrative purposes only. You cannot invest directly in an index. | |
| | | | | | |
| | | THIS PAGE NOT PART OF YOUR FUND REPORT | | | | 3 |
| | | | |
| Fund Summary as of January 31, 2014 | | | BlackRock Commodity Strategies Fund | |
BlackRock Commodity Strategies Fund’s (the “Fund”) investment objective is to seek total return.
|
| Portfolio Management Commentary |
How did the Fund perform?
| Ÿ | | For the six-month period ended January 31, 2014, the Fund’s Institutional and Investor A Shares outperformed the benchmark, the Dow Jones-UBS Commodity Index Total ReturnSM while the Fund’s Investor C Shares underperformed the benchmark index. |
What factors influenced performance?
| Ÿ | | Stock selection within the buoyant energy sector contributed positively to performance for the period. A number of supply disruptions led to increased uncertainty, which alongside modest demand growth, supported consistently high oil prices. These high prices and a steady recovery in the US economy (the largest consumer of crude oil) generated momentum for energy equities during the period. |
| Ÿ | | The Fund’s holdings in mining equities outperformed as commodity prices traded higher (aluminum was the only base metal to fall during the period) and global demand reached record levels. After having lagged the broader equity market in recent years, the outlook for the mining sector has improved following widespread aggressive cutting of operational costs and reassessing of investment projects. |
| Ÿ | | Positioning within agriculture equities also had a positive impact on returns for the period. The Fund benefited from its overweight in the agribusiness and livestock sub-sectors. These companies performed well as a result of strong harvests which increase demand for storage and transportation from agribusinesses. In addition, lower grain prices should translate into lower input costs for livestock companies, improving their earnings. |
| Ÿ | | Conversely, gold-related equities detracted from performance as precious metals broadly declined during the period. Gold bullion and gold-related equities particularly suffered as the global economy continued to recover and the Fed began tapering its monetary stimulus program. |
| Ÿ | | The Fund’s commodity-linked derivatives strategy underperformed the benchmark index during the period. In late January, extremely cold weather in the US and rapidly declining |
| | | inventories of natural gas caused prices to rally sharply, resulting in the underperformance of the Fund’s positions further out on the futures curve. |
Describe recent portfolio activity.
| Ÿ | | In agricultural equities, the Fund reduced its exposure to fertilizer and agriculture equipment companies. Within precious metals, the Fund reduced exposure to some higher-cost gold holdings, including the sale of Detour Gold Corp., while adding to gold royalty exposure. In energy equities, the Fund rotated exposure toward integrated energy companies. In mining equities, the Fund purchased Trevali Mining Corp. (a zinc-focused mining company) and reduced its underweight to coal stocks. |
| Ÿ | | In the final month of the period, the Dow Jones-UBS Commodity Index Total ReturnSM rebalanced. Accordingly, the futures portion of the Fund (the commodity-linked derivatives strategy), which represents roughly 50% of net assets, rebalanced in line with the index. The commodity-related equity portion of the Fund rebalanced back to its target sector weights: 22.5% in energy, 11.5% in metals and mining, 9.0% in agriculture and 7.0% in precious metals. |
| Ÿ | | Also during the period, the Fund maintained a position in cash and cash equivalents, predominantly comprised of US Treasury bills, as collateral against the Fund’s exposure to commodity-linked notes. The Fund’s cash balance did not have a material impact on performance. |
Describe portfolio positioning at period end.
| • | | The Fund ended the period with approximately 50% of net assets allocated to the commodity-related equity strategy and 50% allocated to the commodity-linked derivatives strategy (including collateral held against the commodity-linked note exposure). Aggregating both strategies, the Fund was overweight relative to the benchmark index in energy and industrial metals and underweight in agriculture and precious metals. |
The views expressed reflect the opinions of BlackRock as of the date of this report and are subject to change based on changes in market, economic or other conditions. These views are not intended to be a forecast of future events and are no guarantee of future results.
| | |
| Ten Largest Holdings | | Percent of
Long-Term
Investments |
| | | | |
International Bank for Reconstruction & Development
3-month LIBOR, 8/15/14-CLN | | | 6 | % |
Canadian Imperial Bank of Commerce 3-month LIBOR,
2/27/15-CLN | | | 5 | |
Royal Dutch Shell PLC, B Shares | | | 4 | |
JPMorgan Chase Bank, N.A. 3-month LIBOR,
8/08/14-CLN | | | 4 | |
UBS AG 3-month LIBOR, 8/01/14-CLN | | | 4 | |
Exxon Mobil Corp. | | | 4 | |
Chevron Corp. | | | 4 | |
BP PLC | | | 2 | |
ConocoPhillips | | | 2 | |
BHP Billiton PLC | | | 2 | |
| | |
| Portfolio Composition | | Percent of
Long-Term
Investments |
| | | | |
Common Stocks | | | 74 | % |
Commodity-Linked Notes | | | 26 | |
| | | | | | |
| 4 | | BLACKROCK FUNDS | | JANUARY 31, 2014 | | |
| | | | |
| | | | BlackRock Commodity Strategies Fund | |
|
| Total Return Based on a $10,000 Investment |
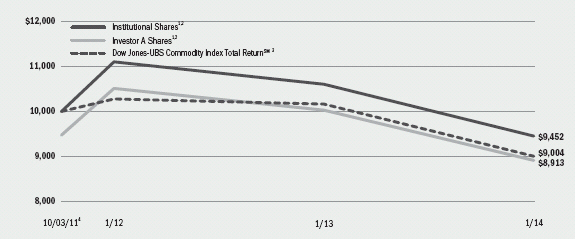
| | 1 | Assuming maximum sales charges, if any, transaction costs and other operating expenses, including investment advisory fees and administration fees, if any. Institutional Shares do not have a sales charge. |
| | 2 | The Fund utilizes two strategies and under normal circumstances expects to invest approximately 50% of its total assets in each strategy; provided, however, that from time to time, Fund management may alter the weightings if it deems it prudent to do so based on market conditions, trends or movements or other similar factors. |
| | 3 | An unmanaged commodity index currently composed of futures contracts on 20 physical commodities, and assumes that the futures positions are fully collateralized. |
| | 4 | Commencement of operations. |
| | | | | | | | | | | | | | | | | | | | |
| Performance Summary for the Period Ended January 31, 2014 | |
| | | | | | Average Annual Total Returns5 | |
| | | | | | 1 Year | | | Since Inception6 | |
| | | 6-Month
Total Returns | | | w/o sales
charge | | | w/ sales
charge | | | w/o sales
charge | | | w/ sales
charge | |
Institutional | | | 0.33 | % | | | (10.85 | )% | | | N/A | | | | (2.39 | )% | | | N/A | |
Investor A | | | 0.11 | | | | (11.07 | ) | | | (15.74 | )% | | | (2.59 | ) | | | (4.82 | )% |
Investor C | | | (0.22 | ) | | | (11.77 | ) | | | (12.65 | ) | | | (3.36 | ) | | | (3.36 | ) |
Dow Jones-UBS Commodity Index Total ReturnSM | | | 0.00 | | | | (11.38 | ) | | | N/A | | | | (4.41 | ) | | | N/A | |
| | 5 | Assuming maximum sales charges, if any. Average annual total returns with and without sales charges reflect reductions for distribution and service fees. See “About Fund Performance” on page 8 for a detailed description of share classes, including any related sales charges and fees. |
| | 6 | The Fund commenced operations on October 3, 2011. |
| | | N/A—Not applicable as share class and index do not have a sales charge. |
| | | Past performance is not indicative of future results. |
| | | | | | | | | | | | | | |
| Expense Example |
| | | Actual | | Hypothetical8 | | |
| | | Beginning Account Value August 1, 2013 | | Ending Account Value January 31, 2014 | | Expenses Paid During the Period7 | | Beginning Account Value August 1, 2013 | | Ending Account Value January 31, 2014 | | Expenses Paid During the Period7 | | Annualized Expense Ratio |
Institutional | | $1,000.00 | | $1,003.30 | | $6.51 | | $1,000.00 | | $1,018.70 | | $6.56 | | 1.29% |
Investor A | | $1,000.00 | | $1,001.10 | | $7.57 | | $1,000.00 | | $1,017.64 | | $7.63 | | 1.50% |
Investor C | | $1,000.00 | | $997.80 | | $11.33 | | $1,000.00 | | $1,013.86 | | $11.42 | | 2.25% |
| | 7 | For each class of the Fund, expenses are equal to the annualized expense ratio for the class, multiplied by the average account value over the period, multiplied by 184/365 (to reflect the one-half year period shown). The fees and expenses of the underlying funds in which the Fund invests are not included in the Fund’s annualized expense ratio. |
| | 8 | Hypothetical 5% annual return before expenses is calculated by pro rating the number of days in the most recent fiscal half year divided by 365. |
| | | See “Disclosure of Expenses” on page 8 for further information on how expenses were calculated. |
| | | | | | |
| | | BLACKROCK FUNDS | | JANUARY 31, 2014 | | 5 |
| | | | |
| Fund Summary as of January 31, 2014 | | | BlackRock Global Long/Short Credit Fund | |
BlackRock Global Long/Short Credit Fund’s (the “Fund”) investment objective is to seek absolute total returns over a complete market cycle.
|
| Portfolio Management Commentary |
How did the Fund perform?
| Ÿ | | For the six-month period ended January 31, 2014, the Fund outperformed its benchmark, the BofA Merrill Lynch 3-Month US Treasury Bill Index. |
What factors influenced performance?
| Ÿ | | The Fund’s net long position in credit (i.e., total long positions minus total short positions) drove positive results as risk assets rallied for the majority of the period despite elevated volatility at times. The summer months, which typically exhibit less liquidity in fixed income markets, gave way to a robust fourth quarter, and while the beginning of 2014 was rocky for risk assets, the Fund performed in line with expectations. The strongest performance in the Fund came from positioning in European financials across the capital structure – from covered bonds to subordinated debt – as the sector benefited from a number of catalysts. A long/short trade in covered bonds and senior unsecured debt of Spanish banks was also positive. Long positions in European and US high yield issuers performed well, with security selection of particular importance given the low level of yields and spreads in the market. |
| Ÿ | | Also contributing positively were trading strategies in UK pub (bar/ tavern) issuers and Italian telecommunications issuers, as well as US communications and consumer-driven issuers. Aviation-related trading added to returns as the Fund was well-positioned for the merger of American Airlines and US Airways in the fourth quarter of 2013. In investment grade credit, exposure to industrial issuers added to returns, especially from securities purchased in the new-issue market. Exposure to longer-dated debt of US communications company Verizon Communications, Inc. generated strong outperformance for the period. Long/short trading in US credits contributed positively to Fund returns, with particularly strong results from a relative value trade between US and European financials. |
| Ÿ | | As credit sectors broadly rallied during the period, the Fund’s hedges against its long European credit positions had a negative impact on performance. Equity index put options and index short positions also detracted from returns. Additionally, short positions in select European sovereigns weighed on results. |
| Ÿ | | As part of its investment strategy, the Fund uses derivatives to hedge against duration (sensitivity to interest rate movements) and currency risk. The Fund may also employ credit derivatives in order to express a positive or negative view on a particular issuer or sector, or to hedge or manage overall credit risk. During the period, the Fund’s derivative holdings had a net negative impact on performance. |
Describe recent portfolio activity.
| Ÿ | | During the six-month period, the Fund tactically increased and decreased risk in response to market conditions. The Fund took advantage of a robust new-issue market in investment grade and high yield corporate credit. The Fund also purchased convertible bonds where attractive entry points were presented. The Fund added exposure to bank loans, both leveraged loans and collateralized loan obligations, seeking higher quality issues in terms of loan structure, credit quality, liquidity and diversification. In addition, the Fund tactically traded aviation-related debt from foreign and domestic airlines and positioned around a merger between two large US airlines. |
| Ÿ | | In investment grade credit, the Fund traded with light exposure in the US. In Europe, the Fund gradually reduced exposure to areas with limited further upside in non-financial sectors in favor of financials, namely subordinated bank debt, given the potential for outperformance in these assets should the European Central Bank’s comprehensive assessment of the banking system have a positive outcome. Within sovereign debt, the Fund held large short positions at the beginning of the period; however, these positions were reduced toward the end of 2013 following the underperformance of peripheral sovereign bonds. Most recently, following a period of weakness in global risk assets, the Fund took the opportunity to increase risk in Europe by purchasing attractive non-financial investment grade credits and taking a long position on the main European credit index. |
| Ÿ | | The Fund’s cash exposure had no material impact on performance as the Fund can express long and short positions via the credit default swap market, which does not require a cash outlay like that of traditional cash bonds. |
Describe portfolio positioning at period end.
| Ÿ | | As of period end, the Fund maintained an allocation to European bank debt given expectations that the European Central Bank’s comprehensive assessment of the banking system will have a positive outcome. The Fund also maintained allocations to higher-quality high yield bonds and bank loans. The Fund held short positions in sovereign debt as a hedge against local risks in non-US assets. |
| Ÿ | | The Fund ended the period with a net long credit position in Europe at 41% of net assets, 19% in the US and 60% overall given a positive environment for credit sectors. The Fund remained positioned to be nimble and tactical to take advantage of long and short opportunities as they arise. |
The views expressed reflect the opinions of BlackRock as of the date of this report and are subject to change based on changes in market, economic or other conditions. These views are not intended to be a forecast of future events and are no guarantee of future results.
| | | | | | |
| 6 | | BLACKROCK FUNDS | | JANUARY 31, 2014 | | |
| | | | |
| | | | BlackRock Global Long/Short Credit Fund | |
|
| Total Return Based on a $10,000 Investment |
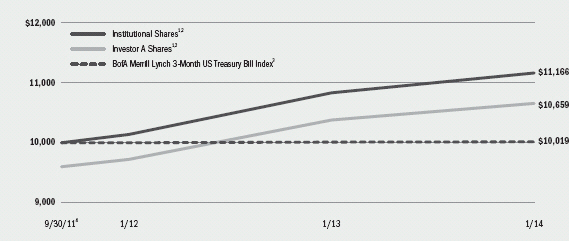
| | 1 | Assuming maximum sales charges, if any, transaction costs and other operating expenses, including investment advisory fees and administration fees, if any. Institutional Shares do not have a sales charge. |
| | 2 | The Fund seeks to provide absolute total returns over a complete market cycle through diversified long and short exposure to the global fixed income markets. |
| | 3 | An unmanaged index that tracks 3-month US Treasury securities. |
| | 4 | Commencement of operations. |
| | | | | | | | | | | | | | | | | | | | | | | | | | | | |
| Performance Summary for the Period Ended January 31, 2014 | |
| | | | | | | | | | | | Average Annual Total Returns5 | |
| | | | | | | | | | | | 1 Year | | | Since Inception6 | |
| | | Standardized 30-Day Yield | | | Unsubsidized 30-Day Yield | | | 6-Month Total Returns | | | w/o sales charge | | | w/ sales
charge | | | w/o sales charge | | | w/ sales charge | |
Institutional | | | 1.64 | % | | | 1.62 | % | | | 2.26 | % | | | 3.06 | % | | | N/A | | | | 4.83 | % | | | N/A | |
Investor A | | | 1.29 | | | | 1.27 | | | | 2.12 | | | | 2.71 | | | | (1.40 | )% | | | 4.58 | | | | 2.77 | % |
Investor C | | | 0.63 | | | | 0.60 | | | | 1.75 | | | | 1.98 | | | | 0.98 | | | | 3.83 | | | | 3.83 | |
BofA Merrill Lynch 3-Month US Treasury Bill Index | | | — | | | | — | | | | 0.03 | | | | 0.08 | | | | N/A | | | | 0.08 | | | | N/A | |
| | 5 | Assuming maximum sales charges, if any. Average annual total returns with and without sales charges reflect reductions for distribution and service fees. See “About Fund Performance” on page 8 for a detailed description of share classes, including any related sales charges and fees. |
| | 6 | The Fund commenced operations on September 30, 2011. |
| | | N/A—Not applicable as share class and index do not have a sales charge. |
| | | Past performance is not indicative of future results. |
| | | | | | | | | | | | | | | | | | | | | | | | | | | | | | | | | | | | |
| Expense Example | |
| | | Actual | | | Hypothetical9 | |
| | | | | | | | | Including
Interest Expense | | | Excluding
Interest Expense | | | | | | Including
Interest Expense | | | Excluding
Interest Expense | |
| | | Beginning Account Value August 1, 2013 | | | Ending Account Value January 31, 2014 | | | Expenses Paid During the Period7 | | | Expenses Paid During the Period8 | | | Beginning
Account Value August 1, 2013 | | | Ending Account Value January 31, 2014 | | | Expenses Paid During the Period7 | | | Ending Account Value January 31, 2014 | | | Expenses Paid During the Period8 | |
Institutional | | | $1,000.00 | | | | $1,022.60 | | | | $7.49 | | | | 5.15 | | | | $1,000.00 | | | | $1,017.80 | | | | $7.48 | | | | $1,020.11 | | | | $5.14 | |
Investor A | | | $1,000.00 | | | | $1,021.20 | | | | $8.92 | | | | 6.57 | | | | $1,000.00 | | | | $1,016.38 | | | | $8.89 | | | | $1,018.70 | | | | $6.56 | |
Investor C | | | $1,000.00 | | | | $1,017.50 | | | | $12.56 | | | | 10.22 | | | | $1,000.00 | | | | $1,012.75 | | | | $12.53 | | | | $1,015.07 | | | | $10.21 | |
| | 7 | For each class of the Fund, expenses are equal to the annualized expense ratio for the class (1.47% for Institutional, 1.75% for Investor A and 2.47% for Investor C), multiplied by the average account value over the period, multiplied by 184/365 (to reflect the one-half year period shown). The fees and expenses of the underlying funds in which the Fund invests are not included in the Fund’s annualized expense ratio. |
| | 8 | For each class of the Fund, expenses are equal to the annualized expense ratio for the class (1.01% for Institutional, 1.29% for Investor A and 2.01% for Investor C), multiplied by the average account value over the period, multiplied by 184/365 (to reflect the one-half year period shown). The fees and expenses of the underlying funds in which the Fund invests are not included in the Fund’s annualized expense ratio. |
| | 9 | Hypothetical 5% annual return before expenses is calculated by pro rating the number of days in the most recent fiscal half year divided by 365. |
| | | See “Disclosure of Expenses” on page 8 for further information on how expenses were calculated. |
| | | | | | |
| | | BLACKROCK FUNDS | | JANUARY 31, 2014 | | 7 |
| Ÿ | | Institutional Shares are not subject to any sales charge. These shares bear no ongoing distribution or service fees and are available only to certain eligible investors. |
| Ÿ | | Investor A Shares are subject to a maximum initial sales charge (front-end load) of 5.25% for BlackRock Commodity Strategies Fund and 4.00% for BlackRock Global Long/Short Credit Fund. These shares are subject to a service fee of 0.25% per year (but no distribution fee). Certain redemptions of these shares may be subject to a contingent deferred sales charge (“CDSC”) where no initial sales charge was paid at the time of purchase. |
| Ÿ | | Investor C Shares are subject to a 1.00% CDSC if redeemed within one year of purchase. In addition, these shares are subject to a distribution fee of 0.75% per year and a service fee of 0.25% per year. |
Performance information reflects past performance and does not guarantee future results. Current performance may be lower or higher than the performance data quoted. Refer to www.blackrock.com/funds to obtain performance data current to the most recent month end. Performance results do not reflect the deduction of taxes that a shareholder would pay on Fund distributions or the redemption of Fund shares. Figures
shown in each of the performance tables on the previous pages assume reinvestment of all dividends and distributions, if any, at net asset value (“NAV”) on the ex-dividend/payable dates. Investment return and principal value of shares will fluctuate so that shares, when redeemed, may be worth more or less than their original cost. Dividends paid to each class of shares will vary because of the different levels of service, distribution and transfer agency fees applicable to each class, which are deducted from the income available to be paid to shareholders.
BlackRock Advisors, LLC (the “Manager”), the Funds’ investment advisor, waived and/or reimbursed a portion of each Fund’s expenses. Without such waiver and/or reimbursement, each Fund’s performance would have been lower. The Manager is under no obligation to waive or reimburse or to continue waiving or reimbursing its fees after the applicable termination date. See Note 5 of the Notes to Financial Statements for additional information on waivers and reimbursements. The standardized 30-day yield includes the effects of any waivers and/or reimbursements. The unsubsidized 30-day yield excludes the effects of any waiver and/or reimbursements.
Shareholders of the Funds may incur the following charges: (a) transactional expenses, such as sales charges; and (b) operating expenses, including investment advisory fees, administration fees, service and distribution fees, including 12b-1 fees, acquired fund fees and expenses and other Fund expenses. The expense examples on the previous pages (which are based on a hypothetical investment of $1,000 invested on August 1, 2013 and held through January 31, 2014) are intended to assist shareholders both in calculating expenses based on an investment in each Fund and in comparing these expenses with similar costs of investing in other mutual funds.
The expense examples provide information about actual account values and actual expenses. In order to estimate the expenses a shareholder paid during the period covered by this report, shareholders can divide their account value by $1,000 and then multiply the result by the number corresponding to their Fund and share class under the headings entitled “Expenses Paid During the Period.”
The expense examples also provide information about hypothetical account values and hypothetical expenses based on a Fund’s actual expense ratio and an assumed rate of return of 5% per year before expenses. In order to assist shareholders in comparing the ongoing expenses of investing in these Funds and other funds, compare the 5% hypothetical examples with the 5% hypothetical examples that appear in other funds’ shareholder reports.
The expenses shown in the expense examples are intended to highlight shareholders’ ongoing costs only and do not reflect any transactional expenses, such as sales charges, if any. Therefore, the hypothetical examples are useful in comparing ongoing expenses only, and will not help shareholders determine the relative total expenses of owning different funds. If these transactional expenses were included, shareholder expenses would have been higher.
| | | | | | |
| 8 | | BLACKROCK FUNDS | | JANUARY 31, 2014 | | |
| | |
| Derivative Financial Instruments | | |
The Funds may invest in various derivative financial instruments, including financial futures contracts, foreign currency exchange contracts, options and swaps, as specified in Note 4 of the Notes to Financial Statements, which may constitute forms of economic leverage. Such derivative financial instruments are used to obtain exposure to a security, index and/or market without owning or taking physical custody of securities or to hedge market, equity, credit, interest rate and/or foreign currency exchange rate risks. Derivative financial instruments involve risks, including the imperfect correlation between the value of a derivative financial instrument and the underlying asset, possible default of the counterparty to the transaction or illiquidity of the derivative financial
instrument. The Funds’ ability to use a derivative financial instrument successfully depends on the investment advisor’s ability to predict pertinent market movements accurately, which cannot be assured. The use of derivative financial instruments may result in losses greater than if they had not been used, may require a Fund to sell or purchase portfolio investments at inopportune times or for distressed values, may limit the amount of appreciation a Fund can realize on an investment, may result in lower dividends paid to shareholders and/or may cause a Fund to hold an investment that it might otherwise sell. The Funds’ investments in these instruments are discussed in detail in the Notes to Financial Statements.
|
| BlackRock Global Long/Short Credit Fund’s Portfolio Information |
| | | | | | | | | | | | | | | |
| | | Percent of Total Investments1 |
| Geographic Allocation | | Long | | Short | | Total |
United States | | | | 27 | % | | | | 15 | % | | | | 42 | % |
United Kingdom | | | | 8 | | | | | — | | | | | 8 | |
Italy | | | | 8 | | | | | 2 | | | | | 10 | |
Netherlands | | | | 7 | | | | | — | | | | | 7 | |
Spain | | | | 7 | | | | | 3 | | | | | 10 | |
Cayman Islands | | | | 4 | | | | | — | | | | | 4 | |
Luxembourg | | | | 3 | | | | | — | | | | | 3 | |
France | | | | 3 | | | | | — | | | | | 3 | |
Ireland | | | | 2 | | | | | — | | | | | 2 | |
Germany | | | | 2 | | | | | — | | | | | 2 | |
Denmark | | | | 2 | | | | | — | | | | | 2 | |
Other2 | | | | 7 | | | | | — | | | | | 7 | |
| Total | | 80% | | 20% | | 100% |
| 1 | Total investments include the gross market values of long and short positions and exclude short-term securities. |
| 2 | Includes holdings within countries that are 1% or less of long-term investments. Please refer to the Schedule of Investments for such countries. |
| | | | | |
| Credit Quality Allocation3 | | Percent of Long-Term Investments |
AAA/Aaa4 | | | | 2 | % |
AA/Aa | | | | 2 | |
A | | | | 11 | |
BBB/Baa | | | | 34 | |
BB/Ba | | | | 21 | |
B | | | | 14 | |
CCC/Caa | | | | 3 | |
Not Rated | | | | 13 | |
| 3 | Using the higher of Standard & Poor’s (“S&P’s”) or Moody’s Investors Service (“Moody’s”) ratings |
| 4 | Includes US Treasury Obligations that are deemed AAA/Aaa by the investment advisor. |
| | | | | | |
| | | BLACKROCK FUNDS | | JANUARY 31, 2014 | | 9 |
| | | | |
| Consolidated Schedule of Investments January 31, 2014 (Unaudited) | | | BlackRock Commodity Strategies Fund | |
| | | (Percentages shown are based on Net Assets | |
| | | | | | | | | | | | |
| Commodity-Linked Notes | | | | | Par
(000) | | | Value | |
Canadian Imperial Bank of Commerce 3-month LIBOR (Indexed to the Dow Jones-UBS Commodity Index Total ReturnSM , multiplied by 3), 2/27/15 | | | USD | | | | 13,000 | | | $ | 13,000,000 | |
International Bank for Reconstruction & Development 3-month LIBOR (Indexed to the Dow Jones-UBS Commodity Index 4 Month Forward Total ReturnSM , multiplied by 3), 8/15/14 | | | | | | | 14,000 | | | | 13,967,667 | |
JPMorgan Chase Bank, N.A. 3-month LIBOR (Indexed to the Dow Jones-UBS Commodity Index 4 Month Forward Total ReturnSM ,multiplied by 3), 3/10/14 | | | | | | | 5,000 | | | | 3,247,500 | |
JPMorgan Chase Bank, N.A. 3-month LIBOR (Indexed to the Dow Jones-UBS Commodity Index Total ReturnSM , multiplied by 3), 2/06/14 | | | | | | | 5,000 | | | | 5,000,000 | |
JPMorgan Chase Bank, N.A. 3-month LIBOR (Indexed to the Dow Jones-UBS Commodity Index Total ReturnSM , multiplied by 3), 8/08/14 | | | | | | | 10,500 | | | | 10,692,150 | |
Swedish Export Credit Corp. 3-month LIBOR (Indexed to the Dow Jones-UBS Commodity Index 4 Month Forward Total ReturnSM ,multiplied by 3), 5/29/14 | | | | | | | 6,000 | | | | 5,130,924 | |
UBS AG 3-month LIBOR (Indexed to the Dow Jones-UBS Commodity Index Total ReturnSM ,multiplied by 3), 1/05/15 | | | | | | | 5,000 | | | | 5,125,270 | |
UBS AG 3-month LIBOR (Indexed to the Dow Jones-UBS Commodity Index Total ReturnSM ,multiplied by 3), 8/01/14 | | | | | | | 10,000 | | | | 10,150,945 | |
Total Commodity-Linked Notes — 16.2% | | | | | | | | | | | 66,314,456 | |
| | | | | | | | | | | | |
| Common Stocks | | | | | Shares | | | | |
Biotechnology — 0.2% | | | | | | | | | | | | |
Genus PLC | | | | | | | 28,650 | | | | 617,487 | |
Chemicals — 2.7% | | | | | | | | | | | | |
Agrinos AS (a) | | | | | | | 70,000 | | | | 71,367 | |
Agrium, Inc. | | | | | | | 10,000 | | | | 871,000 | |
American Vanguard Corp. | | | | | | | 4,300 | | | | 99,932 | |
CF Industries Holdings, Inc. | | | | | | | 1,000 | | | | 230,860 | |
Johnson Matthey PLC | | | | | | | 7,605 | | | | 403,116 | |
Monsanto Co. | | | | | | | 25,000 | | | | 2,663,750 | |
The Mosaic Co. | | | | | | | 43,500 | | | | 1,942,710 | |
Potash Corp. of Saskatchewan, Inc. | | | | | | | 47,000 | | | | 1,472,040 | |
Syngenta AG, Registered Shares | | | | | | | 5,300 | | | | 1,873,720 | |
Umicore | | | | | | | 3,000 | | | | 128,279 | |
Uralkali OJSC — GDR, Registered Shares | | | | | | | 44,000 | | | | 1,068,804 | |
Yara International ASA | | | | | | | 5,000 | | | | 206,488 | |
| | | | | | | | | | | | |
| | | | | | | | | | | | 11,032,066 | |
| | | | | | | | |
| Common Stocks | | Shares | | | Value | |
Energy Equipment & Services — 1.8% | | | | | | | | |
Cameron International Corp. (a) | | | 23,250 | | | $ | 1,394,303 | |
Halliburton Co. | | | 39,000 | | | | 1,911,390 | |
Schlumberger Ltd. | | | 45,308 | | | | 3,967,622 | |
| | | | | | | | |
| | | | | | | | 7,273,315 | |
Food & Staples Retailing — 0.3% | | | | | | | | |
The Andersons, Inc. | | | 9,000 | | | | 744,660 | |
Total Produce PLC | | | 380,000 | | | | 456,133 | |
| | | | | | | | |
| | | | | | | | 1,200,793 | |
Food Products — 4.6% | | | | | | | | |
Adecoagro SA (a) | | | 63,750 | | | | 478,763 | |
Archer-Daniels-Midland Co. | | | 75,500 | | | | 2,980,740 | |
BRF-Brasil Foods SA — ADR | | | 130,000 | | | | 2,298,400 | |
Bunge Ltd. | | | 34,000 | | | | 2,575,840 | |
China Agri-Industries Holdings Ltd. | | | 709,800 | | | | 315,349 | |
Darling International, Inc. (a)(b) | | | 20,000 | | | | 391,200 | |
Devro PLC | | | 20,000 | | | | 101,790 | |
First Resources Ltd. | | | 435,000 | | | | 678,690 | |
Glanbia PLC | | | 50,000 | | | | 726,954 | |
GrainCorp Ltd., Class A | | | 35,764 | | | | 237,624 | |
Hormel Foods Corp. | | | 5,000 | | | | 227,200 | |
Ingredion, Inc. | | | 15,000 | | | | 934,500 | |
Kernel Holding SA (a) | | | 8,000 | | | | 96,448 | |
New Britain Palm Oil Ltd. | | | 30,200 | | | | 167,554 | |
Origin Enterprises PLC (a) | | | 63,424 | | | | 577,398 | |
Pilgrim’s Pride Corp. | | | 25,500 | | | | 426,615 | |
SunOpta, Inc. (a) | | | 65,000 | | | | 607,750 | |
Tate & Lyle PLC | | | 17,000 | | | | 211,423 | |
Tyson Foods, Inc., Class A | | | 84,000 | | | | 3,141,600 | |
Wilmar International Ltd. | | | 664,000 | | | | 1,621,409 | |
| | | | | | | | |
| | | | | | | | 18,797,247 | |
Machinery — 0.7% | | | | | | | | |
AGCO Corp. | | | 6,000 | | | | 319,979 | |
Deere & Co. | | | 9,000 | | | | 773,640 | |
Kubota Corp. | | | 115,000 | | | | 1,769,997 | |
| | | | | | | | |
| | | | | | | | 2,863,616 | |
Metals & Mining — 14.3% | | | | | | | | |
African Rainbow Minerals Ltd. | | | 51,190 | | | | 1,011,749 | |
Agnico-Eagle Mines Ltd. | | | 24,200 | | | | 753,106 | |
Alamos Gold, Inc. | | | 66,180 | | | | 607,281 | |
Anglo American PLC | | | 47,766 | | | | 1,126,274 | |
AngloGold Ashanti Ltd. | | | 67,465 | | | | 982,532 | |
Antofagasta PLC | | | 60,000 | | | | 834,199 | |
B2Gold Corp. (a)(b) | | | 84,644 | | | | 199,878 | |
Barrick Gold Corp. | | | 69,726 | | | | 1,343,497 | |
Beadell Resources Ltd. (a) | | | 622,037 | | | | 383,010 | |
BHP Billiton PLC | | | 187,212 | | | | 5,511,258 | |
Eldorado Gold Corp. | | | 203,926 | | | | 1,296,338 | |
First Quantum Minerals Ltd. | | | 123,825 | | | | 2,215,786 | |
| | | | |
| Portfolio Abbreviations | | | | |
| To simplify the listings of portfolio holdings in the Schedules of Investments, the names and descriptions of many of the securities have been abbreviated according to the following list: | | ADR American Depositary Receipts AKA Also Known As AUD Australian Dollar CHF Swiss Franc CLO Collateralized Loan Obligation ETF Exchange Traded Fund EUR Euro EURIBOR Euro Interbank Offered Rate FKA Formerly Known As | | GBP British Pound GDR Global Depositary Receipts LIBOR London Interbank Offered Rate PIK Payment-in-kind REIT Real Estate Investment Trust SEK Swedish Krona USD US Dollar ZAK South African Rand |
See Notes to Financial Statements.
| | | | | | |
| 10 | | BLACKROCK FUNDS | | JANUARY 31, 2014 | | |
| | | | |
| Consolidated Schedule of Investments (continued) | | | BlackRock Commodity Strategies Fund | |
| | | (Percentages shown are based on Net Assets) | |
| | | | | | | | |
| Common Stocks | | Shares | | | Value | |
Metals & Mining (concluded) | | | | | | | | |
Fortescue Metals Group Ltd. | | | 430,604 | | | $ | 1,997,338 | |
Franco-Nevada Corp. | | | 34,864 | | | | 1,691,941 | |
Freeport-McMoRan Copper & Gold, Inc. | | | 65,302 | | | | 2,116,438 | |
Fresnillo PLC | | | 119,444 | | | | 1,491,769 | |
Glencore Xstrata PLC | | | 689,692 | | | | 3,636,379 | |
Goldcorp, Inc. | | | 147,986 | | | | 3,692,508 | |
Harmony Gold Mining Co. Ltd. | | | 70,024 | | | | 200,163 | |
IAMGOLD Corp. | | | 32,939 | | | | 120,961 | |
Iluka Resources Ltd. | | | 72,866 | | | | 556,277 | |
Industrias Penoles SAB de CV | | | 23,258 | | | | 541,104 | |
Kenmare Resources PLC (a) | | | 831,782 | | | | 239,289 | |
Kinross Gold Corp. | | | 69,062 | | | | 316,864 | |
Kumba Iron Ore Ltd. | | | 6,425 | | | | 261,147 | |
London Mining PLC (a) | | | 116,978 | | | | 179,590 | |
Lonmin PLC | | | 100,000 | | | | 502,395 | |
Lundin Mining Corp. (a) | | | 375,000 | | | | 1,639,731 | |
MAG Silver Corp. (a) | | | 20,000 | | | | 122,828 | |
Mineral Deposits Ltd. (a) | | | 119,541 | | | | 233,295 | |
Nevsun Resources Ltd. | | | 248,000 | | | | 910,725 | |
New Gold, Inc. (a) | | | 134,059 | | | | 769,147 | |
Newcrest Mining Ltd. | | | 56,619 | | | | 467,005 | |
Newmont Mining Corp. | | | 12,000 | | | | 259,200 | |
Petra Diamonds Ltd. (a) | | | 55,000 | | | | 124,683 | |
Platinum Group Metals Ltd. (a)(b) | | | 250,000 | | | | 294,052 | |
Polymetal International PLC | | | 29,854 | | | | 280,940 | |
Polyus Gold International Ltd. | | | 119,567 | | | | 364,951 | |
Randgold Resources Ltd. — ADR | | | 39,485 | | | | 2,720,517 | |
Rio Tinto PLC | | | 65,371 | | | | 3,476,979 | |
Romarco Minerals, Inc. (a) | | | 281,341 | | | | 133,882 | |
Royal Gold, Inc. | | | 15,013 | | | | 839,827 | |
Silver Wheaton Corp. | | | 58,281 | | | | 1,265,829 | |
Sirius Resources NL | | | 128,340 | | | | 244,876 | |
Sociedad Minera Cerro Verde SAA | | | 25,787 | | | | 569,893 | |
Southern Copper Corp. | | | 46,000 | | | | 1,287,080 | |
Tahoe Resources, Inc. (a) | | | 33,004 | | | | 586,145 | |
Teck Resources Ltd., Class B | | | 77,307 | | | | 1,860,227 | |
Trevali Mining Corp. (a) | | | 800,000 | | | | 739,843 | |
Vale SA — ADR, Preference Shares | | | 236,053 | | | | 2,898,731 | |
Vedanta Resources PLC | | | 60,132 | | | | 794,883 | |
Volcan Cia Minera SAA, Class B | | | 684,861 | | | | 276,564 | |
Western Areas Ltd. | | | 143,917 | | | | 333,898 | |
Yamana Gold, Inc. | | | 114,285 | | | | 1,070,251 | |
Zhaojin Mining Industry Co. Ltd., H Shares (b) | | | 147,500 | | | | 86,066 | |
| | | | | | | | |
| | | | | | | | 58,461,119 | |
Oil, Gas & Consumable Fuels — 20.8% | | | | | | | | |
Anadarko Petroleum Corp. | | | 50,613 | | | | 4,083,963 | |
BG Group PLC | | | 190,400 | | | | 3,200,231 | |
BP PLC | | | 758,300 | | | | 5,942,841 | |
Cairn Energy PLC (a) | | | 252,900 | | | | 896,859 | |
Cameco Corp. | | | 34,458 | | | | 732,319 | |
Caracal Energy, Inc. (a) | | | 159,916 | | | | 1,147,496 | |
Chevron Corp. | | | 80,750 | | | | 9,014,123 | |
China Shenhua Energy Co. Ltd., H Shares | | | 345,000 | | | | 885,525 | |
Cimarex Energy Co. | | | 14,000 | | | | 1,371,720 | |
ConocoPhillips | | | 87,750 | | | | 5,699,363 | |
CONSOL Energy, Inc. | | | 43,828 | | | | 1,636,976 | |
Cosan Ltd., Class A | | | 17,300 | | | | 199,988 | |
Devon Energy Corp. | | | 31,300 | | | | 1,853,586 | |
Enbridge, Inc. | | | 26,800 | | | | 1,125,179 | |
ENI SpA | | | 79,716 | | | | 1,810,255 | |
EOG Resources, Inc. | | | 19,500 | | | | 3,222,180 | |
EQT Corp. | | | 18,600 | | | | 1,726,266 | |
Exxon Mobil Corp. | | | 100,232 | | | | 9,237,381 | |
Imperial Oil Ltd. | | | 22,000 | | | | 899,753 | |
Kosmos Energy Ltd. | | | 86,121 | | | | 890,491 | |
| | | | | | | | |
| Common Stocks | | Shares | | | Value | |
Oil, Gas & Consumable Fuels (concluded) | | | | | | | | |
Noble Energy, Inc. | | | 62,100 | | | $ | 3,870,693 | |
Oil Search Ltd. | | | 254,150 | | | | 1,785,582 | |
Phillips 66 | | | 24,769 | | | | 1,810,366 | |
Range Resources Corp. | | | 33,650 | | | | 2,900,293 | |
Royal Dutch Shell PLC, B Shares | | | 310,600 | | | | 11,360,865 | |
Scorpio Tankers, Inc. | | | 300 | | | | 3,000 | |
Statoil ASA | | | 117,500 | | | | 2,784,829 | |
Suncor Energy, Inc. | | | 59,300 | | | | 1,948,181 | |
TransCanada Corp. | | | 66,700 | | | | 2,899,766 | |
| | | | | | | | |
| | | | | | | | 84,940,070 | |
Paper & Forest Products — 0.2% | | | | | | | | |
Canfor Corp. | | | 21,000 | | | | 480,619 | |
Louisiana-Pacific Corp. | | | 27,000 | | | | 473,310 | |
| | | | | | | | |
| | | | | | | | 953,929 | |
Real Estate Investment Trusts (REITs) — 0.2% | | | | | |
Weyerhaeuser Co. | | | 31,000 | | | | 926,280 | |
Total Common Stocks — 45.8% | | | | | | | 187,065,922 | |
Total Long-Term Investments (Cost — $262,658,657) — 62.0% | | | | | | | 253,380,378 | |
| | | | | | | | |
| | | Shares /
Beneficial
Interest (000) | | | | |
| Short-Term Securities | | | | | | |
Money Market Funds — 4.0% | | | | | |
BlackRock Liquidity Funds, TempFund, Institutional Class, 0.03% (c)(d) | | | 15,606,778 | | | | 15,606,778 | |
BlackRock Liquidity Series, LLC, Money Market Series, 0.14% (c)(d)(e) | | $ | 720,425 | | | | 720,425 | |
| | | | | | | | |
| | | | | | | | 16,327,203 | |
| | | | | | | | |
| | |
| | | Par (000) | | | | |
U.S. Treasury Bills — 33.3% | | | | | | | | |
0.01%, 2/06/14 (f) | | | 101,000 | | | | 100,999,830 | |
0.09%, 5/15/14 (f) | | | 7,000 | | | | 6,999,363 | |
0.09%, 6/05/14 (f) | | | 10,000 | | | | 9,998,810 | |
0.08%, 6/12/14 (f) | | | 18,000 | | | | 17,994,652 | |
| | | | | | | | |
| | | | | | | | 135,992,655 | |
Total Short-Term Securities (Cost — $152,316,928) — 37.3% | | | | | | | 152,319,858 | |
Total Investments (Cost — $414,975,585) — 99.3% | | | | 405,700,236 | |
Other Assets Less Liabilities — 0.7% | | | | 2,814,184 | |
| | | | | | | | |
Net Assets — 100.0% | | | $ | 408,514,420 | |
| | | | | | | | |
See Notes to Financial Statements.
| | | | | | |
| | | BLACKROCK FUNDS | | JANUARY 31, 2014 | | 11 |
| | | | |
| Consolidated Schedule of Investments (continued) | | | BlackRock Commodity Strategies Fund | |
|
| Notes to Consolidated Schedule of Investments |
| (a) | Non-income producing security. |
| (b) | Security, or a portion of security, is on loan. |
| (c) | Investments in issuers considered to be an affiliate of the Fund during the six months ended January 31, 2014, for purposes of Section 2(a)(3) of the Investment Company Act of 1940, as amended, were as follows: |
| | | | | | | | | | | | | | | | | | | | |
| Affiliate | | Shares/Beneficial
Interest Held at
July 31, 2013 | | | Net Activity | | | Shares/Beneficial
Interest Held at
January 31, 2014 | | | Value at
January 31, 2014 | | | Income | |
BlackRock Liquidity Funds, TempFund, Institutional Class | | | 15,958,082 | | | | (351,304 | ) | | | 15,606,778 | | | $ | 15,606,778 | | | $ | 2,783 | |
BlackRock Liquidity Series, LLC Money Market Series | | | — | | | $ | 720,425 | | | $ | 720,425 | | | $ | 720,425 | | | $ | 2,919 | |
| (d) | Represents the current yield as of report date. |
| (e) | Security was purchased with the cash collateral from loaned securities. The Fund may withdraw up to 25% of its investment daily, although the manager of the BlackRock Liquidity Series, LLC, Money Market Series, in its sole discretion, may permit an investor to withdraw more than 25% on any one day. |
| (f) | Rate shown reflects the discount rate at the time of purchase. |
| Ÿ | | For Fund compliance purposes, the Fund’s industry classifications refer to any one or more of the industry sub-classifications used by one or more widely recognized market indexes or ratings group indexes, and/or as defined by the investment advisor. These definitions may not apply for purposes of this report, which may combine such industry sub-classifications for reporting ease. |
| Ÿ | | Foreign currency exchange contracts outstanding as of January 31, 2014 were as follows: |
| | | | | | | | | | | | | | | | | | | | | | |
Currency Purchased | | | Currency
Sold | | | Counterparty | | Settlement
Date | | | Unrealized
Appreciation
(Depreciation) | |
| EUR | | | 91,336 | | | | USD | | | | 124,344 | | | Citibank N.A. | | | 2/03/14 | | | $ | (1,159 | ) |
| EUR | | | 46,809 | | | | USD | | | | 63,726 | | | Citibank N.A. | | | 2/03/14 | | | | (594 | ) |
| USD | | | 249,425 | | | | AUD | | | | 285,038 | | | HSBC Bank PLC | | | 2/03/14 | | | | (26 | ) |
| USD | | | 19,184 | | | | GBP | | | | 11,635 | | | Goldman Sachs International | | | 2/03/14 | | | | 57 | |
| USD | | | 140,452 | | | | GBP | | | | 85,184 | | | Goldman Sachs International | | | 2/03/14 | | | | 417 | |
| USD | | | 14,845 | | | | GBP | | | | 9,013 | | | UBS AG | | | 2/04/14 | | | | — | |
| USD | | | 494,675 | | | | GBP | | | | 300,349 | | | UBS AG | | | 2/04/14 | | | | — | |
| ZAR | | | 2,707,128 | | | | USD | | | | 242,502 | | | Deutsche Bank AG | | | 2/06/14 | | | | 1,131 | |
| Total | | | | | | | | | | | | | | | | | | | | $ | (174 | ) |
| | | | | | | | | | | | | | | | | | | | | | |
| Ÿ | | Fair Value Measurements — Various inputs are used in determining the fair value of investments and derivative financial instruments. These inputs to valuation techniques are categorized into a disclosure hierarchy consisting of three broad levels for financial statement purposes as follows: |
| | Ÿ | | Level 1 — unadjusted price quotations in active markets/exchanges for identical assets or liabilities that the Fund has the ability to access |
| | Ÿ | | Level 2 — other observable inputs (including, but not limited to, quoted prices for similar assets or liabilities in markets that are active, quoted prices for identical or similar assets or liabilities in markets that are not active, inputs other than quoted prices that are observable for the assets or liabilities (such as interest rates, yield curves, volatilities, prepayment speeds, loss severities, credit risks and default rates) or other market–corroborated inputs) |
| | Ÿ | | Level 3 — unobservable inputs based on the best information available in the circumstances, to the extent observable inputs are not available (including the Fund’s own assumptions used in determining the fair value of investments and derivative financial instruments) |
The hierarchy gives the highest priority to unadjusted quoted prices in active markets for identical assets or liabilities (Level 1 measurements) and the lowest priority to unobservable inputs (Level 3 measurements). Accordingly, the degree of judgment exercised in determining fair value is greatest for instruments categorized in Level 3. The inputs used to measure fair value may fall into different levels of the fair value hierarchy. In such cases, for disclosure purposes, the fair value hierarchy classification is determined based on the lowest level input that is significant to the fair value measurement in its entirety.
Changes in valuation techniques may result in transfers into or out of an assigned level within the disclosure hierarchy. In accordance with the Fund’s policy, transfers between different levels of the fair value disclosure hierarchy are deemed to have occurred as of the beginning of the reporting period. The categorization of a value determined for investments and derivative financial instruments is based on the pricing transparency of the investment and derivative financial instrument and is not necessarily an indication of the risks associated with investing in those securities. For information about the Fund’s policy regarding valuation of investments and derivative financial instruments, please refer to Note 2 of the Notes to Financial Statements.
See Notes to Financial Statements.
| | | | | | |
| 12 | | BLACKROCK FUNDS | | JANUARY 31, 2014 | | |
| | | | |
| Consolidated Schedule of Investments (continued) | | | BlackRock Commodity Strategies Fund | |
The following tables summarize the Fund’s investments and derivative financial instruments categorized in the disclosure hierarchy as of January 31, 2014:
| | | | | | | | | | | | | | | | |
| | | Level 1 | | | Level 2 | | | Level 3 | | | Total | |
Assets: | | | | | | | | | | | | | | | | |
Investments: | | | | | | | | | | | | | | | | |
Long-Term Investments: | | | | | | | | | | | | | | | | |
Commodity-Linked Notes | | | — | | | | — | | | $ | 66,314,456 | | | $ | 66,314,456 | |
Common Stocks: | | | | | | | | | | | | | | | | |
Biotechnology | | | — | | | $ | 617,487 | | | | — | | | | 617,487 | |
Chemicals | | $ | 8,420,463 | | | | 2,611,603 | | | | — | | | | 11,032,066 | |
Energy Equipment & Services | | | 7,273,315 | | | | — | | | | — | | | | 7,273,315 | |
Food & Staples Retailing | | | 1,200,793 | | | | — | | | | — | | | | 1,200,793 | |
Food Products | | | 15,636,304 | | | | 3,160,943 | | | | — | | | | 18,797,247 | |
Machinery | | | 1,093,619 | | | | 1,769,997 | | | | — | | | | 2,863,616 | |
Metals & Mining | | | 33,612,758 | | | | 24,848,361 | | | | — | | | | 58,461,119 | |
Oil, Gas & Consumable Fuels | | | 56,273,083 | | | | 28,666,987 | | | | — | | | | 84,940,070 | |
Paper & Forest Products | | | 953,929 | | | | — | | | | — | | | | 953,929 | |
Real Estate Investment Trusts (REITs) | | | 926,280 | | | | — | | | | — | | | | 926,280 | |
Short-Term Securities: | | | | | | | | | | | | | | | | |
Money Market Funds | | | 15,606,778 | | | | 720,425 | | | | — | | | | 16,327,203 | |
U.S. Treasury Bills | | | — | | | | 135,992,655 | | | | — | | | | 135,992,655 | |
Total | | $ | 140,997,322 | | | $ | 198,388,458 | | | $ | 66,314,456 | | | $ | 405,700,236 | |
| | | | |
| | | | | | | | | | | | | | | | |
| | | Level 1 | | | Level 2 | | | Level 3 | | | Total | |
Derivative Financial Instruments1 | | | | | | | | | | | | | | | | |
Assets: | | | | | | | | | | | | | | | | |
Foreign currency exchange contracts | | $ | 1,605 | | | | — | | | | — | | | $ | 1,605 | |
Liabilities: | | | | | | | | | | | | | | | | |
Foreign currency exchange contracts | | | (1,779 | ) | | | — | | | | — | | | | (1,779 | ) |
Total | | $ | (174 | ) | | | — | | | | — | | | $ | (174 | ) |
| | | | |
1 Derivative financial instruments are foreign currency exchange contracts which are valued at the unrealized appreciation/depreciation on the instrument. | |
|
| The carrying amount for certain of the Fund’s assets and/or liabilities approximates fair value for financial statement purposes. As of January 31, 2014, such assets and/or liabilities are categorized within the disclosure hierarchy as follows: | |
|
| |
| |
| | | Level 1 | | | Level 2 | | | Level 3 | | | Total | |
Assets: | | | | | | | | | | | | | | | | |
Cash | | $ | 3,722,844 | | | | — | | | | — | | | $ | 3,722,844 | |
Foreign currency at value | | | 28,025 | | | | — | | | | — | | | | 28,025 | |
Liabilities: | | | | | | | | | | | | | | | | |
Collateral on securities loaned at value | | | — | | | $ | (720,425 | ) | | | — | | | | (720,425 | ) |
Total | | $ | 3,750,869 | | | $ | (720,425 | ) | | | — | | | $ | 3,030,444 | |
| | | | |
There were no transfers between Level 1 and Level 2 during the six months ended January 31, 2014.
See Notes to Financial Statements.
| | | | | | |
| | | BLACKROCK FUNDS | | JANUARY 31, 2014 | | 13 |
| | | | |
| Consolidated Schedule of Investments (concluded) | | | BlackRock Commodity Strategies Fund | |
A reconciliation of Level 3 investments is presented when the Fund had a significant amount of Level 3 investments at the beginning and/or end of the period in relation to net assets. The following table is a reconciliation of Level 3 investments for which significant unobservable inputs were used in determining fair value:
| | | | |
| | | Commodity-Linked
Notes | |
Assets: | | | | |
Opening Balance, as of July 31, 2013 | | $ | 58,525,843 | |
Transfers into Level 3 | | | — | |
Transfers out of Level 3 | | | — | |
Accrued discounts/premiums | | | — | |
Net realized gain (loss) | | | (5,918,972 | ) |
Net change in unrealized appreciation/depreciation1 | | | 5,288,613 | |
Purchases | | | 23,000,000 | |
Sales | | | (14,581,028 | ) |
Closing Balance, as of January 31, 2014 | | $ | 66,314,456 | |
| | | | |
Net change in unrealized appreciation/depreciation on investments held as of January 31, 2014 | | $ | (309,044 | ) |
| | | | |
| 1 | Included in the related net change in unrealized appreciation/depreciation in the Statements of Operations. |
The Fund’s investments that are categorized as Level 3 were valued utilizing third party pricing information without adjustment. Such valuations are based on unobservable inputs. A significant change in third party information inputs could result in a significantly lower or higher value of such Level 3 investments.
See Notes to Financial Statements.
| | | | | | |
| 14 | | BLACKROCK FUNDS | | JANUARY 31, 2014 | | |
| | | | |
| Schedule of Investments January 31, 2014 (Unaudited) | | | BlackRock Global Long/Short Credit Fund | |
| | | (Percentages shown are based on Net Assets) | |
| | | | | | | | | | | | |
| Asset-Backed Securities | | Par (000) | | | Value | |
Cayman Islands — 2.8% | | | | | | | | | | | | |
ACAS CLO Ltd.: | | | | | | | | | | | | |
Series 2007-1A, Class A1S,
0.45%, 4/20/21 (a)(b) | | | USD | | | | 3,962 | | | $ | 3,908,513 | |
Series 2012-1A, Class D, 5.10%, 9/20/23 (a)(b) | | | | | | | 1,685 | | | | 1,693,425 | |
Series 2013-1A, Class C, 2.99%, 4/20/25 (a)(b) | | | | | | | 1,000 | | | | 975,000 | |
Adirondack Park CLO Ltd., Series 2013-1A, Class D, 3.89%, 4/15/24 (a)(b) | | | | | | | 1,250 | | | | 1,213,079 | |
ALM V Ltd., Series 2012-5A, Class C,
4.74%, 2/13/23 (a)(b) | | | | | | | 500 | | | | 501,269 | |
ALM VI Ltd.: | | | | | | | | | | | | |
Series 2012-6A, Class A2, 2.74%, 6/14/23 (a)(b) | | | | | | | 3,930 | | | | 3,961,001 | |
Series 2012-6A, Class C, 4.99%, 6/14/23 (a)(b) | | | | | | | 2,000 | | | | 2,005,345 | |
ALM VII Ltd., Series 2012-7A, Class C,
4.74%, 10/19/24 (a)(b) | | | | | | | 3,675 | | | | 3,685,290 | |
ALM VII R Ltd., Series 2013-7RA, Class C, 3.71%, 4/24/24 (a)(b) | | | | | | | 3,920 | | | | 3,778,668 | |
ALM VIII Ltd.: | | | | | | | | | | | | |
Series 2013-8A, Class A1A,
1.69%, 1/20/26 (a)(b) | | | | | | | 5,440 | | | | 5,426,625 | |
Series 2013-8A, Class B, 2.99%, 1/20/26 (a)(b) | | | | | | | 1,520 | | | | 1,484,132 | |
Series 2013-8A, Class D, 4.74%, 1/20/26 (a)(b) | | | | | | | 3,355 | | | | 3,088,068 | |
Apidos CDO: | | | | | | | | | | | | |
Series 2013-16A, Class A1,
1.71%, 1/19/25 (a)(b) | | | | | | | 4,985 | | | | 4,950,105 | |
Series 2013-16A, Class B, 3.06%, 1/19/25 (a)(b) | | | | | | | 3,625 | | | | 3,561,563 | |
Apidos CLO XII, Series 2013-12A, Class D, 3.29%, 4/15/25 (a)(b) | | | | | | | 1,500 | | | | 1,411,614 | |
Ares XXV CLO Ltd., Series 2012-3X, Class C, 3.39%, 1/17/24 (b) | | | | | | | 1,300 | | | | 1,292,463 | |
Atlas Senior Loan Fund Ltd., Series 2013-2A, Class A3L, 2.94%, 2/17/26 (a)(b) | | | | | | | 3,800 | | | | 3,648,000 | |
Babson CLO Ltd.: | | | | | | | | | | | | |
Series 2012-2A, Class C, 4.49%, 5/15/23 (a)(b) | | | | | | | 1,285 | | | | 1,287,106 | |
Series 2013-IIA, Class B1, 2.93%, 1/18/25 (a)(b) | | | | | | | 2,500 | | | | 2,438,116 | |
Battalion CLO IV Ltd., Series 2013-4A, Class C, 3.59%, 10/22/25 (a)(b) | | | | | | | 1,750 | | | | 1,652,525 | |
Benefit Street Partners CLO Ltd.: | | | | | | | | | | | | |
Series 2012-IA, Class C, 4.74%, 10/15/23 (a)(b) | | | | | | | 500 | | | | 501,332 | |
Series 2013-IIIA, Class C, 3.49%, 1/20/26 (a)(b) | | | | | | | 2,100 | | | | 1,970,946 | |
Carlyle Global Market Strategies CLO Ltd.: | | | | | | | | | | | | |
Series 2011-1A, Class E, 5.69%, 8/10/21 (a)(b) | | | | | | | 4,600 | | | | 4,542,161 | |
Series 2012-2A, Class D, 4.94%, 7/20/23 (a)(b) | | | | | | | 5,000 | | | | 5,022,240 | |
Chatham Light CLO Ltd., Series 2005-2A, Class B, 0.94%, 8/03/19 (a)(b) | | | | | | | 4,250 | | | | 4,125,561 | |
CIFC Funding Ltd.: | | | | | | | | | | | | |
Series 2012-1A, Class B1L,
5.51%, 8/14/24 (a)(b) | | | | | | | 500 | | | | 502,500 | |
Series 2013-3A, Class C, 3.51%, 10/24/25 (a)(b) | | | | | | | 2,000 | | | | 1,912,680 | |
ECP CLO Ltd.: | | | | | | | | | | | | |
Series 2008-1A, Class A2, 3.24%, 3/17/22 (a)(b) | | | | | | | 3,250 | | | | 3,250,000 | |
Series 2013-5A, Class C, 3.74%, 1/20/25 (a)(b) | | | | | | | 1,750 | | | | 1,684,159 | |
| | | | | | | | | | | | |
| Asset-Backed Securities | | Par (000) | | | Value | |
Cayman Islands (concluded) | | | | | | | | | | | | |
Figueroa CLO Ltd., Series 2013-1A, Class C, 3.89%, 3/21/24 (a)(b) | | | USD | | | | 500 | | | $ | 486,432 | |
Flatiron CLO Ltd.: | | | | | | | | | | | | |
Series 2012-1A, Class C,
4.74%, 10/25/24 (a)(b) | | | | | | | 625 | | | | 633,869 | |
Series 2013-1A, Class A1,
1.69%, 1/17/26 (a)(b) | | | | | | | 3,205 | | | | 3,187,978 | |
Series 2013-1A, Class C,
3.89%, 1/17/26 (a)(b) | | | | | | | 3,000 | | | | 2,877,737 | |
Galaxy XII CLO Ltd., Series 2012-12A, Class B, 2.84%, 5/19/23 (a)(b) | | | | | | | 1,895 | | | | 1,897,369 | |
Galaxy XV CLO Ltd., Series 2013-15A, Class C, 2.84%, 4/15/25 (a)(b) | | | | | | | 1,000 | | | | 962,989 | |
ING IM CLO Ltd., Series 2012-3A, Class D, 4.99%, 10/15/22 (a)(b) | | | | | | | 2,321 | | | | 2,328,105 | |
ING Investment Management Co., Series 2013-3A, Class B, 2.94%, 1/18/26 (a)(b) | | | | | | | 2,520 | | | | 2,472,841 | |
Jamestown CLO I Ltd., Series 2012-1A, Class A1, 1.67%, 11/05/24 (a)(b) | | | | | | | 1,750 | | | | 1,731,415 | |
KKR Financial CLO Ltd., Series 2013-1A, Class A1, 1.39%, 7/15/25 (a)(b) | | | | | | | 1,640 | | | | 1,606,784 | |
Madison Park Funding XI Ltd., Series 2013-11A, Class C, 3.01%, 10/23/25 (a)(b) | | | | | | | 2,680 | | | | 2,640,380 | |
Mountain Hawk II CLO Ltd., Series 2013-2A, Class A1, 1.40%, 7/22/24 (a)(b) | | | | | | | 2,320 | | | | 2,270,574 | |
Neuberger Berman CLO Ltd., Series 2012-12A, Class D, 5.74%, 7/25/23 (a)(b) | | | | | | | 2,000 | | | | 1,999,969 | |
North End CLO Ltd., Series 2013-1A, Class D, 3.74%, 7/17/25 (a)(b) | | | | | | | 750 | | | | 724,143 | |
Oaktree CLO Ltd., Series 2014-1A, Class A2A, 2.29%, 2/13/25 (a)(b) | | | | | | | 5,470 | | | | 5,389,919 | |
Octagon Investment Partners XVII Ltd.,
Series 2013-1A, Class D, 3.42%, 10/25/25 (a)(b) | | | | | | | 1,000 | | | | 951,023 | |
Octagon Investment Partners XVIII Ltd.,
Series 2013-1A, Class C, 3.94%, 12/16/24 (a)(b) | | | | | | | 2,250 | | | | 2,194,758 | |
OHA Credit Partners VI Ltd., Series 2012-6A, Class D, 4.74%, 5/15/23 (a)(b) | | | | | | | 3,200 | | | | 3,208,647 | |
OHA Credit Partners VII Ltd., Series 2012-7A, Class A, 1.66%, 11/20/23 (a)(b) | | | | | | | 3,350 | | | | 3,334,075 | |
OZLM Funding III Ltd., Series 2013-3A, Class A1, 1.57%, 1/22/25 (a)(b) | | | | | | | 725 | | | | 717,714 | |
OZLM Funding Ltd., Series 2013-4A, Class C, 3.44%, 7/22/25 (a)(b) | | | | | | | 1,000 | | | | 951,846 | |
Race Point CLO Ltd., Series 2012-7A, Class A, 1.66%, 11/08/24 (a)(b) | | | | | | | 1,750 | | | | 1,743,128 | |
Race Point V CLO Ltd., Series 2011-5A, Class B, 2.74%, 12/15/22 (a)(b) | | | | | | | 4,300 | | | | 4,302,367 | |
Sudbury Mill CLO Ltd., Series 2013-1A, Class C, 3.24%, 1/17/26 (a)(b) | | | | | | | 2,500 | | | | 2,461,019 | |
Symphony CLO VIII LP, Series 2012-8A, Class B, 2.74%, 1/09/23 (a)(b) | | | | | | | 4,050 | | | | 4,050,000 | |
Symphony CLO XI Ltd., Series 2013-11A, Class D, 4.24%, 1/17/25 (a)(b) | | | | | | | 1,750 | | | | 1,724,497 | |
Tyron Park CLO Ltd., Series 2013-1A, Class C, 3.77%, 7/15/25 (a)(b) | | | | | | | 1,000 | | | | 969,524 | |
Waterfront CLO Ltd., Series 2007-1A, Class B, 1.19%, 8/02/20 (a)(b) | | | | | | | 3,500 | | | | 3,318,343 | |
West CLO Ltd., Series 2013-1A, Class B, 3.14%, 11/07/25 (a)(b) | | | | | | | 2,250 | | | | 2,201,498 | |
| | | | | | | | | | | | |
| | | | | | | | | | | | 138,812,429 | |
Italy — 0.2% | | | | | | | | | | | | |
Berica PMI Srl, Series 2013-1, Class A1X, 2.63%, 5/31/57 | | | EUR | | | | 8,414 | | | | 11,498,045 | |
See Notes to Financial Statements.
| | | | | | |
| | | BLACKROCK FUNDS | | JANUARY 31, 2014 | | 15 |
| | | | |
| Schedule of Investments (continued) | | | BlackRock Global Long/Short Credit Fund | |
| | | (Percentages shown are based on Net Assets) | |
| | | | | | | | | | | | |
| Asset-Backed Securities | | Par (000) | | | Value | |
Netherlands — 0.9% | | | | | | | | | | | | |
North Westerly CLO BV, Series IV-X, Class A-1, 1.00%, 1/15/26 | | | EUR | | | | 31,266 | | | $ | 41,418,801 | |
United States — 0.1% | | | | | | | | | | | | |
Hilton USA Trust, Series 2013-HLT, Class EFX, 4.45%, 11/05/30 (a)(b) | | | USD | | | | 4,673 | | | | 4,765,904 | |
Total Asset-Backed Securities — 4.0% | | | | | | | | | | | 196,495,179 | |
| | | | | | | | | | | | |
| Common Stocks | | | | | Shares | | | | |
Australia — 0.1% | | | | | | | | | | | | |
Fortescue Metals Group Ltd. | | | | | | | 1,200,000 | | | | 5,597,466 | |
Ireland — 0.1% | | | | | | | | | | | | |
Smurfit Kappa Group PLC | | | | | | | 211,800 | | | | 4,950,427 | |
Netherlands — 0.1% | | | | | | | | | | | | |
NXP Semiconductor NV | | | | | | | 125,135 | | | | 6,050,277 | |
United Kingdom — 0.0% | | | | | | | | | | | | |
International Consolidated Airlines Group (c) | | | | | | | 50,585 | | | | 346,514 | |
United States — 0.5% | | | | | | | | | | | | |
Apple, Inc. | | | | | | | 19,321 | | | | 9,672,093 | |
Atmel Corp. (c) | | | | | | | 64,445 | | | | 538,760 | |
CSX Corp. | | | | | | | 56,450 | | | | 1,519,069 | |
Deere & Co. | | | | | | | 8,650 | | | | 743,554 | |
EMC Corp. | | | | | | | 290,128 | | | | 7,032,703 | |
Oracle Corp. | | | | | | | 33,535 | | | | 1,237,441 | |
The Western Union Co. | | | | | | | 147,505 | | | | 2,271,577 | |
| | | | | | | | | | | | |
| | | | | | | | | | | | 23,015,197 | |
Total Common Stocks — 0.8% | | | | | | | | | | | 39,959,881 | |
| | | | | | | | | | | | |
| Corporate Bonds | | | | | Par (000) | | | | |
Australia — 0.6% | | | | | | | | | | | | |
Virgin Australia Trust: | | | | | | | | | | | | |
Series 2013-1, Class B, 6.00%, 4/23/22 (a) | | | USD | | | | 5,030 | | | | 5,243,775 | |
Series 2013-1, Class C, 7.13%, 10/23/18 (a) | | | | | | | 11,620 | | | | 11,910,500 | |
Series 2013-1, Class D, 8.50%, 10/23/16 (a) | | | | | | | 10,730 | | | | 10,935,707 | |
| | | | | | | | | | | | |
| | | | | | | | | | | | 28,089,982 | |
Belgium — 0.2% | | | | | | | | | | | | |
Anheuser-Busch InBev NV, 4.00%, 9/24/25 | | | GBP | | | | 5,790 | | | | 9,760,698 | |
Bermuda — 0.2% | | | | | | | | | | | | |
Aircastle Ltd.: | | | | | | | | | | | | |
6.25%, 12/01/19 | | | USD | | | | 2,455 | | | | 2,642,194 | |
7.63%, 4/15/20 | | | | | | | 1,000 | | | | 1,132,500 | |
Digicel Ltd., 6.00%, 4/15/21 (a) | | | | | | | 4,175 | | | | 4,049,750 | |
Ingersoll-Rand Global Holding Co. Ltd., 2.88%, 1/15/19 (a) | | | | | | | 682 | | | | 686,329 | |
| | | | | | | | | | | | |
| | | | | | | | | | | | 8,510,773 | |
Canada — 0.7% | | | | | | | | | | | | |
Air Canada, 6.75%, 10/01/19 (a) | | | | | | | 8,000 | | | | 8,540,000 | |
Air Canada Pass-Through Trust: | | | | | | | | | | | | |
Series 2013-1, Class B, 5.38%, 11/15/22 (a) | | | | | | | 2,000 | | | | 2,000,000 | |
Series 2013-1, Class C, 6.63%, 5/15/18 (a) | | | | | | | 3,045 | | | | 3,077,581 | |
| | | | | | | | | | | | |
| Corporate Bonds | | Par (000) | | | Value | |
Canada (concluded) | | | | | | | | | | | | |
Barrick Gold Corp.: | | | | | | | | | | | | |
3.85%, 4/01/22 | | | USD | | | | 1,599 | | | $ | 1,492,700 | |
4.10%, 5/01/23 | | | | | | | 11,666 | | | | 10,768,966 | |
Ultra Petroleum Corp., 5.75%, 12/15/18 (a) | | | | | | | 1,882 | | | | 1,947,870 | |
Valeant Pharmaceuticals International,
6.75%, 8/15/18 (a) | | | | | | | 5,594 | | | | 6,132,423 | |
| | | | | | | | | | | | |
| | | | | | | | | | | | 33,959,540 | |
Cayman Islands — 0.6% | | | | | | | | | | | | |
Punch Taverns Finance B Ltd.: | | | | | | | | | | | | |
Series A3, 7.37%, 6/30/22 | | | GBP | | | | 1,023 | | | | 1,766,013 | |
Series A6, 5.94%, 12/30/24 | | | | | | | 3,963 | | | | 6,286,755 | |
Series A7, 4.77%, 6/30/33 | | | | | | | 4,027 | | | | 6,255,847 | |
Seagate HDD Cayman, 3.75%, 11/15/18 (a) | | | USD | | | | 10,050 | | | | 10,251,000 | |
Transocean, Inc.: | | | | | | | | | | | | |
6.50%, 11/15/20 | | | | | | | 300 | | | | 340,653 | |
6.38%, 12/15/21 | | | | | | | 850 | | | | 947,593 | |
Wynn Macau Ltd., 5.25%, 10/15/21 (a) | | | | | | | 3,555 | | | | 3,555,000 | |
| | | | | | | | | | | | |
| | | | | | | | | | | | 29,402,861 | |
Czech Republic — 0.0% | | | | | | | | | | | | |
RPG Byty Sro, 6.75%, 5/01/20 | | | EUR | | | | 811 | | | | 1,113,163 | |
Czechoslovakia — 0.1% | | | | | | | | | | | | |
CE Energy AS, 7.00%, 2/01/21 | | | | | | | 5,565 | | | | 7,505,563 | |
Denmark — 0.6% | | | | | | | | | | | | |
Allianz SE, 5.05%, 10/24/70 | | | | | | | 7,000 | | | | 9,728,839 | |
Deutsche Pfandbriefbank AG, 2.96%, 9/11/17 | | | | | | | 13,550 | | | | 18,649,000 | |
| | | | | | | | | | | | |
| | | | | | | | | | | | 28,377,839 | |
Finland — 0.2% | | | | | | | | | | | | |
Citycon Oyj, 3.75%, 6/24/20 | | | | | | | 6,380 | | | | 8,917,974 | |
France — 2.0% | | | | | | | | | | | | |
Autoroutes du Sud de la France SA, 2.95%, 1/17/24 | | | | | | | 20,200 | | | | 27,595,360 | |
BPCE SA, 5.15%, 7/21/24 (a) | | | USD | | | | 16,209 | | | | 15,931,664 | |
Electricite de France: | | | | | | | | | | | | |
2.75%, 3/10/23 | | | EUR | | | | 800 | | | | 1,103,136 | |
6.00%, 1/22/99 (a) | | | USD | | | | 15,000 | | | | 15,064,455 | |
Eutelsat SA, 3.13%, 10/10/22 | | | EUR | | | | 1,100 | | | | 1,505,192 | |
Gecina SA, 2.88%, 5/30/23 | | | | | | | 2,200 | | | | 2,921,928 | |
Imerys SA, 2.50%, 11/26/20 | | | | | | | 6,200 | | | | 8,473,710 | |
Plastic Omnium SA, 2.88%, 5/29/20 | | | | | | | 13,300 | | | | 17,918,631 | |
Societe Des Autoroutes Paris-Rhin-Rhone, 2.25%, 1/16/20 | | | | | | | 5,300 | | | | 7,249,659 | |
| | | | | | | | | | | | |
| | | | | | | | | | | | 97,763,735 | |
Germany — 2.0% | | | | | | | | | | | | |
Bayerische Landesbank, 4.50%, 2/07/19 (b) | | | | | | | 3,950 | | | | 5,078,077 | |
Commerzbank AG: | | | | | | | | | | | | |
3.63%, 7/10/17 | | | | | | | 4,490 | | | | 6,516,359 | |
7.75%, 3/16/21 | | | | | | | 14,400 | | | | 22,140,401 | |
8.13%, 9/19/23 (a) | | | USD | | | | 7,614 | | | | 8,356,365 | |
FTE Verwaltungs GmbH, 9.00%, 7/15/20 | | | EUR | | | | 4,980 | | | | 7,421,809 | |
HSH Nordbank AG: | | | | | | | | | | | | |
1.02%, 2/14/17 (b) | | | | | | | 5,423 | | | | 5,591,589 | |
1.06%, 2/14/17 (b) | | | | | | | 9,248 | | | | 9,523,027 | |
Muenchener Rueckversicherungs AG,
6.00%, 5/26/41 (b) | | | | | | | 1,100 | | | | 1,740,271 | |
ThyssenKrupp AG, 4.00%, 8/27/18 | | | | | | | 3,200 | | | | 4,510,082 | |
Volkswagen Leasing GmbH, 2.63%, 1/15/24 | | | | | | | 19,895 | | | | 27,063,318 | |
| | | | | | | | | | | | |
| | | | | | | | | | | | 97,941,298 | |
See Notes to Financial Statements.
| | | | | | |
| 16 | | BLACKROCK FUNDS | | JANUARY 31, 2014 | | |
| | | | |
| Schedule of Investments (continued) | | | BlackRock Global Long/Short Credit Fund | |
| | | (Percentages shown are based on Net Assets) | |
| | | | | | | | | | | | |
| Corporate Bonds | | Par (000) | | | Value | |
Guernsey — 0.2% | | | | | | | | | | | | |
Doric Nimrod Air Finance Alpha Ltd. Pass-Through Trust, 5.25%, 5/30/23 (a) | | | USD | | | | 8,700 | | | $ | 8,917,500 | |
Ireland — 1.6% | | | | | | | | | | | | |
AIB Mortgage Bank: | | | | | | | | | | | | |
4.88%, 6/29/17 | | | EUR | | | | 5,586 | | | | 8,326,587 | |
2.63%, 7/28/17 | | | | | | | 1,390 | | | | 1,931,921 | |
Ardagh Packaging Finance PLC/Ardagh Holdings USA, Inc., 6.25%, 1/31/19 (a) | | | USD | | | | 2,649 | | | | 2,678,801 | |
Bank of Ireland, 3.25%, 1/15/19 | | | EUR | | | | 22,987 | | | | 31,398,050 | |
Bank of Ireland Mortgage Bank, 3.63%, 10/02/20 | | | | | | | 2,750 | | | | 3,995,024 | |
Cloverie PLC for Zurich Insurance Co. Ltd., 7.50%, 7/24/39 (b) | | | | | | | 7,150 | | | | 11,763,937 | |
CRH Finance Ltd., 3.13%, 4/03/23 | | | | | | | 2,675 | | | | 3,687,744 | |
DEPFA Bank PLC, 0.98%, 12/15/15 (b) | | | | | | | 14,007 | | | | 17,380,053 | |
| | | | | | | | | | | | |
| | | | | | | | | | | | 81,162,117 | |
Italy — 5.9% | | | | | | | | | | | | |
A2A SpA, 4.38%, 1/10/21 | | | | | | | 6,050 | | | | 8,874,096 | |
ACEA SpA, 3.75%, 9/12/18 | | | | | | | 6,300 | | | | 9,090,200 | |
Assicurazioni Generali SpA, 2.88%, 1/14/20 | | | | | | | 6,965 | | | | 9,540,298 | |
Astaldi SpA, 7.13%, 12/01/20 | | | | | | | 3,480 | | | | 4,904,714 | |
Banca Monte dei Paschi di Siena SpA, 4.88%, 9/15/16 | | | | | | | 5,122 | | | | 7,316,823 | |
Banca Popolare dell’Emilia Romagna SC, 3.38%, 10/22/18 | | | | | | | 12,100 | | | | 16,761,629 | |
Credito Emiliano SpA, 3.25%, 7/09/20 | | | | | | | 3,560 | | | | 5,027,049 | |
Gtech SpA, 3.50%, 3/05/20 | | | | | | | 1,000 | | | | 1,426,219 | |
Intesa Sanpaolo SpA: | | | | | | | | | | | | |
3.00%, 1/28/19 | | | | | | | 19,120 | | | | 26,070,092 | |
5.25%, 1/12/24 | | | USD | | | | 20,000 | | | | 20,253,140 | |
3.25%, 2/10/26 | | | EUR | | | | 10,400 | | | | 14,153,089 | |
IVS F. SpA, 7.13%, 4/01/20 | | | | | | | 4,211 | | | | 5,949,184 | |
Mediaset SpA, 5.13%, 1/24/19 | | | | | | | 7,085 | | | | 9,959,325 | |
Mediobanca SpA, 3.63%, 10/17/23 | | | | | | | 11,905 | | | | 16,904,474 | |
Snai SpA, 7.63%, 6/15/18 | | | | | | | 2,475 | | | | 3,379,779 | |
Telecom Italia SpA: | | | | | | | | | | | | |
6.38%, 6/24/19 | | | GBP | | | | 6,600 | | | | 11,504,786 | |
4.50%, 1/25/21 | | | EUR | | | | 14,755 | | | | 19,935,459 | |
5.88%, 5/19/23 | | | GBP | | | | 5,650 | | | | 9,175,830 | |
UniCredit SpA: | | | | | | | | | | | | |
3.25%, 1/14/21 | | | EUR | | | | 22,694 | | | | 30,584,638 | |
6.95%, 10/31/22 | | | | | | | 2,920 | | | | 4,328,508 | |
5.90%, 10/28/25 (b) | | | | | | | 23,290 | | | | 32,549,145 | |
Unione di Banche Italiane SCPA: | | | | | | | | | | | | |
3.25%, 10/14/20 | | | | | | | 7,715 | | | | 10,847,824 | |
3.13%, 2/05/24 | | | | | | | 9,530 | | | | 12,846,638 | |
| | | | | | | | | | | | |
| | | | | | | | | | | | 291,382,939 | |
Jersey — 0.6% | | | | | | | | | | | | |
AA Bond Co. Ltd.: | | | | | | | | | | | | |
9.50%, 7/31/19 | | | GBP | | | | 2,430 | | | | 4,403,130 | |
6.27%, 7/31/25 | | | | | | | 7,055 | | | | 13,052,872 | |
Atrium European Real Estate Ltd., 4.00%, 4/20/20 | | | EUR | | | | 3,570 | | | | 4,907,047 | |
Enterprise Funding Ltd., 3.50%, 9/10/20 (d) | | | GBP | | | | 3,000 | | | | 5,656,656 | |
| | | | | | | | | | | | |
| | | | | | | | | | | | 28,019,705 | |
Luxembourg — 2.8% | | | | | | | | | | | | |
Aguila 3 SA, 7.88%, 1/31/18 (a) | | | USD | | | | 3,310 | | | | 3,512,737 | |
Altice Financing SA, 6.50%, 1/15/22 (a) | | | | | | | 6,075 | | | | 6,166,125 | |
Beverage Packaging Holdings Luxembourg II SA / Beverage Packaging Holdings II IS, 6.00%, 6/15/17 (a) | | | | | | | 4,565 | | | | 4,679,125 | |
Bilbao Luxembourg SA, 10.50%
(10.50% Cash or 11.25% PIK), 12/01/18 (e) | | | EUR | | | | 605 | | | | 807,809 | |
| | | | | | | | | | | | |
| Corporate Bonds | | Par (000) | | | Value | |
Luxembourg (concluded) | | | | | | | | | | | | |
Cirsa Funding Luxembourg SA, 8.75%, 5/15/18 | | | EUR | | | | 5,190 | | | $ | 7,122,294 | |
Gategroup Finance Luxembourg SA, 6.75%, 3/01/19 | | | | | | | 4,456 | | | | 6,385,461 | |
GCS Holdco Finance I SA, 6.50%, 11/15/18 | | | | | | | 1,830 | | | | 2,563,777 | |
GELF Bond Issuer I SA, 3.13%, 4/03/18 | | | | | | | 5,170 | | | | 7,240,580 | |
Intralot Finance Luxembourg SA, 9.75%, 8/15/18 | | | | | | | 8,770 | | | | 12,907,495 | |
Magnolia BC SA, 9.00%, 8/01/20 | | | | | | | 2,829 | | | | 3,987,576 | |
Servus Luxembourg Holding SCA, 7.75%, 6/15/18 | | | | | | | 3,934 | | | | 5,595,093 | |
Telecom Italia Capital SA: | | | | | | | | | | | | |
6.38%, 11/15/33 | | | | | | | 6,733 | | | | 6,312,187 | |
6.00%, 9/30/34 | | | | | | | 5,657 | | | | 5,105,443 | |
7.72%, 6/04/38 | | | | | | | 3,875 | | | | 3,991,250 | |
Telecom Italia Finance SA: | | | | | | | | | | | | |
6.13%, 11/15/16 (d) | | | EUR | | | | 33,600 | | | | 51,719,846 | |
7.75%, 1/24/33 | | | | | | | 6,360 | | | | 9,672,227 | |
Tyco Electronics Group SA, 2.38%, 12/17/18 | | | USD | | | | 1,585 | | | | 1,579,055 | |
| | | | | | | | | | | | |
| | | | | | | | | | | | 139,348,080 | |
Mexico — 0.3% | | | | | | | | | | | | |
Banco Santander Mexico SA Institucion de Banca Multiple Grupo Financiero Santand, 5.95%, 1/30/24 (a)(b) | | | | | | | 13,740 | | | | 13,963,275 | |
Petroleos Mexicanos, 4.88%, 1/18/24 (a) | | | | | | | 1,303 | | | | 1,296,800 | |
| | | | | | | | | | | | |
| | | | | | | | | | | | 15,260,075 | |
Netherlands — 5.5% | | | | | | | | | | | | |
ABN AMRO Bank NV: | | | | | | | | | | | | |
6.38%, 4/27/21 | | | EUR | | | | 3,660 | | | | 5,776,161 | |
7.13%, 7/06/22 | | | | | | | 7,000 | | | | 11,522,616 | |
Achmea BV: | | | | | | | | | | | | |
2.50%, 11/19/20 | | | | | | | 8,765 | | | | 11,984,425 | |
6.00%, 4/04/43 (b) | | | | | | | 5,318 | | | | 7,834,498 | |
Adria Bidco BV, 7.88%, 11/15/20 | | | | | | | 2,455 | | | | 3,327,635 | |
Allianz Finance II BV, 5.75%, 7/08/41 (b) | | | | | | | 5,300 | | | | 8,224,439 | |
Cooperatieve Centrale Raiffeisen- Boerenleenbank BA: | | | | | | | | | | | | |
4.00%, 1/11/22 | | | | | | | 4,520 | | | | 6,800,879 | |
3.88%, 7/25/23 | | | | | | | 12,270 | | | | 17,120,344 | |
EDP Finance BV, 5.25%, 1/14/21 (a) | | | USD | | | | 8,840 | | | | 9,005,750 | |
Enel Finance International NV, 4.88%, 4/17/23 | | | EUR | | | | 616 | | | | 928,437 | |
Fresenius Finance BV, 3.00%, 2/01/21 | | | | | | | 17,980 | | | | 24,187,944 | |
ING Bank NV: | | | | | | | | | | | | |
6.13%, 5/29/23 (b) | | | | | | | 10,000 | | | | 15,038,101 | |
5.80%, 9/25/23 (a) | | | USD | | | | 8,160 | | | | 8,542,157 | |
3.50%, 11/21/23 (b) | | | EUR | | | | 6,291 | | | | 8,556,846 | |
4.13%, 11/21/23 (b) | | | USD | | | | 522 | | | | 519,390 | |
IVG Finance BV, 1.75%, 3/29/17 (d) | | | EUR | | | | 3,500 | | | | 3,701,328 | |
LYB International Finance BV, 4.00%, 7/15/23 | | | USD | | | | 565 | | | | 570,051 | |
Madrilena Red de Gas Finance BV, 3.78%, 9/11/18 | | | EUR | | | | 5,060 | | | | 7,257,075 | |
NXP BV/NXP Funding LLC, 3.75%, 6/01/18 (a) | | | USD | | | | 8,916 | | | | 8,916,000 | |
Repsol International Finance BV, 3.63%, 10/07/21 | | | EUR | | | | 11,100 | | | | 15,614,524 | |
TMF Group Holding BV, 9.88%, 12/01/19 | | | | | | | 2,510 | | | | 3,739,221 | |
Univeg Holding BV, 7.88%, 11/15/20 | | | | | | | 7,595 | | | | 10,243,442 | |
Volkswagen International Finance NV: | | | | | | | | | | | | |
5.50%, 11/09/15 (d) | | | | | | | 36,100 | | | | 57,087,127 | |
5.50%, 11/09/15 (a)(d) | | | | | | | 4,200 | | | | 6,511,430 | |
VTR Finance BV, 6.88%, 1/15/24 (a) | | | USD | | | | 4,366 | | | | 4,371,051 | |
Ziggo BV, 3.63%, 3/27/20 | | | EUR | | | | 9,385 | | | | 12,803,826 | |
| | | | | | | | | | | | |
| | | | | | | | | | | | 270,184,697 | |
See Notes to Financial Statements.
| | | | | | |
| | | BLACKROCK FUNDS | | JANUARY 31, 2014 | | 17 |
| | | | |
| Schedule of Investments (continued) | | | BlackRock Global Long/Short Credit Fund | |
| | | (Percentages shown are based on Net Assets) | |
| | | | | | | | | | | | |
| Corporate Bonds | | Par (000) | | | Value | |
Poland — 0.2% | | | | | | | | | | | | |
Play Finance 1 SA, 6.50%, 8/01/19 | | | USD | | | | 5,065 | | | $ | 6,865,365 | |
Play Finance 2 SA, 5.25%, 2/01/19 | | | | | | | 3,490 | | | | 4,701,109 | |
| | | | | | | | | | | | |
| | | | | | | | | | | | 11,566,474 | |
Portugal — 0.5% | | | | | | | | | | | | |
Caixa Geral de Depositos SA: | | | | | | | | | | | | |
5.63%, 12/04/15 | | | | | | | 1,600 | | | | 2,281,355 | |
3.00%, 1/15/19 | | | | | | | 8,400 | | | | 11,558,568 | |
Galp Energia SGPS SA, 4.50%, 1/25/19 | | | | | | | 9,500 | | | | 13,148,343 | |
| | | | | | | | | | | | |
| | | | | | | | | | | | 26,988,266 | |
Slovakia — 0.1% | | | | | | | | | | | | |
Zapadoslovenska Energetika AS, 2.88%, 10/14/18 | | | | | | | 2,575 | | | | 3,555,372 | |
Spain — 4.4% | | | | | | | | | | | | |
AyT Cedulas Cajas Global: | | | | | | | | | | | | |
4.00%, 3/21/17 | | | | | | | 5,400 | | | | 7,744,261 | |
4.25%, 6/14/18 | | | | | | | 3,500 | | | | 5,051,268 | |
4.00%, 3/24/21 | | | | | | | 4,200 | | | | 5,857,217 | |
3.75%, 12/14/22 | | | | | | | 1,100 | | | | 1,483,867 | |
4.25%, 10/25/23 | | | | | | | 100 | | | | 138,680 | |
4.75%, 5/25/27 | | | | | | | 800 | | | | 1,083,244 | |
AyT Cedulas Cajas IX Fondo de Titulizacion, 3.75%, 3/31/15 | | | | | | | 2,000 | | | | 2,770,722 | |
AyT Cedulas Cajas X Fondo de Titulizacion: | | | | | | | | | | | | |
0.36%, 6/30/15 (b) | | | | | | | 1,100 | | | | 1,451,908 | |
3.75%, 6/30/25 | | | | | | | 7,200 | | | | 9,009,007 | |
AyT Cedulas Cajas XXIII Fondo de Titulizacion de Activos, 4.75%, 6/15/16 | | | | | | | 6,000 | | | | 8,676,998 | |
Banco Mare Nostrum SA, 3.13%, 1/21/19 | | | | | | | 9,800 | | | | 13,456,578 | |
Bankia SA, 3.50%, 1/17/19 | | | | | | | 22,300 | | | | 29,993,492 | |
Bankinter SA, 3.88%, 10/30/15 | | | | | | | 1,050 | | | | 1,483,977 | |
BBVA Senior Finance SAU, 3.75%, 1/17/18 | | | | | | | 1,700 | | | | 2,451,673 | |
BPE Financiaciones SA: | | | | | | | | | | | | |
2.88%, 5/19/16 | | | | | | | 16,200 | | | | 22,152,825 | |
2.50%, 2/01/17 | | | | | | | 19,300 | | | | 25,967,132 | |
CaixaBank SA: | | | | | | | | | | | | |
4.50%, 11/22/16 (d) | | | | | | | 12,000 | | | | 16,160,227 | |
3.13%, 5/14/18 | | | | | | | 3,900 | | | | 5,465,071 | |
Caja Rural de Navarra, Sociedad Cooperativa de Crédito Ltd., 2.88%, 6/11/18 | | | | | | | 6,000 | | | | 8,459,114 | |
Cedulas TDA: | | | | | | | | | | | | |
4.13%, 11/29/19 | | | | | | | 3,000 | | | | 4,295,853 | |
4.25%, 3/28/27 | | | | | | | 1,400 | | | | 1,825,693 | |
Cedulas TDA 1 Fondo de Titulizacion de Activos, 0.34%, 4/08/16 (b) | | | | | | | 800 | | | | 1,044,563 | |
Cedulas TDA 6 Fondo de Titulizacion de Activos: | | | | | | | | | | | | |
3.88%, 5/23/25 | | | | | | | 9,900 | | | | 12,848,142 | |
4.25%, 4/10/31 | | | | | | | 10,100 | | | | 12,586,007 | |
International Consolidated Airlines Group SA, 1.75%, 5/31/18 (d) | | | | | | | 5,000 | | | | 9,152,337 | |
Kutxabank SA, 3.00%, 2/01/17 | | | | | | | 1,500 | | | | 2,124,135 | |
Telefonica Emisiones SAU, 3.19%, 4/27/18 | | | | | | | 2,500 | | | | 2,573,335 | |
| | | | | | | | | | | | |
| | | | | | | | | | | | 215,307,326 | |
Sweden — 0.1% | | | | | | | | | | | | |
SAS AB, 7.50%, 4/01/15 (d) | | | SEK | | | | 17,000 | | | | 2,659,737 | |
Scandinavian Airlines System Denmark-Norway- Sweden: | | | | | | | | | | | | |
9.65%, 6/16/14 | | | EUR | | | | 500 | | | | 687,841 | |
10.50%, 6/16/14 | | | | | | | 1,000 | | | | 156,426 | |
| | | | | | | | | | | | |
| | | | | | | | | | | | 3,504,004 | |
Switzerland — 0.3% | | | | | | | | | | | | |
Credit Suisse AG, 5.75%, 9/18/25 (b) | | | | | | | 8,460 | | | | 12,106,089 | |
UBS AG, 4.88%, 5/22/23 (b) | | | USD | | | | 3,340 | | | | 3,319,826 | |
| | | | | | | | | | | | |
| | | | | | | | | | | | 15,425,915 | |
| | | | | | | | | | | | |
| Corporate Bonds | | Par (000) | | | Value | |
United Kingdom — 5.8% | | | | | | | | | | | | |
Abbey National Treasury Service PLC, 2.00%, 1/14/19 | | | EUR | | | | 22,375 | | | $ | 30,456,195 | |
Abbey National Treasury Services PLC, 2.63%, 7/16/20 | | | | | | | 12,780 | | | | 17,549,511 | |
Annington Finance No. 4 PLC, 1.49%, 1/10/23 (b) | | | GBP | | | | 1,701 | | | | 2,774,639 | |
Annington Finance No. 5 PLC, 13.00%
(13.00% Cash or 13.50% PIK), 1/15/23 (e) | | | | | | | 1,131 | | | | 2,268,100 | |
Aviva PLC, 6.13%, 7/05/43 (b) | | | EUR | | | | 5,810 | | | | 8,766,522 | |
Bakkavor Finance 2 PLC, 8.75%, 6/15/20 | | | GBP | | | | 1,468 | | | | 2,617,163 | |
Barclays Bank PLC: | | | | | | | | | | | | |
6.00%, 1/14/21 | | | EUR | | | | 7,690 | | | | 11,932,345 | |
6.63%, 3/30/22 | | | | | | | 1,180 | | | | 1,904,631 | |
7.63%, 11/21/22 | | | USD | | | | 3,169 | | | | 3,367,063 | |
BAT International Finance PLC, 4.00%, 9/04/26 | | | GBP | | | | 7,375 | | | | 12,265,603 | |
BUPA Finance PLC, 5.00%, 4/25/23 | | | | | | | 1,070 | | | | 1,776,333 | |
Enterprise Inns PLC, 6.50%, 12/06/18 | | | | | | | 1,000 | | | | 1,717,874 | |
GKN Holdings PLC, 5.38%, 9/19/22 | | | | | | | 6,515 | | | | 11,468,045 | |
Grainger PLC, 5.00%, 12/16/20 | | | | | | | 8,080 | | | | 13,614,772 | |
House of Fraser Funding PLC, 8.88%, 8/15/18 | | | | | | | 1,870 | | | | 3,327,950 | |
IDH Finance PLC, 6.00%, 12/01/18 | | | | | | | 4,790 | | | | 8,031,762 | |
Jaguar Land Rover Automotive PLC, 8.25%, 3/15/20 | | | | | | | 3,520 | | | | 6,568,631 | |
Lloyds Bank PLC, 6.50%, 3/24/20 | | | EUR | | | | 8,469 | | | | 13,426,926 | |
Ludgate Funding PLC, 6.02%, 1/01/61 | | | GBP | | | | 1,190 | | | | 6,083,906 | |
Marks & Spencer PLC, 4.75%, 6/12/25 | | | | | | | 1,060 | | | | 1,755,825 | |
Mondi Finance PLC, 5.75%, 4/03/17 | | | EUR | | | | 720 | | | | 1,094,081 | |
Nationwide Building Society, 4.13%, 3/20/23 (b) | | | | | | | 4,049 | | | | 5,647,008 | |
Phosphorus Holdco PLC, 10.00%
(10.00% Cash or 10.50% PIK), 4/01/19 (e) | | | GBP | | | | 6,200 | | | | 9,835,448 | |
Portman Building Society, 5.25%, 11/23/20 (b) | | | | | | | 385 | | | | 653,060 | |
Priory Group No. 3 PLC, 7.00%, 2/15/18 | | | | | | | 2,244 | | | | 3,873,355 | |
Royal Bank of Scotland Group PLC, 6.00%, 12/19/23 | | | USD | | | | 40,428 | | | | 40,733,717 | |
Santander UK PLC, 5.00%, 11/07/23 (a) | | | | | | | 4,435 | | | | 4,479,616 | |
Scottish Widows PLC, 5.60%, 6/16/23 | | | EUR | | | | 3,145 | | | | 5,314,178 | |
Together Housing Finance PLC, 4.50%, 12/17/42 | | | | | | | 940 | | | | 1,540,907 | |
The Unique Pub Finance Co. PLC: | | | | | | | | | | | | |
7.40%, 3/28/24 | | | GBP | | | | 2,176 | | | | 3,541,353 | |
Series 2012-02, Class A4, 5.66%, 6/30/27 | | | | | | | 11,198 | | | | 18,432,808 | |
Series 2012-99, Class A3, 6.54%, 3/30/21 | | | | | | | 3,799 | | | | 6,556,740 | |
Virgin Media Finance PLC, 7.00%, 4/15/23 | | | | | | | 1,033 | | | | 1,749,092 | |
Vougeot Bidco PLC, 7.88%, 7/15/20 | | | | | | | 6,659 | | | | 11,715,183 | |
Voyage Care BondCo PLC: | | | | | | | | | | | | |
6.50%, 8/01/18 | | | | | | | 1,230 | | | | 2,092,766 | |
11.00%, 2/01/19 | | | | | | | 1,950 | | | | 3,478,079 | |
WM Treasury PLC, 4.63%, 12/03/42 | | | | | | | 865 | | | | 1,436,662 | |
| | | | | | | | | | | | |
| | | | | | | | | | | | 283,847,849 | |
United States — 17.0% | | | | | | | | | | | | |
Access Midstream Partners LP/ACMP Finance Corp., 5.88%, 4/15/21 | | | USD | | | | 655 | | | | 694,300 | |
The ADT Corp., 4.13%, 6/15/23 | | | | | | | 8,000 | | | | 7,038,936 | |
Alcatel-Lucent USA, Inc.: | | | | | | | | | | | | |
4.63%, 7/01/17 (a) | | | | | | | 4,260 | | | | 4,249,350 | |
6.75%, 11/15/20 (a) | | | | | | | 8,830 | | | | 9,050,750 | |
Ally Financial, Inc., 8.00%, 11/01/31 | | | | | | | 3,711 | | | | 4,462,477 | |
American Airlines Pass-Through Trust: | | | | | | | | | | | | |
Series 2013-1, Class C, 6.13%, 7/15/18 (a) | | | | | | | 12,304 | | | | 12,703,880 | |
Series 2013-2, Class C, 6.00%, 1/15/17 (a) | | | | | | | 33,510 | | | | 34,850,400 | |
See Notes to Financial Statements.
| | | | | | |
| 18 | | BLACKROCK FUNDS | | JANUARY 31, 2014 | | |
| | | | |
| Schedule of Investments (continued) | | | BlackRock Global Long/Short Credit Fund | |
| | | (Percentages shown are based on Net Assets) | |
| | | | | | | | | | | | |
| Corporate Bonds | | Par (000) | | | Value | |
United States (continued) | | | | | | | | | | | | |
American Capital Ltd., 6.50%, 9/15/18 (a) | | | USD | | | | 13,100 | | | $ | 13,656,750 | |
American Tower Corp.: | | | | | | | | | | | | |
3.40%, 2/15/19 | | | | | | | 2,320 | | | | 2,397,335 | |
5.90%, 11/01/21 | | | | | | | 3,300 | | | | 3,709,870 | |
3.50%, 1/31/23 | | | | | | | 5,910 | | | | 5,596,268 | |
5.00%, 2/15/24 | | | | | | | 20,118 | | | | 21,178,420 | |
Amphenol Corp., 2.55%, 1/30/19 | | | | | | | 5,060 | | | | 5,086,393 | |
Anadarko Petroleum Corp.: | | | | | �� | | | | | | | |
6.45%, 9/15/36 | | | | | | | 4,021 | | | | 4,699,894 | |
0.00%, 10/10/36 (f) | | | | | | | 91,630 | | | | 32,299,575 | |
APX Group, Inc., 8.75%, 12/01/20 (a) | | | | | | | 2,685 | | | | 2,725,275 | |
Bank of America Corp.: | | | | | | | | | | | | |
4.13%, 1/22/24 | | | | | | | 10,000 | | | | 10,097,020 | |
5.00%, 1/21/44 | | | | | | | 15,000 | | | | 15,106,620 | |
Barrick North America Finance LLC, 4.40%, 5/30/21 | | | | | | | 1,735 | | | | 1,710,812 | |
BlueLine Rental Finance Corp., 7.00%, 2/01/19 (a) | | | | | | | 1,150 | | | | 1,188,813 | |
BMC Software Finance, Inc., 8.13%, 7/15/21 (a) | | | | | | | 3,390 | | | | 3,500,175 | |
Brand Energy & Infrastructure Services, Inc., 8.50%, 12/01/21 (a) | | | | | | | 2,189 | | | | 2,221,835 | |
Brocade Communications Systems, Inc., 4.63%, 1/15/23 (a) | | | | | | | 2,100 | | | | 1,942,500 | |
CA, Inc., 2.88%, 8/15/18 | | | | | | | 2,590 | | | | 2,638,381 | |
CBS Outdoor Americas Capital LLC/CBS Outdoor Americas Capital Corp.: | | | | | | | | | | | | |
5.25%, 2/15/22 (a) | | | | | | | 700 | | | | 703,500 | |
5.63%, 2/15/24 (a) | | | | | | | 600 | | | | 604,500 | |
Ceridian Corp., 8.88%, 7/15/19 (a) | | | | | | | 1,742 | | | | 1,979,347 | |
Ceridian HCM Holding, Inc., 11.00%, 3/15/21 (a) | | | | | | | 863 | | | | 980,584 | |
CHS/Community Health Systems, Inc.: | | | | | | | | | | | | |
5.13%, 8/01/21 (a) | | | | | | | 2,095 | | | | 2,108,094 | |
6.88%, 2/01/22 (a) | | | | | | | 3,498 | | | | 3,585,450 | |
CNH Capital LLC: | | | | | | | | | | | | |
3.25%, 2/01/17 | | | | | | | 6,700 | | | | 6,792,125 | |
3.63%, 4/15/18 | | | | | | | 2,500 | | | | 2,528,125 | |
Continental Airlines Pass-Through Certificates: | | | | | | | | | | | | |
Series 2012-2, Class A, 4.00%, 4/29/26 | | | | | | | 2,800 | | | | 2,835,000 | |
Series 2012-2, Class B, 5.50%, 4/29/22 | | | | | | | 1,000 | | | | 1,035,000 | |
Series 2012-3, Class C, 6.13%, 4/29/18 | | | | | | | 4,500 | | | | 4,702,500 | |
COX Communications, Inc., 4.50%, 6/30/43 (a) | | | | | | | 10,000 | | | | 8,649,040 | |
Delphi Corp., 5.00%, 2/15/23 | | | | | | | 2,850 | | | | 2,892,750 | |
DIRECTV Holdings LLC/DIRECTV Financing Co., Inc., 3.80%, 3/15/22 | | | | | | | 8,010 | | | | 7,820,604 | |
Edwards Lifesciences Corp., 2.88%, 10/15/18 | | | | | | | 4,040 | | | | 4,087,502 | |
Endo Finance Co., 5.75%, 1/15/22 (a) | | | | | | | 5,571 | | | | 5,557,073 | |
Energy Transfer Partners LP: | | | | | | | | | | | | |
4.15%, 10/01/20 | | | | | | | 2,990 | | | | 3,072,742 | |
4.90%, 2/01/24 | | | | | | | 14,230 | | | | 14,601,133 | |
6.50%, 2/01/42 | | | | | | | 500 | | | | 547,508 | |
Enterprise Products Operating LLC, 4.85%, 3/15/44 | | | | | | | 775 | | | | 763,601 | |
FedEx Corp., 4.00%, 1/15/24 | | | | | | | 5,000 | | | | 5,083,785 | |
Fidelity National Information Services, Inc., | | | | | | | | | | | | |
5.00%, 3/15/22 | | | | | | | 3,875 | | | | 3,999,570 | |
FirstEnergy Solutions Corp., 6.05%, 8/15/21 | | | | | | | 4,000 | | | | 4,430,936 | |
Ford Motor Credit Co. LLC, 2.38%, 1/16/18 | | | | | | | 6,330 | | | | 6,405,992 | |
Forest Laboratories, Inc.: | | | | | | | | | | | | |
4.38%, 2/01/19 (a) | | | | | | | 2,836 | | | | 2,846,635 | |
5.00%, 12/15/21 (a) | | | | | | | 4,003 | | | | 3,982,985 | |
General Motors Co.: | | | | | | | | | | | | |
4.88%, 10/02/23 (a) | | | | | | | 2,755 | | | | 2,789,437 | |
6.25%, 10/02/43 (a) | | | | | | | 8,010 | | | | 8,470,575 | |
| | | | | | | | | | | | |
| Corporate Bonds | | Par (000) | | | Value | |
United States (continued) | | | | | | | | | | | | |
General Motors Financial Co., Inc.: | | | | | | | | | | | | |
2.75%, 5/15/16 (a) | | | USD | | | | 798 | | | $ | 805,980 | |
3.25%, 5/15/18 (a) | | | | | | | 6,000 | | | | 6,045,000 | |
Genworth Holdings, Inc.: | | | | | | | | | | | | |
7.20%, 2/15/21 | | | | | | | 14,408 | | | | 16,849,205 | |
4.80%, 2/15/24 | | | | | | | 7,750 | | | | 7,740,413 | |
GLP Capital LP/GLP Financing II, Inc.: | | | | | | | | | | | | |
4.38%, 11/01/18 (a) | | | | | | | 1,943 | | | | 1,991,575 | |
4.88%, 11/01/20 (a) | | | | | | | 2,436 | | | | 2,466,450 | |
The Goldman Sachs Group, Inc.: | | | | | | | | | | | | |
2.63%, 1/31/19 | | | | | | | 15,610 | | | | 15,623,284 | |
1.84%, 11/29/23 (b) | | | | | | | 20,000 | | | | 20,252,700 | |
4.25%, 1/29/26 | | | | | | | 17,573 | | | | 28,950,982 | |
HD Supply, Inc.: | | | | | | | | | | | | |
8.13%, 4/15/19 | | | | | | | 1,663 | | | | 1,849,048 | |
11.00%, 4/15/20 | | | | | | | 4,000 | | | | 4,750,000 | |
7.50%, 7/15/20 | | | | | | | 3,049 | | | | 3,254,807 | |
Hewlett-Packard Co., 2.75%, 1/14/19 | | | | | | | 17,569 | | | | 17,693,037 | |
Hospira, Inc.: | | | | | | | | | | | | |
5.20%, 8/12/20 | | | | | | | 7,720 | | | | 8,207,503 | |
5.80%, 8/12/23 | | | | | | | 7,000 | | | | 7,510,020 | |
Hyundai Capital America, 1.88%, 8/09/16 (a) | | | | | | | 2,670 | | | | 2,689,774 | |
Icahn Enterprises LP/Icahn Enterprises Finance Corp.: | | | | | | | | | | | | |
3.50%, 3/15/17 (a) | | | | | | | 2,176 | | | | 2,178,720 | |
4.88%, 3/15/19 (a) | | | | | | | 5,589 | | | | 5,568,041 | |
6.00%, 8/01/20 (a) | | | | | | | 5,994 | | | | 6,211,283 | |
5.88%, 2/01/22 (a) | | | | | | | 3,336 | | | | 3,306,810 | |
Jabil Circuit, Inc., 5.63%, 12/15/20 | | | | | | | 5,430 | | | | 5,647,200 | |
Kinder Morgan Energy Partners LP, 2.65%, 11/15/23 | | | | | | | 1,230 | | | | 1,227,907 | |
Laboratory Corp of America Holdings, 2.50%, 11/01/18 | | | | | | | 4,290 | | | | 4,302,012 | |
Laredo Petroleum, Inc., 5.63%, 1/15/22 (a) | | | | | | | 1,452 | | | | 1,444,740 | |
Level 3 Communications, Inc., 8.88%, 6/01/19 | | | | | | | 920 | | | | 1,007,400 | |
Level 3 Financing, Inc.: | | | | | | | | | | | | |
8.13%, 7/01/19 | | | | | | | 5,070 | | | | 5,564,325 | |
6.13%, 1/15/21 (a) | | | | | | | 9,328 | | | | 9,537,880 | |
LifePoint Hospitals, Inc., 5.50%, 12/01/21 (a) | | | | | | | 2,847 | | | | 2,896,823 | |
Maxim Integrated Products, Inc., 2.50%, 11/15/18 | | | | | | | 4,390 | | | | 4,422,174 | |
Meccanica Holdings USA, Inc.: | �� | | | | | | | | | | | |
6.25%, 7/15/19 (a) | | | | | | | 2,205 | | | | 2,320,231 | |
7.38%, 7/15/39 (a) | | | | | | | 6,550 | | | | 6,332,409 | |
6.25%, 1/15/40 (a) | | | | | | | 9,890 | | | | 8,621,113 | |
Michaels Stores, Inc., 5.88%, 12/15/20 (a) | | | | | | | 3,495 | | | | 3,495,000 | |
Morgan Stanley: | | | | | | | | | | | | |
5.63%, 9/23/19 | | | | | | | 5,000 | | | | 5,712,555 | |
5.00%, 11/24/25 | | | | | | | 20,000 | | | | 20,291,300 | |
Norfolk Southern Corp., 4.80%, 8/15/43 | | | | | | | 2,230 | | | | 2,253,034 | |
Nuance Communications, Inc., 5.38%, 8/15/20 (a) | | | | | | | 3,734 | | | | 3,649,985 | |
Oracle Corp., 2.38%, 1/15/19 | | | | | | | 3,500 | | | | 3,565,349 | |
PSEG Power LLC, 4.30%, 11/15/23 | | | | | | | 6,165 | | | | 6,295,155 | |
Realogy Group LLC, 7.88%, 2/15/19 (a) | | | | | | | 4,032 | | | | 4,394,880 | |
Realogy Group LLC/The Sunshine Group Florida Ltd., 3.38%, 5/01/16 (a) | | | | | | | 3,580 | | | | 3,606,850 | |
Rockwood Specialties Group, Inc., 4.63%, 10/15/20 | | | | | | | 2,500 | | | | 2,537,500 | |
Sabine Pass Liquefaction LLC: | | | | | | | | | | | | |
5.63%, 2/01/21 (a) | | | | | | | 2,135 | | | | 2,129,663 | |
6.25%, 3/15/22 (a) | | | | | | | 4,018 | | | | 4,028,045 | |
Sabine Pass LNG LP, 7.50%, 11/30/16 | | | | | | | 2,755 | | | | 3,071,825 | |
SABMiller Holdings, Inc., 2.20%, 8/01/18 (a) | | | | | | | 2,670 | | | | 2,696,641 | |
See Notes to Financial Statements.
| | | | | | |
| | | BLACKROCK FUNDS | | JANUARY 31, 2014 | | 19 |
| | | | |
| Schedule of Investments (continued) | | | BlackRock Global Long/Short Credit Fund | |
| | | (Percentages shown are based on Net Assets) | |
| | | | | | | | | | | | |
| Corporate Bonds | | Par (000) | | | Value | |
United States (concluded) | | | | | | | | | | | | |
Salix Pharmaceuticals Ltd., 6.00%, 1/15/21 (a) | | | USD | | | | 1,799 | | | $ | 1,875,457 | |
Sprint Communications, Inc., 9.00%, 11/15/18 (a) | | | | | | | 3,559 | | | | 4,297,493 | |
Sprint Corp.: | | | | | | | | | | | | |
7.88%, 9/15/23 (a) | | | | | | | 13,460 | | | | 14,368,550 | |
7.13%, 6/15/24 (a) | | | | | | | 4,055 | | | | 4,075,275 | |
Tenet Healthcare Corp.: | | | | | | | | | | | | |
6.00%, 10/01/20 (a) | | | | | | | 4,927 | | | | 5,185,667 | |
8.13%, 4/01/22 | | | | | | | 11,115 | | | | 12,129,244 | |
TIBCO Software, Inc., 2.25%, 5/01/32 | | | | | | | 3,890 | | | | 3,882,706 | |
Time Warner Cable, Inc.: | | | | | | | | | | | | |
8.25%, 4/01/19 | | | | | | | 7,250 | | | | 8,573,248 | |
6.55%, 5/01/37 | | | | | | | 390 | | | | 374,510 | |
7.30%, 7/01/38 | | | | | | | 5,000 | | | | 5,183,345 | |
6.75%, 6/15/39 | | | | | | | 19,610 | | | | 19,088,394 | |
4.50%, 9/15/42 | | | | | | | 7,905 | | | | 6,050,969 | |
Time Warner Entertainment Co. LP, 8.38%, 7/15/33 | | | | | | | 1,270 | | | | 1,465,338 | |
T-Mobile USA, Inc.: | | | | | | | | | | | | |
6.63%, 4/28/21 | | | | | | | 4,100 | | | | 4,315,250 | |
6.13%, 1/15/22 | | | | | | | 1,255 | | | | 1,283,237 | |
6.73%, 4/28/22 | | | | | | | 3,935 | | | | 4,131,750 | |
6.50%, 1/15/24 | | | | | | | 2,310 | | | | 2,359,087 | |
Total System Services, Inc., 2.38%, 6/01/18 | | | | | | | 2,250 | | | | 2,239,727 | |
TRW Automotive, Inc., 4.45%, 12/01/23 (a) | | | | | | | 3,750 | | | | 3,637,500 | |
U.S. Airways Pass-Through Trust: | | | | | | | | | | | | |
Series 2012-1, Class B, 8.00%, 4/01/21 | | | | | | | 958 | | | | 1,080,504 | |
Series 2012-2, Class B, 6.75%, 12/03/22 | | | | | | | 2,988 | | | | 3,204,939 | |
Series 2012-2, Class C, 5.45%, 6/03/18 | | | | | | | 12,800 | | | | 12,832,000 | |
Series 2013-1, Class B, 5.38%, 5/15/23 | | | | | | | 7,000 | | | | 6,860,000 | |
United Airlines Pass-Through Trust, 4.30%, 2/15/27 | | | | | | | 5,950 | | | | 6,069,000 | |
United Continental Holdings, Inc., 6.00%, 12/01/20 | | | | | | | 5,280 | | | | 5,306,400 | |
Verizon Communications, Inc.: | | | | | | | | | | | | |
5.15%, 9/15/23 | | | | | | | 17,582 | | | | 19,114,570 | |
3.85%, 11/01/42 | | | | | | | 4,500 | | | | 3,778,947 | |
6.55%, 9/15/43 | | | | | | | 36,999 | | | | 44,411,380 | |
Whiting Petroleum Corp., 5.00%, 3/15/19 | | | | | | | 5,196 | | | | 5,338,890 | |
The Williams Cos., Inc., 3.70%, 1/15/23 | | | | | | | 2,070 | | | | 1,861,698 | |
Williams Partners LP, 4.50%, 11/15/23 | | | | | | | 6,780 | | | | 6,872,981 | |
Wise Metals Group LLC/Wise Alloys Finance Corp., 8.75%, 12/15/18 (a) | | | | | | | 6,189 | | | | 6,560,340 | |
WM Wrigley Jr. Co., 2.90%, 10/21/19 (a) | | | | | | | 3,860 | | | | 3,892,632 | |
Zayo Group LLC/Zayo Capital, Inc., 8.13%, 1/01/20 | | | | | | | 1,217 | | | | 1,344,785 | |
| | | | | | | | | | | | |
| | | | | | | | | | | | 834,704,563 | |
Total Corporate Bonds — 52.5% | | | | | | | | | | | 2,580,518,308 | |
| | | | | | | | | | | | |
| | | | | | | | | | |
| | | | | | | | | | | | |
| Floating Rate Loan Interests | | Par (000) | | | Value | |
Australia — 0.0% | | | | | | | | | | | | |
FMG Resources LTD (FMG America Finance, Inc.), Loan, 4.25%, 6/28/19 | | | USD | | | | 701 | | | $ | 707,872 | |
Cayman Islands — 0.0% | | | | | | | | | | | | |
Offshore Group Investment Limited (Vantage Delaware Holdings, LLC), Term Loan,
5.00%, 10/25/17 | | | | | | | 463 | | | | 464,669 | |
Denmark — 0.9% | | | | | | | | | | | | |
Deutsche Raststatten Gruppe IV GmbH: | | | | | | | | | | | | |
Term A Loan, 3.50%, 12/10/18 | | | EUR | | | | 14,100 | | | | 19,043,225 | |
Term B Loan, 3.75%, 12/10/19 | | | | | | | 15,100 | | | | 20,529,646 | |
Faenza Germany GmbH Holdings (Ceramtec Acquisition): | | | | | | | | | | | | |
Dollar Term B-3 Loan, 4.25%, 8/28/20 | | | USD | | | | 432 | | | | 435,853 | |
Initial Dollar Term B-1 Loan, 4.25%, 8/28/20 | | | | | | | 1,419 | | | | 1,432,950 | |
Initial Dollar Term B-2 Loan, 4.25%, 8/28/20 | | | | | | | 140 | | | | 141,097 | |
| | | | | | | | | | | | |
| | | | | | | | | | | | 41,582,771 | |
Luxembourg — 0.1% | | | | | | | | | | | | |
AWAS Finance Luxembourg 2012 SA, Term Loan, 3.50%, 7/16/18 | | | | | | | 1,626 | | | | 1,631,180 | |
Fly Funding II S.à r.l., Loan, 4.50%, 8/09/19 | | | | | | | 425 | | | | 429,781 | |
Intelsat Jackson Holdings S.A., Tranche B-2 Term Loan, 3.75%, 6/30/19 | | | | | | | 1,196 | | | | 1,204,393 | |
Mirror Bidco Corp. (Dematic), Term Loan, 4.25%, 12/28/19 | | | | | | | 866 | | | | 870,581 | |
Oxea Finance & Cy SCA (Oxea Finance LLC): | | | | | | | | | | | | |
Term Loan (Second Lien), 8.25%, 7/15/20 | | | | | | | 320 | | | | 327,002 | |
Tranche B-2 Term Loan (First Lien), 4.25%, 1/15/20 | | | | | | | 2,643 | | | | 2,658,257 | |
| | | | | | | | | | | | |
| | | | | | | | | | | | 7,121,194 | |
Netherlands — 0.0% | | | | | | | | | | | | |
Tronox Pigments (Netherlands) BV, New Term Loan, 4.50%, 3/19/20 | | | | | | | 617 | | | | 623,532 | |
United Kingdom — 0.0% | | | | | | | | | | | | |
Virgin Media Investment Holdings Ltd., Term B Facility Loan, 3.50%, 6/08/20 | | | | | | | 515 | | | | 516,030 | |
United States — 4.1% | | | | | | | | | | | | |
Accudyne Industries Borrower SCA/Accudyne Industries LLC (FKA Silver II U.S. Holdings LLC), Refinancing Term Loan, 4.00%, 12/13/19 | | | | | | | 975 | | | | 978,731 | |
Activision Blizzard, Inc., Term Loan, 3.25%, 10/12/20 | | | | | | | 3,107 | | | | 3,127,938 | |
ADS Waste Holdings, Inc., Tranche B Term Loan, 4.25%, 10/09/19 | | | | | | | 1,440 | | | | 1,444,498 | |
Alcatel-Lucent USA, Inc., US Term Loan, 5.75%, 1/30/19 | | | | | | | 9,872 | | | | 9,956,124 | |
Alliance Laundry Systems LLC, Initial Term Loan (First Lien), 4.25%, 12/10/18 | | | | | | | 256 | | | | 257,420 | |
Alliant Holdings I LLC, Initial Term Loan, 4.25%, 12/20/19 | | | | | | | 460 | | | | 464,953 | |
American Builders & Contractors Supply Co., Inc., Term B Loan, 3.50%, 4/16/20 | | | | | | | 1,312 | | | | 1,316,474 | |
American Capital Ltd. (FKA American Capital Strategies Ltd.), Senior Secured Term Loan, 4.00%, 8/22/16 | | | | | | | 217 | | | | 218,336 | |
American Renal Holdings, Inc., Term B Loan (First Lien), 4.50%, 8/20/19 | | | | | | | 1,002 | | | | 1,002,425 | |
See Notes to Financial Statements.
| | | | | | |
| 20 | | BLACKROCK FUNDS | | JANUARY 31, 2014 | | |
| | | | |
| Schedule of Investments (continued) | | | BlackRock Global Long/Short Credit Fund | |
| | | (Percentages shown are based on Net Assets) | |
| | | | | | | | | | | | |
| Floating Rate Loan Interests | | Par (000) | | | Value | |
United States (continued) | | | | | | | | | | | | |
Ameriforge Group, Inc., Initial Term Loan (First Lien), 5.00%, 12/19/19 | | | USD | | | | 203 | | | $ | 203,884 | |
Apex Tool Group LLC, Term Loan, 4.50%, 1/31/20 | | | | | | | 988 | | | | 991,547 | |
ARDAGH HOLDINGS USA, INC., Term B-2 Loan, 4.00%, 12/17/19 | | | | | | | 4,250 | | | | 4,260,625 | |
Ardagh Holdings USA, Inc. (Ardagh Packaging Finance S.A.), Dollar Term Loan, 4.25%, 12/17/19 | | | | | | | 490 | | | | 491,534 | |
Arysta LifeScience SPC LLC, Initial Term Loan (First Lien), 4.50%, 5/29/20 | | | | | | | 1,721 | | | | 1,729,957 | |
Ascend Performance Materials Operations LLC, Term B Loan, 6.75%, 4/10/18 | | | | | | | 197 | | | | 188,640 | |
Asurion, LLC (FKA Asurion Corp.), Incremental Tranche B-1 Term Loan, 4.50%, 5/24/19 | | | | | | | 733 | | | | 732,146 | |
Axalta Coating Systems Dutch Holding B BV & Axalta Coating Systems U.S. Holdings, Inc. (FKA Flash Dutch 2 BV), Initial Term B Loan, 4.75%, 2/01/20 | | | | | | | 1,206 | | | | 1,215,836 | |
Bally Technologies, Inc., Term Loan (First Lien), 4.25%, 11/25/20 | | | | | | | 3,257 | | | | 3,280,254 | |
Berry Plastics Corp., Term E Loan, 3.75%, 1/06/21 | | | | | | | 2,325 | | | | 2,320,838 | |
Biomet, Inc., Dollar Term B-2 Loan, 3.75%, 7/25/17 | | | | | | | 1,821 | | | | 1,831,211 | |
BJ’s Wholesale Club, Inc., New 2013 (November) Replacement Loan (First Lien), 4.50%, 9/26/19 | | | | | | | 1,416 | | | | 1,428,656 | |
BMC Software Finance, Inc., Initial US Term Loan, 5.00%, 9/10/20 | | | | | | | 2,870 | | | | 2,865,523 | |
Boyd Gaming Corp., Term B Loan, 4.00%, 8/14/20 | | | | | | | 2,953 | | | | 2,961,015 | |
Brand Energy & Infrastructure Services, Inc. (FKA FR Brand Acquisition Corp.), Initial Term Loan, 4.75%, 11/26/20 | | | | | | | 4,615 | | | | 4,631,609 | |
Bright Horizons Family Solutions LLC (FKA Bright Horizons Family Solutions, Inc.), Term B Loan, 4.00%, 1/30/20 | | | | | | | 2,619 | | | | 2,630,593 | |
Caesars Entertainment Resort Properties LLC, Term B Loan, 7.00%, 10/11/20 | | | | | | | 20,895 | | | | 21,127,561 | |
Capsugel Holdings US, Inc., Initial Term Loan, 3.50%, 8/01/18 | | | | | | | 1,905 | | | | 1,907,693 | |
CCC Information Services, Inc. (FKA CCC Holdings, Inc.), Term Loan, 4.00%, 12/20/19 | | | | | | | 465 | | | | 466,319 | |
Ceridian Corp., 2013 New Replacement US Term Loan, 4.41%, 5/09/17 | | | | | | | 2,239 | | | | 2,247,872 | |
CHG Healthcare Services, Inc. (FKA CHG Buyer Corp.), Term Loan (First Lien), 4.25%, 11/19/19 | | | | | | | 710 | | | | 715,532 | |
CHS/Community Health Systems, Inc., Term D Loan, 4.25%, 1/27/21 | | | | | | | 7,115 | | | | 7,188,854 | |
Continental Building Products LLC, First Lien Term Loan, 4.75%, 8/28/20 | | | | | | | 2,494 | | | | 2,487,516 | |
CPG International, Inc., Term Loan, 4.75%, 9/30/20 | | | | | | | 2,748 | | | | 2,763,007 | |
DaVita Health Care Partners, Inc. (FKA DaVita, Inc.), Tranche B-2 Term Loan, 4.00%, 11/01/19 | | | | | | | 936 | | | | 941,584 | |
DJO Finance LLC (ReAble Therapeutics Finance LLC), Tranche B-3 Term Loan, 4.75%, 9/15/17 | | | | | | | 177 | | | | 178,102 | |
Dynegy, Inc., Tranche B-2 Term Loan, 4.00%, 4/23/20 | | | | | | | 1,179 | | | | 1,184,239 | |
EFS Cogen Holdings I LLC, Term B Advance, 3.75%, 12/17/20 | | | | | | | 1,785 | | | | 1,795,407 | |
| | | | | | | | | | | | |
| Floating Rate Loan Interests | | Par (000) | | | Value | |
United States (continued) | | | | | | | | | | | | |
Evergreen Acquisition Co. 1 LP, New Term Loan, 5.00%, 7/09/19 | | | USD | | | | 988 | | | $ | 993,672 | |
Federal-Mogul Corp.: | | | | | | | | | | | | |
Tranche B Term Loan, 2.11%, 12/29/14 | | | | | | | 855 | | | | 848,522 | |
Tranche C Term Loan, 2.11%, 12/28/15 | | | | | | | 315 | | | | 313,030 | |
First Data Corp.: | | | | | | | | | | | | |
2018B New Term Loan, 4.16%, 9/24/18 | | | | | | | 705 | | | | 704,415 | |
Term Loan, 4.11%, 3/24/21 | | | | | | | 855 | | | | 852,863 | |
Freescale Semiconductor, Inc.: | | | | | | | | | | | | |
Tranche B-4 Term Loan, 5.00%, 2/28/20 | | | | | | | 1,047 | | | | 1,054,941 | |
Tranche B-5 Term Loan, 5.00%, 1/15/21 | | | | | | | 1,212 | | | | 1,226,458 | |
Gardner Denver, Inc., Initial Dollar Term Loan, 4.25%, 7/30/20 | | | | | | | 8,914 | | | | 8,899,651 | |
Generac Power Systems, Inc., Term B Loan, 3.50%, 5/29/20 | | | | | | | 1,343 | | | | 1,345,171 | |
HD Supply, Inc., Term Loan, 4.50%, 10/12/17 | | | | | | | 1,418 | | | | 1,423,042 | |
Hilton Worldwide Finance LLC, Initial Term Loan, 3.75%, 10/26/20 | | | | | | | 12,282 | | | | 12,352,995 | |
INEOS U.S. Finance LLC, Cash Dollar Term Loan, 4.00%, 5/04/18 | | | | | | | 508 | | | | 510,174 | |
Infor US, Inc. (FKA Lawson Software, Inc.), Tranche B-5 Term Loan, 3.75%, 6/03/20 | | | | | | | 2,925 | | | | 2,931,698 | |
Interactive Data Corp., Refinanced Term Loan, 3.75%, 2/11/18 | | | | | | | 496 | | | | 497,877 | |
iStar Financial, Inc., Loan, 4.50%, 10/15/17 | | | | | | | 227 | | | | 227,910 | |
J.C. Penney Corp., Inc., Loan, 6.00%, 5/22/18 | | | | | | | 1,085 | | | | 1,050,886 | |
Kasima LLC (Digital Cinema Implementation Partners LLC), Term Loan, 3.25%, 5/17/21 | | | | | | | 3,210 | | | | 3,208,652 | |
KCG Holdings, Inc., Term Loan, 5.75%, 12/05/17 | | | | | | | 78 | | | | 78,420 | |
Kinetic Concepts, Inc., Dollar Term E-1 Loan, 4.00%, 5/04/18 | | | | | | | 738 | | | | 743,309 | |
La Frontera Generation LLC, Term Loan, 4.50%, 9/30/20 | | | | | | | 2,695 | | | | 2,719,383 | |
Las Vegas Sands LLC, Term B Loan, 3.25%, 12/19/20 | | | | | | | 5,400 | | | | 5,411,448 | |
Level 3 Financing, Inc., Tranche B 2020 Term Loan, 4.00%, 1/15/20 | | | | | | | 405 | | | | 407,446 | |
MacDermid, Inc., Tranche B Term Loan (First Lien), 4.00%, 6/07/20 | | | | | | | 1,144 | | | | 1,151,882 | |
Media General, Inc., Term B Loan, 4.00%, 7/31/20 | | | | | | | 1,150 | | | | 1,159,108 | |
MGM Resorts International (MGM Grand Detroit LLC), Term B Loan, 3.50%, 12/20/19 | | | | | | | 842 | | | | 841,323 | |
Michaels Stores, Inc., Term B Loan, 3.75%, 1/28/20 | | | | | | | 1,320 | | | | 1,325,345 | |
The Neiman Marcus Group, Inc., Term Loan, 5.00%, 10/25/20 | | | | | | | 3,257 | | | | 3,292,728 | |
NEP/NCP Holdco, Inc., Refinanced New Term Loan (First Lien), 4.75%, 1/22/20 | | | | | | | 178 | | | | 178,645 | |
Northwest Airlines, Inc.: | | | | | | | | | | | | |
Term B757-200 Loan, 1.62%, 9/10/18 | | | | | | | 462 | | | | 407,421 | |
Term B757-200 Loan, 1.62%, 9/10/18 | | | | | | | 458 | | | | 404,479 | |
Term B757-300 Loan, 2.24%, 3/10/17 | | | | | | | 526 | | | | 485,030 | |
Term B757-300 Loan, 2.24%, 3/10/17 | | | | | | | 524 | | | | 483,595 | |
Term B757-300 Loan, 1.62%, 3/10/17 | | | | | | | 455 | | | | 401,537 | |
Ocwen Loan Servicing, Initial Term Loan, 5.00%, 2/15/18 | | | | | | | 203 | | | | 205,157 | |
Offshore Group Investment Ltd. (Vantage Drilling Co.), Second Term Loan, 5.75%, 3/28/19 | | | | | | | 1,260 | | | | 1,278,853 | |
Onex Carestream Finance LP: | | | | | | | | | | | | |
Term Loan (First Lien 2013), 5.00%, 6/07/19 | | | | | | | 1,404 | | | | 1,423,038 | |
Term Loan (Second Lien), 9.50%, 12/07/19 | | | | | | | 1,000 | | | | 1,017,500 | |
OSI Restaurant Partners LLC, 2013 Replacement Term Loan, 3.50%, 10/28/19 | | | | | | | 935 | | | | 936,870 | |
See Notes to Financial Statements.
| | | | | | |
| | | BLACKROCK FUNDS | | JANUARY 31, 2014 | | 21 |
| | | | |
| Schedule of Investments (continued) | | | BlackRock Global Long/Short Credit Fund | |
| | | (Percentages shown are based on Net Assets) | |
| | | | | | | | | | | | |
| Floating Rate Loan Interests | | Par (000) | | | Value | |
United States (concluded) | | | | | | | | | | | | |
Par Pharmaceutical Companies, Inc. (Par Pharmaceutical, Inc.), Additional Term B-1 Loan, 4.25%, 9/30/19 | | | USD | | | | 2,293 | | | $ | 2,298,431 | |
Party City Holdings, Inc., 2013 Replacement Term Loan, 4.25%, 7/27/19 | | | | | | | 5,418 | | | | 5,446,406 | |
PetCo Animal Supplies, Inc., New Loans, 4.00%, 11/24/17 | | | | | | | 198 | | | | 199,196 | |
Pinnacle Entertainment, Inc., Tranche B-2 Term Loan, 3.75%, 8/13/20 | | | | | | | 1,493 | | | | 1,499,216 | |
Pinnacle Foods Finance LLC, Tranche H Term Loan, 3.25%, 4/29/20 | | | | | | | 1,367 | | | | 1,368,283 | |
PVH Corp. (FKA Phillips-Van Heusen Corp.), Tranche B Term Loan, 3.25%, 2/13/20 | | | | | | | 775 | | | | 778,808 | |
Quikrete Holdings, Inc., Initial Loan (First Lien), 4.00%, 9/26/20 | | | | | | | 1,122 | | | | 1,130,368 | |
Realogy Corp., Extended Synthetic Commitment, 4.40%, 10/10/16 | | | | | | | 13 | | | | 13,282 | |
Rexnord LLC/RBS Global, Inc., Term B Loan, 4.00%, 8/21/20 | | | | | | | 2,396 | | | | 2,406,980 | |
Rite Aid Corp., Tranche 1 Term Loan (Second Lien), 5.75%, 8/21/20 | | | | | | | 360 | | | | 367,470 | |
ROC Finance LLC, Funded Term B Loan, 5.00%, 6/20/19 | | | | | | | 409 | | | | 399,008 | |
Sequa Corp., Initial Term Loan, 5.25%, 6/19/17 | | | | | | | 1,521 | | | | 1,503,058 | |
The ServiceMaster Co., Tranche C Term Loan, 4.25%, 1/31/17 | | | | | | | 1,554 | | | | 1,549,761 | |
Spin Holdco, Inc., Initial Term Loan (First Lien), 4.25%, 11/14/19 | | | | | | | 4,411 | | | | 4,447,517 | |
SunGard Data Systems, Inc. (Solar Capital Corp.), Tranche D Term Loan, 4.50%, 1/31/20 | | | | | | | 574 | | | | 575,779 | |
SUPERVALU, Inc., New Term Loan, 5.00%, 3/21/19 | | | | | | | 772 | | | | 775,975 | |
Syniverse Holdings, Inc., Tranche B Term Loan, 4.00%, 4/23/19 | | | | | | | 970 | | | | 974,127 | |
Toys ’R’ Us-Delaware, Inc., Term B-3 Loan, 5.25%, 5/25/18 | | | | | | | 180 | | | | 146,774 | |
Trans Union LLC, 2013 Replacement Term Loan, 4.25%, 2/08/19 | | | | | | | 1,137 | | | | 1,149,618 | |
Travelport LLC (FKA Travelport, Inc.), Term Loan, 6.25%, 6/26/19 | | | | | | | 4,020 | | | | 4,108,557 | |
Tribune Co., Initial Term Loan, 4.00%, 12/27/20 | | | | | | | 350 | | | | 349,051 | |
TriNet HR Corp., Tranche B-2 Term Loan, 5.00%, 8/20/20 | | | | | | | 499 | | | | 502,491 | |
tw telecom holdings, inc. (FKA Time Warner Telecom Holdings, Inc.), Term B Loan, 2.66%, 4/17/20 | | | | | | | 1,154 | | | | 1,154,200 | |
TWCC Holding Corp., Term Loan (Second Lien), 7.00%, 6/26/20 | | | | | | | 1,170 | | | | 1,178,775 | |
U.S. Foods, Inc. (AKA U.S. Foodservice, Inc.), Incremental Term Loan, 4.50%, 3/31/19 | | | | | | | 2,423 | | | | 2,444,025 | |
Univision Communications, Inc., Replacement First-Lien Term Loan, 4.00%, 3/01/20 | | | | | | | 1,491 | | | | 1,498,718 | |
Walter Energy, Inc. (FKA Walter Industries, Inc.), B Term Loan, 6.75%, 4/02/18 | | | | | | | 123 | | | | 118,689 | |
WESCO Distribution, Inc., Tranche B-1 Loan, 3.75%, 12/12/19 | | | | | | | 142 | | | | 143,079 | |
Wilsonart LLC, Initial Term Loan, 4.00%, 10/31/19 | | | | | | | 2,618 | | | | 2,619,039 | |
WTG Holdings III Corp., Term Loan (First Lien), 4.75%, 1/15/21 | | | | | | | 1,920 | | | | 1,933,594 | |
| | | | | | | | | | | | |
| | | | | | | | | | | | 199,409,202 | |
Total Floating Rate Loan Interests — 5.1% | | | | 250,425,270 | |
| | | | | | | | | | | | |
| | | | | | | | | | |
| | | | | | | | | | | | |
| Foreign Agency Obligations | | Par (000) | | | Value | |
Spain — 0.4% | | | | | | | | | | | | |
Autonomous Community of Catalonia, 2.13%, 10/01/14 | | | CHF | | | | 2,400 | | | $ | 2,643,772 | |
Autonomous Community of Madrid Spain, 3.00%, 7/29/14 | | | | | | | 180 | | | | 200,379 | |
Autonomous Community of Valencia Spain: | | | | | | | | | | | | |
4.75%, 3/20/14 | | | EUR | | | | 1,711 | | | | 2,311,563 | |
3.25%, 7/06/15 | | | | | | | 2,080 | | | | 2,825,793 | |
4.38%, 7/16/15 | | | | | | | 4,085 | | | | 5,638,650 | |
4.00%, 11/02/16 | | | | | | | 5,500 | | | | 7,566,255 | |
Total Foreign Agency Obligations — 0.4% | | | | | | | | | | | 21,186,412 | |
| | | | | | | | | | | | |
| Foreign Government Obligations | | | | | | | | | |
Italy — 0.2% | | | | | | | | | | | | |
Buoni Poliennali Del Tesoro, 5.50%, 11/01/22 | | | | | | | 4,910 | | | | 7,601,113 | |
Portugal — 0.2% | | | | | | | | | | | | |
Republic of Portugal, 3.50%, 3/25/15 | | | USD | | | | 11,800 | | | | 11,986,169 | |
Spain — 0.8% | | | | | | | | | | | | |
Kingdom of Spain, 5.40%, 1/31/23 | | | EUR | | | | 25,337 | | | | 38,929,004 | |
Total Foreign Government Obligations — 1.2% | | | | | | | | 58,516,286 | |
| | | | | | | | | | | | |
| Non-Agency Mortgage-Backed Securities | | | | | | | | | |
Collateralized Mortgage Obligations — 0.5% | | | | | | | | | | | | |
United Kingdom — 0.5% | | | | | | | | | | | | |
Gemgarto, Series 2012-1, Class A1, 3.46%, 5/14/45 (b) | | | GBP | | | | 330 | | | | 564,059 | |
Granite Master Issuer PLC: | | | | | | | | | | | | |
Series 2006-2, Class A5, 0.43%, 12/20/54 (b) | | | EUR | | | | 4,116 | | | | 5,506,154 | |
Series 2007-2, Class 3A2, 0.42%, 12/17/54 (b) | | | | | | | 4,488 | | | | 6,003,999 | |
Lanark Master Issuer PLC, Series 2012-2X, Class 2A, 2.15%, 12/22/54 (b) | | | GBP | | | | 890 | | | | 1,514,149 | |
Paragon Mortgages No. 13 PLC, Series 2006-13X, Class A2C, 0.42%, 1/15/39 (b) | | | USD | | | | 6,490 | | | | 5,837,342 | |
Residential Mortgage Securities PLC, Series 2012-26, Class A1, 2.76%, 2/14/41 (b) | | | GBP | | | | 1,072 | | | | 1,833,234 | |
Silk Road Finance Number Three PLC, Series 2012-1, Class A, 1.86%, 6/21/55 (b) | | | | | | | 603 | | | | 1,005,187 | |
| | | | | | | | | | | | |
| | | | | | | | | | | | 22,264,124 | |
Commercial Mortgage-Backed Securities — 0.1% | | | | | |
Ireland — 0.1% | | | | | | | | | | | | |
German Residential Funding PLC, Series 2013-1, Class E, 4.37%, 8/27/24 | | | EUR | | | | 3,773 | | | | 5,257,484 | |
Total Non-Agency Mortgage-Backed Securities — 0.6% | | | | 27,521,608 | |
| | | | | | | | | | | | |
| | | | | | | | | | |
See Notes to Financial Statements.
| | | | | | |
| 22 | | BLACKROCK FUNDS | | JANUARY 31, 2014 | | |
| | | | |
| Schedule of Investments (continued) | | | BlackRock Global Long/Short Credit Fund | |
| | | (Percentages shown are based on Net Assets) | |
| | | | | | | | | | | | |
| Preferred Securities | | Par (000) | | | Value | |
Capital Trusts | | | | | | | | | | | | |
Austria — 0.1% | | | | | | | | | | | | |
Vienna Insurance Group AG Wiener Versicherung Gruppe, 5.75%, 10/09/43 (b) | | | EUR | | | | 4,700 | | | $ | 6,782,656 | |
France — 1.0% | | | | | | | | | | | | |
Credit Agricole SA, 7.88% (a)(b)(g) | | | USD | | | | 7,820 | | | | 7,937,300 | |
Electricite de France: | | | | | | | | | | | | |
5.00% (b)(g) | | | EUR | | | | 7,700 | | | | 10,369,998 | |
5.88% (b)(g) | | | GBP | | | | 7,300 | | | | 11,836,056 | |
Societe Generale SA: | | | | | | | | | | | | |
7.88% (a)(b)(g) | | | USD | | | | 10,242 | | | | 10,395,630 | |
8.25% (b)(g) | | | | | | | 3,820 | | | | 4,070,210 | |
Solvay Finance SA, 4.20% (b)(g) | | | EUR | | | | 3,060 | | | | 4,168,319 | |
| | | | | | | | | | | | |
| | | | | | | | | | | | 48,777,513 | |
Italy — 0.7% | | | | | | | | | | | | |
Enel SpA: | | | | | | | | | | | | |
8.75%, 9/24/73 (a)(b) | | | USD | | | | 11,375 | | | | 12,341,875 | |
5.00%, 1/15/75 (b) | | | EUR | | | | 5,685 | | | | 7,564,282 | |
6.63%, 9/15/76 (b) | | | GBP | | | | 8,015 | | | | 13,267,423 | |
| | | | | | | | | | | | |
| | | | | | | | | | | | 33,173,580 | |
Jersey — 0.1% | | | | | | | | | | | | |
HBOS Capital Funding LP, 6.85% (g) | | | USD | | | | 4,341 | | | | 4,330,147 | |
Spain — 0.6% | | | | | | | | | | | | |
Banco Bilbao Vizcaya Argentaria SA,
9.00% (b)(g) | | | USD | | | | 11,600 | | | | 12,122,000 | |
Banco Popular Espanol SA, 11.50% (b)(g) | | | EUR | | | | 11,000 | | | | 16,171,016 | |
| | | | | | | | | | | | |
| | | | | | | | | | | | 28,293,016 | |
Switzerland — 0.5% | | | | | | | | | | | | |
Credit Suisse Group AG: | | | | | | | | | | | | |
7.50% (a)(b)(g) | | | USD | | | | 15,349 | | | | 16,154,823 | |
7.50% (b)(g) | | | | | | | 10,484 | | | | 11,034,410 | |
| | | | | | | | | | | | |
| | | | | | | | | | | | 27,189,233 | |
United Kingdom — 0.9% | | | | | | | | | | | | |
Barclays Bank PLC: | | | | | | | | | | | | |
4.75% (b)(g) | | | EUR | | | | 3,140 | | | | 3,739,880 | |
8.00% (b)(g) | | | | | | | 13,254 | | | | 18,255,644 | |
8.25% (b)(g) | | | | | | | 22,715 | | | | 23,396,450 | |
| | | | | | | | | | | | |
| | | | | | | | | | | | 45,391,974 | |
United States — 1.3% | | | | | | | | | | | | |
Bank of America Corp., 5.20% (b)(g) | | | USD | | | | 19,150 | | | | 17,148,825 | |
DCP Midstream LLC, 5.85%, 5/21/43 (a)(b) | | | | | | | 1,750 | | | | 1,618,750 | |
ING U.S., Inc., 5.65%, 5/15/53 (b) | | | | | | | 1,090 | | | | 1,046,400 | |
JPMorgan Chase & Co.: | | | | | | | | | | | | |
5.15% (b)(g) | | | | | | | 12,300 | | | | 11,177,625 | |
6.00% (b)(g) | | | | | | | 7,000 | | | | 6,737,500 | |
6.75% (b)(g) | | | | | | | 9,741 | | | | 9,872,503 | |
NBCUniversal Enterprise, Inc., 5.25% (a)(g) | | | | | | | 4,000 | | | | 4,020,000 | |
Royal Bank of Scotland Capital Trust, 6.80% (g) | | | | | | | 470 | | | | 455,900 | |
State Street Capital Trust IV, 1.24%, 6/15/37 (b) | | | | | | | 13,540 | | | | 10,303,940 | |
| | | | | | | | | | | | |
| | | | | | | | | | | | 62,381,443 | |
Total Capital Trusts — 5.2% | | | | | | | | | | | 256,319,562 | |
| | | | | | | | | | | | |
| | | | | | | | | | |
| | | | | | | | | | | | |
| Preferred Securities | | Shares | | | Value | |
Preferred Stocks | | | | | | | | | | | | |
United Kingdom — 0.0% | | | | | | | | | | | | |
Royal Bank of Scotland Group PLC, 6.13% (g) | | | | | | | 19,117 | | | $ | 409,486 | |
Royal Bank of Scotland Group PLC, 6.60% (g) | | | | | | | 95,580 | | | | 2,156,285 | |
| | | | | | | | | | | | |
| | | | | | | | | | | | 2,565,771 | |
United States — 0.9% | | | | | | | | | | | | |
Citigroup, Inc., 6.88% (g) | | | | | | | 302,000 | | | | 7,761,400 | |
Crown Castle International Corp., 4.50%, 11/01/16 | | | | | | | 60,643 | | | | 5,948,472 | |
The Goldman Sachs Group, Inc., 5.63% (g) | | | | | | | 90,000 | | | | 2,080,800 | |
RBS Capital Funding Trust V, 5.90% (g) | | | | | | | 72,103 | | | | 1,511,279 | |
RBS Capital Funding Trust VII, Series G, 6.08% (g) | | | | | | | 72,101 | | | | 1,550,171 | |
Stanley Black & Decker, Inc., 6.25%, 11/16/17 | | | | | | | 21,108 | | | | 2,147,739 | |
United Technologies Corp., 7.50%, 8/01/15 | | | | | | | 105,050 | | | | 6,768,371 | |
Wells Fargo & Co., 5.85% (g) | | | | | | | 650,000 | | | | 15,697,500 | |
| | | | | | | | | | | | |
| | | | | | | | | | | | 43,465,732 | |
Total Preferred Stocks — 0.9% | | | | | | | | | | | 46,031,503 | |
Total Preferred Securities — 6.1% | | | | | | | | | | | 302,351,065 | |
| | | | | | | | | | | | |
| U.S. Treasury Obligations | | | | | Par
(000) | | | | |
U.S. Treasury Bonds, 3.63%, 8/15/43 | | | USD | | | | 1,740 | | | | 1,740,271 | |
U.S. Treasury Notes, 2.75%, 11/15/23 | | | | | | | 1 | | | | 503,495 | |
Total U.S. Treasury Obligations — 0.0% | | | | | | | | | | | 2,243,766 | |
Total Long-Term Investments (Cost — $3,374,807,984) — 70.7% | | | | | | | | | | | 3,479,217,775 | |
| | | | | | | | | | | | |
| Short-Term Securities | | | | | | | | | |
Borrowed Bond Agreements — 17.4% | | | | | | | | | | | | |
Barclays Bank PLC, (0.18)%, Open
(Purchased on 10/01/13 to be repurchased at EUR 354,888, collateralized by Republic of Portugal, 4.75% due at 6/14/19, original par and fair value of EUR 380,000 and $529,513, respectively) | | | EUR | | | | 359 | | | | 483,668 | |
Barclays Bank PLC, (0.18)%, Open
(Purchased on 9/04/13 to be repurchased at EUR 9,660,115, collateralized by Republic of Portugal, 4.75% due at 6/14/19, original par and fair value of EUR 9,735,000 and $13,565,268, respectively) | | | | | | | 9,763 | | | | 13,167,199 | |
Barclays Bank PLC, (0.11)%, Open
(Purchased on 9/04/13 to be repurchased at EUR 6,222,730, collateralized by Kingdom of Spain, 4.10% due at 7/30/18, original par and fair value of EUR 5,890,000 and $8,602,045, respectively) | | | | | | | 6,257 | | | | 8,438,676 | |
Barclays Bank PLC, (0.09)%, Open
(Purchased on 9/05/13 to be repurchased at EUR 20,555,493, collateralized by Kingdom of Spain, 4.60% due at 7/30/19, original par and fair value of EUR 20,000,000 and $29,986,756, respectively) | | | | | | | 20,667 | | | | 27,873,189 | |
See Notes to Financial Statements.
| | | | | | |
| | | BLACKROCK FUNDS | | JANUARY 31, 2014 | | 23 |
| | | | |
| Schedule of Investments (continued) | | | BlackRock Global Long/Short Credit Fund | |
| | | (Percentages shown are based on Net Assets) | |
| | | | | | | | | | | | |
| Short-Term Securities | | Par (000) | | | Value | |
Borrowed Bond Agreements (continued) | | | | | | | | | | | | |
Barclays Bank PLC, (0.06)%, Open
(Purchased on 11/19/13 to be repurchased at EUR 30,781,477, collateralized by Kingdom of Spain, 4.10% due at 7/30/18, original par and fair value of EUR 28,830,000 and $42,104,747, respectively) | | | EUR | | | | 30,870 | | | $ | 41,634,040 | |
Barclays Bank PLC, (0.05)%, Open
(Purchased on 11/25/13 to be repurchased at EUR 15,539,699, collateralized by Buoni Poliennali Del Tesoro, 3.75% due at 8/01/21, original par and fair value of EUR 14,745,000 and $20,730,103, respectively) | | | | | | | 15,600 | | | | 21,040,497 | |
Barclays Bank PLC, (0.04)%, Open
(Purchased on 9/11/13 to be repurchased at EUR 12,676,429, collateralized by Buoni Poliennali Del Tesoro, 3.75% due at 3/01/21, original par and fair value of EUR 12,520,000 and $17,652,415, respectively) | | | | | | | 12,715 | | | | 17,148,693 | |
Barclays Bank PLC, (0.02)%, Open
(Purchased on 9/05/13 to be repurchased at EUR 11,187,060, collateralized by Buoni Poliennali Del Tesoro, 3.75% due at 3/01/21, original par and fair value of EUR 11,000,000 and $15,509,310, respectively) | | | | | | | 11,204 | | | | 15,111,003 | |
Barclays Bank PLC, 0.00%, Open
(Purchased on 11/26/13 to be repurchased at EUR 6,136,598, collateralized by Buoni Poliennali Del Tesoro, 4.50% due at 5/01/23, original par and fair value of EUR 5,716,000 and $8,242,003, respectively) | | | | | | | 6,137 | | | | 8,276,483 | |
Barclays Bank PLC, 0.00%, Open
(Purchased on 12/17/13 to be repurchased at EUR 1,375,210, collateralized by Kingdom of Spain, 5.50% due at 4/30/21, original par and fair value of EUR 1,167,000 and $1,813,025, respectively) | | | | | | | 1,375 | | | | 1,854,758 | |
Barclays Bank PLC, 0.00%, Open
(Purchased on 9/11/13 to be repurchased at EUR 12,541,033, collateralized by Kingdom of Spain, 3.75% due at 10/31/18, original par and fair value of EUR 12,270,000 and $17,686,540, respectively) | | | | | | | 12,541 | | | | 16,914,199 | |
Barclays Bank PLC, 0.05%, Open
(Purchased on 1/22/14 to be repurchased at EUR 2,962,475, collateralized by Kingdom of Spain, 4.10% due at 7/30/18, original par and fair value of EUR 2,680,000 and $3,914,004, respectively) | | | | | | | 2,956 | | | | 3,986,408 | |
Barclays Bank PLC, 0.05%, Open
(Purchased on 1/22/14 to be repurchased at EUR 3,679,428, collateralized by Buoni Poliennali Del Tesoro, 4.50% due at 3/01/26, original par and fair value of EUR 3,250,000 and $4,631,398, respectively) | | | | | | | 3,657 | | | | 4,932,225 | |
Barclays Bank PLC, 0.05%, Open
(Purchased on 1/22/14 to be repurchased at EUR 4,586,973, collateralized by Kingdom of Spain, 4.10% due at 7/30/18, original par and fair value of EUR 3,990,000 and $5,827,193, respectively) | | | | | | | 4,577 | | | | 6,172,388 | |
Barclays Capital, Inc., (1.00)%, Open
(Purchased on 7/19/13 to be repurchased at $4,514,706, collateralized by National Australia Bank Ltd., 2.30% due at 7/25/18, original par and fair value of USD 4,750,000 and $4,809,850, respectively) | | | USD | | | | 4,756 | | | | 4,755,937 | |
| | | | | | | | | | | | |
| Short-Term Securities | | Par (000) | | | Value | |
Borrowed Bond Agreements (continued) | | | | | | | | | | | | |
Barclays Capital, Inc., (0.75)%, Open
(Purchased on 1/14/14 to be repurchased at $19,359,167, collateralized by General Electric Capital Corp., 1.63% due at 4/02/18, original par and fair value of USD 20,000,000 and $19,910,640, respectively) | | | USD | | | | 20,000 | | | $ | 20,000,000 | |
Barclays Capital, Inc., (0.10)%, Open
(Purchased on 12/02/13 to be repurchased at $6,329,196, collateralized by U.S. Treasury Notes, 2.63% due at 12/01/22, original par and fair value of USD 7,000,000 and $6,370,518, respectively) | | | | | | | 6,388 | | | | 6,387,500 | |
Barclays Capital, Inc., (0.10)%, Open
(Purchased on 12/02/13 to be repurchased at $9,301,429, collateralized by U.S. Treasury Bonds, 4.30% due at 12/15/42, original par and fair value of USD 11,000,000 and $9,492,857, respectively) | | | | | | | 9,584 | | | | 9,583,750 | |
Barclays Capital, Inc., 0.00%, 2/03/14
(Purchased on 1/31/14 to be repurchased at $87,296,040, collateralized by U.S. Treasury Notes, 2.75% due at 11/15/23, original par and fair value of USD 86,112,000 and $86,852,261, respectively) | | | | | | | 87,296 | | | | 87,296,040 | |
Citigroup Global Markets, Inc., (0.50)%, Open
(Purchased on 7/19/13 to be repurchased at $5,123,250, collateralized by National Australia Bank Ltd., 2.30% due at 7/25/18, original par and fair value of USD 5,250,000 and $5,316,150, respectively) | | | | | | | 5,257 | | | | 5,256,563 | |
Citigroup Global Markets, Inc., (0.10)%, Open
(Purchased on 11/06/13 to be repurchased at $4,925,872, collateralized by International Business Machines Corp., 3.38% due at 8/01/23, original par and fair value of USD 5,000,000 and $4,963,555, respectively) | | | | | | | 4,975 | | | | 4,975,000 | |
Citigroup Global Markets, Inc., (0.10)%, Open
(Purchased on 12/11/13 to be repurchased at $4,570,233, collateralized by Freeport-McMoRan Copper & Gold, Inc., 3.88% due at 3/15/23, original par and fair value of USD 4,850,000 and $4,644,282, respectively) | | | | | | | 4,614 | | | | 4,613,563 | |
Citigroup Global Markets, Inc., (0.10)%, Open
(Purchased on 12/16/13 to be repurchased at $4,235,872, collateralized by CCO Holdings LLC/CCO Holdings Capital Corp., 5.25% due at 9/30/22, original par and fair value of USD 4,565,000 and $4,388,106, respectively) | | | | | | | 4,274 | | | | 4,273,981 | |
Citigroup Global Markets, Inc., (0.10)%, Open
(Purchased on 12/18/13 to be repurchased at $5,029,722, collateralized by CCO Holdings LLC/CCO Holdings Capital Corp., 5.25% due at 9/30/22, original par and fair value of USD 5,435,000 and $5,224,394, respectively) | | | | | | | 5,075 | | | | 5,074,931 | |
Citigroup Global Markets, Inc., (0.10)%, Open
(Purchased on 8/12/13 to be repurchased at $1,963,485, collateralized by Intel Corp., 4.25% due at 12/15/42, original par and fair value of USD 2,230,000 and $2,057,657, respectively) | | | | | | | 2,024 | | | | 2,023,725 | |
Citigroup Global Markets, Inc., (0.10)%, Open
(Purchased on 8/12/13 to be repurchased at $6,411,888, collateralized by DIRECTV Holdings LLC/DIRECTV Financing Co., Inc., 1.75% due at 1/15/18, original par and fair value of USD 6,640,000 and $6,585,632, respectively) | | | | | | | 6,441 | | | | 6,440,800 | |
See Notes to Financial Statements.
| | | | | | |
| 24 | | BLACKROCK FUNDS | | JANUARY 31, 2014 | | |
| | | | |
| Schedule of Investments (continued) | | | BlackRock Global Long/Short Credit Fund | |
| | | (Percentages shown are based on Net Assets) | |
| | | | | | | | | | | | |
| Short-Term Securities | | Par (000) | | | Value | |
Borrowed Bond Agreements (continued) | | | | | |
Citigroup Global Markets, Inc., (0.05)%, Open
(Purchased on 9/13/13 to be repurchased at $2,276,761, collateralized by Intel Corp., 2.70% due at 12/15/22, original par and fair value of USD 2,500,000 and $2,365,960, respectively) | | | USD | | | | 2,288 | | | $ | 2,287,500 | |
Citigroup Global Markets, Inc., (0.05)%, Open
(Purchased on 9/24/13 to be repurchased at $2,784,741, collateralized by Texas Instruments, Inc., 1.00% due at 5/01/18, original par and fair value of USD 2,900,000 and $2,831,676, respectively) | | | | | | | 2,791 | | | | 2,791,250 | |
Credit Suisse Securities (USA) LLC, (0.25)%, Open
(Purchased on 11/01/13 to be repurchased at $4,538,013, collateralized by Microsoft Corp., 2.38% due at 5/01/23, original par and fair value of USD 5,000,000 and $4,647,135, respectively) | | | | | | | 4,650 | | | | 4,650,000 | |
Credit Suisse Securities (USA) LLC, (0.15)%, Open
(Purchased on 9/30/13 to be repurchased at $4,768,744, collateralized by Ford Motor Co., 4.75% due at 1/15/43, original par and fair value of USD 5,500,000 and $5,120,649, respectively) | | | | | | | 4,991 | | | | 4,991,250 | |
Credit Suisse Securities (USA) LLC, (0.15)%, Open
(Purchased on 9/30/13 to be repurchased at $6,972,657, collateralized by Ford Motor Co., 4.38% due at 8/06/23, original par and fair value of USD 7,000,000 and $7,108,465, respectively) | | | | | | | 7,079 | | | | 7,078,750 | |
Credit Suisse Securities (USA) LLC, (0.09)%, Open
(Purchased on 1/06/14 to be repurchased at $264,196,884, collateralized by U.S. Treasury Notes, 2.75% due at 11/15/23, original par and fair value of USD 271,000,000 and $273,329,651, respectively) | | | | | | | 266,596 | | | | 266,596,250 | |
Credit Suisse Securities (USA) LLC, (0.06)%, Open
(Purchased on 1/23/14 to be repurchased at $8,144,991, collateralized by U.S. Treasury Notes, 0.75% due at 1/15/17, original par and fair value of USD 8,170,000 and $8,186,593, respectively) | | | | | | | 8,160 | | | | 8,159,787 | |
Deutsche Bank Securities, Inc., (0.10)%, Open
(Purchased on 9/04/13 to be repurchased at $9,850,803, collateralized by Westpac Banking Corp., 2.25% due at 7/30/18, original par and fair value of USD 10,000,000 and $10,159,900, respectively) | | | | | | | 9,900 | | | | 9,900,000 | |
Merrill Lynch, Pierce, Fenner & Smith, Inc., (0.80)%, Open
(Purchased on 1/30/14 to be repurchased at $85,389,346, collateralized by U.S. Treasury Notes, 1.50% due at 12/31/18, original par and fair value of USD 88,939,000 and $88,994,587, respectively) | | | | | | | 88,939 | | | | 88,939,000 | |
Merrill Lynch, Pierce, Fenner & Smith, Inc., (0.45)%, 2/03/14
(Purchased on 1/31/14 to be repurchased at $15,170,499, collateralized by U.S. Treasury Notes, 1.50% due at 12/31/18, original par and fair value of USD 15,480,000 and $15,489,675, respectively) | | | | | | | 15,519 | | | | 15,518,700 | |
| | | | | | | | | | | | |
| Short-Term Securities | | Par (000) | | | Value | |
Borrowed Bond Agreements (concluded) | | | | | |
Merrill Lynch, Pierce, Fenner & Smith, Inc., (0.03)%, Open
(Purchased on 1/06/14 to be repurchased at $8,772,704, collateralized by U.S. Treasury Notes, 0.25% due at 12/31/15, original par and fair value of USD 8,800,000 and $8,790,030, respectively) | | | USD | | | | 8,778 | | | $ | 8,778,000 | |
Merrill Lynch, Pierce, Fenner & Smith, Inc., (0.01)%, Open
(Purchased on 1/14/14 to be repurchased at $34,029,445, collateralized by U.S. Treasury Notes, 2.38% due at 12/31/20, original par and fair value of USD 33,800,000 and $34,357,159, respectively) | | | | | | | 34,054 | | | | 34,053,500 | |
Merrill Lynch, Pierce, Fenner & Smith, Inc., 0.01%, Open
(Purchased on 1/23/14 to be repurchased at $54,647,367, collateralized by U.S. Treasury Bonds, 3.75% due at 11/15/43, original par and fair value of USD 54,010,000 and $55,267,407, respectively) | | | | | | | 54,483 | | | | 54,482,587 | |
| | | | | | | | | | | | |
| | | | | | | | | | | | 855,941,790 | |
| | | | | | Shares | | | | |
Money Market Funds — 29.1% | | | | | | | | | | | | |
BlackRock Liquidity Funds, TempFund, Institutional Class, 0.03% (h)(i) | | | | | | | 1,429,570,075 | | | | 1,429,570,075 | |
Total Short-Term Securities (Cost — $2,284,060,701) — 46.5% | | | | | | | | | | | 2,285,511,865 | |
| | | | | | | | | | | | |
| Options Purchased | | | | | | | | | |
(Cost — $3,345,094) — 0.1% | | | | | | | | | | | 3,597,370 | |
Total Investments Before Options Written, Borrowed Bonds and Securities Sold Short (Cost — $5,662,213,779) — 117.3% | | | | 5,768,327,010 | |
| | | | | | | | | | | | |
| Options Written | | | | | | | | | |
(Premiums Received — $470,149) — (0.0)% | | | | (1,344,895 | ) |
| | | | | | | | | | | | |
| Borrowed Bonds | | Par (000) | | | | |
Corporate Bonds — (1.8)% | | | | | | | | | | | | |
CCO Holdings LLC/CCO Holdings Capital Corp., 5.25%, 9/30/22 | | | USD | | | | 10,000 | | | | (9,612,500 | ) |
DIRECTV Holdings LLC/DIRECTV Financing Co., Inc., 1.75%, 1/15/18 | | | | | | | 6,640 | | | | (6,585,632 | ) |
Ford Motor Co.: | | | | | | | | | | | | |
4.38%, 8/06/23 | | | | | | | 7,000 | | | | (7,108,465 | ) |
4.75%, 1/15/43 | | | | | | | 5,500 | | | | (5,120,649 | ) |
Freeport-McMoRan Copper & Gold, Inc., 3.88%, 3/15/23 | | | | | | | 4,850 | | | | (4,644,282 | ) |
General Electric Capital Corp., 1.63%, 4/02/18 Intel Corp.: | | | | | | | 20,000 | | | | (19,910,640 | ) |
2.70%, 12/15/22 | | | | | | | 2,500 | | | | (2,365,960 | ) |
4.25%, 12/15/42 | | | | | | | 2,230 | | | | (2,057,657 | ) |
International Business Machines Corp., 3.38%, 8/01/23 | | | | | | | 5,000 | | | | (4,963,555 | ) |
See Notes to Financial Statements.
| | | | | | |
| | | BLACKROCK FUNDS | | JANUARY 31, 2014 | | 25 |
| | |
| Schedule of Investments (continued) | | BlackRock Global Long/Short Credit Fund |
| | |
| | | | | | | | | | | | |
| Borrowed Bonds | | | | | Par
(000) | | | Value | |
Microsoft Corp., 2.38%, 5/01/23 | | | USD | | | | 5,000 | | | $ | (4,647,135 | ) |
National Australia Bank Ltd., 2.30%, 7/25/18 | | | | | | | 10,000 | | | | (10,126,000 | ) |
Texas Instruments, Inc., 1.00%, 5/01/18 | | | | | | | 2,900 | | | | (2,831,676 | ) |
Westpac Banking Corp., 2.25%, 7/30/18 | | | | | | | 10,000 | | | | (10,159,900 | ) |
| | | | | | | | | | | | |
| | | | | | | | | | | | (90,134,051 | ) |
Foreign Government Obligations — (3.9)% | | | | | | | | | | | | |
Buoni Poliennali Del Tesoro: | | | | | | | | | | | | |
3.75%, 3/01/21-8/01/21 | | | EUR | | | | 38,265 | | | | (53,891,828 | ) |
4.50%, 5/01/23-3/01/26 | | | | | | | 8,966 | | | | (12,873,401 | ) |
Kingdom of Spain: | | | | | | | | | | | | |
3.75%, 10/31/18 | | | | | | | 12,270 | | | | (17,686,540 | ) |
4.10%, 7/30/18 | | | | | | | 41,390 | | | | (60,447,989 | ) |
4.60%, 7/30/19 | | | | | | | 20,000 | | | | (29,986,756 | ) |
5.50%, 4/30/21 | | | | | | | 1,167 | | | | (1,813,025 | ) |
Republic of Portugal, 4.75%, 6/14/19 | | | | | | | 10,115 | | | | (14,094,781 | ) |
| | | | | | | | | | | | |
| | | | | | | | | | | | (190,794,320 | ) |
| | | | | | | | | | | | |
| Borrowed Bonds | | | | | Par
(000) | | | Value | |
U.S. Treasury Obligations — (12.0)% | | | | | | | | | | | | |
U.S. Treasury Bonds: | | | | | | | | | | | | |
3.75%, 11/15/43 | | | USD | | | | 54,010 | | | $ | (55,267,407 | ) |
4.30%, 12/15/42 | | | | | | | 11,000 | | | | (9,492,857 | ) |
U.S. Treasury Notes: | | | | | | | | | | | | |
0.25%, 12/31/15 | | | | | | | 8,800 | | | | (8,790,030 | ) |
0.75%, 1/15/17 | | | | | | | 8,170 | | | | (8,186,593 | ) |
1.50%, 12/31/18 | | | | | | | 104,419 | | | | (104,484,262 | ) |
2.38%, 12/31/20 | | | | | | | 33,800 | | | | (34,357,159 | ) |
2.63%, 12/01/22 | | | | | | | 7,000 | | | | (6,370,518 | ) |
2.75%, 11/15/23 | | | | | | | 357,112 | | | | (360,181,912 | ) |
| | | | | | | | | | | | |
| | | | | | | | | | | | (587,130,738 | ) |
Total Borrowed Bonds (Proceeds — $843,057,760) — (17.7)% | | | | | | | | (868,059,109 | ) |
Total Investments Net of Options Written,
Borrowed Bonds and Securities Sold Short — 99.6% | | | | 4,898,923,006 | |
Other Assets Less Liabilities — 0.4% | | | | | | | | | | | 19,857,451 | |
| | | | | | | | | | | | |
Net Assets — 100.0% | | | | | | | | | | $ | 4,918,780,457 | |
| | | | | | | | | | | | |
|
| Notes to Schedule of Investments |
| (a) | Security exempt from registration pursuant to Rule 144A under the Securities Act of 1933, as amended. These securities may be resold in transactions exempt from registration to qualified institutional investors. |
| (b) | Variable rate security. Rate shown is as of report date. |
| (c) | Non-income producing security. |
| (e) | Represents a payment-in-kind security which may pay interest/dividends in additional par/shares and/or in cash. Rates shown are the current rate and possible payment rates. |
| (g) | Security is perpetual in nature and has no stated maturity date. |
| (h) | Investments in issuers considered to be an affiliate of the Fund during the six months ended January 31, 2014, for purposes of Section 2(a)(3) of the Investment Company Act of 1940, as amended, were as follows: |
| | | | | | | | | | | | | | | | | | | | | | | | | | | | |
| Affiliate | | Shares Held at
July 31, 2013 | | | Shares
Purchased | | | Shares
Sold | | | Shares Held at
January 31, 2014 | | | Value at January 31, 2014 | | | Income | | | Realized
Gain (Loss) | |
BlackRock Liquidity Funds, TempFund, | | | | | | | | | | | | | | | | | | | | | | | | | | | | |
Institutional Class | | | 1,153,874,067 | | | | 275,696,008 | 1 | | | — | | | | 1,429,570,075 | | | $ | 1,429,570,075 | | | $ | 320,698 | | | | — | |
iShares Transportation Average ETF | | | — | | | | 16,220 | | | | (16,220 | ) | | | — | | | | — | | | $ | 4,619 | | | $ | 90,840 | |
iShares iBoxx $ High Yield Corporate Bond ETF | | | — | | | | 304,750 | | | | (304,750 | ) | | | — | | | | — | | | | — | | | $ | (61,645 | ) |
| | 1 | Represents net shares purchased. |
| (i) | Represents the current yield as of report date. |
| Ÿ | | Financial futures contracts outstanding as of January 31, 2014 were as follows: |
| | | | | | | | | | | | | | | | | | |
Contracts
Sold | | Issue | | Exchange | | Expiration | | Notional Value | | | Unrealized
Appreciation
(Depreciation) | |
| (150) | | E-Mini NASDAQ 100 Index | | Chicago Mercantile | | March 2014 | | | USD | | | | 10,542,000 | | | $ | 55,916 | |
| (74) | | E-Mini S&P 500 Futures | | Chicago Mercantile | | March 2014 | | | USD | | | | 6,573,050 | | | | 107,762 | |
| (2,486) | | Euro-Bobl | | Eurex | | March 2014 | | | USD | | | | 424,911,700 | | | | (4,624,190 | ) |
| (1,898) | | Euro-Bund | | Eurex | | March 2014 | | | USD | | | | 368,311,066 | | | | (7,575,525 | ) |
| (176) | | Euro-Schatz | | Eurex | | March 2014 | | | USD | | | | 26,264,104 | | | | (36,054 | ) |
| (1,393) | | EURO STOXX 50 Index | | Eurex | | March 2014 | | | USD | | | | 13,705,489 | | | | 609,157 | |
| (699) | | Gilt British | | NYSE Liffe | | March 2014 | | | USD | | | | 126,847,537 | | | | (1,977,776 | ) |
| (165) | | U.S. Treasury Bonds (30 Year) | | Chicago Board of Trade | | March 2014 | | | USD | | | | 22,042,969 | | | | (542,479 | ) |
| (39) | | U.S. Treasury Notes (5 Year) | | Chicago Board of Trade | | March 2014 | | | USD | | | | 4,704,375 | | | | 10,412 | |
| (641) | | U.S. Treasury Notes (10 Year) | | Chicago Board of Trade | | March 2014 | | | USD | | | | 80,605,750 | | | | (789,852 | ) |
(93) | | U.S. Ultra Treasury Bonds | | Chicago Board of Trade | | March 2014 | | | USD | | | | 13,374,563 | | | | (532,991 | ) |
Total | | | | | | | | | | | | | | | | $ | (15,295,620 | ) |
| | | | | | | | | | | | | | | | | | |
See Notes to Financial Statements.
| | | | | | |
| 26 | | BLACKROCK FUNDS | | JANUARY 31, 2014 | | |
| | | | |
| Schedule of Investments (continued) | | | BlackRock Global Long/Short Credit Fund | |
| Ÿ | | Foreign currency exchange contracts as of January 31, 2014 were as follows: |
| | | | | | | | | | | | | | | | | | |
Currency
Purchased | | | | | Currency
Sold | | | | | Counterparty | | Settlement Date | | Unrealized
Appreciation
(Depreciation) | |
USD | | | 7,622,898 | | | EUR | | | 5,603,000 | | | Barclays Bank PLC | | 2/26/14 | | $ | 66,084 | |
USD | | | 5,982,035 | | | AUD | | | 6,600,000 | | | BNP Paribas S.A. | | 3/31/14 | | | 228,397 | |
USD | | | 179,974 | | | AUD | | | 200,000 | | | Deutsche Bank AG | | 3/31/14 | | | 5,621 | |
USD | | | 2,490,703 | | | CHF | | | 2,261,588 | | | Barclays Bank PLC | | 4/22/14 | | | (5,373 | ) |
USD | | | 678,281 | | | EUR | | | 500,000 | | | Bank of America N.A. | | 4/22/14 | | | 3,904 | |
USD | | | 19,179,019 | | | EUR | | | 14,040,000 | | | Credit Suisse International | | 4/22/14 | | | 242,519 | |
USD | | | 4,092,879 | | | EUR | | | 3,000,000 | | | Goldman Sachs Bank USA | | 4/22/14 | | | 46,618 | |
USD | | | 13,658,690 | | | EUR | | | 10,000,000 | | | Goldman Sachs Bank USA | | 4/22/14 | | | 171,155 | |
USD | | | 53,868,965 | | | EUR | | | 39,782,000 | | | Goldman Sachs Bank USA | | 4/22/14 | | | 212,852 | |
USD | | | 1,302,872,914 | | | EUR | | | 958,243,510 | | | Goldman Sachs Bank USA | | 4/22/14 | | | 10,438,585 | |
USD | | | 331,349 | | | GBP | | | 200,000 | | | Citibank N.A. | | 4/22/14 | | | 2,772 | |
USD | | | 20,812,498 | | | GBP | | | 12,560,000 | | | Citibank N.A. | | 4/22/14 | | | 177,852 | |
USD | | | 238,761,111 | | | GBP | | | 145,422,000 | | | JPMorgan Chase Bank N.A. | | 4/22/14 | | | (150,628 | ) |
USD | | | 2,290,082 | | | SEK | | | 14,789,000 | | | Deutsche Bank AG | | 4/22/14 | | | 35,704 | |
Total | | | | | | | | | | | | | | | | $ | 11,476,062 | |
| | | | | | | | | | | | | | | | | | |
| Ÿ | | Exchange-traded options purchased as of January 31, 2014 were as follows: |
| | | | | | | | | | | | | | | | | | | | | | | | |
| Description | | Put/
Call | | | Strike Price | | | Expiration
Date | | | Contracts | | | Market
Value | |
EURO STOXX 50 Index | | | Call | | | | EUR | | | | 3,150 | | | | 2/21/14 | | | | 2,103 | | | $ | 269,452 | |
TWCC Holding Corp. | | | Call | | | | USD | | | | 155 | | | | 7/19/14 | | | | 4,487 | | | | 145,828 | |
Apple, Inc. | | | Put | | | | USD | | | | 470 | | | | 2/22/14 | | | | 175 | | | | 37,275 | |
EMC Corp. | | | Put | | | | USD | | | | 25 | | | | 2/22/14 | | | | 1,000 | | | | 95,000 | |
Total | | | | | | | | | | | | | | | | | | | | | | $ | 547,555 | |
| | | | | | | | | | | | | | | | | | | | | | | | |
| Ÿ | | OTC credit default swaptions purchased as of January 31, 2014 were as follows: |
| | | | | | | | | | | | | | | | | | | | | | | | | | | | | | | | | | |
| Description | | Counterparty | | Put/ Call | | | Strike Price | | | Pay/Receive
Floating
Rate Index | | Floating Rate Index | | Expiration
Date | | | Notional Amount (000) | | | Market Value | |
Bought protection on 5-Year | | JPMorgan Chase | | | | | | | | | | | | | | | | iTraxx Europe Series | | | | | | | | | | | | | | | | |
Credit Default Swaps | | Bank N.A. | | | Put | | | | EUR | | | | 70 | | | Pay | | 20 Version 1 | | | 2/19/14 | | | | EUR | | | | 241,840 | | | $ | 2,033,322 | |
Bought protection on 5-Year | | JPMorgan Chase | | | | | | | | | | | | | | | | iTraxx Europe Series | | | | | | | | | | | | | | | | |
Credit Default Swaps | | Bank N.A. | | | Put | | | | EUR | | | | 70 | | | Pay | | 20 Version 1 | | | 2/19/14 | | | | EUR | | | | 120,900 | | | | 1,016,493 | |
Total | | | | | | | | | | | | | | | | | | | | | | | | | | | | | | | | $ | 3,049,815 | |
| | | | | | | | | | | | | | | | | | | | | | | | | | | | | | | | | | |
| Ÿ | | OTC credit default swaptions written as of January 31, 2014 were as follows: |
| | | | | | | | | | | | | | | | | | | | | | | | | | | | | | | | | | | | |
| Description | | Counterparty | | Put/
Call | | | Strike Price | | | Pay/Receive
Floating
Rate Index | | Floating Rate Index | | Rating1 | | Expiration
Date | | | Notional Amount (000)2 | | | Market Value | |
Sold protection on 5-Year Credit Default Swaps | | JPMorgan Chase Bank N.A. | | | Put | | | | EUR | | | | 80 | | | Receive | | iTraxx Europe Series 20 Version 1 | | A- | | | 2/19/14 | | | | EUR | | | | 120,900 | | | $ | (448,249 | ) |
Sold protection on 5-Year Credit Default Swaps | | JPMorgan Chase Bank N.A. | | | Put | | | | EUR | | | | 80 | | | Receive | | iTraxx Europe Series 20 Version 1 | | A- | | | 2/19/14 | | | | EUR | | | | 241,840 | | | | (896,646 | ) |
Total | | | | | | | | | | | | | | | | | | | | | | | | | | | | | | | | | | $ | (1,344,895 | ) |
| | | | | | | | | | | | | | | | | | | | | | | | | | | | | | | | | | | | |
| | 1 | Using S&P’s rating of the issuer or the underlying securities of the index, as applicable. |
| | 2 | The maximum potential amount the Fund may pay should a negative credit event take place as defined under the terms of the agreement. |
See Notes to Financial Statements.
| | | | | | |
| | | BLACKROCK FUNDS | | JANUARY 31, 2014 | | 27 |
| | | | |
| Schedule of Investments (continued) | | | BlackRock Global Long/Short Credit Fund | |
| Ÿ | | Centrally cleared credit default swaps - buy protection outstanding as of January 31, 2014 were as follows: |
| | | | | | | | | | | | | | | | | | | | |
| Index | | Pay
Fixed Rate | | | Clearinghouse | | Expiration
Date | | Notional
Amount (000) | | | Unrealized
Appreciation
(Depreciation) | |
CDX.NA.HY Series 20 Version 1 | | | 5.00 | % | | Chicago Mercantile | | 6/20/18 | | | USD | | | | 3,249 | | | $ | (83,364 | ) |
CDX.NA.IG Series 21 Version 1 | | | 1.00 | % | | Chicago Mercantile | | 12/20/18 | | | USD | | | | 124,900 | | | | 77,165 | |
iTraxx Europe Crossover Series 20 Version 1 | | | 5.00 | % | | Intercontinental Exchange | | 12/20/18 | | | EUR | | | | 42,190 | | | | 440,300 | |
Total | | | | | | | | | | | | | | | | | | $ | 434,101 | |
| | | | | | | | | | | | | | | | | | | | |
| Ÿ | | Centrally cleared credit default swaps - sold protection outstanding as of January 31, 2014 were as follows: |
| | | | | | | | | | | | | | | | | | | | | | |
| Index | | Receive
Fixed Rate | | | Clearinghouse | | Expiration
Date | | Credit
Rating1 | | Notional Amount (000)2 | | | Unrealized
Appreciation
(Depreciation) | |
CDX.NA.IG Series 20 Version 1 | | | 1.00 | % | | Chicago Mercantile | | 6/20/18 | | BBB+ | | | USD | | | | 53,000 | | | $ | (84,233 | ) |
iTraxx Europe Series 20 Version 1 | | | 1.00 | % | | Intercontinental Exchange | | 12/20/18 | | A- | | | EUR | | | | 226,415 | | | | 2,013,975 | |
Total | | | | | | | | | | | | | | | | | | | | $ | 1,929,742 | |
| | | | | | | | | | | | | | | | | | | | | | |
| | 1 | Using S&P’s rating of the issuer or the underlying securities of the index, as applicable. |
| | 2 | The maximum potential amount the Fund may pay should a negative credit event take place as defined under the terms of the agreement. |
| Ÿ | | OTC credit default swaps - buy protection outstanding as of January 31, 2014 were as follows: |
| | | | | | | | | | | | | | | | | | | | | | | | | | | | |
| Issuer/Index | | Pay
Fixed Rate | | | Counterparty | | Expiration
Date | | Notional
Amount (000) | | | Market
Value | | | Premiums
Paid
(Received) | | | Unrealized
Appreciation
(Depreciation) | |
Republic of Portugal | | | 1.00 | % | | JPMorgan Chase Bank N.A. | | 6/20/15 | | | USD | | | | 8,050 | | | $ | 28,500 | | | $ | 327,007 | | | $ | (298,507 | ) |
Republic of Portugal | | | 1.00 | % | | JPMorgan Chase Bank N.A. | | 6/20/15 | | | USD | | | | 3,750 | | | | 13,277 | | | | 55,515 | | | | (42,238 | ) |
Republic of Portugal | | | 1.00 | % | | Barclays Bank PLC | | 12/20/15 | | | USD | | | | 900 | | | | 9,089 | | | | 52,558 | | | | (43,469 | ) |
Republic of Portugal | | | 1.00 | % | | Deutsche Bank AG | | 12/20/15 | | | USD | | | | 1,100 | | | | 11,109 | | | | 64,237 | | | | (53,128 | ) |
Anadarko Petroleum Corp. | | | 1.00 | % | | Citibank N.A. | | 12/20/16 | | | USD | | | | 32,070 | | | | (447,058 | ) | | | (401,022 | ) | | | (46,036 | ) |
CDX.NA.IG Series 17 Version 1 | | | 1.00 | % | | Credit Suisse International | | 12/20/16 | | | USD | | | | 4,000 | | | | (74,360 | ) | | | 54,111 | | | | (128,471 | ) |
CDX.NA.IG Series 17 Version 1 | | | 1.00 | % | | Morgan Stanley Capital Services LLC | | 12/20/16 | | | USD | | | | 1,000 | | | | (18,590 | ) | | | 614 | | | | (19,204 | ) |
Republic of Ireland | | | 1.00 | % | | Citibank N.A. | | 12/20/16 | | | USD | | | | 500 | | | | (4,736 | ) | | | 67,538 | | | | (72,274 | ) |
Republic of Ireland | | | 1.00 | % | | Citibank N.A. | | 12/20/16 | | | USD | | | | 200 | | | | (1,894 | ) | | | 26,456 | | | | (28,350 | ) |
Jaguar Land Rover Automotive PLC | | | 5.00 | % | | Credit Suisse International | | 3/20/17 | | | EUR | | | | 1,440 | | | | (231,225 | ) | | | (224,375 | ) | | | (6,850 | ) |
Jaguar Land Rover Automotive PLC | | | 5.00 | % | | Credit Suisse International | | 3/20/17 | | | EUR | | | | 1,390 | | | | (223,198 | ) | | | (212,226 | ) | | | (10,972 | ) |
Jaguar Land Rover Automotive PLC | | | 5.00 | % | | Credit Suisse International | | 3/20/17 | | | EUR | | | | 1,390 | | | | (223,198 | ) | | | (212,226 | ) | | | (10,972 | ) |
Republic of Ireland | | | 1.00 | % | | Citibank N.A. | | 3/20/17 | | | USD | | | | 500 | | | | (4,477 | ) | | | 58,918 | | | | (63,395 | ) |
Banco de Sabadell SA | | | 5.00 | % | | BNP Paribas S.A. | | 6/20/17 | | | EUR | | | | 185 | | | | (29,165 | ) | | | 6,107 | | | | (35,272 | ) |
La Caixa | | | 3.00 | % | | BNP Paribas S.A. | | 6/20/17 | | | EUR | | | | 185 | | | | (18,078 | ) | | | (1,751 | ) | | | (16,327 | ) |
La Caixa | | | 3.00 | % | | BNP Paribas S.A. | | 6/20/17 | | | EUR | | | | 140 | | | | (13,682 | ) | | | (1,069 | ) | | | (12,613 | ) |
Republic of Portugal | | | 1.00 | % | | Citibank N.A. | | 6/20/17 | | | USD | | | | 1,000 | | | | 39,085 | | | | 225,778 | | | | (186,693 | ) |
Banco Bilbao Vizcaya Argentaria SA | | | 3.00 | % | | Citibank N.A. | | 9/20/17 | | | EUR | | | | 230 | | | | (20,565 | ) | | | 9,521 | | | | (30,086 | ) |
Banco de Sabadell SA | | | 5.00 | % | | JPMorgan Chase Bank N.A. | | 9/20/17 | | | EUR | | | | 650 | | | | (107,036 | ) | | | 24,158 | | | | (131,194 | ) |
Peugeot SA | | | 5.00 | % | | Barclays Bank PLC | | 9/20/17 | | | EUR | | | | 184 | | | | (23,811 | ) | | | 15,014 | | | | (38,825 | ) |
Peugeot SA | | | 5.00 | % | | Citibank N.A. | | 9/20/17 | | | EUR | | | | 1,070 | | | | (138,467 | ) | | | 94,825 | | | | (233,292 | ) |
Banco Bilbao Vizcaya Argentaria SA | | | 3.00 | % | | BNP Paribas S.A. | | 12/20/17 | | | EUR | | | | 300 | | | | (27,655 | ) | | | 10,840 | | | | (38,495 | ) |
Banco Popular Espanol SA | | | 5.00 | % | | BNP Paribas S.A. | | 12/20/17 | | | EUR | | | | 800 | | | | (134,280 | ) | | | 38,597 | | | | (172,877 | ) |
Clariant AG | | | 1.00 | % | | BNP Paribas S.A. | | 12/20/17 | | | EUR | | | | 1,900 | | | | (30,192 | ) | | | 142,114 | | | | (172,306 | ) |
Clariant AG | | | 1.00 | % | | JPMorgan Chase Bank N.A. | | 12/20/17 | | | EUR | | | | 540 | | | | (8,620 | ) | | | 35,162 | | | | (43,782 | ) |
Deutsche DSM | | | 1.00 | % | | Deutsche Bank AG | | 12/20/17 | | | EUR | | | | 500 | | | | (17,947 | ) | | | (8,424 | ) | | | (9,523 | ) |
Finmeccanica SpA | | | 5.00 | % | | BNP Paribas S.A. | | 12/20/17 | | | EUR | | | | 450 | | | | (65,143 | ) | | | (17,514 | ) | | | (47,629 | ) |
See Notes to Financial Statements.
| | | | | | |
| 28 | | BLACKROCK FUNDS | | JANUARY 31, 2014 | | |
| | | | |
| Schedule of Investments (continued) | | | BlackRock Global Long/Short Credit Fund | |
| Ÿ | | OTC credit default swaps - buy protection outstanding as of January 31, 2014 were as follows: (continued) |
| | | | | | | | | | | | | | | | | | | | | | | | | | | | |
| Issuer/Index | | Pay
Fixed Rate | | | Counterparty | | Expiration
Date | | Notional
Amount (000) | | | Market
Value | | | Premiums
Paid
(Received) | | | Unrealized
Appreciation
(Depreciation) | |
Banco Bilbao Vizcaya Argentaria SA | | | 3.00 | % | | BNP Paribas S.A. | | 3/20/18 | | | EUR | | | | 150 | | | $ | (14,144 | ) | | $ | 468 | | | $ | (14,612 | ) |
Banco de Sabadell SA | | | 5.00 | % | | Barclays Bank PLC | | 3/20/18 | | | EUR | | | | 790 | | | | (140,536 | ) | | | (30,974 | ) | | | (109,562 | ) |
Banco de Sabadell SA | | | 5.00 | % | | JPMorgan Chase Bank N.A. | | 3/20/18 | | | EUR | | | | 780 | | | | (138,756 | ) | | | (38,198 | ) | | | (100,558 | ) |
Deutsche Bank AG | | | 1.00 | % | | Barclays Bank PLC | | 3/20/18 | | | EUR | | | | 3,700 | | | | (50,947 | ) | | | (1,741 | ) | | | (49,206 | ) |
Deutsche Bank AG | | | 1.00 | % | | Citibank N.A. | | 3/20/18 | | | EUR | | | | 1,500 | | | | (20,654 | ) | | | (1,416 | ) | | | (19,238 | ) |
Expedia, Inc. | | | 1.00 | % | | Credit Suisse International | | 3/20/18 | | | USD | | | | 1,000 | | | | (1,877 | ) | | | 37,829 | | | | (39,706 | ) |
Expedia, Inc. | | | 1.00 | % | | Goldman Sachs Bank USA | | 3/20/18 | | | USD | | | | 1,500 | | | | (2,816 | ) | | | 53,959 | | | | (56,775 | ) |
Expedia, Inc. | | | 1.00 | % | | JPMorgan Chase Bank N.A. | | 3/20/18 | | | USD | | | | 1,000 | | | | (1,883 | ) | | | 29,391 | | | | (31,274 | ) |
Koninklijke DSM NV | | | 1.00 | % | | Credit Suisse International | | 3/20/18 | | | EUR | | | | 7,600 | | | | (277,843 | ) | | | (142,771 | ) | | | (135,072 | ) |
Marks & Spencer Group PLC | | | 1.00 | % | | Credit Suisse International | | 3/20/18 | | | EUR | | | | 1,320 | | | | 13,271 | | | | 56,418 | | | | (43,147 | ) |
Republic of Ireland | | | 1.00 | % | | Bank of America N.A. | | 3/20/18 | | | USD | | | | 850 | | | | (3,112 | ) | | | 25,952 | | | | (29,064 | ) |
Republic of Ireland | | | 1.00 | % | | Deutsche Bank AG | | 3/20/18 | | | USD | | | | 1,000 | | | | (3,661 | ) | | | 30,532 | | | | (34,193 | ) |
Republic of Italy | | | 1.00 | % | | Barclays Bank PLC | | 3/20/18 | | | USD | | | | 6,750 | | | | 132,248 | | | | 342,033 | | | | (209,785 | ) |
Apache Corp. | | | 1.00 | % | | Bank of America N.A. | | 6/20/18 | | | USD | | | | 1,250 | | | | (27,186 | ) | | | (5,194 | ) | | | (21,992 | ) |
AXA SA | | | 1.00 | % | | Barclays Bank PLC | | 6/20/18 | | | EUR | | | | 4,870 | | | | (81,521 | ) | | | 116,758 | | | | (198,279 | ) |
AXA SA | | | 1.00 | % | | BNP Paribas S.A. | | 6/20/18 | | | EUR | | | | 1,995 | | | | (33,395 | ) | | | 96,246 | | | | (129,641 | ) |
AXA SA | | | 1.00 | % | | Credit Suisse International | | 6/20/18 | | | EUR | | | | 2,145 | | | | (35,906 | ) | | | 105,587 | | | | (141,493 | ) |
Banco Bilbao Vizcaya Argentaria SA | | | 3.00 | % | | Goldman Sachs International | | 6/20/18 | | | EUR | | | | 1,200 | | | | (114,891 | ) | | | (5,713 | ) | | | (109,178 | ) |
Caterpillar, Inc. | | | 1.00 | % | | JPMorgan Chase Bank N.A. | | 6/20/18 | | | USD | | | | 2,000 | | | | (48,538 | ) | | | (24,279 | ) | | | (24,259 | ) |
Caterpillar, Inc. | | | 1.00 | % | | JPMorgan Chase Bank N.A. | | 6/20/18 | | | USD | | | | 2,000 | | | | (47,825 | ) | | | (20,993 | ) | | | (26,832 | ) |
ConocoPhillips | | | 1.00 | % | | Citibank N.A. | | 6/20/18 | | | USD | | | | 1,250 | | | | (43,965 | ) | | | (33,142 | ) | | | (10,823 | ) |
ConocoPhillips | | | 1.00 | % | | Citibank N.A. | | 6/20/18 | | | USD | | | | 1,250 | | | | (43,965 | ) | | | (32,696 | ) | | | (11,269 | ) |
Credit Agricole SA | | | 3.00 | % | | JPMorgan Chase Bank N.A. | | 6/20/18 | | | EUR | | | | 2,070 | | | | (252,149 | ) | | | (88,066 | ) | | | (164,083 | ) |
Haliburton Co. | | | 1.00 | % | | Barclays Bank PLC | | 6/20/18 | | | USD | | | | 1,250 | | | | (38,754 | ) | | | (23,302 | ) | | | (15,452 | ) |
Haliburton Co. | | | 1.00 | % | | Citibank N.A. | | 6/20/18 | | | USD | | | | 1,250 | | | | (38,754 | ) | | | (24,482 | ) | | | (14,272 | ) |
iTraxx Europe Series 9 3-6% | | | 5.00 | % | | Citibank N.A. | | 6/20/18 | | | EUR | | | | 10,350 | | | | (582,959 | ) | | | 1,254,179 | | | | (1,837,138 | ) |
iTraxx Sub Financials Series 19 Version 1 | | | 1.00 | % | | Citibank N.A. | | 6/20/18 | | | EUR | | | | 3,010 | | | | (19,889 | ) | | | 61,896 | | | | (81,785 | ) |
Occidental Petroleum Corp. | | | 1.00 | % | | Citibank N.A. | | 6/20/18 | | | USD | | | | 1,250 | | | | (28,863 | ) | | | (24,931 | ) | | | (3,932 | ) |
Occidental Petroleum Corp. | | | 1.00 | % | | Citibank N.A. | | 6/20/18 | | | USD | | | | 1,250 | | | | (28,863 | ) | | | (22,310 | ) | | | (6,553 | ) |
Republic of France | | | 0.25 | % | | Barclays Bank PLC | | 6/20/18 | | | USD | | | | 6,590 | | | | 58,008 | | | | 103,736 | | | | (45,728 | ) |
Republic of France | | | 0.25 | % | | Citibank N.A. | | 6/20/18 | | | USD | | | | 7,125 | | | | 62,717 | | | | 127,027 | | | | (64,310 | ) |
Republic of France | | | 0.25 | % | | JPMorgan Chase Bank N.A. | | 6/20/18 | | | USD | | | | 7,135 | | | | 62,805 | | | | 97,665 | | | | (34,860 | ) |
Société Générale SA | | | 3.00 | % | | JPMorgan Chase Bank N.A. | | 6/20/18 | | | EUR | | | | 2,070 | | | | (254,863 | ) | | | (85,894 | ) | | | (168,969 | ) |
Arrow Electronics, Inc. | | | 1.00 | % | | BNP Paribas S.A. | | 9/20/18 | | | USD | | | | 4,920 | | | | (26,500 | ) | | | 30,177 | | | | (56,677 | ) |
Arrow Electronics, Inc. | | | 1.00 | % | | Deutsche Bank AG | | 9/20/18 | | | USD | | | | 5,000 | | | | (29,429 | ) | | | 20,134 | | | | (49,563 | ) |
Arrow Electronics, Inc. | | | 1.00 | % | | JPMorgan Chase Bank N.A. | | 9/20/18 | | | USD | | | | 5,000 | | | | (26,930 | ) | | | 33,275 | | | | (60,205 | ) |
Caterpillar, Inc. | | | 1.00 | % | | BNP Paribas S.A. | | 9/20/18 | | | USD | | | | 2,000 | | | | (46,474 | ) | | | (18,447 | ) | | | (28,027 | ) |
Caterpillar, Inc. | | | 1.00 | % | | Citibank N.A. | | 9/20/18 | | | USD | | | | 2,000 | | | | (47,825 | ) | | | (21,092 | ) | | | (26,733 | ) |
Caterpillar, Inc. | | | 1.00 | % | | Credit Suisse International | | 9/20/18 | | | USD | | | | 5,000 | | | | (116,184 | ) | | | (25,959 | ) | | | (90,225 | ) |
Citigroup, Inc. | | | 1.00 | % | | Goldman Sachs Bank USA | | 9/20/18 | | | USD | | | | 10,000 | | | | (75,534 | ) | | | 40,300 | | | | (115,834 | ) |
The Dow Chemical Co. | | | 1.00 | % | | JPMorgan Chase Bank N.A. | | 9/20/18 | | | USD | | | | 5,000 | | | | (70,892 | ) | | | (21,522 | ) | | | (49,370 | ) |
Firstenergy Corp. | | | 1.00 | % | | Barclays Bank PLC | | 9/20/18 | | | USD | | | | 3,100 | | | | 13,762 | | | | 75,132 | | | | (61,370 | ) |
Firstenergy Corp. | | | 1.00 | % | | Barclays Bank PLC | | 9/20/18 | | | USD | | | | 900 | | | | 3,996 | | | | 31,724 | | | | (27,728 | ) |
HSBC Bank PLC | | | 1.00 | % | | Goldman Sachs Bank USA | | 9/20/18 | | | EUR | | | | 10,000 | | | | (176,318 | ) | | | (10,254 | ) | | | (166,064 | ) |
Monsanto Co. | | | 1.00 | % | | JPMorgan Chase Bank N.A. | | 9/20/18 | | | USD | | | | 5,000 | | | | (164,151 | ) | | | (122,959 | ) | | | (41,192 | ) |
Peugeot SA | | | 5.00 | % | | Barclays Bank PLC | | 9/20/18 | | | EUR | | | | 1,254 | | | | (148,700 | ) | | | 41,688 | | | | (190,388 | ) |
Peugeot SA | | | 5.00 | % | | BNP Paribas S.A. | | 9/20/18 | | | EUR | | | | 10,880 | | | | (1,290,165 | ) | | | 361,687 | | | | (1,651,852 | ) |
Praxair, Inc. | | | 1.00 | % | | JPMorgan Chase Bank N.A. | | 9/20/18 | | | USD | | | | 5,000 | | | | (147,541 | ) | | | (106,926 | ) | | | (40,615 | ) |
Abbott Laboratories | | | 1.00 | % | | JPMorgan Chase Bank N.A. | | 12/20/18 | | | USD | | | | 15,000 | | | | (572,440 | ) | | | (499,743 | ) | | | (72,697 | ) |
See Notes to Financial Statements.
| | | | | | |
| | | BLACKROCK FUNDS | | JANUARY 31, 2014 | | 29 |
| | | | |
| Schedule of Investments (continued) | | | BlackRock Global Long/Short Credit Fund | |
| Ÿ | | OTC credit default swaps — buy protection outstanding as of January 31, 2014 were as follows: (concluded) |
| | | | | | | | | | | | | | | | | | | | | | | | | | | | | | |
| Issuer/Index | | Pay
Fixed Rate | | | Counterparty | | Expiration
Date | | | Notional
Amount (000) | | | Market
Value | | | Premiums
Paid
(Received) | | | Unrealized
Appreciation
(Depreciation) | |
Beazer Homes USA, Inc. | | | 5.00 | % | | JPMorgan Chase Bank N.A. | | | 12/20/18 | | | | USD | | | | 4,500 | | | $ | (301,212 | ) | | $ | (33,058 | ) | | $ | (268,154 | ) |
Boston Scientific Corp. | | | 1.00 | % | | Credit Suisse International | | | 12/20/18 | | | | USD | | | | 15,000 | | | | (270,744 | ) | | | (181,678 | ) | | | (89,066 | ) |
Cardinal Health, Inc. | | | 1.00 | % | | Barclays Bank PLC | | | 12/20/18 | | | | USD | | | | 15,000 | | | | (486,709 | ) | | | (433,719 | ) | | | (52,990 | ) |
Exelon Corp. | | | 1.00 | % | | Barclays Bank PLC | | | 12/20/18 | | | | USD | | | | 1,800 | | | | 37,390 | | | | 38,512 | | | | (1,122 | ) |
Exelon Corp. | | | 1.00 | % | | Deutsche Bank AG | | | 12/20/18 | | | | USD | | | | 10,700 | | | | (130,333 | ) | | | (153,557 | ) | | | 23,224 | |
Exelon Corp. | | | 1.00 | % | | Deutsche Bank AG | | | 12/20/18 | | | | USD | | | | 6,700 | | | | (81,610 | ) | | | (96,543 | ) | | | 14,933 | |
Exelon Corp. | | | 1.00 | % | | Deutsche Bank AG | | | 12/20/18 | | | | USD | | | | 5,300 | | | | (64,557 | ) | | | (79,094 | ) | | | 14,537 | |
Hewlett-Packard Co. | | | 1.00 | % | | JPMorgan Chase Bank N.A. | | | 12/20/18 | | | | USD | | | | 10,000 | | | | 28,116 | | | | 294,421 | | | | (266,305 | ) |
International Business Machines Corp. | | | 1.00 | % | | Goldman Sachs International | | | 12/20/18 | | | | USD | | | | 15,000 | | | | (482,024 | ) | | | (433,719 | ) | | | (48,305 | ) |
iTraxx Sub Financials Series 20 Version 1 | | | 1.00 | % | | Bank of America N.A. | | | 12/20/18 | | | | EUR | | | | 50,000 | | | | (64,245 | ) | | | 320,638 | | | | (384,883 | ) |
iTraxx Sub Financials Series 20 Version 1 | | | 1.00 | % | | Citibank N.A. | | | 12/20/18 | | | | EUR | | | | 38,550 | | | | (49,534 | ) | | | 518,771 | | | | (568,305 | ) |
iTraxx Sub Financials Series 20 Version 1 | | | 1.00 | % | | Deutsche Bank AG | | | 12/20/18 | | | | EUR | | | | 38,115 | | | | (48,975 | ) | | | 514,400 | | | | (563,375 | ) |
iTraxx Sub Financials Series 20 Version 1 | | | 1.00 | % | | Deutsche Bank AG | | | 12/20/18 | | | | EUR | | | | 13,600 | | | | (17,475 | ) | | | (1,139 | ) | | | (16,336 | ) |
iTraxx Sub Financials Series 20 Version 1 | | | 1.00 | % | | Deutsche Bank AG | | | 12/20/18 | | | | EUR | | | | 13,500 | | | | (18,358 | ) | | | 5,292 | | | | (23,650 | ) |
iTraxx Sub Financials Series 20 Version 1 | | | 1.00 | % | | Deutsche Bank AG | | | 12/20/18 | | | | EUR | | | | 13,500 | | | | (18,358 | ) | | | 27,929 | | | | (46,287 | ) |
iTraxx Sub Financials Series 20 Version 1 | | | 1.00 | % | | JPMorgan Chase Bank N.A. | | | 12/20/18 | | | | EUR | | | | 21,000 | | | | (26,983 | ) | | | 25,062 | | | | (52,045 | ) |
Microsoft Corp. | | | 1.00 | % | | Credit Suisse International | | | 12/20/18 | | | | USD | | | | 11,841 | | | | (396,933 | ) | | | (330,647 | ) | | | (66,286 | ) |
Microsoft Corp. | | | 1.00 | % | | Goldman Sachs International | | | 12/20/18 | | | | USD | | | | 3,159 | | | | (105,889 | ) | | | (89,798 | ) | | | (16,091 | ) |
The Western Union Co. | | | 1.00 | % | | Credit Suisse International | | | 12/20/18 | | | | USD | | | | 3,604 | | | | 85,316 | | | | 70,191 | | | | 15,125 | |
The Western Union Co. | | | 1.00 | % | | JPMorgan Chase Bank N.A. | | | 12/20/18 | | | | USD | | | | 8,200 | | | | 194,136 | | | | 118,997 | | | | 75,139 | |
The Western Union Co. | | | 1.00 | % | | JPMorgan Chase Bank N.A. | | | 12/20/18 | | | | USD | | | | 1,800 | | | | 42,616 | | | | 27,340 | | | | 15,276 | |
Hewlett-Packard Co. | | | 1.00 | % | | Deutsche Bank AG | | | 3/20/19 | | | | USD | | | | 1,660 | | | | 11,086 | | | | 20,068 | | | | (8,982 | ) |
Hewlett-Packard Co. | | | 1.00 | % | | Deutsche Bank AG | | | 3/20/19 | | | | USD | | | | 1,660 | | | | 11,086 | | | | 20,068 | | | | (8,982 | ) |
Hewlett-Packard Co. | | | 1.00 | % | | JPMorgan Chase Bank N.A. | | | 3/20/19 | | | | USD | | | | 3,000 | | | | 20,036 | | | | 36,268 | | | | (16,232 | ) |
Hewlett-Packard Co. | | | 1.00 | % | | JPMorgan Chase Bank N.A. | | | 3/20/19 | | | | USD | | | | 3,000 | | | | 20,036 | | | | 36,268 | | | | (16,232 | ) |
Marks & Spencer Group PLC | | | 1.00 | % | | Barclays Bank PLC | | | 3/20/19 | | | | EUR | | | | 1,680 | | | | 58,805 | | | | 49,055 | | | | 9,750 | |
The Western Union Co. | | | 1.00 | % | | Credit Suisse International | | | 3/20/19 | | | | USD | | | | 4,000 | | | | 116,410 | | | | 135,859 | | | | (19,449 | ) |
Total | | | | | | | | | | | | | | | | | | | | $ | (8,672,014 | ) | | $ | 2,397,439 | | | $ | (11,069,453 | ) |
| | | | | | | | | | | | | | | | | | | | | | |
| Ÿ | | OTC credit default swaps — sold protection outstanding as of January 31, 2014 were as follows: |
| | | | | | | | | | | | | | | | | | | | | | | | | | | | | | | | | | |
| Issuer/Index | | Receive
Fixed Rate | | | Counterparty | | Expiration Date | | | Credit
Rating1 | | | Notional
Amount (000)2 | | | Market
Value | | | Premiums
Paid
(Received) | | | Unrealized
Appreciation
(Depreciation) | |
Norske Skogindustrier ASA | | | 5.00 | % | | Credit Suisse International | | | 12/20/14 | | | | CCC | | | | EUR | | | | 5,770 | | | $ | (585,046 | ) | | $ | (962,519 | ) | | $ | 377,473 | |
CDX.NA.IG Series 17 Version 1 | | | 1.00 | % | | Credit Suisse International | | | 12/20/16 | | | | BBB+ | | | | USD | | | | 5,000 | | | | 92,950 | | | | (55,060 | ) | | | 148,010 | |
Republic of Italy | | | 1.00 | % | | Citibank N.A. | | | 12/20/16 | | | | BBB | | | | USD | | | | 500 | | | | (3,352 | ) | | | (46,532 | ) | | | 43,180 | |
Republic of Italy | | | 1.00 | % | | Citibank N.A. | | | 12/20/16 | | | | BBB | | | | USD | | | | 200 | | | | (1,341 | ) | | | (18,211 | ) | | | 16,870 | |
Ardagh Packaging Finance PLC | | | 5.00 | % | | Barclays Bank PLC | | | 9/20/17 | | | | CCC+ | | | | EUR | | | | 90 | | | | 8,942 | | | | (6,761 | ) | | | 15,703 | |
Ardagh Packaging Finance PLC | | | 5.00 | % | | Credit Suisse International | | | 9/20/17 | | | | CCC+ | | | | EUR | | | | 140 | | | | 13,910 | | | | (10,806 | ) | | | 24,716 | |
CDX.NA.HY Series 19 Version 1 | | | 5.00 | % | | Credit Suisse International | | | 12/20/17 | | | | B+ | | | | USD | | | | 4,000 | | | | 352,598 | | | | 82,819 | | | | 269,779 | |
E. ON AG | | | 1.00 | % | | JPMorgan Chase Bank N.A. | | | 12/20/17 | | | | A- | | | | EUR | | | | 500 | | | | 10,418 | | | | 5,003 | | | | 5,415 | |
Imperial Tobacco Group PLC | | | 1.00 | % | | Citibank N.A. | | | 12/20/17 | | | | BBB | | | | EUR | | | | 500 | | | | 12,151 | | | | (1,232 | ) | | | 13,383 | |
See Notes to Financial Statements.
| | | | | | |
| 30 | | BLACKROCK FUNDS | | JANUARY 31, 2014 | | |
| | | | |
| Schedule of Investments (continued) | | | BlackRock Global Long/Short Credit Fund | |
| Ÿ | | OTC credit default swaps — sold protection outstanding as of January 31, 2014 were as follows: (continued) |
| | | | | | | | | | | | | | | | | | | | | | | | | | | | | | | | | | |
| Issuer/Index | | Receive
Fixed Rate | | | Counterparty | | Expiration Date | | | Credit
Rating1 | | | Notional
Amount (000)2 | | | Market
Value | | | Premiums
Paid
(Received) | | | Unrealized
Appreciation
(Depreciation) | |
Imperial Tobacco Group PLC | | | 1.00 | % | | Deutsche Bank AG | | | 12/20/17 | | | | BBB | | | | EUR | | | | 1,000 | | | $ | 24,303 | | | $ | 5,589 | | | $ | 18,714 | |
Sabre Holdings Corp. TSG | | | 5.00 | % | | Goldman Sachs International | | | 12/20/17 | | | | CCC+ | | | | USD | | | | 1,000 | | | | 118,543 | | | | (48,446 | ) | | | 166,989 | |
ThyssenKrupp AG | | | 1.00 | % | | Credit Suisse International | | | 12/20/17 | | | | BB | | | | EUR | | | | 800 | | | | (45,682 | ) | | | (69,049 | ) | | | 23,367 | |
ThyssenKrupp AG | | | 1.00 | % | | Goldman Sachs International | | | 12/20/17 | | | | BB | | | | EUR | | | | 600 | | | | (34,262 | ) | | | (53,144 | ) | | | 18,882 | |
ThyssenKrupp AG | | | 1.00 | % | | JPMorgan Chase Bank N.A. | | | 12/20/17 | | | | BB | | | | EUR | | | | 540 | | | | (30,835 | ) | | | (47,829 | ) | | | 16,994 | |
Ardagh Packaging Finance PLC | | | 5.00 | % | | Credit Suisse International | | | 3/20/18 | | | | CCC+ | | | | EUR | | | | 1,350 | | | | 123,377 | | | | 13,412 | | | | 109,965 | |
Ardagh Packaging Finance PLC | | | 5.00 | % | | Deutsche Bank AG | | | 3/20/18 | | | | CCC+ | | | | EUR | | | | 1,420 | | | | 129,774 | | | | 14,737 | | | | 115,037 | |
Jaguar Land Rover Automotive PLC | | | 5.00 | % | | Credit Suisse International | | | 3/20/18 | | | | BB | | | | EUR | | | | 2,500 | | | | 449,471 | | | | 239,562 | | | | 209,909 | |
Jaguar Land Rover Automotive PLC | | | 5.00 | % | | Credit Suisse International | | | 3/20/18 | | | | BB | | | | EUR | | | | 2,000 | | | | 359,577 | | | | 199,495 | | | | 160,082 | |
Republic of Italy | | | 1.00 | % | | Barclays Bank PLC | | | 3/20/18 | | | | BBB | | | | EUR | | | | 5,050 | | | | (76,958 | ) | | | (258,762 | ) | | | 181,804 | |
Republic of Italy | | | 1.00 | % | | Barclays Bank PLC | | | 3/20/18 | | | | BBB | | | | USD | | | | 59 | | | | (1,156 | ) | | | (3,918 | ) | | | 2,762 | |
Sabre Holdings Corp. TSG | | | 5.00 | % | | Goldman Sachs International | | | 3/20/18 | | | | CCC+ | | | | USD | | | | 1,500 | | | | 179,343 | | | | (24,752 | ) | | | 204,095 | |
Sabre Holdings Corp. TSG | | | 5.00 | % | | Goldman Sachs International | | | 3/20/18 | | | | CCC+ | | | | USD | | | | 1,500 | | | | 179,343 | | | | (24,535 | ) | | | 203,878 | |
Schaeffler Finance BV | | | 5.00 | % | | Barclays Bank PLC | | | 3/20/18 | | | | B+ | | | | EUR | | | | 650 | | | | 117,095 | | | | 26,226 | | | | 90,869 | |
Schaeffler Finance BV | | | 5.00 | % | | Barclays Bank PLC | | | 3/20/18 | | | | B+ | | | | EUR | | | | 640 | | | | 115,293 | | | | 33,098 | | | | 82,195 | |
Schaeffler Finance BV | | | 5.00 | % | | Credit Suisse International | | | 3/20/18 | | | | B+ | | | | EUR | | | | 640 | | | | 115,293 | | | | 33,098 | | | | 82,195 | |
Swiss Reinsurnace Co. Ltd. | | | 1.00 | % | | Barclays Bank PLC | | | 3/20/18 | | | | AA- | | | | EUR | | | | 3,700 | | | | 95,997 | | | | 6,658 | | | | 89,339 | |
Swiss Reinsurnace Co. Ltd. | | | 1.00 | % | | Citibank N.A. | | | 3/20/18 | | | | AA- | | | | EUR | | | | 1,500 | | | | 38,917 | | | | 2,215 | | | | 36,702 | |
ThyssenKrupp AG | | | 1.00 | % | | Credit Suisse International | | | 3/20/18 | | | | BB | | | | EUR | | | | 1,450 | | | | (94,151 | ) | | | (103,898 | ) | | | 9,747 | |
Advanced Micro Devices, Inc. | | | 5.00 | % | | Goldman Sachs International | | | 6/20/18 | | | | B | | | | USD | | | | 1,000 | | | | 20,131 | | | | (70,381 | ) | | | 90,512 | |
Advanced Micro Devices, Inc. | | | 5.00 | % | | Morgan Stanley Capital Services LLC | | | 6/20/18 | | | | B | | | | USD | | | | 1,600 | | | | 32,210 | | | | (87,907 | ) | | | 120,117 | |
Allianz SE | | | 1.00 | % | | JPMorgan Chase Bank N.A. | | | 6/20/18 | | | | AA | | | | EUR | | | | 4,550 | | | | 164,404 | | | | (10,483 | ) | | | 174,887 | |
Ardagh Packaging Finance PLC | | | 5.00 | % | | Credit Suisse International | | | 6/20/18 | | | | CCC+ | | | | EUR | | | | 1,700 | | | | 143,290 | | | | 79,306 | | | | 63,984 | |
Aviva PLC | | | 1.00 | % | | Barclays Bank PLC | | | 6/20/18 | | | | Not Rated | | | | EUR | | | | 4,870 | | | | 57,013 | | | | (109,131 | ) | | | 166,144 | |
Aviva PLC | | | 1.00 | % | | BNP Paribas S.A. | | | 6/20/18 | | | | Not Rated | | | | EUR | | | | 1,995 | | | | 23,356 | | | | (95,266 | ) | | | 118,622 | |
Aviva PLC | | | 1.00 | % | | Credit Suisse International | | | 6/20/18 | | | | Not Rated | | | | EUR | | | | 2,145 | | | | 25,112 | | | | (101,902 | ) | | | 127,014 | |
Deutsche Bank AG | | | 1.00 | % | | Barclays Bank PLC | | | 6/20/18 | | | | A | | | | EUR | | | | 1,480 | | | | 17,117 | | | | (4,371 | ) | | | 21,488 | |
iTraxx Sub Financials Series 19 Version 1 | | | 1.00 | % | | Barclays Bank PLC | | | 6/20/18 | | | | A | | | | EUR | | | | 7,070 | | | | 46,716 | | | | (137,991 | ) | | | 184,707 | |
iTraxx Sub Financials Series 19 Version 1 | | | 1.00 | % | | Barclays Bank PLC | | | 6/20/18 | | | | A | | | | EUR | | | | 4,450 | | | | 29,405 | | | | (102,132 | ) | | | 131,537 | |
iTraxx Sub Financials Series 19 Version 1 | | | 1.00 | % | | Deutsche Bank AG | | | 6/20/18 | | | | A | | | | EUR | | | | 45,000 | | | | 297,348 | | | | (1,170,582 | ) | | | 1,467,930 | |
iTraxx Sub Financials Series 19 Version 1 | | | 1.00 | % | | Deutsche Bank AG | | | 6/20/18 | | | | A | | | | EUR | | | | 8,130 | | | | 53,721 | | | | (165,423 | ) | | | 219,144 | |
iTraxx Sub Financials Series 19 Version 1 | | | 1.00 | % | | Deutsche Bank AG | | | 6/20/18 | | | | A | | | | EUR | | | | 4,800 | | | | 31,718 | | | | (129,306 | ) | | | 161,024 | |
Muenchener Rueckversicherungs AG | | | 1.00 | % | | JPMorgan Chase Bank N.A. | | | 6/20/18 | | | | Not Rated | | | | EUR | | | | 4,550 | | | | 157,372 | | | | 35,762 | | | | 121,610 | |
RWE AG | | | 1.00 | % | | JPMorgan Chase Bank N.A. | | | 6/20/18 | | | | BBB+ | | | | EUR | | | | 4,060 | | | | 51,085 | | | | 42,780 | | | | 8,305 | |
Schaeffler Finance BV | | | 5.00 | % | | Barclays Bank PLC | | | 6/20/18 | | | | B+ | | | | EUR | | | | 1,000 | | | | 183,002 | | | | 119,461 | | | | 63,541 | |
Telecom Italia SpA | | | 1.00 | % | | Bank of America N.A. | | | 6/20/18 | | | | BB+ | | | | EUR | | | | 2,210 | | | | (152,762 | ) | | | (244,139 | ) | | | 91,377 | |
Telecom Italia SpA | | | 1.00 | % | | Barclays Bank PLC | | | 6/20/18 | | | | BB+ | | | | EUR | | | | 1,095 | | | | (75,690 | ) | | | (132,110 | ) | | | 56,420 | |
Telecom Italia SpA | | | 1.00 | % | | Goldman Sachs International | | | 6/20/18 | | | | BB+ | | | | EUR | | | | 1,115 | | | | (77,073 | ) | | | (118,056 | ) | | | 40,983 | |
See Notes to Financial Statements.
| | | | | | |
| | | BLACKROCK FUNDS | | JANUARY 31, 2014 | | 31 |
| | | | |
| Schedule of Investments (continued) | | | BlackRock Global Long/Short Credit Fund | |
| Ÿ | | OTC credit default swaps — sold protection outstanding as of January 31, 2014 were as follows: (continued) |
| | | | | | | | | | | | | | | | | | | | | | | | | | | | | | | | | | |
| Issuer/Index | | Receive
Fixed Rate | | | Counterparty | | Expiration Date | | | Credit
Rating1 | | | Notional
Amount (000)2 | | | Market
Value | | | Premiums
Paid
(Received) | | | Unrealized
Appreciation
(Depreciation) | |
Tesco PLC | | | 1.00 | % | | Goldman Sachs International | | | 6/20/18 | | | | BBB+ | | | | EUR | | | | 4,060 | | | $ | 56,196 | | | $ | 66,851 | | | $ | (10,655 | ) |
ThyssenKrupp AG | | | 1.00 | % | | Barclays Bank PLC | | | 6/20/18 | | | | BB | | | | EUR | | | | 1,000 | | | | (75,048 | ) | | | (70,742 | ) | | | (4,306 | ) |
ThyssenKrupp AG | | | 1.00 | % | | Credit Suisse International | | | 6/20/18 | | | | BB | | | | EUR | | | | 1,200 | | | | (90,058 | ) | | | (105,024 | ) | | | 14,966 | |
Advanced Micro Devices, Inc. | | | 5.00 | % | | Goldman Sachs International | | | 9/20/18 | | | | B | | | | USD | | | | 1,000 | | | | 10,857 | | | | (71,203 | ) | | | 82,060 | |
Advanced Micro Devices, Inc. | | | 5.00 | % | | Goldman Sachs International | | | 9/20/18 | | | | B | | | | USD | | | | 750 | | | | 8,143 | | | | (28,844 | ) | | | 36,987 | |
Advanced Micro Devices, Inc. | | | 5.00 | % | | JPMorgan Chase Bank N.A. | | | 9/20/18 | | | | B | | | | USD | | | | 1,000 | | | | 10,857 | | | | (62,527 | ) | | | 73,384 | |
Ford Motor Co. | | | 5.00 | % | | Bank of America N.A. | | | 9/20/18 | | | | BBB- | | | | USD | | | | 2,500 | | | | 447,960 | | | | 378,350 | | | | 69,610 | |
Ford Motor Co. | | | 5.00 | % | | Barclays Bank PLC | | | 9/20/18 | | | | BBB- | | | | USD | | | | 2,500 | | | | 447,960 | | | | 367,122 | | | | 80,838 | |
Ford Motor Co. | | | 5.00 | % | | Citibank N.A. | | | 9/20/18 | | | | BBB- | | | | USD | | | | 2,000 | | | | 352,785 | | | | 307,101 | | | | 45,684 | |
Ford Motor Co. | | | 5.00 | % | | Goldman Sachs International | | | 9/20/18 | | | | BBB- | | | | USD | | | | 3,000 | | | | 537,552 | | | | 425,909 | | | | 111,643 | |
General Electric Capital Corp. | | | 1.00 | % | | Deutsche Bank AG | | | 9/20/18 | | | | AA+ | | | | USD | | | | 20,000 | | | | 262,483 | | | | (184,753 | ) | | | 447,236 | |
MGIC Investment Corp. | | | 5.00 | % | | Bank of America N.A. | | | 9/20/18 | | | | B- | | | | USD | | | | 2,150 | | | | 222,216 | | | | 87,049 | | | | 135,167 | |
Radian Group, Inc. | | | 5.00 | % | | Bank of America N.A. | | | 9/20/18 | | | | B- | | | | USD | | | | 2,150 | | | | 212,901 | | | | 135,945 | | | | 76,956 | |
Schaeffler Finance BV | | | 5.00 | % | | Citibank N.A. | | | 9/20/18 | | | | B+ | | | | EUR | | | | 2,400 | | | | 445,431 | | | | 281,625 | | | | 163,806 | |
Telecom Italia SpA | | | 1.00 | % | | Goldman Sachs International | | | 9/20/18 | | | | BB+ | | | | EUR | | | | 3,650 | | | | (287,166 | ) | | | (506,166 | ) | | | 219,000 | |
ThyssenKrupp AG | | | 1.00 | % | | Bank of America N.A. | | | 9/20/18 | | | | BB | | | | EUR | | | | 1,560 | | | | (132,865 | ) | | | (167,908 | ) | | | 35,043 | |
Thyssenkrupp AG | | | 1.00 | % | | Citibank N.A. | | | 9/20/18 | | | | BB | | | | EUR | | | | 2,230 | | | | (189,929 | ) | | | (257,900 | ) | | | 67,971 | |
Thyssenkrupp AG | | | 1.00 | % | | JPMorgan Chase Bank N.A. | | | 9/20/18 | | | | BB | | | | EUR | | | | 2,230 | | | | (189,929 | ) | | | (258,971 | ) | | | 69,042 | |
TRW Automotive, Inc. | | | 1.00 | % | | Goldman Sachs International | | | 9/20/18 | | | | BBB- | | | | USD | | | | 3,000 | | | | (21,738 | ) | | | (55,711 | ) | | | 33,973 | |
TRW Automotive, Inc. | | | 1.00 | % | | JPMorgan Chase Bank N.A. | | | 9/20/18 | | | | BBB- | | | | USD | | | | 2,500 | | | | (18,115 | ) | | | (43,353 | ) | | | 25,238 | |
Advanced Micro Devices, Inc. | | | 5.00 | % | | Goldman Sachs International | | | 12/20/18 | | | | B | | | | USD | | | | 2,000 | | | | 2,804 | | | | (32,731 | ) | | | 35,535 | |
Ardagh Packaging Finance PLC | | | 5.00 | % | | Credit Suisse International | | | 12/20/18 | | | | CCC+ | | | | EUR | | | | 2,000 | | | | 138,035 | | | | (28,677 | ) | | | 166,712 | |
Barrick Gold Corp. | | | 1.00 | % | | Citibank N.A. | | | 12/20/18 | | | | BBB | | | | USD | | | | 4,500 | | | | (152,918 | ) | | | (210,003 | ) | | | 57,085 | |
Barrick Gold Corp. | | | 1.00 | % | | Citibank N.A. | | | 12/20/18 | | | | BBB | | | | USD | | | | 3,727 | | | | (126,660 | ) | | | (210,432 | ) | | | 83,772 | |
Bayerische Landesbank | | | 1.00 | % | | Barclays Bank PLC | | | 12/20/18 | | | | Not Rated | | | | EUR | | | | 8,870 | | | | 57,969 | | | | 27,667 | | | | 30,302 | |
General Motors Co. | | | 5.00 | % | | Bank of America N.A. | | | 12/20/18 | | | | BB+ | | | | USD | | | | 4,000 | | | | 660,723 | | | | 613,622 | | | | 47,101 | |
General Motors Co. | | | 5.00 | % | | Barclays Bank PLC | | | 12/20/18 | | | | BB+ | | | | USD | | | | 4,450 | | | | 735,054 | | | | 636,909 | | | | 98,145 | |
K. Hovnanian Enterprises, Inc. | | | 5.00 | % | | Credit Suisse International | | | 12/20/18 | | | | CCC | | | | USD | | | | 2,200 | | | | 105,309 | | | | (54,878 | ) | | | 160,187 | |
K. Hovnanian Enterprises, Inc. | | | 5.00 | % | | JPMorgan Chase Bank N.A. | | | 12/20/18 | | | | CCC | | | | USD | | | | 4,500 | | | | 215,405 | | | | (103,444 | ) | | | 318,849 | |
K. Hovnanian Enterprises, Inc. | | | 5.00 | % | | JPMorgan Chase Bank N.A. | | | 12/20/18 | | | | CCC | | | | USD | | | | 2,300 | | | | 110,096 | | | | (61,569 | ) | | | 171,665 | |
MGIC Investment Corp. | | | 5.00 | % | | Morgan Stanley Capital Services LLC | | | 12/20/18 | | | | B- | | | | USD | | | | 1,525 | | | | 135,454 | | | | 124,717 | | | | 10,737 | |
MGIC Investment Corp. | | | 5.00 | % | | Morgan Stanley Capital Services LLC | | | 12/20/18 | | | | B- | | | | USD | | | | 1,525 | | | | 135,454 | | | | 124,918 | | | | 10,536 | |
Norske Skogindustrier ASA | | | 5.00 | % | | Credit Suisse International | | | 12/20/18 | | | | CCC | | | | EUR | | | | 1,140 | | | | (674,187 | ) | | | (576,604 | ) | | | (97,583 | ) |
Radian Group, Inc. | | | 5.00 | % | | Morgan Stanley Capital Services LLC | | | 12/20/18 | | | | B- | | | | USD | | | | 1,525 | | | | 146,957 | | | | 124,918 | | | | 22,039 | |
Radian Group, Inc. | | | 5.00 | % | | Morgan Stanley Capital Services LLC | | | 12/20/18 | | | | B- | | | | USD | | | | 1,325 | | | | 127,683 | | | | 108,535 | | | | 19,148 | |
TRW Automotive, Inc. | | | 1.00 | % | | Goldman Sachs International | | | 12/20/18 | | | | BBB- | | | | USD | | | | 5,000 | | | | (57,691 | ) | | | (64,655 | ) | | | 6,964 | |
CNH Global NV | | | 5.00 | % | | Citibank N.A. | | | 3/20/19 | | | | BB+ | | | | EUR | | | | 2,950 | | | | 609,733 | | | | 620,628 | | | | (10,895 | ) |
CNH Global NV | | | 5.00 | % | | Citibank N.A. | | | 3/20/19 | | | | BB+ | | | | EUR | | | | 2,950 | | | | 609,733 | | | | 632,682 | | | | (22,949 | ) |
See Notes to Financial Statements.
| | | | | | |
| 32 | | BLACKROCK FUNDS | | JANUARY 31, 2014 | | |
| | | | |
| Schedule of Investments (continued) | | | BlackRock Global Long/Short Credit Fund | |
| Ÿ | | OTC credit default swaps — sold protection outstanding as of January 31, 2014 were as follows: (concluded) |
| | | | | | | | | | | | | | | | | | | | | | | | | | | | | | | | | | |
| Issuer/Index | | Receive
Fixed Rate | | | Counterparty | | Expiration Date | | | Credit
Rating1 | | | Notional
Amount (000)2 | | | Market
Value | | | Premiums
Paid
(Received) | | | Unrealized
Appreciation
(Depreciation) | |
Time Warner Cable, Inc. | | | 1.00 | % | | Credit Suisse International | | | 3/20/19 | | | | BBB | | | | USD | | | | 2,565 | | | $ | (96,043 | ) | | $ | (132,013 | ) | | $ | 35,970 | |
Time Warner Cable, Inc. | | | 1.00 | % | | JPMorgan Chase Bank N.A. | | | 3/20/19 | | | | BBB | | | | USD | | | | 5,130 | | | | (248,887 | ) | | | (225,244 | ) | | | (23,643 | ) |
Republic of France | | | 0.25 | % | | Barclays Bank PLC | | | 6/20/23 | | | | AA | | | | USD | | | | 4,035 | | | | (233,725 | ) | | | (292,948 | ) | | | 59,223 | |
Republic of France | | | 0.25 | % | | Citibank N.A. | | | 6/20/23 | | | | AA | | | | USD | | | | 4,350 | | | | (251,971 | ) | | | (333,523 | ) | | | 81,552 | |
Republic of France | | | 0.25 | % | | JPMorgan Chase Bank N.A. | | | 6/20/23 | | | | AA | | | | USD | | | | 4,350 | | | | (251,970 | ) | | | (309,905 | ) | | | 57,935 | |
Total | | | | | | | | | | | | | | | | | | | | | | | | $ | 6,398,837 | | | $ | (2,860,593 | ) | | $ | 9,259,430 | |
| | | | | | | | | | | | | | | | | | | | | | | | | | |
| | 1 | Using S&P’s rating of the issuer or the underlying securities of the index, as applicable. |
| | 2 | The maximum potential amount the Fund may pay should a negative credit event take place as defined under the terms of the agreement. |
| Ÿ | | OTC total return swaps outstanding as of January 31, 2014 were as follows: |
| | | | | | | | | | | | | | | | | | | | | | | | | | | | |
| Reference Entity | | Floating Rate | | Counterparty | | Expiration
Date | | | Contract Amount | | | Market
Value | | | Premiums
Paid
(Received) | | | Unrealized
Appreciation
(Depreciation) | |
Volkswagen AG | | 3-month EURIBOR plus 0.03%1 | | JPMorgan Chase Bank N.A. | | | 4/02/14 | | | | EUR | | | | 32,000 | | | $ | 538,966 | | | | — | | | $ | 538,966 | |
Volkswagen AG | | 3-month EURIBOR plus 0.03%1 | | JPMorgan Chase Bank N.A. | | | 4/02/14 | | | | EUR | | | | 20,890 | | | | 351,891 | | | | — | | | | 351,891 | |
Volkswagen AG | | 3-month EURIBOR plus 0.03%1 | | JPMorgan Chase Bank N.A. | | | 4/02/14 | | | | EUR | | | | 6,419 | | | | 139,749 | | | | — | | | | 139,749 | |
Volkswagen AG | | 3-month EURIBOR plus 0.03%1 | | JPMorgan Chase Bank N.A. | | | 4/02/14 | | | | EUR | | | | 5,919 | | | | 99,705 | | | | — | | | | 99,705 | |
Volkswagen AG | | 3-month EURIBOR plus 0.03%1 | | JPMorgan Chase Bank N.A. | | | 4/02/14 | | | | EUR | | | | 5,000 | | | | 84,213 | | | | — | | | | 84,213 | |
Volkswagen AG | | 3-month EURIBOR plus 0.03%1 | | JPMorgan Chase Bank N.A. | | | 4/02/14 | | | | EUR | | | | 5,000 | | | | 84,213 | | | | — | | | | 84,213 | |
Volkswagen AG | | 3-month EURIBOR minus 0.05%1 | | JPMorgan Chase Bank N.A. | | | 4/14/14 | | | | EUR | | | | 42,000 | | | | 825,266 | | | | — | | | | 825,266 | |
International Airlines Group SA | | 3-month LIBOR1 | | JPMorgan Chase Bank N.A. | | | 8/29/14 | | | | GBP | | | | 246,146 | | | | (431,381 | ) | | | — | | | | (431,381 | ) |
United Technologies Corp. | | 3-month LIBOR minus 0.30%1 | | Bank of America N.A. | | | 9/15/14 | | | | USD | | | | 9,250 | | | | (61,766 | ) | | | — | | | | (61,766 | ) |
United Technologies Corp. | | 3-month LIBOR minus 0.30%1 | | Bank of America N.A. | | | 9/26/14 | | | | USD | | | | 9,206 | | | | (11,285 | ) | | | — | | | | (11,285 | ) |
Telecom Italia SpA | | 3-month EURIBOR minus 0.25%1 | | JPMorgan Chase Bank N.A. | | | 11/08/14 | | | | EUR | | | | 12,307,018 | | | | (2,457,378 | ) | | | — | | | | (2,457,378 | ) |
International Airlines Group SA | | 3-month LIBOR plus 0.10%1 | | BNP Paribas S.A. | | | 11/12/14 | | | | GBP | | | | 71,750 | | | | (37,885 | ) | | | — | | | | (37,885 | ) |
Repsol SA | | 3-month EURIBOR minus 0.50%1 | | Citibank N.A. | | | 11/12/14 | | | | EUR | | | | 507,494 | | | | 587,947 | | | | — | | | | 587,947 | |
International Airlines Group SA | | 1-month LIBOR minus 0.30%1 | | Credit Suisse International | | | 11/17/14 | | | | GBP | | | | 45,020 | | | | 7,793 | | | | — | | | | 7,793 | |
Texas Instruments, Inc. | | 3-month LIBOR minus 0.30%1 | | Bank of America N.A. | | | 1/06/15 | | | | USD | | | | 17,410 | | | | 9,723 | | | | — | | | | 9,723 | |
Texas Instruments, Inc. | | 3-month LIBOR minus 0.30%1 | | Bank of America N.A. | | | 1/08/15 | | | | USD | | | | 17,420 | | | | 12,613 | | | | — | | | | 12,613 | |
International Airlines Group SA | | 3-month LIBOR minus 0.30%1 | | Citibank N.A. | | | 1/09/15 | | | | GBP | | | | 546,432 | | | | 133,677 | | | | — | | | | 133,677 | |
Texas Instruments, Inc. | | 3-month LIBOR minus 0.30%1 | | Bank of America N.A. | | | 1/13/15 | | | | USD | | | | 23,485 | | | | (6,092 | ) | | | — | | | | (6,092 | ) |
See Notes to Financial Statements.
| | | | | | |
| | | BLACKROCK FUNDS | | JANUARY 31, 2014 | | 33 |
| | | | |
| Schedule of Investments (continued) | | | BlackRock Global Long/Short Credit Fund | |
| Ÿ | | OTC total return swaps outstanding as of January 31, 2014 were as follows: (concluded) |
| | | | | | | | | | | | | | | | | | | | | | | | |
| Reference Entity | | Floating Rate | | Counterparty | | Expiration
Date | | Contract Amount | | | Market
Value | | | Premiums
Paid
(Received) | | | Unrealized
Appreciation
(Depreciation) | |
Repsol SA | | 3-month EURIBOR minus 0.50%1 | | Citibank N.A. | | 1/19/15 | | EUR | | | 13,716 | | | | (321,511 | ) | | | — | | | | (321,511 | ) |
Texas Instruments, Inc. | | 3-month LIBOR minus 0.30%1 | | Bank of America N.A. | | 1/20/15 | | USD | | | 23,025 | | | | 20,948 | | | | — | | | | 20,948 | |
UniCredit SpA | | 3-month EURIBOR plus 0.10%1 | | Bank of America N.A. | | 1/21/15 | | EUR | | | 887,000 | | | | 423,089 | | | | — | | | | 423,089 | |
NetApp, Inc. | | 3-month LIBOR minus 0.30%1 | | Bank of America N.A. | | 1/26/15 | | USD | | | 28,400 | | | | — | | | | — | | | | — | |
NetApp, Inc. | | 3-month LIBOR minus 0.30%1 | | Bank of America N.A. | | 1/27/15 | | USD | | | 17,000 | | | | — | | | | — | | | | — | |
International Airlines Group SA | | 3-month LIBOR minus 0.10%1 | | Bank of America N.A. | | 1/29/15 | | GBP | | | 15,293 | | | | (602 | ) | | | — | | | | (602 | ) |
Volkswagen AG | | 3-month EURIBOR minus 0.25%1 | | BNP Paribas S.A. | | 1/30/15 | | EUR | | | 23,867 | | | | — | | | | — | | | | — | |
Volkswagen AG | | 3-month EURIBOR minus 0.25%1 | | BNP Paribas S.A. | | 1/30/15 | | EUR | | | 19,844 | | | | — | | | | — | | | | — | |
Volkswagen AG | | 3-month EURIBOR minus 0.25%1 | | BNP Paribas S.A. | | 2/02/15 | | EUR | | | 39,680 | | | | — | | | | — | | | | — | |
Total | | | | | | | | | | | | | | $ | (8,107 | ) | | | — | | | $ | (8,107 | ) |
| | | | | | | | | | | | | | | | |
| | 1 | Fund pays the total return of the reference entity and receives the fixed rate. Net payment made at termination. |
| Ÿ | | Fair Value Measurements — Various inputs are used in determining the fair value of investments and derivative financial instruments. These inputs to valuation techniques are categorized into a disclosure hierarchy consisting of three broad levels for financial statement purposes as follows: |
| | Ÿ | | Level 1 — unadjusted price quotations in active markets/exchanges for identical assets or liabilities that the Fund has the ability to access |
| | Ÿ | | Level 2 — other observable inputs (including, but not limited to, quoted prices for similar assets or liabilities in markets that are active, quoted prices for identical or similar assets or liabilities in markets that are not active, inputs other than quoted prices that are observable for the assets or liabilities (such as interest rates, yield curves, volatilities, prepayment speeds, loss severities, credit risks and default rates) or other market–corroborated inputs) |
| | Ÿ | | Level 3 — unobservable inputs based on the best information available in the circumstances, to the extent observable inputs are not available (including the Fund’s own assumptions used in determining the fair value of investments and derivative financial instruments) |
The hierarchy gives the highest priority to unadjusted quoted prices in active markets for identical assets or liabilities (Level 1 measurements) and the lowest priority to unobservable inputs (Level 3 measurements). Accordingly, the degree of judgment exercised in determining fair value is greatest for instruments categorized in Level 3. The inputs used to measure fair value may fall into different levels of the fair value hierarchy. In such cases, for disclosure purposes, the fair value hierarchy classification is determined based on the lowest level input that is significant to the fair value measurement in its entirety.
Changes in valuation techniques may result in transfers into or out of an assigned level within the disclosure hierarchy. In accordance with the Fund’s policy, transfers between different levels of the fair value disclosure hierarchy are deemed to have occurred as of the beginning of the reporting period. The categorization of a value determined for investments and derivative financial instruments is based on the pricing transparency of the investment and derivative financial instrument and is not necessarily an indication of the risks associated with investing in those securities. For information about the Fund’s policy regarding valuation of investments and derivative financial instruments, please refer to Note 2 of the Notes to Financial Statements.
See Notes to Financial Statements.
| | | | | | |
| 34 | | BLACKROCK FUNDS | | JANUARY 31, 2014 | | |
| | | | |
| Schedule of Investments (continued) | | | BlackRock Global Long/Short Credit Fund | |
The following tables summarize the Fund’s investments and derivative financial instruments categorized in the disclosure hierarchy as of January 31, 2014:
| | | | | | | | | | | | | | | | |
| | | Level 1 | | | Level 2 | | | Level 3 | | | Total | |
Assets: | | | | | | | | | | | | | | | | |
Investments: | | | | | | | | | | | | | | | | |
Long-Term Investments: | | | | | | | | | | | | | | | | |
Asset-Backed Securities | | | — | | | $ | 121,302,088 | | | $ | 75,193,091 | | | $ | 196,495,179 | |
Common Stocks | | $ | 29,065,474 | | | | 10,894,407 | | | | — | | | | 39,959,881 | |
Corporate Bonds | | | — | | | | 2,542,134,827 | | | | 38,383,481 | | | | 2,580,518,308 | |
Floating Rate Loan Interests | | | — | | | | 241,972,683 | | | | 8,452,587 | | | | 250,425,270 | |
Foreign Agency Obligations | | | — | | | | 21,186,412 | | | | — | | | | 21,186,412 | |
Foreign Government Obligations | | | — | | | | 58,516,286 | | | | — | | | | 58,516,286 | |
Non-Agency Mortgage-Backed Securities | | | — | | | | 27,521,608 | | | | — | | | | 27,521,608 | |
Preferred Securities | | | 46,031,503 | | | | 256,319,562 | | | | — | | | | 302,351,065 | |
U.S. Treasury Obligations | | | — | | | | 2,243,766 | | | | — | | | | 2,243,766 | |
Short-Term Securities: | | | | | | | | | | | | | | | | |
Borrowed Bond Agreements | | | — | | | | 855,941,790 | | | | — | | | | 855,941,790 | |
Money Market Funds | | | 1,429,570,075 | | | | — | | | | — | | | | 1,429,570,075 | |
Options Purchased: | | | | | | | | | | | | | | | | |
Equity Contracts | | | 547,555 | | | | — | | | | — | | | | 547,555 | |
Credit Contracts | | | — | | | | 3,049,815 | | | | — | | | | 3,049,815 | |
Liabilities: | | | | | | | | | | | | | | | | |
Investments in Securities: | | | | | | | | | | | | | | | | |
Borrowed Bonds | | | — | | | | (868,059,109 | ) | | | — | | | | (868,059,109 | ) |
Total | | $ | 1,505,214,607 | | | $ | 3,273,024,135 | | | $ | 122,029,159 | | | $ | 4,900,267,901 | |
| | | | |
| | | | | | | | | | | | | | | | |
| | | Level 1 | | | Level 2 | | | Level 3 | | | Total | |
Derivative Financial Instruments1 | | | | | | | | | | | | | | | | |
Assets: | | | | | | | | | | | | | | | | |
Credit contracts | | | — | | | $ | 12,128,885 | | | | — | | | $ | 12,128,885 | |
Equity contracts | | $ | 772,835 | | | | 3,319,793 | | | | — | | | | 4,092,628 | |
Foreign currency exchange contracts | | | — | | | | 11,632,063 | | | | — | | | | 11,632,063 | |
Interest rate contracts | | | 10,412 | | | | — | | | | — | | | | 10,412 | |
Liabilities: | | | | | | | | | | | | | | | | |
Credit contracts | | | — | | | | (12,919,960 | ) | | | — | | | | (12,919,960 | ) |
Equity contracts | | | — | | | | (3,327,900 | ) | | | — | | | | (3,327,900 | ) |
Foreign currency exchange contracts | | | — | | | | (156,001 | ) | | | — | | | | (156,001 | ) |
Interest rate contracts | | | (16,078,867 | ) | | | — | | | | — | | | | (16,078,867 | ) |
Total | | $ | (15,295,620 | ) | | $ | 10,676,880 | | | | — | | | $ | (4,618,740 | ) |
| | | | |
| 1 | Derivative financial instruments are swaps, financial futures contracts, foreign currency exchange contracts and options written. Swaps, financial futures contracts and foreign currency exchange contracts are valued at the unrealized appreciation/depreciation on the instrument and options written are shown at value. |
See Notes to Financial Statements.
| | | | | | |
| | | BLACKROCK FUNDS | | JANUARY 31, 2014 | | 35 |
| | | | |
| Schedule of Investments (concluded) | | | BlackRock Global Long/Short Credit Fund | |
The carrying amount for certain of the Fund’s assets and/or liabilities approximates fair value for financial statement purposes. As of January 31, 2014, such assets and/or liabilities are categorized within the disclosure hierarchy as follows:
| | | | | | | | | | | | | | | | |
| | | Level 1 | | | Level 2 | | | Level 3 | | | Total | |
Assets: | | | | | | | | | | | | | | | | |
Cash | | $ | 8,006,013 | | | | — | | | | — | | | $ | 8,006,013 | |
Foreign currency at value | | | 30,982,250 | | | | — | | | | — | | | | 30,982,250 | |
Cash pledged as collateral for borrowed bond agreements | | | 16,304,000 | | | | — | | | | — | | | | 16,304,000 | |
Cash pledged as collateral for OTC derivatives | | | 4,240,000 | | | | — | | | | — | | | | 4,240,000 | |
Cash pledged for centrally cleared swaps | | | 5,942,000 | | | | — | | | | — | | | | 5,942,000 | |
Cash pledged for financial futures contracts | | | 15,854,000 | | | | — | | | | — | | | | 15,854,000 | |
Liabilities: | | | | | | | | | | | | | | | | |
Cash received as collateral for OTC derivatives | | | — | | | $ | (4,600,000 | ) | | | — | | | | (4,600,000 | ) |
Total | | $ | 81,328,263 | | | $ | (4,600,000 | ) | | | — | | | $ | 76,728,263 | |
| | | | |
There were no transfers between Level 1 and Level 2 during the six months ended January 31, 2014.
A reconciliation of Level 3 investments is presented when the Fund had a significant amount of Level 3 investments at the beginning and/or end of the period in relation to net assets. The following table is a reconciliation of Level 3 investments for which significant unobservable inputs were used in determining fair value:
| | | | | | | | | | | | | | | | |
| | | Asset-Backed
Securities | | | Corporate Bonds | | | Floating Rate
Loan Interests | | | Total | |
Assets: | | | | | | | | | | | | | | | | |
Opening Balance, as of July 31, 2013 | | $ | 22,068,261 | | | | — | | | | 6,307,006 | | | $ | 28,375,267 | |
Transfers into Level 3 | | | 7,014,952 | | | | — | | | | — | | | | 7,014,952 | |
Transfers out of Level 3 | | | (15,046,461 | ) | | | — | | | | (3,857,707 | ) | | | (18,904,168 | ) |
Accrued discounts/premiums | | | 24,141 | | | | 165,836 | | | | 28,804 | | | | 218,781 | |
Net realized gain (loss) | | | 67,413 | | | | — | | | | 24,159 | | | | 91,572 | |
Net change in unrealized appreciation/depreciation1 | | | (911,812 | ) | | | (609,787 | ) | | | (1,500 | ) | | | (1,523,099 | ) |
Purchases | | | 67,499,235 | | | | 38,827,432 | | | | 6,239,325 | | | | 112,565,992 | |
Sales | | | (5,522,638 | ) | | | — | | | | (287,500 | ) | | | (5,810,138 | ) |
Closing Balance, as of January 31, 2014 | | $ | 75,193,091 | | | $ | 38,383,481 | | | $ | 8,452,587 | | | $ | 122,029,159 | |
| | | | |
Net change in unrealized appreciation/depreciation on investments held as of January 31, 2014 | | $ | (847,182 | ) | | $ | (609,787 | ) | | $ | (1,500 | ) | | $ | (1,458,469 | ) |
| | | | |
| 1 | Included in the related net change in unrealized appreciation/depreciation in the Statements of Operations. |
The Fund’s investments that are categorized as Level 3 were valued utilizing third party pricing information without adjustment. Such valuations are based on unobservable inputs. A significant change in third party information inputs could result in a significantly lower or higher value of such Level 3 investments.
See Notes to Financial Statements.
| | | | | | |
| 36 | | BLACKROCK FUNDS | | JANUARY 31, 2014 | | |
| | |
| Statements of Assets and Liabilities | | |
| | | | | | | | |
| January 31, 2014 (Unaudited) | | BlackRock
Commodity
Strategies Fund1 | | | BlackRock
Global Long/Short
Credit Fund | |
| | | | | | | | |
| Assets | | | | | | | | |
Investments at value — unaffiliated2,3 | | $ | 389,373,033 | | | $ | 4,338,756,935 | |
Investments at value — affiliated4 | | | 16,327,203 | | | | 1,429,570,075 | |
Cash | | | 3,722,844 | | | | 8,006,013 | |
Cash pledged as collateral for borrowed bond agreements | | | — | | | | 16,304,000 | |
Cash pledged as collateral for OTC derivatives | | | — | | | | 4,240,000 | |
Cash pledged for centrally cleared swaps | | | — | | | | 5,942,000 | |
Cash pledged for financial futures contracts | | | — | | | | 15,854,000 | |
Foreign currency at value5 | | | 28,025 | | | | 30,982,250 | |
Variation margin receivable on centrally cleared swaps | | | | | | | 1,781,030 | |
Variation margin receivable on financial futures contracts | | | — | | | | 105,636 | |
Investments sold receivable | | | 18,838,795 | | | | 36,329,899 | |
Swap premiums paid | | | — | | | | 12,745,771 | |
Unrealized appreciation on foreign currency exchange contracts | | | 1,605 | | | | 11,632,063 | |
Unrealized appreciation on OTC swaps | | | — | | | | 12,917,238 | |
Capital shares sold receivable | | | 568,142 | | | | 41,216,091 | |
Swaps receivable | | | — | | | | 100,983 | |
Dividends receivable — unaffiliated | | | 81,171 | | | | 199,919 | |
Interest receivable | | | 11,440 | | | | 38,697,783 | |
Receivable from Manager | | | 3,411 | | | | — | |
Securities lending income receivable — affiliated | | | 741 | | | | — | |
Dividends receivable — affiliated | | | 282 | | | | 42,739 | |
Prepaid expenses | | | 32,092 | | | | 225,257 | |
| | | | |
Total assets | | | 428,988,784 | | | | 6,005,649,682 | |
| | | | |
| | | | | | | | |
| Liabilities | | | | | | | | |
Options written at value6 | | | — | | | | 1,344,895 | |
Borrowed bonds at value7 | | | — | | | | 868,059,109 | |
Cash received as collateral for OTC derivatives | | | — | | | | 4,600,000 | |
Variation margin payable on financial futures contracts | | | — | | | | 3,495,035 | |
Collateral on securities loaned at value | | | 720,425 | | | | — | |
Investments purchased payable | | | 18,632,011 | | | | 156,756,273 | |
Swap premiums received | | | — | | | | 13,208,925 | |
Unrealized depreciation on foreign currency exchange contracts | | | 1,779 | | | | 156,001 | |
Unrealized depreciation on OTC swaps | | | — | | | | 14,735,368 | |
Interest expense payable | | | — | | | | 7,156,774 | |
Income dividends payable | | | — | | | | 2,146,949 | |
Capital shares redeemed payable | | | 581,539 | | | | 10,250,401 | |
Swaps payable | | | — | | | | 178,373 | |
Investment advisory fees payable | | | 396,752 | | | | 3,523,321 | |
Other affiliates payable | | | 26,147 | | | | 199,205 | |
Service and distribution fees payable | | | 11,200 | | | | 596,368 | |
Officer’s and Trustees’ fees payable | | | 1,873 | | | | — | |
Other accrued expenses payable | | | 102,638 | | | | 462,228 | |
| | | | |
Total liabilities | | | 20,474,364 | | | | 1,086,869,225 | |
| | | | |
Net Assets | | $ | 408,514,420 | | | $ | 4,918,780,457 | |
| | | | |
| | | | | | | | |
| Net Assets Consist of | | | | | | | | |
Paid-in capital | | $ | 458,096,500 | | | $ | 4,849,914,362 | |
Undistributed net investment income (loss) | | | (1,384,142 | ) | | | 7,449,450 | |
Accumulated net realized loss | | | (38,921,381 | ) | | | (16,184,111 | ) |
Net unrealized appreciation/depreciation | | | (9,276,557 | ) | | | 77,600,756 | |
| | | | |
Net Assets | | $ | 408,514,420 | | | $ | 4,918,780,457 | |
| | | | |
1 Consolidated Statement of Assets and Liabilities. | | | | | | | | |
2 Investments at cost — unaffiliated | | $ | 398,648,382 | | | $ | 4,232,643,704 | |
3 Securities loaned at value | | $ | 687,212 | | | | — | |
4 Investments at cost — affiliated | | $ | 16,327,203 | | | $ | 1,429,570,075 | |
5 Foreign currency at cost | | $ | 28,022 | | | $ | 31,183,349 | |
6 Premiums received | | | — | | | $ | 470,149 | |
7 Proceeds received from borrowed bond agreements | | | — | | | $ | 843,057,760 | |
See Notes to Financial Statements.
| | | | | | |
| | | BLACKROCK FUNDS | | JANUARY 31, 2014 | | 37 |
| | |
| Statements of Assets and Liabilities (concluded) | | |
| | | | | | | | |
| January 31, 2014 (Unaudited) | | BlackRock
Commodity
Strategies Fund1 | | | BlackRock
Global Long/Short
Credit Fund | |
| | | | | | | | |
| Net Asset Value | | | | | | | | |
Institutional | | | | | | | | |
Net assets | | $ | 383,673,438 | | | $ | 2,838,005,785 | |
| | | | |
Shares outstanding2 | | | 41,723,011 | | | | 262,862,467 | |
| | | | |
Net asset value | | $ | 9.20 | | | $ | 10.80 | |
| | | | |
| | | | | | | | |
Investor A | | | | | | | | |
Net assets | | $ | 16,297,468 | | | $ | 1,787,111,017 | |
| | | | |
Shares outstanding2 | | | 1,778,823 | | | | 165,765,989 | |
| | | | |
Net asset value | | $ | 9.16 | | | $ | 10.78 | |
| | | | |
| | | | | | | | |
Investor C | | | | | | | | |
Net assets | | $ | 8,543,514 | | | $ | 293,663,655 | |
| | | | |
Shares outstanding2 | | | 948,773 | | | | 27,371,569 | |
| | | | |
Net asset value | | $ | 9.00 | | | $ | 10.73 | |
| | | | |
| | 1 | Consolidated Statement of Assets and Liabilities. |
| | 2 | Unlimited shares authorized, $0.001 par value. |
See Notes to Financial Statements.
| | | | | | |
| 38 | | BLACKROCK FUNDS | | JANUARY 31, 2014 | | |
| | | | | | | | |
| Six Months Ended January 31, 2014 (Unaudited) | | BlackRock
Commodity
Strategies Fund1 | | | BlackRock
Global Long/Short
Credit Fund | |
| | | | | | | | |
| Investment Income | | | | | | | | |
Interest | | $ | 23,177 | | | $ | 53,099,015 | |
Dividends — unaffiliated | | | 2,075,781 | | | | — | |
Foreign taxes withheld | | | (81,630 | ) | | | — | |
Dividends — affiliated | | | 2,783 | | | | 325,317 | |
Other income — affiliated | | | 30,679 | | | | — | |
Securities lending — affiliated — net | | | 2,919 | | | | — | |
| | | | |
Total income | | | 2,053,709 | | | | 53,424,332 | |
| | | | |
| | | | | | | | |
| Expenses | | | | | | | | |
Investment advisory | | | 2,421,652 | | | | 16,831,110 | |
Administration | | | 157,934 | | | | 1,104,285 | |
Service and distribution — class specific | | | 73,413 | | | | 2,922,902 | |
Professional | | | 52,951 | | | | 56,595 | |
Administration — class specific | | | 52,662 | | | | 266,956 | |
Transfer agent — class specific | | | 50,457 | | | | 960,516 | |
Registration | | | 23,940 | | | | 157,588 | |
Custodian | | | 22,199 | | | | 96,786 | |
Printing | | | 10,508 | | | | 19,595 | |
Officer and Trustees | | | 7,564 | | | | 36,959 | |
Miscellaneous | | | 22,845 | | | | 77,937 | |
Recoupment of past waived fees | | | — | | | | 143 | |
Recoupment of past waived fees — class specific | | | 7,832 | | | | 60,066 | |
| | | | |
Total expenses excluding interest expense | | | 2,903,957 | | | | 22,591,438 | |
Interest expense | | | — | | | | 8,605,021 | |
| | | | |
Total expenses | | | 2,903,957 | | | | 31,196,459 | |
Less fees waived by Manager | | | (97,358 | ) | | | (527,759 | ) |
Less administration fees waived — class specific | | | (3,512 | ) | | | — | |
Less transfer agent fees waived — class specific | | | (451 | ) | | | — | |
Less transfer agent fees reimbursed — class specific | | | (19,721 | ) | | | — | |
| | | | |
Total expenses after fees waived and/or reimbursed | | | 2,782,915 | | | | 30,668,700 | |
| | | | |
Net investment income (loss) | | | (729,206 | ) | | | 22,755,632 | |
| | | | |
| | | | | | | | |
| Realized and Unrealized Gain (Loss) | | | | | | | | |
Net realized gain (loss) from: | | | | | | | | |
Investments — unaffiliated | | | (9,243,323 | ) | | | 27,992,024 | |
Investments — affiliated | | | — | | | | 29,195 | |
Options written | | | — | | | | 1,760,629 | |
Financial futures contracts | | | — | | | | (6,671,464 | ) |
Swaps | | | — | | | | (6,052,777 | ) |
Foreign currency transactions | | | 15,217 | | | | (45,379,190 | ) |
Borrowed bonds | | | — | | | | 12,719,805 | |
| | | | |
| | | (9,228,106 | ) | | | (15,601,778 | ) |
| | | | |
Net change in unrealized appreciation/depreciation on: | | | | | | | | |
Investments — unaffiliated | | | 10,906,615 | | | | 97,907,498 | |
Options written | | | — | | | | (874,746 | ) |
Financial futures contracts | | | — | | | | (15,947,312 | ) |
Swaps | | | — | | | | 968,298 | |
Foreign currency translations | | | 230 | | | | 19,913,855 | |
Borrowed bonds | | | — | | | | (30,464,924 | ) |
| | | | |
| | | 10,906,845 | | | | 71,502,669 | |
| | | | |
Total realized and unrealized gain | | | 1,678,739 | | | | 55,900,891 | |
| | | | |
Net Increase in Net Assets Resulting from Operations | | $ | 949,533 | | | $ | 78,656,523 | |
| | | | |
| | 1 | Consolidated Statement of Operations. |
See Notes to Financial Statements.
| | | | | | |
| | | BLACKROCK FUNDS | | JANUARY 31, 2014 | | 39 |
| | |
| Statements of Changes in Net Assets | | |
| | | | | | | | | | | | | | | | |
| | | BlackRock
Commodity
Strategies Fund1 | | | BlackRock
Global Long/Short
Credit Fund | |
| Increase in Net Assets: | | Six Months
Ended
January 31, 2014
(Unaudited) | | | Year Ended July 31,
2013 | | | Six Months
Ended
January 31,
2014
(Unaudited) | | | Year Ended July 31, 2013 | |
| | | | | | | | | | | | | | | | |
| Operations | | | | | | | | | | | | | | | | |
Net investment income (loss) | | $ | (729,206 | ) | | $ | (912,271 | ) | | $ | 22,755,632 | | | $ | 9,609,676 | |
Net realized gain (loss) | | | (9,228,106 | ) | | | (28,129,385 | ) | | | (15,601,778 | ) | | | 4,605,180 | |
Net change in unrealized appreciation/depreciation | | | 10,906,845 | | | | (17,132,609 | ) | | | 71,502,669 | | | | 5,500,223 | |
| | | | | | | | |
Net increase (decrease) in net assets resulting from operations | | | 949,533 | | | | (46,174,265 | ) | | | 78,656,523 | | | | 19,715,079 | |
| | | | | | | | |
| | | | | | | | | | | | | | | | |
| Dividends and Distributions to Shareholders From | | | | | | | | | | | | | | | | |
Net investment income: | | | | | | | | | | | | | | | | |
Institutional | | | — | | | | (68,445 | )2 | | | (13,954,737 | ) | | | (2,005,733 | )2 |
Investor A | | | — | | | | — | | | | (7,420,322 | ) | | | (1,302,564 | )2 |
Investor C | | | — | | | | — | | | | (353,675 | ) | | | (227,628 | )2 |
Net realized gain: | | | | | | | | | | | | | | | | |
Institutional | | | — | | | | — | | | | — | | | | (4,565,150 | )2 |
Investor A | | | — | | | | — | | | | — | | | | (2,964,703 | )2 |
Investor C | | | — | | | | — | | | | — | | | | (518,094 | )2 |
Return of capital: | | | | | | | | | | | | | | | | |
Institutional | | | — | | | | — | | | | — | | | | (585,625 | )2 |
Investor A | | | — | | | | — | | | | — | | | | (380,317 | )2 |
Investor C | | | — | | | | — | | | | — | | | | (66,462 | )2 |
| | | | | | | | |
Decrease in net assets resulting from dividends and distributions to shareholders | | | — | | | | (68,445 | ) | | | (21,728,734 | ) | | | (12,616,276 | ) |
| | | | | | | | |
| | | | | | | | | | | | | | | | |
| Capital Share Transactions | | | | | | | | | | | | | | | | |
Net increase in net assets derived from capital share transactions | | | 1,086,725 | | | | 365,822,228 | | | | 2,459,063,072 | | | | 2,178,061,981 | |
| | | | | | | | |
| | | | | | | | | | | | | | | | |
| Net Assets | | | | | | | | | | | | | | | | |
Total increase in net assets | | | 2,036,258 | | | | 319,579,518 | | | | 2,515,990,861 | | | | 2,185,160,784 | |
Beginning of period | | | 406,478,162 | | | | 86,898,644 | | | | 2,402,789,596 | | | | 217,628,812 | |
| | | | | | | | |
End of period | | $ | 408,514,420 | | | $ | 406,478,162 | | | $ | 4,918,780,457 | | | $ | 2,402,789,596 | |
| | | | | | | | |
Undistributed net investment income (loss), at end of period | | $ | (1,384,142 | ) | | $ | (654,936 | ) | | $ | 7,449,450 | | | $ | 6,422,552 | |
| | | | | | | | |
| | 1 | Consolidated Statement of Changes in Net Assets. |
| | 2 | Determined in accordance with federal income tax regulations. |
See Notes to Financial Statements.
| | | | | | |
| 40 | | BLACKROCK FUNDS | | JANUARY 31, 2014 | | |
| | |
| Consolidated Statement of Cash Flows | | |
| | | | |
| Six Months Ended January 31, 2014 (Unaudited) | | BlackRock
Commodity
Strategies Fund | |
| | | | |
| Cash Used for Operating Activities | | | | |
Net increase in net assets resulting from operations | | $ | 949,533 | |
Adjustments to reconcile net increase in net assets resulting from operations to net cash used for operating activities: | | | | |
Increase in interest receivable | | | (7,170 | ) |
Decrease in dividends receivable — unaffiliated | | | 64,476 | |
Decrease in dividends receivable — affiliated | | | 353 | |
Increase in securities lending income receivable — affiliated | | | (741 | ) |
Decrease in receivable from Manager | | | 1,263 | |
Increase in prepaid expenses | | | (21,896 | ) |
Increase in collateral on securities loaned at value | | | 720,425 | |
Increase in investment advisory fees payable | | | 34,600 | |
Increase in other affiliates payable | | | 3,610 | |
Decrease in service and distribution fees payable | | | (1,426 | ) |
Increase in Officer’s and Trustees’ fees payable | | | 615 | |
Decrease in other accrued expenses payable | | | (12,987 | ) |
Net realized gain (loss) on investments | | | 9,243,323 | |
Net unrealized gain (loss) on investments and foreign currency translations | | | (10,906,762 | ) |
Amortization of premium and accretion of discount on investments | | | 233 | |
Proceeds from sales of long-term investments | | | 60,255,538 | |
Purchases of long-term investments | | | (56,917,756 | ) |
Net purchases of short-term securities | | | (4,369,285 | ) |
| | | | |
Cash used for operating activities | | | (964,054 | ) |
| | | | |
| | | | |
| Cash Provided by Financing Activities | | | | |
Proceeds from issuance of capital shares | | | 36,373,041 | |
Payments on redemption of capital shares | | | (31,690,480 | ) |
| | | | |
Cash provided by financing activities | | | 4,682,561 | |
| | | | |
| | | | |
| Cash impact from foreign exchange fluctuations | | | | |
Cash impact from foreign exchange fluctuations | | | (83 | ) |
| | | | |
| | | | |
| Cash and Foreign Currency | | | | |
Net increase in cash and foreign currency | | | 3,718,424 | |
Cash and foreign currency at beginning of period | | | 32,445 | |
| | | | |
Cash and foreign currency at end of period | | $ | 3,750,869 | |
| | | | |
See Notes to Financial Statements.
| | | | | | |
| | | BLACKROCK FUNDS | | JANUARY 31, 2014 | | 41 |
| | | | |
| Consolidated Financial Highlights | | | BlackRock Commodity Strategies Fund | |
| | | | | | | | | | | | | | | | | | | | | | | | |
| | | Institutional | | | Investor A | |
| | | Six Months
Ended
January 31,
2014
(Unaudited) | | | Year Ended
July 31,
2013 | | | Period
October 3,
20111 to July 31,
2012 | | | Six Months
Ended
January 31,
2014
(Unaudited) | | | Year Ended
July 31,
2013 | | | Period
October 3,
20111 to July 31,
2012 | |
| Per Share Operating Performance | | | | | | | | | | | | | | | | | | | | | | | | |
Net asset value, beginning of period | | $ | 9.17 | | | $ | 9.93 | | | $ | 10.00 | | | $ | 9.15 | | | $ | 9.93 | | | $ | 10.00 | |
| | | | | | | | |
Net investment loss2 | | | (0.02 | ) | | | (0.03 | ) | | | (0.01 | ) | | | (0.02 | ) | | | (0.04 | ) | | | (0.02 | ) |
Net realized and unrealized gain (loss) | | | 0.05 | | | | (0.73 | ) | | | 0.22 | | | | 0.03 | | | | (0.74 | ) | | | 0.22 | |
| | | | | | | | |
Net increase (decrease) from investment operations | | | 0.03 | | | | (0.76 | ) | | | 0.21 | | | | 0.01 | | | | (0.78 | ) | | | 0.20 | |
| | | | | | | | |
Dividends and distributions from: | | | | | | | | | | | | | | | | | | | | | | | | |
Net investment income | | | — | | | | (0.00 | )3,4 | | | (0.01 | )3 | | | — | | | | — | | | | (0.00 | )3,4 |
Net realized gain | | | — | | | | — | | | | (0.27 | )3 | | | — | | | | — | | | | (0.27 | )3 |
| | | | | | | | |
Total dividends and distributions | | | — | | | | (0.00 | )4 | | | (0.28 | ) | | | — | | | | — | | | | (0.27 | ) |
| | | | | | | | |
Net asset value, end of period | | $ | 9.20 | | | $ | 9.17 | | | $ | 9.93 | | | $ | 9.16 | | | $ | 9.15 | | | $ | 9.93 | |
| | | | | | | | |
| | | | | | | | | | | | | | | | | | | | | | | | |
| Total Investment Return5 | | | | | | | | | | | | | | | | | | | | | | | | |
Based on net asset value | | | 0.33 | %6 | | | (7.63 | )% | | | 2.00 | %6 | | | 0.11 | %6 | | | (7.86 | )% | | | 1.97 | %6 |
| | | | | | | | |
| | | | | | | | | | | | | | | | | | | | | | | | |
| Ratios to Average Net Assets | | | | | | | | | | | | | | | | | | | | | | | | |
Total expenses | | | 1.34 | %7,8 | | | 1.38 | %9 | | | 1.87 | %8,10 | | | 1.73 | %7,8 | | | 1.79 | %9 | | | 2.08 | %8,10 |
| | | | | | | | |
Total expenses excluding recoupment of past waived fees | | | 1.34 | %7,8 | | | 1.38 | %9 | | | 1.87 | %8,10 | | | 1.73 | %7,8 | | | 1.79 | %9 | | | 2.08 | %8,10 |
| | | | | | | | |
Total expenses after fees waived and/or reimbursed | | | 1.29 | %7,8 | | | 1.29 | %9 | | | 1.30 | %8 | | | 1.50 | %7,8 | | | 1.50 | %9 | | | 1.50 | %8 |
| | | | | | | | |
Net investment loss | | | (0.32 | )%7,8 | | | (0.24 | %)9 | | | (0.08 | )%8 | | | (0.51 | )%7,8 | | | (0.39 | %)9 | | | (0.26 | )%8 |
| | | | | | | | |
| | | | | | | | | | | | | | | | | | | | | | | | |
| Supplemental Data | | | | | | | | | | | | | | | | | | | | | | | | |
Net assets, end of period (000) | | $ | 383,673 | | | $ | 378,747 | | | $ | 62,974 | | | $ | 16,297 | | | $ | 17,399 | | | $ | 15,274 | |
| | | | | | | | |
Portfolio turnover | | | 28 | % | | | 63 | % | | | 127 | % | | | 28 | % | | | 63 | % | | | 127 | % |
| | | | | | | | |
| | 1 | Commencement of operations. |
| | 2 | Based on average shares outstanding. |
| | 3 | Determined in accordance with federal income tax regulations. |
| | 4 | Amount is greater than $(0.005) per share. |
| | 5 | Where applicable, excludes the effects of any sales charges and assumes the reinvestment of dividends and distributions. |
| | 6 | Aggregate total investment return. |
| | 7 | Ratios do not include expenses incurred indirectly as a result of investments in underlying funds of approximately 0.02%. |
| | 9 | Ratios do not include expenses incurred indirectly as a result of investments in underlying funds of approximately 0.01%. |
| | 10 | Organization costs were not annualized in the calculation of the expense ratios. If these expenses were annualized, the total expenses for Institutional and Investor A Shares would have been 1.89% and 2.08%, respectively. |
See Notes to Financial Statements.
| | | | | | |
| 42 | | BLACKROCK FUNDS | | JANUARY 31, 2014 | | |
| | | | |
| Consolidated Financial Highlights (concluded) | | | BlackRock Commodity Strategies Fund | |
| | | | | | | | | | | | |
| | | Investor C | |
| | | Six Months
Ended
January 31,
2014
(Unaudited) | | | Year Ended
July 31,
2013 | | | Period
October 3,
20111 to July 31,
2012 | |
| Per Share Operating Performance | | | | | | | | | | | | |
Net asset value, beginning of period | | $ | 9.02 | | | $ | 9.87 | | | $ | 10.00 | |
| | | | |
Net investment loss2 | | | (0.06 | ) | | | (0.11 | ) | | | (0.08 | ) |
Net realized and unrealized gain (loss) | | | 0.04 | | | | (0.74 | ) | | | 0.22 | |
| | | | |
Net increase (decrease) from investment operations | | | (0.02 | ) | | | (0.85 | ) | | | 0.14 | |
| | | | |
Dividends and distributions from: | | | | | | | | | | | | |
Net investment income | | | — | | | | — | | | | — | |
Net realized gain | | | — | | | | — | | | | (0.27 | )3 |
| | | | |
Total dividends and distributions | | | — | | | | — | | | | (0.27 | ) |
| | | | |
Net asset value, end of period | | $ | 9.00 | | | $ | 9.02 | | | $ | 9.87 | |
| | | | |
| | | | | | | | | | | | |
| Total Investment Return4 | | | | | | | | | | | | |
Based on net asset value | | | (0.22 | )%5 | | | (8.61 | )% | | | 1.29 | %5 |
| | | | |
| | | | | | | | | | | | |
| Ratios to Average Net Assets | | | | | | | | | | | | |
Total expenses | | | 2.44 | %6,7 | | | 2.49 | %8 | | | 2.85 | %7,9 |
| | | | |
Total expenses excluding recoupment of past waived fees | | | 2.44 | %6,7 | | | 2.49 | %8 | | | 2.85 | %7,9 |
| | | | |
Total expenses after fees waived and/or reimbursed | | | 2.25 | %6,7 | | | 2.25 | %8 | | | 2.24 | %7 |
| | | | |
Net investment loss | | | (1.24 | )%6,7 | | | (1.14 | %)8 | | | (0.97 | )%7 |
| | | | |
| | | | | | | | | | | | |
| Supplemental Data | | | | | | | | | | | | |
Net assets, end of period (000) | | $ | 8,544 | | | $ | 10,332 | | | $ | 8,651 | |
| | | | |
Portfolio turnover | | | 28 | % | | | 63 | % | | | 127 | % |
| | | | |
| | 1 | Commencement of operations. |
| | 2 | Based on average shares outstanding. |
| | 3 | Determined in accordance with federal income tax regulations. |
| | 4 | Where applicable, excludes the effects of any sales charges and assumes the reinvestment of dividends and distributions. |
| | 5 | Aggregate total investment return. |
| | 6 | Ratios do not include expenses incurred indirectly as a result of investments in underlying funds of approximately 0.02%. |
| | 8 | Ratios do not include expenses incurred indirectly as a result of investments in underlying funds of approximately 0.01%. |
| | 9 | Organization costs were not annualized in the calculation of the expense ratios. If these expenses were annualized, the total expenses for Investor C Shares would have been 2.85%. |
See Notes to Financial Statements.
| | | | | | |
| | | BLACKROCK FUNDS | | JANUARY 31, 2014 | | 43 |
| | | | |
| Financial Highlights | | | BlackRock Global Long/Short Credit Fund | |
| | | | | | | | | | | | | | | | | | | | | | | | |
| | | Institutional | | | Investor A | |
| | | Six Months Ended
January 31,
2014
(Unaudited) | | | Year Ended
July 31,
2013 | | | Period
September 30,
20111 to July 31, 2012 | | | Six Months
Ended
January 31,
2014 (Unaudited) | | | Year Ended
July 31,
2013 | | | Period
September 30,
20111 to July 31, 2012 | |
| Per Share Operating Performance | | | | | | | | | | | | | | | | | | | | | | | | |
Net asset value, beginning of period | | $ | 10.63 | | | $ | 10.32 | | | $ | 10.00 | | | $ | 10.61 | | | $ | 10.30 | | | $ | 10.00 | |
| | | | | | | | |
Net investment income2 | | | 0.11 | | | | 0.15 | | | | 0.06 | | | | 0.09 | | | | 0.12 | | | | 0.06 | |
Net realized and unrealized gain | | | 0.13 | | | | 0.41 | | | | 0.30 | | | | 0.13 | | | | 0.42 | | | | 0.28 | |
| | | | | | | | |
Net increase from investment operations | | | 0.24 | | | | 0.56 | | | | 0.36 | | | | 0.22 | | | | 0.54 | | | | 0.34 | |
| | | | | | | | |
Dividends and distributions from: | | | | | | | | | | | | | | | | | | | | | | | | |
Net investment income | | | (0.07 | ) | | | (0.13 | )3 | | | (0.03 | )3 | | | (0.05 | ) | | | (0.11 | )3 | | | (0.03 | )3 |
Net realized gain | | | — | | | | (0.11 | )3 | | | (0.01 | )3 | | | — | | | | (0.11 | )3 | | | (0.01 | )3 |
Return of capital | | | — | | | | (0.01 | )3 | | | — | | | | — | | | | (0.01 | )3 | | | — | |
| | | | | | | | |
Total dividends and distributions | | | (0.07 | ) | | | (0.25 | ) | | | (0.04 | ) | | | (0.05 | ) | | | (0.23 | ) | | | (0.04 | ) |
| | | | | | | | |
Net asset value, end of period | | $ | 10.80 | | | $ | 10.63 | | | $ | 10.32 | | | $ | 10.78 | | | $ | 10.61 | | | $ | 10.30 | |
| | | | | | | | |
| | | | | | | | | | | | | | | | | | | | | | | | |
| Total Investment Return4 | | | | | | | | | | | | | | | | | | | | | | | | |
Based on net asset value | | | 2.26 | %5 | | | 5.45 | % | | | 3.55 | %5 | | | 2.12 | %5 | | | 5.23 | % | | | 3.32 | %5 |
| | | | | | | | |
| | | | | | | | | | | | | | | | | | | | | | | | |
| Ratios to Average Net Assets | | | | | | | | | | | | | | | | | | | | | | | | |
Total expenses | | | 1.50 | %6,7 | | | 1.56 | % | | | 1.73 | %7,8 | | | 1.78 | %6,7 | | | 1.79 | % | | | 1.93 | %7,8 |
| | | | | | | | |
Total expenses excluding recoupment of past waived fees | | | 1.50 | %6,7 | | | 1.54 | % | | | 1.73 | %7,8 | | | 1.77 | %6,7 | | | 1.77 | % | | | 1.93 | %7,8 |
| | | | | | | | |
Total expenses after fees waived and/or reimbursed | | | 1.47 | %6,7 | | | 1.53 | % | | | 1.46 | %7 | | | 1.75 | %6,7 | | | 1.75 | % | | | 1.66 | %7 |
| | | | | | | | |
Total expenses after fees waived, reimbursed and excluding interest expense | | | 1.01 | %6,7 | | | 1.18 | % | | | 1.20 | %7 | | | 1.29 | %6,7 | | | 1.40 | % | | | 1.39 | %7 |
| | | | | | | | |
Net investment income | | | 1.39 | %6,7 | | | 1.38 | % | | | 0.70 | %7 | | | 1.10 | %6,7 | | | 1.11 | % | | | 0.67 | %7 |
| | | | | | | | |
| | | | | | | | | | | | | | | | | | | | | | | | |
| Supplemental Data | | | | | | | | | | | | | | | | | | | | | | | | |
Net assets, end of period (000) | | $ | 2,838,006 | | | $ | 1,335,924 | | | $ | 133,444 | | | $ | 1,787,111 | | | $ | 910,247 | | | $ | 71,053 | |
| | | | | | | | |
Portfolio turnover | | | 55 | % | | | 185 | % | | | 355 | % | | | 55 | % | | | 185 | % | | | 355 | % |
| | | | | | | | |
| | 1 | Commencement of operations. |
| | 2 | Based on average shares outstanding. |
| | 3 | Determined in accordance with federal income tax regulations. |
| | 4 | Where applicable, excludes the effects of any sales charges and assumes the reinvestment of dividends and distributions. |
| | 5 | Aggregate total investment return. |
| | 6 | Ratios do not include expenses incurred indirectly as a result of investments in underlying funds of approximately 0.07%. |
| | 8 | Organization costs were not annualized in the calculation of the expense ratios. If these expenses were annualized, the total expenses for Institutional and Investor A Shares would have been 1.75% and 1.93%, respectively. |
See Notes to Financial Statements.
| | | | | | |
| 44 | | BLACKROCK FUNDS | | JANUARY 31, 2014 | | |
| | | | |
| Financial Highlights (concluded) | | | BlackRock Global Long/Short Credit Fund | |
| | | | | | | | | | | | |
| | | Investor C | |
| | | Six Months
Ended
January 31,
2014
(Unaudited) | | | Year Ended
July 31,
2013 | | | Period
September 30,
20111 to July 31, 2012 | |
| Per Share Operating Performance | | | | | | | | | | | | |
Net asset value, beginning of period | | $ | 10.56 | | | $ | 10.26 | | | $ | 10.00 | |
| | | | |
Net investment income (loss)2 | | | 0.03 | | | | 0.04 | | | | (0.01 | ) |
Net realized and unrealized gain | | | 0.16 | | | | 0.41 | | | | 0.29 | |
| | | | |
Net increase from investment operations | | | 0.19 | | | | 0.45 | | | | 0.28 | |
| | | | |
Dividends and distributions from: | | | | | | | | | | | | |
Net investment income | | | (0.02 | ) | | | (0.03 | )3 | | | (0.01 | )3 |
Net realized gain | | | — | | | | (0.11 | )3 | | | (0.01 | )3 |
Return of capital | | | — | | | | (0.01 | )3 | | | — | |
| | | | |
Total dividends and distributions | | | (0.02 | ) | | | (0.15 | ) | | | (0.02 | ) |
| | | | |
Net asset value, end of period | | $ | 10.73 | | | $ | 10.56 | | | $ | 10.26 | |
| | | | |
| | | | | | | | | | | | |
| Total Investment Return4 | | | | | | | | | | | | |
Based on net asset value | | | 1.75 | %5 | | | 4.39 | % | | | 2.79 | %5 |
| | | | |
| | | | | | | | | | | | |
| Ratios to Average Net Assets | | | | | | | | | | | | |
Total expenses | | | 2.50 | %6,7 | | | 2.50 | % | | | 2.66 | %7,8 |
| | | | |
Total expenses excluding recoupment of past waived fees | | | 2.50 | %6,7 | | | 2.48 | % | | | 2.66 | %7,8 |
| | | | |
Total expenses after fees waived and/or reimbursed | | | 2.47 | %6,7 | | | 2.47 | % | | | 2.40 | %7 |
| | | | |
Total expenses after fees waived, reimbursed and excluding interest expense | | | 2.01 | %6,7 | | | 2.12 | % | | | 2.14 | %7 |
| | | | |
Net investment income (loss) | | | 0.37 | %6,7 | | | 0.39 | % | | | (0.16 | )%7 |
| | | | |
| | | | | | | | | | | | |
| Supplemental Data | | | | | | | | | | | | |
Net assets, end of period (000) | | $ | 293,664 | | | $ | 156,619 | | | $ | 13,132 | |
| | | | |
Portfolio turnover | | | 55 | % | | | 185 | % | | | 355 | % |
| | | | |
| | 1 | Commencement of operations. |
| | 2 | Based on average shares outstanding. |
| | 3 | Determined in accordance with federal income tax regulations. |
| | 4 | Where applicable, excludes the effects of any sales charges and assumes the reinvestment of dividends and distributions. |
| | 5 | Aggregate total investment return. |
| | 6 | Ratios do not include expenses incurred indirectly as a result of investments in underlying funds of approximately 0.07%. |
| | 8 | Organization costs were not annualized in the calculation of the expense ratios. If these expenses were annualized, the total expenses for Investor C Shares would have been 2.66%. |
See Notes to Financial Statements.
| | | | | | |
| | | BLACKROCK FUNDS | | JANUARY 31, 2014 | | 45 |
| | |
| Notes to Financial Statements (Unaudited) | | |
1. Organization:
BlackRock FundsSM (the “Trust”) is registered under the Investment Company Act of 1940, as amended (the “1940 Act”), as an open-end management investment company. The Trust is organized as a Massa-chusetts business trust. BlackRock Commodity Strategies Fund (“Commodity Strategies”) and BlackRock Global Long/Short Credit Fund (“Global Long/Short Credit”) (collectively, the “Funds” or individually, a “Fund”) are each a series of the Trust. Commodity Strategies is classified as non-diversified and Global Long/Short Credit is classified as diversified.
Each Fund offers multiple classes of shares. Institutional Shares are sold without a sales charge and only to certain eligible investors. Investor A Shares are generally sold with an initial sales charge, but may be subject to a CDSC for certain redemptions where no initial sales charge was paid at the time of purchase. Investor C Shares may be subject to a CDSC. All classes of shares have identical voting, dividend, liquidation and other rights and are subject to the same terms and conditions, except that Investor A and Investor C Shares bear certain expenses related to the shareholder servicing of such shares, and Investor C Shares also bear certain expenses related to the distribution of such shares. Each class has exclusive voting rights with respect to matters relating to its shareholder servicing and distribution expenditures.
Basis of Consolidation: The accompanying consolidated financial statements of Commodity Strategies include the accounts of BlackRock Cayman Commodity Strategies Fund, Ltd. (the “Subsidiary”), which is a wholly owned subsidiary of Commodity Strategies and primarily invests in commodity-related instruments. The Subsidiary enables Commodity Strategies to hold these commodity-related instruments and satisfy regulated investment company tax requirements. Commodity Strategies may invest up to 25% of its total assets in the Subsidiary. Intercompany accounts and transactions, if any, have been eliminated. The Subsidiary is subject to the same investment policies and restrictions that apply to Commodity Strategies.
2. Significant Accounting Policies:
The Funds’ financial statements are prepared in conformity with accounting principles generally accepted in the United States of America (“US GAAP”), which may require management to make estimates and assumptions that affect the reported amounts of assets and liabilities in the financial statements and the reported amounts of increases and decreases in net assets from operations during the reporting period. Actual results could differ from those estimates. The following is a summary of the significant accounting policies followed by the Funds:
Valuation: US GAAP defines fair value as the price the Funds would receive to sell an asset or pay to transfer a liability in an orderly transaction between market participants at the measurement date. The Funds determine the fair values of their financial instruments at market value using independent dealers or pricing services under policies approved by the Board of Trustees of the Trust (the “Board”). The BlackRock Global Valuation Methodologies Committee (the “Global Valuation Committee”) is the committee formed by management to develop global pricing policies and procedures and to provide oversight of the pricing function for the Funds for all financial instruments.
The Funds value their bond investments on the basis of last available bid prices or current market quotations provided by dealers or pricing services. Floating rate loan interests are valued at the mean of the bid prices from one or more brokers or dealers as obtained from a pricing service. In determining the value of a particular investment, pricing services may use certain information with respect to transactions in such investments, quotations from dealers, pricing matrixes, market transactions in comparable investments, various relationships observed in the market between investments and calculated yield measures. Asset-backed and mortgage-backed securities are valued by independent pricing services using models that consider estimated cash flows of each tranche of the security, establish a benchmark yield and develop an estimated tranche-specific spread to the benchmark yield based on the unique attributes of the tranche. Financial futures contracts traded on exchanges are valued at their last sale price. Swap agreements are valued utilizing quotes received daily by the Funds’ pricing service or through brokers, which are derived using daily swap curves and models that incorporate a number of market data factors, such as discounted cash flows, trades and values of the underlying reference instruments. Certain centrally cleared swaps are valued at the price determined by the relevant exchange or clearinghouse. Investments in open-end registered investment companies are valued at NAV each business day. Short-term securities with remaining maturities of 60 days or less may be valued at amortized cost, which approximates fair value.
Equity investments traded on a recognized securities exchange or the NASDAQ Stock Market (“NASDAQ”) are valued at the last reported sale price that day or the NASDAQ official closing price, if applicable. For equity investments traded on more than one exchange, the last reported sale price on the exchange where the stock is primarily traded is used. Equity investments traded on a recognized exchange for which there were no sales on that day are valued at the last available bid (long positions) or ask (short positions) price.
Securities and other assets and liabilities denominated in foreign currencies are translated into US dollars using exchange rates determined as of the close of business on the New York Stock Exchange (“NYSE”). Foreign currency exchange contracts are valued at the mean between the bid and ask prices and are determined as of the close of business on the NYSE. Interpolated values are derived when the settlement date of the contract is an interim date for which quotations are not available.
Exchange-traded options are valued at the mean between the last bid and ask prices at the close of the options market in which the options trade. An exchange-traded option for which there is no mean price is valued at the last bid (long positions) or ask (short positions) price. If no bid or ask price is available, the prior day’s price will be used, unless it is determined that the prior day’s price no longer reflects the fair value of the option. Over-the-counter (“OTC”) options and swaptions are valued by an independent pricing service using a mathematical model, which incorporates a number of market data factors, such as the trades and prices of the underlying instruments.
Commodity Strategies values its investments in BlackRock Liquidity Series, LLC, Money Market Series (the “Money Market Series”) at fair value, which is ordinarily based upon its pro rata ownership in the
| | | | | | |
| 46 | | BLACKROCK FUNDS | | JANUARY 31, 2014 | | |
| | |
| Notes to Financial Statements (continued) | | |
underlying fund’s net assets. The Money Market Series seeks current income consistent with maintaining liquidity and preserving capital. Although the Money Market Series is not registered under the 1940 Act, its investments will follow the parameters of investments by a money market fund that is subject to Rule 2a-7 under the 1940 Act. Commodity Strategies may withdraw up to 25% of its investment daily, although the manager of the Money Market Series, in its sole discretion, may permit an investor to withdraw more than 25% on any one day.
In the event that the application of these methods of valuation results in a price for an investment that is deemed not to be representative of the market value of such investment, or if a price is not available, the investment will be valued by the Global Valuation Committee, or its delegate, in accordance with a policy approved by the Board as reflecting fair value (“Fair Value Assets”). When determining the price for Fair Value Assets, the Global Valuation Committee, or its delegate, seeks to determine the price that each Fund might reasonably expect to receive from the current sale of that asset in an arm’s-length transaction. Fair value determinations shall be based upon all available factors that the Global Valuation Committee or its delegate, deems relevant consistent with the principles of fair value measurement, which include the market approach, income approach and/or in the case of recent investments, the cost approach, as appropriate. The market approach generally consists of using comparable market transactions. The income approach generally is used to discount future cash flows to present value and is adjusted for liquidity as appropriate. These factors include but are not limited to: (i) attributes specific to the investment or asset; (ii) the principal market for the investment or asset; (iii) the customary participants in the principal market for the investment or asset; (iv) data assumptions by market participants for the investment or asset, if reasonably available; (v) quoted prices for similar investments or assets in active markets; and (vi) other factors, such as future cash flows, interest rates, yield curves, volatilities, prepayment speeds, loss severities, credit risks, recovery rates, liquidation amounts and/or default rates. Due to the inherent uncertainty of valuations of such investments, the fair values may differ from the values that would have been used had an active market existed. The Global Valuation Committee, or its delegate, employs various methods for calibrating valuation approaches for investments where an active market does not exist, including regular due diligence of the Funds’ pricing vendors, regular reviews of key inputs and assumptions, transactional back-testing or disposition analysis to compare unrealized gains and losses to realized gains and losses, reviews of missing or stale prices and large movements in market values and reviews of any market related activity. The pricing of all Fair Value Assets is subsequently reported to the Board or a committee thereof on a quarterly basis.
Generally, trading in foreign instruments is substantially completed each day at various times prior to the close of business on the NYSE. Occasionally, events affecting the values of such instruments may occur between the foreign market close and the close of business on the NYSE that may not be reflected in the computation of each Fund’s net assets. If events (e.g., a company announcement, market volatility or a natural disaster) occur during such periods that are expected to materially affect the value of such instruments, those instruments may be Fair Value Assets and valued at their fair value, as determined in good faith by the Global Valuation Committee, or its delegate, using a pricing service and/or policies
approved by the Board. Each business day, the Funds use a pricing service to assist with the valuation of certain foreign exchange-traded equity securities and foreign exchange-traded and OTC options (the “Systematic Fair Value Price”). Using current market factors, the Systematic Fair Value Price is designed to value such foreign securities and foreign options at fair value as of the close of business on the NYSE, which follows the close of the local markets.
Foreign Currency: The Funds’ books and records are maintained in US dollars. Purchases and sales of investment securities are recorded at the rates of exchange prevailing on the respective date of such transactions. Generally, when the US dollar rises in value against a foreign currency, the Funds’ investments denominated in that currency will lose value because that currency is worth fewer US dollars; the opposite effect occurs if the US dollar falls in relative value.
The Funds do not isolate the portion of the results of operations arising as a result of changes in the foreign exchange rates from the changes in the market prices of investments held or sold for financial reporting purposes. Accordingly, the effects of changes in foreign currency exchange rates on investments are not segregated in the Statements of Operations from the effects of changes in market prices of those investments but are included as a component of net realized and unrealized gain (loss) from investments. The Funds report realized currency gains (losses) on foreign currency related transactions as components of net realized gain (loss) for financial reporting purposes, whereas such components are generally treated as ordinary income for federal income tax purposes.
Segregation and Collateralization: In cases where each Fund enters into certain investments (e.g., financial futures contracts, foreign currency exchange contracts, options written, swaps or short sales) that would be “senior securities” for 1940 Act purposes, each Fund may segregate or designate on its books and records cash or liquid securities having a market value at least equal to the amount of the Fund’s future obligations under such investments. Doing so allows the investment to be excluded from treatment as a “senior security.” Furthermore, if required by an exchange or counterparty agreement, each Fund may be required to deliver/deposit cash and/or securities to/with an exchange, or broker-dealer or custodian as collateral for certain investments or obligations.
Investment Transactions and Investment Income: For financial reporting purposes, investment transactions are recorded on the dates the transactions are entered into (the trade dates). Realized gains and losses on investment transactions are determined on the identified cost basis. Dividend income is recorded on the ex-dividend date. Dividends from foreign securities where the ex-dividend date may have passed are subsequently recorded when the Funds are informed of the ex-dividend date. Under the applicable foreign tax laws, a withholding tax at various rates may be imposed on capital gains, dividends and interest. Upon notification from issuers, some of the dividend income received from a real estate investment trust may be redesignated as a reduction of cost of the related investment and/or realized gain. Interest income, including amortization and accretion of premiums and discounts on debt securities, is recognized on the accrual basis. Income, expenses and realized
| | | | | | |
| | | BLACKROCK FUNDS | | JANUARY 31, 2014 | | 47 |
| | |
| Notes to Financial Statements (continued) | | |
and unrealized gains and losses are allocated daily to each class based on its relative net assets.
Dividends and Distributions: Dividends and distributions paid by the Funds are recorded on the ex-dividend dates. Dividends from net investment income are declared and paid at least annually for Commodity Strategies. Global Long/Short Credit’s dividends from net investment income are declared daily and paid monthly. The character and timing of dividends and distributions are determined in accordance with federal income tax regulations, which may differ from US GAAP.
Net income and realized gains from Subsidiary investments are treated as ordinary income for tax purposes. Accordingly, the net investment income (loss) and realized gains (losses) reported in Commodity Strategies’s financial statements presented under US GAAP for such investments held by the Subsidiary may differ significantly from income dividends and capital gain distributions. As such, any net gain will pass through to Commodity Strategies as ordinary income for federal income tax purposes. If a net loss is realized by the Subsidiary in any taxable year, the loss will generally not be available to offset Commodity Strategies’s ordinary income and/or capital gains for that year.
Income Taxes: It is the Funds’ policy to comply with the requirements of the Internal Revenue Code of 1986, as amended, applicable to regulated investment companies, and to distribute substantially all of their taxable income to their shareholders. Therefore, no federal income tax provision is required.
Each Fund files US federal and various state and local tax returns. No income tax returns are currently under examination. The statute of limitations on the Funds’ US federal tax returns remain open for the year ended July 31, 2013 and the period ended July 31, 2012. The statutes of limitations on each Fund’s state and local tax returns may remain open for an additional year depending upon the jurisdiction.
Management has analyzed tax laws and regulations and their application to the Funds’ facts and circumstances and does not believe there are any uncertain tax positions that require recognition of a tax liability.
Other: Expenses directly related to a Fund or its classes are charged to that Fund or class. Other operating expenses shared by several funds are pro rated among those funds on the basis of relative net assets or other appropriate methods. Expenses directly related to the Funds and other shared expenses pro rated to the Funds are allocated daily to each class based on its relative net assets or other appropriate methods.
The Funds have an arrangement with the custodian whereby fees may be reduced by credits earned on uninvested cash balances, which, if applicable, are shown as fees paid indirectly in the Statements of Operations. The custodian imposes fees on overdrawn cash balances, which can be offset by accumulated credits earned or may result in additional custody charges.
3. Securities and Other Investments:
Asset-Backed and Mortgage-Backed Securities: Global Long/Short Credit may invest in asset-backed securities. Asset-backed securities are generally issued as pass-through certificates, which represent undivided
fractional ownership interests in an underlying pool of assets, or as debt instruments, which are also known as collateralized obligations, and are generally issued as the debt of a special purpose entity organized solely for the purpose of owning such assets and issuing such debt. Asset-backed securities are often backed by a pool of assets representing the obligations of a number of different parties. The yield characteristics of certain asset-backed securities may differ from traditional debt securities. One such major difference is that all or a principal part of the obligations may be prepaid at any time because the underlying assets (i.e., loans) may be prepaid at any time. As a result, a decrease in interest rates in the market may result in increases in the level of prepayments as borrowers, particularly mortgagors, refinance and repay their loans. An increased prepayment rate with respect to an asset-backed security subject to such a prepayment feature will have the effect of shortening the maturity of the security. In addition, the Funds may have to subsequently reinvest the proceeds at lower interest rates. If Global Long/ Short Credit has purchased such an asset-backed security at a premium, a faster than anticipated prepayment rate could result in a loss of principal to the extent of the premium paid.
Global Long/Short Credit may purchase certain mortgage pass-through securities. There are a number of important differences among the agencies and instrumentalities of the US government that issue mortgage-related securities and among the securities that they issue. For example, mortgage-related securities guaranteed by Ginnie Mae are guaranteed as to the timely payment of principal and interest by Ginnie Mae and such guarantee is backed by the full faith and credit of the United States. However, mortgage-related securities issued by Freddie Mac and Fannie Mae, including Freddie Mac and Fannie Mae guaranteed mortgage pass-through certificates, which are solely the obligations of Fred-die Mac and Fannie Mae, are not backed by or entitled to the full faith and credit of the United States, but are supported by the right of the issuer to borrow from the Treasury.
Collateralized Debt Obligations: Global Long/Short Credit may invest in collateralized debt obligations (“CDOs”), which include collateralized bond obligations (“CBOs”) and collateralized loan obligations (“CLOs”). CBOs and CLOs are types of asset-backed securities. A CDO is an entity which is backed by a diversified pool of debt securities (CBOs) or syndicated bank loans (CLOs). The cash flows of the CDO can be split into multiple segments, called “tranches”, which will vary in risk profile and yield. The riskiest segment is the subordinated or “equity” tranche. This tranche bears the greatest risk of defaults from the underlying assets in the CDO and serves to protect the other, more senior, tranches from default in all but the most severe circumstances. Since it is shielded from defaults by the more junior tranches, a “senior” tranche will typically have higher credit ratings and lower yields than their underlying securities, and often receive investment grade ratings from one or more of the nationally recognized rating agencies. Despite the protection from the more junior tranches, senior tranches can experience substantial losses due to actual defaults, increased sensitivity to future defaults and the disappearance of one or more protecting tranches as a result of changes in the credit profile of the underlying pool of assets.
Multiple Class Pass-Through Securities: Global Long/Short Credit may invest in multiple class pass-through securities, including collateralized
| | | | | | |
| 48 | | BLACKROCK FUNDS | | JANUARY 31, 2014 | | |
| | |
| Notes to Financial Statements (continued) | | |
mortgage obligations (“CMOs”) and commercial mortgage-backed securities. These multiple class securities may be issued by Ginnie Mae, US government agencies or instrumentalities or by trusts formed by private originators of, or investors in, mortgage loans. In general, CMOs are debt obligations of a legal entity that are collateralized by, and multiple class pass-through securities represent direct ownership interests in, a pool of residential or commercial mortgage loans or mortgage pass-through securities (the “Mortgage Assets”), the payments on which are used to make payments on the CMOs or multiple pass-through securities. Classes of CMOs include interest only (“IOs”), principal only (“POs”), planned amortization classes and targeted amortization classes. IOs and POs are stripped mortgage-backed securities representing interests in a pool of mortgages, the cash flow from which has been separated into interest and principal components. IOs receive the interest portion of the cash flow while POs receive the principal portion. IOs and POs can be extremely volatile in response to changes in interest rates. As interest rates rise and fall, the value of IOs tends to move in the same direction as interest rates. POs perform best when prepayments on the underlying mortgages rise since this increases the rate at which the principal is returned and the yield to maturity on the PO. When payments on mortgages underlying a PO are slower than anticipated, the life of the PO is lengthened and the yield to maturity is reduced. If the underlying Mortgage Assets experience greater than anticipated pre-payments of principal, Global Long/Short Credit may not fully recoup its initial investment in IOs.
Zero-Coupon Bonds: Global Long/Short Credit may invest in zero-coupon bonds, which are normally issued at a significant discount from face value and do not provide for periodic interest payments. Zero-coupon bonds may experience greater volatility in market value than similar maturity debt obligations which provide for regular interest payments.
Commodity-Linked Notes: Commodity Strategies may invest in commodity-linked notes to provide exposure to the investment returns of the commodities markets, without investing directly in commodities. In a commodity-linked note, Commodity Strategies purchases a note and, in return, the issuer typically provides for an interest payment and a principal payment at maturity linked to the price movement of the underlying commodity index less an agreed-upon fee. These notes may be issued by US and foreign banks, brokerage firms, insurance companies and other corporations. Performance of a particular commodity index will affect the value of the commodity-linked note. The value of the commodity-linked note is generally based on a multiple of the performance of the index. The multiple (or leverage) will increase the volatility of the note’s value relative to the change in the underlying index. In addition to credit, interest rate and counterparty risk typically associated with traditional debt investments, commodity-linked notes are subject to risks affecting the underlying commodity index. The value of the commodity-linked notes may fluctuate by changes in overall market movements, volatility of the underlying benchmark, changes in interest rates or factors affecting a particular industry or commodity, such as drought, floods, weather, livestock disease, embargoes, tariffs and international economic, political and regulatory developments. The commodity-linked notes have an automatic redemption feature if the underlying index declines from the original trade date by the amount specified in the agreement.
Commodity Strategies has the option to request prepayment from the issuer at any time. The value of the commodity-linked note, which is marked-to-market daily, is recorded on the Consolidated Statement of Assets and Liabilities. The daily change in value, including any fees to be paid, is included in net change in unrealized appreciation/depreciation on investments on the Consolidated Statement of Operations. Interest accruals are included in interest income on the Consolidated Statement of Operations. Commodity Strategies realizes a gain or loss when a commodity-linked note is sold or matures.
Capital Trusts and Trust Preferred Securities: Global Long/Short Credit may invest in capital trusts and/or trust preferred securities. These securities are typically issued by corporations, generally in the form of interest-bearing notes with preferred securities characteristics, or by an affiliated business trust of a corporation, generally in the form of beneficial interests in subordinated debentures or similarly structured securities. The securities can be structured as either fixed or adjustable coupon securities that can have either a perpetual or stated maturity date. For trust preferred securities, the issuing bank or corporation will pay interest to the trust, which will then be distributed to holders of the trust preferred securities as a dividend. Dividends can be deferred without creating an event of default or acceleration, although maturity cannot take place unless all cumulative payment obligations have been met. The deferral of payments does not affect the purchase or sale of these securities in the open market. Payments on these securities are treated as interest rather than dividends for federal income tax purposes. These securities generally are rated below that of the issuing company’s senior debt securities and are freely callable at the issuer’s option.
Preferred Stock: Global Long/Short Credit may invest in preferred stock. Preferred stock has a preference over common stock in liquidation (and generally in receiving dividends as well) but is subordinated to the liabilities of the issuer in all respects. As a general rule, the market value of preferred stock with a fixed dividend rate and no conversion element varies inversely with interest rates and perceived credit risk, while the market price of convertible preferred stock generally also reflects some element of conversion value. Because preferred stock is junior to debt securities and other obligations of the issuer, deterioration in the credit quality of the issuer will cause greater changes in the value of a preferred stock than in a more senior debt security with similar stated yield characteristics. Unlike interest payments on debt securities, preferred stock dividends are payable only if declared by the issuer’s board of directors. Preferred stock also may be subject to optional or mandatory redemption provisions.
Floating Rate Loan Interests: Global Long/Short Credit may invest in floating rate loan interests. The floating rate loan interests Global Long/ Short Credit holds are typically issued to companies (the “borrower”) by banks, other financial institutions, and privately and publicly offered corporations (the “lender”). Floating rate loan interests are generally non-investment grade, often involve borrowers whose financial condition is troubled or uncertain and companies that are highly leveraged. Global Long/Short Credit may invest in obligations of borrowers who are in bankruptcy proceedings. Floating rate loan interests may include fully funded term loans or revolving lines of credit. Floating rate loan interests are typically senior in the corporate capital structure of the borrower. Floating
| | | | | | |
| | | BLACKROCK FUNDS | | JANUARY 31, 2014 | | 49 |
| | |
| Notes to Financial Statements (continued) | | |
rate loan interests generally pay interest at rates that are periodically determined by reference to a base lending rate plus a premium. The base lending rates are generally the lending rate offered by one or more European banks, such as the London Interbank Offered Rate (“LIBOR”), the prime rate offered by one or more US banks or the certificate of deposit rate. Floating rate loan interests may involve foreign borrowers, and investments may be denominated in foreign currencies. Global Long/Short Credit considers these investments to be investments in debt securities for purposes of its investment policies.
When Global Long/Short Credit purchases a floating rate loan interest it may receive a facility fee and when it sells a floating rate loan interest it may pay a facility fee. On an ongoing basis, Global Long/Short Credit may receive a commitment fee based on the undrawn portion of the underlying line of credit amount of a floating rate loan interest. Facility and commitment fees are typically amortized to income over the term of the loan or term of the commitment, respectively. Consent and amendment fees are recorded to income as earned. Prepayment penalty fees, which may be received by Global Long/Short Credit upon the prepayment of a floating rate loan interest by a borrower, are recorded as realized gains. Global Long/Short Credit may invest in multiple series or tranches of a loan. A different series or tranche may have varying terms and carry different associated risks.
Floating rate loan interests are usually freely callable at the borrower’s option. Global Long/Short Credit may invest in such loans in the form of participations in loans (“Participations”) or assignments (“Assignments”) of all or a portion of loans from third parties. Participations typically will result in Global Long/Short Credit having a contractual relationship only with the lender, not with the borrower. Global Long/Short Credit will have the right to receive payments of principal, interest and any fees to which it is entitled only from the lender selling the Participation and only upon receipt by the lender of the payments from the borrower. In connection with purchasing Participations, Global Long/Short Credit generally will have no right to enforce compliance by the borrower with the terms of the loan agreement, nor any rights of offset against the borrower, and Global Long/Short Credit may not benefit directly from any collateral supporting the loan in which it has purchased the Participation. As a result, Global Long/Short Credit will assume the credit risk of both the borrower and the lender that is selling the Participation. Global Long/ Short Credit’s investment in loan participation interests involves the risk of insolvency of the financial intermediaries who are parties to the transactions. In the event of the insolvency of the lender selling the Participation, Global Long/Short Credit may be treated as a general creditor of the lender and may not benefit from any offset between the lender and the borrower. Assignments typically result in Global Long/Short Credit having a direct contractual relationship with the borrower, and Global Long/Short Credit may enforce compliance by the borrower with the terms of the loan agreement.
Borrowed Bond Agreements: Global Long/Short Credit may enter into borrowed bond agreements. In a borrowed bond agreement, Global Long/Short Credit borrows a bond from a counterparty in exchange for cash collateral with the commitment that the security and the cash will be returned to the counterparty and Global Long/Short Credit, respectively, at a mutually agreed upon rate and date. Certain agreements have no stated maturity and can be terminated by either party at any time. Borrowed bond agreements are entered into primarily in connection with short sales of bonds. Earnings on cash collateral and compensation to the lender of the bond are based on agreed upon rates between Global Long/Short Credit and the counterparty. The value of the underlying cash collateral approximates the market value and accrued interest of the borrowed bond. To the extent that a borrowed bond transaction exceeds one business day, the value of the cash collateral in the possession of the counterparty is monitored on a daily basis to ensure the adequacy of the collateral. As the market value of the borrowed bond changes, the cash collateral is periodically increased or decreased with a frequency and in amounts prescribed in the borrowed bond agreement. Full realization of the collateral by Global Long/Short Credit may be limited if the value of an investment purchased with the cash collateral by the lender decreases. Global Long/Short Credit may also experience delays in gaining access to the collateral.
Borrowed bond agreements are entered into by Global Long/Short Credit under Master Repurchase Agreements (“MRA”), which permit Global Long/Short Credit, under certain circumstances, including an event of default (such as bankruptcy or insolvency), to offset payables and/or receivables under the MRA with collateral held and/or posted to the counterparty and create one single net payment due to or from Global Long/Short Credit. With borrowed bond agreements, typically Global Long/Short Credit and the counterparties are permitted to sell, re-pledge, or use the collateral associated with the transaction. However, bankruptcy or insolvency laws of a particular jurisdiction may impose restrictions on or prohibitions against such a right of offset in the event of the MRA counterparty’s bankruptcy or insolvency. Pursuant to the terms of the MRA, Global Long/Short Credit receives or posts securities as collateral with a market value in excess of the repurchase price to be paid or received by Global Long/Short Credit upon the maturity of the transaction. Upon a bankruptcy or insolvency of the MRA counterparty, Global Long/Short Credit is considered an unsecured creditor with respect to excess collateral and, as such, the return of excess collateral may be delayed.
| | | | | | |
| 50 | | BLACKROCK FUNDS | | JANUARY 31, 2014 | | |
| | |
| Notes to Financial Statements (continued) | | |
The following table is a summary of Global Long/Short Credit’s open borrowed bond agreements by counterparty which are subject to offset under a MRA on a net basis as of January 31, 2014:
| | | | | | | | | | | | | | | | | | | | | | | | | | | | |
| Counterparty | | Borrowed Bond
Agreements1 | | | Borrowed
Bonds at Value
Including
Accrued
Interest2 | | | Exposure Due
to
Counterparty
before
Collateral | | | Non-cash
Collateral
Pledged | | | Cash
Collateral
Pledged | | | Net
Collateral
Pledged | | | Net Exposure
Due (to)/from
Counterparty3 | |
Barclays Bank PLC | | $ | 187,033,426 | | | $ | (194,321,663 | ) | | $ | (7,288,237 | ) | | | — | | | $ | 8,636,000 | | | $ | 8,636,000 | | | $ | 1,347,763 | |
Barclays Capital, Inc. | | | 35,971,250 | | | | (35,980,891 | ) | | | (9,641 | ) | | | — | | | | — | | | | — | | | | (9,641 | ) |
Citigroup Global Markets, Inc. | | | 42,493,250 | | | | (43,567,512 | ) | | | (1,074,262 | ) | | $ | 768,302 | | | | | | | $ | 768,302 | | | | (305,960 | ) |
Credit Suisse Securities (USA) LLC | | | 378,772,077 | | | | (387,613,265 | ) | | | (8,841,188 | ) | | | 1,489,894 | | | $ | 6,103,000 | | | | 7,592,894 | | | | (1,248,294 | ) |
Deutsche Bank Securities, Inc. | | | 9,900,000 | | | | (10,162,386 | ) | | | (262,386 | ) | | | — | | | | — | | | | — | | | | (262,386 | ) |
Merrill Lynch, Pierce, Fenner & Smith, Inc. | | | 201,771,787 | | | | (203,570,166 | ) | | | (1,798,379 | ) | | | — | | | | 1,565,000 | | | | 1,565,000 | | | | (233,379 | ) |
| | | | |
Total | | $ | 855,941,790 | | | $ | (875,215,883 | ) | | $ | (19,274,093 | ) | | $ | 2,258,196 | | | $ | 16,304,000 | | | $ | 18,562,196 | | | $ | (711,897 | ) |
| | | | |
| | 1 | Included in Investments at value — unaffiliated in the Statements of Assets and Liabilities. |
| | 2 | Includes accrued interest on borrowed bonds in the amount of $ 7,156,774 which is shown as interest expense payable in the Statements of Assets and Liabilities. |
| | 3 | Net exposure represents the net receivable (payable) that would be due from/to the counterparty in the event of default. |
Short Sales: Global Long/Short Credit may enter into short sale transactions in which Global Long/Short Credit sells a security it does not hold in anticipation of a decline in the market price of that security. When Global Long/Short Credit makes a short sale, it will borrow the security sold short (borrowed bond) and deliver the security to the counterparty to which it sold the security short. An amount equal to the proceeds received by Global Long/Short Credit is reflected as an asset and an equivalent liability. The amount of the liability is subsequently marked-to-market to reflect the market value of the short sale. Global Long/Short Credit is required to repay the counterparty interest on the security sold short, which is shown as interest expense in the Statements of Operations. Global Long/Short Credit is exposed to market risk based on the amount, if any, that the market value of the security increases beyond the market value at which the position was sold. Thus, a short sale of a security involves the risk that instead of declining, the price of the security sold short will rise. The short sale of securities involves the possibility of a theoretically unlimited loss since there is a theoretically unlimited potential for the market price of the security sold short to increase. A gain, limited to the price at which Global Long/Short Credit sold the security short, or a loss, unlimited as to the dollar amount, will be recognized upon the termination of a short sale if the market price is either less than or greater than the proceeds originally received. There is no assurance Global Long/Short Credit will be able to close out a short position at a particular time or at an acceptable price.
Securities Lending: Commodity Strategies may lend securities to approved borrowers, such as banks, brokers and other financial institutions. The borrower pledges cash, securities issued or guaranteed by the US government or irrevocable letters of credit issued by a bank as collateral. The initial collateral received by Commodity Strategies should have a value of at least 102% of the current value of the loaned securities for securities traded on US exchanges and a value of at least 105% for all other securities. The collateral is maintained thereafter in an amount equal to at least 100% of the current market value of the loaned securities. The market value of the loaned securities is determined at the close
of business of Commodity Strategies and any additional required collateral is delivered to Commodity Strategies on the next business day. Securities lending income, as disclosed in the Statements of Operations, represents the income earned from the investment of the cash collateral, net of rebates paid to, or fees paid by, borrowers and less the fees paid to the securities lending agent. During the term of the loan, Commodity Strategies earns dividend or interest income on the securities loaned but does not receive interest income on the securities received as collateral. Loans of securities are terminable at any time and the borrower, after notice, is required to return borrowed securities within the standard time period for settlement of securities transactions.
The market value of securities on loan and the value of the related collateral are shown separately in the Statements of Assets and Liabilities as a component of investments at value, and collateral on securities loaned at value, respectively. The cash collateral invested by the securities lending agent, BlackRock Investment Management, LLC (“BIM”), if any, is disclosed in the Schedule of Investments.
Securities lending transactions are entered into by a Fund under Master Securities Lending Agreements (each, an “MSLA”) which provide the right, in the event of default (including bankruptcy or insolvency), for the non-defaulting party to liquidate the collateral and calculate a net exposure to the defaulting party or request additional collateral. In the event that a borrower defaults, a Fund, as lender, would offset the market value of the collateral received against the market value of the securities loaned. The value of the collateral is typically greater than that of the market value of the securities loaned, leaving the lender with a net amount payable to the defaulting party. However, bankruptcy or insolvency laws of a particular jurisdiction may impose restrictions on or prohibitions against such a right of offset in the event of an MSLA counterparty’s bankruptcy or insolvency. Under the MSLA, the borrower can resell or re-pledge the loaned securities, and Commodity Strategies can reinvest cash collateral, or, upon an event of default, resell or re-pledge the collateral.
| | | | | | |
| | | BLACKROCK FUNDS | | JANUARY 31, 2014 | | 51 |
| | |
| Notes to Financial Statements (continued) | | |
The following table is a summary of Commodity Strategies’ securities lending agreements by counterparty which are subject to offset under an MSLA as of January 31, 2014:
| | | | | | | | | | | | |
| Counterparty | | Securities
Loaned at Value | | | Cash Collateral
Received1 | | | Net Amount | |
Citigroup Global Markets, Inc. | | $ | 143,850 | | | $ | (143,850 | ) | | | — | |
Deutsche Bank Securities, Inc. | | | 81,690 | | | | (81,690 | ) | | | — | |
Merrill Lynch, Pierce, Fenner & Smith, Inc. | | | 74,384 | | | | (74,384 | ) | | | — | |
Morgan Stanley & Co. LLC | | | 387,288 | | | | (387,288 | ) | | | — | |
| | | | |
Total | | $ | 687,212 | | | $ | (687,212 | ) | | | — | |
| | | | |
| | 1 | Collateral with a value of $720,425 has been received in connection with securities lending agreements. Excess of collateral received from the individual counterparty is not shown for financial reporting purposes. |
The risks of securities lending also include the risk that the borrower may not provide additional collateral when required or may not return the securities when due. To mitigate this risk, Commodity Strategies benefits from a borrower default indemnity provided by BlackRock, Inc. (“BlackRock”). BlackRock’s indemnity allows for full replacement of the securities lent. Commodity Strategies also could suffer a loss if the value of an investment purchased with cash collateral falls below the market value of loaned securities or if the value of an investment purchased with cash collateral falls below the value of the original cash collateral received. During the six months ended January 31, 2014, any securities on loan were collateralized by cash.
4. Derivative Financial Instruments:
The Funds engage in various portfolio investment strategies using derivative contracts both to increase the returns of the Funds and/or to economically hedge their exposure to certain risks such as credit risk, equity risk, interest rate risk or foreign currency exchange rate risk. These contracts may be transacted on an exchange or OTC.
Financial Futures Contracts: Global Long/Short Credit purchases and/or sells financial futures contracts and options on financial futures contracts to gain exposure to, or economically hedge against, changes in interest rates (interest rate risk) or changes in the value of equity securities (equity risk). Financial futures contracts are agreements between Global Long/Short Credit and a counterparty to buy or sell a specific quantity of an underlying instrument at a specified price and at a specified date. Depending on the terms of the particular contract, financial futures contracts are settled either through physical delivery of the underlying instrument on the settlement date or by payment of a cash settlement amount on the settlement date.
Upon entering into a financial futures contract, Global Long/Short Credit is required to deposit initial margin with the broker in the form of cash or securities in an amount that varies depending on a contract’s size and risk profile. The initial margin deposit must then be maintained at an established level over the life of the contract. Securities deposited as initial margin are designated on the Schedule of Investments and cash deposited, if any, is recorded on the Statements of Assets and Liabilities as cash pledged for financial futures contracts. Pursuant to the contract, Global Long/Short Credit agrees to receive from or pay to the broker an
amount of cash equal to the daily fluctuation in value of the contract. Such receipts or payments are known as variation margin. Variation margin is recorded by Global Long/Short Credit as unrealized appreciation or depreciation and, if applicable, as a receivable or payable for variation margin in the Statements of Assets and Liabilities.
When the contract is closed, Global Long/Short Credit records a realized gain or loss equal to the difference between the value of the contract at the time it was opened and the value at the time it was closed. The use of financial futures contracts involves the risk of an imperfect correlation in the movements in the price of financial futures contracts, interest or foreign currency exchange rates and the underlying assets.
Foreign Currency Exchange Contracts: The Funds enter into foreign currency exchange contracts as an economic hedge against either specific transactions or portfolio instruments or to obtain exposure to, or hedge exposure away, from foreign currencies (foreign currency exchange rate risk). A foreign currency exchange contract is an agreement between two parties to buy and sell a currency at a set exchange rate on a future date. Foreign currency exchange contracts, when used by the Funds, help to manage the overall exposure to the currencies in which some of the investments held by the Funds are denominated. The contract is marked-to-market daily and the change in market value is recorded by the Funds as an unrealized gain or loss. When the contract is closed, the Funds record a realized gain or loss equal to the difference between the value at the time it was opened and the value at the time it was closed. The use of foreign currency exchange contracts involves the risk that the value of a foreign currency exchange contract changes unfavorably due to movements in the value of the referenced foreign currencies.
Options: Global Long/Short Credit purchases and writes call and put options to increase or decrease its exposure to underlying instruments (including credit risk and/or equity risk) and/or, in the case of options written, to generate gains from options premiums. A call option gives the purchaser (holder) of the option the right (but not the obligation) to buy, and obligates the seller (writer) to sell (when the option is exercised), the underlying instrument at the exercise or strike price at any time or at a specified time during the option period. A put option gives the holder the right to sell and obligates the writer to buy the underlying instrument at the exercise or strike price at any time or at a specified time during the option period. When Global Long/Short Credit purchases (writes) an option, an amount equal to the premium paid (received) by Global Long/Short Credit is reflected as an asset (liability). The amount of the asset (liability) is subsequently marked-to-market to reflect the current market value of the option purchased (written). When an instrument is purchased or sold through an exercise of an option, the related premium paid (or received) is added to (or deducted from) the basis of the instrument acquired or deducted from (or added to) the proceeds of the instrument sold. When an option expires (or Global Long/Short Credit enters into a closing transaction), Global Long/Short Credit realizes a gain or loss on the option to the extent of the premiums received or paid (or gain or loss to the extent the cost of the closing transaction exceeds the premiums received or paid). When Global Long/Short Credit writes a call option, such option is “covered,” meaning that Global Long/Short Credit holds the underlying instrument subject to being called by the
| | | | | | |
| 52 | | BLACKROCK FUNDS | | JANUARY 31, 2014 | | |
| | |
| Notes to Financial Statements (continued) | | |
option counterparty. When Global Long/Short Credit writes a put option, such option is covered by cash in an amount sufficient to cover the obligation.
Options on swaps (swaptions) are similar to options on securities except that instead of selling or purchasing the right to buy or sell a security, the writer or purchaser of the swap option is granting or buying the right to enter into a previously agreed upon interest rate or credit default swap agreement (interest rate risk and/or credit risk) at any time before the expiration of the option.
Global Long/Short Credit also purchases or sells listed or OTC foreign currency options, foreign currency futures and related options on foreign currency futures as a short or long hedge against possible variations in foreign exchange rates or to gain exposure to foreign currencies (foreign currency exchange rate risk). When foreign currency is purchased or sold through an exercise of a foreign currency option, the related premium paid (or received) is added to (or deducted from) the basis of the foreign currency acquired or deducted from (or added to) the proceeds of the foreign currency sold (receipts from the foreign currency purchased). Such transactions may be effected with respect to hedges on non-US dollar denominated instruments owned by Global Long/Short Credit but not yet delivered, or committed or anticipated to be purchased by Global Long/Short Credit.
In purchasing and writing options, Global Long/Short Credit bears the risk of an unfavorable change in the value of the underlying instrument or the risk that Global Long/Short Credit may not be able to enter into a closing transaction due to an illiquid market. Exercise of a written option could result in Global Long/Short Credit purchasing or selling a security when it otherwise would not, or at a price different from the current market value.
Swaps: Global Long/Short Credit enters into swap agreements, in which Global Long/Short Credit and a counterparty agree either to make periodic net payments on a specified notional amount or a net payment upon termination. Swap agreements are privately negotiated in the OTC market and may be entered into as a bilateral contract (“OTC swaps”) or centrally cleared (“centrally cleared swaps”). Swaps are marked-to-market daily and changes in value are recorded as unrealized appreciation (depreciation).
For OTC swaps, any upfront premiums paid are recorded as assets and any upfront fees received are recorded as liabilities and are shown as swap premiums paid and swap premiums received, respectively, in the Statements of Assets and Liabilities and amortized over the term of the OTC swap. Payments received or made by Global Long/Short Credit for OTC swaps are recorded in the Statements of Operations as realized gains or losses, respectively. When an OTC swap is terminated, Global Long/Short Credit will record a realized gain or loss equal to the difference between the proceeds from (or cost of) the closing transaction and Global Long/Short Credit’s basis in the contract, if any. Generally, the basis of the contracts is the premium received or paid.
In a centrally cleared swap, immediately following execution of the swap agreement, the swap agreement is novated to a central counterparty (the “CCP”) and Global Long/Short Credit’s counterparty on the swap
agreement becomes the CCP. Global Long/Short Credit is required to interface with the CCP through a broker. Upon entering into a centrally cleared swap, Global Long/Short Credit is required to deposit initial margin with the broker in the form of cash or securities in an amount that varies depending on the size and risk profile of the particular swap. Securities deposited as initial margin are designated on the Schedule of Investments and cash deposited is recorded on the Statements of Assets and Liabilities as cash pledged for centrally cleared swaps. The daily change in valuation of centrally cleared swaps is recorded as a receivable or payable for variation margin in the Statements of Assets and Liabilities. Payments received from (paid to) the counterparty, including at termination, are recorded as realized gain (loss) in the Statements of Operations.
Swap transactions involve, to varying degrees, elements of interest rate, credit and market risk in excess of the amounts recognized in the Statements of Assets and Liabilities. Such risks involve the possibility that there will be no liquid market for these agreements, that the counterparty to the agreements may default on its obligation to perform or disagree as to the meaning of the contractual terms in the agreements, and that there may be unfavorable changes in interest rates and/or market values associated with these transactions.
| Ÿ | | Credit default swaps — Global Long/Short Credit enters into credit default swaps to manage its exposure to the market or certain sectors of the market, to reduce its risk exposure to defaults of corporate and/or sovereign issuers or to create exposure to corporate and/or sovereign issuers to which it is not otherwise exposed (credit risk). Global Long/Short Credit may either buy or sell (write) credit default swaps on single-name issuers (corporate or sovereign), a combination or basket of single-name issuers or traded indexes. Credit default swaps on single-name issuers are agreements in which the protection buyer pays fixed periodic payments to the seller in consideration for a guarantee from the protection seller to make a specific payment should a negative credit event take place with respect to the referenced entity (e.g., bankruptcy, failure to pay, obligation accelerators, repudiation, moratorium or restructuring). Credit default swaps on traded indexes are agreements in which the buyer pays fixed periodic payments to the seller in consideration for a guarantee from the seller to make a specific payment should a write-down, principal or interest shortfall or default of all or individual underlying securities included in the index occur. As a buyer, if an underlying credit event occurs, Global Long/Short Credit will either (i) receive from the seller an amount equal to the notional amount of the swap and deliver the referenced security or underlying securities comprising the index, or (ii) receive a net settlement of cash equal to the notional amount of the swap less the recovery value of the security or underlying securities comprising the index. As a seller (writer), if an underlying credit event occurs, Global Long/Short Credit will either pay the buyer an amount equal to the notional amount of the swap and take delivery of the referenced security or underlying securities comprising the index or pay a net settlement of cash equal to the notional amount of the swap less the recovery value of the security or underlying securities comprising the index. |
| | | | | | |
| | | BLACKROCK FUNDS | | JANUARY 31, 2014 | | 53 |
| | |
| Notes to Financial Statements (continued) | | |
| • | | Total return swaps — Global Long/Short Credit enters into total return swaps to obtain exposure to a security or market without owning such security or investing directly in that market or to transfer the risk/ return of one market (e.g., fixed income) to another market (e.g., equity or commodity prices) (equity risk, commodity price risk and/or interest rate risk). Total return swaps are agreements in which there is an exchange of cash flows whereby one party commits to make payments |
| | | based on the total return (coupons plus capital gains/losses) of an underlying instrument in exchange for fixed or floating rate interest payments. To the extent the total return of the instrument or index underlying the transaction exceeds or falls short of the offsetting interest rate obligation, Global Long/Short Credit will receive a payment from or make a payment to the counterparty. |
The following is a summary of the Funds’ derivative financial instruments categorized by risk exposure:
| | | | | | | | | | |
| Fair Values of Derivative Financial Instruments as of January 31, 2014 | |
| | | Derivative Assets | |
| | | | | Commodity
Strategies | | | Global
Long/Short
Credit | |
| | | Statements of Assets and Liabilities Location | | Value | |
Interest rate contracts | | Net unrealized appreciation/depreciation1 | | | — | | | $ | 10,412 | |
Foreign currency exchange contracts | | Unrealized appreciation on foreign currency exchange contracts | | $ | 1,605 | | | | 11,632,063 | |
Credit contracts | | Net unrealized appreciation/depreciation1;
Unrealized appreciation on OTC swaps; Swap premiums paid;
Investment at value — unaffiliated2 | | | — | | | | 27,924,471 | |
Equity contracts | | Net unrealized appreciation/depreciation1;
Unrealized appreciation on OTC swaps;
Investments at value — unaffiliated2 | | | — | | | | 4,640,183 | |
Total | | | | $ | 1,605 | | | $ | 44,207,129 | |
| | | |
| | | | | | | | | | |
| | | Derivative Liabilities | |
| | | | | Commodity
Strategies | | | Global
Long/Short
Credit | |
| | | Statements of Assets and Liabilities Location | | Value | |
Interest rate contracts | | Net unrealized appreciation/depreciation1 | | | — | | | $ | 16,078,867 | |
Foreign currency exchange contracts | | Unrealized depreciation on foreign currency exchange contracts | | $ | 1,779 | | | | 156,001 | |
Credit contracts | | Net unrealized appreciation/depreciation1;
Unrealized depreciation on OTC swaps; Swap premiums received;
Options written at value | | | — | | | | 26,128,885 | |
Equity contracts | | Unrealized depreciation on OTC swaps | | | — | | | | 3,327,900 | |
Total | | | | $ | 1,779 | | | $ | 45,691,653 | |
| | 1 | Includes cumulative appreciation/depreciation on financial futures contracts and centrally cleared swaps, if any, as reported in the Schedules of Investments. Only current day’s variation margin is reported within the Statements of Assets and Liabilities. |
| | 2 | Includes options purchased at value as reported in the Schedules of Investments. |
| | | | | | | | |
The Effect of Derivative Financial Instruments in the Statements of Operations Six Months Ended January 31, 2014 | |
| | | Net Realized Gain (Loss) From | |
| | | Commodity
Strategies | | | Global Long/Short Credit | |
Interest rate contracts: | | | | | | | | |
Financial futures contracts | | | — | | | $ | 2,440,168 | |
Foreign currency exchange contracts: | | | | | | | | |
Foreign currency transactions | | $ | 50,723 | | | | (36,877,307 | ) |
Credit contracts: | | | | | | | | |
Swaps | | | — | | | | (1,624,278 | ) |
Options3 | | | — | | | | (4,133,270 | ) |
Equity contracts: | | | | | | | | |
Financial futures contracts | | | — | | | | (9,111,632 | ) |
Swaps | | | — | | | | (4,428,499 | ) |
Options3 | | | — | | | | (1,564,427 | ) |
| |
Total | | $ | 50,723 | | | $ | (55,299,245 | ) |
| | | | |
| | 1 | Options purchased are included in the net realized gain (loss) from investments. |
| | | | | | |
| 54 | | BLACKROCK FUNDS | | JANUARY 31, 2014 | | |
| | |
| Notes to Financial Statements (continued) | | |
| | | | | | | | |
| | | Net Change in Unrealized Appreciation/Depreciation on | |
| | | Commodity
Strategies | | | Global Long/Short Credit | |
Interest rate contracts: | | | | | | | | |
Financial futures contracts | | | — | | | $ | (16,924,472 | ) |
Swaps | | | — | | | | 236,175 | |
Foreign currency exchange contracts: | | | | | | | | |
Foreign currency translations | | $ | 5,173 | | | | 19,314,145 | |
Credit contracts: | | | | | | | | |
Swaps | | | — | | | | 740,230 | |
Options1 | | | — | | | | 918,042 | |
Equity contracts: | | | | | | | | |
Financial futures contracts | | | — | | | | 977,160 | |
Swaps | | | — | | | | (8,107 | ) |
Options1 | | | — | | | | (1,540,512 | ) |
| |
Total | | $ | 5,173 | | | $ | 3,712,661 | |
| | | | |
| | 1 | Options purchased are included in the net change in unrealized appreciation/depreciation on investments. |
For the six months ended January 31, 2014, the average quarterly balances of outstanding derivative financial instruments were as follows:
| | | | | | | | |
| | | Commodity
Strategies | | | Global Long/Short Credit | |
Financial futures contracts: | | | | | | | | |
Average number of contracts purchased | | | — | | | | 134 | 2 |
Average number of contracts sold | | | — | | | | 6,066 | |
Average notional value of contracts purchased | | | — | | | $ | 183 | 2 |
Average notional value of contracts sold | | | — | | | $ | 914,566,800 | |
Foreign currency exchange contracts: | | | | | | | | |
Average number of contracts - US dollars purchased | | | 3 | | | | 12 | |
Average number of contracts - US dollars sold | | | 2 | | | | 1 | 2 |
Average US dollar amounts purchased | | $ | 459,291 | | | $ | 1,428,562,950 | |
Average US dollar amounts sold | | $ | 215,286 | | | $ | 56,630,958 | 2 |
Options: | | | | | | | | |
Average number of option contracts purchased | | | — | | | | 5,011 | |
Average number of option contracts written | | | — | | | | 5,889 | 2 |
Average notional value of option contracts purchased | | | — | | | $ | 104,097,814 | |
Average notional value of option contracts written | | | — | | | $ | 499,479 | 2 |
Average number of swaption contracts purchased | | | — | | | | 2 | |
Average number of swaption contracts written | | | — | | | | 2 | |
Average notional value of swaption contracts purchased | | | — | | | $ | 321,966,573 | |
Average notional value of swaption contracts written | | | — | | | $ | 321,966,573 | |
Credit default swaps: | | | | | | | | |
Average number of contracts - buy protection | | | — | | | | 104 | |
Average number of contracts - sell protection | | | — | | | | 98 | |
Average notional value - buy protection | | | — | | | $ | 1,073,865,068 | |
Average notional value - sell protection | | | — | | | $ | 572,206,174 | |
Total return swaps: | | | | | | | | |
Average number of contracts | | | — | | | | 8,070,434 | |
Average notional value | | | — | | | $ | 51,458,532 | |
| | 2 | Actual contract amount shown due to limited activity. |
Counterparty Credit Risk: A derivative contract may suffer a mark-to-market loss if the value of the contract decreases due to an unfavorable change in the market rates or values of the underlying instrument. Losses can also occur if the counterparty does not perform under the contract.
A Fund’s risk of loss from counterparty credit risk on OTC derivatives is generally limited to the aggregate unrealized gain netted against any collateral held by such Fund. For OTC options purchased, each Fund bears the risk of loss of the amount of the premiums paid plus the positive change in market values net of any collateral held by such Fund should the counterparty fail to perform under the contracts. Options written by
the Funds do not typically give rise to counterparty credit risk, as options written generally obligate the Funds, and not the counterparty, to perform.
With exchange-traded purchased options and futures and centrally cleared swaps, there is less counterparty credit risk to the Funds since the exchange or clearinghouse, as counterparty to such instruments, guarantees against a possible default. The clearinghouse stands between the buyer and the seller of the contract; therefore, credit risk is limited to failure of the clearinghouse. While offset rights may exist under applicable law, the Funds do not have a contractual right of offset against a clearing broker or clearinghouse in the event of a default
| | | | | | |
| | | BLACKROCK FUNDS | | JANUARY 31, 2014 | | 55 |
| | |
| Notes to Financial Statements (continued) | | |
(including the bankruptcy or insolvency) of the clearing broker or clearinghouse. Additionally, credit risk exists in exchange-traded futures and centrally cleared swaps with respect to initial and variation margin that is held in a clearing broker’s customer accounts. While clearing brokers are required to segregate customer margin from their own assets, in the event that a clearing broker becomes insolvent or goes into bankruptcy and at that time there is a shortfall in the aggregate amount of margin held by the clearing broker for all its clients, typically the shortfall would be allocated on a pro rata basis across all the clearing broker’s customers, potentially resulting in losses to the Funds.
In order to better define its contractual rights and to secure rights that will help the Funds mitigate their counterparty risk, a Fund may enter into an International Swaps and Derivatives Association, Inc. Master Agreement (“ISDA Master Agreement”) or similar agreement with its derivative contract counterparties. An ISDA Master Agreement is a bilateral agreement between each Fund and a counterparty that governs certain OTC derivatives and typically contains, among other things, collateral posting terms and netting provisions in the event of a default and/or termination event. Under an ISDA Master Agreement, each Fund may, under certain circumstances, offset with the counterparty certain derivative financial instruments’ payables and/or receivables with collateral held and/or posted and create one single net payment. The provisions of the ISDA Master Agreement typically permit a single net payment in the event of default including the bankruptcy or insolvency of the counterparty. However, bankruptcy or insolvency laws of a particular jurisdiction may impose restrictions on or prohibitions against the right of offset in bankruptcy, insolvency or other events. In addition, certain ISDA Master Agreements allow counterparties to OTC derivatives to terminate derivative contracts prior to maturity in the event a Fund’s net assets decline by a stated percentage or a Fund fails to meet the terms of its ISDA Master Agreements, which would cause a Fund to accelerate payment of any net liability owed to the counterparty.
Collateral Requirements: For derivatives traded under an ISDA Master Agreement, the collateral requirements are typically calculated by netting the mark-to-market amount for each transaction under such agreement and comparing that amount to the value of any collateral currently pledged by a Fund and the counterparty.
Cash collateral that has been pledged to cover obligations of a Fund and cash collateral received from the counterparty, if any, is reported separately on the Statements of Assets and Liabilities as cash pledged as collateral and cash received as collateral, respectively. Non-cash collateral pledged by a Fund, if any, is noted in the Schedules of Investments. Generally, the amount of collateral due from or to a party has to exceed a minimum transfer amount threshold (e.g., $500,000) before a transfer is required, which is determined at the close of business of each Fund and any additional required collateral is delivered to/pledged by each Fund on the next business day. Typically, the Funds and counterparties are not permitted to sell, re-pledge or use the collateral they receive. To the extent amounts due to a Fund from its counterparties are not fully collateralized, contractually or otherwise, each Fund bears the risk of loss from counterparty non-performance. Each Fund attempts to mitigate counterparty risk by entering into agreements only with counterparties that it believes have the financial resources to honor their obligations and by monitoring the financial stability of those counterparties.
For financial reporting purposes, the Funds do not offset derivative assets and derivative liabilities that are subject to netting arrangements, if any, in the Statements of Assets and Liabilities.
At January 31, 2014, the Funds’ derivative assets and liabilities (by type) are as follows:
| | | | | | | | | | | | | | | | |
| | | Commodity
Strategies | | | Global Long/Short Credit | |
| | | Assets | | | Liabilities | | | Assets | | | Liabilities | |
Derivative Financial Instruments: | | | | | | | | | | | | | | | | |
Financial futures contracts | | | — | | | | — | | | $ | 105,636 | | | $ | 3,495,035 | |
Foreign currency exchange contracts | | $ | 1,605 | | | $ | 1,779 | | | | 11,632,063 | | | | 156,001 | |
Options | | | — | | | | — | | | | 3,597,370 | 1 | | | 1,344,895 | |
Centrally cleared swaps | | | — | | | | — | | | | 1,781,030 | | | | — | |
OTC swaps2 | | | — | | | | — | | | | 25,663,009 | | | | 27,944,293 | |
| | | | |
Total derivative assets and liabilities in the Statements of Assets and Liabilities | | $ | 1,605 | | | $ | 1,779 | | | $ | 42,779,108 | | | $ | 32,940,224 | |
Derivatives not subject to a Master Netting Agreement or similar agreement (“MNA”) | | | — | | | | — | | | | (2,434,221 | ) | | | (3,495,035 | ) |
| | | | |
Total assets and liabilities subject to an MNA | | $ | 1,605 | | | $ | 1,779 | | | $ | 40,344,887 | | | $ | 29,445,189 | |
| | | | |
| | 1 | Includes options purchased at value which is included as Investments at value — unaffiliated in the Statements of Assets and Liabilities and reported in the Schedules of Investments. |
| | 2 | Includes unrealized appreciation/depreciation on OTC swaps and swap premiums paid/received in the Statements of Assets and Liabilities. |
| | | | | | |
| 56 | | BLACKROCK FUNDS | | JANUARY 31, 2014 | | |
| | |
| Notes to Financial Statements (continued) | | |
The following tables present the Funds’ derivative assets and/or liabilities by counterparty net of amounts available for offset under an MNA and net of the related collateral received and pledged by the Funds as of January 31, 2014:
| | | | | | | | | | | | | | | | | | | | |
| Commodity Strategies | | | | | | | | | | | | | | | |
| | | Gross Amounts Not Offset in the Statements of Assets and Liabilities and Subject to an MNA | |
| Counterparty | | Derivative Assets
Subject to an MNA
by Counterparty | | | Derivatives
Available
for Offset | | | Non-cash
Collateral
Received | | | Cash
Collateral
Received | | | Net Amount of
Derivative Assets1 | |
Deutsche Bank AG | | $ | 1,131 | | | | — | | | | — | | | | — | | | $ | 1,131 | |
Goldman Sachs International | | | 474 | | | | — | | | | — | | | | — | | | | 474 | |
| | | | |
Total | | $ | 1,605 | | | | — | | | | | | | | — | | | $ | 1,605 | |
| | | | |
| | | | | |
| | | | | | | | | | | | | | | | | | | | |
| Counterparty | | Derivative Liabilities
Subject to an MNA
by Counterparty | | | Derivatives
Available
for Offset | | | Non-cash
Collateral
Pledged | | | Cash
Collateral
Pledged | | | Net Amount of
Derivative Liabilities2 | |
Citibank N.A. | | $ | 1,753 | | | | — | | | | — | | | | — | | | $ | 1,753 | |
HSBC Bank PLC | | | 26 | | | | — | | | | — | | | | — | | | | 26 | |
| | | | |
Total | | $ | 1,779 | | | | — | | | | — | | | | — | | | $ | 1,779 | |
| | | | |
| | | | | |
| | | | | | | | | | | | | | | | | | | | |
| Global Long/Short Credit | | | | | | | | | | | | | | | |
| | | Gross Amounts Not Offset in the Statements of Assets and Liabilities and Subject to an MNA | |
| Counterparty | | Derivative Assets
Subject to an MNA
by Counterparty | | | Derivatives
Available
for Offset3 | | | Non-cash
Collateral
Received4 | | | Cash
Collateral
Received4 | | | Net Amount of
Derivative Assets1 | |
Bank of America N.A. | | $ | 2,487,087 | | | $ | (932,925 | ) | | $ | (1,299,600 | ) | | | — | | | $ | 254,562 | |
Barclays Bank PLC | | | 3,514,202 | | | | (2,662,185 | ) | | | (852,017 | ) | | | — | | | | — | |
BNP Paribas S.A. | | | 1,033,255 | | | | (1,033,255 | ) | | | — | | | | — | | | | — | |
Citibank N.A. | | | 5,801,413 | | | | (5,298,763 | ) | | | — | | | $ | (502,650 | ) | | | — | |
Credit Suisse International | | | 3,357,200 | | | | (3,357,200 | ) | | | — | | | | — | | | | — | |
Deutsche Bank AG | | | 3,246,090 | | | | (2,802,840 | ) | | | — | | | | (400,000 | ) | | | 43,250 | |
Goldman Sachs Bank USA | | | 10,963,469 | | | | (348,927 | ) | | | — | | | | (3,000,000 | ) | | | 7,614,542 | |
Goldman Sachs International | | | 1,744,261 | | | | (1,744,261 | ) | | | — | | | | — | | | | — | |
JPMorgan Chase Bank N.A. | | | 7,531,631 | | | | (7,531,631 | ) | | | — | | | | — | | | | — | |
Morgan Stanley Capital Services LLC | | | 666,279 | | | | (107,111 | ) | | | — | | | | (559,168 | ) | | | — | |
| | | | |
Total | | $ | 40,344,887 | | | $ | (25,819,098 | ) | | $ | (2,151,617 | ) | | $ | (4,461,818 | ) | | $ | 7,912,354 | |
| | | | |
| | | | | |
| | | | | | | | | | | | | | | | | | | | |
| Counterparty | | Derivative Liabilities
Subject to an MNA by Counterparty | | | Derivatives
Available
for Offset3 | | | Non-cash
Collateral
Pledged | | | Cash
Collateral
Pledged5 | | | Net Amount of
Derivative Liabilities2 | |
Bank of America N.A. | | $ | 932,925 | | | $ | (932,925 | ) | | | — | | | | — | | | | — | |
Barclays Bank PLC | | | 2,662,185 | | | | (2,662,185 | ) | | | — | | | | — | | | | — | |
BNP Paribas S.A. | | | 2,548,260 | | | | (1,033,255 | ) | | | — | | | $ | (1,515,005 | ) | | | — | |
Citibank N.A. | | | 5,298,763 | | | | (5,298,763 | ) | | | — | | | | — | | | | — | |
Credit Suisse International | | | 4,409,604 | | | | (3,357,200 | ) | | | — | | | | (1,052,404 | ) | | | — | |
Deutsche Bank AG | | | 2,802,840 | | | | (2,802,840 | ) | | | — | | | | — | | | | — | |
Goldman Sachs Bank USA | | | 348,927 | | | | (348,927 | ) | | | — | | | | — | | | | — | |
Goldman Sachs International | | | 1,812,083 | | | | (1,744,261 | ) | | | — | | | | — | | | $ | 67,822 | |
JPMorgan Chase Bank N.A. | | | 8,522,491 | | | | (7,531,631 | ) | | | — | | | | (990,860 | ) | | | — | |
Morgan Stanley Capital Services LLC | | | 107,111 | | | | (107,111 | ) | | | — | | | | — | | | | — | |
| | | | |
Total | | $ | 29,445,189 | | | $ | (25,819,098 | ) | | | — | | | $ | (3,558,269 | ) | | $ | 67,822 | |
| | | | |
| | 1 | Net amount represents the net amount receivable from the counterparty in the event of default. |
| | 2 | Net amount represents the net amount payable due to the counterparty in the event of default. |
| | 3 | The amount of derivatives available for offset is limited to the amount of assets and/or liabilities that are subject to an MNA. |
| | 4 | Excess of collateral received from the individual counterparty may not be shown for financial reporting purposes. |
| | 5 | Excess of collateral pledged from the individual counterparty may not be shown for financial reporting purposes. |
| | | | | | |
| | | BLACKROCK FUNDS | | JANUARY 31, 2014 | | 57 |
| | |
| Notes to Financial Statements (continued) | | |
5. Investment Advisory Agreement and Other Transactions with Affiliates:
The PNC Financial Services Group, Inc. is the largest stockholder and an affiliate, for 1940 Act purposes, of BlackRock, Inc.
The Trust, on behalf of the Funds, entered into an Investment Advisory Agreement with the Manager, the Funds’ investment advisor, an indirect, wholly owned subsidiary of BlackRock, to provide investment advisory and administration services. The Manager is responsible for the management of each Fund’s portfolio and provides the necessary personnel, facilities, equipment and certain other services necessary to the operations of each Fund. For such services, each Fund pays the Manager a monthly fee based on a percentage of each Fund’s average daily net assets at the following annual rates:
| | | | | | | | |
| | | Commodity
Strategies | | | Global
Long/Short
Credit | |
| Average Daily Net Assets | | Investment | | | Advisory Fee | |
First $1 Billion | | | 1.15 | % | | | 0.95 | % |
$1 Billion - $3 Billion | | | 1.08 | % | | | 0.89 | % |
$3 Billion - $5 Billion | | | 1.04 | % | | | 0.86 | % |
$5 Billion - $10 Billion | | | 1.00 | % | | | 0.83 | % |
Greater than $10 Billion | | | 0.98 | % | | | 0.81 | % |
The Manager voluntarily agreed to waive its investment advisory fees by the amount of investment advisory fees each Fund pays to the Manager indirectly through its investment in affiliated money market funds. However, the Manager does not waive its investment advisory fees by the amount of investment advisory fees paid in connection with each Fund’s investment in other affiliated investment companies, if any. These amounts are included in fees waived by Manager in the Statements of Operations. For the six months ended January 31, 2014, the Manager waived $4,774 and $527,759 for Commodity Strategies and Global Long/Short Credit, respectively.
For Commodity Strategies, the Manager provides investment management and other services to the Subsidiary. The Manager does not receive separate compensation from the Subsidiary for providing investment management or administrative services. However, Commodity Strategies pays the Manager based on Commodity Strategies’ net assets, which include the assets of the Subsidiary.
The Manager entered into separate sub-advisory agreements with BlackRock International Limited (“BIL”), an affiliate of the Manager, to serve as sub-advisor for Commodity Strategies and with BlackRock Financial Management, Inc. (“BFM”) and BIL, each an affiliate of the Manager, to serve as sub-advisors for Global Long/Short Credit. The Manager pays BFM and BIL, as applicable, for services they provide, a monthly fee that is a percentage of the investment advisory fees paid by the Funds to the Manager.
The Trust, on behalf of the Funds, entered into a Distribution Agreement and Distribution and Service Plan with BlackRock Investments, LLC (“BRIL”), an affiliate of the Manager. Pursuant to the Distribution and Service Plan and in accordance with Rule 12b-1 under the 1940 Act, the Funds pay BRIL ongoing service and distribution fees. The fees are
accrued daily and paid monthly at annual rates based upon the average daily net assets of the shares of each Fund as follows:
| | | | | | | | |
| | | Service
Fee | | | Distribution
Fee | |
Investor A | | | 0.25 | % | | | — | |
Investor C | | | 0.25 | % | | | 0.75 | % |
Pursuant to sub-agreements with BRIL, broker-dealers and BRIL provide shareholder servicing and distribution services to each Fund. The ongoing service and/or distribution fee compensates BRIL and each broker-dealer for providing shareholder servicing and/or distribution related services to Investor A and Investor C shareholders.
For the six months ended January 31, 2014, the following table shows the class specific service and distribution fees borne directly by each class of each Fund:
| | | | | | | | | | | | |
| | | Investor A | | | Investor C | | | Total | |
Commodity Strategies | | $ | 22,353 | | | $ | 51,060 | | | $ | 73,413 | |
Global Long/Short Credit | | $ | 1,764,694 | | | $ | 1,158,208 | | | $ | 2,922,902 | |
Pursuant to written agreements, certain financial intermediaries, some of which may be affiliates, provide the Funds with sub-accounting, recordkeeping, sub-transfer agency and other administrative services with respect to sub-accounts they service. For these services, these entities receive an asset based fee or an annual fee per shareholder account, which will vary depending on share class and/or net assets. For the six months ended January 31, 2014, Global Long/Short Credit paid the following to affiliates in return for these services, which is included in transfer agent — class specific in the Statements of Operations
| | | | | | | | |
| | | Institutional | | | Investor A | |
Global Long/Short Credit | | $ | 703 | | | $ | 133 | |
The Manager maintains a call center, which is responsible for providing certain shareholder services to the Funds, such as responding to share-holder inquiries and processing transactions based upon instructions from shareholders with respect to the subscription and redemption of Fund shares. For the six months ended January 31, 2014, each Fund reimbursed the Manager the following amounts for costs incurred in running the call center, which are included in transfer agent — class specific in the Statements of Operations:
| | | | | | | | | | | | | | | | |
| | | Institutional | | | Investor A | | | Investor C | | | Total | |
Commodity Strategies | | $ | 731 | | | $ | 278 | | | $ | 172 | | | $ | 1,181 | |
Global Long/Short Credit | | $ | 634 | | | $ | 823 | | | $ | 186 | | | $ | 1,643 | |
For the six months ended January 31, 2014, the following table shows the class specific transfer agent fees borne directly by each class of each Fund:
| | | | | | | | | | | | | | | | |
| | | Institutional | | | Investor A | | | Investor C | | | Total | |
Commodity Strategies | | $ | 29,831 | | | $ | 14,285 | | | $ | 6,341 | | | $ | 50,457 | |
Global Long/Short Credit | | $ | 429,962 | | | $ | 480,592 | | | $ | 49,962 | | | $ | 960,516 | |
BNY Mellon Investment Servicing (US) Inc. (“BNYMIS”) and the Manager act as co-administrators for the Funds. For these services, the co-administrators receive an administration fee computed daily and
| | | | | | |
| 58 | | BLACKROCK FUNDS | | JANUARY 31, 2014 | | |
| | |
| Notes to Financial Statements (continued) | | |
payable monthly to each administrator pursuant to separate fee arrangements, based on a percentage of the average daily net assets of each Fund. The combined administration fee, which is shown as administration in the Statements of Operations, is paid at the following annual rates:
| | | | |
| Average Daily Net Assets | | Administration Fee | |
First $500 million | | | 0.075 | % |
$500 million - $1 billion | | | 0.065 | % |
Greater than $1 billion | | | 0.055 | % |
In addition, each of the share classes is charged an administration fee, which is shown as administration – class specific in the Statements of Operations, based on the following percentages of average daily net assets of each respective class:
| | | | |
| Average Daily Net Assets | | Administration Fee —
Class Specific | |
First $500 million | | | 0.025 | % |
$500 million - $1 billion | | | 0.015 | % |
Greater than $1 billion | | | 0.005 | % |
For the six months ended January 31, 2014, the Funds paid the following to the Manager in return for these services, which are included in administration and administration — class specific in the Statements of Operations:
| | | | |
Commodity Strategies | | $ | 151,044 | |
Global Long/Short Credit | | $ | 963,389 | |
For the six months ended January 31, 2014, the following table shows the class specific administration fees borne directly by each class of each Fund:
| | | | | | | | | | | | | | | | |
| | | Institutional | | | Investor A | | | Investor C | | | Total | |
Commodity Strategies | | $ | 49,150 | | | $ | 2,236 | | | $ | 1,276 | | | $ | 52,662 | |
Global Long/Short Credit | | $ | 127,552 | | | $ | 110,494 | | | $ | 28,910 | | | $ | 266,956 | |
BNYMIS and the Manager may have, at their discretion, voluntarily waived all or any portion of their administration fees for a Fund or a share class which are included in administration fees waived — class specific in the Statements of Operations.
The Manager contractually agreed to waive and/or reimburse fees or expenses in order to limit expenses, excluding interest expense, dividend expense, income tax expense, acquired fund fees and expenses and certain other fund expenses, which constitute extraordinary expenses not incurred in the ordinary course of the Funds’ business. The expense limitations as a percentage of average daily net assets are as follows:
| | | | | | | | | | | | |
| | | Institutional | | | Investor A | | | Investor C | |
Commodity Strategies | | | 1.30 | % | | | 1.50 | % | | | 2.25 | % |
Global Long/Short Credit | | | 1.20 | % | | | 1.40 | % | | | 2.15 | % |
The Manager has agreed not to reduce or discontinue this contractual waiver or reimbursement prior to December 1, 2014 unless approved by the Board, including a majority of the Independent Trustees.
These amounts waived or reimbursed, if any, are included in fees waived by Manager, and shown as administration fees waived — class specific,
transfer agent fees waived — class specific and transfer agent fees reimbursed — class specific, respectively, in the Statements of Operations. For the six months ended January 31, 2014, the Manager waived $92,584 of investment advisory fees for Commodity Strategies which is included in fees waived by Manager.
Class specific expense waivers or reimbursements are as follows:
| | | | | | | | | | | | |
| Administration Fees Waived | | | | | | | | | |
| | | Investor A | | | Investor C | | | Total | |
Commodity Strategies | | $ | 2,236 | | | $ | 1,276 | | | $ | 3,512 | |
| | | | | | | | | | | | |
| Transfer Agent Fees Waived | | | | | | | | | |
| | | Investor A | | | Investor C | | | Total | |
Commodity Strategies | | $ | 279 | | | $ | 172 | | | $ | 451 | |
| | | | | | | | | | | | |
| Transfer Agent Fees Reimbursed | | | | | | | | | |
| | | Investor A | | | Investor C | | | Total | |
Commodity Strategies | | $ | 13,613 | | | $ | 6,108 | | | $ | 19,721 | |
If during the Funds’ fiscal year the operating expenses of a share class, that at any time during the prior two fiscal years received a waiver or reimbursement from the Manager, are less than the expense limit for that share class, the Manager is entitled to be reimbursed by such share class up to the lesser of (a) the amount of fees waived or expenses reimbursed during those prior two fiscal years under the agreement and (b) the amount by which the expense limit for that share class exceeds the operating expenses of the share class for the current fiscal year, provided that: (1) the Fund, of which the share class is a part, has more than $50 million in assets for the fiscal year and (2) the Manager or an affiliate continues to serve as the Fund’s investment advisor or administrator. In the event the expense limit for a share class is changed subsequent to a fiscal year in which the Manager becomes entitled to reimbursement for fees waived or reimbursed, the amount available to reimburse the Manager shall be calculated by reference to the expense limit for that share class in effect at the time the Manager became entitled to receive such reimbursement, rather than the subsequently changed expense limit for that share class.
For the six months ended January 31, 2014, the Manager recouped the following Fund level and class specific waivers and/or reimbursements previously recorded by the Funds:
| | | | | | | | | | | | | | | | | | | | |
| | | Fund Level | | | Institutional | | | Investor A | | | Investor C | | | Total | |
Commodity Strategies | | | — | | | $ | 7,832 | | | | — | | | | — | | | $ | 7,832 | |
Global Long/Short Credit | | $ | 143 | | | $ | 15,718 | | | $ | 40,947 | | | $ | 3,401 | | | $ | 60,209 | |
| | | | | | |
| | | BLACKROCK FUNDS | | JANUARY 31, 2014 | | 59 |
| | |
| Notes to Financial Statements (continued) | | |
On January 31, 2014, the Fund level and class specific waivers and/or reimbursements subject to possible future recoupment under the expense limitation agreement are as follows:
| | | | | | | | | | | | |
| | | Expires July 31, | |
| | | 2014 | | | 2015 | | | 2016 | |
Commodity Strategies | | | | | | | | | | | | |
Fund Level | | $ | 255,733 | | | $ | 269,119 | | | $ | 92,584 | |
Investor A | | $ | 9,256 | | | $ | 31,851 | | | $ | 16,128 | |
Investor C | | $ | 6,654 | | | $ | 12,821 | | | $ | 7,556 | |
For the six months ended January 31, 2014, affiliates earned underwriting discounts, direct commissions and dealer concessions on sales of each Fund’s Investor A Shares as follows:
| | | | |
Commodity Strategies | | $ | 2,241 | |
Global Long/Short Credit | | $ | 77,679 | |
For the six months ended January 31, 2014, affiliates received CDSCs as follows:
| | | | | | | | |
| | | Investor A | | | Investor C | |
Commodity Strategies | | $ | 284 | | | $ | 2,921 | |
Global Long/Short Credit | | $ | 25,516 | | | $ | 71,609 | |
Commodity Strategies received an exemptive order from the Securities and Exchange Commission permitting it, among other things, to pay an affiliated securities lending agent a fee based on a share of the income derived from the securities lending activities and has retained BIM as the securities lending agent. BIM, on behalf of Commodity Strategies, may invest cash collateral received by Commodity Strategies for such loans in a private investment company managed by the Manager or in registered money market funds advised by the Manager or its affiliates. The market value of securities on loan and the value of the related collateral, if applicable, is shown in the Statement of Assets and Liabilities as securities loaned at value and collateral on securities loaned at value, respectively. The cash collateral invested by BIM, if any, is disclosed in the Schedule
of Investments. Securities lending income is equal to the total of income earned from the reinvestment of cash collateral, net of rebates paid to, or fees paid by, borrowers of securities. Commodity Strategies retains 65% of securities lending income and pays a fee to BIM equal to 35% of such income. Commodity Strategies benefits from a borrower default indemnity provided by BlackRock. As securities lending agent, BIM bears all operational costs directly related to securities lending as well as the cost of borrower default indemnification. BIM does not receive any fees for managing the cash collateral. The share of income earned by Commodity Strategies is shown as securities lending — affiliated — net in the Statements of Operations. For the six months ended January 31, 2014, BIM received $1,572 in securities lending agent fees related to securities lending activities for Commodity Strategies.
Commodity Strategies recorded payments from an affiliate to compensate for foregone securities lending revenue, which is shown as other income — affiliated in the Statement of Operations.
Certain officers and/or trustees of the Trust are officers and/or directors of BlackRock or its affiliates. The Funds reimburse the Manager for a portion of the compensation paid to the Trust’s Chief Compliance Officer, which is included in officer and trustees in the Statements of Operations.
6. Purchases and Sales:
Purchases and sales of investments, including paydowns and excluding short-term securities and US government securities, for the six months ended January 31, 2014, were as follows:
| | | | | | | | |
| | | Purchases | | | Sales | |
Commodity Strategies | | $ | 75,160,607 | | | $ | 78,334,424 | |
Global Long/Short Credit | | $ | 3,531,158,986 | | | $ | 1,198,080,409 | |
Purchases and sales of US government securities for Global Long/Short Credit, for the six months ended January 31, 2014, were $104,779,191 and $141,027,055, respectively.
Transactions in options written for the six months ended January 31, 2014, were as follows:
| | | | | | | | | | | | | | | | | | | | |
| Global Long/Short Credit | |
| | | Calls | | | Puts | |
| | | Contracts | | | Premiums
Received | | | Contracts | | | Notional
(000)1 | | | Premiums
Received | |
Outstanding options, beginning of period | | | — | | | | — | | | | — | | | | — | | | | — | |
Options written | | | 10,000 | | | $ | 559,613 | | | | 19,445 | | | $ | 938,730 | | | $ | 3,279,392 | |
Options expired | | | — | | | | | | | | (10,445 | ) | | | (575,990 | ) | | | (1,341,109 | ) |
Options closed | | | (10,000 | ) | | | (559,613 | ) | | | (9,000 | ) | | | — | | | | (1,468,134 | ) |
| | | | | | | | |
Outstanding options, end of period | | | — | | | | — | | | | — | | | $ | 362,740 | | | $ | 470,149 | |
| | | | | | | | |
| | 1 | Amount shown is in currency in which the transaction was denominated. |
| | | | | | |
| 60 | | BLACKROCK FUNDS | | JANUARY 31, 2014 | | |
| | |
| Notes to Financial Statements (continued) | | |
7. Income Tax Information:
As of July 31, 2013, Commodity Strategies had a capital loss carryforward, with no expiration date, available to offset future realized capital gains of $1,344,396.
As of January 31, 2014, gross unrealized appreciation and depreciation based on cost for federal income tax purposes were as follows:
| | | | | | | | |
| | | Commodity
Strategies | | | Global
Long/Short
Credit | |
Tax cost | | $ | 416,316,740 | | | $ | 5,662,527,259 | |
| | | | |
Gross unrealized appreciation | | $ | 14,084,564 | | | $ | 120,721,988 | |
Gross unrealized depreciation | | | (24,701,068 | ) | | | (14,922,237 | ) |
| | | | |
Net unrealized appreciation (depreciation) | | $ | (10,616,504 | ) | | $ | 105,799,751 | |
| | | | |
8. Bank Borrowings:
The Trust, on behalf of the Funds, along with certain other funds managed by the Manager and its affiliates (“Participating Funds”), is a party to a 364-day, $800 million credit agreement with a group of lenders, under which the Funds may borrow to fund shareholder redemptions. The agreement expires in April 2014. Excluding commitments designated for a certain individual fund, other Participating Funds, including the Funds, can borrow up to an aggregate commitment amount of $500 million, subject to asset coverage and other limitations as specified in the agreement. The credit agreement has the following terms: a fee of 0.065% per annum on unused commitment amounts and interest at a rate equal to the higher of (a) the one-month LIBOR plus 0.80% per annum or (b) the Fed Funds rate plus 0.80% per annum on amounts borrowed. Participating Funds paid administration and arrangement fees which, along with commitment fees, were allocated among such funds based upon portions of the aggregate commitment available to them and relative net assets of Participating Funds. The Funds did not borrow under the credit agreement during the six months ended January 31, 2014.
9. Concentration, Market and Credit Risk:
In the normal course of business, the Funds invest in securities and enter into transactions where risks exist due to fluctuations in the market (market risk) or failure of the issuer of a security to meet all its obligations (issuer credit risk). The value of securities held by the Funds may decline in response to certain events, including those directly involving
the issuers whose securities are owned by the Funds; conditions affecting the general economy; overall market changes; local, regional or global political, social or economic instability; and currency and interest rate and price fluctuations. Similar to issuer credit risk, the Funds may be exposed to counterparty credit risk, or the risk that an entity with which the Funds have unsettled or open transactions may fail to or be unable to perform on its commitments. The Funds manage counterparty credit risk by entering into transactions only with counterparties that they believe have the financial resources to honor their obligations and by monitoring the financial stability of those counterparties. Financial assets, which potentially expose the Funds to market, issuer and counterparty credit risks, consist principally of financial instruments and receivables due from counterparties. The extent of the Funds’ exposure to market, issuer and counterparty credit risks with respect to these financial assets is generally approximated by their value recorded in the Statements of Assets and Liabilities, less any collateral held by the Funds.
The Funds invest a significant portion of its assets in fixed-income securities and/or uses derivatives tied to the fixed income markets. See the Schedules of Investments for these securities and/or derivatives. Changes in market interest rates or economic conditions, including the Federal Reserve’s decision in December 2013 to taper its quantitative easing policy, may affect the value and/or liquidity of such investments. Interest rate risk is the risk that prices of bonds and other fixed-income securities will increase as interest rates fall and decrease as interest rates rise. The Fund may be subject to a greater risk of rising interest rates due to the current period of historically low rates.
As of January 31, 2014, Commodity Strategies invested a significant portion of its assets in securities in the materials and energy sectors and commodity-linked notes. Changes in economic conditions affecting the materials and energy sectors and commodity-linked notes would have a greater impact on Commodity Strategies and could affect the value, income and/or liquidity of positions in such securities.
As of January 31, 2014, Global Long/Short Credit invested a substantial amount of its assets in issuers located in a single country or a limited number of countries. When Global Long/Short Credit concentrates its investments in this manner, it assumes the risk that economic, political and social conditions in those countries may have a significant impact on its investment performance.
10. Capital Share Transactions:
Transactions in capital shares for each class were as follows:
| | | | | | | | | | | | | | | | | | |
| | | Six Months Ended
January 31, 2014 | | | | | Year Ended
July 31, 2013 | |
| Commodity Strategies | | Shares | | | Amount | | | | | Shares | | | Amount | |
| Institutional | | | | | | | | | | | | | | |
Shares sold | | | 2,987,440 | | | $ | 27,859,353 | | | | | | 40,935,384 | | | $ | 420,434,660 | |
Shares issued in reinvestment of dividends and distributions | | | — | | | | — | | | | | | 6,448 | | | | 64,989 | |
Shares redeemed | | | (2,568,499 | ) | | | (23,821,221 | ) | | | | | (5,978,303 | ) | | | (61,334,477 | ) |
| | | | | | | | | | |
Net increase | | | 418,941 | | | $ | 4,038,132 | | | | | | 34,963,529 | | | $ | 359,165,172 | |
| | | | | | | | | | |
| | | | | | |
| | | BLACKROCK FUNDS | | JANUARY 31, 2014 | | 61 |
| | |
| Notes to Financial Statements (concluded) | | |
| | | | | | | | | | | | | | | | | | |
| | | Six Months Ended
January 31, 2014 | | | | | Year Ended
July 31, 2013 | |
| Commodity Strategies | | Shares | | | Amount | | | | | Shares | | | Amount | |
| | | | | | | | | | | | | | | | | | |
Investor A | | | | | | | | | | | | | | | | | | |
Shares sold | | | 444,473 | | | $ | 4,153,020 | | | | | | 1,554,463 | | | $ | 15,471,926 | |
Shares issued in reinvestment of dividends and distributions | | | — | | | | — | | | | | | — | | | | — | |
Shares redeemed | | | (568,163 | ) | | | (5,297,047 | ) | | | | | (1,190,461 | ) | | | (11,520,849 | ) |
| | | | | | | | | | |
Net decrease | | | (123,690 | ) | | $ | (1,144,027 | ) | | | | | 364,002 | | | $ | 3,951,077 | |
| | | | | | | | | | |
| | | | | | | | | | | | | | | | | | |
Investor C | | | | | | | | | | | | | | | | | | |
Shares sold | | | 98,733 | | | $ | 904,290 | | | | | | 553,796 | | | $ | 5,499,853 | |
Shares issued in reinvestment of distributions | | | — | | | | — | | | | | | — | | | | — | |
Shares redeemed | | | (295,174 | ) | | | (2,711,670 | ) | | | | | (285,252 | ) | | | (2,793,874 | ) |
| | | | | | | | | | |
Net decrease | | | (196,441 | ) | | $ | (1,807,380 | ) | | | | | 268,544 | | | $ | 2,705,979 | |
| | | | | | | | | | |
Total Net Increase | | | 98,810 | | | $ | 1,086,725 | | | | | | 35,596,075 | | | $ | 365,822,228 | |
| | | | | | | | | | |
| | | | | | | | | | | | | | | | | | |
| Global Long/Short Credit | | | | | | | | | | | | | | |
Institutional | | | | | | | | | | | | | | | | | | |
Shares sold | | | 170,259,219 | | | $ | 1,826,362,232 | | | | | | 127,117,761 | | | $ | 1,350,954,746 | |
Shares issued in reinvestment of dividends and distributions | | | 898,017 | | | | 9,656,079 | | | | | | 497,097 | | | | 5,266,587 | |
Shares redeemed | | | (33,990,062 | ) | | | (365,210,013 | ) | | | | | (14,847,896 | ) | | | (157,704,568 | ) |
| | | | | | | | | | |
Net increase | | | 137,167,174 | | | $ | 1,470,808,298 | | | | | | 112,766,962 | | | $ | 1,198,516,765 | |
| | | | | | | | | | |
| | | | | | | | | | | | | | | | | | |
Investor A | | | | | | | | | | | | | | | | | | |
Shares sold | | | 104,096,728 | | | $ | 1,113,667,134 | | | | | | 87,456,273 | | | $ | 927,368,554 | |
Shares issued in reinvestment of dividends and distributions | | | 668,526 | | | | 7,175,504 | | | | | | 401,637 | | | | 4,250,081 | |
Shares redeemed | | | (24,770,110 | ) | | | (266,036,803 | ) | | | | | (8,983,325 | ) | | | (95,244,107 | ) |
| | | | | | | | | | |
Net increase | | | 79,995,144 | | | $ | 854,805,835 | | | | | | 78,874,585 | | | $ | 836,374,528 | |
| | | | | | | | | | |
| | | | | | | | | | | | | | | | | | |
Investor C | | | | | | | | | | | | | | | | | | |
Shares sold | | | 14,182,478 | | | $ | 150,989,712 | | | | | | 14,361,198 | | | $ | 151,724,875 | |
Shares issued in reinvestment of dividends and distributions | | | 29,987 | | | | 321,052 | | | | | | 35,999 | | | | 378,775 | |
Shares redeemed | | | (1,675,948 | ) | | | (17,861,825 | ) | | | | | (847,200 | ) | | | (8,932,962 | ) |
| | | | | | | | | | |
Net increase | | | 12,536,517 | | | $ | 133,448,939 | | | | | | 13,549,997 | | | $ | 143,170,688 | |
| | | | | | | | | | |
Total Net Increase | | | 229,698,835 | | | $ | 2,459,063,072 | | | | | | 205,191,544 | | | $ | 2,178,061,981 | |
| | | | | | | | | | |
11. Subsequent Events:
Management has evaluated the impact of all subsequent events on the Funds through the date the financial statements were issued and has determined that there were no subsequent events requiring adjustment or additional disclosure in the financial statements.
| | | | | | |
| 62 | | BLACKROCK FUNDS | | JANUARY 31, 2014 | | |
Ronald W. Forbes, Co-Chairman of the Board and Trustee
Rodney D. Johnson, Co-Chairman of the Board and Trustee
Paul L. Audet, Trustee
David O. Beim, Trustee
Henry Gabbay, Trustee
Dr. Matina S. Horner, Trustee
Herbert I. London, Trustee
Ian A. MacKinnon, Trustee
Cynthia A. Montgomery, Trustee
Joseph P. Platt, Trustee
Robert C. Robb, Jr., Trustee
Toby Rosenblatt, Trustee
Kenneth L. Urish, Trustee
Frederick W. Winter, Trustee
John M. Perlowski, President and Chief Executive Officer
Richard Hoerner, CFA, Vice President
Brendan Kyne, Vice President
Neal Andrews, Chief Financial Officer
Jay Fife, Treasurer
Brian Kindelan, Chief Compliance Officer and Anti-Money Laundering Officer
Benjamin Archibald, Secretary
Investment Advisor and Co-Administrator
BlackRock Advisors, LLC
Wilmington, DE 19809
Sub-Advisors
BlackRock International Limited1, 2
Edinburgh, EH3 8JB, United Kingdom
BlackRock Financial Management, Inc.2
New York, NY 10055
Distributor
BlackRock Investments, LLC
New York, NY 10022
Accounting Agent, Co-Administrator and Transfer Agent
BNY Mellon Investment Servicing (US) Inc.
Wilmington, DE 19809
Custodian
The Bank of New York Mellon
New York, NY 10286
Legal Counsel
Sidley Austin LLP
New York, NY 10019
Independent Registered Public Accounting Firm
PricewaterhouseCoopers LLC
Philadelphia, PA 19103
Address of the Trust
100 Bellevue Parkway
Wilmington, DE 19809
| | 1 | For Commodity Strategies. |
| | 2 | For Global Long/Short Credit. |
| | | | | | |
| | | BLACKROCK FUNDS | | JANUARY 31, 2014 | | 63 |
Electronic Delivery
Electronic copies of most financial reports and prospectuses are available on the Funds’ websites or shareholders can sign up for e-mail notifications of quarterly statements, annual and semi-annual reports and prospectuses by enrolling in the Funds’ electronic delivery program.
To enroll:
Shareholders Who Hold Accounts with Investment Advisors, Banks or Brokerages:
Please contact your financial advisor. Please note that not all investment advisors, banks or brokerages may offer this service.
Shareholders Who Hold Accounts Directly with BlackRock:
| 1) | Access the BlackRock website at |
| | http://www.blackrock.com/ edelivery |
| 2) | Select “eDelivery” under the “More Information” section |
Householding
The Funds will mail only one copy of shareholder documents, including prospectuses, annual and semi-annual reports and proxy statements, to shareholders with multiple accounts at the same address. This practice is commonly called “householding” and is intended to reduce expenses and eliminate duplicate mailings of shareholder documents. Mailings of your shareholder documents may be householded indefinitely unless you instruct us otherwise. If you do not want the mailing of these documents to be combined with those for other members of your household, please call the Funds at (800) 441-7762.
Availability of Quarterly Schedule of Investments
The Funds file their complete schedule of portfolio holdings with the SEC for the first and third quarters of each fiscal year on Form N-Q. The Funds’ Forms N-Q are available on the SEC’s website at http:// www.sec.gov and may also be reviewed and copied at the SEC’s Public Reference Room in Washington, DC. Information on how to access documents on the SEC’s website without charge may be obtained by calling (800) SEC-0330. The Funds’ Forms N-Q may also be obtained upon request and without charge by calling (800) 441-7762.
Availability of Proxy Voting Policies and Procedures
A description of the policies and procedures that the Funds use to determine how to vote proxies relating to portfolio securities is available (1) without charge, upon request, by calling (800) 441-7762; (2) at http://www.blackrock.com; and (3) on the SEC’s website at http:// www.sec.gov.
Availability of Proxy Voting Record
Information about how the Funds voted proxies relating to securities held in the Funds’ portfolios during the most recent 12-month period ended June 30 is available upon request and without charge (1) at http://www.blackrock.com or by calling (800) 441-7762 and (2) on the SEC’s website at http://www.sec.gov.
Account Information
Call us at (800) 441-7762 from 8:00 AM to 6:00 PM EST on any business day to get information about your account balances, recent transactions and share prices. You can also reach us on the Web at http:// www.blackrock.com/funds.
Automatic Investment Plans
Investor Class shareholders who want to invest regularly can arrange to have $50 or more automatically deducted from their checking or savings account and invested in any of the BlackRock funds.
Systematic Withdrawal Plans
Investor Class shareholders can establish a systematic withdrawal plan and receive periodic payments of $50 or more from their BlackRock funds, as long as their account balance is at least $10,000.
Retirement Plans
Shareholders may make investments in conjunction with Traditional, Rollover, Roth, Coverdell, Simple IRAs, SEP IRAs and 403(b) Plans.
| | | | | | |
| 64 | | BLACKROCK FUNDS | | JANUARY 31, 2014 | | |
| | |
| Additional Information (concluded) | | |
|
| BlackRock Privacy Principles |
BlackRock is committed to maintaining the privacy of its current and former fund investors and individual clients (collectively, “Clients”) and to safeguarding their non-public personal information. The following information is provided to help you understand what personal information BlackRock collects, how we protect that information and why in certain cases we share such information with select parties.
If you are located in a jurisdiction where specific laws, rules or regulations require BlackRock to provide you with additional or different privacy-related rights beyond what is set forth below, then BlackRock will comply with those specific laws, rules or regulations.
BlackRock obtains or verifies personal non-public information from and about you from different sources, including the following: (i) information we receive from you or, if applicable, your financial intermediary, on applications, forms or other documents; (ii) information about your transactions with us, our affiliates, or others; (iii) information we receive from a consumer reporting agency; and (iv) from visits to our websites.
BlackRock does not sell or disclose to non-affiliated third parties any non-public personal information about its Clients, except as permitted by law or as is necessary to respond to regulatory requests or to service Client accounts. These non-affiliated third parties are required to protect the confidentiality and security of this information and to use it only for its intended purpose.
We may share information with our affiliates to service your account or to provide you with information about other BlackRock products or services that may be of interest to you. In addition, BlackRock restricts access to non-public personal information about its Clients to those BlackRock employees with a legitimate business need for the information. BlackRock maintains physical, electronic and procedural safeguards that are designed to protect the non-public personal information of its Clients, including procedures relating to the proper storage and disposal of such information.
| | | | | | |
| | | BLACKROCK FUNDS | | JANUARY 31, 2014 | | 65 |
| | |
| A World-Class Mutual Fund Family | | |
BlackRock offers a diverse lineup of open-end mutual funds crossing all investment styles and managed by experts in equity, fixed income and tax-
exempt investing.
BlackRock ACWI ex-US Index Fund
BlackRock All-Cap Energy & Resources Portfolio
BlackRock Basic Value Fund
BlackRock Capital Appreciation Fund
BlackRock Commodity Strategies Fund
BlackRock Disciplined Small Cap Core Fund
BlackRock Emerging Markets Fund
BlackRock Emerging Markets Dividend Fund
BlackRock Emerging Markets Long/Short Equity Fund
BlackRock Energy & Resources Portfolio
BlackRock Equity Dividend Fund
BlackRock EuroFund
BlackRock Flexible Equity Fund
BlackRock Focus Growth Fund
BlackRock Global Dividend Portfolio
BlackRock Global Long/Short Equity Fund
BlackRock Global Opportunities Portfolio
BlackRock Global SmallCap Fund
BlackRock Health Sciences Opportunities Portfolio
BlackRock International Fund
BlackRock International Index Fund
BlackRock International Opportunities Portfolio
BlackRock Large Cap Core Fund
BlackRock Large Cap Core Plus Fund
BlackRock Large Cap Growth Fund
BlackRock Large Cap Value Fund
BlackRock Latin America Fund
BlackRock Long-Horizon Equity Fund
BlackRock Mid-Cap Growth Equity Portfolio
BlackRock Mid-Cap Value Opportunities Fund
BlackRock Natural Resources Trust
BlackRock Pacific Fund
BlackRock Real Estate Securities Fund
BlackRock Russell 1000® Index Fund
BlackRock Science & Technology Opportunities Portfolio
BlackRock Small Cap Growth Equity Portfolio
BlackRock Small Cap Growth Fund II
BlackRock Small Cap Index Fund
BlackRock S&P 500 Stock Fund
BlackRock U.S. Opportunities Portfolio
BlackRock Value Opportunities Fund
|
| Taxable Fixed Income Funds |
BlackRock Bond Index Fund
BlackRock Core Bond Portfolio
BlackRock CoreAlpha Bond Fund
BlackRock CoRI Funds
2015
2017
2019
2021
2023
BlackRock Emerging Markets Flexible Dynamic Bond Portfolio
BlackRock Floating Rate Income Portfolio
BlackRock Global Long/Short Credit Fund
BlackRock GNMA Portfolio
BlackRock High Yield Bond Portfolio
BlackRock Inflation Protected Bond Portfolio
BlackRock International Bond Portfolio
BlackRock Investment Grade Bond Portfolio
BlackRock Low Duration Bond Portfolio
BlackRock Secured Credit Portfolio
BlackRock Short Obligations Fund
BlackRock Short-Term Treasury Fund
BlackRock Strategic Income Opportunities Portfolio
BlackRock Total Return Fund
BlackRock U.S. Government Bond Portfolio
BlackRock U.S. Mortgage Portfolio
BlackRock Ultra-Short Obligations Fund
BlackRock World Income Fund
|
| Municipal Fixed Income Funds |
BlackRock California Municipal Bond Fund
BlackRock High Yield Municipal Fund
BlackRock National Municipal Fund
BlackRock New Jersey Municipal Bond Fund
BlackRock New York Municipal Bond Fund
BlackRock Pennsylvania Municipal Bond Fund
BlackRock Short-Term Municipal Fund
BlackRock Strategic Municipal Opportunities Fund
| | | | | | | | | | | | | | |
| BlackRock Balanced Capital Fund | | LifePath Active Portfolios | | LifePath Index Portfolios |
| BlackRock Emerging Market Allocation Portfolio | | 2015 | | | 2040 | | | | | Retirement | | 2040 | | |
| BlackRock Global Allocation Fund | | 2020 | | | 2045 | | | | | 2020 | | 2045 | | |
| BlackRock Managed Volatility Portfolio | | 2025 | | | 2050 | | | | | 2025 | | 2050 | | |
| BlackRock Multi-Asset Income Portfolio | | 2030 | | | 2055 | | | | | 2030 | | 2055 | | |
| BlackRock Multi-Asset Real Return Fund | | 2035 | | | | | | | | 2035 | | | | |
| | | | | | |
| BlackRock Strategic Risk Allocation Fund | | LifePath Portfolios | | | | | | | | | | | | |
BlackRock Prepared Portfolios | | Retirement | | | 2040 | | | | | | | | | |
Conservative Prepared Portfolio | | 2020 | | | 2045 | | | | | | | | | |
Moderate Prepared Portfolio | | 2025 | | | 2050 | | | | | | | | | |
Growth Prepared Portfolio | | 2030 | | | 2055 | | | | | | | | | |
Aggressive Growth Prepared Portfolio | | 2035 | | | | | | | | | | | | |
BlackRock mutual funds are currently distributed by BlackRock Investments, LLC. You should consider the investment objectives, risks, charges and expenses of the funds under consideration carefully before investing. Each fund’s prospectus contains this and other information and is available at www.blackrock.com or by calling (800) 441-7762 or from your financial advisor. The prospectus should be read carefully before investing.
| | | | | | |
| 66 | | BLACKROCK FUNDS | | JANUARY 31, 2014 | | |
This report is transmitted to shareholders only. It is not authorized for use as an offer of sale or a solicitation of an offer to buy shares of the Funds unless accompanied or preceded by that Fund’s current prospectus. Past performance results shown in this report should not be considered a representation of future performance. Investment returns and principal value of shares will fluctuate so that shares, when redeemed, may be worth more or less than their original cost. Statements and other information herein are as dated and are subject to change.
Investment in foreign securities involves special risks including fluctuating foreign exchange rates, foreign government regulations, differing degrees of liquidity and the possibility of substantial volatility due to adverse political, economic or other developments.

| | |
| |
CSGLSC-1/14-SAR | |  |
JANUARY 31, 2014
| | | | |
SEMI-ANNUAL REPORT (UNAUDITED) | | | | BLACKROCK® |
BlackRock FundsSM
„ BlackRock Multi-Asset Real Return Fund
„ BlackRock Strategic Risk Allocation Fund
| | |
| Not FDIC Insured ¡ May Lose Value ¡ No Bank Guarantee | | |
| | | | | | |
| 2 | | BLACKROCK FUNDS | | JANUARY 31, 2014 | | |
Dear Shareholder
One year ago, US financial markets were improving despite a sluggish global economy, as loose monetary policy beckoned investors to take on more risk in their portfolios. Slow but positive growth in the US was sufficient to support corporate earnings, while uncomfortably high unemployment reinforced expectations that the Federal Reserve would continue its aggressive monetary stimulus programs. International markets were not as fruitful in the earlier part of the year given uneven growth rates and more direct exposure to macro risks such as the resurgence of political instability in Italy, the banking crisis in Cyprus and a generally poor outlook for European economies. Additionally, emerging markets significantly lagged the rest of the world due to slowing growth and structural imbalances.
Global financial markets were rattled in May when Fed Chairman Bernanke mentioned the possibility of reducing (or “tapering”) the central bank’s asset purchase programs — comments that were widely misinterpreted as signaling an end to the Fed’s zero-interest-rate policy. US Treasury yields rose sharply, triggering a steep sell-off across fixed income markets. (Bond prices move in the opposite direction of yields.) Equity prices also suffered as investors feared the implications of a potential end of a program that had greatly supported the markets. Markets rebounded in late June, however, when the Fed’s tone turned more dovish, and improving economic indicators and better corporate earnings helped extend gains through most of the summer.
The fall was a surprisingly positive period for most asset classes after the Fed defied market expectations with its decision to delay tapering. Higher volatility returned in late September when the US Treasury Department warned that the national debt would soon breach its statutory maximum. The ensuing political brinksmanship led to a partial government shutdown, roiling global financial markets through the first half of October, but equities and other so-called “risk assets” resumed their rally when politicians engineered a compromise to reopen the government and extend the debt ceiling, at least temporarily.
The remainder of 2013 was generally positive for stock markets in the developed world, although investors continued to grapple with uncertainty about when and how much the Fed would scale back on stimulus. When the long-awaited taper announcement ultimately came in mid-December, the Fed reduced the amount of its monthly asset purchases but at the same time extended its time horizon for maintaining low short-term interest rates. Markets reacted positively, as this move signaled the Fed’s perception of real improvement in the economy and investors were finally relieved from the tenacious anxiety that had gripped them for quite some time.
Investors’ risk appetite diminished in the new year. Heightened volatility in emerging markets and mixed US economic data caused global equities to weaken in January while bond markets found renewed strength. While tighter global liquidity was an ongoing headwind for developing countries, financial troubles in Argentina and Turkey launched a sharp sell-off in a number of emerging market currencies. Unexpectedly poor economic data out of China added to the turmoil. In the US, most indicators continued to signal a strengthening economy; however, stagnant wage growth raised concerns about the sustainability of the overall positive momentum. US stocks underperformed other developed equity markets as a number of disappointing corporate earnings reports prompted investors to take advantage of lower valuations abroad.
While accommodative monetary policy was the main driver behind positive market performance over the period, it was also the primary cause of volatility and uncertainty. Developed market stocks were the strongest performers for the six- and 12-month periods ended January 31. In contrast, emerging markets were weighed down by uneven growth, high debt levels and severe currency weakness. Rising interest rates pressured US Treasury bonds and other high-quality fixed income sectors, including tax-exempt municipals and investment grade corporate bonds. High yield bonds, to the contrary, benefited from income-oriented investors’ search for yield in the low-rate environment. Short-term interest rates remained near zero, keeping yields on money market securities near historical lows.
At BlackRock, we believe investors need to think globally and extend their scope across a broader array of asset classes and be prepared to move freely as market conditions change over time. We encourage you to talk with your financial advisor and visit www.blackrock.com for further insight about investing in today’s world.
Sincerely,

Rob Kapito
President, BlackRock Advisors, LLC

“While accommodative monetary policy was the main driver behind positive market performance over the period, it was also the primary cause of volatility and uncertainty.”
Rob Kapito
President, BlackRock Advisors, LLC
| | | | | | | | |
| Total Returns as of January 31, 2014 | |
| | | 6-month | | | 12-month | |
US large cap equities
(S&P 500® Index) | | | 6.85 | % | | | 21.52 | % |
US small cap equities
(Russell 2000® Index) | | | 8.88 | | | | 27.03 | |
International equities
(MSCI Europe, Australasia, Far East Index) | | | 7.51 | | | | 11.93 | |
Emerging market equities
(MSCI Emerging Markets Index) | | | (0.33 | ) | | | (10.17 | ) |
3-month Treasury bill
(BofA Merrill Lynch
3-Month US Treasury
Bill Index) | | | 0.03 | | | | 0.08 | |
US Treasury securities
(BofA Merrill Lynch
10- Year US Treasury
Index) | | | 0.77 | | | | (2.97 | ) |
US investment grade
bonds (Barclays US
Aggregate Bond Index) | | | 1.78 | | | | 0.12 | |
Tax-exempt municipal
bonds (S&P Municipal Bond Index) | | | 3.13 | | | | (1.10 | ) |
US high yield bonds
(Barclays US Corporate
High Yield 2% Issuer
Capped Index) | | | 4.70 | | | | 6.76 | |
|
| Past performance is no guarantee of future results. Index performance is shown for illustrative purposes only. You cannot invest directly in an index. | |
| | | | | | |
| | | THIS PAGE NOT PART OF YOUR FUND REPORT | | | | 3 |
| | | | |
| Fund Summary as of January 31, 2014 | | | BlackRock Multi-Asset Real Return Fund | |
BlackRock Multi-Asset Real Return Fund’s (the “Fund”) investment objective is to seek to generate returns in excess of the actual rate of inflation over a complete market cycle.
|
| Portfolio Management Commentary |
How did the Fund perform?
| Ÿ | | For the six-month period ended January 31, 2014, the Fund outperformed its primary benchmarks, the Barclays US Treasury Inflation Protected Securities (“TIPS”) Index and the US Consumer Price Index. |
What factors influenced performance?
| Ÿ | | Major contributors to positive performance included the Fund’s exposures to master limited partnerships (“MLPs”), and funds that invested in health care equities, high yield bonds and floating rate bank loans. A substantial underweight in TIPS proved to be a meaningful contributor to overall performance as TIPS ended the period in negative territory amid rising interest rates. |
| Ÿ | | Despite having a meaningful underweight, the Fund’s exposure to TIPS during the period ultimately detracted from performance on an absolute basis as the asset class came under pressure from the combination of low inflation expectations and a rise in interest rates. The Fund’s allocation to gold detracted from overall performance. |
| Ÿ | | The Fund held derivatives during the period as a part of its investment strategy. Derivatives are used by the investment advisor as a means to manage and/or take outright views on interest rates, credit risk and/or foreign exchange positions in the Fund. During the period, the Fund’s derivatives positions had a negative impact on performance. |
Describe recent portfolio activity.
| Ÿ | | The Fund increased exposure to floating rate bank loans to benefit from attractive spread levels. It moved from cash into investment grade credit to increase return potential while maintaining downside protection. At period end, the Fund accumulated a small cash position to serve as a zero-duration fixed income asset (no sensitivity to interest rate movements) given higher interest rate volatility in recent months. The Fund reduced its exposure to health care equities in order to capture gains from strong outperformance over the year relative to broader equity markets. The Fund re-introduced an allocation to shorter-term TIPS to benefit from more attractive valuations. |
Describe Fund positioning at period end.
| Ÿ | | At period end, the Fund was allocated across a number of diverse asset classes. In fixed income funds, the Fund held floating rate bank loans, TIPS and high yield bonds. The Fund also held allocations to equities, commodities, real estate investment trusts (“REITs”) and MLPs. |
| Ÿ | | The Fund held a higher-than-normal cash allocation due to a large investment from a financial institution at period end. Cash was promptly invested after period end. |
The views expressed reflect the opinions of BlackRock as of the date of this report and are subject to change based on changes in market, economic or other conditions. These views are not intended to be a forecast of future events and are no guarantee of future results.
| | |
| Portfolio Composition | | Percent of
Investment
Companies |
| | | | |
Fixed Income Funds | | | 40 | % |
Money Market Funds | | | 37 | |
Equity Funds | | | 23 | |
| | |
| Ten Largest Holdings | | Percent of
Investment
Companies |
| | | | |
BlackRock Liquidity Funds, TempFund, Institutional Class | | | 36 | % |
BlackRock Floating Rate Income Portfolio, Institutional Class | | | 18 | |
iShares TIPS Bond ETF | | | 15 | |
Health Care Select Sector SPDR Fund | | | 4 | |
iShares iBoxx $ High Yield Corporate Bond ETF | | | 4 | |
Energy Select Sector SPDR Fund | | | 4 | |
iShares Gold Trust | | | 3 | |
iShares U.S. Real Estate ETF | | | 3 | |
Alerian MLP ETF | | | 3 | |
iShares International Developed Real Estate ETF | | | 3 | |
| | | | | | |
| 4 | | BLACKROCK FUNDS | | JANUARY 31, 2014 | | |
| | | | |
| | | | BlackRock Multi-Asset Real Return Fund | |
|
| Total Return Based on a $10,000 Investment |
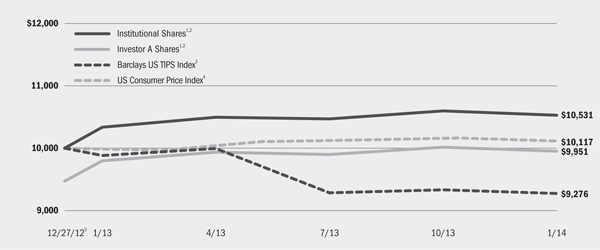
| | 1 | Assuming maximum sales charges, if any, transaction costs and other operating expenses, including investment advisory fees and administration fees, if any. Institutional Shares do not have a sales charge. |
| | 2 | The Fund uses an asset allocation strategy, investing varying percentages of its portfolio in the following major categories: TIPS, equity securities, REITs, MLPs and bonds. |
| | 3 | This is an index that measures the performance of the inflation-protected public obligations of the U.S. Treasury. |
| | 4 | This is a measure of the average change over time in the prices paid by urban consumers for a market basket of consumer goods and services. |
| | 5 | Commencement of operations. |
| | | | | | | | | | | | | | | | | | | | |
| Performance Summary for the Period Ended January 31, 2014 | |
| | | | | | Average Annual Total Returns6 | |
| | | | | | 1 Year | | | Since Inception7 | |
| | | 6-Month
Total Returns | | | w/o sales
charge | | | w/ sales
charge | | | w/o sales
charge | | | w/ sales
charge | |
Institutional | | | 0.58 | % | | | 1.85 | % | | | N/A | | | | 4.83 | % | | | N/A | |
Investor A | | | 0.51 | | | | 1.58 | | | | (3.76 | )% | | | 4.58 | | | | (0.44 | )% |
Investor C | | | 0.12 | | | | 0.79 | | | | (0.19 | ) | | | 3.85 | | | | 3.85 | |
Barclays US TIPS Index | | | (0.09 | ) | | | (6.17 | ) | | | N/A | | | | (6.65 | ) | | | N/A | |
US Consumer Price Index | | | (0.19 | ) | | | 1.50 | | | | N/A | | | | 1.07 | | | | N/A | |
| | 6 | Assuming maximum sales charges, if any. Average annual total returns with and without sales charges reflect reductions for distribution and service fees. See “About Fund Performance” on page 8 for a detailed description of share classes, including any related sales charges and fees. |
| | 7 | The Fund commenced operations on December 27, 2012. |
| | | N/A—Not applicable as share class and index do not have a sales charge. |
| | | Past performance is not indicative of future results. |
| | | | | | | | | | | | | | |
| Expense Example |
| | | Actual | | Hypothetical9 | | |
| | | Beginning Account Value
August 1, 2013 | | Ending Account Value
January 31, 2014 | | Expenses Paid
During the Period8 | | Beginning
Account Value
August 1, 2013 | | Ending
Account Value
January 31, 2014 | | Expenses Paid
During the Period8 | | Annualized
Expense Ratio |
Institutional | | $1,000.00 | | $1,005.80 | | $4.04 | | $1,000.00 | | $1,021.17 | | $4.08 | | 0.80% |
Investor A | | $1,000.00 | | $1,005.10 | | $5.31 | | $1,000.00 | | $1,019.91 | | $5.35 | | 1.05% |
Investor C | | $1,000.00 | | $1,001.20 | | $9.08 | | $1,000.00 | | $1,016.13 | | $9.15 | | 1.80% |
| | 8 | For each class of the Fund, expenses are equal to the annualized expense ratio for the class, multiplied by the average account value over the period, multiplied by 184/365 (to reflect the one-half year period shown). |
| | 9 | Hypothetical 5% annual return before expenses is calculated by pro rating the number of days in the most recent fiscal period divided by 365. |
| | | See “Disclosure of Expenses” on page 8 for further information on how expenses were calculated. |
| | | | | | |
| | | BLACKROCK FUNDS | | JANUARY 31, 2014 | | 5 |
| | | | |
| Fund Summary as of January 31, 2014 | | | BlackRock Strategic Risk Allocation Fund | |
BlackRock Strategic Risk Allocation Fund’s (the “Fund”) investment objective is to seek total return.
|
| Portfolio Management Commentary |
How did the Fund perform?
| Ÿ | | For the six-month period ended January 31, 2014, the Fund underperformed its custom blended benchmark index, 60% MSCI World Index Hedged USD Net/40% Barclays US Aggregate Bond Index. |
What factors influenced performance?
| Ÿ | | The Fund has a global multi-asset strategy designed to balance sources of risk and return more optimally than traditional asset allocation portfolios. The Fund may use derivatives to achieve exposures to all asset classes other than inflation-linked debt. In determining the appropriate allocation across asset classes, the Fund will seek to manage exposure to risks such as interest rate risk, credit risk, inflation risk, liquidity risk, economic risk and emerging market risk. |
| Ÿ | | The Fund’s exposure to emerging markets via sovereign debt and equities delivered negative returns as these markets continued to be shunned by investors due to concerns about slow growth in China, uneven growth rates across emerging market economies and severe volatility in emerging market currencies while facing a retrenchment in global liquidity as the US Federal Reserve began tapering its monetary stimulus program. |
| Ÿ | | Conversely, the Fund’s inflation, economic and credit risk exposures delivered positive returns during the period as nominal yields and inflation expectations declined while equities continued to rally. The strongest returns came from the Fund’s exposures to developed market equities, property (such as REITs) and commodities. |
Describe recent portfolio activity.
| Ÿ | | The Fund maintained its overall target level of risk during the majority of the period. The Fund began the period with a reduced risk profile due to |
| | heightened market volatility, but added back risk as market conditions normalized in September. However, as the overall level of risk was increased, the Fund reduced its allocation to interest rate risk strategies due to rising rate uncertainty. In November, the Fund reduced exposure to US high yield bonds (a credit risk strategy) as the sector had become expensive versus long-term valuations. Toward the end of the period, the Fund reduced exposure to its economic risk strategies while adding to liquidity risk strategies. |
| Ÿ | | At the end of the period, the Fund held an allocation to cash and cash equivalents and inflation-linked bonds. The cash and cash equivalents were utilized to achieve exposure via derivatives to a broad range of global asset classes, including developed market sovereign debt, investment grade and high yield credit, developed market equity, emerging market sovereign debt, property, emerging market equity, developed small cap equity, commodities and energy. |
| Ÿ | | During the period, the use of financial futures contracts and swaps contributed positively to results. The overall effect of derivatives did not have a material impact on Fund performance for the period. |
Describe Fund positioning at period end.
| Ÿ | | As of period end, the Fund maintained its full target risk allocation. The Fund’s investments were allocated across a broad range of global asset classes including developed market sovereign debt, inflation-linked debt, investment grade and high yield credit, developed market equity, emerging market sovereign debt, property, emerging market equity, developed small cap equity, commodities and energy investments. |
The views expressed reflect the opinions of BlackRock as of the date of this report and are subject to change based on changes in market, economic or other conditions. These views are not intended to be a forecast of future events and are no guarantee of future results.
| | |
| Portfolio Composition | | Percent of
Total
Investments |
| | | | |
Short-Term Securities | | | 53 | % |
U.S. Treasury Obligations | | | 26 | |
Fixed Income Funds | | | 21 | |
| | |
| Portfolio Holdings | | Percent of
Total
Investments |
| | | | |
BlackRock Liquidity Funds, TempFund, Institutional Class | | | 53 | % |
U.S. Treasury Notes | | | 26 | |
iShares TIPS Bond ETF | | | 21 | |
| | | | | | |
| 6 | | BLACKROCK FUNDS | | JANUARY 31, 2014 | | |
| | | | |
| | | | BlackRock Strategic Risk Allocation Fund | |
|
| Total Return Based on a $10,000 Investment |
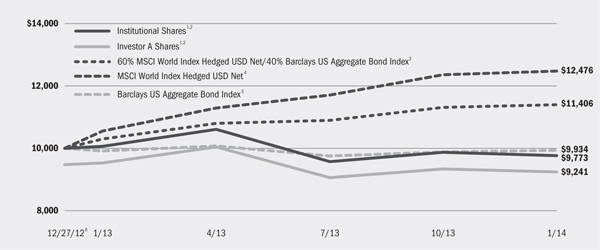
| | 1 | Assuming maximum sales charges, if any, transaction costs and other operating expenses, including investment advisory fees and administration fees, if any. Institutional Shares do not have a sales charge. |
| | 2 | The Fund invests in a broad range of global asset classes, such as equity securities, fixed and floating rate debt instruments, derivatives, other investment companies, REITs and commodity-related instruments. |
| | 3 | This customized weighted index is comprised of the returns of the 60% MSCI World Index Hedged USD Net/40% Barclays US Aggregate Bond Index. |
| | 4 | This is an index composed of the following 23 developed market country indices: Australia, Austria, Belgium, Canada, Denmark, Finland, France, Germany, Hong Kong, Ireland, Israel, Italy, Japan, Netherlands, New Zealand, Norway, Portugal, Singapore, Spain, Sweden, Switzerland, the United Kingdom, and the United States and calculated with net dividends reinvested daily on the ex-dividends date 100% hedged to USD using 1-month forward exchange rates. |
| | 5 | This index represents securities that are SEC-registered, taxable, and dollar denominated. The index covers the U.S. investment grade fixed rate bond market, with index components for government and corporate securities, mortgage pass-through securities, and asset-backed securities. These major sectors are subdivided into more specific indices that are calculated and reported on a regular basis. |
| | 6 | Commencement of operations. |
| | | | | | | | | | | | | | | | | | | | |
| Performance Summary for the Period Ended January 31, 2014 | |
| | | | | | Average Annual Total Returns7 | |
| | | | | | 1 Year | | | Since Inception8 | |
| | | 6-Month
Total Returns | | | w/o sales
charge | | | w/ sales
charge | | | w/o sales
charge | | | w/ sales
charge | |
Institutional | | | 2.06 | % | | | (2.92 | )% | | | N/A | | | | (2.08 | )% | | | N/A | |
Investor A | | | 1.97 | | | | (3.12 | ) | | | (8.20 | )% | | | (2.26 | ) | | | (6.95 | )% |
Investor C | | | 1.58 | | | | (3.90 | ) | | | (4.83 | ) | | | (3.07 | ) | | | (3.07 | ) |
60% MSCI World Index Hedged USD Net/40% Barclays US Aggregate Bond Index | | | 4.68 | | | | 10.73 | | | | N/A | | | | 12.81 | | | | N/A | |
MSCI World Index Hedged USD Net | | | 6.54 | | | | 18.21 | | | | N/A | | | | 22.46 | | | | N/A | |
Barclays US Aggregate Bond Index | | | 1.78 | | | | 0.12 | | | | N/A | | | | (0.61 | ) | | | N/A | |
| | 7 | Assuming maximum sales charges, if any. Average annual total returns with and without sales charges reflect reductions for distribution and service fees. See “About Fund Performance” on page 8 for a detailed description of share classes, including any related sales charges and fees. |
| | 8 | The Fund commenced operations on December 27, 2012. |
| | | N/A—Not applicable as share class and index do not have a sales charge. |
| | | Past performance is not indicative of future results. |
| | | | | | | | | | | | | | |
| Expense Example |
| | | Actual | | Hypothetical10 | | |
| | | Beginning
Account Value
August 1, 2013 | | Ending
Account Value
January 31, 2014 | | Expenses Paid
During the Period9 | | Beginning
Account Value
August 1, 2013 | | Ending
Account Value
January 31, 2014 | | Expenses Paid
During the Period9 | | Annualized
Expense Ratio |
Institutional | | $1,000.00 | | $1,020.60 | | $5.09 | | $1,000.00 | | $1,020.16 | | $5.09 | | 1.00% |
Investor A | | $1,000.00 | | $1,019.70 | | $6.36 | | $1,000.00 | | $1,018.90 | | $6.36 | | 1.25% |
Investor C | | $1,000.00 | | $1,015.80 | | $10.16 | | $1,000.00 | | $1,015.12 | | $10.16 | | 2.00% |
| | 9 | For each class of the Fund, expenses are equal to the annualized expense ratio for the class, multiplied by the average account value over the period, multiplied by 184/ 365 (to reflect the one-half year period shown). |
| | 10 | Hypothetical 5% annual return before expenses is calculated by pro rating the number of days in the most recent fiscal period divided by 365. |
| | | See “Disclosure of Expenses” on page 8 for further information on how expenses were calculated. |
| | | | | | |
| | | BLACKROCK FUNDS | | JANUARY 31, 2014 | | 7 |
| Ÿ | | Institutional Shares are not subject to any sales charge. These shares bear no ongoing distribution or service fees and are available only to certain eligible investors. |
| Ÿ | | Investor A Shares are subject to a maximum initial sales charge (front-end load) of 5.25% and a service fee of 0.25% per year (but no distribution fee). Certain redemptions of these shares may be subject to a contingent deferred sales charge (“CDSC”) where no initial sales charge was paid at the time of purchase. |
| Ÿ | | Investor C Shares are subject to a 1.00% CDSC if redeemed within one year of purchase. In addition, these shares are subject to a distribution fee of 0.75% per year and a service fee of 0.25% per year. |
Performance information reflects past performance and does not guarantee future results. Current performance may be lower or higher than the performance data quoted. Refer to www.blackrock.com/funds to obtain performance data current to the most recent month end. Performance results do not reflect the deduction of taxes that a shareholder would pay on Fund distributions or the redemption of Fund shares.
Figures shown in each of the performance tables on the previous pages assume reinvestment of all dividends and distributions, if any, at net asset value (“NAV”) on the ex-dividend/payable dates. Investment return and principal value of shares will fluctuate so that shares, when redeemed, may be worth more or less than their original cost. Dividends paid to each class of shares will vary because of the different levels of service, distribution and transfer agency fees applicable to each class, which are deducted from the income available to be paid to shareholders.
BlackRock Advisors, LLC (the “Manager”), the Funds’ investment advisor, waived and/or reimbursed a portion of each Fund’s expenses. Without such waiver and/or reimbursement, each Fund’s performance would have been lower. The Manager is under no obligation to waive or reimburse or to continue waiving or reimbursing its fees after the applicable termination date. See Note 5 of the Notes to Consolidated Financial Statements for additional information on waivers and reimbursements.
Shareholders of the Funds may incur the following charges: (a) transactional expenses, such as sales charges; and (b) operating expenses, including investment advisory fees, service and distribution fees, including 12b-1 fees, acquired fund fees and expenses and other Fund expenses. The expense examples on the previous pages (which are based on a hypothetical investment of $1,000 invested on August 1, 2013 and held through January 31, 2014) are intended to assist shareholders both in calculating expenses based on an investment in each Fund and in comparing these expenses with similar costs of investing in other mutual funds.
The expense examples provide information about actual account values and actual expenses. In order to estimate the expenses a shareholder paid during the period covered by this report, shareholders can divide their account value by $1,000 and then multiply the result by the number corresponding to their Fund and share class under the headings entitled “Expenses Paid During the Period.”
The expense examples also provide information about hypothetical account values and hypothetical expenses based on a Fund’s actual expense ratio and an assumed rate of return of 5% per year before expenses. In order to assist shareholders in comparing the ongoing expenses of investing in these Funds and other funds, compare the 5% hypothetical examples with the 5% hypothetical examples that appear in other funds’ shareholder reports.
The expenses shown in the expense examples are intended to highlight shareholders’ ongoing costs only and do not reflect any transactional expenses, such as sales charges, if any. Therefore, the hypothetical examples are useful in comparing ongoing expenses only, and will not help shareholders determine the relative total expenses of owning different funds. If these transactional expenses were included, shareholder expenses would have been higher.
| | | | | | |
| 8 | | BLACKROCK FUNDS | | JANUARY 31, 2014 | | |
| | |
| Derivative Financial Instruments | | |
The Funds may invest in various derivative financial instruments, including financial futures contracts, foreign currency exchange contracts and swaps, as specified in Note 4 of the Notes to Consolidated Financial Statements, which may constitute forms of economic leverage. Such derivative financial instruments are used to obtain exposure to a security, index and/or market without owning or taking physical custody of securities or to hedge market, equity, credit, interest rate, foreign currency exchange rate and/or commodity risks. Derivative financial instruments involve risks, including the imperfect correlation between the value of a derivative financial instrument and the underlying asset, possible default of the counterparty to the transaction or illiquidity of the derivative financial instrument. The Funds’ ability to use a derivative financial instrument
successfully depends on the investment advisor’s ability to predict pertinent market movements accurately, which cannot be assured. The use of derivative financial instruments may result in losses greater than if they had not been used, may require a Fund to sell or purchase portfolio investments at inopportune times or for distressed values, may limit the amount of appreciation a Fund can realize on an investment, may result in lower dividends paid to shareholders and/or may cause a Fund to hold an investment that it might otherwise sell. The Funds’ investments in these instruments are discussed in detail in the Notes to Consolidated Financial Statements.
| | | | | | |
| | | BLACKROCK FUNDS | | JANUARY 31, 2014 | | 9 |
| | | | |
| Consolidated Schedule of Investments January 31, 2014 (Unaudited) | | | BlackRock Multi-Asset Real Return Fund | |
| | | (Percentages shown are based on Net Assets) | |
| | | | | | | | |
| Investment Companies | | Shares | | | Value | |
Equity Funds — 30.6% | | | | | | | | |
Alerian MLP ETF | | | 149,724 | | | $ | 2,665,087 | |
Energy Select Sector SPDR Fund | | | 39,416 | | | | 3,286,506 | |
Health Care Select Sector SPDR Fund | | | 59,671 | | | | 3,339,189 | |
iShares Gold Trust (a)(b) | | | 245,105 | | | | 2,958,417 | |
iShares International Developed Real Estate ETF (b) | | | 91,404 | | | | 2,661,227 | |
iShares U.S. Real Estate ETF (b) | | | 40,878 | | | | 2,667,290 | |
SPDR S&P Oil & Gas Equipment & Services ETF | | | 64,567 | | | | 2,622,712 | |
| | | | | | | | |
| | | | | | | | 20,200,428 | |
Fixed Income Funds — 54.1% | | | | | | | | |
BlackRock Floating Rate Income Portfolio, Institutional Class (b) | | | 1,561,249 | | | | 16,439,948 | |
iShares Barclays 0-5 Year TIPS Bond Fund (b) | | | 25,894 | | | | 2,622,026 | |
iShares iBoxx $ High Yield Corporate Bond ETF (b)(c) | | | 35,722 | | | | 3,331,077 | |
iShares TIPS Bond ETF (b) | | | 118,565 | | | | 13,304,179 | |
| | | | | | | | |
| | | | | | | | 35,697,230 | |
| | | | | | | | |
| | | | | | | |
| | | | | | | | |
| Short-Term Securities — 50.6% | | Shares | | | Value | |
BlackRock Liquidity Funds, TempFund, Institutional Class, 0.03% (b)(d) | | | 32,542,671 | | | $ | 32,542,671 | |
| | | | | | | | | | | | |
| | | Beneficial
Interest
(000) | | | | |
BlackRock Liquidity Series, LLC, Money Market Series, 0.14% (d)(e) | | | USD | | | | 895 | | | | 895,350 | |
Total Investment Companies (Cost — $89,076,258) — 135.3% | | | | 89,335,679 | |
Liabilities in Excess of Other Assets — (35.3)% | | | | (23,290,187 | ) |
| | | | | | | | | | | | |
Net Assets — 100.0% | | | | | | | | | | $ | 66,045,492 | |
| | | | | | | | | | | | |
|
| Notes to Consolidated Schedule of Investments |
| (a) | Non-income producing security. |
| (b) | Investments in issuers considered to be an affiliate of the Fund during the six months ended January 31, 2014, for purposes of Section 2(a)(3) of the Investment Company Act of 1940, as amended, were as follows: |
| | | | | | | | | | | | | | | | | | | | | | | | | | | | |
| Affiliate | | Shares Held at
July 31, 2013 | | | Shares
Purchased | | | Shares
Sold | | | Shares Held at
January 31, 2014 | | | Value at
January 31,
2014 | | | Income | | | Realized
Loss | |
BlackRock Floating Rate Income Portfolio, Institutional Class | | | 296,088 | | | | 1,265,161 | | | | — | | | | 1,561,249 | | | $ | 16,439,948 | | | $ | 97,838 | | | | — | |
BlackRock Liquidity Funds, TempFund, Institutional Class | | | 1,797,240 | | | | 30,745,431 | 1 | | | — | | | | 32,542,671 | | | $ | 32,542,671 | | | $ | 474 | | | | — | |
BlackRock Liquidity Series, LLC, Money Market Series | | | — | | | | 895,350 | 1 | | | — | | | | 895,350 | | | $ | 895,350 | | | $ | 2,272 | | | | — | |
iShares Barclays 0-5 Year TIPS Bond Fund | | | — | | | | 25,894 | | | | — | | | | 25,894 | | | $ | 2,622,026 | | | | — | | | | — | |
iShares 1-3 Year Credit Bond ETF | | | 7,033 | | | | 16,396 | | | | (23,429 | ) | | | — | | | | — | | | $ | 2,801 | | | $ | (8,414 | ) |
iShares TIPS Bond ETF | | | 21,190 | | | | 97,375 | | | | — | | | | 118,565 | | | $ | 13,304,179 | | | $ | 12,090 | | | | — | |
iShares U.S. Real Estate ETF | | | 7,726 | | | | 33,152 | | | | — | | | | 40,878 | | | $ | 2,667,290 | | | $ | 12,545 | | | | — | |
iShares Gold Trust | | | 27,898 | | | | 217,207 | | | | — | | | | 245,105 | | | $ | 2,958,417 | | | | — | | | | — | |
iShares iBoxx $ High Yield Corporate Bond ETF | | | 6,432 | | | | 29,290 | | | | — | | | | 35,722 | | | $ | 3,331,077 | | | $ | 23,700 | | | | — | |
iShares International Developed Real Estate ETF | | | 15,263 | | | | 76,141 | | | | — | | | | 91,404 | | | $ | 2,661,227 | | | $ | 61,334 | | | | — | |
| 1 | Represents net shares purchased. |
| (c) | Security, or a portion of security, is on loan. |
| (d) | Represents the current yield as of report date. |
| (e) | Security was purchased with the cash collateral from loaned securities. The Fund may withdraw up to 25% of its investment daily, although the manager of the BlackRock Liquidity Series, LLC, Money Market Series, in its sole discretion, may permit an investor to withdraw more than 25% on any one day. |
| | | | | | | | |
| Portfolio Abbreviations | | | | | | | | |
| To simplify the listings of portfolio holdings in the Consolidated Schedules of Investments, the names and descriptions of many of the securities have been abbreviated according to the following list: | | AUD BRL CAD ETF EUR GBP INR JPY KRW | | Australian Dollar Brazilian Real Canadian Dollar Exchange Traded Fund Euro British Pound Indian Rupee Japanese Yen South Korean Won | | LIBOR MLP MYR RUB S&P SPDR TWD USD | | London Interbank Offered Rate Master Limited Partnership Malaysian Ringgit Russian Ruble Standard & Poor’s Standard & Poor’s Depositary Receipts Taiwan New Dollar US Dollar |
See Notes to Consolidated Financial Statements.
| | | | | | |
| 10 | | BLACKROCK FUNDS | | JANUARY 31, 2014 | | |
| | | | |
| Consolidated Schedule of Investments (continued) | | | BlackRock Multi-Asset Real Return Fund | |
| Ÿ | | Centrally cleared credit default swaps - sold protection outstanding as of January 31, 2014 were as follows: |
| | | | | | | | | | | | | | | | | | | | | | | | | | |
| Index | | Receive Fixed Rate | | | Clearinghouse | | | Expiration Date | | Credit Rating1 | | | Notional
Amount
(000)2 | | | Unrealized Depreciation | |
CDX.NA.HY Series 21 Version 1 | | | 5.00 | % | | | Chicago Mercantile | | | 12/20/18 | | | B+ | | | | USD | | | | 3,000 | | | $ | (8,283 | ) |
| | 1 | Using S&P’s rating of the issuer or the underlying securities of the index, as applicable. |
| | 2 | The maximum potential amount the Fund may pay should a negative credit event take place as defined under the terms of the agreement. |
| Ÿ | | Over-the-counter total return swaps outstanding as of January 31, 2014 were as follows: |
| | | | | | | | | | | | | | | | | | | | | | | | | | |
| Reference Entity | | Fixed Amount | | | Counterparty | | Expiration Date | | | Contracts | | | Market Value | | | Premiums Paid
(Received) | | | Unrealized Depreciation | |
Excess Return on the S&P GSCI Commodity Index | | USD | 5,414,408 | 3 | | JPMorgan Chase Bank N.A. | | | 6/30/14 | | | | 1 | | | $ | (89,524 | ) | | | — | | | $ | (89,524 | ) |
| | 3 | Fund receives the total return of the reference entity and pays the fixed amount. Net payment made at termination. |
| Ÿ | | Fair Value Measurements — Various inputs are used in determining the fair value of investments and derivative financial instruments. These inputs to valuation techniques are categorized into a disclosure hierarchy consisting of three broad levels for financial statement purposes as follows: |
| | Ÿ | | Level 1 — unadjusted price quotations in active markets/exchanges for identical assets or liabilities that the Fund has the ability to access |
| | Ÿ | | Level 2 — other observable inputs (including, but not limited to, quoted prices for similar assets or liabilities in markets that are active, quoted prices for identical or similar assets or liabilities in markets that are not active, inputs other than quoted prices that are observable for the assets or liabilities (such as interest rates, yield curves, volatilities, prepayment speeds, loss severities, credit risks and default rates) or other market–corroborated inputs) |
| | Ÿ | | Level 3 — unobservable inputs based on the best information available in the circumstances, to the extent observable inputs are not available (including the Fund’s own assumptions used in determining the fair value of investments and derivative financial instruments) |
The hierarchy gives the highest priority to unadjusted quoted prices in active markets for identical assets or liabilities (Level 1 measurements) and the lowest priority to unobservable inputs (Level 3 measurements). Accordingly, the degree of judgment exercised in determining fair value is greatest for instruments categorized in Level 3. The inputs used to measure fair value may fall into different levels of the fair value hierarchy. In such cases, for disclosure purposes, the fair value hierarchy classification is determined based on the lowest level input that is significant to the fair value measurement in its entirety.
Changes in valuation techniques may result in transfers into or out of an assigned level within the disclosure hierarchy. In accordance with the Fund’s policy, transfers between different levels of the fair value disclosure hierarchy are deemed to have occurred as of the beginning of the reporting period. The categorization of a value determined for investments and derivative financial instruments is based on the pricing transparency of the investment and derivative financial instrument and is not necessarily an indication of the risks associated with investing in those securities. For information about the Fund’s policy regarding valuation of investments and derivative financial instruments, please refer to Note 2 of the Notes to Consolidated Financial Statements.
See Notes to Consolidated Financial Statements.
| | | | | | |
| | | BLACKROCK FUNDS | | JANUARY 31, 2014 | | 11 |
| | | | |
| Consolidated Schedule of Investments (concluded) | | | BlackRock Multi-Asset Real Return Fund | |
The following tables summarize the Fund’s investments and derivative financial instruments categorized in the disclosure hierarchy as of January 31, 2014:
| | | | | | | | | | | | | | | | | | | | |
| | | Level 1 | | Level 2 | | Level 3 | | Total |
Assets: | | | | | | | | | | | | | | | | | | | | |
Investments: | | | | | | | | | | | | | | | | | | | | |
Investment Companies | | | $ | 88,440,329 | | | | $ | 895,350 | | | | | — | | | | $ | 89,335,679 | |
| | | | | | | | | | | | | | | | | | | | |
| | | Level 1 | | Level 2 | | Level 3 | | Total |
Derivative Financial Instruments1 | | | | | | | | | | | | | | | | | | | | |
Liabilities: | | | | | | | | | | | | | | | | | | | | |
Commodity contracts | | | | — | | | | $ | (89,524 | ) | | | | — | | | | $ | (89,524 | ) |
Credit contracts | | | | — | | | | | (8,283 | ) | | | | — | | | | | (8,283 | ) |
Total | | | | — | | | | $ | (97,807 | ) | | | | — | | | | $ | (97,807 | ) |
| | | | | |
1 Derivative financial instruments are swaps which are valued at the unrealized appreciation/depreciation on the instrument. | |
The carrying amount for certain of the Fund’s liabilities approximates fair value for financial statement purposes. As of January 31, 2014, collateral on securities loaned at value of $895,350 is categorized as Level 2 within the disclosure hierarchy.
There were no transfers between levels during the six months ended January 31, 2014.
See Notes to Consolidated Financial Statements.
| | | | | | |
| 12 | | BLACKROCK FUNDS | | JANUARY 31, 2014 | | |
| | | | |
| Consolidated Schedule of Investments January 31, 2014 (Unaudited) | | | BlackRock Strategic Risk Allocation Fund | |
| | | (Percentages shown are based on Net Assets) | |
| | | | | | | | | | | | |
| Affiliated Investment Companies (a) | | | | | Shares | | | Value | |
Fixed Income Funds — 19.8% | | | | | | | | | | | | |
iShares TIPS Bond ETF | | | | | | | 44,151 | | | $ | 4,954,184 | |
| | | | | | | | | | | | |
| U.S. Treasury Obligations — 24.3% | | | | | Par (000) | | | | |
U.S. Treasury Notes, 1.88%, 2/28/14 | | | USD | | | | 6,098 | | | | 6,105,147 | |
Total Long-Term Investments (Cost — $11,494,526) — 44.1% | | | | 11,059,331 | |
| | | | | | | | | | | | |
| | | | | | | | | | |
| | | | | | | | | | |
| Short-Term Securities | | | | Shares | | | Value | |
BlackRock Liquidity Funds, TempFund, Institutional Class, 0.03% (a)(b) | | | | | 12,509,472 | | | $ | 12,509,472 | |
Total Short-Term Securities (Cost — $12,509,472) — 49.9% | | | | 12,509,472 | |
Total Investments (Cost — $24,003,998) — 94.0% | | | | | | | | | 23,568,803 | |
Other Assets Less Liabilities — 6.0% | | | | | | | | | 1,512,341 | |
| | | | | | | | | | |
Net Assets — 100.0% | | | | | | | | $ | 25,081,144 | |
| | | | | | | | | | |
|
| Notes to Consolidated Schedule of Investments |
| (a) | Investments in issuers considered to be an affiliate of the Fund during the six months ended January 31, 2014, for purposes of Section 2(a)(3) of the Investment Company Act of 1940, as amended, were as follows: |
| | | | | | | | | | | | | | | | | | | | | | | | | | | | |
| Affiliate | | Shares Held at July 31, 2013 | | | Shares Purchased | | | Shares Sold | | | Shares Held at January 31, 2014 | | | Value at January 31, 2014 | | | Income | | | Realized Loss | |
BlackRock Liquidity Funds, TempFund, Institutional Class | | | 15,327,204 | | | | 94,318 | 1 | | | — | | | | 12,509,472 | | | $ | 12,509,472 | | | $ | 2,058 | | | | — | |
iShares TIPS Bond ETF | | | 59,407 | | | | — | | | | (15,256 | ) | | | 44,151 | | | $ | 4,954,184 | | | $ | 22,768 | | | $ | (157,796 | ) |
| | 1 | Represents net shares purchased. |
| (b) | Represents the current yield as of report date. |
| Ÿ | | Financial futures contracts outstanding as of January 31, 2014 were as follows: |
| | | | | | | | | | | | | | | | | | | | | | |
Contracts
Purchased/ (Sold) | | | Issue | | Exchange | | Expiration | | | | | | Notional Value | | | Unrealized
Appreciation
(Depreciation) | |
| | 1 | | | ASX SPI 200 Futures | | Sydney | | | March 2014 | | | | USD | | | | 112,523 | | | $ | 765 | |
| | 31 | | | Australian Government Bond (10 Year) | | Sydney | | | March 2014 | | | | USD | | | | 3,172,435 | | | | 80,694 | |
| | (15 | ) | | CBOE Volatility Index Futures | | Chicago Board of Trade | | | March 2014 | | | | USD | | | | 260,250 | | | | (18,748 | ) |
| | 22 | | | E-mini Russell 2000 Futures | | New York | | | March 2014 | | | | USD | | | | 2,482,260 | | | | 54,451 | |
| | 8 | | | E-mini S&P 500 Futures | | Chicago Mercantile | | | March 2014 | | | | USD | | | | 710,600 | | | | 1,459 | |
| | 7 | | | EURO STOXX 50 Index Futures | | Eurex | | | March 2014 | | | | USD | | | | 284,928 | | | | 6,143 | |
| | 1 | | | FTSE 100 Index Futures | | London | | | March 2014 | | | | USD | | | | 106,171 | | | | 394 | |
| | 45 | | | Japanese Government Bond (10 Year) | | Tokyo | | | March 2014 | | | | USD | | | | 6,376,285 | | | | 24,906 | |
| | 56 | | | mini MSCI Emerging Markets Index Futures | | New York | | | March 2014 | | | | USD | | | | 2,590,840 | | | | (188,888 | ) |
| | 1 | | | TOPIX Index Futures | | Tokyo | | | March 2014 | | | | USD | | | | 118,919 | | | | (3,467 | ) |
| | Total | | | | | | | | | | | | | | | | | | | $ | (42,291 | ) |
| | | | | | | | | | | | | | | | | | | | | | |
See Notes to Consolidated Financial Statements.
| | | | | | |
| | | BLACKROCK FUNDS | | JANUARY 31, 2014 | | 13 |
| | | | |
| Consolidated Schedule of Investments (continued) | | | BlackRock Strategic Risk Allocation Fund | |
| Ÿ | | Foreign currency exchange contracts outstanding as of January 31, 2014 were as follows: |
| | | | | | | | | | | | | | | | | | | | | | |
Currency
Purchased | | | Currency
Sold | | | Counterparty | | Settlement
Date | | | Unrealized
Appreciation
(Depreciation) | |
| AUD | | | 104,000 | | | | USD | | | | 92,509 | | | Deutsche Bank AG | | | 3/05/14 | | | $ | (1,682 | ) |
| CAD | | | 16,526 | | | | USD | | | | 15,477 | | | Deutsche Bank AG | | | 3/05/14 | | | | (650 | ) |
| USD | | | 24,970 | | | | AUD | | | | 27,788 | | | Deutsche Bank AG | | | 3/05/14 | | | | 702 | |
| USD | | | 175,364 | | | | BRL | | | | 414,000 | | | Citibank N.A. | | | 3/05/14 | | | | 5,255 | |
| USD | | | 332,138 | | | | BRL | | | | 787,000 | | | Deutsche Bank AG | | | 3/05/14 | | | | 8,765 | |
| USD | | | 95,004 | | | | CAD | | | | 104,000 | | | Deutsche Bank AG | | | 3/05/14 | | | | 1,694 | |
| USD | | | 133,691 | | | | EUR | | | | 98,491 | | | Deutsche Bank AG | | | 3/05/14 | | | | 855 | |
| USD | | | 341,326 | | | | EUR | | | | 251,000 | | | Deutsche Bank AG | | | 3/05/14 | | | | 2,800 | |
| USD | | | 88,636 | | | | GBP | | | | 54,121 | | | Deutsche Bank AG | | | 3/05/14 | | | | (314 | ) |
| USD | | | 90,166 | | | | INR | | | | 5,652,000 | | | Citibank N.A. | | | 3/05/14 | | | | 612 | |
| USD | | | 197,088 | | | | INR | | | | 12,387,000 | | | Deutsche Bank AG | | | 3/05/14 | | | | 822 | |
| USD | | | 492,908 | | | | JPY | | | | 50,585,633 | | | Deutsche Bank AG | | | 3/05/14 | | | | (2,276 | ) |
| USD | | | 501,373 | | | | KRW | | | | 530,478,000 | | | Deutsche Bank AG | | | 3/05/14 | | | | 6,753 | |
| USD | | | 119,975 | | | | MYR | | | | 391,000 | | | Deutsche Bank AG | | | 3/05/14 | | | | 3,353 | |
| USD | | | 231,464 | | | | RUB | | | | 7,728,000 | | | Citibank N.A. | | | 3/05/14 | | | | 13,052 | |
| USD | | | 186,796 | | | | RUB | | | | 6,239,000 | | | Deutsche Bank AG | | | 3/05/14 | | | | 10,467 | |
| USD | | | 56,577 | | | | TWD | | | | 1,668,000 | | | Citibank N.A. | | | 3/05/14 | | | | 1,464 | |
| USD | | | 358,373 | | | | TWD | | | | 10,572,000 | | | Deutsche Bank AG | | | 3/05/14 | | | | 9,058 | |
| Total | | | | | | | | | | | | | | | | | | | | $ | 60,730 | |
| | | | | | | | | | | | | | | | | | | | | | |
| Ÿ | | Centrally cleared credit default swaps - sold protection outstanding as of January 31, 2014 were as follows: |
| | | | | | | | | | | | | | | | | | | | | | | | | | |
| Index | | Receive Fixed Rate | | | Clearinghouse | | | Expiration Date | | Credit Rating1 | | | Notional Amount (000)2 | | | Unrealized Appreciation | |
CDX.NA.HY Series 21 Version 1 | | | 5.00 | % | | | Chicago Mercantile | | | 12/20/18 | | | B+ | | | | USD | | | | 2,080 | | | $ | 53,407 | |
CDX.NA.IG Series 21 Version 1 | | | 1.00 | % | | | Chicago Mercantile | | | 12/20/18 | | | BBB+ | | | | USD | | | | 7,533 | | | | 11,310 | |
iTraxx Europe Crossover Series 20 Version 1 | | | 5.00 | % | | | Intercontinental Exchange | | | 12/20/18 | | | BB- | | | | EUR | | | | 746 | | | | 42,791 | |
iTraxx Europe Series 20 Version 1 | | | 1.00 | % | | | Intercontinental Exchange | | | 12/20/18 | | | A- | | | | EUR | | | | 5,381 | | | | 13,221 | |
Total | | | | | | | | | | | | | | | | | | | | | | | | $ | 120,729 | |
| | | | | | | | | | | | | | | | | | | | | | | | | | |
| | 1 | Using S&P’s rating of the issuer or the underlying securities of the index, as applicable. |
| | 2 | The maximum potential amount the Fund may pay should a negative credit event take place as defined under the terms of the agreement. |
See Notes to Consolidated Financial Statements.
| | | | | | |
| 14 | | BLACKROCK FUNDS | | JANUARY 31, 2014 | | |
| | | | |
| Consolidated Schedule of Investments (continued) | | | BlackRock Strategic Risk Allocation Fund | |
| Ÿ | | Over-the-counter total return swaps outstanding as of January 31, 2014 were as follows: |
| | | | | | | | | | | | | | | | | | | | | | | | | | |
| Reference Entity | | Fixed Notional Amount/ Fixed Rate/ Floating Rate | | Counterparty | | Expiration Date | | Contracts/
Notional Amount (000) | | | Market Value | | | Premiums Paid (Received) | | | Unrealized Appreciation (Depreciation) | |
Canadian (10 Year) | | | | | | | | | | | | | | | | | | | | | | | | | | |
Bond Futures February 2014 | | CAD 3,680,0401 | | Bank of America N.A. | | 2/24/14 | | | | | | | 28 | | | $ | 88,579 | | | | — | | | $ | 88,579 | |
Long Gilt Futures March 2014 | | GBP 1,876,6301 | | Bank of America N.A. | | 2/25/14 | | | | | | | 17 | | | | 47,953 | | | | — | | | | 47,953 | |
U.S. Treasury (10 Year) Notes Futures March 2014 | | USD 125,7501 | | Bank of America N.A. | | 2/26/14 | | | | | | | 1 | | | | 679 | | | | — | | | | 679 | |
Euro-Bund Futures March 2014 | | EUR 2,445,9601 | | Bank of America N.A. | | 3/06/14 | | | | | | | 17 | | | | 54,147 | | | | — | | | | 54,147 | |
JPMorgan EMBI Plus Index | | 6-month LIBOR Plus 0.72%2 | | JPMorgan Chase Bank N.A. | | 6/20/14 | | | USD | | | | 3,398 | | | | (67,195 | ) | | | — | | | | (67,195 | ) |
S&P GSCI Light Energy Official Close Index | | USD 2,200,0001 | | JPMorgan Chase Bank N.A. | | 9/19/14 | | | USD | | | | 2,200 | | | | (68,732 | ) | | | — | | | | (68,732 | ) |
S&P GSCI Light Energy Official Close Index | | USD 715,9701 | | JPMorgan Chase Bank N.A. | | 9/19/14 | | | USD | | | | 716 | | | | (25,508 | ) | | | — | | | | (25,508 | ) |
Net Total Return on the FTSE EPRA/NAREIT Global REIT Index | | 3-month LIBOR2 | | JPMorgan Chase Bank N.A. | | 12/19/14 | | | | | | | 355 | | | | 11,286 | | | | — | | | | 11,286 | |
Total | | | | | | | | | | | | | | | | $ | 41,209 | | | | — | | | $ | 41,209 | |
| | | | | | | | | | | | | | | | | | |
| | 1 | Fund receives the total return of the reference entity and pays the fixed amount. Net payment made at termination. |
| | 2 | Fund receives the total return of the reference entity and pays the floating amount. Net payment made at termination. |
| Ÿ | | Fair Value Measurements — Various inputs are used in determining the fair value of investments and derivative financial instruments. These inputs to valuation techniques are categorized into a disclosure hierarchy consisting of three broad levels for financial statement purposes as follows: |
| | Ÿ | | Level 1 — unadjusted price quotations in active markets/exchanges for identical assets or liabilities that the Fund has the ability to access |
| | Ÿ | | Level 2 — other observable inputs (including, but not limited to, quoted prices for similar assets or liabilities in markets that are active, quoted prices for identical or similar assets or liabilities in markets that are not active, inputs other than quoted prices that are observable for the assets or liabilities (such as interest rates, yield curves, volatilities, prepayment speeds, loss severities, credit risks and default rates) or other market–corroborated inputs) |
| | Ÿ | | Level 3 — unobservable inputs based on the best information available in the circumstances, to the extent observable inputs are not available (including the Fund’s own assumptions used in determining the fair value of investments and derivative financial instruments) |
The hierarchy gives the highest priority to unadjusted quoted prices in active markets for identical assets or liabilities (Level 1 measurements) and the lowest priority to unobservable inputs (Level 3 measurements). Accordingly, the degree of judgment exercised in determining fair value is greatest for instruments categorized in Level 3. The inputs used to measure fair value may fall into different levels of the fair value hierarchy. In such cases, for disclosure purposes, the fair value hierarchy classification is determined based on the lowest level input that is significant to the fair value measurement in its entirety.
Changes in valuation techniques may result in transfers into or out of an assigned level within the disclosure hierarchy. In accordance with the Fund’s policy, transfers between different levels of the fair value disclosure hierarchy are deemed to have occurred as of the beginning of the reporting period. The categorization of a value determined for investments and derivative financial instruments is based on the pricing transparency of the investment and derivative financial instrument and is not necessarily an indication of the risks associated with investing in those securities. For information about the Fund’s policy regarding valuation of investments and derivative financial instruments, please refer to Note 2 of the Notes to Consolidated Financial Statements.
See Notes to Consolidated Financial Statements.
| | | | | | |
| | | BLACKROCK FUNDS | | JANUARY 31, 2014 | | 15 |
| | | | |
| Consolidated Schedule of Investments (concluded) | | | BlackRock Strategic Risk Allocation Fund | |
The following tables summarize the Fund’s investments and derivative financial instruments categorized in the disclosure hierarchy as of January 31, 2014:
| | | | | | | | | | | | | | | | | | | | |
| | | Level 1 | | Level 2 | | Level 3 | | Total |
Assets: | | | | | | | | | | | | | | | | | | | | |
Investments: | | | | | | | | | | | | | | | | | | | | |
Long-Term Investments: | | | | | | | | | | | | | | | | | | | | |
Affiliated Investment Companies | | | $ | 4,954,184 | | | | | — | | | | | — | | | | $ | 4,954,184 | |
U.S. Treasury Obligations | | | | — | | | | $ | 6,105,147 | | | | | — | | | | | 6,105,147 | |
Short-Term Securities | | | | 12,509,472 | | | | | — | | | | | — | | | | | 12,509,472 | |
Total | | | $ | 17,463,656 | | | | $ | 6,105,147 | | | | | — | | | | $ | 23,568,803 | |
| | | | | |
| | | | | | | | | | | | | | | | | | | | |
| | | Level 1 | | Level 2 | | Level 3 | | Total |
Derivative Financial Instruments1 | | | | | | | | | | | | | | | | | | | | |
Assets: | | | | | | | | | | | | | | | | | | | | |
Credit contracts | | | | — | | | | $ | 120,729 | | | | | — | | | | $ | 120,729 | |
Equity contracts | | | $ | 63,212 | | | | | 11,286 | | | | | — | | | | | 74,498 | |
Foreign currency exchange contracts | | | | 855 | | | | | 64,797 | | | | | — | | | | | 65,652 | |
Interest rate contracts | | | | 105,600 | | | | | 191,358 | | | | | — | | | | | 296,958 | |
Liabilities: | | | | | | | | | | | | | | | | | | | | |
Commodity contracts | | | | — | | | | | (94,240 | ) | | | | — | | | | | (94,240 | ) |
Equity contracts | | | | (211,103 | ) | | | | — | | | | | — | | | | | (211,103 | ) |
Foreign currency exchange contracts | | | | — | | | | | (4,922 | ) | | | | — | | | | | (4,922 | ) |
Interest rate contracts | | | | — | | | | | (67,195 | ) | | | | — | | | | | (67,195 | ) |
Total | | | $ | (41,436 | ) | | | $ | 221,813 | | | | | — | | | | $ | 180,377 | |
| | | | | |
1 Derivative financial instruments are swaps, financial futures contracts and foreign currency exchange contracts which are valued at the unrealized appreciation/depreciation on the instrument. | |
|
| Certain of the Fund’s assets are held at carrying amount, which approximates fair value for financial statement purposes. As of January 31, 2014, such assets are categorized within the disclosure hierarchy as follows: | |
| | | | | | | | | | | | | | | | | | | | |
| | | Level 1 | | Level 2 | | Level 3 | | Total |
Assets: | | | | | | | | | | | | | | | | | | | | |
Cash | | | $ | 8,733 | | | | | — | | | | | — | | | | $ | 8,733 | |
Cash pledged for financial futures contracts | | | | 593,000 | | | | | — | | | | | — | | | | | 593,000 | |
Cash pledged for centrally cleared swaps | | | | 575,000 | | | | | — | | | | | — | | | | | 575,000 | |
Foreign currency at value | | | | 206,621 | | | | | — | | | | | — | | | | | 206,621 | |
Total | | | $ | 1,383,354 | | | | | — | | | | | — | | | | $ | 1,383,354 | |
| | | | | |
There were no transfers between levels during the six months ended January 31, 2014.
See Notes to Consolidated Financial Statements.
| | | | | | |
| 16 | | BLACKROCK FUNDS | | JANUARY 31, 2014 | | |
| | |
| Consolidated Statements of Assets and Liabilities | | |
| | | | | | | | |
| January 31, 2014 (Unaudited) | | BlackRock Multi-Asset Real Return Fund | | | BlackRock Strategic Risk Allocation Fund | |
| | | | | | | | |
| Assets | | | | | | | | |
Investments at value — unaffiliated1 | | $ | 11,913,494 | | | $ | 6,105,147 | |
Investments at value — affiliated2 (including securities loaned at value of $ 876,550) | | | 77,422,185 | | | | 17,463,656 | |
Cash | | | — | | | | 8,733 | |
Cash pledged for financial futures contracts | | | — | | | | 593,000 | |
Cash pledged for centrally cleared swaps | | | — | | | | 575,000 | |
Foreign currency at value3 | | | — | | | | 206,621 | |
Variation margin receivable on financial futures contracts | | | — | | | | 7,144 | |
Variation margin receivable on centrally cleared swaps | | | — | | | | 7,319 | |
Unrealized appreciation on foreign currency exchange contracts | | | — | | | | 65,652 | |
Unrealized appreciation on OTC swaps | | | — | | | | 202,644 | |
Capital shares sold receivable | | | 6,888,225 | | | | 97 | |
Interest receivable | | | — | | | | 48,641 | |
Receivable from Manager | | | 961 | | | | 144 | |
Dividends receivable — unaffiliated | | | 68 | | | | — | |
Dividends receivable — affiliated | | | — | | | | 331 | |
Securities lending income receivable — affiliated | | | 295 | | | | — | |
Prepaid expenses | | | 34,459 | | | | 37,907 | |
| | | | |
Total assets | | | 96,259,687 | | | | 25,322,036 | |
| | | | |
| | | | | | | | |
| Liabilities | | | | | | | | |
Collateral on securities loaned at value | | | 895,350 | | | | — | |
Variation margin payable on financial futures contracts | | | — | | | | 23,949 | |
Variation margin payable on centrally cleared swaps | | | 11,298 | | | | — | |
Investments purchased payable | | | 28,832,235 | | | | 2,259 | |
Unrealized depreciation on foreign currency exchange contracts | | | — | | | | 4,922 | |
Unrealized depreciation on OTC swaps | | | 89,524 | | | | 161,435 | |
Capital shares redeemed payable | | | 350,661 | | | | 97 | |
Service and distribution fees payable | | | 979 | | | | 389 | |
Investment advisory fees payable | | | 5,713 | | | | 8,749 | |
Professional fees payable | | | 17,239 | | | | 22,035 | |
Officer’s and Trustees’ fees payable | | | 1,114 | | | | 1,202 | |
Other accrued expenses payable | | | 10,082 | | | | 15,855 | |
| | | | |
Total liabilities | | | 30,214,195 | | | | 240,892 | |
| | | | |
Net Assets | | $ | 66,045,492 | | | $ | 25,081,144 | |
| | | | |
| | | | | | | | |
| Net Assets Consist of | | | | | | | | |
Paid-in capital | | $ | 65,972,760 | | | $ | 26,695,065 | |
Distributions in excess of net investment income | | | (103,900 | ) | | | (926,773 | ) |
Accumulated net realized gain (loss) | | | 15,018 | | | | (436,301 | ) |
Net unrealized appreciation/depreciation | | | 161,614 | | | | (250,847 | ) |
| | | | |
Net Assets | | $ | 66,045,492 | | | $ | 25,081,144 | |
| | | | |
1 Investments at cost — unaffiliated | | $ | 11,497,851 | | | $ | 6,106,120 | |
2 Investments at cost — affiliated | | $ | 77,578,407 | | | $ | 17,897,878 | |
3 Foreign currency at cost | | | — | | | $ | 209,148 | |
See Notes to Consolidated Financial Statements.
| | | | | | |
| | | BLACKROCK FUNDS | | JANUARY 31, 2014 | | 17 |
| | |
| Consolidated Statements of Assets and Liabilities (concluded) | | |
| | | | | | | | |
| January 31, 2014 (Unaudited) | | BlackRock Multi-Asset Real Return Fund | | | BlackRock Strategic Risk Allocation Fund | |
| | | | | | | | |
| Net Asset Value | | | | | | | | |
Institutional | | | | |
Net assets | | $ | 63,465,637 | | | $ | 24,338,093 | |
| | | | |
Shares outstanding4 | | | 6,189,639 | | | | 2,599,500 | |
| | | | |
Net asset value | | $ | 10.25 | | | $ | 9.36 | |
| | | | |
| | | | | | | | |
Investor A | | | | | | | | |
Net assets | | $ | 1,805,911 | | | $ | 383,532 | |
| | | | |
Shares outstanding4 | | | 176,532 | | | | 40,978 | |
| | | | |
Net asset value | | $ | 10.23 | | | $ | 9.36 | |
| | | | |
| | | | | | | | |
Investor C | | | | | | | | |
Net assets | | $ | 773,944 | | | $ | 359,519 | |
| | | | |
Shares outstanding4 | | | 76,036 | | | | 38,545 | |
| | | | |
Net asset value | | $ | 10.18 | | | $ | 9.33 | |
| | | | |
| | 4 | Unlimited number of shares authorized, $0.001 par value. |
See Notes to Consolidated Financial Statements.
| | | | | | |
| 18 | | BLACKROCK FUNDS | | JANUARY 31, 2014 | | |
| | |
| Consolidated Statements of Operations | | |
| | | | | | | | |
| Six Months Ended January 31, 2014 (Unaudited) | | BlackRock Multi-Asset Real Return Fund | | | BlackRock Strategic Risk Allocation Fund | |
| | | | | | | | |
| Investment Income | | | | | | | | |
Dividends — affiliated | | $ | 210,782 | | | $ | 24,826 | |
Dividends — unaffiliated | | | 36,169 | | | | 749 | |
Interest | | | — | | | | 2,729 | |
Securities lending — affiliated — net | | | 2,272 | | | | — | |
Other income — affiliated | | | 2,118 | | | | — | |
| | | | |
Total income | | | 251,341 | | | | 28,304 | |
| | | | |
| | | | | | | | |
| Expenses | | | | | | | | |
Investment advisory | | | 54,680 | | | | 95,944 | |
Offering | | | 43,804 | | | | 32,870 | |
Professional | | | 23,592 | | | | 27,485 | |
Administration | | | 6,835 | | | | 9,595 | |
Registration | | | 5,923 | | | | 5,893 | |
Printing | | | 5,734 | | | | 7,962 | |
Service and distribution — class specific | | | 4,034 | | | | 2,143 | |
Administration — class specific | | | 2,170 | | | | 3,197 | |
Officer and Trustees | | | 1,753 | | | | 1,927 | |
Transfer agent — class specific | | | 763 | | | | 822 | |
Custodian | | | 553 | | | | 1,008 | |
Miscellaneous | | | 5,692 | | | | 11,485 | |
| | | | |
Total expenses | | | 155,533 | | | | 200,331 | |
Less fees waived by Manager | | | (54,680 | ) | | | (66,495 | ) |
Less administration fees waived | | | (5,169 | ) | | | — | |
Less administration fees waived — class specific | | | (2,163 | ) | | | (2,791 | ) |
Less transfer agent fees waived — class specific | | | (31 | ) | | | (40 | ) |
Less transfer agent fees reimbursed — class specific | | | (647 | ) | | | (601 | ) |
Less expenses reimbursed by Manager | | | (15,499 | ) | | | — | |
| | | | |
Total expenses after fees waived and reimbursed | | | 77,344 | | | | 130,404 | |
| | | | |
Net investment income (loss) | | | 173,997 | | | | (102,100 | ) |
| | | | |
| | | | | | | | |
| Realized and Unrealized Gain (Loss) | | | | | | | | |
Net realized gain (loss) from: | | | | | | | | |
Investments — unaffiliated | | | 15,056 | | | | — | |
Investments — affiliated | | | (8,414 | ) | | | (157,796 | ) |
Financial futures contracts | | | — | | | | 421,802 | |
Swaps | | | 15,019 | | | | 113,861 | |
Foreign currency transactions | | | — | | | | 30,284 | |
| | | | |
| | | 21,661 | | | | 408,151 | |
| | | | |
Net change in unrealized appreciation/depreciation on: | | | | | | | | |
Investments — unaffiliated | | | 67,171 | | | | (1,020 | ) |
Investments — affiliated | | | (72,149 | ) | | | 115,838 | |
Financial futures contracts | | | — | | | | (165,959 | ) |
Swaps | | | (144,618 | ) | | | 218,558 | |
Foreign currency translations | | | — | | | | 64,288 | |
| | | | |
| | | (149,596 | ) | | | 231,705 | |
| | | | |
Total realized and unrealized gain (loss) | | | (127,935 | ) | | | 639,856 | |
| | | | |
Net Increase in Net Assets Resulting from Operations | | $ | 46,062 | | | $ | 537,756 | |
| | | | |
See Notes to Consolidated Financial Statements.
| | | | | | |
| | | BLACKROCK FUNDS | | JANUARY 31, 2014 | | 19 |
| | |
| Consolidated Statements of Changes in Net Assets | | |
| | | | | | | | | | | | | | | | |
| | | BlackRock
Multi-Asset Real
Return Fund | | | BlackRock
Strategic Risk
Allocation Fund | |
| Increase (Decrease) in Net Assets: | | Six Months Ended January 31, 2014
(Unaudited) | | | Period December 27, 20121 to July 31, 2013 | | | Six Months Ended January 31, 2014 (Unaudited) | | | Period December 27, 20121 to July 31, 2013 | |
| | | | | | | | | | | | | | | | |
| Operations | | | | | | | | | | | | | | | | |
Net investment income (loss) | | $ | 173,997 | | | $ | 94,335 | | | $ | (102,100 | ) | | $ | (55,354 | ) |
Net realized gain (loss) | | | 21,661 | | | | 73,400 | | | | 408,151 | | | | (624,171 | ) |
Net change in unrealized appreciation/depreciation | | | (149,596 | ) | | | 311,210 | | | | 231,705 | | | | (482,552 | ) |
| | | | | | | | |
Net increase (decrease) in net assets resulting from operations | | | 46,062 | | | | 478,945 | | | | 537,756 | | | | (1,162,077 | ) |
| | | | | | | | |
| | | | | | | | | | | | | | | | |
| Dividends and Distributions to Shareholders From | | | | | | | | | | | | | | | | |
Net investment income: | | | | | | | | | | | | | | | | |
Institutional | | | (306,813 | ) | | | — | | | | (974,578 | ) | | | (91,821 | )2 |
Investor A | | | (32,232 | ) | | | — | | | | (14,165 | ) | | | (91 | )2 |
Investor C | | | (10,956 | ) | | | — | | | | (11,257 | ) | | | (90 | )2 |
Net realized gain: | | | | | | | | | | | | | | | | |
Institutional | | | (116,804 | ) | | | — | | | | — | | | | — | |
Investor A | | | (12,783 | ) | | | — | | | | — | | | | — | |
Investor C | | | (5,147 | ) | | | — | | | | — | | | | — | |
| | | | | | | | |
Decrease in net assets resulting from dividends and distributions to shareholders. | | | (484,735 | ) | | | — | | | | (1,000,000 | ) | | | (92,002 | ) |
| | | | | | | | |
| | | | | | | | | | | | | | | | |
| Capital Share Transactions | | | | | | | | | | | | | | | | |
Net increase in net assets derived from capital share transactions | | | 53,833,177 | | | | 12,172,043 | | | | 447,721 | | | | 26,349,746 | |
| | | | | | | | |
| | | | | | | | | | | | | | | | |
| Net Assets | | | | | | | | | | | | | | | | |
Total increase (decrease) in net assets | | | 53,394,504 | | | | 12,650,988 | | | | (14,523 | ) | | | 25,095,667 | |
Beginning of period | | | 12,650,988 | | | | — | | | | 25,095,667 | | | | — | |
| | | | | | | | |
End of period | | $ | 66,045,492 | | | $ | 12,650,988 | | | $ | 25,081,144 | | | $ | 25,095,667 | |
| | | | | | | | |
Undistributed (distributions in excess of) net investment income, end of period | | $ | (103,900 | ) | | $ | 72,104 | | | $ | (926,773 | ) | | $ | 175,327 | |
| | | | | | | | |
| | 1 | Commencement of operations. |
| | 2 | Determined in accordance with federal income tax regulations. |
See Notes to Consolidated Financial Statements.
| | | | | | |
| 20 | | BLACKROCK FUNDS | | JANUARY 31, 2014 | | |
| | | | |
| Consolidated Financial Highlights | | | BlackRock Multi-Asset Real Return Fund | |
| | | | | | | | | | | | | | | | | | | | | | | | |
| | | Institutional | | | Investor A | | | Investor C | |
| | | Six Months
Ended
January 31,
2014
(Unaudited) | | | Period
December 27,
20121 to July 31, 2013 | | | Six Months
Ended
January 31,
2014
(Unaudited) | | | Period
December 27,
20121 to July 31, 2013 | | | Six Months
Ended
January 31,
2014
(Unaudited) | | | Period
December 27,
20121 to July 31, 2013 | |
| | | | | | | | | | | | | | | | | | | | | | | | |
| Per Share Operating Performance | | | | | | | | | | | | | | | | | | | | | | | | |
Net asset value, beginning of period | | $ | 10.47 | | | $ | 10.00 | | | $ | 10.45 | | | $ | 10.00 | | | $ | 10.41 | | | $ | 10.00 | |
| | | | | | | | | | | | |
Net investment income2 | | | 0.10 | | | | 0.09 | | | | 0.10 | | | | 0.08 | | | | 0.06 | | | | 0.04 | |
Net realized and unrealized gain (loss) | | | (0.04 | ) | | | 0.38 | | | | (0.04 | ) | | | 0.37 | | | | (0.04 | ) | | | 0.37 | |
| | | | | | | | | | | | |
Net increase from investment operations | | | 0.06 | | | | 0.47 | | | | 0.06 | | | | 0.45 | | | | 0.02 | | | | 0.41 | |
| | | | | | | | | | | | |
Dividends and distributions from: | | | | | | | | | | | | | | | | | | | | | | | | |
Net investment income | | | (0.20 | ) | | | — | | | | (0.20 | ) | | | — | | | | (0.17 | ) | | | — | |
Net realized gain | | | (0.08 | ) | | | — | | | | (0.08 | ) | | | — | | | | (0.08 | ) | | | — | |
| | | | | | | | | | | | |
Total dividends and distributions | | | (0.28 | ) | | | — | | | | (0.28 | ) | | | — | | | | (0.25 | ) | | | — | |
| | | | | | | | | | | | |
Net asset value, end of period | | $ | 10.25 | | | $ | 10.47 | | | $ | 10.23 | | | $ | 10.45 | | | $ | 10.18 | | | $ | 10.41 | |
| | | | | | | | | | | | |
| | | | | | | | | | | | | | | | | | | | | | | | |
| Total Investment Return3,4 | | | | | | | | | | | | | | | | | | | | | | | | |
Based on net asset value | | | 0.58 | % | | | 4.70 | % | | | 0.51 | % | | | 4.50 | % | | | 0.12 | % | | | 4.10 | % |
| | | | | | | | | | | | |
| | | | | | | | | | | | | | | | | | | | | | | | |
| Ratios to Average Net Assets5 | | | | | | | | | | | | | | | | | | | | | | | | |
Total expenses | | | 1.66 | %6 | | | 3.48 | %7,8 | | | 1.91 | %6 | | | 3.73 | %7,8 | | | 2.69 | %6 | | | 4.42 | %7,8 |
| | | | | | | | | | | | |
Total expenses after fees waived and reimbursed | | | 0.80 | %6 | | | 0.79 | %8 | | | 1.05 | %6 | | | 1.05 | %8 | | | 1.80 | %6 | | | 1.79 | %8 |
| | | | | | | | | | | | |
Net investment income | | | 1.93 | %6 | | | 1.47 | %8 | | | 1.92 | %6 | | | 1.34 | %8 | | | 1.15 | %6 | | | 0.66 | %8 |
| | | | | | | | | | | | |
| | | | | | | | | | | | | | | | | | | | | | | | |
| Supplemental Data | | | | | | | | | | | | | | | | | | | | | | | | |
Net assets, end of period (000) | | $ | 63,466 | | | $ | 11,915 | | | $ | 1,806 | | | $ | 464 | | | $ | 774 | | | $ | 271 | |
| | | | | | | | | | | | |
Portfolio turnover | | | 13 | % | | | 40 | % | | | 13 | % | | | 40 | % | | | 13 | % | | | 40 | % |
| | | | | | | | | | | | |
| | 1 | Commencement of operations. |
| | 2 | Based on average shares outstanding. |
| | 3 | Where applicable, excludes the effects of any sales charges and assumes the reinvestment of dividends and distributions. |
| | 4 | Aggregate total investment return. |
| | 6 | Ratios do not include expenses incurred indirectly as a result of investments in underlying funds of approximately 0.36%. |
| | 7 | Organization costs were not annualized in the calculation of the expense ratios. If these expenses were annualized, the total expenses for Institutional, Investor A and Investor C would have been 3.60%, 3.85% and 4.54%, respectively. |
| | 8 | Ratios do not include expenses incurred indirectly as a result of investments in underlying funds of approximately 0.41%. |
See Notes to Consolidated Financial Statements.
| | | | | | |
| | | BLACKROCK FUNDS | | JANUARY 31, 2014 | | 21 |
| | | | |
| Consolidated Financial Highlights (concluded) | | | BlackRock Strategic Risk Allocation Fund | |
| | | | | | | | | | | | | | | | | | | | | | | | |
| | | Institutional | | | Investor A | | | Investor C | |
| | | Six Months
Ended
January 31,
2014
(Unaudited) | | | Period
December 27,
20121 to July 31, 2013 | | | Six Months
Ended
January 31,
2014
(Unaudited) | | | Period
December 27,
20121 to July 31, 2013 | | | Six Months
Ended
January 31,
2014
(Unaudited) | | | Period
December 27,
20121 to July 31, 2013 | |
| | | | | | | | | | | | | | | | | | | | | | | | |
| Per Share Operating Performance | | | | | | | | | | | | | | | | | | | | | | | | |
Net asset value, beginning of period | | $ | 9.54 | | | $ | 10.00 | | | $ | 9.53 | | | $ | 10.00 | | | $ | 9.48 | | | $ | 10.00 | |
| | | | | | | | | | | | |
Net investment loss2 | | | (0.04 | ) | | | (0.02 | ) | | | (0.05 | ) | | | (0.02 | ) | | | (0.09 | ) | | | (0.06 | ) |
Net realized and unrealized gain (loss) | | | 0.24 | | | | (0.40 | ) | | | 0.24 | | | | (0.41 | ) | | | 0.24 | | | | (0.42 | ) |
| | | | | | | | | | | | |
Net increase (decrease) from investment operations | | | 0.20 | | | | (0.42 | ) | | | 0.19 | | | | (0.43 | ) | | | 0.15 | | | | (0.48 | ) |
| | | | | | | | | | | | |
Dividends from net investment income | | | (0.38 | ) | | | (0.04 | )3 | | | (0.36 | ) | | | (0.04 | )3 | | | (0.30 | ) | | | (0.04 | )3 |
| | | | | | | | | | | | |
Net asset value, end of period | | $ | 9.36 | | | $ | 9.54 | | | $ | 9.36 | | | $ | 9.53 | | | $ | 9.33 | | | $ | 9.48 | |
| | | | | | | | | | | | |
| | | | | | | | | | | | | | | | | | | | | | | | |
| Total Investment Return4,5 | | | | | | | | | | | | | | | | | | | | | | | | |
Based on net asset value | | | 2.06 | % | | | (4.25 | )% | | | 1.97 | % | | | (4.35 | )% | | | 1.58 | % | | | (4.86 | )% |
| | | | | | | | | | | | |
| | | | | | | | | | | | | | | | | | | | | | | | |
| Ratios to Average Net Assets6 | | | | | | | | | | | | | | | | | | | | | | | | |
Total expenses | | | 1.55 | %7 | | | 2.36 | %8,9 | | | 1.93 | %7 | | | 2.38 | %8,9 | | | 2.62 | %7 | | | 3.00 | %8,9 |
| | | | | | | | | | | | |
Total expenses after fees waived and reimbursed | | | 1.00 | %7 | | | 0.99 | %9 | | | 1.25 | %7 | | | 1.24 | %9 | | | 2.00 | %7 | | | 1.98 | %9 |
| | | | | | | | | | | | |
Net investment loss | | | (0.78 | )%7 | | | (0.35 | )%9 | | | (1.03 | )%7 | | | (0.30 | )%9 | | | (1.79 | )%7 | | | (0.98 | )%9 |
| | | | | | | | | | | | |
| | | | | | | | | | | | | | | | | | | | | | | | |
| Supplemental Data | | | | | | | | | | | | | | | | | | | | | | | | |
Net assets, end of period (000) | | $ | 24,338 | | | $ | 24,404 | | | $ | 384 | | | $ | 378 | | | $ | 360 | | | $ | 313 | |
| | | | | | | | | | | | |
Portfolio turnover | | | 0 | % | | | 59 | % | | | 0 | % | | | 59 | % | | | 0 | % | | | 59 | % |
| | | | | | | | | | | | |
| | 1 | Commencement of operations. |
| | 2 | Based on average shares outstanding. |
| | 3 | Determined in accordance with federal income tax regulations. |
| | 4 | Where applicable, excludes the effects of any sales charges and assumes the reinvestment of dividends and distributions. |
| | 5 | Aggregate total investment return. |
| | 7 | Ratios do not include expenses incurred indirectly as a result of investments in underlying funds of approximately 0.15%. |
| | 8 | Organization costs were not annualized in the calculation of the expense ratios. If these expenses were annualized, the total expenses for Institutional, Investor A and Investor C would have been 2.57%, 2.59% and 3.21%, respectively. |
| | 9 | Ratios do not include expenses incurred indirectly as a result of investments in underlying funds of approximately 0.18%. |
See Notes to Consolidated Financial Statements.
| | | | | | |
| 22 | | BLACKROCK FUNDS | | JANUARY 31, 2014 | | |
| | |
| Notes to Consolidated Financial Statements (Unaudited) | | |
1. Organization:
BlackRock FundsSM (the “Trust”) is registered under the Investment Company Act of 1940, as amended (the “1940 Act”), as an open-end management investment company. The Trust is organized as a Massachusetts business trust. BlackRock Multi-Asset Real Return Fund (“Multi-Asset Real Return”) and BlackRock Strategic Risk Allocation Fund (“Strategic Risk Allocation”) (collectively, the “Funds” or individually, a “Fund”) are each a series of the Trust. Strategic Risk Allocation is classified as non-diversified. Multi-Asset Real Return is classified as diversified. Each Fund offers multiple classes of shares. Institutional Shares are sold without a sales charge and only to certain eligible investors. Investor A Shares are generally sold with a front-end sales charge. Investor C Shares may be subject to a CDSC. All classes of shares have identical voting, dividend, liquidation and other rights and the same terms and conditions, except that Investor A and Investor C Shares bear certain expenses related to the shareholder servicing of such shares, and Investor C Shares also bear certain expenses related to the distribution of such shares. Each class has exclusive voting rights with respect to matters relating to its shareholder servicing and distribution expenditures.
As of January 31, 2014, Multi-Asset Real Return and Strategic Risk Allocation’s investments in BlackRock Liquidity Funds, TempFund were 49% and 50%, respectively, of each Fund’s net assets. The financial statements of BlackRock Liquidity Funds, TempFund, including the Schedule of Investments, can be read in conjunction with each Fund’s financial statements. BlackRock Liquidity Funds, TempFund financial statements, included in filings under BlackRock Liquidity Funds, is available, without charge, on the Securities and Exchange Commission’s (“SEC”) website at http://www.sec.gov.
Basis of Consolidation: The accompanying consolidated financial statements include the accounts of BlackRock Cayman Multi-Asset Real Return Fund, Ltd. and BlackRock Cayman Strategic Risk Allocation Fund, Ltd. (the “Subsidiaries”), which are wholly owned subsidiaries of each respective Fund and primarily invest in commodity-related instruments and other derivatives. The Subsidiaries enable the Funds to hold these commodity-related instruments and other derivatives and satisfy regulated investment company tax requirements. Each Fund may invest up to 25% of its total assets in the Subsidiary. Intercompany accounts and transactions, if any, have been eliminated. The Subsidiaries are subject to the same investment policies and restrictions that apply to the Funds.
2. Significant Accounting Policies:
The Funds’ consolidated financial statements are prepared in conformity with accounting principles generally accepted in the United States of
America (“US GAAP”), which may require management to make estimates and assumptions that affect the reported amounts of assets and liabilities in the consolidated financial statements and the reported amounts of increases and decreases in net assets from operations during the reporting period. Actual results could differ from those estimates. The following is a summary of significant polices followed by the Funds:
Valuation: US GAAP defines fair value as the price the Funds would receive to sell an asset or pay to transfer a liability in an orderly transaction between market participants at the measurement date. The Funds determine the fair values of their financial instruments at market value using independent dealers or pricing services under policies approved by the Board of Trustees of the Trust (the “Board”). The BlackRock Global Valuation Methodologies Committee (the “Global Valuation Committee”) is the committee formed by management to develop global pricing policies and procedures and to provide oversight of the pricing function for the Funds for all financial instruments.
The Funds value their bond investments on the basis of last available bid prices or current market quotations provided by dealers or pricing services. In determining the value of a particular investment, pricing services may use certain information with respect to transactions in such investments, quotations from dealers, pricing matrixes, market transactions in comparable investments, various relationships observed in the market between investments and calculated yield measures. Financial futures contracts traded on exchanges are valued at their last sale price. Swap agreements are valued utilizing quotes received daily by the Funds’ pricing service or through brokers, which are derived using daily swap curves and models that incorporate a number of market data factors, such as discounted cash flows, trades and values of the underlying reference instruments. Certain centrally cleared swaps are valued at the price determined by the relevant exchange or clearinghouse. Investments in open-end registered investment companies are valued at NAV each business day.
Equity investments traded on a recognized securities exchange or the NASDAQ Stock Market (“NASDAQ”) are valued at the last reported sale price that day or the NASDAQ official closing price, if applicable. For equity investments traded on more than one exchange, the last reported sale price on the exchange where the stock is primarily traded is used. Equity investments traded on a recognized exchange for which there were no sales on that day are valued at the last available bid price.
| | | | | | |
| | | BLACKROCK FUNDS | | JANUARY 31, 2014 | | 23 |
| | |
| Notes to Consolidated Financial Statements (continued) | | |
Securities and other assets and liabilities denominated in foreign currencies are translated into US dollars using exchange rates determined as of the close of business on the New York Stock Exchange (“NYSE”). Foreign currency exchange contracts are valued at the mean between the bid and ask prices and are determined as of the close of business on the NYSE. Interpolated values are derived when the settlement date of the contract is an interim date for which quotations are not available.
Multi-Asset Real Return values its investments in BlackRock Liquidity Series, LLC, Money Market Series (the “Money Market Series”) at fair value, which is ordinarily based upon its pro rata ownership in the underlying fund’s net assets. The Money Market Series seeks current income consistent with maintaining liquidity and preserving capital. Although the Money Market Series is not registered under the 1940 Act, its investments will follow the parameters of investments by a money market fund that is subject to Rule 2a-7 under the 1940 Act. The Fund may withdraw up to 25% of its investment daily, although the manager of the Money Market Series, in its sole discretion, may permit an investor to withdraw more than 25% on any one day.
In the event that the application of these methods of valuation results in a price for an investment that is deemed not to be representative of the market value of such investment, or if a price is not available, the investment will be valued by the Global Valuation Committee, or its delegate, in accordance with a policy approved by the Board as reflecting fair value (“Fair Value Assets”). When determining the price for Fair Value Assets, the Global Valuation Committee, or its delegate, seeks to determine the price that each Fund might reasonably expect to receive from the current sale of that asset in an arm’s-length transaction. Fair value determinations shall be based upon all available factors that the Global Valuation Committee, or its delegate, deems relevant consistent with the principles of fair value measurement, which include the market approach, income approach and/or in the case of recent investments, the cost approach, as appropriate. The market approach generally consists of using comparable market transactions. The income approach generally is used to discount future cash flows to present value and is adjusted for liquidity as appropriate. These factors include but are not limited to: (i) attributes specific to the investment or asset; (ii) the principal market for the investment or asset; (iii) the customary participants in the principal market for the investment or asset; (iv) data assumptions by market participants for the investment or asset, if reasonably available; (v) quoted prices for similar investments or assets in active markets; and (vi) other factors, such as future cash flows, interest rates, yield curves, volatilities, prepayment speeds, loss severities, credit risks, recovery rates, liquidation amounts and/or default rates. Due to the inherent uncertainty of valuations of such investments, the fair values may differ from the values that would have been used had an active market
existed. The Global Valuation Committee, or its delegate, employs various methods for calibrating valuation approaches for investments where an active market does not exist, including regular due diligence of the Funds’ pricing vendors, regular reviews of key inputs and assumptions, transactional back-testing or disposition analysis to compare unrealized gains and losses to realized gains and losses, reviews of missing or stale prices and large movements in market values and reviews of any market related activity. The pricing of all Fair Value Assets is subsequently reported to the Board or a committee thereof on a quarterly basis.
Foreign Currency: The Funds’ books and records are maintained in US dollars. Purchases and sales of investment securities are recorded at the rates of exchange prevailing on the respective date of such transactions. Generally, when the US dollar rises in value against a foreign currency, the Funds’ investments denominated in that currency will lose value because that currency is worth fewer US dollars; the opposite effect occurs if the US dollar falls in relative value.
The Funds do not isolate the portion of the results of operations arising as a result of changes in the foreign exchange rates from the changes in the market prices of investments held or sold for financial reporting purposes. Accordingly, the effects of changes in foreign currency exchange rates on investments are not segregated in the Consolidated Statements of Operations from the effects of changes in market prices of those investments but are included as a component of net realized and unrealized gain (loss) from investments. The Funds report realized currency gains (losses) on foreign currency related transactions as components of net realized gain (loss) for financial reporting purposes, whereas such components are treated as ordinary income for federal income tax purposes.
Segregation and Collateralization: In cases where a Fund enters into certain investments (e.g., financial futures contracts, foreign currency exchange contracts and swaps) that would be “senior securities” for 1940 Act purposes, the Fund may segregate or designate on its books and records cash or liquid securities having a market value at least equal to the amount of the Fund’s future obligations under such investments. Doing so allows the investment to be excluded from treatment as a “senior security.” Furthermore, if required by an exchange or counterparty agreement, the Fund may be required to deliver/deposit cash and/or securities to/with an exchange, or broker-dealer or custodian as collateral for certain investments or obligations.
Investment Transactions and Investment Income: For financial reporting purposes, investment transactions are recorded on the dates the transactions are entered into (the trade dates). Realized gains and losses on investment transactions are determined on the identified cost basis.
| | | | | | |
| 24 | | BLACKROCK FUNDS | | JANUARY 31, 2014 | | |
| | |
| Notes to Consolidated Financial Statements (continued) | | |
Dividend income is recorded on the ex-dividend dates. Interest income, including amortization and accretion of premiums and discounts on debt securities, is recognized on the accrual basis. Income, expenses and realized and unrealized gains and losses are allocated daily to each class based on its relative net assets.
Dividends and Distributions: Dividends and distributions paid by the Funds are recorded on the ex-dividend dates. The character and timing of dividends and distributions are determined in accordance with federal income tax regulations, which may differ from US GAAP.
Net income and realized gains from Subsidiary investments are treated as ordinary income for tax purposes. Accordingly, the net investment income (loss) and realized gains (losses) reported in the Funds’ financial statements presented under US GAAP for such investments held by the Subsidiary may differ significantly from income dividends and capital gain distributions. As such, any net gain will pass through to the Funds as ordinary income for federal income tax purposes. If a net loss is realized by the Subsidiary in any taxable year, the loss will generally not be available to offset the Funds’ ordinary income and/or capital gains for that year.
Income Taxes: It is the Funds’ policy to comply with the requirements of the Internal Revenue Code of 1986, as amended, applicable to regulated investment companies, and to distribute substantially all of their taxable income to their shareholders. Therefore, no federal income tax provision is required.
Each Fund files US federal and various state and local tax returns. No income tax returns are currently under examination. The statute of limitations on the Funds’ US federal tax returns remains open for the period ended July 31, 2013. The statutes of limitations on each Fund’s state and local tax returns may remain open for an additional year depending upon the jurisdiction.
Management has analyzed tax laws and regulations and their application to the Funds’ facts and circumstances and does not believe there are any uncertain tax positions that require recognition of a tax liability.
Offering Costs: Offering costs are amortized over a 12-month period beginning with the commencement of operations.
Other: Expenses directly related to a Fund or its classes are charged to that Fund or class. Other operating expenses shared by several funds are pro rated among those funds on the basis of relative net assets or other appropriate methods. Expenses directly related to the Funds and other shared expenses pro rated to the Funds are allocated daily to each class based on its relative net assets or other appropriate methods.
The Funds have an arrangement with the custodian whereby fees may be reduced by credits earned on uninvested cash balances, which, if applicable, are shown as fees paid indirectly in the Consolidated Statements of Operations. The custodian imposes fees on overdrawn cash balances, which can be offset by accumulated credits earned or may result in additional custody charges.
3. Securities and Other Investments:
Securities Lending: The Funds may lend securities to approved borrowers, such as banks, brokers and other financial institutions. The borrower pledges cash, securities issued or guaranteed by the US government or irrevocable letters of credit issued by a bank as collateral. The initial collateral received by the Funds should have a value of at least 102% of the current value of the loaned securities for securities traded on US exchanges and a value of at least 105% for all other securities. The collateral is maintained thereafter in an amount equal to at least 100% of the current market value of the loaned securities. The market value of the loaned securities is determined at the close of business of each Fund and any additional required collateral is delivered to the Funds on the next business day. Securities lending income, as disclosed in the Consolidated Statements of Operations, represents the income earned from the investment of the cash collateral, net of rebates paid to, or fees paid by, borrowers and less the fees paid to the securities lending agent. During the term of the loan, the Funds earn dividend or interest income on the securities loaned but do not receive interest income on the securities received as collateral. Loans of securities are terminable at any time and the borrower, after notice, is required to return borrowed securities within the standard time period for settlement of securities transactions.
The market value of securities on loan and the value of the related collateral are shown separately in the Consolidated Statements of Assets and Liabilities as a component of investments at value, and collateral on securities loaned at value, respectively. The cash collateral invested by the securities lending agent, BlackRock Investment Management, LLC (“BIM”), if any, is disclosed in the Consolidated Schedules of Investments.
Securities lending transactions are entered into by each Fund under Master Securities Lending Agreements (each, an “MSLA”) which provide the right, in the event of default (including bankruptcy or insolvency), for the non-defaulting party to liquidate the collateral and calculate a net exposure to the defaulting party or request additional collateral. In the event that a borrower defaults, each Fund, as lender, would offset the market value of the collateral received against the market value of the securities loaned. The value of the collateral is typically greater than that of the market value of the securities loaned, leaving the lender with a net amount payable to the defaulting party. However, bankruptcy or insolvency laws of a particular jurisdiction may impose restrictions on or
| | | | | | |
| | | BLACKROCK FUNDS | | JANUARY 31, 2014 | | 25 |
| | |
| Notes to Consolidated Financial Statements (continued) | | |
prohibitions against such a right of offset in the event of an MSLA counterparty’s bankruptcy or insolvency. Under the MSLA, the borrower can resell or re-pledge the loaned securities, and the Funds can reinvest cash collateral, or, upon an event of default, resell or re-pledge the collateral.
The following table is a summary of Multi-Asset Real Return’s securities lending agreements by counterparty which are subject to offset under an MSLA as of January 31, 2014:
| | | | | | | | | | | | |
| Counterparty | | Securities
Loaned
at Value | | | Cash
Collateral
Received1 | | | Net Amount | |
Morgan Stanley | | $ | 876,550 | | | $ | (876,550 | ) | | | — | |
| | | | |
| | 1 | Collateral with a value of $895,350 has been received in connection with securities lending agreements. Excess of collateral received from the individual counterparty is not shown for financial reporting purposes. |
The risks of securities lending also include the risk that the borrower may not provide additional collateral when required or may not return the securities when due. To mitigate this risk, the Fund benefits from a borrower default indemnity provided by BlackRock, Inc. (“BlackRock”). BlackRock’s indemnity allows for full replacement of the securities lent. The Fund also could suffer a loss if the value of an investment purchased with cash collateral falls below the market value of loaned securities or if the value of an investment purchased with cash collateral falls below the value of the original cash collateral received. During the six months ended January 31, 2014, any securities on loan were collateralized by cash.
4. Derivative Financial Instruments:
The Funds engage in various portfolio investment strategies using derivative contracts both to increase the returns of the Funds and/or to economically hedge their exposure to certain risks such as credit risk, equity risk, interest rate risk, foreign currency exchange rate risk or commodity price risk. These contracts may be transacted on an exchange or over-the counter (“OTC”).
Financial Futures Contracts: Strategic Risk Allocation purchases and/or sells financial futures contracts to gain exposure to, or economically hedge against, changes in interest rates (interest rate risk) or changes in the value of equity securities (equity risk). Financial futures contracts are agreements between the Fund and a counterparty to buy or sell a specific quantity of an underlying instrument at a specified price and at a specified date. Depending on the terms of the particular contract, financial futures contracts are settled either through physical delivery of the underlying instrument on the settlement date or by payment of a cash settlement amount on the settlement date.
Upon entering into a financial futures contract, the Fund is required to deposit initial margin with the broker in the form of cash or securities in an amount that varies depending on a contract’s size and risk profile. The initial margin deposit must then be maintained at an established level over the life of the contract. Securities deposited as initial margin are designated on the Consolidated Schedule of Investments and cash deposited is recorded on the Consolidated Statements of Assets and Liabilities as cash pledged for financial futures contracts. Pursuant to the contract, the Fund agrees to receive from or pay to the broker an amount of cash equal to the daily fluctuation in value of the contract. Such receipts or payments are known as variation margin. Variation margin is recorded by the Fund as unrealized appreciation or depreciation, and, if applicable, as a receivable or payable for the variation margin in the Consolidated Statement of Assets and Liabilities.
When the contract is closed, the Fund records a realized gain or loss equal to the difference between the value of the contract at the time it was opened and the value at the time it was closed. The use of financial futures contracts involves the risk of an imperfect correlation in the movements in the price of financial futures contracts, interest or foreign currency exchange rates and the underlying assets.
Foreign Currency Exchange Contracts: Strategic Risk Allocation enters into foreign currency exchange contracts as an economic hedge against either specific transactions or portfolio instruments or to obtain exposure to or hedge exposure away from foreign currencies (foreign currency exchange rate risk). A foreign currency exchange contract is an agreement between two parties to buy and sell a currency at a set exchange rate on a future date. Foreign currency exchange contracts, when used by the Fund, help to manage the overall exposure to the currencies in which some of the investments held by the Fund are denominated. The contract is marked-to-market daily and the change in market value is recorded by the Fund as an unrealized gain or loss. When the contract is closed, the Fund records a realized gain or loss equal to the difference between the value at the time it was opened and the value at the time it was closed. The use of foreign currency exchange contracts involves the risk that the value of a foreign currency exchange contract changes unfavorably due to movements in the value of the referenced foreign currencies.
Swaps: The Funds enter into swap agreements, in which a Fund and a counterparty agree either to make periodic net payments on a specified notional amount or a net payment upon termination. Swap agreements are privately negotiated in the OTC market and may be entered into as a bilateral contract (“OTC swaps”) or centrally cleared (“centrally cleared swaps”). Swaps are marked-to-market daily and changes in value are recorded as unrealized appreciation (depreciation).
| | | | | | |
| 26 | | BLACKROCK FUNDS | | JANUARY 31, 2014 | | |
| | |
| Notes to Consolidated Financial Statements (continued) | | |
For OTC swaps, any upfront premiums paid are recorded as assets and any upfront fees received are recorded as liabilities and are shown as swap premiums paid and swap premiums received, respectively, in the Consolidated Statements of Assets and Liabilities and amortized over the term of the OTC swap. Payments received or made by the Funds for OTC swaps are recorded in the Consolidated Statements of Operations as realized gains or losses, respectively. When an OTC swap is terminated, the Funds will record a realized gain or loss equal to the difference between the proceeds from (or cost of) the closing transaction and the Funds’ basis in the contract, if any. Generally, the basis of the contracts is the premium received or paid.
In a centrally cleared swap, immediately following execution of the swap agreement, the swap agreement is novated to a central counterparty (the “CCP”) and the Fund’s counterparty on the swap agreement becomes the CCP. The Funds are required to interface with the CCP through a broker. Upon entering into a centrally cleared swap, the Funds are required to deposit initial margin with the broker in the form of cash or securities in an amount that varies depending on the size and risk profile of the particular swap. Securities deposited as initial margin are designated on the Consolidated Schedule of Investments and cash deposited is recorded on the Consolidated Statements of Assets and Liabilities as cash pledged for centrally cleared swaps. The daily change in valuation of centrally cleared swaps is recorded as a receivable or payable for variation margin in the Consolidated Statements of Assets and Liabilities. Payments received from (paid to) the counterparty, including at termination, are recorded as realized gain (loss) in the Consolidated Statements of Operations.
Swap transactions involve, to varying degrees, elements of interest rate, credit and market risk in excess of the amounts recognized in the Consolidated Statements of Assets and Liabilities. Such risks involve the possibility that there will be no liquid market for these agreements, that the counterparty to the agreements may default on its obligation to perform or disagree as to the meaning of the contractual terms in the agreements, and that there may be unfavorable changes in interest rates and/or market values associated with these transactions.
| Ÿ | | Credit default swaps — Strategic Risk Allocation enters into credit default swaps to manage its exposure to the market or certain sectors of the market, to reduce its risk exposure to defaults of corporate and/or sovereign issuers or to create exposure to corporate and/or |
| | | sovereign issuers to which it is not otherwise exposed (credit risk). Strategic Risk Allocation may either buy or sell (write) credit default swaps on single-name issuers (corporate or sovereign), a combination or basket of single-name issuers or traded indexes. Credit default swaps on single-name issuers are agreements in which the protection buyer pays fixed periodic payments to the seller in consideration for a guarantee from the protection seller to make a specific payment should a negative credit event take place with respect to the referenced entity (e.g., bankruptcy, failure to pay, obligation accelerators, repudiation, moratorium or restructuring). Credit default swaps on traded indexes are agreements in which the buyer pays fixed periodic payments to the seller in consideration for a guarantee from the seller to make a specific payment should a write-down, principal or interest shortfall or default of all or individual underlying securities included in the index occur. As a buyer, if an underlying credit event occurs, the Fund will either (i) receive from the seller an amount equal to the notional amount of the swap and deliver the referenced security or underlying securities comprising the index, or (ii) or receive a net settlement of cash equal to the notional amount of the swap less the recovery value of the security or underlying securities comprising the index. As a seller (writer), if an underlying credit event occurs, the Fund will either pay the buyer an amount equal to the notional amount of the swap and take delivery of the referenced security or underlying securities comprising the index or pay a net settlement of cash equal to the notional amount of the swap less the recovery value of the security or underlying securities comprising the index. |
| Ÿ | | Total return swaps — The Funds enter into total return swaps to obtain exposure to a security or market without owning such security or investing directly in that market or to transfer the risk/return of one market (e.g., fixed income) to another market (e.g., equity or commodity prices) (equity risk, commodity price risk and/or interest rate risk). Total return swaps are agreements in which there is an exchange of cash flows whereby one party commits to make payments based on the total return (coupons plus capital gains/losses) of an underlying instrument in exchange for fixed or floating rate interest payments. To the extent the total return of the instrument or index underlying the transaction exceeds or falls short of the offsetting interest rate obligation, the Funds will receive a payment from or make a payment to the counterparty. |
| | | | | | |
| | | BLACKROCK FUNDS | | JANUARY 31, 2014 | | 27 |
| | |
| Notes to Consolidated Financial Statements (continued) | | |
The following is a summary of the Funds’ derivative financial instruments categorized by risk exposure:
| | | | | | | | | | | | |
| | | Fair Values of Derivative Financial Instruments as of January 31, 2014 | | | | | | | | |
| | | Derivative Assets | |
| | | | | | | | | | Strategic Risk
Allocation | |
| | | Consolidated Statements of Assets and Liabilities Location | | | | | | | Value | |
Interest rate contracts | | Net unrealized appreciation/depreciation1; Unrealized appreciation on OTC swaps1 | | | | | | | | $ | 296,958 | |
Foreign currency exchange contracts | | Unrealized appreciation on foreign currency exchange contracts | | | | | | | | | 65,652 | |
Credit contracts | | Unrealized depreciation on OTC swaps1 | | | | | | | | | 120,729 | |
Equity contracts | | Net unrealized appreciation/depreciation1; Unrealized appreciation on OTC swaps1 | | | | | | | | | 74,498 | |
Total | | | | | | | | | | $ | 557,837 | |
| | | | | | | | | | | |
| | | Derivative Liabilities | |
| | | | | Multi-Asset
Real Return | | | | | Strategic Risk
Allocation | |
| | | Consolidated Statements of Assets and Liabilities Location | | | | | Value | | | |
Interest rate contracts | | Net unrealized appreciation/depreciation1; Unrealized depreciation on OTC swaps1 | | | — | | | | | $ | 67,195 | |
Foreign currency exchange contracts | | Unrealized depreciation on foreign currency exchange contracts | | | — | | | | | | 4,922 | |
Credit contracts | | Net unrealized appreciation/depreciation1 | | $ | 8,283 | | | | | | — | |
Equity contracts | | Net unrealized appreciation/depreciation1 | | | — | | | | | | 211,103 | |
Commodity contracts | | Unrealized depreciation on OTC swaps1 | | | 89,524 | | | | | | 94,240 | |
Total | | | | $ | 97,807 | | | | | $ | 377,460 | |
| | 1 | Includes cumulative appreciation/depreciation on financial futures contracts and centrally cleared swaps, if any, as reported in the Consolidated Schedules of Investments. Only current day’s variation margin is reported within the Consolidated Statements of Assets and Liabilities. |
| | | | | | | | |
The Effect of Derivative Financial Instruments in the Consolidated Statements of Operations Six Months Ended January 31, 2014 | |
| | | Net Realized Gain (Loss) From | |
| | | Multi-Asset
Real Return | | | Strategic Risk
Allocation | |
Interest rate contracts: | | | | | | | | |
Financial futures contracts | | | — | | | $ | (167,066 | ) |
Swaps | | | — | | | | (205,554 | ) |
Foreign currency exchange contracts: | | | | | | | | |
Foreign currency transactions | | | — | | | | 12,802 | |
Credit contracts: | | | | | | | | |
Swaps | | $ | (3,833 | ) | | | 341,670 | |
Equity contracts: | | | | | | | | |
Financial futures contracts | | | — | | | | 588,868 | |
Swaps | | | — | | | | 19,248 | |
Commodity contracts: | | | | | | | | |
Swaps | | | 18,852 | | | | (41,503 | ) |
| |
Total | | $ | 15,019 | | | $ | 548,465 | |
| | | | |
| | | | |
| | | Net Change in Unrealized Appreciation/Depreciation on | |
| | | Multi-Asset Real Return | | | Strategic Risk
Allocation | |
Interest rate contracts: | | | | | | | | |
Financial futures contracts | | | — | | | $ | 135,272 | |
Swaps | | | — | | | | 279,939 | |
Foreign currency exchange contracts: | | | | | | | | |
Foreign currency translations | | | — | | | | 62,377 | |
Credit contracts: | | | | | | | | |
Swaps | | $ | (8,283 | ) | | | 7,361 | |
Equity contracts: | | | | | | | | |
Financial futures contracts | | | — | | | | (301,231 | ) |
Swaps | | | — | | | | (11,275 | ) |
Commodity contracts: | | | | | | | | |
Swaps | | | (136,335 | ) | | | (57,467 | ) |
| |
Total | | $ | (144,618 | ) | | $ | 114,976 | |
| | | | |
| | | | | | |
| 28 | | BLACKROCK FUNDS | | JANUARY 31, 2014 | | |
| | |
| Notes to Consolidated Financial Statements (continued) | | |
For the six months ended January 31, 2014, the average quarterly balances of outstanding derivative financial instruments were as follows:
| | | | | | | | |
| | | Multi-Asset
Real Return | | | Strategic Risk
Allocation | |
Financial futures contracts: | | | | | | | | |
Average number of contracts purchased | | | — | | | | 178 | |
Average number of contracts sold | | | — | | | | 8 | |
Average notional value of contracts purchased | | | — | | | $ | 16,961,517 | |
Average notional value of contracts sold | | | — | | | $ | 130,125 | |
Foreign currency exchange contracts: | | | | | | | | |
Average number of contracts - US dollars purchased | | | — | | | | 10 | |
Average number of contracts - US dollars sold | | | — | | | | 2 | |
Average US dollar amounts purchased | | | — | | | $ | 2,086,985 | |
Average US dollar amounts sold | | | — | | | $ | 61,854 | |
Credit default swaps: | | | | | | | | |
Average number of contracts - sell protection | | | 1 | | | | 4 | |
Average notional value - sell protection | | $ | 1,500,000 | | | $ | 15,164,016 | |
Total return swaps: | | | | | | | | |
Average number of contracts | | | 1 | | | | 444 | |
Average notional value | | $ | 3,505,549 | | | $ | 18,087,361 | |
Counterparty Credit Risk: A derivative contract may suffer a mark-to-market loss if the value of the contract decreases due to an unfavorable change in the market rates or values of the underlying instrument. Losses can also occur if the counterparty does not perform under the contract.
A Fund’s risk of loss from counterparty credit risk on OTC derivatives is generally limited to the aggregate unrealized gain netted against any collateral held by such Fund.
With exchange traded futures and centrally cleared swaps, there is less counterparty credit risk to the Funds since the exchange or clearing-house, as counterparty to such instruments, guarantees against a possible default. The clearinghouse stands between the buyer and the seller of the contract; therefore, the credit risk is limited to failure of the clearinghouse. While offset rights may exist under applicable law, a Fund does not have a contractual right of offset against a clearing broker or clearing-house in the event of a default (including the bankruptcy or insolvency) of the clearing broker or clearinghouse. Additionally, credit risk exists in exchange traded futures and centrally cleared swaps with respect to initial and variation margin that is held in a clearing broker’s customer accounts. While clearing brokers are required to segregate customer margin from their own assets, in the event that a clearing broker becomes insolvent or goes into bankruptcy and at that time there is a shortfall in the aggregate amount of margin held by the clearing broker for all its clients, typically the shortfall would be allocated on a pro rata basis across all the clearing broker’s customers, potentially resulting in losses to the Funds.
In order to better define its contractual rights and to secure rights that will help the Funds mitigate their counterparty risk, a Fund may enter into an International Swaps and Derivatives Association, Inc. Master Agreement (“ISDA Master Agreement”) or similar agreement with its derivative contract counterparties. An ISDA Master Agreement is a bilateral agreement between each Fund and a counterparty that governs certain OTC derivatives and typically contains, among other things, collateral posting terms and netting provisions in the event of a default and/or termination event. Under an ISDA Master Agreement, each Fund may, under certain circumstances, offset with the counterparty certain derivative financial instruments’ payables and/or receivables with collateral held and/or posted and create one single net payment. The provisions of the ISDA Master Agreement typically permit a single net payment in the event of default including the bankruptcy or insolvency of the counterparty. However, bankruptcy or insolvency laws of a particular jurisdiction may impose restrictions on or prohibitions against the right of offset in bankruptcy, insolvency or other events. In addition, certain ISDA Master Agreements allow counterparties to OTC derivatives to terminate derivative contracts prior to maturity in the event the Fund’s net assets decline by a stated percentage or the Fund fails to meet the terms of its ISDA Master Agreements, which would cause the Fund to accelerate payment of any net liability owed to the counterparty.
Collateral Requirements: For derivatives traded under an ISDA Master Agreement, the collateral requirements are typically calculated by netting the mark-to-market amount for each transaction under such agreement and comparing that amount to the value of any collateral currently pledged by the Fund and the counterparty.
Cash collateral that has been pledged to cover obligations of a Fund and cash collateral received from the counterparty, if any, is reported separately on the Consolidated Statements of Assets and Liabilities as cash pledged as collateral and cash received as collateral, respectively. Non-cash collateral pledged by a Fund, if any, is noted in the Consolidated Schedule of Investments. Generally, the amount of collateral due from or to a party has to exceed a minimum transfer amount threshold (e.g. $500,000) before a transfer is required, which is determined at the close of business of the Fund and additional required collateral is delivered to/pledged by the Fund on the next business day. Typically, the Funds and counterparties are not permitted to sell, re-pledge or use the collateral they receive. To the extent amounts due to the Fund from its counterparties are not fully collateralized, contractually or otherwise, the Fund bears the risk of loss from counterparty non-performance. Each Fund attempts to mitigate counterparty risk by only entering into agreements with counterparties that it believes have the financial resources to honor their obligations and by monitoring the financial stability of those counterparties.
| | | | | | |
| | | BLACKROCK FUNDS | | JANUARY 31, 2014 | | 29 |
| | |
| Notes to Consolidated Financial Statements (continued) | | |
At January 31, 2014, the Funds’ derivative assets and liabilities (by type) are as follows:
| | | | | | | | | | | | | | | | |
| | | Multi-Asset Real Return | | | Strategic Risk Allocation | |
| | | Assets | | | Liabilities | | | Assets | | | Liabilities | |
Derivative Financial Instruments: | | | | | | | | | | | | | | | | |
Financial futures contracts | | | — | | | | — | | | $ | 7,144 | | | $ | 23,949 | |
Foreign currency exchange contracts | | | — | | | | — | | | | 65,652 | | | | 4,922 | |
Centrally cleared swaps | | | — | | | $ | 11,298 | | | | 7,319 | | | | — | |
OTC swaps1 | | | — | | | | 89,524 | | | | 202,644 | | | | 161,435 | |
| | | | |
Total derivative assets and liabilities in the Consolidated Statements of Assets and Liabilities | | | — | | | $ | 100,822 | | | $ | 282,759 | | | $ | 190,306 | |
Derivatives not subject to a master netting agreement or similar agreement (“MNA”) | | | — | | | | (11,298 | ) | | | (14,463 | ) | | | (23,949 | ) |
| | | | |
Total assets and liabilities subject to an MNA | | | — | | | $ | 89,524 | | | $ | 268,296 | | | $ | 166,357 | |
| | | | |
| | 1 | Includes unrealized appreciation/depreciation on OTC swaps and swap premiums paid/received, if any, in the Consolidated Statements of Assets and Liabilities. |
The following tables present the Funds’ derivative assets and/or liabilities by counterparty net of amounts available for offset under an MNA and net of the related collateral received/pledged by the Funds as of January 31, 2014:
| | | | | | | | | | | | | | | | | | | | |
| Multi-Asset Real Return | |
| | | Gross Amounts Not Offset in the Consolidated Statements of Assets and Liabilities and Subject to an MNA | |
| Counterparty | | Derivative Liabilities Subject to an MNA by Counterparty | | | Derivatives Available for Offset | | | Non-cash Collateral Pledged | | | Cash Collateral Pledged | | | Net Amount of Derivative Liabilities1 | |
JPMorgan Chase Bank N.A. | | $ | 89,524 | | | | — | | | | — | | | | — | | | $ | 89,524 | |
| | | | | | | | | | | | | | | | |
| Strategic Risk Allocation | | | | | | | | | | | | | | | |
| | | Gross Amounts Not Offset in the Consolidated Statements of Assets and Liabilities and Subject to an MNA | |
| Counterparty | | Derivative Assets
Subject to an MNA by Counterparty | | | Derivatives Available for Offset2 | | | Non-cash Collateral Received | | | Cash
Collateral
Received | | | Net Amount of
Derivative Assets3 | |
Bank of America N.A. | | $ | 191,358 | | | | — | | | | — | | | | — | | | $ | 191,358 | |
Citibank N.A. | | | 20,383 | | | | — | | | | — | | | | — | | | | 20,383 | |
Deutsche Bank AG | | | 45,269 | | | $ | (4,922 | ) | | | — | | | | — | | | | 40,347 | |
JPMorgan Chase Bank N.A. | | | 11,286 | | | | (11,286 | ) | | | — | | | | — | | | | — | |
| | | | |
Total | | $ | 268,296 | | | $ | (16,208 | ) | | | — | | | | — | | | $ | 252,088 | |
| | | | |
| | | | | | | | | | | | | | | | |
| Counterparty | | Derivative Liabilities Subject to an MNA by Counterparty | | | Derivatives Available for Offset2 | | | Non-cash Collateral Pledged | | | Cash Collateral Pledged | | | Net Amount of Derivative Liabilities1 | |
Deutsche Bank AG | | $ | 4,922 | | | $ | (4,922 | ) | | | — | | | | — | | | | — | |
JPMorgan Chase Bank N.A. | | | 161,435 | | | | (11,286 | ) | | | — | | | | — | | | $ | 150,149 | |
| | | | |
Total | | $ | 166,357 | | | $ | (16,208 | ) | | | — | | | | — | | | $ | 150,149 | |
| | | | |
| | 1 | Net amount represents the net amount payable due to the counterparty in the event of default. |
| | 2 | The amount of derivatives available for offset is limited to the amount of assets and/or liabilities that are subject to an MNA. |
| | 3 | Net amount represents the net amount receivable from the counterparty in the event of default. |
| | | | | | |
| 30 | | BLACKROCK FUNDS | | JANUARY 31, 2014 | | |
| | |
| Notes to Consolidated Financial Statements (continued) | | |
5. Investment Advisory Agreement and Other Transactions with Affiliates:
The PNC Financial Services Group, Inc. is the largest stockholder and an affiliate, for 1940 Act purposes, of BlackRock.
The Trust, on behalf of the Funds, entered into an Investment Advisory Agreement with the Manager, the Funds’ investment advisor, an indirect, wholly owned subsidiary of BlackRock, to provide investment advisory and administration services. The Manager is responsible for the management of each Fund’s portfolio and provides the necessary personnel, facilities, equipment and certain other services necessary to the operations of each Fund. For such services, each Fund pays the Manager a monthly fee based on a percentage of each Fund’s average daily net assets at the following annual rates:
| | | | | | | | |
| | | Multi-Asset
Real Return | | | Strategic Risk
Allocation | |
| Average Daily Net Assets | | Investment | | | Advisory Fee | |
First $1 Billion | | | 0.60 | % | | | 0.75 | % |
$1 Billion - $3 Billion | | | 0.56 | % | | | 0.71 | % |
$3 Billion - $5 Billion | | | 0.54 | % | | | 0.68 | % |
$5 Billion - $10 Billion | | | 0.52 | % | | | 0.65 | % |
Greater than $10 Billion | | | 0.51 | % | | | 0.64 | % |
The Manager voluntarily agreed to waive its investment advisory fees by the amount of investment advisory fees each Fund pays to the Manager indirectly through its investment in affiliated money market funds. However, the Manager does not waive its investment advisory fees by the amount of investment advisory fees paid in connection with Strategic Risk Allocation’s investments in other affiliated investment companies, if any. These amounts are included in fees waived by Manager in the Consolidated Statements of Operations. For the six months ended January 31, 2014, the amounts waived were as follows:
| | | | |
Multi-Asset Real Return | | $ | 810 | |
Strategic Risk Allocation | | $ | 5,394 | |
The Manager provides investment management and other services to the Subsidiaries. The Manager does not receive separate compensation from the Subsidiaries for providing investment management or administrative services. However, the Funds pay the Manager based on each Fund’s net assets which includes the assets of the Subsidiaries.
The Manager entered into separate sub-advisory agreements with BlackRock Financial Management, Inc. (“BFM”), an affiliate of the Manager, to serve as sub-advisor for Multi-Asset Real Return and Strategic Risk Allocation, and with BlackRock International Limited (“BIL”), an affiliate of the Manager, to serve as sub-advisor for Strategic Risk Allocation. The Manager pays BFM and BIL, for services they provide, a monthly fee that is a percentage of the investment advisory fees paid by the applicable Fund to the Manager.
The Trust, on behalf of the Funds, entered into a Distribution Agreement and Distribution and Service Plan with BlackRock Investments, LLC (“BRIL”), an affiliate of the Manager. Pursuant to the Distribution and
Service Plan and in accordance with Rule 12b-1 under the 1940 Act, the Funds pay BRIL ongoing service and distribution fees. The fees are accrued daily and paid monthly at annual rates based upon the average daily net assets of the shares of each Fund as follows:
| | | | | | | | |
| | | Service
Fee | | | Distribution
Fee | |
Investor A | | | 0.25 | % | | | — | |
Investor C | | | 0.25 | % | | | 0.75 | % |
Pursuant to sub-agreements with BRIL, broker-dealers and BRIL provide shareholder servicing and distribution services to the Fund. The ongoing service and/or distribution fee compensates BRIL and each broker-dealer for providing shareholder servicing and/or distribution related services to Investor A and Investor C shareholders.
For the six months ended January 31, 2014, the following table shows the class specific service and distribution fees borne directly by each class of each Fund:
| | | | | | | | | | | | |
| | | Investor A | | | Investor C | | | Total | |
Multi-Asset Real Return | | $ | 1,446 | | | $ | 2,588 | | | $ | 4,034 | |
Strategic Risk Allocation | | $ | 461 | | | $ | 1,682 | | | $ | 2,143 | |
Pursuant to written agreements, certain financial intermediaries, some of which may be affiliates, provide the Funds with sub-accounting, recordkeeping, sub-transfer agency and other administrative services with respect to sub-accounts they service. For these services, these entities receive an asset based fee or an annual fee per shareholder account, which will vary depending on share class and/or net assets.
The Manager maintains a call center, which is responsible for providing certain shareholder services to the Funds, such as responding to shareholder inquiries and processing transactions based upon instructions from shareholders with respect to the subscription and redemption of Fund shares. For the six months ended January 31, 2014, each Fund reimbursed the Manager the following amounts for costs incurred in running the call center, which are included in transfer agent — class specific in the Consolidated Statements of Operations:
| | | | | | | | | | | | | | | | |
| | | Institutional | | | Investor A | | | Investor C | | | Total | |
Multi-Asset Real Return | | $ | 23 | | | $ | 4 | | | $ | 4 | | | $ | 31 | |
Strategic Risk Allocation | | $ | 47 | | | $ | 4 | | | $ | 4 | | | $ | 55 | |
For the six months ended January 31, 2014, the following table shows the class specific transfer agent fees borne directly by each class of each Fund:
| | | | | | | | | | | | | | | | |
| | | Institutional | | | Investor A | | | Investor C | | | Total | |
Multi-Asset Real Return | | $ | 438 | | | $ | 161 | | | $ | 164 | | | $ | 763 | |
Strategic Risk Allocation | | $ | 437 | | | $ | 262 | | | $ | 123 | | | $ | 822 | |
BNY Mellon Investment Servicing (US) Inc. (“BNYMIS”) and the Manager act as co-administrators for the Funds. For these services, the co-administrators receive an administration fee computed daily and payable monthly to each administrator pursuant to separate fee arrangements, based on a percentage of the average daily net assets of
| | | | | | |
| | | BLACKROCK FUNDS | | JANUARY 31, 2014 | | 31 |
| | |
| Notes to Consolidated Financial Statements (continued) | | |
each Fund. The combined administration fee, which is shown as administration in the Consolidated Statements of Operations, is paid at the following annual rates:
| | | | |
| Average Daily Net Assets | | Administration Fee | |
First $500 Million | | | 0.075 | % |
$500 million - $1 Billion | | | 0.065 | % |
Greater than $1 Billion | | | 0.055 | % |
In addition, each of the share classes is charged an administration fee, which is shown as administration — class specific in the Consolidated Statements of Operations, based on the following percentages of average daily net assets of each respective class:
| | | | |
| Average Daily Net Assets | | Administration Fee — Class Specific | |
First $500 Million | | | 0.025 | % |
$500 Million - $1 Billion | | | 0.015 | % |
Greater than $1 Billion | | | 0.005 | % |
For the six months ended January 31, 2014, the Funds paid the following to the Manager in return for these services, which are included in administration and administration — class specific in the Consolidated Statements of Operations:
| | | | |
Multi-Asset Real Return | | $ | 2,170 | |
Strategic Risk Allocation | | $ | 3,197 | |
For the six months ended January 31, 2014, the following table shows the class specific administration fees borne directly by each class of each Fund:
| | | | | | | | | | | | | | | | |
| | | Institutional | | | Investor A | | | Investor C | | | Total | |
Multi-Asset Real Return | | $ | 1,960 | | | $ | 145 | | | $ | 65 | | | $ | 2,170 | |
Strategic Risk Allocation | | $ | 3,109 | | | $ | 46 | | | $ | 42 | | | $ | 3,197 | |
BNYMIS and the Manager may have, at their discretion, voluntarily waived all or any portion of their administration fees for a Fund or a share class, which are included in administration fees waived and administration fees waived — class specific in the Consolidated Statements of Operations.
The Manager contractually agreed to waive and/or reimburse fees or expenses, excluding interest expense, dividend expense, income tax expense, acquired fund fees and expenses and certain other fund expenses, which constitute extraordinary expenses not incurred in the ordinary course of the Funds’ business, in order to limit expenses. The expense limitations as a percentage of average daily net assets are as follows:
| | | | | | | | | | | | |
| | | Institutional | | | Investor A | | | Investor C | |
Multi-Asset Real Return | | | 0.80 | % | | | 1.05 | % | | | 1.80 | % |
Strategic Risk Allocation | | | 1.00 | % | | | 1.25 | % | | | 2.00 | % |
The Manager has agreed not to reduce or discontinue this contractual waiver or reimbursement prior to December 1, 2014 unless approved by the Board, including a majority of the independent trustees.
In addition, BlackRock has contractually agreed to waive the management fee on assets estimated to be attributed to Multi-Asset Real Return’s investments in other equity and fixed income mutual funds managed by BlackRock or its affiliates. These amounts waived or reimbursed are included in fees waived by Manager and expenses reimbursed by Manager, and shown as administration fees waived — class specific, transfer agent fees waived — class specific, transfer agent fees reimbursed — class specific and expenses reimbursed, respectively, in the Consolidated Statements of Operations. For the six months ended January 31, 2014, the amounts included in fees waived by Manager were as follows:
| | | | |
Multi-Asset Real Return | | $ | 53,870 | |
Strategic Risk Allocation | | $ | 61,101 | |
The Manager reimbursed expenses of $ $15,499 for Multi-Asset Real Return, which is included in expenses reimbursed by Manager.
Class specific expense waivers or reimbursements are as follows:
| | | | | | | | | | | | | | | | |
| Administration Fees Waived | |
| | | Institutional | | | Investor A | | | Investor C | | | Total | |
Multi-Asset Real Return | | $ | 1,960 | | | $ | 143 | | | $ | 60 | | | $ | 2,163 | |
Strategic Risk Allocation | | $ | 2,703 | | | $ | 46 | | | $ | 42 | | | $ | 2,791 | |
| | | | | | | | | | | | | | | | |
| Transfer Agent Fees Waived | |
| | | Institutional | | | Investor A | | | Investor C | | | Total | |
Multi-Asset Real Return | | $ | 23 | | | $ | 4 | | | $ | 4 | | | $ | 31 | |
Strategic Risk Allocation | | $ | 32 | | | $ | 4 | | | $ | 4 | | | $ | 40 | |
| | | | | | | | | | | | | | | | |
| Transfer Agent Fees Reimbursed | |
| | | Institutional | | | Investor A | | | Investor C | | | Total | |
Multi-Asset Real Return | | $ | 393 | | | $ | 128 | | | $ | 126 | | | $ | 647 | |
Strategic Risk Allocation | | $ | 238 | | | $ | 249 | | | $ | 114 | | | $ | 601 | |
If during a Fund’s fiscal year the operating expenses of a share class, that at any time during the prior two fiscal years received a waiver or reimbursement from the Manager, are less than the expense limit for that share class, the Manager is entitled to be reimbursed by such share class up to the lesser of (a) the amount of fees waived or expenses reimbursed during those prior two fiscal years under the agreement and (b) the amount by which the expense limit for that share class exceeds the operating expenses of the share class for the current fiscal year, provided that: (1) the Fund, of which the share class is a part, has more than $50 million in assets for the fiscal year and (2) the Manager or an affiliate continues to serve as the Fund’s investment advisor or administrator. In the event the expense limit for a share class is changed subsequent to a fiscal year in which the Manager becomes entitled to reimbursement for fees waived or reimbursed, the amount available to reimburse the Manager shall be calculated by reference to the expense limit for that share class in effect at the time the Manager became entitled to receive such reimbursement, rather than the subsequently changed expense limit for that share class.
| | | | | | |
| 32 | | BLACKROCK FUNDS | | JANUARY 31, 2014 | | |
| | |
| Notes to Consolidated Financial Statements (continued) | | |
On January 31, 2014, the Fund level and class specific waivers and/or reimbursements subject to possible future recoupment under the expense limitation agreement are as follows:
| | | | | | | | |
| | | Expiring July 31, | |
| | | 2015 | | | 2016 | |
Multi-Asset Real Return | | | | | | | | |
Fund Level | | $ | 141,165 | | | $ | 74,539 | |
Institutional | | $ | 1,543 | | | $ | 2,376 | |
Investor A | | $ | 184 | | | $ | 275 | |
Investor C | | $ | 47 | | | $ | 190 | |
Strategic Risk Allocation | | | | | | | | |
Fund Level | | $ | 148,224 | | | $ | 61,101 | |
Institutional | | $ | 3,482 | | | $ | 2,973 | |
Investor A | | $ | 235 | | | $ | 298 | |
Investor C | | $ | 108 | | | $ | 160 | |
For the six months ended January 31, 2014, affiliates earned underwriting discounts, direct commissions and dealer concessions on sales of each Fund’s Investor A Shares as follows:
| | | | |
Multi-Asset Real Return | | $ | 1,504 | |
Strategic Risk Allocation | | $ | 3 | |
For the six months ended January 31, 2014, affiliates received CDSCs as follows:
| | | | |
| | | Investor C | |
Multi-Asset Real Return | | $ | 81 | |
Multi-Asset Real Return received an exemptive order from the SEC permitting it, among other things, to pay an affiliated securities lending agent a fee based on a share of the income derived from the securities lending activities and has retained BIM as the securities lending agent. BIM, on behalf of the Fund, may invest cash collateral received by the Fund for such loans in a private investment company managed by the Manager or in registered money market funds advised by the Manager or its affiliates. The market value of securities on loan and the value of the related collateral, if applicable, is shown in the Consolidated Statements of Assets and Liabilities as securities loaned at value and collateral on securities loaned at value, respectively. The cash collateral invested by BIM, if any, is disclosed in the Consolidated Schedules of Investments. Securities lending income is equal to the total of income earned from the reinvestment of cash collateral, net of rebates paid to, or fees paid by, borrowers of securities. The Fund retains 65% of securities lending income and pays a fee to BIM equal to 35% of such income. The Fund benefits from a borrower default indemnity provided by BlackRock. As securities lending agent, BIM bears all operational costs directly related to securities lending as well as the cost of borrower default indemnification. BIM does not receive any fees for managing the cash collateral. The share of income earned by the Fund is shown as securities lending — affiliated — net in the Consolidated Statements of Operations. For the six months ended January 31, 2014, BIM received $1,223 in securities lending agent fees related to securities lending activities for the Fund.
Multi-Asset Real Return recorded a payment from an affiliate to compensate for forgone securities lending revenue, which is shown as Other income — affiliated in the Consolidated Statements of Operations.
Certain officers and/or trustees of the Trust are officers and/or directors of BlackRock or its affiliates. The Funds reimburse the Manager for a portion of the compensation paid to the Trust’s Chief Compliance Officer, which is included in officer and trustees in the Consolidated Statements of Operations.
6. Purchases and Sales:
Purchases and sales of investments, excluding short-term securities and US Government securities for the six months ended January 31, 2014, were as follows:
| | | | | | | | |
| | | Purchases | | | Sales | |
Multi-Asset Real Return | | $ | 47,934,140 | | | $ | 2,704,236 | |
Strategic Risk Allocation | | | — | | | $ | 1,709,113 | |
7. Income Tax Information:
As of July 31, 2013, Strategic Risk Allocation has a capital loss carryforward with no expiration date, available to offset future realized capital gains of $844,452.
As of January 31, 2014, gross unrealized appreciation and depreciation based on cost for federal income tax purposes were as follows:
| | | | | | | | |
| | | Multi-Asset
Real Return | | | Strategic Risk
Allocation | |
Tax cost | | $ | 89,131,391 | | | $ | 24,143,859 | |
| | | | |
Gross unrealized appreciation | | $ | 501,694 | | | | — | |
Gross unrealized depreciation | | | (297,406 | ) | | $ | (575,056 | ) |
| | | | |
Net unrealized appreciation (depreciation) | | $ | 204,288 | | | $ | (575,056 | ) |
| | | | |
8. Bank Borrowings:
The Trust, on behalf of the Funds, along with certain other funds managed by the Manager and its affiliates (“Participating Funds”), are a party to a 364-day, $800 million credit agreement with a group of lenders, under which each Fund may borrow to fund shareholder redemptions. The agreement expires in April 2014. Excluding commitments designated for a certain individual fund, other Participating Funds, including the Funds, can borrow up to an aggregate commitment amount of $500 million, subject to asset coverage and other limitations as specified in the agreement. The credit agreement has the following terms: a fee of 0.065% per annum on unused commitment amounts and interest at a rate equal to the higher of (a) the one-month LIBOR plus 0.80% per annum or (b) the Fed Funds rate plus 0.80% per annum on amounts borrowed. Participating Funds paid administration and arrangement fees, which, along with commitment fees, were allocated among such funds based upon portions of the aggregate commitment available to
| | | | | | |
| | | BLACKROCK FUNDS | | JANUARY 31, 2014 | | 33 |
| | |
| Notes to Consolidated Financial Statements (continued) | | |
them and relative net assets of Participating Funds. The Funds did not borrow under the credit agreement during the six months ended January 31, 2014.
9. Market and Credit Risk:
In the normal course of business, the Funds invest in securities and enter into transactions where risks exist due to fluctuations in the market (market risk) or failure of the issuer of a security to meet all its obligations (issuer credit risk). The value of securities held by the Funds may decline in response to certain events, including those directly involving the issuers whose securities are owned by the Funds; conditions affecting the general economy; overall market changes; local, regional or global political, social or economic instability; and currency and interest rate and price fluctuations. Similar to issuer credit risk, the Funds may
be exposed to counterparty credit risk, or the risk that an entity with which the Funds have unsettled or open transactions may fail to or be unable to perform on its commitments. The Funds manage counterparty credit risk by entering into transactions only with counterparties that they believe have the financial resources to honor their obligations and by monitoring the financial stability of those counterparties. Financial assets, which potentially expose the Funds to market, issuer and counterparty credit risks, consist principally of financial instruments and receivables due from counterparties. The extent of the Funds’ exposure to market, issuer and counterparty credit risks with respect to these financial assets is generally approximated by their value recorded in the Consolidated Statements of Assets and Liabilities, less any collateral held by the Funds.
10. Capital Share Transactions:
Transactions in capital shares for each class were as follows:
| | | | | | | | | | | | | | | | | | |
| | | Six Months Ended
January 31, 2014 | | | | | Period
December 27, 20121 to
July 31, 2013 | |
| Multi-Asset Real Return | | Shares | | | Amount | | | | | Shares | | | Amount | |
Institutional | | | | | | | | | | | | | | | | | | |
Shares sold | | | 5,234,014 | | | $ | 53,840,284 | | | | | | 1,148,538 | | | $ | 11,548,104 | |
Shares issued in reinvestment of dividends and distributions | | | 13,735 | | | | 140,916 | | | | | | — | | | | — | |
Shares redeemed | | | (196,272 | ) | | | (2,049,035 | ) | | | | | (10,376 | ) | | | (106,895 | ) |
| | | | | | | | | | |
Net increase | | | 5,051,477 | | | $ | 51,932,165 | | | | | | 1,138,162 | | | $ | 11,441,209 | |
| | | | | | | | | | |
| | | | | | | | | | | | | | | | | | |
Investor A | | | | | | | | | | | | | | | | | | |
Shares sold | | | 135,418 | | | $ | 1,417,693 | | | | | | 70,146 | | | $ | 727,498 | |
Shares issued in reinvestment of dividends and distributions | | | 4,080 | | | | 41,776 | | | | | | — | | | | — | |
Shares redeemed | | | (7,381 | ) | | | (76,584 | ) | | | | | (25,731 | ) | | | (267,340 | ) |
| | | | | | | | | | |
Net increase | | | 132,117 | | | $ | 1,382,885 | | | | | | 44,415 | | | $ | 460,158 | |
| | | | | | | | | | |
| | | | | | | | | | | | | | | | | | |
Investor C | | | | | | | | | | | | | | | | | | |
Shares sold | | | 50,173 | | | $ | 520,441 | | | | | | 26,085 | | | $ | 270,761 | |
Shares issued in reinvestment of dividends and distributions | | | 1,445 | | | | 14,731 | | | | | | — | | | | — | |
Shares redeemed | | | (1,659 | ) | | | (17,045 | ) | | | | | (8 | ) | | | (85 | ) |
| | | | | | | | | | |
Net increase | | | 49,959 | | | $ | 518,127 | | | | | | 26,077 | | | $ | 270,676 | |
| | | | | | | | | | |
Total Net Increase | | | 5,233,553 | | | $ | 53,833,177 | | | | | | 1,208,654 | | | $ | 12,172,043 | |
| | | | | | | | | | |
| | 1 | Commencement of operations. |
| | | | | | |
| 34 | | BLACKROCK FUNDS | | JANUARY 31, 2014 | | |
| | |
| Notes to Consolidated Financial Statements (concluded) | | |
| | | | | | | | | | | | | | | | | | |
| | | Six Months
Ended
January 31, 2014 | | | | | Period
December 27, 20121 to
July 31, 2013 | |
| Strategic Risk Allocation | | Shares | | | Amount | | | | | Shares | | | Amount | |
Institutional | | | | | | | | | | | | | | | | | | |
Shares sold | | | 55,237 | | | $ | 523,708 | | | | | | 2,550,267 | | | $ | 25,504,357 | |
Shares issued in reinvestment of dividends | | | 3,189 | | | | 29,856 | | | | | | 9,182 | | | | 91,821 | |
Shares redeemed | | | (17,796 | ) | | | (171,352 | ) | | | | | (579 | ) | | | (5,511 | ) |
| | | | | | | | | | |
Net increase | | | 40,630 | | | $ | 382,212 | | | | | | 2,558,870 | | | $ | 25,590,667 | |
| | | | | | | | | | |
| | | | | | | | | | | | | | | | | | |
Investor A | | | | | | | | | | | | | | | | | | |
Shares sold | | | 6,836 | | | $ | 66,134 | | | | | | 49,167 | | | $ | 507,183 | |
Shares issued in reinvestment of dividends | | | 1,418 | | | | 13,268 | | | | | | 9 | | | | 91 | |
Shares redeemed | | | (6,993 | ) | | | (66,373 | ) | | | | | (9,459 | ) | | | (89,170 | ) |
| | | | | | | | | | |
Net increase | | | 1,261 | | | $ | 13,029 | | | | | | 39,717 | | | $ | 418,104 | |
| | | | | | | | | | |
| | | | | | | | | | | | | | | | | | |
Investor C | | | | | | | | | | | | | | | | | | |
Shares sold | | | 4,484 | | | $ | 43,236 | | | | | | 56,700 | | | $ | 569,640 | |
Shares issued in reinvestment of dividends | | | 1,060 | | | | 9,897 | | | | | | 9 | | | | 90 | |
Shares redeemed | | | (70 | ) | | | (653 | ) | | | | | (23,638 | ) | | | (228,755 | ) |
| | | | | | | | | | |
Net increase | | | 5,474 | | | $ | 52,480 | | | | | | 33,071 | | | $ | 340,975 | |
| | | | | | | | | | |
Total Net Increase | | | 47,365 | | | $ | 447,721 | | | | | | 2,631,658 | | | $ | 26,349,746 | |
| | | | | | | | | | |
| | 1 | Commencement of operations. |
At January 31, 2014, shares owned by affiliates of Multi-Asset Real Return and Strategic Risk Allocation were as follows:
| | | | | | | | |
| Shares | | Multi-Asset Real Return | | | Strategic Risk Allocation | |
Institutional | | | 995,000 | | | | 2,504,182 | |
Investor A | | | 2,500 | | | | 2,509 | |
Investor C | | | 2,500 | | | | 2,509 | |
11. Subsequent Events:
Management has evaluated the impact of all subsequent events on the Funds through the date the consolidated financial statements were issued and has determined that there were no subsequent events requiring adjustment or additional disclosure in the consolidated financial statements.
| | | | | | |
| | | BLACKROCK FUNDS | | JANUARY 31, 2014 | | 35 |
Ronald W. Forbes, Co-Chair of the Board and Trustee
Rodney D. Johnson, Co-Chair of the Board and Trustee
Paul L. Audet, Trustee
David O. Beim, Trustee
Henry Gabbay, Trustee
Dr. Matina S. Horner, Trustee
Herbert I. London, Trustee
Ian A. MacKinnon, Trustee
Cynthia A. Montgomery, Trustee
Joseph P. Platt, Trustee
Robert C. Robb, Jr., Trustee
Toby Rosenblatt, Trustee
Kenneth L. Urish, Trustee
Frederick W. Winter, Trustee
John M. Perlowski, President and Chief Executive Officer
Richard Hoerner, CFA, Vice President
Brendan Kyne, Vice President
Neal Andrews, Chief Financial Officer
Jay Fife, Treasurer
Brian Kindelan, Chief Compliance Officer and Anti-Money Laundering Officer
Benjamin Archibald, Secretary
Investment Advisor and Co-Administrator
BlackRock Advisors, LLC
Wilmington, DE 19809
Sub-Advisors
BlackRock Financial Management, Inc.1, 2
New York, NY 10055
BlackRock International Limited2
Edinburgh, EH3 8JB, United Kingdom
Distributor
BlackRock Investments, LLC
New York, NY 10022
Accounting Agent, Co-Administrator and Transfer Agent
BNY Mellon Investment Servicing (US) Inc.
Wilmington, DE 19809
Custodian
The Bank of New York Mellon
New York, NY 10286
Legal Counsel
Sidley Austin LLP
New York, NY 10019
Independent Registered Public Accounting Firm
Deloitte & Touche LLP
Philadelphia, PA 19103
Address of the Trust
100 Bellevue Parkway
Wilmington, DE 19809
| | 1 | For Multi-Asset Real Return. |
| | 2 | For Strategic Risk Allocation. |
| | | | | | |
| 36 | | BLACKROCK FUNDS | | JANUARY 31, 2014 | | |
Electronic Delivery
Electronic copies of most financial reports and prospectuses are available on the Funds’ websites or shareholders can sign up for e-mail notifications of quarterly statements, annual and semi-annual reports and prospectuses by enrolling in the Funds’ electronic delivery program.
To enroll:
Shareholders Who Hold Accounts with Investment Advisors, Banks or Brokerages:
Please contact your financial advisor. Please note that not all investment advisors, banks or brokerages may offer this service.
Shareholders Who Hold Accounts Directly with BlackRock:
| 1) | Access the BlackRock website at |
| | http://www.blackrock.com/ edelivery |
| 2) | Select “eDelivery” under the “More Information” section |
Householding
The Funds will mail only one copy of shareholder documents, including prospectuses, annual and semi-annual reports and proxy statements, to shareholders with multiple accounts at the same address. This practice is commonly called “householding” and is intended to reduce expenses and eliminate duplicate mailings of shareholder documents. Mailings of your shareholder documents may be householded indefinitely unless you instruct us otherwise. If you do not want the mailing of these documents to be combined with those for other members of your household, please call the Funds at (800) 441-7762.
Availability of Quarterly Schedule of Investments
The Funds file their complete schedule of portfolio holdings with the SEC for the first and third quarters of each fiscal year on Form N-Q. The Funds’ Forms N-Q are available on the SEC’s website at http:// www.sec.gov and may also be reviewed and copied at the SEC’s Public Reference Room in Washington, DC. Information on how to access documents on the SEC’s website without charge may be obtained by calling (800) SEC-0330. The Funds’ Forms N-Q may also be obtained upon request and without charge by calling (800) 441-7762.
Availability of Proxy Voting Policies and Procedures
A description of the policies and procedures that the Funds use to determine how to vote proxies relating to portfolio securities is available (1) without charge, upon request, by calling (800) 441-7762; (2) at http://www.blackrock.com; and (3) on the SEC’s website at http:// www.sec.gov.
Availability of Proxy Voting Record
Information about how the Funds voted proxies relating to securities held in the Funds’ portfolios during the most recent 12-month period ended June 30 is available upon request and without charge (1) at http://www.blackrock.com or by calling (800) 441-7762 and (2) on the SEC’s website at http://www.sec.gov.
Account Information
Call us at (800) 441-7762 from 8:00 AM to 6:00 PM EST on any business day to get information about your account balances, recent transactions and share prices. You can also reach us on the Web at http:// www.blackrock.com/funds.
Automatic Investment Plans
Investor Class shareholders who want to invest regularly can arrange to have $50 or more automatically deducted from their checking or savings account and invested in any of the BlackRock funds.
Systematic Withdrawal Plan
Investor Class shareholders can establish a systematic withdrawal plan and receive periodic payments of $50 or more from their BlackRock funds, as long as their account balance is at least $10,000.
Retirement Plans
Shareholders may make investments in conjunction with Traditional, Rollover, Roth, Coverdell, Simple IRAs, SEP IRAs and 403(b) Plans.
| | | | | | |
| | | BLACKROCK FUNDS | | JANUARY 31, 2014 | | 37 |
| | |
| Additional Information (concluded) | | |
|
| BlackRock Privacy Principles |
BlackRock is committed to maintaining the privacy of its current and former fund investors and individual clients (collectively, “Clients”) and to safeguarding their non-public personal information. The following information is provided to help you understand what personal information BlackRock collects, how we protect that information and why in certain cases we share such information with select parties.
If you are located in a jurisdiction where specific laws, rules or regulations require BlackRock to provide you with additional or different privacy-related rights beyond what is set forth below, then BlackRock will comply with those specific laws, rules or regulations.
BlackRock obtains or verifies personal non-public information from and about you from different sources, including the following: (i) information we receive from you or, if applicable, your financial intermediary, on applications, forms or other documents; (ii) information about your transactions with us, our affiliates, or others; (iii) information we receive from a consumer reporting agency; and (iv) from visits to our websites.
BlackRock does not sell or disclose to non-affiliated third parties any non-public personal information about its Clients, except as permitted by law or as is necessary to respond to regulatory requests or to service Client accounts. These non-affiliated third parties are required to protect the confidentiality and security of this information and to use it only for its intended purpose.
We may share information with our affiliates to service your account or to provide you with information about other BlackRock products or services that may be of interest to you. In addition, BlackRock restricts access to non-public personal information about its Clients to those BlackRock employees with a legitimate business need for the information. BlackRock maintains physical, electronic and procedural safeguards that are designed to protect the non-public personal information of its Clients, including procedures relating to the proper storage and disposal of such information.
| | | | | | |
| 38 | | BLACKROCK FUNDS | | JANUARY 31, 2014 | | |
| | |
| A World-Class Mutual Fund Family | | |
BlackRock offers a diverse lineup of open-end mutual funds crossing all investment styles and managed by experts in equity, fixed income and tax-exempt investing.
BlackRock ACWI ex-US Index Fund
BlackRock All-Cap Energy & Resources Portfolio
BlackRock Basic Value Fund
BlackRock Capital Appreciation Fund
BlackRock Commodity Strategies Fund
BlackRock Disciplined Small Cap Core Fund
BlackRock Emerging Markets Dividend Fund
BlackRock Emerging Markets Fund
BlackRock Emerging Markets Long/Short Equity Fund
BlackRock Energy & Resources Portfolio
BlackRock Equity Dividend Fund
BlackRock EuroFund
BlackRock Flexible Equity Fund
BlackRock Focus Growth Fund
BlackRock Global Dividend Portfolio
BlackRock Global Long/Short Equity Fund
BlackRock Global Opportunities Portfolio
BlackRock Global SmallCap Fund
BlackRock Health Sciences Opportunities Portfolio
BlackRock International Fund
BlackRock International Index Fund
BlackRock International Opportunities Portfolio
BlackRock Large Cap Core Fund
BlackRock Large Cap Core Plus Fund
BlackRock Large Cap Growth Fund
BlackRock Large Cap Value Fund
BlackRock Latin America Fund
BlackRock Long-Horizon Equity Fund
BlackRock Mid-Cap Growth Equity Portfolio
BlackRock Mid-Cap Value Opportunities Fund
BlackRock Natural Resources Trust
BlackRock Pacific Fund
BlackRock Real Estate Securities Fund
BlackRock Russell 1000® Index Fund
BlackRock Science & Technology Opportunities Portfolio
BlackRock Small Cap Growth Equity Portfolio
BlackRock Small Cap Growth Fund II
BlackRock Small Cap Index Fund
BlackRock S&P 500 Stock Fund
BlackRock U.S. Opportunities Portfolio
BlackRock Value Opportunities Fund
|
| Taxable Fixed Income Funds |
BlackRock Bond Index Fund
BlackRock Core Bond Portfolio
BlackRock CoreAlpha Bond Fund
BlackRock CoRI Funds
2015
2017
2019
2021
2023
BlackRock Emerging Markets Flexible Dynamic Bond Portfolio
BlackRock Floating Rate Income Portfolio
BlackRock Global Long/Short Credit Fund
BlackRock GNMA Portfolio
BlackRock High Yield Bond Portfolio
BlackRock Inflation Protected Bond Portfolio
BlackRock International Bond Portfolio
BlackRock Investment Grade Bond Portfolio
BlackRock Low Duration Bond Portfolio
BlackRock Secured Credit Portfolio
BlackRock Short Obligations Fund
BlackRock Short-Term Treasury Fund
BlackRock Strategic Income Opportunities Portfolio
BlackRock Total Return Fund
BlackRock U.S. Government Bond Portfolio
BlackRock U.S. Mortgage Portfolio
BlackRock Ultra-Short Obligations Fund
BlackRock World Income Fund
|
| Municipal Fixed Income Funds |
BlackRock California Municipal Bond Fund
BlackRock High Yield Municipal Fund
BlackRock National Municipal Fund
BlackRock New Jersey Municipal Bond Fund
BlackRock New York Municipal Bond Fund
BlackRock Pennsylvania Municipal Bond Fund
BlackRock Short-Term Municipal Fund
BlackRock Strategic Municipal Opportunities Fund
| | | | | | | | | | | | | | |
| BlackRock Balanced Capital Fund | | LifePath Active Portfolios | | LifePath Index Portfolios |
| BlackRock Emerging Market Allocation Portfolio | | 2015 | | | 2040 | | | | | Retirement | | 2040 | | |
| BlackRock Global Allocation Fund | | 2020 | | | 2045 | | | | | 2020 | | 2045 | | |
| BlackRock Managed Volatility Portfolio | | 2025 | | | 2050 | | | | | 2025 | | 2050 | | |
| BlackRock Multi-Asset Income Portfolio | | 2030 | | | 2055 | | | | | 2030 | | 2055 | | |
| BlackRock Multi-Asset Real Return Fund | | 2035 | | | | | | | | 2035 | | | | |
| BlackRock Strategic Risk Allocation Fund | | | | | | | | | | | | | | |
| | | | | | |
| | LifePath Portfolios | | | | | | | | | | | | |
| BlackRock Prepared Portfolios | | Retirement | | | 2040 | | | | | | | | | |
Conservative Prepared Portfolio | | 2020 | | | 2045 | | | | | | | | | |
Moderate Prepared Portfolio | | 2025 | | | 2050 | | | | | | | | | |
Growth Prepared Portfolio | | 2030 | | | 2055 | | | | | | | | | |
Aggressive Growth Prepared Portfolio | | 2035 | | | | | | | | | | | | |
BlackRock mutual funds are currently distributed by BlackRock Investments, LLC. You should consider the investment objectives, risks, charges and expenses of the funds under consideration carefully before investing. Each fund’s prospectus contains this and other information and is available at www.blackrock.com or by calling (800) 441-7762 or from your financial advisor. The prospectus should be read carefully before investing.
| | | | | | |
| | | BLACKROCK FUNDS | | JANUARY 31, 2014 | | 39 |
| | |
This report is transmitted to shareholders only. It is not authorized for use as an offer of sale or a solicitation of an offer to buy shares of the Funds unless accompanied or preceded by the Fund’s current prospectus. Past performance results shown in this report should not be considered a representation of future performance. Investment returns and principal value of shares will fluctuate so that shares, when redeemed, may be worth more or less than their original cost. Statements and other information herein are as dated and are subject to change. Investment in foreign securities involves special risks including fluctuating foreign exchange rates, foreign government regulations, differing degrees of liquidity and the possibility of substantial volatility due to adverse political, economic or other developments. | |  |
| | |
| | |
| MRRSRA-1/14-SAR | |  |
JANUARY 31, 2014
| | | | |
SEMI-ANNUAL REPORT (UNAUDITED) | | | | BLACKROCK® |
BlackRock FundsSM
„ BlackRock Short Obligations Fund
„ BlackRock Short-Term Treasury Fund
„ BlackRock Ultra-Short Obligations Fund
| | |
| Not FDIC Insured ¡ May Lose Value ¡ No Bank Guarantee | | |
| | | | | | |
| 2 | | BLACKROCK FUNDS | | JANUARY 31, 2014 | | |
Dear Shareholder
One year ago, US financial markets were improving despite a sluggish global economy, as loose monetary policy beckoned investors to take on more risk in their portfolios. Slow but positive growth in the US was sufficient to support corporate earnings, while uncomfortably high unemployment reinforced expectations that the Federal Reserve would continue its aggressive monetary stimulus programs. International markets were not as fruitful in the earlier part of the year given uneven growth rates and more direct exposure to macro risks such as the resurgence of political instability in Italy, the banking crisis in Cyprus and a generally poor outlook for European economies. Additionally, emerging markets significantly lagged the rest of the world due to slowing growth and structural imbalances.
Global financial markets were rattled in May when Fed Chairman Bernanke mentioned the possibility of reducing (or “tapering”) the central bank’s asset purchase programs — comments that were widely misinterpreted as signaling an end to the Fed’s zero-interest-rate policy. US Treasury yields rose sharply, triggering a steep sell-off across fixed income markets. (Bond prices move in the opposite direction of yields.) Equity prices also suffered as investors feared the implications of a potential end of a program that had greatly supported the markets. Markets rebounded in late June, however, when the Fed’s tone turned more dovish, and improving economic indicators and better corporate earnings helped extend gains through most of the summer.
The fall was a surprisingly positive period for most asset classes after the Fed defied market expectations with its decision to delay tapering. Higher volatility returned in late September when the US Treasury Department warned that the national debt would soon breach its statutory maximum. The ensuing political brinksmanship led to a partial government shutdown, roiling global financial markets through the first half of October, but equities and other so-called “risk assets” resumed their rally when politicians engineered a compromise to reopen the government and extend the debt ceiling, at least temporarily.
The remainder of 2013 was generally positive for stock markets in the developed world, although investors continued to grapple with uncertainty about when and how much the Fed would scale back on stimulus. When the long-awaited taper announcement ultimately came in mid-December, the Fed reduced the amount of its monthly asset purchases but at the same time extended its time horizon for maintaining low short-term interest rates. Markets reacted positively, as this move signaled the Fed’s perception of real improvement in the economy and investors were finally relieved from the tenacious anxiety that had gripped them for quite some time.
Investors’ risk appetite diminished in the new year. Heightened volatility in emerging markets and mixed US economic data caused global equities to weaken in January while bond markets found renewed strength. While tighter global liquidity was an ongoing headwind for developing countries, financial troubles in Argentina and Turkey launched a sharp sell-off in a number of emerging market currencies. Unexpectedly poor economic data out of China added to the turmoil. In the US, most indicators continued to signal a strengthening economy; however, stagnant wage growth raised concerns about the sustainability of the overall positive momentum. US stocks underperformed other developed equity markets as a number of disappointing corporate earnings reports prompted investors to take advantage of lower valuations abroad.
While accommodative monetary policy was the main driver behind positive market performance over the period, it was also the primary cause of volatility and uncertainty. Developed market stocks were the strongest performers for the six- and 12-month periods ended Jan. 31. In contrast, emerging markets were weighed down by uneven growth, high debt levels and severe currency weakness. Rising interest rates pressured US Treasury bonds and other high-quality fixed income sectors, including tax-exempt municipals and investment grade corporate bonds. High yield bonds, to the contrary, benefited from income-oriented investors’ search for yield in the low-rate environment. Short-term interest rates remained near zero, keeping yields on money market securities near historical lows.
At BlackRock, we believe investors need to think globally and extend their scope across a broader array of asset classes and be prepared to move freely as market conditions change over time. We encourage you to talk with your financial advisor and visit www.blackrock.com for further insight about investing in today’s world.
Sincerely,

Rob Kapito
President, BlackRock Advisors, LLC

“While accommodative monetary policy was the main driver behind positive market performance over the period, it was also the primary cause of volatility and uncertainty.”
Rob Kapito
President, BlackRock Advisors, LLC
| | | | | | | | |
| Total Returns as of January 31, 2014 | |
| | | 6-month | | | 12-month | |
US large cap equities
(S&P 500® Index) | | | 6.85 | % | | | 21.52 | % |
US small cap equities
(Russell 2000® Index) | | | 8.88 | | | | 27.03 | |
International equities
(MSCI Europe, Australasia, Far East Index) | | | 7.51 | | | | 11.93 | |
Emerging market equities
(MSCI Emerging Markets Index) | | | (0.33 | ) | | | (10.17 | ) |
3-month Treasury bill
(BofA Merrill Lynch
3-Month US Treasury
Bill Index) | | | 0.03 | | | | 0.08 | |
US Treasury securities
(BofA Merrill Lynch
10- Year US Treasury
Index) | | | 0.77 | | | | (2.97 | ) |
US investment grade
bonds (Barclays US
Aggregate Bond Index) | | | 1.78 | | | | 0.12 | |
Tax-exempt municipal
bonds (S&P Municipal Bond Index) | | | 3.13 | | | | (1.10 | ) |
US high yield bonds
(Barclays US Corporate
High Yield 2% Issuer
Capped Index) | | | 4.70 | | | | 6.76 | |
|
| Past performance is no guarantee of future results. Index performance is shown for illustrative purposes only. You cannot invest directly in an index. | |
| | | | | | |
| | | THIS PAGE NOT PART OF YOUR FUND REPORT | | | | 3 |
| | | | |
| Fund Summary as of January 31, 2014 | | | BlackRock Short Obligations Fund | |
BlackRock Short Obligations Fund’s (the “Fund”) investment objective is to seek current income consistent with preservation of capital.
|
| Portfolio Management Commentary |
How did the Fund perform?
| Ÿ | | For the six-month period ended January 31, 2014, the Fund outperformed its benchmark, the BofA Merrill Lynch 6-Month US Treasury Bill Index. |
What factors influenced performance?
| Ÿ | | The Fund’s relative outperformance was attributable to its non-benchmark allocation to spread sectors such as corporate bonds and banking obligations, including certificates of deposit. In addition, the Fund benefited from maintaining a spread duration overweight (greater sensitivity to changes in credit spreads) relative to the benchmark. |
| Ÿ | | There were no detractors from the Fund’s performance relative to the benchmark index during the period. |
Describe recent portfolio activity.
| Ÿ | | During the period, the Fund maintained a floating rate credit overweight with purchases focused on the new-issue market. This activity resulted in a shift in overall portfolio duration (sensitivity to interest rate movements) to 91 days from 99 days and in spread duration to 359 days from 341 days. |
Describe Fund positioning at period end.
| Ÿ | | The Fund continued to maintain non-benchmark exposure to credit securities with a concentration in high-quality bank obligations. As of period end, 58% of the Fund’s net assets were invested in floating rate securities. Of the Fund’s exposure maturing in excess of one year, over 80% was held in floating rate securities at the close of the period. |
The views expressed reflect the opinions of BlackRock as of the date of this report and are subject to change based on changes in market, economic or other conditions. These views are not intended to be a forecast of future events and are no guarantee of future results.
| | | | |
| Portfolio Composition | | Percent of
Net Assets | |
Corporate Bonds | | | 64 | % |
Commercial Paper | | | 12 | |
Certificates of Deposit | | | 10 | |
Repurchase Agreements | | | 9 | |
Money Market Funds | | | 1 | |
Other Assets Less Liabilities | | | 4 | |
| | | | |
| Maturity Breakdown | | Percent of
Net Assets | |
1-7 days | | | 20 | % |
8-14 days | | | 6 | |
15-30 days | | | 8 | |
31-60 days | | | 25 | |
61-90 days | | | 19 | |
91-120 days | | | 3 | |
121-150 days | | | 3 | |
> 150 days | | | 16 | |
| | | | | | |
| 4 | | BLACKROCK FUNDS | | JANUARY 31, 2014 | | |
| | |
| | | BlackRock Short Obligations Fund |
|
| Total Return Based on a $10,000 Investment |
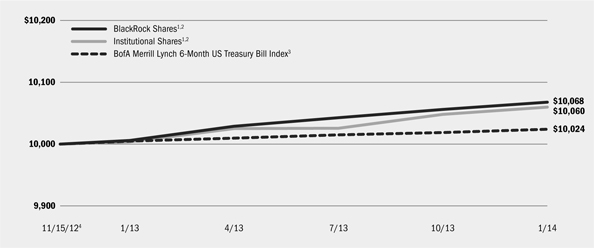
| | 1 | Assuming transaction costs and other operating expenses, including investment advisory fees and administration fees, if any. BlackRock and Institutional Shares do not have a sales charge. |
| | 2 | Under normal market conditions, Fund will invest in U.S. dollar denominated investment grade and short-term fixed and floating rate debt securities maturing in three years or less (with certain exceptions) and will maintain a dollar-weighted average maturity of 180 days or less and a dollar- weighted average life of 365 days or less. |
| | 3 | An unmanaged index that tracks 6-Month US Treasury securities. |
| | 4 | Commencement of operations. |
| | | | | | | | | | | | | | | | | | | | |
| Performance Summary for the Period Ended January 31, 2014 | |
| | | | | | | | | | | | Average Annual Total Returns | |
| | | Standardized
30-Day Yield5 | | | Unsubsidized
30-Day Yield5 | | | 6-Month
Total Returns | | | 1 Year | | | Since Inception6 | |
BlackRock | | | 0.48 | % | | | (0.25 | )% | | | 0.25 | % | | | 0.62 | % | | | 0.56 | % |
Institutional | | | 0.46 | | | | (0.25 | ) | | | 0.34 | | | | 0.56 | | | | 0.50 | |
BofA Merrill Lynch 6-Month US Treasury Bill Index | | | — | | | | — | | | | 0.09 | | | | 0.19 | | | | 0.20 | |
| | 5 | The standardized 30-day yield includes the effects of any waivers and/or reimbursements. The unsubsidized 30-day yield excludes the effects of any waiver and/or reimbursements. |
| | 6 | The Fund commenced operations on November 15, 2012. |
| | | Past performance is not indicative of future results. |
| | | | | | | | | | | | | | |
| Expense Example |
| | | Actual | | Hypothetical7 | | |
| | | Beginning
Account Value
August 1, 2013 | | Ending
Account Value
January 31, 2014 | | Expenses Paid
During the Period8 | | Beginning
Account Value
August 1, 2013 | | Ending
Account Value
January 31, 2014 | | Expenses Paid
During the Period8 | | Annualized
Expense Ratio |
BlackRock Short Obligations Fund |
BlackRock | | $1,000.00 | | $1,002.50 | | $0.50 | | $1,000.00 | | $1,024.70 | | $0.51 | | 0.10% |
Institutional | | $1,000.00 | | $1,003.40 | | $0.66 | | $1,000.00 | | $1,024.55 | | $0.66 | | 0.13% |
| | 7 | Hypothetical 5% annual return before expenses is calculated by pro rating the number of days in the most recent fiscal period divided by 365. |
| | 8 | For each class of the Fund, expenses are equal to the annualized expense ratio for the class, multiplied by the average account value over the period, multiplied by 184/365 (to reflect the one-half year period shown). |
| | | See “Disclosure of Expenses” on page 10 for further information on how expenses were calculated. |
| | | | | | |
| | | BLACKROCK FUNDS | | JANUARY 31, 2014 | | 5 |
| | | | |
| Fund Summary as of January 31, 2014 | | | BlackRock Short-Term Treasury Fund | |
BlackRock Short-Term Treasury Fund’s (the “Fund”) investment objective is to seek current income consistent with liquidity and preservation of capital.
|
| Portfolio Management Commentary |
How did the Fund perform?
| Ÿ | | For the six-month period ended January 31, 2014, the Fund performed in line with its benchmark, the BofA Merrill Lynch 0-3 Month US Treasury Bill Index. |
What factors influenced performance?
| Ÿ | | The Fund invests in US Treasury bills, Treasury notes with maturities less than 13 months and ultra-short-dated repurchase agreements. As spreads between Treasury bills and Treasury notes tightened in the later months of 2013, the Fund shifted positioning such that a greater percentage of assets were invested in Treasury bills. This move detracted from performance for the short-term as Treasury bills generated lower returns relative to Treasury notes in the steep 6-month to 1-year range of the yield curve. Additionally, the Fund’s allocation to repurchase agreements hindered results as these investments often yielded as low as 0.01% to 0.02% during the period. |
| Ÿ | | The Fund’s longer duration bias (higher sensitivity to interest rate movements) helped performance as Treasury money market rates generally declined and the Treasury bill curve flattened during the period. |
| | | Additionally, the Fund’s holdings in the 6-month to 1-year Treasury note sectors benefited from the roll-down effect (i.e., a bond’s effective maturity becomes shorter with the passing of time and therefore is evaluated at a lower yield level, which, in a steep yield curve environment, results in higher prices). |
Describe recent portfolio activity.
| Ÿ | | During the six-month period, the Fund rotated out of approximately 40% of its Treasury note exposure in favor of Treasury bills as the spread between notes and bills tightened. The Fund marginally increased its allocation to overnight tri-party repurchase agreements during the period as the Fed’s reverse repo program (with yields at 0.03% as of period end) imposed a soft floor on rates in the repo market. The Fund targeted a range of 65 to 85 days duration. |
Describe Fund positioning at period end.
| Ÿ | | As of period end, the Fund’s duration was 75 days. Approximately 40% of the Fund’s assets were invested in repurchase agreements, with the remaining assets allocated roughly evenly between Treasury bills and Treasury notes. |
The views expressed reflect the opinions of BlackRock as of the date of this report and are subject to change based on changes in market, economic or other conditions. These views are not intended to be a forecast of future events and are no guarantee of future results.
| | | | |
| Portfolio Composition | | Percent of
Net Assets | |
U.S. Treasury Obligations | | | 60 | % |
Repurchase Agreements | | | 40 | |
| | | | |
| Maturity Breakdown | | Percent of
Net Assets | |
1-7 days | | | 43 | % |
8-14 days | | | — | |
15-30 days | | | 9 | |
31-60 days | | | 3 | |
61-90 days | | | 13 | |
91-120 days | | | 4 | |
121-150 days | | | 15 | |
> 150 days | | | 13 | |
| | | | | | |
| 6 | | BLACKROCK FUNDS | | JANUARY 31, 2014 | | |
| | | | |
| | | | BlackRock Short-Term Treasury Fund | |
|
| Total Return Based on a $10,000 Investment |
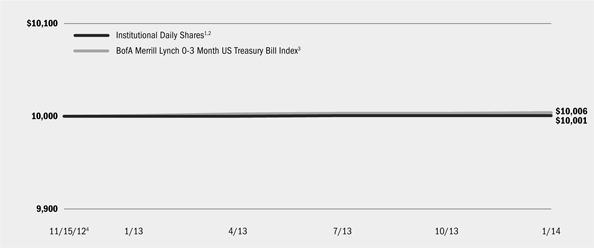
| | 1 | Assuming transaction costs and other operating expenses, including investment advisory fees and administration fees, if any. Institutional Daily Shares do not have a sales charge. |
| | 2 | Under normal market conditions, Fund will invest at least 80% of its net assets, plus the amount of any borrowings for investment purposes, in US Treasury bills, notes, trust receipts and direct obligations of the United States. |
| | 3 | An index that measures total return on cash; including price and interest income, based on short-term government Treasury bills of about 90-day maturity. |
| | 4 | Commencement of operations. |
| | | | | | | | | | | | | | | | | | | | |
| Performance Summary for the Period Ended January 31, 2014 | |
| | | | | | | | | Average Annual Total Returns | |
| | | Standardized
30-Day Yield5 | | | Unsubsidized
30-Day Yield5 | | | 6-Month
Total Returns | | | 1 Year | | | Since Inception6 | |
Institutional Daily | | | 0.03 | % | | | (1.03 | )% | | | 0.01 | % | | | 0.01 | % | | | 0.01 | % |
BofA Merrill Lynch 0-3 Month US Treasury Bill Index | | | — | | | | — | | | | 0.02 | | | | 0.05 | | | | 0.05 | |
| | 5 | The standardized 30-day yield includes the effects of any waivers and/or reimbursements. The unsubsidized 30-day yield excludes the effects of any waiver and/or reimbursements. |
| | 6 | The Fund commenced operations on November 15, 2012. |
| | | Past performance is not indicative of future results. |
| | | | | | | | | | | | | | |
| Expense Example |
| | | Actual | | Hypothetical7 | | |
| | | Beginning Account Value
August 1, 2013 | | Ending
Account Value
January 31, 2014 | | Expenses Paid
During the Period8 | | Beginning
Account Value
August 1, 2013 | | Ending
Account Value
January 31, 2014 | | Expenses Paid
During the Period8 | | Annualized
Expense Ratio |
BlackRock Short-Term Treasury Fund | | | | | | | | | | | | |
Institutional Daily | | $1,000.00 | | $1,000.10 | | $0.40 | | $1,000.00 | | $1,024.80 | | $0.41 | | 0.08% |
| | 7 | Hypothetical 5% annual return before expenses is calculated by pro rating the number of days in the most recent fiscal period divided by 365. |
| | 8 | For each class of the Fund, expenses are equal to the annualized expense ratio for the class, multiplied by the average account value over the period, multiplied by 184/365 (to reflect the one-half year period shown). |
| | | See “Disclosure of Expenses” on page 10 for further information on how expenses were calculated. |
| | | | | | |
| | | BLACKROCK FUNDS | | JANUARY 31, 2014 | | 7 |
| | | | |
| Fund Summary as of January 31, 2014 | | | BlackRock Ultra-Short Obligations Fund | |
BlackRock Ultra-Short Obligations Fund’s (the “Fund”) investment objective is to seek current income consistent with preservation of capital.
|
| Portfolio Management Commentary |
How did the Fund perform?
| Ÿ | | For the six-month period ended January 31, 2014, the Fund outperformed its benchmark, the BofA Merrill Lynch 3-Month US Treasury Bill Index. |
What factors influenced performance?
| Ÿ | | The Fund’s relative outperformance was attributable to its non-benchmark allocation to spread sectors including corporate bonds and money market securities. Spreads contracted over the period with little or low spread volatility exhibited in short-term credit instruments. |
| Ÿ | | There were no detractors from the Fund’s performance relative to the benchmark index during the period. |
Describe recent portfolio activity.
| Ÿ | | During the period, changes in the Fund were negligible with a slight shift in overall portfolio duration (sensitivity to interest rate movements) to 83 days from 78 days and in spread duration (sensitivity to changes in credit spreads) to 103 days from 108 days. |
Describe Fund positioning at period end.
| Ÿ | | As of period end, 38% of the Fund’s net assets were invested in floating rate securities. The Fund continued to maintain non-benchmark exposure to credit securities with a concentration in high-quality bank obligations. |
The views expressed reflect the opinions of BlackRock as of the date of this report and are subject to change based on changes in market, economic or other conditions. These views are not intended to be a forecast of future events and are no guarantee of future results.
| | | | |
| Portfolio Composition | | Percent of
Net Assets | |
Commercial Paper | | | 33 | % |
Corporate Bonds | | | 28 | |
Certificates of Deposit | | | 18 | |
Repurchase Agreements | | | 16 | |
Corporate Notes | | | 4 | |
Money Market Funds | | | 1 | |
| | | | |
| Maturity Breakdown | | Percent of
Net Assets | |
1-7 days | | | 32 | % |
8-14 days | | | 4 | |
15-30 days | | | 13 | |
31-60 days | | | 11 | |
61-90 days | | | 11 | |
91-120 days | | | — | |
121-150 days | | | 13 | |
> 150 days | | | 16 | |
| | | | | | |
| 8 | | BLACKROCK FUNDS | | JANUARY 31, 2014 | | |
| | |
| | | BlackRock Ultra-Short Obligations Fund |
|
| Total Return Based on a $10,000 Investment |
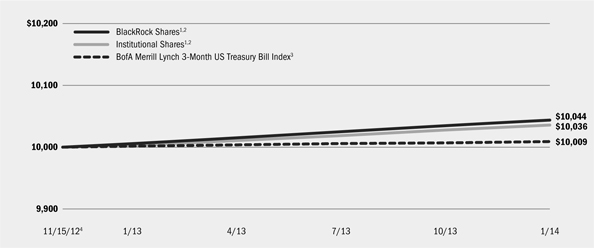
| | 1 | Assuming transaction costs and other operating expenses, including investment advisory fees and administration fees, if any. BlackRock and Institutional Shares do not have a sales charge. |
| | 2 | Under normal market conditions, Fund invests in a broad range of U.S. dollar-denominated money market instruments, including government, U.S. and foreign bank and commercial obligations and repurchase agreements. |
| | 3 | An unmanaged index that tracks 3-Month US Treasury securities. |
| | 4 | Commencement of operations. |
| | | | | | | | | | | | | | | | | | | | |
| Performance Summary for the Period Ended January 31, 2014 | |
| | | | | | | | | Average Annual Total Returns | |
| | | Standardized
30-Day Yield5 | | | Unsubsidized
30-Day Yield5 | | | 6-Month
Total Returns | | | 1 Year | | | Since Inception6 | |
BlackRock | | | 0.36 | % | | | (0.39 | )% | | | 0.19 | % | | | 0.39 | % | | | 0.37 | % |
Institutional | | | 0.33 | | | | (0.38 | ) | | | 0.18 | | | | 0.33 | | | | 0.30 | |
BofA Merrill Lynch 3-Month US Treasury Bill Index | | | — | | | | — | | | | 0.03 | | | | 0.08 | | | | 0.21 | |
| | 5 | The standardized 30-day yield includes the effects of any waivers and/or reimbursements. The unsubsidized 30-day yield excludes the effects of any waiver and/or reimbursements. |
| | 6 | The Fund commenced operations on November 15, 2012. |
| | | Past performance is not indicative of future results. |
| | | | | | | | | | | | | | |
| Expense Example |
| | | Actual | | Hypothetical7 | | |
| | | Beginning Account Value
August 1, 2013 | | Ending Account Value
January 31, 2014 | | Expenses Paid
During the Period8 | | Beginning Account Value
August 1, 2013 | | Ending Account Value
January 31, 2014 | | Expenses Paid
During the Period8 | | Annualized Expense Ratio |
BlackRock Ultra-Short Obligations Fund | | | | | | | | | | | | |
BlackRock | | $1,000.00 | | $1,001.90 | | $0.50 | | $1,000.00 | | $1,024.70 | | $0.51 | | 0.10% |
Institutional | | $1,000.00 | | $1,001.80 | | $0.66 | | $1,000.00 | | $1,024.55 | | $0.66 | | 0.13% |
| | 7 | Hypothetical 5% annual return before expenses is calculated by pro rating the number of days in the most recent fiscal period divided by 365. |
| | 8 | For each class of the Fund, expenses are equal to the annualized expense ratio for the class, multiplied by the average account value over the period, multiplied by 184/365 (to reflect the one-half year period shown). |
| | | See “Disclosure of Expenses” on page 10 for further information on how expenses were calculated. |
| | | | | | |
| | | BLACKROCK FUNDS | | JANUARY 31, 2014 | | 9 |
| • | | BlackRock, Institutional and Institutional Daily Shares are not subject to any sales charge. These shares bear no ongoing distribution or service fees and are available only to eligible investors. Prior to July 9, 2013, BlackRock Short Obligations and BlackRock Ultra-Short Obligations Funds’ Institutional Shares performance results are those of BlackRock Shares restated to reflect Institutional Shares fees. |
Refer to www.blackrock.com/cash to obtain performance data current to the most recent month-end. Performance information reflects past performance and does not guarantee future results. Current performance may be lower or higher than the performance data quoted. Performance results do not reflect the deduction of taxes that a shareholder would pay on fund distributions or the redemption of fund shares. Figures shown in each of the performance charts on the previous pages assume reinvestment of all dividends and distributions, if any, at net asset value
(“NAV”) on the ex-dividend dates. Investment return and principal value of shares will fluctuate so that shares, when redeemed, may be worth more or less than their original cost.
BlackRock Advisors, LLC (the “Manager”), the Funds’ investment advisor, waived and/or reimbursed a portion of each Fund’s expenses. Without such waiver and/or reimbursement, a Fund’s performance would have been lower. The Manager is under no obligation to waive or reimburse or to continue waiving or reimbursing its fees after the applicable termination date. See Note 4 of the Notes to Financial Statements for additional information on waivers and reimbursements. The standardized 30-day yield includes the effects of any waivers and/or reimbursements. The unsubsidized 30-day yield excludes the effects of any waivers and/or reimbursements.
Shareholders of the Funds may incur the following charges: (a) transactional expenses and (b) operating expenses, including investment advisory fees, administration fees, service and distribution fees, including 12b-1 fees, acquired fund fees and expenses, and other Fund expenses. The expense examples on the previous pages (which are based on a hypothetical investment of $1,000 invested on August 1, 2013 and held through January 31, 2014) are intended to assist shareholders both in calculating expenses based on an investment in the Funds and in comparing these expenses with similar costs of investing in other mutual funds.
The expense examples provide information about actual account values and actual expenses. In order to estimate the expenses a shareholder paid during the period covered by this report, shareholders can divide their account value by $1,000 and then multiply the result by the number corresponding to their Fund and share class under the headings entitled “Expenses Paid During the Period.”
The expense examples also provide information about hypothetical account values and hypothetical expenses based on each Fund’s actual expense ratios and an assumed rate of return of 5% per year before expenses. In order to assist shareholders in comparing the ongoing expenses of investing in these Funds and other funds, compare the 5% hypothetical example with the 5% hypothetical examples that appear in other funds’ shareholder reports.
The expenses shown in the expense examples are intended to highlight shareholders’ ongoing costs only and do not reflect any transactional expenses, such as sales charges, if any. Therefore, the hypothetical examples are useful in comparing ongoing expenses only, and will not help shareholders determine the relative total expenses of owning different funds. If these transactional expenses were included, shareholder expenses would have been higher.
| | | | | | |
| 10 | | BLACKROCK FUNDS | | JANUARY 31, 2014 | | |
| | | | |
| Schedule of Investments January 31, 2013 (Unaudited) | | | BlackRock Short Obligations Fund | |
| | | (Percentages shown are based on Net Assets) | |
| | | | | | | | |
| Asset-Backed Securities | | Par
(000) | | | Value | |
Hyundai Auto Receivables Trust, 0.46%, 1/16/17 | | $ | 200 | | | $ | 199,996 | |
| | | | | | | | |
| Corporate Bonds | | | | | | |
Automobiles — 4.0% | | | | | | | | |
Daimler Finance North America LLC,
0.84%, 1/09/15 (a)(b) | | | 500 | | | | 501,794 | |
Volkswagen International Finance NV,
0.86%, 4/01/14 (a)(b) | | | 500 | | | | 500,345 | |
| | | | | | | | |
| | | | | | | | 1,002,139 | |
Commercial Banks — 30.0% | | | | | | | | |
Australia & New Zealand Banking Group Ltd.: | | | | | | | | |
0.44%, 5/07/15 (a)(b) | | | 400 | | | | 400,304 | |
0.62%, 1/10/17 (a)(b) | | | 250 | | | | 249,856 | |
Banque Federative du Credit Mutuel SA,
1.09%, 1/20/17 (a)(b) | | | 500 | | | | 499,857 | |
The Bear Stearns Cos. LLC, 5.70%, 11/15/14 | | | 500 | | | | 520,201 | |
BP Capital Markets PLC, 0.57%, 11/06/15 (b) | | | 500 | | | | 500,795 | |
BPCE SA: | | | | | | | | |
1.99%, 2/07/14 (a)(b) | | | 625 | | | | 625,056 | |
0.74%, 7/15/15 (b) | | | 300 | | | | 299,915 | |
Commonwealth Bank of Australia, 1.95%, 3/16/15 | | | 350 | | | | 355,827 | |
Cooperatieve Centrale Raiffeisen-Boerenleenbank BA,
0.72%, 3/18/16 (b) | | | 500 | | | | 502,433 | |
Deutsche Bank Securities, Inc., 3.45%, 3/30/15 | | | 500 | | | | 516,875 | |
JPMorgan Chase & Co., 4.75%, 3/01/15 | | | 250 | | | | 260,824 | |
JPMorgan Chase Bank NA, 0.49%, 7/30/15 (b) | | | 250 | | | | 249,776 | |
Rabobank Nederland NV, 0.59%, 4/14/14 (b) | | | 400 | | | | 400,320 | |
Svenska Handelsbanken AB: | | | | | | | | |
0.70%, 3/21/16 (b) | | | 500 | | | | 501,507 | |
0.72%, 9/23/16 (b) | | | 250 | | | | 250,590 | |
Wells Fargo & Co., 1.25%, 2/13/15 | | | 375 | | | | 378,034 | |
Wells Fargo Bank NA, 0.52%, 7/20/15 (b) | | | 500 | | | | 501,161 | |
Westpac Banking Corp., 0.98%, 3/31/14 (a)(b) | | | 500 | | | | 500,539 | |
| | | | | | | | |
| | | | | | | | 7,513,870 | |
Diversified Financial Services — 6.8% | | | | | | | | |
General Electric Capital Corp., 5.90%, 5/13/14 | | | 500 | | | | 507,709 | |
Shell International Finance BV, 0.45%, 11/15/16 (b) | | | 500 | | | | 500,139 | |
Toyota Motor Credit Corp.: | | | | | | | | |
0.41%, 12/05/14 (b) | | | 500 | | | | 500,739 | |
0.39%, 9/18/15 (b) | | | 200 | | | | 200,035 | |
| | | | | | | | |
| | | | | | | | 1,708,622 | |
Diversified Telecommunication Services — 2.0% | | | | | | | | |
AT&T, Inc., 0.62%, 2/12/16 (b) | | | 500 | | | | 499,655 | |
Finance — 2.0% | | | | | | | | |
John Deere Capital Corp., 0.31%, 1/12/15 (b) | | | 500 | | | | 500,302 | |
Food Products — 3.0% | | | | | | | | |
General Mills, Inc., 0.54%, 1/29/16 (b) | | | 250 | | | | 250,099 | |
Kellogg Co., 0.47%, 2/13/15 (b) | | | 500 | | | | 500,517 | |
| | | | | | | | |
| | | | | | | | 750,616 | |
| | | | | | | | |
| Corporate Bonds | | Par
(000) | | | Value | |
Health Care Equipment & Supplies — 1.6% | | | | | | | | |
Baxter International, Inc., 0.41%, 12/11/14 (b) | | $ | 390 | | | $ | 390,509 | |
Health Care Providers & Services — 3.2% | | | | | | | | |
Principal Life Global Funding II, 0.61%, 5/27/16 (a)(b) | | | 500 | | | | 500,815 | |
UnitedHealth Group, Inc., 0.36%, 8/28/14 (b) | | | 300 | | | | 300,093 | |
| | | | | | | | |
| | | | | | | | 800,908 | |
Media — 2.0% | | | | | | | | |
NBCUniversal Media LLC, 2.10%, 4/01/14 | | | 500 | | | | 501,382 | |
Metals & Mining — 3.2% | | | | | | | | |
Rio Tinto Finance USA Ltd., 8.95%, 5/01/14 | | | 300 | | | | 306,005 | |
Rio Tinto Finance USA PLC, 1.08%, 6/17/16 (b) | | | 500 | | | | 504,476 | |
| | | | | | | | |
| | | | | | | | 810,481 | |
Oil, Gas & Consumable Fuels — 3.2% | | | | | | | | |
Devon Energy Corp., 0.69%, 12/15/15 (b) | | | 250 | | | | 250,232 | |
Total Capital Canada Ltd., 0.62%, 1/15/16 (b) | | | 300 | | | | 301,374 | |
TransCanada Pipelines Ltd., 0.93%, 6/30/16 (b) | | | 250 | | | | 251,980 | |
| | | | | | | | |
| | | | | | | | 803,586 | |
Wireless Telecommunication Services — 2.0% | | | | | | | | |
Vodafone Group PLC, 0.62%, 2/19/16 (b) | | | 500 | | | | 499,455 | |
Total Corporate Bonds — 63.0% | | | | | | | 15,781,525 | |
Total Long-Term Investments (Cost — $15,959,326) — 63.8% | | | | | | | 15,981,521 | |
| | | | | | | | |
| Short-Term Securities | | | | | | |
Certificates of Deposit | | | | | | | | |
Yankee (c) — 10.0% | | | | | | | | |
Bank of Nova Scotia, Houston, 0.45%, 3/27/14 (b) | | | 500 | | | | 500,335 | |
Bank of Tokyo-Mitsubishi UFJ Ltd., New York,
0.72%, 4/02/14 (b) | | | 500 | | | | 500,445 | |
Credit Suisse, New York: | | | | | | | | |
0.52%, 1/23/15 | | | 250 | | | | 249,950 | |
0.65%, 12/07/15 (b) | | | 500 | | | | 499,819 | |
Deutsche Bank A.G., New York, 0.71%, 2/05/14 | | | 250 | | | | 250,020 | |
Lloyds TSB Bank PLC, New York, 0.58%, 8/22/14 | | | 250 | | | | 250,393 | |
Natixis, New York, 0.49%, 5/09/14 (b) | | | 250 | | | | 250,134 | |
Total Certificates of Deposit — 10.0% | | | | | | | 2,501,096 | |
| | | | | | | | |
| Commercial Paper | | | | | | |
AXA Financial, Inc., 0.43%, 3/31/14 (d) | | | 600 | | | | 599,765 | |
DirecTV Holdings LLC, 0.40%, 7/07/14 (d) | | | 659 | | | | 657,888 | |
Electricite de France, 0.58%, 1/05/15 (a)(b) | | | 250 | | | | 248,778 | |
Harley-Davidson Financial Services, 0.20%, 2/20/14 (d) | | | 333 | | | | 332,960 | |
See Notes to Financial Statements.
| | | | | | |
| | | BLACKROCK FUNDS | | JANUARY 31, 2014 | | 11 |
| | | | |
| Schedule of Investments (continued) | | | BlackRock Short Obligations Fund | |
| | | (Percentages shown are based on Net Assets) | |
| | | | | | | | |
| Commercial Paper | | Par
(000) | | | Value | |
Suncorp Metway Ltd., 0.41%, 5/05/14 (d) | | $ | 500 | | | $ | 499,732 | |
Tesco Treasury Services PLC, 0.20%, 2/03/14 (d) | | | 750 | | | | 749,987 | |
Total Commercial Paper — 12.4% | | | | | | | 3,089,110 | |
| | | | | | | | |
| Money Market Funds — 1.2% | | Shares | | | | |
BlackRock Liquidity Funds, TempFund, Institutional Class, 0.03% (e)(f) | | | 306,176 | | | | 306,176 | |
| | | | | | | | |
| Repurchase Agreements | | Par
(000) | | | | |
Barclays Capital, Inc., 0.74%, 5/22/14
(Purchased on 11/22/13 to be repurchased at $752,790, collateralized by various corporate/debt obligations, 4.50% to 11.00% due from 4/01/16 to 9/15/41, aggregate original par and fair value of $835,574 and $858,650, respectively) | | | 750 | | | | 751,385 | |
Total Value of Barclays Capital, Inc.
(Collateral value of $858,650) | | | | | | | 751,385 | |
Mizuho Securities USA, 1.00%,2/13/14
(Purchased on 12/13/13 to be repurchased at $250,431, collateralized by various U.S. government sponsored agency and U.S. Treasury obligations, 0.00% to 4.00% due from 2/06/14 to 1/20/38, aggregate original par and fair value of $1,095,369 and $265,623, respectively) | | | 250 | | | | 250,064 | |
| | | | | | | | |
| Repurchase Agreements | | Par
(000) | | | Value | |
Mizuho Securities USA, 1.13%, 3/07/14 (g)
(Purchased on 3/04/13 to be repurchased at $252,888, collateralized by various corporate/debt, U.S. government sponsored agency and U.S. Treasury obligations, 0.00% to 6.44% due from 2/06/14 to 11/25/39, aggregate original par and fair value of $1,868,586 and $269,930, respectively) | | $ | 250 | | | $ | 250,000 | |
Total Value of Mizuho Securities USA
(Collateral value of $535,553) | | | | | | | 500,064 | |
RBS Securities, Inc., 1.00%, 3/04/14
(Purchased on 1/03/14 to be repurchased at $1,001,667, collateralized by various corporate/debt and U.S. government sponsored agency obligations, 0.00% to 3.50% due from 1/01/34 to 3/25/37, aggregate original par and fair value of $2,327,272 and $1,040,680, respectively) | | | 1,000 | | | | 1,000,742 | |
Total Value of RBS Securities, Inc.
(Collateral value of $1,040,680) | | | | | | | 1,000,742 | |
Total Repurchase Agreements — 9.0% | | | | | | | 2,252,191 | |
Total Short-Term Securities (Cost — $8,144,844) — 32.6% | | | | | | | 8,148,573 | |
Total Investments (Cost — $24,104,170) — 96.4% | | | | | | | 24,130,094 | |
Other Assets Less Liabilities — 3.6% | | | | | | | 898,183 | |
| | | | | | | | |
Net Assets — 100.0% | | | | | | $ | 25,028,277 | |
| | | | | | | | |
|
| Notes to Schedule of Investments |
| (a) | Security exempt from registration pursuant to Rule 144A under the Securities Act of 1933, as amended. These securities may be resold in transactions exempt from registration to qualified institutional investors. |
| (b) | Variable rate security. Rate shown is as of report date. |
| (c) | Issuer is a US branch of a foreign domiciled bank. |
| (d) | Rate shown reflects the discount rate at the time of purchase. |
| (e) | Investments in issuers considered to be an affiliate of the Fund during the period ended January 31, 2014, for purposes of Section 2(a)(3) of the Investment Company Act of 1940, as amended, were as follows: |
| | | | | | | | | | | | | | | | |
| Affiliate | | Shares Held at
July 31, 2013 | | | Net
Activity
(Shares) | | | Shares Held at
January 31, 2014 | | | Income | |
BlackRock Liquidity Funds, TempFund, Institutional Class | | | — | | | | 306,176 | | | | 306,176 | | | $ | 25 | |
| (f) | Represents the current yield as of report date. |
| (g) | Variable rate security. Rate shown is as of report date and maturity shown is the date the principal owed can be recovered through demand. |
| Ÿ | | For Fund compliance purposes, the Fund’s industry classifications refer to any one or more of the industry sub-classifications used by one or more widely recognized market indexes or ratings group indexes and/or as defined by Fund management. These definitions may not apply for purposes of this report, which may combine industry sub-classifications for reporting ease. |
See Notes to Financial Statements.
| | | | | | |
| 12 | | BLACKROCK FUNDS | | JANUARY 31, 2014 | | |
| | | | |
| Schedule of Investments (concluded) | | | BlackRock Short Obligations Fund | |
| Ÿ | | Fair Value Measurements — Various inputs are used in determining the fair value of investments. These inputs to valuation techniques are categorized into a disclosure hierarchy consisting of three broad levels for financial statement purposes as follows: |
| | Ÿ | | Level 1 — unadjusted price quotations in active markets/exchanges for identical assets or liabilities that the Fund has the ability to access |
| | Ÿ | | Level 2 — other observable inputs (including, but not limited to, quoted prices for similar assets or liabilities in markets that are active, quoted prices for identical or similar assets or liabilities in markets that are not active, inputs other than quoted prices that are observable for the assets or liabilities (such as interest rates, yield curves, volatilities, prepayment speeds, loss severities, credit risks and default rates) or other market–corroborated inputs) |
| | Ÿ | | Level 3 — unobservable inputs based on the best information available in the circumstances, to the extent observable inputs are not available (including the Fund’s own assumptions used in determining the fair value of investments) |
The hierarchy gives the highest priority to unadjusted quoted prices in active markets for identical assets or liabilities (Level 1 measurements) and the lowest priority to unobservable inputs (Level 3 measurements). Accordingly, the degree of judgment exercised in determining fair value is greatest for instruments categorized in Level 3. The inputs used to measure fair value may fall into different levels of the fair value hierarchy. In such cases, for disclosure purposes, the fair value hierarchy classification is determined based on the lowest level input that is significant to the fair value measurement in its entirety.
Changes in valuation techniques may result in transfers into or out of an assigned level within the disclosure hierarchy. In accordance with the Fund’s policy, transfers between different levels of the fair value disclosure hierarchy are deemed to have occurred as of the beginning of the reporting period. The categorization of a value determined for investments is based on the pricing transparency of the investment and is not necessarily an indication of the risks associated with investing in those securities. For information about the Fund’s policy regarding valuation of investments, please refer to Note 2 of the Notes to Financial Statements.
The following table summarizes the Fund’s investments categorized in the disclosure hierarchy as of January 31, 2014:
| | | | | | | | | | | | | | | | |
| | | Level 1 | | | Level 2 | | | Level 3 | | | Total | |
Assets: | | | | | | | | | | | | | | | | |
Investments:1 | | | | | | | | | | | | | | | | |
Long-Term Investments | | | — | | | $ | 15,981,521 | | | | — | | | $ | 15,981,521 | |
Short-Term Securities | | $ | 306,176 | | | | 7,842,397 | | | | — | | | | 8,148,573 | |
Total | | $ | 306,176 | | | $ | 23,823,918 | | | | — | | | $ | 24,130,094 | |
| | | | |
| 1 | See above Schedule of Investments for values in each security type. |
The carrying amount for certain of the Fund’s assets and/or liabilities approximates fair value for financial statement purposes. As of January 31, 2014, cash of $1,007,167 is categorized as Level 1 within the disclosure hierarchy.
There were no transfers between levels during the six months ended January 31, 2014.
See Notes to Financial Statements.
| | | | | | |
| | | BLACKROCK FUNDS | | JANUARY 31, 2014 | | 13 |
| | | | |
| Schedule of Investments January 31, 2014 (Unaudited) | | | BlackRock Short-Term Treasury Fund | |
| | | (Percentages shown are based on Net Assets) | |
| | | | | | | | |
| Money Market Funds — 0.0% | | Shares | | | Value | |
BlackRock Liquidity Funds, T-Fund, Institutional Class, 0.01% (a)(b) | | | 4,633 | | | $ | 4,633 | |
| | | | | | | | |
| U.S. Treasury Obligations | | Par (000) | | | | |
U.S. Treasury Bills: (c) | | | | | | | | |
0.08%, 2/06/14 | | $ | 500 | | | | 500,000 | |
0.05%, 3/13/14 | | | 500 | | | | 499,967 | |
0.09%, 5/08/14 | | | 500 | | | | 499,955 | |
0.09%, 6/19/14 | | | 500 | | | | 499,925 | |
0.09%, 6/26/14 | | | 1,200 | | | | 1,199,797 | |
0.14%, 11/13/14 | | | 400 | | | | 399,764 | |
0.13%, 12/11/14 | | | 400 | | | | 399,705 | |
0.13%, 1/08/15 | | | 400 | | | | 399,661 | |
U.S. Treasury Notes: | | | | | | | | |
0.25%, 2/28/14 | | | 1,400 | | | | 1,400,055 | |
1.25%, 4/15/14 | | | 500 | | | | 501,153 | |
0.25%, 4/30/14 | | | 950 | | | | 950,371 | |
0.25%, 5/31/14 | | | 550 | | | | 550,322 | |
0.75%, 6/15/14 | | | 500 | | | | 501,192 | |
0.63%, 7/15/14 | | | 578 | | | | 579,400 | |
0.50%, 8/15/14 | | | 150 | | | | 150,316 | |
Total U.S. Treasury Obligations — 60.2% | | | | | | | 9,031,583 | |
| | | | | | | | |
| Repurchase Agreements | | | | | | |
Deutsche Bank Securities, Inc., 0.02%, 2/03/14
(Purchased on 1/31/14 to be repurchased at $1,000,002, collateralized by U.S. Treasury Inflation Adjusted Note, 0.13% due at 4/15/18, original par and fair value of $980,600 and $1,020,016, respectively) | | | 1,000 | | | | 1,000,000 | |
Total Value of Deutsche Bank Securities, Inc.
(Collateral value of $1,020,016) | | | | | | | 1,000,000 | |
Merrill Lynch, Pierce, Fenner & Smith, Inc., 0.02%, 2/03/14
(Purchased on 1/31/14 to be repurchased at $1,000,002, collateralized by various U.S. Treasury obligations, 0.00%to 1.38% due from 10/16/14 to 12/31/18, aggregate original par and fair value of $1,025,200 and $1,020,004, respectively) | | | 1,000 | | | | 1,000,000 | |
Total Value of Merrill Lynch, Pierce, Fenner & Smith, Inc.
(Collateral value of $1,020,004) | | | | | | | 1,000,000 | |
| | | | | | | | |
| Repurchase Agreements | | Par
(000) | | | Value | |
Mizuho Securities USA, Inc., 0.02%, 2/03/14
(Purchased on 1/31/14 to be repurchased at $1,971,003, collateralized by U.S. Treasury Bill, 0.00% due at 2/06/14, original par and fair value of $2,010,500 and $2,010,496, respectively) | | $ | 1,971 | | | $ | 1,971,000 | |
Total Value of Mizuho Securities USA, Inc.
(Collateral value of $2,010,496) | | | | | | | 1,971,000 | |
Morgan Stanley & Co. LLC, 0.02%, 2/03/14
(Purchased on 1/31/14 to be repurchased at $1,000,002, collateralized by various U.S. Treasury obligations, 0.00%to 4.13% due from 3/13/14 to 5/15/15, aggregate original par and fair value of $1,020,100 and $1,020,061, respectively) | | | 1,000 | | | | 1,000,000 | |
Total Value of Morgan Stanley & Co. LLC
(Collateral value of $1,020,061) | | | | | | | 1,000,000 | |
TD Securities USA LLC, 0.02%, 2/03/14
(Purchased on 1/31/14 to be repurchased at $1,000,002, collateralized by U.S. Treasury Bond, 5.38% due at 2/15/31, original par and fair value of $786,500 and $1,020,113, respectively) | | | 1,000 | | | | 1,000,000 | |
Total Value of TD Securities USA LLC
(Collateral value of $1,020,113) | | | | | | | 1,000,000 | |
Total Repurchase Agreements — 39.8% | | | | | | | 5,971,000 | |
Total Investments (Cost — $15,006,095) — 100.0% | | | | | | | 15,007,216 | |
Liabilities in Excess of Other Assets — 0.0% | | | | | | | (5,609 | ) |
| | | | | | | | |
Net Assets — 100.0% | | | | | | $ | 15,001,607 | |
| | | | | | | | |
See Notes to Financial Statements.
| | | | | | |
| 14 | | BLACKROCK FUNDS | | JANUARY 31, 2014 | | |
| | | | |
| Schedule of Investments (concluded) | | | BlackRock Short-Term Treasury Fund | |
|
| Notes to Schedule of Investments |
| (a) | Represents the current yield as of report date. |
| (b) | Investments in issuers considered to be an affiliate of the Fund during the period ended January 31, 2014, for purposes of Section 2(a)(3) of the Investment Company Act of 1940, as amended, were as follows: |
| | | | | | | | | | | | | | | | |
| Affiliate | | Shares Held at
July 31, 2013 | | | Net
Activity
(Shares) | | | Shares Held at
January 31, 2014 | | | Income | |
BlackRock Liquidity Funds, T-Fund, Institutional Class | | | — | | | | 4,633 | | | | 4,633 | | | $ | 9 | |
| (c) | Rate shown reflects the discount rate at the time of purchase. |
| Ÿ | | Fair Value Measurements — Various inputs are used in determining the fair value of investments. These inputs to valuation techniques are categorized into a disclosure hierarchy consisting of three broad levels for financial statement purposes as follows: |
| | Ÿ | | Level 1 — unadjusted price quotations in active markets/exchanges for identical assets or liabilities that the Fund has the ability to access |
| | Ÿ | | Level 2 — other observable inputs (including, but not limited to, quoted prices for similar assets or liabilities in markets that are active, quoted prices for identical or similar assets or liabilities in markets that are not active, inputs other than quoted prices that are observable for the assets or liabilities (such as interest rates, yield curves, volatilities, prepayment speeds, loss severities, credit risks and default rates) or other market–corroborated inputs) |
| | Ÿ | | Level 3 — unobservable inputs based on the best information available in the circumstances, to the extent observable inputs are not available (including the Fund’s own assumptions used in determining the fair value of investments) |
The hierarchy gives the highest priority to unadjusted quoted prices in active markets for identical assets or liabilities (Level 1 measurements) and the lowest priority to unobservable inputs (Level 3 measurements). Accordingly, the degree of judgment exercised in determining fair value is greatest for instruments categorized in Level 3. The inputs used to measure fair value may fall into different levels of the fair value hierarchy. In such cases, for disclosure purposes, the fair value hierarchy classification is determined based on the lowest level input that is significant to the fair value measurement in its entirety.
Changes in valuation techniques may result in transfers into or out of an assigned level within the disclosure hierarchy. In accordance with the Fund’s policy, transfers between different levels of the fair value disclosure hierarchy are deemed to have occurred as of the beginning of the reporting period. The categorization of a value determined for investments is based on the pricing transparency of the investment and is not necessarily an indication of the risks associated with investing in those securities. For information about the Fund’s policy regarding valuation of investments, please refer to Note 2 of the Notes to Financial Statements.
The following table summarizes the Fund’s investments categorized in the disclosure hierarchy as of January 31, 2014:
| | | | | | | | | | | | | | | | |
| | | Level 1 | | | Level 2 | | | Level 3 | | | Total | |
Assets: | | | | | | | | | | | | | | | | |
Investments: | | | | | | | | | | | | | | | | |
Short-Term Securities1 | | $ | 4,633 | | | $ | 15,002,583 | | | | — | | | $ | 15,007,216 | |
| 1 | See above Schedule of Investments for values in each security type. |
The carrying amount for certain of the Fund’s assets and/or liabilities approximates fair value for financial statement purposes. As of January 31, 2014, cash of $1,438 is categorized as Level 1 within the disclosure hierarchy.
There were no transfers between levels during the six months ended January 31, 2014.
See Notes to Financial Statements.
| | | | | | |
| | | BLACKROCK FUNDS | | JANUARY 31, 2014 | | 15 |
| | | | |
| Schedule of Investments January 31, 2014 (Unaudited) | | | BlackRock Ultra-Short Obligations Fund | |
| | | (Percentages shown are based on Net Assets) | |
| | | | | | | | |
| Corporate Bonds | | Par
(000) | | | Value | |
Commercial Banks — 18.9% | | | | | | | | |
Bank of Montreal, 0.71%, 4/29/14 (a) | | $ | 500 | | | $ | 500,563 | |
BPCE SA, 1.99%, 2/07/14 (a)(b) | | | 799 | | | | 799,072 | |
JPMorgan Chase & Co., 0.99%, 5/02/14 (a) | | | 300 | | | | 300,515 | |
Lloyds TSB Bank PLC: | | | | | | | | |
1.84%, 2/17/14 (a) | | | 100 | | | | 100,146 | |
3.74%, 4/17/14 (a) | | | 220 | | | | 221,234 | |
Societe Generale SA, 1.29%, 4/11/14 (a) | | | 700 | | | | 701,177 | |
Sumitomo Mitsui Banking Corp., 1.19%, 7/22/14 (a)(b) | | | 500 | | | | 501,937 | |
Svenska Handelsbanken AB, 4.88%, 6/10/14 (b) | | | 1,000 | | | | 1,015,900 | |
Wells Fargo & Co., 3.75%, 10/01/14 | | | 575 | | | | 587,935 | |
| | | | | | | | |
| | | | | | | | 4,728,479 | |
Diversified Financial Services — 5.3% | | | | | | | | |
American Express Credit Corp.: | | | | | | | | |
1.10%, 6/24/14 (a) | | | 300 | | | | 300,871 | |
5.13%, 8/25/14 | | | 750 | | | | 769,823 | |
Volkswagen International Finance NV, 0.84%, 11/20/14 (a)(b) | | | 250 | | | | 250,893 | |
| | | | | | | | |
| | | | | | | | 1,321,587 | |
Metals & Mining — 2.0% | | | | | | | | |
Rio Tinto Finance USA Ltd., 8.95%, 5/01/14 | | | 500 | | | | 510,007 | |
Utility Gas & Electric — 2.0% | | | | | | | | |
Southern California Edison Co., 0.27%, 1/26/15 (a) | | | 500 | | | | 500,149 | |
Total Long-Term Investments (Cost — $7,058,916) — 28.2% | | | | | | | 7,060,222 | |
| | | | | | | | |
| Short-Term Securities | | | | | | |
Certificates of Deposit | | | | | | | | |
Yankee (c) — 18.0% | | | | | | | | |
Bank of Nova Scotia, Houston, 0.72%, 2/10/14 (a) | | | 1,000 | | | | 1,000,130 | |
Bank of Tokyo-Mitsubishi UFJ Ltd., New York, 0.84%, 3/07/14 (a) | | | 400 | | | | 400,246 | |
Barclays Bank PLC, New York, 0.44%, 5/30/14 (a) | | | 250 | | | | 249,968 | |
BNP Paribas S.A., New York: | | | | | | | | |
0.35%, 3/06/14 | | | 350 | | | | 350,059 | |
0.56%, 1/06/15 | | | 250 | | | | 250,093 | |
Canadian Imperial Bank of Commerce, New York: | | | | | | | | |
0.26%, 3/03/14 (a) | | | 750 | | | | 750,149 | |
0.31%, 7/01/14 (a) | | | 250 | | | | 250,098 | |
Credit Suisse, New York, 0.53%, 1/12/15 | | | 500 | | | | 499,928 | |
Lloyds TSB Bank PLC, New York, 0.58%, 8/22/14 | | | 750 | | | | 751,179 | |
Total Certificates of Deposit — 18.0% | | | | | | | 4,501,850 | |
| | | | | | | | |
| | | | | | | |
| | | | | | | | |
| Commercial Paper | | Par (000) | | | Value | |
AXA Financial, Inc.: | | | | | | | | |
0.21%, 2/11/14 (b)(d) | | $ | 300 | | | $ | 299,987 | |
0.43%, 3/31/14 (d) | | | 600 | | | | 599,765 | |
BNP Paribas Finance, Inc., 0.46%, 2/14/14 (d) | | | 325 | | | | 324,986 | |
BPCE SA, 0.40%, 8/01/14 (d) | | | 250 | | | | 249,505 | |
British Telecommunications PLC, 0.72%, 3/07/14 (d) | | | 500 | | | | 499,885 | |
Cafco LLC, 0.40%, 2/04/14 (d) | | | 475 | | | | 474,993 | |
Daimler Finance North America LLC, 0.34%, 2/03/14 (d) | | | 750 | | | | 749,987 | |
DirecTV Holdings LLC, 0.40%, 7/07/14 (d) | | | 750 | | | | 748,734 | |
Electricite de France, 0.58%, 1/05/15 (a)(b) | | | 750 | | | | 746,333 | |
Harley-Davidson Financial Services, 0.17%, 2/19/14 (d) | | | 500 | | | | 499,943 | |
Macquarie Bank Ltd.: | | | | | | | | |
0.37%, 7/03/14 (a) | | | 1,000 | | | | 999,964 | |
0.33%, 7/15/14 (d) | | | 250 | | | | 249,662 | |
Nissan Motor Acceptance Corp., 0.26%, 2/24/14 (d) | | | 730 | | | | 729,891 | |
Suncorp Metway Ltd.: | | | | | | | | |
0.43%, 4/16/14 (d) | | | 500 | | | | 499,807 | |
0.30%, 5/07/14 (d) | | | 350 | | | | 349,806 | |
Vodafone Group PLC, 0.45%, 6/25/14 (d) | | | 250 | | | | 249,624 | |
Total Commercial Paper — 33.1% | | | | | | | 8,272,872 | |
| | | | | | | | |
| Corporate Notes — 3.4% | | | | | | |
Sanofi-Aventis SA, 0.56%, 3/28/14 (a) | | | 860 | | | | 860,378 | |
| | | | | | | | |
| Money Market Funds — 0.9% | | Shares | | | | |
BlackRock Liquidity Funds, TempFund, Institutional Class, 0.03% (e)(f) | | | 213,417 | | | | 213,417 | |
| | | | | | | | |
| Repurchase Agreements | | Par
(000) | | | | |
Barclays Capital, Inc., 0.74%, 5/22/14
(Purchased on 11/22/13 to be repurchased at $752,790, collateralized by various corporate/debt obligations, 2.00% to 11.00% due from 4/01/16 to 12/15/37, aggregate original par and fair value of $840,598 and $861,180, respectively) | | | 750 | | | | 751,385 | |
Total Value of Barclays Capital, Inc.
(Collateral value of $861,180) | | | | | | | 751,385 | |
See Notes to Financial Statements.
| | | | | | |
| 16 | | BLACKROCK FUNDS | | JANUARY 31, 2014 | | |
| | | | |
| Schedule of Investments (continued) | | | BlackRock Ultra-Short Obligations Fund | |
| | | (Percentages shown are based on Net Assets) | |
| | | | | | | | |
| Repurchase Agreements | | Par
(000) | | | Value | |
Citigroup Global Markets, Inc., 0.30%, 2/03/14
(Purchased on 1/31/14 to be repurchased at $500,013, collateralized by various corporate/debt obligations, 0.00% to 6.02% due from 6/25/14 to 11/20/57, aggregate original par and fair value of $1,189,896 and $545,868, respectively) | | $ | 500 | | | $ | 500,000 | |
Total Value of Citigroup Global Markets, Inc.
(Collateral value of $545,868) | | | | | | | 500,000 | |
Deutsche Bank Securities, Inc., 0.35%, 2/07/14 (g)
(Purchased on 11/15/13 to be repurchased at $500,438, collateralized by various corporate/debt and municipal bond obligations, 0.00% to 12.00% due from 9/30/14 to 12/29/99, aggregate original par and fair value of $1,664,366 and $583,404, respectively) | | | 500 | | | | 500,039 | |
Total Value of Deutsche Bank Securities, Inc.
(Collateral value of $583,404) | | | | | | | 500,039 | |
JPMorgan Securities LLC, 0.54%, 2/19/14
(Purchased on 11/19/13 to be repurchased at $751,035, collateralized by various corporate/debt obligations, 0.00% to 8.31% due from 7/25/18 to 8/25/46, aggregate original par and fair value of $6,397,926 and $885,964, respectively) | | | 750 | | | | 750,157 | |
Total Value of JPMorgan Securities LLC
(Collateral value of $885,964) | | | | | | | 750,157 | |
Mizuho Securities USA, 1.00%, 2/13/14
(Purchased on 12/13/13 to be repurchased at $250,431, collateralized by various U.S. government sponsored agency and U.S. Treasury obligations, 0.00% to 4.00% due from 2/06/14 to 1/20/38, aggregate original par and fair value of $342,600 and $256,138, respectively) | | | 250 | | | | 250,065 | |
Mizuho Securities USA, 1.13%, 3/07/14 (h)
(Purchased on 3/04/13 to be repurchased at $252,888, collateralized by various corporate/debt, U.S. government sponsored agency and U.S. Treasury obligations, 0.00% to 6.44% due from 2/06/14 to 11/25/39, aggregate original par and fair value of $1,868,586 and $269,930, respectively) | | | 250 | | | | 250,000 | |
Total Value of Mizuho Securities USA
(Collateral value of $526,068) | | | | | | | 500,065 | |
| | | | | | | | |
| Repurchase Agreements | | Par
(000) | | | Value | |
Morgan Stanley & Co. LLC, 0.48%, 3/21/14
(Purchased on 12/23/13 to be repurchased at $500,587, collateralized by various U.S. government sponsored agency obligations, 0.00% to 6.54% due from 11/25/41 to 12/25/43, aggregate original par and fair value of $1,972,640 and $545,840, respectively) | | $ | 500 | | | $ | 500,000 | |
Total Value of Morgan Stanley & Co. LLC
(Collateral value of $545,840) | | | | | | | 500,000 | |
RBS Securities, Inc., 1.00%, 3/04/14
(Purchased on 1/03/14 to be repurchased at $500,833, collateralized by various corporate/debt and U.S. government sponsored agency obligations, 0.00% to 3.50% due from 1/01/34 to 3/25/37, aggregate original par and fair value of $1,163,311 and $522,831, respectively) | | | 500 | | | | 500,371 | |
Total Value of RBS Securities, Inc.
(Collateral value of $522,831) | | | | | | | 500,371 | |
Total Repurchase Agreements — 16.0% | | | | | | | 4,002,017 | |
Total Short-Term Securities (Cost — $17,846,857) — 71.4% | | | | 17,850,534 | |
Total Investments (Cost — $24,905,773) — 99.6% | | | | 24,910,756 | |
Other Assets Less Liabilities — 0.4% | | | | | | | 95,855 | |
| | | | | | | | |
Net Assets — 100.0% | | | | | | $ | 25,006,611 | |
| | | | | | | | |
See Notes to Financial Statements.
| | | | | | |
| | | BLACKROCK FUNDS | | JANUARY 31, 2014 | | 17 |
| | | | |
| Schedule of Investments (concluded) | | | BlackRock Ultra-Short Obligations Fund | |
|
| Notes to Schedule of Investments |
| (a) | Variable rate security. Rate shown is as of report date. |
| (b) | Security exempt from registration pursuant to Rule 144A under the Securities Act of 1933, as amended. These securities may be resold in transactions exempt from registration to qualified institutional investors. |
| (c) | Issuer is a US branch of a foreign domiciled bank. |
| (d) | Rate shown reflects the discount rate at the time of purchase. |
| (e) | Investments in issuers considered to be an affiliate of the Fund during the period ended January 31, 2014, for purposes of Section 2(a)(3) of the Investment Company Act of 1940, as amended, were as follows: |
| | | | | | | | | | | | | | | | |
| Affiliate | | Shares Held at
July 31, 2013 | | | Net
Activity
(Shares) | | | Shares Held at
January 31, 2014 | | | Income | |
BlackRock Liquidity Funds, TempFund, Institutional Class | | | 18,935 | | | | 194,482 | | | | 213,417 | | | $ | 85 | |
| (f) | Represents the current yield as of report date. |
| (g) | Rate shown is as of report date and maturity shown is the final maturity date or the date the principal owed can be recovered through demand. |
| (h) | Variable rate security. Rate shown is as of report date and maturity shown is the date the principal owed can be recovered through demand. |
| Ÿ | | For Fund compliance purposes, the Fund’s industry classifications refer to any one or more of the industry sub-classifications used by one or more widely recognized market indexes or ratings group indexes and/or as defined by Fund management. These definitions may not apply for purposes of this report, which may combine industry sub-classifications for reporting ease. |
| Ÿ | | Fair Value Measurements — Various inputs are used in determining the fair value of investments. These inputs to valuation techniques are categorized into a disclosure hierarchy consisting of three broad levels for financial statement purposes as follows: |
| | Ÿ | | Level 1 — unadjusted price quotations in active markets/exchanges for identical assets or liabilities that the Fund has the ability to access |
| | Ÿ | | Level 2 — other observable inputs (including, but not limited to, quoted prices for similar assets or liabilities in markets that are active, quoted prices for identical or similar assets or liabilities in markets that are not active, inputs other than quoted prices that are observable for the assets or liabilities (such as interest rates, yield curves, volatilities, prepayment speeds, loss severities, credit risks and default rates) or other market–corroborated inputs) |
| | Ÿ | | Level 3 — unobservable inputs based on the best information available in the circumstances, to the extent observable inputs are not available (including the Fund’s own assumptions used in determining the fair value of investments) |
The hierarchy gives the highest priority to unadjusted quoted prices in active markets for identical assets or liabilities (Level 1 measurements) and the lowest priority to unobservable inputs (Level 3 measurements). Accordingly, the degree of judgment exercised in determining fair value is greatest for instruments categorized in Level 3. The inputs used to measure fair value may fall into different levels of the fair value hierarchy. In such cases, for disclosure purposes, the fair value hierarchy classification is determined based on the lowest level input that is significant to the fair value measurement in its entirety.
Changes in valuation techniques may result in transfers into or out of an assigned level within the disclosure hierarchy. In accordance with the Fund’s policy, transfers between different levels of the fair value disclosure hierarchy are deemed to have occurred as of the beginning of the reporting period. The categorization of a value determined for investments is based on the pricing transparency of the investment and is not necessarily an indication of the risks associated with investing in those securities. For information about the Fund’s policy regarding valuation of investments, please refer to Note 2 of the Notes to Financial Statements.
The following table summarizes the Fund’s investments categorized in the disclosure hierarchy as of January 31, 2014:
| | | | | | | | | | | | | | | | |
| | | Level 1 | | | Level 2 | | | Level 3 | | | Total | |
Assets: | | | | | | | | | | | | | | | | |
Investments:1 | | | | | | | | | | | | | | | | |
Long-Term Investments | | | — | | | $ | 6,960,076 | | | | 100,146 | | | $ | 7,060,222 | |
Short-Term Securities | | $ | 213,417 | | | | 17,637,117 | | | | — | | | | 17,850,534 | |
Total | | $ | 213,417 | | | $ | 24,597,193 | | | | 100,146 | | | $ | 24,910,756 | |
| | | | |
| 1 | See above Schedule of Investments for values in each security type. |
There were no transfers between levels during the six months ended January 31, 2014.
See Notes to Financial Statements.
| | | | | | |
| 18 | | BLACKROCK FUNDS | | JANUARY 31, 2014 | | |
| | |
| Statements of Assets and Liabilities | | |
| | | | | | | | | | | | |
| January 31, 2014 (Unaudited) | | BlackRock
Short
Obligations
Fund | | | BlackRock
Short-Term
Treasury
Fund | | | BlackRock
Ultra-Short
Obligations
Fund | |
| | | | | | | | | | | | |
| Assets | | | | | | | | | | | | |
Investments at value — unaffiliated1 | | $ | 21,571,727 | | | $ | 9,031,583 | | | $ | 20,695,322 | |
Investments at value — affiliated2 | | | 306,176 | | | | 4,633 | | | | 213,417 | |
Repurchase agreements at value3 | | | 2,252,191 | | | | 5,971,000 | | | | 4,002,017 | |
Cash | | | 1,007,167 | | | | 1,438 | | | | — | |
Interest receivable | | | 56,884 | | | | 5,223 | | | | 58,604 | |
Deferred offering costs | | | 36,923 | | | | 19,686 | | | | 34,804 | |
Receivable from Manager | | | 8,282 | | | | 9,243 | | | | 8,554 | |
Prepaid expenses | | | 9,193 | | | | — | | | | 10,057 | |
| | | | |
Total assets | | | 25,248,543 | | | | 15,042,806 | | | | 25,022,775 | |
| | | | |
| | | | | | | | | | | | |
| Liabilities | | | | | | | | | | | | |
Investments purchased payable | | | 199,997 | | | | — | | | | — | |
Income dividends payable | | | 10,162 | | | | 124 | | | | 7,467 | |
Printing fees payable | | | 5,297 | | | | 5,395 | | | | 5,221 | |
Officer’s and Trustees’ fees payable | | | 1,202 | | | | 1,226 | | | | 1,202 | |
Other affiliates payable | | | 789 | | | | 340 | | | | 786 | |
Professional fees payable | | | — | | | | 20,625 | | | | — | |
Other accrued expenses payable | | | 2,819 | | | | 13,489 | | | | 1,488 | |
| | | | |
Total liabilities | | | 220,266 | | | | 41,199 | | | | 16,164 | |
| | | | |
Net Assets | | $ | 25,028,277 | | | $ | 15,001,607 | | | $ | 25,006,611 | |
| | | | |
| | | | | | | | | | | | |
| Net Assets Consist of | | | | | | | | | | | | |
Paid-in capital | | $ | 24,988,938 | | | $ | 14,993,791 | | | $ | 24,989,902 | |
Undistributed net investment income | | | 11,109 | | | | 6,196 | | | | 10,098 | |
Accumulated net realized gain | | | 2,335 | | | | 476 | | | | 1,515 | |
Net unrealized appreciation/depreciation | | | 25,895 | | | | 1,144 | | | | 5,096 | |
| | | | |
Net Assets | | $ | 25,028,277 | | | $ | 15,001,607 | | | $ | 25,006,611 | |
| | | | |
1 Investments at cost — unaffiliated | | $ | 21,545,803 | | | $ | 9,030,462 | | | $ | 20,690,339 | |
2 Investments at cost — affiliated | | $ | 306,176 | | | $ | 4,633 | | | $ | 213,417 | |
3 Repurchase agreements at cost | | $ | 2,252,191 | | | $ | 5,971,000 | | | $ | 4,002,017 | |
See Notes to Financial Statements.
| | | | | | |
| | | BLACKROCK FUNDS | | JANUARY 31, 2014 | | 19 |
| | |
| Statements of Assets and Liabilities (concluded) | | |
| | | | | | | | | | | | |
| January 31, 2014 (Unaudited) | | BlackRock
Short
Obligations
Fund | | | BlackRock
Short-Term
Treasury
Fund | | | BlackRock
Ultra-Short
Obligations
Fund | |
| | | | | | | | | | | | |
| Net Asset Value | | | | | | | | | | | | |
BlackRock | | | | | | | | | | | | |
Net assets | | $ | 15,021,466 | | | | — | | | $ | 15,004,602 | |
| | | | |
Shares outstanding4 | | | 1,500,450 | | | | — | | | | 1,500,060 | |
| | | | |
Net asset value | | $ | 10.01 | | | | — | | | $ | 10.00 | |
| | | | |
Institutional | | | | | | | | | | | | |
Net assets | | $ | 10,006,811 | | | | — | | | $ | 10,002,009 | |
| | | | |
Shares outstanding4 | | | 1,000,000 | | | | — | | | | 1,000,000 | |
| | | | |
Net asset value | | $ | 10.01 | | | | — | | | $ | 10.00 | |
| | | | |
Institutional Daily | | | | | | | | | | | | |
Net assets | | | — | | | $ | 15,001,607 | | | | — | |
| | | | |
Shares outstanding4 | | | — | | | | 1,500,000 | | | | — | |
| | | | |
Net asset value | | | — | | | $ | 10.00 | | | | — | |
| | | | |
| | 4 | Unlimited number of shares authorized, $0.001 par value. |
See Notes to Financial Statements.
| | | | | | |
| 20 | | BLACKROCK FUNDS | | JANUARY 31, 2014 | | |
| | | | | | | | | | | | |
| Six Months Ended January 31, 2014 (Unaudited) | | BlackRock
Short
Obligations
Fund | | | BlackRock
Short-Term
Treasury
Fund | | | BlackRock
Ultra-Short
Obligations
Fund | |
| | | | | | | | | | | | |
| Investment Income | | | | | | | | | | | | |
Interest — unaffiliated | | $ | 75,842 | | | $ | 6,755 | | | $ | 60,416 | |
Interest — affiliated | | | 25 | | | | 9 | | | | 85 | |
| | | | |
Total Income | | | 75,867 | | | | 6,764 | | | | 60,501 | |
| | | | |
| | | | | | | | | | | | |
| Expenses | | | | | | | | | | | | |
Investment advisory | | | 31,539 | | | | 18,905 | | | | 31,515 | |
Organization and offering | | | 41,972 | | | | 26,580 | | | | 40,444 | |
Professional | | | 17,988 | | | | 20,041 | | | | 18,912 | |
Administration | | | 9,462 | | | | 5,672 | | | | 9,454 | |
Administration — BlackRock | | | 1,893 | | | | — | | | | 1,892 | |
Administration — Institutional | | | 1,261 | | | | — | | | | 1,260 | |
Administration — Institutional Daily | | | — | | | | 1,890 | | | | — | |
Printing | | | 5,878 | | | | 4,734 | | | | 5,801 | |
Registration | | | 3,435 | | | | 6,430 | | | | 3,435 | |
Custodian | | | 2,689 | | | | 12,810 | | | | 3,100 | |
Officer and Trustees | | | 1,927 | | | | 1,820 | | | | 1,927 | |
Transfer agent — BlackRock | | | 63 | | | | — | | | | 78 | |
Transfer agent — Institutional | | | 22 | | | | — | | | | 22 | |
Transfer agent — Institutional Daily | | | — | | | | 113 | | | | — | |
Miscellaneous | | | 4,165 | | | | 4,316 | | | | 4,416 | |
| | | | |
Total expenses | | | 122,294 | | | | 103,311 | | | | 122,256 | |
Less fees waived by Manager | | | (31,539 | ) | | | (18,905 | ) | | | (31,515 | ) |
Less administration fees waived | | | (9,462 | ) | | | (5,672 | ) | | | (9,454 | ) |
Less administration fees waived — BlackRock | | | (1,893 | ) | | | — | | | | (1,892 | ) |
Less administration fees waived — Institutional Daily | | | — | | | | (1,890 | ) | | | — | |
Less transfer agent fees waived — BlackRock | | | (42 | ) | | | — | | | | (42 | ) |
Less transfer agent fees waived — Institutional Daily | | | — | | | | (27 | ) | | | — | |
Less transfer agent fees reimbursed — BlackRock | | | (16 | ) | | | — | | | | (36 | ) |
Less transfer agent fees reimbursed — Institutional Daily | | | — | | | | (86 | ) | | | — | |
Less expenses reimbursed by Manager | | | (65,098 | ) | | | (70,742 | ) | | | (65,088 | ) |
| | | | |
Total expenses after fees waived and reimbursed | | | 14,244 | | | | 5,989 | | | | 14,229 | |
| | | | |
Net investment income | | | 61,623 | | | | 775 | | | | 46,272 | |
| | | | |
| | | | | | | | | | | | |
| Realized and Unrealized Gain | | | | | | | | | | | | |
Net realized gain from investments | | | 696 | | | | 460 | | | | 67 | |
Net change in unrealized appreciation/depreciation | | | 6,512 | | | | (592 | ) | | | 2,058 | |
| | | | |
Net realized and unrealized gain (loss) | | | 7,208 | | | | (132 | ) | | | 2,125 | |
| | | | |
Net Increase in Net Assets Resulting from Operations | | $ | 68,831 | | | $ | 643 | | | $ | 48,397 | |
| | | | |
See Notes to Financial Statements.
| | | | | | |
| | | BLACKROCK FUNDS | | JANUARY 31, 2014 | | 21 |
| | |
| Statements of Changes in Net Assets | | |
| | | | | | | | | | | | | | | | |
| | | BlackRock
Short
Obligations
Fund | | | BlackRock
Short-Term
Treasury
Fund | |
| Increase (Decrease) in Net Assets: | | Six Months
Ended
January 31, 2014
(Unaudited) | | | Period
November 15, 20121 to July 31, 2013 | | | Six Months
Ended
January 31,
2014
(Unaudited) | | | Period
November 15, 20121 to July 31, 2013 | |
| | | | | | | | | | | | | | | | |
| Operations | | | | | | | | | | | | | | | | |
Net investment income | | $ | 61,623 | | | $ | 81,558 | | | $ | 775 | | | $ | 1,047 | |
Net realized gain | | | 696 | | | | 1,639 | | | | 460 | | | | 16 | |
Net change in unrealized appreciation/depreciation | | | 6,512 | | | | 19,383 | | | | (592 | ) | | | 1,736 | |
| | | | | | | | |
Net increase in net assets resulting from operations | | | 68,831 | | | | 102,580 | | | | 643 | | | | 2,799 | |
| | | | | | | | |
| | | | | | | | | | | | | | | | |
| Dividends to Shareholders From | | | | | | | | | | | | | | | | |
Net investment income: | | | | | | | | | | | | | | | | |
BlackRock | | | (37,739 | ) | | | (78,450 | )2 | | | — | | | | — | |
Institutional | | | (23,884 | ) | | | (3,061 | )2 | | | — | | | | — | |
Institutional Daily | | | — | | | | — | | | | (775 | ) | | | (1,060 | )2 |
| | | | | | | | |
Decrease in net assets resulting from dividends to shareholders | | | (61,623 | ) | | | (81,511 | ) | | | (775 | ) | | | (1,060 | ) |
| | | | | | | | |
| | | | | | | | | | | | | | | | |
| Capital Share Transactions | | | | | | | | | | | | | | | | |
Net increase in net assets derived from capital share transactions | | | — | | | | 25,000,000 | | | | — | | | | 15,000,000 | |
| | | | | | | | |
| | | | | | | | | | | | | | | | |
| Net Assets | | | | | | | | | | | | | | | | |
Total increase (decrease) in net assets | | | 7,208 | | | | 25,021,069 | | | | (132 | ) | | | 15,001,739 | |
Beginning of period | | | 25,021,069 | | | | — | | | | 15,001,739 | | | | — | |
| | | | | | | | |
End of period | | $ | 25,028,277 | | | $ | 25,021,069 | | | $ | 15,001,607 | | | $ | 15,001,739 | |
| | | | | | | | |
Undistributed net investment income at end of period | | $ | 11,109 | | | $ | 11,109 | | | $ | 6,196 | | | $ | 6,196 | |
| | | | | | | | |
| | 1 | Commencement of operations. |
| | 2 | Dividends are determined in accordance with federal income tax regulations. |
See Notes to Financial Statements.
| | | | | | |
| 22 | | BLACKROCK FUNDS | | JANUARY 31, 2014 | | |
| | |
| Statements of Changes in Net Assets (concluded) | | |
| | | | | | | | |
| | | BlackRock
Ultra-Short
Obligations
Fund | |
| Increase in Net Assets: | | Six Months
Ended
January 31,
2014
(Unaudited) | | | Period
November 15, 20121
to July 31, 2013 | |
| | | | | | | | |
| Operations | | | | | | | | |
Net investment income | | $ | 46,272 | | | $ | 63,226 | |
Net realized gain | | | 67 | | | | 1,448 | |
Net change in unrealized appreciation/depreciation | | | 2,058 | | | | 3,038 | |
| | | | |
Net increase in net assets resulting from operations | | | 48,397 | | | | 67,712 | |
| | | | |
| | | | | | | | |
| Dividends to Shareholders From | | | | | | | | |
Net investment income: | | | | | | | | |
BlackRock | | | (28,579 | ) | | | (60,959 | )2 |
Institutional | | | (17,693 | ) | | | (2,267 | )2 |
Institutional Daily | | | — | | | | — | |
| | | | |
Decrease in net assets resulting from dividends to shareholders | | | (46,272 | ) | | | (63,226 | ) |
| | | | |
| | | | | | | | |
| Capital Share Transactions | | | | | | | | |
Net increase in net assets derived from capital share transactions | | | — | | | | 25,000,000 | |
| | | | |
| | | | | | | | |
| Net Assets | | | | | | | | |
Total increase in net assets | | | 2,125 | | | | 25,004,486 | |
Beginning of period | | | 25,004,486 | | | | — | |
| | | | |
End of period | | $ | 25,006,611 | | | $ | 25,004,486 | |
| | | | |
Undistributed net investment income at end of period | | $ | 10,098 | | | $ | 10,098 | |
| | | | |
| | 1 | Commencement of operations. |
| | 2 | Dividends are determined in accordance with federal income tax regulations. |
See Notes to Financial Statements.
| | | | | | |
| | | BLACKROCK FUNDS | | JANUARY 31, 2014 | | 23 |
| | | | |
| Financial Highlights | | | BlackRock Short Obligations Fund | |
| | | | | | | | | | | | | | | | |
| | | BlackRock | | | Institutional | |
| | | Six Months
Ended
January 31,
2014
(Unaudited) | | | Period
November 15,
20121 to July 31, 2013 | | | Six Months
Ended
January 31,
2014
(Unaudited) | | | Period
July 9,
20131 to
July 31,
2013 | |
| | | | | | | | | | | | | | | | |
| Per Share Operating Performance | | | | | | | | | | | | | | | | |
Net asset value, beginning of period | | $ | 10.01 | | | $ | 10.00 | | | $ | 10.00 | | | $ | 10.00 | |
| | | | | | | | |
Net investment income2 | | | 0.03 | | | | 0.03 | | | | 0.02 | | | | 0.00 | 3 |
Net realized and unrealized gain | | | 0.00 | 3 | | | 0.01 | | | | 0.00 | 3 | | | 0.00 | 3 |
| | | | | | | | |
Net increase from investment operations | | | 0.03 | | | | 0.04 | | | | 0.02 | | | | 0.00 | 3 |
| | | | | | | | |
Dividends from net investment income | | | (0.03 | ) | | | (0.03 | )4 | | | (0.01 | ) | | | (0.00 | )4,5 |
| | | | | | | | |
Net asset value, end of period | | $ | 10.01 | | | $ | 10.01 | | | $ | 10.01 | | | $ | 10.00 | |
| | | | | | | | |
| | | | | | | | | | | | | | | | |
| Total Investment Return6,7 | | | | | | | | | | | | | | | | |
Based on net asset value | | | 0.25 | % | | | 0.43 | % | | | 0.34 | % | | | 0.03 | % |
| | | | | | | | |
| | | | | | | | | | | | | | | | |
| Ratios to Average Net Assets8 | | | | | | | | | | | | | | | | |
Total expenses | | | 0.80 | %9 | | | 1.00 | %10 | | | 0.80 | %11 | | | 1.53 | %12 |
| | | | | | | | |
Total expenses after fees waived and reimbursed | | | 0.10 | % | | | 0.13 | % | | | 0.13 | % | | | 0.13 | % |
| | | | | | | | |
Net investment income | | | 0.50 | % | | | 0.46 | % | | | 0.47 | % | | | 0.51 | % |
| | | | | | | | |
| | | | | | | | | | | | | | | | |
| Supplemental Data | | | | | | | | | | | | | | | | |
Net assets, end of period (000) | | $ | 15,021 | | | $ | 15,017 | | | $ | 10,007 | | | $ | 10,004 | |
| | | | | | | | |
Portfolio turnover | | | 26 | % | | | 35 | % | | | 26 | % | | | 35 | % |
| | | | | | | | |
| | 1 | Commencement of operations. |
| | 2 | Based on average shares outstanding. |
| | 3 | Amount is less than $0.005 per share. |
| | 4 | Dividends are determined in accordance with federal income tax regulations. |
| | 5 | Amount is greater than $(0.005) per share. |
| | 6 | Where applicable, assumes the reinvestment of dividends and distributions. |
| | 7 | Aggregate total investment return. |
| | 9 | Organization costs were not annualized in the calculation of the expense ratio. If these expenses were annualized, the total expenses for BlackRock Shares would have been 0.97%. |
| | 10 | Organization costs were not annualized in the calculation of the expense ratio. If these expenses were annualized, the total expenses for BlackRock Shares would have been 1.00%. |
| | 11 | Organization costs were not annualized in the calculation of the expense ratio. If these expenses were annualized, the total expenses for Institutional Shares would have been 0.97%. |
| | 12 | Organization costs were not annualized in the calculation of the expense ratio. If these expenses were annualized, the total expenses for Institutional Shares would have been 1.53%. |
See Notes to Financial Statements.
| | | | | | |
| 24 | | BLACKROCK FUNDS | | JANUARY 31, 2014 | | |
| | | | |
| Financial Highlights | | | BlackRock Short-Term Treasury Fund | |
| | | | | | | | |
| | | Institutional Daily | |
| | | Six Months
Ended
January 31,
2014
(Unaudited) | | | Period
November 15,
20121 to July 31, 2013 | |
| | | | | | | | |
| Per Share Operating Performance | | | | | | | | |
Net asset value, beginning of period | | $ | 10.00 | | | $ | 10.00 | |
| | | | |
Net investment income2 | | | 0.00 | 3 | | | 0.00 | 3 |
Net realized and unrealized gain | | | 0.00 | 3 | | | 0.00 | 3 |
| | | | |
Net increase from investment operations | | | 0.00 | 3 | | | 0.00 | 3 |
| | | | |
Dividends from net investment income | | | (0.00 | )4 | | | (0.00 | )4,5 |
| | | | |
Net asset value, end of period | | $ | 10.00 | | | $ | 10.00 | |
| | | | |
| | | | | | | | |
| Total Investment Return6,7 | | | | | | | | |
Based on net asset value | | | 0.01 | % | | | 0.01 | % |
| | | | |
| | | | | | | | |
| Ratios to Average Net Assets8 | | | | | | | | |
Total expenses | | | 1.19 | %9 | | | 1.64 | %10 |
| | | | |
Total expenses after fees waived and reimbursed | | | 0.08 | % | | | 0.11 | % |
| | | | |
Net investment income | | | 0.01 | % | | | 0.01 | % |
| | | | |
| | | | | | | | |
| Supplemental Data | | | | | | | | |
Net assets, end of period (000) | | $ | 15,002 | | | $ | 15,002 | |
| | | | |
| | 1 | Commencement of operations. |
| | 2 | Based on average shares outstanding. |
| | 3 | Amount is less than $0.005 per share. |
| | 4 | Amount is greater than $(0.005) per share. |
| | 5 | Dividends are determined in accordance with federal income tax regulations. |
| | 6 | Where applicable, assumes the reinvestment of dividends and distributions. |
| | 7 | Aggregate total investment return. |
| | 9 | Organization costs were not annualized in the calculation of the expense ratio. If these expenses were annualized, the total expenses for Institutional Daily Shares would have been 1.37%. |
| | 10 | Organization costs were not annualized in the calculation of the expense ratio. If these expenses were annualized, the total expenses for Institutional Daily Shares would have been 1.65%. |
See Notes to Financial Statements.
| | | | | | |
| | | BLACKROCK FUNDS | | JANUARY 31, 2014 | | 25 |
| | | | |
| Financial Highlights | | | BlackRock Ultra-Short Obligations Fund | |
| | | | | | | | | | | | | | | | |
| | | BlackRock | | | Institutional | |
| | | Six Months
Ended
January 31,
2014
(Unaudited) | | | Period November 15, 20121 to July 31, 2013 | | | Six Months Ended January 31, 2014 (Unaudited) | | | Period July 9, 20131 to July 31, 2013 | |
| | | | | | | | | | | | | | | | |
| Per Share Operating Performance | | | | | | | | | | | | | | | | |
Net asset value, beginning of period | | $ | 10.00 | | | $ | 10.00 | | | $ | 10.00 | | | $ | 10.00 | |
| | | | | | | | |
Net investment income2 | | | 0.02 | | | | 0.03 | | | | 0.02 | | | | 0.00 | 3 |
Net realized and unrealized gain | | | 0.00 | 3 | | | 0.00 | 3 | | | 0.00 | 3 | | | 0.00 | 3 |
| | | | | | | | |
Net increase from investment operations | | | 0.02 | | | | 0.03 | | | | 0.02 | | | | 0.00 | 3 |
| | | | | | | | |
Dividends from net investment income | | | (0.02 | ) | | | (0.03 | )4 | | | (0.02 | ) | | | (0.00 | )4,5 |
| | | | | | | | |
Net asset value, end of period | | $ | 10.00 | | | $ | 10.00 | | | $ | 10.00 | | | $ | 10.00 | |
| | | | | | | | |
| | | | | | | | | | | | | | | | |
| Total Investment Return6,7 | | | | | | | | | | | | | | | | |
Based on net asset value | | | 0.19 | % | | | 0.25 | % | | | 0.18 | % | | | 0.02 | % |
| | | | | | | | |
| | | | | | | | | | | | | | | | |
| Ratios to Average Net Assets8 | | | | | | | | | | | | | | | | |
Total expenses | | | 0.81 | %9 | | | 0.99 | %10 | | | 0.81 | %11 | | | 1.32 | %12 |
| | | | | | | | |
Total expenses after fees waived and reimbursed | | | 0.10 | % | | | 0.12 | % | | | 0.13 | % | | | 0.13 | % |
| | | | | | | | |
Net investment income | | | 0.38 | % | | | 0.36 | % | | | 0.35 | % | | | 0.38 | % |
| | | | | | | | |
| | | | | | | | | | | | | | | | |
| Supplemental Data | | | | | | | | | | | | | | | | |
Net assets, end of period (000) | | $ | 15,005 | | | $ | 15,003 | | | $ | 10,002 | | | $ | 10,001 | |
| | | | | | | | |
Portfolio turnover | | | 29 | % | | | 91 | % | | | 29 | % | | | 91 | % |
| | | | | | | | |
| | 1 | Commencement of operations. |
| | 2 | Based on average shares outstanding. |
| | 3 | Amount is less than $0.005 per share. |
| | 4 | Dividends are determined in accordance with federal income tax regulations. |
| | 5 | Amount is greater than $(0.005) per share. |
| | 6 | Where applicable, assumes the reinvestment of dividends and distributions. |
| | 7 | Aggregate total investment return. |
| | 9 | Organization costs were not annualized in the calculation of the expense ratio. If these expenses were annualized, the total expenses for BlackRock Shares would have been 0.97%. |
| | 10 | Organization costs were not annualized in the calculation of the expense ratio. If these expenses were annualized, the total expenses for BlackRock Shares would have been 0.99%. |
| | 11 | Organization costs were not annualized in the calculation of the expense ratio. If these expenses were annualized, the total expenses for Institutional Shares would have been 0.97%. |
| | 12 | Organization costs were not annualized in the calculation of the expense ratio. If these expenses were annualized, the total expenses for Institutional Shares would have been 1.32%. |
See Notes to Financial Statements.
| | | | | | |
| 26 | | BLACKROCK FUNDS | | JANUARY 31, 2014 | | |
| | |
| Notes to Financial Statements (Unaudited) | | |
1. Organization:
BlackRock FundsSM (the “Trust”), is registered under the Investment Company Act of 1940, as amended (the “1940 Act”), as an open-end management investment company. The Trust is organized as a Massachusetts business trust. BlackRock Short Obligations Fund (“Short Obligations”), BlackRock Short-Term Treasury Fund (“Short-Term Treasury”) and BlackRock Ultra-Short Obligations Fund (“Ultra-Short Obligations”) (collectively, the “Funds” or individually, a “Fund”) are each a series of the Trust. Each of the Funds is classified as diversified. Each Fund commenced operations on November 15, 2012. Short Obligations, Short-Term Treasury and Ultra-Short Obligations offer separate classes of shares. On July 9, 2013, Short Obligations and Ultra-Short Obligations issued Institutional Shares. The BlackRock and Institutional Shares of Short Obligations and Ultra-Short Obligations and the Institutional and Institutional Daily Shares of Short-Term Treasury have equal voting, dividend, liquidation and other rights, except that only shares of the respective classes are entitled to vote on matters concerning only that class.
2. Significant Accounting Policies:
The Funds’ financial statements are prepared in conformity with accounting principles generally accepted in the United States of America (“US GAAP”), which may require management to make estimates and assumptions that affect the reported amounts of assets and liabilities in the financial statements and the reported amounts of increases and decreases in net assets from operations during the reporting period. Actual results could differ from those estimates. The following is a summary of the significant accounting policies followed by the Funds:
Valuation: US GAAP defines fair value as the price the Funds would receive to sell an asset or pay to transfer a liability in an orderly transaction between market participants at the measurement date. The Funds determine the fair value of their financial instruments at market value using independent dealers or pricing services under policies approved by the Board of Trustees of the Trust (the “Board”). The BlackRock Global Valuation Methodologies Committee (the “Global Valuation Committee”) is the committee formed by management to develop global pricing policies and procedures and to provide oversight of the pricing function for the Funds for all financial instruments.
The Funds value their bond investments on the basis of last available bid prices or current market quotations provided by dealers or pricing services. In determining the value of a particular investment, pricing services may use certain information with respect to transactions in such investments, quotations from dealers, pricing matrixes, market transactions in comparable investments, various relationships observed in the market between investments and calculated yield measures. Asset-backed and mortgage-backed securities are valued by independent pricing services using models that consider estimated cash flows of each tranche of the security, establish a benchmark yield and develop an estimated tranche-specific spread to the benchmark yield based on the unique attributes of the tranche. Investments in open-end registered investment companies are valued at net asset value (“NAV”) each business
day. Short-term securities with remaining maturities of 60 days or less may be valued at amortized cost, which approximates fair value.
In the event that application of these methods of valuation results in a price for an investment that is deemed not to be representative of the market value of such investment, or if a price is not available, the investment will be valued by the Global Valuation Committee, or its delegate, in accordance with a policy approved by the Board as reflecting fair value (“Fair Value Assets”). When determining the price for Fair Value Assets, the Global Valuation Committee, or its delegate, seeks to determine the price that each Fund might reasonably expect to receive from the current sale of that asset in an arm’s-length transaction. Fair value determinations shall be based upon all available factors that the Global Valuation Committee, or its delegate, deems relevant consistent with the principles of fair value measurement, which include the market approach, income approach and/or in the case of recent investments, the cost approach, as appropriate. The market approach generally consists of using comparable market transactions. The income approach generally is used to discount future cash flows to present value and is adjusted for liquidity as appropriate. These factors include but are not limited to (i) attributes specific to the investment or asset; (ii) the principal market for the investment or asset; (iii) the customary participants in the principal market for the investment or asset; (iv) data assumptions by market participants for the investment or asset, if reasonably available; (v) quoted prices for similar investments or assets in active markets; and (vi) other factors, such as future cash flows, interest rates, yield curves, volatilities, prepayment speeds, loss severities, credit risks, recovery rates, liquidation amounts and/or default rates. Due to the inherent uncertainty of valuations of such investments, the fair values may differ from the values that would have been used had an active market existed. The Global Valuation Committee, or its delegate, employs various methods for calibrating valuation approaches for investments where an active market does not exist, including regular due diligence of the Funds’ pricing vendors, regular reviews of key inputs and assumptions, transactional back-testing or disposition analysis to compare unrealized gains and losses to realized gains and losses, reviews of missing or stale prices and large movements in market values and reviews of any market related activity. The pricing of all Fair Value Assets is subsequently reported to the Board or a committee thereof on a quarterly basis.
Investment Transactions and Investment Income: For financial reporting purposes, investment transactions are recorded on the dates the transactions are entered into (the trade dates). Realized gains and losses on investment transactions are determined on the identified cost basis. Interest income, including amortization and accretion of premiums and discounts on debt securities, is recognized on the accrual basis. Income, expenses and realized and unrealized gains and losses are allocated daily to each class based on its relative net assets.
Dividends and Distributions: Dividends from net investment income are declared daily and paid monthly. Distributions of capital gains are recorded on the ex-dividend dates. The character and timing of dividends
| | | | | | |
| | | BLACKROCK FUNDS | | JANUARY 31, 2014 | | 27 |
| | |
| Notes to Financial Statements (continued) | | |
and distributions are determined in accordance with federal income tax regulations, which may differ from US GAAP.
Income Taxes: It is Funds’ policy to comply with the requirements of the Internal Revenue Code of 1986, as amended, applicable to regulated investment companies, and to distribute substantially all of their taxable income to its shareholders. Therefore, no federal income tax provision is required.
Each Fund files US federal and various state and local tax returns. No income tax returns are currently under examination. The statute of limitations on each Fund’s US federal tax returns remains open for the period ended July 31, 2013. The statutes of limitations on the Fund’s state and local tax returns may remain open for an additional year depending upon the jurisdiction.
Management has analyzed tax laws and regulations and their application to the Funds’ facts and circumstances and does not believe there are any uncertain tax positions that require recognition of a tax liability.
Organization and Offering Costs: Upon commencement of operations, organization costs associated with the establishment of the Funds were expensed by the Funds and reimbursed by the Manager. The Manager reimbursed Short Obligations, Short-Term Treasury and Ultra-Short Obligations $1,248, $3,443 and $2,174, respectively, which are included in expenses reimbursed by Manager in the Statements of Operations. Offering costs are amortized over a 12-month period beginning with the commencement of operations.
Other: Expenses directly related to a Fund or its classes are charged to that Fund or class. Other operating expenses shared by several funds are pro rated among those funds on the basis of relative net assets or other appropriate methods. Expenses directly related to the Funds and other shared expenses pro rated to the Funds are allocated daily to each class based on its relative net assets or other appropriate methods.
The Funds have an arrangement with the custodian whereby fees may be reduced by credits earned on uninvested cash balances, which, if applicable, are shown as fees paid indirectly in the Statements of Operations. The custodian imposes fees on overdrawn cash balances, which can be offset by accumulated credits earned or may result in additional custody charges.
3. Securities and Other Investments:
Asset-Backed and Mortgage-Backed Securities: The Funds may invest in asset-backed securities. Asset-backed securities are generally issued as pass-through certificates, which represent undivided fractional ownership interests in an underlying pool of assets, or as debt instruments, which are also known as collateralized obligations, and are generally issued as the debt of a special purpose entity organized solely for the purpose of owning such assets and issuing such debt. Asset-backed securities are often backed by a pool of assets representing the obligations of a number of different parties. The yield characteristics of certain
asset-backed securities may differ from traditional debt securities. One such major difference is that all or a principal part of the obligations may be prepaid at any time because the underlying assets (i.e., loans) may be prepaid at any time. As a result, a decrease in interest rates in the market may result in increases in the level of prepayments as borrowers, particularly mortgagors, refinance and repay their loans. An increased prepayment rate with respect to an asset-backed security subject to such a prepayment feature will have the effect of shortening the maturity of the security. In addition, the Funds may have to subsequently reinvest the proceeds at lower interest rates. If the Funds have purchased such an asset-backed security at a premium, a faster than anticipated prepayment rate could result in a loss of principal to the extent of the premium paid.
The Funds may purchase certain mortgage pass-through securities. There are a number of important differences among the agencies and instrumentalities of the US government that issue mortgage-related securities and among the securities that they issue. For example, mortgage-related securities guaranteed by Ginnie Mae are guaranteed as to the timely payment of principal and interest by Ginnie Mae and such guarantee is backed by the full faith and credit of the United States. However, mortgage-related securities issued by Freddie Mac and Fannie Mae, including Freddie Mac and Fannie Mae guaranteed mortgage pass-through certificates, which are solely the obligations of Freddie Mac and Fannie Mae, are not backed by or entitled to the full faith and credit of the United States, but are supported by the right of the issuer to borrow from the Treasury.
Repurchase Agreements: The Funds may enter into repurchase agreements. In a repurchase agreement, a Fund purchases a security from a counterparty who agrees to repurchase the same security at a mutually agreed upon date and price. On a daily basis, the counterparty is required to maintain collateral subject to the agreement and in value no less than the agreed repurchase amount. The agreements are conditioned upon the collateral being deposited under the Federal Reserve book entry system or held in a segregated account by a Fund’s custodian or designated sub-custodians under tri-party repurchase agreements. In the event the counterparty defaults and the fair value of the collateral declines, a Fund could experience losses, delays and costs in liquidating the collateral.
Repurchase agreements are entered into by the Fund under Master Repurchase Agreements (“MRA”), which permit a Fund, under certain circumstances including an event of default (such as bankruptcy or insolvency), to offset payables and/or receivables under the MRA with collateral held and/or posted to the counterparty and create one single net payment due to or from a Fund. However, bankruptcy or insolvency laws of a particular jurisdiction may impose restrictions on or prohibitions against such a right of offset in the event of the MRA counterparty’s bankruptcy or insolvency. Pursuant to the terms of the MRA, a Fund receives securities as collateral with a market value in excess of the repurchase price to be received by the Fund upon the maturity of the repurchase transaction. Upon a bankruptcy or insolvency of the MRA
| | | | | | |
| 28 | | BLACKROCK FUNDS | | JANUARY 31, 2014 | | |
| | |
| Notes to Financial Statements (continued) | | |
counterparty, a Fund would recognizes a liability with respect to such excess collateral to reflect the Fund’s obligation under bankruptcy law to return the excess to the counterparty.
4. Investment Advisory Agreement and Other Transactions with Affiliates:
The PNC Financial Services Group, Inc. is the largest stockholder and an affiliate, for 1940 Act purposes, of BlackRock, Inc. (“BlackRock”).
The Trust, on behalf of the Funds, entered into an Investment Advisory Agreement with the Manager, the Funds’ investment advisor, an indirect, wholly owned subsidiary of BlackRock, to provide investment advisory and administration services. The Manager is responsible for the management of each Fund’s portfolio and provides the necessary personnel, facilities, equipment and certain other services necessary to the operations of each Fund. For such services, each Fund pays the Manager a monthly fee based on a percentage of each Fund’s average daily net assets at the following annual rates:
| | | | |
| Average Daily Net Assets | | Investment Advisory Fee | |
First $1 billion | | | 0.250 | % |
$1 billion - $3 billion | | | 0.240 | % |
$3 billion - $5 billion | | | 0.230 | % |
$5 billion - $10 billion | | | 0.220 | % |
Greater than $10 billion | | | 0.210 | % |
The Manager voluntarily agreed to waive its investment advisory fees by the amount of investment advisory fees each Fund pays to the Manager indirectly through its investment in affiliated money market funds. However, the Manager does not waive its investment advisory fees by the amount of investment advisory fees paid in connection with each Fund’s investment in other affiliated investment companies, if any. These amounts are included in expenses reimbursed by Manager in the Statements of Operations. For the six months ended January 31, 2014, the Manager reimbursed $24, $19 and $142 for Short Obligations, Short-Term Treasury and Ultra-Short Obligations, respectively.
Pursuant to written agreements, certain financial intermediaries, some of which may be affiliates, provide the Funds with sub-accounting, recordkeeping, sub-transfer agency and other administrative services with respect to sub-accounts they service. For these services, these entities receive an asset based fee or an annual fee per shareholder account, which will vary depending on share class and/or net assets.
The Manager maintains a call center, which is responsible for providing certain shareholder services to the Funds, such as responding to shareholder inquiries and processing transactions based upon instructions from shareholders with respect to the subscription and redemption of Fund shares.
BNY Mellon Investment Servicing (US) Inc. (“BNYMIS”) and the Manager act as co-administrators for the Funds. For these services, the co-administrators receive an administration fee computed daily and payable monthly to each administrator pursuant to separate fee arrangements, based on a percentage of the average daily net assets of each Fund. The combined administration fee, which is shown as administration in the Statements of Operations, is paid at the following annual rates:
| | | | |
| Average Daily Net Assets | | Administration Fee | |
First $500 Million | | | 0.075 | % |
$500 Million - $1 Billion | | | 0.065 | % |
Greater than $1 Billion | | | 0.055 | % |
In addition, each of the share classes is charged an administration fee, which is shown as administration — class specific in the Statement of Operations, based on the following percentages of average daily net assets of each respective class:
| | | | |
| Average Daily Net Assets | | Administration Fee — Class Specific | |
First $500 Million | | | 0.025 | % |
$500 Million - $1 Billion | | | 0.015 | % |
Greater than $1 Billion | | | 0.005 | % |
For the six months ended January 31, 2014, the Funds paid the following to the Manager in return for these services, which are included in administration, administration — class specific, administration fees waived and administration fees waived — class specific in the Statements of Operations:
| | | | |
Short Obligations | | $ | 1,261 | |
Short-Term Treasury | | $ | 1,890 | |
Ultra-Short Obligations | | $ | 1,260 | |
BNYMIS and the Manager may have, at their discretion, voluntarily waived all or any portion of their administration fees for a Fund or a share class, which are included in administration fees waived and administration fees waived — class specific in the Statements of Operations.
The Manager contractually or voluntarily agreed to waive and/or reimburse fees or expenses in order to limit expenses, excluding interest expense, dividend expense, income tax expense, acquired fund fees and expenses and certain other fund expenses, which constitute extraordinary expenses not incurred in the ordinary course of the Funds’
| | | | | | |
| | | BLACKROCK FUNDS | | JANUARY 31, 2014 | | 29 |
| | |
| Notes to Financial Statements (continued) | | |
business. The expense limitations as a percentage of average daily net assets are as follows:
| | | | | | | | | | | | | | | | | | | | |
| | | Short Obligations | | | Short-Term Treasury | | | Ultra-Short Obligations | |
| | | Contractual1 | | | Voluntary2,3 | | | Contractual1 | | | Contractual1 | | | Voluntary2,4 | |
| | | | | | | | | | | | | | | | | | | | |
BlackRock | | | 0.30 | % | | | 0.10 | % | | | — | | | | 0.25 | % | | | 0.10 | % |
Institutional | | | 0.35 | % | | | 0.20 | % | | | 0.20 | %5 | | | 0.30 | % | | | 0.20 | % |
Institutional Daily | | | — | | | | — | | | | 0.20 | % | | | — | | | | — | |
| | 1 | The Manager has agreed not to reduce or discontinue this contractual waiver or reimbursement prior to December 1, 2014 unless approved by the Board, including a majority of the independent trustees. |
| | 2 | The voluntary expense cap is in effect until December 1, 2014. However, the voluntary cap may be terminated prior to that date without shareholder notification or approval. |
| | 3 | Prior to December 17, 2012, Short Obligations had a voluntary expense cap of 0.25% and from December 17, 2012 to January 22, 2013 a voluntary expense cap of 0.18%. |
| | 4 | Prior to January 22, 2013, Ultra-Short Obligations had a voluntary expense cap of 0.18%. |
| | 5 | There were no shares outstanding as of January 31, 2014. |
The Manager voluntarily agreed to waive and/or reimburse fees and/or expenses to enable Short-Term Treasury to maintain minimum levels of daily net investment income. These amounts are reported in the Statements of Operations as fees waived by Manager. The Manager may discontinue the waiver or reimbursement at any time.
These amounts waived or reimbursed are included in fees waived by Manager and expenses reimbursed by Manager, and shown as administration fees waived — class specific, and transfer agent fees reimbursed — class specific, respectively, in the Statements of Operations. For the six months ended January 31, 2014, the Manager waived $31,539, $18,905 and $31,515 of investment advisory fees for Short Obligations, Short-Term Treasury and Ultra-Short Obligations, respectively, which are included in fees waived by Manager. The Manager reimbursed expenses of $63,826, $67,280 and $62,772 for Short Obligations, Short-Term Treasury and Ultra-Short Obligations, respectively, which are included in expenses reimbursed by Manager.
If during a Fund’s fiscal year the operating expenses of a share class, that at any time during the prior two fiscal years received a waiver or reimbursement from the Manager, are less than the expense limit for that share class, the Manager is entitled to be reimbursed by such share class up to the lesser of (a) the amount of fees waived or expenses reimbursed during those prior two fiscal years under the agreement and (b) the amount by which the expense limit for that share class exceeds the operating expenses of the share class for the current fiscal year, provided that: (1) the Fund of which the share class is a part has more than $50 million in assets for the fiscal year and (2) the Manager or an affiliate continues to serve as the Fund’s investment advisor or administrator. In the event the expense limit for a share class is changed subsequent to a fiscal year in which the Manager becomes entitled to reimbursement for fees waived or reimbursed, the amount available to reimburse the Manager shall be calculated by reference to the expense limit for that share class in effect at the time the Manager became entitled to receive such reimbursement, rather than the subsequently changed expense limit for that share class.
On January 31, 2014, the Fund level and class specific waivers and/or reimbursements subject to possible future recoupment under the expense limitation agreement are as follows:
| | | | | | | | |
| | | Expiring July 31, | |
| | | 2015 | | | 2016 | |
Short Obligations | | | | | | | | |
Fund Level | | $ | 82,787 | | | $ | 80,842 | |
BlackRock | | $ | 4,339 | | | $ | 1,951 | |
Short-Term Treasury | | | | | | | | |
Fund Level | | $ | 143,220 | | | $ | 85,829 | |
Institutional Daily | | $ | 2,816 | | | $ | 2,004 | |
Ultra-Short Obligations | | | | | | | | |
Fund Level | | $ | 82,082 | | | $ | 87,009 | |
BlackRock | | $ | 4,341 | | | $ | 1,970 | |
Certain officers and/or trustees of the Trust are officers and/or directors of BlackRock or its affiliates. The Funds reimburse the Manager for a portion of the compensation paid to the Trust’s Chief Compliance Officer, which is included in officer and trustees in the Statements of Operations.
5. Purchases and Sales:
Purchases and sales of investments including paydowns and excluding short-term securities and US government securities for the six months ended January 31, 2014, were as follows:
| | | | | | | | |
| | | Purchases | | | Sales | |
Short Obligations | | $ | 5,865,217 | | | $ | 4,159,739 | |
Ultra-Short Obligations | | $ | 835,929 | | | $ | 860,000 | |
Sales of US government securities for Short-Term Treasury for the six months ended January 31, 2014, were $500,000. There were no purchases for the six months ended January 31, 2014.
| | | | | | |
| 30 | | BLACKROCK FUNDS | | JANUARY 31, 2014 | | |
| | |
| Notes to Financial Statements (continued) | | |
6. Income Tax Information:
As of January 31, 2014, gross unrealized appreciation and gross unrealized depreciation based on cost for federal income tax purposes were as follows:
| | | | | | | | | | | | |
| | | Short
Obligations | | | Short-Term
Treasury | | | Ultra-Short
Obligations | |
Tax cost | | $ | 24,104,170 | | | $ | 15,006,095 | | | $ | 24,905,773 | |
| | | | |
Gross unrealized appreciation | | $ | 27,868 | | | $ | 1,268 | | | $ | 5,482 | |
Gross unrealized depreciation | | | (1,944 | ) | | | (147 | ) | | | (499 | ) |
| | | | |
Net unrealized appreciation | | $ | 25,924 | | | $ | 1,121 | | | $ | 4,983 | |
| | | | |
7. Concentration, Market and Credit Risk:
In the normal course of business, the Funds invest in securities and enter into transactions where risks exist due to fluctuations in the market (market risk) or failure of the issuer of a security to meet all its obligations (issuer credit risk). The value of securities held by the Funds may decline in response to certain events, including those directly involving the issuers whose securities are owned by the Funds; conditions affecting the general economy; overall market changes; local, regional or global political, social or economic instability; and currency and interest rate and price fluctuations. Similar to issuer credit risk, the Funds may be exposed to counterparty credit risk, or the risk that an entity with which the Funds have unsettled or open transactions may fail to or be unable to perform on its commitments. The Funds manage counterparty risk by entering into transactions only with counterparties that they believe have the financial resources to honor their obligations and by monitoring the financial stability of those counterparties. Financial assets, which potentially expose the Funds to market, issuer and counterparty credit risks, consist principally of financial instruments and receivables due from counterparties. The extent of the Funds’ exposure to market, issuer and counterparty credit risks with respect to these financial assets is generally approximated by their value as recorded in Statements of Assets and Liabilities, less any collateral held by the Funds.
The Funds invest a significant portion of their assets in fixed-income securities. See the Schedules of Investments for these securities. Changes in market interest rates or economic conditions, including the Federal Reserve’s decision in December 2013 to taper its quantitative easing policy, may affect the value and/or liquidity of such investments. Interest rate risk is the risk that prices of bonds and other fixed-income securities will increase as interest rates fall and decrease as interest rates rise. The Funds may be subject to a greater risk of rising interest rates due to the current period of historically low rates.
As of January 31, 2014, Short Obligations and Ultra-Short Obligations invested a significant portion of its assets in securities in the financial services sector. Changes in economic conditions affecting the
financial services sector would have a greater impact on the Fund and could affect the value, income and/or liquidity of positions in such securities.
8. Capital Share Transactions:
Transactions in capital shares for each class were as follows:
| | | | | | | | | | | | | | | | |
| | | Six Months
Ended
January 31, 2014 | | | Period
November 15, 20121
to
July 31, 2013 | |
| Short Obligations | | Shares | | | Amount | | | Shares | | | Amount | |
| BlackRock | | | | | | | | | | | | |
Shares sold | | | — | | | | — | | | | 2,500,001 | | | $ | 25,000,010 | |
Shares redeemed | | | — | | | | — | | | | (999,551 | ) | | | (10,000,010 | ) |
| | | | | | | | |
Net increase | | | — | | | | — | | | | 1,500,450 | | | $ | 15,000,000 | |
| | | | | | | | |
| | | | | | | | | | | | | | | | |
| | | Six Months
Ended
January 31, 2014 | | | Period
July 9, 20131
to
July 31, 2013 | |
| Institutional | | | | | | | | | | | | |
Shares sold | | | — | | | | — | | | | 1,000,000 | | | $ | 10,000,000 | |
| | | | | | | | |
Net increase | | | — | | | | — | | | | 1,000,000 | | | $ | 10,000,000 | |
| | | | | | | | |
Total Net Increase | | | — | | | | — | | | | 2,500,450 | | | $ | 25,000,000 | |
| | | | | | | | |
| | | | | | | | | | | | | | | | |
| Short-Term Treasury | | Six Months
Ended
January 31, 2014 | | | Period November 15, 20121 to July 31, 2013 | |
| Institutional Daily | | | | | | | | | | | | |
Shares sold | | | — | | | | — | | | | 1,500,001 | | | $ | 15,000,010 | |
Shares redeemed | | | — | | | | — | | | | (1 | ) | | | (10 | ) |
| | | | | | | | |
Net increase | | | — | | | | — | | | | 1,500,000 | | | $ | 15,000,000 | |
| | | | | | | | |
| | | | | | | | | | | | | | | | |
| Ultra-Short Obligations | | Six Months
Ended January 31, 2014 | | | Period November 15, 20121 to July 31, 2013 | |
| BlackRock | | | | | | | | | | | | |
Shares sold | | | — | | | | — | | | | 2,500,301 | | | $ | 25,003,010 | |
Shares issued in reinvestment of dividends | | | — | | | | — | | | | — | | | | 2 | |
Shares redeemed | | | — | | | | — | | | | (1,000,241 | ) | | | (10,003,012 | ) |
| | | | | | | | |
Net increase | | | — | | | | — | | | | 1,500,060 | | | $ | 15,000,000 | |
| | | | | | | | |
| | 1 | Commencement of operations. |
| | | | | | |
| | | BLACKROCK FUNDS | | JANUARY 31, 2014 | | 31 |
| | |
| Notes to Financial Statements (concluded) | | |
| | | | | | | | | | | | | | | | |
Ultra-Short Obligations
(concluded) | | Six Months Ended
January 31, 2014 | | | Period July 9, 20131 to July 31, 2013 | |
| | | Shares | | | Amount | | | Shares | | | Amount | |
| Institutional | | | | | | | | | | | | |
Shares sold | | | — | | | | — | | | | 1,000,000 | | | $ | 10,000,000 | |
| | | | | | | | |
Net increase | | | — | | | | — | | | | 1,000,000 | | | $ | 10,000,000 | |
| | | | | | | | |
Total Net Increase | | | — | | | | — | | | | 2,500,060 | | | $ | 25,000,000 | |
| | | | | | | | |
| | 1 | Commencement of operations. |
At January 31, 2014, all shares outstanding were owned by affiliates.
9. Subsequent Events:
Management has evaluated the impact of all subsequent events on the Fund through the date the financial statements were issued and has determined that there were no subsequent events requiring adjustment or additional disclosure in the financial statements.
| | | | | | |
| 32 | | BLACKROCK FUNDS | | JANUARY 31, 2014 | | |
Ronald W. Forbes, Co-Chairman of the Board and Trustee
Rodney D. Johnson, Co-Chairman of the Board and Trustee
Paul L. Audet, Trustee
David O. Beim, Trustee
Henry Gabbay, Trustee
Dr. Matina S. Horner, Trustee
Herbert I. London, Trustee
Ian A. MacKinnon, Trustee
Cynthia A. Montgomery, Trustee
Joseph P. Platt, Trustee
Robert C. Robb, Jr., Trustee
Toby Rosenblatt, Trustee
Kenneth L. Urish, Trustee
Frederick W. Winter, Trustee
John M. Perlowski, President and Chief Executive Officer
Richard Hoerner, CFA, Vice President
Brendan Kyne, Vice President
Neal Andrews, Chief Financial Officer
Jay Fife, Treasurer
Brian Kindelan, Chief Compliance Officer and Anti-Money Laundering Officer
Benjamin Archibald, Secretary
Investment Advisor and Co-Administrator
BlackRock Advisors, LLC
Wilmington, DE 19809
Distributor
BlackRock Investments, LLC
New York, NY 10022
Accounting Agent, Co-Administrator and Transfer Agent
BNY Mellon Investment Servicing (US) Inc.
Wilmington, DE 19809
Custodian
The Bank of New York Mellon
New York, NY 10286
Legal Counsel
Sidley Austin LLP
New York, NY 10019
Independent Registered Public Accounting Firm
PricewaterhouseCoopers LLP
Philadelphia, PA 19103
Address of the Trust
100 Bellevue Parkway
Wilmington, DE 19809
| | | | | | |
| | | BLACKROCK FUNDS | | JANUARY 31, 2014 | | 33 |
Electronic Delivery
Electronic copies of most financial reports and prospectuses are available on the Funds’ website or shareholders can sign up for e-mail notifications of quarterly statements, annual and semi-annual reports and prospectuses by enrolling in the Funds’ electronic delivery program.
To enroll:
Shareholders Who Hold Accounts with Investment Advisors, Banks or Brokerages:
Please contact your financial advisor. Please note that not all investment advisors, banks or brokerages may offer this service.
Shareholders Who Hold Accounts Directly with BlackRock:
| 1) | Access the BlackRock website at |
| | http://www.blackrock.com/cash |
| 2) | Select “eDelivery” under the “More Information” section |
Householding
The Funds will mail only one copy of shareholder documents, including prospectuses, annual and semi-annual reports and proxy statements, to shareholders with multiple accounts at the same address. This practice is commonly called “householding” and is intended to reduce expenses and eliminate duplicate mailings of shareholder documents. Mailings of your shareholder documents may be householded indefinitely unless you instruct us otherwise. If you do not want the mailing of these documents to be combined with those for other members of your household, please call the Funds at (800) 537-4942.
Availability of Quarterly Schedule of Investments
The Funds file their complete schedule of portfolio holdings with the Securities and Exchange Commission’s (the “SEC”) for the first and third quarters of each fiscal year on Form N-Q. The Funds’ Forms N-Q are available on the SEC’s website at http://www.sec.gov and may also be reviewed and copied at the SEC’s Public Reference Room in Washington, DC. Information on how to access documents on the SEC’s website without charge may be obtained by calling (800) SEC-0330. The Funds’ Forms N-Q may also be obtained upon request and without charge by calling (800) 537-4942.
Availability of Proxy Voting Policies and Procedures
A description of the policies and procedures that the Funds use to determine how to vote proxies relating to portfolio securities is available (1) without charge, upon request, by calling (800) 537-4942; (2) at http://www.blackrock.com; and (3) on the SEC’s website at http:// www.sec.gov.
Availability of Proxy Voting Record
Information about how the Funds voted proxies relating to securities held in the Funds’ portfolios during the most recent 12-month period ended June 30 is available upon request and without charge (1) at http://www.blackrock.com or by calling (800) 537-4942 and (2) on the SEC’s website at http://www.sec.gov.
Account Information
Call us at (800) 537-4942 from 8:00 AM to 6:00 PM EST on any business day to get information about your account balances, recent transactions and share prices. You can also reach us on the Web at http:// www.blackrock.com/funds.
Retirement Plans
Shareholders may make investments in conjunction with Traditional, Rollover, Roth, Coverdell, Simple IRAs, SEP IRAs and 403(b) Plans.
| | | | | | |
| 34 | | BLACKROCK FUNDS | | JANUARY 31, 2014 | | |
| | |
| Additional Information (concluded) | | |
|
| BlackRock Privacy Principles |
BlackRock is committed to maintaining the privacy of its current and former fund investors and individual clients (collectively, “Clients”) and to safeguarding their non-public personal information. The following information is provided to help you understand what personal information BlackRock collects, how we protect that information and why in certain cases we share such information with select parties.
If you are located in a jurisdiction where specific laws, rules or regulations require BlackRock to provide you with additional or different privacy-related rights beyond what is set forth below, then BlackRock will comply with those specific laws, rules or regulations.
BlackRock obtains or verifies personal non-public information from and about you from different sources, including the following: (i) information we receive from you or, if applicable, your financial intermediary, on applications, forms or other documents; (ii) information about your transactions with us, our affiliates, or others; (iii) information we receive from a consumer reporting agency; and (iv) from visits to our websites.
BlackRock does not sell or disclose to non-affiliated third parties any non-public personal information about its Clients, except as permitted by law or as is necessary to respond to regulatory requests or to service Client accounts. These non-affiliated third parties are required to protect the confidentiality and security of this information and to use it only for its intended purpose.
We may share information with our affiliates to service your account or to provide you with information about other BlackRock products or services that may be of interest to you. In addition, BlackRock restricts access to non-public personal information about its Clients to those BlackRock employees with a legitimate business need for the information. BlackRock maintains physical, electronic and procedural safeguards that are designed to protect the non-public personal information of its Clients, including procedures relating to the proper storage and disposal of such information.
| | | | | | |
| | | BLACKROCK FUNDS | | JANUARY 31, 2014 | | 35 |
| | |
| A World-Class Mutual Fund Family | | |
BlackRock offers a diverse lineup of open-end mutual funds crossing all investment styles and managed by experts in equity, fixed income and tax-exempt investing.
BlackRock ACWI ex-US Index Fund
BlackRock All-Cap Energy & Resources Portfolio
BlackRock Basic Value Fund
BlackRock Capital Appreciation Fund
BlackRock Commodity Strategies Fund
BlackRock Disciplined Small Cap Core Fund
BlackRock Emerging Markets Fund
BlackRock Emerging Markets Dividend Fund
BlackRock Emerging Markets Long/Short Equity Fund
BlackRock Energy & Resources Portfolio
BlackRock Equity Dividend Fund
BlackRock EuroFund
BlackRock Flexible Equity Fund
BlackRock Focus Growth Fund
BlackRock Global Dividend Portfolio
BlackRock Global Long/Short Equity Fund
BlackRock Global Opportunities Portfolio
BlackRock Global SmallCap Fund
BlackRock Health Sciences Opportunities Portfolio
BlackRock International Fund
BlackRock International Index Fund
BlackRock International Opportunities Portfolio
BlackRock Large Cap Core Fund
BlackRock Large Cap Core Plus Fund
BlackRock Large Cap Growth Fund
BlackRock Large Cap Value Fund
BlackRock Latin America Fund
BlackRock Long-Horizon Equity Fund
BlackRock Mid-Cap Growth Equity Portfolio
BlackRock Mid-Cap Value Opportunities Fund
BlackRock Natural Resources Trust
BlackRock Pacific Fund
BlackRock Real Estate Securities Fund
BlackRock Russell 1000® Index Fund
BlackRock Science & Technology Opportunities Portfolio
BlackRock Small Cap Growth Equity Portfolio
BlackRock Small Cap Growth Fund II
BlackRock Small Cap Index Fund
BlackRock S&P 500 Stock Fund
BlackRock U.S. Opportunities Portfolio
BlackRock Value Opportunities Fund
|
| Taxable Fixed Income Funds |
BlackRock Bond Index Fund
BlackRock Core Bond Portfolio
BlackRock CoreAlpha Bond Fund
BlackRock CoRI Funds
2015
2017
2019
2021
2023
BlackRock Emerging Markets Flexible Dynamic Bond
Portfolio
BlackRock Floating Rate Income Portfolio
BlackRock Global Long/Short Credit Fund
BlackRock GNMA Portfolio
BlackRock High Yield Bond Portfolio
BlackRock Inflation Protected Bond Portfolio
BlackRock International Bond Portfolio
BlackRock Investment Grade Bond Portfolio
BlackRock Low Duration Bond Portfolio
BlackRock Secured Credit Portfolio
BlackRock Short Obligations Fund
BlackRock Short-Term Treasury Fund
BlackRock Strategic Income Opportunities Portfolio
BlackRock Total Return Fund
BlackRock U.S. Government Bond Portfolio
BlackRock U.S. Mortgage Portfolio
BlackRock Ultra-Short Obligations Fund
BlackRock World Income Fund
|
| Municipal Fixed Income Funds |
BlackRock California Municipal Bond Fund
BlackRock High Yield Municipal Fund
BlackRock National Municipal Fund
BlackRock New Jersey Municipal Bond Fund
BlackRock New York Municipal Bond Fund
BlackRock Pennsylvania Municipal Bond Fund
BlackRock Short-Term Municipal Fund
BlackRock Strategic Municipal Opportunities Fund
| | | | | | | | | | | | | | |
| BlackRock Balanced Capital Fund | | LifePath Active Portfolios | | LifePath Index Portfolios |
| BlackRock Emerging Market Allocation Portfolio | | 2015 | | | 2040 | | | | | Retirement | | 2040 | | |
| BlackRock Global Allocation Fund | | 2020 | | | 2045 | | | | | 2020 | | 2045 | | |
| BlackRock Managed Volatility Portfolio | | 2025 | | | 2050 | | | | | 2025 | | 2050 | | |
| BlackRock Multi-Asset Income Portfolio | | 2030 | | | 2055 | | | | | 2030 | | 2055 | | |
| BlackRock Multi-Asset Real Return Fund | | 2035 | | | | | | | | 2035 | | | | |
| BlackRock Strategic Risk Allocation Fund | | | | | | | | | | | | | | |
| | | | | | |
| | LifePath Portfolios | | | | | | | | | | | | |
| BlackRock Prepared Portfolios | | Retirement | | | 2040 | | | | | | | | | |
Conservative Prepared Portfolio | | 2020 | | | 2045 | | | | | | | | | |
Moderate Prepared Portfolio | | 2025 | | | 2050 | | | | | | | | | |
Growth Prepared Portfolio | | 2030 | | | 2055 | | | | | | | | | |
Aggressive Growth Prepared Portfolio | | 2035 | | | | | | | | | | | | |
BlackRock mutual funds are currently distributed by BlackRock Investments, LLC. You should consider the investment objectives, risks, charges and expenses of the funds under consideration carefully before investing. Each fund’s prospectus contains this and other information and is available at www.blackrock.com or by calling (800) 441-7762 or from your financial advisor. The prospectus should be read carefully before investing.
| | | | | | |
| 36 | | BLACKROCK FUNDS | | JANUARY 31, 2014 | | |
| | |
| This report is transmitted to shareholders only. It is not authorized for use as an offer of sale or a solicitation of an offer to buy shares of the Funds unless accompanied or preceded by that Fund’s current prospectus. Past performance results shown in this report should not be considered a representation of future performance. Investment returns and principal value of shares will fluctuate so that shares, when redeemed, may be worth more or less than their original cost. Statements and other information herein are as dated and are subject to change. | |  |
| | |
| SHORTS-1/14-SAR | |  |
| | |
| |
| Item 2 – | | Code of Ethics – Not Applicable to this semi-annual report |
| |
| Item 3 – | | Audit Committee Financial Expert – Not Applicable to this semi-annual report |
| |
| Item 4 – | | Principal Accountant Fees and Services – Not Applicable to this semi-annual report |
| |
| Item 5 – | | Audit Committee of Listed Registrants – Not Applicable |
| |
| Item 6 – | | Investments |
| | (a) The registrant’s Schedule of Investments is included as part of the Report to Stockholders filed under Item 1 of this Form. |
| | (b) Not Applicable due to no such divestments during the semi-annual period covered since the previous Form N-CSR filing. |
| |
| Item 7 – | | Disclosure of Proxy Voting Policies and Procedures for Closed-End Management Investment Companies – Not Applicable |
| |
| Item 8 – | | Portfolio Managers of Closed-End Management Investment Companies – Not Applicable |
| |
| Item 9 – | | Purchases of Equity Securities by Closed-End Management Investment Company and Affiliated Purchasers – Not Applicable |
| |
| Item 10 – | | Submission of Matters to a Vote of Security Holders –There have been no material changes to these procedures. |
| |
| Item 11 – | | Controls and Procedures |
| |
| | (a) – The registrant’s principal executive and principal financial officers, or persons performing similar functions, have concluded that the registrant’s disclosure controls and procedures (as defined in Rule 30a-3(c) under the Investment Company Act of 1940, as amended (the “1940 Act”)) are effective as of a date within 90 days of the filing of this report based on the evaluation of these controls and procedures required by Rule 30a-3(b) under the 1940 Act and Rule 15d-15(b) under the Securities Exchange Act of 1934, as amended. |
| |
| | (b) – There were no changes in the registrant’s internal control over financial reporting (as defined in Rule 30a-3(d) under the 1940 Act) that occurred during the second fiscal quarter of the period covered by this report that have materially affected, or are reasonably likely to materially affect, the registrant’s internal control over financial reporting. |
| |
| Item 12 – | | Exhibits attached hereto |
| |
| | (a)(1) – Code of Ethics – Not Applicable to this semi-annual report |
| |
| | (a)(2) – Certifications – Attached hereto |
| |
| | (a)(3) – Not Applicable |
| |
| | (b) – Certifications – Attached hereto |
2
Pursuant to the requirements of the Securities Exchange Act of 1934 and the Investment Company Act of 1940, the registrant has duly caused this report to be signed on its behalf by the undersigned, thereunto duly authorized.
| | |
| BlackRock Funds |
| |
| By: | | /s/ John M. Perlowski |
| | John M. Perlowski |
| | Chief Executive Officer (principal executive officer) of |
| | BlackRock Funds |
|
| Date: April 2, 2014 |
Pursuant to the requirements of the Securities Exchange Act of 1934 and the Investment Company Act of 1940, this report has been signed below by the following persons on behalf of the registrant and in the capacities and on the dates indicated.
| | |
| By: | | /s/ John M. Perlowski |
| | John M. Perlowski |
| | Chief Executive Officer (principal executive officer) of |
| | BlackRock Funds |
|
| Date: April 2, 2014 |
| |
| By: | | /s/ Neal J. Andrews |
| | Neal J. Andrews |
| | Chief Financial Officer (principal financial officer) of |
| | BlackRock Funds |
|
| Date: April 2, 2014 |
|
|
3