UNITED STATES
SECURITIES AND EXCHANGE COMMISSION
Washington, D.C. 20549
FORM N-CSR
CERTIFIED SHAREHOLDER REPORT OF REGISTERED MANAGEMENT INVESTMENT COMPANIES
Investment Company Act file number: 811-05742
Name of Fund: BlackRock Funds
BlackRock All-Cap Energy & Resources Portfolio
BlackRock Emerging Markets Dividend Fund
BlackRock Energy & Resources Portfolio
BlackRock Flexible Equity Fund
BlackRock Global Opportunities Portfolio
BlackRock Health Sciences Opportunities Portfolio
BlackRock International Opportunities Portfolio
BlackRock Managed Volatility Portfolio
BlackRock Mid-Cap Growth Equity Portfolio
BlackRock Science & Technology Opportunities Portfolio
BlackRock Small Cap Growth Equity Portfolio
BlackRock U.S. Opportunities Portfolio
Fund Address: 100 Bellevue Parkway, Wilmington, DE 19809
Name and address of agent for service: John M. Perlowski, Chief Executive Officer, BlackRock Funds, 55 East 52nd Street, New York, NY 10055
Registrant’s telephone number, including area code: (800) 441-7762
Date of fiscal year end: 09/30/2014
Date of reporting period: 03/31/2014
Item 1 – Report to Stockholders
MARCH 31, 2014
| | | | |
SEMI-ANNUAL REPORT (UNAUDITED) | | | | BLACKROCK® |
BlackRock FundsSM
„ BlackRock All-Cap Energy & Resources Portfolio
„ BlackRock Emerging Markets Dividend Fund
„ BlackRock Energy & Resources Portfolio
| | |
| Not FDIC Insured ¡ May Lose Value ¡ No Bank Guarantee | | |
| | | | | | |
| 2 | | BLACKROCK FUNDS | | MARCH 31, 2014 | | |
Shareholder Letter
Dear Shareholder,
One year ago, U.S. financial markets were improving despite a sluggish global economy, as easy monetary policy provided investors with enough conviction to take on more risk in their portfolios. Slow but positive growth in the U.S. was sufficient to support corporate earnings, while uncomfortably high unemployment reinforced expectations that the Federal Reserve would continue to maintain its aggressive monetary stimulus programs.
Sentiment swiftly reversed in May when then-Fed Chairman Bernanke first mentioned the possibility of reducing (or “tapering”) the central bank’s asset purchase programs – comments that were widely misinterpreted as signaling an end to the Fed’s zero-interest-rate policy. U.S. Treasury yields rose sharply, triggering a steep sell-off across fixed income markets. (Bond prices move in the opposite direction of yields.) Global equities also suffered as investors feared the implications of a potential end to a program that had greatly supported the markets. Emerging markets, which are more sensitive to changes in global liquidity, were particularly hurt by the prospect of ebbing cash flows from the U.S. Markets rebounded in late June, however, when the Fed’s tone turned more dovish, and improving economic indicators and better corporate earnings helped extend gains through most of the summer.
Although the tone of economic and financial news was mixed during the autumn, it was a surprisingly positive period for most asset classes. Early on, the Fed defied market expectations with its decision to delay tapering, but higher volatility returned in late September when the U.S. Treasury Department warned that the national debt would soon breach its statutory maximum. The ensuing political brinksmanship led to a partial government shutdown, roiling global financial markets through the first half of October. Equities and other so-called “risk assets” managed to resume their rally when politicians engineered a compromise to reopen the government and extend the debt ceiling.
The remainder of 2013 was generally positive for stock markets in the developed world, although investors continued to grapple with uncertainty about when and how much the Fed would scale back on stimulus. When the Fed ultimately announced its tapering plans in mid-December, markets reacted positively, as this action signaled the Fed’s perception of real improvement in the economy, and investors were finally relieved from the anxiety that had gripped them for quite some time.
The start of the new year brought another turn in sentiment, as heightened risks in emerging markets and mixed U.S. economic data caused global equities to weaken in January while bond markets found renewed strength. Although these headwinds persisted, equities were back on the rise in February as investors were encouraged by a one-year extension of the U.S. debt ceiling and market-friendly comments from the Fed’s new Chairwoman, Janet Yellen. While U.S. economic data pointed to softer growth, investors viewed this trend as temporarily driven by poor winter weather and continued adding risk to their portfolios on the belief that growth would pick up in the coming months. In March, markets focused on decelerating growth in China and tensions between Russia and Ukraine over the disputed region of Crimea. Additionally, investors were caught off guard by a statement from Chairwoman Yellen indicating that the Fed may raise short-term interest rates earlier than the markets had previously forecasted. Bond markets came under pressure as the middle of the yield curve vaulted higher in response to the unexpected shift in forward guidance.
Against a backdrop of modest economic growth, investors over the past year remained highly attuned to potential changes in monetary policy. Despite the fact that markets were gearing up for a modest shift toward tighter conditions from the Fed, equity markets in the developed world generated strong returns for the six- and 12-month periods ended March 31, with stocks in the United States performing particularly well. In contrast, emerging markets were weighed down by concerns about reduced global liquidity, severe currency weakness, high levels of debt and uneven growth.
Interest rate uncertainty posed a headwind for fixed income assets, and higher-quality sectors of the market experienced heightened volatility and poor performance over the reporting period. High yield bonds, however, benefited from income-oriented investors’ search for yield in the overall low-rate environment. Short-term interest rates remained near zero, keeping yields on money market securities close to historic lows.
At BlackRock, we believe investors need to think globally, extend their scope across a broad array of asset classes and be prepared to move freely as market conditions change over time. We encourage you to talk with your financial advisor and visit www.blackrock.com for further insight about investing in today’s world.
Sincerely,

Rob Kapito
President, BlackRock Advisors, LLC

In a modest global growth environment, expectations around monetary policy changes continued to be a key theme in financial market performance.
Rob Kapito
President, BlackRock Advisors, LLC
| | | | | | | | |
| Total Returns as of March 31, 2014 | |
| | | 6-month | | | 12-month | |
U.S. large cap equities (S&P 500® Index) | | | 12.51 | % | | | 21.86 | % |
U.S. small cap equities (Russell 2000® Index) | | | 9.94 | | | | 24.90 | |
International equities (MSCI Europe, Australasia, Far East Index) | | | 6.41 | | | | 17.56 | |
Emerging market equities (MSCI Emerging Markets Index) | | | 1.39 | | | | (1.43 | ) |
3-month Treasury bill (BofA Merrill Lynch
3-Month U.S. Treasury Bill Index) | | | 0.03 | | | | 0.07 | |
U.S. Treasury securities (BofA Merrill Lynch 10- Year U.S. Treasury Index) | | | 0.85 | | | | (4.38 | ) |
U.S. investment grade bonds (Barclays U.S. Aggregate Bond Index) | | | 1.70 | | | | (0.10 | ) |
Tax-exempt municipal bonds (S&P Municipal Bond Index) | | | 3.91 | | | | 0.31 | |
U.S. high yield bonds (Barclays U.S. Corporate High Yield 2% Issuer Capped Index) | | | 6.66 | | | | 7.53 | |
|
| Past performance is no guarantee of future results. Index performance is shown for illustrative purposes only. You cannot invest directly in an index. | |
| | | | | | |
| | | THIS PAGE NOT PART OF YOUR FUND REPORT | | | | 3 |
| | | | |
| Fund Summary as of March 31, 2014 | | | BlackRock All-Cap Energy & Resources Portfolio | |
BlackRock All-Cap Energy & Resources Portfolio’s (the “Fund”) investment objective is to provide long-term growth of capital.
Effective March 17, 2014, the Fund’s performance benchmarks changed from the S&P 500® Index and a customized weighted index, comprised of 70% Wilshire 5000 Modified Energy Cap Weighted Index and 30% MSCI All-Country World Energy Index, to solely the MSCI World Energy Index. The investment advisor believes that this change in the performance benchmark more accurately reflects the investment strategy of the Fund.
|
| Portfolio Management Commentary |
How did the Fund perform?
| Ÿ | | For the six-month period ended March 31, 2014, the Fund underperformed the MSCI World Energy Index and its former benchmarks, the S&P 500® Index and the customized weighted index. The following discussion of relative performance pertains to the MSCI World Energy Index. |
What factors influenced performance?
| Ÿ | | The Fund’s position in Cairn Energy PLC, a global oil & gas exploration & production company, detracted from performance as the company came under scrutiny from the Indian tax authority due to a matter relating to the initial public offering of their Indian subsidiary, Cairn India, in 2006. India’s tax authority cited retrospective legislation introduced in 2012 regarding the taxation of indirect transfers of Indian assets as the reason for the investigation. Also having a negative impact on results was the Fund’s overweight position in U.S. integrated energy company Chevron Corp. as the company posted disappointing earnings results for the fourth quarter of 2013. |
| Ÿ | | Conversely, the Fund’s position in Phillips 66, a refiner engaged in producing natural gas liquids and petrochemicals, aided relative performance over the six-month period. The company has benefited from the discount between the price of their crude oil inputs (linked to domestic U.S. prices) and the price of the refined product outputs (linked to international |
| | | prices). Southwestern Energy Co. was also a notable contributor as a higher average natural gas price provided an improved earnings outlook for gas producers. |
Describe recent portfolio activity.
| Ÿ | | Early in the six-month period, the Fund reduced exposure to oil services while increasing exposure to integrated and exploration & production companies based on attractive valuations. In the latter half of the period, the Fund rotated exposure within the integrated energy segment, exiting positions in Hess Corp. and Eni SpA on the back of their strong 2013 performance, and initiating a position in Statoil ASA. Additionally, the Fund added a new position in Cimarex Energy Co., a U.S. exploration & production company located in the Permian basin. |
Describe portfolio positioning at period end.
| Ÿ | | As of period end, nearly half of the Fund’s net assets were invested in integrated oil & gas companies. The Fund also held a large exposure to the oil & gas exploration & production segment with a focus on companies that exhibit the ability to meet or exceed market expectations in terms of earnings and costs and have the potential to surprise on the upside through their development and exploration projects. The Fund maintained a meaningful allocation to oil services as well. The remainder of the Fund was invested in distribution companies, coal and uranium stocks, and names in the oil & gas refining & marketing space. |
The views expressed reflect the opinions of BlackRock as of the date of this report and are subject to change based on changes in market, economic or other conditions. These views are not intended to be a forecast of future events and are no guarantee of future results.
| | | | |
| Ten Largest Holdings | | Percent of Long-Term Investments | |
Chevron Corp. | | | 11 | % |
Exxon Mobil Corp. | | | 10 | |
Royal Dutch Shell PLC - ADR | | | 9 | |
ConocoPhillips | | | 7 | |
Schlumberger Ltd. | | | 5 | |
BP PLC | | | 5 | |
Anadarko Petroleum Corp. | | | 5 | |
Noble Energy, Inc. | | | 4 | |
EOG Resources, Inc. | | | 4 | |
Statoil ASA | | | 3 | |
| | | | |
| Industry Allocation | | Percent of Long-Term Investments | |
Oil, Gas & Consumable Fuels | | | 91 | % |
Energy Equipment & Services | | | 9 | |
For Fund compliance purposes, the Fund’s industry classifications refer to any one or more of the industry sub-classifications used by one or more widely recognized market indexes or ratings group indexes, and/or as defined by the investment advisor. These definitions may not apply for purposes of this report, which may combine such industry sub-classifications for reporting ease.
| | | | | | |
| 4 | | BLACKROCK FUNDS | | MARCH 31, 2014 | | |
| | | | |
| | | | BlackRock All-Cap Energy & Resources Portfolio | |
| | |
| Total Return Based on a $10,000 Investment | | |
| | |
 | | 1 Assuming maximum sales charges, if any, transaction costs and other operating expenses, including investment advisory fees and administration fees, if any. Institutional Shares do not have a sales charge. 2 Under normal market conditions, the Fund invests at least 80% of its total assets in equity securities of global energy and natural resources companies and companies in associated businesses, as well as utilities (such as gas, water, cable, electrical and tele-communications utilities). |
| | 3 | This unmanaged total return index covers 500 industrial, utility, transportation and financial companies of the U.S. markets (mostly New York Stock Exchange (“NYSE”) issues) representing about 75% of NYSE market capitalization and 30% of NYSE issues. |
| | 4 | The Wilshire 5000 Modified Energy Cap Weighted Index is a customized index comprised of the energy sector constituents of the Wilshire 5000 (Full Cap) Index, which have been market capitalization weighted and the six largest securities and all securities that have a percentage market value below 0.01% have been removed. |
| | 5 | The MSCI All-Country World Energy Index is comprised of the energy sector constituents of the MSCI All-Country World Index, a free float-adjusted market capitalization weighted index designed to measure the equity market performance of developed and emerging markets. |
| | 6 | An index comprised of the energy sector constituents of the MSCI World Index, a free float-adjusted market capitalization weighted index designed to measure the equity market performance of developed markets. Effective March 17, 2014, the Fund now uses this index as its benchmark rather than the S&P 500® Index and a customized weighted index, comprised of 70% Wilshire 5000 Modified Energy Cap Weighted Index and 30% MSCI All-Country World Energy Index because management believes that this benchmark better represents the sector exposures of the Fund and is a more appropriate basis for evaluating performance. |
| | 7 | Commencement of operations. |
|
| Performance Summary for the Period Ended March 31, 2014 |
| | | | | | | | | | | | | | | | | | | | | | | | | | | | |
| | | | | | Average Annual Total Returns8 | |
| | | | | | 1 Year | | | 5 Years | | | Since Inception9 | |
| | | 6-Month Total Returns | | | w/o sales charge | | | w/ sales charge | | | w/o sales charge | | | w/ sales
charge | | | w/o sales charge | | | w/ sales
charge | |
Institutional | | | 4.92 | % | | | 15.25 | % | | | N/A | | | | 14.46 | % | | | N/A | | | | 8.26 | % | | | N/A | |
Service | | | 4.63 | | | | 14.73 | | | | N/A | | | | 14.00 | | | | N/A | | | | 7.83 | | | | N/A | |
Investor A | | | 4.69 | | | | 14.73 | | | | 8.71 | % | | | 13.97 | | | | 12.75 | % | | | 7.82 | | | | 7.18 | % |
Investor B | | | 4.26 | | | | 13.89 | | | | 9.39 | | | | 13.14 | | | | 12.89 | | | | 7.12 | | | | 7.12 | |
Investor C | | | 4.33 | | | | 13.94 | | | | 12.94 | | | | 13.15 | | | | 13.15 | | | | 7.05 | | | | 7.05 | |
S&P 500® Index | | | 12.51 | | | | 21.86 | | | | N/A | | | | 21.16 | | | | N/A | | | | 7.13 | | | | N/A | |
70% Wilshire 5000 Modified Energy Cap Weighted Index / 30% MSCI All-Country World Energy Index | | | 9.74 | | | | 15.04 | | | | N/A | | | | 19.60 | | | | N/A | | | | 10.75 | | | | N/A | |
MSCI World Energy Index | | | 8.72 | | | | 14.07 | | | | N/A | | | | 13.52 | | | | N/A | | | | 7.40 | | | | N/A | |
| | 8 | Assuming maximum sales charges, if any. Average annual total returns with and without sales charges reflect reductions for distribution and service fees. See “About Fund Performance” on page 10 for a detailed description of share classes, including any related sales charges and fees. |
| | 9 | The Fund commenced operations on February 16, 2005. |
| | | N/A—Not applicable as share class and index do not have a sales charge. |
| | | Past performance is not indicative of future results. |
| | | | | | | | | | | | | | |
| | | Actual | | Hypothetical11 | | |
| | | Beginning Account Value October 1, 2013 | | Ending Account Value March 31, 2014 | | Expenses Paid During the Period10 | | Beginning Account Value October 1, 2013 | | Ending Account Value March 31, 2014 | | Expenses Paid During the Period10 | | Annualized Expense Ratio |
Institutional | | $1,000.00 | | $1,049.20 | | $4.90 | | $1,000.00 | | $1,020.14 | | $4.84 | | 0.96% |
Service | | $1,000.00 | | $1,046.30 | | $7.04 | | $1,000.00 | | $1,018.05 | | $6.94 | | 1.38% |
Investor A | | $1,000.00 | | $1,046.90 | | $7.04 | | $1,000.00 | | $1,018.05 | | $6.94 | | 1.38% |
Investor B | | $1,000.00 | | $1,042.60 | | $10.69 | | $1,000.00 | | $1,014.46 | | $10.55 | | 2.10% |
Investor C | | $1,000.00 | | $1,043.30 | | $10.70 | | $1,000.00 | | $1,014.46 | | $10.55 | | 2.10% |
| | 10 | For each class of the Fund, expenses are equal to the annualized expense ratio for the class, multiplied by the average account value over the period, multiplied by 182/365 (to reflect the one-half year period shown). |
| | 11 | Hypothetical 5% annual return before expenses is calculated by pro rating the number of days in the most recent fiscal half year divided by 365. |
| | | See “Disclosure of Expenses” on page 11 for further information on how expenses were calculated. |
| | | | | | |
| | | BLACKROCK FUNDS | | MARCH 31, 2014 | | 5 |
| | | | |
| Fund Summary as of March 31, 2014 | | | BlackRock Emerging Markets Dividend Fund | |
BlackRock Emerging Markets Dividend Fund’s (the “Fund”) investment objective is primarily to seek investment income and, as a secondary objective, to seek capital appreciation.
|
| Portfolio Management Commentary |
How did the Fund perform?
| Ÿ | | For the six-month period ended March 31, 2014, the Fund underperformed its benchmark, the MSCI Emerging Markets Index. |
What factors influenced performance?
| Ÿ | | Relative to the benchmark index, the Fund’s underweight to India and stock selection in Russia hurt performance during the period. On a sector basis, stock selection in telecommunication services (“telecom”), consumer staples and materials detracted from returns. The largest individual detractor for the period was a position in Lukoil OAO, which suffered due to geopolitical tensions in Russia and Ukraine. |
| Ÿ | | Conversely, stock selection in South Korea, China and Taiwan contributed positively to relative performance. Additionally, stock selection in the energy and consumer discretionary sectors had a positive impact. The largest individual contributor to returns was Macau casino operator Sands China Ltd., which continued to benefit from growth in gaming revenues and a positive outlook for growth in the mass market. |
Describe recent portfolio activity.
| Ÿ | | During the six-month period, the Fund increased exposure to financials. Specifically, the Fund purchased Brazilian bank Itau Unibanco Holding SA given a positive outlook for improving asset quality and diminishing |
| | non-performing loans in the sector. In addition, the Fund added to positions in Kasikornbank PCL in Thailand and Powszechny Zaklad Ubezpieczen SA in Poland. In other sectors, the Fund reduced its position in Tata Motors Ltd. due to concerns about increased capital expenditures. The Fund also exited a holding in Brazilian exchange BM&FBovespa SA as the company suffered from weaker trading volumes in both equities and derivatives. A position in Copa Holdings SA was eliminated given concerns about the company’s currency exposure given its cash balance in Venezuela. |
Describe portfolio positioning at period end.
| Ÿ | | Relative to the MSCI Emerging Markets Index, the Fund ended the period with overweight exposures to Mexico and the Philippines. The Fund held a structural underweight in Korea given low dividend yields in that market. Other significant underweights included India and China. From a sector perspective, the Fund was overweight in industrials, telecom and consumer staples, and underweight in information technology and energy. The investment advisor continues to monitor a number of factors that may drive growth in emerging markets including corporate earnings growth, net exports and government reform in a number of developing countries. |
The views expressed reflect the opinions of BlackRock as of the date of this report and are subject to change based on changes in market, economic or other conditions. These views are not intended to be a forecast of future events and are no guarantee of future results.
| | | | |
| Ten Largest Holdings | | Percent of Long-Term Investments | |
Taiwan Semiconductor Manufacturing Co. Ltd. - ADR | | | 4 | % |
Lukoil OAO - ADR | | | 4 | |
Powszechny Zaklad Ubezpieczen SA | | | 3 | |
CCR SA | | | 3 | |
Itau Unibanco Holding SA - ADR | | | 3 | |
China Petroleum & Chemical Corp., H Shares | | | 3 | |
Kimberly-Clark de Mexico SAB de CV, Class A | | | 3 | |
Philippine Long Distance Telephone Co. - ADR | | | 2 | |
China Merchants Holdings International Co. Ltd | | | 2 | |
BB Seguridade Participacoes SA | | | 2 | |
| | | | |
| Geographic Allocation | | Percent of Long-Term Investments | |
China | | | 15 | % |
Brazil | | | 14 | |
Taiwan | | | 12 | |
Mexico | | | 10 | |
South Africa | | | 7 | |
Russia | | | 5 | |
Thailand | | | 5 | |
South Korea | | | 5 | |
Philippines | | | 5 | |
Poland | | | 3 | |
Indonesia | | | 3 | |
Other1 | | | 16 | |
| 1 | Includes holdings within countries that are 2% or less of long-term investments. Please refer to the Schedule of Investments for such countries. |
| | | | | | |
| 6 | | BLACKROCK FUNDS | | MARCH 31, 2014 | | |
| | | | |
| | | | BlackRock Emerging Markets Dividend Fund | |
|
| Total Return Based on a $10,000 Investment |
| | |
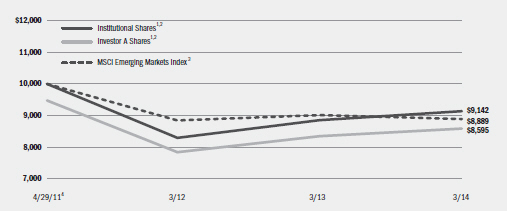 | | 1 Assuming maximum sales charges, if any, transaction costs and other operating expenses, including investment advisory fees and administration fees, if any. Institutional Shares do not have a sales charge. The Fund’s total returns prior to August 16, 2013, are the returns of the Fund when it followed different investment strategies under the name BlackRock China Fund. |
| | 2 | Under normal circumstances, the Fund will invest at least 80% of its net assets (plus any borrowings for investment purposes) in dividend-paying equity securities of, or derivatives having economic characteristics similar to the dividend-paying equity securities of, companies domiciled in, or tied economically to, emerging market countries and at least 80% of its net assets (plus any borrowings for investment purposes) in dividend paying securities. |
| | 3 | A free float-adjusted market capitalization index that is designed to measure equity market performance of emerging markets. The MSCI Emerging Markets Index consists of the following 21 emerging market country indices: Brazil, Chile, China, Colombia, Czech Republic, Egypt, Greece, Hungary, India, Indonesia, Korea, Malaysia, Mexico, Peru, Philippines, Poland, Russia, South Africa, Taiwan, Thailand and Turkey. |
| | 4 | Commencement of operations. |
| | | | | | | | | | | | | | | | | | | | |
| Performance Summary for the Period Ended March 31, 2014 | |
| | | | | | Average Annual Total Returns5 | |
| | | | | | 1 Year | | | Since Inception6 | |
| | | 6-Month Total Returns | | | w/o sales
charge | | | w/ sales
charge | | | w/o sales
charge | | | w/ sales
charge | |
Institutional | | | (0.66 | )% | | | 3.16 | % | | | N/A | | | | (3.02 | )% | | | N/A | |
Investor A | | | (0.84 | ) | | | 2.87 | | | | (2.53 | )% | | | (3.28 | ) | | | (5.05 | )% |
Investor C | | | (1.21 | ) | | | 2.14 | | | | 1.14 | | | | (3.95 | ) | | | (3.95 | ) |
MSCI Emerging Markets Index | | | 1.39 | | | | (1.43 | ) | | | N/A | | | | (3.95 | ) | | | N/A | |
| | 5 | Assuming maximum sales charges, if any. Average annual total returns with and without sales charges reflect reductions for distribution and service fees. See “About Fund Performance” on page 10 for a detailed description of share classes, including any related sales charges and fees. |
| | 6 | The Fund commenced operations on April 29, 2011. |
| | | N/A—Not applicable as share class and index do not have a sales charge. |
| | | Past performance is not indicative of future results. |
| | | | | | | | | | | | | | |
| Expense Example |
| | | Actual | | Hypothetical8 | | |
| | | Beginning Account Value October 1, 2013 | | Ending Account Value March 31, 2014 | | Expenses Paid During the Period7 | | Beginning Account Value October 1, 2013 | | Ending Account Value March 31, 2014 | | Expenses Paid
During the Period7 | | Annualized Expense Ratio |
Institutional | | $1,000.00 | | $993.40 | | $7.55 | | $1,000.00 | | $1,017.35 | | $7.64 | | 1.52% |
Investor A | | $1,000.00 | | $991.60 | | $8.74 | | $1,000.00 | | $1,016.16 | | $8.85 | | 1.76% |
Investor C | | $1,000.00 | | $987.90 | | $12.49 | | $1,000.00 | | $1,012.37 | | $12.64 | | 2.52% |
| | 7 | For each class of the Fund, expenses are equal to the annualized expense ratio for the class, multiplied by the average account value over the period, multiplied by 182/365 (to reflect the one-half year period shown). |
| | 8 | Hypothetical 5% annual return before expenses is calculated by pro rating the number of days in the most recent fiscal half year divided by 365. |
| | | See “Disclosure of Expenses” on page 11 for further information on how expenses were calculated. |
| | | | | | |
| | | BLACKROCK FUNDS | | MARCH 31, 2014 | | 7 |
| | | | |
| Fund Summary as of March 31, 2014 | | | BlackRock Energy & Resources Portfolio | |
BlackRock Energy & Resources Portfolio’s (the “Fund”) investment objective is to provide long-term growth of capital.
Effective March 17, 2014, the Fund’s performance benchmarks changed from the S&P 500® Index and the Wilshire 5000 Modified Energy Equal Weighted Index, to solely the MSCI World Small and Mid-Cap Energy Index. The investment advisor believes that this change in the performance benchmark more accurately reflects the investment strategy of the Fund.
|
| Portfolio Management Commentary |
How did the Fund perform?
| Ÿ | | For the six-month period ended March 31, 2014, all classes outperformed the MSCI World Small and Mid-Cap Energy Index but underperformed its former benchmarks, the S&P 500® Index and the Wilshire 5000 Modified Energy Equal Weighted Index. The following discussion of relative performance pertains to the MSCI World Small and Mid-Cap Energy Index. |
What factors influenced performance?
| Ÿ | | Relative to the benchmark index, the Fund’s overweight in Cairn Energy PLC, a global oil & gas exploration & production company, detracted from performance as the company came under scrutiny from the Indian tax authority due to a matter relating to the initial public offering of their Indian subsidiary, Cairn India, in 2006. India’s tax authority cited retrospective legislation introduced in 2012 regarding the taxation of indirect transfers of Indian assets as the reason for the investigation. The Fund’s performance was also hurt by exposure to U.S. onshore exploration & production stocks that declined as investors took profits on these names following a period of their strong performance. In particular, holdings in Rosetta Resources, Inc., Gulfport Energy Corp. and Trilogy Energy Corp. detracted from returns. |
| Ÿ | | Conversely, a position in Helmerich & Payne, Inc. a U.S. oil services company, contributed positively to performance. The company has benefited from the development of unconventional resources driving increased demand for onshore drilling rigs in the U.S. The Fund’s position in Clayton Williams Energy, Inc., a U.S.-based exploration & production company, buoyed performance after the firm posted strong third-quarter results and a positive operational update. |
Describe recent portfolio activity.
| Ÿ | | During the six-month period, the Fund continued reducing positions in companies with coal exposure. Within the exploration & production space, the Fund initiated positions in Cimarex Energy Co. and RSP Permian, Inc., two North American companies. In the integrated space, the Fund initiated a position in Murphy Oil Corp. |
Describe portfolio positioning at period end.
| Ÿ | | As of period end, the Fund was invested mostly in oil & gas exploration & production companies while maintaining underweight exposures in the oil services and refining & marketing segments. The investment advisor maintains caution on oil services given ongoing rhetoric from integrated oil & gas companies regarding their capital expenditure discipline. |
The views expressed reflect the opinions of BlackRock as of the date of this report and are subject to change based on changes in market, economic or other conditions. These views are not intended to be a forecast of future events and are no guarantee of future results.
| | | | |
| Ten Largest Holdings | | Percent of Long-Term Investments | |
Cimarex Energy Co. | | | 5 | % |
CONSOL Energy, Inc. | | | 5 | |
Helmerich & Payne, Inc. | | | 4 | |
Southwestern Energy Co. | | | 4 | |
EOG Resources, Inc. | | | 4 | |
Superior Energy Services, Inc. | | | 4 | |
AltaGas Ltd. | | | 4 | |
Cameron International Corp. | | | 3 | |
Pioneer Natural Resources Co. | | | 3 | |
Foster Wheeler AG | | | 3 | |
| | | | |
| Industry Allocation | | Percent of Long-Term Investments | |
Oil, Gas & Consumable Fuels | | | 79 | % |
Energy Equipment & Services | | | 15 | |
Construction & Engineering | | | 6 | |
For Fund compliance purposes, the Fund’s industry classifications refer to any one or more of the industry sub-classifications used by one or more widely recognized market indexes or ratings group indexes, and/or as defined by the investment advisor. These definitions may not apply for purposes of this report, which may combine such industry sub-classifications for reporting ease.
| | | | | | |
| 8 | | BLACKROCK FUNDS | | MARCH 31, 2014 | | |
| | | | |
| | | | BlackRock Energy & Resources Portfolio | |
| | |
| Total Return Based on a $10,000 Investment | | |
| | |
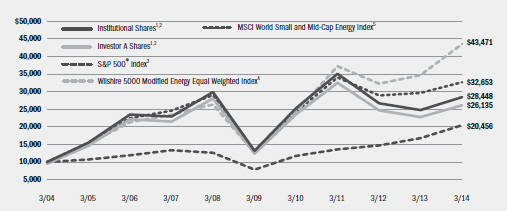 | | 1 Assuming maximum sales charges, if any, transaction costs and other operating expenses, including investment advisory fees and administration fees, if any. Institutional Shares do not have a sales charge. 2 Under normal conditions, the Fund invests at least 80% of its total assets in equity securities of global energy and natural resources companies and companies in associated businesses, as well as utilities (such as gas, water, cable, electrical and telecommunications utilities). |
| | 3 | This unmanaged total return index covers 500 industrial, utility, transportation and financial companies of the U.S. markets (mostly New York Stock Exchange (“NYSE”) issues) representing about 75% of NYSE market capitalization and 30% of NYSE issues. |
| | 4 | The Wilshire 5000 Modified Energy Equal Weighted Index is a customized index comprised of the energy sector constituents of the Wilshire 5000 (Full Cap) Index, which have been equally weighted and the six largest securities and all securities that have a percentage market value below 0.01% have been removed. |
| | 5 | An index comprised of the energy sector constituents of the MSCI World SMID Index, a free float-adjusted market capitalization weighted index designed to measure the equity market performance of the mid and small cap developed market Effective March 17, 2014, the Fund now uses this index as its benchmark rather than the S&P 500 Index® and the Wilshire 5000 Modified Energy Equal Weighted Index because management believes that this benchmark better represents the sector exposures of the Fund and is a more appropriate basis for evaluating performance. |
| | | | | | | | | | | | | | |
| Performance Summary for the Period Ended March 31, 2014 |
| | | | | | | | | | | | | | | | | | | | | | | | | | | | |
| | | | | | Average Annual Total Returns6 | |
| | | | | | 1 Year | | | 5 Years | | | 10 Years | |
| | | 6-Month Total Returns | | | w/o sales charge | | | w/ sales charge | | | w/o sales charge | | | w/ sales charge | | | w/o sales charge | | | w/ sales charge | |
Institutional | | | 6.00 | % | | | 14.98 | % | | | N/A | | | | 16.57 | % | | | N/A | | | | 11.02 | % | | | N/A | |
Investor A | | | 5.86 | | | | 14.67 | | | | 8.65 | % | | | 16.17 | | | | 14.93 | % | | | 10.68 | | | | 10.08 | % |
Investor B | | | 5.45 | | | | 13.81 | | | | 9.31 | | | | 15.29 | | | | 15.06 | | | | 10.03 | | | | 10.03 | |
Investor C | | | 5.46 | | | | 13.79 | | | | 12.79 | | | | 15.31 | | | | 15.31 | | | | 9.88 | | | | 9.88 | |
S&P 500® Index | | | 12.51 | | | | 21.86 | | | | N/A | | | | 21.16 | | | | N/A | | | | 7.42 | | | | N/A | |
Wilshire 5000 Modified Energy Equal Weighted Index | | | 17.59 | | | | 25.57 | | | | N/A | | | | 28.11 | | | | N/A | | | | 15.83 | | | | N/A | |
MSCI World Small and Mid-Cap Energy Index | | | 4.97 | | | | 10.38 | | | | N/A | | | | 20.48 | | | | N/A | | | | 12.56 | | | | N/A | |
| | 6 | Assuming maximum sales charges, if any. Average annual total returns with and without sales charges reflect reductions for distribution and service fees. See “About Fund Performance” on page 10 for a detailed description of share classes, including any related sales charges and fees. |
| | | N/A—Not applicable as share class and index do not have a sales charge. |
| | | Past performance is not indicative of future results. |
| | | | | | | | | | | | | | |
| | | Actual | | Hypothetical8 | | |
| | | Beginning Account Value October 1, 2013 | | Ending Account Value March 31, 2014 | | Expenses Paid During the Period7 | | Beginning Account Value October 1, 2013 | | Ending Account Value March 31, 2014 | | Expenses Paid During the Period7 | | Annualized Expense Ratio |
Institutional | | $1,000.00 | | $1,060.00 | | $5.50 | | $1,000.00 | | $1,019.60 | | $5.39 | | 1.07% |
Investor A | | $1,000.00 | | $1,058.60 | | $6.83 | | $1,000.00 | | $1,018.30 | | $6.69 | | 1.33% |
Investor B | | $1,000.00 | | $1,054.50 | | $10.76 | | $1,000.00 | | $1,014.46 | | $10.55 | | 2.10% |
Investor C | | $1,000.00 | | $1,054.60 | | $10.76 | | $1,000.00 | | $1,014.46 | | $10.55 | | 2.10% |
| | 7 | For each class of the Fund, expenses are equal to the annualized expense ratio for the class, multiplied by the average account value over the period, multiplied by 182/365 (to reflect the one-half year period shown). |
| | 8 | Hypothetical 5% annual return before expenses is calculated by pro rating the number of days in the most recent fiscal half year divided by 365. |
| | | See “Disclosure of Expenses” on page 11 for further information on how expenses were calculated. |
| | | | | | |
| | | BLACKROCK FUNDS | | MARCH 31, 2014 | | 9 |
| Ÿ | | Institutional Shares are not subject to any sales charge. These shares bear no ongoing distribution or service fees and are available only to certain eligible investors. |
| Ÿ | | Service Shares are not subject to any sales charge (front-end load) or deferred sales charge. These shares are subject to a service fee of 0.25% per year (but no distribution fee) and are only available to eligible investors. |
| Ÿ | | Investor A Shares are subject to a maximum initial sales charge (front-end load) of 5.25% and a service fee of 0.25% per year (but no distribution fee). Certain redemptions of these shares may be subject to a contingent deferred sales charge (“CDSC”) where no initial sales charge was paid at the time of purchase. |
| Ÿ | | Investor B Shares are subject to a maximum CDSC of 4.50% declining to 0% after six years. In addition, these shares are subject to a distribution fee of 0.75% per year and a service fee of 0.25% per year. These shares automatically convert to Investor A Shares after approximately eight years. (There is no initial sales charge for automatic share conversions.) All returns for periods greater than eight years reflect this conversion. These shares are only available through exchanges and dividend reinvestments by existing shareholders and for purchase by certain employer-sponsored retirement plans. |
| Ÿ | | Investor C Shares are subject to a 1.00% CDSC if redeemed within one year of purchase. In addition, these shares are subject to a distribution fee of 0.75% per year and a service fee of 0.25% per year. |
Performance information reflects past performance and does not guarantee future results. Current performance may be lower or higher than the
performance data quoted. Refer to www.blackrock.com/funds to obtain performance data current to the most recent month end. Performance results do not reflect the deduction of taxes that a shareholder would pay on Fund distributions or the redemption of Fund shares. Figures shown in each of the performance tables on the previous pages assume reinvestment of all dividends and distributions, if any, at net asset value (“NAV”) on the ex-dividend/payable dates. Investment return and principal value of shares will fluctuate so that shares, when redeemed, may be worth more or less than their original cost. Dividends paid to each class of shares will vary because of the different levels of service, distribution and transfer agency fees applicable to each class, which are deducted from the income available to be paid to shareholders.
Performance for the BlackRock Energy & Resources Portfolio for the periods prior to January 28, 2005 is based on performance of a certain former State Street Research mutual fund that reorganized with BlackRock Energy & Resources Portfolio on that date.
BlackRock Advisors, LLC (the “Manager”), the Funds’ investment advisor, waived and/or reimbursed a portion of each Fund’s expenses. Without such waiver and/or reimbursement, each Fund’s performance would have been lower. The Manager is under no obligation to waive or reimburse or to continue waiving or reimbursing its fees after the applicable termination date. See Note 5 of the Notes to Financial Statements for additional information on waivers and reimbursements.
| | | | | | |
| 10 | | BLACKROCK FUNDS | | MARCH 31, 2014 | | |
Shareholders of the Funds may incur the following charges: (a) transactional expenses, such as sales charges; and (b) operating expenses, including investment advisory fees, administration fees, service and distribution fees, including 12b-1 fees, acquired fund fees and expenses and other Fund expenses. The expense examples on the previous pages (which are based on a hypothetical investment of $1,000 invested on October 1, 2013 and held through March 31, 2014) are intended to assist shareholders both in calculating expenses based on an investment in each Fund and in comparing these expenses with similar costs of investing in other mutual funds.
The expense examples provide information about actual account values and actual expenses. In order to estimate the expenses a shareholder paid during the period covered by this report, shareholders can divide their account value by $1,000 and then multiply the result by the number corresponding to their Fund and share class under the headings entitled “Expenses Paid During the Period.”
The expense examples also provide information about hypothetical account values and hypothetical expenses based on a Fund’s actual expense ratio and an assumed rate of return of 5% per year before expenses. In order to assist shareholders in comparing the ongoing expenses of investing in these Funds and other funds, compare the 5% hypothetical examples with the 5% hypothetical examples that appear in other funds’ shareholder reports.
The expenses shown in the expense examples are intended to highlight shareholders’ ongoing costs only and do not reflect any transactional expenses, such as sales charges, if any. Therefore, the hypothetical examples are useful in comparing ongoing expenses only, and will not help shareholders determine the relative total expenses of owning different funds. If these transactional expenses were included, shareholder expenses would have been higher.
|
| Derivative Financial Instruments |
The Funds may invest in various derivative financial instruments, including forward foreign currency exchange contracts, as specified in Note 4 of the Notes to Financial Statements, which may constitute forms of economic leverage. Such derivative financial instruments are used to obtain exposure to a security, index and/or market without owning or taking physical custody of securities or to hedge market and/or foreign currency exchange rate risks. Derivative financial instruments involve risks, including the imperfect correlation between the value of a derivative financial instrument and the underlying asset, possible default of the counterparty to the transaction or illiquidity of the derivative financial instrument. The Funds’ ability to use a derivative financial instrument
successfully depends on the investment advisor’s ability to predict pertinent market movements accurately, which cannot be assured. The use of derivative financial instruments may result in losses greater than if they had not been used, may require a Fund to sell or purchase portfolio investments at inopportune times or for distressed values, may limit the amount of appreciation a Fund can realize on an investment, may result in lower dividends paid to shareholders and/or may cause a Fund to hold an investment that it might otherwise sell. The Funds’ investments in these instruments are discussed in detail in the Notes to Financial Statements.
| | | | | | |
| | | BLACKROCK FUNDS | | MARCH 31, 2014 | | 11 |
| | | | |
| Schedule of Investments March 31, 2014 (Unaudited) | | | BlackRock All-Cap Energy & Resources Portfolio | |
| | | (Percentages shown are based on Net Assets) | |
| | | | | | | | |
| Common Stocks | | Shares | | | Value | |
Energy Equipment & Services — 9.0% | | | | | | | | |
Cameron International Corp. (a) | | | 57,688 | | | $ | 3,563,388 | |
Halliburton Co. | | | 84,600 | | | | 4,982,094 | |
Schlumberger Ltd. | | | 103,941 | | | | 10,134,247 | |
| | | | | | | | |
| | | | | | | | 18,679,729 | |
Oil, Gas & Consumable Fuels — 89.0% | | | | | | | | |
Anadarko Petroleum Corp. | | | 112,500 | | | | 9,535,500 | |
BG Group PLC | | | 338,900 | | | | 6,326,988 | |
BP PLC | | | 1,251,235 | | | | 10,053,675 | |
Cairn Energy PLC (a) | | | 509,200 | | | | 1,417,997 | |
Canadian Oil Sands Ltd. | | | 81,704 | | | | 1,713,899 | |
Caracal Energy, Inc. (a) | | | 282,000 | | | | 1,631,362 | |
Chevron Corp. | | | 178,598 | | | | 21,237,089 | |
Cimarex Energy Co. | | | 46,000 | | | | 5,479,060 | |
ConocoPhillips | | | 189,700 | | | | 13,345,395 | |
CONSOL Energy, Inc. | | | 62,530 | | | | 2,498,073 | |
Devon Energy Corp. | | | 44,000 | | | | 2,944,920 | |
Enbridge, Inc. | | | 62,500 | | | | 2,838,648 | |
EOG Resources, Inc. | | | 40,770 | | | | 7,997,851 | |
Exxon Mobil Corp. | | | 205,700 | | | | 20,092,776 | |
Imperial Oil Ltd. | | | 54,000 | | | | 2,514,627 | |
Kosmos Energy Ltd. (a) | | | 225,314 | | | | 2,478,454 | |
Murphy Oil Corp. | | | 33,500 | | | | 2,105,810 | |
Noble Energy, Inc. | | | 125,400 | | | | 8,908,416 | |
Oil Search Ltd. | | | 616,287 | | | | 4,837,476 | |
| | | | | | | | |
| Common Stocks | | Shares | | | Value | |
Oil, Gas & Consumable Fuels (concluded) | | | | | | | | |
Phillips 66 | | | 55,200 | | | $ | 4,253,712 | |
Pioneer Natural Resources Co. | | | 11,100 | | | | 2,077,254 | |
Range Resources Corp. | | | 59,700 | | | | 4,953,309 | |
Royal Dutch Shell PLC — ADR | | | 258,300 | | | | 18,871,398 | |
Southwestern Energy Co. (a) | | | 142,900 | | | | 6,574,829 | |
Statoil ASA | | | 242,612 | | | | 6,845,230 | |
Total SA | | | 95,000 | | | | 6,253,369 | |
TransCanada Corp. | | | 138,900 | | | | 6,313,636 | |
| | | | | | | | |
| | | | | | | | 184,100,753 | |
Total Long-Term Investments (Cost — $165,453,327) — 98.0% | | | | 202,780,482 | |
| | | | | | | | |
| Short-Term Securities | | | | | | |
BlackRock Liquidity Funds, TempFund, Institutional Class, 0.03% (b)(c) | | | 4,560,360 | | | | 4,560,360 | |
Total Short-Term Securities (Cost — $4,560,360) — 2.2% | | | | 4,560,360 | |
Total Investments (Cost — $170,013,687) — 100.2% | | | | | | | 207,340,842 | |
Liabilities in Excess of Other Assets — (0.2)% | | | | | | | (385,245 | ) |
| | | | | | | | |
Net Assets — 100.0% | | | | | | $ | 206,955,597 | |
| | | | | | | | |
|
| Notes to Schedule of Investments |
| (a) | Non-income producing security. |
| (b) | Investments in issuers considered to be an affiliate of the Fund during the six months ended March 31, 2014, for purposes of Section 2(a)(3) of the Investment Company Act of 1940, as amended, were as follows: |
| | | | | | | | | | | | | | | | |
| Affiliate | | Shares/Beneficial Interest Held at
September 30, 2013 | | | Net Activity | | | Shares/Beneficial Interest Held at March 31, 2014 | | | Income | |
BlackRock Liquidity Funds, TempFund, Institutional Class | | | 6,884,032 | | | | (2,323,672 | ) | | | 4,560,360 | | | $ | 1,094 | |
BlackRock Liquidity Series, LLC, Money Market Series | | $ | 4,708,251 | | | $ | (4,708,251 | ) | | | — | | | $ | 945 | |
|
| (c) Represents the current yield as of report date. |
| | | | |
| Portfolio Abbreviations |
ADR American Depositary Receipts | | MXN Mexican Peso | | PLN Polish Zloty |
CLP Chilean Peso | | NVDR Non-Voting Depository Receipts | | USD U.S. Dollar |
GDR Global Depositary Receipts | | | | |
See Notes to Financial Statements.
| | | | | | |
| 12 | | BLACKROCK FUNDS | | MARCH 31, 2014 | | |
| | | | |
| Schedule of Investments (concluded) | | | BlackRock All-Cap Energy & Resources Portfolio | |
| Ÿ | | For Fund compliance purposes, the Fund’s industry classifications refer to any one or more of the industry sub-classifications used by one or more widely recognized market indexes or ratings group indexes, and/or as defined by the investment advisor. These definitions may not apply for purposes of this report, which may combine such industry sub-classifications for reporting ease. |
| Ÿ | | Fair Value Measurements — Various inputs are used in determining the fair value of investments. These inputs to valuation techniques are categorized into a disclosure hierarchy consisting of three broad levels for financial statement purposes as follows: |
| | Ÿ | | Level 1 — unadjusted price quotations in active markets/exchanges for identical assets or liabilities that the Fund has the ability to access |
| | Ÿ | | Level 2 — other observable inputs (including, but not limited to, quoted prices for similar assets or liabilities in markets that are active, quoted prices for identical or similar assets or liabilities in markets that are not active, inputs other than quoted prices that are observable for the assets or liabilities (such as interest rates, yield curves, volatilities, prepayment speeds, loss severities, credit risks and default rates) or other market–corroborated inputs) |
| | Ÿ | | Level 3 — unobservable inputs based on the best information available in the circumstances, to the extent observable inputs are not available (including the Fund’s own assumptions used in determining the fair value of investments) |
The hierarchy gives the highest priority to unadjusted quoted prices in active markets for identical assets or liabilities (Level 1 measurements) and the lowest priority to unobservable inputs (Level 3 measurements). Accordingly, the degree of judgment exercised in determining fair value is greatest for instruments categorized in Level 3. The inputs used to measure fair value may fall into different levels of the fair value hierarchy. In such cases, for disclosure purposes, the fair value hierarchy classification is determined based on the lowest level input that is significant to the fair value measurement in its entirety.
Changes in valuation techniques may result in transfers into or out of an assigned level within the disclosure hierarchy. In accordance with the Fund’s policy, transfers between different levels of the fair value disclosure hierarchy are deemed to have occurred as of the beginning of the reporting period. The categorization of a value determined for investments is based on the pricing transparency of the investment and is not necessarily an indication of the risks associated with investing in those securities. For information about the Fund’s policy regarding valuation of investments, please refer to Note 2 of the Notes to Financial Statements.
The following table summarizes the Fund’s investments categorized in the disclosure hierarchy as of March 31, 2014:
| | | | | | | | | | | | | | | | |
| | | Level 1 | | | Level 2 | | | Level 3 | | | Total | |
Assets: | | | | | | | | | | | | | | | | |
Investments: | | | | | | | | | | | | | | | | |
Long-Term Investments: | | | | | | | | | | | | | | | | |
Common Stocks: | | | | | | | | | | | | | | | | |
Energy Equipment & Services | | $ | 18,679,729 | | | | — | | | | — | | | $ | 18,679,729 | |
Oil, Gas & Consumable Fuels | | | 148,366,018 | | | $ | 35,734,735 | | | | — | | | | 184,100,753 | |
Short-Term Securities | | | 4,560,360 | | | | — | | | | — | | | | 4,560,360 | |
Total | | $ | 171,606,107 | | | $ | 35,734,735 | | | | — | | | $ | 207,340,842 | |
| | | | |
The carrying amount for certain of the Fund’s assets approximates fair value for financial statement purposes. As of March 31, 2014, foreign currency at value of $223,722 is categorized as Level 1 within the disclosure hierarchy.
There were no transfers between levels during the six months ended March 31, 2014.
See Notes to Financial Statements.
| | | | | | |
| | | BLACKROCK FUNDS | | MARCH 31, 2014 | | 13 |
| | | | |
| Schedule of Investments March 31, 2014 (Unaudited) | | | BlackRock Emerging Markets Dividend Fund | |
| | | (Percentages shown are based on Net Assets) | |
| | | | | | | | |
| Common Stocks | | Shares | | | Value | |
Brazil — 14.0% | | | | | | | | |
Ambev SA — ADR (a) | | | 9,441 | | | $ | 69,958 | |
BB Seguridade Participacoes SA | | | 8,732 | | | | 95,863 | |
CCR SA | | | 19,410 | | | | 147,906 | |
EDP — Energias do Brasil SA | | | 4,894 | | | | 21,979 | |
Itau Unibanco Holding SA — ADR | | | 9,579 | | | | 142,344 | |
Mahle-Metal Leve SA Industria e Comercio | | | 3,841 | | | | 40,374 | |
Marcopolo SA, Preference | | | 10,361 | | | | 20,777 | |
Vale SA — ADR | | | 5,252 | | | | 72,635 | |
Vale SA, Preference — ADR | | | 3,532 | | | | 43,973 | |
| | | | | | | | |
| | | | | | | | 655,809 | |
Cambodia — 0.9% | | | | | | | | |
NagaCorp Ltd. | | | 42,000 | | | | 43,847 | |
Chile — 1.6% | | | | | | | | |
Banco de Chile — ADR | | | 669 | | | | 50,362 | |
Cia Cervecerias Unidas SA — ADR | | | 1,173 | | | | 26,252 | |
| | | | | | | | |
| | | | | | | | 76,614 | |
China — 14.8% | | | | | | | | |
Bank of China Ltd., H Shares | | | 55,000 | | | | 24,435 | |
Beijing Capital International Airport Co. Ltd., H Shares | | | 66,000 | | | | 45,429 | |
China Hongqiao Group Ltd. | | | 134,000 | | | | 84,793 | |
China Merchants Holdings International Co. Ltd. | | | 30,000 | | | | 103,436 | |
China Petroleum & Chemical Corp., H Shares | | | 149,000 | | | | 133,275 | |
Great Wall Motor Co. Ltd., H Shares | | | 4,500 | | | | 22,670 | |
Hengan International Group Co. Ltd. | | | 6,500 | | | | 67,480 | |
Jiangsu Expressway Co. Ltd., H Shares | | | 66,000 | | | | 75,242 | |
Sands China Ltd. | | | 8,400 | | | | 62,999 | |
Want Want China Holdings Ltd. | | | 33,000 | | | | 49,372 | |
Yashili International Holdings Ltd. | | | 51,000 | | | | 23,057 | |
| | | | | | | | |
| | | | | | | | 692,188 | |
Cyprus — 0.7% | | | | | | | | |
Globaltrans Investment PLC — GDR | | | 2,905 | | | | 33,524 | |
Czech Republic — 1.0% | | | | | | | | |
Komercni Banka AS | | | 201 | | | | 48,030 | |
India — 2.1% | | | | | | | | |
Infosys Ltd. — ADR | | | 1,279 | | | | 69,296 | |
Tata Motors Ltd. — ADR | | | 761 | | | | 26,947 | |
| | | | | | | | |
| | | | | | | | 96,243 | |
Indonesia — 2.6% | | | | | | | | |
Bank Central Asia Tbk PT | | | 62,801 | | | | 58,983 | |
Media Nusantara Citra Tbk PT | | | 159,500 | | | | 37,281 | |
Semen Indonesia Persero Tbk PT | | | 16,728 | | | | 23,515 | |
| | | | | | | | |
| | | | | | | | 119,779 | |
Ireland — 1.1% | | | | | | | | |
Dragon Oil PLC | | | 5,396 | | | | 50,961 | |
Kazakhstan — 0.4% | | | | | | | | |
Kcell JSC — GDR | | | 1,523 | | | | 20,865 | |
Malaysia — 1.6% | | | | | | | | |
DiGi.Com Bhd | | | 45,600 | | | | 75,330 | |
Mexico — 10.0% | | | | | | | | |
Bolsa Mexicana de Valores SAB de CV | | | 23,508 | | | | 46,420 | |
Fibra Uno Administracion SA de CV | | | 13,858 | | | | 44,836 | |
| | | | | | | | |
| Common Stocks | | Shares | | | Value | |
Mexico (concluded) | | | | | | | | |
Fomento Economico Mexicano SAB de CV — ADR | | | 343 | | | $ | 31,981 | |
Grupo Aeroportuario del Pacifico SAB de CV, Class B | | | 12,853 | | | | 75,254 | |
Grupo Aeroportuario del Sureste SAB de CV — ADR | | | 397 | | | | 48,688 | |
Grupo Financiero Santander Mexico SAB de CV,
Class B — ADR | | | 3,534 | | | | 43,433 | |
Kimberly-Clark de Mexico SAB de CV, Class A | | | 43,786 | | | | 116,881 | |
Mexico Real Estate Management SA de CV | | | 31,780 | | | | 59,931 | |
| | | | | | | | |
| | | | | | | | 467,424 | |
Peru — 1.6% | | | | | | | | |
Credicorp Ltd. | | | 558 | | | | 76,959 | |
Philippines — 4.9% | | | | | | | | |
Alliance Global Group, Inc. | | | 64,100 | | | | 40,834 | |
Philippine Long Distance Telephone Co. | | | 375 | | | | 22,828 | |
Philippine Long Distance Telephone Co. — ADR | | | 1,892 | | | | 115,450 | |
Robinsons Land Corp. | | | 101,700 | | | | 49,803 | |
| | | | | | | | |
| | | | | | | | 228,915 | |
Poland — 3.3% | | | | | | | | |
Powszechny Zaklad Ubezpieczen SA | | | 1,084 | | | | 154,038 | |
Portugal — 0.9% | | | | | | | | |
Jeronimo Martins SGPS SA | | | 2,519 | | | | 42,271 | |
Russia — 5.1% | | | | | | | | |
Lukoil OAO — ADR | | | 3,073 | | | | 171,858 | |
MMC Norilsk Nickel OJSC — ADR | | | 2,644 | | | | 44,287 | |
Mobile Telesystems OJSC — ADR | | | 1,336 | | | | 23,367 | |
| | | | | | | | |
| | | | | | | | 239,512 | |
South Africa — 7.0% | | | | | | | | |
FirstRand Ltd. | | | 20,073 | | | | 68,825 | |
Life Healthcare Group Holdings Ltd. | | | 13,360 | | | | 48,815 | |
Mr. Price Group Ltd. | | | 4,313 | | | | 64,463 | |
Sanlam Ltd. | | | 16,685 | | | | 91,141 | |
Sasol Ltd. | | | 1,018 | | | | 56,932 | |
| | | | | | | | |
| | | | | | | | 330,176 | |
South Korea — 4.0% | | | | | | | | |
Grand Korea Leisure Co. Ltd. | | | 1,520 | | | | 62,657 | |
Hyundai Motor Co., Preference | | | 495 | | | | 63,314 | |
SK Telecom Co. Ltd. | | | 184 | | | | 37,341 | |
SK Telecom Co. Ltd. — ADR | | | 1,034 | | | | 23,337 | |
| | | | | | | | |
| | | | | | | | 186,649 | |
Taiwan — 11.3% | | | | | | | | |
Cleanaway Co. Ltd. | | | 5,000 | | | | 30,567 | |
Delta Electronics, Inc. | | | 11,000 | | | | 68,126 | |
Far EasTone Telecommunications Co. Ltd. | | | 43,000 | | | | 91,022 | |
Mega Financial Holding Co. Ltd. | | | 30,299 | | | | 23,514 | |
Quanta Computer, Inc. | | | 12,000 | | | | 32,354 | |
Taiwan Cement Corp. | | | 46,000 | | | | 71,148 | |
Taiwan Semiconductor Manufacturing Co. Ltd. | | | 4,000 | | | | 15,738 | |
Taiwan Semiconductor Manufacturing Co. Ltd. — ADR | | | 8,791 | | | | 175,996 | |
Tripod Technology Corp. | | | 12,000 | | | | 23,665 | |
| | | | | | | | |
| | | | | | | | 532,130 | |
See Notes to Financial Statements.
| | | | | | |
| 14 | | BLACKROCK FUNDS | | MARCH 31, 2014 | | |
| | | | |
| Schedule of Investments (continued) | | | BlackRock Emerging Markets Dividend Fund | |
| | | (Percentages shown are based on Net Assets) | |
| | | | | | | | |
| Common Stocks | | Shares | | | Value | |
Thailand — 5.1% | | | | | | | | |
Advanced Info Service PCL — NVDR | | | 6,600 | | | $ | 46,094 | |
Bangkok Expressway PCL — NVDR | | | 20,500 | | | | 20,885 | |
BEC World PCL — NVDR | | | 44,900 | | | | 75,577 | |
Kasikornbank PCL — NVDR | | | 14,400 | | | | 79,244 | |
Siam City Cement PCL — NVDR | | | 1,600 | | | | 17,107 | |
| | | | | | | | |
| | | | | | | | 238,907 | |
Turkey — 2.2% | | | | | | | | |
BIM Birlesik Magazalar AS | | | 2,453 | | | | 55,255 | |
Turk Traktor ve Ziraat Makineleri AS | | | 914 | | | | 23,492 | |
Turkiye Halk Bankasi AS | | | 4,228 | | | | 26,187 | |
| | | | | | | | |
| | | | | | | | 104,934 | |
Total Common Stocks — 96.2% | | | | | | | 4,515,105 | |
| | | | | | | | |
| Participation Notes (a) | | | | | | |
Qatar — 1.3% | | | | | | | | |
Deutsche Bank AG (Qatar Electricity & Water Co.),
due 4/14/17 | | | 1,277 | | | | 60,321 | |
| | | | | | | | |
| Participation Notes (a) | | Shares | | | Value | |
South Korea — 1.0% | | | | | | | | |
Deutsche Bank AG (Hyundai Motor & Finance Co.),
due 8/15/23 | | | 1,630 | | | $ | 47,011 | |
Total Participation Notes — 2.3% | | | | | | | 107,332 | |
Total Long-Term Investments (Cost — $4,504,594) — 98.5% | | | | 4,622,437 | |
| | | | | | | | |
| Short-Term Securities | | | | | | |
BlackRock Liquidity Funds, TempFund, Institutional
Class, 0.03% (b)(c) | | | 68,894 | | | | 68,894 | |
Total Short-Term Securities (Cost — $68,894) — 1.4% | | | | 68,894 | |
Total Investments (Cost — $4,573,488) — 99.9% | | | | | | | 4,691,331 | |
Other Assets Less Liabilities — 0.1% | | | | | | | 2,890 | |
| | | | | | | | |
Net Assets — 100.0% | | | | | | $ | 4,694,221 | |
| | | | | | | | |
|
| Notes to Schedule of Investments |
| (a) | Non-income producing security. |
| (b) | Investments in issuers considered to be an affiliate of the Fund during the six months ended March 31, 2014, for purposes of Section 2(a)(3) of the Investment Company Act of 1940, as amended, were as follows: |
| | | | | | | | | | | | | | | | |
| Affiliate | | Shares Held at
September 30, 2013 | | | Net Activity | | | Shares Held at
March 31, 2014 | | | Income | |
BlackRock Liquidity Funds, TempFund, Institutional Class | | | 68,511 | | | | 383 | | | | 68,894 | | | $ | 34 | |
| (c) | Represents the current yield as of report date. |
| Ÿ | | Forward foreign currency exchange contracts outstanding as of March 31, 2014 were as follows: |
| | | | | | | | | | | | | | | | | | | | | | |
Currency Purchased | | | Currency
Sold | | | Counterparty | | Settlement
Date | | | Unrealized
Appreciation
(Depreciation) | |
| MXN | | | 1,126,742 | | | | USD | | | | 84,649 | | | JPMorgan Chase Bank N.A. | | | 4/29/14 | | | $ | 1,462 | |
| MXN | | | 1,167,170 | | | | USD | | | | 87,738 | | | JPMorgan Chase Bank N.A. | | | 4/29/14 | | | | 1,463 | |
| PLN | | | 269,760 | | | | USD | | | | 87,246 | | | Citibank N.A. | | | 4/29/14 | | | | 1,800 | |
| PLN | | | 196,240 | | | | USD | | | | 64,455 | | | Deutsche Bank AG | | | 4/29/14 | | | | 322 | |
| USD | | | 170,548 | | | | MXN | | | | 2,293,912 | | | Citibank N.A. | | | 4/29/14 | | | | (4,765 | ) |
| USD | | | 148,801 | | | | PLN | | | | 466,000 | | | Morgan Stanley & Co. International PLC | | | 4/29/14 | | | | (5,022 | ) |
| USD | | | 43,250 | | | | CLP | | | | 24,267,577 | | | Citibank N.A. | | | 5/28/14 | | | | (734 | ) |
| USD | | | 853 | | | | CLP | | | | 478,641 | | | Citibank N.A. | | | 5/28/14 | | | | (14 | ) |
| Total | | | | | | | | | | | | | | | | | | | | $ | (5,488 | ) |
| | | | | | | | | | | | | | | | | | | | | | |
| Ÿ | | Fair Value Measurements — Various inputs are used in determining the fair value of investments and derivative financial instruments. These inputs to valuation techniques are categorized into a disclosure hierarchy consisting of three broad levels for financial statement purposes as follows: |
| | Ÿ | | Level 1 — unadjusted price quotations in active markets/exchanges for identical assets or liabilities that the Fund has the ability to access |
| | Ÿ | | Level 2 — other observable inputs (including, but not limited to, quoted prices for similar assets or liabilities in markets that are active, quoted prices for identical or similar |
See Notes to Financial Statements.
| | | | | | |
| | | BLACKROCK FUNDS | | MARCH 31, 2014 | | 15 |
| | | | |
| Schedule of Investments (continued) | | | BlackRock Emerging Markets Dividend Fund | |
| | assets or liabilities in markets that are not active, inputs other than quoted prices that are observable for the assets or liabilities (such as interest rates, yield curves, volatilities, prepayment speeds, loss severities, credit risks and default rates) or other market–corroborated inputs) |
| | Ÿ | | Level 3 — unobservable inputs based on the best information available in the circumstances, to the extent observable inputs are not available (including the Fund’s own assumptions used in determining the fair value of investments and derivative financial instruments) |
The hierarchy gives the highest priority to unadjusted quoted prices in active markets for identical assets or liabilities (Level 1 measurements) and the lowest priority to unobservable inputs (Level 3 measurements). Accordingly, the degree of judgment exercised in determining fair value is greatest for instruments categorized in Level 3. The inputs used to measure fair value may fall into different levels of the fair value hierarchy. In such cases, for disclosure purposes, the fair value hierarchy classification is determined based on the lowest level input that is significant to the fair value measurement in its entirety.
Changes in valuation techniques may result in transfers into or out of an assigned level within the disclosure hierarchy. In accordance with the Fund’s policy, transfers between different levels of the fair value disclosure hierarchy are deemed to have occurred as of the beginning of the reporting period. The categorization of a value determined for investments and derivative financial instruments is based on the pricing transparency of the investment and derivative financial instrument and is not necessarily an indication of the risks associated with investing in those securities. For information about the Fund’s policy regarding valuation of investments and derivative financial instruments, please refer to Note 2 of the Notes to Financial Statements.
The following tables summarize the Fund’s investments and derivative financial instruments categorized in the disclosure hierarchy as of March 31, 2014:
| | | | | | | | | | | | | | | | |
| | | Level 1 | | | Level 2 | | | Level 3 | | | Total | |
Assets: | | | | | | | | | | | | | | | | |
Investments: | | | | | | | | | | | | | | | | |
Long-Term Investments: | | | | | | | | | | | | | | | | |
Common Stocks: | | | | | | | | | | | | | | | | |
Brazil | | $ | 655,809 | | | | — | | | | — | | | $ | 655,809 | |
Cambodia | | | — | | | $ | 43,847 | | | | — | | | | 43,847 | |
Chile | | | 76,614 | | | | — | | | | — | | | | 76,614 | |
China | | | — | | | | 692,188 | | | | — | | | | 692,188 | |
Cyprus | | | 33,524 | | | | — | | | | — | | | | 33,524 | |
Czech Republic | | | — | | | | 48,030 | | | | — | | | | 48,030 | |
India | | | 96,243 | | | | — | | | | — | | | | 96,243 | |
Indonesia | | | — | | | | 119,779 | | | | — | | | | 119,779 | |
Ireland | | | — | | | | 50,961 | | | | — | | | | 50,961 | |
Kazakhstan | | | 20,865 | | | | — | | | | — | | | | 20,865 | |
Malaysia | | | — | | | | 75,330 | | | | — | | | | 75,330 | |
Mexico | | | 467,424 | | | | — | | | | — | | | | 467,424 | |
Peru | | | 76,959 | | | | — | | | | — | | | | 76,959 | |
Philippines | | | 115,450 | | | | 113,465 | | | | — | | | | 228,915 | |
Poland | | | — | | | | 154,038 | | | | — | | | | 154,038 | |
Portugal | | | — | | | | 42,271 | | | | — | | | | 42,271 | |
Russia | | | 239,512 | | | | — | | | | — | | | | 239,512 | |
South Africa | | | — | | | | 330,176 | | | | — | | | | 330,176 | |
South Korea | | | 23,337 | | | | 163,312 | | | | — | | | | 186,649 | |
Taiwan | | | 175,996 | | | | 356,134 | | | | — | | | | 532,130 | |
Thailand | | | — | | | | 238,907 | | | | — | | | | 238,907 | |
Turkey | | | — | | | | 104,934 | | | �� | — | | | | 104,934 | |
Participation Notes: | | | | | | | | | | | | | | | | |
Qatar | | | — | | | | 60,321 | | | | — | | | | 60,321 | |
South Korea | | | — | | | | 47,011 | | | | — | | | | 47,011 | |
Short-Term Securities | | | 68,894 | | | | — | | | | — | | | | 68,894 | |
Total | | $ | 2,050,627 | | | $ | 2,640,704 | | | | — | | | $ | 4,691,331 | |
| | | | |
See Notes to Financial Statements.
| | | | | | |
| 16 | | BLACKROCK FUNDS | | MARCH 31, 2014 | | |
| | | | |
| Schedule of Investments (concluded) | | | BlackRock Emerging Markets Dividend Fund | |
| | | | | | | | | | | | | | | | |
| | | Level 1 | | | Level 2 | | | Level 3 | | | Total | |
Derivative Financial Instruments1 | | | | | | | | | | | | | | | | |
Assets: | | | | | | | | | | | | | | | | |
Foreign currency exchange contracts | | | — | | | $ | 5,047 | | | | — | | | $ | 5,047 | |
Liabilities: | | | | | | | | | | | | | | | | |
Foreign currency exchange contracts | | | — | | | | (10,535 | ) | | | — | | | | (10,535 | ) |
Total | | | — | | | $ | (5,488 | ) | | | — | | | $ | (5,488 | ) |
| | | | |
1 Derivative financial instruments are forward foreign currency exchange contracts, which are valued at the unrealized appreciation/depreciation on the instrument. | |
|
| The carrying amount for certain of the Fund’s assets approximates fair value for financial statement purposes. As of March 31, 2014, such assets are categorized within the disclosure hierarchy as follows: | |
| | | | | | | | | | | | | | | | |
| | | Level 1 | | | Level 2 | | | Level 3 | | | Total | |
Assets: | | | | | | | | | | | | | | | | |
Cash | | $ | 14,000 | | | | — | | | | — | | | $ | 14,000 | |
Foreign currency at value | | | 3,860 | | | | — | | | | — | | | | 3,860 | |
Total | | $ | 17,860 | | | | — | | | | — | | | $ | 17,860 | |
| | | | |
There were no transfers between levels during the six months ended March 31, 2014.
See Notes to Financial Statements.
| | | | | | |
| | | BLACKROCK FUNDS | | MARCH 31, 2014 | | 17 |
| | | | |
| Schedule of Investments March 31, 2014 (Unaudited) | | | BlackRock Energy & Resources Portfolio | |
| | | (Percentages shown are based on Net Assets) | |
| | | | | | | | |
| Common Stocks | | Shares | | | Value | |
Commercial Services & Supplies — 0.0% | | | | | | | | |
Republic Resources, Inc. (Acquired 7/18/97 to 2/24/99, cost $779,869) (a)(b) | | | 28,750 | | | | — | |
Construction & Engineering — 5.8% | | | | | | | | |
Foster Wheeler AG (b) | | | 600,000 | | | $ | 19,452,000 | |
KBR, Inc. | | | 544,000 | | | | 14,513,920 | |
| | | | | | | | |
| | | | | | | | 33,965,920 | |
Energy Equipment & Services — 11.7% | | | | | | | | |
Cameron International Corp. (b) | | | 330,000 | | | | 20,384,100 | |
Helmerich & Payne, Inc. | | | 240,000 | | | | 25,814,400 | |
Poseidon Concepts Corp. (b) | | | 35,081 | | | | 18 | |
Superior Energy Services, Inc. | | | 738,257 | | | | 22,708,785 | |
| | | | | | | | |
| | | | | | | | 68,907,303 | |
Machinery — 0.0% | | | | | | | | |
Railpower Technologies Corp. (Acquired 4/26/04 to 6/17/04, cost $1,010,377) (a)(b) | | | 360,600 | | | | — | |
Oil, Gas & Consumable Fuels — 82.1% | | | | | | | | |
AltaGas Ltd. | | | 506,500 | | | | 20,754,817 | |
Arch Coal, Inc. | | | 1,384,800 | | | | 6,674,736 | |
Bellatrix Exploration Ltd. (b) | | | 862,632 | | | | 7,295,892 | |
Cabot Oil & Gas Corp. | | | 429,400 | | | | 14,548,072 | |
Cairn Energy PLC (b) | | | 3,247,000 | | | | 9,042,096 | |
Canadian Oil Sands Ltd. | | | 900,000 | | | | 18,879,240 | |
Caracal Energy, Inc. (b) | | | 1,173,200 | | | | 6,786,930 | |
Carrizo Oil & Gas, Inc. (b) | | | 301,500 | | | | 16,118,190 | |
Cimarex Energy Co. | | | 235,010 | | | | 27,992,041 | |
CONSOL Energy, Inc. | | | 689,200 | | | | 27,533,540 | |
Crocotta Energy, Inc. (b) | | | 2,268,300 | | | | 6,955,710 | |
Denbury Resources, Inc. | | | 887,338 | | | | 14,552,343 | |
EnQuest PLC (b) | | | 5,414,000 | | | | 11,199,018 | |
EOG Resources, Inc. | | | 118,400 | | | | 23,226,528 | |
EQT Corp. | | | 171,744 | | | | 16,654,016 | |
Gulfport Energy Corp. (b) | | | 126,135 | | | | 8,978,289 | |
Ithaca Energy, Inc. (b) | | | 5,071,000 | | | | 12,614,428 | |
Kosmos Energy Ltd. (b) | | | 1,761,588 | | | | 19,377,468 | |
Longview Energy Co. (Acquired 8/13/04,
cost $1,281,000) (a)(b) | | | 85,400 | | | | 727,608 | |
Murphy Oil Corp. | | | 190,000 | | | | 11,943,400 | |
Noble Energy, Inc. | | | 272,000 | | | | 19,322,880 | |
| | | | | | | | |
| Common Stocks | | Shares | | | Value | |
Oil, Gas & Consumable Fuels (concluded) | | | | | | | | |
Oil Search Ltd. | | | 2,400,000 | | | $ | 18,838,531 | |
Painted Pony Petroleum Ltd. (b) | | | 1,970,000 | | | | 15,931,072 | |
PDC Energy, Inc. (b) | | | 203,800 | | | | 12,688,588 | |
Pioneer Natural Resources Co. | | | 108,337 | | | | 20,274,186 | |
Range Resources Corp. | | | 187,640 | | | | 15,568,491 | |
Rex Energy Corp. (b) | | | 379,600 | | | | 7,102,316 | |
Rosetta Resources, Inc. (b) | | | 373,400 | | | | 17,392,972 | |
RSP Permian, Inc. (b) | | | 317,842 | | | | 9,182,455 | |
SM Energy Co. | | | 210,000 | | | | 14,970,900 | |
Southwestern Energy Co. (b) | | | 507,500 | | | | 23,350,075 | |
Stone Energy Corp. (b) | | | 375,538 | | | | 15,761,330 | |
Tourmaline Oil Corp. (b) | | | 154,420 | | | | 7,299,855 | |
TransGlobe Energy Corp. (b) | | | 690,000 | | | | 5,261,601 | |
| | | | | | | | |
| | | | | | | | 484,799,614 | |
Total Common Stocks — 99.6% | | | | | | | 587,672,837 | |
| | | | | | | | |
| Warrants (c) | | | | | | |
Oil, Gas & Consumable Fuels — 0.0% | | | | | | | | |
Magnum Hunter Resources Corp. (Issued/Exercisable 10/15/13, 1 Share for 1 Warrant, Expires 4/15/16, Strike Price USD 8.50) | | | 235,700 | | | | 2 | |
Total Warrants — 0.0% | | | | | | | 2 | |
Total Long-Term Investments (Cost — $451,474,985) — 99.6% | | | | 587,672,839 | |
| | | | | | | | |
| Short-Term Securities | | | | | | |
BlackRock Liquidity Funds, TempFund, Institutional
Class, 0.03% (d)(e) | | | 4,401,608 | | | | 4,401,608 | |
Total Short-Term Securities (Cost — $4,401,608) — 0.7% | | | | 4,401,608 | |
Total Investments (Cost — $455,876,593) — 100.3% | | | | | | | 592,074,447 | |
Liabilities in Excess of Other Assets — (0.3)% | | | | | | | (1,863,820 | ) |
| | | | | | | | |
Net Assets — 100.0% | | | | | | $ | 590,210,627 | |
| | | | | | | | |
|
| Notes to Schedule of Investments |
| (a) | Restricted security as to resale. As of report date, the Fund held restricted securities with a current value of $727,608 and an original cost of $3,071,246, which was 0.2% of its net assets. |
| (b) | Non-income producing security. |
| (c) | Warrants entitle the Fund to purchase a predetermined number of shares of common stock and are non-income producing. The purchase price and number of shares are subject to adjustment under certain conditions until the expiration date of the warrants, if any. |
| (d) | Investments in issuers considered to be an affiliate of the Fund during the six months ended March 31, 2014, for purposes of Section 2(a)(3) of the Investment Company Act of 1940, as amended, were as follows: |
| | | | | | | | | | | | | | | | |
| Affiliate | | Shares Held at
September 30, 2013 | | | Net Activity | | | Shares Held at
March 31, 2014 | | | Income | |
BlackRock Liquidity Funds, TempFund, Institutional Class | | | 14,345,070 | | | | (9,943,462 | ) | | | 4,401,608 | | | $ | 5,428 | |
| | | | | | | | |
(e) Represents the current yield as of report date. |
See Notes to Financial Statements.
| | | | | | |
| 18 | | BLACKROCK FUNDS | | MARCH 31, 2014 | | |
| | | | |
| Schedule of Investments (concluded) | | | BlackRock Energy & Resources Portfolio | |
| Ÿ | | For Fund compliance purposes, the Fund’s industry classifications refer to any one or more of the industry sub-classifications used by one or more widely recognized market indexes or ratings group indexes, and/or as defined by the investment advisor. These definitions may not apply for purposes of this report, which may combine such industry sub-classifications for reporting ease. |
| Ÿ | | Fair Value Measurements — Various inputs are used in determining the fair value of investments. These inputs to valuation techniques are categorized into a disclosure hierarchy consisting of three broad levels for financial statement purposes as follows: |
| | Ÿ | | Level 1 — unadjusted price quotations in active markets/exchanges for identical assets or liabilities that the Fund has the ability to access |
| | Ÿ | | Level 2 — other observable inputs (including, but not limited to, quoted prices for similar assets or liabilities in markets that are active, quoted prices for identical or similar assets or liabilities in markets that are not active, inputs other than quoted prices that are observable for the assets or liabilities (such as interest rates, yield curves, volatilities, prepayment speeds, loss severities, credit risks and default rates) or other market–corroborated inputs) |
| | Ÿ | | Level 3 — unobservable inputs based on the best information available in the circumstances, to the extent observable inputs are not available (including the Fund’s own assumptions used in determining the fair value of investments) |
The hierarchy gives the highest priority to unadjusted quoted prices in active markets for identical assets or liabilities (Level 1 measurements) and the lowest priority to unobservable inputs (Level 3 measurements). Accordingly, the degree of judgment exercised in determining fair value is greatest for instruments categorized in Level 3. The inputs used to measure fair value may fall into different levels of the fair value hierarchy. In such cases, for disclosure purposes, the fair value hierarchy classification is determined based on the lowest level input that is significant to the fair value measurement in its entirety.
Changes in valuation techniques may result in transfers into or out of an assigned level within the disclosure hierarchy. In accordance with the Fund’s policy, transfers between different levels of the fair value disclosure hierarchy are deemed to have occurred as of the beginning of the reporting period. The categorization of a value determined for investments is based on the pricing transparency of the investment and is not necessarily an indication of the risks associated with investing in those securities. For information about the Fund’s policy regarding valuation of investments, please refer to Note 2 of the Notes to Financial Statements.
The following table summarizes the Fund’s investments categorized in the disclosure hierarchy as of March 31, 2014:
| | | | | | | | | | | | | | | | |
| | | Level 1 | | | Level 2 | | | Level 3 | | | Total | |
Assets: | | | | | | | | | | | | | | | | |
Investments: | | | | | | | | | | | | | | | | |
Long-Term Investments: | | | | | | | | | | | | | | | | |
Common Stocks: | | | | | | | | | | | | | | | | |
Construction & Engineering | | $ | 33,965,920 | | | | — | | | | — | | | $ | 33,965,920 | |
Energy Equipment & Services | | | 68,907,303 | | | | — | | | | — | | | | 68,907,303 | |
Oil, Gas & Consumable Fuels | | | 444,992,361 | | | $ | 39,079,645 | | | $ | 727,608 | | | | 484,799,614 | |
Warrants | | | 2 | | | | — | | | | — | | | | 2 | |
Short-Term Securities | | | 4,401,608 | | | | — | | | | — | | | | 4,401,608 | |
Total | | $ | 552,267,194 | | | $ | 39,079,645 | | | $ | 727,608 | | | $ | 592,074,447 | |
| | | | |
There were no transfers between levels during the six months ended March 31, 2014.
See Notes to Financial Statements.
| | | | | | |
| | | BLACKROCK FUNDS | | MARCH 31, 2014 | | 19 |
| | |
| Statements of Assets and Liabilities | | |
| | | | | | | | | | | | |
| March 31, 2014 (Unaudited) | | BlackRock All-Cap Energy & Resources
Portfolio | | | BlackRock Emerging Markets Dividend Fund | | | BlackRock Energy & Resources Portfolio | |
| | | | | | | | | | | | |
| Assets | | | | | | | | | | | | |
Investments at value — unaffiliated1 | | $ | 202,780,482 | | | $ | 4,622,437 | | | $ | 587,672,839 | |
Investments at value — affiliated2 | | | 4,560,360 | | | | 68,894 | | | | 4,401,608 | |
Cash | | | — | | | | 14,000 | | | | — | |
Foreign currency at value3 | | | 223,722 | | | | 3,860 | | | | — | |
Investments sold receivable | | | — | | | | 44,462 | | | | — | |
Unrealized appreciation on forward foreign currency exchange contracts | | | — | | | | 5,047 | | | | — | |
Capital shares sold receivable | | | 132,426 | | | | 31 | | | | 367,640 | |
Dividends receivable — unaffiliated | | | 111,461 | | | | 15,977 | | | | 147,302 | |
Dividends receivable — affiliated | | | 96 | | | | 4 | | | | 262 | |
Receivable from Manager | | | 1,846 | | | | 20,885 | | | | 585 | |
Prepaid expenses | | | 45,110 | | | | 31,516 | | | | 39,244 | |
| | | | |
Total assets | | | 207,855,503 | | | | 4,827,113 | | | | 592,629,480 | |
| | | | |
| | | | | | | | | | | | |
| Liabilities | | | | | | | | | | | | |
Investments purchased payable | | | — | | | | 92,822 | | | | — | |
Unrealized depreciation on forward foreign currency exchange contracts | | | — | | | | 10,535 | | | | — | |
Capital shares redeemed payable | | | 431,914 | | | | — | | | | 1,268,033 | |
Transfer agent fees payable | | | 156,254 | | | | 897 | | | | 390,242 | |
Investment advisory fees payable | | | 130,731 | | | | — | | | | 382,398 | |
Service and distribution fees payable | | | 81,981 | | | | 654 | | | | 169,082 | |
Professional fees payable | | | 29,242 | | | | 17,687 | | | | 35,772 | |
Other affiliates payable | | | 22,285 | | | | — | | | | 73,888 | |
Officer’s and Trustees’ fees payable | | | 2,595 | | | | 396 | | | | 5,434 | |
Other accrued expenses payable | | | 44,904 | | | | 9,901 | | | | 94,004 | |
| | | | |
Total liabilities | | | 899,906 | | | | 132,892 | | | | 2,418,853 | |
| | | | |
Net Assets | | $ | 206,955,597 | | | $ | 4,694,221 | | | $ | 590,210,627 | |
| | | | |
| | | | | | | | | | | | |
| Net Assets Consist of | | | | | | | | | | | | |
Paid-in capital | | $ | 229,614,429 | | | $ | 5,183,319 | | | $ | 562,395,431 | |
Undistributed (distributions in excess of) net investment income (loss) | | | (27,557 | ) | | | 1,975 | | | | (10,605,199 | ) |
Accumulated net realized loss | | | (59,958,781 | ) | | | (603,427 | ) | | | (97,779,143 | ) |
Net unrealized appreciation/depreciation | | | 37,327,506 | | | | 112,354 | | | | 136,199,538 | |
| | | | |
Net Assets | | $ | 206,955,597 | | | $ | 4,694,221 | | | $ | 590,210,627 | |
| | | | |
1 Investments at cost — unaffiliated | | $ | 165,453,327 | | | $ | 4,504,594 | | | $ | 451,474,985 | |
2 Investments at cost — affiliated | | $ | 4,560,360 | | | $ | 68,894 | | | $ | 4,401,608 | |
3 Foreign currency at cost | | $ | 223,674 | | | $ | 3,853 | | | | — | |
See Notes to Financial Statements.
| | | | | | |
| 20 | | BLACKROCK FUNDS | | MARCH 31, 2014 | | |
| | |
| Statements of Assets and Liabilities (concluded) | | |
| | | | | | | | | | | | |
| March 31, 2014 (Unaudited) | | BlackRock
All-Cap Energy &
Resources
Portfolio | | | BlackRock
Emerging
Markets
Dividend
Fund | | | BlackRock
Energy &
Resources
Portfolio | |
| | | | | | | | | | | | |
| Net Asset Value | | | | | | | | | | | | |
Institutional | | | | | | | | | | | | |
Net assets | | $ | 34,919,506 | | | $ | 2,684,370 | | | $ | 93,194,472 | |
| | | | |
Shares outstanding1 | | | 2,194,031 | | | | 309,629 | | | | 2,353,233 | |
| | | | |
Net asset value | | $ | 15.92 | | | $ | 8.67 | | | $ | 39.60 | |
| | | | |
Service | | | | | | | | | | | | |
Net assets | | $ | 1,938,373 | | | | — | | | | — | |
| | | | |
Shares outstanding1 | | | 125,016 | | | | — | | | | — | |
| | | | |
Net asset value | | $ | 15.50 | | | | — | | | | — | |
| | | | |
Investor A | | | | | | | | | | | | |
Net assets | | $ | 98,658,582 | | | $ | 1,597,099 | | | $ | 397,746,024 | |
| | | | |
Shares outstanding1 | | | 6,374,413 | | | | 184,972 | | | | 11,588,182 | |
| | | | |
Net asset value | | $ | 15.48 | | | $ | 8.63 | | | $ | 34.32 | |
| | | | |
Investor B | | | | | | | | | | | | |
Net assets | | $ | 6,292,918 | | | | — | | | $ | 3,859,734 | |
| | | | |
Shares outstanding1 | | | 428,646 | | | | — | | | | 154,586 | |
| | | | |
Net asset value | | $ | 14.68 | | | | — | | | $ | 24.97 | |
| | | | |
Investor C | | | | | | | | | | | | |
Net assets | | $ | 65,146,218 | | | $ | 412,752 | | | $ | 95,410,397 | |
| | | | |
Shares outstanding1 | | | 4,428,420 | | | | 48,089 | | | | 3,854,879 | |
| | | | |
Net asset value | | $ | 14.71 | | | $ | 8.58 | | | $ | 24.75 | |
| | | | |
| | 1 | Unlimited shares authorized, $ 0.001 par value. |
See Notes to Financial Statements.
| | | | | | |
| | | BLACKROCK FUNDS | | MARCH 31, 2014 | | 21 |
| | | | | | | | | | | | |
| Six Months Ended March 31, 2014 (Unaudited) | | BlackRock
All-Cap Energy &
Resources
Portfolio | | | BlackRock
Emerging
Markets
Dividend
Fund | | | BlackRock
Energy &
Resources
Portfolio | |
| | | | | | | | | | | | |
| Investment Income | | | | | | | | | | | | |
Dividends — unaffiliated | | $ | 2,181,959 | | | $ | 56,411 | | | $ | 1,216,475 | |
Dividends — affiliated | | | 1,094 | | | | 34 | | | | 5,428 | |
Foreign taxes withheld | | | (134,759 | ) | | | (6,030 | ) | | | (55,564 | ) |
Other income — affiliated | | | 26,012 | | | | 894 | | | | 982 | |
Securities lending — affiliated — net | | | 945 | | | | — | | | | — | |
| | | | |
Total income | | | 2,075,251 | | | | 51,309 | | | | 1,167,321 | |
| | | | |
| | | | | | | | | | | | |
| Expenses | | | | | | | | | | | | |
Investment advisory | | | 798,388 | | | | 22,491 | | | | 2,258,842 | |
Service and distribution — class specific | | | 503,916 | | | | 3,433 | | | | 1,021,707 | |
Transfer agent — class specific | | | 197,605 | | | | 1,825 | | | | 584,730 | |
Administration | | | 79,839 | | | | 1,687 | | | | 220,698 | |
Registration | | | 34,344 | | | | 20,258 | | | | 30,806 | |
Professional | | | 32,796 | | | | 56,203 | | | | 36,610 | |
Administration — class specific | | | 26,659 | | | | 562 | | | | 75,383 | |
Printing | | | 10,728 | | | | 13,206 | | | | 24,643 | |
Custodian | | | 6,906 | | | | 5,041 | | | | 17,797 | |
Officer and Trustees | | | 4,756 | | | | 1,449 | | | | 10,680 | |
Miscellaneous | | | 14,171 | | | | 15,825 | | | | 17,969 | |
Recoupment of past waived fees — class specific | | | 45 | | | | — | | | | 10,446 | |
| | | | |
Total expenses | | | 1,710,153 | | | | 141,980 | | | | 4,310,311 | |
Less fees waived by Manager | | | (1,776 | ) | | | (22,491 | ) | | | (8,840 | ) |
Less administration fees waived | | | — | | | | (1,687 | ) | | | — | |
Less administration fees waived — class specific | | | (22,266 | ) | | | (562 | ) | | | (8,073 | ) |
Less transfer agent fees waived — class specific | | | (4,454 | ) | | | (148 | ) | | | (1,558 | ) |
Less transfer agent fees reimbursed — class specific | | | (16,580 | ) | | | (1,624 | ) | | | (6,894 | ) |
Less expenses reimbursed by Manager | | | — | | | | (77,951 | ) | | | — | |
| | | | |
Total expenses after fees waived and/or reimbursed | | | 1,665,077 | | | | 37,517 | | | | 4,284,946 | |
| | | | |
Net investment income (loss) | | | 410,174 | | | | 13,792 | | | | (3,117,625 | ) |
| | | | |
| | | | | | | | | | | | |
| Realized and Unrealized Gain (Loss) | | | | | | | | | | | | |
Net realized gain (loss) from: | | | | | | | | | | | | |
Investments | | | 39,737,357 | | | | (56,240 | ) | | | 101,674,592 | |
Foreign currency transactions | | | (68,127 | ) | | | 710 | | | | 24,087 | |
| | | | |
| | | 39,669,230 | | | | (55,530 | ) | | | 101,698,679 | |
| | | | |
Net change in unrealized appreciation/depreciation on: | | | | | | | | | | | | |
Investments | | | (30,657,031 | ) | | | 6,630 | | | | (65,330,177 | ) |
Foreign currency translations | | | 273 | | | | (5,635 | ) | | | 1,533 | |
| | | | |
| | | (30,656,758 | ) | | | 995 | | | | (65,328,644 | ) |
| | | | |
Total realized and unrealized gain (loss) | | | 9,012,472 | | | | (54,535 | ) | | | 36,370,035 | |
| | | | |
Net Increase (Decrease) in Net Assets Resulting from Operations | | $ | 9,422,646 | | | $ | (40,743 | ) | | $ | 33,252,410 | |
| | | | |
See Notes to Financial Statements.
| | | | | | |
| 22 | | BLACKROCK FUNDS | | MARCH 31, 2014 | | |
| | |
| Statements of Changes in Net Assets | | |
| | | | | | | | | | | | | | | | | | | | | | | | |
| | | BlackRock
All-Cap Energy &
Resources
Portfolio | | | BlackRock
Emerging
Markets
Dividend
Fund | | | BlackRock
Energy &
Resources
Portfolio | |
| Increase (Decrease) in Net Assets: | | Six Months
Ended
March 31,
2014
(Unaudited) | | | Year Ended
September 30,
2013 | | | Six Months
Ended
March 31,
2014
(Unaudited) | | | Year Ended
September 30,
2013 | | | Six Months
Ended
March 31,
2014
(Unaudited) | | | Year Ended
September 30,
2013 | |
| | | | | | | | | | | | | | | | | | | | | | | | |
| Operations | | | | | | | | | | | | | | | | | | | | | | | | |
Net investment income (loss) | | $ | 410,174 | | | $ | 240,598 | | | $ | 13,792 | | | $ | 70,383 | | | $ | (3,117,625 | ) | | $ | (3,281,433 | ) |
Net realized gain (loss) | | | 39,669,230 | | | | 43,388,887 | | | | (55,530 | ) | | | (367,588 | ) | | | 101,698,679 | | | | (122,591,564 | ) |
Net change in unrealized appreciation/depreciation | | | (30,656,758 | ) | | | (17,065,324 | ) | | | 995 | | | | 663,985 | | | | (65,328,644 | ) | | | 208,114,198 | |
| | | | | | | | | | | | |
Net increase (decrease) in net assets resulting from operations | | | 9,422,646 | | | | 26,564,161 | | | | (40,743 | ) | | | 366,780 | | | | 33,252,410 | | | | 82,241,201 | |
| | | | | | | | | | | | |
| | | | | | | | | | | | | | | | | | | | | | | | |
| Dividends and Distributions to Shareholders From | | | | | | | | | | | | | | | | | | | | | | | | |
Net investment income: | | | | | | | | | | | | | | | | | | | | | | | | |
Institutional | | | (243,720 | ) | | | (50,085 | )1 | | | (62,421 | ) | | | (35,294 | )1 | | | — | | | | — | |
Service | | | (7,889 | ) | | | — | | | | — | | | | — | | | | — | | | | — | |
Investor A | | | (428,293 | ) | | | — | | | | (32,128 | ) | | | (5,061 | )1 | | | — | | | | — | |
Investor C | | | — | | | | — | | | | (5,451 | ) | | | (126 | )1 | | | — | | | | — | |
Return of capital: | | | | | | | | | | | | | | | | | | | | | | | | |
Institutional | | | — | | | | — | | | | — | | | | — | | | | — | | | | (195,831 | )1 |
Investor A | | | — | | | | — | | | | — | | | | — | | | | — | | | | (591,849 | )1 |
Investor B | | | — | | | | — | | | | — | | | | — | | | | — | | | | (10,822 | )1 |
Investor C | | | — | | | | — | | | | — | | | | — | | | | — | | | | (201,151 | )1 |
| | | | | | | | | | | | |
Decrease in net assets resulting from dividends and distributions to shareholders | | | (679,902 | ) | | | (50,085 | ) | | | (100,000 | ) | | | (40,481 | ) | | | — | | | | (999,653 | ) |
| | | | | | | | | | | | |
| | | | | | | | | | | | | | | | | | | | | | | | |
| Capital Share Transactions | | | | | | | | | | | | | | | | | | | | | | | | |
Net increase (decrease) in net assets derived from capital share transactions | | | (23,095,487 | ) | | | (320,389,090 | ) | | | 576,674 | | | | 1,188,900 | | | | (81,909,914 | ) | | | (343,987,639 | ) |
| | | | | | | | | | | | |
| | | | | | | | | | | | | | | | | | | | | | | | |
| Net Assets | | | | | | | | | | | | | | | | | | | | | | | | |
Total increase (decrease) in net assets | | | (14,352,743 | ) | | | (293,875,014 | ) | | | 435,931 | | | | 1,515,199 | | | | (48,657,504 | ) | | | (262,746,091 | ) |
Beginning of period | | | 221,308,340 | | | | 515,183,354 | | | | 4,258,290 | | | | 2,743,091 | | | | 638,868,131 | | | | 901,614,222 | |
| | | | | | | | | | | | |
End of period | | $ | 206,955,597 | | | $ | 221,308,340 | | | $ | 4,694,221 | | | $ | 4,258,290 | | | $ | 590,210,627 | | | $ | 638,868,131 | |
| | | | | | | | | | | | |
Undistributed (distributions in excess of) net investment income (loss), end of period | | $ | (27,557 | ) | | $ | 242,171 | | | $ | 1,975 | | | $ | 88,183 | | | $ | (10,605,199 | ) | | $ | (7,487,574 | ) |
| | | | | | | | | | | | |
| | 1 | Determined in accordance with federal income tax regulations. |
See Notes to Financial Statements.
| | | | | | |
| | | BLACKROCK FUNDS | | MARCH 31, 2014 | | 23 |
| | | | |
| Financial Highlights | | | BlackRock All-Cap Energy & Resources Portfolio | |
| | | | | | | | | | | | | | | | | | | | | | | | | | | | | | | | | | | | | | | | | | | | | | | | |
| | | Institutional | | | Service | |
| | | Six Months
Ended
March 31, | | | Year Ended September 30, | | | Six Months
Ended
March 31, | | | Year Ended September 30, | |
| | | 2014 | | | | | | | | | | | | | | | | | | 2014 | | | | | | | | | | | | | | | | |
| | | (Unaudited) | | | 2013 | | | 2012 | | | 2011 | | | 2010 | | | 2009 | | | (Unaudited) | | | 2013 | | | 2012 | | | 2011 | | | 2010 | | | 2009 | |
| | | | | | | | | | | | | | | | | | | | | | | | | | | | | | | | | | | | | | | | | | | | | | | | |
| Per Share Operating Performance | | | | | | | | | | | | | | | | | | | | | | | | | | | | | | | | | | | | | | | | | | | | | | | | |
Net asset value, beginning of period | | $ | 15.28 | | | $ | 13.51 | | | $ | 12.14 | | | $ | 13.76 | | | $ | 12.46 | | | $ | 16.20 | | | $ | 14.87 | | | $ | 13.20 | | | $ | 11.90 | | | $ | 13.49 | | | $ | 12.24 | | | $ | 16.01 | |
| | | | | | | | |
Net investment income (loss)1 | | | 0.08 | | | | 0.06 | | | | 0.05 | | | | 0.01 | | | | 0.02 | | | | 0.02 | | | | 0.04 | | | | 0.02 | | | | 0.00 | 2 | | | (0.05 | ) | | | (0.03 | ) | | | (0.03 | ) |
Net realized and unrealized gain (loss) | | | 0.67 | | | | 1.71 | | | | 1.32 | | | | (1.51 | )3 | | | 1.38 | 3 | | | (2.14 | )3 | | | 0.65 | | | | 1.65 | | | | 1.30 | | | | (1.47 | )3 | | | 1.35 | 3 | | | (2.12 | )3 |
| | | | | | | | |
Net increase (decrease) from investment operations | | | 0.75 | | | | 1.77 | | | | 1.37 | | | | (1.50 | ) | | | 1.40 | | | | (2.12 | ) | | | 0.69 | | | | 1.67 | | | | 1.30 | | | | (1.52 | ) | | | 1.32 | | | | (2.15 | ) |
| | | | | | | | |
Dividends and distributions from: | | | | | | | | | | | | | | | | | | | | | | | | | | | | | | | | | | | | | | | | | | | | | | | | |
Net investment income | | | (0.11 | ) | | | (0.00 | )4,5 | | | — | | | | (0.12 | )4 | | | (0.10 | )4 | | | — | | | | (0.06 | ) | | | — | | | | — | | | | (0.07 | )4 | | | (0.07 | )4 | | | — | |
Net realized gain | | | — | | | | — | | | | — | | | | — | | | | — | | | | (1.62 | )4 | | | — | | | | — | | | | — | | | | — | | | | — | | | | (1.62 | )4 |
| | | | | | | | |
Total dividends and distributions | | | (0.11 | ) | | | — | | | | — | | | | (0.12 | ) | | | (0.10 | ) | | | (1.62 | ) | | | (0.06 | ) | | | — | | | | — | | | | (0.07 | ) | | | (0.07 | ) | | | (1.62 | ) |
| | | | | | | | |
Net asset value, end of period | | $ | 15.92 | | | $ | 15.28 | | | $ | 13.51 | | | $ | 12.14 | | | $ | 13.76 | | | $ | 12.46 | | | $ | 15.50 | | | $ | 14.87 | | | $ | 13.20 | | | $ | 11.90 | | | $ | 13.49 | | | $ | 12.24 | |
| | | | | | | | |
| | | | | | | | | | | | | | | | | | | | | | | | | | | | | | | | | | | | | | | | | | | | | | | | |
| Total Investment Return6 | | | | | | | | | | | | | | | | | | | | | | | | | | | | | | | | | | | | | | | | | | | | | | | | |
Based on net asset value | | | 4.92 | %7 | | | 13.13 | % | | | 11.29 | % | | | (11.10 | )%8 | | | 11.32 | %8 | | | (7.53 | )%8 | | | 4.63 | %7 | | | 12.65 | % | | | 10.93 | % | | | (11.36 | )%8 | | | 10.79 | %8 | | | (7.85 | )%8 |
| | | | | | | | |
| | | | | | | | | | | | | | | | | | | | | | | | | | | | | | | | | | | | | | | | | | | | | | | | |
| Ratios to Average Net Assets | | | | | | | | | | | | | | | | | | | | | | | | | | | | | | | | | | | | | | | | | | | | | | | | |
Total expenses | | | 1.02 | %9 | | | 0.98 | % | | | 0.95 | % | | | 0.93 | % | | | 0.94 | % | | | 0.98 | % | | | 1.38 | %9 | | | 1.34 | % | | | 1.29 | % | | | 1.27 | % | | | 1.34 | % | | | 1.54 | % |
| | | | | | | | |
Total expenses excluding recoupment of past waived fees | | | 1.02 | %9 | | | 0.98 | % | | | 0.95 | % | | | 0.91 | % | | | 0.93 | % | | | 0.97 | % | | | 1.38 | %9 | | | 1.34 | % | | | 1.29 | % | | | 1.24 | % | | | 1.27 | % | | | 1.47 | % |
| | | | | | | | |
Total expenses after fees waived and/or reimbursed and paid indirectly | | | 0.96 | %9 | | | 0.96 | % | | | 0.94 | % | | | 0.93 | % | | | 0.93 | % | | | 0.93 | % | | | 1.38 | %9 | | | 1.33 | % | | | 1.29 | % | | | 1.26 | % | | | 1.34 | % | | | 1.35 | % |
| | | | | | | | |
Net investment income (loss) | | | 0.99 | %9 | | | 0.49 | % | | | 0.34 | % | | | 0.03 | % | | | 0.16 | % | | | 0.17 | % | | | 0.57 | %9 | | | 0.17 | % | | | 0.00 | % | | | (0.30 | )% | | | (0.25 | )% | | | (0.26 | )% |
| | | | | | | | |
| | | | | | | | | | | | | | | | | | | | | | | | | | | | | | | | | | | | | | | | | | | | | | | | |
| Supplemental Data | | | | | | | | | | | | | | | | | | | | | | | | | | | | | | | | | | | | | | | | | | | | | | | | |
Net assets, end of period (000) | | $ | 34,920 | | | $ | 35,726 | | | $ | 272,779 | | | $ | 400,269 | | | $ | 420,071 | | | $ | 328,434 | | | $ | 1,938 | | | $ | 2,298 | | | $ | 3,828 | | | $ | 4,816 | | | $ | 4,231 | | | $ | 3,426 | |
| | | | | | | | |
Portfolio turnover | | | 54 | % | | | 28 | % | | | 19 | % | | | 22 | % | | | 38 | % | | | 22 | % | | | 54 | % | | | 28 | % | | | 19 | % | | | 22 | % | | | 38 | % | | | 22 | % |
| | | | | | | | |
| | 1 | Based on average shares outstanding. |
| | 2 | Amount is less than $0.005 per share. |
| | 3 | Includes redemption fees, which are less than $0.005 per share. |
| | 4 | Determined in accordance with federal income tax regulations. |
| | 5 | Amount is greater than $(0.005) per share. |
| | 6 | Where applicable, assumes the reinvestment of dividends and distributions. |
| | 7 | Aggregate total investment return. |
| | 8 | Redemption fee of 2.00% is reflected in total return calculations. There was no impact to the return. |
See Notes to Financial Statements.
| | | | | | |
| 24 | | BLACKROCK FUNDS | | MARCH 31, 2014 | | |
| | | | |
| Financial Highlights (continued) | | | BlackRock All-Cap Energy & Resources Portfolio | |
| | | | | | | | | | | | | | | | | | | | | | | | | | | | | | | | | | | | | | | | | | | | | | | | |
| | | Investor A | | | Investor B | |
| | | Six Months
Ended
March 31, | | | Year Ended September 30, | | | Six Months
Ended
March 31, | | | Year Ended September 30, | |
| | | 2014 | | | | | | | | | | | | | | | | | | 2014 | | | | | | | | | | | | | | | | |
| | | (Unaudited) | | | 2013 | | | 2012 | | | 2011 | | | 2010 | | | 2009 | | | (Unaudited) | | | 2013 | | | 2012 | | | 2011 | | | 2010 | | | 2009 | |
| | | | | | | | | | | | | | | | | | | | | | | | | | | | | | | | | | | | | | | | | | | | | | | | |
| Per Share Operating Performance | | | | | | | | | | | | | | | | | | | | | | | | | | | | | | | | | | | | | | | | | | | | | | | | |
Net asset value, beginning of period | | $ | 14.85 | | | $ | 13.19 | | | $ | 11.90 | | | $ | 13.50 | | | $ | 12.24 | | | $ | 16.01 | | | $ | 14.08 | | | $ | 12.59 | | | $ | 11.45 | | | $ | 13.03 | | | $ | 11.84 | | | $ | 15.68 | |
| | | | | | | | |
Net investment income (loss)1 | | | 0.04 | | | | 0.02 | | | | (0.01 | ) | | | (0.06 | ) | | | (0.03 | ) | | | (0.02 | ) | | | (0.01 | ) | | | (0.08 | ) | | | (0.11 | ) | | | (0.18 | ) | | | (0.13 | ) | | | (0.09 | ) |
Net realized and unrealized gain (loss) | | | 0.65 | | | | 1.64 | | | | 1.30 | | | | (1.47 | )2 | | | 1.35 | 2 | | | (2.13 | )2 | | | 0.61 | | | | 1.57 | | | | 1.25 | | | | (1.40 | )2 | | | 1.32 | 2 | | | (2.13 | )2 |
| | | | | | | | |
Net increase (decrease) from investment operations | | | 0.69 | | | | 1.66 | | | | 1.29 | | | | (1.53 | ) | | | 1.32 | | | | (2.15 | ) | | | 0.60 | | | | 1.49 | | | | 1.14 | | | | (1.58 | ) | | | 1.19 | | | | (2.22 | ) |
| | | | | | | | |
Dividends and distributions from: | | | | | | | | | | | | | | | | | | | | | | | | | | | | | | | | | | | | | | | | | | | | | | | | |
Net investment income | | | (0.06 | ) | | | — | | | | — | | | | (0.07 | )3 | | | (0.06 | )3 | | | — | | | | — | | | | — | | | | — | | | | — | | | | — | | | | — | |
Net realized gain | | | — | | | | — | | | | — | | | | — | | | | — | | | | (1.62 | )3 | | | — | | | | — | | | | — | | | | — | | | | — | | | | (1.62 | )3 |
| | | | | | | | |
Total dividends and distributions | | | (0.06 | ) | | | — | | | | — | | | | (0.07 | ) | | | (0.06 | ) | | | (1.62 | ) | | | — | | | | — | | | | — | | | | — | | | | — | | | | (1.62 | ) |
| | | | | | | | |
Net asset value, end of period | | $ | 15.48 | | | $ | 14.85 | | | $ | 13.19 | | | $ | 11.90 | | | $ | 13.50 | | | $ | 12.24 | | | $ | 14.68 | | | $ | 14.08 | | | $ | 12.59 | | | $ | 11.45 | | | $ | 13.03 | | | $ | 11.84 | |
| | | | | | | | |
| | | | | | | | | | | | | | | | | | | | | | | | | | | | | | | | | | | | | | | | | | | | | | | | |
| Total Investment Return4 | | | | | | | | | | | | | | | | | | | | | | | | | | | | | | | | | | | | | | | | | | | | | | | | |
Based on net asset value | | | 4.69 | %5 | | | 12.59 | % | | | 10.84 | % | | | (11.46 | )%6 | | | 10.84 | %6 | | | (7.85 | )%6 | | | 4.26 | %5 | | | 11.84 | % | | | 9.96 | % | | | (12.13 | )%6 | | | 10.05 | %6 | | | (8.56 | )%6 |
| | | | | | | | |
| | | | | | | | | | | | | | | | | | | | | | | | | | | | | | | | | | | | | | | | | | | | | | | | |
| Ratios to Average Net Assets | | | | | | | | | | | | | | | | | | | | | | | | | | | | | | | | | | | | | | | | | | | | | | | | |
Total expenses | | | 1.40 | %7 | | | 1.39 | % | | | 1.35 | % | | | 1.35 | % | | | 1.34 | % | | | 1.48 | % | | | 2.39 | %7 | | | 2.28 | % | | | 2.20 | % | | | 2.11 | % | | | 2.17 | % | | | 2.35 | % |
| | | | | | | | |
Total expenses excluding recoupment of past waived fees | | | 1.40 | %7 | | | 1.37 | % | | | 1.35 | % | | | 1.28 | % | | | 1.32 | % | | | 1.45 | % | | | 2.39 | %7 | | | 2.28 | % | | | 2.19 | % | | | 2.09 | % | | | 2.16 | % | | | 2.33 | % |
| | | | | | | | |
Total expenses after fees waived and/or reimbursed and paid indirectly | | | 1.38 | %7 | | | 1.37 | % | | | 1.34 | % | | | 1.34 | % | | | 1.34 | % | | | 1.34 | % | | | 2.10 | %7 | | | 2.10 | % | | | 2.10 | % | | | 2.10 | % | | | 2.10 | % | | | 2.06 | % |
| | | | | | | | |
Net investment income (loss) | | | 0.57 | %7 | | | 0.12 | % | | | (0.09 | )% | | | (0.38 | )% | | | (0.25 | )% | | | (0.25 | )% | | | (0.16 | )%7 | | | (0.60 | )% | | | (0.83 | )% | | | (1.15 | )% | | | (1.03 | )% | | | (0.95 | )% |
| | | | | | | | |
| | | | | | | | | | | | | | | | | | | | | | | | | | | | | | | | | | | | | | | | | | | | | | | | |
| Supplemental Data | | | | | | | | | | | | | | | | | | | | | | | | | | | | | | | | | | | | | | | | | | | | | | | | |
Net assets, end of period (000) | | $ | 98,659 | | | $ | 103,388 | | | $ | 137,765 | | | $ | 187,017 | | | $ | 207,523 | | | $ | 178,364 | | | $ | 6,293 | | | $ | 9,802 | | | $ | 15,162 | | | $ | 18,872 | | | $ | 27,113 | | | $ | 30,873 | |
| | | | | | | | |
Portfolio turnover | | | 54 | % | | | 28 | % | | | 19 | % | | | 22 | % | | | 38 | % | | | 22 | % | | | 54 | % | | | 28 | % | | | 19 | % | | | 22 | % | | | 38 | % | | | 22 | % |
| | | | | | | | |
| | 1 | Based on average shares outstanding. |
| | 2 | Includes redemption fees, which are less than $0.005 per share. |
| | 3 | Determined in accordance with federal income tax regulations. |
| | 4 | Where applicable, excludes the effects of any sales charges and assumes the reinvestment of dividends and distributions. |
| | 5 | Aggregate total investment return. |
| | 6 | Redemption fee of 2.00% is reflected in total return calculations. There was no impact to the return. |
See Notes to Financial Statements.
| | | | | | |
| | | BLACKROCK FUNDS | | MARCH 31, 2014 | | 25 |
| | | | |
| Financial Highlights (concluded) | | | BlackRock All-Cap Energy & Resources Portfolio | |
| | | | | | | | | | | | | | | | | | | | | | | | |
| | | Investor C | |
| | | Six Months
Ended
March 31,
2014 | | | Year Ended September 30, | |
| | | (Unaudited) | | | 2013 | | | 2012 | | | 2011 | | | 2010 | | | 2009 | |
| Per Share Operating Performance | | | | | | | | | | | | | | | | | | | | | | | | |
Net asset value, beginning of period | | $ | 14.10 | | | $ | 12.62 | | | $ | 11.47 | | | $ | 13.04 | | | $ | 11.85 | | | $ | 15.69 | |
| | | | |
Net investment loss1 | | | (0.01 | ) | | | (0.07 | ) | | | (0.10 | ) | | | (0.17 | ) | | | (0.13 | ) | | | (0.09 | ) |
Net realized and unrealized gain (loss) | | | 0.62 | | | | 1.55 | | | | 1.25 | | | | (1.40 | )2 | | | 1.32 | 2 | | | (2.13 | )2 |
| | | | |
Net increase (decrease) from investment operations | | | 0.61 | | | | 1.48 | | | | 1.15 | | | | (1.57 | ) | | | 1.19 | | | | (2.22 | ) |
| | | | |
Distributions from net realized gain | | | — | | | | — | | | | — | | | | — | | | | — | | | | (1.62 | )3 |
| | | | |
Net asset value, end of period | | $ | 14.71 | | | $ | 14.10 | | | $ | 12.62 | | | $ | 11.47 | | | $ | 13.04 | | | $ | 11.85 | |
| | | | |
| | | | | | | | | | | | | | | | | | | | | | | | |
| Total Investment Return4 | | | | | | | | | | | | | | | | | | | | | | | | |
Based on net asset value | | | 4.33 | %5 | | | 11.73 | % | | | 10.03 | % | | | (12.04 | )%6 | | | 10.04 | %6 | | | (8.54 | )%6 |
| | | | |
| | | | | | | | | | | | | | | | | | | | | | | | |
| Ratios to Average Net Assets | | | | | | | | | | | | | | | | | | | | | | | | |
Total expenses | | | 2.13 | %7 | | | 2.12 | % | | | 2.08 | % | | | 2.05 | % | | | 2.08 | % | | | 2.23 | % |
| | | | |
Total expenses excluding recoupment of past waived fees | | | 2.13 | %7 | | | 2.12 | % | | | 2.08 | % | | | 2.03 | % | | | 2.08 | % | | | 2.21 | % |
| | | | |
Total expenses after fees waived and/or reimbursed and paid indirectly | | | 2.10 | %7 | | | 2.09 | % | | | 2.07 | % | | | 2.04 | % | | | 2.08 | % | | | 2.05 | % |
| | | | |
Net investment loss | | | (0.15 | )%7 | | | (0.59 | )% | | | (0.79 | )% | | | (1.08 | )% | | | (1.00 | )% | | | (0.95 | )% |
| | | | |
| | | | | | | | | | | | | | | | | | | | | | | | |
| Supplemental Data | | | | | | | | | | | | | | | | | | | | | | | | |
Net assets, end of period (000) | | $ | 65,146 | | | $ | 70,094 | | | $ | 85,649 | | | $ | 99,433 | | | $ | 116,401 | | | $ | 113,347 | |
| | | | |
Portfolio turnover | | | 54 | % | | | 28 | % | | | 19 | % | | | 22 | % | | | 38 | % | | | 22 | % |
| | | | |
| | 1 | Based on average shares outstanding. |
| | 2 | Includes redemption fees, which are less than $0.005 per share. |
| | 3 | Determined in accordance with federal income tax regulations. |
| | 4 | Where applicable, excludes the effects of any sales charges and assumes the reinvestment of dividends and distributions. |
| | 5 | Aggregate total investment return. |
| | 6 | Redemption fee of 2.00% is reflected in total return calculations. There was no impact to the return. |
See Notes to Financial Statements.
| | | | | | |
| 26 | | BLACKROCK FUNDS | | MARCH 31, 2014 | | |
| | | | |
| Financial Highlights | | | BlackRock Emerging Markets Dividend Fund | |
| | | | | | | | | | | | | | | | | | | | | | | | | | | | | | | | | | | | | | | | | | | | | | | | |
| | | Institutional | | | Investor A | | | Investor C | |
| | | Six Months
Ended
March 31, | | | Year Ended | | | Period
April 29,
20111 to | | | Six Months
Ended
March 31, | | | Year Ended | | | Period
April 29,
20111 to | | | Six Months
Ended
March 31, | | | Year Ended | | | Period
April 1 29,
20111 to | |
| | | 2014 | | | September 30, | | | September | | | 2014 | | | September 30, | | | September | | | 2014 | | | September 30, | | | September | |
| | | (Unaudited) | | | 2013 | | | 2012 | | | 30, 2011 | | | (Unaudited) | | | 2013 | | | 2012 | | | 30, 2011 | | | (Unaudited) | | | 2013 | | | 2012 | | | 30, 2011 | |
| Per Share Operating Performance | | | | | | | | | | | | | | | | | | | | | | | | | | | | | | | | | | | | | | | | | | | | | | | | |
Net asset value, beginning of period. | | $ | 8.93 | | | $ | 7.79 | | | $ | 6.90 | | | $ | 10.00 | | | $ | 8.89 | | | $ | 7.77 | | | $ | 6.89 | | | $ | 10.00 | | | $ | 8.84 | | | $ | 7.72 | | | $ | 6.87 | | | $ | 10.00 | |
| | | | | | | | | | | | |
Net investment income2 | | | 0.03 | | | | 0.15 | | | | 0.12 | | | | 0.13 | | | | 0.02 | | | | 0.21 | | | | 0.18 | | | | 0.09 | | | | (0.01 | ) | | | 0.20 | | | | 0.05 | | | | 0.09 | |
Net realized and unrealized gain (loss) | | | (0.09 | ) | | | 1.11 | | | | 0.89 | | | | (3.23 | ) | | | (0.09 | ) | | | 1.02 | | | | 0.82 | | | | (3.20 | ) | | | (0.10 | ) | | | 0.95 | | | | 0.90 | | | | (3.22 | ) |
| | | | | | | | | | | | |
Net increase (decrease) from investment operations | | | (0.06 | ) | | | 1.26 | | | | 1.01 | | | | (3.10 | ) | | | (0.07 | ) | | | 1.23 | | | | 1.00 | | | | (3.11 | ) | | | (0.11 | ) | | | 1.15 | | | | 0.95 | | | | (3.13 | ) |
| | | | | | | | | | | | |
Dividends from net investment income | | | (0.20 | ) | | | (0.12 | )3 | | | (0.12 | )3 | | | — | | | | (0.19 | ) | | | (0.11 | )3 | | | (0.12 | )3 | | | — | | | | (0.15 | ) | | | (0.03 | )3 | | | (0.10 | )3 | | | — | |
| | | | | | | | | | | | |
Net asset value, end of period | | $ | 8.67 | | | $ | 8.93 | | | $ | 7.79 | | | $ | 6.90 | | | $ | 8.63 | | | $ | 8.89 | | | $ | 7.77 | | | $ | 6.89 | | | $ | 8.58 | | | $ | 8.84 | | | $ | 7.72 | | | $ | 6.87 | |
| | | | | | | | | | | | |
| | | | | | | | | | | | | | | | | | | | | | | | | | | | | | | | | | | | | | | | | | | | | | | | |
| Total Investment Return4 | | | | | | | | | | | | | | | | | | | | | | | | | | | | | | | | | | | | | | | | | | | | | | | | |
Based on net asset value | | | (0.66 | )%5 | | | 16.15 | %6 | | | 14.82 | % | | | (31.00 | )%5 | | | (0.84 | )%5 | | | 15.82 | %6 | | | 14.64 | % | | | (31.10 | )%5 | | | (1.21 | )%5 | | | 14.95 | %6 | | | 13.95 | % | | | (31.30 | )%5 |
| | | | | | | | | | | | |
| | | | | | | | | | | | | | | | | | | | | | | | | | | | | | | | | | | | | | | | | | | | | | | | |
| Ratios to Average Net Assets | | | | | | | | | | | | | | | | | | | | | | | | | | | | | | | | | | | | | | | | | | | | | | | | |
Total expenses | | | 6.10 | %7 | | | 7.54 | % | | | 13.05 | % | | | 9.67 | %7,8 | | | 6.48 | %7 | | | 8.33 | % | | | 14.41 | % | | | 12.18 | %7,8 | | | 7.36 | %7 | | | 9.53 | % | | | 14.94 | % | | | 11.73 | %7,8 |
| | | | | | | | | | | | |
Total expenses after fees waived and/or reimbursed | | | 1.52 | %7 | | | 1.63 | % | | | 1.65 | % | | | 1.65 | %7 | | | 1.76 | %7 | | | 1.87 | % | | | 1.90 | % | | | 1.90 | %7 | | | 2.52 | %7 | | | 2.61 | % | | | 2.65 | % | | | 2.65 | %7 |
| | | | | | | | | | | | |
Net investment income | | | 0.74 | %7 | | | 1.71 | % | | | 1.55 | % | | | 3.39 | %7 | | | 0.54 | %7 | | | 2.44 | % | | | 2.24 | % | | | 2.47 | %7 | | | (0.14 | )%7 | | | 2.33 | % | | | 0.60 | % | | | 2.30 | %7 |
| | | | | | | | | | | | |
| | | | | | | | | | | | | | | | | | | | | | | | | | | | | | | | | | | | | | | | | | | | | | | | |
| Supplemental Data | | | | | | | | | | | | | | | | | | | | | | | | | | | | | | | | | | | | | | | | | | | | | | | | |
Net assets, end of period (000) | | $ | 2,684 | | | $ | 2,736 | | | $ | 2,355 | | | $ | 2,049 | | | $ | 1,597 | | | $ | 1,308 | | | $ | 360 | | | $ | 51 | | | $ | 413 | | | $ | 214 | | | $ | 28 | | | $ | 19 | |
| | | | | | | | | | | | |
Portfolio turnover | | | 38 | % | | | 150 | % | | | 40 | % | | | 14 | % | | | 38 | % | | | 150 | % | | | 40 | % | | | 14 | % | | | 38 | % | | | 150 | % | | | 40 | % | | | 14 | % |
| | | | | | | | | | | | |
| | 1 | Commencement of operations. |
| | 2 | Based on average shares outstanding. |
| | 3 | Determined in accordance with federal income tax regulations. |
| | 4 | Where applicable, excludes the effects of any sales charges and assumes the reinvestment of dividends and distributions. |
| | 5 | Aggregate total investment return. |
| | 6 | Includes a payment from an affiliate related to securities lending which impacted the Fund’s total return. Not including this payment the Fund’s total return would have been 15.76%, 15.43% and 14.56% for the Institutional, Investor A and Investor C Shares, respectively. |
| | 8 | Organization costs were not annualized in the calculation of the expense ratios. If these expenses were annualized, the total expenses for Institutional, Investor A and Investor C would have been 13.81%, 18.86% and 16.54%, respectively. |
See Notes to Financial Statements.
| | | | | | |
| | | BLACKROCK FUNDS | | MARCH 31, 2014 | | 27 |
| | | | |
| Financial Highlights | | | BlackRock Energy & Resources Portfolio | |
| | | | | | | | | | | | | | | | | | | | | | | | | | | | | | | | | | | | | | | | | | | | | | | | |
| | | Institutional | | | Investor A | |
| | | Six Months
Ended
March 31, | | | Year Ended September 30, | | | Six Months
Ended
March 31, | | | Year Ended September 30, | |
| | | 2014 | | | | | | | | | | | | | | | | | | 2014 | | | | | | | | | | | | | | | | |
| | | (Unaudited) | | | 2013 | | | 2012 | | | 2011 | | | 2010 | | | 2009 | | | (Unaudited) | | | 2013 | | | 2012 | | | 2011 | | | 2010 | | | 2009 | |
| Per Share Operating Performance | | | | | | | | | | | | | | | | | | | | | | | | | | | | | | | | | | | | | | | | | | | | | | | | |
Net asset value, beginning of period | | $ | 37.36 | | | $ | 32.87 | | | $ | 31.70 | | | $ | 34.98 | | | $ | 32.61 | | | $ | 51.31 | | | $ | 32.42 | | | $ | 28.62 | | | $ | 27.73 | | | $ | 30.63 | | | $ | 28.67 | | | $ | 47.29 | |
| | | | | | | | |
Net investment income (loss)1 | | | (0.13 | ) | | | (0.04 | ) | | | (0.16 | ) | | | (0.08 | ) | | | 0.05 | | | | (0.07 | ) | | | (0.16 | ) | | | (0.11 | ) | | | (0.24 | ) | | | (0.20 | ) | | | (0.12 | ) | | | (0.13 | ) |
Net realized and unrealized gain (loss) | | | 2.37 | | | | 4.56 | | | | 2.79 | | | | (2.68 | ) | | | 2.31 | | | | (9.60 | ) | | | 2.06 | | | | 3.94 | | | | 2.46 | | | | (2.34 | ) | | | 2.08 | | | | (9.46 | ) |
| | | | | | | | |
Net increase (decrease) from investment operations | | | 2.24 | | | | 4.52 | | | | 2.63 | | | | (2.76 | ) | | | 2.36 | | | | (9.67 | ) | | | 1.90 | | | | 3.83 | | | | 2.22 | | | | (2.54 | ) | | | 1.96 | | | | (9.59 | ) |
| | | | | | | | |
Dividends and distributions from: | | | | | | | | | | | | | | | | | | | | | | | | | | | | | | | | | | | | | | | | | | | | | | | | |
Net investment income | | | — | | | | — | | | | (0.25 | )2 | | | (0.52 | )2 | | | — | | | | — | | | | — | | | | — | | | | (0.17 | )2 | | | (0.36 | )2 | | | — | | | | — | |
Return of capital | | | — | | | | (0.03 | )2 | | | (0.47 | )2 | | | — | | | | — | | | | — | | | | — | | | | (0.03 | )2 | | | (0.42 | )2 | | | — | | | | — | | | | — | |
Net realized gain | | | — | | | | — | | | | (0.74 | )2 | | | — | | | | — | | | | (9.04 | )2 | | | — | | | | — | | | | (0.74 | )2 | | | — | | | | — | | | | (9.04 | )2 |
| | | | | | | | |
Total dividends and distributions | | | — | | | | (0.03 | ) | | | (1.46 | ) | | | (0.52 | ) | | | — | | | | (9.04 | ) | | | — | | | | (0.03 | ) | | | (1.33 | ) | | | (0.36 | ) | | | — | | | | (9.04 | ) |
| | | | | | | | |
Redemption fees added to paid-in capital | | | — | | | | — | | | | — | | | | 0.003 | | | | 0.01 | | | | 0.01 | | | | — | | | | — | | | | — | | | | 0.00 | 3 | | | 0.00 | 3 | | | 0.01 | |
| | | | | | | | |
Net asset value, end of period | | $ | 39.60 | | | $ | 37.36 | | | $ | 32.87 | | | $ | 31.70 | | | $ | 34.98 | | | $ | 32.61 | | | $ | 34.32 | | | $ | 32.42 | | | $ | 28.62 | | | $ | 27.73 | | | $ | 30.63 | | | $ | 28.67 | |
| | | | | | | | |
| | | | | | | | | | | | | | | | | | | | | | | | | | | | | | | | | | | | | | | | | | | | | | | | |
| Total Investment Return4 | | | | | | | | | | | | | | | | | | | | | | | | | | | | | | | | | | | | | | | | | | | | | | | | |
Based on net asset value | | | 6.00 | %5 | | | 13.78 | % | | | 7.76 | % | | | (8.28 | )% | | | 7.27 | %6,7 | | | (7.64 | )%8,9 | | | 5.86 | %5 | | | 13.42 | % | | | 7.41 | % | | | (8.61 | )% | | | 6.84 | %10,11 | | | (8.20 | )%7,12 |
| | | | | | | | |
| | | | | | | | | | | | | | | | | | | | | | | | | | | | | | | | | | | | | | | | | | | | | | | | |
| Ratios to Average Net Assets | | | | | | | | | | | | | | | | | | | | | | | | | | | | | | | | | | | | | | | | | | | | | | | | |
Total expenses | | | 1.09 | %13 | | | 1.04 | % | | | 0.99 | % | | | 0.93 | % | | | 0.97 | % | | | 1.00 | % | | | 1.34 | %13 | | | 1.34 | % | | | 1.34 | % | | | 1.28 | % | | | 1.35 | % | | | 1.40 | % |
| | | | | | | | |
Total expenses excluding recoupment of past waived fees. | | | 1.09 | %13 | | | 1.03 | % | | | 0.99 | % | | | 0.93 | % | | | 0.97 | % | | | 0.98 | % | | | 1.34 | %13 | | | 1.33 | % | | | 1.33 | % | | | 1.26 | % | | | 1.31 | % | | | 1.38 | % |
| | | | | | | | |
Total expenses after fees waived and/or reimbursed and paid indirectly | | | 1.07 | %13 | | | 1.03 | % | | | 0.99 | % | | | 0.92 | % | | | 0.97 | % | | | 0.99 | % | | | 1.33 | %13 | | | 1.34 | % | | | 1.34 | % | | | 1.27 | % | | | 1.35 | % | | | 1.31 | % |
| | | | | | | | |
Net investment income (loss) | | | (0.68 | )%13 | | | (0.11 | )% | | | (0.44 | )% | | | (0.18 | )% | | | 0.13 | % | | | (0.25 | )% | | | (0.95 | )%13 | | | (0.38 | )% | | | (0.77 | )% | | | (0.52 | )% | | | (0.39 | )% | | | (0.55 | )% |
| | | | | | | | |
| | | | | | | | | | | | | | | | | | | | | | | | | | | | | | | | | | | | | | | | | | | | | | | | |
| Supplemental Data | | | | | | | | | | | | | | | | | | | | | | | | | | | | | | | | | | | | | | | | | | | | | | | | |
Net assets, end of period (000) | | $ | 93,195 | | | $ | 105,317 | | | $ | 222,034 | | | $ | 306,403 | | | $ | 274,009 | | | $ | 134,187 | | | $ | 397,746 | | | $ | 425,568 | | | $ | 539,085 | | | $ | 632,030 | | | $ | 644,786 | | | $ | 636,437 | |
| | | | | | | | |
Portfolio turnover | | | 41 | % | | | 33 | % | | | 15 | % | | | 40 | % | | | 16 | % | | | 25 | % | | | 41 | % | | | 33 | % | | | 15 | % | | | 40 | % | | | 16 | % | | | 25 | % |
| | | | | | | | |
| | 1 | Based on average shares outstanding. |
| | 2 | Determined in accordance with federal income tax regulations. |
| | 3 | Amount is less than $0.005 per share. |
| | 4 | Where applicable, excludes the effects of any sales charges and assumes the reinvestment of dividends and distributions. |
| | 5 | Aggregate total investment return. |
| | 6 | Includes proceeds received from a settlement of litigation, which impacted the Fund’s total return. Excluding these proceeds, the Fund’s total return would have been 7.20%. |
| | 7 | Redemption fee of 2.00% is reflected in total return calculations. The impact to the return from redemption fees received during the period was an increase of 0.03%. |
| | 8 | Includes proceeds received from a settlement of litigation, which impacted the Fund’s total return. Excluding these proceeds, the Fund’s total return would have been (7.66)%. |
| | 9 | Redemption fee of 2.00% is reflected in total return calculations. The impact to the return from redemption fees received during the period was an increase of 0.02%. |
| | 10 | Includes proceeds received from a settlement of litigation, which impacted the Fund’s total return. Excluding these proceeds, the Fund’s total return would have been 6.77%. |
| | 11 | Redemption fee of 2.00% is reflected in total return calculations. There was no impact to the return. |
| | 12 | Includes proceeds received from a settlement of litigation, which impacted the Fund’s total return. Excluding these proceeds, the Fund’s total return would have been (8.23)%. |
See Notes to Financial Statements.
| | | | | | |
| 28 | | BLACKROCK FUNDS | | MARCH 31, 2014 | | |
| | | | |
| Financial Highlights (concluded) | | | BlackRock Energy & Resources Portfolio | |
| | | | | | | | | | | | | | | | | | | | | | | | | | | | | | | | | | | | | | | | | | | | | | | | |
| | | Investor B | | | Investor C | |
| | | Six Months
Ended
March 31,
2014 | | | Year Ended September 30, | | | Six Months
Ended
March 31,
2014 | | | Year Ended September 30, | |
| | | (Unaudited) | | | 2013 | | | 2012 | | | 2011 | | | 2010 | | | 2009 | | | (Unaudited) | | | 2013 | | | 2012 | | | 2011 | | | 2010 | | | 2009 | |
| Per Share Operating Performance | | | | | | | | | | | | | | | | | | | | | | | | | | | | | | | | | | | | | | | | | | | | | | | | |
Net asset value, beginning of period | | $ | 23.68 | | | $ | 21.07 | | | $ | 20.65 | | | $ | 22.86 | | | $ | 21.56 | | | $ | 39.68 | | | $ | 23.47 | | | $ | 20.88 | | | $ | 20.55 | | | $ | 22.81 | | | $ | 21.51 | | | $ | 39.61 | |
| | | | | | | | |
Net investment loss1 | | | (0.20 | ) | | | (0.25 | ) | | | (0.36 | ) | | | (0.38 | ) | | | (0.27 | ) | | | (0.22 | ) | | | (0.20 | ) | | | (0.24 | ) | | | (0.34 | ) | | | (0.37 | ) | | | (0.24 | ) | | | (0.22 | ) |
Net realized and unrealized gain (loss) | | | 1.49 | | | | 2.89 | | | | 1.87 | | | | (1.73 | ) | | | 1.57 | | | | (8.87 | ) | | | 1.48 | | | | 2.86 | | | | 1.84 | | | | (1.69 | ) | | | 1.54 | | | | (8.85 | ) |
| | | | | | | | |
Net increase (decrease) from investment operations | | | 1.29 | | | | 2.64 | | | | 1.51 | | | | (2.11 | ) | | | 1.30 | | | | (9.09 | ) | | | 1.28 | | | | 2.62 | | | | 1.50 | | | | (2.06 | ) | | | 1.30 | | | | (9.07 | ) |
| | | | | | | | |
Dividends and distributions from: | | | | | | | | | | | | | | | | | | | | | | | | | | | | | | | | | | | | | | | | | | | | | | | | |
Net investment income | | | — | | | | — | | | | (0.06 | )2 | | | (0.10 | )2 | | | — | | | | — | | | | — | | | | — | | | | (0.09 | )2 | | | (0.20 | )2 | | | — | | | | — | |
Return of capital | | | — | | | | (0.03 | )2 | | | (0.29 | )2 | | | — | | | | — | | | | — | | | | — | | | | (0.03 | )2 | | | (0.34 | )2 | | | — | | | | — | | | | — | |
Net realized gain | | | — | | | | — | | | | (0.74 | )2 | | | — | | | | — | | | | (9.04 | )2 | | | — | | | | — | | | | (0.74 | )2 | | | — | | | | — | | | | (9.04 | )2 |
| | | | | | | | |
Total dividends and distributions | | | — | | | | (0.03 | ) | | | (1.09 | ) | | | (0.10 | ) | | | — | | | | (9.04 | ) | | | — | | | | (0.03 | ) | | | (1.17 | ) | | | (0.20 | ) | | | — | | | | (9.04 | ) |
| | | | | | | | |
Redemption fees added to paid-in capital | | | — | | | | — | | | | — | | | | 0.00 | 3 | | | 0.00 | 3 | | | 0.01 | | | | — | | | | — | | | | — | | | | 0.00 | 3 | | | 0.00 | 3 | | | 0.01 | |
| | | | | | | | |
Net asset value, end of period | | $ | 24.97 | | | $ | 23.68 | | | $ | 21.07 | | | $ | 20.65 | | | $ | 22.86 | | | $ | 21.56 | | | $ | 24.75 | | | $ | 23.47 | | | $ | 20.88 | | | $ | 20.55 | | | $ | 22.81 | | | $ | 21.51 | |
| | | | | | | | |
| | | | | | | | | | | | | | | | | | | | | | | | | | | | | | | | | | | | | | | | | | | | | | | | |
| Total Investment Return4 | | | | | | | | | | | | | | | | | | | | | | | | | | | | | | | | | | | | | | | | | | | | | | | | |
Based on net asset value | | | 5.45 | %5 | | | 12.57 | % | | | 6.63 | % | | | (9.33 | )% | | | 6.03 | %6,7 | | | (8.74 | )%8,9 | | | 5.46 | %5 | | | 12.59 | % | | | 6.57 | % | | | (9.25 | )% | | | 6.04 | %7,10 | | | (8.68 | )%9,11 |
| | | | | | | | |
| | | | | | | | | | | | | | | | | | | | | | | | | | | | | | | | | | | | | | | | | | | | | | | | |
| Ratios to Average Net Assets | | | | | | | | | | | | | | | | | | | | | | | | | | | | | | | | | | | | | | | | | | | | | | | | |
Total expenses | | | 2.41 | %12 | | | 2.31 | % | | | 2.16 | % | | | 2.07 | % | | | 2.10 | % | | | 2.25 | % | | | 2.11 | %12 | | | 2.10 | % | | | 2.07 | % | | | 2.04 | % | | | 2.06 | % | | | 2.16 | % |
| | | | | | | | |
Total expenses excluding recoupment of past waived fees | | | 2.41 | %12 | | | 2.30 | % | | | 2.16 | % | | | 2.03 | % | | | 2.10 | % | | | 2.23 | % | | | 2.09 | %12 | | | 2.10 | % | | | 2.07 | % | | | 1.99 | % | | | 2.05 | % | | | 2.16 | % |
| | | | | | | | |
Total expenses after fees waived and/or reimbursed and paid indirectly | | | 2.10 | %12 | | | 2.10 | % | | | 2.10 | % | | | 2.07 | % | | | 2.09 | % | | | 2.05 | % | | | 2.10 | %12 | | | 2.09 | % | | | 2.07 | % | | | 2.03 | % | | | 2.05 | % | | | 2.05 | % |
| | | | | | | | |
Net investment loss | | | (1.71 | )%12 | | | (1.15 | )% | | | (1.56 | )% | | | (1.31 | )% | | | (1.17 | )% | | | (1.28 | )% | | | (1.71 | )%12 | | | (1.12 | )% | | | (1.50 | )% | | | (1.29 | )% | | | (1.07 | )% | | | (1.29 | )% |
| | | | | | | | |
| | | | | | | | | | | | | | | | | | | | | | | | | | | | | | | | | | | | | | | | | | | | | | | | |
| Supplemental Data | | | | | | | | | | | | | | | | | | | | | | | | | | | | | | | | | | | | | | | | | | | | | | | | |
Net assets, end of period (000) | | $ | 3,860 | | | $ | 4,576 | | | $ | 7,687 | | | $ | 16,450 | | | $ | 25,633 | | | $ | 34,218 | | | $ | 95,410 | | | $ | 103,407 | | | $ | 132,808 | | | $ | 146,186 | | | $ | 142,490 | | | $ | 129,556 | |
| | | | | | | | |
Portfolio turnover | | | 41 | % | | | 33 | % | | | 15 | % | | | 40 | % | | | 16 | % | | | 25 | % | | | 41 | % | | | 33 | % | | | 15 | % | | | 40 | % | | | 16 | % | | | 25 | % |
| | | | | | | | |
| | 1 | Based on average shares outstanding. |
| | 2 | Determined in accordance with federal income tax regulations. |
| | 3 | Amount is less than $0.005 per share. |
| | 4 | Where applicable, excludes the effects of any sales charges and assumes the reinvestment of dividends and distributions. |
| | 5 | Aggregate total investment return. |
| | 6 | Includes proceeds received from a settlement of litigation, which impacted the Fund’s total return. Excluding these proceeds, the Fund’s total return would have been 5.94%. |
| | 7 | Redemption fee of 2.00% is reflected in total return calculations. There was no impact to the return. |
| | 8 | Includes proceeds received from a settlement of litigation, which impacted the Fund’s total return. Excluding these proceeds, the Fund’s total return would have been (8.77)%. |
| | 9 | Redemption fee of 2.00% is reflected in total return calculations. The impact to the return from redemption fees received during the period was an increase of 0.04%. |
| | 10 | Includes proceeds received from a settlement of litigation, which impacted the Fund’s total return. Excluding these proceeds, the Fund’s total return would have been 5.95%. |
| | 11 | Includes proceeds received from a settlement of litigation, which impacted the Fund’s total return. Excluding these proceeds, the Fund’s total return would have been (8.71)%. |
See Notes to Financial Statements.
| | | | | | |
| | | BLACKROCK FUNDS | | MARCH 31, 2014 | | 29 |
| | |
| Notes to Financial Statements (Unaudited) | | |
1. Organization:
BlackRock FundsSM (the “Trust”) is registered under the Investment Company Act of 1940, as amended (the “1940 Act”), as an open-end management investment company. The Trust is organized as a Massachusetts business trust. BlackRock All-Cap Energy & Resources Portfolio (“All-Cap Energy & Resources”), BlackRock Emerging Markets Dividend Fund (“Emerging Markets Dividend”) and BlackRock Energy & Resources Portfolio (“Energy & Resources”) (collectively, the “Funds” or individually, a “Fund”) are each a series of the Trust. The Funds are classified as non-diversified; however, Emerging Markets Dividend intends to operate as a diversified fund.
Each Fund offers multiple classes of shares. Institutional and Service Shares are sold without a sales charge and only to certain eligible investors. Investor A Shares are generally sold with an initial sales charge, but may be subject to a CDSC for certain redemptions where no initial sales charge was paid at the time of purchase. Investor B and Investor C Shares may be subject to a CDSC. All classes of shares have identical voting, dividend, liquidation and other rights and are subject to the same terms and conditions, except that Service, Investor A, Investor B and Investor C Shares bear certain expenses related to the shareholder servicing of such shares, and Investor B and Investor C Shares also bear certain expenses related to the distribution of such shares. Investor B Shares automatically convert to Investor A Shares after approximately eight years. Investor B Shares are only available through exchanges and dividend reinvestments by existing shareholders and for purchase by certain employer-sponsored retirement plans. Each class has exclusive voting rights with respect to matters relating to its shareholder servicing and distribution expenditures (except that Investor B shareholders may vote on material changes to the Investor A distribution and service plan).
The Funds, together with certain other registered investment companies advised by the Manager or its affiliates, are included in a complex of open-end funds referred to as the Equity-Liquidity Complex.
2. Significant Accounting Policies:
The Funds’ financial statements are prepared in conformity with accounting principles generally accepted in the United States of America (“U.S. GAAP”), which may require management to make estimates and assumptions that affect the reported amounts of assets and liabilities in the financial statements and the reported amounts of increases and decreases in net assets from operations during the reporting period. Actual results could differ from those estimates. The following is a summary of significant accounting policies followed by the Funds:
Valuation: U.S. GAAP defines fair value as the price the Funds would receive to sell an asset or pay to transfer a liability in an orderly transaction between market participants at the measurement date. The Funds determine the fair values of their financial instruments at market value using independent dealers or pricing services under policies approved by the Board of Trustees of the Trust (the “Board”). The BlackRock Global Valuation Methodologies Committee (the “Global Valuation Committee”)
is the committee formed by management to develop global pricing policies and procedures and to provide oversight of the pricing function for the Funds for all financial instruments.
Equity investments traded on a recognized securities exchange or the NASDAQ Stock Market (“NASDAQ”) are valued at the last reported sale price that day or the NASDAQ official closing price, if applicable. For equity investments traded on more than one exchange, the last reported sale price on the exchange where the stock is primarily traded is used. Equity investments traded on a recognized exchange for which there were no sales on that day are valued at the last available bid (long positions) or ask (short positions) price. Investments in open-end registered investment companies are valued at NAV each business day.
Securities and other assets and liabilities denominated in foreign currencies are translated into U.S. dollars using exchange rates determined as of the close of business on the New York Stock Exchange (“NYSE”). Foreign currency exchange contracts are valued at the mean between the bid and ask prices and are determined as of the close of business on the NYSE. Interpolated values are derived when the settlement date of the contract is an interim date for which quotations are not available.
The Funds value their investments in BlackRock Liquidity Series, LLC, Money Market Series (the “Money Market Series”) at fair value, which is ordinarily based upon their pro rata ownership in the underlying fund’s net assets. The Money Market Series seeks current income consistent with maintaining liquidity and preserving capital. Although the Money Market Series is not registered under the 1940 Act, its investments will follow the parameters of investments by a money market fund that is subject to Rule 2a-7 under the 1940 Act. Each Fund may withdraw up to 25% of its investment daily, although the manager of the Money Market Series, in its sole discretion, may permit an investor to withdraw more than 25% on any one day.
In the event that the application of these methods of valuation results in a price for an investment that is deemed not to be representative of the market value of such investment, or if a price is not available, the investment will be valued by the Global Valuation Committee, or its delegate, in accordance with a policy approved by the Board as reflecting fair value (“Fair Value Assets”). When determining the price for Fair Value Assets, the Global Valuation Committee, or its delegate, seeks to determine the price that each Fund might reasonably expect to receive from the current sale of that asset in an arm’s-length transaction. Fair value determinations shall be based upon all available factors that the Global Valuation Committee, or its delegate, deems relevant consistent with the principles of fair value measurement, which include the market approach, income approach and/or in the case of recent investments, the cost approach, as appropriate. The market approach generally consists of using comparable market transactions. The income approach generally is used to discount future cash flows to present value and is adjusted for liquidity as appropriate. These factors include but are not limited to: (i) attributes specific to the investment or asset; (ii) the principal market for the investment or asset; (iii) the customary participants
| | | | | | |
| 30 | | BLACKROCK FUNDS | | MARCH 31, 2014 | | |
| | |
| Notes to Financial Statements (continued) | | |
in the principal market for the investment or asset; (iv) data assumptions by market participants for the investment or asset, if reasonably available; (v) quoted prices for similar investments or assets in active markets; and (vi) other factors, such as future cash flows, interest rates, yield curves, volatilities, prepayment speeds, loss severities, credit risks, recovery rates, liquidation amounts and/or default rates. Due to the inherent uncertainty of valuations of such investments, the fair values may differ from the values that would have been used had an active market existed. The Global Valuation Committee, or its delegate, employs various methods for calibrating valuation approaches for investments where an active market does not exist, including regular due diligence of the Funds’ pricing vendors, regular reviews of key inputs and assumptions, transactional back-testing or disposition analysis to compare unrealized gains and losses to realized gains and losses, reviews of missing or stale prices and large movements in market values and reviews of any market related activity. The pricing of all Fair Value Assets is subsequently reported to the Board or a committee thereof on a quarterly basis.
Generally, trading in foreign instruments is substantially completed each day at various times prior to the close of business on the NYSE. Occasionally, events affecting the values of such instruments may occur between the foreign market close and the close of business on the NYSE that may not be reflected in the computation of each Fund’s net assets. If events (e.g., a company announcement, market volatility or a natural disaster) occur during such periods that are expected to materially affect the value of such instruments, those instruments may be Fair Value Assets and valued at their fair value, as determined in good faith by the Global Valuation Committee, or its delegate, using a pricing service and/or policies approved by the Board. Each business day, the Funds use a pricing service to assist with the valuation of certain foreign exchange-traded equity securities and foreign exchange-traded and over-the-counter (“OTC”) options (the “Systematic Fair Value Price”). Using current market factors, the Systematic Fair Value Price is designed to value such foreign securities and foreign options at fair value as of the close of business on the NYSE, which follows the close of the local markets.
Foreign Currency: The Funds’ books and records are maintained in U.S. dollars. Purchases and sales of investment securities are recorded at the rates of exchange prevailing on the respective date of such transactions. Generally, when the U.S. dollar rises in value against a foreign currency, the Funds’ investments denominated in that currency will lose value because that currency is worth fewer U.S. dollars; the opposite effect occurs if the U.S. dollar falls in relative value.
The Funds do not isolate the portion of the results of operations arising as a result of changes in the foreign exchange rates from the changes in the market prices of investments held or sold for financial reporting purposes. Accordingly, the effects of changes in foreign currency exchange rates on investments are not segregated in the Statements of Operations from the effects of changes in market prices of those investments but are included as a component of net realized and unrealized gain (loss) from investments. The Funds report realized currency gains (losses) on foreign currency related transactions as components of net realized gain
(loss) for financial reporting purposes, whereas such components are generally treated as ordinary income for federal income tax purposes.
Segregation and Collateralization: In cases where a Fund enters into certain investments (e.g., forward foreign currency exchange contracts), that would be “senior securities” for 1940 Act purposes, such Fund may segregate or designate on its books and records cash or liquid securities having a market value at least equal to the amount of a Fund’s future obligations under such investments. Doing so allows the investment to be excluded from treatment as a “senior security.” Furthermore, if required by an exchange or counterparty agreement, each Fund may be required to deliver/deposit cash and/or securities to/with an exchange, or broker-dealer or custodian as collateral for certain investments or obligations.
Investment Transactions and Investment Income: For financial reporting purposes, investment transactions are recorded on the dates the transactions are entered into (the trade dates). Realized gains and losses on investment transactions are determined on the identified cost basis. Dividend income is recorded on the ex-dividend date. Dividends from foreign securities where the ex-dividend date may have passed are subsequently recorded when the Funds are informed of the ex-dividend date. Under the applicable foreign tax laws, a withholding tax at various rates may be imposed on capital gains, dividends and interest. Income, expenses and realized and unrealized gains and losses are allocated daily to each class based on its relative net assets.
Dividends and Distributions: Dividends and distributions paid by the Funds are recorded on the ex-dividend date. Portions of return of capital distributions under U.S. GAAP may be taxed at ordinary income rates. The character of dividends and distributions is determined in accordance with federal income tax regulations, which may differ from U.S. GAAP. The portion of distributions that exceeds a Fund’s current and accumulated earnings and profits, which are measured on a tax basis, will constitute a non-taxable return of capital. Realized net capital gains can be offset by capital losses carried forward from prior years. However, certain Funds have capital loss carry-forwards from pre-2012 tax years that offset realized net capital gains but do not offset current and accumulated earnings and profits. Consequently, if distributions in any tax year are less than the Fund’s current earnings and profits but greater than net investment income and net realized capital gains (taxable income), distributions in excess of taxable income are not treated as non-taxable return of capital, but rather may be taxable to shareholders at ordinary income rates. Under certain circumstances, taxable excess distributions could be significant.
Income Taxes: It is the Funds’ policy to comply with the requirements of the Internal Revenue Code of 1986, as amended, applicable to regulated investment companies, and to distribute substantially all of their taxable income to their shareholders. Therefore, no federal income tax provision is required.
| | | | | | |
| | | BLACKROCK FUNDS | | MARCH 31, 2014 | | 31 |
| | |
| Notes to Financial Statements (continued) | | |
The Funds file U.S. federal and various state and local tax returns. No income tax returns are currently under examination. The statute of limitations on All-Cap Energy & Resources’ and Energy & Resources’ U.S. federal tax returns remains open for each of the four years ended Sep-tember 30, 2013. The statute of limitations on Emerging Markets Dividend’s U.S. federal tax returns remains open for the period ended Sep-tember 30, 2011 and the two years ended September 30, 2013. The statutes of limitations on each Fund’s state and local tax returns may remain open for an additional year depending upon the jurisdiction.
Management has analyzed tax laws and regulations and their application to the Funds’ facts and circumstances and does not believe there are any uncertain tax positions that require recognition of a tax liability.
Other: Expenses directly related to a Fund or its classes are charged to that Fund or class. Other operating expenses shared by several funds are pro rated among those funds on the basis of relative net assets or other appropriate methods. Expenses directly related to the Funds and other shared expenses pro rated to the Funds are allocated daily to each class based on its relative net assets or other appropriate methods.
The Funds have an arrangement with the custodian whereby fees may be reduced by credits earned on uninvested cash balances, which, if applicable, are shown as fees paid indirectly in the Statements of Operations. The custodian imposes fees on overdrawn cash balances, which can be offset by accumulated credits earned or may result in additional custody charges.
3. Securities and Other Investments:
Participation Notes: Emerging Markets Dividend may invest in P-Notes. P-Notes are promissory notes issued by banks or broker-dealers that are designed to offer Emerging Markets Dividend a return measured by the change in the value of the underlying security or basket of securities (the “underlying security”) while not holding the actual shares of the underlying security. P-Notes are typically used to allow Emerging Markets Dividend to gain exposure to securities traded in foreign markets that may be restricted due to country-specific regulations. When the P-Note matures, the issuer will pay to, or receive from, Emerging Markets Dividend the difference between the value of the underlying security at the time of the purchase and the underlying security’s value at maturity of the P-Notes. Income received on P-Notes is recorded by Emerging Markets Dividend as dividend income in the Statements of Operations. An investment in a P-Note involves additional risks beyond the risks normally associated with a direct investment in the underlying security. While the holder of a P-Note is entitled to receive from the bank or broker-dealer any dividends paid by the underlying security, the holder is not entitled to the same rights (e.g., voting rights) as a direct owner of the underlying security. P-Notes are considered general unsecured contractual obligations of the bank or broker-dealer. Emerging Markets Dividend must rely on the creditworthiness of the issuer for its investment returns on the P-Notes and has no rights against the issuer of the underlying security. A P-Note may be more volatile and less liquid than other investments held by Emerging Markets Dividend since the P-Note
generally is dependent on the liquidity in the local trading market for the underlying security.
Securities Lending: Each Fund may lend its securities to approved borrowers, such as brokers, dealers and other financial institutions. The borrower pledges collateral consisting of cash, an irrevocable letter of credit issued by a bank, or securities issued or guaranteed by the U.S. government. The initial collateral received by each Fund is required to have a value of at least 102% of the current value of the loaned securities for securities traded on U.S. exchanges and a value of at least 105% for all other securities. The collateral is maintained thereafter, at a value equal to at least 100% of the current market value of the securities on loan. The market value of the loaned securities is determined at the close of each business day of the Fund and any additional required collateral is delivered to the Fund on the next business day. During the term of the loan, each Fund earns dividend or interest income on the securities loaned but does not receive interest income on the securities received as collateral. Loans of securities are terminable at any time and the borrower, after notice, is required to return borrowed securities within the standard time period for settlement of securities transactions.
The market value of securities on loan and the value of the related collateral are shown separately in the Statements of Assets and Liabilities as a component of investments at value, and collateral on securities loaned at value, respectively. As of March 31, 2014, any securities on loan were collateralized by cash. The cash collateral invested by the securities lending agent, BlackRock Investment Management, LLC (“BIM”), if any, is disclosed in the Schedules of Investments.
Securities lending transactions are entered into by the Funds under Master Securities Lending Agreements (each, an “MSLA”) which provide the right, in the event of default (including bankruptcy or insolvency), for the non-defaulting party to liquidate the collateral and calculate a net exposure to the defaulting party or request additional collateral. In the event that a borrower defaults, each Fund, as lender, would offset the market value of the collateral received against the market value of the securities loaned. The value of the collateral is typically greater than that of the market value of the securities loaned, leaving the lender with a net amount payable to the defaulting party. However, bankruptcy or insolvency laws of a particular jurisdiction may impose restrictions on or prohibitions against such a right of offset in the event of an MSLA counterparty’s bankruptcy or insolvency. Under the MSLA, the borrower can resell or re-pledge the loaned securities, and the Funds can reinvest cash collateral, or, upon an event of default, resell or re-pledge the collateral.
The risks of securities lending include the risk that the borrower may not provide additional collateral when required or may not return the securities when due. To mitigate these risks, the Funds benefit from a borrower default indemnity provided by BIM. BIM’s indemnity allows for full replacement of the securities lent. Each Fund could suffer a loss if the value of an investment purchased with cash collateral falls below the
| | | | | | |
| 32 | | BLACKROCK FUNDS | | MARCH 31, 2014 | | |
| | |
| Notes to Financial Statements (continued) | | |
market value of loaned securities or if the value of an investment purchased with cash collateral falls below the value of the original cash collateral received.
4. Derivative Financial Instruments:
Emerging Markets Dividend engages in various portfolio investment strategies using derivative contracts both to increase the returns of Emerging Markets Dividend and/or to economically hedge its exposure to certain risks such as foreign currency exchange rate risk. These contracts may be transacted on an exchange or OTC.
Forward Foreign Currency Exchange Contracts: Emerging Markets Dividend enters into forward foreign currency exchange contracts as an economic hedge against either specific transactions or portfolio instruments or to obtain exposure to, or hedge exposure away from, foreign currencies (foreign currency exchange rate risk). A forward foreign currency exchange contract is an agreement between two parties to buy and sell a currency at a set exchange rate on a future date. Forward foreign currency exchange contracts, when used by Emerging Markets Dividend, help to manage the overall exposure to the currencies in which some of the investments held by Emerging Markets Dividend are denominated. The contract is marked-to-market daily and the change in market value is recorded by Emerging Markets Dividend as an unrealized gain or loss. When the contract is closed, Emerging Markets Dividend records a realized gain or loss equal to the difference between the value at the time it was opened and the value at the time it was closed. The use of forward foreign currency exchange contracts involves the risk that the value of a foreign currency exchange contract changes unfavorably due to movements in the value of the referenced foreign currencies.
The following is a summary of Emerging Markets Dividend’s derivative financial instruments categorized by risk exposure:
| | | | | | |
| Fair Values of Derivative Financial Instruments as of March 31, 2014 | |
| | | Derivative Assets | |
| | | Statements of Assets and Liabilities Location | | Value | |
Forward foreign currency exchange contracts | | Unrealized
appreciation on forward
foreign currency
exchange contracts | | $ | 5,047 | |
| |
| |
| | | Derivative Liabilities | |
| | | Statements of Assets and Liabilities Location | | Value | |
Forward foreign currency exchange contracts | | Unrealized
depreciation on forward
foreign currency
exchange contracts | | $ | 10,535 | |
| |
| | | | |
The Effect of Derivative Financial Instruments in the Statements of Operations Six Months Ended March 31, 2014 | |
| Net Realized Gain From | |
Foreign currency exchange contracts: | | | | |
Foreign currency transactions | | $ | 3,092 | |
| |
| | | | |
| Net Change in Unrealized Appreciation/Depreciation on | | | |
Foreign currency exchange contracts: | | | | |
Foreign currency translations | | $ | (5,488 | ) |
| |
For the six months ended March 31, 2014, the average quarterly balances of outstanding derivative financial instruments were as follows:
| | | | |
Forward foreign currency exchange contracts: | | | | |
Average number of contracts - USD purchased | | | 3 | |
Average number of contracts - USD sold | | | 2 | |
Average USD amounts purchased | | $ | 213,972 | |
Average USD amounts sold | | $ | 162,044 | |
Counterparty Credit Risk: A derivative contract may suffer a mark-to-market loss if the value of the contract decreases due to an unfavorable change in the market rates or values of the underlying instrument. Losses can also occur if the counterparty does not perform under the contract.
A Fund’s risk of loss from counterparty credit risk on OTC derivatives is generally limited to the aggregate unrealized gain netted against any collateral held by such Fund.
In order to better define its contractual rights and to secure rights that will help the Funds mitigate their counterparty risk, a Fund may enter into an International Swaps and Derivatives Association, Inc. Master Agreement (“ISDA Master Agreement”) or similar agreement with its derivative contract counterparties. An ISDA Master Agreement is a bilateral agreement between Emerging Markets Dividend and a counterparty that governs certain OTC derivatives and typically contains, among other things, collateral posting terms and netting provisions in the event of a default and/or termination event. Under an ISDA Master Agreement, Emerging Markets Dividend may, under certain circumstances, offset with the counter- party certain derivative financial instruments’ payables and/or receivables with collateral held and/or posted and create one single net payment. The provisions of the ISDA Master Agreement typically permit a single net payment in the event of default including the bankruptcy or insolvency of the counterparty. Bankruptcy or insolvency laws of a particular jurisdiction may impose restrictions on or prohibitions against the right of offset in bankruptcy, insolvency or other events. In addition, certain ISDA Master Agreements allow counterparties to OTC derivatives to terminate derivative contracts prior to maturity in the event Emerging Markets Dividend’s net assets decline by a stated percentage or Emerging Markets Dividend fails to meet the terms of its ISDA Master Agreements, which would cause Emerging Markets Dividend to accelerate payment of any net liability owed to the counterparty.
| | | | | | |
| | | BLACKROCK FUNDS | | MARCH 31, 2014 | | 33 |
| | |
| Notes to Financial Statements (continued) | | |
At March 31, 2014, Emerging Markets Dividend’s derivative assets and liabilities (by type) are as follows:
| | | | | | | | |
| | | Assets | | | Liabilities | |
Derivative Financial Instruments: | | | | | | | | |
Forward foreign currency exchange contracts | | $ | 5,047 | | | $ | 10,535 | |
| |
Total derivative assets and liabilities subject to a Master Netting Agreement (“MNA”) | | $ | 5,047 | | | $ | 10,535 | |
| | | | |
The following tables present Emerging Markets Dividend’s derivative assets and liabilities by counterparty net of amounts available for offset under an MNA and net of the related collateral received and pledged by Emerging Markets Dividend as of March 31, 2014:
| | | | | | | | | | | | | | | | | | | | |
| Counterparty | | Derivative Assets Subject to an MNA by Counterparty | | | Derivatives Available for Offset1 | | | Non-cash Collateral Received | | | Cash Collateral Received | | | Net Amount of Derivative Assets2 | |
Citibank N.A. | | $ | 1,800 | | | $ | (1,800 | ) | | | — | | | | — | | | | — | |
Deutsche Bank AG | | | 322 | | | | — | | | | — | | | | — | | | $ | 322 | |
JPMorgan Chase Bank N.A. | | | 2,925 | | | | — | | | | — | | | | — | | | | 2,925 | |
| |
Total | | $ | 5,047 | | | $ | (1,800 | ) | | | — | | | | — | | | $ | 3,247 | |
| | | | |
| | | | | | | | | | | | | | | | | | | | |
| Counterparty | | Derivative Liabilities Subject to an MNA by Counterparty | | | Derivatives Available for Offset1 | | | Non-cash Collateral Received | | | Cash
Collateral Received | | | Net Amount of Derivative Liabilities3 | |
Citibank N.A. | | $ | 5,513 | | | $ | (1,800 | ) | | | — | | | | — | | | $ | 3,713 | |
Morgan Stanley & Co. International PLC | | | 5,022 | | | | — | | | | — | | | | — | | | | 5,022 | |
| |
Total | | $ | 10,535 | | | $ | (1,800 | ) | | | — | | | | — | | | $ | 8,735 | |
| | | | |
| | 1 | The amount of derivatives available for offset is limited to the amount of derivative assets and/or liabilities that are subject to an MNA. |
| | 2 | Net amount represents the net amount receivable from the counterparty in the event of default. |
| | 3 | Net amount represents the net amount payable due to the counterparty in the event of default. |
5. Investment Advisory Agreement and Other Transactions with Affiliates:
The PNC Financial Services Group, Inc. is the largest stockholder and an affiliate, for 1940 Act purposes, of BlackRock.
The Trust, on behalf of the Funds, entered into an Investment Advisory Agreement with the Manager, the Funds’ investment advisor, an indirect, wholly owned subsidiary of BlackRock, to provide investment advisory and administration services. The Manager is responsible for the management of each Fund’s portfolio and provides the necessary personnel, facilities, equipment and certain other services necessary to the operations of each Fund. For such services, each Fund, except Emerging Markets Dividend pays the Manager a monthly fee based on a percentage of each Fund’s average daily net assets at the following annual rates:
| | | | |
| Average Daily Net Assets | | Investment Advisory Fee | |
First $1 Billion | | | 0.750 | % |
$1 Billion - $2 Billion | | | 0.700 | % |
$2 Billion - $3 Billion | | | 0.675 | % |
Greater than $3 Billion | | | 0.650 | % |
Emerging Markets Dividend pays the Manager a monthly fee based on a percentage of its average daily net assets at the following annual rates:
| | | | |
| Average Daily Net Assets | | Investment Advisory Fee | |
First $1 Billion | | | 1.00 | % |
$1 Billion - $3 Billion | | | 0.94 | % |
$3 Billion - $5 Billion | | | 0.90 | % |
$5 Billion - $10 Billion | | | 0.87 | % |
Greater than $10 Billion | | | 0.85 | % |
The Manager voluntarily agreed to waive its investment advisory fees by the amount of investment advisory fees each Fund pays to the Manager indirectly through its investment in affiliated money market funds. However, the Manager does not waive its investment advisory fees by the amount of investment advisory fees paid in connection with each Fund’s investment in other affiliated investment companies, if any. These amounts are included in fees waived by Manager in the Statements of Operations. For the six months ended March 31, 2014, the amounts waived were as follows:
| | | | |
All-Cap Energy & Resources | | $ | 1,776 | |
Emerging Markets Dividend | | $ | 58 | |
Energy & Resources | | $ | 8,840 | |
The Manager, on behalf of each Fund, entered into sub-advisory agreements with BlackRock International Limited (“BIL”), an affiliate of the Manager. The Manager pays BIL, for services it provides, a monthly fee
| | | | | | |
| 34 | | BLACKROCK FUNDS | | MARCH 31, 2014 | | |
| | |
| Notes to Financial Statements (continued) | | |
that is a percentage of the investment advisory fees paid by each Fund to the Manager.
The Trust, on behalf of the Funds, entered into a Distribution Agreement and a Distribution and Service Plan with BlackRock Investments, LLC (“BRIL”), an affiliate of the Manager. Pursuant to the Distribution and Service Plan and in accordance with Rule 12b-1 under the 1940 Act, the Funds pay BRIL ongoing service and distribution fees. The fees are accrued daily and paid monthly at annual rates based upon the average daily net assets of the shares of each Fund as follows:
| | | | | | | | |
| | | Service Fee | | | Distribution Fee | |
Service | | | 0.25 | % | | | — | |
Investor A | | | 0.25 | % | | | — | |
Investor B | | | 0.25 | % | | | 0.75 | % |
Investor C | | | 0.25 | % | | | 0.75 | % |
Pursuant to sub-agreements with BRIL, broker-dealers and BRIL provide shareholder servicing and distribution services to each Fund. The ongoing service and/or distribution fee compensates BRIL and each broker-dealer for providing shareholder servicing and/or distribution related services to Service, Investor A, Investor B and Investor C shareholders.
For the six months ended March 31, 2014, the following table shows the class specific service and distribution fees borne directly by each class of each Fund:
| | | | | | | | | | | | |
| | | All-Cap Energy & Resources | | | Emerging Markets Dividend | | | Energy & Resources | |
Service | | $ | 2,580 | | | | — | | | | — | |
Investor A | | | 126,390 | | | $ | 1,867 | | | $ | 508,287 | |
Investor B | | | 40,892 | | | | — | | | | 20,693 | |
Investor C | | | 334,054 | | | | 1,566 | | | | 492,727 | |
| | | | |
Total | | $ | 503,916 | | | $ | 3,433 | | | $ | 1,021,707 | |
| | | | |
Pursuant to written agreements, certain financial intermediaries, some of which may be affiliates, provide the Funds with sub-accounting, recordkeeping, sub-transfer agency and other administrative services with respect to sub-accounts they service. For these services, these entities receive an asset based fee or an annual fee per shareholder account, which will vary depending on share class and/or net assets. For the six months ended March 31, 2014, the Funds paid the following to affiliates in return for these services, which are included in transfer agent — class specific in the Statements of Operations:
| | | | | | | | |
| | | All-Cap Energy & Resources | | | Energy & Resources | |
Investor A | | | — | | | $ | 114 | |
Investor C | | $ | 6 | | | | 20 | |
| | | | |
Total | | $ | 6 | | | $ | 134 | |
| | | | |
The Manager maintains a call center, which is responsible for providing certain shareholder services to the Funds, such as responding to shareholder inquiries and processing transactions based upon instructions from shareholders with respect to the subscription and redemption of
Fund shares. For the six months ended March 31, 2014, each Fund reimbursed the Manager the following amounts for costs incurred in running the call center, which are included in transfer agent — class specific in the Statements of Operations:
| | | | | | | | | | | | |
| | | All-Cap Energy & Resources | | | Emerging Markets Dividend | | | Energy & Resources | |
Institutional | | $ | 486 | | | $ | 62 | | | $ | 946 | |
Investor A | | | 7,411 | | | | 61 | | | | 18,834 | |
Investor B | | | 1,425 | | | | — | | | | 1,063 | |
Investor C | | | 1,811 | | | | 25 | | | | 2,335 | |
| | | | |
Total | | $ | 11,133 | | | $ | 148 | | | $ | 23,178 | |
| | | | |
For the six months ended March 31, 2014, the following table shows the class specific transfer agent fees borne directly by each class of each Fund:
| | | | | | | | | | | | |
| | | All-Cap Energy & Resources | | | Emerging Markets Dividend | | | Energy & Resources | |
Institutional | | $ | 13,517 | | | $ | 605 | | | $ | 89,132 | |
Service | | | 1,918 | | | | — | | | | — | |
Investor A | | | 103,433 | | | | 975 | | | | 390,851 | |
Investor B | | | 17,934 | | | | — | | | | 10,562 | |
Investor C | | | 60,803 | | | | 245 | | | | 94,185 | |
| | | | |
Total | | $ | 197,605 | | | $ | 1,825 | | | $ | 584,730 | |
| | | | |
BNY Mellon Investment Servicing (US) Inc. (“BNYMIS”) and the Manager act as co-administrators for the Funds. For these services, the co-administrators receive an administration fee computed daily and payable monthly to each administrator pursuant to separate fee arrangements, based on a percentage of the average daily net assets of each Fund. The combined administration fee, which is shown as administration in the Statements of Operations, is paid at the following annual rates:
| | | | |
| Average Daily Net Assets | | Administration Fee | |
First $500 Million | | | 0.075 | % |
$500 Million - $1 Billion | | | 0.065 | % |
Greater than $1 Billion | | | 0.055 | % |
In addition, each of the share classes is charged an administration fee, which is shown as administration — class specific in the Statements of Operations, based on the following percentages of average daily net assets of each respective class:
| | | | |
| Average Daily Net Assets | | Administration Fee — Class Specific | |
First $500 Million | | | 0.025 | % |
$500 Million - $1 Billion | | | 0.015 | % |
Greater than $1 Billion | | | 0.005 | % |
For the six months ended March 31, 2014, the Funds paid the following to the Manager in return for these services, which are included in administration and administration — class specific in the Statements of
| | | | | | |
| | | BLACKROCK FUNDS | | MARCH 31, 2014 | | 35 |
| | |
| Notes to Financial Statements (continued) | | |
Operations:
| | | | |
All-Cap Energy & Resources | | $ | 73,093 | |
Emerging Markets Dividend | | $ | 562 | |
Energy & Resources | | $ | 212,710 | |
For the six months ended March 31, 2014, the following table shows the class specific administration fees borne directly by each class of each Fund:
| | | | | | | | | | | | |
| | | All-Cap Energy & Resources | | | Emerging Markets Dividend | | | Energy & Resources | |
Institutional | | $ | 4,388 | | | $ | 336 | | | $ | 11,719 | |
Service | | | 258 | | | | — | | | | — | |
Investor A | | | 12,640 | | | | 187 | | | | 50,829 | |
Investor B | | | 1,022 | | �� | | — | | | | 517 | |
Investor C | | | 8,351 | | | | 39 | | | | 12,318 | |
| | | | |
Total | | $ | 26,659 | | | $ | 562 | | | $ | 75,383 | |
| | | | |
BNYMIS and the Manager may have, at their discretion, voluntarily waived all or any portion of their administration fees for a Fund or a share class which are included in administration fees waived and administration fees waived — class specific in the Statements of Operations.
The Manager contractually agreed to waive and/or reimburse fees or expenses in order to limit expenses, excluding interest expense, dividend expense, income tax expense, acquired fund fees and expenses and certain other fund expenses, which constitute extraordinary expenses not incurred in the ordinary course of the Funds’ business. The expense limitations as a percentage of average daily net assets are as follows:
| | | | | | | | | | | | |
| | | All-Cap Energy &
Resources | | | Emerging Dividend Markets | | | Energy & Resources | |
BlackRock | | | 0.92 | %1 | | | N/A | | | | N/A | |
Institutional | | | 0.96 | % | | | 1.50 | % | | | 1.07 | % |
Service | | | 1.38 | % | | | N/A | | | | 1.38 | %1 |
Investor A | | | 1.38 | % | | | 1.75 | % | | | 1.38 | % |
Investor B | | | 2.10 | % | | | N/A | | | | 2.10 | % |
Investor C | | | 2.10 | % | | | 2.50 | % | | | 2.10 | % |
Class R | | | 1.83 | %1 | | | N/A | | | | 1.94 | %1 |
| | 1 | There were no shares outstanding as of March 31, 2014. |
The Manager has agreed not to reduce or discontinue this contractual waiver or reimbursement prior to February 1, 2015 unless approved by the Board, including a majority of the Independent Trustees.
The Manager has agreed not to reduce or discontinue this contractual waiver or reimbursement prior to September 1, 2014 unless approved by the Board, including a majority of the Independent Trustees.
These amounts waived or reimbursed are included in fees waived by Manager, and shown as administration fees waived, administration fees waived — class specific, transfer agent fees waived — class specific, transfer agent fees reimbursed — class specific and expenses reimbursed by Manager, respectively, in the Statements of Operations. For
the six months ended March 31, 2014, the Manager waived $22,433 of investment advisory fees for Emerging Markets Dividend, which is included in fees waived by Manager.
Class specific expense waivers or reimbursements are as follows:
| | | | | | | | | | | | |
| Administration Fees Waived | | | | | | | | | |
| | | All-Cap Energy & Resources | | | Emerging Markets Dividend | | | Energy & Resources | |
Institutional | | $ | 4,388 | | | $ | 336 | | | $ | 6,141 | |
Service | | | 55 | | | | — | | | | — | |
Investor A | | | 9,094 | | | | 187 | | | | — | |
Investor B | | | 1,022 | | | | — | | | | 517 | |
Investor C | | | 7,707 | | | | 39 | | | | 1,415 | |
| | | | |
Total | | $ | 22,266 | | | $ | 562 | | | $ | 8,073 | |
| | | | |
| | | | | | | | | | | | |
| Transfer Agent Fees Waived | |
| | | All-Cap Energy & Resources | | | Emerging Markets Dividend | | | Energy & Resources | |
Institutional | | $ | 486 | | | $ | 62 | | | $ | 495 | |
Investor A | | | 1,489 | | | | 61 | | | | — | |
Investor B | | | 1,425 | | | | — | | | | 1,063 | |
Investor C | | | 1,054 | | | | 25 | | | | — | |
| | | | |
Total | | $ | 4,454 | | | $ | 148 | | | $ | 1,558 | |
| | | | |
| | | | | | | | | | | | |
| Transfer Agent Fees Reimbursed | |
| | | All-Cap Energy & Resources | | | Emerging Markets Dividend | | | Energy & Resources | |
Institutional | | $ | 6,100 | | | $ | 517 | | | $ | 2,173 | |
Service | | | 10 | | | | — | | | | — | |
Investor A | | | 6 | | | | 897 | | | | — | |
Investor B | | | 9,239 | | | | — | | | | 4,721 | |
Investor C | | | 1,225 | | | | 210 | | | | — | |
| | | | |
Total | | $ | 16,580 | | | $ | 1,624 | | | $ | 6,894 | |
| | | | |
If during a Fund’s fiscal year the operating expenses of a share class, that at any time during the prior two fiscal years received a waiver or reimbursement from the Manager, are less than the expense limit for that share class, the Manager is entitled to be reimbursed by such share class up to the lesser of (a) the amount of fees waived or expenses reimbursed during those prior two fiscal years under the agreement and (b) the amount by which the expense limit for that share class exceeds the operating expenses of the share class for the current fiscal year, provided that: (1) the Fund, of which the share class is a part, has more than $50 million in assets for the fiscal year and (2) the Manager or an affiliate continues to serve as the Fund’s investment advisor or administrator. In the event the expense limit for a share class is changed subsequent to a fiscal year in which the Manager becomes entitled to reimbursement for fees waived or reimbursed, the amount available to reimburse the Manager shall be calculated by reference to the expense limit for that share class in effect at the time the Manager became entitled to receive such reimbursement, rather than the subsequently changed expense limit for that share class.
| | | | | | |
| 36 | | BLACKROCK FUNDS | | MARCH 31, 2014 | | |
| | |
| Notes to Financial Statements (continued) | | |
For the six months ended March 31, 2014, the Manager recouped the following Fund level and class specific waivers and/or reimbursements previously recorded by the Funds:
| | | | | | | | |
| | | All-Cap Energy & Resources | | | Energy & Resources | |
Institutional | | | — | | | $ | 1,566 | |
Service | | $ | 12 | | | | — | |
Investor A | | | 33 | | | | 74 | |
Investor B | | | — | | | | — | |
Investor C | | | — | | | | 8,806 | |
| | | | |
Total | | $ | 45 | | | $ | 10,446 | |
| | | | |
On March 31, 2014, the Fund level and class specific waivers and/or reimbursements subject to possible future recoupment under the expense limitation agreement are as follows:
| | | | | | | | | | | | |
| | | Expiring September 30, | |
| | | 2014 | | | 2015 | | | 2016 | |
All-Cap Energy & Resources | | | | | | | | | | | | |
Fund Level | | | — | | | $ | 406 | | | | — | |
Institutional | | $ | 8,691 | | | $ | 25,585 | | | $ | 10,974 | |
Service | | | — | | | | — | | | $ | 65 | |
Investor A | | | — | | | $ | 15,689 | | | $ | 10,589 | |
Investor B | | $ | 17,006 | | | $ | 22,079 | | | $ | 11,686 | |
Investor C | | | — | | | $ | 22,395 | | | $ | 9,986 | |
Emerging Markets Dividend | | | | | | | | | | | | |
Fund Level | | $ | 291,902 | | | $ | 221,737 | | | $ | 102,071 | |
Institutional | | $ | 741 | | | $ | 1,750 | | | $ | 915 | |
Investor A | | $ | 592 | | | $ | 1,610 | | | $ | 1,145 | |
Investor C | | $ | 235 | | | $ | 461 | | | $ | 274 | |
Energy & Resources | | | | | | | | | | | | |
Institutional | | | — | | | | — | | | $ | 8,809 | |
Investor B | | $ | 8,328 | | | $ | 11,644 | | | $ | 6,301 | |
Investor C | | | — | | | $ | 1,034 | | | $ | 1,415 | |
For the six months ended March 31, 2014, affiliates earned underwriting discounts, direct commissions and dealer concessions on sales of each Fund’s Investor A Shares as follows:
| | | | |
All-Cap Energy & Resources | | $ | 2,906 | |
Emerging Markets Dividend | | $ | 209 | |
Energy & Resources | | $ | 9,229 | |
For the six months ended March 31, 2014, affiliates received CDSCs as follows:
| | | | | | | | | | | | |
| | | Investor A | | | Investor B | | | Investor C | |
All-Cap Energy & Resources | | | — | | | $ | 1,700 | | | $ | 578 | |
Emerging Markets Dividend | | | — | | | | — | | | $ | 26 | |
Energy & Resources | | $ | 7,020 | | | $ | 2,957 | | | $ | 593 | |
The U.S. Securities and Exchange Commission has issued an exemptive order which permits BIM, an affiliate of the Manager, to serve as securities lending agent for the Funds, subject to applicable conditions. As securities lending agent, BIM bears all operational costs directly related to securities lending. The Funds are responsible for expenses in connection with the investment of cash collateral received for securities on loan
(the “collateral investment expenses”). The cash collateral is invested in a private investment company managed by the Manager or its affiliates. However, BIM has agreed to cap the collateral investment expenses of the private investment company to an annual rate of 0.04%. The investment advisor to the private investment company will not charge any advisory fees with respect to shares purchased by the Funds.
Securities lending income is equal to the total of income earned from the reinvestment of cash collateral, net of fees and other payments to and from borrowers of securities, and less the collateral investment expenses. Each Fund retains a portion of securities lending income and remits a remaining portion to BIM as compensation for its services as securities lending agent. Pursuant to the securities lending agreement effective February 1,2014, BIM may lend securities only when the difference between the borrower rebate rate and the risk free rate exceeds a certain level (such securities, the “specials only securities”).
Pursuant to a securities lending agreement effective February 1, 2014, each Fund retains 80% of securities lending income. In addition, commencing the business day following the date that the aggregate securities lending income earned across the Equity-Liquidity Complex in a calendar year exceeds the aggregate securities lending income earned across the Equity-Liquidity Complex through the lending of specials only securities in the calendar year 2013, each Fund, pursuant to the securities lending agreement, will retain for the remainder of the calendar year securities lending income in an amount equal to 85% of securities lending income. Prior to February 1, 2014, each Fund retained 65% of securities lending income and paid a fee to BIM equal to 35% of such income. The share of securities lending income earned by each Fund, if any, is shown as securities lending — affiliated — net in the Statements of Operations. For the six months ended March 31, 2014, All-Cap Energy & Resources paid BIM $509 for securities lending agent services.
The Funds recorded payments from an affiliate to compensate for foregone securities lending revenue, which is shown as other income — affiliated in the Statements of Operations.
Certain officers and/or trustees of the Trust are officers and/or directors of BlackRock or its affiliates. The Funds reimburse the Manager for a portion of the compensation paid to the Trust’s Chief Compliance Officer, which is included in officer and trustees in the Statements of Operations.
The Funds may purchase securities from, or sell securities to, an affiliated fund provided the affiliation is due solely to having a common investment advisor, common officers, or common trustees. For the six months ended March 31, 2014, the purchase and sale transaction with an affiliated fund in compliance with Rule 17a-7 under the 1940 Act were as follows:
| | | | | | | | |
| | | Purchases | | | Sales | |
All-Cap Energy & Resources | | $ | 3,167,071 | | | $ | 2,520,785 | |
Energy & Resources | | $ | 12,411,058 | | | | — | |
| | | | | | |
| | | BLACKROCK FUNDS | | MARCH 31, 2014 | | 37 |
| | |
| Notes to Financial Statements (continued) | | |
6. Purchases and Sales:
Purchases and sales of investments, excluding short-term securities, for the six months ended March 31, 2014 were as follows:
| | | | | | | | |
| | | Purchases | | | Sales | |
All-Cap Energy & Resources | | $ | 113,320,427 | | | $ | 134,701,283 | |
Emerging Markets Dividend | | $ | 2,193,878 | | | $ | 1,627,164 | |
Energy & Resources | | $ | 241,980,938 | | | $ | 318,173,885 | |
7. Income Tax Information:
As of September 30, 2013, the Funds had capital loss carryforwards available to offset future realized capital gains through the indicated expiration dates as follows:
| | | | | | | | | | | | |
| Expires September 30, | | All-Cap Energy & Resources | | | Emerging Markets Dividend | | | Energy & Resources | |
2018 | | $ | 98,676,572 | | | | — | | | | — | |
2019 | | | — | | | $ | 18,788 | | | | — | |
No expiration date1 | | | — | | | | 510,449 | | | $ | 100,034,290 | |
| | | | |
Total | | $ | 98,676,572 | | | $ | 529,237 | | | $ | 100,034,290 | |
| | | | |
| | 1 | Must be utilized prior to losses subject to expiration. |
As of March 31, 2014, gross unrealized appreciation and depreciation based on cost for federal income tax purposes were as follows:
| | | | | | | | | | | | |
| | | All-Cap Energy & Resources | | | Emerging Markets Dividend | | | Energy & Resources | |
Tax cost | | $ | 171,402,546 | | | $ | 4,592,148 | | | $ | 457,154,570 | |
| | | | |
Gross unrealized appreciation | | $ | 36,917,014 | | | $ | 284,284 | | | $ | 160,083,819 | |
Gross unrealized depreciation | | | (978,718 | ) | | | (185,101 | ) | | | (25,163,942 | ) |
| | | | |
Net unrealized appreciation | | $ | 35,938,296 | | | $ | 99,183 | | | $ | 134,919,877 | |
| | | | |
8. Bank Borrowings:
The Trust, on behalf of the Funds, along with certain other funds managed by the Manager and its affiliates (“Participating Funds”), is a party to a 364-day, $800 million credit agreement with a group of lenders, under which the Funds may borrow to fund shareholder redemptions. The agreement expires in April 2014. Excluding commitments designated for a certain individual fund, other Participating Funds, including the Funds, can borrow up to an aggregate commitment amount of $500 million, subject to asset coverage and other limitations as specified in the agreement. The credit agreement has the following terms: a fee of 0.065% per annum on unused commitment amounts and interest at a rate equal to the higher of (a) the one-month LIBOR plus 0.80% per annum or (b) the Fed Funds rate plus 0.80% per annum on amounts borrowed. Participating Funds paid administration and arrangement fees
which, along with commitment fees, were allocated among such funds based upon portions of the aggregate commitment available to them and relative net assets of Participating Funds. The Funds did not borrow under the credit agreement during the six months ended March 31, 2014.
9. Concentration, Market and Credit Risk:
In the normal course of business, the Funds invest in securities and enter into transactions where risks exist due to fluctuations in the market (market risk) or failure of the issuer of a security to meet all its obligations (issuer credit risk). The value of securities held by the Funds may decline in response to certain events, including those directly involving the issuers whose securities are owned by the Funds; conditions affecting the general economy; overall market changes; local, regional or global political, social or economic instability; and currency and interest rate and price fluctuations. Similar to issuer credit risk, the Funds may be exposed to counterparty credit risk, or the risk that an entity with which the Funds have unsettled or open transactions may fail to or be unable to perform on its commitments. The Funds manage counterparty credit risk by entering into transactions only with counterparties that they believe have the financial resources to honor their obligations and by monitoring the financial stability of those counterparties. Financial assets, which potentially expose the Funds to market, issuer and counterparty credit risks, consist principally of financial instruments and receivables due from counterparties. The extent of the Funds’ exposure to market, issuer and counterparty credit risks with respect to these financial assets is generally approximated by their value recorded in the Statements of Assets and Liabilities, less any collateral held by the Funds.
As of March 31, 2014, All-Cap Energy & Resources and Energy & Resources invested a significant portion of their assets in securities in the energy sector. Changes in economic conditions affecting the energy sector would have a greater impact on All-Cap Energy & Resources and Energy & Resources and could affect the value, income and/or liquidity of positions in such securities.
As of March 31, 2014, Emerging Markets Dividend had the following industry classifications:
| | | | |
| Industry | | | |
Banks | | | 12 | % |
Transportation Infrastructure | | | 11 | |
Wireless Telecommunication Services | | | 10 | |
Oil, Gas & Consumable Fuels | | | 9 | |
Insurance | | | 7 | |
Metals & Mining | | | 5 | |
Other1 | | | 46 | |
| | 1 | All other industries held were each less than 5% of long-term investments. |
| | | | | | |
| 38 | | BLACKROCK FUNDS | | MARCH 31, 2014 | | |
| | |
| Notes to Financial Statements (continued) | | |
10. Capital Share Transactions:
Transactions in capital shares for each class were as follows:
| | | | | | | | | | | | | | | | | | |
| | | Six Months
Ended
March 31, 2014 | | | | | Year Ended
September 30, 2013 | |
| All-Cap Energy & Resources | | Shares | | | Amount | | | | | Shares | | | Amount | |
Institutional | | | | | | | | | | | | | | | | | | |
Shares sold | | | 222,750 | | | $ | 3,449,999 | | | | | | 609,736 | | | $ | 8,327,536 | |
Shares issued in reinvestment of dividends | | | 15,019 | | | | 229,181 | | | | | | 3,624 | | | | 48,053 | |
Shares redeemed | | | (381,906 | ) | | | (5,913,974 | ) | | | | | (18,459,698 | ) | | | (251,072,170 | ) |
| | | | | | | | | | |
Net decrease | | | (144,137 | ) | | $ | (2,234,794 | ) | | | | | (17,846,338 | ) | | $ | (242,696,581 | ) |
| | | | | | | | | | |
| | | | | | | | | | | | | | | | | | |
Service | | | | | | | | | | | | | | | | | | |
Shares sold | | | 7,071 | | | $ | 104,560 | | | | | | 11,893 | | | $ | 160,737 | |
Shares issued in reinvestment of dividends | | | 521 | | | | 7,757 | | | | | | — | | | | — | |
Shares redeemed | | | (37,100 | ) | | | (559,027 | ) | | | | | (147,367 | ) | | | (1,963,145 | ) |
| | | | | | | | | | |
Net decrease | | | (29,508 | ) | | $ | (446,710 | ) | | | | | (135,474 | ) | | $ | (1,802,408 | ) |
| | | | | | | | | | |
| | | | | | | | | | | | | | | | | | |
Investor A | | | | | | | | | | | | | | | | | | |
Shares sold and automatic conversion of shares | | | 521,601 | | | $ | 7,872,618 | | | | | | 857,797 | | | $ | 11,617,915 | |
Shares issued in reinvestment of dividends | | | 28,029 | | | | 416,519 | | | | | | — | | | | — | |
Shares redeemed | | | (1,137,260 | ) | | | (17,146,066 | ) | | | | | (4,341,334 | ) | | | (57,971,504 | ) |
| | | | | | | | | | |
Net decrease | | | (587,630 | ) | | $ | (8,856,929 | ) | | | | | (3,483,537 | ) | | $ | (46,353,589 | ) |
| | | | | | | | | | |
| | | | | | | | | | | | | | | | | | |
Investor B | | | | | | | | | | | | | | | | | | |
Shares sold | | | 2,497 | | | $ | 36,039 | | | | | | 4,373 | | | $ | 53,854 | |
Shares redeemed and automatic conversion of shares | | | (270,212 | ) | | | (3,853,782 | ) | | | | | (512,064 | ) | | | (6,549,791 | ) |
| | | | | | | | | | |
Net decrease | | | (267,715 | ) | | $ | (3,817,743 | ) | | | | | (507,691 | ) | | $ | (6,495,937 | ) |
| | | | | | | | | | |
| | | | | | | | | | | | | | | | | | |
Investor C | | | | | | | | | | | | | | | | | | |
Shares sold | | | 106,515 | | | $ | 1,528,906 | | | | | | 247,719 | | | $ | 3,143,188 | |
Shares redeemed | | | (647,546 | ) | | | (9,268,217 | ) | | | | | (2,067,037 | ) | | | (26,183,763 | ) |
| | | | | | | | | | |
Net decrease | | | (541,031 | ) | | $ | (7,739,311 | ) | | | | | (1,819,318 | ) | | $ | (23,040,575 | ) |
| | | | | | | | | | |
Total Net Decrease | | | (1,570,021 | ) | | $ | (23,095,487 | ) | | | | | (23,792,358 | ) | | $ | (320,389,090 | ) |
| | | | | | | | | | |
| | | | | | | | | | | | | | | | | | |
Emerging Markets Dividend Fund | | | | | | | | | | | | | | | | | | |
Institutional | | | | | | | | | | | | | | | | | | |
Shares sold | | | 4,163 | | | $ | 36,457 | | | | | | 154,817 | | | $ | 1,426,951 | |
Shares issued in reinvestment of dividends | | | 277 | | | | 2,415 | | | | | | 83 | | | | 736 | |
Shares redeemed | | | (1,060 | ) | | | (8,880 | ) | | | | | (150,829 | ) | | | (1,349,152 | ) |
| | | | | | | | | | |
Net increase | | | 3,380 | | | $ | 29,992 | | | | | | 4,071 | | | $ | 78,535 | |
| | | | | | | | | | |
| | | | | | | | | | | | | | | | | | |
Investor A | | | | | | | | | | | | | | | | | | |
Shares sold | | | 66,504 | | | $ | 591,862 | | | | | | 161,369 | | | $ | 1,438,208 | |
Shares issued in reinvestment of dividends | | | 3,159 | | | | 27,452 | | | | | | 392 | | | | 3,443 | |
Shares redeemed | | | (31,741 | ) | | | (277,904 | ) | | | | | (61,010 | ) | | | (519,642 | ) |
| | | | | | | | | | |
Net increase | | | 37,922 | | | $ | 341,410 | | | | | | 100,751 | | | $ | 922,009 | |
| | | | | | | | | | |
| | | | | | |
| | | BLACKROCK FUNDS | | MARCH 31, 2014 | | 39 |
| | |
| Notes to Financial Statements (continued) | | |
| | | | | | | | | | | | | | | | | | |
| | | Six Months
Ended
March 31, 2014 | | | | | Year Ended
September 30, 2013 | |
| Emerging Market Dividend (concluded) | | Shares | | | Amount | | | | | Shares | | | Amount | |
Investor C | | | | | | | | | | | | | | | | | | |
Shares sold | | | 24,164 | | | $ | 207,938 | | | | | | 26,270 | | | $ | 236,210 | |
Shares issued in reinvestment of dividends | | | 594 | | | | 5,142 | | | | | | 7 | | | | 58 | |
Shares redeemed | | | (895 | ) | | | (7,808 | ) | | | | | (5,685 | ) | | | (47,912 | ) |
| | | | | | | | | | |
Net increase | | | 23,863 | | | $ | 205,272 | | | | | | 20,592 | | | $ | 188,356 | |
| | | | | | | | | | |
Total Net Increase | | | 65,165 | | | $ | 576,674 | | | | | | 125,414 | | | $ | 1,188,900 | |
| | | | | | | | | | |
| | | | | | | | | | | | | | | | | | |
Energy & Resources | | | | | | | | | | | | | | | | | | |
Institutional | | | | | | | | | | | | | | | | | | |
Shares sold | | | 252,371 | | | $ | 9,646,944 | | | | | | 742,386 | | | $ | 25,044,510 | |
Shares issued in reinvestment of distributions | | | — | | | | — | | | | | | 4,497 | | | | 146,688 | |
Shares redeemed | | | (718,172 | ) | | | (27,203,430 | ) | | | | | (4,681,998 | ) | | | (157,551,585 | ) |
| | | | | | | | | | |
Net decrease | | | (465,801 | ) | | $ | (17,556,486 | ) | | | | | (3,935,115 | ) | | $ | (132,360,387 | ) |
| | | | | | | | | | |
| | | | | | | | | | | | | | | | | | |
Investor A | | | | | | | | | | | | | | | | | | |
Shares sold and automatic conversion of shares | | | 662,741 | | | $ | 21,799,405 | | | | | | 1,979,712 | | | $ | 58,200,723 | |
Shares issued in reinvestment of distributions | | | — | | | | — | | | | | | 20,430 | | | | 579,797 | |
Shares redeemed | | | (2,200,316 | ) | | | (72,194,162 | ) | | | | | (7,709,607 | ) | | | (225,348,532 | ) |
| | | | | | | | | | |
Net decrease | | | (1,537,575 | ) | | $ | (50,394,757 | ) | | | | | (5,709,465 | ) | | $ | (166,568,012 | ) |
| | | | | | | | | | |
| | | | | | | | | | | | | | | | | | |
Investor B | | | | | | | | | | | | | | | | | | |
Shares sold | | | 1,211 | | | $ | 28,544 | | | | | | 2,873 | | | $ | 60,212 | |
Shares issued in reinvestment of distributions | | | — | | | | — | | | | | | 501 | | | | 10,444 | |
Shares redeemed and automatic conversion of shares | | | (39,906 | ) | | | (955,664 | ) | | | | | (174,940 | ) | | | (3,737,657 | ) |
| | | | | | | | | | |
Net decrease | | | (38,695 | ) | | $ | (927,120 | ) | | | | | (171,566 | ) | | $ | (3,667,001 | ) |
| | | | | | | | | | |
| | | | | | | | | | | | | | | | | | |
Investor C | | | | | | | | | | | | | | | | | | |
Shares sold | | | 119,713 | | | $ | 2,857,113 | | | | | | 423,372 | | | $ | 9,011,500 | |
Shares issued in reinvestment of distributions | | | — | | | | — | | | | | | 9,345 | | | | 193,162 | |
Shares redeemed | | | (670,821 | ) | | | (15,888,664 | ) | | | | | (2,385,985 | ) | | | (50,596,901 | ) |
| | | | | | | | | | |
Net decrease | | | (551,108 | ) | | $ | (13,031,551 | ) | | | | | (1,953,268 | ) | | $ | (41,392,239 | ) |
| | | | | | | | | | |
Total Net Decrease | | | (2,593,179 | ) | | $ | (81,909,914 | ) | | | | | (11,769,414 | ) | | $ | (343,987,639 | ) |
| | | | | | | | | | |
At March 31, 2014, shares owned by affiliates of Emerging Markets Dividend were as follows:
| | | | |
| | | Shares | |
Institutional | | | 296,000 | |
Investor A | | | 2,000 | |
Investor C | | | 2,000 | |
| | | | | | |
| 40 | | BLACKROCK FUNDS | | MARCH 31, 2014 | | |
| | |
| Notes to Financial Statements (continued) | | |
11. Subsequent Events:
Management’s evaluation of the impact of all subsequent events on the Funds’ financial statements was completed through the date the financial statements were issued and the following item was noted:
Effective April 24, 2014, the credit agreement was terminated and a new agreement was entered into. The Funds became a party to a 364-day, $1.1 billion credit agreement, which expires in April 2015. Excluding commitments designated for a certain individual fund, the Funds can borrow up to an aggregate commitment amount of $650 million, subject to asset coverage and other limitations as specified in the agreement. The credit agreement has the following terms: a fee of 0.06% per annum on unused commitment amounts and interest at a rate equal to the higher of (a) the one-month LIBOR plus 0.80% per annum or (b) the Fed Funds rate plus 0.80% per annum on amounts borrowed.
| | | | | | |
| | | BLACKROCK FUNDS | | MARCH 31, 2014 | | 41 |
Ronald W. Forbes, Co-Chairman of the Board and Trustee
Rodney D. Johnson, Co-Chairman of the Board and Trustee
Paul L. Audet, Trustee
David O. Beim, Trustee
Henry Gabbay, Trustee
Dr. Matina S. Horner, Trustee
Herbert I. London, Trustee
Ian A. MacKinnon, Trustee
Cynthia A. Montgomery, Trustee
Joseph P. Platt, Trustee
Robert C. Robb, Jr., Trustee
Toby Rosenblatt, Trustee
Kenneth L. Urish, Trustee
Frederick W. Winter, Trustee
John M. Perlowski, President and Chief Executive Officer
Richard Hoerner, CFA, Vice President
Brendan Kyne, Vice President
Neal Andrews, Chief Financial Officer
Jay Fife, Treasurer
Brian Kindelan, Chief Compliance Officer and Anti-Money Laundering Officer
Benjamin Archibald, Secretary
Investment Advisor and Co-Administrator
BlackRock Advisors, LLC
Wilmington, DE 19809
Sub-Advisor
BlackRock International Limited
Edinburgh, EH3 8BL, United Kingdom
Accounting Agent, Co-Administrator and Transfer Agent
BNY Mellon Investment Servicing (US) Inc.
Wilmington, DE 19809
Custodian
The Bank of New York Mellon
New York, NY 10286
Distributor
BlackRock Investments, LLC
New York, NY 10022
Legal Counsel
Sidley Austin LLP
New York, NY 10019
Independent Registered Public Accounting Firm
Deloitte & Touche LLP
Philadelphia, PA 19103
Address of the Trust
100 Bellevue Parkway
Wilmington, DE 19809
| | | | | | |
| 42 | | BLACKROCK FUNDS | | MARCH 31, 2014 | | |
Electronic Delivery
Electronic copies of most financial reports and prospectuses are available on the Funds’ website or shareholders can sign up for e-mail notifications of quarterly statements, annual and semi-annual reports and prospectuses by enrolling in the Funds’ electronic delivery program.
To enroll:
Shareholders Who Hold Accounts with Investment Advisors, Banks or Brokerages:
Please contact your financial advisor. Please note that not all investment advisors, banks or brokerages may offer this service.
Shareholders Who Hold Accounts Directly With BlackRock:
| 1) | Access the BlackRock website at http://www.blackrock.com/ edelivery |
| 2) | Select “eDelivery” under the “More Information” section |
Householding
The Funds will mail only one copy of shareholder documents, including prospectuses, annual and semi-annual reports and proxy statements, to shareholders with multiple accounts at the same address. This practice is commonly called “householding” and is intended to reduce expenses and eliminate duplicate mailings of shareholder documents. Mailings of your shareholder documents may be householded indefinitely unless you instruct us otherwise. If you do not want the mailing of these documents to be combined with those for other members of your household, please call the Funds at (800) 441-7762.
Availability of Quarterly Schedule of investments
The Funds file their complete schedule of portfolio holdings with the SEC for the first and third quarters of each fiscal year on Form N-Q. The Funds’ Forms N-Q are available on the SEC’s website at
http:// www.sec.gov and may also be reviewed and copied at the SEC’s Public Reference Room in Washington, D.C. Information on how to access documents on the SEC’s website without charge may be obtained by calling (800) SEC-0330. The Funds’ Forms N-Q may also be obtained upon request and without charge by calling (800) 441-7762.
Availability of Proxy Voting Policies and Procedures
A description of the policies and procedures that the Funds use to determine how to vote proxies relating to portfolio securities is available (1) without charge, upon request, by calling
(800) 441-7762; (2) at http://www.blackrock.com; and (3) on the SEC’s website at http:// www.sec.gov.
Availability of Proxy Voting Record
Information about how the Funds voted proxies relating to securities held in the Funds’ portfolios during the most recent 12-month period ended June 30 is available upon request and without charge (1) at http://www.blackrock.com or by calling (800) 441-7762 and (2) on the SEC’s website at http://www.sec.gov.
Account Information
Call us at (800) 441-7762 from 8:00 AM to 6:00 PM EST on any business day to get information about your account balances, recent transactions and share prices. You can also reach us on the Web at http:// www.blackrock.com/funds.
Automatic Investment Plans
Investor Class shareholders who want to invest regularly can arrange to have $50 or more automatically deducted from their checking or savings account and invested in any of the BlackRock funds.
Systematic Withdrawal Plans
Investor Class shareholders can establish a systematic withdrawal plan and receive periodic payments of $50 or more from their BlackRock funds, as long as their account balance is at least $10,000.
Retirement Plans
Shareholders may make investments in conjunction with Traditional, Rollover, Roth, Coverdell, Simple IRAs, SEP IRAs and 403(b) Plans.
| | | | | | |
| | | BLACKROCK FUNDS | | MARCH 31, 2014 | | 43 |
| | |
| Additional Information (concluded) | | |
|
| BlackRock Privacy Principles |
BlackRock is committed to maintaining the privacy of its current and former fund investors and individual clients (collectively, “Clients”) and to safeguarding their non-public personal information. The following information is provided to help you understand what personal information BlackRock collects, how we protect that information and why in certain cases we share such information with select parties.
If you are located in a jurisdiction where specific laws, rules or regulations require BlackRock to provide you with additional or different privacy-related rights beyond what is set forth below, then BlackRock will comply with those specific laws, rules or regulations.
BlackRock obtains or verifies personal non-public information from and about you from different sources, including the following: (i) information we receive from you or, if applicable, your financial intermediary, on applications, forms or other documents; (ii) information about your transactions with us, our affiliates, or others; (iii) information we receive from a consumer reporting agency; and (iv) from visits to our websites.
BlackRock does not sell or disclose to non-affiliated third parties any non-public personal information about its Clients, except as permitted by law or as is necessary to respond to regulatory requests or to service Client accounts. These non-affiliated third parties are required to protect the confidentiality and security of this information and to use it only for its intended purpose.
We may share information with our affiliates to service your account or to provide you with information about other BlackRock products or services that may be of interest to you. In addition, BlackRock restricts access to non-public personal information about its Clients to those BlackRock employees with a legitimate business need for the information. BlackRock maintains physical, electronic and procedural safeguards that are designed to protect the non-public personal information of its Clients, including procedures relating to the proper storage and disposal of such information.
| | | | | | |
| 44 | | BLACKROCK FUNDS | | MARCH 31, 2014 | | |
| | |
| A World-Class Mutual Fund Family | | |
BlackRock offers a diverse lineup of open-end mutual funds crossing all investment styles and managed by experts in equity, fixed income and tax-exempt investing.
| | | | |
| BlackRock ACWI ex-US Index Fund | | BlackRock Global Long/Short Equity Fund | | BlackRock Natural Resources Trust |
| BlackRock All-Cap Energy & Resources Portfolio | | BlackRock Global Opportunities Portfolio | | BlackRock Pacific Fund |
| BlackRock Basic Value Fund | | BlackRock Global SmallCap Fund | | BlackRock Real Estate Securities Fund |
| BlackRock Capital Appreciation Fund | | BlackRock Health Sciences Opportunities Portfolio | | BlackRock Russell 1000® Index Fund |
| BlackRock Commodity Strategies Fund | | BlackRock International Fund | | BlackRock Science & Technology Opportunities Portfolio |
| BlackRock Disciplined Small Cap Core Fund | | BlackRock International Index Fund | | BlackRock Small Cap Growth Equity Portfolio |
| BlackRock Emerging Markets Dividend Fund | | BlackRock International Opportunities Portfolio | | BlackRock Small Cap Growth Fund II |
| BlackRock Emerging Markets Fund | | BlackRock Large Cap Core Fund | | BlackRock Small Cap Index Fund |
| BlackRock Emerging Markets Long/Short Equity Fund | | BlackRock Large Cap Core Plus Fund | | BlackRock S&P 500 Stock Fund |
| BlackRock Energy & Resources Portfolio | | BlackRock Large Cap Growth Fund | | BlackRock U.S. Opportunities Portfolio |
| BlackRock Equity Dividend Fund | | BlackRock Large Cap Value Fund | | BlackRock Value Opportunities Fund |
| BlackRock EuroFund | | BlackRock Latin America Fund | | |
| BlackRock Flexible Equity Fund | | BlackRock Long-Horizon Equity Fund | | |
| BlackRock Focus Growth Fund | | BlackRock Mid-Cap Growth Equity Portfolio | | |
| BlackRock Global Dividend Portfolio | | BlackRock Mid-Cap Value Opportunities Fund | | |
|
| Taxable Fixed Income Funds |
| | | | |
| BlackRock Bond Index Fund | | BlackRock Emerging Markets Flexible Dynamic Bond Portfolio | | BlackRock Short Obligations Fund |
| BlackRock Core Bond Portfolio | | BlackRock Floating Rate Income Portfolio | | BlackRock Short-Term Treasury Fund |
| BlackRock CoreAlpha Bond Fund | | BlackRock Global Long/Short Credit Fund | | BlackRock Strategic Income Opportunities Portfolio |
BlackRock CoRI Funds | | BlackRock GNMA Portfolio | | BlackRock Total Return Fund |
2015 | | BlackRock High Yield Bond Portfolio | | BlackRock U.S. Government Bond Portfolio |
2017 | | BlackRock Inflation Protected Bond Portfolio | | BlackRock U.S. Mortgage Portfolio |
2019 | | BlackRock Investment Grade Bond Portfolio | | BlackRock Ultra-Short Obligations Fund |
2021 | | BlackRock Low Duration Bond Portfolio | | BlackRock World Income Fund |
2023 | | BlackRock Secured Credit Portfolio | | |
| | |
| | | | |
|
| Municipal Fixed Income Funds |
| | | | |
| BlackRock California Municipal Bond Fund | | BlackRock New Jersey Municipal Bond Fund | | BlackRock Short-Term Municipal Fund |
| BlackRock High Yield Municipal Fund | | BlackRock New York Municipal Bond Fund | | BlackRock Strategic Municipal Opportunities Fund |
| BlackRock National Municipal Fund | | BlackRock Pennsylvania Municipal Bond Fund | | |
| | | | | | | | | | | | | | |
| BlackRock Balanced Capital Fund | | LifePath Active Portfolios | | LifePath Index Portfolios |
| BlackRock Emerging Market Allocation Portfolio | | 2015 | | | 2040 | | | | | Retirement | | 2040 | | |
| BlackRock Global Allocation Fund | | 2020 | | | 2045 | | | | | 2020 | | 2045 | | |
| BlackRock Managed Volatility Portfolio | | 2025 | | | 2050 | | | | | 2025 | | 2050 | | |
| BlackRock Multi-Asset Income Portfolio | | 2030 | | | 2055 | | | | | 2030 | | 2055 | | |
| BlackRock Multi-Asset Real Return Fund | | 2035 | | | | | | | | 2035 | | | | |
| BlackRock Strategic Risk Allocation Fund | | | | | | | | | | | | | | |
| | | | | | |
| BlackRock Prepared Portfolios | | LifePath Portfolios | | | | | | | | | | | | |
Conservative Prepared Portfolio | | Retirement | | | 2040 | | | | | | | | | |
Moderate Prepared Portfolio | | 2020 | | | 2045 | | | | | | | | | |
Growth Prepared Portfolio | | 2025 | | | 2050 | | | | | | | | | |
Aggressive Growth Prepared Portfolio | | 2030 | | | 2055 | | | | | | | | | |
| | 2035 | | | | | | | | | | | | |
BlackRock mutual funds are currently distributed by BlackRock Investments, LLC. You should consider the investment objectives, risks, charges and expenses of the funds under consideration carefully before investing. Each fund’s prospectus contains this and other information and is available at www.blackrock.com or by calling (800) 441-7762 or from your financial advisor. The prospectus should be read carefully before investing.
| | | | | | |
| | | BLACKROCK FUNDS | | MARCH 31, 2014 | | 45 |
| | |
This report is transmitted to shareholders only. It is not authorized for use as an offer of sale or a solicitation of an offer to buy shares of the Funds unless accompanied or preceded by that Fund’s current prospectus. Past performance results shown in this report should not be considered a representation of future performance. Investment returns and principal value of shares will fluctuate so that shares, when redeemed, may be worth more or less than their original cost. Statements and other information herein are as dated and are subject to change. Investment in foreign securities involves special risks including fluctuating foreign exchange rates, foreign government regulations, differing degrees of liquidity and the possibility of substantial volatility due to adverse political, economic or other developments. | |  |
| | |
| Eq-Allcap-3/14-SAR | |  |
MARCH 31, 2014
| | | | |
SEMI-ANNUAL REPORT (UNAUDITED) | | | | BLACKROCK® |
BlackRock FundsSM
„ BlackRock Flexible Equity Fund
„ BlackRock Mid-Cap Growth Equity Portfolio
„ BlackRock Small Cap Growth Equity Portfolio
| | |
| Not FDIC Insured ¡ May Lose Value ¡ No Bank Guarantee | | |
| | | | | | |
| 2 | | BLACKROCK FUNDS | | MARCH 31, 2014 | | |
Shareholder Letter
Dear Shareholder,
One year ago, U.S. financial markets were improving despite a sluggish global economy, as easy monetary policy provided investors with enough conviction to take on more risk in their portfolios. Slow but positive growth in the U.S. was sufficient to support corporate earnings, while uncomfortably high unemployment reinforced expectations that the Federal Reserve would continue to maintain its aggressive monetary stimulus programs.
Sentiment swiftly reversed in May when then-Fed Chairman Bernanke first mentioned the possibility of reducing (or “tapering”) the central bank’s asset purchase programs — comments that were widely misinterpreted as signaling an end to the Fed’s zero-interest-rate policy. U.S. Treasury yields rose sharply, triggering a steep sell-off across fixed income markets. (Bond prices move in the opposite direction of yields.) Global equities also suffered as investors feared the implications of a potential end to a program that had greatly supported the markets. Emerging markets, which are more sensitive to changes in global liquidity, were particularly hurt by the prospect of ebbing cash flows from the U.S. Markets rebounded in late June, however, when the Fed’s tone turned more dovish, and improving economic indicators and better corporate earnings helped extend gains through most of the summer.
Although the tone of economic and financial news was mixed during the autumn, it was a surprisingly positive period for most asset classes. Early on, the Fed defied market expectations with its decision to delay tapering, but higher volatility returned in late September when the U.S. Treasury Department warned that the national debt would soon breach its statutory maximum. The ensuing political brinksmanship led to a partial government shutdown, roiling global financial markets through the first half of October. Equities and other so-called “risk assets” managed to resume their rally when politicians engineered a compromise to reopen the government and extend the debt ceiling.
The remainder of 2013 was generally positive for stock markets in the developed world, although investors continued to grapple with uncertainty about when and how much the Fed would scale back on stimulus. When the Fed ultimately announced its tapering plans in mid-December, markets reacted positively, as this action signaled the Fed’s perception of real improvement in the economy, and investors were finally relieved from the anxiety that had gripped them for quite some time.
The start of the new year brought another turn in sentiment, as heightened risks in emerging markets and mixed U.S. economic data caused global equities to weaken in January while bond markets found renewed strength. Although these headwinds persisted, equities were back on the rise in February as investors were encouraged by a one-year extension of the U.S. debt ceiling and market-friendly comments from the Fed’s new Chairwoman, Janet Yellen. While U.S. economic data pointed to softer growth, investors viewed this trend as temporarily driven by poor winter weather and continued adding risk to their portfolios on the belief that growth would pick up in the coming months. In March, markets focused on decelerating growth in China and tensions between Russia and Ukraine over the disputed region of Crimea. Additionally, investors were caught off guard by a statement from Chairwoman Yellen indicating that the Fed may raise short-term interest rates earlier than the markets had previously forecasted. Bond markets came under pressure as the middle of the yield curve vaulted higher in response to the unexpected shift in forward guidance.
Against a backdrop of modest economic growth, investors over the past year remained highly attuned to potential changes in monetary policy. Despite the fact that markets were gearing up for a modest shift toward tighter conditions from the Fed, equity markets in the developed world generated strong returns for the six- and 12-month periods ended March 31, with stocks in the United States performing particularly well. In contrast, emerging markets were weighed down by concerns about reduced global liquidity, severe currency weakness, high levels of debt and uneven growth.
Interest rate uncertainty posed a headwind for fixed income assets, and higher-quality sectors of the market experienced heightened volatility and poor performance over the reporting period. High yield bonds, however, benefited from income-oriented investors’ search for yield in the overall low-rate environment. Short-term interest rates remained near zero, keeping yields on money market securities close to historic lows.
At BlackRock, we believe investors need to think globally, extend their scope across a broad array of asset classes and be prepared to move freely as market conditions change over time. We encourage you to talk with your financial advisor and visit www.blackrock.com for further insight about investing in today’s world.
Sincerely,

Rob Kapito
President, BlackRock Advisors, LLC

In a modest global growth environment, expectations around monetary policy changes continued to be a key theme in financial market performance.
Rob Kapito
President, BlackRock Advisors, LLC
| | | | | | | | |
| Total Returns as of March 31, 2014 | |
| | | 6-month | | | 12-month | |
U.S. large cap equities
(S&P 500® Index) | | | 12.51 | % | | | 21.86 | % |
U.S. small cap equities
(Russell 2000® Index) | | | 9.94 | | | | 24.90 | |
International equities
(MSCI Europe, Australasia,
Far East Index) | | | 6.41 | | | | 17.56 | |
Emerging market equities
(MSCI Emerging Markets
Index) | | | 1.39 | | | | (1.43 | ) |
3-month Treasury bill
(BofA Merrill Lynch
3-Month U.S. Treasury
Bill Index) | | | 0.03 | | | | 0.07 | |
U.S. Treasury securities
(BofA Merrill Lynch
10-Year U.S. Treasury
Index) | | | 0.85 | | | | (4.38 | ) |
U.S. investment grade
bonds (Barclays U.S.
Aggregate Bond Index) | | | 1.70 | | | | (0.10 | ) |
Tax-exempt municipal
bonds (S&P Municipal
Bond Index) | | | 3.91 | | | | 0.31 | |
U.S. high yield bonds
(Barclays U.S. Corporate
High Yield 2% Issuer
Capped Index) | | | 6.66 | | | | 7.53 | |
|
| Past performance is no guarantee of future results. Index performance is shown for illustrative purposes only. You cannot invest directly in an index. | |
| | | | | | |
| | | THIS PAGE NOT PART OF YOUR FUND REPORT | | | | 3 |
| | | | |
| Fund Summary as of March 31, 2014 | | | BlackRock Flexible Equity Fund | |
BlackRock Flexible Equity Fund’s (the “Fund”) investment objective is to seek to achieve long-term total return.
|
| Portfolio Management Commentary |
How did the Fund perform?
| Ÿ | | For the six-month period ended March 31, 2014, the Fund underperformed its benchmark, the S&P 500® Index. |
What factors influenced performance?
| Ÿ | | During the period, stock selection, particularly within the industrials sector, weighed heavily on relative returns. In particular, a significant position in Japan Airlines Co. Ltd. and a smaller position in WestJet Airlines Ltd. both posted double-digit declines after experiencing strong gains during the prior reporting period. Concerns surrounding runway access at one of Japan’s primary airports coupled with a weakening yen contributed to stock price weakness. Additionally, in a strong equity market, allocations to cash, precious metals and a short position in Russell 2000® Index futures underperformed relative to the market, but also limited the Fund’s beta (sensitivity) to the broader equity market, detracting from relative returns. An underweight in health care, the top-performing sector in the benchmark index, also proved costly. |
| Ÿ | | The Fund ended the period with an approximate 10% weighting in cash, which created a drag on relative performance. Despite creating a headwind for the Fund in a rapidly rising equity market, cash plays an important strategic role within the Fund on a structural and shorter-term strategic basis. On a structural basis, the Fund holds cash to preserve the ability to fund high-conviction ideas without having to sell other positions. On a strategic basis, cash accumulated in the Fund as a result of trimming several positions that neared their price targets while new opportunities were scarce given the level of market valuations. |
| Ÿ | | Conversely, stock selection within the information technology sector, led by gains in one of the Fund’s top holdings, Google, Inc., made the largest positive impact |
| | on performance during the period. The internet search provider rallied substantially in the fourth quarter on strong revenue growth driven by rising mobile advertising revenue. Additionally, select consumer discretionary holdings, such as Expedia Inc. and educational publisher Houghton Mifflin Harcourt, also made positive contributions to returns. |
Describe recent portfolio activity.
| Ÿ | | During the six-month period, substantial changes were made in terms of holdings and overall structure. The investment advisor took advantage of market strength in the fourth quarter of 2013 and early first quarter of 2014 to take profits in many of the top-performing holdings across the Fund such as Google, Inc., Visa, Inc. and Vodafone Group PLC. Additionally, the Fund eliminated its exposure to silver and redeployed those proceeds into its existing gold position. Proceeds from sales were primarily directed toward several new, high-conviction positions that are classified as consumer discretionary stocks, but represent unique investment insights across a variety of non-related industries including publishing, automobile manufacturing and broadcasters. The Fund’s index short positions and cash position were also augmented. |
Describe portfolio positioning at period end.
| Ÿ | | At period end, the Fund held substantial exposure to non-equity assets in the forms of cash and gold. Relative to the S&P 500 Index, the Fund was overweight in consumer discretionary, driven largely by exposures to broadcasters and automobile manufacturers. In contrast, the Fund was intentionally underweight in consumer staples, health care and utilities. |
The views expressed reflect the opinions of BlackRock as of the date of this report and are subject to change based on changes in market, economic or other conditions. These views are not intended to be a forecast of future events and are no guarantee of future results.
| | |
| Ten Largest Holdings | | Percent of
Long-Term
Investments |
| | | | |
Japan Airlines Co. Ltd. | | | 8 | % |
American International Group, Inc. | | | 7 | |
SPDR Gold Trust | | | 6 | |
UnitedHealth Group, Inc. | | | 6 | |
General Motors Co. | | | 6 | |
Sinclair Broadcast Group, Inc., Class A | | | 6 | |
Houghton Mifflin Harcourt Co. | | | 5 | |
Fidelity National Financial, Inc., Class A | | | 4 | |
Nexstar Broadcasting Group, Inc., Class A | | | 4 | |
Suncor Energy, Inc. | | | 4 | |
| | |
| Sector Allocation | | Percent of
Long-Term
Investments |
| | | | |
Consumer Discretionary | | | 25 | % |
Financials | | | 16 | |
Information Technology | | | 15 | |
Industrials | | | 11 | |
Energy | | | 10 | |
Investment Companies | | | 9 | |
Health Care | | | 8 | |
Telecommunication Services | | | 4 | |
Consumer Staples | | | 2 | |
For Fund compliance purposes, the Fund’s sector classifications refer to any one or more of the sector sub-classifications used by one or more widely recognized market indexes or ratings group indexes, and/or as defined by the investment advisor. These definitions may not apply for purposes of this report, which may combine sector sub-classifications for reporting ease.
| | | | | | |
| 4 | | BLACKROCK FUNDS | | MARCH 31, 2014 | | |
| | | | |
| | | | BlackRock Flexible Equity Fund | |
|
| Total Return Based on a $10,000 Investment |
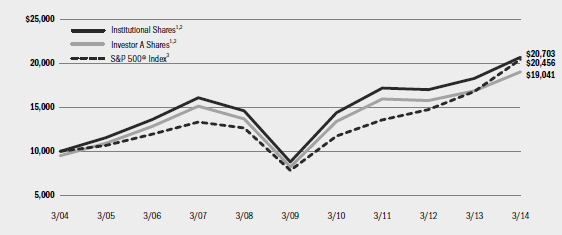
| | 1 | Assuming maximum sales charges, if any, transaction costs and other operating expenses, including investment advisory fees and administration fees, if any. Institutional Shares do not have a sales charge. |
| | 2 | Under normal circumstances, the Fund will invest at least 80% of its net assets (plus any borrowings for investment purposes) in equity securities and equity-like securities and instruments with similar economic characteristics. The Fund seeks to invest in securities issued by North American companies. The Fund may invest in companies of any market capitalization size, style, or sector. The Fund’s total return prior to July 31, 2012 are the returns of the Fund when it followed a different investment strategy. |
| | 3 | This total return unmanaged index covers 500 industrial, utility, transportation and financial companies of the U.S. markets (mostly New York Stock Exchange (“NYSE”) issues) representing about 75% of NYSE market capitalization and 30% of NYSE issues. |
| | | | | | | | | | | | | | | | | | | | | | | | | | | | |
| Performance Summary for the Period Ended March 31, 2014 | |
| | | | | | Average Annual Total Returns4 | |
| | | | | | 1 Year | | | 5 Years | | | 10 Years | |
| | | 6-Month Total Returns | | | w/o sales charge | | | w/sales charge | | | w/o sales charge | | | w/sales charge | | | w/o sales charge | | | w/sales charge | |
Institutional | | | 6.12 | % | | | 13.22 | % | | | N/A | | | | 18.77 | % | | | N/A | | | | 7.55 | % | | | N/A | |
Service | | | 5.89 | | | | 12.84 | | | | N/A | | | | 18.39 | | | | N/A | | | | 7.23 | | | | N/A | |
Investor A | | | 5.99 | | | | 12.88 | | | | 6.96 | % | | | 18.37 | | | | 17.10 | % | | | 7.23 | | | | 6.65 | % |
Investor B | | | 5.59 | | | | 11.98 | | | | 7.48 | | | | 17.45 | | | | 17.24 | | | | 6.58 | | | | 6.58 | |
Investor C | | | 5.58 | | | | 12.01 | | | | 11.01 | | | | 17.46 | | | | 17.46 | | | | 6.42 | | | | 6.42 | |
Class R | | | 5.70 | | | | 12.39 | | | | N/A | | | | 18.07 | | | | N/A | | | | 7.19 | | | | N/A | |
S&P 500® Index | | | 12.51 | | | | 21.86 | | | | N/A | | | | 21.16 | | | | N/A | | | | 7.42 | | | | N/A | |
| | 4 | Assuming maximum sales charges, if any. Average annual total returns with and without sales charges reflect reductions for distribution and service fees. See “About Fund Performance” on page 10 for a detailed description of share classes, including any related sales charges and fees. |
| | | N/A - Not applicable as share class and index do not have a sales charge. |
| | | Past performance is not indicative of future results. |
| | | | | | | | | | | | | | |
| Expense Example |
| | | Actual | | Hypothetical6 | | |
| | | Beginning Account Value
October 1, 2013 | | Ending Account Value
March 31, 2014 | | Expenses Paid
During the Period5 | | Beginning Account Value
October 1, 2013 | | Ending Account Value
March 31, 2014 | | Expenses Paid
During the Period5 | | Annualized Expense Ratio |
Institutional | | $1,000.00 | | $1,061.20 | | $4.98 | | $1,000.00 | | $1,020.09 | | $4.89 | | 0.97% |
Service | | $1,000.00 | | $1,058.90 | | $6.62 | | $1,000.00 | | $1,018.50 | | $6.49 | | 1.29% |
Investor A | | $1,000.00 | | $1,059.90 | | $6.62 | | $1,000.00 | | $1,018.50 | | $6.49 | | 1.29% |
Investor B | | $1,000.00 | | $1,055.90 | | $10.56 | | $1,000.00 | | $1,014.66 | | $10.35 | | 2.06% |
Investor C | | $1,000.00 | | $1,055.80 | | $10.56 | | $1,000.00 | | $1,014.66 | | $10.35 | | 2.06% |
Class R | | $1,000.00 | | $1,057.00 | | $8.41 | | $1,000.00 | | $1,016.75 | | $8.25 | | 1.64% |
| | 5 | For each class of the Fund, expenses are equal to the annualized expense ratio for the class, multiplied by the average account value over the period, multiplied by 182/365 (to reflect the one-half year period shown). |
| | 6 | Hypothetical 5% annual return before expenses is calculated by pro rating the number of days in the most recent fiscal half year divided by 365. |
| | | See “Disclosure of Expenses” on page 10 for further information on how expenses were calculated. |
| | | | | | |
| | | BLACKROCK FUNDS | | MARCH 31, 2014 | | 5 |
| | | | |
| Fund Summary as of March 31, 2014 | | | BlackRock Mid-Cap Growth Equity Portfolio | |
BlackRock Mid-Cap Growth Equity Portfolio’s (the “Fund”) investment objective is long-term capital appreciation.
|
| Portfolio Management Commentary |
How did the Fund perform?
| Ÿ | | For the six-month period ended March 31, 2014, the Fund outperformed its benchmark, the Russell Midcap® Growth Index. |
What factors influenced performance?
| Ÿ | | Relative performance was supported by favorable stock selection in the consumer discretionary and industrials sectors. Selection in financials also had a positive impact. |
| Ÿ | | In consumer discretionary, the Fund’s outperformance was led by internet & catalog retail holdings Vipshop Holdings Ltd. and Liberty Ventures. Shares of Chinese off-price retailer Vipshop Holdings Ltd. surged as the company continued to capitalize on the massive opportunity in e-commerce in China. Liberty Ventures outperformed as its investments in TripAdvisor, Inc. and Expedia, Inc. (which are also held in the Fund) appreciated and the markets began to price in a greater return on the company’s private investment initiatives. Other notable contributors in the sector included casino operator Wynn Resorts Ltd., athletic apparel maker Under Armour, Inc. and consumer-products company Jarden Corp. |
| Ÿ | | Within the industrials sector, Spirit Airlines, Inc. and SolarCity Corp. were the Fund’s strongest performers. Underlying Spirit’s strength was its industry-leading level of profitability, aggressive yet balanced capacity growth plans, and further opportunity to drive ancillary revenues through non-traditional fees. The company also benefited from consolidation in the U.S. airline industry. SolarCity Corp. shares advanced as the company’s disruptive solar power leasing business model continued to gain traction. Also adding to returns in the industrials sector was a position in Acuity Brands, Inc. |
| Ÿ | | Contributing to results in financials was bank holding SVB Financial Group as well as the Fund’s underexposure to real estate investment trusts, which significantly trailed the broader market during the period. |
| Ÿ | | Conversely, the Fund’s energy holdings detracted from performance for the period. A position in Laredo Petroleum, Inc. lagged on concerns that private equity owners may further reduce their ownership in the company. Shares of Oceaneering International, Inc. fell due to concerns about slowing deepwater spend. Gulfport Energy Corp. also weighed on the Fund’s performance in the energy sector. |
| Ÿ | | Additionally, the Fund was not immune to the market volatility toward the end of the period as investors stampeded out of high-growth, more volatile companies in favor of previously underperforming sectors. The reversal exacted the greatest toll on the strongest performing stocks of 2013, especially internet and social media players, a number of which were held in the Fund. |
| Ÿ | | Chinese online media company SINA Corp. was the largest individual detractor in the Fund. SINA shares lost ground amid a confluence of factors, including concerns about growth in China; the larger decline in high-growth technology names; worries about user growth for the company’s social media platform Weibo as well as 2014 margins; and, finally, the turmoil in emerging markets. Other detractors in the IT sector included Qlik Technologies, Inc. and Yandex NV. |
Describe recent portfolio activity.
| Ÿ | | The Fund continued to actively manage risk throughout the six-month period and reduced the overall level of risk in the portfolio, particularly through moderating exposure to internet-related and non-U.S. stocks. |
| Ÿ | | On a sector basis, the most notable decrease was within IT, where the Fund trimmed holdings in the internet software & services industry. The Fund also reduced exposure to energy stocks. The Fund increased exposure to commercial services & supplies and air freight & logistics holdings in industrials, as well as household and food products within consumer staples. |
Describe portfolio positioning at period end.
| Ÿ | | As of period end, the Fund’s largest sector overweights relative to the Russell Midcap Growth® Index were consumer discretionary, industrials and IT, while the most notable underweights were in materials and consumer staples. The Fund’s overweights in consumer discretionary and IT reflect the investment adviser’s favorable view on companies that continue to take share in the expanding growth of consumer wealth globally and, in particular, the rise of e-commerce. |
The views expressed reflect the opinions of BlackRock as of the date of this report and are subject to change based on changes in market, economic or other conditions. These views are not intended to be a forecast of future events and are no guarantee of future results.
| | |
| Ten Largest Holdings | | Percent of
Long-Term
Investments |
| | | | |
Liberty Ventures, Series A | | | 4 | % |
Jarden Corp. | | | 3 | |
Wynn Resorts Ltd. | | | 3 | |
The Madison Square Garden Co., Class A | | | 3 | |
Schibsted ASA | | | 3 | |
Yelp, Inc. | | | 2 | |
Alliance Data Systems Corp. | | | 2 | |
The Cooper Cos., Inc. | | | 2 | |
Moody’s Corp. | | | 2 | |
WEX, Inc. | | | 2 | |
| | |
| Sector Allocation | | Percent of
Long-Term
Investments |
| | | | |
Consumer Discretionary | | | 32 | % |
Information Technology | | | 22 | |
Industrials | | | 21 | |
Health Care | | | 10 | |
Financials | | | 6 | |
Consumer Staples | | | 4 | |
Energy | | | 3 | |
Telecommunication Services | | | 2 | |
For Fund compliance purposes, the Fund’s sector classifications refer to any one or more of the sector sub-classifications used by one or more widely recognized market indexes or ratings group indexes, and/or as defined by the investment advisor. These definitions may not apply for purposes of this report, which may combine sector sub-classifications for reporting ease.
| | | | | | |
| 6 | | BLACKROCK FUNDS | | MARCH 31, 2014 | | |
| | | | |
| | | | BlackRock Mid-Cap Growth Equity Portfolio | |
|
| Total Return Based on a $10,000 Investment |
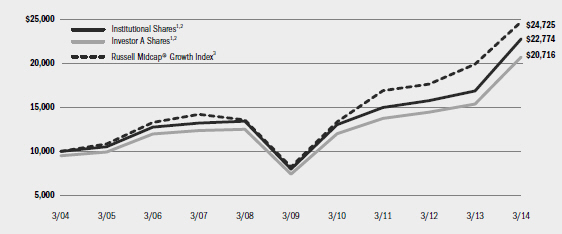
| | 1 | Assuming maximum sales charges, if any, transaction costs and other operating expenses, including investment advisory fees and administration fees, if any. Institutional Shares do not have a sales charge. |
| | 2 | The Fund normally invests at least 80% of its net assets in equity securities issued by U.S. mid-capitalization companies, which Fund management believes have above-average earnings growth potential. |
| | 3 | An index that consists of the bottom 800 securities of the Russell 1000® Index with greater-than-average growth orientation as ranked by total market capitalization. Securities in this index generally have higher price-to-book and price-to-earnings ratios, lower dividend yields and higher forecasted growth values. |
| | | | | | | | | | | | | | | | | | | | | | | | | | | | |
| Performance Summary for the Period Ended March 31, 2014 | |
| | | | | | Average Annual Total Returns4 | |
| | | | | | 1 Year | | | 5 Years | | | 10 Years | |
| | | 6-Month
Total Returns | | | w/o sales
charge | | | w/sales
charge | | | w/o sales
charge | | | w/sales
charge | | | w/o sales
charge | | | w/sales
charge | |
Institutional | | | 12.37 | % | | | 35.05 | % | | | N/A | | | | 23.35 | % | | | N/A | | | | 8.58 | % | | | N/A | |
Service | | | 12.09 | | | | 34.39 | | | | N/A | | | | 22.78 | | | | N/A | | | | 8.19 | | | | N/A | |
Investor A | | | 12.21 | | | | 34.65 | | | | 27.58 | % | | | 22.89 | | | | 21.57 | % | | | 8.14 | | | | 7.55 | % |
Investor B | | | 11.76 | | | | 33.56 | | | | 29.06 | | | | 21.96 | | | | 21.78 | | | | 7.48 | | | | 7.48 | |
Investor C | | | 11.70 | | | | 33.59 | | | | 32.59 | | | | 21.97 | | | | 21.97 | | | | 7.32 | | | | 7.32 | |
Class R | | | 11.99 | | | | 34.19 | | | | N/A | | | | 22.66 | | | | N/A | | | | 8.01 | | | | N/A | |
Russell Midcap® Growth Index | | | 10.44 | | | | 24.22 | | | | N/A | | | | 24.73 | | | | N/A | | | | 9.47 | | | | N/A | |
| | 4 | Assuming maximum sales charges, if any. Average annual total returns with and without sales charges reflect reductions for distribution and service fees. See “About Fund Performance” on page 10 for a detailed description of share classes, including any related sales charges and fees. |
| | | N/A—Not applicable as share class and index do not have a sales charge. |
| | | Past performance is not indicative of future results. |
| | | | | | | | | | | | | | |
| Expense Example |
| | | Actual | | Hypothetical6 | | |
| | | Beginning Account Value
October 1, 2013 | | Ending Account Value
March 31, 2014 | | Expenses Paid
During the Period5 | | Beginning Account Value
October 1, 2013 | | Ending Account Value
March 31, 2014 | | Expenses Paid
During the Period5 | | Annualized Expense Ratio |
Institutional | | $1,000.00 | | $1,123.70 | | $5.88 | | $1,000.00 | | $1,019.40 | | $5.59 | | 1.11% |
Service | | $1,000.00 | | $1,120.90 | | $8.35 | | $1,000.00 | | $1,017.05 | | $7.95 | | 1.58% |
Investor A | | $1,000.00 | | $1,122.10 | | $7.35 | | $1,000.00 | | $1,018.00 | | $6.99 | | 1.39% |
Investor B | | $1,000.00 | | $1,117.60 | | $11.40 | | $1,000.00 | | $1,014.16 | | $10.85 | | 2.16% |
Investor C | | $1,000.00 | | $1,117.00 | | $11.40 | | $1,000.00 | | $1,014.16 | | $10.85 | | 2.16% |
Class R | | $1,000.00 | | $1,119.90 | | $8.72 | | $1,000.00 | | $1,016.70 | | $8.30 | | 1.65% |
| | 5 | For each class of the Fund, expenses are equal to the annualized expense ratio for the class, multiplied by the average account value over the period, multiplied by 182/365 (to reflect the one-half year period shown). |
| | 6 | Hypothetical 5% annual return before expenses is calculated by pro rating the number of days in the most recent fiscal half year divided by 365. |
| | | See “Disclosure of Expenses” on page 10 for further information on how expenses were calculated. |
| | | | | | |
| | | BLACKROCK FUNDS | | MARCH 31, 2014 | | 7 |
| | | | |
| Fund Summary as of March 31, 2014 | | | BlackRock Small Cap Growth Equity Portfolio | |
BlackRock Small Cap Growth Equity Portfolio’s (the “Fund”) investment objective is to seek long-term capital growth.
|
| Portfolio Management Commentary |
How did the Fund perform?
| Ÿ | | For the six-month period ended March 31, 2014, the Fund outperformed its benchmark, the Russell 2000® Growth Index. |
What factors influenced performance?
| Ÿ | | The Fund’s outperformance was attributable mostly to stock selection within the health care and information technology (“IT”) sectors. Within health care, a position in Biopharmaceutical Gentium Spa appreciated substantially throughout the period, driven by several factors including better-than-expected third-quarter earnings, the company’s main vascular drug Defibrotide (Defitelio) receiving the European Medicines Agency’s orphan drug designation, and the company’s acceptance of a take-over bid from Jazz Pharmaceuticals. The Fund’s position in specialty pharmaceutical Santarus also contributed positively to performance after the company accepted a takeover bid from Salix Pharmaceuticals. Within IT, a position in supply chain IT system provider Manhattan Associates rallied considerably after the company reported record fourth-quarter and full-year 2013 financial results. Touchscreen and touchpad provider Synaptics notably appreciated throughout the period on the back of strong smartphone touchscreen demand and better-than-expected third-quarter revenues. |
| Ÿ | | Conversely, stock selection within the consumer discretionary sector detracted from performance. In particular, the Fund’s position in television |
| | network company CTC Media, which streams local Russian news and media globally, hurt returns. CTC Media stock depreciated throughout the period as investors’ concerns about a weakening macroeconomic outlook for Russia overshadowed the company’s better-than-expected fourth-quarter earnings and 2014 outlook. The Fund’s holding of home appliance and equipment retailer Sears Hometown & Outlet Stores also detracted from performance. The company reported disappointing third-and fourth-quarter earnings, missed its earnings estimates for fiscal year 2014, and continued to struggle with sales due in part to no longer selling consumer electronics in their Hometown stores. |
Describe recent portfolio activity.
| Ÿ | | During the six-month period, the Fund’s weightings in the IT and materials sectors increased while the weightings in consumer discretionary and industrials decreased. |
Describe portfolio positioning at period end.
| Ÿ | | Relative to the Russell 2000 Growth® Index, the Fund’s most significant sector overweight as of period end was IT and the most significant underweight was consumer discretionary. |
The views expressed reflect the opinions of BlackRock as of the date of this report and are subject to change based on changes in market, economic or other conditions. These views are not intended to be a forecast of future events and are no guarantee of future results.
| | | | |
| Ten Largest Holdings | | Percent of
Long-Term
Investments | |
Align Technology, Inc. | | | 3 | % |
Aspen Technology, Inc. | | | 3 | |
Manhattan Associates, Inc. | | | 2 | |
Thoratec Corp. | | | 2 | |
Synaptics, Inc. | | | 2 | |
KapStone Paper and Packaging Corp. | | | 2 | |
Syntel, Inc. | | | 2 | |
Spirit Airlines, Inc. | | | 2 | |
PROS Holdings, Inc. | | | 2 | |
NIC, Inc. | | | 2 | |
| | | | |
| Sector Allocation | | Percent of
Long-Term
Investments | |
Information Technology | | | 30 | % |
Health Care | | | 21 | |
Industrials | | | 17 | |
Consumer Discretionary | | | 11 | |
Financials | | | 6 | |
Energy | | | 5 | |
Materials | | | 5 | |
Telecommunication Services | | | 2 | |
Consumer Staples | | | 2 | |
Utilities | | | 1 | |
For Fund compliance purposes, the Fund’s sector classifications refer to any one or more of the sector sub-classifications used by one or more widely recognized market indexes or ratings group indexes, and/or as defined by the investment advisor. These definitions may not apply for purposes of this report, which may combine sector sub-classifications for reporting ease.
| | | | | | |
| 8 | | BLACKROCK FUNDS | | MARCH 31, 2014 | | |
| | | | |
| | | | BlackRock Small Cap Growth Equity Portfolio | |
| | |
| Total Return Based on a $10,000 Investment | | |
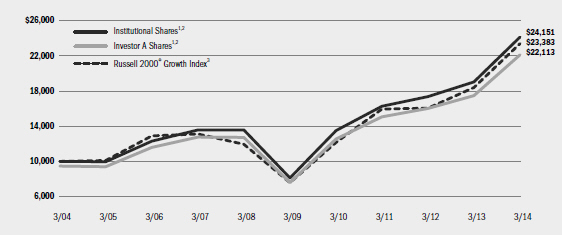
| | 1 | Assuming maximum sales charges, if any, transaction costs and other operating expenses, including investment advisory fees and administration fees, if any. Institutional Shares do not have a sales charge. |
| | 2 | Under normal circumstances, the Fund will invest at least 80% of its net assets (plus any borrowings for investment purposes) in equity securities of small cap companies and at least 80% of its net assets (plus any borrowings for investment purposes) in securities or instruments of issuers located in the United States. |
| | 3 | An index that contains those securities with greater-than-average growth orientations, generally having higher price-to-value ratios and higher fore- casted growth values. |
| | | | | | | | | | | | | | | | | | | | | | | | | | | | |
| Performance Summary for the Period Ended March 31, 2014 | |
| | | | | | Average Annual Total Returns4 | |
| | | | | | 1 Year | | | 5 Years | | | 10 Years | |
| | | 6-Month Total Returns | | | w/o sales charge | | | w/sales charge | | | w/o sales charge | | | w/sales charge | | | w/o sales charge | | | w/sales charge | |
Institutional | | | 12.76 | % | | | 26.82 | % | | | N/A | | | | 24.38 | % | | | N/A | | | | 9.22 | % | | | N/A | |
Service | | | 12.62 | | | | 26.50 | | | | N/A | | | | 24.03 | | | | N/A | | | | 8.93 | | | | N/A | |
Investor A | | | 12.62 | | | | 26.48 | | | | 19.83 | % | | | 23.93 | | | | 22.60 | % | | | 8.84 | | | | 8.26 | % |
Investor B | | | 12.15 | | | | 25.45 | | | | 22.14 | | | | 22.87 | | | | 22.69 | | | | 8.10 | | | | 8.10 | |
Investor C | | | 12.20 | | | | 25.53 | | | | 24.79 | | | | 22.88 | | | | 22.88 | | | | 7.91 | | | | 7.91 | |
Russell 2000® Growth Index | | | 8.70 | | | | 27.19 | | | | N/A | | | | 25.24 | | | | N/A | | | | 8.87 | | | | N/A | |
| | 4 | Assuming maximum sales charges, if any. Average annual total returns with and without sales charges reflect reductions for distribution and service fees. See “About Fund Performance” on page 10 for a detailed description of share classes, including any related sales charges and fees. |
| | | N/A—Not applicable as share class and index do not have a sales charge. |
| | | Past performance is not indicative of future results. |
| | | | | | | | | | | | | | |
| Expense Example | | | | | | |
| | | Actual | | Hypothetical6 | | |
| | | Beginning Account Value
October 1, 2013 | | Ending Account Value
March 31, 2014 | | Expenses Paid
During the Period5 | | Beginning Account Value
October 1, 2013 | | Ending Account Value
March 31, 2014 | | Expenses Paid
During the Period5 | | Annualized Expense Ratio |
Institutional | | $1,000.00 | | $1,127.60 | | $4.77 | | $1,000.00 | | $1,020.44 | | $4.53 | | 0.90% |
Service | | $1,000.00 | | $1,126.20 | | $5.88 | | $1,000.00 | | $1,019.40 | | $5.59 | | 1.11% |
Investor A | | $1,000.00 | | $1,126.20 | | $6.10 | | $1,000.00 | | $1,019.20 | | $5.79 | | 1.15% |
Investor B | | $1,000.00 | | $1,121.50 | | $10.53 | | $1,000.00 | | $1,015.01 | | $10.00 | | 1.99% |
Investor C | | $1,000.00 | | $1,122.00 | | $10.05 | | $1,000.00 | | $1,015.46 | | $9.55 | | 1.90% |
| | 5 | For each class of the Fund, expenses are equal to the annualized expense ratio for the class, multiplied by the average account value over the period, multiplied by 182/365 (to reflect the one-half year period shown). |
| | 6 | Hypothetical 5% annual return before expenses is calculated by pro rating the number of days in the most recent fiscal half year divided by 365. |
| | | See “Disclosure of Expenses” on page 10 for further information on how expenses were calculated. |
| | | | | | |
| | | BLACKROCK FUNDS | | MARCH 31, 2014 | | 9 |
| Ÿ | | Institutional Shares are not subject to any sales charge. These shares bear no ongoing distribution or service fees and are available only to certain eligible investors. |
| Ÿ | | Service Shares are not subject to any sales charge (front-end load) or deferred sales charge. These shares are subject to a service fee of 0.25% per year (but no distribution fee). |
| Ÿ | | Investor A Shares are subject to a maximum initial sales charge (front-end load) of 5.25% and a service fee of 0.25% per year (but no distribution fee). Certain redemptions of these shares may be subject to a contingent deferred sales charge (“CDSC”) where no initial sales charge was paid at the time of purchase. |
| Ÿ | | Investor B Shares are subject to a maximum CDSC of 4.50% declining to 0% after six years. In addition, these shares are subject to a distribution fee of 0.75% per year and a service fee of 0.25% per year. These shares automatically convert to Investor A Shares after approximately eight years. (There is no initial sales charge for automatic share conversions.) All returns for periods greater than eight years reflect this conversion. These shares are only available through exchanges and dividend reinvestments by existing shareholders and for purchase by certain employer-sponsored retirement plans. |
| Ÿ | | Investor C Shares are subject to a 1.00% CDSC if redeemed within one year of purchase. In addition, these shares are subject to a distribution fee of 0.75% per year and a service fee of 0.25% per year. |
| Ÿ | | Class R Shares are not subject to any sales charge. These shares are subject to a distribution fee of 0.25% per year and a service fee of 0.25% per year. These shares are available only to certain employer- sponsored retirement plans. Prior to October 2, 2006, Class R performance results of BlackRock Mid-Cap Growth Equity Portfolio are those of Institutional Shares (which have no distribution or service fees) restated |
to reflect Class R Share fees. Prior to July 30, 2010, Class R performance results of BlackRock Flexible Equity Fund are those of Institutional Shares (which have no distribution or service fees) restated to reflect Class R Share fees.
Performance information reflects past performance and does not guarantee future results. Current performance may be lower or higher than the performance data quoted. Refer to www.blackrock.com/funds to obtain performance data current to the most recent month end. Performance results do not reflect the deduction of taxes that a shareholder would pay on fund distributions or the redemption of fund shares. Figures shown in each of the performance tables on the previous pages assume reinvestment of all dividends and distributions, if any, at net asset value (“NAV”) on the ex-dividend date. Investment return and principal value of shares will fluctuate so that shares, when redeemed, may be worth more or less than their original cost. Dividends paid to each class of shares will vary because of the different levels of service, distribution and transfer agency fees applicable to each class, which are deducted from the income available to be paid to shareholders.
Performance for BlackRock Flexible Equity Fund for the periods prior to January 31, 2005 is based on performance of a certain former State Street Research mutual fund that reorganized with BlackRock Flexible Equity Fund on that date.
BlackRock Advisors, LLC (the “Manager”), the Funds’ investment advisor, waived and/or reimbursed a portion of each Fund’s expenses. Without such waiver and/or reimbursement, each Fund’s performance would have been lower. The Manager is under no obligation to waive or reimburse or to continue waiving or reimbursing its fees after the applicable termination date. See Note 5 of the Notes to Financial Statements for additional information on waivers and reimbursements.
Shareholders of these Funds may incur the following charges: (a) transactional expenses, such as sales charges; and (b) operating expenses, including investment advisory fees, administration fees, service and distribution fees, including 12b-1 fees, acquired fund fees and expenses and other Fund expenses. The expense examples on the previous pages (which are based on a hypothetical investment of $1,000 invested on October 1, 2013 and held through March 31, 2014) are intended to assist shareholders both in calculating expenses based on an investment in each Fund and in comparing these expenses with similar costs of investing in other mutual funds.
The expense examples provide information about actual account values and actual expenses. In order to estimate the expenses a shareholder paid during the period covered by this report, shareholders can divide their account value by $1,000 and then multiply the result by the number corresponding to their Fund and share class under the headings entitled “Expenses Paid During the Period.”
The expense examples also provide information about hypothetical account values and hypothetical expenses based on a Fund’s actual expense ratio and an assumed rate of return of 5% per year before expenses. In order to assist shareholders in comparing the ongoing expenses of investing in these Funds and other funds, compare the 5% hypothetical examples with the 5% hypothetical examples that appear in other funds’ shareholder reports.
The expenses shown in the expense examples are intended to highlight shareholders’ ongoing costs only and do not reflect any transactional expenses, such as sales charges, if any. Therefore, the hypothetical examples are useful in comparing ongoing expenses only, and will not help shareholders determine the relative total expenses of owning different funds. If these transactional expenses were included, shareholder expenses would have been higher.
| | | | | | |
| 10 | | BLACKROCK FUNDS | | MARCH 31, 2014 | | |
| | |
| Derivative Financial Instruments | | |
The Funds may invest in various derivative financial instruments, including financial futures contracts, forward foreign currency exchange contracts, options and swaps, as specified in Note 4 of the Notes to Financial Statements, which may constitute forms of economic leverage. Such derivative financial instruments are used to obtain exposure to a security, index and/or market without owning or taking physical custody of securities or to hedge market, equity, interest rate and/or foreign currency exchange rate risks. Derivative financial instruments involve risks, including the imperfect correlation between the value of a derivative financial instrument and the underlying asset, possible default of the counterparty to the transaction or illiquidity of the derivative financial
instrument. The Funds’ ability to use a derivative financial instrument successfully depends on the investment advisor’s ability to predict pertinent market movements accurately, which cannot be assured. The use of derivative financial instruments may result in losses greater than if they had not been used, may require a Fund to sell or purchase portfolio investments at inopportune times or for distressed values, may limit the amount of appreciation a Fund can realize on an investment, may result in lower dividends paid to shareholders or may cause a Fund to hold an investment that it might otherwise sell. The Funds’ investments in these instruments are discussed in detail in the Notes to Financial Statements.
| | | | | | |
| | | BLACKROCK FUNDS | | MARCH 31, 2014 | | 11 |
| | | | |
| Consolidated Schedule of Investments March 31, 2014 (Unaudited) | | | BlackRock Flexible Equity Fund | |
| | | (Percentages shown are based on Net Assets) | |
| | | | | | | | |
| Common Stocks | | Shares | | | Value | |
Airlines — 7.8% | | | | | | | | |
Air Canada, Class B (a) | | | 74,400 | | | $ | 372,168 | |
Japan Airlines Co. Ltd. | | | 941,300 | | | | 46,325,695 | |
United Continental Holdings, Inc. (a) | | | 94,400 | | | | 4,213,072 | |
Westjet Airlines Ltd. | | | 10,000 | | | | 222,976 | |
| | | | | | | | |
| | | | | | | | 51,133,911 | |
Automobiles — 6.3% | | | | | | | | |
Bayerische Motoren Werke AG | | | 66,000 | | | | 8,340,206 | |
General Motors Co. | | | 952,600 | | | | 32,788,492 | |
| | | | | | | | |
| | | | | | | | 41,128,698 | |
Building Products — 1.6% | | | | | | | | |
Owens Corning | | | 234,100 | | | | 10,106,097 | |
Capital Markets — 0.0% | | | | | | | | |
Freedom Pay, Inc. (a) | | | 43,051 | | | | — | |
Chemicals — 0.5% | | | | | | | | |
CF Industries Holdings, Inc. | | | 12,400 | | | | 3,231,936 | |
Consumer Finance — 1.1% | | | | | | | | |
Discover Financial Services | | | 123,500 | | | | 7,186,465 | |
Diversified Consumer Services — 4.1% | | | | | | | | |
Houghton Mifflin Harcourt Co. (a) | | | 1,332,767 | | | | 27,095,153 | |
Diversified Financial Services — 2.9% | | | | | | | | |
Ally Financial, Inc. (a) | | | 925 | | | | 7,608,125 | |
Berkshire Hathaway, Inc., Class B (a) | | | 92,300 | | | | 11,534,731 | |
| | | | | | | | |
| | | | | | | | 19,142,856 | |
Energy Equipment & Services — 0.9% | | | | | | | | |
Noble Corp. PLC | | | 176,900 | | | | 5,791,706 | |
Food & Staples Retailing — 2.1% | | | | | | | | |
Metro AG (a) | | | 331,804 | | | | 13,534,803 | |
Health Care Providers & Services — 5.9% | | | | | | | | |
Community Health Systems, Inc. (a) | | | 145,600 | | | | 5,703,152 | |
UnitedHealth Group, Inc. | | | 404,500 | | | | 33,164,955 | |
| | | | | | | | |
| | | | | | | | 38,868,107 | |
Insurance — 9.6% | | | | | | | | |
American International Group, Inc. | | | 754,300 | | | | 37,722,543 | |
Fidelity National Financial, Inc., Class A | | | 808,500 | | | | 25,419,240 | |
| | | | | | | | |
| | | | | | | | 63,141,783 | |
Internet Software & Services — 3.0% | | | | | | | | |
eBay, Inc. (a) | | | 242,320 | | | | 13,385,757 | |
Google, Inc., Class A (a) | | | 5,800 | | | | 6,464,158 | |
| | | | | | | | |
| | | | | | | | 19,849,915 | |
IT Services — 3.4% | | | | | | | | |
Visa, Inc., Class A | | | 104,200 | | | | 22,492,612 | |
Media — 11.7% | | | | | | | | |
Comcast Corp., Class A | | | 163,700 | | | | 8,188,274 | |
Liberty Global PLC, Series A (a) | | | 144,700 | | | | 6,019,520 | |
Liberty Global PLC, Series C (a) | | | 144,700 | | | | 5,890,737 | |
Nexstar Broadcasting Group, Inc., Class A | | | 648,200 | | | | 24,320,464 | |
Sinclair Broadcast Group, Inc., Class A | | | 1,183,800 | | | | 32,069,142 | |
| | | | | | | | |
| | | | | | | | 76,488,137 | |
Oil, Gas & Consumable Fuels — 7.6% | | | | | | | | |
EQT Corp. | | | 118,370 | | | | 11,478,339 | |
| | | | | | | | |
| Common Stocks | | Shares | | | Value | |
Oil, Gas & Consumable Fuels (concluded) | | | | | | | | |
Gazprom Neft OAO — ADR | | | 6,130 | | | $ | 126,462 | |
Gazprom OAO — ADR | | | 166,700 | | | | 1,295,259 | |
HollyFrontier Corp. | | | 68,440 | | | | 3,256,375 | |
Marathon Petroleum Corp. | | | 119,000 | | | | 10,357,760 | |
Suncor Energy, Inc. | | | 671,100 | | | | 23,461,656 | |
| | | | | | | | |
| | | | | | | | 49,975,851 | |
Pharmaceuticals — 1.5% | | | | | | | | |
Pfizer, Inc. | | | 310,300 | | | | 9,966,836 | |
Semiconductors & Semiconductor Equipment — 3.7% | |
Micron Technology, Inc. (a) | | | 525,700 | | | | 12,438,062 | |
Samsung Electronics Co. Ltd., Preference Shares | | | 8,400 | | | | 8,367,888 | |
SK Hynix, Inc. (a) | | | 99,600 | | | | 3,379,515 | |
| | | | | | | | |
| | | | | | | | 24,185,465 | |
Software — 3.0% | | | | | | | | |
Activision Blizzard, Inc. | | | 943,800 | | | | 19,291,272 | |
Wireless Telecommunication Services — 3.1% | | | | | | | | |
SoftBank Corp. | | | 109,600 | | | | 8,282,281 | |
Vodafone Group PLC — ADR | | | 329,945 | | | | 12,145,276 | |
| | | | | | | | |
| | | | | | | | 20,427,557 | |
Total Common Stocks — 79.8% | | | | | | | 523,039,160 | |
| | | | | | | | |
| Investment Companies | | | | | | |
iShares Gold Trust (a) | | | 1,226,700 | | | | 15,260,148 | |
SPDR Gold Trust (a) | | | 277,000 | | | | 34,239,970 | |
Total Investment Companies — 7.6% | | | | | | | 49,500,118 | |
| | | | | | | | |
| Participation Notes (a) | | | | | | |
Semiconductors & Semiconductor Equipment — 2.3% | |
Merrill Lynch International (Samsung Electronics Co. Ltd.), due 9/09/14 | | | 12,000 | | | | 15,176,880 | |
Total Long-Term Investments (Cost — $513,897,671) — 89.7% | | | | | | | 587,716,158 | |
| | | | | | | | |
| Short-Term Securities | | | | | | |
BlackRock Liquidity Funds, TempFund, Institutional Class, 0.03% (b)(c) | | | 45,393,347 | | | | 45,393,347 | |
Total Short-Term Securities (Cost — $45,393,347) — 7.0% | | | | | | | 45,393,347 | |
| | | | | | | | |
| Options Purchased | | | | | | |
(Cost — $1,835,275) — 0.4% | | | | | | | 2,775,910 | |
Total Investments Before Options Written (Cost — $561,126,293) — 97.1% | | | | | | | 635,885,415 | |
| | | | | | | | |
| | | | | | | |
| | | | |
| Portfolio Abbreviations | | |
ADR American Depositary Receipts CAD Canadian Dollar EUR Euro | | JPY Japanese Yen LIBOR London Interbank Offered Rate USD US Dollar | | |
See Notes to Financial Statements.
| | | | | | |
| 12 | | BLACKROCK FUNDS | | MARCH 31, 2014 | | |
| | | | |
| Consolidated Schedule of Investments (continued) | | | BlackRock Flexible Equity Fund | |
| | | (Percentages shown are based on Net Assets) | |
| | | | | | |
Options Written | | | | | Value | |
(Premiums Received — $438,165) — (0.1)% | | | | $ | (380,361 | ) |
Total Investments Net of Options Written — 97.0% | | | | | 635,505,054 | |
Other Assets Less Liabilities — 3.0% | | | | | 19,553,755 | |
| | | | | | |
Net Assets — 100.0% | | | | $ | 655,058,809 | |
| | | | | | |
|
| Notes to Consolidated Schedule of Investments |
| (a) | Non-income producing security. |
| (b) | Investments in issuers considered to be an affiliate of the Fund during the six months ended March 31, 2014, for purposes of Section 2(a)(3) of the Investment Company Act of 1940, as amended, were as follows: |
| | | | | | | | | | | | | | | | | | | | | | | | | | | | |
| Affiliate | | Shares Held at
September 30, 2013 | | | Shares
Purchased | | | Shares
Sold | | | Shares Held at
March 31, 2014 | | | Value at
March 31, 2014 | | | Income | | | Realized Loss | |
BlackRock Liquidity Funds, TempFund, Institutional Class | | | 25,752,136 | | | | 19,641,212 | 1 | | | — | | | | 45,393,347 | | | $ | 45,393,347 | | | $ | 6,548 | | | | — | |
BlackRock Liquidity Series, LLC, Money Market Series | | | — | | | | — | | | | — | | | | — | | | | — | | | | 814 | | | | — | |
iShares Gold Trust | | | — | | | | 1,226,700 | | | | — | | | | 1,226,700 | | | | 15,260,148 | | | | — | | | | — | |
iShares Silver Trust | | | 783,500 | | | | — | | | | 783,500 | | | | — | | | | — | | | | — | | | $ | (1,777,073 | ) |
| | 1 | Represents net shares purchased. |
| (c) | Represents the current yield as of report date. |
| Ÿ | | For Fund compliance purposes, the Fund’s industry classifications refer to any one or more of the industry sub-classifications used by one or more widely recognized market indexes or ratings group indexes and/or as defined by the investment advisor. These definitions may not apply for purposes of this report, which may combine such industry sub-classifications for reporting ease. |
| Ÿ | | Financial futures contracts outstanding as of March 31, 2014 were as follows: |
| | | | | | | | | | | | | | | | | | | | |
Contracts
Sold | | | Issue | | Exchange | | Expiration | | | | | Notional
Value | | | Unrealized
Appreciation | |
| | (425 | ) | | E-Mini Russell 2000 Futures | | Intercontinental Exchange | | June 2014 | | | USD | | | | 49,746,250 | | | $ | 540,620 | |
| Ÿ | | Forward foreign currency exchange contracts outstanding as of March 31, 2014 were as follows: |
| | | | | | | | | | | | | | | | | | | | | | |
Currency Purchased | | | Currency
Sold | | | Counterparty | | Settlement
Date | | | Unrealized
Appreciation
(Depreciation) | |
| CAD | | | 7,400,000 | | | | USD | | | | 6,678,399 | | | Citibank N.A. | | | 4/22/14 | | | $ | 12,010 | |
| EUR | | | 1,845,000 | | | | USD | | | | 2,534,292 | | | Citibank N.A. | | | 4/22/14 | | | | 7,357 | |
| EUR | | | 9,943,767 | | | | USD | | | | 13,518,362 | | | Citibank N.A. | | | 4/22/14 | | | | 180,047 | |
| JPY | | | 260,540,000 | | | | USD | | | | 2,544,063 | | | Citibank N.A. | | | 4/22/14 | | | | (19,513 | ) |
| USD | | | 6,926,576 | | | | CAD | | | | 7,602,000 | | | Barclays Bank PLC | | | 4/22/14 | | | | 53,537 | |
| USD | | | 2,549,740 | | | | CAD | | | | 2,825,000 | | | Citibank N.A. | | | 4/22/14 | | | | (4,369 | ) |
| USD | | | 39,249,579 | | | | EUR | | | | 28,906,000 | | | Deutsche Bank AG | | | 4/22/14 | | | | (570,966 | ) |
| USD | | | 48,835,998 | | | | JPY | | | | 5,092,401,000 | | | BNP Paribas S.A. | | | 4/22/14 | | | | (507,745 | ) |
| USD | | | 4,662,307 | | | | JPY | | | | 472,447,000 | | | JPMorgan Chase Bank N.A. | | | 4/22/14 | | | | 84,447 | |
| USD | | | 3,030,638 | | | | JPY | | | | 310,207,000 | | | Toronto-Dominion Bank | | | 4/22/14 | | | | 24,831 | |
| Total | | | | | | | | | | | | | | | | | | | | $ | (740,364 | ) |
| | | | | | | | | | | | | | | | | | | | | | |
| Ÿ | | Exchange-traded options purchased as of March 31, 2014 were as follows: |
| | | | | | | | | | | | | | | | | | | | | | | | |
| Description | | Put | | | Strike Price | | | Expiration
Date | | | Contracts | | | Market
Value | |
58.com, Inc. — ADR | | | Put | | | | USD | | | | 40.00 | | | | 4/19/14 | | | | 500 | | | $ | 111,250 | |
Facebook, Inc. | | | Put | | | | USD | | | | 62.50 | | | | 4/19/14 | | | | 1,000 | | | | 352,500 | |
Seattle Genetics, Inc. | | | Put | | | | USD | | | | 50.00 | | | | 4/19/14 | | | | 300 | | | | 195,000 | |
ServiceNow, Inc. | | | Put | | | | USD | | | | 60.00 | | | | 4/19/14 | | | | 400 | | | | 102,000 | |
Tableau Software, Inc. | | | Put | | | | USD | | | | 80.00 | | | | 4/19/14 | | | | 600 | | | | 360,000 | |
See Notes to Financial Statements.
| | | | | | |
| | | BLACKROCK FUNDS | | MARCH 31, 2014 | | 13 |
| | | | |
| Consolidated Schedule of Investments (continued) | | | BlackRock Flexible Equity Fund | |
| Ÿ | | Exchange-traded options purchased as of March 31, 2014 were as follows: (concluded) |
| | | | | | | | | | | | | | | | | | | | | | |
| Description | | Put | | | Strike Price | | | Expiration
Date | | Contracts | | | Market Value | |
Yelp, Inc. | | | Put | | | | USD | | | | 82.50 | | | 4/19/14 | | | 400 | | | $ | 294,000 | |
Yelp, Inc. | | | Put | | | | USD | | | | 80.00 | | | 4/19/14 | | | 200 | | | | 111,000 | |
Demandware, Inc. | | | Put | | | | USD | | | | 55.00 | | | 5/17/14 | | | 300 | | | | 51,000 | |
FireEye, Inc. | | | Put | | | | USD | | | | 60.00 | | | 5/17/14 | | | 350 | | | | 196,000 | |
Workday, Inc. | | | Put | | | | USD | | | | 90.00 | | | 5/17/14 | | | 166 | | | | 69,720 | |
Facebook, Inc. | | | Put | | | | USD | | | | 57.50 | | | 6/21/14 | | | 438 | | | | 178,485 | |
FireEye, Inc. | | | Put | | | | USD | | | | 55.00 | | | 6/21/14 | | | 504 | | | | 241,920 | |
DexCom, Inc. | | | Put | | | | USD | | | | 40.00 | | | 9/20/14 | | | 266 | | | | 210,140 | |
Veeva Systems, Inc. | | | Put | | | | USD | | | | 25.00 | | | 9/20/14 | | | 663 | | | | 208,845 | |
Tableau Software, Inc. | | | Put | | | | USD | | | | 70.00 | | | 10/18/14 | | | 95 | | | | 94,050 | |
Total | | | | | | | | | | | | | | | | | | | | $ | 2,775,910 | |
| | | | | | | | | | | | | | | | | | | | | | |
| Ÿ | | Exchange-traded options written as of March 31, 2014 were as follows: |
| | | | | | | | | | | | | | | | | | | | | | |
| Description | | Call | | | Strike Price | | | Expiration
Date | | Contracts | | | Market
Value | |
American International Group, Inc. | | | Call | | | | USD | | | | 51.00 | | | 4/11/14 | | | 1,734 | | | $ | (50,286 | ) |
Discover Financial Services | | | Call | | | | USD | | | | 55.00 | | | 4/19/14 | | | 404 | | | | (137,360 | ) |
Marathon Petroleum Corp. | | | Call | | | | USD | | | | 92.50 | | | 4/19/14 | | | 238 | | | | (17,255 | ) |
CF Industries Holdings, Inc. | | | Call | | | | USD | | | | 250.00 | | | 4/25/14 | | | 124 | | | | (175,460 | ) |
Total | | | | | | | | | | | | | | | | | | | | $ | (380,361 | ) |
| | | | | | | | | | | | | | | | | | | | | | |
| Ÿ | | OTC total return swaps outstanding as of March 31, 2014 were as follows: |
| | | | | | | | | | | | | | | | | | | | | | | | | | | | |
| Reference Entity | | Fixed Rate/
Floating Rate | | Counterparty | | | Expiration
Date | | Contracts | | | Market Value | | | Premiums
Paid
(Received) | | | Unrealized
Appreciation | |
Samsung Electronics Co. Ltd. | | 1-month LIBOR plus 0.50%1 | | | Citibank N.A. | | | 9/05/14 | | | USD | | | | 6,000 | | | $ | 451,678 | | | | — | | | $ | 451,678 | |
Samsung Electronics Co. Ltd. | | 1-month LIBOR plus 0.50%1 | | | Citibank N.A. | | | 9/11/14 | | | USD | | | | 4,500 | | | | 338,758 | | | | — | | | | 338,758 | |
Samsung Electronics Co. Ltd. | | 1-month LIBOR plus 0.50%1 | | | Citibank N.A. | | | 9/11/14 | | | USD | | | | 4,200 | | | | 316,174 | | | | — | | | | 316,174 | |
Total | | | | | | | | | | | | | | | | | | $ | 1,106,610 | | | | — | | | $ | 1,106,610 | |
| | | | | | | | | | | | | | | | | | | | |
| | 1 | Fund pays the floating rate and receives the total return of the reference entity. |
| Ÿ | | Fair Value Measurements — Various inputs are used in determining the fair value of investments and derivative financial instruments. These inputs to valuation techniques are categorized into a disclosure hierarchy consisting of three broad levels for financial statement purposes as follows: |
| | Ÿ | | Level 1 — unadjusted price quotations in active markets/exchanges for identical assets or liabilities that the Fund has the ability to access |
| | Ÿ | | Level 2 — other observable inputs (including, but not limited to, quoted prices for similar assets or liabilities in markets that are active, quoted prices for identical or similar assets or liabilities in markets that are not active, inputs other than quoted prices that are observable for the assets or liabilities (such as interest rates, yield curves, volatilities, prepayment speeds, loss severities, credit risks and default rates) or other market–corroborated inputs) |
| | Ÿ | | Level 3 — unobservable inputs based on the best information available in the circumstances, to the extent observable inputs are not available (including the Fund’s own assumptions used in determining the fair value of investments and derivative financial instruments) |
The hierarchy gives the highest priority to unadjusted quoted prices in active markets for identical assets or liabilities (Level 1 measurements) and the lowest priority to unobservable inputs (Level 3 measurements). Accordingly, the degree of judgment exercised in determining fair value is greatest for instruments categorized in Level 3. The inputs used to measure fair value may fall into different levels of the fair value hierarchy. In such cases, for disclosure purposes, the fair value hierarchy classification is determined based on the lowest level input that is significant to the fair value measurement in its entirety.
Changes in valuation techniques may result in transfers into or out of an assigned level within the disclosure hierarchy. In accordance with the Fund’s policy, transfers between different levels of the fair value disclosure hierarchy are deemed to have occurred as of the beginning of the reporting period. The categorization of a value determined for investments and derivative financial instruments is based on the pricing transparency of the investment and derivative financial instrument and is not necessarily an indication of the risks associated with investing in those securities. For information about the Fund’s policy regarding valuation of investments and derivative financial instruments, please refer to Note 2 of the Notes to Financial Statements.
See Notes to Financial Statements.
| | | | | | |
| 14 | | BLACKROCK FUNDS | | MARCH 31, 2014 | | |
| | |
| Consolidated Schedule of Investments (concluded) | | BlackRock Flexible Equity Fund |
The following tables summarize the Fund’s investments and derivative financial instruments categorized in the disclosure hierarchy as of March 31, 2014:
| | | | | | | | | | | | | | | | |
| | | Level 1 | | | Level 2 | | | Level 3 | | | Total | |
Assets: | | | | | | | | | | | | | | | | |
Investments: | | | | | | | | | | | | | | | | |
Long-Term Investments: | | | | | | | | | | | | | | | | |
Common Stocks: | | | | | | | | | | | | | | | | |
Airlines | | $ | 4,808,216 | | | $ | 46,325,695 | | | | — | | | $ | 51,133,911 | |
Automobiles | | | 32,788,492 | | | | 8,340,206 | | | | — | | | | 41,128,698 | |
Building Products | | | 10,106,097 | | | | — | | | | — | | | | 10,106,097 | |
Capital Markets | | | — | | | | — | | | | — | | | | — | |
Chemicals | | | 3,231,936 | | | | — | | | | — | | | | 3,231,936 | |
Consumer Finance | | | 7,186,465 | | | | — | | | | — | | | | 7,186,465 | |
Diversified Consumer Services | | | 27,095,153 | | | | — | | | | — | | | | 27,095,153 | |
Diversified Financial Services | | | 11,534,731 | | | | 7,608,125 | | | | — | | | | 19,142,856 | |
Energy Equipment & Services | | | 5,791,706 | | | | — | | | | — | | | | 5,791,706 | |
Food & Staples Retailing | | | — | | | | 13,534,803 | | | | — | | | | 13,534,803 | |
Health Care Providers & Services | | | 38,868,107 | | | | — | | | | — | | | | 38,868,107 | |
Insurance | | | 63,141,783 | | | | — | | | | — | | | | 63,141,783 | |
Internet Software & Services | | | 19,849,915 | | | | — | | | | — | | | | 19,849,915 | |
IT Services | | | 22,492,612 | | | | — | | | | — | | | | 22,492,612 | |
Media | | | 76,488,137 | | | | — | | | | — | | | | 76,488,137 | |
Oil, Gas & Consumable Fuels | | | 49,975,851 | | | | — | | | | — | | | | 49,975,851 | |
Pharmaceuticals | | | 9,966,836 | | | | — | | | | — | | | | 9,966,836 | |
Semiconductors & Semiconductor Equipment | | | 12,438,062 | | | | 11,747,403 | | | | — | | | | 24,185,465 | |
Software | | | 19,291,272 | | | | — | | | | — | | | | 19,291,272 | |
Wireless Telecommunication Services | | | 12,145,276 | | | | 8,282,281 | | | | — | | | | 20,427,557 | |
Investment Companies | | | 49,500,118 | | | | — | | | | — | | | | 49,500,118 | |
Participation Notes: | | | | | | | | | | | | | | | | |
Semiconductors & Semiconductor Equipment | | | — | | | | 15,176,880 | | | | — | | | | 15,176,880 | |
Short-Term Securities | | | 45,393,347 | | | | — | | | | — | | | | 45,393,347 | |
Options Purchased: | | | | | | | | | | | | | | | | |
Equity Contracts | | | 2,775,910 | | | | — | | | | — | | | | 2,775,910 | |
Total | | $ | 524,870,022 | | | $ | 111,015,393 | | | | — | | | $ | 635,885,415 | |
| | | | |
| | | | | | | | | | | | | | | | |
| | | Level 1 | | | Level 2 | | | Level 3 | | | Total | |
Derivative Financial Instruments1 | | | | | | | | | | | | | | | | |
Assets: | | | | | | | | | | | | | | | | |
Equity contracts | | $ | 540,620 | | | $ | 1,106,610 | | | | — | | | $ | 1,647,230 | |
Foreign currency exchange contracts | | | — | | | | 362,229 | | | | — | | | | 362,229 | |
Liabilities: | | | | | | | | | | | | | | | | |
Equity contracts | | | (380,361 | ) | | | — | | | | — | | | | (380,361 | ) |
Foreign currency exchange contracts | | | — | | | | (1,102,593 | ) | | | — | | | | (1,102,593 | ) |
Total | | $ | 160,259 | | | $ | 366,246 | | | | — | | | $ | 526,505 | |
| | | | |
|
1 Derivative financial instruments are swaps, financial futures contracts, forward foreign currency exchange contracts and options written. Swaps, financial futures contracts and forward foreign currency exchange contracts are valued at the unrealized appreciation/depreciation on the instrument and options written are shown at value. | |
|
| The carrying amount for certain of the Fund’s assets and/or liabilities approximates fair value for financial statement purposes. As of March 31, 2014, such assets and/or liabilities are categorized within the disclosure hierarchy as follows: | |
| | | | | | | | | | | | | | | | |
| | | Level 1 | | | Level 2 | | | Level 3 | | | Total | |
Assets: | | | | | | | | | | | | | | | | |
Cash pledged for financial futures contracts | | $ | 2,105,000 | | | | — | | | | — | | | $ | 2,105,000 | |
Foreign currency at value | | | 3,329,352 | | | | — | | | | — | | | | 3,329,352 | |
Liabilities: | | | | | | | | | | | | | | | | |
Cash received as collateral for OTC derivatives | | | — | | | $ | (900,000 | ) | | | — | | | | (900,000 | ) |
Total | | $ | 5,434,353 | | | $ | (900,000 | ) | | | — | | | $ | 4,534,353 | |
| | | | |
There were no transfers between levels during the six months ended March 31, 2014.
See Notes to Financial Statements.
| | | | | | |
| | | BLACKROCK FUNDS | | MARCH 31, 2014 | | 15 |
| | | | |
| Schedule of Investments March 31, 2014 (Unaudited) | | | BlackRock Mid-Cap Growth Equity Portfolio | |
| | | (Percentages shown are based on Net Assets) | |
| | | | | | | | |
| Common Stocks | | Shares | | | Value | |
Air Freight & Logistics — 1.4% | | | | | | | | |
XPO Logistics, Inc. (a) | | | 184,716 | | | $ | 5,432,498 | |
Airlines — 2.1% | | | | | | | | |
Spirit Airlines, Inc. (a) | | | 144,016 | | | | 8,554,550 | |
Banks — 1.9% | | | | | | | | |
First Republic Bank | | | 81,029 | | | | 4,374,756 | |
SVB Financial Group (a) | | | 26,100 | | | | 3,361,158 | |
| | | | | | | | |
| | | | | | | | 7,735,914 | |
Biotechnology — 2.0% | | | | | | | | |
United Therapeutics Corp. (a) | | | 84,642 | | | | 7,958,887 | |
Capital Markets — 1.7% | | | | | | | | |
Affiliated Managers Group, Inc. (a) | | | 33,340 | | | | 6,669,667 | |
Commercial Services & Supplies — 4.2% | | | | | | | | |
KAR Auction Services, Inc. | | | 279,664 | | | | 8,487,802 | |
Waste Connections, Inc. | | | 191,643 | | | | 8,405,462 | |
| | | | | | | | |
| | | | | | | | 16,893,264 | |
Construction & Engineering — 0.5% | | | | | | | | |
Louis XIII Holdings Ltd. (a)(b) | | | 1,988,500 | | | | 2,179,339 | |
Diversified Financial Services — 2.4% | | | | | | | | |
Moody’s Corp. | | | 118,949 | | | | 9,435,035 | |
Electrical Equipment — 5.0% | | | | | | | | |
Acuity Brands, Inc. | | | 31,000 | | | | 4,109,670 | |
AMETEK, Inc. | | | 168,597 | | | | 8,681,059 | |
SolarCity Corp. (a)(b) | | | 114,560 | | | | 7,173,747 | |
| | | | | | | | |
| | | | | | | | 19,964,476 | |
Energy Equipment & Services — 3.5% | | | | | | | | |
Core Laboratories NV | | | 33,631 | | | | 6,673,736 | |
FMC Technologies, Inc. (a) | | | 66,333 | | | | 3,468,553 | |
Oceaneering International, Inc. | | | 54,025 | | | | 3,882,237 | |
| | | | | | | | |
| | | | | | | | 14,024,526 | |
Food Products — 1.8% | | | | | | | | |
Mead Johnson Nutrition Co. | | | 88,440 | | | | 7,352,902 | |
Health Care Equipment & Supplies — 3.5% | | | | | | | | |
The Cooper Cos., Inc. | | | 68,699 | | | | 9,436,495 | |
Intuitive Surgical, Inc. (a) | | | 10,897 | | | | 4,772,777 | |
| | | | | | | | |
| | | | | | | | 14,209,272 | |
Health Care Technology — 1.6% | | | | | | | | |
Athenahealth, Inc. (a)(b) | | | 40,187 | | | | 6,439,565 | |
Hotels, Restaurants & Leisure — 4.8% | | | | | | | | |
Panera Bread Co. — Class A (a) | | | 43,851 | | | | 7,738,386 | |
Wynn Resorts Ltd. | | | 51,320 | | | | 11,400,738 | |
| | | | | | | | |
| | | | | | | | 19,139,124 | |
Household Durables — 3.3% | | | | | | | | |
Jarden Corp. (a) | | | 218,903 | | | | 13,096,966 | |
Household Products — 2.0% | | | | | | | | |
Spectrum Brands Holdings, Inc. | | | 103,013 | | | | 8,210,136 | |
Internet & Catalog Retail — 8.0% | | | | | | | | |
ASOS PLC (a) | | | 37,399 | | | | 3,232,760 | |
Liberty Ventures, Series A (a) | | | 119,433 | | | | 15,565,703 | |
Qunar Cayman Islands Ltd. — ADR (a) | | | 180,545 | | | | 5,522,872 | |
Vipshop Holdings Ltd. — ADR (a) | | | 51,824 | | | | 7,737,323 | |
| | | | | | | | |
| | | | | | | | 32,058,658 | |
Internet Software & Services — 8.1% | | | | | | | | |
AOL, Inc. (a) | | | 80,838 | | | | 3,538,279 | |
CoStar Group, Inc. (a) | | | 26,063 | | | | 4,867,005 | |
IAC/InterActiveCorp | | | 111,378 | | | | 7,951,275 | |
| | | | | | | | |
| Common Stocks | | Shares | | | Value | |
Internet Software & Services (concluded) | | | | | | | | |
SINA Corp. (a) | | | 71,647 | | | $ | 4,328,195 | |
Yelp, Inc. (a) | | | 131,006 | | | | 10,078,292 | |
Youku Tudou, Inc. — ADR (a) | | | 68,506 | | | | 1,920,908 | |
| | | | | | | | |
| | | | | | | | 32,683,954 | |
IT Services — 4.7% | | | | | | | | |
Alliance Data Systems Corp. (a) | | | 36,212 | | | | 9,865,959 | |
WEX, Inc. (a) | | | 94,443 | | | | 8,976,807 | |
| | | | | | | | |
| | | | | | | | 18,842,766 | |
Machinery — 3.7% | | | | | | | | |
Colfax Corp. (a) | | | 104,906 | | | | 7,482,945 | |
Pentair Ltd. | | | 42,487 | | | | 3,370,919 | |
Timken Co. | | | 69,489 | | | | 4,084,563 | |
| | | | | | | | |
| | | | | | | | 14,938,427 | |
Marine — 0.8% | | | | | | | | |
Kirby Corp. (a) | | | 32,500 | | | | 3,290,625 | |
Media — 8.7% | | | | | | | | |
Aimia, Inc. | | | 406,100 | | | | 6,520,375 | |
Lions Gate Entertainment Corp. | | | 245,267 | | | | 6,555,987 | |
The Madison Square Garden Co., Class A (a) | | | 194,360 | | | | 11,035,761 | |
Schibsted ASA | | | 172,414 | | | | 10,689,084 | |
| | | | | | | | |
| | | | | | | | 34,801,207 | |
Pharmaceuticals — 2.7% | | | | | | | | |
Alexza Pharmaceuticals, Inc. (a) | | | 81,252 | | | | — | |
Jazz Pharmaceuticals PLC (a) | | | 40,391 | | | | 5,601,424 | |
Zoetis, Inc. | | | 176,460 | | | | 5,106,752 | |
| | | | | | | | |
| | | | | | | | 10,708,176 | |
Professional Services — 1.2% | | | | | | | | |
Towers Watson & Co., Class A | | | 42,531 | | | | 4,850,660 | |
Road & Rail — 2.2% | | | | | | | | |
Genesee & Wyoming, Inc., Class A (a) | | | 73,418 | | | | 7,145,040 | |
JB Hunt Transport Services, Inc. | | | 24,641 | | | | 1,772,181 | |
| | | | | | | | |
| | | | | | | | 8,917,221 | |
Software — 7.2% | | | | | | | | |
Autodesk, Inc. (a) | | | 146,368 | | | | 7,198,378 | |
Guidewire Software, Inc. (a) | | | 117,314 | | | | 5,754,252 | |
Qlik Technologies, Inc. (a) | | | 137,098 | | | | 3,645,436 | |
ServiceNow, Inc. (a) | | | 87,504 | | | | 5,243,240 | |
Splunk, Inc. (a) | | | 97,099 | | | | 6,941,607 | |
| | | | | | | | |
| | | | | | | | 28,782,913 | |
Specialty Retail — 5.4% | | | | | | | | |
CarMax, Inc. (a) | | | 143,960 | | | | 6,737,328 | |
Lumber Liquidators Holdings, Inc. (a) | | | 75,637 | | | | 7,094,751 | |
Tractor Supply Co. | | | 113,125 | | | | 7,990,019 | |
| | | | | | | | |
| | | | | | | | 21,822,098 | |
Textiles, Apparel & Luxury Goods — 2.0% | | | | | | | | |
Under Armour, Inc., Class A (a) | | | 68,142 | | | | 7,811,799 | |
Wireless Telecommunication Services — 1.6% | | | | | | | | |
SBA Communications Corp., Class A (a) | | | 71,019 | | | | 6,459,888 | |
Total Common Stocks — 98.0% | | | | | | | 393,264,513 | |
| | | | | | | | |
| | | | | | | |
See Notes to Financial Statements.
| | | | | | |
| 16 | | BLACKROCK FUNDS | | MARCH 31, 2014 | | |
| | | | |
| Schedule of Investments (continued) | | | BlackRock Mid-Cap Growth Equity Portfolio | |
| | | (Percentages shown are based on Net Assets) | |
| | | | | | | | |
| Preferred Stocks | | Shares | | | Value | |
Internet Software & Services — 1.3% | | | | | | | | |
Uber Technologies, Inc. (Acquired 3/20/14, cost $5,000,920) (c)(d) | | | 5,000,920 | | | $ | 5,000,920 | |
Software — 0.7% | | | | | | | | |
Palantir Technologies, Inc. (Acquired 2/07/14,cost $2,811,904) (d) | | | 458,712 | | | | 2,811,904 | |
Total Preferred Stocks — 2.0% | | | | | | | 7,812,824 | |
Total Long-Term Investments (Cost — $320,335,364) — 100.0% | | | | | | | 401,077,337 | |
| | | | | | | | |
| Short-Term Securities | | | | | | |
BlackRock Liquidity Funds, TempFund, Institutional Class, 0.03% (e)(f) | | | 2,093,119 | | | | 2,093,119 | |
| | | | | | | | |
| Short-Term Securities | | Beneficial
Interest
(000) | | | Value | |
BlackRock Liquidity Series, LLC, Money Market Series, 0.16% (e)(f)(g) | | $ | 10,457 | | | | 10,457,192 | |
Total Short-Term Securities (Cost — $12,550,311) — 3.1% | | | | | | | 12,550,311 | |
Total Investments (Cost — $332,885,675) — 103.1% | | | | 413,627,648 | |
Liabilities in Excess of Other Assets — (3.1)% | | | | | | | (12,338,715 | ) |
| | | | | | | | |
Net Assets — 100.0% | | | | | | $ | 401,288,933 | |
| | | | | | | | |
|
| Notes to Schedule of Investments |
| (a) | Non-income producing security. |
| (b) | Security, or a portion of security, is on loan. |
| (d) | Restricted securities as to resale. As of report date, the Fund held restricted securities with a current value of $7,812,824 and an original cost of $7,812,824 which was 2.0% of its net assets. |
| (e) | Investments in issuers considered to be an affiliate of the Fund during the six months ended March 31, 2014, for purposes of Section 2(a)(3) of the Investment Company Act of 1940, as amended, were as follows: |
| | | | | | | | | | | | | | | | | | | | |
| Affiliate | | Shares/
Beneficial
Interest Held at
September 30,
2013 | | | Net Activity | | | Shares/
Beneficial
Interest Held at
March 31, 2014 | | | Value at
March 31,
2014 | | | Income | |
BlackRock Liquidity Funds, TempFund, Institutional Class | | | 340,952 | | | | 1,752,167 | | | | 2,093,119 | | | $ | 2,093,119 | | | $ | 382 | |
BlackRock Liquidity Series, LLC, Money Market Series | | $ | 31,633,241 | | | $ | (21,176,049 | ) | | $ | 10,457,192 | | | $ | 10,457,192 | | | $ | 47,212 | |
| (f) | Represents the current yield as of report date. |
| (g) | Security was purchased with the cash collateral from loaned securities. The Fund may withdraw up to 25% of its investment daily, although the manager of the BlackRock Liquidity Series, LLC, Money Market Series, in its sole discretion, may permit an investor to withdraw more than 25% on any one day. |
| Ÿ | | For Fund compliance purposes, the Fund’s industry classifications refer to any one or more of the industry sub-classifications used by one or more widely recognized market indexes or ratings group indexes, and/or as defined by the investment advisor. These definitions may not apply for purposes of this report, which may combine such industry sub-classifications for reporting ease. |
| Ÿ | | Fair Value Measurements — Various inputs are used in determining the fair value of investments. These inputs to valuation techniques are categorized into a disclosure hierarchy consisting of three broad levels for financial statement purposes as follows: |
| | Ÿ | | Level 1 — unadjusted price quotations in active markets/exchanges for identical assets or liabilities that the Fund has the ability to access |
| | Ÿ | | Level 2 — other observable inputs (including, but not limited to, quoted prices for similar assets or liabilities in markets that are active, quoted prices for identical or similar assets or liabilities in markets that are not active, inputs other than quoted prices that are observable for the assets or liabilities (such as interest rates, yield curves, volatilities, prepayment speeds, loss severities, credit risks and default rates) or other market–corroborated inputs) |
| | Ÿ | | Level 3 — unobservable inputs based on the best information available in the circumstances, to the extent observable inputs are not available (including the Fund’s own assumptions used in determining the fair value of investments) |
The hierarchy gives the highest priority to unadjusted quoted prices in active markets for identical assets or liabilities (Level 1 measurements) and the lowest priority to unobservable inputs (Level 3 measurements). Accordingly, the degree of judgment exercised in determining fair value is greatest for instruments categorized in Level 3. The inputs used to measure fair value may fall into different levels of the fair value hierarchy. In such cases, for disclosure purposes, the fair value hierarchy classification is determined based on the lowest level input that is significant to the fair value measurement in its entirety.
Changes in valuation techniques may result in transfers into or out of an assigned level within the disclosure hierarchy. In accordance with the Fund’s policy, transfers between different levels of the fair value disclosure hierarchy are deemed to have occurred as of the beginning of the reporting period. The categorization of a value determined for investments is based on the pricing transparency of the investment and is not necessarily an indication of the risks associated with investing in those securities. For information about the Fund’s policy regarding valuation of investments, please refer to Note 2 of the Notes to Financial Statements.
See Notes to Financial Statements.
| | | | | | |
| | | BLACKROCK FUNDS | | MARCH 31, 2014 | | 17 |
| | | | |
| Schedule of Investments (continued) | | | BlackRock Mid-Cap Growth Equity Portfolio | |
The following table summarizes the Fund’s investments categorized in the disclosure hierarchy as of March 31, 2014:
| | | | | | | | | | | | | | | | |
| | | Level 1 | | | Level 2 | | | Level 3 | | | Total | |
Assets: | | | | | | | | | | | | | | | | |
Investments: | | | | | | | | | | | | | | | | |
Long-Term Investments: | | | | | | | | | | | | | | | | |
Common Stocks: | | | | | | | | | | | | | | | | |
Air Freight & Logistics | | $ | 5,432,498 | | | | — | | | | — | | | $ | 5,432,498 | |
Airlines | | | 8,554,550 | | | | — | | | | — | | | | 8,554,550 | |
Banks | | | 7,735,914 | | | | — | | | | — | | | | 7,735,914 | |
Biotechnology | | | 7,958,887 | | | | — | | | | — | | | | 7,958,887 | |
Capital Markets | | | 6,669,667 | | | | — | | | | — | | | | 6,669,667 | |
Commercial Services & Supplies | | | 16,893,264 | | | | — | | | | — | | | | 16,893,264 | |
Construction & Engineering | | | — | | | $ | 2,179,339 | | | | — | | | | 2,179,339 | |
Diversified Financial Services | | | 9,435,035 | | | | — | | | | — | | | | 9,435,035 | |
Electrical Equipment | | | 19,964,476 | | | | — | | | | — | | | | 19,964,476 | |
Energy Equipment & Services | | | 14,024,526 | | | | — | | | | — | | | | 14,024,526 | |
Food Products | | | 7,352,902 | | | | — | | | | — | | | | 7,352,902 | |
Health Care Equipment & Supplies | | | 14,209,272 | | | | — | | | | — | | | | 14,209,272 | |
Health Care Technology | | | 6,439,565 | | | | — | | | | — | | | | 6,439,565 | |
Hotels, Restaurants & Leisure | | | 19,139,124 | | | | — | | | | — | | | | 19,139,124 | |
Household Durables | | | 13,096,966 | | | | — | | | | — | | | | 13,096,966 | |
Household Products | | | 8,210,136 | | | | — | | | | — | | | | 8,210,136 | |
Internet & Catalog Retail | | | 28,825,898 | | | | 3,232,760 | | | | — | | | | 32,058,658 | |
Internet Software & Services | | | 32,683,954 | | | | — | | | | — | | | | 32,683,954 | |
IT Services | | | 18,842,766 | | | | — | | | | — | | | | 18,842,766 | |
Machinery | | | 14,938,427 | | | | — | | | | — | | | | 14,938,427 | |
Marine | | | 3,290,625 | | | | — | | | | — | | | | 3,290,625 | |
Media | | | 24,112,123 | | | | 10,689,084 | | | | — | | | | 34,801,207 | |
Pharmaceuticals | | | 10,708,176 | | | | — | | | | — | | | | 10,708,176 | |
Professional Services | | | 4,850,660 | | | | — | | | | — | | | | 4,850,660 | |
Road & Rail | | | 8,917,221 | | | | — | | | | — | | | | 8,917,221 | |
Software | | | 28,782,913 | | | | — | | | | — | | | | 28,782,913 | |
Specialty Retail | | | 21,822,098 | | | | — | | | | — | | | | 21,822,098 | |
Textiles, Apparel & Luxury Goods | | | 7,811,799 | | | | — | | | | — | | | | 7,811,799 | |
Wireless Telecommunication Services | | | 6,459,888 | | | | — | | | | — | | | | 6,459,888 | |
Preferred Stocks | | | — | | | | — | | | $ | 7,812,824 | | | | 7,812,824 | |
Short-Term Securities | | | 2,093,119 | | | | 10,457,192 | | | | — | | | | 12,550,311 | |
Total | | $ | 379,256,449 | | | $ | 26,558,375 | | | $ | 7,812,824 | | | $ | 413,627,648 | |
| | | | |
|
| The carrying amount for certain of the Fund’s assets and/or liabilities approximates fair value for financial statement purposes. As of March 31, 2014, such assets and/or liabilities are categorized within the disclosure hierarchy as follows: | |
| | | | | | | | | | | | | | | | |
| | | Level 1 | | | Level 2 | | | Level 3 | | | Total | |
Assets: | | | | | | | | | | | | | | | | |
Foreign currency at value | | $ | 53,815 | | | | — | | | | — | | | $ | 53,815 | |
Liabilities: | | | | | | | | | | | | | | | | |
Collateral on securities loaned at value | | | — | | | $ | (10,457,192 | ) | | | — | | | | (10,457,192 | ) |
Total | | $ | 53,815 | | | $ | (10,457,192 | ) | | | — | | | $ | (10,403,377 | ) |
| | | | |
There were no transfers between Level 1 and Level 2 during the six months ended March 31, 2014.
See Notes to Financial Statements.
| | | | | | |
| 18 | | BLACKROCK FUNDS | | MARCH 31, 2014 | | |
| | | | |
| Schedule of Investments (concluded) | | | BlackRock Mid-Cap Growth Equity Portfolio | |
A reconciliation of Level 3 investments is presented when the Fund had a significant amount of Level 3 investments at the beginning and/or end of the period in relation to net assets. The following table is a reconciliation of Level 3 investments for which significant unobservable inputs were used in determining fair value:
| | | | |
| | | Preferred Stocks | |
Assets: | |
Opening balance, as of September 30, 2013 | | | — | |
Transfers into Level 3 | | | — | |
Transfers out of Level 3 | | | — | |
Accrued discounts/premiums | | | — | |
Net realized gain (loss) | | | — | |
Net change in unrealized appreciation/depreciation1 | | | — | |
Purchases | | $ | 7,812,824 | |
Sales | | | — | |
Closing balance, as of March 31, 2014 | | $ | 7,812,824 | |
| | | | |
Net change in unrealized appreciation/depreciation on investments still held at March 31, 20141,2 | | | — | |
| | | | |
| 1 | Included in the related net change in unrealized appreciation/depreciation in the Statements of Operations. |
| 2 | Any difference between Net change in unrealized appreciation/depreciation and Net change in unrealized appreciation/depreciation on investments still held at March 31, 2014 is generally due to investments no longer held or categorized as level 3 at period end. |
The Fund’s investments that are categorized as Level 3 were valued utilizing third party pricing information without adjustment. Such valuations are based on unobservable inputs. A significant change in third party information could result in a significantly lower or higher value of such Level 3 investments.
See Notes to Financial Statements.
| | | | | | |
| | | BLACKROCK FUNDS | | MARCH 31, 2014 | | 19 |
| | | | |
| Schedule of Investments March 31, 2014 (Unaudited) | | | BlackRock Small Cap Growth Equity Portfolio | |
| | | (Percentages shown are based on Net Assets) | |
| | | | | | | | |
| Common Stocks | | Shares | | | Value | |
Aerospace & Defense — 1.5% | | | | | | | | |
Ducommun, Inc. (a) | | | 106,410 | | | $ | 2,666,635 | |
Esterline Technologies Corp. (a) | | | 18,081 | | | | 1,926,350 | |
Spirit AeroSystems Holdings, Inc., Class A (a) | | | 178,331 | | | | 5,027,151 | |
Taser International, Inc. (a) | | | 169,276 | | | | 3,096,058 | |
| | | | | | | | |
| | | | | | | | 12,716,194 | |
Airlines — 1.7% | | | | | | | | |
Republic Airways Holdings, Inc. (a) | | | 52,272 | | | | 477,766 | |
Spirit Airlines, Inc. (a) | | | 239,316 | | | | 14,215,370 | |
| | | | | | | | |
| | | | | | | | 14,693,136 | |
Auto Components — 2.1% | | | | | | | | |
Gentherm, Inc. (a) | | | 196,726 | | | | 6,830,327 | |
Stoneridge, Inc. (a) | | | 95,264 | | | | 1,069,815 | |
Tower International, Inc. (a) | | | 356,315 | | | | 9,698,894 | |
| | | | | | | | |
| | | | | | | | 17,599,036 | |
Banks — 0.3% | | | | | | | | |
Access National Corp. | | | 9,636 | | | | 156,200 | |
CommunityOne Bancorp (a) | | | 29,762 | | | | 333,930 | |
First Citizens BancShares, Inc., Class A | | | 2,201 | | | | 529,891 | |
Independent Bank Group, Inc. | | | 3,346 | | | | 196,577 | |
State Bank Financial Corp. | | | 18 | | | | 318 | |
Texas Capital Bancshares, Inc. (a) | | | 16,424 | | | | 1,066,575 | |
| | | | | | | | |
| | | | | | | | 2,283,491 | |
Biotechnology — 7.4% | | | | | | | | |
ACADIA Pharmaceuticals, Inc. (a) | | | 29,005 | | | | 705,692 | |
Achillion Pharmaceuticals, Inc. (a) | | | 256,337 | | | | 843,349 | |
Acorda Therapeutics, Inc. (a) | | | 18,123 | | | | 687,043 | |
Aegerion Pharmaceuticals, Inc. (a) | | | 9,370 | | | | 432,144 | |
Alnylam Pharmaceuticals, Inc. (a) | | | 40,778 | | | | 2,737,835 | |
AMAG Pharmaceuticals, Inc. (a) | | | 38,312 | | | | 741,337 | |
Ambit Biosciences Corp. (a) | | | 39,677 | | | | 361,854 | |
Arena Pharmaceuticals, Inc. (a) | | | 57,329 | | | | 361,173 | |
ArQule, Inc. (a) | | | 65,615 | | | | 134,511 | |
AVEO Pharmaceuticals, Inc. (a) | | | 56,002 | | | | 83,723 | |
BIND Therapeutics, Inc. (a) | | | 98,981 | | | | 1,183,813 | |
BioSpecifics Technologies Corp. (a)(b) | | | 78,153 | | | | 2,025,726 | |
BioTime, Inc. (a)(c) | | | 90,590 | | | | 298,041 | |
Bluebird Bio, Inc. (a) | | | 25,649 | | | | 583,258 | |
Celldex Therapeutics, Inc. (a) | | | 37,305 | | | | 659,179 | |
Cepheid, Inc. (a) | | | 49,511 | | | | 2,553,777 | |
Chimerix, Inc. (a) | | | 27,174 | | | | 620,654 | |
Clovis Oncology, Inc. (a) | | | 7,304 | | | | 505,948 | |
Cytokinetics, Inc. (a) | | | 197,194 | | | | 1,873,343 | |
Dicerna Pharmaceuticals, Inc. (a) | | | 23,896 | | | | 675,062 | |
Dyax Corp. (a) | | | 46,581 | | | | 418,297 | |
Dynavax Technologies Corp. (a) | | | 1,039,592 | | | | 1,871,266 | |
Emergent Biosolutions, Inc. (a) | | | 71,187 | | | | 1,798,895 | |
Enzon Pharmaceuticals, Inc. | | | 631,173 | | | | 650,108 | |
Exact Sciences Corp. (a) | | | 9,267 | | | | 131,313 | |
Foundation Medicine, Inc. (a)(c) | | | 28,298 | | | | 916,006 | |
GTx, Inc. (a)(c) | | | 73,283 | | | | 112,123 | |
Halozyme Therapeutics, Inc. (a) | | | 27,574 | | | | 350,190 | |
Harvard Apparatus Regenerative Technology, Inc. (a) | | | 88,148 | | | | 799,502 | |
Immunogen, Inc. (a) | | | 9,511 | | | | 141,999 | |
Intercept Pharmaceuticals, Inc. (a) | | | 4,493 | | | | 1,481,746 | |
InterMune, Inc. (a) | | | 55,736 | | | | 1,865,484 | |
Intrexon Corp. (a) | | | 71,434 | | | | 1,878,000 | |
Ironwood Pharmaceuticals, Inc. (a) | | | 36,795 | | | | 453,314 | |
Isis Pharmaceuticals, Inc. (a) | | | 94,442 | | | | 4,080,839 | |
Karyopharm Therapeutics, Inc. (a) | | | 23,861 | | | | 737,066 | |
Keryx Biopharmaceuticals, Inc. (a) | | | 38,513 | | | | 656,262 | |
Kindred Biosciences, Inc. (a) | | | 3,147 | | | | 58,314 | |
Ligand Pharmaceuticals, Inc., Class B (a) | | | 14,605 | | | | 982,332 | |
| | | | | | | | |
| Common Stocks | | Shares | | | Value | |
Biotechnology (concluded) | | | | | | | | |
Macrogenics, Inc. (a) | | | 2,332 | | | $ | 64,900 | |
Momenta Pharmaceuticals, Inc. (a) | | | 144,140 | | | | 1,679,231 | |
Myriad Genetics, Inc. (a)(c) | | | 12,940 | | | | 442,419 | |
Neurocrine Biosciences, Inc. (a) | | | 14,006 | | | | 225,497 | |
NPS Pharmaceuticals, Inc. (a) | | | 41,083 | | | | 1,229,614 | |
OncoGenex Pharmaceutical, Inc. (a) | | | 149,327 | | | | 1,756,086 | |
Ophthotech Corp. (a) | | | 37,846 | | | | 1,352,616 | |
OPKO Health, Inc. (a)(c) | | | 95,925 | | | | 894,021 | |
OvaScience, Inc. (a) | | | 8,582 | | | | 76,723 | |
PDL BioPharma, Inc. | | | 37,443 | | | | 311,151 | |
Peregrine Pharmaceuticals, Inc. (a)(c) | | | 437,447 | | | | 831,149 | |
Portola Pharmaceuticals, Inc. (a) | | | 73,828 | | | | 1,912,145 | |
Puma Biotechnology, Inc. (a) | | | 14,492 | | | | 1,509,197 | |
Receptos, Inc. (a) | | | 27,061 | | | | 1,134,938 | |
Regulus Therapeutics, Inc. (a) | | | 167,699 | | | | 1,512,645 | |
Repligen Corp. (a) | | | 146,225 | | | | 1,880,453 | |
Rigel Pharmaceuticals, Inc. (a) | | | 267,702 | | | | 1,038,684 | |
Sangamo Biosciences, Inc. (a) | | | 24,291 | | | | 439,181 | |
Stemline Therapeutics, Inc. (a) | | | 11,671 | | | | 237,622 | |
Sunesis Pharmaceuticals, Inc. (a) | | | 242,671 | | | | 1,604,055 | |
Synageva BioPharma Corp. (a) | | | 8,393 | | | | 696,367 | |
Tetralogic Pharmaceuticals Corp. (a) | | | 3,581 | | | | 22,847 | |
Tetraphase Pharmaceuticals, Inc. (a) | | | 68,214 | | | | 742,850 | |
Threshold Pharmaceuticals, Inc. (a) | | | 389,610 | | | | 1,854,544 | |
Ultragenyx Pharmaceutical, Inc. (a) | | | 32,810 | | | | 1,604,081 | |
Vanda Pharmaceuticals, Inc. (a) | | | 6,161 | | | | 100,116 | |
Verastem, Inc. (a) | | | 36,447 | | | | 393,263 | |
Xencor, Inc. (a) | | | 8,619 | | | | 101,101 | |
| | | | | | | | |
| | | | | | | | 63,098,014 | |
Building Products — 1.9% | | | | | | | | |
Griffon Corp. | | | 497 | | | | 5,934 | |
Insteel Industries, Inc. | | | 9,186 | | | | 180,689 | |
NCI Building Systems, Inc. (a) | | | 21,832 | | | | 381,187 | |
PGT, Inc. (a) | | | 1,104,701 | | | | 12,715,108 | |
Ply Gem Holdings, Inc. (a)(c) | | | 202,488 | | | | 2,557,423 | |
| | | | | | | | |
| | | | | | | | 15,840,341 | |
Capital Markets — 0.8% | | | | | | | | |
GAMCO Investors, Inc., Class A | | | 7,455 | | | | 578,881 | |
HFF, Inc., Class A | | | 160,759 | | | | 5,403,110 | |
Marcus & Millichap, Inc. (a) | | | 5,363 | | | | 95,676 | |
MCG Capital Corp. | | | 1,253 | | | | 4,749 | |
Westwood Holdings Group, Inc. | | | 13,094 | | | | 820,863 | |
| | | | | | | | |
| | | | | | | | 6,903,279 | |
Chemicals — 1.1% | | | | | | | | |
Codexis, Inc. (a) | | | 220 | | | | 449 | |
Ferro Corp. (a) | | | 70,323 | | | | 960,612 | |
FutureFuel Corp. | | | 50,795 | | | | 1,031,139 | |
KMG Chemicals, Inc. | | | 598 | | | | 9,377 | |
Landec Corp. (a) | | | 23,879 | | | | 266,490 | |
OM Group, Inc. | | | 109,566 | | | | 3,639,783 | |
OMNOVA Solutions, Inc. (a) | | | 34,664 | | | | 359,812 | |
PolyOne Corp. | | | 91,646 | | | | 3,359,742 | |
| | | | | | | | |
| | | | | | | | 9,627,404 | |
Commercial Services & Supplies — 0.6% | | | | | | | | |
Deluxe Corp. | | | 30,788 | | | | 1,615,446 | |
G&K Services, Inc., Class A | | | 13,130 | | | | 803,162 | |
Performant Financial Corp. (a) | | | 184,195 | | | | 1,666,965 | |
Steelcase, Inc., Class A | | | 10,323 | | | | 171,465 | |
Viad Corp. | | | 35,892 | | | | 862,844 | |
| | | | | | | | |
| | | | | | | | 5,119,882 | |
Communications Equipment — 3.2% | | | | | | | | |
Aruba Networks, Inc. (a)(c) | | | 449,515 | | | | 8,428,406 | |
See Notes to Financial Statements.
| | | | | | |
| 20 | | BLACKROCK FUNDS | | MARCH 31, 2014 | | |
| | | | |
| Schedule of Investments (continued) | | | BlackRock Small Cap Growth Equity Portfolio | |
| | | (Percentages shown are based on Net Assets) | |
| | | | | | | | |
| Common Stocks | | Shares | | | Value | |
Communications Equipment (concluded) | | | | | | | | |
Aviat Networks, Inc. (a) | | | 201,039 | | | $ | 319,652 | |
Calix, Inc. (a) | | | 156,835 | | | | 1,322,119 | |
Extreme Networks, Inc. (a) | | | 916,444 | | | | 5,315,375 | |
Ubiquiti Networks, Inc. (a)(c) | | | 263,131 | | | | 11,964,567 | |
| | | | | | | | |
| | | | | | | | 27,350,119 | |
Construction & Engineering — 0.1% | | | | | | | | |
Comfort Systems USA, Inc. | | | 48,357 | | | | 736,961 | |
Consumer Finance — 0.2% | | | | | | | | |
JGWPT Holdings, Inc., Class A (a) | | | 91,567 | | | | 1,672,013 | |
Containers & Packaging — 1.0% | | | | | | | | |
Berry Plastics Group, Inc. (a) | | | 26,996 | | | | 624,957 | |
Graphic Packaging Holding Co. (a) | | | 771,733 | | | | 7,840,807 | |
| | | | | | | | |
| | | | | | | | 8,465,764 | |
Distributors — 0.1% | | | | | | | | |
Core-Mark Holding Co., Inc. | | | 11,337 | | | | 823,066 | |
Diversified Consumer Services — 1.1% | | | | | | | | |
2U, Inc. (a) | | | 8,831 | | | | 120,543 | |
Capella Education Co. | | | 6,330 | | | | 399,739 | |
Collectors Universe, Inc. | | | 67,346 | | | | 1,267,452 | |
LifeLock, Inc. (a) | | | 230,021 | | | | 3,935,659 | |
National American University Holdings, Inc. | | | 9,696 | | | | 37,717 | |
Steiner Leisure Ltd. (a) | | | 75,364 | | | | 3,485,585 | |
| | | | | | | | |
| | | | | | | | 9,246,695 | |
Diversified Telecommunication Services — 2.5% | | | | | | | | |
Cbeyond, Inc. (a)(b) | | | 1,456,154 | | | | 10,557,117 | |
Inteliquent, Inc. | | | 267,507 | | | | 3,886,877 | |
Leap Wireless International, Inc. (a) | | | 11,529 | | | | 29,053 | |
Magicjack Vocaltec Ltd. (a)(c) | | | 125,430 | | | | 2,662,879 | |
Premiere Global Services, Inc. (a) | | | 166,054 | | | | 2,002,611 | |
Vonage Holdings Corp. (a) | | | 412,686 | | | | 1,762,169 | |
| | | | | | | | |
| | | | | | | | 20,900,706 | |
Electrical Equipment — 2.1% | | | | | | | | |
EnerSys, Inc. | | | 128,609 | | | | 8,911,318 | |
Franklin Electric Co., Inc. | | | 1,393 | | | | 59,230 | |
Generac Holdings, Inc. | | | 134,021 | | | | 7,903,218 | |
Lihua International, Inc. (a) | | | 121,652 | | | | 597,311 | |
| | | | | | | | |
| | | | | | | | 17,471,077 | |
Electronic Equipment, Instruments & Components — 3.0% | |
Aeroflex Holding Corp. (a) | | | 268,374 | | | | 2,230,188 | |
Benchmark Electronics, Inc. (a) | | | 3,251 | | | | 73,635 | |
Coherent, Inc. (a) | | | 14,784 | | | | 966,134 | |
Electro Scientific Industries, Inc. | | | 20,886 | | | | 205,727 | |
Fabrinet (a) | | | 144,279 | | | | 2,996,675 | |
FARO Technologies, Inc. (a) | | | 5,991 | | | | 317,523 | |
Knowles Corp. (a) | | | 130,465 | | | | 4,118,780 | |
Methode Electronics, Inc. | | | 6,111 | | | | 187,363 | |
Newport Corp. (a) | | | 303,715 | | | | 6,280,826 | |
OSI Systems, Inc. (a) | | | 13,643 | | | | 816,670 | |
RealD, Inc. (a) | | | 659,267 | | | | 7,364,012 | |
| | | | | | | | |
| | | | | | | | 25,557,533 | |
Energy Equipment & Services — 0.4% | | | | | | | | |
Hercules Offshore, Inc. (a) | | | 58,510 | | | | 268,561 | |
ION Geophysical Corp. (a) | | | 426,921 | | | | 1,797,337 | |
Matrix Service Co. (a) | | | 41,688 | | | | 1,408,221 | |
Parker Drilling Co. (a) | | | 8,292 | | | | 58,790 | |
| | | | | | | | |
| | | | | | | | 3,532,909 | |
Food & Staples Retailing — 0.3% | | | | | | | | |
The Pantry, Inc. (a) | | | 190,971 | | | | 2,929,495 | |
| | | | | | | | |
| Common Stocks | | Shares | | | Value | |
Food Products — 1.5% | | | | | | | | |
Chiquita Brands International, Inc. (a) | | | 12,378 | | | $ | 154,106 | |
Farmer Bros Co. (a) | | | 19,316 | | | | 380,525 | |
Omega Protein Corp. (a) | | | 111,816 | | | | 1,349,619 | |
Pilgrim’s Pride Corp. (a) | | | 479,149 | | | | 10,023,797 | |
Seaboard Corp. (a) | | | 402 | | | | 1,053,823 | |
| | | | | | | | |
| | | | | | | | 12,961,870 | |
Gas Utilities — 0.0% | | | | | | | | |
Southwest Gas Corp. | | | 1,181 | | | | 63,124 | |
Health Care Equipment & Supplies — 5.9% | | | | | | | | |
Align Technology, Inc. (a) | | | 397,590 | | | | 20,591,186 | |
Anika Therapeutics, Inc. (a)(c) | | | 1,688 | | | | 69,377 | |
Cardiovascular Systems, Inc. (a) | | | 5,833 | | | | 185,431 | |
Cutera, Inc. (a) | | | 59,233 | | | | 662,817 | |
Dexcom, Inc. (a) | | | 11,818 | | | | 488,792 | |
Haemonetics Corp. (a) | | | 33,081 | | | | 1,078,110 | |
ICU Medical, Inc. (a) | | | 45,096 | | | | 2,700,348 | |
Medical Action Industries, Inc. (a) | | | 163,443 | | | | 1,139,198 | |
Natus Medical, Inc. (a) | | | 19,061 | | | | 491,774 | |
RTI Surgical, Inc. (a) | | | 42,729 | | | | 174,334 | |
SurModics, Inc. (a) | | | 195,813 | | | | 4,425,374 | |
Thoratec Corp. (a) | | | 503,084 | | | | 18,015,438 | |
| | | | | | | | |
| | | | | | | | 50,022,179 | |
Health Care Providers & Services — 3.2% | | | | | | | | |
Alliance HealthCare Services, Inc. (a) | | | 11,329 | | | | 379,861 | |
AMN Healthcare Services, Inc. (a) | | | 273,535 | | | | 3,758,371 | |
BioTelemetry, Inc. (a) | | | 71,456 | | | | 720,991 | |
Corvel Corp. (a) | | | 96,096 | | | | 4,781,737 | |
Cross Country Healthcare, Inc. (a) | | | 89,779 | | | | 724,517 | |
Five Star Quality Care, Inc. (a) | | | 123,029 | | | | 597,921 | |
Hanger, Inc. (a) | | | 25,535 | | | | 860,019 | |
Team Health Holdings, Inc. (a) | | | 72,310 | | | | 3,235,873 | |
VCA Antech, Inc. (a) | | | 370,093 | | | | 11,928,097 | |
| | | | | | | | |
| | | | | | | | 26,987,387 | |
Health Care Technology — 1.0% | | | | | | | | |
MedAssets, Inc. (a) | | | 120,598 | | | | 2,979,977 | |
Merge Healthcare, Inc. (a) | | | 32,102 | | | | 78,329 | |
Omnicell, Inc. (a) | | | 196,429 | | | | 5,621,798 | |
| | | | | | | | |
| | | | | | | | 8,680,104 | |
Hotels, Restaurants & Leisure — 1.8% | | | | | | | | |
Bravo Brio Restaurant Group, Inc. (a) | | | 14 | | | | 198 | |
Caesars Acquisition Co., Class A (a) | | | 4,448 | | | | 63,206 | |
Del Frisco’s Restaurant Group, Inc. (a) | | | 11,549 | | | | 322,217 | |
Einstein Noah Restaurant Group, Inc. | | | 37,090 | | | | 610,501 | |
Jack in the Box, Inc. (a) | | | 179,411 | | | | 10,574,484 | |
Monarch Casino & Resort, Inc. (a) | | | 11,495 | | | | 213,002 | |
Popeyes Louisiana Kitchen, Inc. (a) | | | 55,670 | | | | 2,262,429 | |
Red Lion Hotels Corp. (a) | | | 48,638 | | | | 283,560 | |
Ruth’s Hospitality Group, Inc. | | | 46,606 | | | | 563,467 | |
Six Flags Entertainment Corp. | | | 19,163 | | | | 769,394 | |
Speedway Motorsports, Inc. | | | 12 | | | | 225 | |
| | | | | | | | |
| | | | | | | | 15,662,683 | |
Household Durables — 0.2% | | | | | | | | |
Cavco Industries, Inc. (a) | | | 9,015 | | | | 707,227 | |
Flexsteel Industries, Inc. | | | 1,627 | | | | 61,208 | |
Zagg, Inc. (a) | | | 157,061 | | | | 725,622 | |
| | | | | | | | |
| | | | | | | | 1,494,057 | |
Insurance — 0.7% | | | | | | | | |
Crawford & Co., Class B | | | 7,308 | | | | 79,730 | |
See Notes to Financial Statements.
| | | | | | |
| | | BLACKROCK FUNDS | | MARCH 31, 2014 | | 21 |
| | | | |
| Schedule of Investments (continued) | | | BlackRock Small Cap Growth Equity Portfolio | |
| | | (Percentages shown are based on Net Assets) | |
| | | | | | | | |
| Common Stocks | | Shares | | | Value | |
Insurance (concluded) | | | | | | | | |
Fidelity & Guaranty Life | | | 2,538 | | | $ | 59,897 | |
Fortegra Financial Corp. (a) | | | 39,559 | | | | 278,100 | |
Greenlight Capital Re Ltd., Class A (a) | | | 51,883 | | | | 1,701,762 | |
Hallmark Financial Services, Inc. (a) | | | 14,434 | | | | 119,947 | |
Third Point Reinsurance Ltd. (a) | | | 214,865 | | | | 3,405,610 | |
Universal Insurance Holdings, Inc. | | | 16,244 | | | | 206,299 | |
| | | | | | | | |
| | | | | | | | 5,851,345 | |
Internet & Catalog Retail — 0.4% | | | | | | | | |
1-800-Flowers.com, Inc., Class A (a) | | | 141,769 | | | | 798,159 | |
HSN, Inc. | | | 7,417 | | | | 443,017 | |
Orbitz Worldwide, Inc. (a) | | | 290,258 | | | | 2,275,623 | |
| | | | | | | | |
| | | | | | | | 3,516,799 | |
Internet Software & Services — 6.1% | | | | | | | | |
Blucora, Inc. (a) | | | 303,368 | | | | 5,973,316 | |
Borderfree, Inc. (a) | | | 6,382 | | | | 118,960 | |
Care.com, Inc. (a)(c) | | | 2,741 | | | | 45,364 | |
Chegg, Inc. (a)(c) | | | 38,052 | | | | 266,364 | |
Constant Contact, Inc. (a) | | | 29,294 | | | | 716,531 | |
CoStar Group, Inc. (a) | | | 11,517 | | | | 2,150,685 | |
Demandware, Inc. (a) | | | 13,649 | | | | 874,355 | |
Earthlink Holdings Corp. | | | 14,356 | | | | 51,825 | |
Global Eagle Entertainment, Inc. (a) | | | 26,525 | | | | 418,565 | |
Gogo, Inc. (a)(c) | | | 256,211 | | | | 5,262,574 | |
j2 Global, Inc. | | | 19,315 | | | | 966,716 | |
Limelight Networks, Inc. (a) | | | 226,206 | | | | 493,129 | |
LogMeIn, Inc. (a) | | | 20,765 | | | | 932,141 | |
Move, Inc. (a) | | | 151,280 | | | | 1,748,797 | |
NIC, Inc. | | | 673,599 | | | | 13,007,197 | |
Perficient, Inc. (a) | | | 71,600 | | | | 1,297,392 | |
Q2 Holdings, Inc. (a) | | | 6,382 | | | | 99,112 | |
Rocket Fuel, Inc. (a) | | | 1,843 | | | | 79,028 | |
Spark Networks, Inc. (a) | | | 148,655 | | | | 777,466 | |
Stamps.com, Inc. (a) | | | 28,738 | | | | 964,447 | |
support.com, Inc. (a) | | | 313,902 | | | | 800,450 | |
Travelzoo, Inc. (a) | | | 102,270 | | | | 2,341,983 | |
Tremor Video, Inc. (a) | | | 52,980 | | | | 218,278 | |
Web.com Group, Inc. (a) | | | 341,734 | | | | 11,629,208 | |
YuMe, Inc. (a)(c) | | | 41,731 | | | | 305,054 | |
| | | | | | | | |
| | | | | | | | 51,538,937 | |
IT Services — 2.8% | | | | | | | | |
Cardtronics, Inc. (a) | | | 120,660 | | | | 4,687,641 | |
Global Cash Access Holdings, Inc. (a) | | | 580,702 | | | | 3,983,616 | |
Planet Payment, Inc. (a) | | | 16,204 | | | | 44,399 | |
Syntel, Inc. (a) | | | 166,170 | | | | 14,938,683 | |
| | | | | | | | |
| | | | | | | | 23,654,339 | |
Leisure Products — 0.5% | | | | | | | | |
Brunswick Corp. | | | 96,485 | | | | 4,369,806 | |
Life Sciences Tools & Services — 0.4% | | | | | | | | |
Furiex Pharmaceuticals, Inc. (a) | | | 17,062 | | | | 1,484,394 | |
Harvard Bioscience, Inc. (a) | | | 214,254 | | | | 1,015,564 | |
PAREXEL International Corp. (a) | | | 10,258 | | | | 554,855 | |
| | | | | | | | |
| | | | | | | | 3,054,813 | |
Machinery — 4.3% | | | | | | | | |
Douglas Dynamics, Inc. | | | 1,737 | | | | 30,259 | |
Federal Signal Corp. (a) | | | 121,847 | | | | 1,815,520 | |
Global Brass & Copper Holdings, Inc. | | | 270,022 | | | | 4,258,247 | |
The Greenbrier Cos., Inc. (a) | | | 223,893 | | | | 10,209,521 | |
Hyster-Yale Materials Handling, Inc. | | | 45,348 | | | | 4,421,430 | |
John Bean Technologies Corp. | | | 103,208 | | | | 3,189,127 | |
Luxfer Holdings PLC — ADR | | | 628,668 | | | | 12,309,319 | |
| | | | | | | | |
| Common Stocks | | Shares | | | Value | |
Machinery (concluded) | | | | | | | | |
Xerium Technologies, Inc. (a) | | | 8,607 | | | $ | 138,142 | |
| | | | | | | | |
| | | | | | | | 36,371,565 | |
Marine — 1.1% | | | | | | | | |
Matson, Inc. | | | 370,292 | | | | 9,142,509 | |
Media — 1.1% | | | | | | | | |
Crown Media Holdings, Inc., Class A (a) | | | 185,694 | | | | 713,065 | |
CTC Media, Inc. | | | 777,684 | | | | 7,162,470 | |
ReachLocal, Inc. (a) | | | 79,215 | | | | 780,268 | |
Salem Communications Corp., Class A | | | 13,686 | | | | 136,723 | |
SFX Entertainment, Inc. (a)(c) | | | 39,968 | | | | 281,774 | |
| | | | | | | | |
| | | | | | | | 9,074,300 | |
Metals & Mining — 0.2% | | | | | | | | |
Worthington Industries, Inc. | | | 38,514 | | | | 1,473,161 | |
Multi-Utilities — 0.0% | | | | | | | | |
Avista Corp. | | | 8 | | | | 245 | |
Oil, Gas & Consumable Fuels — 4.4% | | | | | | | | |
APCO Oil and Gas International, Inc. (a) | | | 7,631 | | | | 110,268 | |
Bonanza Creek Energy, Inc. (a) | | | 167,987 | | | | 7,458,623 | |
Callon Petroleum Co. (a) | | | 50,851 | | | | 425,623 | |
Carrizo Oil & Gas, Inc. (a) | | | 33,988 | | | | 1,816,998 | |
Clayton Williams Energy, Inc. (a) | | | 4,693 | | | | 530,356 | |
Energy XXI Bermuda Ltd. | | | 7,901 | | | | 186,227 | |
EPL Oil & Gas, Inc. (a) | | | 9,411 | | | | 363,265 | |
Kodiak Oil & Gas Corp. (a) | | | 216,772 | | | | 2,631,612 | |
L&L Energy, Inc. (a)(c) | | | 130,233 | | | | 196,912 | |
LinnCo LLC | | | 63,153 | | | | 1,708,289 | |
Penn Virginia Corp. (a) | | | 100,301 | | | | 1,754,264 | |
Renewable Energy Group, Inc. (a) | | | 134,938 | | | | 1,616,557 | |
REX American Resources Corp. (a) | | | 2,550 | | | | 145,477 | |
Rosetta Resources, Inc. (a) | | | 3,719 | | | | 173,231 | |
RSP Permian, Inc. (a) | | | 68,318 | | | | 1,973,707 | |
Sanchez Energy Corp. (a) | | | 4,855 | | | | 143,854 | |
SemGroup Corp., Class A | | | 3,308 | | | | 217,269 | |
Targa Resources Corp. | | | 3,251 | | | | 322,694 | |
Vaalco Energy, Inc. (a) | | | 217,137 | | | | 1,856,521 | |
Warren Resources, Inc. (a) | | | 798,963 | | | | 3,835,022 | |
Western Refining, Inc. | | | 251,153 | | | | 9,694,506 | |
| | | | | | | | |
| | | | | | | | 37,161,275 | |
Paper & Forest Products — 2.4% | | | | | | | | |
Boise Cascade Co. (a) | | | 151,515 | | | | 4,339,390 | |
Clearwater Paper Corp. (a) | | | 1,959 | | | | 122,771 | |
KapStone Paper and Packaging Corp. (a) | | | 563,977 | | | | 16,265,097 | |
| | | | | | | | |
| | | | | | | | 20,727,258 | |
Personal Products — 0.3% | | | | | | | | |
USANA Health Sciences, Inc. (a) | | | 36,993 | | | | 2,787,053 | |
Pharmaceuticals — 2.3% | | | | | | | | |
Aerie Pharmaceuticals, Inc. (a) | | | 19,731 | | | | 418,100 | |
Alexza Pharmaceuticals, Inc. (a) | | | 1,000,249 | | | | — | |
Lannett Co., Inc. (a) | | | 194,560 | | | | 6,949,683 | |
The Medicines Co. (a) | | | 167,804 | | | | 4,768,990 | |
Nektar Therapeutics (a) | | | 91,029 | | | | 1,103,271 | |
Questcor Pharmaceuticals, Inc. | | | 43,000 | | | | 2,791,990 | |
Relypsa, Inc. (a) | | | 9,949 | | | | 296,580 | |
Revance Therapeutics, Inc. (a) | | | 35,386 | | | | 1,114,659 | |
Sciclone Pharmaceuticals, Inc. (a) | | | 502,809 | | | | 2,287,781 | |
| | | | | | | | |
| | | | | | | | 19,731,054 | |
Professional Services — 2.4% | | | | | | | | |
The Dolan Co. (a) | | | 14,888 | | | | 238 | |
See Notes to Financial Statements.
| | | | | | |
| 22 | | BLACKROCK FUNDS | | MARCH 31, 2014 | | |
| | | | |
| Schedule of Investments (continued) | | | BlackRock Small Cap Growth Equity Portfolio | |
| | | (Percentages shown are based on Net Assets) | |
| | | | | | | | |
| Common Stocks | | Shares | | | Value | |
Professional Services (concluded) | | | | | | | | |
Kforce, Inc. | | | 518,536 | | | $ | 11,055,188 | |
Mistras Group, Inc. (a) | | | 9,994 | | | | 227,563 | |
RPX Corp. (a)(c) | | | 573,842 | | | | 9,342,148 | |
| | | | | | | | |
| | | | | | | | 20,625,137 | |
Real Estate Investment Trusts (REITs) — 2.3% | | | | | | | | |
Altisource Residential Corp. | | | 3 | | | | 95 | |
Aviv REIT, Inc. | | | 13,664 | | | | 334,085 | |
Cedar Realty Trust, Inc. | | | 94 | | | | 574 | |
DuPont Fabros Technology, Inc. (c) | | | 253,452 | | | | 6,100,590 | |
The GEO Group, Inc. | | | 32,299 | | | | 1,041,320 | |
Investors Real Estate Trust | | | 22,709 | | | | 203,927 | |
MFA Financial, Inc. | | | 64,568 | | | | 500,402 | |
PS Business Parks, Inc. | | | 100,317 | | | | 8,388,508 | |
Sabra Health Care REIT, Inc. | | | 81,572 | | | | 2,275,043 | |
Sovran Self Storage, Inc. | | | 13,972 | | | | 1,026,243 | |
| | | | | | | | |
| | | | | | | | 19,870,787 | |
Real Estate Management & Development — 0.5% | | | | | | | | |
AV Homes, Inc. (a) | | | 7 | | | | 127 | |
Forestar Group, Inc. (a) | | | 182,418 | | | | 3,247,040 | |
Tejon Ranch Co. (a) | | | 22,543 | | | | 762,630 | |
| | | | | | | | |
| | | | | | | | 4,009,797 | |
Road & Rail — 0.4% | | | | | | | | |
Ryder System, Inc. | | | 6,603 | | | | 527,712 | |
Swift Transportation Co. (a) | | | 106,788 | | | | 2,643,003 | |
Universal Truckload Services, Inc. | | | 1,394 | | | | 40,287 | |
| | | | | | | | |
| | | | | | | | 3,211,002 | |
Semiconductors & Semiconductor Equipment — 5.5% | |
Advanced Energy Industries, Inc. (a) | | | 286,420 | | | | 7,017,290 | |
Alpha & Omega Semiconductor Ltd. (a) | | | 62,511 | | | | 460,081 | |
Entegris, Inc. (a) | | | 22,415 | | | | 271,446 | |
Inphi Corp. (a) | | | 170,282 | | | | 2,739,837 | |
Intermolecular, Inc. (a) | | | 280,962 | | | | 786,694 | |
Lattice Semiconductor Corp. (a) | | | 29,189 | | | | 228,842 | |
Microsemi Corp. (a) | | | 513,969 | | | | 12,864,644 | |
Pericom Semiconductor Corp. (a) | | | 44,136 | | | | 345,585 | |
Silicon Image, Inc. (a) | | | 665,251 | | | | 4,590,232 | |
Synaptics, Inc. (a)(c) | | | 291,356 | | | | 17,487,187 | |
Tessera Technologies, Inc. | | | 150 | | | | 3,545 | |
| | | | | | | | |
| | | | | | | | 46,795,383 | |
Software — 8.5% | | | | | | | | |
Aspen Technology, Inc. (a) | | | 459,015 | | | | 19,443,875 | |
AVG Technologies NV (a) | | | 314,044 | | | | 6,582,362 | |
Ebix, Inc. (c) | | | 22,182 | | | | 378,647 | |
Interactive Intelligence Group, Inc. (a) | | | 1,753 | | | | 127,093 | |
Manhattan Associates, Inc. (a) | | | 534,781 | | | | 18,733,378 | |
Progress Software Corp. (a) | | | 439,121 | | | | 9,572,838 | |
PROS Holdings, Inc. (a) | | | 426,297 | | | | 13,432,618 | |
PTC, Inc. (a) | | | 46,133 | | | | 1,634,492 | |
QAD, Inc., Class A | | | 28,477 | | | | 581,785 | |
Rosetta Stone, Inc. (a) | | | 97,813 | | | | 1,097,462 | |
Viggle, Inc. (a) | | | 16,470 | | | | 173,347 | |
| | | | | | | | |
| | | | | | | | 71,757,897 | |
Specialty Retail — 2.2% | | | | | | | | |
ANN, Inc. (a) | | | 12,173 | | | | 504,936 | |
Big 5 Sporting Goods Corp. | | | 290,116 | | | | 4,656,362 | |
Brown Shoe Co., Inc. | | | 34,516 | | | | 916,055 | |
The Container Store Group, Inc. (a)(c) | | | 81,687 | | | | 2,773,274 | |
Haverty Furniture Cos., Inc. | | | 89,400 | | | | 2,655,180 | |
Kirkland’s, Inc. (a) | | | 59,545 | | | | 1,100,987 | |
Murphy USA, Inc. (a) | | | 18,650 | | | | 757,003 | |
| | | | | | | | |
| Common Stocks | | Shares | | | Value | |
Specialty Retail (concluded) | | | | | | | | |
Sears Hometown and Outlet Stores, Inc. (a) | | | 192,860 | | | $ | 4,561,139 | |
Systemax, Inc. (a) | | | 16 | | | | 239 | |
The Wet Seal, Inc., Class A (a) | | | 646,976 | | | | 854,008 | |
| | | | | | | | |
| | | | | | | | 18,779,183 | |
Technology Hardware, Storage & Peripherals — 0.3% | |
Dot Hill Systems Corp. (a) | | | 43,476 | | | | 168,252 | |
Immersion Corp. (a) | | | 175,271 | | | | 1,849,109 | |
Quantum Corp. (a) | | | 277,474 | | | | 338,518 | |
| | | | | | | | |
| | | | | | | | 2,355,879 | |
Textiles, Apparel & Luxury Goods — 1.2% | | | | | | | | |
Cherokee, Inc. | | | 425 | | | | 5,920 | |
Deckers Outdoor Corp. (a) | | | 1,628 | | | | 129,800 | |
Movado Group, Inc. | | | 211,707 | | | | 9,643,254 | |
Vince Holding Corp. (a) | | | 21,991 | | | | 579,683 | |
| | | | | | | | |
| | | | | | | | 10,358,657 | |
Thrifts & Mortgage Finance — 1.0% | | | | | | | | |
EverBank Financial Corp. | | | 181,357 | | | | 3,578,174 | |
Heritage Financial Group, Inc. | | | 11,636 | | | | 228,647 | |
HomeStreet, Inc. | | | 193,847 | | | | 3,789,709 | |
MGIC Investment Corp. (a) | | | 76,058 | | | | 648,014 | |
Provident Financial Holdings, Inc. | | | 9,110 | | | | 140,476 | |
| | | | | | | | |
| | | | | | | | 8,385,020 | |
Trading Companies & Distributors — 0.6% | | | | | | | | |
Aceto Corp. | | | 8,272 | | | | 166,184 | |
H&E Equipment Services, Inc. (a) | | | 3,448 | | | | 139,472 | |
Stock Building Supply Holdings, Inc. (a) | | | 10,569 | | | | 214,762 | |
Watsco, Inc. | | | 48,012 | | | | 4,796,879 | |
Willis Lease Finance Corp. (a) | | | 9,853 | | | | 201,691 | |
| | | | | | | | |
| | | | | | | | 5,518,988 | |
Water Utilities — 0.6% | | | | | | | | |
American States Water Co. | | | 146,938 | | | | 4,744,628 | |
Total Common Stocks — 97.5% | | | | | | | 827,305,336 | |
| | | | | | | | |
| Preferred Stocks | | | | | | |
Software — 0.5% | | | | | | | | |
MongoDB Series C (Acquired 12/19/13,
cost $1,517,990) (a)(d) | | | 60,511 | | | | 1,518,221 | |
MongoDB Series D (Acquired 12/19/13,
cost $472,222) (a)(d) | | | 18,824 | | | | 472,294 | |
MongoDB Series E (Acquired 12/19/13,
cost $16,682) (a)(d) | | | 665 | | | | 16,685 | |
Palantir Technologies, Inc. (Acquired 2/06/14,
cost $1,999,998) (d) | | | 326,264 | | | | 1,999,998 | |
Total Preferred Stocks — 0.5% | | | | 4,007,198 | |
| | | | | | | | |
| Warrants (e) | | | | | | |
Real Estate Management & Development — 0.0% | | | | | | | | |
Tejon Ranch Co. (Issued/Exercisable 8/08/13, 1 Share for 1 Warrant, Expires 8/31/16,
Strike Price USD 40.00)(c) | | | 3,330 | | | | 12,155 | |
Total Long-Term Investments (Cost — $711,417,825) — 98.0% | | | | 831,324,689 | |
| | | | | | | | |
| | | | | | | |
See Notes to Financial Statements.
| | | | | | |
| | | BLACKROCK FUNDS | | MARCH 31, 2014 | | 23 |
| | | | |
| Schedule of Investments (continued) | | | BlackRock Small Cap Growth Equity Portfolio | |
| | | (Percentages shown are based on Net Assets) | |
| | | | | | | | |
| Short-Term Securities | | Shares | | | Value | |
BlackRock Liquidity Funds, TempFund, Institutional Class, 0.03% (f)(g) | | | 15,937,807 | | | $ | 15,937,807 | |
| | |
| Short-Term Securities | | Beneficial
Interest (000) | | | | |
BlackRock Liquidity Series, LLC, Money Market Series, 0.16% (f)(g)(h) | | $ | 52,750 | | | | 52,750,304 | |
Total Short-Term Securities (Cost — $68,688,111) — 8.1% | | | | | | | 68,688,111 | |
| | | | | | |
| | | | | Value | |
Total Investments (Cost — $780,105,936) — 106.1% | | $ | 900,012,800 | |
Liabilities in Excess of Other Assets — (6.1)% | | | (51,825,354 | ) |
| | | | | | |
Net Assets — 100.0% | | $ | 848,187,446 | |
| | | | | | |
|
| Notes to Schedule of Investments |
| (a) | Non-income producing security. |
| (b) | Investments in issuers (whereby the Fund held 5% or more of the companies’ outstanding securities) that were considered to be an affiliate during the six months ended March 31, 2014, for purposes of Section 2(a)(3) of the Investment Company Act of 1940, as amended, were as follows: |
| | | | | | | | | | | | | | | | | | | | |
| Affiliate | | Shares Held at
September 30, 2013 | | | Shares Sold | | | Shares Held at
March 31, 2014 | | | Value at
March 31, 2014 | | | Realized Gain (Loss) | |
BioSpecifics Technologies Corp.1 | | | 339,291 | | | | (261,138 | ) | | | 78,153 | | | $ | 2,025,726 | | | $ | 773,917 | |
Cbeyond, Inc.1 | | | 2,230,851 | | | | (774,697 | ) | | | 1,456,154 | | | $ | 10,557,117 | | | $ | (4,039,248 | ) |
Gentium SpA — ADR1 | | | 1,267,927 | | | | (1,267,927 | ) | | | — | | | | — | | | $ | 47,756,522 | |
| | 1 | No longer an affiliated company or held by the Fund as of report date. |
| (c) | Security, or a portion of security, is on loan. |
| (d) | Restricted securities as to resale. As of report date, the Fund held restricted securities with a current value of $4,007,198 and an original cost of $4,006,892 which was 0.5% of its net assets. |
| (e) | Warrants entitle the Fund to purchase a predetermined number of shares of common stock and are non-income producing. The purchase price and number of shares are subject to adjustment under certain conditions until the expiration date of the warrants, if any. |
| (f) | Investments in issuers considered to be an affiliate of the Fund during the six months ended March 31, 2014, for purposes of Section 2(a)(3) of the Investment Company Act of 1940, as amended, were as follows: |
| | | | | | | | | | | | | | | | |
| Affiliate | | Shares/Beneficial
Interest Held at
September 30, 2013 | | | Net Activity | | | Shares/Beneficial
Interest Held at
March 31, 2014 | | | Income | |
BlackRock Liquidity Funds, TempFund, Institutional Class | | | 23,218,232 | | | | (7,280,425 | ) | | | 15,937,807 | | | $ | 2,611 | |
BlackRock Liquidity Series, LLC, Money Market Series | | $ | 122,835,897 | | | $ | (70,085,593 | ) | | $ | 52,750,304 | | | $ | 489,479 | |
| (g) | Represents the current yield as of report date. |
| (h) | Security was purchased with the cash collateral from loaned securities. The Fund may withdraw up to 25% of its investment daily, although the manager of the BlackRock Liquidity Series, LLC, Money Market Series, in its sole discretion, may permit an investor to withdraw more than 25% on any one day. |
| Ÿ | | For Fund compliance purposes, the Fund’s industry classifications refer to any one or more of the industry sub-classifications used by one or more widely recognized market indexes or ratings group indexes, and/or as defined by the investment advisor. These definitions may not apply for purposes of this report, which may combine such industry sub-classifications for reporting ease. |
| Ÿ | | Financial futures contracts outstanding as of March 31, 2014 were as follows: |
| | | | | | | | | | | | | | | | | | | | |
Contracts
Purchased | | | Issue | | Exchange | | Expiration | | | | | Notional
Value | | | Unrealized
Depreciation | |
| | 159 | | | E-Mini Russell 2000 Futures | | Intercontinental Exchange | | June 2014 | | | USD | | | | 18,610,950 | | | $ | (158,560 | ) |
| Ÿ | | Fair Value Measurements — Various inputs are used in determining the fair value of investments and derivative financial instruments. These inputs to valuation techniques are categorized into a disclosure hierarchy consisting of three broad levels for financial statement purposes as follows: |
| | Ÿ | | Level 1 — unadjusted price quotations in active markets/exchanges for identical assets or liabilities that the Fund has the ability to access |
| | Ÿ | | Level 2 — other observable inputs (including, but not limited to, quoted prices for similar assets or liabilities in markets that are active, quoted prices for identical or similar assets or liabilities in markets that are not active, inputs other than quoted prices that are observable for the assets or liabilities (such as interest rates, yield curves, volatilities, prepayment speeds, loss severities, credit risks and default rates) or other market–corroborated inputs) |
| | Ÿ | | Level 3 — unobservable inputs based on the best information available in the circumstances, to the extent observable inputs are not available (including the Fund’s own assumptions used in determining the fair value of investments and derivative financial instruments) |
The hierarchy gives the highest priority to unadjusted quoted prices in active markets for identical assets or liabilities (Level 1 measurements) and the lowest priority to unobservable inputs (Level 3 measurements). Accordingly, the degree of judgment exercised in determining fair value is greatest for instruments categorized in Level 3. The inputs used to measure fair value may fall into different levels of the fair value hierarchy. In such cases, for disclosure purposes, the fair value hierarchy classification is determined based on the lowest level input that is significant to the fair value measurement in its entirety.
See Notes to Financial Statements.
| | | | | | |
| 24 | | BLACKROCK FUNDS | | MARCH 31, 2014 | | |
| | | | |
| Schedule of Investments (continued) | | | BlackRock Small Cap Growth Equity Portfolio | |
Changes in valuation techniques may result in transfers into or out of an assigned level within the disclosure hierarchy. In accordance with the Fund’s policy, transfers between different levels of the fair value disclosure hierarchy are deemed to have occurred as of the beginning of the reporting period. The categorization of a value determined for investments and derivative financial instruments is based on the pricing transparency of the investment and derivative financial instruments and is not necessarily an indication of the risks associated with investing in those securities. For information about the Fund’s policy regarding valuation of investments and derivative financial instruments, please refer to Note 2 of the Notes to Financial Statements.
The following tables summarize the Fund’s investments and derivative financial instruments categorized in the disclosure hierarchy as of March 31, 2014:
| | | | | | | | | | | | | | | | |
| | | Level 1 | | | Level 2 | | | Level 3 | | | Total | |
Assets: | | | | | | | | | | | | | | | | |
Investments: | | | | | | | | | | | | | | | | |
Long-Term Investments: | | | | | | | | | | | | | | | | |
Common Stocks: | | | | | | | | | | | | | | | | |
Aerospace & Defense | | $ | 12,716,194 | | | | — | | | | — | | | $ | 12,716,194 | |
Airlines | | | 14,693,136 | | | | — | | | | — | | | | 14,693,136 | |
Auto Components | | | 17,599,036 | | | | — | | | | — | | | | 17,599,036 | |
Banks | | | 2,283,491 | | | | — | | | | — | | | | 2,283,491 | |
Biotechnology | | | 63,098,014 | | | | — | | | | — | | | | 63,098,014 | |
Building Products | | | 15,840,341 | | | | — | | | | — | | | | 15,840,341 | |
Capital Markets | | | 6,903,279 | | | | — | | | | — | | | | 6,903,279 | |
Chemicals | | | 9,627,404 | | | | — | | | | — | | | | 9,627,404 | |
Commercial Services & Supplies | | | 5,119,882 | | | | — | | | | — | | | | 5,119,882 | |
Communications Equipment | | | 27,350,119 | | | | — | | | | — | | | | 27,350,119 | |
Construction & Engineering | | | 736,961 | | | | — | | | | — | | | | 736,961 | |
Consumer Finance | | | 1,672,013 | | | | — | | | | — | | | | 1,672,013 | |
Containers & Packaging | | | 8,465,764 | | | | — | | | | — | | | | 8,465,764 | |
Distributors | | | 823,066 | | | | — | | | | — | | | | 823,066 | |
Diversified Consumer Services | | | 9,246,695 | | | | — | | | | — | | | | 9,246,695 | |
Diversified Telecommunication Services | | | 20,900,706 | | | | — | | | | — | | | | 20,900,706 | |
Electrical Equipment | | | 17,471,077 | | | | — | | | | — | | | | 17,471,077 | |
Electronic Equipment, Instruments & Components | | | 25,557,533 | | | | — | | | | — | | | | 25,557,533 | |
Energy Equipment & Services | | | 3,532,909 | | | | — | | | | — | | | | 3,532,909 | |
Food & Staples Retailing | | | 2,929,495 | | | | — | | | | — | | | | 2,929,495 | |
Food Products | | | 12,961,870 | | | | — | | | | — | | | | 12,961,870 | |
Gas Utilities | | | 63,124 | | | | — | | | | — | | | | 63,124 | |
Health Care Equipment & Supplies | | | 50,022,179 | | | | — | | | | — | | | | 50,022,179 | |
Health Care Providers & Services | | | 26,987,387 | | | | — | | | | — | | | | 26,987,387 | |
Health Care Technology | | | 8,680,104 | | | | — | | | | — | | | | 8,680,104 | |
Hotels, Restaurants & Leisure | | | 15,662,683 | | | | — | | | | — | | | | 15,662,683 | |
Household Durables | | | 1,494,057 | | | | — | | | | — | | | | 1,494,057 | |
Insurance | | | 5,851,345 | | | | — | | | | — | | | | 5,851,345 | |
Internet & Catalog Retail | | | 3,516,799 | | | | — | | | | — | | | | 3,516,799 | |
Internet Software & Services | | | 51,538,937 | | | | — | | | | — | | | | 51,538,937 | |
IT Services | | | 23,654,339 | | | | — | | | | — | | | | 23,654,339 | |
Leisure Products | | | 4,369,806 | | | | — | | | | — | | | | 4,369,806 | |
Life Sciences Tools & Services | | | 3,054,813 | | | | — | | | | — | | | | 3,054,813 | |
Machinery | | | 36,371,565 | | | | — | | | | — | | | | 36,371,565 | |
Marine | | | 9,142,509 | | | | — | | | | — | | | | 9,142,509 | |
Media | | | 9,074,300 | | | | — | | | | — | | | | 9,074,300 | |
Metals & Mining | | | 1,473,161 | | | | — | | | | — | | | | 1,473,161 | |
Multi-Utilities | | | 245 | | | | — | | | | — | | | | 245 | |
Oil, Gas & Consumable Fuels | | | 36,964,363 | | | | — | | | $ | 196,912 | | | | 37,161,275 | |
Paper & Forest Products | | | 20,727,258 | | | | — | | | | — | | | | 20,727,258 | |
Personal Products | | | 2,787,053 | | | | — | | | | — | | | | 2,787,053 | |
Pharmaceuticals | | | 19,731,054 | | | | — | | | | — | | | | 19,731,054 | |
Professional Services | | | 20,625,137 | | | | — | | | | — | | | | 20,625,137 | |
Real Estate Investment Trusts (REITs) | | | 19,870,787 | | | | — | | | | — | | | | 19,870,787 | |
Real Estate Management & Development | | | 4,009,797 | | | | — | | | | — | | | | 4,009,797 | |
Road & Rail | | | 3,211,002 | | | | — | | | | — | | | | 3,211,002 | |
Semiconductors & Semiconductor Equipment | | | 46,795,383 | | | | — | | | | — | | | | 46,795,383 | |
Software | | | 71,584,550 | | | | — | | | | 173,347 | | | | 71,757,897 | |
Specialty Retail | | | 18,779,183 | | | | — | | | | — | | | | 18,779,183 | |
Technology Hardware, Storage & Peripherals | | | 2,355,879 | | | | — | | | | — | | | | 2,355,879 | |
See Notes to Financial Statements.
| | | | | | |
| | | BLACKROCK FUNDS | | MARCH 31, 2014 | | 25 |
| | | | |
| Schedule of Investments (concluded) | | | BlackRock Small Cap Growth Equity Portfolio | |
| | | | | | | | | | | | | | | | |
| | | Level 1 | | | Level 2 | | | Level 3 | | | Total | |
Textiles, Apparel & Luxury Goods | | $ | 10,358,657 | | | | — | | | | — | | | $ | 10,358,657 | |
Thrifts & Mortgage Finance | | | 8,385,020 | | | | — | | | | — | | | | 8,385,020 | |
Trading Companies & Distributors | | | 5,518,988 | | | | — | | | | — | | | | 5,518,988 | |
Water Utilities | | | 4,744,628 | | | | — | | | | — | | | | 4,744,628 | |
Preferred Stocks | | | — | | | | — | | | $ | 4,007,198 | | | | 4,007,198 | |
Warrants | | | 12,155 | | | | — | | | | — | | | | 12,155 | |
Short-Term Securities | | | 15,937,807 | | | $ | 52,750,304 | | | | — | | | | 68,688,111 | |
Total | | $ | 842,885,039 | | | $ | 52,750,304 | | | $ | 4,377,457 | | | $ | 900,012,800 | |
| | | | |
| | | | | | | | | | | | | | | | |
| | | Level 1 | | | Level 2 | | | Level 3 | | | Total | |
Derivative Financial Instruments1 | | | | | | | | | | | | | | | | |
Liabilities: | | | | | | | | | | | | | | | | |
Equity contracts | | $ | (158,560 | ) | | | — | | | | — | | | $ | (158,560 | ) |
|
1 Derivative financial instruments are financial futures contracts which are valued at the unrealized appreciation/depreciation on the instrument. | |
|
| The carrying amount for certain of the Fund’s assets and/or liabilities approximates fair value for financial statement purposes. As of March 31, 2014, such assets and/or liabilities are categorized within the disclosure hierarchy as follows: | |
| | | | | | | | | | | | | | | | |
| | | Level 1 | | | Level 2 | | | Level 3 | | | Total | |
Assets: | | | | | | | | | | | | | | | | |
Cash pledged for financial futures contracts | | $ | 837,280 | | | | — | | | | — | | | $ | 837,280 | |
Liabilities: | | | | | | | | | | | | | | | | |
Bank overdraft | | | — | | | $ | (2,613 | ) | | | — | | | | (2,613 | ) |
Collateral on securities loaned at value | | | — | | | | (52,750,304 | ) | | | — | | | | (52,750,304 | ) |
Total | | $ | 837,280 | | | $ | (52,752,917 | ) | | | — | | | $ | (51,915,637 | ) |
| | | | |
There were no transfers between levels during the six months ended March 31, 2014.
See Notes to Financial Statements.
| | | | | | |
| 26 | | BLACKROCK FUNDS | | MARCH 31, 2014 | | |
| | |
| Statements of Assets and Liabilities | | |
| | | | | | | | | | | | |
| March 31, 2014 (Unaudited) | | BlackRock
Flexible Equity Fund1 | | | BlackRock Mid-Cap
Growth Equity
Portfolio | | | BlackRock
Small Cap
Growth Equity
Portfolio | |
| | | | | | | | | | | | |
| Assets | | | | | | | | | | | | |
Investments at value — unaffiliated2,3 | | $ | 575,231,920 | | | $ | 401,077,337 | | | $ | 831,324,689 | |
Investments at value — affiliated4 | | | 60,653,495 | | | | 12,550,311 | | | | 68,688,111 | |
Cash pledged for financial futures contracts | | | 2,105,000 | | | | — | | | | 837,280 | |
Foreign currency at value5 | | | 3,329,352 | | | | 53,815 | | | | — | |
Variation margin receivable on financial futures contracts | | | 1,819 | | | | — | | | | 374,510 | |
Investments sold receivable | | | 16,267,698 | | | | 1,625,445 | | | | 10,543,168 | |
Unrealized appreciation on forward foreign currency exchange contracts | | | 362,229 | | | | — | | | | — | |
Unrealized appreciation on OTC swaps | | | 1,106,610 | | | | — | | | | — | |
Capital shares sold receivable | | | 256,160 | | | | 590,677 | | | | 1,010,956 | |
Dividends receivable — unaffiliated | | | 1,706,057 | | | | 119,459 | | | | 56,866 | |
Dividends receivable — affiliated | | | 1,252 | | | | 107 | | | | 371 | |
Receivable from Manager | | | 39,611 | | | | 24,298 | | | | — | |
Securities lending income receivable — affiliated | | | — | | | | 10,138 | | | | 80,701 | |
Prepaid expenses | | | 50,060 | | | | 47,563 | | | | 56,973 | |
| | | | |
Total assets | | | 661,111,263 | | | | 416,099,150 | | | | 912,973,625 | |
| | | | |
| | | | | | | | | | | | |
| Liabilities | | | | | | | | | | | | |
Bank overdraft | | | — | | | | — | | | | 2,613 | |
Options written at value6 | | | 380,361 | | | | — | | | | — | |
Cash received as collateral for OTC derivatives | | | 900,000 | | | | — | | | | — | |
Collateral on securities loaned at value | | | — | | | | 10,457,192 | | | | 52,750,304 | |
Variation margin payable on financial futures contracts | | | 981,250 | | | | — | | | | — | |
Investments purchased payable | | | 28 | | | | 3,179,653 | | | | 9,069,242 | |
Unrealized depreciation on forward foreign currency exchange contracts | | | 1,102,593 | | | | — | | | | — | |
Capital shares redeemed payable | | | 1,507,027 | | | | 504,291 | | | | 1,627,877 | |
Investment advisory fees payable | | | 444,477 | | | | 286,428 | | | | 408,706 | |
Service and distribution fees payable | | | 198,970 | | | | 103,419 | | | | 110,208 | |
Officer’s and Trustees’ fees payable | | | 5,658 | | | | 2,335 | | | | 11,457 | |
Other affiliates payable | | | 2,273 | | | | — | | | | 95,200 | |
Other accrued expenses payable | | | 529,817 | | | | 276,899 | | | | 710,572 | |
| | | | |
Total Liabilities | | | 6,052,454 | | | | 14,810,217 | | | | 64,786,179 | |
| | | | |
Net Assets | | $ | 655,058,809 | | | $ | 401,288,933 | | | $ | 848,187,446 | |
| | | | |
| | | | | | | | | | | | |
| Net Assets Consist of | | | | | | | | | | | | |
Paid-in capital | | $ | 563,600,586 | | | $ | 296,952,600 | | | $ | 588,580,367 | |
Undistributed (accumulated) net investment income (loss) | | | 12,044,632 | | | | (2,274,893 | ) | | | (4,851,087 | ) |
Accumulated net realized gain | | | 3,682,944 | | | | 25,869,252 | | | | 144,709,862 | |
Net unrealized appreciation/depreciation | | | 75,730,647 | | | | 80,741,974 | | | | 119,748,304 | |
| | | | |
Net Assets | | $ | 655,058,809 | | | $ | 401,288,933 | | | $ | 848,187,446 | |
| | | | |
1 Consolidated Statement of Assets and Liabilities. | | | | | | | | | | | | |
2 Investments at cost — unaffiliated | | $ | 500,724,137 | | | $ | 320,335,364 | | | $ | 711,417,825 | |
3 Securities loaned at value | | | — | | | $ | 10,261,642 | | | $ | 52,611,050 | |
4 Investments at cost — affiliated | | $ | 60,402,156 | | | $ | 12,550,311 | | | $ | 68,688,111 | |
5 Foreign currency at cost | | $ | 3,315,012 | | | $ | 53,814 | | | | — | |
6 Premiums received | | $ | 438,165 | | | | — | | | | — | |
See Notes to Financial Statements.
| | | | | | |
| | | BLACKROCK FUNDS | | MARCH 31, 2014 | | 27 |
| | |
| Statements of Assets and Liabilities (concluded) | | |
| | | | | | | | | | | | |
| March 31, 2014 (Unaudited) | | BlackRock
Flexible
Equity
Fund1 | | | BlackRock Mid-Cap
Growth Equity
Portfolio | | | BlackRock
Small Cap Growth Equity
Portfolio | |
| | | | | | | | | | | | |
| Net Asset Value | | | | | | | | | | | | |
Institutional | | | | | | | | | | | | |
Net assets | | $ | 55,716,700 | | | $ | 34,035,790 | | | $ | 451,264,502 | |
| | | | |
Shares outstanding2 | | | 3,793,937 | | | | 1,966,168 | | | | 19,561,420 | |
| | | | |
Net asset value | | $ | 14.69 | | | $ | 17.31 | | | $ | 23.07 | |
| | | | |
Service | | | | | | | | | | | | |
Net assets | | $ | 301,365 | | | $ | 2,242,370 | | | $ | 26,004,703 | |
| | | | |
Shares outstanding2 | | | 20,806 | | | | 139,703 | | | | 1,250,597 | |
| | | | |
Net asset value | | $ | 14.48 | | | $ | 16.05 | | | $ | 20.79 | |
| | | | |
Investor A | | | | | | | | | | | | |
Net assets | | $ | 488,085,929 | | | $ | 322,288,440 | | | $ | 333,802,207 | |
| | | | |
Shares outstanding2 | | | 34,282,353 | | | | 20,820,321 | | | | 17,020,224 | |
| | | | |
Net asset value | | $ | 14.24 | | | $ | 15.48 | | | $ | 19.61 | |
| | | | |
Investor B | | | | | | | | | | | | |
Net assets | | $ | 9,520,938 | | | $ | 3,994,432 | | | $ | 1,069,503 | |
| | | | |
Shares outstanding2 | | | 738,115 | | | | 306,837 | | | | 72,589 | |
| | | | |
Net asset value | | $ | 12.90 | | | $ | 13.02 | | | $ | 14.73 | |
| | | | |
Investor C | | | | | | | | | | | | |
Net assets | | $ | 100,269,175 | | | $ | 31,005,469 | | | $ | 36,046,531 | |
| | | | |
Shares outstanding2 | | | 7,829,917 | | | | 2,391,548 | | | | 2,473,979 | |
| | | | |
Net asset value | | $ | 12.81 | | | $ | 12.96 | | | $ | 14.57 | |
| | | | |
Class R | | | | | | | | | | | | |
Net assets | | $ | 1,164,702 | | | $ | 7,722,432 | | | | — | |
| | | | |
Shares outstanding2 | | | 79,590 | | | | 502,954 | | | | — | |
| | | | |
Net asset value | | $ | 14.63 | | | $ | 15.35 | | | | — | |
| | | | |
| | 1 | Consolidated Statement of Assets and Liabilities. |
| | 2 | Unlimited number of shares authorized, $0.001 par value. |
See Notes to Financial Statements.
| | | | | | |
| 28 | | BLACKROCK FUNDS | | MARCH 31, 2014 | | |
| | | | | | | | | | | | |
| Six Months Ended March 31, 2014 (Unaudited) | | BlackRock
Flexible Equity Fund1 | | | BlackRock
Mid-Cap
Growth Equity
Portfolio | | | BlackRock
Small Cap
Growth Equity
Portfolio | |
| | | | | | | | | | | | |
| Investment Income | | | | | | | | | | | | |
Dividends — unaffiliated | | $ | 15,310,080 | | | $ | 386,982 | | | $ | 2,425,784 | |
Dividends — affiliated | | | 6,548 | | | | 382 | | | | 2,611 | |
Securities lending — affiliated — net | | | 814 | | | | 47,212 | | | | 489,479 | |
Other income — affiliated | | | 9,080 | | | | 18,726 | | | | 172,901 | |
Foreign taxes withheld | | | (196,066 | ) | | | (23,890 | ) | | | — | |
| | | | |
Total income | | | 15,130,456 | | | | 429,412 | | | | 3,090,775 | |
| | | | |
| | | | | | | | | | | | |
| Expenses | | | | | | | | | | | | |
Investment advisory | | | 2,748,472 | | | | 1,498,086 | | | | 2,870,062 | |
Service and distribution — class specific | | | 1,208,103 | | | | 566,468 | | | | 640,672 | |
Transfer agent — class specific | | | 741,253 | | | | 464,559 | | | | 1,138,268 | |
Administration | | | 248,245 | | | | 140,446 | | | | 362,088 | |
Administration — class specific | | | 85,383 | | | | 46,762 | | | | 123,761 | |
Professional | | | 37,933 | | | | 32,289 | | | | 44,105 | |
Registration | | | 42,071 | | | | 38,503 | | | | 37,131 | |
Custodian | | | 35,491 | | | | 10,865 | | | | 73,580 | |
Printing | | | 19,710 | | | | 7,526 | | | | 30,798 | |
Officer and Trustees | | | 11,672 | | | | 6,380 | | | | 19,488 | |
Miscellaneous | | | 19,614 | | | | 13,264 | | | | 24,259 | |
Recoupment of past waived fees — class specific | | | — | | | | 10,242 | | | | 15,195 | |
| | | | |
Total expenses | | | 5,197,947 | | | | 2,835,390 | | | | 5,379,407 | |
Less fees waived by Manager | | | (11,961 | ) | | | (827 | ) | | | (4,608 | ) |
Less administration fees waived — class specific | | | (85,308 | ) | | | (39,872 | ) | | | — | |
Less transfer agent fees waived — class specific | | | (50,276 | ) | | | (62,839 | ) | | | — | |
Less transfer agent fees reimbursed — class specific | | | (280,748 | ) | | | (27,544 | ) | | | — | |
| | | | |
Total expenses after fees waived and reimbursed | | | 4,769,654 | | | | 2,704,308 | | | | 5,374,799 | |
| | | | |
Net investment income (loss) | | | 10,360,802 | | | | (2,274,896 | ) | | | (2,284,024 | ) |
| | | | |
| | | | | | | | | | | | |
| Realized and Unrealized Gain (Loss) | | | | | | | | | | | | |
Net realized gain (loss) from: | | | | | | | | | | | | |
Investments — unaffiliated | | | 69,720,568 | | | | 30,345,904 | | | | 145,601,406 | |
Investments — affiliated | | | (1,777,073 | ) | | | — | | | | 44,491,191 | |
Options written | | | 729,887 | | | | — | | | | — | |
Financial futures contracts | | | (3,660,129 | ) | | | — | | | | 2,052,048 | |
Swaps | | | (2,000,601 | ) | | | — | | | | — | |
Foreign currency transactions | | | 1,383,701 | | | | (9,025 | ) | | | — | |
| | | | |
| | | 64,396,353 | | | | 30,336,879 | | | | 192,144,645 | |
| | | | |
Net change in unrealized appreciation/depreciation on: | | | | | | | | | | | | |
Investments — unaffiliated | | | (38,824,543 | ) | | | 12,781,817 | | | | (24,346,944 | ) |
Investments — affiliated | | | 333,715 | | | | — | | | | (22,014,193 | ) |
Options written | | | 149,769 | | | | — | | | | — | |
Financial futures contracts | | | 713,708 | | | | — | | | | (321,252 | ) |
Swaps | | | 1,768,225 | | | | — | | | | — | |
Foreign currency translations | | | 1,376,792 | | | | 4 | | | | — | |
| | | | |
| | | (34,482,334 | ) | | | 12,781,821 | | | | (46,682,389 | ) |
| | | | |
Total realized and unrealized gain | | | 29,914,019 | | | | 43,118,700 | | | | 145,462,256 | |
| | | | |
Net Increase in Net Assets Resulting from Operations | | $ | 40,274,821 | | | $ | 40,843,804 | | | $ | 143,178,232 | |
| | | | |
| | 1 | Consolidated Statement of Operations. |
See Notes to Financial Statements.
| | | | | | |
| | | BLACKROCK FUNDS | | MARCH 31, 2014 | | 29 |
| | |
| Statements of Changes in Net Assets | | |
| | | | | | | | | | | | | | | | | | | | | | | | |
| | | BlackRock
Flexible
Equity
Fund1 | | | BlackRock
Mid-Cap
Growth Equity
Portfolio | | | BlackRock
Small Cap
Growth Equity
Portfolio | |
| Increase (Decrease) in Net Assets: | | Six Months
Ended March 31, 2014 (Unaudited) | | | Year Ended
September 30,
2013 | | | Six Months
Ended March 31, 2014
(Unaudited) | | | Year Ended
September 30,
2013 | | | Six Months
Ended March 31, 2014 (Unaudited) | | | Year Ended
September 30,
2013 | |
| | | | | | | | | | | | | | | | | | | | | | | | |
| Operations | | | | | | | | | | | | | | | | | | | | | | | | |
Net investment income (loss) | | $ | 10,360,802 | | | $ | 7,677,041 | | | $ | (2,274,896 | ) | | $ | (63,600 | ) | | $ | (2,284,024 | ) | | $ | (680,869 | ) |
Net realized gain | | | 64,396,353 | | | | 30,339,554 | | | | 30,336,879 | | | | 61,948,809 | | | | 192,144,645 | | | | 337,408,833 | |
Net change in unrealized appreciation/depreciation | | | (34,482,334 | ) | | | 47,234,064 | | | | 12,781,821 | | | | 26,906,700 | | | | (46,682,389 | ) | | | (35,983,349 | ) |
| | | | | | | | | | | | |
Net increase in net assets resulting from operations | | | 40,274,821 | | | | 85,250,659 | | | | 40,843,804 | | | | 88,791,909 | | | | 143,178,232 | | | | 300,744,615 | |
| | | | | | | | | | | | |
| | | | | | | | | | | | | | | | | | | | | | | | |
| Dividends and Distributions to Shareholders From | | | | | | | | | | | | | | | | | | | | | | | | |
Net investment income: | | | | | | | | | | | | | | | | | | | | | | | | |
Institutional | | | (973,756 | ) | | | (1,253,277 | )2 | | | — | | | | — | | | | — | | | | (2,500,056 | )2 |
Service | | | (2,950 | ) | | | (4,137 | )2 | | | — | | | | — | | | | — | | | | — | |
Investor A | | | (5,945,499 | ) | | | (4,742,133 | )2 | | | — | | | | — | | | | — | | | | — | |
Investor B | | | (39,265 | ) | | | (10,767 | )2 | | | — | | | | — | | | | — | | | | — | |
Investor C | | | (580,645 | ) | | | (182,439 | )2 | | | — | | | | — | | | | — | | | | — | |
Class R | | | (7,904 | ) | | | (7,295 | )2 | | | — | | | | — | | | | — | | | | — | |
Net realized gain: | | | | | | | | | | | | | | | | | | | | | | | | |
Institutional | | | — | | | | — | | | | (3,566,206 | ) | | | — | | | | (224,335,020 | ) | | | (94,587,297 | )2 |
Service | | | — | | | | — | | | | (359,600 | ) | | | — | | | | (8,970,316 | ) | | | (3,052,314 | )2 |
Investor A | | | — | | | | — | | | | (48,709,954 | ) | | | — | | | | (114,556,719 | ) | | | (37,128,147 | )2 |
Investor B | | | — | | | | — | | | | (773,466 | ) | | | — | | | | (545,137 | ) | | | (164,432 | )2 |
Investor C | | | — | | | | — | | | | (4,928,001 | ) | | | — | | | | (14,869,102 | ) | | | (3,289,903 | )2 |
Class R | | | — | | | | — | | | | (1,635,424 | ) | | | — | | | | — | | | | — | |
| | | | | | | | | | | | |
Decrease in net assets resulting from dividends and distributions to shareholders | | | (7,550,019 | ) | | | (6,200,048 | ) | | | (59,972,651 | ) | | | — | | | | (363,276,294 | ) | | | (140,722,149 | ) |
| | | | | | | | | | | | |
| | | | | | | | | | | | | | | | | | | | | | | | |
| Capital Share Transactions | | | | | | | | | | | | | | | | | | | | | | | | |
Net increase (decrease) in net assets derived from capital share transactions | | | (70,267,394 | ) | | | (279,569,298 | ) | | | 76,501,497 | | | | (33,574,893 | ) | | | (186,203,034 | ) | | | (296,762,969 | ) |
| | | | | | | | | | | | |
| | | | | | | | | | | | | | | | | | | | | | | | |
| Net Assets | | | | | | | | | | | | | | | | | | | | | | | | |
Total increase (decrease) in net assets | | | (37,542,592 | ) | | | (200,518,687 | ) | | | 57,372,650 | | | | 55,217,016 | | | | (406,301,096 | ) | | | (136,740,503 | ) |
Beginning of period | | | 692,601,401 | | | | 893,120,088 | | | | 343,916,283 | | | | 288,699,267 | | | | 1,254,488,542 | | | | 1,391,229,045 | |
| | | | | | | | | | | | |
End of period | | $ | 655,058,809 | | | $ | 692,601,401 | | | $ | 401,288,933 | | | $ | 343,916,283 | | | $ | 848,187,446 | | | $ | 1,254,488,542 | |
| | | | | | | | | | | | |
Undistributed (accumulated) net investment income (loss) | | $ | 12,044,632 | | | $ | 9,233,849 | | | $ | (2,274,893 | ) | | $ | 3 | | | $ | (4,851,087 | ) | | $ | (2,567,063 | ) |
| | | | | | | | | | | | |
| | 1 | Consolidated Statement of Changes in Net Assets. |
| | 2 | Determined in accordance with federal income tax regulations. |
See Notes to Financial Statements.
| | | | | | |
| 30 | | BLACKROCK FUNDS | | MARCH 31, 2014 | | |
| | | | |
| Financial Highlights | | | BlackRock Flexible Equity Fund | |
| | | | | | | | | | | | | | | | | | | | | | | | | | | | | | | | | | | | | | | | | | | | | | | | |
| | | Institutional | | | Service | |
| | | Six Months Ended March 31, 2014 (Unaudited)1 | | | Year Ended September 30, | | | Six Months Ended March 31, 2014 (Unaudited)1 | | | Year Ended September 30, | |
| | | | 20131 | | | 20121 | | | 2011 | | | 2010 | | | 2009 | | | | 20131 | | | 20121 | | | 2011 | | | 2010 | | | 2009 | |
| Per Share Operating Performance | | | | | | | | | | | | | | | | | | | | | | | | | | | | | | | | | | | | | | | | | | | | | | | | |
Net asset value, beginning of period | | $ | 14.04 | | | $ | 12.53 | | | $ | 9.81 | | | $ | 10.53 | | | $ | 9.34 | | | $ | 9.94 | | | $ | 13.81 | | | $ | 12.30 | | | $ | 9.63 | | | $ | 10.33 | | | $ | 9.17 | | | $ | 9.78 | |
| | | | | | | | |
Net investment income2 | | | 0.25 | | | | 0.19 | | | | 0.10 | | | | 0.12 | | | | 0.10 | | | | 0.08 | | | | 0.20 | | | | 0.14 | | | | 0.06 | | | | 0.08 | | | | 0.04 | | | | 0.05 | |
Net realized and unrealized gain (loss) | | | 0.61 | | | | 1.46 | | | | 2.72 | | | | (0.74 | ) | | | 1.16 | | | | (0.61 | ) | | | 0.62 | | | | 1.44 | | | | 2.68 | | | | (0.73 | ) | | | 1.17 | | | | (0.60 | ) |
| | | | | | | | |
Net increase (decrease) from investment operations | | | 0.86 | | | | 1.65 | | | | 2.82 | | | | (0.62 | ) | | | 1.26 | | | | (0.53 | ) | | | 0.82 | | | | 1.58 | | | | 2.74 | | | | (0.65 | ) | | | 1.21 | | | | (0.55 | ) |
| | | | | | | | |
Dividends from net investment income | | | (0.21 | ) | | | (0.14 | )3 | | | (0.10 | )3 | | | (0.10 | )3 | | | (0.07 | )3 | | | (0.07 | )3 | | | (0.15 | ) | | | (0.07 | )3 | | | (0.07 | )3 | | | (0.05 | )3 | | | (0.05 | )3 | | | (0.06 | )3 |
| | | | | | | | |
Net asset value, end of period | | $ | 14.69 | | | $ | 14.04 | | | $ | 12.53 | | | $ | 9.81 | | | $ | 10.53 | | | $ | 9.34 | | | $ | 14.48 | | | $ | 13.81 | | | $ | 12.30 | | | $ | 9.63 | | | $ | 10.33 | | | $ | 9.17 | |
| | | | | | | | |
| | | | | | | | | | | | | | | | | | | | | | | | | | | | | | | | | | | | | | | | | | | | | | | | |
| Total Investment Return4 | | | | | | | | | | | | | | | | | | | | | | | | | | | | | | | | | | | | | | | | | | | | | | | | |
Based on net asset value | | | 6.12 | %5 | | | 13.36 | % | | | 28.90 | % | | | (6.03 | )%6 | | | 13.56 | % | | | (5.09 | )% | | | 5.89 | %5 | | | 13.00 | % | | | 28.58 | % | | | (6.38 | )%6 | | | 13.20 | % | | | (5.36 | )% |
| | | | | | | | |
| | | | | | | | | | | | | | | | | | | | | | | | | | | | | | | | | | | | | | | | | | | | | | | | |
| Ratios to Average Net Assets | | | | | | | | | | | | | | | | | | | | | | | | | | | | | | | | | | | | | | | | | | | | | | | | |
Total expenses | | | 1.11 | %7,8 | | | 1.15 | %9 | | | 1.13 | % | | | 1.08 | % | | | 1.13 | % | | | 1.16 | % | | | 1.31 | %7,8 | | | 1.75 | %9 | | | 1.95 | % | | | 1.49 | % | | | 1.31 | % | | | 1.32 | % |
| | | | | | | | |
Total expenses excluding recoupment of past waived fees | | | 1.11 | %7,8 | | | 1.15 | %9 | | | 1.13 | % | | | 1.08 | % | | | 1.13 | % | | | 1.16 | % | | | 1.31 | %7,8 | | | 1.73 | %9 | | | 1.95 | % | | | 1.49 | % | | | 1.31 | % | | | 1.32 | % |
| | | | | | | | |
Total expenses after fees waived, reimbursed and paid indirectly | | | 0.97 | %7,8 | | | 0.97 | %9 | | | 0.97 | % | | | 0.97 | % | | | 0.97 | % | | | 0.95 | % | | | 1.29 | %7,8 | | | 1.29 | %9 | | | 1.29 | % | | | 1.29 | % | | | 1.27 | % | | | 1.26 | % |
| | | | | | | | |
Net investment income | | | 3.44 | %7,8 | | | 1.48 | %9 | | | 0.89 | % | | | 0.98 | % | | | 0.99 | % | | | 1.00 | % | | | 2.80 | %7,8 | | | 1.15 | %9 | | | 0.56 | % | | | 0.65 | % | | | 0.37 | % | | | 0.69 | % |
| | | | | | | | |
| | | | | | | | | | | | | | | | | | | | | | | | | | | | | | | | | | | | | | | | | | | | | | | | |
| Supplemental Data | | | | | | | | | | | | | | | | | | | | | | | | | | | | | | | | | | | | | | | | | | | | | | | | |
Net assets, end of period (000) | | $ | 55,717 | | | $ | 64,078 | | | $ | 142,963 | | | $ | 195,753 | | | $ | 204,286 | | | $ | 165,710 | | | $ | 301 | | | $ | 421 | | | $ | 674 | | | $ | 1,025 | | | $ | 737 | | | $ | 2,561 | |
| | | | | | | | |
Portfolio turnover | | | 51 | % | | | 119 | % | | | 156 | % | | | 137 | % | | | 123 | % | | | 181 | % | | | 51 | % | | | 119 | % | | | 156 | % | | | 137 | % | | | 123 | % | | | 181 | % |
| | | | | | | | |
| | 1 | Consolidated Financial Highlights. |
| | 2 | Based on average shares outstanding. |
| | 3 | Determined in accordance with federal income tax regulations. |
| | 4 | Where applicable, assumes the reinvestment of dividends and distributions. |
| | 5 | Aggregate total investment return. |
| | 6 | Includes proceeds received from a settlement of litigation, which had no impact on the Fund’s total return. |
| | 7 | Ratios do not include expenses incurred indirectly as a result of investments in underlying funds of approximately 0.01%. |
| | 9 | Ratios do not include expenses incurred indirectly as a result of investments in underlying funds of approximately 0.03%. |
See Notes to Financial Statements.
| | | | | | |
| | | BLACKROCK FUNDS | | MARCH 31, 2014 | | 31 |
| | | | |
| Financial Highlights (continued) | | | BlackRock Flexible Equity Fund | |
| | | | | | | | | | | | | | | | | | | | | | | | | | | | | | | | | | | | | | | | | | | | | | | | |
| | | Investor A | | | Investor B | |
| | | Six Months Ended March 31, | | | Year Ended September 30, | | | Six Months Ended March 31, | | | Year Ended September 30, | |
| | | 2014 | | | | | | | | | | | | | | | | | | 2014 | | | | | | | | | | | | | | | | |
| | | (Unaudited)1 | | | 20131 | | | 20121 | | | 2011 | | | 2010 | | | 2009 | | | (Unaudited)1 | | | 20131 | | | 20121 | | | 2011 | | | 2010 | | | 2009 | |
| Per Share Operating Performance | | | | | | | | | | | | | | | | | | | | | | | | | | | | | | | | | | | | | | | | | | | | | | | | |
Net asset value, beginning of period | | $ | 13.59 | | | $ | 12.14 | | | $ | 9.50 | | | $ | 10.21 | | | $ | 9.06 | | | $ | 9.66 | | | $ | 12.26 | | | $ | 10.95 | | | $ | 8.58 | | | $ | 9.25 | | | $ | 8.23 | | | $ | 8.84 | |
| | | | | | | | |
Net investment income (loss)2 | | | 0.22 | | | | 0.14 | | | | 0.07 | | | | 0.08 | | | | 0.06 | | | | 0.05 | | | | 0.14 | | | | 0.04 | | | | (0.02 | ) | | | (0.01 | ) | | | (0.02 | ) | | | (0.00 | )3 |
Net realized and unrealized gain (loss) | | | 0.60 | | | | 1.41 | | | | 2.63 | | | | (0.72 | ) | | | 1.13 | | | | (0.59 | ) | | | 0.55 | | | | 1.28 | | | | 2.39 | | | | (0.65 | ) | | | 1.04 | | | | (0.56 | ) |
| | | | | | | | |
Net increase (decrease) from investment operations | | | 0.82 | | | | 1.55 | | | | 2.70 | | | | (0.64 | ) | | | 1.19 | | | | (0.54 | ) | | | 0.69 | | | | 1.32 | | | | 2.37 | | | | (0.66 | ) | | | 1.02 | | | | (0.56 | ) |
| | | | | | | | |
Dividends from net investment income | | | (0.17 | ) | | | (0.10 | )4 | | | (0.06 | )4 | | | (0.07 | )4 | | | (0.04 | )4 | | | (0.06 | )4 | | | (0.05 | ) | | | (0.01 | )4 | | | — | | | | (0.01 | )4 | | | — | | | | (0.05 | )4 |
| | | | | | | | |
Net asset value, end of period | | $ | 14.24 | | | $ | 13.59 | | | $ | 12.14 | | | $ | 9.50 | | | $ | 10.21 | | | $ | 9.06 | | | $ | 12.90 | | | $ | 12.26 | | | $ | 10.95 | | | $ | 8.58 | | | $ | 9.25 | | | $ | 8.23 | |
| | | | | | | | |
| | | | | | | | | | | | | | | | | | | | | | | | | | | | | | | | | | | | | | | | | | | | | | | | |
| Total Investment Return5 | | | | | | | | | | | | | | | | | | | | | | | | | | | | | | | | | | | | | | | | | | | | | | | | |
Based on net asset value | | | 5.99 | %6 | | | 12.92 | % | | | 28.54 | % | | | (6.33 | )%7 | | | 13.21 | % | | | (5.32 | )% | | | 5.59 | %6 | | | 12.04 | % | | | 27.62 | % | | | (7.17 | )%7 | | | 12.39 | % | | | (6.12 | )% |
| | | | | | | | |
| | | | | | | | | | | | | | | | | | | | | | | | | | | | | | | | | | | | | | | | | | | | | | | | |
| Ratios to Average Net Assets | | | | | | | | | | | | | | | | | | | | | | | | | | | | | | | | | | | | | | | | | | | | | | | | |
Total expenses | | | 1.41 | %8,9 | | | 1.43 | %10 | | | 1.40 | % | | | 1.37 | % | | | 1.40 | % | | | 1.51 | % | | | 2.47 | %8,9 | | | 2.42 | %10 | | | 2.31 | % | | | 2.13 | % | | | 2.22 | % | | | 2.38 | % |
| | | | | | | | |
Total expenses excluding recoupment of past waived fees | | | 1.41 | %8,9 | | | 1.43 | %10 | | | 1.40 | % | | | 1.37 | % | | | 1.40 | % | | | 1.51 | % | | | 2.47 | %8,9 | | | 2.41 | %10 | | | 2.30 | % | | | 2.12 | % | | | 2.20 | % | | | 2.38 | % |
| | | | | | | | |
Total expenses after fees waived, reimbursed and paid indirectly | | | 1.29 | %8,9 | | | 1.29 | %10 | | | 1.29 | % | | | 1.29 | % | | | 1.29 | % | | | 1.26 | % | | | 2.06 | %8,9 | | | 2.06 | %10 | | | 2.06 | % | | | 2.06 | % | | | 2.04 | % | | | 2.02 | % |
| | | | | | | | |
Net investment income (loss) | | | 3.11 | %8,9 | | | 1.11 | %10 | | | 0.60 | % | | | 0.66 | % | | | 0.61 | % | | | 0.70 | % | | | 2.12 | %8,9 | | | 0.36 | %10 | | | (0.19 | )% | | | (0.10 | )% | | | (0.24 | )% | | | (0.04 | )% |
| | | | | | | | |
| | | | | | | | | | | | | | | | | | | | | | | | | | | | | | | | | | | | | | | | | | | | | | | | |
| Supplemental Data | | | | | | | | | | | | | | | | | | | | | | | | | | | | | | | | | | | | | | | | | | | | | | | | |
Net assets, end of period (000) | | $ | 488,086 | | | $ | 512,059 | | | $ | 615,464 | | | $ | 587,989 | | | $ | 726,666 | | | $ | 395,763 | | | $ | 9,521 | | | $ | 11,918 | | | $ | 17,465 | | | $ | 26,233 | | | $ | 42,239 | | | $ | 41,196 | |
| | | | | | | | |
Portfolio turnover | | | 51 | % | | | 119 | % | | | 156 | % | | | 137 | % | | | 123 | % | | | 181 | % | | | 51 | % | | | 119 | % | | | 156 | % | | | 137 | % | | | 123 | % | | | 181 | % |
| | | | | | | | |
| | 1 | Consolidated Financial Highlights. |
| | 2 | Based on average shares outstanding. |
| | 3 | Amount is greater than $(0.005) per share. |
| | 4 | Determined in accordance with federal income tax regulations. |
| | 5 | Where applicable, excludes the effects of any sales charges and assumes the reinvestment of dividends and distributions. |
| | 6 | Aggregate total investment return. |
| | 7 | Includes proceeds received from a settlement of litigation, which had no impact on the Fund’s total return. |
| | 8 | Ratios do not include expenses incurred indirectly as a result of investments in underlying funds of approximately 0.01%. |
| | 10 | Ratios do not include expenses incurred indirectly as a result of investments in underlying funds of approximately 0.03%. |
See Notes to Financial Statements.
| | | | | | |
| 32 | | BLACKROCK FUNDS | | MARCH 31, 2014 | | |
| | | | |
| Financial Highlights (concluded) | | | BlackRock Flexible Equity Fund | |
| | | | | | | | | | | | | | | | | | | | | | | | | | | | | | | | | | | | | | | | | | | | |
| | | Investor C | | | Class R | |
| | | Six Months Ended March 31, 2014 (Unaudited)1 | | | Year Ended September 30, | | | Six Months Ended March 31, 2014 (Unaudited)1 | | | Year Ended September 30, | | | Period July 30, 20102 to September 30, 2010 | |
| | | | 20131 | | | 20121 | | | 2011 | | | 2010 | | | 2009 | | | | 20131 | | | 20121 | | | 2011 | | |
| Per Share Operating Performance | | | | | | | | | | | | | | | | | | | | | | | | | | | | | | | | | |
Net asset value, beginning of period | | $ | 12.20 | | | $ | 10.91 | | | $ | 8.55 | | | $ | 9.22 | | | $ | 8.20 | | | $ | 8.81 | | | $ | 13.94 | | | $ | 12.46 | | | $ | 9.75 | | | $ | 10.51 | | | $ | 10.24 | |
| | | | | | | | |
Net investment income (loss)3 | | | 0.15 | | | | 0.04 | | | | (0.02 | ) | | | (0.01 | ) | | | (0.01 | ) | | | (0.00 | )4 | | | 0.24 | | | | 0.10 | | | | 0.03 | | | | 0.04 | | | | 0.00 | 5 |
Net realized and unrealized gain (loss) | | | 0.53 | | | | 1.27 | | | | 2.38 | | | | (0.64 | ) | | | 1.03 | | | | (0.56 | ) | | | 0.56 | | | | 1.45 | | | | 2.71 | | | | (0.73 | ) | | | 0.27 | |
| | | | | | | | |
Net increase (decrease) from investment operations | | | 0.68 | | | | 1.31 | | | | 2.36 | | | | (0.65 | ) | | | 1.02 | | | | (0.56 | ) | | | 0.80 | | | | 1.55 | | | | 2.74 | | | | (0.69 | ) | | | 0.27 | |
| | | | | | | | |
Dividends from net investment income | | | (0.07 | ) | | | (0.02 | )6 | | | — | | | | (0.02 | )6 | | | — | | | | (0.05 | )6 | | | (0.11 | ) | | | (0.07 | )6 | | | (0.03 | )6 | | | (0.07 | )6 | | | — | |
| | | | | | | | |
Net asset value, end of period | | $ | 12.81 | | | $ | 12.20 | | | $ | 10.91 | | | $ | 8.55 | | | $ | 9.22 | | | $ | 8.20 | | | $ | 14.63 | | | $ | 13.94 | | | $ | 12.46 | | | $ | 9.75 | | | $ | 10.51 | |
| | | | | | | | |
| | | | | | | | | | | | | | | | | | | | | | | | | | | | | | | | | | | | | | | | | | | | |
| Total Investment Return7 | | | | | | | | | | | | | | | | | | | | | | | | | | | | | | | | | |
Based on net asset value | | | 5.58 | %8 | | | 12.01 | % | | | 27.60 | % | | | (7.11 | )%9 | | | 12.44 | % | | | (6.14 | )% | | | 5.70 | %8 | | | 12.51 | % | | | 28.13 | % | | | (6.66 | )%9 | | | 13.17 | %8 |
| | | | | | | | |
| | | | | | | | | | | | | | | | | | | | | | | | | | | | | | | | | | | | | | | | | | | | |
| Ratios to Average Net Assets | | | | | | | | | | | | | | | | | | | | | | | | | | | | | | | | | |
Total expenses | | | 2.16 | %10,11 | | | 2.20 | %12 | | | 2.18 | % | | | 2.16 | % | | | 2.22 | % | | | 2.39 | % | | | 1.71 | %10,11 | | | 1.78 | %12 | | | 1.78 | % | | | 1.72 | % | | | 2.21 | %11 |
| | | | | | | | |
Total expenses excluding recoupment of past waived fees | | | 2.16 | %10,11 | | | 2.20 | %12 | | | 2.18 | % | | | 2.16 | % | | | 2.22 | % | | | 2.39 | % | | | 1.71 | %10,11 | | | 1.78 | %12 | | | 1.78 | % | | | 1.70 | % | | | 2.21 | %11 |
| | | | | | | | |
Total expenses after fees waived, reimbursed and paid indirectly | | | 2.06 | %10,11 | | | 2.06 | %12 | | | 2.06 | % | | | 2.06 | % | | | 2.06 | % | | | 2.02 | % | | | 1.64 | %10,11 | | | 1.65 | %12 | | | 1.65 | % | | | 1.65 | % | | | 1.65 | %11 |
| | | | | | | | |
Net investment income (loss) | | | 2.37 | %10,11 | | | 0.34 | %12 | | | (0.18 | )% | | | (0.11 | )% | | | (0.17 | )% | | | (0.06 | )% | | | 3.29 | %10,11 | | | 0.78 | %12 | | | 0.25 | % | | | 0.31 | % | | | 0.08 | %11 |
| | | | | | | | |
| | | | | | | | | | | | | | | | | | | | | | | | | | | | | | | | | | | | | | | | | | | | |
| Supplemental Data | | | | | | | | | | | | | | | | | | | | | | | | | | | | | | | | | |
Net assets, end of period (000) | | $ | 100,269 | | | $ | 103,097 | | | $ | 115,242 | | | $ | 112,520 | | | $ | 148,923 | | | $ | 92,141 | | | $ | 1,165 | | | $ | 1,028 | | | $ | 1,312 | | | $ | 920 | | | $ | 838 | |
| | | | | | | | |
Portfolio turnover | | | 51 | % | | | 119 | % | | | 156 | % | | | 137 | % | | | 123 | % | | | 181 | % | | | 51 | % | | | 119 | % | | | 156 | % | | | 137 | % | | | 123 | % |
| | | | | | | | |
| | 1 | Consolidated Financial Highlights. |
| | 2 | Commencement of operations. |
| | 3 | Based on average shares outstanding. |
| | 4 | Amount is greater than $(0.005) per share. |
| | 5 | Amount is less than $0.005 per share. |
| | 6 | Determined in accordance with federal income tax regulations. |
| | 7 | Where applicable, excludes the effects of any sales charges and assumes the reinvestment of dividends and distributions. |
| | 8 | Aggregate total investment return. |
| | 9 | Includes proceeds received from a settlement of litigation, which had no impact on the Fund’s total return. |
| | 10 | Ratios do not include expenses incurred indirectly as a result of investments in underlying funds of approximately 0.01%. |
| | 12 | Ratios do not include expenses incurred indirectly as a result of investments in underlying funds of approximately 0.03%. |
See Notes to Financial Statements.
| | | | | | |
| | | BLACKROCK FUNDS | | MARCH 31, 2014 | | 33 |
| | | | |
| Financial Highlights | | | BlackRock Mid-Cap Growth Equity Portfolio | |
| | | | | | | | | | | | | | | | | | | | | | | | | | | | | | | | | | | | | | | | | | | | | | | | |
| | | Institutional | | | Service | |
| | | Six Months Ended March 31, 2014 (Unaudited) | | | Year Ended September 30, | | | Six Months Ended March 31, 2014 (Unaudited) | | | Year Ended September 30, | |
| | | | 2013 | | | 2012 | | | 2011 | | | 2010 | | | 2009 | | | | 2013 | | | 2012 | | | 2011 | | | 2010 | | | 2009 | |
| Per Share Operating Performance | | | | | | | | | | | | | | | | | | | | | | | | | | | | | | | | | | | | | |
Net asset value, beginning of period | | $ | 18.22 | | | $ | 13.58 | | | $ | 11.10 | | | $ | 11.18 | | | $ | 10.27 | | | $ | 10.33 | | | $ | 17.05 | | | $ | 12.77 | | | $ | 10.49 | | | $ | 10.60 | | | $ | 9.78 | | | $ | 9.87 | |
| | | | | | | | |
Net investment income (loss)1 | | | (0.08 | ) | | | 0.05 | | | | 0.04 | | | | (0.05 | ) | | | (0.01 | ) | | | (0.04 | ) | | | (0.11 | ) | | | (0.02 | ) | | | (0.01 | ) | | | (0.10 | ) | | | (0.05 | ) | | | (0.06 | ) |
Net realized and unrealized gain (loss) | | | 2.09 | | | | 4.59 | | | | 2.44 | | | | (0.03 | ) | | | 0.92 | | | | (0.02 | ) | | | 1.94 | | | | 4.30 | | | | 2.29 | | | | (0.01 | ) | | | 0.87 | | | | (0.03 | ) |
| | | | | | | | |
Net increase (decrease) from investment operations | | | 2.01 | | | | 4.64 | | | | 2.48 | | | | (0.08 | ) | | | 0.91 | | | | (0.06 | ) | | | 1.83 | | | | 4.28 | | | | 2.28 | | | | (0.11 | ) | | | 0.82 | | | | (0.09 | ) |
| | | | | | | | |
Distributions from net realized gain | | | (2.92 | ) | | | — | | | | — | | | | — | | | | — | | | | — | | | | (2.83 | ) | | | — | | | | — | | | | — | | | | — | | | | — | |
| | | | | | | | |
Net asset value, end of period | | $ | 17.31 | | | $ | 18.22 | | | $ | 13.58 | | | $ | 11.10 | | | $ | 11.18 | | | $ | 10.27 | | | $ | 16.05 | | | $ | 17.05 | | | $ | 12.77 | | | $ | 10.49 | | | $ | 10.60 | | | $ | 9.78 | |
| | | | | | | | |
| | | | | | | | | | | | | | | | | | | | | | | | | | | | | | | | | | | | | | | | | | | | | | | | |
| Total Investment Return2 | | | | | | | | | | | | | | | | | | | | | | | | | | | | | | | | | | | | | |
Based on net asset value | | | 12.37 | %3 | | | 34.17 | % | | | 22.34 | % | | | (0.72 | )%4 | | | 8.86 | %5 | | | (0.58 | )%6 | | | 12.09 | %3 | | | 33.52 | % | | | 21.74 | % | | | (1.04 | )%7 | | | 8.38 | %8 | | | (0.91 | )%9 |
| | | | | | | | |
| | | | | | | | | | | | | | | | | | | | | | | | | | | | | | | | | | | | | | | | | | | | | | | | |
| Ratios to Average Net Assets | | | | | | | | | | | | | | | | | | | | | | | | | | | | | | | | | | | | | |
Total expenses | | | 1.11 | %10 | | | 1.13 | % | | | 1.11 | % | | | 1.17 | % | | | 1.15 | % | | | 1.20 | % | | | 1.58 | %10 | | | 1.67 | % | | | 2.29 | % | | | 1.87 | % | | | 1.63 | % | | | 1.65 | % |
| | | | | | | | |
Total expenses excluding recoupment of past waived fees | | | 1.07 | %10 | | | 1.11 | % | | | 1.11 | % | | | 1.17 | % | | | 1.14 | % | | | 1.20 | % | | | 1.35 | %10 | | | 1.51 | % | | | 2.29 | % | | | 1.87 | % | | | 1.62 | % | | | 1.64 | % |
| | | | | | | | |
Total expenses after fees waived, reimbursed and paid indirectly | | | 1.11 | %10 | | | 1.11 | % | | | 1.07 | % | | | 1.17 | % | | | 1.15 | % | | | 1.18 | % | | | 1.58 | %10 | | | 1.58 | % | | | 1.58 | % | | | 1.58 | % | | | 1.58 | % | | | 1.51 | % |
| | | | | | | | |
Net investment income (loss) | | | (0.86 | )%10 | | | 0.30 | % | | | 0.27 | % | | | (0.38 | )% | | | (0.09 | )% | | | (0.44 | )% | | | (1.33 | )%10 | | | (0.15 | )% | | | (0.06 | )% | | | (0.83 | )% | | | (0.52 | )% | | | (0.76 | )% |
| | | | | | | | |
| | | | | | | | | | | | | | | | | | | | | | | | | | | | | | | | | | | | | | | | | | | | | | | | |
| Supplemental Data | | | | | | | | | | | | | | | | | | | | | | | | | | | | | | | | | | | | | |
Net assets, end of period (000) | | $ | 34,036 | | | $ | 21,485 | | | $ | 18,526 | | | $ | 19,348 | | | $ | 24,421 | | | $ | 25,572 | | | $ | 2,242 | | | $ | 2,065 | | | $ | 1,865 | | | $ | 714 | | | $ | 330 | | | $ | 360 | |
| | | | | | | | |
Portfolio turnover | | | 55 | % | | | 160 | % | | | 88 | % | | | 131 | % | | | 76 | % | | | 53 | % | | | 55 | % | | | 160 | % | | | 88 | % | | | 131 | % | | | 76 | % | | | 53 | % |
| | | | | | | | |
| | 1 | Based on average shares outstanding. |
| | 2 | Where applicable, assumes the reinvestment of dividends and distributions. |
| | 3 | Aggregate total investment return. |
| | 4 | Includes proceeds received from a settlement of litigation, which impacted the Fund’s total return. Excluding these proceeds, the Fund’s total return would have been (0.90)%. |
| | 5 | Includes proceeds received from a settlement of litigation, which impacted the Fund’s total return. Excluding these proceeds, the Fund’s total return would have been 8.47%. |
| | 6 | Includes proceeds received from a settlement of litigation, which impacted the Fund’s total return. Excluding these proceeds, the Fund’s total return would have been (0.87)%. |
| | 7 | Includes proceeds received from a settlement of litigation, which impacted the Fund’s total return. Excluding these proceeds, the Fund’s total return would have been (1.23)%. |
| | 8 | Includes proceeds received from a settlement of litigation, which impacted the Fund’s total return. Excluding these proceeds, the Fund’s total return would have been 7.98%. |
| | 9 | Includes proceeds received from a settlement of litigation, which impacted the Fund’s total return. Excluding these proceeds, the Fund’s total return would have been (1.22)%. |
See Notes to Financial Statements.
| | | | | | |
| 34 | | BLACKROCK FUNDS | | MARCH 31, 2014 | | |
| | | | |
| Financial Highlights (continued) | | | BlackRock Mid-Cap Growth Equity Portfolio | |
| | | | | | | | | | | | | | | | | | | | | | | | | | | | | | | | | | | | | | | | | | | | | | | | |
| | | Investor A | | | Investor B | |
| | | Six Months Ended March 31, 2014 (Unaudited) | | | Year Ended September 30, | | | Six Months Ended March 31, 2014 (Unaudited) | | | Year Ended September 30, | |
| | | | |
| | | | 2013 | | | 2012 | | | 2011 | | | 2010 | | | 2009 | | | | 2013 | | | 2012 | | | 2011 | | | 2010 | | | 2009 | |
| Per Share Operating Performance | | | | | | | | | | | | | | | | | | | | | | | | | | | | | |
Net asset value, beginning of period | | $ | 16.56 | | | $ | 12.38 | | | $ | 10.15 | | | $ | 10.27 | | | $ | 9.47 | | | $ | 9.56 | | | $ | 14.27 | | | $ | 10.75 | | | $ | 8.88 | | | $ | 9.05 | | | $ | 8.42 | | | $ | 8.56 | |
| | | | | | | | |
Net investment income (loss)1 | | | (0.09 | ) | | | 0.00 | 2 | | | (0.01 | ) | | | (0.09 | ) | | | (0.05 | ) | | | (0.06 | ) | | | (0.13 | ) | | | (0.08 | ) | | | (0.09 | ) | | | (0.16 | ) | | | (0.12 | ) | | | (0.10 | ) |
Net realized and unrealized gain (loss) | | | 1.87 | | | | 4.18 | | | | 2.24 | | | | (0.03 | ) | | | 0.85 | | | | (0.03 | ) | | | 1.59 | | | | 3.60 | | | | 1.96 | | | | (0.01 | ) | | | 0.75 | | | | (0.04 | ) |
| | | | | | | | |
Net increase (decrease) from investment operations | | | 1.78 | | | | 4.18 | | | | 2.23 | | | | (0.12 | ) | | | 0.80 | | | | (0.09 | ) | | | 1.46 | | | | 3.52 | | | | 1.87 | | | | (0.17 | ) | | | 0.63 | | | | (0.14 | ) |
| | | | | | | | |
Distributions from net realized gain | | | (2.86 | ) | | | — | | | | — | | | | — | | | | — | | | | — | | | | (2.71 | ) | | | — | | | | — | | | | — | | | | — | | | | — | |
| | | | | | | | |
Net asset value, end of period | | $ | 15.48 | | | $ | 16.56 | | | $ | 12.38 | | | $ | 10.15 | | | $ | 10.27 | | | $ | 9.47 | | | $ | 13.02 | | | $ | 14.27 | | | $ | 10.75 | | | $ | 8.88 | | | $ | 9.05 | | | $ | 8.42 | |
| | | | | | | | |
| | | | | | | | | | | | | | | | | | | | | | | | | | | | | | | | | | | | | | | | | | | | | | | | |
| Total Investment Return3 | | | | | | | | | | | | | | | | | | | | | | | | | | | | | |
Based on net asset value | | | 12.21 | %4 | | | 33.76 | % | | | 21.97 | % | | | (1.17 | )%5 | | | 8.45 | %6 | | | (0.94 | )%7 | | | 11.76 | %4 | | | 32.74 | % | | | 21.06 | % | | | (1.88 | )%8 | | | 7.48 | %9 | | | (1.64 | )%10 |
| | | | | | | | |
| | | | | | | | | | | | | | | | | | | | | | | | | | | | | | | | | | | | | | | | | | | | | | | | |
| Ratios to Average Net Assets | | | | | | | | | | | | | | | | | | | | | | | | | | | | | |
Total expenses | | | 1.47 | %11 | | | 1.55 | % | | | 1.55 | % | | | 1.59 | % | | | 1.58 | % | | | 1.76 | % | | | 2.66 | %11 | | | 2.70 | % | | | 2.59 | % | | | 2.43 | % | | | 2.48 | % | | | 2.73 | % |
| | | | | | | | |
Total expenses excluding recoupment of past waived fees | | | 1.47 | %11 | | | 1.55 | % | | | 1.55 | % | | | 1.56 | % | | | 1.55 | % | | | 1.72 | % | | | 2.66 | %11 | | | 2.70 | % | | | 2.59 | % | | | 2.42 | % | | | 2.47 | % | | | 2.64 | % |
| | | | | | | | |
Total expenses after fees waived, reimbursed and paid indirectly | | | 1.39 | %11 | | | 1.39 | % | | | 1.39 | % | | | 1.58 | % | | | 1.58 | % | | | 1.59 | % | | | 2.16 | %11 | | | 2.16 | % | | | 2.16 | % | | | 2.39 | % | | | 2.38 | % | | | 2.34 | % |
| | | | | | | | |
Net investment income (loss) | | | (1.16 | )%11 | | | 0.03 | % | | | (0.06 | )% | | | (0.79 | )% | | | (0.51 | )% | | | (0.85 | )% | | | (1.93 | )%11 | | | (0.66 | )% | | | (0.88 | )% | | | (1.58 | )% | | | (1.36 | )% | | | (1.57 | )% |
| | | | | | | | |
| | | | | | | | | | | | | | | | | | | | | | | | | | | | | | | | | | | | | | | | | | | | | | | | |
| Supplemental Data | | | | | | | | | | | | | | | | | | | | | | | | | | | | | |
Net assets, end of period (000) | | $ | 322,288 | | | $ | 282,726 | | | $ | 237,748 | | | $ | 232,924 | | | $ | 180,501 | | | $ | 181,159 | | | $ | 3,994 | | | $ | 4,330 | | | $ | 5,123 | | | $ | 7,596 | | | $ | 8,209 | | | $ | 11,978 | |
| | | | | | | | |
Portfolio turnover | | | 55 | % | | | 160 | % | | | 88 | % | | | 131 | % | | | 76 | % | | | 53 | % | | | 55 | % | | | 160 | % | | | 88 | % | | | 131 | % | | | 76 | % | | | 53 | % |
| | | | | | | | |
| | 1 | Based on average shares outstanding. |
| | 2 | Amount is less than $0.005 per share. |
| | 3 | Where applicable, excludes the effects of any sales charges and assumes the reinvestment of dividends and distributions. |
| | 4 | Aggregate total investment return. |
| | 5 | Includes proceeds received from a settlement of litigation, which impacted the Fund’s total return. Excluding these proceeds, the Fund’s total return would have been (1.36)%. |
| | 6 | Includes proceeds received from a settlement of litigation, which impacted the Fund’s total return. Excluding these proceeds, the Fund’s total return would have been 8.03%. |
| | 7 | Includes proceeds received from a settlement of litigation, which impacted the Fund’s total return. Excluding these proceeds, the Fund’s total return would have been (1.26)%. |
| | 8 | Includes proceeds received from a settlement of litigation, which impacted the Fund’s total return. Excluding these proceeds, the Fund’s total return would have been (2.10)%. |
| | 9 | Includes proceeds received from a settlement of litigation, which impacted the Fund’s total return. Excluding these proceeds, the Fund’s total return would have been 7.01%. |
| | 10 | Includes proceeds received from a settlement of litigation, which impacted the Fund’s total return. Excluding these proceeds, the Fund’s total return would have been (1.99)%. |
See Notes to Financial Statements.
| | | | | | |
| | | BLACKROCK FUNDS | | MARCH 31, 2014 | | 35 |
| | | | |
| Financial Highlights (concluded) | | | BlackRock Mid-Cap Growth Equity Portfolio | |
| | | | | | | | | | | | | | | | | | | | | | | | | | | | | | | | | | | | | | | | | | | | | | | | |
| | | Investor C | | | Class R | |
| | | Six Months Ended March 31, 2014 (Unaudited) | | | Year Ended September 30, | | | Six Months Ended March 31, 2014 (Unaudited) | | | Year Ended September 30, | |
| | | | 2013 | | | 2012 | | | 2011 | | | 2010 | | | 2009 | | | | 2013 | | | 2012 | | | 2011 | | | 2010 | | | 2009 | |
| Per Share Operating Performance | | | | | | | | | | | | | | | | | | | | | | | | | | | | | |
Net asset value, beginning of period | | $ | 14.28 | | | $ | 10.75 | | | $ | 8.89 | | | $ | 9.05 | | | $ | 8.41 | | | $ | 8.56 | | | $ | 16.44 | | | $ | 12.32 | | | $ | 10.13 | | | $ | 10.25 | | | $ | 9.46 | | | $ | 9.56 | |
| | | | | | | | |
Net investment loss1 | | | (0.13 | ) | | | (0.09 | ) | | | (0.08 | ) | | | (0.16 | ) | | | (0.11 | ) | | | (0.11 | ) | | | (0.11 | ) | | | (0.04 | ) | | | (0.03 | ) | | | (0.10 | ) | | | (0.04 | ) | | | (0.07 | ) |
Net realized and unrealized gain (loss) | | | 1.58 | | | | 3.62 | | | | 1.94 | | | | (0.00 | )2 | | | 0.75 | | | | (0.04 | ) | | | 1.85 | | | | 4.16 | | | | 2.22 | | | | (0.02 | ) | | | 0.83 | | | | (0.03 | ) |
| | | | | | | | |
Net increase (decrease) from investment operations | | | 1.45 | | | | 3.53 | | | | 1.86 | | | | (0.16 | ) | | | 0.64 | | | | (0.15 | ) | | | 1.74 | | | | 4.12 | | | | 2.19 | | | | (0.12 | ) | | | 0.79 | | | | (0.10 | ) |
| | | | | | | | |
Distributions from net realized gain | | | (2.77 | ) | | | — | | | | — | | | | — | | | | — | | | | — | | | | (2.83 | ) | | | — | | | | — | | | | — | | | | — | | | | — | |
| | | | | | | | |
Net asset value, end of period | | $ | 12.96 | | | $ | 14.28 | | | $ | 10.75 | | | $ | 8.89 | | | $ | 9.05 | | | $ | 8.41 | | | $ | 15.35 | | | $ | 16.44 | | | $ | 12.32 | | | $ | 10.13 | | | $ | 10.25 | | | $ | 9.46 | |
| | | | | | | | |
| | | | | | | | | | | | | | | | | | | | | | | | | | | | | | | | | | | | | | | | | | | | | | | | |
| Total Investment Return3 | | | | | | | | | | | | | | | | | | | | | | | | | | | | | |
Based on net asset value | | | 11.70 | %4 | | | 32.84 | % | | | 20.92 | % | | | (1.77 | )%5 | | | 7.61 | %6 | | | (1.75 | )%7 | | | 11.99 | %4 | | | 33.44 | % | | | 21.62 | % | | | (1.17 | )%8 | | | 8.35 | %9 | | | (1.05 | )%10 |
| | | | | | | | |
| | | | | | | | | | | | | | | | | | | | | | | | | | | | | | | | | | | | | | | | | | | | | | | | |
| Ratios to Average Net Assets | | | | | | | | | | | | | | | | | | | | | | | | | | | | | |
Total expenses | | | 2.16 | %11 | | | 2.23 | % | | | 2.31 | % | | | 2.34 | % | | | 2.33 | % | | | 2.46 | % | | | 1.71 | %11 | | | 1.74 | % | | | 1.84 | % | | | 1.91 | % | | | 1.97 | % | | | 2.04 | % |
| | | | | | | | |
Total expenses excluding recoupment of past waived fees | | | 2.14 | %11 | | | 2.23 | % | | | 2.31 | % | | | 2.31 | % | | | 2.30 | % | | | 2.44 | % | | | 1.71 | %11 | | | 1.74 | % | | | 1.84 | % | | | 1.91 | % | | | 1.97 | % | | | 2.04 | % |
| | | | | | | | |
Total expenses after fees waived, reimbursed and paid indirectly | | | 2.16 | %11 | | | 2.16 | % | | | 2.16 | % | | | 2.33 | % | | | 2.33 | % | | | 2.34 | % | | | 1.65 | %11 | | | 1.65 | % | | | 1.65 | % | | | 1.65 | % | | | 1.65 | % | | | 1.63 | % |
| | | | | | | | |
Net investment loss | | | (1.94 | )%11 | | | (0.75 | )% | | | (0.81 | )% | | | (1.54 | )% | | | (1.26 | )% | | | (1.59 | )% | | | (1.38 | )%11 | | | (0.26 | )% | | | (0.28 | )% | | | (0.84 | )% | | | (0.44 | )% | | | (0.89 | )% |
| | | | | | | | |
| | | | | | | | | | | | | | | | | | | | | | | | | | | | | | | | | | | | | | | | | | | | | | | | |
| Supplemental Data | | | | | | | | | | | | | | | | | | | | | | | | | | | | | |
Net assets, end of period (000) | | $ | 31,005 | | | $ | 23,959 | | | $ | 18,774 | | | $ | 16,615 | | | $ | 12,578 | | | $ | 12,418 | | | $ | 7,722 | | | $ | 9,352 | | | $ | 6,663 | | | $ | 5,227 | | | $ | 4,138 | | | $ | 2,323 | |
| | | | | | | | |
Portfolio turnover | | | 55 | % | | | 160 | % | | | 88 | % | | | 131 | % | | | 76 | % | | | 53 | % | | | 55 | % | | | 160 | % | | | 88 | % | | | 131 | % | | | 76 | % | | | 53 | % |
| | | | | | | | |
| | 1 | Based on average shares outstanding. |
| | 2 | Amount is greater than $(0.005) per share. |
| | 3 | Where applicable, excludes the effects of any sales charges and assumes the reinvestment of dividends and distributions. |
| | 4 | Aggregate total investment return. |
| | 5 | Includes proceeds received from a settlement of litigation, which impacted the Fund’s total return. Excluding these proceeds, the Fund’s total return would have been (1.99)%. |
| | 6 | Includes proceeds received from a settlement of litigation, which impacted the Fund’s total return. Excluding these proceeds, the Fund’s total return would have been 7.13%. |
| | 7 | Includes proceeds received from a settlement of litigation, which impacted the Fund’s total return. Excluding these proceeds, the Fund’s total return would have been (2.10)%. |
| | 8 | Includes proceeds received from a settlement of litigation, which impacted the Fund’s total return. Excluding these proceeds, the Fund’s total return would have been (1.37)%. |
| | 9 | Includes proceeds received from a settlement of litigation, which impacted the Fund’s total return. Excluding these proceeds, the Fund’s total return would have been 7.93%. |
| | 10 | Includes proceeds received from a settlement of litigation, which impacted the Fund’s total return. Excluding these proceeds, the Fund’s total return would have been (1.36)%. |
See Notes to Financial Statements.
| | | | | | |
| 36 | | BLACKROCK FUNDS | | MARCH 31, 2014 | | |
| | | | |
| Financial Highlights | | | BlackRock Small Cap Growth Equity Portfolio | |
| | | | | | | | | | | | | | | | | | | | | | | | | | | | | | | | | | | | | | | | | | | | | | | | |
| | | Institutional | | | Service | |
| | | Six Months
Ended
March 31,
2014 | | | Year Ended September 30, | | | Six Months
Ended
March 31,
2014 | | | Year Ended September 30, | |
| | | (Unaudited) | | | 2013 | | | 2012 | | | 2011 | | | 2010 | | | 2009 | | | (Unaudited) | | | 2013 | | | 2012 | | | 2011 | | | 2010 | | | 2009 | |
| Per Share Operating Performance | | | | | | | | | | | | | | | | | | | | | | | | | | | | | | | | | | | | | | | | | | | | | | | | |
Net asset value, beginning of period | | $ | 29.86 | | | $ | 26.67 | | | $ | 20.09 | | | $ | 20.42 | | | $ | 18.66 | | | $ | 20.33 | | | $ | 27.81 | | | $ | 25.01 | | | $ | 18.93 | | | $ | 19.29 | | | $ | 17.67 | | | $ | 19.30 | |
| | | | | | | | |
Net investment income (loss)1 | | | (0.04 | ) | | | 0.01 | | | | 0.04 | | | | (0.13 | ) | | | (0.12 | ) | | | (0.07 | ) | | | (0.07 | ) | | | (0.06 | ) | | | (0.04 | ) | | | (0.18 | ) | | | (0.16 | ) | | | (0.10 | ) |
Net realized and unrealized gain (loss) | | | 3.35 | | | | 5.90 | | | | 7.14 | | | | (0.20 | )2 | | | 1.88 | 2 | | | (1.60 | )2 | | | 3.09 | | | | 5.49 | | | | 6.72 | | | | (0.18 | )2 | | | 1.78 | 2 | | | (1.53 | )2 |
| | | | | | | | |
Net increase (decrease) from investment operations | | | 3.31 | | | | 5.91 | | | | 7.18 | | | | (0.33 | ) | | | 1.76 | | | | (1.67 | ) | | | 3.02 | | | | 5.43 | | | | 6.68 | | | | (0.36 | ) | | | 1.62 | | | | (1.63 | ) |
| | | | | | | | |
Dividends and distributions from: | | | | | | | | | | | | | | | | | | | | | | | | | | | | | | | | | | | | | | | | | | | | | | | | |
Net investment income | | | — | | | | (0.07 | )3 | | | — | | | | — | | | | — | | | | — | | | | — | | | | — | | | | — | | | | — | | | | — | | | | — | |
Net realized gain | | | (10.10 | ) | | | (2.65 | )3 | | | (0.60 | )3 | | | — | | | | — | | | | — | | | | (10.04 | ) | | | (2.63 | )3 | | | (0.60 | )3 | | | — | | | | — | | | | — | |
| | | | | | | | |
Total dividends and distributions | | | (10.10 | ) | | | (2.72 | ) | | | (0.60 | ) | | | — | | | | — | | | | — | | | | (10.04 | ) | | | (2.63 | ) | | | (0.60 | ) | | | — | | | | — | | | | — | |
| | | | | | | | |
Net asset value, end of period | | $ | 23.07 | | | $ | 29.86 | | | $ | 26.67 | | | $ | 20.09 | | | $ | 20.42 | | | $ | 18.66 | | | $ | 20.79 | | | $ | 27.81 | | | $ | 25.01 | | | $ | 18.93 | | | $ | 19.29 | | | $ | 17.67 | |
| | | | | | | | |
| | | | | | | | | | | | | | | | | | | | | | | | | | | | | | | | | | | | | | | | | | | | | | | | |
| Total Investment Return4 | | | | | | | | | | | | | | | | | | | | | | | | | | | | | | | | | | | | | | | | | | | | | | | | |
Based on net asset value | | | 12.76 | %5 | | | 25.36 | % | | | 36.16 | % | | | (1.62 | )%6,7 | | | 9.43 | %7 | | | (8.22 | )%7,8 | | | 12.62 | %5 | | | 24.96 | % | | | 35.72 | % | | | (1.87 | )%6,7 | | | 9.17 | %7 | | | (8.45 | )%7,9 |
| | | | | | | | |
| | | | | | | | | | | | | | | | | | | | | | | | | | | | | | | | | | | | | | | | | | | | | | | | |
| Ratios to Average Net Assets | | | | | | | | | | | | | | | | | | | | | | | | | | | | | | | | | | | | | | | | | | | | | | | | |
Total expenses | | | 0.90 | %10 | | | 0.82 | % | | | 0.82 | % | | | 0.80 | % | | | 0.83 | % | | | 0.88 | % | | | 1.11 | %10 | | | 1.12 | % | | | 1.20 | % | | | 1.07 | % | | | 1.10 | % | | | 1.15 | % |
| | | | | | | | |
Total expenses excluding recoupment of past waived fees | | | 0.90 | %10 | | | 0.82 | % | | | 0.82 | % | | | 0.80 | % | | | 0.83 | % | | | 0.88 | % | | | 1.11 | %10 | | | 1.12 | % | | | 1.20 | % | | | 1.07 | % | | | 1.10 | % | | | 1.14 | % |
| | | | | | | | |
Total expenses after fees waived, reimbursed and paid indirectly | | | 0.90 | %10 | | | 0.82 | % | | | 0.82 | % | | | 0.80 | % | | | 0.83 | % | | | 0.88 | % | | | 1.11 | %10 | | | 1.12 | % | | | 1.17 | % | | | 1.07 | % | | | 1.10 | % | | | 1.11 | % |
| | | | | | | | |
Net investment income (loss) | | | (0.28 | )%10 | | | 0.06 | % | | | 0.15 | % | | | (0.55 | )% | | | (0.59 | )% | | | (0.48 | )% | | | (0.57 | )%10 | | | (0.25 | )% | | | (0.15 | )% | | | (0.81 | )% | | | (0.86 | )% | | | (0.70 | )% |
| | | | | | | | |
| | | | | | | | | | | | | | | | | | | | | | | | | | | | | | | | | | | | | | | | | | | | | | | | |
| Supplemental Data | | | | | | | | | | | | | | | | | | | | | | | | | | | | | | | | | | | | | | | | | | | | | | | | |
Net assets, end of period (000) | | $ | 451,265 | | | $ | 862,261 | | | $ | 979,582 | | | $ | 931,857 | | | $ | 806,461 | | | $ | 855,375 | | | $ | 26,005 | | | $ | 24,792 | | | $ | 29,281 | | | $ | 23,683 | | | $ | 47,917 | | | $ | 43,932 | |
| | | | | | | | |
Portfolio turnover | | | 52 | % | | | 175 | % | | | 147 | % | | | 141 | % | | | 128 | % | | | 82 | % | | | 52 | % | | | 175 | % | | | 147 | % | | | 141 | % | | | 128 | % | | | 82 | % |
| | | | | | | | |
| | 1 | Based on average shares outstanding. |
| | 2 | Includes redemption fees, which are less than $0.005 per share. |
| | 3 | Determined in accordance with federal income tax regulations. |
| | 4 | Where applicable, assumes the reinvestment of dividends and distributions. |
| | 5 | Aggregate total investment return. |
| | 6 | Includes proceeds received from a settlement of litigation, which had no impact on the Fund’s total return. |
| | 7 | Redemption fee of 2.00% is reflected in total return calculations. There was no impact to the return. |
| | 8 | Includes proceeds received from a settlement of litigation, which impacted the Fund’s total return. Excluding these proceeds, the Fund’s total return would have been (8.26)%. |
| | 9 | Includes proceeds received from a settlement of litigation, which impacted the Fund’s total return. Excluding these proceeds, the Fund’s total return would have been (8.50)%. |
See Notes to Financial Statements.
| | | | | | |
| | | BLACKROCK FUNDS | | MARCH 31, 2014 | | 37 |
| | | | |
| Financial Highlights (continued) | | | BlackRock Small Cap Growth Equity Portfolio | |
| | | | | | | | | | | | | | | | | | | | | | | | | | | | | | | | | | | | | | | | | | | | | | | | |
| | | Investor A | | | Investor B | |
| | | Six Months
Ended
March 31, | | | Year Ended September 30, | | | Six Months
Ended
March 31, | | | Year Ended September 30, | |
| | | 2014 | | | | | | | | | | | | | | | | | | 2014 | | | | | | | | | | | | | | | | |
| | | (Unaudited) | | | 2013 | | | 2012 | | | 2011 | | | 2010 | | | 2009 | | | (Unaudited) | | | 2013 | | | 2012 | | | 2011 | | | 2010 | | | 2009 | |
| Per Share Operating Performance | | | | | | | | | | | | | | | | | | | | | | | | | | | | | | | | | | | | | | | | | | | | | | | | |
Net asset value, beginning of period | | $ | 26.75 | | | $ | 24.17 | | | $ | 18.31 | | | $ | 18.69 | | | $ | 17.14 | | | $ | 18.76 | | | $ | 22.34 | | | $ | 20.50 | | | $ | 15.75 | | | $ | 16.20 | | | $ | 15.00 | | | $ | 16.56 | |
| | | | | | | | |
Net investment loss1 | | | (0.07 | ) | | | (0.06 | ) | | | (0.04 | ) | | | (0.21 | ) | | | (0.18 | ) | | | (0.13 | ) | | | (0.13 | ) | | | (0.21 | ) | | | (0.21 | ) | | | (0.32 | ) | | | (0.30 | ) | | | (0.21 | ) |
Net realized and unrealized gain (loss) | | | 2.96 | | | | 5.27 | | | | 6.50 | | | | (0.17 | )2 | | | 1.73 | 2 | | | (1.49 | )2 | | | 2.39 | | | | 4.41 | | | | 5.56 | | | | (0.13 | )2 | | | 1.50 | 2 | | | (1.35 | )2 |
| | | | | | | | |
Net increase (decrease) from investment operations | | | 2.89 | | | | 5.21 | | | | 6.46 | | | | (0.38 | ) | | | 1.55 | | | | (1.62 | ) | | | 2.26 | | | | 4.20 | | | | 5.35 | | | | (0.45 | ) | | | 1.20 | | | | (1.56 | ) |
| | | | | | | | |
Distributions from net realized gain | | | (10.03 | ) | | | (2.63 | )3 | | | (0.60 | )3 | | | — | | | | — | | | | — | | | | (9.87 | ) | | | (2.36 | )3 | | | (0.60 | )3 | | | — | | | | — | | | | — | |
| | | | | | | | |
Net asset value, end of period | | $ | 19.61 | | | $ | 26.75 | | | $ | 24.17 | | | $ | 18.31 | | | $ | 18.69 | | | $ | 17.14 | | | $ | 14.73 | | | $ | 22.34 | | | $ | 20.50 | | | $ | 15.75 | | | $ | 16.20 | | | $ | 15.00 | |
| | | | | | | | |
| | | | | | | | | | | | | | | | | | | | | | | | | | | | | | | | | | | | | | | | | | | | | | | | |
| Total Investment Return4 | | | | | | | | | | | | | | | | | | | | | | | | | | | | | | | | | | | | | | | | | | | | | | | | |
Based on net asset value | | | 12.62 | %5 | | | 24.91 | % | | | 35.73 | % | | | (2.03 | )%6,7 | | | 9.04 | %7 | | | (8.64 | )%7,8 | | | 12.15 | %5 | | | 23.92 | % | | | 34.46 | % | | | (2.78 | )%6,7 | | | 8.00 | %7 | | | (9.42 | )%7,9 |
| | | | | | | | |
| | | | | | | | | | | | | | | | | | | | | | | | | | | | | | | | | | | | | | | | | | | | | | | | |
| Ratios to Average Net Assets | | | | | | | | | | | | | | | | | | | | | | | | | | | | | | | | | | | | | | | | | | | | | | | | |
Total expenses | | | 1.15 | %10 | | | 1.14 | % | | | 1.17 | % | | | 1.18 | % | | | 1.22 | % | | | 1.33 | % | | | 1.99 | %10 | | | 1.98 | % | | | 2.07 | % | | | 1.96 | % | | | 2.19 | % | | | 2.30 | % |
| | | | | | | | |
Total expenses excluding recoupment of past waived fees | | | 1.15 | %10 | | | 1.14 | % | | | 1.17 | % | | | 1.18 | % | | | 1.22 | % | | | 1.33 | % | | | 1.99 | %10 | | | 1.98 | % | | | 2.07 | % | | | 1.96 | % | | | 2.07 | % | | | 2.20 | % |
| | | | | | | | |
Total expenses after fees waived, reimbursed and paid indirectly | | | 1.15 | %10 | | | 1.14 | % | | | 1.17 | % | | | 1.18 | % | | | 1.22 | % | | | 1.33 | % | | | 1.99 | %10 | | | 1.98 | % | | | 2.07 | % | | | 1.96 | % | | | 2.19 | % | | | 2.20 | % |
| | | | | | | | |
Net investment loss | | | (0.61 | )%10 | | | (0.25 | )% | | | (0.18 | )% | | | (0.94 | )% | | | (0.98 | )% | | | (0.92 | )% | | | (1.43 | )%10 | | | (1.08 | )% | | | (1.12 | )% | | | (1.72 | )% | | | (1.94 | )% | | | (1.72 | )% |
| | | | | | | | |
| | | | | | | | | | | | | | | | | | | | | | | | | | | | | | | | | | | | | | | | | | | | | | | | |
| Supplemental Data | | | | | | | | | | | | | | | | | | | | | | | | | | | | | | | | | | | | | | | | | | | | | | | | |
Net assets, end of period (000) | | $ | 333,802 | | | $ | 332,978 | | | $ | 352,073 | | | $ | 235,400 | | | $ | 269,080 | | | $ | 240,361 | | | $ | 1,070 | | | $ | 1,265 | | | $ | 1,506 | | | $ | 1,687 | | | $ | 2,369 | | | $ | 3,327 | |
| | | | | | | | |
Portfolio turnover | | | 52 | % | | | 175 | % | | | 147 | % | | | 141 | % | | | 128 | % | | | 82 | % | | | 52 | % | | | 175 | % | | | 147 | % | | | 141 | % | | | 128 | % | | | 82 | % |
| | | | | | | | |
| | 1 | Based on average shares outstanding. |
| | 2 | Includes redemption fees, which are less than $0.005 per share. |
| | 3 | Determined in accordance with federal income tax regulations. |
| | 4 | Where applicable, excludes the effects of any sales charges and assumes the reinvestment of dividends and distributions. |
| | 5 | Aggregate total investment return. |
| | 6 | Includes proceeds received from a settlement of litigation, which had no impact on the Fund’s total return. |
| | 7 | Redemption fee of 2.00% is reflected in total return calculations. There was no impact to the return. |
| | 8 | Includes proceeds received from a settlement of litigation, which impacted the Fund’s total return. Excluding these proceeds, the Fund’s total return would have been (8.69)%. |
| | 9 | Includes proceeds received from a settlement of litigation, which impacted the Fund’s total return. Excluding these proceeds, the Fund’s total return would have been (9.48)%. |
See Notes to Financial Statements.
| | | | | | |
| 38 | | BLACKROCK FUNDS | | MARCH 31, 2014 | | |
| | | | |
| Financial Highlights (concluded) | | | BlackRock Small Cap Growth Equity Portfolio | |
| | | | | | | | | | | | | | | | | | | | | | | | |
| | | Investor C | |
| | | Six Months Ended March 31, 2014 (Unaudited) | | | Year Ended September 30, | |
| | | | 2013 | | | 2012 | | | 2011 | | | 2010 | | | 2009 | |
| Per Share Operating Performance | | | | | | | | | | | | | | | | | | | | | | | | |
Net asset value, beginning of period | | $ | 22.23 | | | $ | 20.50 | | | $ | 15.73 | | | $ | 16.19 | | | $ | 14.99 | | | $ | 16.56 | |
| | | | |
Net investment loss1 | | | (0.12 | ) | | | (0.21 | ) | | | (0.19 | ) | | | (0.35 | ) | | | (0.30 | ) | | | (0.22 | ) |
Net realized and unrealized gain (loss) | | | 2.38 | | | | 4.38 | | | | 5.56 | | | | (0.11 | )2 | | | 1.50 | 2 | | | (1.35 | )2 |
| | | | |
Net increase (decrease) from investment operations | | | 2.26 | | | | 4.17 | | | | 5.37 | | | | (0.46 | ) | | | 1.20 | | | | (1.57 | ) |
| | | | |
Distributions from net realized gain | | | (9.92 | ) | | | (2.44 | )3 | | | (0.60 | )3 | | | — | | | | — | | | | — | |
| | | | |
Net asset value, end of period | | $ | 14.57 | | | $ | 22.23 | | | $ | 20.50 | | | $ | 15.73 | | | $ | 16.19 | | | $ | 14.99 | |
| | | | |
| | | | | | | | | | | | | | | | | | | | | | | | |
| Total Investment Return4 | | | | | | | | | | | | | | | | | | | | | | | | |
Based on net asset value | | | 12.20 | %5 | | | 23.91 | % | | | 34.63 | % | | | (2.84 | )%6,7 | | | 8.01 | %7 | | | (9.48 | )%7,8 |
| | | | |
| | | | | | | | | | | | | | | | | | | | | | | | |
| Ratios to Average Net Assets | | | | | | | | | | | | | | | | | | | | | | | | |
Total expenses | | | 1.90 | %9 | | | 1.95 | % | | | 1.99 | % | | | 2.08 | % | | | 2.19 | % | | | 2.31 | % |
| | | | |
Total expenses excluding recoupment of past waived fees | | | 1.90 | %9 | | | 1.95 | % | | | 1.99 | % | | | 2.05 | % | | | 2.13 | % | | | 2.29 | % |
| | | | |
Total expenses after fees waived, reimbursed and paid indirectly | | | 1.90 | %9 | | | 1.95 | % | | | 1.99 | % | | | 2.07 | % | | | 2.16 | % | | | 2.22 | % |
| | | | |
Net investment loss | | | (1.37 | )%9 | | | (1.06 | )% | | | (0.99 | )% | | | (1.83 | )% | | | (1.92 | )% | | | (1.81 | )% |
| | | | |
| | | | | | | | | | | | | | | | | | | | | | | | |
| Supplemental Data | | | | | | | | | | | | | | | | | | | | | | | | |
Net assets, end of period (000) | | $ | 36,047 | | | $ | 33,193 | | | $ | 28,787 | | | $ | 23,947 | | | $ | 33,219 | | | $ | 25,915 | |
| | | | |
Portfolio turnover | | | 52 | % | | | 175 | % | | | 147 | % | | | 141 | % | | | 128 | % | | | 82 | % |
| | | | |
| | 1 | Based on average shares outstanding. |
| | 2 | Includes redemption fees, which are less than $0.005 per share. |
| | 3 | Determined in accordance with federal income tax regulations. |
| | 4 | Where applicable, excludes the effects of any sales charges and assumes the reinvestment of dividends and distributions. |
| | 5 | Aggregate total investment return. |
| | 6 | Includes proceeds received from a settlement of litigation, which had no impact on the Fund’s total return. |
| | 7 | Redemption fee of 2.00% is reflected in total return calculations. There was no impact to the return. |
| | 8 | Includes proceeds received from a settlement of litigation, which impacted the Fund’s total return. Excluding these proceeds, the Fund’s total return would have been (9.54)%. |
See Notes to Financial Statements.
| | | | | | |
| | | BLACKROCK FUNDS | | MARCH 31, 2014 | | 39 |
| | |
| Notes to Financial Statements (Unaudited) | | |
1. Organization:
BlackRock FundsSM (the “Trust”) is registered under the Investment Company Act of 1940, as amended (the “1940 Act”), as an open-end management investment company. The Trust is organized as a Massa-chusetts business trust. BlackRock Flexible Equity Fund (“Flexible Equity”), BlackRock Mid-Cap Growth Equity Portfolio (“Mid-Cap Growth Equity”) and BlackRock Small Cap Growth Equity Portfolio (“Small Cap Growth Equity”) (collectively, the “Funds” or individually, a “Fund”) are each a series of the Trust. The Funds are classified as diversified. Each Fund offers multiple classes of shares. Institutional and Service Shares are sold without a sales charge and only to certain eligible investors. Investor A Shares are generally sold with an initial sales charge, but may be subject to a CDSC for certain redemptions where no initial sales charge was paid at the time of purchase. Investor B and Investor C Shares may be subject to a CDSC. Class R Shares are sold without a sales charge and only to certain employer-sponsored retirement plans. All classes of shares have identical voting, dividend, liquidation and other rights and are subject to the same terms and conditions, except that Service, Investor A, Investor B, Investor C and Class R Shares bear certain expenses related to the shareholder servicing of such shares, and Investor B, Investor C and Class R Shares also bear certain expenses related to the distribution of such shares. Investor B Shares automatically convert to Investor A Shares after approximately eight years. Investor B Shares are only available through exchanges and dividend reinvestments by existing shareholders and for purchase by certain employer-sponsored retirement plans. Each class has exclusive voting rights with respect to matters relating to its shareholder servicing and distribution expenditures (except that Investor B shareholders may vote on material changes to the Investor A distribution and service plan).
Basis of Consolidation: The accompanying consolidated financial statements of Flexible Equity include the accounts of BlackRock Flexible Equity Fund Subsidiary, Ltd. (the “Subsidiary”), which is a wholly owned subsidiary of Flexible Equity, and primarily invests in commodity-related instruments. The Subsidiary enables Flexible Equity to hold these commodity-related instruments and satisfy regulated investment company tax requirements. Flexible Equity may invest up to 25% of its total assets in the Subsidiary. Intercompany accounts and transactions, if any, have been eliminated. The Subsidiary is subject to the same investment policies and restrictions that apply to Flexible Equity, except that the Subsidiary may invest without limitation in commodity-related instruments.
The Funds, together with certain other registered investment companies advised by the Manager or its affiliates, are included in a complex of open-end funds referred to as the Equity-Liquidity Complex.
2. Significant Accounting Policies:
The Funds’ financial statements are prepared in conformity with accounting principles generally accepted in the United States of America (“U.S. GAAP”), which may require management to make estimates and assumptions that affect the reported amounts of assets and liabilities in the financial statements and the reported amounts of increases and decreases in net assets from operations during the reporting period. Actual results could differ from those estimates. The following is a summary of significant accounting policies followed by the Funds:
Valuation: U.S. GAAP defines fair value as the price the Funds would receive to sell an asset or pay to transfer a liability in an orderly transaction between market participants at the measurement date. The Funds determine the fair values of their financial instruments at market value using independent dealers or pricing services under policies approved by the Board of Trustees of the Trust (the “Board”). The BlackRock Global Valuation Methodologies Committee (the “Global Valuation Committee”) is the committee formed by management to develop global pricing policies and procedures and to provide oversight of the pricing function for the Funds for all financial instruments.
Equity investments traded on a recognized securities exchange or the NASDAQ Stock Market (“NASDAQ”) are valued at the last reported sale price that day or the NASDAQ official closing price, if applicable. For equity investments traded on more than one exchange, the last reported sale price on the exchange where the stock is primarily traded is used. Equity investments traded on a recognized exchange for which there were no sales on that day are valued at the last available bid (long positions) or ask (short positions) price. Financial futures contracts traded on exchanges are valued at their last sale price. Swap agreements are valued utilizing quotes received daily by the Fund’s pricing service or through brokers, which are derived using daily swap curves and models that incorporate a number of market data factors, such as discounted cash flows, trades and values of the underlying reference instruments. Investments in open-end registered investment companies are valued at NAV each business day.
Securities and other assets and liabilities denominated in foreign currencies are translated into U.S. dollars using exchange rates determined as of the close of business on the New York Stock Exchange (“NYSE”). Foreign currency exchange contracts are valued at the mean between the bid and ask prices and are determined as of the close of business on the NYSE. Interpolated values are derived when the settlement date of the contract is an interim date for which quotations are not available.
Exchange-traded options are valued at the mean between the last bid and ask prices at the close of the options market in which the options trade. An exchange-traded option for which there is no mean price is valued at the last bid (long positions) or ask (short positions) price. If no bid or ask price is available, the prior day’s price will be used, unless it is determined that the prior day’s price no longer reflects the fair value of the option. Over-the-counter (“OTC”) options are valued by an independent pricing service using a mathematical model, which incorporates a number of market data factors, such as the trades and prices of the underlying instruments.
The Funds value their investments in BlackRock Liquidity Series, LLC, Money Market Series (the “Money Market Series”) at fair value, which is ordinarily based upon their pro rata ownership in the underlying fund’s net assets. The Money Market Series seeks current income consistent with maintaining liquidity and preserving capital. Although the Money Market Series is not registered under the 1940 Act, its investments will follow the parameters of investments by a money market fund that is subject to Rule 2a-7 under the 1940 Act. Each Fund may withdraw up to 25% of its investment daily, although the manager of the Money Market
| | | | | | |
| 40 | | BLACKROCK FUNDS | | MARCH 31, 2014 | | |
| | |
| Notes to Financial Statements (continued) | | |
Series, in its sole discretion, may permit an investor to withdraw more than 25% on any one day.
In the event that the application of these methods of valuation results in a price for an investment that is deemed not to be representative of the market value of such investment, or if a price is not available, the investment will be valued by the Global Valuation Committee, or its delegate, in accordance with a policy approved by the Board as reflecting fair value (“Fair Value Assets”). When determining the price for Fair Value Assets, the Global Valuation Committee, or its delegate, seeks to determine the price that each Fund might reasonably expect to receive from the current sale of that asset in an arm’s-length transaction. Fair value determinations shall be based upon all available factors that the Global Valuation Committee, or its delegate, deems relevant consistent with the principles of fair value measurement, which include the market approach, income approach and/or in the case of recent investments, the cost approach, as appropriate. The market approach generally consists of using comparable market transactions. The income approach generally is used to discount future cash flows to present value and is adjusted for liquidity as appropriate. These factors include but are not limited to: (i) attributes specific to the investment or asset; (ii) the principal market for the investment or asset; (iii) the customary participants in the principal market for the investment or asset; (iv) data assumptions by market participants for the investment or asset, if reasonably available; (v) quoted prices for similar investments or assets in active markets; and (vi) other factors, such as future cash flows, interest rates, yield curves, volatilities, prepayment speeds, loss severities, credit risks, recovery rates, liquidation amounts and/or default rates. Due to the inherent uncertainty of valuations of such investments, the fair values may differ from the values that would have been used had an active market existed. The Global Valuation Committee, or its delegate, employs various methods for calibrating valuation approaches for investments where an active market does not exist, including regular due diligence of the Funds’ pricing vendors, regular reviews of key inputs and assumptions, transactional back-testing or disposition analysis to compare unrealized gains and losses to realized gains and losses, reviews of missing or stale prices and large movements in market values and reviews of any market related activity. The pricing of all Fair Value Assets is subsequently reported to the Board or a committee thereof on a quarterly basis.
Generally, trading in foreign instruments is substantially completed each day at various times prior to the close of business on the NYSE. Occasionally, events affecting the values of such instruments may occur between the foreign market close and the close of business on the NYSE that may not be reflected in the computation of each Fund’s net assets. If events (e.g., a company announcement, market volatility or a natural disaster) occur during such periods that are expected to materially affect the value of such instruments, those instruments may be Fair Value Assets and valued at their fair value, as determined in good faith by the Global Valuation Committee, or its delegate, using a pricing service and/or policies approved by the Board. Each business day, the Funds use a pricing service to assist with the valuation of certain foreign exchange-traded equity securities and foreign exchange-traded and OTC options (the “Systematic Fair Value Price”). Using current market factors, the Systematic Fair Value Price is designed to value such foreign securities
and foreign options at fair value as of the close of business on the NYSE, which follows the close of the local markets.
Foreign Currency: The Funds’ books and records are maintained in U.S. dollars. Purchases and sales of investment securities are recorded at the rates of exchange prevailing on the respective date of such transactions. Generally, when the U.S. dollar rises in value against a foreign currency, the Funds’ investments denominated in that currency will lose value because that currency is worth fewer U.S. dollars; the opposite effect occurs if the U.S. dollar falls in relative value.
The Funds do not isolate the portion of the results of operations arising as a result of changes in the foreign exchange rates from the changes in the market prices of investments held or sold for financial reporting purposes. Accordingly, the effects of changes in foreign currency exchange rates on investments are not segregated in the Statements of Operations from the effects of changes in market prices of those investments but are included as a component of net realized and unrealized gain (loss) from investments. The Funds report realized currency gains (losses) on foreign currency related transactions as components of net realized gain (loss) for financial reporting purposes, whereas such components are generally treated as ordinary income for federal income tax purposes.
Segregation and Collateralization: In cases where a Fund enters into certain investments (e.g., financial futures contracts, forward foreign currency exchange contracts, options written, and swaps), that would be “senior securities” for 1940 Act purposes, such Fund may segregate or designate on its books and records cash or liquid securities having a market value at least equal to the amount of a Fund’s future obligations under such investments. Doing so allows the investment to be excluded from treatment as a “senior security.” Furthermore, if required by an exchange or counterparty agreement, the Fund may be required to deliver/deposit cash and/or securities to/with an exchange, or broker-dealer or custodian as collateral for certain investments or obligations.
Investment Transactions and Investment Income: For financial reporting purposes, investment transactions are recorded on the dates the transactions are entered into (the trade dates). Realized gains and losses on investment transactions are determined on the identified cost basis. Dividend income is recorded on the ex-dividend date. Dividends from foreign securities where the ex-dividend date may have passed are subsequently recorded when the Funds are informed of the ex-dividend date. Under the applicable foreign tax laws, a withholding tax at various rates may be imposed on capital gains, dividends and interest. Upon notification from issuers, some of the dividend income received from a real estate investment trust may be redesignated as a reduction of cost of the related investment and/or realized gain. Income, expenses and realized and unrealized gains and losses are allocated daily to each class based on its relative net assets.
Dividends and Distributions: Dividends and distributions paid by the Funds are recorded on the ex-dividend date. The character and timing of dividends and distributions are determined in accordance with federal income tax regulations, which may differ from U.S. GAAP.
Net income and realized gains from investments held by the Subsidiary are treated as ordinary income for tax purposes. Accordingly, the net
| | | | | | |
| | | BLACKROCK FUNDS | | MARCH 31, 2014 | | 41 |
| | |
| Notes to Financial Statements (continued) | | |
investment income (loss) and realized gains (losses) reported in the Fund’s financial statements presented under US GAAP for such investments held by the Subsidiary may differ significantly from income dividends and capital gain distributions. As such, any net gain will pass through to the Fund as ordinary income for federal income tax purposes. If a net loss is realized by the Subsidiary in any taxable year, the loss will generally not be available to offset the Fund’s ordinary income and/or capital gains for that year.
Income Taxes: It is the Funds’ policy to comply with the requirements of the Internal Revenue Code of 1986, as amended, applicable to regulated investment companies, and to distribute substantially all of their taxable income to their shareholders. Therefore, no federal income tax provision is required, except with respect to any taxes related to the Subsidiaries.
The Funds file U.S. federal and various state and local tax returns. No income tax returns are currently under examination. The statute of limitations on the Funds’ U.S. federal tax returns remains open for each of the four years ended September 30, 2013. The statutes of limitations on each Fund’s state and local tax returns may remain open for an additional year depending upon the jurisdiction.
Management has analyzed tax laws and regulations and their application to the Funds’ facts and circumstances and does not believe there are any uncertain tax positions that require recognition of a tax liability.
Other: Expenses directly related to a Fund or its classes are charged to that Funds or class. Other operating expenses shared by several funds are pro rated among those funds on the basis of relative net assets or other appropriate methods. Expenses directly related to the Fund and other shared expenses pro rated to the Fund are allocated daily to each class based on its relative net assets or other appropriate methods.
The Funds have an arrangement with the custodian whereby fees may be reduced by credits earned on uninvested cash balances, which, if applicable, are shown as fees paid indirectly in the Statements of Operations. The custodian imposes fees on overdrawn cash balances, which can be offset by accumulated credits earned or may result in additional custody charges.
3. Securities and Other Investments:
Participation Notes: Flexible Equity may invest in participation notes (“P-Notes”). P-Notes are promissory notes issued by banks or broker-dealers that are designed to offer Flexible Equity a return measured by the change in the value of the underlying security or basket of securities (the“underlying security”) while not holding the actual shares of the underlying security. P-Notes are typically used to allow Flexible Equity to gain exposure to securities traded in foreign markets that may be restricted due to country-specific regulations. When the P-Note matures, the issuer will pay to, or receive from, Flexible Equity the difference between the value of the underlying security at the time of the purchase and the underlying security’s value at maturity of the P-Notes. Income received on P-Notes is recorded by Flexible Equity as dividend income in the Statements of Operations. An investment in a P-Note involves additional risks beyond the risks normally associated with a direct investment
in the underlying security. While the holder of a P-Note is entitled to receive from the bank or broker-dealer any dividends paid by the underlying security, the holder is not entitled to the same rights (e.g., voting rights) as a direct owner of the underlying security. P-Notes are considered general unsecured contractual obligations of the bank or broker-dealer. Flexible Equity must rely on the creditworthiness of the issuer for its investment returns on the P-Notes and has no rights against the issuer of the underlying security. A P-Note may be more volatile and less liquid than other investments held by Flexible Equity since the P-Note generally is dependent on the liquidity in the local trading market for the underlying security.
Securities Lending: Each Fund may lend its securities to approved borrowers, such as brokers, dealers and other financial institutions. The borrower pledges collateral consisting of cash, an irrevocable letter of credit issued by a bank, or securities issued or guaranteed by the U.S. government. The initial collateral received by each Fund is required to have a value of at least 102% of the current value of the loaned securities for securities traded on U.S. exchanges and a value of at least 105% for all other securities. The collateral is maintained thereafter, at a value equal to at least 100% of the current market value of the securities on loan. The market value of the loaned securities is determined at the close of each business day of the Fund and any additional required collateral is delivered to the Fund on the next business day. During the term of the loan, each Fund earns dividend or interest income on the securities loaned but does not receive interest income on the securities received as collateral. Loans of securities are terminable at any time and the borrower, after notice, is required to return borrowed securities within the standard time period for settlement of securities transactions.
The market value of securities on loan and the value of the related collateral are shown separately in the Statements of Assets and Liabilities as a component of investments at value, and collateral on securities loaned at value, respectively. As of March 31, 2014, any securities on loan were collateralized by cash. The cash collateral invested by the securities lending agent, BlackRock Investment Management, LLC (“BIM”), if any, is disclosed in the Schedules of Investments.
Securities lending transactions are entered into by the Funds under Master Securities Lending Agreements (each, an “MSLA”) which provide the right, in the event of default (including bankruptcy or insolvency), for the non-defaulting party to liquidate the collateral and calculate a net exposure to the defaulting party or request additional collateral. In the event that a borrower defaults, each Fund, as lender, would offset the market value of the collateral received against the market value of the securities loaned. The value of the collateral is typically greater than that of the market value of the securities loaned, leaving the lender with a net amount payable to the defaulting party. However, bankruptcy or insolvency laws of a particular jurisdiction may impose restrictions on or prohibitions against such a right of offset in the event of an MSLA counterparty’s bankruptcy or insolvency. Under the MSLA, the borrower can resell or re-pledge the loaned securities, and the Funds can reinvest cash collateral, or, upon an event of default, resell or re-pledge the collateral.
| | | | | | |
| 42 | | BLACKROCK FUNDS | | MARCH 31, 2014 | | |
| | |
| Notes to Financial Statements (continued) | | |
The following table is a summary of the Funds’ securities lending agreements by counterparty which are subject to offset under an MSLA as of March 31, 2014:
| | | | | | | | | | | | |
| Mid-Cap Growth Equity | | | | | | |
| Counterparty | | Securities Loaned at Value | | | Cash Collateral Received1 | | | Net Amount | |
Credit Suisse Securities (USA) LLC | | $ | 3,208,899 | | | $ | (3,208,899 | ) | | | — | |
Deutsche Bank Securities, Inc. | | | 54,799 | | | | (54,799 | ) | | | — | |
Goldman Sachs & Co. | | | 6,121,168 | | | | (6,121,168 | ) | | | — | |
JP Morgan Securities LLC | | | 438,388 | | | | (438,388 | ) | | | — | |
Merrill Lynch, Pierce, Fenner & Smith, Inc. | | | 438,388 | | | | (438,388 | ) | | | — | |
| | | | |
Total | | $ | 10,261,642 | | | $ | (10,261,642 | ) | | | — | |
| | | | |
| | 1 | Excess of collateral received from the individual counterparty is not shown for financial reporting purposes. Collateral with a value of $10,457,192 has been received in connection with securities lending agreements. |
| | | | | | | | | | | | |
| Small Cap Growth Equity | | | | | | |
| Counterparty | | Securities Loaned at Value | | | Cash Collateral Received1 | | | Net Amount2 | |
Barclays Capital Inc. | | $ | 3,227,133 | | | $ | (3,227,133 | ) | | | — | |
Citigroup Global Markets, Inc. | | | 12,934,056 | | | | (12,907,175 | ) | | $ | 26,881 | |
Deutsche Bank Securities, Inc. | | | 90 | | | | (90 | ) | | | — | |
Goldman Sachs & Co. | | | 6,722,197 | | | | (6,628,649 | ) | | | 93,548 | |
JP Morgan Securities LLC | | | 2,107,784 | | | | (2,107,784 | ) | | | — | |
Morgan Stanley | | | 10,680,682 | | | | (10,680,682 | ) | | | — | |
UBS Securities LLC | | | 16,939,108 | | | | (16,792,333 | ) | | | 146,775 | |
| | | | |
Total | | $ | 52,611,050 | | | $ | (52,343,846 | ) | | $ | 120,429 | |
| | | | |
| | 1 | Excess of collateral received from the individual counterparty is not shown for financial reporting purposes. Collateral with a value of $52,750,304 has been received in connection with securities lending agreements. |
| | 2 | The market value of the loaned securities is determined as of March 31,2014. Additional collateral is delivered to the Fund on the next business day in accordance with the MSLA. The net amount would be subject to the borrower default indemnity in the event of default by the counterparty. |
The risks of securities lending include the risk that the borrower may not provide additional collateral when required or may not return the securities when due. To mitigate these risks, the Fund benefits from a borrower default indemnity provided by BIM. BIM’s indemnity allows for full replacement of the securities lent. Each Fund could suffer a loss if the value of an investment purchased with cash collateral falls below the market value of loaned securities or if the value of an investment purchased with cash collateral falls below the value of the original cash collateral received.
4. Derivative Financial Instruments:
The Funds engage in various portfolio investment strategies using derivative contracts both to increase the returns of the Funds and/or to economically hedge, or protect, their exposure to certain risks such as equity risk or foreign currency exchange rate risk. These contracts may be transacted on an exchange or OTC.
Financial Futures Contracts: Flexible Equity and Small Cap Growth Equity purchase and/or sell financial futures contracts and options on financial future contracts to gain exposure to, or economically hedge against, changes in the value of equity securities (equity risk) or foreign currencies (foreign currency exchange rate risk). Financial futures contracts are agreements between the Funds and a counterparty to buy or
sell a specific quantity of an underlying instrument at a specified price and at a specified date. Depending on the terms of the particular contract, financial futures contracts are settled either through physical delivery of the underlying instrument on the settlement date or by payment of a cash settlement amount on the settlement date.
Upon entering into a financial futures contract, Flexible Equity and Small Cap Growth Equity are required to deposit initial margin with the broker in the form of cash or securities in an amount that varies depending on a contract’s size and risk profile. The initial margin deposit must then be maintained at an established level over the life of the contract. Securities deposited as initial margin are designated on the Schedule of Investments and cash deposited, if any, is recorded on the Statements of Assets and Liabilities as cash pledged for financial futures contracts. Pursuant to the contract, Flexible Equity and Small Cap Growth Equity agree to receive from or pay to the broker an amount of cash equal to the daily fluctuation in value of the contract. Such receipts or payments are known as variation margin. Variation margin is recorded by Flexible Equity and Small Cap Growth Equity as unrealized appreciation or depreciation; and, if applicable, as a receivable or payable for variation margin in the Statements of Assets and Liabilities.
When the contract is closed, Flexible Equity and Small Cap Growth Equity record a realized gain or loss equal to the difference between the value of the contract at the time it was opened and the value at the time it was closed. The use of financial futures contracts involves the risk of an imperfect correlation in the movements in the price of financial futures contracts, interest or foreign currency exchange rates and the underlying assets.
Forward Foreign Currency Exchange Contracts: Flexible Equity enters into forward foreign currency exchange contracts as an economic hedge against either specific transactions or portfolio instruments or to obtain exposure to, or hedge exposure away from, foreign currencies (foreign currency exchange rate risk). A forward foreign currency exchange contract is an agreement between two parties to buy and sell a currency at a set exchange rate on a future date. Forward foreign currency exchange contracts, when used by Flexible Equity, help to manage the overall exposure to the currencies in which some of the investments held by Flexible Equity are denominated. The contract is marked-to-market daily and the change in market value is recorded by Flexible Equity as an unrealized gain or loss. When the contract is closed, Flexible Equity records a realized gain or loss equal to the difference between the value at the time it was opened and the value at the time it was closed. The use of foreign currency exchange contracts involves the risk that the value of a forward foreign currency exchange contract changes unfavorably due to movements in the value of the referenced foreign currencies.
Options: Flexible Equity purchases and writes call and put options to increase or decrease their exposure to underlying instruments (including equity risk) and/or, in the case of options written, to generate gains from options premiums. A call option gives the purchaser (holder) of the option the right (but not the obligation) to buy, and obligates the seller (writer) to sell (when the option is exercised), the underlying instrument at the exercise or strike price at any time or at a specified time during
| | | | | | |
| | | BLACKROCK FUNDS | | MARCH 31, 2014 | | 43 |
| | |
| Notes to Financial Statements (continued) | | |
the option period. A put option gives the holder the right to sell and obligates the writer to buy the underlying instrument at the exercise or strike price at any time or at a specified time during the option period. When a Fund purchases (writes) an option, an amount equal to the premium paid (received) by a Fund is reflected as an asset (liability). The amount of the asset (liability) is subsequently marked-to-market to reflect the current market value of the option purchased (written). When an instrument is purchased or sold through an exercise of an option, the related premium paid (or received) is added to (or deducted from) the basis of the instrument acquired or deducted from (or added to) the proceeds of the instrument sold. When an option expires (or a Fund enters into a closing transaction), a Fund realizes a gain or loss on the option to the extent of the premiums received or paid (or gain or loss to the extent the cost of the closing transaction exceeds the premiums received or paid). When a Fund writes a call option, such option is “covered,” meaning that a Fund holds the underlying instrument subject to being called by the option counterparty. When a Fund writes a put option, such option is covered by cash in an amount sufficient to cover the obligation.
In purchasing and writing options, the Funds bear the risk of an unfavorable change in the value of the underlying instrument or the risk that the Funds may not be able to enter into a closing transaction due to an illiquid market. Exercise of a written option could result in the Funds purchasing or selling a security when it otherwise would not, or at a price different from the current market value.
Swaps: Flexible Equity enters into swap agreements, in which the Fund and a counterparty agree either to make periodic net payments on a specified notional amount or a net payment upon termination. Swap agreements are privately negotiated in the OTC market and may be entered into as a bilateral contract (“OTC swaps”) or centrally cleared (“centrally cleared swaps”). Swaps are marked-to-market daily and changes in value are recorded as unrealized appreciation (depreciation).
For OTC swaps, any upfront premiums paid are recorded as assets and any upfront fees received are recorded as liabilities and are shown as swap premiums paid and swap premiums received, respectively, in the Statements of Assets and Liabilities and amortized over the term of the OTC swap. Payments received or made by the Funds for OTC swaps are recorded in the Statements of Operations as realized gains or losses, respectively. When an OTC swap is terminated, the Funds will record a realized gain or loss equal to the difference between the proceeds from (or cost of) the closing transaction and the Funds’ basis in the contract, if any. Generally, the basis of the contracts is the premium received or paid.
In a centrally cleared swap, immediately following execution of the swap agreement, the swap agreement is novated to a central counterparty (the “CCP”) and the Fund’s counterparty on the swap agreement becomes the CCP. The Fund is required to interface with the CCP through a broker. Upon entering into a centrally cleared swap, the Funds are required to deposit initial margin with the broker in the form of cash or securities in an amount that varies depending on the size and risk profile of the particular swap. Securities deposited as initial margin are designated on the Schedule of Investments and cash deposited is recorded on the Statements of Assets and Liabilities as cash pledged for centrally
cleared swaps. The daily change in valuation of centrally cleared swaps is recorded as a receivable or payable for variation margin in the Statements of Assets and Liabilities. Payments received from (paid to) the counterparty, including at termination, are recorded as realized gain (loss) in the Statements of Operations.
Swap transactions involve, to varying degrees, elements of interest rate, credit and market risk in excess of the amounts recognized in the Statements of Assets and Liabilities. Such risks involve the possibility that there will be no liquid market for these agreements, that the counterparty to the agreements may default on its obligation to perform or disagree as to the meaning of the contractual terms in the agreements, and that there may be unfavorable changes in interest rates and/or market values associated with these transactions.
| Ÿ | | Total return swaps — Flexible Equity enters into total return swaps to obtain exposure to a security or market without owning such security or investing directly in that market or to transfer the risk/return of one market (e.g., fixed income) to another market (e.g., equity) (equity risk). Total return swaps are agreements in which there is an exchange of cash flows whereby one party commits to make payments based on the total return (coupons plus capital gains/losses) of an underlying instrument in exchange for fixed or floating rate interest payments. To the extent the total return of the instrument or index underlying the transaction exceeds or falls short of the offsetting interest rate obligation, the Funds will receive a payment from or make a payment to the counterparty. |
The following is a summary of the Funds’ derivative financial instruments categorized by risk exposure:
| | | | | | |
| Fair Values of Derivative Financial Instruments as of March 31, 2014 | |
| Derivative Assets | |
| | | | | Flexible Equity | |
| | | Statements of Assets and Liabilities Location | | Value | |
Foreign currency exchange contracts | | Unrealized
appreciation on forward
foreign currency
exchange contracts | | $ | 362,229 | |
Equity contracts | | Net unrealized
appreciation/depreciation1 ;
Unrealized appreciation
on OTC swaps1 ;
Investments at value —
unaffiliated2 ; | | $ | 4,423,140 | |
| | | | | | |
Total | | | | $ | 4,785,369 | |
| | | | | | |
| | | | | | | | | | |
| Derivative Liabilities | |
| | | | | Flexible Equity | | | Small Cap Growth Equity | |
| | | Statements of Assets and Liabilities Location | | | | | Value | |
Foreign currency exchange contracts | | Unrealized
depreciation on forward
foreign currency
exchange contracts | | $ | 1,102,593 | | | | — | |
Equity contracts | | Net unrealized
appreciation/depreciation1 ;
Options written at value | | | 380,361 | | | $ | 158,560 | |
| | | | | | |
Total | | | | $ | 1,482,954 | | | $ | 158,560 | |
| | | | | | |
| | 1 | Includes cumulative appreciation/depreciation on financial futures contracts as reported in the Schedules of Investments. Only current day’s variation margin is reported within the Statements of Assets and Liabilities. |
| | 2 | Includes options purchased at value as reported in the Schedule of Investments. |
| | | | | | |
| 44 | | BLACKROCK FUNDS | | MARCH 31, 2014 | | |
| | |
| Notes to Financial Statements (continued) | | |
| | | | | | | | |
The Effect of Derivative Financial Instruments in the Statements of Operations Six Months Ended March 31, 2014 | |
| Net Realized Gain (Loss) From | |
| | | Flexible Equity | | | Small Cap Growth Equity | |
Foreign currency exchange contracts: | | | | | | | | |
Foreign currency transactions | | $ | 1,668,890 | | | | — | |
Equity contracts: | | | | | | | | |
Financial futures contracts | | | (3,660,129 | ) | | $ | 2,052,048 | |
Swaps | | | (2,000,601 | ) | | | — | |
Options3 | | | (3,878,802 | ) | | | — | |
| | | | |
Total | | $ | (7,870,642 | ) | | $ | 2,052,048 | |
| | | | |
| | | | | | | | |
Net Change in Unrealized Appreciation/Depreciation on | |
| | | Flexible Equity | | | Small Cap Growth Equity | |
Foreign currency exchange contracts: | | | | | | | | |
Foreign currency translations | | $ | 1,579,769 | | | | — | |
Equity contracts: | | | | | | | | |
Financial futures contracts | | | 713,708 | | | $ | (321,252 | ) |
Swaps | | | 1,768,225 | | | | — | |
Options3 | | | 3,891,704 | | | | | |
| | | | |
Total | | $ | 7,953,406 | | | $ | (321,252 | ) |
| | | | |
| | 3 | Options purchased are included in the net realized gain (loss) from investments — unaffiliated and net change in unrealized appreciation/ depreciation on investments — unaffiliated. |
For the six months ended March 31, 2014, the average quarterly balances of outstanding derivative financial instruments were as follows:
| | | | | | | | |
| | | Flexible Equity | | | Small Cap Growth Equity | |
Financial futures contracts: | | | | | | | | |
Average number of contracts purchased | | | — | | | | 159 | |
Average notional value of contracts purchased | | | — | | | $ | 18,538,605 | |
Average number of contracts sold | | | 325 | | | | — | |
Average notional value of contracts sold | | $ | 37,880,805 | | | | — | |
Forward foreign currency exchange contracts: | | | | | | | | |
Average number of contracts - USD purchased | | | 5 | | | | — | |
Average number of contracts - USD sold | | | 4 | | | | — | |
Average USD amounts purchased | | $ | 106,392,083 | | | | — | |
Average USD amounts sold | | $ | 16,550,639 | | | | — | |
Options: | | | | | | | | |
Average number of option contracts purchased | | | 10,363 | | | | | |
Average number of option contracts written | | | 1,250 | | | | — | |
Average notional value of option contracts purchased | | $ | 58,594,131 | | | | — | |
Average notional value of option contracts written | | $ | 8,183,450 | | | | — | |
Total return swaps: | | | | | | | | |
Average number of contracts | | | 3 | | | | — | |
Average notional value | | $ | 18,495,446 | | | | — | |
Counterparty Credit Risk: A derivative contract may suffer a mark-to-market loss if the value of the contract decreases due to an unfavorable change in the market rates or values of the underlying instrument. Losses can also occur if the counterparty does not perform under the contract.
A Fund’s risk of loss from counterparty credit risk on OTC derivatives is generally limited to the aggregate unrealized gain netted against any collateral held by such Fund.
For OTC options purchased, each Fund bears the risk of loss of the amount of the premiums paid plus the positive change in market values net of any collateral held by such Fund should the counterparty fail to perform under the contracts. Options written by the Funds do not typically give rise to counterparty credit risk, as options written generally obligate the Funds, and not the counterparty, to perform.
With exchange-traded purchased options, futures and centrally cleared swaps, there is less counterparty credit risk to the Funds since the exchange or clearinghouse, as counterparty to such instruments, guarantees against a possible default. The clearinghouse stands between the buyer and the seller of the contract; therefore, the credit risk is limited to failure of the clearinghouse. While offset rights may exist under applicable law, a Fund does not have a contractual right of offset against a clearing broker or clearinghouse in the event of a default (including the bankruptcy or insolvency) of the clearing broker or clearinghouse. Additionally, credit risk exists in exchange-traded futures and centrally cleared swaps with respect to initial and variation margin that is held in a clearing broker’s customer accounts. While clearing brokers are required to segregate customer margin from their own assets, in the event that a clearing broker becomes insolvent or goes into bankruptcy and at that time there is a shortfall in the aggregate amount of margin held by the clearing broker for all its clients, typically the shortfall would be allocated on a pro rata basis across all the clearing broker’s customers, potentially resulting in losses to the Funds.
In order to better define its contractual rights and to secure rights that will help the Fund mitigate its counterparty risk, the Fund may enter into an International Swaps and Derivatives Association, Inc. Master Agreement (“ISDA Master Agreement”) or similar agreement with its derivative contract counterparties. An ISDA Master Agreement is a bilateral agreement between each Fund and a counterparty that governs certain OTC derivatives and typically contains, among other things, collateral posting terms and netting provisions in the event of a default and/or termination event. Under an ISDA Master Agreement, each Fund may, under certain circumstances, offset with the counterparty certain derivative financial instruments’ payables and/or receivables with collateral held and/or posted and create one single net payment. The provisions of the ISDA Master Agreement typically permit a single net payment in the event of default including the bankruptcy or insolvency of the counterparty. Bankruptcy or insolvency laws of a particular jurisdiction may impose restrictions on or prohibitions against the right of offset in bankruptcy, insolvency or other events. In addition, certain ISDA Master Agreements allow counterparties to OTC derivatives to terminate derivative contracts prior to maturity in the event the Fund’s net assets decline by a stated percentage or the Fund fails to meet the terms of its ISDA Master Agreements, which would cause the Fund to accelerate payment of any net liability owed to the counterparty.
Collateral Requirements: For derivatives traded under an ISDA Master Agreement, the collateral requirements are typically calculated by netting the mark-to-market amount for each transaction under such agreement
| | | | | | |
| | | BLACKROCK FUNDS | | MARCH 31, 2014 | | 45 |
| | |
| Notes to Financial Statements (continued) | | |
and comparing that amount to the value of any collateral currently pledged by the Fund and the counterparty.
Cash collateral that has been pledged to cover obligations of the Fund and cash collateral received from the counterparty, if any, is reported separately on the Statements of Assets and Liabilities as cash pledged as collateral and cash received as collateral, respectively. Non-cash collateral pledged by the Fund, if any, is noted in the Schedule of Investments. Generally, the amount of collateral due from or to a party has to exceed a minimum transfer amount threshold (typically either $250,000 or $500,000) before a transfer is required, which is determined at the close of business of the Fund and any additional required collateral is delivered to/pledged by the Fund on the next business day. Typically, the
Fund and counterparties are not permitted to sell, re-pledge or use the collateral they receive. To the extent amounts due to the Fund from its counterparties are not fully collateralized, contractually or otherwise, the Fund bears the risk of loss from counterparty non-performance. Each Fund attempts to mitigate counterparty risk by entering into agreements only with counterparties that it believes have the financial resources to honor their obligations and by monitoring the financial stability of those counterparties.
For financial reporting purposes, the Funds do not offset derivative assets and derivative liabilities that are subject to netting arrangements, if any, in the Statements of Assets and Liabilities.
At March 31, 2014, the Funds’ derivative assets and liabilities (by type) are as follows:
| | | | | | | | | | | | | | | | | | |
| | | Flexible Equity | | | | | Small Cap Growth Equity | |
| | | Assets | | | Liabilities | | | | | Assets | | | Liabilities | |
Derivative Financial Instruments: | | | | | | | | | | | | | | | | | | |
Financial futures contracts | | | 1,819 | | | $ | 981,250 | | | | | $ | 374,510 | | | | — | |
Forward foreign currency exchange contracts | | $ | 362,229 | | | | 1,102,593 | | | | | | — | | | | — | |
Options | | | 2,775,910 | 1 | | | 380,361 | | | | | | — | | | | — | |
Swaps - OTC2 | | | 1,106,610 | | | | — | | | | | | — | | | | — | |
| | | | | | | | | | |
Total derivative assets and liabilities in the Statements of Assets and Liabilities | | $ | 4,246,568 | | | $ | 2,464,204 | | | | | $ | 374,510 | | | | — | |
| | | | | | | | | | |
Derivatives not subject to a Master Netting Agreement or similar agreement (“MNA”) | | | (2,777,729 | ) | | | (1,361,611 | ) | | | | | (374,510 | ) | | | — | |
| | | | | | | | | | |
Total derivative assets and liabilities subject to an MNA | | $ | 1,468,839 | | | $ | 1,102,593 | | | | | | — | | | | — | |
| | | | | | | | | | |
| | 1 | Includes options purchased at value which are included in Investments at value — unaffiliated in the Statements of Assets and Liabilities and reported in the Schedule of Investments. |
| | 2 | Includes unrealized appreciation/depreciation on OTC swaps and swap premiums paid/received in the Statements of Assets and Liabilities. |
The following table presents the Funds’ derivative assets and liabilities by counterparty net of amounts available for offset under an MNA and net of the related collateral received and pledged by the Fund as of March 31, 2014:
| | | | | | | | | | | | | | | | | | | | |
| Flexible Equity | | | | | | | | | | | | | | | |
| Counterparty | | Derivative Assets Subject to an MNA by Counterparty | | | Derivatives Available for Offset1 | | | Non-cash Collateral Received | | | Cash Collateral Received2 | | | Net Amount of Derivative Assets3 | |
Barclays Bank PLC | | $ | 53,537 | | | | — | | | | — | | | | — | | | $ | 53,537 | |
Citibank N.A. | | | 1,306,024 | | | $ | (23,882 | ) | | | — | | | $ | (900,000 | ) | | | 382,142 | |
JPMorgan Chase Bank N.A. | | | 84,447 | | | | — | | | | — | | | | — | | | | 84,447 | |
Toronto-Dominion Bank | | | 24,831 | | | | — | | | | — | | | | — | | | | 24,831 | |
| | | | |
Total | | $ | 1,468,839 | | | $ | (23,882 | ) | | | — | | | $ | (900,000 | ) | | $ | 544,957 | |
| | | | |
| | | | | | | | | | | | | | | | | | | | |
| Counterparty | | Derivative Liabilities
Subject to an MNA by Counterparty | | | Derivatives Available for Offset1 | | | Non-cash Collateral Pledged | | | Cash Collateral Pledged | | | Net Amount of Derivative Liabilities4 | |
BNP Paribas S.A. | | $ | 507,745 | | | | — | | | | — | | | | — | | | $ | 507,745 | |
Citibank N.A. | | | 23,882 | | | $ | (23,882 | ) | | | — | | | | — | | | | — | |
Deutsche Bank AG | | | 570,966 | | | | — | | | | — | | | | — | | | | 570,966 | |
| | | | |
Total | | $ | 1,102,593 | | | $ | (23,882 | ) | | | — | | | | — | | | $ | 1,078,711 | |
| | | | |
| | 1 | The amount of derivatives available for offset is limited to the amount of derivative assets and/or liabilities that are subject to an MNA. |
| | 2 | Excess of collateral received from the individual counterparty may not be shown for financial reporting purposes. |
| | 3 | Net amount represents the net amount receivable from the counterparty in the event of default. |
| | 4 | Net amount represents the net amount payable due to the counterparty in the event of default. |
| | | | | | |
| 46 | | BLACKROCK FUNDS | | MARCH 31, 2014 | | |
| | |
| Notes to Financial Statements (continued) | | |
5. Investment Advisory Agreement and Other Transactions with Affiliates:
The PNC Financial Services Group, Inc. is the largest stockholder and an affiliate, for 1940 Act purposes, of BlackRock.
The Trust, on behalf of the Funds, entered into an Investment Advisory Agreement with the Manager, the Funds’ investment advisor, an indirect, wholly owned subsidiary of BlackRock, to provide investment advisory and administration services. The Manager is responsible for the management of each Fund’s portfolio and provides the necessary personnel, facilities, equipment and certain other services necessary to the operations of each Fund. For such services, each Fund pays the Manager a monthly fee based on a percentage of each Fund’s average daily net assets at the following annual rates:
| | | | | | | | |
| | | Flexible Equity and Mid-Cap Growth Equity | | | Small Cap Growth Equity | |
| Average Daily Net Assets | | Investment Advisory Fee | | | Investment Advisory Fee | |
First $1 Billion | | | 0.800 | % | | | 0.550 | % |
$1 Billion - $2 Billion | | | 0.700 | % | | | 0.500 | % |
$2 Billion - $3 Billion | | | 0.650 | % | | | 0.475 | % |
Greater than $3 Billion | | | 0.625 | % | | | 0.450 | % |
The Manager voluntarily agreed to waive its investment advisory fees by the amount of investment advisory fees each Fund pays to the Manager indirectly through its investment in affiliated money market funds. However, the Manager does not waive its investment advisory fees by the amount of investment advisory fees paid in connection with each Fund’s investment in other affiliated investment companies, if any. These amounts are shown as fees waived by Manager in the Statements of Operations.
The Manager provides investment management and other services to the Subsidiary. The Manager does not receive separate compensation from the Subsidiary for providing investment management or administrative services. However, Flexible Equity pays the Manager based on Flexible Equity’s net assets which include the assets of the Subsidiary.
The Trust, on behalf of the Funds, entered into a Distribution Agreement and a Distribution and Service Plan with BlackRock Investments, LLC (“BRIL”), an affiliate of the Manager. Pursuant to the Distribution and Service Plan and in accordance with Rule 12b-1 under the 1940 Act, the Funds pay BRIL ongoing service and distribution fees. The fees are accrued daily and paid monthly at annual rates based upon the average daily net assets of the shares of each Fund as follows:
| | | | | | | | |
| | | Service Fee | | | Distribution Fee | |
Service | | | 0.25 | % | | | — | |
Investor A | | | 0.25 | % | | | — | |
Investor B | | | 0.25 | % | | | 0.75 | % |
Investor C | | | 0.25 | % | | | 0.75 | % |
Class R | | | 0.25 | % | | | 0.25 | % |
Pursuant to sub-agreements with BRIL, broker-dealers and BRIL provide shareholder servicing and distribution services to each Fund. The ongoing service and/or distribution fee compensates BRIL and each broker-
dealer for providing shareholder servicing and/or distribution related services to Service, Investor A, Investor B, Investor C and Class R shareholders.
For the six months ended March 31, 2014, the following table shows the class specific service and distribution fees borne directly by each class of each Fund:
| | | | | | | | | | | | |
| | | Flexible Equity | | | Mid-Cap Growth Equity | | | Small Cap Growth Equity | |
Service | | $ | 423 | | | $ | 2,775 | | | $ | 33,075 | |
Investor A | | | 634,320 | | | | 382,289 | | | | 422,557 | |
Investor B | | | 54,747 | | | | 21,076 | | | | 6,167 | |
Investor C | | | 515,757 | | | | 138,446 | | | | 178,873 | |
Class R | | | 2,856 | | | | 21,882 | | | | — | |
| | | | |
Total | | $ | 1,208,103 | | | $ | 566,468 | | | $ | 640,672 | |
| | | | |
Pursuant to written agreements, certain financial intermediaries, some of which may be affiliates, provide the Funds with sub-accounting, recordkeeping, sub-transfer agency and other administrative services with respect to sub-accounts they service. For these services, these entities receive an asset based fee or an annual fee per shareholder account, which will vary depending on share class and/or net assets. For the six months ended March 31, 2014, the Funds paid the following to the affiliates in return for these services, which are included in transfer agent — class specific in the Statements of Operations:
| | | | |
Flexible Equity | | $ | 2,864 | |
Mid-Cap Growth Equity | | $ | 4,164 | |
Small Cap Growth Equity | | $ | 38,302 | |
The Manager maintains a call center, which is responsible for providing certain shareholder services to the Funds, such as responding to shareholder inquiries and processing transactions based upon instructions from shareholders with respect to the subscription and redemption of Fund shares. For the six months ended March 31, 2014, each Fund reimbursed the Manager the following amounts for costs incurred in running the call center, which are included in transfer agent — class specific in the Statements of Operations:
| | | | | | | | | | | | |
| | | Flexible Equity | | | Mid-Cap Growth Equity | | | Small Cap Growth Equity | |
Institutional | | $ | 1,293 | | | $ | 832 | | | $ | 1,753 | |
Investor A | | | 43,900 | | | | 63,998 | | | | 3,125 | |
Investor B | | | 3,931 | | | | 2,701 | | | | 74 | |
Investor C | | | 1,126 | | | | 746 | | | | 664 | |
Class R | | | 26 | | | | 91 | | | | — | |
| | | | |
Total | | $ | 50,276 | | | $ | 68,368 | | | $ | 5,616 | |
| | | | |
For the six months ended March 31, 2014, the following table shows the class specific transfer agent fees borne directly by each class of each Fund:
| | | | | | | | | | | | |
| | | Flexible Equity | | | Mid-Cap Growth Equity | | | Small Cap Growth Equity | |
Institutional | | $ | 53,195 | | | $ | 14,274 | | | $ | 714,143 | |
Service | | | 189 | | | | 1,554 | | | | 23,049 | |
Investor A | | | 548,522 | | | | 396,332 | | | | 360,010 | |
Investor B | | | 28,374 | | | | 15,055 | | | | 1,852 | |
Investor C | | | 109,486 | | | | 26,302 | | | | 39,214 | |
| | | | | | |
| | | BLACKROCK FUNDS | | MARCH 31, 2014 | | 47 |
| | |
| Notes to Financial Statements (continued) | | |
| | | | | | | | | | | | |
| | | Flexible Equity | | | Mid-Cap Growth Equity | | | Small Cap Growth Equity | |
Class R | | $ | 1,487 | | | $ | 11,042 | | | | — | |
| | | | |
Total | | $ | 741,253 | | | $ | 464,559 | | | $ | 1,138,268 | |
| | | | |
BNY Mellon Investment Servicing (US) Inc. (“BNYMIS”) and the Manager act as co-administrators for the Funds. For these services, the co-administrators receive an administration fee computed daily and payable monthly to each administrator pursuant to separate fee arrangements, based on a percentage of the average daily net assets of each Fund. The combined administration fee, which is shown as administration in the Statements of Operations, is paid at the following annual rates:
| | | | |
| Average Daily Net Assets | | Administration Fee | |
First $500 Million | | | 0.075 | % |
$500 Million - $1 Billion | | | 0.065 | % |
Greater than $1 Billion | | | 0.055 | % |
In addition, each of the share classes is charged an administration fee, which is shown as administration-class specific in the Statements of Operations, based on the following percentages of average daily net assets of each respective class:
| | | | |
| Average Daily Net Assets | | Administration Fee — Class Specific | |
First $500 Million | | | 0.025 | % |
$500 Million - $1 Billion | | | 0.015 | % |
Greater than $1 Billion | | | 0.005 | % |
For the six months ended March 31, 2014, the Funds paid the following to the Manager in return for these services, which are included in administration and administration — class specific in the Statements of Operations:
| | | | |
Flexible Equity | | $ | 259,330 | |
Mid-Cap Growth Equity | | $ | 142,955 | |
Small Cap Growth Equity | | $ | 381,126 | |
For the six months ended March 31, 2014, the following table shows the class specific administration fees borne directly by each class of each Fund:
| | | | | | | | | | | | |
| | | Flexible Equity | | | Mid-Cap Growth Equity | | | Small Cap Growth Equity | |
Institutional | | $ | 8,079 | | | $ | 3,167 | | | $ | 73,571 | |
Service | | | 42 | | | | 278 | | | | 3,308 | |
Investor A | | | 62,856 | | | | 38,228 | | | | 42,256 | |
Investor B | | | 1,369 | | | | 532 | | | | 154 | |
Investor C | | | 12,894 | | | | 3,463 | | | | 4,472 | |
Class R | | | 143 | | | | 1,094 | | | | — | |
| | | | |
Total | | $ | 85,383 | | | $ | 46,762 | | | $ | 123,761 | |
| | | | |
BNYMIS and the Manager may have, at their discretion, voluntarily waived all or any portion of their administration fees for a Fund or a share class which are included in administration fees waived – class specific in the Statements of Operations.
The Manager contractually or voluntarily agreed to waive and/or reimburse fees or expenses in order to limit expenses, excluding interest expense, dividend expense, income tax expense, acquired fund fees and
expenses and certain other fund expenses, which constitute extraordinary expenses not incurred in the ordinary course of the Funds’ business. The expense limitations as a percentage of average daily net assets are as follows:
| | | | | | | | | | | | | | | | |
| | | Flexible
Equity | | | Mid-Cap Growth Equity | | | Small Cap Growth Equity | |
| | | Contractual1 | | | Contractual2 | | | Contractual2 | | | Voluntary3 | |
Institutional | | | 0.97 | % | | | 1.11 | % | | | 1.02 | % | | | — | |
Service | | | 1.29 | % | | | 1.58 | % | | | 1.29 | % | | | 1.18 | % |
Investor A | | | 1.29 | % | | | 1.39 | % | | | 1.50 | % | | | — | |
Investor B | | | 2.06 | % | | | 2.16 | % | | | 2.28 | % | | | — | |
Investor C | | | 2.06 | % | | | 2.16 | % | | | 2.28 | % | | | — | |
Class R | | | 1.65 | %4 | | | 1.65 | % | | | 1.72 | %5 | | | — | |
| | 1 | The Manager has agreed not to reduce or discontinue this contractual waiver or reimbursement prior to February 1, 2015, except for Class R Shares which is prior to February 1, 2024, unless approved by the Board, including a majority of the independent Trustees. |
| | 2 | The Manager has agreed not to reduce or discontinue this contractual waiver or reimbursement prior to February 1, 2015 unless approved by the Board, including a majority of the independent Trustees. |
| | 3 | The voluntary waiver or reimbursement may be reduced or discontinued at any time. |
| | 4 | On February 1 of each year, the waiver agreement will renew automatically for an additional one year so that the agreement will have a perpetual ten year term. |
| | 5 | There were no shares outstanding as of March 31, 2014. |
These amounts waived or reimbursed are included in fees waived by Manager, and shown as administration fees waived — class specific, transfer agent fees waived — class specific and transfer agent fees reimbursed — class specific, respectively, in the Statements of Operations. For the six months ended March 31, 2014, class specific expense waivers or reimbursements are as follows:
| | | | | | | | |
| Administration Fees Waived | | | |
| | | Flexible Equity | | | Mid-Cap Growth Equity | |
Institutional | | $ | 8,079 | | | | — | |
Service | | | 23 | | | | — | |
Investor A | | | 62,856 | | | $ | 38,228 | |
Investor B | | | 1,369 | | | | 532 | |
Investor C | | | 12,894 | | | | 154 | |
Class R | | | 87 | | | | 958 | |
| | | | |
Total | | $ | 85,308 | | | $ | 39,872 | |
| | | | |
| | | | | | | | |
| Transfer Agent Fees Waived | | | | | | |
| | | Flexible Equity | | | Mid-Cap Growth Equity | |
Institutional | | $ | 1,293 | | | | — | |
Investor A | | | 43,900 | | | $ | 60,112 | |
Investor B | | | 3,931 | | | | 2,701 | |
Investor C | | | 1,126 | | | | — | |
Class R | | | 26 | | | | 26 | |
| | | | |
Total | | $ | 50,276 | | | $ | 62,839 | |
| | | | |
| | | | | | | | |
| Transfer Agent Fees Reimbursed | | | | | | |
| | | Flexible Equity | | | Mid-Cap Growth Equity | |
Institutional | | $ | 34,834 | | | | — | |
Service | | | 9 | | | | — | |
Investor A | | | 193,538 | | | $ | 18,562 | |
| | | | | | |
| 48 | | BLACKROCK FUNDS | | MARCH 31, 2014 | | |
| | |
| Notes to Financial Statements (continued) | | |
| | | | | | | | |
| Transfer Agent Fees Reimbursed | | | | | | |
| | | Flexible Equity | | | Mid-Cap Growth Equity | |
Investor B | | $ | 16,685 | | | $ | 7,343 | |
Investor C | | | 35,443 | | | | — | |
Class R | | | 239 | | | | 1,639 | |
| | | | |
Total | | $ | 280,748 | | | $ | 27,544 | |
| | | | |
If during a Fund’s fiscal year the operating expenses of a share class, that at any time during the prior two fiscal years received a waiver or reimbursement from the Manager, are less than the expense limit for that share class, the Manager is entitled to be reimbursed by such share class up to the lesser of (a) the amount of fees waived or expenses reimbursed during those prior two fiscal years under the agreement and (b) the amount by which the expense limit for that share class exceeds the operating expenses of the share class for the current fiscal year, provided that: (1) the Fund, of which the share class is a part, has more than $50 million in assets for the fiscal year and (2) the Manager or an affiliate continues to serve as the Fund’s investment advisor or administrator. In the event the expense limit for a share class is changed subsequent to a fiscal year in which the Manager becomes entitled to reimbursement for fees waived or reimbursed, the amount available to reimburse the Manager shall be calculated by reference to the expense limit for that share class in effect at the time the Manager became entitled to receive such reimbursement, rather than the subsequently changed expense limit for that share class.
For the six months ended March 31, 2014, the Manager recouped the following Fund level and class specific waivers previously recorded by the Funds:
| | | | | | | | |
| | | Mid-Cap Growth Equity | | | Small Cap Growth Equity | |
Institutional | | $ | 5,248 | | | $ | 15,195 | |
Service | | | 2,582 | | | | — | |
Investor C | | | 2,412 | | | | — | |
| | | | |
Total | | $ | 10,242 | | | $ | 15,195 | |
| | | | |
On March 31, 2014, the Fund level and class specific waivers and/or reimbursements subject to possible future recoupment under the expense limitation agreement are as follows:
| | | | | | | | | | | | |
| | | Expiring September 30, | |
| | | 2014 | | | 2015 | | | 2016 | |
Flexible Equity | | | | | | | | | | | | |
Fund Level | | $ | 3,058 | | | $ | 4,185 | | | | — | |
Institutional | | $ | 286,798 | | | $ | 161,208 | | | $ | 44,206 | |
Service | | $ | 7,949 | | | $ | 2,177 | | | $ | 32 | |
Investor A | | $ | 668,091 | | | $ | 726,434 | | | $ | 300,294 | |
Investor B | | $ | 57,761 | | | $ | 50,744 | | | $ | 21,985 | |
Investor C | | $ | 140,462 | | | $ | 141,245 | | | $ | 49,463 | |
R Shares | | $ | 1,419 | | | $ | 1,533 | | | $ | 352 | |
Mid-Cap Growth Equity | | | | | | | | | | | | |
Institutional | | $ | 868 | | | $ | 2,628 | | | | — | |
Service | | $ | 4,864 | | | $ | 1,701 | | | | — | |
Investor A | | $ | 397,817 | | | $ | 387,828 | | | $ | 116,902 | |
Investor B | | $ | 28,651 | | | $ | 24,471 | | | $ | 10,576 | |
Investor C | | $ | 26,056 | | | $ | 14,126 | | | $ | 154 | |
R Shares | | $ | 11,748 | | | $ | 6,418 | | | $ | 2,623 | |
For the six months ended March 31, 2014, affiliates earned underwriting discounts, direct commissions and dealer concessions on sales of each Fund’s Investor A Shares as follows:
| | | | |
Flexible Equity | | $ | 4,440 | |
Mid-Cap Growth Equity | | $ | 14,289 | |
Small Cap Growth Equity | | $ | 10,151 | |
For the six months ended March 31, 2014, affiliates received CDSCs as follows:
| | | | | | | | | | | | |
| | | Investor A | | | Investor B | | | Investor C | |
Flexible Equity | | $ | 11 | | | $ | 1,221 | | | $ | 2,327 | |
Mid-Cap Growth Equity | | $ | 250 | | | $ | 296 | | | $ | 977 | |
Small Cap Growth Equity | | $ | 1,448 | | | $ | 53 | | | $ | 1,286 | |
The U.S. Securities and Exchange Commission has issued an exemptive order which permits BIM, an affiliate of the Manager, to serve as securities lending agent for the Funds, subject to applicable conditions. As securities lending agent, BIM bears all operational costs directly related to securities lending. The Funds are responsible for expenses in connection with the investment of cash collateral received for securities on loan (the “collateral investment expenses”). The cash collateral is invested in a private investment company managed by the Manager or its affiliates. However, BIM has agreed to cap the collateral investment expenses of the private investment company to an annual rate of 0.04%. The investment advisor to the private investment company will not charge any advisory fees with respect to shares purchased by the Funds.
Securities lending income is equal to the total of income earned from the reinvestment of cash collateral, net of fees and other payments to and from borrowers of securities, and less the collateral investment expenses. Each Fund retains a portion of securities lending income and remits a remaining portion to BIM as compensation for its services as securities lending agent. Pursuant to the securities lending agreement effective February 1, 2014, BIM may lend securities only when the difference between the borrower rebate rate and the risk free rate exceeds a certain level (such securities, the “specials only securities”).
Pursuant to a securities lending agreement effective February 1, 2014, each Fund retains 80% of securities lending income. In addition, commencing the business day following the date that the aggregate securities lending income earned across the Equity-Liquidity Complex in a calendar year exceeds the aggregate securities lending income earned across the Equity-Liquidity Complex through the lending of specials only securities in the calendar year 2013, each Fund, pursuant to the securities lending agreement will retain for the remainder of the calendar year, securities lending income in an amount equal to 85% of securities lending income. Prior to February 1, 2014, each Fund retained 65% of securities lending income and paid a fee to BIM equal to 35% of such income. The share of securities lending income earned by each Fund, if any, is shown as securities lending — affiliated — net in the Statements of Operations. For the six months ended March 31, 2014, the Funds paid BIM for securities lending agent services as follows:
| | | | |
Flexible Equity | | $ | 438 | |
Mid-Cap Growth Equity | | $ | 18,966 | |
Small Cap Growth Equity | | $ | 218,457 | |
| | | | | | |
| | | BLACKROCK FUNDS | | MARCH 31, 2014 | | 49 |
| | |
| Notes to Financial Statements (continued) | | |
Certain officers and/or trustees of the Trust are officers and/or directors of BlackRock or its affiliates. The Funds reimburse the Manager for a portion of the compensation paid to the Trust’s Chief Compliance Officer, which is included in officer and trustees in the Statements of Operations.
6. Purchases and Sales:
Purchases and sales of investments, excluding short-term securities, for the six months ended March 31, 2014, were as follows:
| | | | | | | | |
| | | Purchases | | | Sales | |
Flexible Equity | | $ | 328,949,415 | | | $ | 428,225,882 | |
Mid-Cap Growth Equity | | $ | 219,066,817 | | | $ | 204,756,228 | |
Small Cap Growth Equity | | $ | 538,381,038 | | | $ | 1,079,825,452 | |
Transactions in options written for the six months ended March 31, 2014, were as follows:
| | | | | | | | |
Flexible Equity | |
| | | Calls | |
| | | Contracts | | | Premiums Received | |
| | | | |
Outstanding options, beginning of period | | | 1,149 | | | $ | 79,236 | |
Options written | | | 14,097 | | | | 2,799,647 | |
Options exercised | | | (1,251 | ) | | | (430,957 | ) |
Options expired | | | (3,756 | ) | | | (350,440 | ) |
Options closed | | | (7,739 | ) | | | (1,659,321 | ) |
| | | | |
Outstanding options, end of period | | | 2,500 | | | $ | 438,165 | |
| | | | |
7. Income Tax Information:
As of September 30, 2013, the Fund had a capital loss carryforward available to offset future realized capital gains of $62,693,400, all of which is due to expire September 30, 2017.
As of March 31, 2014, gross unrealized appreciation and depreciation based on cost for federal income tax purposes were as follows:
| | | | | | | | | | | | |
| | | Flexible Equity | | | Mid-Cap Growth Equity | | | Small Cap Growth Equity | |
Tax cost | | $ | 563,514,128 | | | $ | 333,429,685 | | | $ | 785,356,202 | |
| | | | |
Gross unrealized appreciation | | $ | 85,903,329 | | | $ | 82,281,050 | | | $ | 146,395,832 | |
Gross unrealized depreciation | | | (13,532,042 | ) | | | (2,083,087 | ) | | | (31,739,234 | ) |
| | | | |
Net unrealized appreciation | | $ | 72,371,287 | | | $ | 80,197,963 | | | $ | 114,656,598 | |
| | | | |
8. Bank Borrowings:
The Trust, on behalf of the Funds, along with certain other funds managed by the Manager and its affiliates (“Participating Funds”), is a party to a 364-day, $800 million credit agreement with a group of lenders, under which the Funds may borrow to fund shareholder redemptions. The
agreement expires in April 2014. Excluding commitments designated for a certain individual fund, other Participating Funds, including the Funds, can borrow up to an aggregate commitment amount of $500 million, subject to asset coverage and other limitations as specified in the agreement. The credit agreement has the following terms: a fee of 0.065% per annum on unused commitment amounts and interest at a rate equal to the higher of (a) the one-month LIBOR plus 0.80% per annum or (b) the Fed Funds rate plus 0.80% per annum on amounts borrowed. Participating Funds paid administration and arrangement fees, which, along with commitment fees, were allocated among such funds based upon portions of the aggregate commitment available to them and relative net assets of Participating Funds. The Funds did not borrow under the credit agreement during the six months ended March 31, 2014.
9. Concentration, Market and Credit Risk:
In the normal course of business, the Funds invest in securities and enter into transactions where risks exist due to fluctuations in the market (market risk) or failure of the issuer of a security to meet all its obligations (issuer credit risk). The value of securities held by the Funds may decline in response to certain events, including those directly involving the issuers whose securities are owned by the Funds; conditions affecting the general economy; overall market changes; local, regional or global political, social or economic instability; and currency and interest rate and price fluctuations. Similar to issuer credit risk, the Funds may be exposed to counterparty credit risk, or the risk that an entity with which the Funds have unsettled or open transactions may fail to or be unable to perform on its commitments. The Funds manage counterparty credit risk by entering into transactions only with counterparties that they believe have the financial resources to honor their obligations and by monitoring the financial stability of those counterparties. Financial assets, which potentially expose the Funds to market, issuer and counterparty credit risks, consist principally of financial instruments and receivables due from counterparties. The extent of the Funds’ exposure to market, issuer and counterparty credit risks with respect to these financial assets is generally approximated by their value recorded in the Statements of Assets and Liabilities, less any collateral held by the Funds.
As of March 31, 2014, Flexible Equity invested a significant portion of its assets in securities in the consumer discretionary and financials sectors. Mid-Cap Growth Equity invested a significant portion of its assets in securities in the consumer discretionary, information technology and industrials sectors. Small Cap Growth Equity invested a significant portion of its assets in securities in the information technology and health care sectors. Changes in economic conditions affecting these sectors would have a greater impact on the respective Funds and could affect the value, income and/or liquidity of positions in such securities.
| | | | | | |
| 50 | | BLACKROCK FUNDS | | MARCH 31, 2014 | | |
| | |
| Notes to Financial Statements (continued) | | |
10. Capital Share Transactions:
Transactions in capital shares for each class were as follows:
| | | | | | | | | | | | | | | | | | |
| | | Six Months Ended
March 31, 2014 | | | | | Year Ended
September 30, 2013 | |
| Flexible Equity | | Shares | | | Amount | | | | | Shares | | | Amount | |
Institutional | | | | | | | | | | | | | | | | | | |
Shares sold | | | 559,559 | | | $ | 8,152,413 | | | | | | 1,480,403 | | | $ | 19,061,403 | |
Shares issued in reinvestment of dividends | | | 61,089 | | | | 904,109 | | | | | | 78,980 | | | | 961,390 | |
Shares redeemed | | | (1,392,156 | ) | | | (20,315,394 | ) | | | | | (8,399,300 | ) | | | (107,020,444 | ) |
| | | | | | | | | | |
Net decrease | | | (771,508 | ) | | $ | (11,258,872 | ) | | | | | (6,839,917 | ) | | $ | (86,997,651 | ) |
| | | | | | | | | | |
| | | | | | | | | | | | | | | | | | |
Service | | | | | | | | | | | | | | | | | | |
Shares sold | | | 1,277 | | | $ | 18,069 | | | | | | 4,658 | | | $ | 59,314 | |
Shares issued in reinvestment of dividends | | | 202 | | | | 2,950 | | | | | | 344 | | | | 4,137 | |
Shares redeemed | | | (11,152 | ) | | | (160,461 | ) | | | | | (29,279 | ) | | | (361,847 | ) |
| | | | | | | | | | |
Net decrease | | | (9,673 | ) | | $ | (139,442 | ) | | | | | (24,277 | ) | | $ | (298,396 | ) |
| | | | | | | | | | |
| | | | | | | | | | | | | | | | | | |
Investor A | | | | | | | | | | | | | | | | | | |
Shares sold and automatic conversion of shares | | | 964,410 | | | $ | 13,598,485 | | | | | | 2,981,374 | | | $ | 37,203,485 | |
Shares issued in reinvestment of dividends | | | 404,269 | | | | 5,805,298 | | | | | | 392,256 | | | | 4,639,298 | |
Shares redeemed | | | (4,764,519 | ) | | | (67,486,838 | ) | | | | | (16,386,872 | ) | | | (202,891,873 | ) |
| | | | | | | | | | |
Net decrease | | | (3,395,840 | ) | | $ | (48,083,055 | ) | | | | | (13,013,242 | ) | | $ | (161,049,090 | ) |
| | | | | | | | | | |
| | | | | | | | | | | | | | | | | | |
Investor B | | | | | | | | | | | | | | | | | | |
Shares sold | | | 2,095 | | | $ | 26,543 | | | | | | 9,549 | | | $ | 106,426 | |
Shares issued in reinvestment of dividends | | | 2,955 | | | | 38,498 | | | | | | 964 | | | | 10,535 | |
Shares redeemed and automatic conversion of shares | | | (238,928 | ) | | | (3,050,694 | ) | | | | | (633,285 | ) | | | (7,157,447 | ) |
| | | | | | | | | | |
Net decrease | | | (233,878 | ) | | $ | (2,985,653 | ) | | | | | (622,772 | ) | | $ | (7,040,486 | ) |
| | | | | | | | | | |
| | | | | | | | | | | | | | | | | | |
Investor C | | | | | | | | | | | | | | | | | | |
Shares sold | | | 159,987 | | | $ | 2,030,858 | | | | | | 441,994 | | | $ | 5,001,546 | |
Shares issued in reinvestment of dividends | | | 43,155 | | | | 558,433 | | | | | | 16,337 | | | | 175,633 | |
Shares redeemed | | | (824,780 | ) | | | (10,474,039 | ) | | | | | (2,573,973 | ) | | | (28,939,114 | ) |
| | | | | | | | | | |
Net decrease | | | (621,638 | ) | | $ | (7,884,748 | ) | | | | | (2,115,642 | ) | | $ | (23,761,935 | ) |
| | | | | | | | | | |
| | | | | | | | | | | | | | | | | | |
Class R | | | | | | | | | | | | | | | | | | |
Shares sold | | | 27,724 | | | $ | 401,513 | | | | | | 14,316 | | | $ | 204,012 | |
Shares issued in reinvestment of dividends | | | 536 | | | | 7,904 | | | | | | 19,595 | | | | 238,521 | |
Shares redeemed | | | (22,435 | ) | | | (325,041 | ) | | | | | (65,492 | ) | | | (864,273 | ) |
| | | | | | | | | | |
Net increase (decrease) | | | 5,825 | | | $ | 84,376 | | | | | | (31,581 | ) | | $ | (421,740 | ) |
| | | | | | | | | | |
Total Net Decrease | | | (5,026,712 | ) | | $ | (70,267,394 | ) | | | | | (22,647,431 | ) | | $ | (279,569,298 | ) |
| | | | | | | | | | |
| | | | | | |
| | | BLACKROCK FUNDS | | MARCH 31, 2014 | | 51 |
| | |
| Notes to Financial Statements (continued) | | |
| | | | | | | | | | | | | | | | | | |
| | | Six Months Ended
March 31, 2014 | | | | | Year Ended
September 30, 2013 | |
| Mid-Cap Growth Equity | | Shares | | | Amount | | | | | Shares | | | Amount | |
Institutional | | | | | | | | | | | | | | | | | | |
Shares sold | | | 767,597 | | | $ | 13,691,360 | | | | | | 177,733 | | | $ | 2,878,224 | |
Shares issued in reinvestment of distributions | | | 194,583 | | | | 3,105,529 | | | | | | — | | | | — | |
Shares redeemed | | | (174,960 | ) | | | (3,018,067 | ) | | | | | (362,839 | ) | | | (5,180,039 | ) |
| | | | | | | | | | |
Net increase (decrease) | | | 787,220 | | | $ | 13,778,822 | | | | | | (185,106 | ) | | $ | (2,301,815 | ) |
| | | | | | | | | | |
| | | | | | | | | | | | | | | | | | |
Service | | | | | | | | | | | | | | | | | | |
Shares sold | | | 28,498 | | | $ | 485,687 | | | | | | 13,860 | | | $ | 183,892 | |
Shares issued in reinvestment of distributions | | | 24,218 | | | | 359,153 | | | | | | — | | | | — | |
Shares redeemed | | | (34,065 | ) | | | (553,346 | ) | | | | | (38,893 | ) | | | (564,426 | ) |
| | | | | | | | | | |
Net increase (decrease) | | | 18,651 | | | $ | 291,494 | | | | | | (25,033 | ) | | $ | (380,534 | ) |
| | | | | | | | | | |
| | | | | | | | | | | | | | | | | | |
Investor A | | | | | | | | | | | | | | | | | | |
Shares sold and automatic conversion of shares | | | 1,756,617 | | | $ | 27,968,905 | | | | | | 1,038,890 | | | $ | 14,803,094 | |
Shares issued in reinvestment of distributions | | | 3,329,309 | | | | 47,575,761 | | | | | | — | | | | — | |
Shares redeemed | | | (1,333,503 | ) | | | (21,152,622 | ) | | | | | (3,177,171 | ) | | | (43,484,976 | ) |
| | | | | | | | | | |
Net increase (decrease) | | | 3,752,423 | | | $ | 54,392,044 | | | | | | (2,138,281 | ) | | $ | (28,681,882 | ) |
| | | | | | | | | | |
| | | | | | | | | | | | | | | | | | |
Investor B | | | | | | | | | | | | | | | | | | |
Shares sold | | | 9,200 | | | $ | 126,727 | | | | | | 8,359 | | | $ | 106,415 | |
Shares issued in reinvestment of distributions | | | 63,066 | | | | 759,319 | | | | | | — | | | | — | |
Shares redeemed and automatic conversion of shares | | | (68,903 | ) | | | (931,755 | ) | | | | | (181,592 | ) | | | (2,167,718 | ) |
| | | | | | | | | | |
Net increase (decrease) | | | 3,363 | | | $ | (45,709 | ) | | | | | (173,233 | ) | | $ | (2,061,303 | ) |
| | | | | | | | | | |
| | | | | | | | | | | | | | | | | | |
Investor C | | | | | | | | | | | | | | | | | | |
Shares sold | | | 501,067 | | | $ | 6,776,552 | | | | | | 279,854 | | | $ | 3,492,185 | |
Shares issued in reinvestment of distributions | | | 396,072 | | | | 4,748,893 | | | | | | — | | | | — | |
Shares redeemed | | | (183,652 | ) | | | (2,421,775 | ) | | | | | (347,917 | ) | | | (4,134,057 | ) |
| | | | | | | | | | |
Net increase (decrease) | | | 713,487 | | | $ | 9,103,670 | | | | | | (68,063 | ) | | $ | (641,872 | ) |
| | | | | | | | | | |
| | | | | | | | | | | | | | | | | | |
Class R | | | | | | | | | | | | | | | | | | |
Shares sold | | | 136,352 | | | $ | 2,174,055 | | | | | | 200,992 | | | $ | 2,814,955 | |
Shares issued in reinvestment of distributions | | | 115,333 | | | | 1,635,424 | | | | | | — | | | | — | |
Shares redeemed | | | (317,590 | ) | | | (4,828,303 | ) | | | | | (173,049 | ) | | | (2,322,442 | ) |
| | | | | | | | | | |
Net increase (decrease) | | | (65,905 | ) | | $ | (1,018,824 | ) | | | | | 27,943 | | | $ | 492,513 | |
| | | | | | | | | | |
Total Net Increase (Decrease) | | | 5,209,239 | | | $ | 76,501,497 | | | | | | (2,561,773 | ) | | $ | (33,574,893 | ) |
| | | | | | | | | | |
| | | | | |
| Small Cap Growth Equity | | | | | | | | | | | | | | |
Institutional | | | | | | | | | | | | | | | | | | |
Shares sold | | | 2,823,048 | | | $ | 74,478,049 | | | | | | 10,643,445 | | | $ | 269,637,687 | |
Shares issued in reinvestment of dividends and distributions | | | 9,997,391 | | | | 219,842,574 | | | | | | 4,121,612 | | | | 93,766,649 | |
Shares redeemed | | | (22,135,762 | ) | | | (577,293,992 | ) | | | | | (22,615,252 | ) | | | (594,896,244 | ) |
| | | | | | | | | | |
Net decrease | | | (9,315,323 | ) | | $ | (282,973,369 | ) | | | | | (7,850,195 | ) | | $ | (231,491,908 | ) |
| | | | | | | | | | |
| | | | | | |
| 52 | | BLACKROCK FUNDS | | MARCH 31, 2014 | | |
| | |
| Notes to Financial Statements (concluded) | | |
| | | | | | | | | | | | | | | | | | |
| | | Six Months Ended
March 31, 2014 | | | | | Year Ended
September 30, 2013 | |
| Small Cap Growth Equity (concluded) | | Shares | | | Amount | | | | | Shares | | | Amount | |
Service | | | | | | | | | | | | | | | | | | |
Shares sold | | | 202,017 | | | $ | 4,818,887 | | | | | | 245,960 | | | $ | 5,973,963 | |
Shares issued in reinvestment of distributions | | | 452,078 | | | | 8,964,705 | | | | | | 138,883 | | | | 2,949,869 | |
Shares redeemed | | | (294,961 | ) | | | (6,686,955 | ) | | | | | (664,355 | ) | | | (16,295,845 | ) |
| | | | | | | | | | |
Net increase (decrease) | | | 359,134 | | | $ | 7,096,637 | | | | | | (279,512 | ) | | $ | (7,372,013 | ) |
| | | | | | | | | | |
| | | | | | | | | | | | | | | | | | |
Investor A | | | | | | | | | | | | | | | | | | |
Shares sold and automatic conversion of shares | | | 2,207,426 | | | $ | 47,329,272 | | | | | | 3,182,798 | | | $ | 74,853,134 | |
Shares issued in reinvestment of distributions | | | 6,048,548 | | | | 113,168,173 | | | | | | 1,800,128 | | | | 36,794,609 | |
Shares redeemed | | | (3,681,825 | ) | | | (84,730,421 | ) | | | | | (7,105,594 | ) | | | (170,531,397 | ) |
| | | | | | | | | | |
Net increase (decrease) | | | 4,574,149 | | | $ | 75,767,024 | | | | | | (2,122,668 | ) | | $ | (58,883,654 | ) |
| | | | | | | | | | |
| | | | | | | | | | | | | | | | | | |
Investor B | | | | | | | | | | | | | | | | | | |
Shares sold | | | 2,277 | | | $ | 38,239 | | | | | | 5,873 | | | $ | 119,158 | |
Shares issued in reinvestment of distributions | | | 34,769 | | | | 489,889 | | | | | | 9,190 | | | | 157,884 | |
Shares redeemed and automatic conversion of shares | | | (21,071 | ) | | | (319,940 | ) | | | | | (31,902 | ) | | | (630,671 | ) |
| | | | | | | | | | |
Net increase (decrease) | | | 15,975 | | | $ | 208,188 | | | | | | (16,839 | ) | | $ | (353,629 | ) |
| | | | | | | | | | |
| | | | | | | | | | | | | | | | | | |
Investor C | | | | | | | | | | | | | | | | | | |
Shares sold | | | 252,080 | | | $ | 4,313,859 | | | | | | 426,789 | | | $ | 8,393,879 | |
Shares issued in reinvestment of distributions | | | 1,031,671 | | | | 14,371,093 | | | | | | 185,401 | | | | 3,168,491 | |
Shares redeemed | | | (302,927 | ) | | | (4,986,466 | ) | | | | | (523,586 | ) | | | (10,224,135 | ) |
| | | | | | | | | | |
Net increase | | | 980,824 | | | $ | 13,698,486 | | | | | | 88,604 | | | $ | 1,338,235 | |
| | | | | | | | | | |
Total Net Decrease | | | (3,385,241 | ) | | $ | (186,203,034 | ) | | | | | (10,180,610 | ) | | $ | (296,762,969 | ) |
| | | | | | | | | | |
11. Subsequent Events:
Management’s evaluation of the impact of all subsequent events on the Funds’ financial statements was completed through the date the financial statements were issued and the following item was noted:
Effective April 24, 2014, the credit agreement was terminated and a new agreement was entered into. The Fund became a party to a 364-day, $1.1 billion credit agreement, which expires in April 2015. Excluding commitments designated for a certain individual fund, the Fund can borrow up to an aggregate commitment amount of $650 million, subject to asset coverage and other limitations as specified in the agreement. The credit agreement has the following terms: a fee of 0.06% per annum on unused commitment amounts and interest at a rate equal to the higher of (a) the one-month LIBOR plus 0.80% per annum or (b) the Fed Funds rate plus 0.80% per annum on amounts borrowed.
| | | | | | |
| | | BLACKROCK FUNDS | | MARCH 31, 2014 | | 53 |
Ronald W. Forbes, Co-Chairman of the Board and Trustee
Rodney D. Johnson, Co-Chairman of the Board and Trustee
Paul L. Audet, Trustee
David O. Beim, Trustee
Henry Gabbay, Trustee
Dr. Matina S. Horner, Trustee
Herbert I. London, Trustee
Ian A. MacKinnon, Trustee
Cynthia A. Montgomery, Trustee
Joseph P. Platt, Trustee
Robert C. Robb, Jr., Trustee
Toby Rosenblatt, Trustee
Kenneth L. Urish, Trustee
Frederick W. Winter, Trustee
John M. Perlowski, President and Chief Executive Officer
Richard Hoerner, CFA, Vice President
Brendan Kyne, Vice President
Neal Andrews, Chief Financial Officer
Jay Fife, Treasurer
Brian Kindelan, Chief Compliance Officer and Anti-Money Laundering Officer
Benjamin Archibald, Secretary
Investment Advisor and Co-Administrator
BlackRock Advisors, LLC
Wilmington, DE 19809
Accounting Agent, Co-Administrator and Transfer Agent
BNY Mellon Investment Servicing (US) Inc.
Wilmington, DE 19809
Custodian
The Bank of New York Mellon
New York, NY 10286
Distributor
BlackRock Investments, LLC
New York, NY 10022
Legal Counsel
Sidley Austin LLP
New York, NY 10019
Independent Registered Public Accounting Firm
Deloitte & Touche LLP
Philadelphia, PA 19103
Address of the Trust
100 Bellevue Parkway
Wilmington, DE 19809
| | | | | | |
| 54 | | BLACKROCK FUNDS | | MARCH 31, 2014 | | |
Electronic Delivery
Electronic copies of most financial reports and prospectuses are available on the Funds’ website or shareholders can sign up for e-mail notifications of quarterly statements, annual and semi-annual reports and prospectuses by enrolling in the Funds’ electronic delivery program.
To enroll:
Shareholders Who Hold Accounts with Investment Advisors, Banks or Brokerages:
Please contact your financial advisor. Please note that not all investment advisors, banks or brokerages may offer this service.
Shareholders Who Hold Accounts Directly with BlackRock:
| 1) | Access the BlackRock website at |
| | http://www.blackrock.com/edelivery |
| 2) | Select “eDelivery” under the “More Information” section |
Householding
The Funds will mail only one copy of shareholder documents, including prospectuses, annual and semi-annual reports and proxy statements, to shareholders with multiple accounts at the same address. This practice is commonly called “householding” and is intended to reduce expenses and eliminate duplicate mailings of shareholder documents. Mailings of your shareholder documents may be householded indefinitely unless you instruct us otherwise. If you do not want the mailing of these documents to be combined with those for other members of your household, please contact the Funds at (800) 441-7762.
Availability of Quarterly Schedule of Investments
The Funds file their complete schedule of portfolio holdings with the SEC for the first and third quarters of each fiscal year on Form N-Q. The Funds’ Forms N-Q are available on the SEC’s website at
http://www.sec.gov and may also be reviewed and copied at the SEC’s Public Reference Room in Washington, D.C. Information on how to access documents on the SEC’s website without charge may be obtained by calling (800) SEC-0330. The Funds’ Forms N-Q may also be obtained upon request and without charge by calling (800) 441-7762.
Availability of Proxy Voting Policies and Procedures
A description of the policies and procedures that the Funds use to determine how to vote proxies relating to portfolio securities is available (1) without charge, upon request, by calling
(800) 441-7762; (2) at http://www.blackrock.com; and (3) on the SEC’s website at http:// www.sec.gov.
Availability of Proxy Voting Record
Information about how the Funds voted proxies relating to securities held in the Funds’ portfolios during the most recent 12-month period ended June 30 is available upon request and without charge (1) at http://www.blackrock.com or by calling (800) 441-7762 and (2) on the SEC’s website at http://www.sec.gov.
Account Information
Call us at (800) 441-7762 from 8:00 AM to 6:00 PM EST on any business day to get information about your account balances, recent transactions and share prices. You can also reach us on the Web at http:// www.blackrock.com/funds.
Automatic Investment Plans
Investor Class shareholders who want to invest regularly can arrange to have $50 or more automatically deducted from their checking or savings account and invested in any of the BlackRock funds.
Systematic Withdrawal Plans
Investor Class shareholders can establish a systematic withdrawal plan and receive periodic payments of $50 or more from their BlackRock funds, as long as their account balance is at least $10,000.
Retirement Plans
Shareholders may make investments in conjunction with Traditional, Rollover, Roth, Coverdell, Simple IRAs, SEP IRAs and 403(b) Plans.
| | | | | | |
| | | BLACKROCK FUNDS | | MARCH 31, 2014 | | 55 |
| | |
| Additional Information (concluded) | | |
|
| BlackRock Privacy Principles |
BlackRock is committed to maintaining the privacy of its current and former fund investors and individual clients (collectively, “Clients”) and to safeguarding their non-public personal information. The following information is provided to help you understand what personal information BlackRock collects, how we protect that information and why in certain cases we share such information with select parties.
If you are located in a jurisdiction where specific laws, rules or regulations require BlackRock to provide you with additional or different privacy-related rights beyond what is set forth below, then BlackRock will comply with those specific laws, rules or regulations.
BlackRock obtains or verifies personal non-public information from and about you from different sources, including the following: (i) information we receive from you or, if applicable, your financial intermediary, on applications, forms or other documents; (ii) information about your transactions with us, our affiliates, or others; (iii) information we receive from a consumer reporting agency; and (iv) from visits to our websites.
BlackRock does not sell or disclose to non-affiliated third parties any non-public personal information about its Clients, except as permitted by law or as is necessary to respond to regulatory requests or to service Client accounts. These non-affiliated third parties are required to protect the confidentiality and security of this information and to use it only for its intended purpose.
We may share information with our affiliates to service your account or to provide you with information about other BlackRock products or services that may be of interest to you. In addition, BlackRock restricts access to non-public personal information about its Clients to those BlackRock employees with a legitimate business need for the information. BlackRock maintains physical, electronic and procedural safeguards that are designed to protect the non-public personal information of its Clients, including procedures relating to the proper storage and disposal of such information.
| | | | | | |
| 56 | | BLACKROCK FUNDS | | MARCH 31, 2014 | | |
| | |
| A World-Class Mutual Fund Family | | |
BlackRock offers a diverse lineup of open-end mutual funds crossing all investment styles and managed by experts in equity, fixed income and tax-exempt investing.
BlackRock ACWI ex-US Index Fund
BlackRock All-Cap Energy & Resources Portfolio
BlackRock Basic Value Fund
BlackRock Capital Appreciation Fund
BlackRock Commodity Strategies Fund
BlackRock Disciplined Small Cap Core Fund
BlackRock Emerging Markets Dividend Fund
BlackRock Emerging Markets Fund
BlackRock Emerging Markets Long/Short Equity Fund
BlackRock Energy & Resources Portfolio
BlackRock Equity Dividend Fund
BlackRock EuroFund
BlackRock Flexible Equity Fund
BlackRock Focus Growth Fund
BlackRock Global Dividend Portfolio
BlackRock Global Long/Short Equity Fund
BlackRock Global Opportunities Portfolio
BlackRock Global SmallCap Fund
BlackRock Health Sciences Opportunities Portfolio
BlackRock International Fund
BlackRock International Index Fund
BlackRock International Opportunities Portfolio
BlackRock Large Cap Core Fund
BlackRock Large Cap Core Plus Fund
BlackRock Large Cap Growth Fund
BlackRock Large Cap Value Fund
BlackRock Latin America Fund
BlackRock Long-Horizon Equity Fund
BlackRock Mid-Cap Growth Equity Portfolio
BlackRock Mid-Cap Value Opportunities Fund
BlackRock Natural Resources Trust
BlackRock Pacific Fund
BlackRock Real Estate Securities Fund
BlackRock Russell 1000® Index Fund
BlackRock Science & Technology Opportunities Portfolio
BlackRock Small Cap Growth Equity Portfolio
BlackRock Small Cap Growth Fund II
BlackRock Small Cap Index Fund
BlackRock S&P 500 Stock Fund
BlackRock U.S. Opportunities Portfolio
BlackRock Value Opportunities Fund
|
| Taxable Fixed Income Funds |
BlackRock Bond Index Fund
BlackRock Core Bond Portfolio
BlackRock CoreAlpha Bond Fund
BlackRock CoRI Funds
2015
2017
2019
2021
2023
BlackRock Emerging Markets Flexible Dynamic Bond Portfolio
BlackRock Floating Rate Income Portfolio
BlackRock Global Long/Short Credit Fund
BlackRock GNMA Portfolio
BlackRock High Yield Bond Portfolio
BlackRock Inflation Protected Bond Portfolio
BlackRock Investment Grade Bond Portfolio
BlackRock Low Duration Bond Portfolio
BlackRock Secured Credit Portfolio
BlackRock Short Obligations Fund
BlackRock Short-Term Treasury Fund
BlackRock Strategic Income Opportunities Portfolio
BlackRock Total Return Fund
BlackRock U.S. Government Bond Portfolio
BlackRock U.S. Mortgage Portfolio
BlackRock Ultra-Short Obligations Fund
BlackRock World Income Fund
|
| Municipal Fixed Income Funds |
BlackRock California Municipal Bond Fund
BlackRock High Yield Municipal Fund
BlackRock National Municipal Fund
BlackRock New Jersey Municipal Bond Fund
BlackRock New York Municipal Bond Fund
BlackRock Pennsylvania Municipal Bond Fund
BlackRock Short-Term Municipal Fund
BlackRock Strategic Municipal Opportunities Fund
| | | | | | | | | | | | | | |
| BlackRock Balanced Capital Fund | | LifePath Active Portfolios | | LifePath Index Portfolios |
| BlackRock Emerging Market Allocation Portfolio | | 2015 | | | 2040 | | | | | Retirement | | 2040 | | |
| BlackRock Global Allocation Fund | | 2020 | | | 2045 | | | | | 2020 | | 2045 | | |
| BlackRock Managed Volatility Portfolio | | 2025 | | | 2050 | | | | | 2025 | | 2050 | | |
| BlackRock Multi-Asset Income Portfolio | | 2030 | | | 2055 | | | | | 2030 | | 2055 | | |
| BlackRock Multi-Asset Real Return Fund | | 2035 | | | | | | | | 2035 | | | | |
| BlackRock Strategic Risk Allocation Fund | | | | | | | | | | | | | | |
| | | | | | |
| | LifePath Portfolios | | | | | | | | | | | | |
| BlackRock Prepared Portfolios | | Retirement | | | 2040 | | | | | | | | | |
Conservative Prepared Portfolio | | 2020 | | | 2045 | | | | | | | | | |
Moderate Prepared Portfolio | | 2025 | | | 2050 | | | | | | | | | |
Growth Prepared Portfolio | | 2030 | | | 2055 | | | | | | | | | |
Aggressive Growth Prepared Portfolio | | 2035 | | | | | | | | | | | | |
BlackRock mutual funds are currently distributed by BlackRock Investments, LLC. You should consider the investment objectives, risks, charges and expenses of the funds under consideration carefully before investing. Each fund’s prospectus contains this and other information and is available at www.blackrock.com or by calling (800) 441-7762 or from your financial advisor. The prospectus should be read carefully before investing.
| | | | | | |
| | | BLACKROCK FUNDS | | MARCH 31, 2014 | | 57 |
This report is transmitted to shareholders only. It is not authorized for use as an offer of sale or a solicitation of an offer to buy shares of a Fund unless accompanied or preceded by that Fund’s current prospectus. Past performance results shown in this report should not be considered a representation of future performance. Investment returns and principal value of shares will fluctuate so that shares, when redeemed, may be worth more or less than their original cost. Statements and other information herein are as dated and are subject to change.
Investment in foreign securities involves special risks including fluctuating foreign exchange rates, foreign government regulations, differing degrees of liquidity and the possibility of substantial volatility due to adverse political, economic or other developments.

| | |
| |
Eq-Midcap-3/31-SAR | |  |
MARCH 31, 2014
| | | | |
SEMI-ANNUAL REPORT (UNAUDITED) | | | | BLACKROCK® |
BlackRock FundsSM
„ BlackRock Global Opportunities Portfolio
„ BlackRock Health Sciences Opportunities Portfolio
„ BlackRock International Opportunities Portfolio
„ BlackRock Science & Technology Opportunities Portfolio
„ BlackRock U.S. Opportunities Portfolio
| | |
| Not FDIC Insured ¡ May Lose Value ¡ No Bank Guarantee | | |
| | | | | | |
| 2 | | BLACKROCK FUNDS | | MARCH 31, 2014 | | |
Shareholder Letter
Dear Shareholder,
One year ago, U.S. financial markets were improving despite a sluggish global economy, as easy monetary policy provided investors with enough conviction to take on more risk in their portfolios. Slow but positive growth in the U.S. was sufficient to support corporate earnings, while uncomfortably high unemployment reinforced expectations that the Federal Reserve would continue to maintain its aggressive monetary stimulus programs.
Sentiment swiftly reversed in May when then-Fed Chairman Bernanke first mentioned the possibility of reducing (or “tapering”) the central bank’s asset purchase programs — comments that were widely misinterpreted as signaling an end to the Fed’s zero-interest-rate policy. U.S. Treasury yields rose sharply, triggering a steep sell-off across fixed income markets. (Bond prices move in the opposite direction of yields.) Global equities also suffered as investors feared the implications of a potential end to a program that had greatly supported the markets. Emerging markets, which are more sensitive to changes in global liquidity, were particularly hurt by the prospect of ebbing cash flows from the U.S. Markets rebounded in late June, however, when the Fed’s tone turned more dovish, and improving economic indicators and better corporate earnings helped extend gains through most of the summer.
Although the tone of economic and financial news was mixed during the autumn, it was a surprisingly positive period for most asset classes. Early on, the Fed defied market expectations with its decision to delay tapering, but higher volatility returned in late September when the U.S. Treasury Department warned that the national debt would soon breach its statutory maximum. The ensuing political brinksmanship led to a partial government shutdown, roiling global financial markets through the first half of October. Equities and other so-called “risk assets” managed to resume their rally when politicians engineered a compromise to reopen the government and extend the debt ceiling.
The remainder of 2013 was generally positive for stock markets in the developed world, although investors continued to grapple with uncertainty about when and how much the Fed would scale back on stimulus. When the Fed ultimately announced its tapering plans in mid-December, markets reacted positively, as this action signaled the Fed’s perception of real improvement in the economy, and investors were finally relieved from the anxiety that had gripped them for quite some time.
The start of the new year brought another turn in sentiment, as heightened risks in emerging markets and mixed U.S. economic data caused global equities to weaken in January while bond markets found renewed strength. Although these headwinds persisted, equities were back on the rise in Feb-ruary as investors were encouraged by a one-year extension of the U.S. debt ceiling and market-friendly comments from the Fed’s new Chairwoman, Janet Yellen. While U.S. economic data pointed to softer growth, investors viewed this trend as temporarily driven by poor winter weather and continued adding risk to their portfolios on the belief that growth would pick up in the coming months. In March, markets focused on decelerating growth in China and tensions between Russia and Ukraine over the disputed region of Crimea. Additionally, investors were caught off guard by a statement from Chairwoman Yellen indicating that the Fed may raise short-term interest rates earlier than the markets had previously forecasted. Bond markets came under pressure as the middle of the yield curve vaulted higher in response to the unexpected shift in forward guidance.
Against a backdrop of modest economic growth, investors over the past year remained highly attuned to potential changes in monetary policy. Despite the fact that markets were gearing up for a modest shift toward tighter conditions from the Fed, equity markets in the developed world generated strong returns for the six- and 12-month periods ended March 31, with stocks in the United States performing particularly well. In contrast, emerging markets were weighed down by concerns about reduced global liquidity, severe currency weakness, high levels of debt and uneven growth.
Interest rate uncertainty posed a headwind for fixed income assets, and higher-quality sectors of the market experienced heightened volatility and poor performance over the reporting period. High yield bonds, however, benefited from income-oriented investors’ search for yield in the overall low-rate environment. Short-term interest rates remained near zero, keeping yields on money market securities close to historic lows.
At BlackRock, we believe investors need to think globally, extend their scope across a broad array of asset classes and be prepared to move freely as market conditions change over time. We encourage you to talk with your financial advisor and visit www.blackrock.com for further insight about investing in today’s world.
Sincerely,

Rob Kapito
President, BlackRock Advisors, LLC

In a modest global growth environment, expectations around monetary policy changes continued to be a key theme in financial market performance.
Rob Kapito
President, BlackRock Advisors, LLC
| | | | | | | | |
| Total Returns as of March 31, 2014 | |
| | | 6-month | | | 12-month | |
U.S. large cap equities
(S&P 500® Index) | | | 12.51 | % | | | 21.86 | % |
U.S. small cap equities
(Russell 2000® Index) | | | 9.94 | | | | 24.90 | |
International equities
(MSCI Europe, Australasia, Far East Index) | | | 6.41 | | | | 17.56 | |
Emerging market equities
(MSCI Emerging Markets Index) | | | 1.39 | | | | (1.43 | ) |
3-month Treasury bill
(BofA Merrill Lynch
3-Month U.S. Treasury Bill Index) | | | 0.03 | | | | 0.07 | |
U.S. Treasury securities
(BofA Merrill Lynch
10- Year U.S. Treasury
Index) | | | 0.85 | | | | (4.38 | ) |
U.S. investment grade
bonds (Barclays U.S. Aggregate Bond Index) | | | 1.70 | | | | (0.10 | ) |
Tax-exempt municipal
bonds (S&P Municipal Bond Index) | | | 3.91 | | | | 0.31 | |
U.S. high yield bonds
(Barclays U.S. Corporate
High Yield 2% Issuer
Capped Index) | | | 6.66 | | | | 7.53 | |
|
| Past performance is no guarantee of future results. Index performance is shown for illustrative purposes only. You cannot invest directly in an index. | |
| | | | | | |
| | | THIS PAGE NOT PART OF YOUR FUND REPORT | | | | 3 |
| | | | |
| Fund Summary as of March 31, 2014 | | | BlackRock Global Opportunities Portfolio | |
BlackRock Global Opportunities Portfolio’s (the “Fund”) investment objective is to provide long-term capital appreciation.
|
| Portfolio Management Commentary |
How did the Fund perform?
| Ÿ | | For the six-month period ended March 31, 2014, the Fund’s Institutional and Investor A Shares outperformed the benchmark, the MSCI All Country World Index (“ACWI”), while Investor B, Investor C and Class R Shares of the Fund underperformed the benchmark. |
What factors influenced performance?
| Ÿ | | Stock selection contributed positively to the Fund’s performance in the industrials, materials and information technology (“IT”) sectors. In industrials, standout performance came from select positions such as United Rentals, Inc., which continued to benefit from a broad-based construction recovery, and American Airlines Group, Inc., which benefited from increased pricing power due to industry consolidation. In the materials sector, strong performance came from selection in the specialty chemicals segment, where the Fund continued to favor well-capitalized businesses with the ability to consistently grow and generate cash flow in excess of their cost of capital. Within IT, the Fund’s internet software holdings added to returns attributable to a preference for emerging technology and businesses with high potential for monetizing their new products or subscribers. |
| Ÿ | | Detracting from performance was stock selection in the energy sector. In particular, Eurasia Drilling Co. Ltd., a Russian provider of onshore drilling services, came under pressure on account of drilling contract disruptions coupled with the geopolitical turmoil in Ukraine, which ultimately led to the Fund exiting the position. In health care, the Fund’s exposure to biotechnology hurt returns as the industry experienced selling pressure during October 2013 and again in March 2014 due to investors taking profits on their recent strong performance. |
Describe recent portfolio activity.
| Ÿ | | During the six-month period, the Fund pared back exposure to Japan, moving to a slight underweight versus the benchmark index, with most of the sales within consumer discretionary, financials and materials. The proceeds were rotated into stock-specific ideas within industrials and also financial stocks that are more sensitive to a recovering U.S. economy. |
Describe portfolio positioning at period end.
| Ÿ | | Relative to the MSCI All Country World Index, the Fund ended the period overweight in European equities and underweight developed markets in the Americas and Asia ex-Japan. From a sector perspective, the Fund was most notably overweight in industrials and health care, while the most significant underweights were in energy and consumer staples. |
The views expressed reflect the opinions of BlackRock as of the date of this report and are subject to change based on changes in market, economic or other conditions. These views are not intended to be a forecast of future events and are no guarantee of future results.
| | |
| Ten Largest Holdings | | Percent of
Long-Term
Investments |
| | | | |
Google, Inc., Class A | | | 2 | % |
Apple, Inc. | | | 2 | |
JPMorgan Chase & Co. | | | 2 | |
NH Hoteles SA | | | 2 | |
Covidien PLC | | | 2 | |
Citigroup, Inc. | | | 2 | |
Kennedy-Wilson Holdings, Inc. | | | 1 | |
Anheuser-Busch InBev NV | | | 1 | |
BankUnited, Inc. | | | 1 | |
Vivendi SA | | | 1 | |
| | |
| Geographic Allocation | | Percent of
Long-Term
Investments |
| | | | |
United States | | | 48 | % |
United Kingdom | | | 7 | |
France | | | 5 | |
Germany | | | 5 | |
Ireland | | | 5 | |
Japan | | | 5 | |
China | | | 3 | |
Spain | | | 3 | |
Switzerland | | | 3 | |
Italy | | | 2 | |
Sweden | | | 2 | |
Other1 | | | 12 | |
| 1 | Includes holdings within countries that are 1% or less of long-term investments. Please refer to the Schedule of Investments for such countries. |
| | | | | | |
| 4 | | BLACKROCK FUNDS | | MARCH 31, 2014 | | |
| | |
| | | BlackRock Global Opportunities Portfolio |
|
| Total Return Based on a $10,000 Investment |
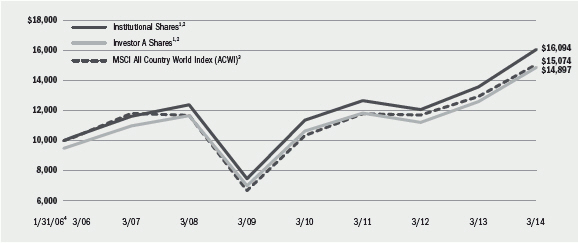
| | 1 | Assuming maximum sales charges, if any, transaction costs and other operating expenses, including investment advisory fees and administration fees, if any. Institutional Shares do not have a sales charge. |
| | 2 | Under normal market conditions, the Fund will invests at least 75% of its total assets in global equity securities of any market capitalization, selected for their above-average return potential. The Fund may invest up to 25% of its total assets in stocks of issuers in emerging market countries. The Fund may also invest up to 25% of its total assets in global fixed-income securities, including corporate bonds, U.S. government debt securities, non-U.S. government and supranational debt securities, asset-backed securities, mortgage-backed securities, emerging market debt securities and non-investment grade debt securities (high yield or junk bonds). |
| | 3 | This unmanaged index is a free float-adjusted market capitalization weighted index that is designed to measure the equity market performance of developed and emerging markets. The MSCI All Country World Index consists of 45 country indices comprising 24 developed and 21 emerging market country indices. |
| | 4 | Commencement of operations. |
| | | | | | | | | | | | | | | | | | | | | | | | | | | | |
| Performance Summary for the Period Ended March 31, 2014 | |
| | | | | | Average Annual Total Returns5 | |
| | | | | | 1 Year | | | 5 Years | | | Since Inception6 | |
| | | 6-Month
Total Returns | | | w/o sales
charge | | | w/sales
charge | | | w/o sales
charge | | | w/sales
charge | | | w/o sales
charge | | | w/sales
charge | |
Institutional | | | 8.87 | % | | | 18.49 | % | | | N/A | | | | 16.69 | % | | | N/A | | | | 6.00 | % | | | N/A | |
Investor A | | | 8.63 | | | | 18.22 | | | | 12.01 | % | | | 16.42 | | | | 15.17 | % | | | 5.70 | | | | 5.00 | % |
Investor B | | | 8.24 | | | | 17.17 | | | | 12.67 | | | | 15.62 | | | | 15.39 | | | | 4.93 | | | | 4.93 | |
Investor C | | | 8.19 | | | | 17.16 | | | | 16.16 | | | | 15.63 | | | | 15.63 | | | | 4.89 | | | | 4.89 | |
Class R | | | 8.36 | | | | 17.66 | | | | N/A | | | | 15.93 | | | | N/A | | | | 5.31 | | | | N/A | |
MSCI All Country World Index (ACWI) | | | 8.48 | | | | 16.55 | | | | N/A | | | | 17.80 | | | | N/A | | | | 5.15 | | | | N/A | |
| | 5 | Assuming maximum sales charges, if any. Average annual total returns with and without sales charges reflect reductions for distribution and service fees. See “About Fund Performance” on page 14 for a detailed description of share classes, including any related sales charges and fees. |
| | 6 | The Fund commenced operations on January 31, 2006. |
| | | N/A—Not applicable as share class and index do not have a sales charge. |
| | | Past performance is not indicative of future results. |
| | | | | | | | | | | | | | |
| Expense Example |
| | | Actual | | Hypothetical8 | | |
| | | Beginning
Account Value
October 1, 2013 | | Ending
Account Value
March 31, 2014 | | Expenses Paid
During the Period7 | | Beginning
Account Value
October 1, 2013 | | Ending
Account Value
March 31, 2014 | | Expenses Paid
During the Period7 | | Annualized
Expense Ratio |
Institutional | | $1,000.00 | | $1,088.70 | | $5.52 | | $1,000.00 | | $1,019.65 | | $5.34 | | 1.06% |
Investor A | | $1,000.00 | | $1,086.30 | | $6.92 | | $1,000.00 | | $1,018.30 | | $6.69 | | 1.33% |
Investor B | | $1,000.00 | | $1,082.40 | | $11.32 | | $1,000.00 | | $1,014.06 | | $10.95 | | 2.18% |
Investor C | | $1,000.00 | | $1,081.90 | | $11.11 | | $1,000.00 | | $1,014.26 | | $10.75 | | 2.14% |
Class R | | $1,000.00 | | $1,083.60 | | $8.93 | | $1,000.00 | | $1,016.36 | | $8.65 | | 1.72% |
| | 7 | For each class of the Fund, expenses are equal to the annualized expense ratio for the class, multiplied by the average account value over the period, multiplied by 182/365 (to reflect the one-half year period shown). |
| | 8 | Hypothetical 5% annual return before expenses is calculated by pro rating the number of days in the most recent fiscal half year divided by 365. |
| | | See “Disclosure of Expenses” on page 15 for further information on how expenses were calculated. |
| | | | | | |
| | | BLACKROCK FUNDS | | MARCH 31, 2014 | | 5 |
| | | | |
| Fund Summary as of March 31, 2014 | | | BlackRock Health Sciences Opportunities Portfolio | |
BlackRock Health Sciences Opportunities Portfolio’s (the “Fund”) investment objective is to provide long-term growth of capital.
|
| Portfolio Management Commentary |
How did the Fund perform?
| Ÿ | | For the six-month period ended March 31, 2014, the Fund underperformed its benchmark, the Russell 3000® Health Care Index, and outperformed the broad-market S&P 500® Index. The following discussion of relative performance pertains to the Russell 3000® Health Care Index. |
What factors influenced performance?
| Ÿ | | The Fund’s underperformance relative to the benchmark index was attributable mostly to an overweight allocation and stock selection in the biotechnology industry. During October 2013 and again in March 2014, biotechnology stocks experienced selling pressure due to investors taking profits on their recent strong performance, with small and medium capitalization stocks declining the most. Also detracting from relative performance was the Fund’s underweight allocation to pharmaceuticals as investors preferred the stability of these large capitalization companies during periods of market turbulence. |
| Ÿ | | Key contributors to relative performance were the Fund’s overweight allocation and stock selection in the life sciences tools & services industry and an underweight allocation and stock selection in health care services. |
Describe recent portfolio activity.
| Ÿ | | During the fourth quarter of 2013, the Fund sold several of its biotechnology holdings given their recent strong price appreciation and consequently, less appealing risk-reward profiles. These proceeds were invested in both devices & supplies and pharmaceutical companies selected for their individual fundamental merits and attractive valuations. Amid market weakness in March, the Fund took profits on higher growth positions across the portfolio as recent strong performance in these names made them particularly vulnerable in the market downturn. |
Describe portfolio positioning at period end.
| Ÿ | | As of period end, valuations in the health care remained reasonable, even after the strong performance of the sector over the previous two years. The Fund continued to maintain a focus on innovative companies and, as such, the two largest industry allocations were biotechnology and pharmaceuticals, where the innovation cycle is in an upward trend and is expected to drive a secular growth story. Additionally, given the potential for this theme expanding to medical devices in 2014, the Fund maintained holdings in several of these companies with new product launches on the horizon. |
The views expressed reflect the opinions of BlackRock as of the date of this report and are subject to change based on changes in market, economic or other conditions. These views are not intended to be a forecast of future events and are no guarantee of future results.
| | |
| Ten Largest Holdings | | Percent of
Long-Term
Investments |
| | | | |
Johnson & Johnson | | | 4 | % |
Biogen Idec, Inc. | | | 4 | |
Pfizer, Inc. | | | 4 | |
Merck & Co., Inc. | | | 3 | |
AbbVie, Inc. | | | 3 | |
Alexion Pharmaceuticals, Inc. | | | 3 | |
Bayer AG, Registered Shares | | | 3 | |
Celgene Corp. | | | 3 | |
UnitedHealth Group, Inc. | | | 2 | |
Covidien PLC | | | 2 | |
| | |
| Industry Allocation | | Percent of
Long-Term
Investments |
| | | | |
Pharmaceuticals | | | 36 | % |
Biotechnology | | | 26 | |
Health Care Equipment & Supplies | | | 18 | |
Health Care Providers & Services | | | 12 | |
Life Sciences Tools & Services | | | 6 | |
Health Care Technology | | | 1 | |
Chemicals | | | 1 | |
For Fund compliance purposes, the Fund’s industry classifications refer to any one or more of the industry sub-classifications used by one or more widely recognized market indexes or ratings group indexes, and/or as defined by the investment advisor. These definitions may not apply for purposes of this report, which may combine such industry sub-classifications for reporting ease.
| | | | | | |
| 6 | | BLACKROCK FUNDS | | MARCH 31, 2014 | | |
| | |
| | | BlackRock Health Sciences Opportunities Portfolio |
|
| Total Return Based on a $10,000 Investment |
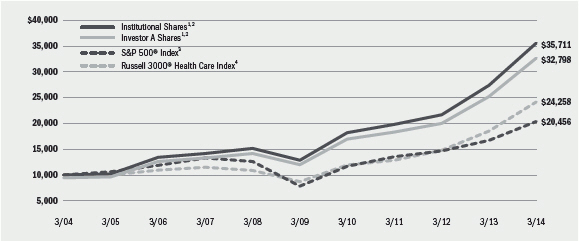
| | 1 | Assuming maximum sales charges, if any, transaction costs and other operating expenses, including investment advisory fees and administration fees, if any. Institutional Shares do not have a sales charge. |
| | 2 | Under normal market conditions, the Fund invests at least 80% of its total assets in equity securities, primarily common stock, of companies in health sciences and related industries. |
| | 3 | An unmanaged total return index, which covers 500 industrial, utility, transportation and financial companies of the U.S. markets (mostly New York Stock Exchange (“NYSE”) issues) representing about 75% of NYSE market capitalization and 30% of NYSE issues. |
| | 4 | An unmanaged index representative of companies involved in medical services or health care in the Russell 3000® Index, which is comprised of the 3,000 largest US companies as determined by total market capitalization. |
| | | | | | | | | | | | | | | | | | | | | | | | | | | | |
| Performance Summary for the Period Ended March 31, 2014 | |
| | | | | | Average Annual Total Returns5 | |
| | | | | | 1 Year | | | 5 Years | | | 10 Years | |
| | | 6-Month Total Returns | | | w/o sales charge | | | w/sales charge | | | w/o sales charge | | | w/sales charge | | | w/o sales charge | | | w/sales charge | |
Institutional | | | 14.20 | % | | | 29.84 | % | | | N/A | | | | 22.55 | % | | | N/A | | | | 13.57 | % | | | N/A | |
Service | | | 14.02 | | | | 29.46 | | | | N/A | | | | 22.18 | | | | N/A | | | | 13.25 | | | | N/A | |
Investor A | | | 14.02 | | | | 29.46 | | | | 22.67 | % | | | 22.18 | | | | 20.87 | % | | | 13.22 | | | | 12.61 | % |
Investor B | | | 13.57 | | | | 28.42 | | | | 23.92 | | | | 21.21 | | | | 21.03 | | | | 12.52 | | | | 12.52 | |
Investor C | | | 13.60 | | | | 28.52 | | | | 27.52 | | | | 21.30 | | | | 21.30 | | | | 12.41 | | | | 12.41 | |
Class R | | | 13.90 | | | | 29.10 | | | | N/A | | | | 21.68 | | | | N/A | | | | 12.72 | | | | N/A | |
S&P 500® Index | | | 12.51 | | | | 21.86 | | | | N/A | | | | 21.16 | | | | N/A | | | | 7.42 | | | | N/A | |
Russell 3000® Health Care Index | | | 16.22 | | | | 30.56 | | | | N/A | | | | 22.67 | | | | N/A | | | | 9.27 | | | | N/A | |
| | 5 | Assuming maximum sales charges, if any. Average annual total returns with and without sales charges reflect reductions for distribution and service fees. See “About Fund Performance” on page 14 for a detailed description of share classes, including any related sales charges and fees. |
| | | N/A—Not applicable as share class and index do not have a sales charge. |
| | | Past performance is not indicative of future results. |
| | | | | | | | | | | | | | |
| Expense Example |
| | | Actual | | Hypothetical7 | | |
| | | Beginning Account Value
October 1, 2013 | | Ending Account Value
March 31, 2014 | | Expenses Paid
During the Period6 | | Beginning
Account Value
October 1, 2013 | | Ending
Account Value
March 31, 2014 | | Expenses Paid
During the Period6 | | Annualized
Expense Ratio |
Institutional | | $1,000.00 | | $1,142.00 | | $4.75 | | $1,000.00 | | $1,020.49 | | $4.48 | | 0.89% |
Service | | $1,000.00 | | $1,140.20 | | $6.30 | | $1,000.00 | | $1,019.05 | | $5.94 | | 1.18% |
Investor A | | $1,000.00 | | $1,140.20 | | $6.24 | | $1,000.00 | | $1,019.10 | | $5.89 | | 1.17% |
Investor B | | $1,000.00 | | $1,135.70 | | $10.60 | | $1,000.00 | | $1,015.01 | | $10.00 | | 1.99% |
Investor C | | $1,000.00 | | $1,136.00 | | $10.12 | | $1,000.00 | | $1,015.46 | | $9.55 | | 1.90% |
Class R | | $1,000.00 | | $1,139.00 | | $7.73 | | $1,000.00 | | $1,017.70 | | $7.29 | | 1.45% |
| | 6 | For each class of the Fund, expenses are equal to the annualized expense ratio for the class, multiplied by the average account value over the period, multiplied by 182/365 (to reflect the one-half year period shown). |
| | 7 | Hypothetical 5% annual return before expenses is calculated by pro rating the number of days in the most recent fiscal half year divided by 365. |
| | | See “Disclosure of Expenses” on page 15 for further information on how expenses were calculated. |
| | | | | | |
| | | BLACKROCK FUNDS | | MARCH 31, 2014 | | 7 |
| | | | |
| Fund Summary as of March 31, 2014 | | | BlackRock International Opportunities Portfolio | |
BlackRock International Opportunities Portfolio’s (the “Fund”) investment objective is to seek long-term capital appreciation.
|
| Portfolio Management Commentary |
How did the Fund perform?
| Ÿ | | For the six-month period ended March 31, 2014, the Fund outperformed its benchmark, the MSCI All Country World Index (“ACWI”) Ex-U.S. |
What factors influenced performance?
| Ÿ | | The Fund’s outperformance was driven by stock selection in the financials, industrials and health care sectors. Within financials, the Fund’s positions in Bank of Ireland and Bankinter SA boosted returns as financial conditions improved in the peripheral European countries during the period. In the industrials sector, Sacyr SA contributed positively as the company benefited from the beginning of an economic recovery in Spain and investor optimism for its debt restructuring plans. In health care, the Fund benefited from a position in Roche Holding AG as investors responded favorably to the company’s strong business results and future pipeline potential. From a regional perspective, an overweight allocation to Europe, stock selection in emerging Asia, and an underweight allocation to emerging Americas all contributed positively to performance. |
| Ÿ | | Conversely, stock selection in the information technology (“IT”) sector detracted from relative performance, specifically within the internet software & services industry. Exposure to high-growth names across the portfolio had a negative impact on results as investors shifted away from these |
| | | stocks in favor of more value-oriented companies. Additionally, the Fund’s underweight allocation to utilities proved disadvantageous as the sector generated strong performance over the period. Regionally, stock selection in Japan negatively impacted performance in the latter part of the period as investors harvested profits following the strong performance of these stocks in 2013. |
Describe recent portfolio activity.
| Ÿ | | During the six-month period, the Fund marginally reduced its overweight to developed Europe, with the more notable reductions focused in the United Kingdom and France. Offsetting this slight reduction was an increased allocation to emerging Asia, specifically within China and South Korea. From a sector perspective, the Fund decreased exposures to consumer discretionary and IT, and increased weightings in the health care and telecommunication services sectors. |
Describe portfolio positioning at period end.
| Ÿ | | Relative to the MSCI All Country World Index Ex-U.S., the Fund ended the period overweight in Europe and underweight in both emerging markets and Asia ex-Japan. On a sector basis, the Fund was most notably overweight in industrials and health care, while the most significant underweights were in consumer staples and energy. |
The views expressed reflect the opinions of BlackRock as of the date of this report and are subject to change based on changes in market, economic or other conditions. These views are not intended to be a forecast of future events and are no guarantee of future results.
| | | | |
| Ten Largest Holdings | | Percent of
Long-Term
Investments | |
Novartis AG, Registered Shares | | | 3 | % |
Roche Holding AG | | | 3 | |
SoftBank Corp. | | | 2 | |
Svenska Cellulosa AB SCA, B Shares | | | 2 | |
Vivendi SA | | | 2 | |
Daimler AG, Registered Shares | | | 2 | |
Sumitomo Mitsui Financial Group, Inc. | | | 2 | |
Anheuser-Busch InBev NV | | | 2 | |
AstraZeneca PLC | | | 2 | |
NH Hoteles SA | | | 2 | |
| | | | |
| Geographic Allocation | | Percent of
Long-Term
Investments | |
United Kingdom | | | 15 | % |
Japan | | | 12 | |
Switzerland | | | 10 | |
Germany | | | 9 | |
France | | | 8 | |
Ireland | | | 5 | |
China | | | 4 | |
Sweden | | | 4 | |
Canada | | | 3 | |
Denmark | | | 3 | |
Italy | | | 3 | |
Netherlands | | | 3 | |
Spain | | | 3 | |
United States | | | 3 | |
Belgium | | | 2 | |
Other1 | | | 13 | |
| | 1 | Includes holdings within countries that are 1% or less of long-term investments. Please refer to the Schedule of Investments for such countries. |
| | | | | | |
| 8 | | BLACKROCK FUNDS | | MARCH 31, 2014 | | |
| | |
| | | BlackRock International Opportunities Portfolio |
|
| Total Return Based on a $10,000 Investment |
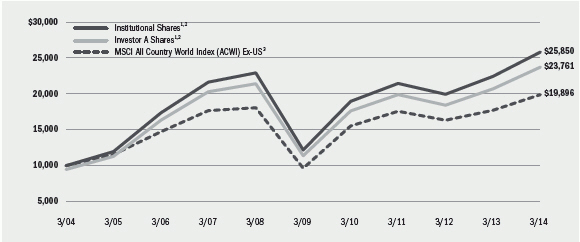
| | 1 | Assuming maximum sales charges, if any, transaction costs and other operating expenses, including investment advisory fees and administration fees, if any. Institutional Shares do not have a sales charge. |
| | 2 | Under normal market conditions, the Fund invests at least 80% of its net assets in equity securities issued by foreign companies of any market capitalization. The Fund may invest up to 40% of its net assets in stocks of issuers in emerging market countries. |
| | 3 | A market capitalization weighted index maintained by MSCI Inc. and is designed to provide a broad measure of stock performance throughout the world, with the exception of US-based companies. The index includes both developed and emerging markets. |
| | | | | | | | | | | | | | | | | | | | | | | | | | | | |
| Performance Summary for the Period Ended March 31, 2014 | | | | | | | | |
| | | | | | Average Annual Total Returns4 | |
| | | | | | 1 Year | | | 5 Years | | | 10 Years | |
| | | 6-Month
Total Returns | | | w/o sales
charge | | | w/sales
charge | | | w/o sales
charge | | | w/sales
charge | | | w/o sales
charge | | | w/sales
charge | |
Institutional | | | 7.48 | % | | | 15.09 | % | | | N/A | | | | 16.16 | % | | | N/A | | | | 9.96 | % | | | N/A | |
Service | | | 7.34 | | | | 14.72 | | | | N/A | | | | 15.69 | | | | N/A | | | | 9.57 | | | | N/A | |
Investor A | | | 7.33 | | | | 14.75 | | | | 8.73 | % | | | 15.85 | | | | 14.61 | % | | | 9.63 | | | | 9.04 | % |
Investor B | | | 6.89 | | | | 13.83 | | | | 9.33 | | | | 14.92 | | | | 14.69 | | | | 8.95 | | | | 8.95 | |
Investor C | | | 6.93 | | | | 13.91 | | | | 12.91 | | | | 14.96 | | | | 14.96 | | | | 8.80 | | | | 8.80 | |
MSCI All Country World Index (ACWI) Ex-US | | | 5.30 | | | | 12.31 | | | | N/A | | | | 15.52 | | | | N/A | | | | 7.12 | | | | N/A | |
| | 4 | Assuming maximum sales charges, if any. Average annual total returns with and without sales charges reflect reductions for distribution and service fees. See “About Fund Performance” on page 14 for a detailed description of share classes, including any related sales charges and fees. |
| | | N/A—Not applicable as share class and index do not have a sales charge. |
| | | Past performance is not indicative of future results. |
| | | | | | | | | | | | | | | | | | | | | | | | | | | | |
| Expense Example | | | | | | | | |
| | | Actual | | | Hypothetical6 | | | | |
| | | Beginning
Account Value
October 1, 2013 | | | Ending
Account Value
March 31, 2014 | | | Expenses Paid
During the Period5 | | | Beginning
Account Value
October 1, 2013 | | | Ending
Account Value
March 31, 2014 | | | Expenses Paid
During the Period5 | | | Annualized
Expense Ratio | |
Institutional | | | $1,000.00 | | | | $1,074.80 | | | | $6.26 | | | | $1,000.00 | | | | $1,018.90 | | | | $6.09 | | | | 1.21 | % |
Service | | | $1,000.00 | | | | $1,073.40 | | | | $7.75 | | | | $1,000.00 | | | | $1,017.45 | | | | $7.54 | | | | 1.50 | % |
Investor A | | | $1,000.00 | | | | $1,073.30 | | | | $7.81 | | | | $1,000.00 | | | | $1,017.40 | | | | $7.59 | | | | 1.51 | % |
Investor B | | | $1,000.00 | | | | $1,068.90 | | | | $12.17 | | | | $1,000.00 | | | | $1,013.16 | | | | $11.85 | | | | 2.36 | % |
Investor C | | | $1,000.00 | | | | $1,069.30 | | | | $11.71 | | | | $1,000.00 | | | | $1,013.61 | | | | $11.40 | | | | 2.27 | % |
| | 5 | For each class of the Fund, expenses are equal to the annualized expense ratio for the class, multiplied by the average account value over the period, multiplied by 182/365 (to reflect the one-half year period shown). |
| | 6 | Hypothetical 5% annual return before expenses is calculated by pro rating the number of days in the most recent fiscal half year divided by 365. |
| | | See “Disclosure of Expenses” on page 15 for further information on how expenses were calculated. |
| | | | | | |
| | | BLACKROCK FUNDS | | MARCH 31, 2014 | | 9 |
| | | | |
| Fund Summary as of March 31, 2014 | | | BlackRock Science & Technology Opportunities Portfolio | |
BlackRock Science & Technology Opportunities Portfolio’s (the “Fund”) investment objective is to provide long-term capital appreciation.
|
| Portfolio Management Commentary |
| Ÿ | | Effective October 11, 2013, the benchmark against which the Fund measures its performance changed from the NYSE Arca Tech 100 IndexSM to the MSCI World Information Technology Index. The investment adviser believes that this change in the benchmark better represents the sector exposures of the Fund and is a more appropriate basis for evaluating performance. |
How did the Fund perform?
| Ÿ | | For the six-month period ended March 31, 2014, the Fund outperformed the MSCI World Information Technology Index. The Fund’s Institutional Shares performed in line with its former benchmark, the NYSE Arca Tech 100 IndexSM, while all other share classes underperformed its former benchmark. The following discussion of relative performance pertains to the MSCI World Information Technology Index. |
What factors influenced performance?
| Ÿ | | Stock selection within the application software segment, was the largest contributor to the Fund’s outperformance due to positions in big data provider Splunk, Inc. and computer-aided design provider Autodesk, Inc. as these companies benefited from being the “best-of-breed” (those offering industry-leading solutions) within their respective markets. |
| Ÿ | | Additionally, the Fund’s holdings in data processing & outsourced services had a positive impact on returns. In particular, names such as |
| | Alliance Data Systems Corp., GMO Payment Gateway, Inc. and QIWI PLC were notable contributors as they continued to benefit from a secular shift from cash-based to electronic-based payment transactions. |
| Ÿ | | Detracting from relative performance was stock selection within semiconductor equipment where Aixtron SE suffered due to equipment order delays. Despite the short-term weakness, the Fund continued to hold the stock given a positive long-term outlook for the company. |
Describe recent portfolio activity.
| Ÿ | | During the six-month period, the Fund reduced exposure to application software and internet software & services stocks as the Fund took profits in names that had strong performance in recent months. These proceeds helped fund purchases of internet retailers with the potential to benefit from a fast-growing e-commerce market. |
Describe portfolio positioning at period end.
| Ÿ | | Relative to the MSCI World Information Technology Index, the Fund ended the period overweight in application software and internet software & services stocks and underweight in computer storage & peripherals names. From a regional perspective, the Fund was most notably overweight in emerging Asia and Asia ex-Japan, while the most significant underweights were in the developed Americas and Japan. |
The views expressed reflect the opinions of BlackRock as of the date of this report and are subject to change based on changes in market, economic or other conditions. These views are not intended to be a forecast of future events and are no guarantee of future results.
| | |
| Ten Largest Holdings | | Percent of Long-Term Investments |
| | | | |
Apple, Inc. | | | 5 | % |
Google, Inc., Class A | | | 5 | |
21Vianet Group, Inc. - ADR | | | 3 | |
Alliance Data Systems Corp. | | | 3 | |
Facebook, Inc., Class A | | | 3 | |
Amazon.com, Inc. | | | 3 | |
Salesforce.com, Inc. | | | 3 | |
priceline.com, Inc. | | | 2 | |
Tencent Holdings Ltd. | | | 2 | |
Vipshop Holdings Ltd. - ADR | | | 2 | |
| | |
| Industry Allocation | | Percent of Long-Term Investments |
| | | | |
Internet Software & Services | | | 31 | % |
Software | | | 24 | |
IT Services | | | 14 | |
Semiconductors & Semiconductor Equipment | | | 10 | |
Internet & Catalog Retail | | | 10 | |
Technology Hardware, Storage & Peripherals | | | 6 | |
Other1 | | | 5 | |
| | 1 | Includes holdings within industries that are 1% or less of long-term investments. Please refer to the Schedule of Investments for such industries. |
For Fund compliance purposes, the Fund’s industry classifications refer to any one or more of the industry sub-classifications used by one or more widely recognized market indexes or ratings group indexes, and/or as defined by the investment advisor. These definitions may not apply for purposes of this report, which may combine such industry sub-classifications for reporting ease.
| | | | | | |
| 10 | | BLACKROCK FUNDS | | MARCH 31, 2014 | | |
| | | | |
| | | | BlackRock Science & Technology Opportunities Portfolio | |
|
| Total Return Based on a $10,000 Investment |
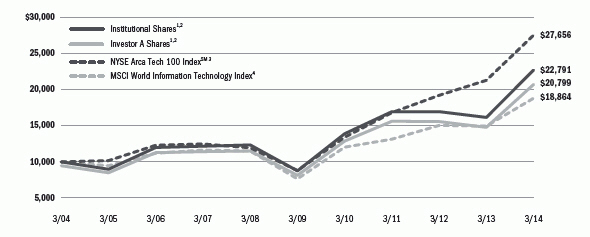
| | 1 | Assuming maximum sales charges, if any, transaction costs and other operating expenses, including investment advisory fees and administration fees, if any. Institutional Shares do not have a sales charge. |
| | 2 | Under normal market conditions, the Fund invests at least 80% of its net assets in equity securities issued by U.S. and non-U.S. science and technology companies in all market capitalization ranges, selected for their rapid and sustainable growth potential from the development, advancement and use of science and/or use of technology. The Fund may invest up to 25% of its net assets in emerging market countries. |
| | 3 | A price-weighted index comprised of common stocks and ADRs of technology-related companies listed on U.S. exchanges. Modeled as a multi-industry technology index, the objective of the NYSE Arca Tech 100 IndexSM is to provide a benchmark for measuring the performance of companies using technology innovation across a broad spectrum of industries. |
| | 4 | An index that measures the performance of the technology sector in developed equity markets. Effective October 11, 2013, the Fund now uses this index as its benchmark rather than the NYSE Arca Tech 100 Index SM because management believes that this benchmark better represents the sector exposures of the Fund and is a more appropriate basis for evaluating performance. |
| | | | | | | | | | | | | | | | | | | | | | | | | | | | |
| Performance Summary for the Period Ended March 31, 2014 | | | | | | | | |
| | | | | | Average Annual Total Returns5 | |
| | | | | | 1 Year | | | 5 Years | | | 10 Years | |
| | | 6-Month
Total Returns | | | w/o sales
charge | | | w/sales
charge | | | w/o sales
charge | | | w/sales
charge | | | w/o sales
charge | | | w/sales
charge | |
Institutional | | | 16.46 | % | | | 40.65 | % | | | N/A | | | | 21.04 | % | | | N/A | | | | 8.59 | % | | | N/A | |
Service | | | 16.26 | | | | 40.25 | | | | N/A | | | | 20.74 | | | | N/A | | | | 8.27 | | | | N/A | |
Investor A | | | 16.28 | | | | 40.19 | | | | 32.83 | % | | | 20.61 | | | | 19.31 | % | | | 8.18 | | | | 7.60 | % |
Investor B | | | 15.74 | | | | 38.94 | | | | 34.44 | | | | 19.59 | | | | 19.40 | | | | 7.45 | | | | 7.45 | |
Investor C | | | 15.78 | | | | 38.91 | | | | 37.91 | | | | 19.53 | | | | 19.53 | | | | 7.24 | | | | 7.24 | |
Class R | | | 16.11 | | | | 39.80 | | | | N/A | | | | 20.28 | | | | N/A | | | | 7.81 | | | | N/A | |
NYSE Arca Tech 100 IndexSM | | | 16.50 | | | | 29.42 | | | | N/A | | | | 25.71 | | | | N/A | | | | 10.71 | | | | N/A | |
MSCI World Information Technology Index | | | 14.10 | | | | 25.57 | | | | N/A | | | | 19.75 | | | | N/A | | | | 6.55 | | | | N/A | |
| | 5 | Assuming maximum sales charges, if any. Average annual total returns with and without sales charges reflect reductions for distribution and service fees. See “About Fund Performance” on page 14 for a detailed description of share classes, including any related sales charges and fees. |
| | | N/A—Not applicable as share class and index do not have a sales charge. Past performance is not indicative of future results. |
| | | | | | | | | | | | | | | | | | | | | | | | | | | | |
| Expense Example | | | | | | | | |
| | | Actual | | | Hypothetical7 | | | | |
| | | Beginning
Account Value
October 1, 2013 | | | Ending
Account Value
March 31, 2014 | | | Expenses Paid
During the Period6 | | | Beginning
Account Value
October 1, 2013 | | | Ending
Account Value
March 31, 2014 | | | Expenses Paid
During the Period6 | | | Annualized
Expense Ratio | |
Institutional | | | $1,000.00 | | | | $1,164.60 | | | | $6.96 | | | | $1,000.00 | | | | $1,018.50 | | | | $6.49 | | | | 1.29 | % |
Service | | | $1,000.00 | | | | $1,162.60 | | | | $7.71 | | | | $1,000.00 | | | | $1,017.80 | | | | $7.19 | | | | 1.43 | % |
Investor A | | | $1,000.00 | | | | $1,162.80 | | | | $8.68 | | | | $1,000.00 | | | | $1,016.90 | | | | $8.10 | | | | 1.61 | % |
Investor B | | | $1,000.00 | | | | $1,157.40 | | | | $12.96 | | | | $1,000.00 | | | | $1,012.91 | | | | $12.09 | | | | 2.41 | % |
Investor C | | | $1,000.00 | | | | $1,157.80 | | | | $13.18 | | | | $1,000.00 | | | | $1,012.72 | | | | $12.29 | | | | 2.45 | % |
Class R | | | $1,000.00 | | | | $1,161.10 | | | | $10.18 | | | | $1,000.00 | | | | $1,015.51 | | | | $9.50 | | | | 1.89 | % |
| | 6 | For each class of the Fund, expenses are equal to the annualized expense ratio for the class, multiplied by the average account value over the period, multiplied by 182/365 (to reflect the one-half year period shown). |
| | 7 | Hypothetical 5% annual return before expenses is calculated by pro rating the number of days in the most recent fiscal half year divided by 365. |
| | | See “Disclosure of Expenses” on page 15 for further information on how expenses were calculated. |
| | | | | | |
| | | BLACKROCK FUNDS | | MARCH 31, 2014 | | 11 |
| | | | |
| Fund Summary as of March 31, 2014 | | | BlackRock U.S. Opportunities Portfolio | |
BlackRock U.S. Opportunities Portfolio’s (the “Fund”) investment objective is to provide long-term capital appreciation.
|
| Portfolio Management Commentary |
How did the Fund perform?
| Ÿ | | For the six-month period ended March 31, 2014, the Fund’s Institutional, Investor A and Service Shares outperformed the benchmark, the Russell Midcap® Index, while the Fund’s Investor B Shares underperformed and Investor C Shares performed in line with the benchmark index. |
What factors influenced performance?
| Ÿ | | Stock selection within the financials and information technology (“IT”) sectors were the largest contributors to relative performance for the period. Within financials, exposure to regional banks such as Western Alliance Bancorp and BankUnited, Inc. generated strong performance as these names benefited from the continued recovery in U.S. credit and a pickup in commercial loan demand. Within IT, the continued growth in demand for big-data analytics benefited the Fund’s application software holding, Splunk, Inc. |
| Ÿ | | Conversely, stock selection in the consumer discretionary and energy sectors detracted from relative performance. In consumer discretionary, |
| | | selection in the cable & satellite segment hampered results after Sirius XM Holdings, Inc. gave back its earlier gains by the end of the reporting period. Within energy, selection decisions in the oil & gas exploration & production industry detracted from performance. In particular, Cabot Oil & Gas Corp. was negatively impacted by investors’ near-term concerns about the outlook for natural gas discounts. |
Describe recent portfolio activity.
| Ÿ | | During the six-month period, the Fund reduced exposures to the financials, IT and utilities sectors and increased exposures to health care and consumer discretionary. |
Describe portfolio positioning at period end.
| Ÿ | | Relative to the Russell Midcap® Index, the Fund ended the period overweight in the consumer discretionary, health care and materials sectors, while maintaining underweight allocations to utilities, financials and IT. |
The views expressed reflect the opinions of BlackRock as of the date of this report and are subject to change based on changes in market, economic or other conditions. These views are not intended to be a forecast of future events and are no guarantee of future results.
| | |
| Ten Largest Holdings | | Percent of
Long-Term
Investments |
| | | | |
Kennedy-Wilson Holdings, Inc. | | | 2 | % |
BankUnited, Inc. | | | 2 | |
Acuity Brands, Inc. | | | 2 | |
SBA Communications Corp., Class A | | | 1 | |
Jarden Corp. | | | 1 | |
Alliance Data Systems Corp. | | | 1 | |
WisdomTree Investments, Inc. | | | 1 | |
Roper Industries, Inc. | | | 1 | |
Sequential Brands Group, Inc. | | | 1 | |
Thermo Fisher Scientific, Inc. | | | 1 | |
| | |
| Sector Allocation | | Percent of
Long-Term
Investments |
| | | | |
Consumer Discretionary | | | 21 | % |
Financials | | | 17 | |
Health Care | | | 15 | |
Industrials | | | 14 | |
Information Technology | | | 14 | |
Materials | | | 7 | |
Energy | | | 6 | |
Consumer Staples | | | 4 | |
Telecommunication Services | | | 2 | |
For Fund compliance purposes, the Fund’s sector classifications refer to any one or more of the sector sub-classifications used by one or more widely recognized market indexes or ratings group indexes, and/or as defined by the investment advisor. These definitions may not apply for purposes of this report, which may combine such sector sub-classifications for reporting ease.
| | | | | | |
| 12 | | BLACKROCK FUNDS | | MARCH 31, 2014 | | |
| | | | |
| | | | BlackRock U.S. Opportunities Portfolio | |
|
| Total Return Based on a $10,000 Investment |

| | 1 | Assuming maximum sales charges, if any, transaction costs and other operating expenses, including investment advisory fees and administration fees, if any. Institutional Shares do not have a sales charge. |
| | 2 | Under normal market conditions, the Fund invests at least 80% of its net assets in equity securities issued by U.S. emerging capitalization companies with relatively attractive earnings growth potential and valuation. |
| | 3 | This market index measures the performance of the mid-cap segment of the U.S. equities universe. It is a subset of the Russell 1000® Index including approximately 800 of the smallest securities based on a combination of their market cap and current index membership. The Russell Midcap® Index represents approximately 31% of the total market capitalization of the Russell 1000® companies. |
|
| Performance Summary for the Period Ended March 31, 2014 |
| | | | | | | | | | | | | | | | | | | | | | | | | | | | |
| | | | | | Average Annual Total Returns4 | |
| | | | | | 1 Year | | | 5 Years | | | 10 Years | |
| | | 6-Month
Total Returns | | | w/o sales
charge | | | w/sales
charge | | | w/o sales
charge | | | w/sales
charge | | | w/o sales
charge | | | w/sales
charge | |
Institutional | | | 12.84 | % | | | 27.53 | % | | | N/A | | | | 21.80 | % | | | N/A | | | | 11.60 | % | | | N/A | |
Service | | | 12.62 | | | | 27.06 | | | | N/A | | | | 21.26 | | | | N/A | | | | 11.15 | | | | N/A | |
Investor A | | | 12.64 | | | | 27.04 | | | | 20.37 | % | | | 21.23 | | | | 19.93 | % | | | 11.10 | | | | 10.50 | % |
Investor B | | | 12.15 | | | | 26.01 | | | | 21.59 | | | | 20.28 | | | | 20.09 | | | | 10.43 | | | | 10.43 | |
Investor C | | | 12.20 | | | | 26.07 | | | | 25.09 | | | | 20.33 | | | | 20.33 | | | | 10.28 | | | | 10.28 | |
Russell Midcap® Index | | | 12.21 | | | | 23.51 | | | | N/A | | | | 25.55 | | | | N/A | | | | 10.05 | | | | N/A | |
| | 4 | Assuming maximum sales charges, if any. Average annual total returns with and without sales charges reflect reductions for distribution and service fees. See “About Fund Performance” on page 14 for a detailed description of share classes, including any related sales charges and fees. |
| | | N/A—Not applicable as share class and index do not have a sales charge. |
| | | Past performance is not indicative of future results. |
| | | | | | | | | | | | | | | | | | | | | | | | | | | | |
| | | Actual | | | Hypothetical6 | | | | |
| | | Beginning
Account Value
October 1, 2013 | | | Ending
Account Value
March 31, 2014 | | | Expenses Paid
During the Period5 | | | Beginning
Account Value
October 1, 2013 | | | Ending
Account Value
March 31, 2014 | | | Expenses Paid
During the Period5 | | | Annualized
Expense Ratio | |
Institutional | | | $1,000.00 | | | | $1,128.40 | | | | $5.09 | | | | $1,000.00 | | | | $1,020.14 | | | | $4.84 | | | | 0.96 | % |
Service | | | $1,000.00 | | | | $1,126.20 | | | | $7.21 | | | | $1,000.00 | | | | $1,018.15 | | | | $6.84 | | | | 1.36 | % |
Investor A | | | $1,000.00 | | | | $1,126.40 | | | | $7.21 | | | | $1,000.00 | | | | $1,018.15 | | | | $6.84 | | | | 1.36 | % |
Investor B | | | $1,000.00 | | | | $1,121.50 | | | | $11.37 | | | | $1,000.00 | | | | $1,014.21 | | | | $10.80 | | | | 2.15 | % |
Investor C | | | $1,000.00 | | | | $1,122.00 | | | | $11.22 | | | | $1,000.00 | | | | $1,014.36 | | | | $10.65 | | | | 2.12 | % |
| | 5 | For each class of the Fund, expenses are equal to the annualized expense ratio for the class, multiplied by the average account value over the period, multiplied by 182/365 (to reflect the one-half year period shown). |
| | 6 | Hypothetical 5% annual return before expenses is calculated by pro rating the number of days in the most recent fiscal half year divided by 365. |
| | | See “Disclosure of Expenses” on page 15 for further information on how expenses were calculated. |
| | | | | | |
| | | BLACKROCK FUNDS | | MARCH 31, 2014 | | 13 |
| Ÿ | | Institutional Shares are not subject to any sales charge. These shares bear no ongoing distribution or service fees and are available only to certain eligible investors. |
| Ÿ | | Service Shares are not subject to any sales charge (front-end load) or deferred sales charge. These shares are subject to a service fee of 0.25% per year (but no distribution fee) and are only available to eligible investors. Prior to January 28, 2005, the performance results of Service Shares of the BlackRock Health Sciences Opportunities Portfolio (“Health Sciences Opportunities”) are those of Investor A Shares restated to reflect Service Share fees. |
| Ÿ | | Investor A Shares are subject to a maximum initial sales charge (front-end load) of 5.25% and a service fee of 0.25% per year (but no distribution fee). Certain redemptions of these shares may be subject to a contingent deferred sales charge (“CDSC”) where no initial sales charge was paid at the time of purchase. |
| Ÿ | | Investor B Shares are subject to a maximum CDSC of 4.50% declining to 0% after six years. In addition, these shares are subject to a distribution fee of 0.75% per year and a service fee of 0.25% per year. These shares automatically convert to Investor A Shares after approximately eight years. (There is no initial sales charge for automatic share conversions.) All returns for periods greater than eight years reflect this conversion. These shares are only available through exchanges and dividend reinvestments by existing shareholders and for purchase by certain employer-sponsored retirement plans. |
| Ÿ | | Investor C Shares are subject to a 1.00% CDSC if redeemed within one year of purchase. In addition, these shares are subject to a distribution fee of 0.75% per year and a service fee of 0.25% per year. |
| Ÿ | | Class R Shares are not subject to any sales charge (front-end load) or deferred sales charge. These shares are subject to a distribution fee of 0.25% per year and a service fee of 0.25% per year. These shares are available only to certain employer-sponsored retirement plans. Prior to September 8, 2008, the performance results of Class R Shares of BlackRock Science & Technology Opportunities Portfolio are those of |
Institutional Shares (which have no distribution or service fees) restated to reflect Class R Share fees. Prior to September 12, 2011, the performance results of Class R Shares of BlackRock Global Opportunities Portfolio and Health Sciences Opportunities are those of the applicable Fund’s Institutional Shares (which have no distribution or service fees) restated to reflect Class R Share fees.
Performance information reflects past performance and does not guarantee future results. Current performance may be lower or higher than the performance data quoted. Refer to www.blackrock.com/funds to obtain performance data current to the most recent month-end. Performance results do not reflect the deduction of taxes that a shareholder would pay on Fund distributions or the redemption of Fund shares. Figures shown in each of the performance tables on the previous pages assume reinvestment of all dividends and distributions, if any, at net asset value (“NAV”) on the ex-dividend/payable dates. Investment return and principal value of shares will fluctuate so that shares, when redeemed, may be worth more or less than their original cost. Dividends paid to each class of shares will vary because of the different levels of service, distribution and transfer agency fees applicable to each class, which are deducted from the income available to be paid to shareholders.
Performance for Health Sciences Opportunities for the periods prior to January 28, 2005 is based on performance of a certain former State Street Research mutual fund that reorganized with Health Sciences Opportunities on that date.
BlackRock Advisors, LLC (the “Manager”), the Funds’ investment advisor, waived and/or reimbursed a portion of each Fund’s expenses. Without such waiver and/or reimbursement, each Fund’s performance would have been lower. The Manager is under no obligation to waive or reimburse or to continue waiving or reimbursing its fees after the applicable termination date. See Note 5 of the Notes to Financial Statements for additional information on waivers and reimbursements.
| | | | | | |
| 14 | | BLACKROCK FUNDS | | MARCH 31, 2014 | | |
Shareholders of the Funds may incur the following charges: (a) transactional expenses, such as sales charges; and (b) operating expenses, including investment advisory fees, administration fees, service and distribution fees, including 12b-1 fees, acquired fund fees and expenses and other Fund expenses. The expense examples on the previous pages (which are based on a hypothetical investment of $1,000 invested on October 1, 2013 and held through March 31, 2014) are intended to assist shareholders both in calculating expenses based on an investment in each Fund and in comparing these expenses with similar costs of investing in other mutual funds.
The expense examples provide information about actual account values and actual expenses. In order to estimate the expenses a shareholder paid during the period covered by this report, shareholders can divide their account value by $1,000 and then multiply the result by the number corresponding to their Fund and share class under the headings entitled “Expenses Paid During the Period.”
The expense examples also provide information about hypothetical account values and hypothetical expenses based on a Fund’s actual expense ratio and an assumed rate of return of 5% per year before expenses. In order to assist shareholders in comparing the ongoing expenses of investing in these Funds and other funds, compare the 5% hypothetical examples with the 5% hypothetical examples that appear in other funds’ shareholder reports.
The expenses shown in the expense examples are intended to highlight shareholders’ ongoing costs only and do not reflect any transactional expenses, such as sales charges, if any. Therefore, the hypothetical examples are useful in comparing ongoing expenses only, and will not help shareholders determine the relative total expenses of owning different funds. If these transactional expenses were included, shareholder expenses would have been higher.
|
| Derivative Financial Instruments |
The Funds may invest in various derivative financial instruments, including forward foreign currency exchange contracts and options, as specified in Note 4 of the Notes to Financial Statements, which may constitute forms of economic leverage. Such derivative financial instruments are used to obtain exposure to a security, index and/or market without owning or taking physical custody of securities or to hedge market, equity and/or foreign currency exchange rate risks. Derivative financial instruments involve risks, including the imperfect correlation between the value of a derivative financial instrument and the underlying asset, possible default of the counterparty to the transaction or illiquidity of the derivative financial
instrument. The Funds’ ability to use a derivative financial instrument successfully depends on the investment advisor’s ability to predict pertinent market movements accurately, which cannot be assured. The use of derivative financial instruments may result in losses greater than if they had not been used, may require a Fund to sell or purchase portfolio investments at inopportune times or for distressed values, may limit the amount of appreciation a Fund can realize on an investment, may result in lower dividends paid to shareholders and/or may cause a Fund to hold an investment that it might otherwise sell. The Funds’ investments in these instruments are discussed in detail in the Notes to Financial Statements.
| | | | | | |
| | | BLACKROCK FUNDS | | MARCH 31, 2014 | | 15 |
| | | | |
| Schedule of Investments March 31, 2014 (Unaudited) | | | BlackRock Global Opportunities Portfolio | |
| | | (Percentages shown are based on Net Assets) | |
| | | | | | | | |
| Common Stocks | | Shares | | | Value | |
Belgium — 1.4% | | | | | | | | |
Anheuser-Busch InBev NV | | | 46,918 | | | $ | 4,941,210 | |
Canada — 1.0% | | | | | | | | |
MEG Energy Corp. (a) | | | 106,200 | | | | 3,588,993 | |
China — 2.6% | | | | | | | | |
Anhui Conch Cement Co. Ltd., H Shares (b) | | | 716,000 | | | | 3,079,740 | |
Baidu, Inc. — ADR (a) | | | 10,500 | | | | 1,599,990 | |
China Cinda Asset Management Co. Ltd.,
H Shares (a)(b) | | | 2,203,000 | | | | 1,254,147 | |
Ctrip.com International Ltd. — ADR (a) | | | 35,700 | | | | 1,799,994 | |
Ping An Insurance Group Co. of China Ltd., H Shares | | | 184,000 | | | | 1,529,200 | |
| | | | | | | | |
| | | | | | | | 9,263,071 | |
Denmark — 1.2% | | | | | | | | |
ISS A/S (a) | | | 33,600 | | | | 1,128,401 | |
Novo Nordisk A/S, Class B | | | 66,700 | | | | 3,037,002 | |
| | | | | | | | |
| | | | | | | | 4,165,403 | |
France — 4.8% | | | | | | | | |
BNP Paribas SA | | | 33,870 | | | | 2,611,362 | |
Rexel SA | | | 84,200 | | | | 2,209,196 | |
Schneider Electric SA | | | 29,500 | | | | 2,614,491 | |
Société Générale SA | | | 75,275 | | | | 4,633,621 | |
Vivendi SA | | | 171,120 | | | | 4,762,782 | |
| | | | | | | | |
| | | | | | | | 16,831,452 | |
Germany — 5.2% | | | | | | | | |
Bayer AG, Registered Shares | | | 19,000 | | | | 2,573,065 | |
Commerzbank AG (a) | | | 105,390 | | | | 1,938,566 | |
Daimler AG, Registered Shares | | | 44,400 | | | | 4,200,214 | |
Henkel AG & Co. KGaA | | | 26,500 | | | | 2,852,534 | |
OSRAM Licht AG (a) | | | 60,400 | | | | 3,916,461 | |
Telefonica Deutschland Holding AG | | | 201,000 | | | | 1,604,120 | |
Wirecard AG | | | 34,400 | | | | 1,428,354 | |
| | | | | | | | |
| | | | | | | | 18,513,314 | |
Greece — 0.8% | | | | | | | | |
Alpha Bank AE (a) | | | 2,764,674 | | | | 2,712,875 | |
Hong Kong — 1.9% | | | | | | | | |
AIA Group Ltd. | | | 514,500 | | | | 2,447,039 | |
Melco Crown Entertainment Ltd. — ADR (a) | | | 44,100 | | | | 1,704,465 | |
Samsonite International SA (b) | | | 785,100 | | | | 2,429,240 | |
| | | | | | | | |
| | | | | | | | 6,580,744 | |
Indonesia — 1.5% | | | | | | | | |
Global Mediacom Tbk PT | | | 10,106,400 | | | | 2,103,878 | |
Matahari Department Store Tbk PT (a) | | | 2,462,200 | | | | 3,026,913 | |
| | | | | | | | |
| | | | | | | | 5,130,791 | |
Ireland — 5.0% | | | | | | | | |
Actavis PLC (a) | | | 8,500 | | | | 1,749,725 | |
Alkermes PLC (a) | | | 51,800 | | | | 2,283,862 | |
| | | | | | | | |
| Common Stocks | | Shares | | | Value | |
Ireland (concluded) | | | | | | | | |
Covidien PLC | | | 74,300 | | | $ | 5,472,938 | |
CRH PLC | | | 127,400 | | | | 3,567,222 | |
Eaton Corp. PLC | | | 23,970 | | | | 1,800,626 | |
Green REIT PLC (a) | | | 1,724,032 | | | | 2,850,150 | |
| | | | | | | | |
| | | | | | | | 17,724,523 | |
Italy — 2.3% | | | | | | | | |
Assicurazioni Generali SpA | | | 77,955 | | | | 1,737,595 | |
Banca Generali SpA | | | 87,272 | | | | 2,881,742 | |
Intesa Sanpaolo SpA | | | 699,015 | | | | 2,371,907 | |
Moncler SpA (a) | | | 69,700 | | | | 1,191,642 | |
| | | | | | | | |
| | | | | | | | 8,182,886 | |
Japan — 5.1% | | | | | | | | |
Kenedix Realty Investment Corp. | | | 345 | | | | 1,710,859 | |
Nabtesco Corp. | | | 109,700 | | | | 2,532,091 | |
Shinsei Bank Ltd. | | | 1,609,000 | | | | 3,158,846 | |
SMC Corp. | | | 7,200 | | | | 1,898,878 | |
SoftBank Corp. | | | 49,500 | | | | 3,740,629 | |
Sumitomo Mitsui Financial Group, Inc. | | | 59,200 | | | | 2,537,545 | |
Tokyo Tatemono Co. Ltd. | | | 281,000 | | | | 2,407,708 | |
| | | | | | | | |
| | | | | | | | 17,986,556 | |
Mexico — 0.5% | | | | | | | | |
Cemex SAB de CV — ADR (a) | | | 134,600 | | | | 1,699,998 | |
Netherlands — 1.4% | | | | | | | | |
ING Groep NV — CVA (a) | | | 124,400 | | | | 1,769,187 | |
Randstad Holding NV | | | 56,218 | | | | 3,290,383 | |
| | | | | | | | |
| | | | | | | | 5,059,570 | |
New Zealand — 0.9% | | | | | | | | |
Xero Ltd. (Acquired 10/15/13, cost $1,616,409) (a)(c) | | | 106,300 | | | | 3,267,128 | |
Nigeria — 0.7% | | | | | | | | |
Lekoil Ltd. (a) | | | 2,787,800 | | | | 2,451,635 | |
Norway — 0.3% | | | | | | | | |
Statoil ASA | | | 38,300 | | | | 1,080,624 | |
Russia — 0.0% | | | | | | | | |
Eurasia Drilling Co. Ltd. — GDR | | | 6,654 | | | | 170,542 | |
South Africa — 0.9% | | | | | | | | |
Naspers Ltd., N Shares | | | 27,900 | | | | 3,074,385 | |
South Korea — 0.6% | | | | | | | | |
NAVER Corp. | | | 3,000 | | | | 2,192,013 | |
Spain — 2.6% | | | | | | | | |
NH Hoteles SA (a) | | | 818,927 | | | | 5,827,362 | |
Sacyr SA (a) | | | 507,600 | | | | 3,375,985 | |
| | | | | | | | |
| | | | | | | | 9,203,347 | |
Sweden — 2.3% | | | | | | | | |
Nordea Bank AB | | | 109,970 | | | | 1,559,992 | |
| | | | | | |
ADR | | American Depositary Receipts | | NZD | | New Zealand Dollar |
CHF | | Swiss Franc | | REIT | | Real Estate Investment Trust |
DKK | | Danish Krone | | SCA | | Svenska Cellulosa Aktiebolaget |
EUR | | Euro | | SEK | | Swedish Krona |
GBP | | British Pound | | SGD | | Singapore Dollar |
GDR | | Global Depositary Receipts | | TRY | | Turkish Lira |
HKD | | Hong Kong Dollar | | USD | | US Dollar |
JPY | | Japanese Yen | | ZAR | | South African Rand |
NOK | | Norwegian Krone | | | | |
See Notes to Financial Statements.
| | | | | | |
| 16 | | BLACKROCK FUNDS | | MARCH 31, 2014 | | |
| | | | |
| Schedule of Investments (continued) | | | BlackRock Global Opportunities Portfolio | |
| | | (Percentages shown are based on Net Assets) | |
| | | | | | | | |
| Common Stocks | | Shares | | | Value | |
Sweden (concluded) | | | | | | | | |
Skanska AB, B Shares | | | 83,700 | | | $ | 1,973,092 | |
Svenska Cellulosa AB SCA, B Shares | | | 151,018 | | | | 4,447,653 | |
| | | | | | | | |
| | | | | | | | 7,980,737 | |
Switzerland — 3.0% | | | | | | | | |
Adecco SA | | | 39,200 | | | | 3,262,468 | |
Novartis AG, Registered Shares | | | 42,700 | | | | 3,625,568 | |
Roche Holding AG | | | 11,840 | | | | 3,561,043 | |
| | | | | | | | |
| | | | | | | | 10,449,079 | |
Taiwan — 0.3% | | | | | | | | |
Hermes Microvision, Inc. — GDR (a)(d) | | | 23,717 | | | | 930,062 | |
United Kingdom — 6.6% | | | | | | | | |
AO World PLC (a) | | | 322,900 | | | | 1,690,322 | |
APR Energy PLC (b) | | | 205,822 | | | | 2,763,943 | |
ASOS PLC (a) | | | 10,500 | | | | 907,617 | |
AstraZeneca PLC | | | 43,300 | | | | 2,806,991 | |
Crest Nicholson Holdings PLC | | | 663,986 | | | | 4,353,662 | |
Foxtons Group PLC (a) | | | 502,249 | | | | 3,016,842 | |
Kennedy Wilson Europe Real Estate PLC (a) | | | 94,669 | | | | 1,641,394 | |
Metro Bank PLC (Acquired 1/15/14, cost $1,748,929) (a)(c) | | | 82,275 | | | | 1,783,130 | |
Perform Group PLC (a) | | | 407,157 | | | | 1,663,029 | |
Poundland Group PLC (a) | | | 118,900 | | | | 753,247 | |
Vodafone Group PLC — ADR | | | 52,035 | | | | 1,915,408 | |
| | | | | | | | |
| | | | | | | | 23,295,585 | |
United States — 45.2% | | | | | | | | |
AbbVie, Inc. | | | 70,700 | | | | 3,633,980 | |
Acuity Brands, Inc. | | | 25,429 | | | | 3,371,123 | |
Adobe Systems, Inc. (a) | | | 30,750 | | | | 2,021,505 | |
American Airlines Group, Inc. (a) | | | 59,100 | | | | 2,163,060 | |
Apple, Inc. | | | 12,885 | | | | 6,915,895 | |
Aramark Holdings Corp. | | | 88,300 | | | | 2,553,636 | |
Autodesk, Inc. (a) | | | 51,500 | | | | 2,532,770 | |
BankUnited, Inc. | | | 137,788 | | | | 4,790,889 | |
Biogen Idec, Inc. (a) | | | 5,300 | | | | 1,621,111 | |
BioMarin Pharmaceutical, Inc. (a) | | | 34,700 | | | | 2,366,887 | |
Bristol-Myers Squibb Co. | | | 48,400 | | | | 2,514,380 | |
Cabot Oil & Gas Corp. | | | 125,578 | | | | 4,254,583 | |
CBS Corp., Class B | | | 42,400 | | | | 2,620,320 | |
Celgene Corp. (a) | | | 11,500 | | | | 1,605,400 | |
Charles River Laboratories International, Inc. (a) | | | 46,300 | | | | 2,793,742 | |
Citigroup, Inc. | | | 113,568 | | | | 5,405,837 | |
Concho Resources, Inc. (a) | | | 30,500 | | | | 3,736,250 | |
Continental Building Products, Inc. (a) | | | 58,253 | | | | 1,097,487 | |
Crown Holdings, Inc. (a) | | | 41,500 | | | | 1,856,710 | |
Eastman Chemical Co. | | | 35,310 | | | | 3,044,075 | |
Facebook, Inc., Class A (a) | | | 28,460 | | | | 1,714,430 | |
Flowserve Corp. | | | 35,900 | | | | 2,812,406 | |
General Motors Co. | | | 65,200 | | | | 2,244,184 | |
Genworth Financial, Inc., Class A (a) | | | 180,400 | | | | 3,198,492 | |
Google, Inc., Class A (a) | | | 7,179 | | | | 8,001,067 | |
The Hain Celestial Group, Inc. (a) | | | 36,756 | | | | 3,362,071 | |
Hertz Global Holdings, Inc. (a) | | | 117,140 | | | | 3,120,610 | |
JPMorgan Chase & Co. | | | 97,285 | | | | 5,906,172 | |
Kennedy-Wilson Holdings, Inc. | | | 222,300 | | | | 5,003,973 | |
Las Vegas Sands Corp. | | | 23,490 | | | | 1,897,522 | |
Lowe’s Cos., Inc. | | | 43,820 | | | | 2,142,798 | |
Merck & Co., Inc. | | | 47,000 | | | | 2,668,190 | |
Mondelez International, Inc., Class A | | | 96,100 | | | | 3,320,255 | |
| | | | | | | | |
| Common Stocks | | Shares | | | Value | |
United States (concluded) | | | | | | | | |
National Oilwell Varco, Inc. | | | 23,794 | | | $ | 1,852,839 | |
Oasis Petroleum, Inc. (a) | | | 42,384 | | | | 1,768,684 | |
Pfizer, Inc. | | | 111,200 | | | | 3,571,744 | |
Platform Specialty Products Corp. (a) | | | 226,800 | | | | 4,320,540 | |
Ralph Lauren Corp. | | | 16,100 | | | | 2,590,973 | |
Roper Industries, Inc. | | | 34,040 | | | | 4,544,680 | |
Schlumberger Ltd. | | | 19,000 | | | | 1,852,500 | |
ServiceNow, Inc. (a) | | | 28,800 | | | | 1,725,696 | |
St. Jude Medical, Inc. | | | 41,200 | | | | 2,694,068 | |
Strategic Growth Bancorp (Acquired 3/10/14,
cost $1,691,208) (a)(c) | | | 135,840 | | | | 1,691,208 | |
SunPower Corp. (a) | | | 39,638 | | | | 1,278,722 | |
Textron, Inc. | | | 46,200 | | | | 1,815,198 | |
United Parcel Service, Inc., Class B | | | 36,100 | | | | 3,515,418 | |
United Rentals, Inc. (a) | | | 40,355 | | | | 3,831,304 | |
US Silica Holdings, Inc. | | | 39,700 | | | | 1,515,349 | |
Varian Medical Systems, Inc. (a) | | | 31,000 | | | | 2,603,690 | |
Verizon Communications, Inc. | | | 25,089 | | | | 1,193,484 | |
Visa, Inc., Class A | | | 15,350 | | | | 3,313,451 | |
Whole Foods Market, Inc. | | | 45,100 | | | | 2,287,021 | |
WisdomTree Investments, Inc. (a) | | | 240,249 | | | | 3,152,067 | |
Yelp, Inc. (a) | | | 22,520 | | | | 1,732,464 | |
| | | | | | | | |
| | | | | | | | 159,142,910 | |
Total Common Stocks — 98.1% | | | | | | | 345,619,433 | |
| | | | | | | | |
| Preferred Stocks | | | | | | |
United States — 1.5% | | | | | | | | |
Hortonworks, Inc., Series D (Acquired 3/21/14,
cost $3,133,876) (a)(c) | | | 257,147 | | | | 3,133,876 | |
Palantir Technologies, Inc. (Acquired 2/07/14,
cost $942,242) (c) | | | 153,710 | | | | 942,242 | |
Uber Technologies, Inc. (Acquired 3/20/14,
cost $1,176,400) (c)(e) | | | 1,176,400 | | | | 1,176,400 | |
Total Preferred Stocks — 1.5% | | | | | | | 5,252,518 | |
| | | | | | | | |
Total Long-Term Investments (Cost — $290,802,132) — 99.6% | | | 350,871,951 | |
| | | | | | | | |
| Short-Term Securities | | | | | | |
BlackRock Liquidity Funds, TempFund, Institutional
Class, 0.03% (f)(g) | | | 1,552,261 | | | | 1,552,261 | |
| | | | | | | | |
| | |
| | | Beneficial
Interest
(000) | | | | |
BlackRock Liquidity Series, LLC, Money Market Series, 0.16% (f)(g)(h) | | $ | 7,540 | | | | 7,540,083 | |
Total Short-Term Securities (Cost — $9,092,344) — 2.6% | | | | 9,092,344 | |
Total Investments (Cost — $299,894,476) — 102.2% | | | | 359,964,295 | |
Liabilities in Excess of Other Assets — (2.2)% | | | | | | | (7,691,926 | ) |
| | | | | | | | |
Net Assets — 100.0% | | | | | | $ | 352,272,369 | |
| | | | | | | | |
|
| Notes to Schedule of Investments |
| (a) | Non-income producing security. |
| (b) | Security, or a portion of security, is on loan. |
See Notes to Financial Statements.
| | | | | | |
| | | BLACKROCK FUNDS | | MARCH 31, 2014 | | 17 |
| | | | |
| Schedule of Investments (continued) | | | BlackRock Global Opportunities Portfolio | |
| (c) | Restricted security as to resale. As of report date, the Fund held restricted securities with a current value of $11,993,984 and an original cost of $10,309,067, which was 3.4% of its net assets. |
| (d) | Security exempt from registration pursuant to Rule 144A under the Securities Act of 1933, as amended. These securities may be resold in transactions exempt from registration to qualified institutional investors. |
| (f) | Represents the current yield as of report date. |
| (g) | Investments in issuers considered to be an affiliate of the Fund during the six months ended March 31, 2014, for purposes of Section 2(a)(3) of the Investment Company Act of 1940, as amended, were as follows: |
| | | | | | | | | | | | | | | | |
| Affiliate | | Shares/Beneficial
Interest Held at
September 30, 2013 | | | Net
Activity | | | Shares/Beneficial
Interest Held at
March 31, 2014 | | | Income | |
BlackRock Liquidity Funds, TempFund, Institutional Class | | | 60,217 | | | | 1,492,044 | | | | 1,552,261 | | | $ | 259 | |
BlackRock Liquidity Series, LLC, Money Market Series | | $ | 3,939,993 | | | $ | 3,600,090 | | | $ | 7,540,083 | | | $ | 75,010 | |
| (h) | Security was purchased with the cash collateral from loaned securities. The Fund may withdraw up to 25% of its investment daily, although the manager of the BlackRock Liquidity Series, LLC, Money Market Series, in its sole discretion, may permit an investor to withdraw more than 25% on any one day. |
| Ÿ | | Forward foreign currency exchange contracts outstanding as of March 31, 2014 were as follows: |
| | | | | | | | | | | | | | | | | | | | | | |
Currency
Purchased | | | Currency
Sold | | | Counterparty | | Settlement
Date | | | Unrealized
Appreciation
(Depreciation) | |
| CHF | | | 2,335,000 | | | | USD | | | | 2,640,522 | | | Citibank N.A. | | | 4/22/14 | | | $ | 1,203 | |
| CHF | | | 2,590,918 | | | | USD | | | | 2,881,858 | | | Credit Suisse International | | | 4/22/14 | | | | 49,401 | |
| CHF | | | 186,267 | | | | USD | | | | 209,469 | | | Deutsche Bank AG | | | 4/22/14 | | | | 1,266 | |
| CHF | | | 154,158 | | | | USD | | | | 174,660 | | | Goldman Sachs International | | | 4/22/14 | | | | (252 | ) |
| CHF | | | 4,240,830 | | | | USD | | | | 4,797,216 | | | Royal Bank of Scotland PLC | | | 4/22/14 | | | | 688 | |
| CHF | | | 138,229 | | | | USD | | | | 155,830 | | | The Bank of New York Mellon | | | 4/22/14 | | | | 557 | |
| CHF | | | 4,595,945 | | | | USD | | | | 5,192,671 | | | UBS AG | | | 4/22/14 | | | | 6,995 | |
| DKK | | | 8,120,583 | | | | USD | | | | 1,481,656 | | | Bank of America N.A. | | | 4/22/14 | | | | 17,013 | |
| EUR | | | 223,000 | | | | USD | | | | 305,642 | | | Barclays Bank PLC | | | 4/22/14 | | | | 1,560 | |
| EUR | | | 1,113,000 | | | | USD | | | | 1,522,228 | | | BNP Paribas S.A. | | | 4/22/14 | | | | 11,027 | |
| EUR | | | 2,540,000 | | | | USD | | | | 3,503,290 | | | BNP Paribas S.A. | | | 4/22/14 | | | | (4,218 | ) |
| EUR | | | 191,000 | | | | USD | | | | 263,011 | | | Citibank N.A. | | | 4/22/14 | | | | 109 | |
| EUR | | | 191,307 | | | | USD | | | | 263,121 | | | Citibank N.A. | | | 4/22/14 | | | | 421 | |
| EUR | | | 619,167 | | | | USD | | | | 853,215 | | | Citibank N.A. | | | 4/22/14 | | | | (258 | ) |
| EUR | | | 671,442 | | | | USD | | | | 912,813 | | | Citibank N.A. | | | 4/22/14 | | | | 12,157 | |
| EUR | | | 1,128,110 | | | | USD | | | | 1,556,144 | | | Citibank N.A. | | | 4/22/14 | | | | (2,074 | ) |
| EUR | | | 3,293,000 | | | | USD | | | | 4,456,799 | | | Citibank N.A. | | | 4/22/14 | | | | 79,597 | |
| EUR | | | 153,000 | | | | USD | | | | 210,681 | | | Deutsche Bank AG | | | 4/22/14 | | | | 90 | |
| EUR | | | 1,201,000 | | | | USD | | | | 1,670,089 | | | JPMorgan Chase Bank N.A. | | | 4/22/14 | | | | (15,606 | ) |
| EUR | | | 444,867 | | | | USD | | | | 604,570 | | | Royal Bank of Scotland PLC | | | 4/22/14 | | | | 8,273 | |
| EUR | | | 952,000 | | | | USD | | | | 1,314,663 | | | State Street Bank and Trust Co. | | | 4/22/14 | | | | (3,200 | ) |
| EUR | | | 79,000 | | | | USD | | | | 108,425 | | | The Bank of New York Mellon | | | 4/22/14 | | | | 404 | |
| GBP | | | 157,000 | | | | USD | | | | 262,416 | | | Bank of America N.A. | | | 4/22/14 | | | | (717 | ) |
| GBP | | | 37,569 | | | | USD | | | | 62,251 | | | Barclays Bank PLC | | | 4/22/14 | | | | 372 | |
| GBP | | | 285,000 | | | | USD | | | | 477,148 | | | BNP Paribas S.A. | | | 4/22/14 | | | | (2,089 | ) |
| GBP | | | 336,000 | | | | USD | | | | 559,110 | | | BNP Paribas S.A. | | | 4/22/14 | | | | 959 | |
| GBP | | | 454,000 | | | | USD | | | | 747,999 | | | Citibank N.A. | | | 4/22/14 | | | | 8,762 | |
| GBP | | | 664,000 | | | | USD | | | | 1,103,790 | | | Citibank N.A. | | | 4/22/14 | | | | 3,014 | |
| GBP | | | 250,000 | | | | USD | | | | 407,910 | | | Goldman Sachs International | | | 4/22/14 | | | | 8,808 | |
| HKD | | | 4,750,000 | | | | USD | | | | 612,404 | | | BNP Paribas S.A. | | | 4/22/14 | | | | 32 | |
See Notes to Financial Statements.
| | | | | | |
| 18 | | BLACKROCK FUNDS | | MARCH 31, 2014 | | |
| | | | |
| Schedule of Investments (continued) | | | BlackRock Global Opportunities Portfolio | |
| Ÿ | | Forward foreign currency exchange contracts outstanding as of March 31, 2014 were as follows: (continued) |
| | | | | | | | | | | | | | | | | | | | | | |
Currency Purchased | | | Currency
Sold | | | Counterparty | | Settlement
Date | | | Unrealized
Appreciation
(Depreciation) | |
| HKD | | | 1,160,000 | | | | USD | | | | 149,540 | | | Citibank N.A. | | | 4/22/14 | | | $ | 24 | |
| HKD | | | 13,166,000 | | | | USD | | | | 1,698,000 | | | Deutsche Bank AG | | | 4/22/14 | | | | (455 | ) |
| JPY | | | 303,091,000 | | | | USD | | | | 2,994,423 | | | Bank of America N.A. | | | 4/22/14 | | | | (57,568 | ) |
| JPY | | | 44,591,599 | | | | USD | | | | 435,207 | | | Barclays Bank PLC | | | 4/22/14 | | | | (3,128 | ) |
| JPY | | | 209,719,955 | | | | USD | | | | 2,053,736 | | | Barclays Bank PLC | | | 4/22/14 | | | | (21,617 | ) |
| JPY | | | 26,713,000 | | | | USD | | | | 261,366 | | | Citibank N.A. | | | 4/22/14 | | | | (2,525 | ) |
| JPY | | | 273,704,459 | | | | USD | | | | 2,680,917 | | | Deutsche Bank AG | | | 4/22/14 | | | | (28,808 | ) |
| JPY | | | 172,647,000 | | | | USD | | | | 1,702,885 | | | Goldman Sachs International | | | 4/22/14 | | | | (29,991 | ) |
| JPY | | | 10,556,137 | | | | USD | | | | 103,006 | | | JPMorgan Chase Bank N.A. | | | 4/22/14 | | | | (721 | ) |
| JPY | | | 234,645,000 | | | | USD | | | | 2,285,897 | | | State Street Bank and Trust Co. | | | 4/22/14 | | | | (12,261 | ) |
| JPY | | | 9,288,000 | | | | USD | | | | 90,615 | | | The Bank of New York Mellon | | | 4/22/14 | | | | (617 | ) |
| JPY | | | 9,507,477 | | | | USD | | | | 93,175 | | | The Bank of New York Mellon | | | 4/22/14 | | | | (1,051 | ) |
| JPY | | | 183,573,000 | | | | USD | | | | 1,799,554 | | | Westpac Banking Corp. | | | 4/22/14 | | | | (20,790 | ) |
| NOK | | | 6,844,000 | | | | USD | | | | 1,102,047 | | | Morgan Stanley Capital Services LLC | | | 4/22/14 | | | | 39,973 | |
| SEK | | | 682,000 | | | | USD | | | | 105,432 | | | Citibank N.A. | | | 4/22/14 | | | | (96 | ) |
| SGD | | | 2,518,000 | | | | USD | | | | 1,979,474 | | | Deutsche Bank AG | | | 4/22/14 | | | | 22,298 | |
| USD | | | 3,273,235 | | | | CHF | | | | 2,853,835 | | | Barclays Bank PLC | | | 4/22/14 | | | | 44,521 | |
| USD | | | 3,583,914 | | | | CHF | | | | 3,135,000 | | | Credit Suisse International | | | 4/22/14 | | | | 37,102 | |
| USD | | | 5,581,869 | | | | CHF | | | | 5,044,000 | | | Goldman Sachs International | | | 4/22/14 | | | | (124,709 | ) |
| USD | | | 1,914,060 | | | | CHF | | | | 1,737,995 | | | UBS AG | | | 4/22/14 | | | | (52,237 | ) |
| USD | | | 2,625,564 | | | | DKK | | | | 14,504,681 | | | Bank of America N.A. | | | 4/22/14 | | | | (51,303 | ) |
| USD | | | 998,602 | | | | DKK | | | | 5,376,000 | | | Morgan Stanley Capital Services LLC | | | 4/22/14 | | | | 6,451 | |
| USD | | | 828,398 | | | | EUR | | | | 612,000 | | | Bank of America N.A. | | | 4/22/14 | | | | (14,685 | ) |
| USD | | | 1,458,424 | | | | EUR | | | | 1,073,000 | | | Bank of America N.A. | | | 4/22/14 | | | | (19,728 | ) |
| USD | | | 1,550,964 | | | | EUR | | | | 1,134,000 | | | BNP Paribas S.A. | | | 4/22/14 | | | | (11,220 | ) |
| USD | | | 2,787,451 | | | | EUR | | | | 2,025,000 | | | BNP Paribas S.A. | | | 4/22/14 | | | | (2,164 | ) |
| USD | | | 27,386,174 | | | | EUR | | | | 20,169,000 | | | Deutsche Bank AG | | | 4/22/14 | | | | (398,388 | ) |
| USD | | | 178,238 | | | | EUR | | | | 130,000 | | | Goldman Sachs Bank USA | | | 4/22/14 | | | | (848 | ) |
| USD | | | 305,340 | | | | EUR | | | | 226,000 | | | JPMorgan Chase Bank N.A. | | | 4/22/14 | | | | (5,995 | ) |
| USD | | | 2,595,334 | | | | EUR | | | | 1,900,000 | | | Royal Bank of Scotland PLC | | | 4/22/14 | | | | (22,083 | ) |
| USD | | | 3,934,269 | | | | EUR | | | | 2,877,000 | | | Royal Bank of Scotland PLC | | | 4/22/14 | | | | (29,051 | ) |
| USD | | | 1,197,152 | | | | GBP | | | | 720,000 | | | Goldman Sachs Bank USA | | | 4/22/14 | | | | (2,997 | ) |
| USD | | | 7,569,301 | | | | GBP | | | | 4,607,000 | | | Goldman Sachs International | | | 4/22/14 | | | | (109,985 | ) |
| USD | | | 131,720 | | | | GBP | | | | 79,000 | | | The Bank of New York Mellon | | | 4/22/14 | | | | 37 | |
| USD | | | 173,130 | | | | HKD | | | | 1,344,000 | | | Citibank N.A. | | | 4/22/14 | | | | (157 | ) |
| USD | | | 403,837 | | | | HKD | | | | 3,133,000 | | | Royal Bank of Scotland PLC | | | 4/22/14 | | | | (113 | ) |
| USD | | | 19,192,896 | | | | JPY | | | | 2,001,350,000 | | | BNP Paribas S.A. | | | 4/22/14 | | | | (199,547 | ) |
| USD | | | 822,021 | | | | JPY | | | | 84,068,000 | | | Royal Bank of Scotland PLC | | | 4/22/14 | | | | 7,429 | |
| USD | | | 1,429,918 | | | | JPY | | | | 145,760,000 | | | UBS AG | | | 4/22/14 | | | | 17,550 | |
| USD | | | 1,071,538 | | | | NOK | | | | 6,464,000 | | | Credit Suisse International | | | 4/22/14 | | | | (7,074 | ) |
| USD | | | 1,581,141 | | | | NZD | | | | 1,840,000 | | | Bank of America N.A. | | | 4/22/14 | | | | (12,821 | ) |
| USD | | | 1,595,454 | | | | NZD | | | | 1,930,000 | | | JPMorgan Chase Bank N.A. | | | 4/22/14 | | | | (76,475 | ) |
| USD | | | 356,861 | | | | SEK | | | | 2,304,000 | | | BNP Paribas S.A. | | | 4/22/14 | | | | 1,005 | |
| USD | | | 432,694 | | | | SEK | | | | 2,801,000 | | | BNP Paribas S.A. | | | 4/22/14 | | | | 75 | |
| USD | | | 371,402 | | | | SEK | | | | 2,425,000 | | | JPMorgan Chase Bank N.A. | | | 4/22/14 | | | | (3,143 | ) |
| USD | | | 967,937 | | | | SEK | | | | 6,275,000 | | | JPMorgan Chase Bank N.A. | | | 4/22/14 | | | | (1,245 | ) |
See Notes to Financial Statements.
| | | | | | |
| | | BLACKROCK FUNDS | | MARCH 31, 2014 | | 19 |
| | |
| Schedule of Investments (continued) | | BlackRock Global Opportunities Portfolio |
| Ÿ | | Forward foreign currency exchange contracts outstanding as of March 31, 2014 were as follows: (concluded) |
| | | | | | | | | | | | | | | | | | | | | | |
Currency
Purchased | | | Currency
Sold | | | Counterparty | | Settlement
Date | | | Unrealized
Appreciation
(Depreciation) | |
| USD | | | 1,168,109 | | | | ZAR | | | | 12,699,000 | | | BNP Paribas S.A. | | | 4/22/14 | | | $ | (34,042 | ) |
| USD | | | 946,933 | | | | ZAR | | | | 10,310,000 | | | Citibank N.A. | | | 4/22/14 | | | | (29,063 | ) |
| USD | | | 1,214,538 | | | | ZAR | | | | 13,225,000 | | | UBS AG | | | 4/22/14 | | | | (37,407 | ) |
| ZAR | | | 27,525,000 | | | | USD | | | | 2,510,460 | | | Goldman Sachs Bank USA | | | 4/22/14 | | | | 95,194 | |
| Total | | | | | | | | | | | | | | | | | | | | $ | (970,155 | ) |
| | | | | | | | | | | | | | | | | | | | | | |
| Ÿ | | Fair Value Measurements — Various inputs are used in determining the fair value of investments and derivative financial instruments. These inputs to valuation techniques are categorized into a disclosure hierarchy consisting of three broad levels for financial statement purposes as follows: |
| | Ÿ | | Level 1 — unadjusted price quotations in active markets/exchanges for identical assets or liabilities that the Fund has the ability to access |
| | Ÿ | | Level 2 — other observable inputs (including, but not limited to, quoted prices for similar assets or liabilities in markets that are active, quoted prices for identical or similar assets or liabilities in markets that are not active, inputs other than quoted prices that are observable for the assets or liabilities (such as interest rates, yield curves, volatilities, prepayment speeds, loss severities, credit risks and default rates) or other market–corroborated inputs) |
| | Ÿ | | Level 3 — unobservable inputs based on the best information available in the circumstances, to the extent observable inputs are not available (including the Fund’s own assumptions used in determining the fair value of investments and derivative financial instruments) |
The hierarchy gives the highest priority to unadjusted quoted prices in active markets for identical assets or liabilities (Level 1 measurements) and the lowest priority to unobservable inputs (Level 3 measurements). Accordingly, the degree of judgment exercised in determining fair value is greatest for instruments categorized in Level 3. The inputs used to measure fair value may fall into different levels of the fair value hierarchy. In such cases, for disclosure purposes, the fair value hierarchy classification is determined based on the lowest level input that is significant to the fair value measurement in its entirety.
Changes in valuation techniques may result in transfers into or out of an assigned level within the disclosure hierarchy. In accordance with the Fund’s policy, transfers between different levels of the fair value disclosure hierarchy are deemed to have occurred as of the beginning of the reporting period. The categorization of a value determined for investments and derivative financial instruments is based on the pricing transparency of the investment and derivative financial instrument and is not necessarily an indication of the risks associated with investing in those securities. For information about the Fund’s policy regarding valuation of investments and derivative financial instruments, please refer to Note 2 of the Notes to Financial Statements.
The following tables summarize the Fund’s investments and derivative financial instruments categorized in the disclosure hierarchy as of March 31, 2014:
| | | | | | | | | | | | | | | | |
| | | Level 1 | | | Level 2 | | | Level 3 | | | Total | |
Assets: | | | | | | | | | | | | | | | | |
Investments: | | | | | | | | | | | | | | | | |
Long-Term Investments: | | | | | | | | | | | | | | | | |
Common Stocks: | | | | | | | | | | | | | | | | |
Belgium | | | — | | | $ | 4,941,210 | | | | — | | | $ | 4,941,210 | |
Canada | | $ | 3,588,993 | | | | — | | | | — | | | | 3,588,993 | |
China | | | 3,399,984 | | | | 5,863,087 | | | | — | | | | 9,263,071 | |
Denmark | | | 1,128,401 | | | | 3,037,002 | | | | — | | | | 4,165,403 | |
France | | | 2,209,196 | | | | 14,622,256 | | | | — | | | | 16,831,452 | |
Germany | | | — | | | | 18,513,314 | | | | — | | | | 18,513,314 | |
Greece | | | — | | | | 2,712,875 | | | | — | | | | 2,712,875 | |
Hong Kong | | | 1,704,465 | | | | 4,876,279 | | | | — | | | | 6,580,744 | |
Indonesia | | | — | | | | 5,130,791 | | | | — | | | | 5,130,791 | |
Ireland | | | 14,157,301 | | | | 3,567,222 | | | | — | | | | 17,724,523 | |
Italy | | | 1,191,642 | | | | 6,991,244 | | | | — | | | | 8,182,886 | |
Japan | | | — | | | | 17,986,556 | | | | — | | | | 17,986,556 | |
Mexico | | | 1,699,998 | | | | — | | | | — | | | | 1,699,998 | |
Netherlands | | | — | | | | 5,059,570 | | | | — | | | | 5,059,570 | |
New Zealand | | | — | | | | 3,267,128 | | | | — | | | | 3,267,128 | |
Nigeria | | | 2,451,635 | | | | — | | | | — | | | | 2,451,635 | |
Norway | | | — | | | | 1,080,624 | | | | — | | | | 1,080,624 | |
Russia | | | 170,542 | | | | — | | | | — | | | | 170,542 | |
South Africa | | | — | | | | 3,074,385 | | | | — | | | | 3,074,385 | |
South Korea | | | — | | | | 2,192,013 | | | | — | | | | 2,192,013 | |
Spain | | | — | | | | 9,203,347 | | | | — | | | | 9,203,347 | |
Sweden | | | — | | | | 7,980,737 | | | | — | | | | 7,980,737 | |
Switzerland | | | — | | | | 10,449,079 | | | | — | | | | 10,449,079 | |
Taiwan | | | 930,062 | | | | — | | | | — | | | | 930,062 | |
United Kingdom | | | 14,781,005 | | | | 6,731,450 | | | $ | 1,783,130 | | | | 23,295,585 | |
United States | | | 157,451,702 | | | | — | | | | 1,691,208 | | | | 159,142,910 | |
See Notes to Financial Statements.
| | | | | | |
| 20 | | BLACKROCK FUNDS | | MARCH 31, 2014 | | |
| | | | |
| Schedule of Investments (concluded) | | | BlackRock Global Opportunities Portfolio | |
| | | | | | | | | | | | | | | | |
| | | Level 1 | | | Level 2 | | | Level 3 | | | Total | |
Preferred Stocks | | | — | | | | — | | | $ | 5,252,518 | | | $ | 5,252,518 | |
Short-Term Securities | | $ | 1,552,261 | | | $ | 7,540,083 | | | | — | | | | 9,092,344 | |
Total | | $ | 206,417,187 | | | $ | 144,820,252 | | | $ | 8,726,856 | | | $ | 359,964,295 | |
| | | | |
| | | | | | | | | | | | | | | | |
| | | Level 1 | | | Level 2 | | | Level 3 | | | Total | |
Derivative Financial Instruments1 | | | | | | | | | | | | | | | | |
Assets: | | | | | | | | | | | | | | | | |
Foreign currency exchange contracts | | | — | | | $ | 484,367 | | | | — | | | $ | 484,367 | |
Liabilities: | | | | | | | | | | | | | | | | |
Foreign currency exchange contracts | | | — | | | | (1,454,522 | ) | | | — | | | | (1,454,522 | ) |
Total | | | — | | | $ | (970,155 | ) | | | — | | | $ | (970,155 | ) |
| | | | |
| 1 | Derivative financial instruments are foreign currency exchange contracts, which are valued at the unrealized appreciation/depreciation on the instrument. |
The carrying amount for certain of the Fund’s assets and/or liabilities approximates fair value for financial statement purposes. As of March 31, 2014, such assets and/or liabilities are categorized within the disclosure hierarchy as follows:
| | | | | | | | | | | | | | | | |
| | | | | | | | | | | | | | | | |
| | | Level 1 | | | Level 2 | | | Level 3 | | | Total | |
Assets: | | | | | | | | | | | | | | | | |
Foreign currency at value | | $ | 154,419 | | | | — | | | | — | | | $ | 154,419 | |
Liabilities: | | | | | | | | | | | | | | | | |
Bank overdraft | | | — | | | $ | (1,261 | ) | | | — | | | | (1,261 | ) |
Collateral on securities loaned at value | | | — | | | | (7,540,083 | ) | | | — | | | | (7,540,083 | ) |
Total | | $ | 154,419 | | | $ | (7,541,344 | ) | | | — | | | $ | (7,386,925 | ) |
| | | | |
Certain foreign securities are fair valued utilizing an external pricing service to reflect any significant market movements between the time the Fund values such foreign securities and the earlier closing of foreign markets. Such fair valuations are categorized as Level 2 in the disclosure hierarchy. As of March 31, 2014, securities with a value of $3,872,225 were systematically fair valued due to significant market movements, but were not valued using systematic fair values as of September 30, 2013. Therefore, these securities were transferred from Level 2 to Level 1 during the period September 30, 2013 to March 31, 2014.
A reconciliation of Level 3 investments is presented when the Fund had a significant amount of Level 3 investments at the beginning and/or end of the period in relation to net assets. The following table is a reconciliation of Level 3 investments for which significant unobservable inputs were used in determining fair value:
| | | | | | | | | | | | |
| | | | | | | | | | | | |
| | | Common Stocks | | | Preferred Stocks | | | Total | |
Assets: | | | | | | | | | | | | |
Balance, as of September 30, 2013 | | | — | | | | — | | | | — | |
Accrued discounts/premiums | | | — | | | | — | | | | — | |
Realized gain (loss) | | | — | | | | — | | | | — | |
Net change in unrealized appreciation/depreciation1,2 | | $ | 34,200 | | | | — | | | $ | 34,200 | |
Net purchases | | | 3,440,138 | | | $ | 5,252,518 | | | | 8,692,656 | |
Transfers in/out of Level 3 | | | — | | | | — | | | | — | |
Closing Balance, as of March 31, 2014 | | $ | 3,474,338 | | | $ | 5,252,518 | | | $ | 8,726,856 | |
| | | | |
Net change in unrealized appreciation/depreciation on investments still held at March 31, 20142 | | $ | 34,200 | | | | — | | | $ | 34,200 | |
| | | | |
| 1 | Included in the related net change in unrealized appreciation/depreciation in the Statements of Operations. |
| 2 | Any difference between Net change in unrealized appreciation/depreciation and Net change in unrealized appreciation/depreciation on investments still held at March 31, 2014 is generally due to investments no longer held or categorized as Level 3 at period end. |
See Notes to Financial Statements.
| | | | | | |
| | | BLACKROCK FUNDS | | MARCH 31, 2014 | | 21 |
| | | | |
| Schedule of Investments March 31, 2014 (Unaudited) | | | BlackRock Health Sciences Opportunities Portfolio | |
| | | (Percentages shown are based on Net Assets) | |
| | | | | | | | |
| Common Stocks | | Shares | | | Value | |
Biotechnology — 25.6% | | | | | | | | |
ACADIA Pharmaceuticals, Inc. (a) | | | 410,921 | | | $ | 9,997,708 | |
Acceleron Pharma, Inc. (a)(b) | | | 159,600 | | | | 5,506,200 | |
Acorda Therapeutics, Inc. (a) | | | 543,800 | | | | 20,615,458 | |
Actelion Ltd., Registered Shares | | | 266,600 | | | | 25,265,257 | |
Aegerion Pharmaceuticals, Inc. (a)(b) | | | 218,300 | | | | 10,067,996 | |
Agios Pharmaceuticals, Inc. (a) | | | 60,100 | | | | 2,352,915 | |
Akebia Therapeutics, Inc. (a) | | | 150,000 | | | | 2,934,000 | |
Alexion Pharmaceuticals, Inc. (a) | | | 641,017 | | | | 97,517,916 | |
Alkermes PLC (a) | | | 1,022,700 | | | | 45,090,843 | |
Amgen, Inc. | | | 626,810 | | | | 77,310,746 | |
Aquinox Pharmaceuticals, Inc. (a) | | | 90,900 | | | | 1,157,157 | |
Array BioPharma, Inc. (a) | | | 1,057,100 | | | | 4,968,370 | |
Biogen Idec, Inc. (a) | | | 471,000 | | | | 144,064,770 | |
BioMarin Pharmaceutical, Inc. (a) | | | 680,500 | | | | 46,416,905 | |
Biota Pharmaceuticals, Inc. (a) | | | 418,300 | | | | 2,555,813 | |
Bluebird Bio, Inc. (a) | | | 109,200 | | | | 2,483,208 | |
Celgene Corp. (a) | | | 674,519 | | | | 94,162,852 | |
Conatus Pharmaceuticals, Inc. (a) | | | 110,200 | | | | 896,477 | |
Concert Pharmaceuticals, Inc. (a) | | | 166,100 | | | | 2,234,045 | |
Dicerna Pharmaceuticals, Inc. (a) | | | 43,100 | | | | 1,217,575 | |
Dyax Corp. (a) | | | 765,337 | | | | 6,872,726 | |
Eleven Biotherapeutics, Inc. (a) | | | 65,100 | | | | 1,056,573 | |
Epizyme, Inc. (a) | | | 307,200 | | | | 6,994,944 | |
Exelixis, Inc. (a)(b) | | | 446,800 | | | | 1,581,672 | |
Gilead Sciences, Inc. (a) | | | 685,493 | | | | 48,574,034 | |
Incyte Corp. Ltd. (a) | | | 221,700 | | | | 11,865,384 | |
Infinity Pharmaceuticals, Inc. (a) | | | 339,500 | | | | 4,036,655 | |
InterMune, Inc. (a) | | | 452,900 | | | | 15,158,563 | |
Isis Pharmaceuticals, Inc. (a) | | | 589,167 | | | | 25,457,906 | |
Karyopharm Therapeutics, Inc. (a) | | | 344,339 | | | | 10,636,632 | |
MacroGenics, Inc. (a) | | | 63,500 | | | | 1,767,205 | |
Medivation, Inc. (a) | | | 234,300 | | | | 15,081,891 | |
Neurocrine Biosciences, Inc. (a) | | | 764,438 | | | | 12,307,452 | |
Prosensa Holding BV (a) | | | 106,300 | | | | 598,469 | |
Protalix BioTherapeutics, Inc. (a)(b) | | | 1,155,326 | | | | 5,291,393 | |
PTC Therapeutics, Inc. (a) | | | 61,200 | | | | 1,599,768 | |
Puma Biotechnology, Inc. (a) | | | 210,500 | | | | 21,921,470 | |
Regeneron Pharmaceuticals, Inc. (a) | | | 164,822 | | | | 49,492,750 | |
Seattle Genetics, Inc. (a)(b) | | | 1,008,118 | | | | 45,929,856 | |
Tekmira Pharmaceuticals Corp. (a) | | | 337,500 | | | | 7,252,875 | |
Ultragenyx Pharmaceutical, Inc. (a) | | | 37,000 | | | | 1,808,930 | |
Ultragenyx Pharmaceutical, Inc. (Acquired 12/18/12,
cost $3,351,658) (a)(c) | | | 386,105 | | | | 17,932,840 | |
UniQure B.V. (a) | | | 91,800 | | | | 1,427,490 | |
Verastem, Inc. (a) | | | 239,640 | | | | 2,585,716 | |
Vertex Pharmaceuticals, Inc. (a) | | | 541,070 | | | | 38,264,470 | |
| | | | | | | | |
| | | | | | | | 952,313,875 | |
Chemicals — 0.5% | | | | | | | | |
Sigma-Aldrich Corp. | | | 197,100 | | | | 18,405,198 | |
Diversified Consumer Services — 0.3% | | | | | | | | |
Service Corp. International | | | 522,100 | | | | 10,379,348 | |
Health Care Equipment & Supplies — 17.2% | | | | | | | | |
Abbott Laboratories | | | 1,546,300 | | | | 59,548,012 | |
Alere, Inc. (a) | | | 482,500 | | | | 16,573,875 | |
AtriCure, Inc. (a) | | | 335,881 | | | | 6,317,922 | |
Baxter International, Inc. | | | 267,300 | | | | 19,667,934 | |
Becton Dickinson & Co. | | | 333,922 | | | | 39,095,588 | |
Boston Scientific Corp. (a) | | | 4,592,200 | | | | 62,086,544 | |
CareFusion Corp. (a) | | | 652,200 | | | | 26,231,484 | |
Coloplast A/S, Class B | | | 341,900 | | | | 27,643,001 | |
The Cooper Cos., Inc. | | | 122,800 | | | | 16,867,808 | |
Covidien PLC | | | 1,151,000 | | | | 84,782,660 | |
DENTSPLY International, Inc. | | | 169,300 | | | | 7,794,572 | |
| | | | | | | | |
| Common Stocks | | Shares | | | Value | |
Health Care Equipment & Supplies (concluded) | | | | | |
Edwards Lifesciences Corp. (a)(b) | | | 347,500 | | | $ | 25,774,075 | |
Medtronic, Inc. | | | 780,700 | | | | 48,044,278 | |
PW Medtech Group Ltd. (a) | | | 10,900,900 | | | | 4,852,267 | |
St. Jude Medical, Inc. | | | 911,800 | | | | 59,622,602 | |
Stryker Corp. | | | 940,100 | | | | 76,589,947 | |
Varian Medical Systems, Inc. (a)(b) | | | 400,400 | | | | 33,629,596 | |
Zimmer Holdings, Inc. | | | 251,900 | | | | 23,824,702 | |
| | | | | | | | |
| | | | | | | | 638,946,867 | |
Health Care Providers & Services — 12.2% | | | | | | | | |
Aetna, Inc. | | | 453,723 | | | | 34,015,613 | |
AmerisourceBergen Corp. | | | 139,200 | | | | 9,130,128 | |
Cardinal Health, Inc. | | | 707,680 | | | | 49,523,446 | |
CIGNA Corp. | | | 407,500 | | | | 34,119,975 | |
Envision Healthcare Holdings, Inc. (a) | | | 453,600 | | | | 15,345,288 | |
Express Scripts Holding Co. (a) | | | 272,847 | | | | 20,488,081 | |
HCA Holdings, Inc. (a) | | | 1,029,200 | | | | 54,033,000 | |
McKesson Corp. | | | 284,900 | | | | 50,304,793 | |
Phoenix Healthcare Group Co. Ltd (a) | | | 599,500 | | | | 873,112 | |
Premier, Inc., Class A (a) | | | 370,500 | | | | 12,207,975 | |
Team Health Holdings, Inc. (a) | | | 391,100 | | | | 17,501,725 | |
UnitedHealth Group, Inc. | | | 1,079,282 | | | | 88,490,331 | |
Universal Health Services, Inc., Class B | | | 548,500 | | | | 45,015,395 | |
WellPoint, Inc. | | | 226,300 | | | | 22,528,165 | |
| | | | | | | | |
| | | | | | | | 453,577,027 | |
Health Care Technology — 0.7% | | | | | | | | |
Cerner Corp. (a) | | | 452,700 | | | | 25,464,375 | |
Life Sciences Tools & Services — 5.6% | | | | | | | | |
Agilent Technologies, Inc. | | | 794,800 | | | | 44,445,216 | |
Charles River Laboratories International, Inc. (a) | | | 647,200 | | | | 39,052,048 | |
ICON PLC (a) | | | 313,200 | | | | 14,892,660 | |
Illumina, Inc. (a)(b) | | | 382,000 | | | | 56,788,120 | |
Thermo Fisher Scientific, Inc. | | | 439,500 | | | | 52,845,480 | |
| | | | | | | | |
| | | | | | | | 208,023,524 | |
Pharmaceuticals — 35.3% | | | | | | | | |
AbbVie, Inc. | | | 2,241,700 | | | | 115,223,380 | |
Achaogen, Inc. (a) | | | 247,700 | | | | 3,829,442 | |
Actavis PLC (a) | | | 215,900 | | | | 44,443,015 | |
Allergan, Inc. | | | 375,200 | | | | 46,562,320 | |
AstraZeneca PLC | | | 293,900 | | | | 19,052,535 | |
Bayer AG, Registered Shares | | | 717,500 | | | | 97,167,052 | |
Bristol-Myers Squibb Co. | | | 1,263,800 | | | | 65,654,410 | |
Chugai Pharmaceutical Co. Ltd. | | | 715,000 | | | | 18,262,756 | |
Eli Lilly & Co. | | | 1,109,000 | | | | 65,275,740 | |
Forest Laboratories, Inc. (a) | | | 556,100 | | | | 51,311,347 | |
Intra-Cellular Therapies, Inc. (a) | | | 791,254 | | | | 14,384,998 | |
Johnson & Johnson | | | 1,543,000 | | | | 151,568,890 | |
Mallinckrodt PLC (a) | | | 498,200 | | | | 31,590,862 | |
Merck & Co., Inc. | | | 2,118,700 | | | | 120,278,599 | |
Mylan, Inc. (a) | | | 1,044,200 | | | | 50,988,286 | |
Novartis AG, Registered Shares | | | 926,400 | | | | 78,658,701 | |
Perrigo Co. PLC | | | 413,600 | | | | 63,967,376 | |
Pfizer, Inc. | | | 3,957,540 | | | | 127,116,185 | |
Roche Holding AG | | | 187,500 | | | | 56,393,208 | |
Shire PLC — ADR | | | 172,100 | | | | 25,562,013 | |
Valeant Pharmaceuticals International, Inc. (a) | | | 418,300 | | | | 55,144,489 | |
Zoetis, Inc. | | | 302,500 | | | | 8,754,350 | |
| | | | | | | | |
| | | | | | | | 1,311,189,954 | |
Total Common Stocks — 97.4% | | | | | | | 3,618,300,168 | |
| | | | | | | | |
| | | | | | | |
See Notes to Financial Statements.
| | | | | | |
| 22 | | BLACKROCK FUNDS | | MARCH 31, 2014 | | |
| | | | |
| Schedule of Investments (continued) | | | BlackRock Health Sciences Opportunities Portfolio | |
| | | (Percentages shown are based on Net Assets) | |
| | | | | | | | |
Preferred Stocks | | | Shares | | | | Value | |
Biotechnology — 0.2% | | | | | | | | |
SAGE Therapeutics, Series C (Acquired 3/10/14, cost $8,368,520) (a)(c) | | | 1,976,271 | | | $ | 8,368,520 | |
Total Preferred Stocks — 0.2% | | | | 8,368,520 | |
Total Long-Term Investments (Cost — $2,633,127,764) — 97.6% | | | | 3,626,668,688 | |
| | | | | | | | |
| Short-Term Securities | | | | | | |
BlackRock Liquidity Funds, TempFund, Institutional Class, 0.03% (d)(e) | | | 108,321,040 | | | | 108,321,040 | |
| | | | | | | | |
| | |
| | | Beneficial
Interest (000) | | | | |
BlackRock Liquidity Series, LLC, Money Market Series, 0.16% (d)(e)(f) | | $ | 57,300 | | | | 57,299,570 | |
Total Short-Term Securities (Cost — $165,620,610) — 4.5% | | | | 165,620,610 | |
| | | | |
| | | Value | |
Total Investments (Cost — $2,798,748,374) — 102.1% | | | 3,792,289,298 | |
Liabilities in Excess of Other Assets — (2.1)% | | | (76,636,512 | ) |
| | | | |
Net Assets — 100.0% | | $ | 3,715,652,786 | |
| | | | |
|
| Notes to Schedule of Investments |
| (a) | Non-income producing security. |
| (b) | Security, or a portion of security, is on loan. |
| (c) | Restricted security as to resale. As of report date, the Fund held restricted securities with a current value of $26,301,360 and an original cost of $11,720,178, which was 0.7% of its net assets. |
| (d) | Represents the current yield as of report date. |
| (e) | Investments in issuers considered to be an affiliate of the Fund during the six months ended March 31, 2014, for purposes of Section 2(a)(3) of the Investment Company Act of 1940, as amended, were as follows: |
| | | | | | | | | | | | | | | | |
| Affiliate | | Shares/Beneficial
Interest Held at
September 30, 2013 | | | Net Activity | | | Shares/Beneficial
Interest Held at
March 31, 2014 | | | Income | |
BlackRock Liquidity Funds, TempFund, Institutional Class | | | 51,597,591 | | | | 56,723,449 | | | | 108,321,040 | | | $ | 15,512 | |
BlackRock Liquidity Series, LLC, Money Market Series | | $ | 189,308,224 | | | $ | (132,008,654 | ) | | $ | 57,299,570 | | | $ | 158,697 | |
| (f) | Security was purchased with the cash collateral from loaned securities. The Fund may withdraw up to 25% of its investment daily, although the manager of the BlackRock Liquidity Series, LLC, Money Market Series, in its sole discretion, may permit an investor to withdraw more than 25% on any one day. |
| Ÿ | | For Fund compliance purposes, the Fund’s industry classifications refer to any one or more of the industry sub-classifications used by one or more widely recognized market indexes or ratings group indexes, and/or as defined by the investment advisor. These definitions may not apply for purposes of this report, which may combine such industry sub-classifications for reporting ease. |
| Ÿ | | Forward foreign currency exchange contracts outstanding as of March 31, 2014 were as follows: |
| | | | | | | | | | | | | | | | | | | | | | |
Currency Purchased | | | Currency
Sold | | | Counterparty | | Settlement
Date | | | Unrealized
Appreciation
(Depreciation) | |
| CHF | | | 4,081,406 | | | | USD | | | | 4,616,876 | | | Royal Bank of Scotland PLC | | | 4/22/14 | | | $ | 662 | |
| CHF | | | 1,414,618 | | | | USD | | | | 1,594,744 | | | The Bank of New York Mellon | | | 4/22/14 | | | | 5,697 | |
| CHF | | | 28,530,404 | | | | USD | | | | 32,277,827 | | | UBS AG | | | 4/22/14 | | | | 318 | |
| USD | | | 35,419,113 | | | | CHF | | | | 32,090,000 | | | Citibank N.A. | | | 4/22/14 | | | | (886,215 | ) |
| USD | | | 2,473,284 | | | | CHF | | | | 2,179,876 | | | JPMorgan Chase Bank N.A. | | | 4/22/14 | | | | 7,061 | |
| USD | | | 1,960,104 | | | | CHF | | | | 1,720,848 | | | Royal Bank of Scotland PLC | | | 4/22/14 | | | | 13,206 | |
| USD | | | 2,003,023 | | | | CHF | | | | 1,780,202 | | | State Street Bank and Trust Co. | | | 4/22/14 | | | | (11,026 | ) |
| USD | | | 6,044,503 | | | | CHF | | | | 5,460,000 | | | UBS AG | | | 4/22/14 | | | | (132,720 | ) |
| USD | | | 82,395,437 | | | | CHF | | | | 74,816,292 | | | UBS AG | | | 4/22/14 | | | | (2,248,691 | ) |
| USD | | | 35,354,414 | | | | EUR | | | | 26,215,000 | | | Citibank N.A. | | | 4/22/14 | | | | (759,042 | ) |
See Notes to Financial Statements.
| | | | | | |
| | | BLACKROCK FUNDS | | MARCH 31, 2014 | | 23 |
| | | | |
| Schedule of Investments (continued) | | | BlackRock Health Sciences Opportunities Portfolio | |
| Ÿ | | Forward foreign currency exchange contracts outstanding as of March 31, 2014 were as follows: (concluded) |
| | | | | | | | | | | | | | | | | | | | | | |
Currency Purchased | | | Currency Sold | | | Counterparty | | Settlement
Date | | | Unrealized
Appreciation
(Depreciation) | |
| USD | | | 3,584,684 | | | | EUR | | | | 2,640,000 | | | Deutsche Bank AG | | | 4/22/14 | | | $ | (52,147 | ) |
| USD | | | 2,465,447 | | | | EUR | | | | 1,808,000 | | | UBS AG | | | 4/22/14 | | | | (25,231 | ) |
| USD | | | 11,451,558 | | | | EUR | | | | 8,399,000 | | | UBS AG | | | 4/22/14 | | | | (118,800 | ) |
| USD | | | 16,656,734 | | | | GBP | | | | 10,138,000 | | | Goldman Sachs Bank USA | | | 4/22/14 | | | | (242,030 | ) |
| USD | | | 5,086,513 | | | | HKD | | | | 39,440,000 | | | Citibank N.A. | | | 4/22/14 | | | | 1,356 | |
| USD | | | 5,231,197 | | | | JPY | | | | 545,486,000 | | | BNP Paribas S.A. | | | 4/22/14 | | | | (54,388 | ) |
| Total | | | | | | | | | | | | | | | | | | | | $ | (4,501,990 | ) |
| | | | | | | | | | | | | | | | | | | | | | |
| Ÿ | | Fair Value Measurements — Various inputs are used in determining the fair value of investments and derivative financial instruments. These inputs to valuation techniques are categorized into a disclosure hierarchy consisting of three broad levels for financial statement purposes as follows: |
| | Ÿ | | Level 1 — unadjusted price quotations in active markets/exchanges for identical assets or liabilities that the Fund has the ability to access |
| | Ÿ | | Level 2 — other observable inputs (including, but not limited to, quoted prices for similar assets or liabilities in markets that are active, quoted prices for identical or similar assets or liabilities in markets that are not active, inputs other than quoted prices that are observable for the assets or liabilities (such as interest rates, yield curves, volatilities, prepayment speeds, loss severities, credit risks and default rates) or other market–corroborated inputs) |
| | Ÿ | | Level 3 — unobservable inputs based on the best information available in the circumstances, to the extent observable inputs are not available (including the Fund’s own assumptions used in determining the fair value of investments and derivative financial instruments) |
The hierarchy gives the highest priority to unadjusted quoted prices in active markets for identical assets or liabilities (Level 1 measurements) and the lowest priority to unobservable inputs (Level 3 measurements). Accordingly, the degree of judgment exercised in determining fair value is greatest for instruments categorized in Level 3. The inputs used to measure fair value may fall into different levels of the fair value hierarchy. In such cases, for disclosure purposes, the fair value hierarchy classification is determined based on the lowest level input that is significant to the fair value measurement in its entirety.
Changes in valuation techniques may result in transfers into or out of an assigned level within the disclosure hierarchy. In accordance with the Fund’s policy, transfers between different levels of the fair value disclosure hierarchy are deemed to have occurred as of the beginning of the reporting period. The categorization of a value determined for investments and derivative financial instruments is based on the pricing transparency of the investment and derivative financial instrument and is not necessarily an indication of the risks associated with investing in those securities. For information about the Fund’s policy regarding valuation of investments and derivative financial instruments, please refer to Note 2 of the Notes to Financial Statements.
The following tables summarize the Fund’s investments and derivative financial instruments categorized in the disclosure hierarchy as of March 31, 2014:
| | | | | | | | | | | | | | | | |
| | | Level 1 | | | Level 2 | | | Level 3 | | | Total | |
Assets: | | | | | | | | | | | | | | | | |
Investments: | | | | | | | | | | | | | | | | |
Long-Term Investments: | | | | | | | | | | | | | | | | |
Common Stocks: | | | | | | | | | | | | | | | | |
Biotechnology | | $ | 909,115,778 | | | $ | 43,198,097 | | | | — | | | $ | 952,313,875 | |
Chemicals | | | 18,405,198 | | | | — | | | | — | | | | 18,405,198 | |
Diversified Consumer Services | | | 10,379,348 | | | | — | | | | — | | | | 10,379,348 | |
Health Care Equipment & Supplies | | | 606,451,599 | | | | 32,495,268 | | | | — | | | | 638,946,867 | |
Health Care Providers & Services | | | 452,703,915 | | | | 873,112 | | | | — | | | | 453,577,027 | |
Health Care Technology | | | 25,464,375 | | | | — | | | | — | | | | 25,464,375 | |
Life Sciences Tools & Services | | | 208,023,524 | | | | — | | | | — | | | | 208,023,524 | |
Pharmaceuticals | | | 1,041,655,702 | | | | 269,534,252 | | | | — | | | | 1,311,189,954 | |
Preferred Stocks | | | — | | | | — | | | $ | 8,368,520 | | | | 8,368,520 | |
Short-Term Securities | | | 108,321,040 | | | | 57,299,570 | | | | — | | | | 165,620,610 | |
Total | | $ | 3,380,520,479 | | | $ | 403,400,299 | | | $ | 8,368,520 | | | $ | 3,792,289,298 | |
| | | | |
| | | | | | | | | | | | | | | | |
| | | Level 1 | | | Level 2 | | | Level 3 | | | Total | |
Derivative Financial Instruments1 | | | | | | | | | | | | | | | | |
Assets: | | | | | | | | | | | | | | | | |
Foreign currency exchange contracts | | | — | | | $ | 28,300 | | | | — | | | $ | 28,300 | |
Liabilities: | | | | | | | | | | | | | | | | |
Foreign currency exchange contracts | | | — | | | | (4,530,290 | ) | | | — | | | | (4,530,290 | ) |
Total | | | — | | | $ | (4,501,990 | ) | | | — | | | $ | (4,501,990 | ) |
| | | | |
1 Derivative financial instruments are foreign currency exchange contracts and options written. Foreign currency exchange contracts are valued at the unrealized appreciation/ depreciation on the instrument and options written are shown at value. | | | | | |
See Notes to Financial Statements.
| | | | | | |
| 24 | | BLACKROCK FUNDS | | MARCH 31, 2014 | | |
| | |
| Schedule of Investments (concluded) | | BlackRock Health Sciences Opportunities Portfolio |
| | | | | | | | | | | | | | | | |
|
| The carrying amount for certain of the Fund’s assets and/or liabilities approximates fair value for financial statement purposes. As of March 31, 2014, such assets and/or liabilities are categorized within the disclosure hierarchy as follows: | |
| | | | | | | | | | | | | | | | |
| | | Level 1 | | | Level 2 | | | Level 3 | | | Total | |
Assets: | | | | | | | | | | | | | | | | |
Cash pledged as collateral for options written | | $ | 22,627,237 | | | | — | | | | — | | | $ | 22,627,237 | |
Foreign currency at value | | | 5,058,309 | | | | — | | | | — | | | | 5,058,309 | |
Liabilities: | | | | | | | | | | | | | | | | |
Bank overdraft | | | — | | | $ | (22,920 | ) | | | — | | | | (22,920 | ) |
Collateral on securities loaned at value | | | — | | | | (57,299,570 | ) | | | — | | | | (57,299,570 | ) |
Total | | $ | 27,685,546 | | | $ | (57,322,490 | ) | | | — | | | $ | (29,636,944 | ) |
| | | | |
There were no transfers between levels during the six months ended March 31, 2014.
See Notes to Financial Statements.
| | | | | | |
| | | BLACKROCK FUNDS | | MARCH 31, 2014 | | 25 |
| | | | |
| Schedule of Investments March 31, 2014 (Unaudited) | | | BlackRock International Opportunities Portfolio | |
| | | (Percentages shown are based on Net Assets) | |
| | | | | | | | |
| Common Stocks | | Shares | | | Value | |
Austria — 1.1% | | | | | | | | |
Erste Group Bank AG | | | 597,823 | | | $ | 20,451,338 | |
Belgium — 1.7% | | | | | | | | |
Anheuser-Busch InBev NV | | | 298,879 | | | | 31,476,702 | |
Brazil — 0.3% | | | | | | | | |
Banco Bradesco SA — ADR | | | 346,400 | | | | 4,735,288 | |
Canada — 2.6% | | | | | | | | |
Gildan Activewear, Inc. | | | 208,300 | | | | 10,496,963 | |
MEG Energy Corp. (a) | | | 563,900 | | | | 19,056,810 | |
Tourmaline Oil Corp. (a) | | | 419,175 | | | | 19,815,545 | |
| | | | | | | | |
| | | | | | | | 49,369,318 | |
China — 3.6% | | | | | | | | |
Anhui Conch Cement Co. Ltd., H Shares (b) | | | 5,069,000 | | | | 21,803,357 | |
Baidu, Inc. — ADR (a) | | | 61,000 | | | | 9,295,180 | |
China Cinda Asset Management Co. Ltd., H
Shares (a)(b) | | | 19,100,000 | | | | 10,873,447 | |
Ctrip.com International Ltd. — ADR (a) | | | 191,400 | | | | 9,650,388 | |
Ping An Insurance Group Co. of China Ltd., H Shares | | | 1,845,000 | | | | 15,333,555 | |
| | | | | | | | |
| | | | | | | | 66,955,927 | |
Denmark — 2.6% | | | | | | | | |
Chr Hansen Holding A/S | | | 419,068 | | | | 16,631,878 | |
ISS A/S (a) | | | 276,200 | | | | 9,275,725 | |
Novo Nordisk A/S, Class B | | | 517,300 | | | | 23,553,843 | |
| | | | | | | | |
| | | | | | | | 49,461,446 | |
Finland — 1.2% | | | | | | | | |
Nokia OYJ (a) | | | 1,695,080 | | | | 12,471,475 | |
Sanitec Corp. (a) | | | 834,044 | | | | 9,616,901 | |
| | | | | | | | |
| | | | | | | | 22,088,376 | |
France — 8.3% | | | | | | | | |
BNP Paribas SA | | | 215,723 | | | | 16,632,149 | |
Criteo SA — ADR (a) | | | 235,100 | | | | 9,533,305 | |
Publicis Groupe SA | | | 237,800 | | | | 21,468,958 | |
Rexel SA | | | 783,294 | | | | 20,551,661 | |
Safran SA | | | 143,700 | | | | 9,955,527 | |
Schneider Electric SA | | | 156,700 | | | | 13,887,820 | |
Société Générale SA | | | 414,300 | | | | 25,502,611 | |
Vivendi SA | | | 1,346,800 | | | | 37,485,479 | |
| | | | | | | | |
| | | | | | | | 155,017,510 | |
Germany — 8.9% | | | | | | | | |
Aixtron SE (a) | | | 766,348 | | | | 12,557,382 | |
Bayer AG, Registered Shares | | | 226,600 | | | | 30,687,183 | |
Commerzbank AG (a) | | | 482,378 | | | | 8,872,963 | |
Daimler AG, Registered Shares | | | 350,400 | | | | 33,147,631 | |
Dmg Mori Seiki AG | | | 233,764 | | | | 7,178,012 | |
KUKA AG | | | 194,756 | | | | 9,543,081 | |
OSRAM Licht AG (a) | | | 431,143 | | | | 27,956,203 | |
ProSiebenSat.1 Media AG | | | 415,200 | | | | 19,044,997 | |
Telefonica Deutschland Holding AG | | | 1,092,100 | | | | 8,715,720 | |
Wirecard AG | | | 185,800 | | | | 7,714,775 | |
| | | | | | | | |
| | | | | | | | 165,417,947 | |
Greece — 0.8% | | | | | | | | |
Alpha Bank AE (a) | | | 14,402,330 | | | | 14,132,486 | |
Hong Kong — 2.2% | | | | | | | | |
AIA Group Ltd. | | | 4,062,500 | | | | 19,321,859 | |
ASM Pacific Technology Ltd. | | | 105,000 | | | | 1,020,007 | |
Samsonite International SA | | | 6,428,300 | | | | 19,890,311 | |
| | | | | | | | |
| | | | | | | | 40,232,177 | |
India — 0.5% | | | | | | | | |
Tata Motors Ltd. — ADR | | | 264,000 | | | | 9,348,240 | |
| | | | | | | | |
| Common Stocks | | Shares | | | Value | |
Indonesia — 1.2% | | | | | | | | |
Global Mediacom Tbk PT | | | 31,933,500 | | | $ | 6,647,688 | |
Matahari Department Store Tbk PT (a) | | | 12,907,200 | | | | 15,867,503 | |
| | | | | | | | |
| | | | | | | | 22,515,191 | |
Ireland — 5.2% | | | | | | | | |
Bank of Ireland (a) | | | 29,178,500 | | | | 12,425,755 | |
CRH PLC | | | 941,600 | | | | 26,364,960 | |
Dalata Hotel Group PLC (a) | | | 2,131,126 | | | | 8,338,129 | |
Green REIT PLC (a) | | | 9,077,594 | | | | 15,006,975 | |
Kingspan Group PLC | | | 559,297 | | | | 10,579,233 | |
Ryanair Holdings Plc — ADR (a) | | | 426,500 | | | | 25,082,465 | |
| | | | | | | | |
| | | | | | | | 97,797,517 | |
Italy — 3.0% | | | | | | | | |
Banca Generali SpA | | | 438,300 | | | | 14,472,768 | |
Intesa Sanpaolo SpA | | | 6,136,600 | | | | 20,822,795 | |
Moncler SpA (a) | | | 530,500 | | | | 9,069,813 | |
UniCredit SpA | | | 1,355,200 | | | | 12,388,000 | |
| | | | | | | | |
| | | | | | | | 56,753,376 | |
Japan — 12.0% | | | | | | | | |
Calbee, Inc. | | | 11,900 | | | | 280,047 | |
Kenedix Realty Investment Corp. | | | 2,612 | | | | 12,952,940 | |
Makita Corp. | | | 166,100 | | | | 9,144,406 | |
Mitsui OSK Lines Ltd. | | | 2,362,000 | | | | 9,187,491 | |
Nabtesco Corp. | | | 1,078,700 | | | | 24,898,512 | |
Shinsei Bank Ltd. | | | 9,586,000 | | | | 18,819,573 | |
SMC Corp. | | | 102,400 | | | | 27,006,260 | |
SoftBank Corp. | | | 591,600 | | | | 44,706,181 | |
Sumitomo Mitsui Financial Group, Inc. | | | 754,600 | | | | 32,345,121 | |
Tokyo Tatemono Co. Ltd. | | | 2,040,000 | | | | 17,479,448 | |
Yahoo! Japan Corp. | | | 2,481,500 | | | | 12,156,712 | |
Yaskawa Electric Corp. | | | 1,016,800 | | | | 14,047,790 | |
| | | | | | | | |
| | | | | | | | 223,024,481 | |
Mexico — 1.0% | | | | | | | | |
Cemex SAB de CV — ADR (a) | | | 1,453,400 | | | | 18,356,442 | |
Netherlands — 3.4% | | | | | | | | |
Aalberts Industries NV | | | 594,005 | | | | 20,689,772 | |
ING Groep NV — CVA (a) | | | 1,128,700 | | | | 16,052,104 | |
Randstad Holding NV | | | 458,875 | | | | 26,857,489 | |
| | | | | | | | |
| | | | | | | | 63,599,365 | |
New Zealand — 0.9% | | | | | | | | |
Xero Ltd. (Acquired 10/15/13, cost $8,211,297) (a)(c) | | | 540,000 | | | | 16,596,888 | |
Nigeria — 0.7% | | | | | | | | |
Lekoil Ltd. (a)(d) | | | 14,262,400 | | | | 12,542,580 | |
Norway — 1.3% | | | | | | | | |
Statoil ASA | | | 888,400 | | | | 25,065,959 | |
Russia — 0.0% | | | | | | | | |
Eurasia Drilling Co. Ltd. — GDR | | | 36,998 | | | | 948,259 | |
South Africa — 1.1% | | | | | | | | |
Naspers Ltd., N Shares | | | 145,900 | | | | 16,077,158 | |
Playtech PLC | | | 324,920 | | | | 3,668,144 | |
| | | | | | | | |
| | | | | | | | 19,745,302 | |
South Korea — 1.2% | | | | | | | | |
Hyundai Development Co. — Engineering & Construction | | | 173,900 | | | | 4,918,351 | |
NAVER Corp. | | | 22,800 | | | | 16,659,295 | |
| | | | | | | | |
| | | | | | | | 21,577,646 | |
Spain — 3.4% | | | | | | | | |
Bankinter SA | | | 1,754,200 | | | | 14,124,238 | |
See Notes to Financial Statements.
| | | | | | |
| 26 | | BLACKROCK FUNDS | | MARCH 31, 2014 | | |
| | | | |
| Schedule of Investments (continued) | | | BlackRock International Opportunities Portfolio | |
| | | (Percentages shown are based on Net Assets) | |
| | | | | | | | |
| Common Stocks | | Shares | | | Value | |
Spain (concluded) | | | | | | | | |
NH Hoteles SA (a) | | | 4,375,356 | | | $ | 31,134,377 | |
Sacyr SA (a) | | | 2,747,937 | | | | 18,276,191 | |
| | | | | | | | |
| | | | | | | | 63,534,806 | |
Sweden — 3.6% | | | | | | | | |
Nordea Bank AB | | | 673,900 | | | | 9,559,682 | |
Seamless Distribution AB (a)(b) | | | 755,464 | | | | 3,722,576 | |
Skanska AB, B Shares | | | 647,490 | | | | 15,263,531 | |
Svenska Cellulosa AB SCA, B Shares | | | 1,290,522 | | | | 38,007,354 | |
| | | | | | | | |
| | | | | | | | 66,553,143 | |
Switzerland — 10.0% | | | | | | | | |
Actelion Ltd., Registered Shares | | | 225,755 | | | | 21,394,441 | |
Adecco SA | | | 280,100 | | | | 23,311,669 | |
Novartis AG, Registered Shares | | | 728,200 | | | | 61,829,950 | |
Roche Holding AG | | | 203,014 | | | | 61,059,257 | |
UBS AG, Registered Shares | | | 904,902 | | | | 18,725,460 | |
| | | | | | | | |
| | | | | | | | 186,320,777 | |
Taiwan — 1.1% | | | | | | | | |
Epistar Corp. | | | 6,579,000 | | | | 15,846,838 | |
Hermes Microvision, Inc. — GDR (a)(e) | | | 121,933 | | | | 4,781,603 | |
| | | | | | | | |
| | | | | | | | 20,628,441 | |
Thailand — 0.6% | | | | | | | | |
PTT Global Chemical PCL (a) | | | 5,138,600 | | | | 11,444,632 | |
Turkey — 0.5% | | | | | | | | |
Turkiye Halk Bankasi AS | | | 1,578,159 | | | | 9,774,736 | |
United Kingdom — 15.0% | | | | | | | | |
AO World PLC (a) | | | 2,035,000 | | | | 10,652,851 | |
APR Energy PLC (b) | | | 1,520,844 | | | | 20,423,117 | |
AstraZeneca PLC | | | 481,300 | | | | 31,201,039 | |
Babcock International Group PLC | | | 995,100 | | | | 22,346,296 | |
Crest Nicholson Holdings PLC | | | 3,923,492 | | | | 25,725,779 | |
DS Smith PLC | | | 3,266,120 | | | | 17,701,338 | |
esure Group PLC | | | 2,215,306 | | | | 10,369,636 | |
Foxtons Group PLC (a) | | | 4,194,324 | | | | 25,193,907 | |
Halma PLC | | | 1,563,576 | | | | 15,029,168 | |
Hargreaves Lansdown PLC | | | 397,345 | | | | 9,665,883 | |
Kennedy Wilson Europe Real Estate PLC (a) | | | 808,719 | | | | 14,021,769 | |
Monitise PLC (a) | | | 7,242,500 | | | | 8,582,815 | |
Ocado Group PLC (a) | | | 694,700 | | | | 5,336,685 | |
Perform Group PLC (a) | | | 2,727,873 | | | | 11,141,971 | |
Poundland Group PLC (a) | | | 626,032 | | | | 3,965,993 | |
| | | | | | | | |
| Common Stocks | | Shares | | | Value | |
United Kingdom (concluded) | | | | | | | | |
Rio Tinto PLC | | | 242,800 | | | $ | 13,540,323 | |
Travis Perkins PLC | | | 572,600 | | | | 18,029,780 | |
Ultra Electronics Holdings PLC | | | 196,181 | | | | 5,857,599 | |
Vodafone Group PLC | | | 3,227,549 | | | | 11,868,661 | |
| | | | | | | | |
| | | | | | | | 280,654,610 | |
United States — 1.5% | | | | | | | | |
Euronet Worldwide, Inc. (a) | | | 271,683 | | | | 11,299,296 | |
Platform Specialty Products Corp. (a) | | | 147,683 | | | | 2,813,361 | |
Schlumberger Ltd. | | | 68,700 | | | | 6,698,250 | |
Verizon Communications, Inc. | | | 155,622 | | | | 7,420,057 | |
| | | | | | | | |
| | | | | | | | 28,230,964 | |
Total Common Stocks — 100.5% | | | | | | | 1,874,351,870 | |
| | | | | | | | |
| Preferred Stocks | | | | | | |
United States — 0.5% | | | | | | | | |
SAGE Therapeutics, Series C (Acquired 1/15/14, cost $9,137,436) (a)(c) | | | 429,853 | | | | 9,316,121 | |
Total Preferred Stocks — 0.5% | | | | | | | 9,316,121 | |
| | | | | | | | |
Total Long-Term Investments
(Cost — $1,592,965,858) — 101.0% | | | 1,883,667,991 | |
| | | | | | | | |
| Short-Term Securities | | | | | | |
BlackRock Liquidity Funds, TempFund, Institutional Class, 0.03% (f)(g) | | | 5,443,397 | | | | 5,443,397 | |
| | | Beneficial Interest (000) | | | | |
BlackRock Liquidity Series, LLC, Money Market
Series, 0.16% (f)(g)(h) | | $ | 56,773 | | | | 56,773,283 | |
Total Short-Term Securities (Cost — $62,216,680) — 3.3% | | | | 62,216,680 | |
Total Investments (Cost — $1,655,182,538) — 104.3% | | | | 1,945,884,671 | |
Liabilities in Excess of Other Assets — (4.3)% | | | | (80,607,622 | ) |
| | | | | | | | |
Net Assets — 100.0% | | | | | | $ | 1,865,277,049 | |
| | | | | | | | |
|
| Notes to Schedule of Investments |
| (a) | Non-income producing security. |
| (b) | Security, or a portion of security, is on loan. |
| (c) | Restricted security as to resale. As of report date, the Fund held restricted securities with a current value of $25,913,009 and an original cost of $17,348,733, which was 1.4% of its net assets. |
| (d) | Investments in issuers (whereby the Fund held 5% or more of the companies’ outstanding securities) that were considered to be an affiliate during the six months ended March 31, 2014, for purposes of Section 2(a)(3) of the Investment Company Act of 1940, as amended, were as follows: |
| | | | | | | | | | | | | | | | |
| Affiliate | | Shares Held at
September 30, 2013 | | | Shares
Purchased | | | Shares Held at
March 31, 2014 | | | Value at
March 31, 2014 | |
Lekoil Ltd.1 | | | 11,466,200 | | | | 2,796,200 | | | | 14,262,400 | | | $ | 12,542,580 | |
| | 1 | No longer an affiliated company as of report date. |
| (e) | Security exempt from registration pursuant to Rule 144A under the Securities Act of 1933, as amended. These securities may be resold in transactions exempt from registration to qualified institutional investors. |
See Notes to Financial Statements.
| | | | | | |
| | | BLACKROCK FUNDS | | MARCH 31, 2014 | | 27 |
| | | | |
| Schedule of Investments (continued) | | | BlackRock International Opportunities Portfolio | |
| (f) | Investments in issuers considered to be an affiliate of the Fund during the six months ended March 31, 2014, for purposes of Section 2(a)(3) of the Investment Company Act of 1940, as amended, were as follows: |
| | | | | | | | | | | | | | | | |
| Affiliate | | Shares/Beneficial
Interest Held at
September 30, 2013 | | | Net Activity | | | Shares/Beneficial
Interest Held at
March 31, 2014 | | | Income | |
BlackRock Liquidity Funds, TempFund, Institutional Class | | | 362,527 | | | | 5,080,870 | | | | 5,443,397 | | | $ | 2,228 | |
BlackRock Liquidity Series, LLC, Money Market Series | | $ | 30,786,020 | | | $ | 25,987,263 | | | $ | 56,773,283 | | | $ | 513,794 | |
| (g) | Represents the current yield as of report date. |
| (h) | Security was purchased with the cash collateral from loaned securities. The Fund may withdraw up to 25% of its investment daily, although the manager of the BlackRock Liquidity Series, LLC, Money Market Series, in its sole discretion, may permit an investor to withdraw more than 25% on any one day. |
| Ÿ | | Forward foreign currency exchange contracts outstanding as of March 31, 2014 were as follows: |
| | | | | | | | | | | | | | | | | | | | | | |
Currency Purchased | | | Currency
Sold | | | Counterparty | | Settlement
Date | | | Unrealized
Appreciation
(Depreciation) | |
| CHF | | | 1,906,973 | | | | USD | | | | 2,097,027 | | | BNP Paribas S.A. | | | 4/22/14 | | | $ | 60,446 | |
| CHF | | | 629,437 | | | | USD | | | | 691,176 | | | Citibank N.A. | | | 4/22/14 | | | | 20,943 | |
| CHF | | | 1,227,629 | | | | USD | | | | 1,351,315 | | | State Street Bank and Trust Co. | | | 4/22/14 | | | | 37,575 | |
| CHF | | | 3,185,439 | | | | USD | | | | 3,499,125 | | | State Street Bank and Trust Co. | | | 4/22/14 | | | | 104,752 | |
| CHF | | | 1,159,659 | | | | USD | | | | 1,307,320 | | | The Bank of New York Mellon | | | 4/22/14 | | | | 4,670 | |
| CHF | | | 1,196,084 | | | | USD | | | | 1,367,042 | | | The Bank of New York Mellon | | | 4/22/14 | | | | (13,841 | ) |
| DKK | | | 50,994,542 | | | | USD | | | | 9,304,307 | | | Bank of America N.A. | | | 4/22/14 | | | | 106,834 | |
| EUR | | | 5,370,000 | | | | USD | | | | 7,406,562 | | | BNP Paribas S.A. | | | 4/22/14 | | | | (8,917 | ) |
| EUR | | | 4,464,000 | | | | USD | | | | 6,205,603 | | | Citibank N.A. | | | 4/22/14 | | | | (56,052 | ) |
| EUR | | | 4,504,000 | | | | USD | | | | 6,258,326 | | | Citibank N.A. | | | 4/22/14 | | | | (53,672 | ) |
| EUR | | | 19,684,000 | | | | USD | | | | 27,152,562 | | | Citibank N.A. | | | 4/22/14 | | | | (36,130 | ) |
| EUR | | | 34,055,241 | | | | USD | | | | 46,297,453 | | | Citibank N.A. | | | 4/22/14 | | | | 616,621 | |
| EUR | | | 5,929,000 | | | | USD | | | | 8,244,761 | | | JPMorgan Chase Bank N.A. | | | 4/22/14 | | | | (77,044 | ) |
| EUR | | | 5,497,000 | | | | USD | | | | 7,567,995 | | | The Bank of New York Mellon | | | 4/22/14 | | | | 4,604 | |
| GBP | | | 10,080,000 | | | | USD | | | | 16,616,053 | | | Deutsche Bank AG | | | 4/22/14 | | | | 186,031 | |
| GBP | | | 18,219,000 | | | | USD | | | | 30,318,347 | | | Goldman Sachs Bank USA | | | 4/22/14 | | | | 50,421 | |
| GBP | | | 1,002,000 | | | | USD | | | | 1,665,299 | | | State Street Bank and Trust Co. | | | 4/22/14 | | | | 4,908 | |
| HKD | | | 49,251,000 | | | | USD | | | | 6,342,487 | | | Citibank N.A. | | | 4/22/14 | | | | 7,641 | |
| HKD | | | 298,710,000 | | | | USD | | | | 38,524,197 | | | Deutsche Bank AG | | | 4/22/14 | | | | (10,322 | ) |
| JPY | | | 1,061,454,671 | | | | USD | | | | 10,352,948 | | | Barclays Bank PLC | | | 4/22/14 | | | | (67,791 | ) |
| JPY | | | 173,400,532 | | | | USD | | | | 1,678,320 | | | Deutsche Bank AG | | | 4/22/14 | | | | 1,876 | |
| JPY | | | 817,426,000 | | | | USD | | | | 7,944,428 | | | JPMorgan Chase Bank N.A. | | | 4/22/14 | | | | (23,830 | ) |
| JPY | | | 913,540,000 | | | | USD | | | | 9,018,716 | | | JPMorgan Chase Bank N.A. | | | 4/22/14 | | | | (166,805 | ) |
| JPY | | | 941,720,000 | | | | USD | | | | 9,174,176 | | | State Street Bank and Trust Co. | | | 4/22/14 | | | | (49,210 | ) |
| JPY | | | 1,518,073,459 | | | | USD | | | | 14,906,602 | | | The Bank of New York Mellon | | | 4/22/14 | | | | (196,954 | ) |
| JPY | | | 1,803,901,000 | | | | USD | | | | 17,683,518 | | | Westpac Banking Corp. | | | 4/22/14 | | | | (204,293 | ) |
| NOK | | | 21,473,000 | | | | USD | | | | 3,575,484 | | | Bank of America N.A. | | | 4/22/14 | | | | 7,596 | |
| NOK | | | 65,234,602 | | | | USD | | | | 10,849,738 | | | Barclays Bank PLC | | | 4/22/14 | | | | 35,597 | |
| SGD | | | 21,429,000 | | | | USD | | | | 16,845,970 | | | Deutsche Bank AG | | | 4/22/14 | | | | 189,765 | |
| USD | | | 7,464,736 | | | | CHF | | | | 6,508,279 | | | Barclays Bank PLC | | | 4/22/14 | | | | 101,532 | |
| USD | | | 27,754,415 | | | | CHF | | | | 25,080,000 | | | Goldman Sachs International | | | 4/22/14 | | | | (620,082 | ) |
| USD | | | 5,859,913 | | | | CHF | | | | 5,200,263 | | | JPMorgan Chase Bank N.A. | | | 4/22/14 | | | | (23,454 | ) |
| USD | | | 25,542,148 | | | | CHF | | | | 23,192,653 | | | UBS AG | | | 4/22/14 | | | | (697,082 | ) |
| USD | | | 2,168,425 | | | | CHF | | | | 1,917,230 | | | Westpac Banking Corp. | | | 4/22/14 | | | | (652 | ) |
| USD | | | 1,134,594 | | | | DKK | | | | 6,067,000 | | | Bank of America N.A. | | | 4/22/14 | | | | 14,918 | |
| USD | | | 1,901,490 | | | | DKK | | | | 10,218,039 | | | Bank of America N.A. | | | 4/22/14 | | | | 15,731 | |
See Notes to Financial Statements.
| | | | | | |
| 28 | | BLACKROCK FUNDS | | MARCH 31, 2014 | | |
| | | | |
| Schedule of Investments (continued) | | | BlackRock International Opportunities Portfolio | |
| Ÿ | | Forward foreign currency exchange contracts outstanding as of March 31, 2014 were as follows: (continued) |
| | | | | | | | | | | | | | | | | | | | | | |
Currency Purchased | | | Currency Sold | | | Counterparty | | Settlement
Date | | | Unrealized
Appreciation
(Depreciation) | |
| USD | | | 2,091,354 | | | | DKK | | | | 11,339,817 | | | Bank of America N.A. | | | 4/22/14 | | | $ | (1,431 | ) |
| USD | | | 4,972,598 | | | | DKK | | | | 27,028,216 | | | Bank of America N.A. | | | 4/22/14 | | | | (15,512 | ) |
| USD | | | 13,830,929 | | | | DKK | | | | 76,407,667 | | | Bank of America N.A. | | | 4/22/14 | | | | (270,253 | ) |
| USD | | | 933,647 | | | | DKK | | | | 5,103,532 | | | BNP Paribas S.A. | | | 4/22/14 | | | | (8,219 | ) |
| USD | | | 3,200,288 | | | | DKK | | | | 17,372,039 | | | Citibank N.A. | | | 4/22/14 | | | | (5,755 | ) |
| USD | | | 4,290,484 | | | | DKK | | | | 23,377,305 | | | Citibank N.A. | | | 4/22/14 | | | | (23,842 | ) |
| USD | | | 2,076,812 | | | | DKK | | | | 11,255,260 | | | Credit Suisse International | | | 4/22/14 | | | | (368 | ) |
| USD | | | 1,283,967 | | | | DKK | | | | 7,007,527 | | | Morgan Stanley Capital Services LLC | | | 4/22/14 | | | | (9,285 | ) |
| USD | | | 2,955,027 | | | | DKK | | | | 16,163,492 | | | Morgan Stanley Capital Services LLC | | | 4/22/14 | | | | (27,977 | ) |
| USD | | | 6,414,088 | | | | DKK | | | | 34,530,404 | | | Morgan Stanley Capital Services LLC | | | 4/22/14 | | | | 41,436 | |
| USD | | | 4,657,210 | | | | EUR | | | | 3,357,000 | | | Barclays Bank PLC | | | 4/22/14 | | | | 32,648 | |
| USD | | | 948,119 | | | | EUR | | | | 690,000 | | | BNP Paribas S.A. | | | 4/22/14 | | | | (2,416 | ) |
| USD | | | 8,382,590 | | | | EUR | | | | 6,129,000 | | | BNP Paribas S.A. | | | 4/22/14 | | | | (60,643 | ) |
| USD | | | 8,498,747 | | | | EUR | | | | 6,129,000 | | | BNP Paribas S.A. | | | 4/22/14 | | | | 55,513 | |
| USD | | | 9,174,290 | | | | EUR | | | | 6,750,000 | | | Citibank N.A. | | | 4/22/14 | | | | (124,426 | ) |
| USD | | | 13,148,590 | | | | EUR | | | | 9,590,000 | | | Citibank N.A. | | | 4/22/14 | | | | (62,474 | ) |
| USD | | | 252,858,749 | | | | EUR | | | | 186,222,000 | | | Deutsche Bank AG | | | 4/22/14 | | | | (3,678,351 | ) |
| USD | | | 3,848,577 | | | | EUR | | | | 2,807,000 | | | Goldman Sachs Bank USA | | | 4/22/14 | | | | (18,311 | ) |
| USD | | | 5,589,645 | | | | EUR | | | | 4,019,000 | | | State Street Bank and Trust Co. | | | 4/22/14 | | | | 53,121 | |
| USD | | | 297,231 | | | | EUR | | | | 218,000 | | | UBS AG | | | 4/22/14 | | | | (3,084 | ) |
| USD | | | 10,767,559 | | | | EUR | | | | 7,818,000 | | | Westpac Banking Corp. | | | 4/22/14 | | | | (2,420 | ) |
| USD | | | 1,606,010 | | | | GBP | | | | 962,000 | | | Citibank N.A. | | | 4/22/14 | | | | 2,478 | |
| USD | | | 8,662,724 | | | | GBP | | | | 5,210,000 | | | Goldman Sachs Bank USA | | | 4/22/14 | | | | (21,687 | ) |
| USD | | | 14,005,918 | | | | GBP | | | | 8,385,000 | | | Goldman Sachs Bank USA | | | 4/22/14 | | | | 29,184 | |
| USD | | | 77,087,917 | | | | GBP | | | | 46,919,000 | | | Goldman Sachs International | | | 4/22/14 | | | | (1,120,121 | ) |
| USD | | | 6,663,513 | | | | GBP | | | | 4,007,000 | | | JPMorgan Chase Bank N.A. | | | 4/22/14 | | | | (15,649 | ) |
| USD | | | 1,603,387 | | | | GBP | | | | 960,000 | | | UBS AG | | | 4/22/14 | | | | 3,189 | |
| USD | | | 3,339,643 | | | | GBP | | | | 1,997,000 | | | Westpac Banking Corp. | | | 4/22/14 | | | | 10,897 | |
| USD | | | 4,775,089 | | | | GBP | | | | 2,861,000 | | | Westpac Banking Corp. | | | 4/22/14 | | | | 6,164 | |
| USD | | | 1,217,248 | | | | HKD | | | | 9,439,000 | | | Citibank N.A. | | | 4/22/14 | | | | 240 | |
| USD | | | 3,664,720 | | | | HKD | | | | 28,429,000 | | | Citibank N.A. | | | 4/22/14 | | | | (745 | ) |
| USD | | | 13,402,111 | | | | HKD | | | | 103,936,000 | | | Royal Bank of Scotland PLC | | | 4/22/14 | | | | 1,227 | |
| USD | | | 106,641,902 | | | | JPY | | | | 11,120,144,000 | | | BNP Paribas S.A. | | | 4/22/14 | | | | (1,108,748 | ) |
| USD | | | 1,440,758 | | | | JPY | | | | 146,781,000 | | | Citibank N.A. | | | 4/22/14 | | | | 18,497 | |
| USD | | | 2,546,983 | | | | JPY | | | | 260,685,000 | | | Credit Suisse International | | | 4/22/14 | | | | 21,029 | |
| USD | | | 7,658,086 | | | | JPY | | | | 790,280,000 | | | JPMorgan Chase Bank N.A. | | | 4/22/14 | | | | 525 | |
| USD | | | 34,625,887 | | | | JPY | | | | 3,567,564,000 | | | JPMorgan Chase Bank N.A. | | | 4/22/14 | | | | 57,329 | |
| USD | | | 9,497,152 | | | | JPY | | | | 972,005,000 | | | Westpac Banking Corp. | | | 4/22/14 | | | | 78,733 | |
| USD | | | 22,648,944 | | | | NOK | | | | 140,029,000 | | | Bank of America N.A. | | | 4/22/14 | | | | (716,916 | ) |
| USD | | | 7,428,787 | | | | NZD | | | | 8,645,000 | | | Bank of America N.A. | | | 4/22/14 | | | | (60,240 | ) |
| USD | | | 8,102,095 | | | | NZD | | | | 9,801,000 | | | JPMorgan Chase Bank N.A. | | | 4/22/14 | | | | (388,357 | ) |
| USD | | | 1,338,779 | | | | SEK | | | | 8,646,000 | | | Bank of America N.A. | | | 4/22/14 | | | | 3,392 | |
| USD | | | 1,687,843 | | | | SEK | | | | 10,779,000 | | | Bank of America N.A. | | | 4/22/14 | | | | 23,011 | |
See Notes to Financial Statements.
| | | | | | |
| | | BLACKROCK FUNDS | | MARCH 31, 2014 | | 29 |
| | | | |
| Schedule of Investments (continued) | | | BlackRock International Opportunities Portfolio | |
| Ÿ | | Forward foreign currency exchange contracts outstanding as of March 31, 2014 were as follows: (concluded) |
| | | | | | | | | | | | | | | | | | | | | | |
Currency Purchased | | | Currency
Sold | | | Counterparty | | Settlement
Date | | | Unrealized
Appreciation
(Depreciation) | |
| USD | | | 2,943,865 | | | | SEK | | | | 18,919,000 | | | Bank of America N.A. | | | 4/22/14 | | | $ | 21,799 | |
| USD | | | 3,102,763 | | | | SEK | | | | 19,867,000 | | | Bank of America N.A. | | | 4/22/14 | | | | 34,277 | |
| USD | | | 1,877,238 | | | | SEK | | | | 12,120,000 | | | BNP Paribas S.A. | | | 4/22/14 | | | | 5,287 | |
| USD | | | 1,978,695 | | | | SEK | | | | 12,856,000 | | | BNP Paribas S.A. | | | 4/22/14 | | | | (6,932 | ) |
| USD | | | 7,281,596 | | | | SEK | | | | 47,253,000 | | | Citibank N.A. | | | 4/22/14 | | | | (16,696 | ) |
| USD | | | 2,516,747 | | | | SEK | | | | 16,449,000 | | | Goldman Sachs Bank USA | | | 4/22/14 | | | | (23,825 | ) |
| USD | | | 1,953,482 | | | | SEK | | | | 12,755,000 | | | JPMorgan Chase Bank N.A. | | | 4/22/14 | | | | (16,546 | ) |
| USD | | | 5,092,199 | | | | SEK | | | | 33,012,000 | | | JPMorgan Chase Bank N.A. | | | 4/22/14 | | | | (6,550 | ) |
| USD | | | 2,568,815 | | | | SEK | | | | 16,546,000 | | | Royal Bank of Scotland PLC | | | 4/22/14 | | | | 13,262 | |
| USD | | | 9,375,352 | | | | TRY | | | | 20,300,000 | | | Bank of America N.A. | | | 4/22/14 | | | | (46,793 | ) |
| USD | | | 3,304,997 | | | | ZAR | | | | 35,930,000 | | | BNP Paribas S.A. | | | 4/22/14 | | | | (96,316 | ) |
| USD | | | 2,743,876 | | | | ZAR | | | | 30,509,000 | | | Citibank N.A. | | | 4/22/14 | | | | (144,258 | ) |
| USD | | | 6,491,633 | | | | ZAR | | | | 73,095,782 | | | Citibank N.A. | | | 4/22/14 | | | | (427,979 | ) |
| USD | | | 3,435,972 | | | | ZAR | | | | 37,414,000 | | | UBS AG | | | 4/22/14 | | | | (105,825 | ) |
| ZAR | | | 275,695,000 | | | | USD | | | | 25,145,189 | | | Goldman Sachs Bank USA | | | 4/22/14 | | | | 953,477 | |
| Total | | | | | | | | | | | | | | | | | | | | $ | (7,905,905 | ) |
| | | | | | | | | | | | | | | | | | | | | | |
| Ÿ | | Fair Value Measurements — Various inputs are used in determining the fair value of investments and derivative financial instruments. These inputs to valuation techniques are categorized into a disclosure hierarchy consisting of three broad levels for financial statement purposes as follows: |
| | Ÿ | | Level 1 — unadjusted price quotations in active markets/exchanges for identical assets or liabilities that the Fund has the ability to access |
| | Ÿ | | Level 2 — other observable inputs (including, but not limited to, quoted prices for similar assets or liabilities in markets that are active, quoted prices for identical or similar assets or liabilities in markets that are not active, inputs other than quoted prices that are observable for the assets or liabilities (such as interest rates, yield curves, volatilities, prepayment speeds, loss severities, credit risks and default rates) or other market–corroborated inputs) |
| | Ÿ | | Level 3 — unobservable inputs based on the best information available in the circumstances, to the extent observable inputs are not available (including the Fund’s own assumptions used in determining the fair value of investments and derivative financial instruments) |
The hierarchy gives the highest priority to unadjusted quoted prices in active markets for identical assets or liabilities (Level 1 measurements) and the lowest priority to unobservable inputs (Level 3 measurements). Accordingly, the degree of judgment exercised in determining fair value is greatest for instruments categorized in Level 3. The inputs used to measure fair value may fall into different levels of the fair value hierarchy. In such cases, for disclosure purposes, the fair value hierarchy classification is determined based on the lowest level input that is significant to the fair value measurement in its entirety.
Changes in valuation techniques may result in transfers into or out of an assigned level within the disclosure hierarchy. In accordance with the Fund’s policy, transfers between different levels of the fair value disclosure hierarchy are deemed to have occurred as of the beginning of the reporting period. The categorization of a value determined for investments and derivative financial instruments is based on the pricing transparency of the investment and derivative financial instrument and is not necessarily an indication of the risks associated with investing in those securities. For information about the Fund’s policy regarding valuation of investments and derivative financial instruments, please refer to Note 2 of the Notes to Financial Statements.
The following tables summarize the Fund’s investments and derivative financial instruments categorized in the disclosure hierarchy as of March 31, 2014:
| | | | | | | | | | | | | | | | |
| | | Level 1 | | | Level 2 | | | Level 3 | | | Total | |
Assets: | | | | | | | | | | | | | | | | |
Investments: | | | | | | | | | | | | | | | | |
Long-Term Investments: | | | | | | | | | | | | | | | | |
Common Stocks: | | | | | | | | | | | | | | | | |
Austria | | | — | | | $ | 20,451,338 | | | | — | | | $ | 20,451,338 | |
Belgium | | | — | | | | 31,476,702 | | | | — | | | | 31,476,702 | |
Brazil | | $ | 4,735,288 | | | | — | | | | — | | | | 4,735,288 | |
Canada | | | 49,369,318 | | | | — | | | | — | | | | 49,369,318 | |
China | | | 18,945,568 | | | | 48,010,359 | | | | — | | | | 66,955,927 | |
Denmark | | | 9,275,725 | | | | 40,185,721 | | | | — | | | | 49,461,446 | |
Finland | | | — | | | | 22,088,376 | | | | — | | | | 22,088,376 | |
France | | | 30,084,966 | | | | 124,932,544 | | | | — | | | | 155,017,510 | |
Germany | | | — | | | | 165,417,947 | | | | — | | | | 165,417,947 | |
Greece | | | — | | | | 14,132,486 | | | | — | | | | 14,132,486 | |
Hong Kong | | | — | | | | 40,232,177 | | | | — | | | | 40,232,177 | |
See Notes to Financial Statements.
| | | | | | |
| 30 | | BLACKROCK FUNDS | | MARCH 31, 2014 | | |
| | | | |
| Schedule of Investments (concluded) | | | BlackRock International Opportunities Portfolio | |
| | | | | | | | | | | | | | | | |
| | | Level 1 | | | Level 2 | | | Level 3 | | | Total | |
India | | $ | 9,348,240 | | | | — | | | | — | | | $ | 9,348,240 | |
Indonesia | | | — | | | $ | 22,515,191 | | | | — | | | | 22,515,191 | |
Ireland | | | 59,006,802 | | | | 38,790,715 | | | | — | | | | 97,797,517 | |
Italy | | | 9,069,813 | | | | 47,683,563 | | | | — | | | | 56,753,376 | |
Japan | | | 280,047 | | | | 222,744,434 | | | | — | | | | 223,024,481 | |
Mexico | | | 18,356,442 | | | | — | | | | — | | | | 18,356,442 | |
Netherlands | | | — | | | | 63,599,365 | | | | — | | | | 63,599,365 | |
New Zealand | | | — | | | | 16,596,888 | | | | — | | | | 16,596,888 | |
Nigeria | | | 12,542,580 | | | | — | | | | — | | | | 12,542,580 | |
Norway | | | — | | | | 25,065,959 | | | | — | | | | 25,065,959 | |
Russia | | | 948,259 | | | | — | | | | — | | | | 948,259 | |
South Africa | | | — | | | | 19,745,302 | | | | — | | | | 19,745,302 | |
South Korea | | | — | | | | 21,577,646 | | | | — | | | | 21,577,646 | |
Spain | | | — | | | | 63,534,806 | | | | — | | | | 63,534,806 | |
Sweden | | | — | | | | 66,553,143 | | | | — | | | | 66,553,143 | |
Switzerland | | | — | | | | 186,320,777 | | | | — | | | | 186,320,777 | |
Taiwan | | | 4,781,603 | | | | 15,846,838 | | | | — | | | | 20,628,441 | |
Thailand | | | 11,444,632 | | | | — | | | | — | | | | 11,444,632 | |
Turkey | | | — | | | | 9,774,736 | | | | — | | | | 9,774,736 | |
United Kingdom | | | 85,931,480 | | | | 194,723,130 | | | | — | | | | 280,654,610 | |
United States | | | 28,230,964 | | | | — | | | | — | | | | 28,230,964 | |
Preferred Stocks | | | — | | | | — | | | $ | 9,316,121 | | | | 9,316,121 | |
Short-Term Securities | | | 5,443,397 | | | | 56,773,283 | | | | — | | | | 62,216,680 | |
Total | | $ | 357,795,124 | | | $ | 1,578,773,426 | | | $ | 9,316,121 | | | $ | 1,945,884,671 | |
| | | | |
| | | | | | | | | | | | | | | | |
| | | Level 1 | | | Level 2 | | | Level 3 | | | Total | |
Derivative Financial Instruments1 | | | | | | | | | | | | | | | | |
Assets: | | | | | | | | | | | | | | | | |
Foreign currency exchange contracts | | | — | | | $ | 3,039,176 | | | | — | | | $ | 3,039,176 | |
Liabilities: | | | | | | | | | | | | | | | | |
Foreign currency exchange contracts | | | — | | | | (10,945,081 | ) | | | — | | | | (10,945,081 | ) |
Total | | | — | | | $ | (7,905,905 | ) | | | — | | | $ | (7,905,905 | ) |
| | | | |
1 Derivative financial instruments are foreign currency exchange contracts, which are valued at the unrealized appreciation/depreciation on the instrument. | | | | | |
| |
| The carrying amount for certain of the Fund’s assets and/or liabilities approximates fair value for financial statement purposes. As of March 31, 2014, such assets and/or liabilities are categorized within the disclosure hierarchy as follows: | | | | | |
| | | | | | | | | | | | | | | | |
| | | Level 1 | | | Level 2 | | | Level 3 | | | Total | |
Assets: | | | | | | | | | | | | | | | | |
Foreign currency at value | | $ | 40,967,721 | | | | — | | | | — | | | $ | 40,967,721 | |
Liabilities: | | | | | | | | | | | | | | | | |
Bank overdraft | | | — | | | $ | (2,378 | ) | | | — | | | | (2,378 | ) |
Collateral on securities loaned at value | | | — | | | | (56,773,283 | ) | | | — | | | | (56,773,283 | ) |
Total | | $ | 40,967,721 | | | $ | (56,775,661 | ) | | | — | | | $ | (15,807,940 | ) |
| | | | |
Certain foreign securities are fair valued utilizing an external pricing service to reflect any significant market movements between the time the Fund values such foreign securities and the earlier closing of foreign markets. Such fair valuations are categorized as Level 2 in the disclosure hierarchy. As of March 31, 2014, securities with a value of $42,272,865 were systematically fair valued due to significant market movements, but were not valued using systematic fair values as of September 30, 2013. Therefore, these securities were transferred from Level 2 to Level 1 during the period September 30, 2013 to March 31, 2014.
Certain foreign securities are fair valued utilizing an external pricing service to reflect any significant market movements between the time the Fund values such foreign securities and the earlier closing of foreign markets. Such fair valuations are categorized as Level 2 in the disclosure hierarchy. As of September 30, 2013, the Fund did not utilize the external pricing service model adjustments as significant market movements did not occur. As of March 31, 2014, securities with a value of $35,563,543 were systematically fair valued due to significant market movements. Therefore, these securities were transferred from Level 1 to Level 2 during the period September 30, 2013 to March 31, 2014.
See Notes to Financial Statements.
| | | | | | |
| | | BLACKROCK FUNDS | | MARCH 31, 2014 | | 31 |
| | | | |
| Schedule of Investments March 31, 2014 (Unaudited) | | | BlackRock Science & Technology Opportunities Portfolio | |
| | | (Percentages shown are based on Net Assets) | |
| | | | | | | | |
| Common Stocks | | Shares | | | Value | |
Communications Equipment — 1.0% | | | | | | | | |
QUALCOMM, Inc. | | | 29,885 | | | $ | 2,356,731 | |
Diversified Telecommunication Services — 0.5% | | | | | | | | |
8X8, Inc. (a) | | | 107,500 | | | | 1,162,075 | |
Electronic Equipment, Instruments & Components — 1.0% | | | | | |
Fingerprint Cards AB, Class B (a)(b) | | | 70,900 | | | | 592,867 | |
Tong Hsing Electronic Industries Ltd. | | | 172,000 | | | | 891,135 | |
Yaskawa Electric Corp. | | | 57,600 | | | | 795,784 | |
| | | | | | | | |
| | | | | | | | 2,279,786 | |
Internet & Catalog Retail — 9.4% | | | | | | | | |
Amazon.com, Inc. (a) | | | 16,350 | | | | 5,502,102 | |
Expedia, Inc. | | | 22,400 | | | | 1,624,000 | |
Makemytrip Ltd. (a) | | | 65,600 | | | | 1,776,448 | |
Ocado Group PLC (a) | | | 140,500 | | | | 1,079,321 | |
priceline.com, Inc. (a) | | | 4,490 | | | | 5,351,586 | |
Qunar Cayman Islands Ltd. — ADR (a) | | | 36,100 | | | | 1,104,299 | |
Vipshop Holdings Ltd. — ADR (a) | | | 32,700 | | | | 4,882,110 | |
| | | | | | | | |
| | | | | | | | 21,319,866 | |
Internet Software & Services — 28.6% | | | | | | | | |
21Vianet Group, Inc. — ADR (a) | | | 242,890 | | | | 6,970,942 | |
58.com, Inc. — ADR (a) | | | 32,900 | | | | 1,369,627 | |
Baidu, Inc. — ADR (a) | | | 20,400 | | | | 3,108,552 | |
Borderfree, Inc. (a) | | | 8,600 | | | | 160,304 | |
ChannelAdvisor Corp. (a) | | | 43,700 | | | | 1,649,238 | |
Criteo SA — ADR (a) | | | 26,700 | | | | 1,082,685 | |
Cvent, Inc. (a) | | | 34,165 | | | | 1,235,065 | |
DealerTrack Holdings, Inc. (a) | | | 26,600 | | | | 1,308,454 | |
Demandware, Inc. (a) | | | 20,600 | | | | 1,319,636 | |
E2open, Inc. (a) | | | 46,968 | | | | 1,107,036 | |
eBay, Inc. (a) | | | 57,100 | | | | 3,154,204 | |
econtext Asia Ltd. (a) | | | 1,665,000 | | | | 874,624 | |
Facebook, Inc., Class A (a) | | | 93,100 | | | | 5,608,344 | |
Google, Inc., Class A (a) | | | 8,883 | | | | 9,900,192 | |
Kakaku.com, Inc. | | | 137,900 | | | | 2,243,221 | |
LinkedIn Corp., Class A (a) | | | 12,100 | | | | 2,237,774 | |
NAVER Corp. | | | 3,600 | | | | 2,630,415 | |
Rocket Fuel, Inc. (a)(b) | | | 22,600 | | | | 969,088 | |
SPS Commerce, Inc. (a) | | | 26,800 | | | | 1,646,860 | |
Tencent Holdings Ltd. | | | 74,200 | | | | 5,179,174 | |
TrustBuddy International AB | | | 7,806,300 | | | | 3,003,212 | |
Twitter, Inc. (a)(b) | | | 23,100 | | | | 1,078,077 | |
Xoom Corp. (a) | | | 44,100 | | | | 860,832 | |
Yahoo!, Inc. (a) | | | 43,300 | | | | 1,554,470 | |
Yelp, Inc. (a) | | | 14,300 | | | | 1,100,099 | |
YY, Inc. — ADR (a) | | | 48,400 | | | | 3,695,824 | |
| | | | | | | | |
| | | | | | | | 65,047,949 | |
IT Services — 13.0% | | | | | | | | |
Alliance Data Systems Corp. (a) | | | 21,900 | | | | 5,966,655 | |
EPAM Systems, Inc. (a) | | | 33,850 | | | | 1,113,665 | |
Euronet Worldwide, Inc. (a) | | | 90,975 | | | | 3,783,650 | |
Fidelity National Information Services, Inc. | | | 40,238 | | | | 2,150,721 | |
GMO Payment Gateway, Inc. | | | 33,700 | | | | 1,435,871 | |
Jack Henry & Associates, Inc. | | | 40,531 | | | | 2,260,009 | |
Luxoft Holding, Inc. (a) | | | 54,300 | | | | 1,904,301 | |
MasterCard, Inc., Class A | | | 48,100 | | | | 3,593,070 | |
QIWI PLC — ADR | | | 45,000 | | | | 1,559,250 | |
TriNet Group, Inc. (a) | | | 12,086 | | | | 257,553 | |
Visa, Inc., Class A | | | 21,300 | | | | 4,597,818 | |
Wirecard AG | | | 22,200 | | | | 921,787 | |
| | | | | | | | |
| | | | | | | | 29,544,350 | |
| | | | | | | | |
| Common Stocks | | Shares | | | Value | |
Machinery — 0.3% | | | | | | | | |
Arcam AB (a) | | | 22,200 | | | $ | 675,710 | |
Media — 1.0% | | | | | | | | |
Imax Corp. (a) | | | 29,200 | | | | 798,036 | |
Rentrak Corp. (a) | | | 24,500 | | | | 1,476,860 | |
| | | | | | | | |
| | | | | | | | 2,274,896 | |
Oil, Gas & Consumable Fuels — 0.5% | | | | | | | | |
Solazyme, Inc. (a)(b) | | | 104,200 | | | | 1,209,762 | |
Semiconductors & Semiconductor Equipment — 9.7% | | | | | |
Aixtron SE (a) | | | 87,900 | | | | 1,440,330 | |
Applied Materials, Inc. | | | 71,700 | | | | 1,464,114 | |
ASM Pacific Technology Ltd. | | | 201,600 | | | | 1,958,413 | |
Avago Technologies Ltd. | | | 35,999 | | | | 2,318,696 | |
Cavium, Inc. (a) | | | 33,600 | | | | 1,469,328 | |
Epistar Corp. | | | 1,631,000 | | | | 3,928,590 | |
Hermes Microvision, Inc. — GDR (a)(c) | | | 25,206 | | | | 988,453 | |
Intel Corp. | | | 177,000 | | | | 4,568,370 | |
NXP Semiconductor NV (a) | | | 45,765 | | | | 2,691,440 | |
SK Hynix, Inc. (a) | | | 32,300 | | | | 1,095,967 | |
| | | | | | | | |
| | | | | | | | 21,923,701 | |
Software — 19.9% | | | | | | | | |
Adobe Systems, Inc. (a) | | | 44,600 | | | | 2,932,004 | |
Autodesk, Inc. (a) | | | 65,600 | | | | 3,226,208 | |
Concur Technologies, Inc. (a) | | | 21,490 | | | | 2,129,014 | |
Guidewire Software, Inc. (a) | | | 40,430 | | | | 1,983,092 | |
Microsoft Corp. | | | 56,900 | | | | 2,332,331 | |
Monitise PLC (a) | | | 1,208,600 | | | | 1,432,266 | |
NetSuite, Inc. (a) | | | 14,000 | | | | 1,327,620 | |
Proofpoint, Inc. (a) | | | 78,510 | | | | 2,911,151 | |
Red Hat, Inc. (a) | | | 32,300 | | | | 1,711,254 | |
Salesforce.com, Inc. (a) | | | 96,000 | | | | 5,480,640 | |
Seamless Distribution AB (a)(b) | | | 90,244 | | | | 444,681 | |
ServiceNow, Inc. (a) | | | 76,280 | | | | 4,570,698 | |
Tableau Software, Inc., Class A (a) | | | 25,750 | | | | 1,959,060 | |
Totvs SA | | | 124,900 | | | | 1,936,528 | |
UBISOFT Entertainment (a) | | | 71,500 | | | | 1,278,591 | |
Ultimate Software Group, Inc. (a) | | | 6,800 | | | | 931,600 | |
WANdisco PLC (a) | | | 136,513 | | | | 2,366,896 | |
Workday, Inc., Class A (a) | | | 14,800 | | | | 1,353,164 | |
Xero Ltd. (Acquired 10/15/13, cost $2,411,080) (a)(d) | | | 158,560 | | | | 4,873,338 | |
| | | | | | | | |
| | | | | | | | 45,180,136 | |
Technology Hardware, Storage & Peripherals — 5.8% | | | | | |
Apple, Inc. | | | 20,937 | | | | 11,237,725 | |
Nimble Storage, Inc. (a) | | | 19,100 | | | | 723,699 | |
Stratasys Ltd. (a) | | | 10,800 | | | | 1,145,772 | |
| | | | | | | | |
| | | | | | | | 13,107,196 | |
Wireless Telecommunication Services — 1.3% | | | | | | | | |
Aerohive Networks, Inc. (a) | | | 42,000 | | | | 443,100 | |
RingCentral, Inc., Class A (a) | | | 59,400 | | | | 1,075,140 | |
SoftBank Corp. | | | 18,200 | | | | 1,375,342 | |
| | | | | | | | |
| | | | | | | | 2,893,582 | |
Total Common Stocks — 92.0% | | | | | | | 208,975,740 | |
| | | | | | | | |
| | | | | | | |
See Notes to Financial Statements.
| | | | | | |
| 32 | | BLACKROCK FUNDS | | MARCH 31, 2014 | | |
| | | | |
| Schedule of Investments (continued) | | | BlackRock Science & Technology Opportunities Portfolio | |
| |
| (Percentages shown are based on Net Assets)
|
|
| | | | | | | | |
Preferred Stocks | | | Shares | | | | Value | |
Internet Software & Services — 0.9% | | | | | | | | |
Uber Technologies, Inc. (Acquired 3/20/14, cost $2,000,000) (d)(e) | | | 2,000,000 | | | $ | 2,000,000 | |
Software — 2.9% | | | | | | | | |
Hortonworks, Inc., Series D (Acquired 3/21/14, cost $3,100,459) (a)(d) | | | 254,405 | | | | 3,100,459 | |
MongoDB Series C (Acquired 12/19/13, cost | | | | | | | | |
$1,512,772) (a)(d) | | | 60,303 | | | | 1,513,002 | |
MongoDB Series D (Acquired 12/19/13, cost | | | | | | | | |
$470,592) (a)(d) | | | 18,759 | | | | 470,663 | |
MongoDB Series E (Acquired 12/19/13, cost | | | | | | | | |
$16,632) (a)(d) | | | 663 | | | | 16,635 | |
Palantir Technologies, Inc. (Acquired 2/07/14, cost $1,500,011) (d) | | | 244,700 | | | | 1,500,011 | |
| | | | | | | | |
| | | | | | | | 6,600,770 | |
Total Preferred Stocks — 3.8% | | | | | | | 8,600,770 | |
Total Long-Term Investments (Cost — $157,099,711) — 95.8% | | | | | | | 217,576,510 | |
| | | | | | | | |
| | | | | | | |
| | | | | | | | |
| Short-Term Securities | | Shares | | | Value | |
BlackRock Liquidity Funds, TempFund, Institutional Class, 0.03% (f)(g) | | | 9,533,475 | | | $ | 9,533,475 | |
| | | Beneficial
Interest
(000) | | | | |
BlackRock Liquidity Series, LLC, Money Market Series, 0.16% (f)(g)(h) | | $ | 3,760 | | | | 3,760,146 | |
Total Short-Term Securities (Cost — $13,293,621) — 5.8% | | | | 13,293,621 | |
Total Investments (Cost — $170,393,332) — 101.6% | | | | 230,870,131 | |
Liabilities in Excess of Other Assets — (1.6)% | | | | | | | (3,662,535 | ) |
| | | | | | | | |
Net Assets — 100.0% | | | | | | $ | 227,207,596 | |
| | | | | | | | |
|
| Notes to Schedule of Investments |
| (a) | Non-income producing security. |
| (b) | Security, or a portion of security, is on loan. |
| (c) | Security exempt from registration pursuant to Rule 144A under the Securities Act of 1933, as amended. These securities may be resold in transactions exempt from registration to qualified institutional investors. |
| (d) | Restricted security as to resale. As of report date, the Fund held restricted securities with a current value of $13,474,108 and an original cost of $12,511,557, which was 5.9% of its net assets. |
| (f) | Investments in issuers considered to be an affiliate of the Fund during the six months ended March 31, 2014, for purposes of Section 2(a)(3) of the Investment Company Act of 1940, as amended, were as follows: |
| | | | | | | | | | | | | | | | |
| Affiliate | | Shares/Beneficial
Interest Held at
September 30, 2013 | | | Net Activity | | | Shares/Beneficial
Interest Held at
March 31, 2014 | | | Income | |
BlackRock Liquidity Funds, TempFund, Institutional Class | | | 1,949,728 | | | | 7,583,747 | | | | 9,533,475 | | | $ | 1,295 | |
BlackRock Liquidity Series, LLC, Money Market Series | | $ | 13,648,085 | | | $ | (9,887,939 | ) | | $ | 3,760,146 | | | $ | 101,582 | |
| (g) | Represents the current yield as of report date. |
| (h) | Security was purchased with the cash collateral from loaned securities. The Fund may withdraw up to 25% of its investment daily, although the manager of the BlackRock Liquidity Series, LLC, Money Market Series, in its sole discretion, may permit an investor to withdraw more than 25% on any one day. |
| Ÿ | | For Fund compliance purposes, the Fund’s industry classifications refer to any one or more of the industry sub-classifications used by one or more widely recognized market indexes or ratings group indexes, and/or as defined by the investment advisor. These definitions may not apply for purposes of this report, which may combine such industry sub-classifications for reporting ease. |
See Notes to Financial Statements.
| | | | | | |
| | | BLACKROCK FUNDS | | MARCH 31, 2014 | | 33 |
| | | | |
| Schedule of Investments (continued) | | | BlackRock Science & Technology Opportunities Portfolio | |
| Ÿ | | Forward foreign currency exchange contracts outstanding as of March 31, 2014 were as follows: |
| | | | | | | | | | | | | | | | | | | | | | |
Currency
Purchased | | | | | Currency
Sold | | | Counterparty | | Settlement
Date | | | Unrealized
Appreciation
(Depreciation) | |
| SEK | | | 1,267,834 | | | | USD | | | | 196,507 | | | Royal Bank of Scotland PLC | | | 4/22/14 | | | $ | (688 | ) |
| USD | | | 234,953 | | | | EUR | | | | 172,000 | | | Barclays Bank PLC | | | 4/22/14 | | | | (1,992 | ) |
| USD | | | 1,014,828 | | | | EUR | | | | 742,000 | | | BNP Paribas S.A. | | | 4/22/14 | | | | (7,342 | ) |
| USD | | | 416,991 | | | | EUR | | | | 305,000 | | | Citibank N.A. | | | 4/22/14 | | | | (3,173 | ) |
| USD | | | 555,355 | | | | EUR | | | | 409,000 | | | Deutsche Bank AG | | | 4/22/14 | | | | (8,079 | ) |
| USD | | | 133,814 | | | | EUR | | | | 98,000 | | | Goldman Sachs Bank USA | | | 4/22/14 | | | | (1,189 | ) |
| USD | | | 164,282 | | | | EUR | | | | 120,000 | | | Goldman Sachs Bank USA | | | 4/22/14 | | | | (1,029 | ) |
| USD | | | 635,163 | | | | GBP | | | | 389,000 | | | Citibank N.A. | | | 4/22/14 | | | | (13,251 | ) |
| USD | | | 218,422 | | | | GBP | | | | 131,000 | | | Deutsche Bank AG | | | 4/22/14 | | | | 62 | |
| USD | | | 659,753 | | | | GBP | | | | 396,000 | | | Goldman Sachs Bank USA | | | 4/22/14 | | | | (328 | ) |
| USD | | | 972,686 | | | | GBP | | | | 585,000 | | | Goldman Sachs Bank USA | | | 4/22/14 | | | | (2,435 | ) |
| USD | | | 3,146,345 | | | | GBP | | | | 1,915,000 | | | Goldman Sachs Bank USA | | | 4/22/14 | | | | (45,718 | ) |
| USD | | | 383,231 | | | | HKD | | | | 2,974,000 | | | BNP Paribas S.A. | | | 4/22/14 | | | | (219 | ) |
| USD | | | 488,199 | | | | HKD | | | | 3,791,000 | | | BNP Paribas S.A. | | | 4/22/14 | | | | (589 | ) |
| USD | | | 492,581 | | | | HKD | | | | 3,823,000 | | | BNP Paribas S.A. | | | 4/22/14 | | | | (334 | ) |
| USD | | | 1,170,303 | | | | HKD | | | | 9,078,000 | | | Citibank N.A. | | | 4/22/14 | | | | (160 | ) |
| USD | | | 2,836,918 | | | | HKD | | | | 21,997,000 | | | Citibank N.A. | | | 4/22/14 | | | | 757 | |
| USD | | | 126,321 | | | | HKD | | | | 980,000 | | | Royal Bank of Scotland PLC | | | 4/22/14 | | | | (35 | ) |
| USD | | | 465,192 | | | | HKD | | | | 3,609,000 | | | Royal Bank of Scotland PLC | | | 4/22/14 | | | | (131 | ) |
| USD | | | 307,494 | | | | HKD | | | | 2,385,000 | | | Toronto-Dominion Bank | | | 4/22/14 | | | | (14 | ) |
| USD | | | 455,978 | | | | HKD | | | | 3,541,000 | | | Toronto-Dominion Bank | | | 4/22/14 | | | | (577 | ) |
| USD | | | 4,716,095 | | | | NZD | | | | 5,705,000 | | | JPMorgan Chase Bank N.A. | | | 4/22/14 | | | | (226,056 | ) |
| USD | | | 178,868 | | | | SEK | | | | 1,144,000 | | | Bank of America N.A. | | | 4/22/14 | | | | 2,175 | |
| USD | | | 2,853,524 | | | | SEK | | | | 18,472,000 | | | BNP Paribas S.A. | | | 4/22/14 | | | | 497 | |
| USD | | | 69,809 | | | | SEK | | | | 454,000 | | | Goldman Sachs Bank USA | | | 4/22/14 | | | | (311 | ) |
| USD | | | 96,821 | | | | SEK | | | | 631,000 | | | Goldman Sachs Bank USA | | | 4/22/14 | | | | (638 | ) |
| USD | | | 147,347 | | | | SEK | | | | 956,000 | | | Goldman Sachs Bank USA | | | 4/22/14 | | | | (309 | ) |
| USD | | | 159,210 | | | | SEK | | | | 1,017,000 | | | Toronto-Dominion Bank | | | 4/22/14 | | | | 2,133 | |
| USD | | | 789,758 | | | | ZAR | | | | 8,659,000 | | | Goldman Sachs Bank USA | | | 4/22/14 | | | | (29,947 | ) |
| Total | | | | | | | | | | | | | | | | | | | | $ | (338,920 | ) |
| | | | | | | | | | | | | | | | | | | | | | |
| Ÿ | | Fair Value Measurements — Various inputs are used in determining the fair value of investments and derivative financial instruments. These inputs to valuation techniques are categorized into a disclosure hierarchy consisting of three broad levels for financial statement purposes as follows: |
| | Ÿ | | Level 1 – unadjusted price quotations in active markets/exchanges for identical assets or liabilities that the Fund has the ability to access |
| | Ÿ | | Level 2 – other observable inputs (including, but not limited to, quoted prices for similar assets or liabilities in markets that are active, quoted prices for identical or similar assets or liabilities in markets that are not active, inputs other than quoted prices that are observable for the assets or liabilities (such as interest rates, yield curves, volatilities, prepayment speeds, loss severities, credit risks and default rates) or other market–corroborated inputs) |
| | Ÿ | | Level 3 – unobservable inputs based on the best information available in the circumstances, to the extent observable inputs are not available (including the Fund’s own assumptions used in determining the fair value of investments and derivative financial instruments) |
The hierarchy gives the highest priority to unadjusted quoted prices in active markets for identical assets or liabilities (Level 1 measurements) and the lowest priority to unobservable inputs (Level 3 measurements). Accordingly, the degree of judgment exercised in determining fair value is greatest for instruments categorized in Level 3. The inputs used to measure fair value may fall into different levels of the fair value hierarchy. In such cases, for disclosure purposes, the fair value hierarchy classification is determined based on the lowest level input that is significant to the fair value measurement in its entirety.
See Notes to Financial Statements.
| | | | | | |
| 34 | | BLACKROCK FUNDS | | MARCH 31, 2014 | | |
| | | | |
| Schedule of Investments (continued) | | | BlackRock Science & Technology Opportunities Portfolio | |
Changes in valuation techniques may result in transfers into or out of an assigned level within the disclosure hierarchy. In accordance with the Fund’s policy, transfers between different levels of the fair value disclosure hierarchy are deemed to have occurred as of the beginning of the reporting period. The categorization of a value determined for investments and derivative financial instruments is based on the pricing transparency of the investment and derivative financial instrument and is not necessarily an indication of the risks associated with investing in those securities. For information about the Fund’s policy regarding valuation of investments and derivative financial instruments, please refer to Note 2 of the Notes to Financial Statements.
The following tables summarize the Fund’s investments and derivative financial instruments categorized in the disclosure hierarchy as of March 31, 2014:
| | | | | | | | | | | | | | | | |
| | | Level 1 | | | Level 2 | | | Level 3 | | | Total | |
Assets: | | | | | | | | | | | | | | | | |
Investments: | | | | | | | | | | | | | | | | |
Long-Term Investments: | | | | | | | | | | | | | | | | |
Common Stocks: | | | | | | | | | | | | | | | | |
Communications Equipment | | $ | 2,356,731 | | | | — | | | | — | | | $ | 2,356,731 | |
Diversified Telecommunication Services | | | 1,162,075 | | | | — | | | | — | | | | 1,162,075 | |
Electronic Equipment, Instruments & Components | | | — | | | $ | 2,279,786 | | | | — | | | | 2,279,786 | |
Internet & Catalog Retail | | | 20,240,545 | | | | 1,079,321 | | | | — | | | | 21,319,866 | |
Internet Software & Services | | | 56,363,736 | | | | 8,684,213 | | | | — | | | | 65,047,949 | |
IT Services | | | 27,186,692 | | | | 2,357,658 | | | | — | | | | 29,544,350 | |
Machinery | | | 675,710 | | | | — | | | | — | | | | 675,710 | |
Media | | | 2,274,896 | | | | — | | | | — | | | | 2,274,896 | |
Oil, Gas & Consumable Fuels | | | 1,209,762 | | | | — | | | | — | | | | 1,209,762 | |
Semiconductors & Semiconductor Equipment | | | 13,500,401 | | | | 8,423,300 | | | | — | | | | 21,923,701 | |
Software | | | 37,151,260 | | | | 8,028,876 | | | | — | | | | 45,180,136 | |
Technology Hardware, Storage & Peripherals | | | 13,107,196 | | | | — | | | | — | | | | 13,107,196 | |
Wireless Telecommunication Services | | | 1,518,240 | | | | 1,375,342 | | | | — | | | | 2,893,582 | |
Preferred Stocks | | | — | | | | — | | | $ | 8,600,770 | | | | 8,600,770 | |
Short-Term Securities | | | 9,533,475 | | | | 3,760,146 | | | | — | | | | 13,293,621 | |
Total | | $ | 186,280,719 | | | $ | 35,988,642 | | | $ | 8,600,770 | | | $ | 230,870,131 | |
| | | | |
| | | | | | | | | | | | | | | | |
| | | Level 1 | | | Level 2 | | | Level 3 | | | Total | |
Derivative Financial Instruments1 | | | | | | | | | | | | | | | | |
Assets: | | | | | | | | | | | | | | | | |
Foreign currency exchange contracts | | | — | | | $ | 5,624 | | | | — | | | $ | 5,624 | |
Liabilities: | | | | | | | | | | | | | | | | |
Foreign currency exchange contracts | | | — | | | | (344,544 | ) | | | — | | | | (344,544 | ) |
Total | | | — | | | $ | (338,920 | ) | | | — | | | $ | (338,920 | ) |
| | | | |
| 1 Derivative financial instruments are foreign currency exchange contracts, which are valued at the unrealized appreciation/depreciation on the instrument. | | | | | |
| |
| The carrying amount for certain of the Fund’s assets and/or liabilities approximates fair value for financial statement purposes. As of March 31, 2014, such assets and/or liabilities are categorized within the disclosure hierarchy as follows: | | | | | |
| | | | | | | | | | | | | | | | |
| | | Level 1 | | | Level 2 | | | Level 3 | | | Total | |
Assets: | | | | | | | | | | | | | | | | |
Foreign currency at value | | $ | 3,930,868 | | | | — | | | | — | | | $ | 3,930,868 | |
Liabilities: | | | | | | | | | | | | | | | | |
Bank overdraft | | | — | | | $ | (1,127 | ) | | | — | | | | (1,127 | ) |
Collateral on securities loaned at value | | | — | | | | (3,760,146 | ) | | | — | | | | (3,760,146 | ) |
Total | | $ | 3,930,868 | | | $ | (3,761,273 | ) | | | — | | | $ | 169,595 | |
| | | | |
There were no transfers between Level 1 and Level 2 during the six months ended March 31, 2014.
See Notes to Financial Statements.
| | | | | | |
| | | BLACKROCK FUNDS | | MARCH 31, 2014 | | 35 |
| | | | |
| Schedule of Investments (concluded) | | | BlackRock Science & Technology Opportunities Portfolio | |
A reconciliation of Level 3 investments is presented when the Fund had a significant amount of Level 3 investments at the beginning and/or end of the period in relation to net assets. The following table is a reconciliation of Level 3 investments for which significant unobservable inputs were used in determining fair value:
| | | | |
| | | Preferred Stocks | |
Assets: | |
Opening Balance, as of September 30, 2013 | | | — | |
Transfers into Level 3 | | | — | |
Transfers out of Level 3 | | | — | |
Accrued discounts/premiums | | | — | |
Net realized gain (loss) | | | — | |
Net change in unrealized appreciation/depreciation1,2 | | $ | 303 | |
Purchases | | | 8,600,467 | |
Sales | | | — | |
Closing Balance, as of March 31, 2014 | | $ | 8,600,770 | |
| | | | |
Net change in unrealized appreciation/depreciation on investments still held at March 31, 2014 | | $ | 303 | |
| | | | |
| 1 | Included in the related net change in unrealized appreciation/depreciation in the Statements of Operations. |
| 2 | Any difference between Net change in unrealized appreciation/depreciation and Net change in unrealized appreciation/depreciation on investments still held at March 31, 2014 is generally due to investments no longer held or categorized as Level 3 at period end. |
See Notes to Financial Statements.
| | | | | | |
| 36 | | BLACKROCK FUNDS | | MARCH 31, 2014 | | |
| | | | |
| Schedule of Investments March 31, 2014 (Unaudited) | | | BlackRock U.S. Opportunities Portfolio | |
| | | (Percentages shown are based on Net Assets) | |
| | | | | | | | |
| Common Stocks | | Shares | | | Value | |
Aerospace & Defense — 1.8% | | | | | | | | |
B/E Aerospace, Inc. (a) | | | 116,800 | | | $ | 10,137,072 | |
Textron, Inc. | | | 208,700 | | | | 8,199,823 | |
Triumph Group, Inc. | | | 156,524 | | | | 10,108,320 | |
| | | | | | | | |
| | | | | | | | 28,445,215 | |
Airlines — 1.1% | | | | | | | | |
American Airlines Group, Inc. (a) | | | 265,550 | | | | 9,719,130 | |
JetBlue Airways Corp. (a) | | | 901,700 | | | | 7,835,773 | |
| | | | | | | | |
| | | | | | | | 17,554,903 | |
Auto Components — 2.6% | | | | | | | | |
Lear Corp. | | | 133,160 | | | | 11,148,155 | |
TRW Automotive Holdings Corp. (a) | | | 210,900 | | | | 17,213,658 | |
Visteon Corp. (a) | | | 152,700 | | | | 13,504,788 | |
| | | | | | | | |
| | | | | | | | 41,866,601 | |
Automobiles — 0.5% | | | | | | | | |
Tesla Motors, Inc. (a) | | | 41,160 | | | | 8,579,802 | |
Banks — 4.9% | | | | | | | | |
BankUnited, Inc. | | | 736,680 | | | | 25,614,364 | |
Regions Financial Corp. | | | 1,527,880 | | | | 16,974,747 | |
SunTrust Banks, Inc. | | | 349,230 | | | | 13,895,862 | |
Texas Capital Bancshares, Inc. (a) | | | 125,300 | | | | 8,136,982 | |
Western Alliance Bancorp (a) | | | 574,286 | | | | 14,127,436 | |
| | | | | | | | |
| | | | | | | | 78,749,391 | |
Biotechnology — 3.8% | | | | | | | | |
Alexion Pharmaceuticals, Inc. (a) | | | 48,900 | | | | 7,439,157 | |
Alkermes PLC (a) | | | 294,600 | | | | 12,988,914 | |
BioMarin Pharmaceutical, Inc. (a) | | | 212,700 | | | | 14,508,267 | |
Karyopharm Therapeutics, Inc. (a) | | | 105,359 | | | | 3,254,540 | |
Regeneron Pharmaceuticals, Inc. (a) | | | 24,760 | | | | 7,434,933 | |
Seattle Genetics, Inc. (a) | | | 168,168 | | | | 7,661,734 | |
UniQure B.V. (a) | | | 800 | | | | 12,440 | |
Vertex Pharmaceuticals, Inc. (a) | | | 98,000 | | | | 6,930,560 | |
| | | | | | | | |
| | | | | | | | 60,230,545 | |
Building Products — 0.3% | | | | | | | | |
Continental Building Products, Inc. (a) | | | 262,426 | | | | 4,944,106 | |
Capital Markets — 2.3% | | | | | | | | |
Invesco Ltd. | | | 443,070 | | | | 16,393,590 | |
WisdomTree Investments, Inc. (a) | | | 1,591,127 | | | | 20,875,586 | |
| | | | | | | | |
| | | | | | | | 37,269,176 | |
Chemicals — 2.9% | | | | | | | | |
Axiall Corp. | | | 313,047 | | | | 14,062,071 | |
Cytec Industries, Inc. | | | 108,090 | | | | 10,550,665 | |
Eastman Chemical Co. | | | 138,000 | | | | 11,896,980 | |
The Valspar Corp. | | | 128,340 | | | | 9,255,881 | |
| | | | | | | | |
| | | | | | | | 45,765,597 | |
Consumer Finance — 0.3% | | | | | | | | |
Regional Management Corp. (a) | | | 210,900 | | | | 5,200,794 | |
Containers & Packaging — 2.2% | | | | | | | | |
Crown Holdings, Inc. (a) | | | 413,450 | | | | 18,497,753 | |
Owens-Illinois, Inc. (a) | | | 483,470 | | | | 16,355,790 | |
| | | | | | | | |
| | | | | | | | 34,853,543 | |
Electrical Equipment — 2.9% | | | | | | | | |
Acuity Brands, Inc. | | | 191,751 | | | | 25,420,430 | |
Roper Industries, Inc. | | | 154,520 | | | | 20,629,965 | |
| | | | | | | | |
| | | | | | | | 46,050,395 | |
Electronic Equipment, Instruments & Components — 0.5% | | | | | |
Amphenol Corp., Class A | | | 88,680 | | | | 8,127,522 | |
| | | | | | | | |
| Common Stocks | | Shares | | | Value | |
Energy Equipment & Services — 0.8% | | | | | | | | |
Bristow Group, Inc. | | | 109,600 | | | $ | 8,276,992 | |
Geospace Technologies Corp. (a) | | | 56,755 | | | | 3,755,478 | |
| | | | | | | | |
| | | | | | | | 12,032,470 | |
Food & Staples Retailing — 0.5% | | | | | | | | |
Whole Foods Market, Inc. | | | 160,000 | | | | 8,113,600 | |
Food Products — 3.1% | | | | | | | | |
Annie’s, Inc. (a)(b) | | | 174,370 | | | | 7,007,930 | |
The Hain Celestial Group, Inc. (a) | | | 153,701 | | | | 14,059,030 | |
The Hillshire Brands Co. | | | 214,400 | | | | 7,988,544 | |
Hormel Foods Corp. | | | 221,900 | | | | 10,933,013 | |
Keurig Green Mountain, Inc. | | | 83,800 | | | | 8,848,442 | |
| | | | | | | | |
| | | | | | | | 48,836,959 | |
Health Care Equipment & Supplies — 2.2% | | | | | | | | |
CareFusion Corp. (a) | | | 180,210 | | | | 7,248,046 | |
The Cooper Cos., Inc. | | | 62,070 | | | | 8,525,935 | |
Edwards Lifesciences Corp. (a) | | | 120,200 | | | | 8,915,234 | |
Varian Medical Systems, Inc. (a) | | | 125,400 | | | | 10,532,346 | |
| | | | | | | | |
| | | | | | | | 35,221,561 | |
Health Care Providers & Services — 1.7% | | | | | | | | |
HCA Holdings, Inc. (a) | | | 308,360 | | | | 16,188,900 | |
Universal Health Services, Inc., Class B | | | 123,190 | | | | 10,110,203 | |
| | | | | | | | |
| | | | | | | | 26,299,103 | |
Hotels, Restaurants & Leisure — 1.0% | | | | | | | | |
ARAMARK Holdings Corp. | | | 283,900 | | | | 8,210,388 | |
Diamond Resorts International, Inc. (a) | | | 490,600 | | | | 8,315,670 | |
| | | | | | | | |
| | | | | | | | 16,526,058 | |
Household Durables — 3.2% | | | | | | | | |
Installed Building Products, Inc. (a) | | | 349,300 | | | | 4,872,735 | |
Jarden Corp. (a) | | | 359,580 | | | | 21,513,671 | |
The New Home Co., Inc. (a) | | | 237,600 | | | | 3,383,424 | |
PulteGroup, Inc. | | | 603,920 | | | | 11,589,225 | |
Toll Brothers, Inc. (a) | | | 277,955 | | | | 9,978,585 | |
| | | | | | | | |
| | | | | | | | 51,337,640 | |
Household Products — 0.6% | | | | | | | | |
Energizer Holdings, Inc. | | | 102,400 | | | | 10,315,776 | |
Insurance — 2.6% | | | | | | | | |
AON PLC | | | 138,340 | | | | 11,659,295 | |
Genworth Financial, Inc., Class A (a) | | | 977,000 | | | | 17,322,210 | |
Reinsurance Group of America, Inc. | | | 149,820 | | | | 11,930,167 | |
| | | | | | | | |
| | | | | | | | 40,911,672 | |
Internet & Catalog Retail — 1.0% | | | | | | | | |
Groupon, Inc. (a) | | | 663,900 | | | | 5,204,976 | |
Liberty Interactive Corp., Class A (a) | | | 389,400 | | | | 11,241,978 | |
| | | | | | | | |
| | | | | | | | 16,446,954 | |
Internet Software & Services — 1.7% | | | | | | | | |
Borderfree, Inc. (a) | | | 58,800 | | | | 1,096,032 | |
ChannelAdvisor Corp. (a) | | | 259,166 | | | | 9,780,925 | |
Cvent, Inc. (a) | | | 244,700 | | | | 8,845,905 | |
Rocket Fuel, Inc. (a)(b) | | | 154,000 | | | | 6,603,520 | |
| | | | | | | | |
| | | | | | | | 26,326,382 | |
IT Services — 3.0% | | | | | | | | |
Alliance Data Systems Corp. (a) | | | 76,660 | | | | 20,886,017 | |
Euronet Worldwide, Inc. (a) | | | 257,073 | | | | 10,691,666 | |
Fidelity National Information Services, Inc. | | | 278,620 | | | | 14,892,239 | |
See Notes to Financial Statements.
| | | | | | |
| | | BLACKROCK FUNDS | | MARCH 31, 2014 | | 37 |
| | | | |
| Schedule of Investments (continued) | | | BlackRock U.S. Opportunities Portfolio | |
| | | (Percentages shown are based on Net Assets) | |
| | | | | | | | |
| Common Stocks | | Shares | | | Value | |
IT Services (concluded) | | | | | | | | |
TriNet Group, Inc. (a) | | | 83,917 | | | $ | 1,788,271 | |
| | | | | | | | |
| | | | | | | | 48,258,193 | |
Life Sciences Tools & Services — 3.7% | | | | | | | | |
Agilent Technologies, Inc. | | | 200,700 | | | | 11,223,144 | |
Charles River Laboratories International, Inc. (a) | | | 212,800 | | | | 12,840,352 | |
Illumina, Inc. (a)(b) | | | 102,930 | | | | 15,301,574 | |
Thermo Fisher Scientific, Inc. | | | 160,940 | | | | 19,351,426 | |
| | | | | | | | |
| | | | | | | | 58,716,496 | |
Machinery — 4.1% | | | | | | | | |
Actuant Corp., Class A | | | 282,330 | | | | 9,641,569 | |
Crane Co. | | | 182,400 | | | | 12,977,760 | |
Flowserve Corp. | | | 148,200 | | | | 11,609,988 | |
Snap-On, Inc. | | | 150,870 | | | | 17,120,728 | |
Stanley Black & Decker, Inc. | | | 179,300 | | | | 14,566,332 | |
| | | | | | | | |
| | | | | | | | 65,916,377 | |
Marine — 0.4% | | | | | | | | |
Diana Shipping, Inc. (a) | | | 589,300 | | | | 7,065,707 | |
Media — 4.8% | | | | | | | | |
AMC Networks, Inc., Class A (a) | | | 153,400 | | | | 11,212,006 | |
The E.W. Scripps Co., Class A (a) | | | 194,200 | | | | 3,441,224 | |
The Interpublic Group of Cos., Inc. | | | 872,390 | | | | 14,952,765 | |
Liberty Global PLC, Series A (a) | | | 168,870 | | | | 7,024,992 | |
Liberty Global PLC, Series C (a) | | | 168,870 | | | | 6,874,698 | |
LIN Media LLC, Class A (a) | | | 147,100 | | | | 3,898,150 | |
The Madison Square Garden Co., Class A (a) | | | 169,500 | | | | 9,624,210 | |
Nexstar Broadcasting Group, Inc., Class A | | | 74,800 | | | | 2,806,496 | |
Sirius XM Holdings, Inc. (a) | | | 3,946,600 | | | | 12,629,120 | |
Tribune Co. (a) | | | 51,000 | | | | 4,062,150 | |
| | | | | | | | |
| | | | | | | | 76,525,811 | |
Metals & Mining — 1.6% | | | | | | | | |
Constellium NV (a) | | | 432,900 | | | | 12,705,615 | |
US Silica Holdings, Inc. | | | 340,100 | | | | 12,981,617 | |
| | | | | | | | |
| | | | | | | | 25,687,232 | |
Multiline Retail — 0.6% | | | | | | | | |
Nordstrom, Inc. | | | 140,000 | | | | 8,743,000 | |
Oil, Gas & Consumable Fuels — 5.4% | | | | | | | | |
Cabot Oil & Gas Corp. | | | 522,284 | | | | 17,694,982 | |
Concho Resources, Inc. (a) | | | 157,180 | | | | 19,254,550 | |
Diamondback Energy, Inc. (a) | | | 122,400 | | | | 8,238,744 | |
Gaslog Ltd. (a) | | | 428,700 | | | | 9,984,423 | |
Kosmos Energy Ltd. (a) | | | 692,110 | | | | 7,613,210 | |
Navigator Holdings Ltd. (a) | | | 274,500 | | | | 7,137,000 | |
Oasis Petroleum, Inc. (a) | | | 273,560 | | | | 11,415,659 | |
Solazyme, Inc. (a)(b) | | | 414,930 | | | | 4,817,337 | |
| | | | | | | | |
| | | | | | | | 86,155,905 | |
Pharmaceuticals — 2.7% | | | | | | | | |
Mallinckrodt PLC (a) | | | 173,400 | | | | 10,995,294 | |
Mylan, Inc. (a) | | | 345,800 | | | | 16,885,414 | |
Perrigo Co. PLC | | | 95,100 | | | | 14,708,166 | |
| | | | | | | | |
| | | | | | | | 42,588,874 | |
Professional Services — 1.0% | | | | | | | | |
Equifax, Inc. | | | 224,060 | | | | 15,242,802 | |
Real Estate Investment Trusts (REITs) — 4.1% | | | | | | | | |
Hospitality Properties Trust | | | 466,340 | | | | 13,393,285 | |
Host Hotels & Resorts, Inc. | | | 780,400 | | | | 15,795,296 | |
Liberty Property Trust | | | 200,849 | | | | 7,423,379 | |
RLJ Lodging Trust | | | 568,450 | | | | 15,200,353 | |
Weyerhaeuser Co. | | | 440,513 | | | | 12,929,057 | |
| | | | | | | | |
| | | | | | | | 64,741,370 | |
| | | | | | | | |
| Common Stocks | | Shares | | | Value | |
Real Estate Management & Development — 1.8% | | | | | |
Kennedy-Wilson Holdings, Inc. | | | 1,257,400 | | | $ | 28,304,074 | |
Road & Rail — 1.1% | | | | | | | | |
Hertz Global Holdings, Inc. (a) | | | 629,046 | | | | 16,757,785 | |
Semiconductors & Semiconductor Equipment — 4.2% | | | | | |
Advanced Energy Industries, Inc. (a) | | | 280,244 | | | | 6,865,978 | |
Applied Materials, Inc. | | | 436,000 | | | | 8,903,120 | |
Avago Technologies Ltd. | | | 197,318 | | | | 12,709,252 | |
Canadian Solar, Inc. (a) | | | 129,600 | | | | 4,152,384 | |
NXP Semiconductor NV (a) | | | 220,190 | | | | 12,949,374 | |
SunPower Corp. (a)(b) | | | 179,640 | | | | 5,795,186 | |
Veeco Instruments, Inc. (a) | | | 359,900 | | | | 15,090,607 | |
| | | | | | | | |
| | | | | | | | 66,465,901 | |
Software — 2.2% | | | | | | | | |
Autodesk, Inc. (a) | | | 227,200 | | | | 11,173,696 | |
ServiceNow, Inc. (a) | | | 215,100 | | | | 12,888,792 | |
Tableau Software, Inc., Class A (a) | | | 109,800 | | | | 8,353,584 | |
Varonis Systems, Inc. (a) | | | 72,800 | | | | 2,603,328 | |
| | | | | | | | |
| | | | | | | | 35,019,400 | |
Specialty Retail — 2.7% | | | | | | | | |
Abercrombie & Fitch Co., Class A | | | 200,850 | | | | 7,732,725 | |
Dick’s Sporting Goods, Inc. | | | 137,600 | | | | 7,514,336 | |
Genesco, Inc. (a) | | | 145,190 | | | | 10,826,818 | |
GNC Holdings, Inc., Class A | | | 210,500 | | | | 9,266,210 | |
L Brands, Inc. | | | 134,800 | | | | 7,652,596 | |
| | | | | | | | |
| | | | | | | | 42,992,685 | |
Textiles, Apparel & Luxury Goods — 3.3% | | | | | | | | |
Kate Spade & Co. (a) | | | 276,000 | | | | 10,236,840 | |
PVH Corp. | | | 107,130 | | | | 13,366,610 | |
Ralph Lauren Corp. | | | 58,600 | | | | 9,430,498 | |
Sequential Brands Group, Inc. (a)(c) | | | 2,500,000 | | | | 20,000,000 | |
| | | | | | | | |
| | | | | | | | 53,033,948 | |
Thrifts & Mortgage Finance — 0.5% | | | | | | | | |
Strategic Growth Bancorp (Acquired 3/10/14,
cost $7,599,729) (a)(d) | | | 610,420 | | | | 7,599,729 | |
Trading Companies & Distributors — 1.1% | | | | | | | | |
United Rentals, Inc. (a) | | | 191,567 | | | | 18,187,371 | |
Wireless Telecommunication Services — 2.0% | | | | | | | | |
Aerohive Networks, Inc. (a) | | | 291,400 | | | | 3,074,270 | |
SBA Communications Corp., Class A (a) | | | 250,330 | | | | 22,770,017 | |
T-Mobile U.S., Inc. | | | 164,900 | | | | 5,446,647 | |
| | | | | | | | |
| | | | | | | | 31,290,934 | |
Total Common Stocks — 94.8% | | | | | | | 1,509,299,359 | |
| | | | | | | | |
| | | | | | | |
See Notes to Financial Statements.
| | | | | | |
| 38 | | BLACKROCK FUNDS | | MARCH 31, 2014 | | |
| | | | |
| Schedule of Investments (continued) | | | BlackRock U.S. Opportunities Portfolio | |
| | | | |
| | | | | | | | |
Preferred Stocks | | | Shares | | | | Value | |
Internet Software & Services — 0.3% | | | | | | | | |
Uber Technologies, Inc. (Acquired 3/20/14, cost $5,218,000) (d)(e) | | | 5,218,000 | | | $ | 5,218,000 | |
Software — 1.8% | | | | | | | | |
Hortonworks, Inc., Series D (Acquired 3/21/14,cost $14,233,594) (a)(d) | | | 1,167,923 | | | | 14,233,594 | |
MongoDB Series C (Acquired 12/19/13, cost $7,974,602) (a)(d) | | | 317,888 | | | | 7,975,810 | |
MongoDB Series D (Acquired 12/19/13, cost $2,480,799) (a)(d) | | | 98,891 | | | | 2,481,175 | |
MongoDB Series E (Acquired 12/19/13, cost $87,676) (a)(d) | | | 3,495 | | | | 87,690 | |
Palantir Technologies, Inc. (Acquired 2/07/14,cost $4,300,011) (d) | | | 701,470 | | | | 4,300,011 | |
| | | | | | | | |
| | | | | | | | 29,078,280 | |
Total Preferred Stocks — 2.1% | | | | | | | 34,296,280 | |
Total Long-Term Investments (Cost — $1,150,979,992) — 96.9% | | | | 1,543,595,639 | |
| | | | | | | | |
| | | | | | | |
| | | | | | | | |
| Short-Term Securities | | Shares | | | Value | |
BlackRock Liquidity Funds, TempFund, Institutional Class, 0.03% (f)(g) | | | 51,289,172 | | | $ | 51,289,172 | |
| Short-Term Securities | | Beneficial
Interest
(000) | | | | |
BlackRock Liquidity Series, LLC, Money Market Series, 0.16% (f)(g)(h) | | $ | 27,405 | | | | 27,404,520 | |
Total Short-Term Securities (Cost — $78,693,692) — 5.0% | | | | | | | 78,693,692 | |
Total Investments (Cost — $1,229,673,684) — 101.9% | | | | 1,622,289,331 | |
Liabilities in Excess of Other Assets — (1.9)% | | | | (29,550,252 | ) |
| | | | | | | | |
Net Assets — 100.0% | | | | | | $ | 1,592,739,079 | |
| | | | | | | | |
|
| Notes to Schedule of Investments |
| (a) | Non-income producing security. |
| (b) | Security, or a portion of security, is on loan. |
| (c) | Investments in issuers (whereby the Fund held 5% or more of the companies’ outstanding securities) that were considered to be an affiliate during the six months ended March 31, 2014, for purposes of Section 2(a)(3) of the Investment Company Act of 1940, as amended, were as follows: |
| | | | | | | | | | | | | | | | |
| Affiliate | | Shares Held at
September 30, 2013 | | | Shares
Purchased | | | Shares Held at
March 31, 2014 | | | Value at
March 31,
2014 | |
Sequential Brands Group, Inc. | | | 2,500,000 | | | | — | | | | 2,500,000 | | | $ | 20,000,000 | |
| (d) | Restricted security as to resale. As of report date, the Fund held restricted securities with a current value of $41,896,009 and an original cost of $41,894,411, which was 3.9% of its net assets. |
| (f) | Investments in issuers considered to be an affiliate of the Fund during the six months ended March 31, 2014, for purposes of Section 2(a)(3) of the Investment Company Act of 1940, as amended, were as follows: |
| | | | | | | | | | | | | | | | |
| Affiliate | | Shares/ Beneficial
Interest Held at
September 30, 2013 | | | Net Activity | | | Shares/Beneficial
Interest Held at
March 31, 2014 | | | Income | |
BlackRock Liquidity Funds, TempFund, Institutional Class | | | 47,610,474 | | | | 3,678,698 | | | | 51,289,172 | | | $ | 3,450 | |
BlackRock Liquidity Series, LLC, Money Market Series | | $ | 185,313,336 | | | $ | (160,608,816 | ) | | $ | 24,704,520 | | | $ | 438,749 | |
| (g) | Represents the current yield as of report date. |
| (h) | Security was purchased with the cash collateral from loaned securities. The Fund may withdraw up to 25% of its investment daily, although the manager of the BlackRock Liquidity Series, LLC, Money Market Series, in its sole discretion, may permit an investor to withdraw more than 25% on any one day. |
| Ÿ | | For Fund compliance purposes, the Fund’s industry classifications refer to any one or more of the industry sub-classifications used by one or more widely recognized market indexes or ratings group indexes, and/or as defined by the investment advisor. These definitions may not apply for purposes of this report, which may combine such industry sub-classifications for reporting ease. |
| Ÿ | | Fair Value Measurements — Various inputs are used in determining the fair value of investments. These inputs to valuation techniques are categorized into a disclosure hierarchy consisting of three broad levels for financial statement purposes as follows: |
| | Ÿ | | Level 1 — unadjusted price quotations in active markets/exchanges for identical assets or liabilities that the Fund has the ability to access |
| | Ÿ | | Level 2 — other observable inputs (including, but not limited to, quoted prices for similar assets or liabilities in markets that are active, quoted prices for identical or similar assets or liabilities in markets that are not active, inputs other than quoted prices that are observable for the assets or liabilities (such as interest rates, yield curves, volatilities, prepayment speeds, loss severities, credit risks and default rates) or other market–corroborated inputs) |
See Notes to Financial Statements.
| | | | | | |
| | | BLACKROCK FUNDS | | MARCH 31, 2014 | | 39 |
| | |
| Schedule of Investments (continued) | | BlackRock U.S. Opportunities Portfolio |
| | Ÿ | | Level 3 — unobservable inputs based on the best information available in the circumstances, to the extent observable inputs are not available (including the Fund’s own assumptions used in determining the fair value of investments) |
The hierarchy gives the highest priority to unadjusted quoted prices in active markets for identical assets or liabilities (Level 1 measurements) and the lowest priority to unobservable inputs (Level 3 measurements). Accordingly, the degree of judgment exercised in determining fair value is greatest for instruments categorized in Level 3. The inputs used to measure fair value may fall into different levels of the fair value hierarchy. In such cases, for disclosure purposes, the fair value hierarchy classification is determined based on the lowest level input that is significant to the fair value measurement in its entirety.
Changes in valuation techniques may result in transfers into or out of an assigned level within the disclosure hierarchy. In accordance with the Fund’s policy, transfers between different levels of the fair value disclosure hierarchy are deemed to have occurred as of the beginning of the reporting period. The categorization of a value determined for investments is based on the pricing transparency of the investment and is not necessarily an indication of the risks associated with investing in those securities. For information about the Fund’s policy regarding valuation of investments, please refer to Note 2 of the Notes to Financial Statements.
The following table summarizes the Fund’s investments categorized in the disclosure hierarchy as of March 31, 2014:
| | | | | | | | | | | | | | | | |
| | | Level 1 | | | Level 2 | | | Level 3 | | | Total | |
Assets: | | | | | | | | | | | | | | | | |
Investments: | | | | | | | | | | | | | | | | |
Long-Term Investments: | | | | | | | | | | | | | | | | |
Common Stocks: | | | | | | | | | | | | | | | | |
Aerospace & Defense | | $ | 28,445,215 | | | | — | | | | — | | | $ | 28,445,215 | |
Airlines | | | 17,554,903 | | | | — | | | | — | | | | 17,554,903 | |
Auto Components | | | 41,866,601 | | | | — | | | | — | | | | 41,866,601 | |
Automobiles | | | 8,579,802 | | | | — | | | | — | | | | 8,579,802 | |
Banks | | | 78,749,391 | | | | — | | | | — | | | | 78,749,391 | |
Biotechnology | | | 60,230,545 | | | | — | | | | — | | | | 60,230,545 | |
Building Products | | | 4,944,106 | | | | — | | | | — | | | | 4,944,106 | |
Capital Markets | | | 37,269,176 | | | | — | | | | — | | | | 37,269,176 | |
Chemicals | | | 45,765,597 | | | | — | | | | — | | | | 45,765,597 | |
Consumer Finance | | | 5,200,794 | | | | — | | | | — | | | | 5,200,794 | |
Containers & Packaging | | | 34,853,543 | | | | — | | | | — | | | | 34,853,543 | |
Electrical Equipment | | | 46,050,395 | | | | — | | | | — | | | | 46,050,395 | |
Electronic Equipment, Instruments & Components | | | 8,127,522 | | | | — | | | | — | | | | 8,127,522 | |
Energy Equipment & Services | | | 12,032,470 | | | | — | | | | — | | | | 12,032,470 | |
Food & Staples Retailing | | | 8,113,600 | | | | — | | | | — | | | | 8,113,600 | |
Food Products | | | 48,836,959 | | | | — | | | | — | | | | 48,836,959 | |
Health Care Equipment & Supplies | | | 35,221,561 | | | | — | | | | — | | | | 35,221,561 | |
Health Care Providers & Services | | | 26,299,103 | | | | — | | | | — | | | | 26,299,103 | |
Hotels, Restaurants & Leisure | | | 16,526,058 | | | | — | | | | — | | | | 16,526,058 | |
Household Durables | | | 51,337,640 | | | | — | | | | — | | | | 51,337,640 | |
Household Products | | | 10,315,776 | | | | — | | | | — | | | | 10,315,776 | |
Insurance | | | 40,911,672 | | | | — | | | | — | | | | 40,911,672 | |
Internet & Catalog Retail | | | 16,446,954 | | | | — | | | | — | | | | 16,446,954 | |
Internet Software & Services | | | 26,326,382 | | | | — | | | | — | | | | 26,326,382 | |
IT Services | | | 48,258,193 | | | | — | | | | — | | | | 48,258,193 | |
Life Sciences Tools & Services | | | 58,716,496 | | | | — | | | | — | | | | 58,716,496 | |
Machinery | | | 65,916,377 | | | | — | | | | — | | | | 65,916,377 | |
Marine | | | 7,065,707 | | | | — | | | | — | | | | 7,065,707 | |
Media | | | 76,525,811 | | | | — | | | | — | | | | 76,525,811 | |
Metals & Mining | | | 25,687,232 | | | | — | | | | — | | | | 25,687,232 | |
Multiline Retail | | | 8,743,000 | | | | — | | | | — | | | | 8,743,000 | |
Oil, Gas & Consumable Fuels | | | 86,155,905 | | | | — | | | | — | | | | 86,155,905 | |
Pharmaceuticals | | | 42,588,874 | | | | — | | | | — | | | | 42,588,874 | |
Professional Services | | | 15,242,802 | | | | — | | | | — | | | | 15,242,802 | |
Real Estate Investment Trusts (REITs) | | | 64,741,370 | | | | — | | | | — | | | | 64,741,370 | |
Real Estate Management & Development | | | 28,304,074 | | | | — | | | | — | | | | 28,304,074 | |
Road & Rail | | | 16,757,785 | | | | — | | | | — | | | | 16,757,785 | |
Semiconductors & Semiconductor Equipment | | | 66,465,901 | | | | — | | | | — | | | | 66,465,901 | |
See Notes to Financial Statements.
| | | | | | |
| 40 | | BLACKROCK FUNDS | | MARCH 31, 2014 | | |
| | |
| Schedule of Investments (concluded) | | BlackRock U.S. Opportunities Portfolio |
| | | | | | | | | | | | | | | | |
| | | Level 1 | | | Level 2 | | | Level 3 | | | Total | |
Software | | $ | 35,019,400 | | | | — | | | | — | | | $ | 35,019,400 | |
Specialty Retail | | | 42,992,685 | | | | — | | | | — | | | | 42,992,685 | |
Textiles, Apparel & Luxury Goods | | | 53,033,948 | | | | — | | | | — | | | | 53,033,948 | |
Thrifts & Mortgage Finance | | | — | | | | — | | | $ | 7,599,729 | | | | 7,599,729 | |
Trading Companies & Distributors | | | 18,187,371 | | | | — | | | | — | | | | 18,187,371 | |
Wireless Telecommunication Services | | | 31,290,934 | | | | — | | | | — | | | | 31,290,934 | |
Preferred Stocks | | | — | | | | — | | | | 34,296,280 | | | | 34,296,280 | |
Short-Term Securities | | | 51,289,172 | | | $ | 27,404,520 | | | | — | | | | 78,693,692 | |
Total | | $ | 1,552,988,802 | | | $ | 27,404,520 | | | $ | 41,896,009 | | | $ | 1,622,289,331 | |
| | | | |
| The carrying amount for certain of the Fund’s assets and/or liabilities approximates fair value for financial statement purposes. As of March 31, 2014, such assets and/or liabilities are categorized within the disclosure hierarchy as follows: | | | | | |
| | | | | | | | | | | | | | | | |
| | | Level 1 | | | Level 2 | | | Level 3 | | | Total | |
Assets: | | | | | | | | | | | | | | | | |
Cash | | $ | 63,853 | | | | — | | | | — | | | $ | 63,853 | |
Liabilities: | | | | | | | | | | | | | | | | |
Collateral on securities loaned at value | | | — | | | $ | (27,404,520 | ) | | | — | | | | (27,404,520 | ) |
Total | | $ | 63,853 | | | $ | (27,404,520 | ) | | | — | | | $ | (27,340,667 | ) |
| | | | |
There were no transfers between Level 1 and Level 2 during the six months ended March 31, 2014.
A reconciliation of Level 3 investments is presented when the Fund had a significant amount of Level 3 investments at the beginning and/or end of the period in relation to net assets. The following table is a reconciliation of Level 3 investments for which significant unobservable inputs were used in determining fair value:
| | | | | | | | | | | | |
| | | Common Stocks | | | Preferred Stocks | | | Total | |
Assets: | | | | | | | | | | | | |
Opening Balance, as of September 30, 2013 | | $ | 13,062,500 | | | | — | | | $ | 13,062,500 | |
Transfers into Level 3 | | | — | | | | — | | | | — | |
Transfers out of Level 3 | | | (13,062,500 | ) | | | — | | | | (13,062,500 | ) |
Accrued discounts/premiums | | | — | | | | — | | | | — | |
Net realized gain (loss) | | | — | | | | — | | | | — | |
Net change in unrealized appreciation/depreciation1,2 | | | — | | | $ | 1,601 | | | | 1,601 | |
Purchases | | | 7,599,729 | | | | 34,294,679 | | | | 41,894,408 | |
Sales | | | — | | | | — | | | | — | |
Closing Balance, as of March 31, 2014 | | $ | 7,599,729 | | | $ | 34,296,280 | | | $ | 41,896,009 | |
| | | | |
Net change in unrealized appreciation/depreciation on investments still held at March 31, 20142 | | | — | | | $ | 1,601 | | | $ | 1,601 | |
| | | | |
| 1 | Included in the related net change in unrealized appreciation/depreciation in the Statements of Operations. |
| 2 | Any difference between Net change in unrealized appreciation/depreciation and Net change in unrealized appreciation/depreciation on investments still held at March 31, 2014 is generally due to investments no longer held or categorized as Level 3 at period end. |
See Notes to Financial Statements.
| | | | | | |
| | | BLACKROCK FUNDS | | MARCH 31, 2014 | | 41 |
| | |
| Statements of Assets and Liabilities | | |
| | | | | | | | | | | | | | | | | | | | |
| March 31, 2014 (Unaudited) | | BlackRock
Global
Opportunities
Portfolio | | | BlackRock
Health
Sciences
Opportunities
Portfolio | | | BlackRock
International
Opportunities
Portfolio | | | BlackRock
Science
& Technology
Opportunities
Portfolio | | | BlackRock
U.S.
Opportunities
Portfolio | |
| | | | | | | | | | | | | | | | | | | | |
| Assets | | | | | | | | | | | | | | | | | | | | |
Investments at value — unaffiliated1,2 | | $ | 350,871,951 | | | $ | 3,626,668,688 | | | $ | 1,883,667,991 | | | $ | 217,576,510 | | | $ | 1,543,595,639 | |
Investments at value — affiliated3 | | | 9,092,344 | | | | 165,620,610 | | | | 62,216,680 | | | | 13,293,621 | | | | 78,693,692 | |
Cash | | | — | | | | — | | | | — | | | | — | | | | 63,853 | |
Cash pledged as collateral for options written | | | — | | | | 22,627,237 | | | | — | | | | — | | | | — | |
Foreign currency at value4 | | | 154,419 | | | | 5,058,309 | | | | 40,967,721 | | | | 3,930,868 | | | | — | |
Investments sold receivable | | | 5,070,489 | | | | 30,371,551 | | | | 69,152,831 | | | | 9,451,817 | | | | 15,273,472 | |
Unrealized appreciation on forward foreign currency exchange contracts | | | 484,367 | | | | 28,300 | | | | 3,039,176 | | | | 5,624 | | | | — | |
Capital shares sold receivable | | | 102,405 | | | | 7,790,558 | | | | 2,329,720 | | | | 365,801 | | | | 945,089 | |
Dividends receivable — unaffiliated | | | 632,556 | | | | 4,179,949 | | | | 5,720,559 | | | | 33,643 | | | | 839,108 | |
Dividends receivable — affiliated | | | 79 | | | | 2,272 | | | | 215 | | | | 275 | | | | 743 | |
Receivable from Manager | | | 26,058 | | | | — | | | | 150 | | | | — | | | | 81,876 | |
Securities lending income receivable — affiliated | | | 19,764 | | | | 16,560 | | | | 144,297 | | | | 26,701 | | | | 103,680 | |
Prepaid expenses | | | 44,902 | | | | 129,878 | | | | 81,954 | | | | 56,414 | | | | 72,890 | |
| | | | |
Total assets | | | 366,499,334 | | | | 3,862,493,912 | | | | 2,067,321,294 | | | | 244,741,274 | | | | 1,639,670,042 | |
| | | | |
| | | | | | | | | | | | | | | | | | | | |
| Liabilities | | | | | | | | | | | | | | | | | | | | |
Bank overdraft | | | 1,261 | | | | 22,920 | | | | 2,378 | | | | 1,127 | | | | — | |
Collateral on securities loaned at value | | | 7,540,083 | | | | 57,299,570 | | | | 56,773,283 | | | | 3,760,146 | | | | 27,404,520 | |
Investments purchased payable | | | 4,027,924 | | | | 70,912,459 | | | | 120,519,958 | | | | 12,317,705 | | | | 12,566,441 | |
Unrealized depreciation on forward foreign currency exchange contracts | | | 1,454,522 | | | | 4,530,290 | | | | 10,945,081 | | | | 344,544 | | | | — | |
Capital shares redeemed payable | | | 567,295 | | | | 9,510,182 | | | | 10,860,392 | | | | 653,029 | | | | 3,994,827 | |
Investment advisory fees payable | | | 272,630 | | | | 2,237,657 | | | | 1,559,122 | | | | 198,022 | | | | 1,203,947 | |
Service and distribution fees payable | | | 105,198 | | | | 1,094,470 | | | | 314,634 | | | | 64,323 | | | | 342,830 | |
Other affiliates payable | | | 21,957 | | | | 238,385 | | | | 196,651 | | | | 18,367 | | | | 181,292 | |
Officer’s and Trustees’ fees payable | | | 2,670 | | | | 15,732 | | | | 11,781 | | | | 1,348 | | | | 12,603 | |
Other accrued expenses payable | | | 233,425 | | | | 979,461 | | | | 860,965 | | | | 175,067 | | | | 1,224,503 | |
| | | | |
Total liabilities | | | 14,226,965 | | | | 146,841,126 | | | | 202,044,245 | | | | 17,533,678 | | | | 46,930,963 | |
| | | | |
Net Assets | | $ | 352,272,369 | | | $ | 3,715,652,786 | | | $ | 1,865,277,049 | | | $ | 227,207,596 | | | $ | 1,592,739,079 | |
| | | | |
| | | | | | | | | | | | | | | | | | | | |
| Net Assets Consist of | | | | | | | | | | | | | | | | | | | | |
Paid-in capital | | $ | 394,981,148 | | | $ | 2,565,035,738 | | | $ | 1,467,238,541 | | | $ | 199,079,666 | | | $ | 1,027,504,083 | |
Undistributed (accumulated) net investment income (loss) | | | 2,263,033 | | | | 8,412,395 | | | | 28,599,142 | | | | (2,393,919 | ) | | | (4,565,543 | ) |
Accumulated net realized gain (loss) | | | (104,080,125 | ) | | | 153,077,518 | | | | 86,619,031 | | | | (29,648,215 | ) | | | 177,184,892 | |
Net unrealized appreciation/depreciation | | | 59,108,313 | | | | 989,127,135 | | | | 282,820,335 | | | | 60,170,064 | | | | 392,615,647 | |
| | | | |
Net Assets | | $ | 352,272,369 | | | $ | 3,715,652,786 | | | $ | 1,865,277,049 | | | $ | 227,207,596 | | | $ | 1,592,739,079 | |
| | | | |
1 Investments at cost — unaffiliated | | $ | 290,802,132 | | | $ | 2,633,127,764 | | | $ | 1,592,965,858 | | | $ | 157,099,711 | | | $ | 1,150,979,992 | |
2 Securities loaned at value | | $ | 7,125,179 | | | $ | 57,419,168 | | | $ | 53,293,449 | | | $ | 3,668,024 | | | $ | 27,482,834 | |
3 Investments at cost — affiliated | | $ | 9,092,344 | | | $ | 165,620,610 | | | $ | 62,216,680 | | | $ | 13,293,621 | | | $ | 78,693,692 | |
4 Foreign currency at cost | | $ | 153,416 | | | $ | 5,046,592 | | | $ | 40,808,317 | | | $ | 3,909,921 | | | | — | |
See Notes to Financial Statements.
| | | | | | |
| 42 | | BLACKROCK FUNDS | | MARCH 31, 2014 | | |
| | |
| Statements of Assets and Liabilities (concluded) | | |
| | | | | | | | | | | | | | | | | | | | |
| March 31, 2014 (Unaudited) | | BlackRock
Global
Opportunities
Portfolio | | | BlackRock
Health
Sciences
Opportunities
Portfolio | | | BlackRock
International
Opportunities
Portfolio | | | BlackRock
Science
& Technology
Opportunities
Portfolio | | | BlackRock U.S. Opportunities
Portfolio | |
| | | | | | | | | | | | | | | | | | | | |
| Net Asset Value | | | | | | | | | | | | | | | | | | | | |
Institutional | | | | | | | | | | | | | | | | | | | | |
Net assets | | $ | 63,853,324 | | | $ | 930,562,271 | | | $ | 856,622,574 | | | $ | 48,929,788 | | | $ | 698,941,802 | |
| | | | |
Shares outstanding1 | | | 4,371,791 | | | | 20,791,748 | | | | 20,746,410 | | | | 3,424,635 | | | | 16,784,990 | |
| | | | |
Net asset value | | $ | 14.61 | | | $ | 44.76 | | | $ | 41.29 | | | $ | 14.29 | | | $ | 41.64 | |
| | | | |
| | | | | | | | | | | | | | | | | | | | |
Service | | | | | | | | | | | | | | | | | | | | |
Net assets | | | — | | | $ | 28,171,587 | | | $ | 40,880,406 | | | $ | 1,950,951 | | | $ | 153,288,223 | |
| | | | |
Shares outstanding1 | | | — | | | | 648,643 | | | | 1,028,676 | | | | 142,102 | | | | 3,891,679 | |
| | | | |
Net asset value | | | — | | | $ | 43.43 | | | $ | 39.74 | | | $ | 13.73 | | | $ | 39.39 | |
| | | | |
| | | | | | | | | | | | | | | | | | | | |
Investor A | | | | | | | | | | | | | | | | | | | | |
Net assets | | $ | 212,298,995 | | | $ | 1,944,408,162 | | | $ | 810,069,215 | | | $ | 134,022,787 | | | $ | 509,928,398 | |
| | | | |
Shares outstanding1 | | | 14,673,558 | | | | 44,893,844 | | | | 20,586,128 | | | | 9,930,296 | | | | 13,123,181 | |
| | | | |
Net asset value | | $ | 14.47 | | | $ | 43.31 | | | $ | 39.35 | | | $ | 13.50 | | | $ | 38.86 | |
| | | | |
| | | | | | | | | | | | | | | | | | | | |
Investor B | | | | | | | | | | | | | | | | | | | | |
Net assets | | $ | 3,850,608 | | | $ | 31,320,491 | | | $ | 4,160,958 | | | $ | 2,297,473 | | | $ | 12,673,126 | |
| | | | |
Shares outstanding1 | | | 273,878 | | | | 777,348 | | | | 113,920 | | | | 190,500 | | | | 377,703 | |
| | | | |
Net asset value | | $ | 14.06 | | | $ | 40.29 | | | $ | 36.53 | | | $ | 12.06 | | | $ | 33.55 | |
| | | | |
| | | | | | | | | | | | | | | | | | | | |
Investor C | | | | | | | | | | | | | | | | | | | | |
Net assets | | $ | 58,035,730 | | | $ | 725,620,904 | | | $ | 153,543,896 | | | $ | 35,285,598 | | | $ | 217,907,530 | |
| | | | |
Shares outstanding1 | | | 4,143,959 | | | | 18,207,791 | | | | 4,244,304 | | | | 2,933,954 | | | | 6,484,770 | |
| | | | |
Net asset value | | $ | 14.00 | | | $ | 39.85 | | | $ | 36.18 | | | $ | 12.03 | | | $ | 33.60 | |
| | | | |
| | | | | | | | | | | | | | | | | | | | |
Class R | | | | | | | | | | | | | | | | | | | | |
Net assets | | $ | 14,233,712 | | | $ | 55,569,371 | | | | — | | | $ | 4,720,999 | | | | — | |
| | | | |
Shares outstanding1 | | | 988,907 | | | | 1,293,062 | | | | — | | | | 342,810 | | | | — | |
| | | | |
Net asset value | | $ | 14.39 | | | $ | 42.98 | | | | — | | | $ | 13.77 | | | | — | |
| | | | |
| | 1 | Unlimited shares authorized, $0.001 par value. |
See Notes to Financial Statements.
| | | | | | |
| | | BLACKROCK FUNDS | | MARCH 31, 2014 | | 43 |
| | | | | | | | | | | | | | | | | | | | |
| Six Months Ended March 31, 2014 (Unaudited) | | BlackRock
Global
Opportunities
Portfolio | | | BlackRock
Health
Sciences
Opportunities
Portfolio | | | BlackRock
International
Opportunities
Portfolio | | | BlackRock
Science &
Technology
Opportunities
Portfolio | | | BlackRock
U.S.
Opportunities
Portfolio | |
| | | | | | | | | | | | | | | | | | | | |
| Investment Income | | | | | | | | | | | | | | | | | |
Dividends — unaffiliated | | $ | 3,528,892 | | | $ | 20,823,440 | | | $ | 22,392,318 | | | $ | 237,046 | | | $ | 5,081,032 | |
Dividends — affiliated | | | 259 | | | | 15,512 | | | | 2,228 | | | | 1,295 | | | | 3,450 | |
Foreign taxes withheld | | | (112,721 | ) | | | (700,723 | ) | | | (1,047,909 | ) | | | (3,433 | ) | | | — | |
Other Income — affiliated | | | 9,738 | | | | 54,891 | | | | 25,744 | | | | 9,566 | | | | 245,073 | |
Securities lending — affiliated — net | | | 75,010 | | | | 158,697 | | | | 513,794 | | | | 101,582 | | | | 438,749 | |
| | | | |
Total income | | | 3,501,178 | | | | 20,351,817 | | | | 21,886,175 | | | | 346,056 | | | | 5,768,304 | |
| | | | |
| | | | | | | | | | | | | | | | | | | | |
| Expenses | | | | | | | | | | | | | | | | | | | | |
Investment advisory | | | 1,587,071 | | | | 12,008,927 | | | | 8,956,177 | | | | 905,467 | | | | 8,621,919 | |
Service and distribution — class specific | | | 611,298 | | | | 5,903,237 | | | | 1,831,347 | | | | 334,373 | | | | 1,991,071 | |
Transfer agent — class specific | | | 253,506 | | | | 1,992,932 | | | | 1,324,705 | | | | 269,772 | | | | 1,322,281 | |
Administration | | | 132,256 | | | | 1,017,101 | | | | 578,876 | | | | 75,456 | | | | 513,359 | |
Administration — class specific | | | 44,109 | | | | 296,857 | | | | 197,267 | | | | 25,113 | | | | 188,848 | |
Professional | | | 36,803 | | | | 36,547 | | | | 42,764 | | | | 29,481 | | | | 36,447 | |
Registration | | | 29,383 | | | | 84,177 | | | | 50,798 | | | | 35,596 | | | | 46,841 | |
Custodian | | | 25,007 | | | | 95,443 | | | | 102,625 | | | | 8,908 | | | | 39,796 | |
Officer and Trustees | | | 6,434 | | | | 45,233 | | | | 26,972 | | | | 3,918 | | | | 24,699 | |
Printing | | | 6,174 | | | | 47,255 | | | | 31,776 | | | | 5,729 | | | | 29,505 | |
Miscellaneous | | | 16,100 | | | | 37,838 | | | | 36,001 | | | | 12,604 | | | | 21,771 | |
Recoupment of past waived fees — class specific | | | 723 | | | | — | | | | 286 | | | | 20,042 | | | | 2,606 | |
Total expenses | | | 2,748,864 | | | | 21,565,547 | | | | 13,179,594 | | | | 1,726,459 | | | | 12,839,143 | |
Less fees waived by Manager | | | (531 | ) | | | (25,724 | ) | | | (4,178 | ) | | | (2,530 | ) | | | (1,679,062 | ) |
Less administration fees waived — class specific | | | (42,917 | ) | | | — | | | | (1,778 | ) | | | (10,079 | ) | | | (174,976 | ) |
Less transfer agent fees waived — class specific | | | (3,862 | ) | | | — | | | | (275 | ) | | | (3,851 | ) | | | (7,000 | ) |
Less transfer agent fees reimbursed — class specific | | | (160,706 | ) | | | — | | | | (1,989 | ) | | | (6,952 | ) | | | (644,258 | ) |
| | | | |
Total expenses after fees waived and/or reimbursed | | | 2,540,848 | | | | 21,539,823 | | | | 13,171,374 | | | | 1,703,047 | | | | 10,333,847 | |
| | | | |
Net investment income (loss) | | | 960,330 | | | | (1,188,006 | ) | | | 8,714,801 | | | | (1,356,991 | ) | | | (4,565,543 | ) |
| | | | |
| | | | | | | | | | | | | | | | | | | | |
| Realized and Unrealized Gain (Loss) | | | | | | | | | | | | | | | | | | | | |
Net realized gain (loss) from: | | | | | | | | | | | | | | | | | | | | |
Investments | | | 24,137,007 | | | | 238,121,859 | | | | 115,932,555 | | | | 13,930,706 | | | | 205,189,830 | |
Options written | | | — | | | | 1,609,622 | | | | — | | | | — | | | | — | |
Foreign currency transactions | | | (881,375 | ) | | | (12,447,789 | ) | | | (21,105,239 | ) | | | (338,766 | ) | | | — | |
| | | | |
| | | 23,255,632 | | | | 227,283,692 | | | | 94,827,316 | | | | 13,591,940 | | | | 205,189,830 | |
| | | | |
Net change in unrealized appreciation/depreciation on: | | | | | | | | | | | | | | | | | | | | |
Investments | | | 3,919,525 | | | | 198,899,971 | | | | 5,854,829 | | | | 14,642,739 | | | | (11,208,570 | ) |
Foreign currency translations | | | 776,329 | | | | 9,186,215 | | | | 17,194,211 | | | | 51,702 | | | | — | |
| | | | |
| | | 4,695,854 | | | | 208,086,186 | | | | 23,049,040 | | | | 14,694,441 | | | | (11,208,570 | ) |
| | | | |
Total realized and unrealized gain | | | 27,951,486 | | | | 435,369,878 | | | | 117,876,356 | | | | 28,286,381 | | | | 193,981,260 | |
| | | | |
Net Increase in Net Assets Resulting from Operations | | $ | 28,911,816 | | | $ | 434,181,872 | | | $ | 126,591,157 | | | $ | 26,929,390 | | | $ | 189,415,717 | |
| | | | |
See Notes to Financial Statements.
| | | | | | |
| 44 | | BLACKROCK FUNDS | | MARCH 31, 2014 | | |
| | |
| Statements of Changes in Net Assets | | |
| | | | | | | | | | | | | | | | |
| | | BlackRock
Global Opportunities
Portfolio | | | BlackRock
Health Sciences
Opportunities
Portfolio | |
| Increase in Net Assets: | | Six Months
Ended
March 31,
2014
(Unaudited) | | | Year Ended
September 30,
2013 | | | Six Months
Ended
March 31,
2014
(Unaudited) | | | Year Ended
September 30,
2013 | |
| | | | | | | | | | | | | | | | |
| Operations | | | | | | | | | | | | | | | | |
Net investment income (loss) | | $ | 960,330 | | | $ | 1,484,765 | | | $ | (1,188,006 | ) | | $ | 4,016,643 | |
Net realized gain | | | 23,255,632 | | | | 42,405,072 | | | | 227,283,692 | | | | 288,619,944 | |
Net change in unrealized appreciation/depreciation | | | 4,695,854 | | | | 21,126,620 | | | | 208,086,186 | | | | 403,472,884 | |
| | | | | | | | |
Net increase in net assets resulting from operations | | | 28,911,816 | | | | 65,016,457 | | | | 434,181,872 | | | | 696,109,471 | |
| | | | | | | | |
| | | | | | | | | | | | | | | | |
| Dividends and Distributions to Shareholders From | | | | | | | | | | | | | | | | |
Net investment income: | | | | | | | | | | | | | | | | |
Institutional | | | — | | | | (718,206 | )1 | | | (2,684,586 | ) | | | (2,499,090 | )1 |
Service | | | — | | | | — | | | | (15,999 | ) | | | (44,478 | )1 |
Investor A | | | — | | | | (1,967,914 | )1 | | | (1,334,162 | ) | | | (3,119,552 | )1 |
Investor B | | | — | | | | (4,918 | )1 | | | — | | | | — | |
Investor C | | | — | | | | (104,581 | )1 | | | — | | | | (1,211 | )1 |
Class R | | | — | | | | (104,371 | )1 | | | — | | | | (11,171 | )1 |
Net realized gain: | | | | | | | | | | | | | | | | |
Institutional | | | — | | | | — | | | | (73,784,321 | ) | | | (30,594,431 | )1 |
Service | | | — | | | | — | | | | (2,296,130 | ) | | | (1,018,612 | )1 |
Investor A | | | — | | | | — | | | | (159,449,440 | ) | | | (67,678,578 | )1 |
Investor B | | | — | | | | — | | | | (3,350,382 | ) | | | (2,559,474 | )1 |
Investor C | | | — | | | | — | | | | (60,490,412 | ) | | | (26,229,484 | )1 |
Class R | | | — | | | | — | | | | (3,720,372 | ) | | | (1,006,211 | )1 |
| | | | | | | | |
Decrease in net assets resulting from dividends and distributions to shareholders | | | — | | | | (2,899,990 | ) | | | (307,125,804 | ) | | | (134,762,292 | ) |
| | | | | | | | |
| | | | | | | | | | | | | | | | |
| Capital Share Transactions | | | | | | | | | | | | | | | | |
Net increase (decrease) in net assets derived from capital share transactions | | | (16,283,932 | ) | | | (47,329,070 | ) | | | 509,897,577 | | | | 570,833,474 | |
| | | | | | | | | | | | | | | | |
| Net Assets | | | | | | | | | | | | | | | | |
Total increase in net assets | | | 12,627,884 | | | | 14,787,397 | | | | 636,953,645 | | | | 1,132,180,653 | |
Beginning of period | | | 339,644,485 | | | | 324,857,088 | | | | 3,078,699,141 | | | | 1,946,518,488 | |
| | | | | | | | |
End of period | | $ | 352,272,369 | | | $ | 339,644,485 | | | $ | 3,715,652,786 | | | $ | 3,078,699,141 | |
| | | | | | | | |
Undistributed net investment income, end of period | | $ | 2,263,033 | | | $ | 1,302,703 | | | $ | 8,412,395 | | | $ | 13,635,148 | |
| | | | | | | | |
| | 1 | Determined in accordance with federal income tax regulations. |
See Notes to Financial Statements.
| | | | | | |
| | | BLACKROCK FUNDS | | MARCH 31, 2014 | | 45 |
| | |
| Statements of Changes in Net Assets (concluded) | | |
| | | | | | | | | | | | | | | | | | | | | | | | |
| | | BlackRock
International
Opportunities
Portfolio | | | BlackRock
Science &
Technology
Opportunities Portfolio | | | BlackRock
U.S. Opportunities
Portfolio | |
| Increase (Decrease) in Net Assets: | | Six Months
Ended March 31,
2014
(Unaudited) | | | Year Ended
September 30,
2013 | | | Six Months Ended March 31,
2014 (Unaudited) | | | Year Ended
September 30,
2013 | | | Six Months Ended March 31, 2014 (Unaudited) | | | Year Ended
September 30,
2013 | |
| | | | | | | | | | | | | | | | | | | | | | | | |
| Operations | | | | | | | | | | | | | | | | | | | | | | | | |
Net investment income (loss) | | $ | 8,714,801 | | | $ | 18,796,396 | | | $ | (1,356,991 | ) | | $ | (1,193,075 | ) | | $ | (4,565,543 | ) | | $ | (1,165,708 | ) |
Net realized gain | | | 94,827,316 | | | | 185,281,736 | | | | 13,591,940 | | | | 9,764,585 | | | | 205,189,830 | | | | 476,110,315 | |
Net change in unrealized appreciation/depreciation | | | 23,049,040 | | | | 102,538,962 | | | | 14,694,441 | | | | 21,890,030 | | | | (11,208,570 | ) | | | (17,583,669 | ) |
| | | | | | | | | | | | |
Net increase in net assets resulting from operations | | | 126,591,157 | | | | 306,617,094 | | | | 26,929,390 | | | | 30,461,540 | | | | 189,415,717 | | | | 457,360,938 | |
| | | | | | | | | | | | |
| | | | | | | | | | | | | | | | | | | | | | | | |
| Dividends and Distributions to Shareholders From | | | | | | | | | | | | | | | | | | | | | |
Net investment income: | | | | | | | | | | | | | | | | | | | | | | | | |
Institutional | | | (1,532,662 | ) | | | (13,286,367 | )1 | | | — | | | | — | | | | — | | | | (10,774,061 | )1 |
Service | | | (48,294 | ) | | | (559,333 | )1 | | | — | | | | — | | | | — | | | | (397,297 | )1 |
Investor A | | | (919,073 | ) | | | (10,010,464 | )1 | | | — | | | | — | | | | — | | | | (828,656 | )1 |
Investor B | | | — | | | | (51,463 | )1 | | | — | | | | — | | | | — | | | | — | |
Investor C | | | — | | | | (1,092,382 | )1 | | | — | | | | — | | | | — | | | | — | |
Net realized gain: | | | | | | | | | | | | | | | | | | | | | | | | |
Institutional | | | (2,005,514 | ) | | | — | | | | — | | | | — | | | | (134,711,811 | ) | | | (25,442,679 | )1 |
Service | | | (101,390 | ) | | | — | | | | — | | | | — | | | | (31,011,668 | ) | | | (3,450,902 | )1 |
Investor A | | | (1,953,372 | ) | | | — | | | | — | | | | — | | | | (103,656,072 | ) | | | (12,518,844 | )1 |
Investor B | | | (14,262 | ) | | | — | | | | — | | | | — | | | | (2,930,164 | ) | | | (304,395 | )1 |
Investor C | | | (410,265 | ) | | | — | | | | — | | | | — | | | | (47,392,290 | ) | | | (5,116,563 | )1 |
| | | | | | | | | | | | |
Decrease in net assets resulting from dividends and distributions to shareholders | | | (6,984,832 | ) | | | (25,000,009 | ) | | | — | | | | — | | | | (319,702,005 | ) | | | (58,833,397 | ) |
| | | | | | | | | | | | |
| | | | | | | | | | | | | | | | | | | | | | | | |
| Capital Share Transactions | | | | | | | | | | | | | | | | | | | | | | | | |
Net increase (decrease) in net assets derived from capital share transactions | | | 21,409,466 | | | | (255,326,514 | ) | | | 30,690,991 | | | | (35,823,712 | ) | | | 153,578,400 | | | | (1,133,474,361 | ) |
| | | | | | | | | | | | |
| | | | | | | | | | | | | | | | | | | | | | | | |
| Net Assets | | | | | | | | | | | | | | | | | | | | | | | | |
Total increase (decrease) in net assets | | | 141,015,791 | | | | 26,290,571 | | | | 57,620,381 | | | | (5,362,172 | ) | | | 23,292,112 | | | | (734,946,820 | ) |
Beginning of period | | | 1,724,261,258 | | | | 1,697,970,687 | | | | 169,587,215 | | | | 174,949,387 | | | | 1,569,446,967 | | | | 2,304,393,787 | |
| | | | | | | | | | | | |
End of period | | $ | 1,865,277,049 | | | $ | 1,724,261,258 | | | $ | 227,207,596 | | | $ | 169,587,215 | | | $ | 1,592,739,079 | | | $ | 1,569,446,967 | |
| | | | | | | | | | | | |
Undistributed (accumulated) net investment income (loss), end of period | | $ | 28,599,142 | | | $ | 22,384,370 | | | $ | (2,393,919 | ) | | $ | (1,036,928 | ) | | $ | (4,565,543 | ) | | | — | |
| | | | | | | | | | | | |
| | 1 | Determined in accordance with federal income tax regulations. |
See Notes to Financial Statements.
| | | | | | |
| 46 | | BLACKROCK FUNDS | | MARCH 31, 2014 | | |
| | | | |
| Financial Highlights | | | BlackRock Global Opportunities Portfolio | |
| | | | | | | | | | | | | | | | | | | | | | | | |
| | | Institutional | |
| | | Six Months
Ended
March 31,
2014 (Unaudited) | | | Year Ended September 30, | |
| | | | 2013 | | | 2012 | | | 2011 | | | 2010 | | | 2009 | |
| Per Share Operating Performance | | | | | | | | | | | | | | | | | | | | | | | | |
Net asset value, beginning of period | | $ | 13.42 | | | $ | 11.11 | | | $ | 9.32 | | | $ | 10.52 | | | $ | 10.13 | | | $ | 9.96 | |
| | | | |
Net investment income1 | | | 0.07 | | | | 0.10 | | | | 0.14 | | | | 0.08 | | | | 0.06 | | | | 0.06 | |
Net realized and unrealized gain (loss) | | | 1.12 | | | | 2.36 | | | | 1.67 | | | | (1.20 | )2 | | | 0.48 | 2 | | | 0.12 | 2 |
| | | | |
Net increase (decrease) from investment operations | | | 1.19 | | | | 2.46 | | | | 1.81 | | | | (1.12 | ) | | | 0.54 | | | | 0.18 | |
| | | | |
Dividends from net investment income | | | — | | | | (0.15 | )3 | | | (0.02 | )3 | | | (0.08 | )3 | | | (0.15 | )3 | | | (0.01 | )3 |
| | | | |
Net asset value, end of period | | $ | 14.61 | | | $ | 13.42 | | | $ | 11.11 | | | $ | 9.32 | | | $ | 10.52 | | | $ | 10.13 | |
| | | | |
| | | | | | | | | | | | | | | | | | | | | | | | |
| Total Investment Return4 | | | | | | | | | | | | | | | | | | | | | | | | |
Based on net asset value | | | 8.87 | %5 | | | 22.40 | % | | | 19.45 | % | | | (10.81 | )%6 | | | 5.32 | %6 | | | 1.78 | %6 |
| | | | |
| | | | | | | | | | | | | | | | | | | | | | | | |
| Ratios to Average Net Assets | | | | | | | | | | | | | | | | | | | | | | | | |
Total expenses | | | 1.20 | %7 | | | 1.22 | % | | | 1.25 | % | | | 1.53 | % | | | 1.43 | % | | | 1.50 | % |
| | | | |
Total expenses excluding recoupment of past waived fees | | | 1.20 | %7 | | | 1.22 | % | | | 1.25 | % | | | 1.52 | % | | | 1.42 | % | | | 1.49 | % |
| | | | |
Total expenses after fees waived and/or reimbursed and paid indirectly | | | 1.06 | %7 | | | 1.06 | % | | | 1.06 | % | | | 1.34 | % | | | 1.37 | % | | | 1.36 | % |
| | | | |
Net investment income | | | 0.92 | %7 | | | 0.83 | % | | | 1.35 | % | | | 0.68 | % | | | 0.64 | % | | | 0.70 | % |
| | | | |
| | | | | | | | | | | | | | | | | | | | | | | | |
| Supplemental Data | | | | | | | | | | | | | | | | | | | | | | | | |
Net assets, end of period (000) | | $ | 63,853 | | | $ | 63,182 | | | $ | 54,448 | | | $ | 58,793 | | | $ | 21,699 | | | $ | 16,971 | |
| | | | |
Portfolio turnover | | | 63 | % | | | 149 | % | | | 122 | % | | | 137 | % | | | 146 | % | | | 190 | % |
| | | | |
| | 1 | Based on average shares outstanding. |
| | 2 | Includes redemption fees, which are less than $0.005 per share. |
| | 3 | Determined in accordance with federal income tax regulations. |
| | 4 | Where applicable, assumes the reinvestment of dividends and distributions. |
| | 5 | Aggregate total investment return. |
| | 6 | Redemption fee of 2.00% is reflected in total return calculations. There was no impact to the return. |
See Notes to Financial Statements.
| | | | | | |
| | | BLACKROCK FUNDS | | MARCH 31, 2014 | | 47 |
| | | | |
| Financial Highlights (continued) | | | BlackRock Global Opportunities Portfolio | |
| | | | | | | | | | | | | | | | | | | | | | | | | | | | | | | | | | | | | | | | | | | | | | | | |
| | | Investor A | | | Investor B | |
| | | Six Months
Ended
March 31,
2014 (Unaudited) | | | Year Ended September 30, | | | Six Months
Ended
March 31,
2014 (Unaudited) | | | Year Ended September 30, | |
| | | | 2013 | | | 2012 | | | 2011 | | | 2010 | | | 2009 | | | | 2013 | | | 2012 | | | 2011 | | | 2010 | | | 2009 | |
| Per Share Operating Performance | | | | | | | | | | | | | | | | | | | | | | | | | | | | | | | | | | | | | | | | | | | | | | | | |
Net asset value, beginning of period | | $ | 13.32 | | | $ | 11.02 | | | $ | 9.26 | | | $ | 10.45 | | | $ | 10.08 | | | $ | 9.92 | | | $ | 12.99 | | | $ | 10.75 | | | $ | 9.10 | | | $ | 10.31 | | | $ | 9.93 | | | $ | 9.83 | |
| | | | | | | | |
Net investment income (loss)1 | | | 0.05 | | | | 0.07 | | | | 0.11 | | | | 0.05 | | | | 0.03 | | | | 0.04 | | | | (0.02 | ) | | | (0.03 | ) | | | 0.02 | | | | (0.04 | ) | | | (0.04 | ) | | | (0.02 | ) |
Net realized and unrealized gain (loss) | | | 1.10 | | | | 2.35 | | | | 1.66 | | | | (1.20 | )2 | | | 0.46 | 2 | | | 0.12 | 2 | | | 1.09 | | | | 2.28 | | | | 1.63 | | | | (1.17 | )2 | | | 0.45 | 2 | | | 0.12 | 2 |
| | | | | | | | |
Net increase (decrease) from investment operations | | | 1.15 | | | | 2.42 | | | | 1.77 | | | | (1.15 | ) | | | 0.49 | | | | 0.16 | | | | 1.07 | | | | 2.25 | | | | 1.65 | | | | (1.21 | ) | | | 0.41 | | | | 0.10 | |
| | | | | | | | |
Dividends from net investment income | | | — | | | | (0.12 | )3 | | | (0.01 | )3 | | | (0.04 | )3 | | | (0.12 | )3 | | | — | | | | — | | | | (0.01 | )3 | | | — | | | | — | | | | (0.03 | )3 | | | — | |
| | | | | | | | |
Net asset value, end of period | | $ | 14.47 | | | $ | 13.32 | | | $ | 11.02 | | | $ | 9.26 | | | $ | 10.45 | | | $ | 10.08 | | | $ | 14.06 | | | $ | 12.99 | | | $ | 10.75 | | | $ | 9.10 | | | $ | 10.31 | | | $ | 9.93 | |
| | | | | | | | |
| | | | | | | | | | | | | | | | | | | | | | | | | | | | | | | | | | | | | | | | | | | | | | | | |
| Total Investment Return4 | | | | | | | | | | | | | | | | | | | | | | | | | | | | | | | | | | | | | | | | | | | | | | | | |
Based on net asset value | | | 8.63 | %5 | | | 22.14 | % | | | 19.16 | % | | | (11.11 | )%6 | | | 4.92 | %6 | | | 1.61 | %6 | | | 8.24 | %5 | | | 20.95 | % | | | 18.13 | % | | | (11.74 | )%6 | | | 4.09 | %6 | | | 1.02 | %6 |
| | | | | | | | |
| | | | | | | | | | | | | | | | | | | | | | | | | | | | | | | | | | | | | | | | | | | | | | | | |
| Ratios to Average Net Assets | | | | | | | | | | | | | | | | | | | | | | | | | | | | | | | | | | | | | | | | | | | | | | | | |
Total expenses | | | 1.46 | %7 | | | 1.48 | % | | | 1.52 | % | | | 1.76 | % | | | 1.72 | % | | | 1.81 | % | | | 2.20 | %7 | | | 2.19 | % | | | 2.21 | % | | | 2.56 | % | | | 2.45 | % | | | 2.65 | % |
| | | | | | | | |
Total expenses excluding recoupment of past waived fees | | | 1.46 | %7 | | | 1.48 | % | | | 1.52 | % | | | 1.74 | % | | | 1.70 | % | | | 1.80 | % | | | 2.20 | %7 | | | 2.19 | % | | | 2.20 | % | | | 2.53 | % | | | 2.45 | % | | | 2.63 | % |
| | | | | | | | |
Total expenses after fees waived and/or reimbursed and paid indirectly | | | 1.33 | %7 | | | 1.33 | % | | | 1.33 | % | | | 1.61 | % | | | 1.67 | % | | | 1.66 | % | | | 2.18 | %7 | | | 2.18 | % | | | 2.18 | % | | | 2.42 | % | | | 2.43 | % | | | 2.42 | % |
| | | | | | | | |
Net investment income (loss) | | | 0.66 | %7 | | | 0.56 | % | | | 1.06 | % | | | 0.42 | % | | | 0.32 | % | | | 0.49 | % | | | (0.24 | )%7 | | | (0.29 | )% | | | 0.21 | % | | | (0.39 | )% | | | (0.44 | )% | | | (0.25 | )% |
| | | | | | | | |
| | | | | | | | | | | | | | | | | | | | | | | | | | | | | | | | | | | | | | | | | | | | | | | | |
| Supplemental Data | | | | | | | | | | | | | | | | | | | | | | | | | | | | | | | | | | | | | | | | | | | | | | | | |
Net assets, end of period (000) | | $ | 212,299 | | | $ | 202,343 | | | $ | 195,961 | | | $ | 210,299 | | | $ | 39,280 | | | $ | 45,110 | | | $ | 3,851 | | | $ | 4,254 | | | $ | 5,412 | | | $ | 6,750 | | | $ | 3,617 | | | $ | 4,351 | |
| | | | | | | | |
Portfolio turnover | | | 63 | % | | | 149 | % | | | 122 | % | | | 137 | % | | | 146 | % | | | 190 | % | | | 63 | % | | | 149 | % | | | 122 | % | | | 137 | % | | | 146 | % | | | 190 | % |
| | | | | | | | |
| | 1 | Based on average shares outstanding. |
| | 2 | Includes redemption fees, which are less than $0.005 per share. |
| | 3 | Determined in accordance with federal income tax regulations. |
| | 4 | Where applicable, excludes the effects of any sales charges and assumes the reinvestment of dividends and distributions. |
| | 5 | Aggregate total investment return. |
| | 6 | Redemption fee of 2.00% is reflected in total return calculations. There was no impact to the return. |
See Notes to Financial Statements.
| | | | | | |
| 48 | | BLACKROCK FUNDS | | MARCH 31, 2014 | | |
| | |
| Financial Highlights (concluded) | | BlackRock Global Opportunities Portfolio |
| | | | | | | | | | | | | | | | | | | | | | | | | | | | | | | | | | | | | | | | |
| | | Investor C | | | Class R | |
| | | Six Months
Ended
March 31,
2014 (Unaudited) | | | Year Ended September 30, | | | Six Months
Ended
March 31,
2014 (Unaudited) | | | Year Ended September 30, | | | Period
September 12,
20111 to September 30,
2011 | |
| | | | 2013 | | | 2012 | | | 2011 | | | 2010 | | | 2009 | | | | 2013 | | | 2012 | | |
| Per Share Operating Performance | | | | | | | | | | | | | | | | | | | | | | | | | | | | | | | | | | | | | | | | |
Net asset value, beginning of period | | $ | 12.94 | | | $ | 10.71 | | | $ | 9.06 | | | $ | 10.27 | | | $ | 9.91 | | | $ | 9.82 | | | $ | 13.28 | | | $ | 10.99 | | | $ | 9.26 | | | $ | 9.76 | |
| | | | | | | | |
Net investment income (loss)2 | | | (0.01 | ) | | | (0.03 | ) | | | 0.03 | | | | (0.04 | ) | | | (0.04 | ) | | | (0.02 | ) | | | 0.02 | | | | 0.02 | | | | 0.08 | | | | 0.00 | 3 |
Net realized and unrealized gain (loss) | | | 1.07 | | | | 2.28 | | | | 1.62 | | | | (1.17 | )4 | | | 0.45 | 4 | | | 0.11 | 4 | | | 1.09 | | | | 2.35 | | | | 1.65 | | | | (0.50 | )4 |
| | | | | | | | |
Net increase (decrease) from investment operations | | | 1.06 | | | | 2.25 | | | | 1.65 | | | | (1.21 | ) | | | 0.41 | | | | 0.09 | | | | 1.11 | | | | 2.37 | | | | 1.73 | | | | (0.50 | ) |
| | | | | | | | |
Dividends from net investment income | | | — | | | | (0.02 | )5 | | | — | | | | — | | | | (0.05 | )5 | | | — | | | | — | | | | (0.08 | )5 | | | (0.00 | )5,6 | | | — | |
| | | | | | | | |
Net asset value, end of period | | $ | 14.00 | | | $ | 12.94 | | | $ | 10.71 | | | $ | 9.06 | | | $ | 10.27 | | | $ | 9.91 | | | $ | 14.39 | | | $ | 13.28 | | | $ | 10.99 | | | $ | 9.26 | |
| | | | | | | | |
| | | | | | | | | | | | | | | | | | | | | | | | | | | | | | | | | | | | | | | | |
| Total Investment Return7 | | | | | | | | | | | | | | | | | | | | | | | | | | | | | | | | | | | | | | | | |
Based on net asset value | | | 8.19 | %8 | | | 21.07 | % | | | 18.21 | % | | | (11.78 | )%9 | | | 4.13 | %9 | | | 0.92 | %9 | | | 8.36 | %8 | | | 21.71 | % | | | 18.72 | % | | | (4.83 | )%8,9 |
| | | | | | | | |
| | | | | | | | | | | | | | | | | | | | | | | | | | | | | | | | | | | | | | | | |
| Ratios to Average Net Assets | | | | | | | | | | | | | | | | | | | | | | | | | | | | | | | | | | | | | | | | |
Total expenses | | | 2.23 | %10 | | | 2.28 | % | | | 2.32 | % | | | 2.59 | % | | | 2.49 | % | | | 2.62 | % | | | 1.77 | %10 | | | 1.81 | % | | | 1.80 | % | | | 1.98 | %10 |
| | | | | | | | |
Total expenses excluding recoupment of past waived fees | | | 2.23 | %10 | | | 2.28 | % | | | 2.32 | % | | | 2.57 | % | | | 2.49 | % | | | 2.62 | % | | | 1.76 | %10 | | | 1.80 | % | | | 1.79 | % | | | 1.98 | %10 |
| | | | | | | | |
Total expenses after fees waived and/or reimbursed and paid indirectly | | | 2.14 | %10 | | | 2.14 | % | | | 2.14 | % | | | 2.42 | % | | | 2.44 | % | | | 2.42 | % | | | 1.72 | %10 | | | 1.72 | % | | | 1.65 | % | | | 1.72 | %10 |
| | | | | | | | |
Net investment income (loss) | | | (0.16 | )%10 | | | (0.25 | )% | | | 0.26 | % | | | (0.38 | )% | | | (0.40 | )% | | | (0.26 | )% | | | 0.25 | %10 | | | 0.18 | % | | | 0.74 | % | | | 0.23 | %10 |
| | | | | | | | |
| | | | | | | | | | | | | | | | | | | | | | | | | | | | | | | | | | | | | | | | |
| Supplemental Data | | | | | | | | | | | | | | | | | | | | | | | | | | | | | | | | | | | | | | | | |
Net assets, end of period (000) | | $ | 58,036 | | | $ | 55,494 | | | $ | 54,332 | | | $ | 58,687 | | | $ | 19,554 | | | $ | 16,348 | | | $ | 14,234 | | | $ | 14,371 | | | $ | 14,704 | | | $ | 14,891 | |
| | | | | | | | |
Portfolio turnover | | | 63 | % | | | 149 | % | | | 122 | % | | | 137 | % | | | 146 | % | | | 190 | % | | | 63 | % | | | 149 | % | | | 122 | % | | | 137 | % |
| | | | | | | | |
| | 1 | Commencement of operations. |
| | 2 | Based on average shares outstanding. |
| | 3 | Amount is less than $0.005 per share. |
| | 4 | Includes redemption fees, which are less than $0.005 per share. |
| | 5 | Determined in accordance with federal income tax regulations. |
| | 6 | Amount is greater than $(0.005) per share. |
| | 7 | Where applicable, excludes the effects of any sales charges and assumes the reinvestment of dividends and distributions. |
| | 8 | Aggregate total investment return. |
| | 9 | Redemption fee of 2.00% is reflected in total return calculations. There was no impact to the return. |
See Notes to Financial Statements.
| | | | | | |
| | | BLACKROCK FUNDS | | MARCH 31, 2014 | | 49 |
| | | | |
| Financial Highlights | | | BlackRock Health Sciences Opportunities Portfolio | |
| | | | | | | | | | | | | | | | | | | | | | | | | | | | | | | | | | | | | | | | | | | | | | | | |
| | | Institutional | | | Service | |
| | | Six Months
Ended
March 31,
2014 (Unaudited) | | | Year Ended September 30, | | | Six Months
Ended
March 31,
2014 (Unaudited) | | | Year Ended September 30, | |
| | | | 2013 | | | 2012 | | | 2011 | | | 2010 | | | 2009 | | | | 2013 | | | 2012 | | | 2011 | | | 2010 | | | 2009 | |
| Per Share Operating Performance | | | | | | | | | | | | | | | | | | | | | | | | | | | | | | | | | | | | | | | | | | | | | | | | |
Net asset value, beginning of period | | $ | 43.24 | | | $ | 34.62 | | | $ | 28.77 | | | $ | 28.92 | | | $ | 26.29 | | | $ | 28.77 | | | $ | 42.02 | | | $ | 33.72 | | | $ | 28.05 | | | $ | 28.22 | | | $ | 25.74 | | | $ | 28.20 | |
| | | | | | | | |
Net investment income (loss)1 | | | 0.06 | | | | 0.20 | | | | 0.15 | | | | 0.02 | | | | 0.06 | | | | 0.08 | | | | — | | | | 0.09 | | | | 0.05 | | | | (0.07 | ) | | | (0.03 | ) | | | 0.01 | |
Net realized and unrealized gain (loss) | | | 5.66 | | | | 10.82 | | | | 7.26 | | | | 1.23 | 2 | | | 2.57 | 2 | | | (0.14 | )2 | | | 5.49 | | | | 10.53 | | | | 7.10 | | | | 1.19 | 2 | | | 2.51 | 2 | | | (0.14 | )2 |
| | | | | | | | |
Net increase (decrease) from investment operations | | | 5.72 | | | | 11.02 | | | | 7.41 | | | | 1.25 | | | | 2.63 | | | | (0.06 | ) | | | 5.49 | | | | 10.62 | | | | 7.15 | | | | 1.12 | | | | 2.48 | | | | (0.13 | ) |
| | | | | | | | |
Dividends and distributions from: | | | | | | | | | | | | | | | | | | | | | | | | | | | | | | | | | | | | | | | | | | | | | | | | |
Net investment income | | | (0.15 | ) | | | (0.18 | )3 | | | — | | | | (0.05 | )3 | | | — | | | | — | | | | (0.03 | ) | | | (0.10 | )3 | | | — | | | | — | | | | — | | | | — | |
Net realized gain | | | (4.05 | ) | | | (2.22 | )3 | | | (1.56 | )3 | | | (1.35 | )3 | | | — | | | | (2.42 | )3 | | | (4.05 | ) | | | (2.22 | )3 | | | (1.48 | )3 | | | (1.29 | )3 | | | — | | | | (2.33 | )3 |
| | | | | | | | |
Total dividends and distributions | | | (4.20 | ) | | | (2.40 | ) | | | (1.56 | ) | | | (1.40 | ) | | | — | | | | (2.42 | ) | | | (4.08 | ) | | | (2.32 | ) | | | (1.48 | ) | | | (1.29 | ) | | | — | | | | (2.33 | ) |
| | | | | | | | |
Net asset value, end of period | | $ | 44.76 | | | $ | 43.24 | | | $ | 34.62 | | | $ | 28.77 | | | $ | 28.92 | | | $ | 26.29 | | | $ | 43.43 | | | $ | 42.02 | | | $ | 33.72 | | | $ | 28.05 | | | $ | 28.22 | | | $ | 25.74 | |
| | | | | | | | |
| | | | | | | | | | | | | | | | | | | | | | | | | | | | | | | | | | | | | | | | | | | | | | | | |
| Total Investment Return4 | | | | | | | | | | | | | | | | | | | | | | | | | | | | | | | | | | | | | | | | | | | | | | | | |
Based on net asset value | | | 14.20 | %5 | | | 34.07 | % | | | 27.06 | % | | | 4.41 | %6 | | | 10.00 | %6,7 | | | 1.91 | %6 | | | 14.02 | %5 | | | 33.68 | % | | | 26.73 | % | | | 4.04 | %6 | | | 9.64 | %6,7 | | | 1.59 | %6 |
| | | | | | | | |
| | | | | | | | | | | | | | | | | | | | | | | | | | | | | | | | | | | | | | | | | | | | | | | | |
| Ratios to Average Net Assets | | | | | | | | | | | | | | | | | | | | | | | | | | | | | | | | | | | | | | | | | | | | | | | | |
Total expenses | | | 0.90 | %8 | | | 0.94 | % | | | 0.98 | % | | | 1.00 | % | | | 1.00 | % | | | 1.03 | % | | | 1.18 | %8 | | | 1.23 | % | | | 1.28 | % | | | 1.32 | % | | | 1.33 | % | | | 1.37 | % |
| | | | | | | | |
Total expenses excluding recoupment of past waived fees | | | 0.90 | %8 | | | 0.94 | % | | | 0.98 | % | | | 1.00 | % | | | 1.00 | % | | | 1.03 | % | | | 1.18 | %8 | | | 1.23 | % | | | 1.28 | % | | | 1.31 | % | | | 1.33 | % | | | 1.35 | % |
| | | | | | | | |
Total expenses after fees waived and/or reimbursed and paid indirectly | | | 0.89 | %8 | | | 0.94 | % | | | 0.98 | % | | | 1.00 | % | | | 1.00 | % | | | 1.03 | % | | | 1.18 | %8 | | | 1.23 | % | | | 1.28 | % | | | 1.31 | % | | | 1.32 | % | | | 1.36 | % |
| | | | | | | | |
Net investment income (loss) | | | 0.29 | %8 | | | 0.54 | % | | | 0.47 | % | | | 0.07 | % | | | 0.21 | % | | | 0.36 | % | | | 0.01 | %8 | | | 0.25 | % | | | 0.18 | % | | | (0.24 | )% | | | (0.12 | )% | | | 0.03 | % |
| | | | | | | | |
| | | | | | | | | | | | | | | | | | | | | | | | | | | | | | | | | | | | | | | | | | | | | | | | |
| Supplemental Data | | | | | | | | | | | | | | | | | | | | | | | | | | | | | | | | | | | | | | | | | | | | | | | | |
Net assets, end of
period (000) | | $ | 930,562 | | | $ | 748,148 | | | $ | 473,193 | | | $ | 362,292 | | | $ | 232,697 | | | $ | 171,607 | | | $ | 28,172 | | | $ | 23,035 | | | $ | 14,921 | | | $ | 13,478 | | | $ | 11,704 | | | $ | 8,110 | |
| | | | | | | | |
Portfolio turnover | | | 39 | % | | | 94 | % | | | 135 | % | | | 135 | % | | | 184 | % | | | 153 | % | | | 39 | % | | | 94 | % | | | 135 | % | | | 135 | % | | | 184 | % | | | 153 | % |
| | | | | | | | |
| | 1 | Based on average shares outstanding. |
| | 2 | Includes redemption fees, which are less than $0.005 per share. |
| | 3 | Determined in accordance with federal income tax regulations. |
| | 4 | Where applicable, assumes the reinvestment of dividends and distributions. |
| | 5 | Aggregate total investment return. |
| | 6 | Redemption fee of 2.00% is reflected in total return calculations. There was no impact to the return. |
| | 7 | Includes proceeds received from a settlement of litigation, which had no impact on the Fund’s total return. |
See Notes to Financial Statements.
| | | | | | |
| 50 | | BLACKROCK FUNDS | | MARCH 31, 2014 | | |
| | | | |
| Financial Highlights (continued) | | | BlackRock Health Sciences Opportunities Portfolio | |
| | | | | | | | | | | | | | | | | | | | | | | | | | | | | | | | | | | | | | | | | | | | | | | | |
| | | Investor A | | | Investor B | |
| | | Six Months
Ended
March 31,
2014 (Unaudited) | | | Year Ended September 30, | | | Six Months
Ended
March 31,
2014 (Unaudited) | | | Year Ended September 30, | |
| | | | 2013 | | | 2012 | | | 2011 | | | 2010 | | | 2009 | | | | 2013 | | | 2012 | | | 2011 | | | 2010 | | | 2009 | |
| Per Share Operating Performance | | | | | | | | | | | | | | | | | | | | | | | | | | | | | | | | | | | | | | | | | | | | | | | | |
Net asset value, beginning of period | | $ | 41.92 | | | $ | 33.64 | | | $ | 28.00 | | | $ | 28.18 | | | $ | 25.69 | | | $ | 28.14 | | | $ | 38.99 | | | $ | 31.46 | | | $ | 26.26 | | | $ | 26.39 | | | $ | 24.25 | | | $ | 26.73 | |
| | | | | | | | |
Net investment income (loss)1 | | | — | | | | 0.09 | | | | 0.05 | | | | (0.07 | ) | | | (0.03 | ) | | | 0.01 | | | | (0.16 | ) | | | (0.17 | ) | | | (0.17 | ) | | | (0.28 | ) | | | (0.23 | ) | | | (0.17 | ) |
Net realized and unrealized gain (loss) | | | 5.47 | | | | 10.51 | | | | 7.07 | | | | 1.19 | 2 | | | 2.52 | 2 | | | (0.15 | )2 | | | 5.10 | | | | 9.79 | | | | 6.63 | | | | 1.14 | 2 | | | 2.37 | 2 | | | (0.16 | )2 |
| | | | | | | | |
Net increase (decrease) from investment operations | | | 5.47 | | | | 10.60 | | | | 7.12 | | | | 1.12 | | | | 2.49 | | | | (0.14 | ) | | | 4.94 | | | | 9.62 | | | | 6.46 | | | | 0.86 | | | | 2.14 | | | | (0.33 | ) |
| | | | | | | | |
Dividends and distributions from: | | | | | | | | | | | | | | | | | | | | | | | | | | | | | | | | | | | | | | | | | | | | | | | | |
Net investment income | | | (0.03 | ) | | | (0.10 | )3 | | | — | | | | — | | | | — | | | | — | | | | — | | | | — | | | | — | | | | — | | | | — | | | | — | |
Net realized gain | | | (4.05 | ) | | | (2.22 | )3 | | | (1.48 | )3 | | | (1.30 | )3 | | | — | | | | (2.31 | )3 | | | (3.64 | ) | | | (2.09 | )3 | | | (1.26 | )3 | | | (0.99 | )3 | | | — | | | | (2.15 | )3 |
| | | | | | | | |
Total dividends and distributions | | | (4.08 | ) | | | (2.32 | ) | | | (1.48 | ) | | | (1.30 | ) | | | — | | | | (2.31 | ) | | | (3.64 | ) | | | (2.09 | ) | | | (1.26 | ) | | | (0.99 | ) | | | — | | | | (2.15 | ) |
| | | | | | | | |
Net asset value, end of period | | $ | 43.31 | | | $ | 41.92 | | | $ | 33.64 | | | $ | 28.00 | | | $ | 28.18 | | | $ | 25.69 | | | $ | 40.29 | | | $ | 38.99 | | | $ | 31.46 | | | $ | 26.26 | | | $ | 26.39 | | | $ | 24.25 | |
| | | | | | | | |
| | | | | | | | | | | | | | | | | | | | | | | | | | | | | | | | | | | | | | | | | | | | | | | | |
| Total Investment Return4 | | | | | | | | | | | | | | | | | | | | | | | | | | | | | | | | | | | | | | | | | | | | | | | | |
Based on net asset value | | | 14.02 | %5 | | | 33.73 | % | | | 26.68 | % | | | 4.03 | %6 | | | 9.69 | %6,7 | | | 1.57 | %6 | | | 13.57 | %5 | | | 32.63 | % | | | 25.70 | % | | | 3.27 | %6 | | | 8.82 | %6,7 | | | 0.73 | %6 |
| | | | | | | | |
| | | | | | | | | | | | | | | | | | | | | | | | | | | | | | | | | | | | | | | | | | | | | | | | |
| Ratios to Average Net Assets | | | | | | | | | | | | | | | | | | | | | | | | | | | | | | | | | | | | | | | | | | | | | | | | |
Total expenses | | | 1.17 | %8 | | | 1.22 | % | | | 1.29 | % | | | 1.31 | % | | | 1.31 | % | | | 1.37 | % | | | 2.00 | %8 | | | 2.02 | % | | | 2.07 | % | | | 2.06 | % | | | 2.10 | % | | | 2.20 | % |
| | | | | | | | |
Total expenses excluding recoupment of past waived fees | | | 1.17 | %8 | | | 1.22 | % | | | 1.29 | % | | | 1.31 | % | | | 1.31 | % | | | 1.37 | % | | | 2.00 | %8 | | | 2.02 | % | | | 2.07 | % | | | 2.06 | % | | | 2.10 | % | | | 2.17 | % |
| | | | | | | | |
Total expenses after fees waived and/or reimbursed and paid indirectly | | | 1.17 | %8 | | | 1.21 | % | | | 1.28 | % | | | 1.31 | % | | | 1.31 | % | | | 1.37 | % | | | 1.99 | %8 | | | 2.02 | % | | | 2.07 | % | | | 2.06 | % | | | 2.09 | % | | | 2.20 | % |
| | | | | | | | |
Net investment income (loss) | | | 0.02 | %8 | | | 0.26 | % | | | 0.17 | % | | | (0.24 | )% | | | (0.11 | )% | | | 0.02 | % | | | (0.82 | )%8 | | | (0.51 | )% | | | (0.59 | )% | | | (0.99 | )% | | | (0.88 | )% | | | (0.80 | )% |
| | | | | | | | |
| | | | | | | | | | | | | | | | | | | | | | | | | | | | | | | | | | | | | | | | | | | | | | | | |
| Supplemental Data | | | | | | | | | | | | | | | | | | | | | | | | | | | | | | | | | | | | | | | | | | | | | | | | |
Net assets, end of
period (000) | | $ | 1,944,408 | | | $ | 1,641,026 | | | $ | 1,018,429 | | | $ | 825,046 | | | $ | 682,857 | | | $ | 478,273 | | | $ | 31,320 | | | $ | 39,048 | | | $ | 40,452 | | | $ | 46,180 | | | $ | 47,855 | | | $ | 57,835 | |
| | | | | | | | |
Portfolio turnover | | | 39 | % | | | 94 | % | | | 135 | % | | | 135 | % | | | 184 | % | | | 153 | % | | | 39 | % | | | 94 | % | | | 135 | % | | | 135 | % | | | 184 | % | | | 153 | % |
| | | | | | | | |
| | 1 | Based on average shares outstanding. |
| | 2 | Includes redemption fees, which are less than $0.005 per share. |
| | 3 | Determined in accordance with federal income tax regulations. |
| | 4 | Where applicable, excludes the effects of any sales charges and assumes the reinvestment of dividends and distributions. |
| | 5 | Aggregate total investment return. |
| | 6 | Redemption fee of 2.00% is reflected in total return calculations. There was no impact to the return. |
| | 7 | Includes proceeds received from a settlement of litigation, which had no impact on the Fund’s total return. |
See Notes to Financial Statements.
| | | | | | |
| | | BLACKROCK FUNDS | | MARCH 31, 2014 | | 51 |
| | | | |
| Financial Highlights (concluded) | | | BlackRock Health Sciences Opportunities Portfolio | |
| | | | | | | | | | | | | | | | | | | | | | | | | | | | | | | | | | | | | | | | |
| | | Investor C | | | Class R | |
| | | Six Months
Ended
March 31,
2014 (Unaudited) | | | Year Ended September 30, | | | Six Months
Ended
March 31,
2014 (Unaudited) | | | Year Ended September 30, | | | Period
September 12,
20111 to September 30,
2011 | |
| | | | 2013 | | | 2012 | | | 2011 | | | 2010 | | | 2009 | | | | 2013 | | | 2012 | | |
| Per Share Operating Performance | | | | | | | | | | | | | | | | | | | | | | | | | | | | | | | | | | | | | | | | |
Net asset value, beginning of period | | $ | 38.77 | | | $ | 31.34 | | | $ | 26.18 | | | $ | 26.37 | | | $ | 24.22 | | | $ | 26.70 | | | $ | 41.62 | | | $ | 33.46 | | | $ | 28.00 | | | $ | 28.19 | |
| | | | | | | | |
Net investment loss2 | | | (0.14 | ) | | | (0.16 | ) | | | (0.16 | ) | | | (0.27 | ) | | | (0.21 | ) | | | (0.15 | ) | | | (0.05 | ) | | | (0.03 | ) | | | (0.07 | ) | | | (0.01 | ) |
Net realized and unrealized gain (loss) | | | 5.05 | | | | 9.74 | | | | 6.62 | | | | 1.14 | 3 | | | 2.36 | 3 | | | (0.16 | )3 | | | 5.44 | | | | 10.43 | | | | 7.05 | | | | (0.18 | )3 |
| | | | | | | | |
Net increase (decrease) from investment operations | | | 4.91 | | | | 9.58 | | | | 6.46 | | | | 0.87 | | | | 2.15 | | | | (0.31 | ) | | | 5.39 | | | | 10.40 | | | | 6.98 | | | | (0.19 | ) |
| | | | | | | | |
Dividends and distributions from: | | | | | | | | | | | | | | | | | | | | | | | | | | | | | | | | | | | | | | | | |
Net investment income | | | — | | | | (0.00 | )4,5 | | | — | | | | — | | | | — | | | | — | | | | — | | | | (0.02 | )4 | | | — | | | | — | |
Net realized gain | | | (3.83 | ) | | | (2.15 | )4 | | | (1.30 | )4 | | | (1.06 | )4 | | | — | | | | (2.17 | )4 | | | (4.03 | ) | | | (2.22 | )4 | | | (1.52 | )4 | | | — | |
| | | | | | | | |
Total dividends and distributions | | | (3.83 | ) | | | (2.15 | ) | | | (1.30 | ) | | | (1.06 | ) | | | — | | | | (2.17 | ) | | | (4.03 | ) | | | (2.24 | ) | | | (1.52 | ) | | | — | |
| | | | | | | | |
Net asset value, end of period | | $ | 39.85 | | | $ | 38.77 | | | $ | 31.34 | | | $ | 26.18 | | | $ | 26.37 | | | $ | 24.22 | | | $ | 42.98 | | | $ | 41.62 | | | $ | 33.46 | | | $ | 28.00 | |
| | | | | | | | |
| | | | | | | | | | | | | | | | | | | | | | | | | | | | | | | | | | | | | | | | |
| Total Investment Return6 | | | | | | | | | | | | | | | | | | | | | | | | | | | | | | | | | | | | | | | | |
Based on net asset value | | | 13.60 | %7 | | | 32.71 | % | | | 25.80 | % | | | 3.32 | %8 | | | 8.88 | %8,9 | | | 0.81 | %8 | | | 13.90 | %7 | | | 33.21 | % | | | 26.17 | % | | | (0.64 | )%7,8 |
| | | | | | | | |
| | | | | | | | | | | | | | | | | | | | | | | | | | | | | | | | | | | | | | | | |
| Ratios to Average Net Assets | | | | | | | | | | | | | | | | | | | | | | | | | | | | | | | | | | | | | | | | |
Total expenses | | | 1.90 | %10 | | | 1.95 | % | | | 2.01 | % | | | 2.02 | % | | | 2.04 | % | | | 2.09 | % | | | 1.45 | %10 | | | 1.55 | % | | | 1.70 | % | | | 1.75 | %10 |
| | | | | | | | |
Total expenses excluding recoupment of past waived fees | | | 1.90 | %10 | | | 1.95 | % | | | 2.01 | % | | | 2.02 | % | | | 2.04 | % | | | 2.09 | % | | | 1.45 | %10 | | | 1.54 | % | | | 1.70 | % | | | 1.75 | %10 |
| | | | | | | | |
Total expenses after fees waived and/or reimbursed and paid indirectly | | | 1.90 | %10 | | | 1.95 | % | | | 2.01 | % | | | 2.02 | % | | | 2.04 | % | | | 2.09 | % | | | 1.45 | %10 | | | 1.55 | % | | | 1.68 | % | | | 1.75 | %10 |
| | | | | | | | |
Net investment loss | | | (0.71 | )%10 | | | (0.48 | )% | | | (0.55 | )% | | | (0.95 | )% | | | (0.83 | )% | | | (0.70 | )% | | | (0.24 | )%10 | | | (0.09 | )% | | | (0.24 | )% | | | (0.82 | )%10 |
| | | | | | | | |
| | | | | | | | | | | | | | | | | | | | | | | | | | | | | | | | | | | | | | | | |
| Supplemental Data | | | | | | | | | | | | | | | | | | | | | | | | | | | | | | | | | | | | | | | | |
Net assets, end of
period (000) | | $ | 725,621 | �� | | $ | 596,123 | | | $ | 384,910 | | | $ | 327,855 | | | $ | 285,428 | | | $ | 255,340 | | | $ | 55,569 | | | $ | 31,319 | | | $ | 14,613 | | | $ | 9,580 | |
| | | | | | | | |
Portfolio turnover | | | 39 | % | | | 94 | % | | | 135 | % | | | 135 | % | | | 184 | % | | | 153 | % | | | 39 | % | | | 94 | % | | | 135 | % | | | 135 | % |
| | | | | | | | |
| | 1 | Commencement of operations. |
| | 2 | Based on average shares outstanding. |
| | 3 | Includes redemption fees, which are less than $0.005 per share. |
| | 4 | Determined in accordance with federal income tax regulations. |
| | 5 | Amount is greater than $(0.005) per share. |
| | 6 | Where applicable, excludes the effects of any sales charges and assumes the reinvestment of dividends and distributions. |
| | 7 | Aggregate total investment return. |
| | 8 | Redemption fee of 2.00% is reflected in total return calculations. There was no impact to the return. |
| | 9 | Includes proceeds received from a settlement of litigation, which had no impact on the Fund’s total return. |
See Notes to Financial Statements.
| | | | | | |
| 52 | | BLACKROCK FUNDS | | MARCH 31, 2014 | | |
| | | | |
| Financial Highlights | | | BlackRock International Opportunities Portfolio | |
| | | | | | | | | | | | | | | | | | | | | | | | | | | | | | | | | | | | | | | | | | | | | | | | |
| | | Institutional | | | Service | |
| | | Six Months
Ended
March 31,
2014 (Unaudited) | | | Year Ended September 30, | | | Six Months
Ended
March 31,
2014 (Unaudited) | | | Year Ended September 30, | |
| | | | 2013 | | | 2012 | | | 2011 | | | 2010 | | | 2009 | | | | 2013 | | | 2012 | | | 2011 | | | 2010 | | | 2009 | |
| Per Share Operating Performance | | | | | | | | | | | | | | | | | | | | | | | | | | | | | | | | | | | | | | | | | | | | | | | | |
Net asset value, beginning of period | | $ | 38.58 | | | $ | 32.82 | | | $ | 28.37 | | | $ | 32.76 | | | $ | 31.36 | | | $ | 29.44 | | | $ | 37.16 | | | $ | 31.62 | | | $ | 27.34 | | | $ | 31.58 | | | $ | 30.26 | | | $ | 28.36 | |
| | | | | | | | |
Net investment income1 | | | 0.24 | | | | 0.48 | | | | 0.56 | | | | 0.49 | | | | 0.28 | | | | 0.34 | | | | 0.16 | | | | 0.26 | | | | 0.39 | | | | 0.34 | | | | 0.16 | | | | 0.27 | |
Net realized and unrealized gain (loss) | | | 2.64 | | | | 5.84 | | | | 4.49 | | | | (4.52 | )2 | | | 1.58 | 2 | | | 1.68 | 2 | | | 2.57 | | | | 5.67 | | | | 4.33 | | | | (4.37 | )2 | | | 1.53 | 2 | | | 1.63 | 2 |
| | | | | | | | |
Net increase (decrease) from investment operations | | | 2.88 | | | | 6.32 | | | | 5.05 | | | | (4.03 | ) | | | 1.86 | | | | 2.02 | | | | 2.73 | | | | 5.93 | | | | 4.72 | | | | (4.03 | ) | | | 1.69 | | | | 1.90 | |
| | | | | | | | |
Dividends from: | | | | | | | | | | | | | | | | | | | | | | | | | | | | | | | | | | | | | | | | | | | | | | | | |
Net investment income | | | (0.07 | ) | | | (0.56 | )3 | | | (0.60 | )3 | | | (0.36 | )3 | | | (0.46 | )3 | | | (0.10 | )3 | | | (0.05 | ) | | | (0.39 | )3 | | | (0.44 | )3 | | | (0.21 | )3 | | | (0.37 | )3 | | | — | |
Net realized gain | | | (0.10 | ) | | | — | | | | — | | | | — | | | | — | | | | — | | | | (0.10 | ) | | | — | | | | — | | | | — | | | | — | | | | — | |
| | | | | | | | |
Total dividends and distributions | | | (0.17 | ) | | | (0.56 | ) | | | (0.60 | ) | | | (0.36 | ) | | | (0.46 | ) | | | (0.10 | ) | | | (0.15 | ) | | | (0.39 | ) | | | (0.44 | ) | | | (0.21 | ) | | | (0.37 | ) | | | — | |
| | | | | | | | |
Net asset value, end of period | | $ | 41.29 | | | $ | 38.58 | | | $ | 32.82 | | | $ | 28.37 | | | $ | 32.76 | | | $ | 31.36 | | | $ | 39.74 | | | $ | 37.16 | | | $ | 31.62 | | | $ | 27.34 | | | $ | 31.58 | | | $ | 30.26 | |
| | | | | | | | |
| | | | | | | | | | | | | | | | | | | | | | | | | | | | | | | | | | | | | | | | | | | | | | | | |
| Total Investment Return4 | | | | | | | | | | | | | | | | | | | | | | | | | | | | | | | | | | | | | | | | | | | | | | | | |
Based on net asset value | | | 7.48 | %5 | | | 19.50 | % | | | 18.08 | % | | | (12.50 | )%6 | | | 5.99 | %6 | | | 6.99 | %6 | | | 7.34 | %5 | | | 18.93 | % | | | 17.48 | % | | | (12.88 | )%6 | | | 5.63 | %6 | | | 6.70 | %6 |
| | | | | | | | |
| | | | | | | | | | | | | | | | | | | | | | | | | | | | | | | | | | | | | | | | | | | | | | | | |
| Ratios to Average Net Assets | �� | | | | | | | | | | | | | | | | | | | | | | | | | | | | | | | | | | | | | | | | | | | | | | | |
Total expenses | | | 1.21 | %7 | | | 1.23 | % | | | 1.29 | % | | | 1.26 | % | | | 1.35 | % | | | 1.45 | % | | | 1.50 | %7 | | | 1.71 | % | | | 1.90 | % | | | 1.66 | % | | | 1.72 | % | | | 1.75 | % |
| | | | | | | | |
Total expenses excluding recoupment of past waived fees | | | 1.21 | %7 | | | 1.23 | % | | | 1.29 | % | | | 1.26 | % | | | 1.34 | % | | | 1.45 | % | | | 1.50 | %7 | | | 1.60 | % | | | 1.90 | % | | | 1.66 | % | | | 1.69 | % | | | 1.73 | % |
| | | | | | | | |
Total expenses after fees waived and/or reimbursed and paid indirectly | | | 1.21 | %7 | | | 1.23 | % | | | 1.29 | % | | | 1.26 | % | | | 1.35 | % | | | 1.43 | % | | | 1.50 | %7 | | | 1.71 | % | | | 1.80 | % | | | 1.65 | % | | | 1.72 | % | | | 1.70 | % |
| | | | | | | | |
Net investment income | | | 1.19 | %7 | | | 1.34 | % | | | 1.83 | % | | | 1.41 | % | | | 0.91 | % | | | 1.36 | % | | | 0.83 | %7 | | | 0.76 | % | | | 1.31 | % | | | 1.02 | % | | | 0.53 | % | | | 1.13 | % |
| | | | | | | | |
| | | | | | | | | | | | | | | | | | | | | | | | | | | | | | | | | | | | | | | | | | | | | | | | |
| Supplemental Data | | | | | | | | | | | | | | | | | | | | | | | | | | | | | | | | | | | | | | | | | | | | | | | | |
Net assets, end of
period (000) | | $ | 856,623 | | | $ | 775,659 | | | $ | 798,205 | | | $ | 792,695 | | | $ | 802,167 | | | $ | 673,420 | | | $ | 40,880 | | | $ | 40,885 | | | $ | 47,598 | | | $ | 47,846 | | | $ | 70,365 | | | $ | 83,093 | |
| | | | | | | | |
Portfolio turnover | | | 68 | % | | | 157 | % | | | 99 | % | | | 116 | % | | | 116 | % | | | 143 | % | | | 68 | % | | | 157 | % | | | 99 | % | | | 116 | % | | | 116 | % | | | 143 | % |
| | | | | | | | |
| | 1 | Based on average shares outstanding. |
| | 2 | Includes redemption fees, which are less than $0.005 per share. |
| | 3 | Determined in accordance with federal income tax regulations. |
| | 4 | Where applicable, assumes the reinvestment of dividends and distributions. |
| | 5 | Aggregate total investment return. |
| | 6 | Redemption fee of 2.00% is reflected in total return calculations. There was no impact to the return. |
See Notes to Financial Statements.
| | | | | | |
| | | BLACKROCK FUNDS | | MARCH 31, 2014 | | 53 |
| | | | |
| Financial Highlights (continued) | | | BlackRock International Opportunities Portfolio | |
| | | | | | | | | | | | | | | | | | | | | | | | | | | | | | | | | | | | | | | | | | | | | | | | |
| | | Investor A | | | Investor B | |
| | | Six Months
Ended
March 31,
2014 (Unaudited) | | | Year Ended September 30, | | | Six Months
Ended
March 31,
2014 (Unaudited) | | | Year Ended September 30, | |
| | | | 2013 | | | 2012 | | | 2011 | | | 2010 | | | 2009 | | | | 2013 | | | 2012 | | | 2011 | | | 2010 | | | 2009 | |
| Per Share Operating Performance | | | | | | | | | | | | | | | | | | | | | | | | | | | | | | | | | | | | | | | | | | | | | | | | |
Net asset value, beginning of period | | $ | 36.80 | | | $ | 31.33 | | | $ | 27.10 | | | $ | 31.33 | | | $ | 30.02 | | | $ | 28.14 | | | $ | 34.27 | | | $ | 29.15 | | | $ | 25.18 | | | $ | 29.10 | | | $ | 27.83 | | | $ | 26.29 | |
| | | | | | | | |
Net investment income (loss)1 | | | 0.17 | | | | 0.35 | | | | 0.45 | | | | 0.39 | | | | 0.21 | | | | 0.27 | | | | (0.06 | ) | | | 0.02 | | | | 0.16 | | | | 0.10 | | | | (0.05 | ) | | | 0.09 | |
Net realized and unrealized gain (loss) | | | 2.53 | | | | 5.59 | | | | 4.30 | | | | (4.34 | )2 | | | 1.50 | 2 | | | 1.62 | 2 | | | 2.42 | | | | 5.25 | | | | 4.03 | | | | (4.01 | )2 | | | 1.42 | 2 | | | 1.45 | 2 |
| | | | | | | | |
Net increase (decrease) from investment operations | | | 2.70 | | | | 5.94 | | | | 4.75 | | | | (3.95 | ) | | | 1.71 | | | | 1.89 | | | | 2.36 | | | | 5.27 | | | | 4.19 | | | | (3.91 | ) | | | 1.37 | | | | 1.54 | |
| | | | | | | | |
Dividends and distributions from: | | | | | | | | | | | | | | | | | | | | | | | | | | | | | | | | | | | | | | | | | | | | | | | | |
Net investment income | | | (0.05 | ) | | | (0.47 | )3 | | | (0.52 | )3 | | | (0.28 | )3 | | | (0.40 | )3 | | | (0.01 | )3 | | | — | | | | (0.15 | )3 | | | (0.22 | )3 | | | (0.01 | )3 | | | (0.10 | )3 | | | — | |
Net realized gain | | | (0.10 | ) | | | — | | | | — | | | | — | | | | — | | | | — | | | | (0.10 | ) | | | — | | | | — | | | | — | | | | — | | | | — | |
| | | | | | | | |
Total dividends and distributions | | | (0.15 | ) | | | (0.47 | ) | | | (0.52 | ) | | | (0.28 | ) | | | (0.40 | ) | | | (0.01 | ) | | | (0.10 | ) | | | (0.15 | ) | | | (0.22 | ) | | | (0.01 | ) | | | (0.10 | ) | | | — | |
| | | | | | | | |
Net asset value, end of period | | $ | 39.35 | | | $ | 36.80 | | | $ | 31.33 | | | $ | 27.10 | | | $ | 31.33 | | | $ | 30.02 | | | $ | 36.53 | | | $ | 34.27 | | | $ | 29.15 | | | $ | 25.18 | | | $ | 29.10 | | | $ | 27.83 | |
| | | | | | | | |
| | | | | | | | | | | | | | | | | | | | | | | | | | | | | | | | | | | | | | | | | | | | | | | | |
| Total Investment Return4 | | | | | | | | | | | | | | | | | | | | | | | | | | | | | | | | | | | | | | | | | | | | | | | | |
Based on net asset value | | | 7.33 | %5 | | | 19.16 | % | | | 17.74 | % | | | (12.77 | )%6 | | | 5.73 | %6 | | | 6.73 | %6 | | | 6.89 | %5 | | | 18.15 | % | | | 16.72 | % | | | (13.45 | )%6 | | | 4.92 | %6 | | | 5.86 | %6 |
| | | | | | | | |
| | | | | | | | | | | | | | | | | | | | | | | | | | | | | | | | | | | | | | | | | | | | | | | | |
| Ratios to Average Net Assets | | | | | | | | | | | | | | | | | | | | | | | | | | | | | | | | | | | | | | | | | | | | | | | | |
Total expenses | | | 1.51 | %7 | | | 1.52 | % | | | 1.57 | % | | | 1.54 | % | | | 1.59 | % | | | 1.68 | % | | | 2.47 | %7 | | | 2.40 | % | | | 2.41 | % | | | 2.32 | % | | | 2.38 | % | | | 2.49 | % |
| | | | | | | | |
Total expenses excluding recoupment of past waived fees | | | 1.51 | %7 | | | 1.52 | % | | | 1.57 | % | | | 1.54 | % | | | 1.59 | % | | | 1.68 | % | | | 2.47 | %7 | | | 2.40 | % | | | 2.41 | % | | | 2.32 | % | | | 2.38 | % | | | 2.49 | % |
| | | | | | | | |
Total expenses after fees waived and/or reimbursed and paid indirectly | | | 1.51 | %7 | | | 1.52 | % | | | 1.57 | % | | | 1.53 | % | | | 1.59 | % | | | 1.68 | % | | | 2.36 | %7 | | | 2.40 | % | | | 2.41 | % | | | 2.32 | % | | | 2.38 | % | | | 2.49 | % |
| | | | | | | | |
Net investment income (loss) | | | 0.87 | %7 | | | 1.02 | % | | | 1.52 | % | | | 1.16 | % | | | 0.72 | % | | | 1.15 | % | | | (0.33 | )%7 | | | 0.06 | % | | | 0.60 | % | | | 0.34 | % | | | (0.18 | )% | | | 0.41 | % |
| | | | | | | | |
| | | | | | | | | | | | | | | | | | | | | | | | | | | | | | | | | | | | | | | | | | | | | | | | |
| Supplemental Data | | | | | | | | | | | | | | | | | | | | | | | | | | | | | | | | | | | | | | | | | | | | | | | | |
Net assets, end of
period (000) | | $ | 810,069 | | | $ | 753,074 | | | $ | 692,445 | | | $ | 703,201 | | | $ | 794,034 | | | $ | 604,283 | | | $ | 4,161 | | | $ | 6,507 | | | $ | 10,813 | | | $ | 15,568 | | | $ | 25,080 | | | $ | 33,094 | |
| | | | | | | | |
Portfolio turnover | | | 68 | % | | | 157 | % | | | 99 | % | | | 116 | % | | | 116 | % | | | 143 | % | | | 68 | % | | | 157 | % | | | 99 | % | | | 116 | % | | | 116 | % | | | 143 | % |
| | | | | | | | |
| | 1 | Based on average shares outstanding. |
| | 2 | Includes redemption fees, which are less than $0.005 per share. |
| | 3 | Determined in accordance with federal income tax regulations. |
| | 4 | Where applicable, excludes the effects of any sales charges and assumes the reinvestment of dividends and distributions. |
| | 5 | Aggregate total investment return. |
| | 6 | Redemption fee of 2.00% is reflected in total return calculations. There was no impact to the return. |
See Notes to Financial Statements.
| | | | | | |
| 54 | | BLACKROCK FUNDS | | MARCH 31, 2014 | | |
| | | | |
| Financial Highlights (concluded) | | | BlackRock International Opportunities Portfolio | |
| | | | | | | | | | | | | | | | | | | | | | | | |
| | | Investor C | |
| | | Six Months
Ended
March 31,
2014 (Unaudited) | | | Year Ended September 30, | |
| | | | 2013 | | | 2012 | | | 2011 | | | 2010 | | | 2009 | |
| Per Share Operating Performance | | | | | | | | | | | | | | | | | | | | | | | | |
Net asset value, beginning of period | | $ | 33.93 | | | $ | 28.91 | | | $ | 24.98 | | | $ | 28.92 | | | $ | 27.74 | | | $ | 26.21 | |
| | | | |
Net investment income (loss)1 | | | 0.02 | | | | 0.07 | | | | 0.20 | | | | 0.11 | | | | (0.02 | ) | | | 0.08 | |
Net realized and unrealized gain (loss) | | | 2.33 | | | | 5.17 | | | | 3.98 | | | | (3.98 | )2 | | | 1.39 | 2 | | | 1.45 | 2 |
| | | | |
Net increase (decrease) from investment operations | | | 2.35 | | | | 5.24 | | | | 4.18 | | | | (3.87 | ) | | | 1.37 | | | | 1.53 | |
| | | | |
Dividends from: | | | | | | | | | | | | | | | | | | | | | | | | |
Net investment income | | | — | | | | (0.22 | )3 | | | (0.25 | )3 | | | (0.07 | )3 | | | (0.19 | )3 | | | — | |
Net realized gain | | | (0.10 | ) | | | — | | | | — | | | | — | | | | — | | | | — | |
| | | | |
Total dividends and distributions | | | (0.10 | ) | | | (0.22 | ) | | | (0.25 | ) | | | (0.07 | ) | | | (0.19 | ) | | | — | |
| | | | |
Net asset value, end of period | | $ | 36.18 | | | $ | 33.93 | | | $ | 28.91 | | | $ | 24.98 | | | $ | 28.92 | | | $ | 27.74 | |
| | | | |
| | | | | | | | | | | | | | | | | | | | | | | | |
| Total Investment Return4 | | | | | | | | | | | | | | | | | | | | | | | | |
Based on net asset value | | | 6.93 | %5 | | | 18.25 | % | | | 16.83 | % | | | (13.44 | )%6 | | | 4.95 | %6 | | | 5.84 | %6 |
| | | | |
| | | | | | | | | | | | | | | | | | | | | | | | |
| Ratios to Average Net Assets | | | | | | | | | | | | | | | | | | | | | | | | |
Total expenses | | | 2.27 | %7 | | | 2.30 | % | | | 2.34 | % | | | 2.31 | % | | | 2.36 | % | | | 2.49 | % |
| | | | |
Total expenses excluding recoupment of past waived fees | | | 2.27 | %7 | | | 2.30 | % | | | 2.34 | % | | | 2.31 | % | | | 2.36 | % | | | 2.49 | % |
| | | | |
Total expenses after fees waived and/or reimbursed and paid indirectly | | | 2.27 | %7 | | | 2.30 | % | | | 2.34 | % | | | 2.31 | % | | | 2.36 | % | | | 2.48 | % |
| | | | |
Net investment income (loss) | | | 0.10 | %7 | | | 0.24 | % | | | 0.73 | % | | | 0.37 | % | | | (0.06 | )% | | | 0.38 | % |
| | | | |
| | | | | | | | | | | | | | | | | | | | | | | | |
| Supplemental Data | | | | | | | | | | | | | | | | | | | | | | | | |
Net assets, end of period (000) | | $ | 153,544 | | | $ | 148,136 | | | $ | 148,910 | | | $ | 169,481 | | | $ | 224,958 | | | $ | 187,246 | |
| | | | |
Portfolio turnover | | | 68 | % | | | 157 | % | | | 99 | % | | | 116 | % | | | 116 | % | | | 143 | % |
| | | | |
| | 1 | Based on average shares outstanding. |
| | 2 | Includes redemption fees, which are less than $0.005 per share. |
| | 3 | Determined in accordance with federal income tax regulations. |
| | 4 | Where applicable, excludes the effects of any sales charges and assumes the reinvestment of dividends and distributions. |
| | 5 | Aggregate total investment return. |
| | 6 | Redemption fee of 2.00% is reflected in total return calculations. There was no impact to the return. |
See Notes to Financial Statements.
| | | | | | |
| | | BLACKROCK FUNDS | | MARCH 31, 2014 | | 55 |
| | | | |
| Financial Highlights | | | BlackRock Science & Technology Opportunities Portfolio | |
| | | | | | | | | | | | | | | | | | | | | | | | | | | | | | | | | | | | | | | | | | | | | | | | |
| | | Institutional | | | Service | |
| | | Six Months
Ended
March 31,
2014 (Unaudited) | | | Year Ended September 30, | | | Six Months
Ended
March 31,
2014 (Unaudited) | | | Year Ended September 30, | |
| | | | 2013 | | | 2012 | | | 2011 | | | 2010 | | | 2009 | | | | 2013 | | | 2012 | | | 2011 | | | 2010 | | | 2009 | |
| Per Share Operating Performance | | | | | | | | | | | | | | | | | | | | | | | | | | | | | | | | | | | | | | | | | | | | | | | | |
Net asset value, beginning of period | | $ | 12.27 | | | $ | 10.01 | | | $ | 8.61 | | | $ | 9.02 | | | $ | 7.79 | | | $ | 6.98 | | | $ | 11.81 | | | $ | 9.66 | | | $ | 8.32 | | | $ | 8.72 | | | $ | 7.56 | | | $ | 6.80 | |
| | | | | | | | |
Net investment loss1 | | | (0.07 | ) | | | (0.03 | ) | | | (0.06 | ) | | | (0.06 | ) | | | (0.05 | ) | | | (0.02 | ) | | | (0.07 | ) | | | (0.05 | ) | | | (0.08 | ) | | | (0.07 | ) | | | (0.08 | ) | | | (0.04 | ) |
Net realized and unrealized gain (loss) | | | 2.09 | | | | 2.29 | | | | 1.46 | | | | (0.35 | )2 | | | 1.28 | 2 | | | 0.83 | 2 | | | 1.99 | | | | 2.20 | | | | 1.42 | | | | (0.33 | )2 | | | 1.24 | 2 | | | 0.80 | 2 |
| | | | | | | | |
Net increase (decrease) from investment operations | | | 2.02 | | | | 2.26 | | | | 1.40 | | | | (0.41 | ) | | | 1.23 | | | | 0.81 | | | | 1.92 | | | | 2.15 | | | | 1.34 | | | | (0.40 | ) | | | 1.16 | | | | 0.76 | |
| | | | | | | | |
Net asset value, end of period | | $ | 14.29 | | | $ | 12.27 | | | $ | 10.01 | | | $ | 8.61 | | | $ | 9.02 | | | $ | 7.79 | | | $ | 13.73 | | | $ | 11.81 | | | $ | 9.66 | | | $ | 8.32 | | | $ | 8.72 | | | $ | 7.56 | |
| | | | | | | | |
| | | | | | | | | | | | | | | | | | | | | | | | | | | | | | | | | | | | | | | | | | | | | | | | |
| Total Investment Return3 | | | | | | | | | | | | | | | | | | | | | | | | | | | | | | | | | | | | | | | | | | | | | | | | |
Based on net asset value | | | 16.46 | %4 | | | 22.58 | % | | | 16.26 | % | | | (4.55 | )%5 | | | 15.79 | %5,6 | | | 11.60 | %5,7 | | | 16.26 | %4 | | | 22.26 | % | | | 16.11 | % | | | (4.59 | )%5 | | | 15.34 | %5,8 | | | 11.18 | %5,9 |
| | | | | | | | |
| | | | | | | | | | | | | | | | | | | | | | | | | | | | | | | | | | | | | | | | | | | | | | | | |
| Ratios to Average Net Assets | | | | | | | | | | | | | | | | | | | | | | | | | | | | | | | | | | | | | | | | | | | | | | | | |
Total expenses | | | 1.35 | %10 | | | 1.50 | % | | | 1.45 | % | | | 1.46 | % | | | 1.55 | % | | | 1.90 | % | | | 1.43 | %10 | | | 1.56 | % | | | 1.57 | % | | | 1.55 | % | | | 1.76 | % | | | 1.96 | % |
| | | | | | | | |
Total expenses excluding recoupment of past waived fees | | | 1.35 | %10 | | | 1.49 | % | | | 1.44 | % | | | 1.46 | % | | | 1.55 | % | | | 1.90 | % | | | 1.43 | %10 | | | 1.56 | % | | | 1.56 | % | | | 1.54 | % | | | 1.67 | % | | | 1.96 | % |
| | | | | | | | |
Total expenses after fees waived and/or reimbursed and paid indirectly | | | 1.29 | %10 | | | 1.36 | % | | | 1.39 | % | | | 1.39 | % | | | 1.39 | % | | | 1.36 | % | | | 1.43 | %10 | | | 1.56 | % | | | 1.57 | % | | | 1.53 | % | | | 1.74 | % | | | 1.75 | % |
| | | | | | | | |
Net investment loss | | | (0.95 | )%10 | | | (0.34 | )% | | | (0.63 | )% | | | (0.60 | )% | | | (0.59 | )% | | | (0.27 | )% | | | (1.09 | )%10 | | | (0.54 | )% | | | (0.81 | )% | | | (0.74 | )% | | | (0.94 | )% | | | (0.71 | )% |
| | | | | | | | |
| | | | | | | | | | | | | | | | | | | | | | | | | | | | | | | | | | | | | | | | | | | | | | | | |
| Supplemental Data | | | | | | | | | | | | | | | | | | | | | | | | | | | | | | | | | | | | | | | | | | | | | | | | |
Net assets, end of period (000) | | $ | 48,930 | | | $ | 36,218 | | | $ | 34,022 | | | $ | 33,982 | | | $ | 33,135 | | | $ | 27,013 | | | $ | 1,951 | | | $ | 869 | | | $ | 944 | | | $ | 851 | | | $ | 659 | | | $ | 193 | |
| | | | | | | | |
Portfolio turnover | | | 36 | % | | | 86 | % | | | 320 | % | | | 103 | % | | | 97 | % | | | 158 | % | | | 36 | % | | | 86 | % | | | 320 | % | | | 103 | % | | | 97 | % | | | 158 | % |
| | | | | | | | |
| | 1 | Based on average shares outstanding. |
| | 2 | Includes redemption fees, which are less than $0.005 per share. |
| | 3 | Where applicable, assumes the reinvestment of dividends and distributions. |
| | 4 | Aggregate total investment return. |
| | 5 | Redemption fee of 2.00% is reflected in total return calculations. There was no impact to the return. |
| | 6 | Includes proceeds received from a settlement of litigation, which impacted the Fund’s total return. Excluding these proceeds, the Fund’s total return would have been 15.53%. |
| | 7 | Includes proceeds received from a settlement of litigation, which impacted the Fund’s total return. Excluding these proceeds, the Fund’s total return would have been 9.03%. |
| | 8 | Includes proceeds received from a settlement of litigation, which impacted the Fund’s total return. Excluding these proceeds, the Fund’s total return would have been 15.08%. |
| | 9 | Includes proceeds received from a settlement of litigation, which impacted the Fund’s total return. Excluding these proceeds, the Fund’s total return would have been 8.53%. |
See Notes to Financial Statements.
| | | | | | |
| 56 | | BLACKROCK FUNDS | | MARCH 31, 2014 | | |
| | | | |
| Financial Highlights (continued) | | | BlackRock Science & Technology Opportunities Portfolio | |
| | | | | | | | | | | | | | | | | | | | | | | | | | | | | | | | | | | | | | | | | | | | | | | | |
| | | Investor A | | | Investor B | |
| | | Six Months
Ended
March 31,
2014
(Unaudited) | | | Year Ended September 30, | | | Six Months
Ended
March 31,
2014
(Unaudited) | | | Year Ended September 30, | |
| | | | 2013 | | | 2012 | | | 2011 | | | 2010 | | | 2009 | | | | 2013 | | | 2012 | | | 2011 | | | 2010 | | | 2009 | |
| Per Share Operating Performance | | | | | | | | | | | | | | | | | | | | | | | | | | | | | | | | | | | | | | | | | | | | | | | | |
Net asset value, beginning of period | | $ | 11.61 | | | $ | 9.51 | | | $ | 8.21 | | | $ | 8.62 | | | $ | 7.48 | | | $ | 6.73 | | | $ | 10.42 | | | $ | 8.60 | | | $ | 7.48 | | | $ | 7.93 | | | $ | 6.94 | | | $ | 6.30 | |
| | | | | | | | |
Net investment loss1 | | | (0.08 | ) | | | (0.06 | ) | | | (0.09 | ) | | | (0.09 | ) | | | (0.08 | ) | | | (0.04 | ) | | | (0.12 | ) | | | (0.13 | ) | | | (0.15 | ) | | | (0.16 | ) | | | (0.14 | ) | | | (0.08 | ) |
Net realized and unrealized gain (loss) | | | 1.97 | | | | 2.16 | | | | 1.39 | | | | (0.32 | )2 | | | 1.22 | 2 | | | 0.79 | 2 | | | 1.76 | | | | 1.95 | | | | 1.27 | | | | (0.29 | )2 | | | 1.13 | 2 | | | 0.72 | 2 |
| | | | | | | | |
Net increase (decrease) from investment operations | | | 1.89 | | | | 2.10 | | | | 1.30 | | | | (0.41 | ) | | | 1.14 | | | | 0.75 | | | | 1.64 | | | | 1.82 | | | | 1.12 | | | | (0.45 | ) | | | 0.99 | | | | 0.64 | |
| | | | | | | | |
Net asset value, end of period | | $ | 13.50 | | | $ | 11.61 | | | $ | 9.51 | | | $ | 8.21 | | | $ | 8.62 | | | $ | 7.48 | | | $ | 12.06 | | | $ | 10.42 | | | $ | 8.60 | | | $ | 7.48 | | | $ | 7.93 | | | $ | 6.94 | |
| | | | | | | | |
| | | | | | | | | | | | | | | | | | | | | | | | | | | | | | | | | | | | | | | | | | | | | | | | |
| Total Investment Return3 | | | | | | | | | | | | | | | | | | | | | | | | | | | | | | | | | | | | | | | | | | | | | | | | |
Based on net asset value | | | 16.28 | %4 | | | 22.08 | % | | | 15.84 | % | | | (4.76 | )%5 | | | 15.24 | %5,6 | | | 11.14 | %5,7 | | | 15.74 | %4 | | | 21.16 | % | | | 14.97 | % | | | (5.68 | )%5 | | | 14.27 | %5,8 | | | 10.16 | %5,9 |
| | | | | | | | |
| | | | | | | | | | | | | | | | | | | | | | | | | | | | | | | | | | | | | | | | | | | | | | | | |
| Ratios to Average Net Assets | | | | | | | | | | | | | | | | | | | | | | | | | | | | | | | | | | | | | | | | | | | | | | | | |
Total expenses | | | 1.63 | %10 | | | 1.72 | % | | | 1.72 | % | | | 1.79 | % | | | 1.82 | % | | | 2.24 | % | | | 2.43 | %10 | | | 2.50 | % | | | 2.52 | % | | | 2.67 | % | | | 2.70 | % | | | 3.13 | % |
| | | | | | | | |
Total expenses excluding recoupment of past waived fees | | | 1.60 | %10 | | | 1.72 | % | | | 1.70 | % | | | 1.71 | % | | | 1.81 | % | | | 2.24 | % | | | 2.43 | %10 | | | 2.50 | % | | | 2.52 | % | | | 2.44 | % | | | 2.65 | % | | | 3.00 | % |
| | | | | | | | |
Total expenses after fees waived and/or reimbursed and paid indirectly | | | 1.61 | %10 | | | 1.70 | % | | | 1.71 | % | | | 1.78 | % | | | 1.79 | % | | | 1.77 | % | | | 2.41 | %10 | | | 2.49 | % | | | 2.52 | % | | | 2.66 | % | | | 2.69 | % | | | 2.65 | % |
| | | | | | | | |
Net investment loss | | | (1.27 | )%10 | | | (0.67 | )% | | | (0.95 | )% | | | (0.98 | )% | | | (0.99 | )% | | | (0.68 | )% | | | (2.06 | )%10 | | | (1.47 | )% | | | (1.76 | )% | | | (1.87 | )% | | | (1.90 | )% | | | (1.53 | )% |
| | | | | | | | |
| | | | | | | | | | | | | | | | | | | | | | | | | | | | | | | | | | | | | | | | | | | | | | | | |
| Supplemental Data | | | | | | | | | | | | | | | | | | | | | | | | | | | | | | | | | | | | | | | | | | | | | | | | |
Net assets, end of period (000) | | $ | 134,023 | | | $ | 97,437 | | | $ | 106,466 | | | $ | 106,632 | | | $ | 105,577 | | | $ | 83,734 | | | $ | 2,297 | | | $ | 2,275 | | | $ | 2,645 | | | $ | 3,130 | | | $ | 4,390 | | | $ | 6,538 | |
| | | | | | | | |
Portfolio turnover | | | 36 | % | | | 86 | % | | | 320 | % | | | 103 | % | | | 97 | % | | | 158 | % | | | 36 | % | | | 86 | % | | | 320 | % | | | 103 | % | | | 97 | % | | | 158 | % |
| | | | | | | | |
| | 1 | Based on average shares outstanding. |
| | 2 | Includes redemption fees, which are less than $0.005 per share. |
| | 3 | Where applicable, excludes the effects of any sales charges and assumes the reinvestment of dividends and distributions. |
| | 4 | Aggregate total investment return. |
| | 5 | Redemption fee of 2.00% is reflected in total return calculations. There was no impact to the return. |
| | 6 | Includes proceeds received from a settlement of litigation, which impacted the Fund’s total return. Excluding these proceeds, the Fund’s total return would have been 14.97%. |
| | 7 | Includes proceeds received from a settlement of litigation, which impacted the Fund’s total return. Excluding these proceeds, the Fund’s total return would have been 8.47%. |
| | 8 | Includes proceeds received from a settlement of litigation, which impacted the Fund’s total return. Excluding these proceeds, the Fund’s total return would have been 13.98%. |
| | 9 | Includes proceeds received from a settlement of litigation, which impacted the Fund’s total return. Excluding these proceeds, the Fund’s total return would have been 7.30%. |
See Notes to Financial Statements.
| | | | | | |
| | | BLACKROCK FUNDS | | MARCH 31, 2014 | | 57 |
| | | | |
| Financial Highlights (concluded) | | | BlackRock Science & Technology Opportunities Portfolio | |
| | | | | | | | | | | | | | | | | | | | | | | | | | | | | | | | | | | | | | | | | | | | | | | | |
| | | Investor C | | | Class R | |
| | | Six Months Ended March 31, 2014 (Unaudited) | | | Year Ended September 30, | | | Six Months Ended March 31, 2014 (Unaudited) | | | Year Ended September 30, | |
| | | | 2013 | | | 2012 | | | 2011 | | | 2010 | | | 2009 | | | | 2013 | | | 2012 | | | 2011 | | | 2010 | | | 2009 | |
| Per Share Operating Performance | | | | | | | | | | | | | | | | | | | | | | | | | | | | | | | | | | | | | | | | | | | | | | | | |
Net asset value, beginning of period | | $ | 10.39 | | | $ | 8.58 | | | $ | 7.47 | | | $ | 7.92 | | | $ | 6.94 | | | $ | 6.29 | | | $ | 11.86 | | | $ | 9.74 | | | $ | 8.43 | | | $ | 8.88 | | | $ | 7.72 | | | $ | 6.97 | |
| | | | | | | | |
Net investment loss1 | | | (0.12 | ) | | | (0.14 | ) | | | (0.15 | ) | | | (0.16 | ) | | | (0.14 | ) | | | (0.09 | ) | | | (0.10 | ) | | | (0.09 | ) | | | (0.12 | ) | | | (0.12 | ) | | | (0.11 | ) | | | (0.06 | ) |
Net realized and unrealized gain (loss) | | | 1.76 | | | | 1.95 | | | | 1.26 | | | | (0.29 | )2 | | | 1.12 | 2 | | | 0.74 | 2 | | | 2.01 | | | | 2.21 | | | | 1.43 | | | | (0.33 | )2 | | | 1.27 | 2 | | | 0.81 | 2 |
| | | | | | | | |
Net increase (decrease) from investment operations | | | 1.64 | | | | 1.81 | | | | 1.11 | | | | (0.45 | ) | | | 0.98 | | | | 0.65 | | | | 1.91 | | | | 2.12 | | | | 1.31 | | | | (0.45 | ) | | | 1.16 | | | | 0.75 | |
Net asset value, end of period | | $ | 12.03 | | | $ | 10.39 | | | $ | 8.58 | | | $ | 7.47 | | | $ | 7.92 | | | $ | 6.94 | | | $ | 13.77 | | | $ | 11.86 | | | $ | 9.74 | | | $ | 8.43 | | | $ | 8.88 | | | $ | 7.72 | |
| | | | | | | | |
| | | | | | | | | | | | | | | | | | | | | | | | | | | | | | | | | | | | | | | | | | | | | | | | |
| Total Investment Return3 | | | | | | | | | | | | | | | | | | | | | | | | | | | | | | | | | | | | | | | | | | | | | | | | |
Based on net asset value | | | 15.78 | %4 | | | 21.10 | % | | | 14.86 | % | | | (5.68 | )%5 | | | 14.12 | %5,6 | | | 10.33 | %5,7 | | | 16.11 | %4 | | | 21.77 | % | | | 15.54 | % | | | (5.07 | )%5 | | | 15.03 | %5,8 | | | 10.76 | %5,9 |
| | | | | | | | |
| | | | | | | | | | | | | | | | | | | | | | | | | | | | | | | | | | | | | | | | | | | | | | | | |
| Ratios to Average Net Assets | | | | | | | | | | | | | | | | | | | | | | | | | | | | | | | | | | | | | | | | | | | | | | | | |
Total expenses | | | 2.45 | %10 | | | 2.58 | % | | | 2.60 | % | | | 2.68 | % | | | 2.73 | % | | | 3.23 | % | | | 1.89 | %10 | | | 1.97 | % | | | 2.00 | % | | | 2.00 | % | | | 2.10 | % | | | 2.42 | % |
| | | | | | | | |
Total expenses excluding recoupment of past waived fees | | | 2.43 | %10 | | | 2.58 | % | | | 2.59 | % | | | 2.59 | % | | | 2.73 | % | | | 3.23 | % | | | 1.86 | %10 | | | 1.97 | % | | | 1.99 | % | | | 2.00 | % | | | 2.10 | % | | | 2.42 | % |
| | | | | | | | |
Total expenses after fees waived and/or reimbursed and paid indirectly | | | 2.45 | %10 | | | 2.57 | % | | | 2.60 | % | | | 2.67 | % | | | 2.71 | % | | | 2.68 | % | | | 1.89 | %10 | | | 1.93 | % | | | 1.99 | % | | | 2.00 | % | | | 2.09 | % | | | 2.13 | % |
| | | | | | | | |
Net investment loss | | | (2.11 | )%10 | | | (1.56 | )% | | | (1.84 | )% | | | (1.88 | )% | | | (1.92 | )% | | | (1.59 | )% | | | (1.55 | )%10 | | | (0.92 | )% | | | (1.23 | )% | | | (1.21 | )% | | | (1.29 | )% | | | (1.04 | )% |
| | | | | | | | |
| | | | | | | | | | | | | | | | | | | | | | | | | | | | | | | | | | | | | | | | | | | | | | | | |
| Supplemental Data | | | | | | | | | | | | | | | | | | | | | | | | | | | | | | | | | | | | | | | | | | | | | | | | |
Net assets, end of
period (000) | | $ | 35,286 | | | $ | 28,234 | | | $ | 26,543 | | | $ | 27,651 | | | $ | 27,053 | | | $ | 22,575 | | | $ | 4,721 | | | $ | 4,555 | | | $ | 4,329 | | | $ | 3,518 | | | $ | 2,961 | | | $ | 1,904 | |
| | | | | | | | |
Portfolio turnover | | | 36 | % | | | 86 | % | | | 320 | % | | | 103 | % | | | 97 | % | | | 158 | % | | | 36 | % | | | 86 | % | | | 320 | % | | | 103 | % | | | 97 | % | | | 158 | % |
| | | | | | | | |
| | 1 | Based on average shares outstanding. |
| | 2 | Includes redemption fees, which are less than $0.005 per share. |
| | 3 | Where applicable, excludes the effects of any sales charges and assumes the reinvestment of dividends and distributions. |
| | 4 | Aggregate total investment return. |
| | 5 | Redemption fee of 2.00% is reflected in total return calculations. There was no impact to the return. |
| | 6 | Includes proceeds received from a settlement of litigation, which impacted the Fund’s total return. Excluding these proceeds, the Fund’s total return would have been 13.83%. |
| | 7 | Includes proceeds received from a settlement of litigation, which impacted the Fund’s total return. Excluding these proceeds, the Fund’s total return would have been 7.47%. |
| | 8 | Includes proceeds received from a settlement of litigation, which impacted the Fund’s total return. Excluding these proceeds, the Fund’s total return would have been 14.77%. |
| | 9 | Includes proceeds received from a settlement of litigation, which impacted the Fund’s total return. Excluding these proceeds, the Fund’s total return would have been 8.18%. |
See Notes to Financial Statements.
| | | | | | |
| 58 | | BLACKROCK FUNDS | | MARCH 31, 2014 | | |
| | | | |
| Financial Highlights | | | BlackRock U.S. Opportunities Portfolio | |
| | | | | | | | | | | | | | | | | | | | | | | | | | | | | | | | | | | | | | | | | | | | | | | | |
| | | Institutional | | | Service | |
| | | Six Months
Ended
March 31,
2014 (Unaudited) | | | Year Ended September 30, | | | Six Months
Ended
March 31,
2014 (Unaudited) | | | Year Ended September 30, | |
| | | | 2013 | | | 2012 | | | 2011 | | | 2010 | | | 2009 | | | | 2013 | | | 2012 | | | 2011 | | | 2010 | | | 2009 | |
| Per Share Operating Performance | | | | | | | | | | | | | | | | | | | | | | | | | | | | | | | | | | | | | | | | | |
Net asset value, beginning of period | | $ | 45.82 | | | $ | 36.42 | | | $ | 33.86 | | | $ | 36.94 | | | $ | 32.20 | | | $ | 31.69 | | | $ | 43.72 | | | $ | 34.71 | | | $ | 32.44 | | | $ | 35.40 | | | $ | 30.93 | | | $ | 30.58 | |
| | | | | | | | |
Net investment income (loss)1 | | | (0.05 | ) | | | 0.11 | | | | 0.19 | | | | 0.05 | | | | 0.04 | | | | 0.09 | | | | (0.13 | ) | | | (0.09 | ) | | | 0.02 | | | | (0.12 | ) | | | (0.11 | ) | | | (0.01 | ) |
Net realized and unrealized gain (loss) | | | 5.20 | | | | 10.41 | | | | 6.31 | | | | (2.44 | )2 | | | 4.77 | 2 | | | 0.42 | 2 | | | 4.94 | | | | 9.98 | | | | 6.03 | | | | (2.34 | )2 | | | 4.58 | 2 | | | 0.35 | 2 |
| | | | | | | | |
Net increase (decrease) from investment operations | | | 5.15 | | | | 10.52 | | | | 6.50 | | | | (2.39 | ) | | | 4.81 | | | | 0.51 | | | | 4.81 | | | | 9.89 | | | | 6.05 | | | | (2.46 | ) | | | 4.47 | | | | 0.34 | |
| | | | | | | | |
Dividends and distributions from: | | | | | | | | | | | | | | | | | | | | | | | | | | | | | | | | | | | | | | | | | | | | | | | | |
Net investment income | | | — | | | | (0.33 | )3 | | | — | | | | — | | | | (0.07 | )3 | | | (0.01 | )3 | | | — | | | | (0.09 | )3 | | | — | | | | — | | | | — | | | | — | |
Net realized gains | | | (9.33 | ) | | | (0.79 | )3 | | | (3.94 | )3 | | | (0.69 | )3 | | | — | | | | — | | | | (9.14 | ) | | | (0.79 | )3 | | | (3.78 | )3 | | | (0.50 | )3 | | | — | | | | — | |
| | | | | | | | |
Total dividends and distributions | | | (9.33 | ) | | | (1.12 | ) | | | (3.94 | ) | | | (0.69 | ) | | | (0.07 | ) | | | (0.01 | ) | | | (9.14 | ) | | | (0.88 | ) | | | (3.78 | ) | | | (0.50 | ) | | | — | | | | — | |
| | | | | | | | |
Redemption fees added to paid-in capital | | | — | | | | — | | | | — | | | | 0.00 | 4 | | | 0.00 | 4 | | | 0.01 | | | | — | | | | — | | | | — | | | | 0.00 | 4 | | | 0.00 | 4 | | | 0.01 | |
| | | | | | | | |
Net asset value, end of period | | $ | 41.64 | | | $ | 45.82 | | | $ | 36.42 | | | $ | 33.86 | | | $ | 36.94 | | | $ | 32.20 | | | $ | 39.39 | | | $ | 43.72 | | | $ | 34.71 | | | $ | 32.44 | | | $ | 35.40 | | | $ | 30.93 | |
| | | | | | | | |
| | | | | | | | | | | | | | | | | | | | | | | | | | | | | | | | | | | | | | | | | | | | | | | | |
| Total Investment Return5 | | | | | | | | | | | | | | | | | | | | | | | | | | | | | | | | | | | | | | | | | | | | | |
Based on net asset value | | | 12.84 | %6 | | | 29.79 | % | | | 20.40 | % | | | (6.75 | )%7 | | | 14.96 | %7,8 | | | 1.63 | %9 | | | 12.62 | %6 | | | 29.26 | % | | | 19.80 | % | | | (7.16 | )%7 | | | 14.45 | %7,8 | | | 1.14 | %9 |
| | | | | | | | |
| | | | | | | | | | | | | | | | | | | | | | | | | | | | | | | | | | | | | | | | | | | | | | | | |
| Ratios to Average Net Assets | | | | | | | | | | | | | | | | | | | | | | | | | | | | | | | | | | | | | | | | | |
Total expenses | | | 1.36 | %10 | | | 1.37 | % | | | 1.30 | % | | | 1.36 | % | | | 1.30 | % | | | 1.40 | % | | | 1.61 | %10 | | | 1.61 | % | | | 1.62 | % | | | 1.57 | % | | | 1.60 | % | | | 1.71 | % |
| | | | | | | | |
Total expenses excluding recoupment of past waived fees | | | 1.36 | %10 | | | 1.37 | % | | | 1.30 | % | | | 1.36 | % | | | 1.30 | % | | | 1.40 | % | | | 1.61 | %10 | | | 1.61 | % | | | 1.62 | % | | | 1.57 | % | | | 1.60 | % | | | 1.70 | % |
| | | | | | | | |
Total expenses after fees waived and/or reimbursed and paid indirectly | | | 0.96 | %10 | | | 1.01 | % | | | 1.03 | % | | | 1.03 | % | | | 1.03 | % | | | 1.01 | % | | | 1.36 | %10 | | | 1.45 | % | | | 1.51 | % | | | 1.46 | % | | | 1.48 | % | | | 1.49 | % |
| | | | | | | | |
Net investment income (loss) | | | (0.24 | )%10 | | | 0.28 | % | | | 0.52 | % | | | 0.12 | % | | | 0.13 | % | | | 0.36 | % | | | (0.64 | )%10 | | | (0.22 | )% | | | 0.05 | % | | | (0.30 | )% | | | (0.34 | )% | | | (0.06 | )% |
| | | | | | | | |
| | | | | | | | | | | | | | | | | | | | | | | | | | | | | | | | | | | | | | | | | | | | | | | | |
| Supplemental Data | | | | | | | | | | | | | | | | | | | | | | | | | | | | | | | | | | | | | | | | | | | | | | | | |
Net assets, end of
period (000) | | $ | 698,942 | | | $ | 676,540 | | | $ | 1,294,928 | | | $ | 1,905,254 | | | $ | 1,588,509 | | | $ | 890,264 | | | $ | 153,288 | | | $ | 155,414 | | | $ | 159,939 | | | $ | 183,604 | | | $ | 235,926 | | | $ | 191,318 | |
| | | | | | | | |
Portfolio turnover | | | 39 | % | | | 82 | % | | | 106 | % | | | 120 | % | | | 123 | % | | | 166 | % | | | 39 | % | | | 82 | % | | | 106 | % | | | 120 | % | | | 123 | % | | | 166 | % |
| | | | | | | | |
| | 1 | Based on average shares outstanding. |
| | 2 | Includes redemption fees, which are less than $0.005 per share. |
| | 3 | Determined in accordance with federal income tax regulations. |
| | 4 | Amount is less than $0.005 per share. |
| | 5 | Where applicable, assumes the reinvestment of dividends and distributions. |
| | 6 | Aggregate total investment return. |
| | 7 | Redemption fee of 2.00% is reflected in total return calculations. There was no impact to the return. |
| | 8 | Includes proceeds received from a settlement of litigation, which had no impact on the Fund’s total return. |
| | 9 | Redemption fee of 2.00% is reflected in total return calculations. The impact to the return from redemption fees received during the period was an increase of 0.03%. |
See Notes to Financial Statements.
| | | | | | |
| | | BLACKROCK FUNDS | | MARCH 31, 2014 | | 59 |
| | | | |
| Financial Highlights (continued) | | | BlackRock U.S. Opportunities Portfolio | |
| | | | | | | | | | | | | | | | | | | | | | | | | | | | | | | | | | | | | | | | | | | | | | | | |
| | | Investor A | | | Investor B | |
| | | Six Months
Ended March 31,
2014 (Unaudited) | | | Year Ended September 30, | | | Six Months
Ended
March 31,
2014 (Unaudited) | | | Year Ended September 30, | |
| | | | 2013 | | | 2012 | | | 2011 | | | 2010 | | | 2009 | | | | 2013 | | | 2012 | | | 2011 | | | 2010 | | | 2009 | |
| Per Share Operating Performance | | | | | | | | | | | | | | | | | | | | | | | | | | | | | | | | | | | | | | | | | | | | | |
Net asset value, beginning of period | | $ | 43.23 | | | $ | 34.30 | | | $ | 32.08 | | | $ | 35.02 | | | $ | 30.61 | | | $ | 30.29 | | | $ | 38.39 | | | $ | 30.72 | | | $ | 29.11 | | | $ | 31.96 | | | $ | 28.16 | | | $ | 28.06 | |
| | | | | | | | |
Net investment income (loss)1 | | | (0.13 | ) | | | (0.09 | ) | | | 0.01 | | | | (0.13 | ) | | | (0.12 | ) | | | (0.04 | ) | | | (0.25 | ) | | | (0.35 | ) | | | (0.23 | ) | | | (0.40 | ) | | | (0.35 | ) | | | (0.17 | ) |
Net realized and unrealized gain (loss) | | | 4.89 | | | | 9.86 | | | | 5.97 | | | | (2.31 | )2 | | | 4.53 | 2 | | | 0.35 | 2 | | | 4.26 | | | | 8.79 | | | | 5.39 | | | | (2.06 | )2 | | | 4.15 | 2 | | | 0.26 | 2 |
| | | | | | | | |
Net increase (decrease) from investment operations | | | 4.76 | | | | 9.77 | | | | 5.98 | | | | (2.44 | ) | | | 4.41 | | | | 0.31 | | | | 4.01 | | | | 8.44 | | | | 5.16 | | | | (2.46 | ) | | | 3.80 | | | | 0.09 | |
| | | | | | | | |
Dividends and distributions from: | | | | | | | | | | | | | | | | | | | | | | | | | | | | | | | | | | | | | | | | | | | | | | | | |
Net investment income | | | — | | | | (0.05 | )3 | | | — | | | | — | | | | — | | | | — | | | | — | | | | — | | | | — | | | | — | | | | — | | | | — | |
Net realized gains | | | (9.13 | ) | | | (0.79 | )3 | | | (3.76 | )3 | | | (0.50 | )3 | | | — | | | | — | | | | (8.85 | ) | | | (0.77 | )3 | | | (3.55 | )3 | | | (0.39 | )3 | | | — | | | | — | |
| | | | | | | | |
Total dividends and distributions | | | (9.13 | ) | | | (0.84 | ) | | | (3.76 | ) | | | (0.50 | ) | | | — | | | | — | | | | (8.85 | ) | | | (0.77 | ) | | | (3.55 | ) | | | (0.39 | ) | | | — | | | | — | |
| | | | | | | | |
Redemption fees added to paid-in capital | | | — | | | | — | | | | — | | | | 0.00 | 4 | | | 0.00 | 4 | | | 0.01 | | | | — | | | | — | | | | — | | | | 0.00 | 4 | | | 0.00 | 4 | | | 0.01 | |
| | | | | | | | |
Net asset value, end of period | | $ | 38.86 | | | $ | 43.23 | | | $ | 34.30 | | | $ | 32.08 | | | $ | 35.02 | | | $ | 30.61 | | | $ | 33.55 | | | $ | 38.39 | | | $ | 30.72 | | | $ | 29.11 | | | $ | 31.96 | | | $ | 28.16 | |
| | | | | | | | |
| | | | | | | | | | | | | | | | | | | | | | | | | | | | | | | | | | | | | | | | | | | | | | | | |
| Total Investment Return5 | | | | | | | | | | | | | | | | | | | | | | | | | | | | | | | | | | | | | | | | | | | | | | | | |
Based on net asset value | | | 12.64 | %6 | | | 29.19 | % | | | 19.82 | % | | | (7.19 | )%7 | | | 14.41 | %7,8 | | | 1.06 | %9 | | | 12.15 | %6 | | | 28.19 | % | | | 18.87 | % | | | (7.90 | )%7 | | | 13.49 | %7,8 | | | 0.36 | %9 |
| | | | | | | | |
| | | | | | | | | | | | | | | | | | | | | | | | | | | | | | | | | | | | | | | | | | | | | | | | |
| Ratios to Average Net Assets | | | | | | | | | | | | | | | | | | | | | | | | | | | | | | | | | | | | | | | | | | | | | | | | |
Total expenses | | | 1.62 | %10 | | | 1.63 | % | | | 1.62 | % | | | 1.59 | % | | | 1.64 | % | | | 1.76 | % | | | 2.39 | %10 | | | 2.43 | % | | | 2.42 | % | | | 2.39 | % | | | 2.44 | % | | | 2.59 | % |
| | | | | | | | |
Total expenses excluding recoupment of past waived fees | | | 1.62 | %10 | | | 1.63 | % | | | 1.62 | % | | | 1.59 | % | | | 1.64 | % | | | 1.75 | % | | | 2.39 | %10 | | | 2.42 | % | | | 2.42 | % | | | 2.37 | % | | | 2.44 | % | | | 2.59 | % |
| | | | | | | | |
Total expenses after fees waived and/or reimbursed and paid indirectly | | | 1.36 | %10 | | | 1.47 | % | | | 1.51 | % | | | 1.49 | % | | | 1.51 | % | | | 1.56 | % | | | 2.15 | %10 | | | 2.26 | % | | | 2.30 | % | | | 2.28 | % | | | 2.30 | % | | | 2.27 | % |
| | | | | | | | |
Net investment income (loss) | | | (0.64 | )%10 | | | (0.23 | )% | | | 0.03 | % | | | (0.34 | )% | | | (0.37 | )% | | | (0.15 | )% | | | (1.43 | )%10 | | | (1.04 | )% | | | (0.74 | )% | | | (1.12 | )% | | | (1.18 | )% | | | (0.77 | )% |
| | | | | | | | |
| | | | | | | | | | | | | | | | | | | | | | | | | | | | | | | | | | | | | | | | | | | | | | | | |
| Supplemental Data | | | | | | | | | | | | | | | | | | | | | | | | | | | | | | | | | | | | | | | | | | | | | | | | |
Net assets, end of
period (000) | | $ | 509,928 | | | $ | 512,224 | | | $ | 610,343 | | | $ | 888,293 | | | $ | 1,158,626 | | | $ | 855,127 | | | $ | 12,673 | | | $ | 13,107 | | | $ | 12,833 | | | $ | 15,047 | | | $ | 20,255 | | | $ | 21,849 | |
| | | | | | | | |
Portfolio turnover | | | 39 | % | | | 82 | % | | | 106 | % | | | 120 | % | | | 123 | % | | | 166 | % | | | 39 | % | | | 82 | % | | | 106 | % | | | 120 | % | | | 123 | % | | | 166 | % |
| | | | | | | | |
| | 1 | Based on average shares outstanding. |
| | 2 | Includes redemption fees, which are less than $0.005 per share. |
| | 3 | Determined in accordance with federal income tax regulations. |
| | 4 | Amount is less than $0.005 per share. |
| | 5 | Where applicable, excludes the effects of any sales charges and assumes the reinvestment of dividends and distributions. |
| | 6 | Aggregate total investment return. |
| | 7 | Redemption fee of 2.00% is reflected in total return calculations. There was no impact to the return. |
| | 8 | Includes proceeds received from a settlement of litigation, which had no impact on the Fund’s total return. |
| | 9 | Redemption fee of 2.00% is reflected in total return calculations. The impact to the return from redemption fees received during the period was an increase of 0.04%. |
See Notes to Financial Statements.
| | | | | | |
| 60 | | BLACKROCK FUNDS | | MARCH 31, 2014 | | |
| | | | |
| Financial Highlights (concluded) | | | BlackRock U.S. Opportunities Portfolio | |
| | | | | | | | | | | | | | | | | | | | | | | | |
| | | Investor C | |
| | | Six Months
Ended
March 31,
2014
(Unaudited) | | | Year Ended September 30, | |
| | | | 2013 | | | 2012 | | | 2011 | | | 2010 | | | 2009 | |
| Per Share Operating Performance | | | | | | | | | | | | | | | | | | | | | | | | |
Net asset value, beginning of period | | $ | 38.44 | | | $ | 30.75 | | | $ | 29.11 | | | $ | 31.95 | | | $ | 28.14 | | | $ | 28.04 | |
| | | | |
Net investment loss1 | | | (0.25 | ) | | | (0.33 | ) | | | (0.21 | ) | | | (0.38 | ) | | | (0.33 | ) | | | (0.19 | ) |
Net realized and unrealized gain (loss) | | | 4.28 | | | | 8.79 | | | | 5.39 | | | | (2.07 | )2 | | | 4.14 | 2 | | | 0.28 | 2 |
| | | | |
Net increase (decrease) from investment operations | | | 4.03 | | | | 8.46 | | | | 5.18 | | | | (2.45 | ) | | | 3.81 | | | | 0.09 | |
| | | | |
Distributions from net realized gains | | | (8.87 | ) | | | (0.77 | )3 | | | (3.54 | )3 | | | (0.39 | )3 | | | — | | | | — | |
| | | | |
Redemption fees added to paid-in capital | | | — | | | | — | | | | — | | | | 0.00 | 4 | | | 0.00 | 4 | | | 0.01 | |
| | | | |
Net asset value, end of period | | $ | 33.60 | | | $ | 38.44 | | | $ | 30.75 | | | $ | 29.11 | | | $ | 31.95 | | | $ | 28.14 | |
| | | | |
| | | | | | | | | | | | | | | | | | | | | | | | |
| Total Investment Return5 | | | | | | | | | | | | | | | | | | | | | | | | |
Based on net asset value | | | 12.20 | %6 | | | 28.22 | % | | | 18.94 | % | | | (7.87 | )%7 | | | 13.54 | %7,8 | | | 0.36 | %9 |
| | | | |
| | | | | | | | | | | | | | | | | | | | | | | | |
| Ratios to Average Net Assets | | | | | | | | | | | | | | | | | | | | | | | | |
Total expenses | | | 2.34 | %10 | | | 2.38 | % | | | 2.35 | % | | | 2.34 | % | | | 2.39 | % | | | 2.52 | % |
| | | | |
Total expenses excluding recoupment of past waived fees | | | 2.34 | %10 | | | 2.38 | % | | | 2.35 | % | | | 2.33 | % | | | 2.38 | % | | | 2.52 | % |
| | | | |
Total expenses after fees waived and/or reimbursed and paid indirectly | | | 2.12 | %10 | | | 2.22 | % | | | 2.25 | % | | | 2.24 | % | | | 2.27 | % | | | 2.28 | % |
| | | | |
Net investment loss | | | (1.40 | )%10 | | | (0.98 | )% | | | (0.69 | )% | | | (1.08 | )% | | | (1.12 | )% | | | (0.85 | )% |
| | | | |
| | | | | | | | | | | | | | | | | | | | | | | | |
| Supplemental Data | | | | | | | | | | | | | | | | | | | | | | | | |
Net assets, end of period (000) | | $ | 217,910 | | | $ | 212,162 | | | $ | 226,350 | | | $ | 282,586 | | | $ | 334,958 | | | $ | 238,819 | |
| | | | |
Portfolio turnover | | | 39 | % | | | 82 | % | | | 106 | % | | | 120 | % | | | 123 | % | | | 166 | % |
| | | | |
| | 1 | Based on average shares outstanding. |
| | 2 | Includes redemption fees, which are less than $0.005 per share. |
| | 3 | Determined in accordance with federal income tax regulations. |
| | 4 | Amount is less than $0.005 per share. |
| | 5 | Where applicable, excludes the effects of any sales charges and assumes the reinvestment of dividends and distributions. |
| | 6 | Aggregate total investment return. |
| | 7 | Redemption fee of 2.00% is reflected in total return calculations. There was no impact to the return. |
| | 8 | Includes proceeds received from a settlement of litigation, which had no impact on the Fund’s total return. |
| | 9 | Redemption fee of 2.00% is reflected in total return calculations. The impact to the return from redemption fees received during the period was an increase of 0.04%. |
See Notes to Financial Statements.
| | | | | | |
| | | BLACKROCK FUNDS | | MARCH 31, 2014 | | 61 |
| | |
| Notes to Financial Statements (Unaudited) | | |
1. Organization:
BlackRock FundsSM (the “Trust”) is registered under the Investment Company Act of 1940, as amended (the “1940 Act”), as an open-end management investment company. The Trust is organized as a Massa-chusetts business trust. BlackRock Global Opportunities Portfolio (“Global Opportunities”), BlackRock Health Sciences Opportunities Portfolio (“Health Sciences Opportunities”), BlackRock International Opportunities Portfolio (“International Opportunities”), BlackRock Science & Technology Opportunities Portfolio (“Science & Technology Opportunities”) and BlackRock U.S. Opportunities Portfolio (“U.S. Opportunities”) (collectively, the “Funds” or individually, a “Fund”) are each a series of the Trust. Each of the Funds, except Health Sciences Opportunities, is classified as diversified.
Each Fund offers multiple classes of shares. Institutional and Service Shares are sold without a sales charge and only to certain eligible investors. Investor A Shares are generally sold with an initial sales charge, but may be subject to a CDSC for certain redemptions where no initial sales charge was paid at the time of purchase. Investor B and Investor C Shares may be subject to a CDSC. Class R Shares are sold without a sales charge and only to certain employer-sponsored retirement plans. All classes of shares have identical voting, dividend, liquidation and other rights and are subject to the same terms and conditions, except that Service, Investor A, Investor B, Investor C and Class R Shares bear certain expenses related to the shareholder servicing of such shares, and Investor B, Investor C and Class R Shares also bear certain expenses related to the distribution of such shares. Investor B Shares automatically convert to Investor A Shares after approximately eight years. Investor B Shares are only available through exchanges and dividend reinvestments by existing shareholders and for purchase by certain employer-sponsored retirement plans. Each class has exclusive voting rights with respect to matters relating to its shareholder servicing and distribution expenditures (except that Investor B shareholders may vote on material changes to the Investor A distribution and service plan).
The Funds, together with certain other registered investment companies advised by the Manager or its affiliates, are included in a complex of open-end funds referred to as the Equity-Liquidity Complex.
2. Significant Accounting Policies:
The Funds’ financial statements are prepared in conformity with accounting principles generally accepted in the United States of America (“U.S. GAAP”), which may require management to make estimates and assumptions that affect the reported amounts of assets and liabilities in the financial statements and the reported amounts of increases and decreases in net assets from operations during the reporting period. Actual results could differ from those estimates. The following is a summary of significant accounting policies followed by the Funds:
Valuation: U.S. GAAP defines fair value as the price the Funds would receive to sell an asset or pay to transfer a liability in an orderly transaction between market participants at the measurement date. The Funds determine the fair values of their financial instruments at market value using independent dealers or pricing services under policies approved by the Board of Trustees of the Trust (the “Board”). The BlackRock Global Valuation Methodologies Committee (the “Global Valuation Committee”)
is the committee formed by management to develop global pricing policies and procedures and to provide oversight of the pricing function for the Funds for all financial instruments.
Equity investments traded on a recognized securities exchange or the NASDAQ Stock Market (“NASDAQ”) are valued at the last reported sale price that day or the NASDAQ official closing price, if applicable. For equity investments traded on more than one exchange, the last reported sale price on the exchange where the stock is primarily traded is used. Equity investments traded on a recognized exchange for which there were no sales on that day are valued at the last available bid (long positions) or ask (short positions) price. Investments in open-end registered investment companies are valued at NAV each business day.
Securities and other assets and liabilities denominated in foreign currencies are translated into U.S. dollars using exchange rates determined as of the close of business on the New York Stock Exchange (“NYSE”). Foreign currency exchange contracts are valued at the mean between the bid and ask prices and are determined as of the close of business on the NYSE. Interpolated values are derived when the settlement date of the contract is an interim date for which quotations are not available.
Exchange-traded options are valued at the mean between the last bid and ask prices at the close of the options market in which the options trade. An exchange-traded option for which there is no mean price is valued at the last bid (long positions) or ask (short positions) price. If no bid or ask price is available, the prior day’s price will be used, unless it is determined that the prior day’s price no longer reflects the fair value of the option. Over-the-counter (“OTC”) options are valued by an independent pricing service using a mathematical model, which incorporates a number of market data factors, such as the trades and prices of the underlying instruments.
The Funds value their investments in BlackRock Liquidity Series, LLC, Money Market Series (the “Money Market Series”) at fair value, which is ordinarily based upon their pro rata ownership in the underlying fund’s net assets. The Money Market Series seeks current income consistent with maintaining liquidity and preserving capital. Although the Money Market Series is not registered under the 1940 Act, its investments will follow the parameters of investments by a money market fund that is subject to Rule 2a-7 under the 1940 Act. Each Fund may withdraw up to 25% of its investment daily, although the manager of the Money Market Series, in its sole discretion, may permit an investor to withdraw more than 25% on any one day.
In the event that the application of these methods of valuation results in a price for an investment that is deemed not to be representative of the market value of such investment, or if a price is not available, the investment will be valued by the Global Valuation Committee, or its delegate, in accordance with a policy approved by the Board as reflecting fair value (“Fair Value Assets”). When determining the price for Fair Value Assets, the Global Valuation Committee, or its delegate, seeks to determine the price that each Fund might reasonably expect to receive from the current sale of that asset in an arm’s-length transaction. Fair value determinations shall be based upon all available factors that the Global Valuation Committee, or its delegate, deems relevant consistent with the
| | | | | | |
| 62 | | BLACKROCK FUNDS | | MARCH 31, 2014 | | |
| | |
| Notes to Financial Statements (continued) | | |
principles of fair value measurement, which include the market approach, income approach and/or in the case of recent investments, the cost approach, as appropriate. The market approach generally consists of using comparable market transactions. The income approach generally is used to discount future cash flows to present value and is adjusted for liquidity as appropriate. These factors include but are not limited to: (i) attributes specific to the investment or asset; (ii) the principal market for the investment or asset; (iii) the customary participants in the principal market for the investment or asset; (iv) data assumptions by market participants for the investment or asset, if reasonably available; (v) quoted prices for similar investments or assets in active markets; and (vi) other factors, such as future cash flows, interest rates, yield curves, volatilities, prepayment speeds, loss severities, credit risks, recovery rates, liquidation amounts and/or default rates. Due to the inherent uncertainty of valuations of such investments, the fair values may differ from the values that would have been used had an active market existed. The Global Valuation Committee, or its delegate, employs various methods for calibrating valuation approaches for investments where an active market does not exist, including regular due diligence of the Funds’ pricing vendors, regular reviews of key inputs and assumptions, transactional back-testing or disposition analysis to compare unrealized gains and losses to realized gains and losses, reviews of missing or stale prices and large movements in market values and reviews of any market related activity. The pricing of all Fair Value Assets is subsequently reported to the Board or a committee thereof on a quarterly basis.
Generally, trading in foreign instruments is substantially completed each day at various times prior to the close of business on the NYSE. Occasionally, events affecting the values of such instruments may occur between the foreign market close and the close of business on the NYSE that may not be reflected in the computation of each Fund’s net assets. If events (e.g., a company announcement, market volatility or a natural disaster) occur during such periods that are expected to materially affect the value of such instruments, those instruments may be Fair Value Assets and valued at their fair value, as determined in good faith by the Global Valuation Committee, or its delegate, using a pricing service and/or policies approved by the Board. Each business day, the Funds use a pricing service to assist with the valuation of certain foreign exchange-traded equity securities and foreign exchange-traded and OTC options (the “Systematic Fair Value Price”). Using current market factors, the Systematic Fair Value Price is designed to value such foreign securities and foreign options at fair value as of the close of business on the NYSE, which follows the close of the local markets.
Foreign Currency: The Funds’ books and records are maintained in U.S. dollars. Purchases and sales of investment securities are recorded at the rates of exchange prevailing on the respective date of such transactions. Generally, when the U.S. dollar rises in value against a foreign currency, the Funds’ investments denominated in that currency will lose value because that currency is worth fewer U.S. dollars; the opposite effect occurs if the U.S. dollar falls in relative value.
The Funds do not isolate the portion of the results of operations arising as a result of changes in the foreign exchange rates from the changes in the market prices of investments held or sold for financial reporting purposes. Accordingly, the effects of changes in foreign currency exchange
rates on investments are not segregated in the Statements of Operations from the effects of changes in market prices of those investments but are included as a component of net realized and unrealized gain (loss) from investments. The Funds report realized currency gains (losses) on foreign currency related transactions as components of net realized gain (loss) for financial reporting purposes, whereas such components are generally treated as ordinary income for federal income tax purposes.
Segregation and Collateralization: In cases where a Fund enters into certain investments (e.g., forward foreign currency exchange contracts and options written), that would be “senior securities” for 1940 Act purposes, such Fund may segregate or designate on its books and records cash or liquid securities having a market value at least equal to the amount of a Fund’s future obligations under such investments. Doing so allows the investment to be excluded from treatment as a “senior security.” Furthermore, if required by an exchange or counterparty agreement, each Fund may be required to deliver/deposit cash and/or securities to/with an exchange, or broker-dealer or custodian as collateral for certain investments or obligations.
Investment Transactions and Investment Income: For financial reporting purposes, investment transactions are recorded on the dates the transactions are entered into (the trade dates). Realized gains and losses on investment transactions are determined on the identified cost basis. Dividend income is recorded on the ex-dividend date. Dividends from foreign securities where the ex-dividend date may have passed are subsequently recorded when the Funds are informed of the ex-dividend date. Under the applicable foreign tax laws, a withholding tax at various rates may be imposed on capital gains, dividends and interest. Upon notification from issuers, some of the dividend income received from a real estate investment trust may be redesignated as a reduction of cost of the related investment and/or realized gain. Income, expenses and realized and unrealized gains and losses are allocated daily to each class based on its relative net assets.
Dividends and Distributions: Dividends and distributions paid by the Funds are recorded on the ex-dividend dates. The character and timing of dividends and distributions are determined in accordance with federal income tax regulations, which may differ from U.S. GAAP.
Income Taxes: It is the Funds’ policy to comply with the requirements of the Internal Revenue Code of 1986, as amended, applicable to regulated investment companies, and to distribute substantially all of their taxable income to their shareholders. Therefore, no federal income tax provision is required.
The Funds file U.S. federal and various state and local tax returns. No income tax returns are currently under examination. The statute of limitations on the Funds’ U.S. federal tax returns remain open for each of the four years ended September 30, 2013. The statutes of limitations on each Fund’s state and local tax returns may remain open for an additional year depending upon the jurisdiction.
Management has analyzed tax laws and regulations and their application to the Funds’ facts and circumstances and does not believe there are any uncertain tax positions that require recognition of a tax liability.
| | | | | | |
| | | BLACKROCK FUNDS | | MARCH 31, 2014 | | 63 |
| | |
| Notes to Financial Statements (continued) | | |
Other: Expenses directly related to a Fund or its classes are charged to that Fund or class. Other operating expenses shared by several funds are pro rated among those funds on the basis of relative net assets or other appropriate methods. Expenses directly related to the Funds and other shared expenses pro rated to the Funds are allocated daily to each class based on its relative net assets or other appropriate methods.
The Funds have an arrangement with the custodian whereby fees may be reduced by credits earned on uninvested cash balances, which, if applicable, are shown as fees paid indirectly in the Statements of Operations. The custodian imposes fees on overdrawn cash balances, which can be offset by accumulated credits earned or may result in additional custody charges.
3. Securities and Other Investments:
Securities Lending: Each Fund may lend its securities to approved borrowers, such as brokers, dealers and other financial institutions. The borrower pledges collateral consisting of cash, an irrevocable letter of credit issued by a bank, or securities issued or guaranteed by the U.S. government. The initial collateral received by each Fund is required to have a value of at least 102% of the current value of the loaned securities for securities traded on U.S. exchanges and a value of at least 105% for all other securities. The collateral is maintained thereafter, at a value equal to at least 100% of the current market value of the securities on loan. The market value of the loaned securities is determined at the close of each business day of the Fund and any additional required collateral is delivered to the Fund on the next business day. During the term of the loan, each Fund earns dividend or interest income on the securities loaned but does not receive interest income on the securities received as collateral. Loans of securities are terminable at any time and the borrower, after notice, is required to return borrowed securities within the standard time period for settlement of securities transactions.
The market value of securities on loan and the value of the related collateral are shown separately in the Statements of Assets and Liabilities as a component of investments at value, and collateral on securities loaned at value, respectively. As of March 31, 2014, any securities on loan were collateralized by cash. The cash collateral invested by the securities lending agent, BlackRock Investment Management, LLC (“BIM”), if any, is disclosed in the Schedules of Investments.
Securities lending transactions are entered into by the Funds under Master Securities Lending Agreements (each, an “MSLA”) which provide the right, in the event of default (including bankruptcy or insolvency), for the non-defaulting party to liquidate the collateral and calculate a net exposure to the defaulting party or request additional collateral. In the event that a borrower defaults, each Fund, as lender, would offset the market value of the collateral received against the market value of the securities loaned. The value of the collateral is typically greater than that of the market value of the securities loaned, leaving the lender with a net amount payable to the defaulting party. However, bankruptcy or insolvency laws of a particular jurisdiction may impose restrictions on or prohibitions against such a right of offset in the event of an MSLA counterparty’s bankruptcy or insolvency. Under the MSLA, the borrower
can resell or re-pledge the loaned securities, and the Funds can reinvest cash collateral, or, upon an event of default, resell or re-pledge the collateral.
The following tables are a summary of the Funds’ securities lending agreements by counterparty which are subject to offset under an MSLA as of March 31, 2014:
| | | | | | | | | | | | |
| Global Opportunities | | | | | | | |
| Counterparty | | Securities Loaned
at Value | | | Cash Collateral
Received1 | | | Net
Amount | |
Barclays Capital, Inc. | | $ | 335,720 | | | $ | (335,720 | ) | | | — | |
Credit Suisse Securities (USA) LLC | | | 2,924,893 | | | | (2,924,893 | ) | | | — | |
Deutsche Bank Securities, Inc. | | | 1,736,801 | | | | (1,736,801 | ) | | | — | |
JP Morgan Clearing Corp. | | | 227,716 | | | | (227,716 | ) | | | — | |
Merrill Lynch, Pierce, Fenner & Smith, Inc. | | | 326,271 | | | | (326,271 | ) | | | — | |
Morgan Stanley & Co. LLC | | | 910,865 | | | | (910,865 | ) | | | — | |
UBS Securities LLC | | | 662,913 | | | | (662,913 | ) | | | — | |
| | | | |
Total | | $ | 7,125,179 | | | $ | (7,125,179 | ) | | | — | |
| | | | |
| | | | | | | | | | | | |
| Health Sciences Opportunities | | | | | | | |
| Counterparty | | Securities Loaned
at Value | | | Cash Collateral
Received1 | | | Net
Amount2 | |
Citigroup Global Markets, Inc. | | $ | 283,502 | | | $ | (283,502 | ) | | | — | |
Credit Suisse Securities (USA) LLC | | | 17,776,102 | | | | (17,776,102 | ) | | | — | |
Goldman Sachs & Co. | | | 12,178,493 | | | | (12,043,550 | ) | | $ | 134,943 | |
JP Morgan Clearing Corp. | | | 1,543,794 | | | | (1,526,350 | ) | | | 17,444 | |
Merrill Lynch, Pierce, Fenner & Smith, Inc. | | | 430,978 | | | | (430,978 | ) | | | — | |
Morgan Stanley & Co. LLC | | | 25,120,049 | | | | (24,977,051 | ) | | | 142,998 | |
UBS Securities LLC | | | 86,250 | | | | (86,250 | ) | | | — | |
| | | | |
Total | | $ | 57,419,168 | | | $ | (57,123,783 | ) | | $ | 295,385 | |
| | | | |
| | | | | | | | | | | | |
| International Opportunities | | | | | | | |
| Counterparty | | Securities Loaned
at Value | | | Cash Collateral
Received1 | | | Net
Amount | |
Credit Suisse Securities (USA) LLC | | $ | 22,913,813 | | | $ | (22,913,813 | ) | | | — | |
Deutsche Bank Securities, Inc. | | | 1,812,889 | | | | (1,812,889 | ) | | | — | |
JP Morgan Clearing Corp. | | | 492,754 | | | | (492,754 | ) | | | — | |
Merrill Lynch, Pierce, Fenner & Smith, Inc. | | | 3,017,644 | | | | (3,017,644 | ) | | | — | |
Morgan Stanley & Co. LLC | | | 6,831,485 | | | | (6,831,485 | ) | | | — | |
UBS Securities LLC | | | 18,224,864 | | | | (18,224,864 | ) | | | — | |
| | | | |
Total | | $ | 53,293,449 | | | $ | (53,293,449 | ) | | | — | |
| | | | |
| | | | | | | | | | | | |
| Science & Technology Opportunities | | | | |
| Counterparty | | Securities Loaned
at Value | | | Cash Collateral
Received1 | | | Net
Amount | |
Barclays Capital, Inc. | | $ | 2,013,590 | | | $ | (2,013,590 | ) | | | — | |
Citigroup Global Markets, Inc. | | | 246,377 | | | | (246,377 | ) | | | — | |
Deutsche Bank Securities, Inc. | | | 605,251 | | | | (605,251 | ) | | | — | |
Goldman Sachs & Co. | | | 795,714 | | | | (795,714 | ) | | | — | |
Merrill Lynch, Pierce, Fenner & Smith, Inc. | | | 7,092 | | | | (7,092 | ) | | | — | |
| | | | |
Total | | $ | 3,668,024 | | | $ | (3,668,024 | ) | | | — | |
| | | | |
| | 1 | Collateral with a value of $7,540,083, $57,299,570, $56,773,283 and $3,760,146 has been received in connection with securities lending agreements for Global Opportunities, Health Sciences Opportunities, International Opportunities and Science & Technology Opportunities, respectively. Excess of collateral received from the individual counterparty is not shown for financial reporting purposes. |
| | 2 | The market value of the loaned securities is determined as of March 31, 2014. Additional collateral is delivered to Health Sciences Opportunities on the next business day in accordance with the MSLA. The net amount would be subject to the borrower default indemnity in the event of default by the counterparty. |
| | | | | | |
| 64 | | BLACKROCK FUNDS | | MARCH 31, 2014 | | |
| | |
| Notes to Financial Statements (continued) | | |
| | | | | | | | | | | | |
| U.S. Opportunities | | | | | | | | | |
| Counterparty | | Securities Loaned
at Value | | | Cash Collateral
Received1 | | | Net Amount2 | |
Barclays Capital, Inc. | | $ | 2,838,746 | | | $ | (2,838,746 | ) | | | — | |
Credit Suisse Securities (USA) LLC | | | 3,018,600 | | | | (2,990,000 | ) | | $ | 28,600 | |
Deutsche Bank Securities, Inc. | | | 4,472,667 | | | | (4,472,667 | ) | | | — | |
Goldman Sachs & Co. | | | 16,649,053 | | | | (16,250,760 | ) | | | 398,293 | |
Merrill Lynch, Pierce, Fenner & Smith, Inc. | | | 289,368 | | | | (289,368 | ) | | | — | |
Morgan Stanley & Co. LLC | | | 214,400 | | | | (214,400 | ) | | | — | |
| | | | |
Total | | $ | 27,482,834 | | | $ | (27,055,941 | ) | | $ | 426,893 | |
| | | | |
| 1 | Collateral with a value of $27,404,520 has been received in connection with securities lending agreements. Excess of collateral received from the individual counterparty is not shown for financial reporting purposes. |
| 2 | The market value of the loaned securities is determined as of March 31, 2014. Additional collateral is delivered to U.S. Opportunities on the next business day in accordance with the MSLA. The net amount would be subject to the borrower default indemnity in the event of default by the counterparty. |
The risks of securities lending include the risk that the borrower may not provide additional collateral when required or may not return the securities when due. To mitigate these risks, the Funds benefit from a borrower default indemnity provided by BIM. BIM’s indemnity allows for full replacement of the securities lent. Each Fund could suffer a loss if the value of an investment purchased with cash collateral falls below the market value of loaned securities or if the value of an investment purchased with cash collateral falls below the value of the original cash collateral received.
4. Derivative Financial Instruments:
The Funds engage in various portfolio investment strategies using derivative contracts both to increase the returns of the Funds and/or to economically hedge their exposure to certain risks such as equity risk or foreign currency exchange rate risk. These contracts may be transacted on an exchange or OTC.
Forward Foreign Currency Exchange Contracts: Certain Funds enter into forward foreign currency exchange contracts as an economic hedge against either specific transactions or portfolio instruments or to obtain exposure to, or hedge exposure away from, foreign currencies (foreign currency exchange rate risk). A forward foreign currency exchange contract is an agreement between two parties to buy and sell a currency at a set exchange rate on a future date. Forward foreign currency exchange contracts, when used by the Funds, help to manage the overall
exposure to the currencies in which some of the investments held by the Funds are denominated. The contract is marked-to-market daily and the change in market value is recorded by the Funds as an unrealized gain or loss. When the contract is closed, the Funds record a realized gain or loss equal to the difference between the value at the time it was opened and the value at the time it was closed. The use of forward foreign currency exchange contracts involves the risk that the value of a foreign currency exchange contract changes unfavorably due to movements in the value of the referenced foreign currencies.
Options: Certain Funds purchase and write call and put options to increase or decrease their exposure to underlying instruments (including equity risk) and/or, in the case of options written, to generate gains from options premiums. A call option gives the purchaser (holder) of the option the right (but not the obligation) to buy, and obligates the seller (writer) to sell (when the option is exercised), the underlying instrument at the exercise or strike price at any time or at a specified time during the option period. A put option gives the holder the right to sell and obligates the writer to buy the underlying instrument at the exercise or strike price at any time or at a specified time during the option period. When a Fund purchases (writes) an option, an amount equal to the premium paid (received) by a Fund is reflected as an asset (liability). The amount of the asset (liability) is subsequently marked-to-market to reflect the current market value of the option purchased (written). When an instrument is purchased or sold through an exercise of an option, the related premium paid (or received) is added to (or deducted from) the basis of the instrument acquired or deducted from (or added to) the proceeds of the instrument sold. When an option expires (or a Fund enters into a closing transaction), a Fund realizes a gain or loss on the option to the extent of the premiums received or paid (or gain or loss to the extent the cost of the closing transaction exceeds the premiums received or paid). When a Fund writes a call option, such option is “covered,” meaning that a Fund holds the underlying instrument subject to being called by the option counterparty. When a Fund writes a put option, such option is covered by cash in an amount sufficient to cover the obligation.
In purchasing and writing options, a Fund bears the risk of an unfavorable change in the value of the underlying instrument or the risk that a Fund may not be able to enter into a closing transaction due to an illiquid market. Exercise of a written option could result in a Fund purchasing or selling a security when it otherwise would not, or at a price different from the current market value.
| | | | | | |
| | | BLACKROCK FUNDS | | MARCH 31, 2014 | | 65 |
| | |
| Notes to Financial Statements (continued) | | |
The following is a summary of the Funds’ derivative financial instruments categorized by risk exposure:
| | | | | | | | | | | | | | | | | | |
| Fair Values of Derivative Financial Instruments as of March 31, 2014 | |
| | | Derivative Assets | |
| | | | | Global
Opportunities | | | Health Sciences
Opportunities | | | International
Opportunities | | | Science & Technology
Opportunities | |
| | | Statements of Assets
and Liabilities Location | | Value | |
Foreign currency exchange contracts | | Unrealized appreciation on
foreign currency exchange contracts | | $ | 484,367 | | | $ | 28,300 | | | $ | 3,039,176 | | | $ | 5,624 | |
| |
| | | Derivative Liabilities | |
| | | | | Global
Opportunities | | | Health Sciences
Opportunities | | | International
Opportunities | | | Science & Technology
Opportunities | |
| | | Statements of Assets and Liabilities Location | | Value | |
Foreign currency exchange contracts | | Unrealized depreciation on
foreign currency exchange contracts | | $ | 1,454,522 | | | $ | 4,530,290 | | | $ | 10,945,081 | | | $ | 344,544 | |
| |
| | | | |
The Effect of Derivative Financial Instruments in the Statements of Operations
Six Months Ended March 31, 2014 |
| | | | | | | | | | | | | | | | |
| | | Net Realized Gain (Loss) From | |
| | | Global
Opportunities | | | Health Sciences
Opportunities | | | International
Opportunities | | | Science & Technology
Opportunities | |
Foreign currency exchange contracts: | | | | | | | | | | | | | | | | |
Foreign currency transactions | | $ | (780,633 | ) | | $ | (12,472,049 | ) | | $ | (22,106,257 | ) | | $ | (329,494 | ) |
Equity contracts: | | | | | | | | | | | | | | | | |
Options | | | — | | | | 1,609,622 | | | | — | | | | — | |
| | | | |
Total | | $ | (780,633 | ) | | $ | (10,862,427 | ) | | $ | (22,106,257 | ) | | $ | (329,494 | ) |
| | | | |
| | | | |
| | | | | | | | | | | | | | | | | |
| | | Net Change in Unrealized Appreciation/Depreciation on | |
| | | Global
Opportunities | | | Health Sciences
Opportunities | | | International
Opportunities | | | Science & Technology
Opportunities | |
Foreign currency exchange contracts: | | | | | | | | | | | | | | | | |
Foreign currency translations | | $ | 779,320 | | | $ | 9,222,553 | | | $ | 17,366,394 | | | $ | 24,708 | |
| | | | | | | | | | | | | | | | |
For the six months ended March 31, 2014, the average quarterly balances of outstanding derivative financial instruments were as follows: | |
| | | Global
Opportunities | | | Health Sciences
Opportunities | | | International
Opportunities | | | Science & Technology
Opportunities | |
Foreign currency exchange contracts: | | | | | | | | | | | | | | | | |
Average number of contracts - USD purchased | | | 36 | | | | 12 | | | | 55 | | | | 25 | |
Average number of contracts - USD sold | | | 45 | | | | 3 | | | | 37 | | | | 2 | |
Average USD amounts purchased | | $ | 95,908,499 | | | $ | 202,062,405 | | | $ | 795,173,442 | | | $ | 22,529,628 | |
Average USD amounts sold | | $ | 52,117,381 | | | $ | 35,448,419 | | | $ | 354,990,746 | | | $ | 3,936,944 | |
Options: | | | | | | | | | | | | | | | | |
Average number of option contracts written | | | — | | | | 619 | | | | — | | | | — | |
Average notional value of option contracts written | | | — | | | $ | 4,174,875 | | | | — | | | | — | |
Counterparty Credit Risk: A derivative contract may suffer a mark-to-market loss if the value of the contract decreases due to an unfavorable change in the market rates or values of the underlying instrument. Losses can also occur if the counterparty does not perform under the contract.
A Fund’s risk of loss from counterparty credit risk on OTC derivatives is generally limited to the aggregate unrealized gain netted against any collateral held by such Fund. For OTC options purchased, each Fund bears the risk of loss of the amount of the premiums paid plus the positive change in market values net of any collateral held by such Fund should the counterparty fail to perform under the contracts. Options written by the Funds do not typically give rise to counterparty credit risk, as options written generally obligate the Funds, and not the counterparty, to perform.
With exchange-traded purchased options, there is less counterparty credit risk to the Funds since the exchange or clearinghouse, as counterparty to such instruments, guarantees against a possible default. The clearinghouse stands between the buyer and the seller of the contract; therefore, credit risk is limited to failure of the clearinghouse. While offset rights may exist under applicable law, the Funds do not have a contractual right of offset against a clearing broker or clearinghouse in the event of a default (including the bankruptcy or insolvency) of the clearing broker or clearinghouse. While clearing brokers are required to segregate customer margin from their own assets, in the event that a clearing broker becomes insolvent or goes
| | | | | | |
| 66 | | BLACKROCK FUNDS | | MARCH 31, 2014 | | |
| | |
| Notes to Financial Statements (continued) | | |
into bankruptcy and at that time there is a shortfall in the aggregate amount of margin held by the clearing broker for all its clients, typically the shortfall would be allocated on a pro rata basis across all the clearing broker’s customers, potentially resulting in losses to the Funds.
In order to better define its contractual rights and to secure rights that will help the Funds mitigate their counterparty risk, a Fund may enter into an International Swaps and Derivatives Association, Inc. Master Agreement (“ISDA Master Agreement”) or similar agreement with its derivative contract counterparties. An ISDA Master Agreement is a bilateral agreement between each Fund and a counterparty that governs certain OTC derivatives and typically contains, among other things, collateral posting terms and netting provisions in the event of a default and/or termination event. Under an ISDA Master Agreement, each Fund may, under certain circumstances, offset with the counterparty certain derivative financial instruments’ payables and/or receivables with collateral held and/or posted and create one single net payment. The provisions of the ISDA Master Agreement typically permit a single net payment in the event of default including the bankruptcy or insolvency of the counterparty. Bankruptcy or insolvency laws of a particular jurisdiction may impose restrictions on or prohibitions against the right of offset in bankruptcy, insolvency or other events. In addition, certain ISDA Master Agreements allow counterparties to OTC derivatives to terminate derivative contracts prior to maturity in the event a Fund’s net assets decline by a stated percentage or a Fund fails to meet the terms of its ISDA Master Agreements, which would cause a Fund to accelerate payment of any net liability owed to the counterparty.
Collateral Requirements: For derivatives traded under an ISDA Master Agreement, the collateral requirements are typically calculated by netting the mark-to-market amount for each transaction under such agreement and comparing that amount to the value of any collateral currently pledged by a Fund and the counterparty.
Cash collateral that has been pledged to cover obligations of a Fund and cash collateral received from the counterparty, if any, is reported separately on the Statements of Assets and Liabilities as cash pledged as collateral and cash received as collateral, respectively. Non-cash collateral pledged by a Fund, if any, is noted in the Schedules of Investments. Generally, the amount of collateral due from or to a party has to exceed a minimum transfer amount threshold (typically either $250,000 or $500,000) before a transfer is required, which is determined at the close of business of each Fund and any additional required collateral is delivered to/pledged by each Fund on the next business day. Typically, the Funds and counterparties are not permitted to sell, re-pledge or use the collateral they receive. To the extent amounts due to a Fund from its counterparties are not fully collateralized, contractually or otherwise, each Fund bears the risk of loss from counterparty non-performance. Each Fund attempts to mitigate counterparty risk by entering into agreements only with counterparties that it believes have the financial resources to honor their obligations and by monitoring the financial stability of those counterparties.
For financial reporting purposes, the Funds do not offset derivative assets and derivative liabilities that are subject to netting arrangements, if any, in the Statements of Assets and Liabilities.
At March 31, 2014, the Funds’ derivative assets and liabilities (by type) are as follows:
| | | | | | | | |
| Global Opportunities | | Assets | | | Liabilities | |
Derivative Financial Instruments: | | | | | | | | |
Forward foreign currency exchange contracts | | $ | 484,367 | | | $ | 1,454,522 | |
| | | | |
Total derivative assets and liabilities subject to a Master Netting Agreement (“MNA”) | | $ | 484,367 | | | $ | 1,454,522 | |
| | | | |
| | | | | | | | |
| Health Sciences Opportunities | | | | | | |
Derivative Financial Instruments: | | | | | | | | |
Forward foreign currency exchange contracts | | $ | 28,300 | | | $ | 4,530,290 | |
| | | | |
Total derivative assets and liabilities subject to an MNA | | $ | 28,300 | | | $ | 4,530,290 | |
| | | | |
| | | | | | | | |
| International Opportunities | | | | | | |
Derivative Financial Instruments: | | | | | | | | |
Forward foreign currency exchange contracts | | $ | 3,039,176 | | | $ | 10,945,081 | |
| | | | |
Total derivative assets and liabilities subject to an MNA | | $ | 3,039,176 | | | $ | 10,945,081 | |
| | | | |
| | | | | | | | |
| Science & Technology Opportunities | | | | | | |
Derivative Financial Instruments: | | | | | | | | |
Forward foreign currency exchange contracts | | $ | 5,624 | | | $ | 344,544 | |
| | | | |
Total derivative assets and liabilities subject to an MNA | | $ | 5,624 | | | $ | 344,544 | |
| | | | |
| | | | | | |
| | | BLACKROCK FUNDS | | MARCH 31, 2014 | | 67 |
| | |
| Notes to Financial Statements (continued) | | |
The following tables present the Funds’ derivative assets and liabilities by counterparty net of amounts available for offset under an MNA and net of the related collateral received and pledged by the Funds as of March 31, 2014:
| | | | | | | | | | | | | | | | | | | | |
| Global Opportunities | | | | | | | | | | | | | | | |
| Counterparty | | Derivative Assets
Subject to an MNA
by Counterparty | | | Derivatives
Available
for Offset1 | | | Non-cash
Collateral
Received | | | Cash
Collateral
Received | | | Net Amount of
Derivative Assets2 | |
Bank of America N.A. | | $ | 17,013 | | | $ | (17,013) | | | | — | | | | — | | | | — | |
The Bank of New York Mellon | | | 998 | | | | (998 | ) | | | — | | | | — | | | | — | |
Barclays Bank PLC | | | 46,453 | | | | (24,745 | ) | | | — | | | | — | | | $ | 21,708 | |
BNP Paribas S.A. | | | 13,098 | | | | (13,098 | ) | | | | | | | | | | | | |
Citibank N.A. | | | 105,287 | | | | (34,173 | ) | | | — | | | | — | | | | 71,114 | |
Credit Suisse International | | | 86,503 | | | | (7,074 | ) | | | — | | | | — | | | | 79,429 | |
Deutsche Bank AG | | | 23,654 | | | | (23,654 | ) | | | — | | | | — | | | | — | |
Goldman Sachs Bank USA | | | 95,194 | | | | (3,845 | ) | | | — | | | | — | | | | 91,349 | |
Goldman Sachs International | | | 8,808 | | | | (8,808 | ) | | | — | | | | — | | | | — | |
Morgan Stanley Capital Services LLC | | | 46,424 | | | | — | | | | — | | | | — | | | | 46,424 | |
Royal Bank of Scotland PLC | | | 16,390 | | | | (16,390 | ) | | | — | | | | — | | | | — | |
UBS AG | | | 24,545 | | | | (24,545 | ) | | | — | | | | — | | | | — | |
| | | | |
Total | | $ | 484,367 | | | $ | (174,343) | | | | — | | | | — | | | $ | 310,024 | |
| | | | |
| | | | | | | | | | | | | | | | | | | | |
| Counterparty | | Derivative Liabilities
Subject to an MNA
by Counterparty | | | Derivatives
Available
for Offset1 | | | Non-cash
Collateral
Pledged | | | Cash
Collateral
Pledged | | | Net Amount of
Derivative Liabilities3 | |
Bank of America N.A. | | $ | 156,822 | | | $ | (17,013) | | | | — | | | | — | | | $ | 139,809 | |
The Bank of New York Mellon | | $ | 1,668 | | | | (998 | ) | | | — | | | | — | | | | 670 | |
Barclays Bank PLC | | | 24,745 | | | | (24,745 | ) | | | — | | | | — | | | | — | |
BNP Paribas S.A. | | | 253,280 | | | | (13,098 | ) | | | — | | | | — | | | | 240,182 | |
Citibank N.A. | | | 34,173 | | | | (34,173 | ) | | | — | | | | — | | | | — | |
Credit Suisse International | | | 7,074 | | | | (7,074 | ) | | | — | | | | — | | | | — | |
Deutsche Bank AG | | | 427,651 | | | | (23,654 | ) | | | — | | | | — | | | | 403,997 | |
Goldman Sachs Bank USA | | | 3,845 | | | | (3,845 | ) | | | — | | | | — | | | | — | |
Goldman Sachs International | | | 264,937 | | | | (8,808 | ) | | | — | | | | — | | | | 256,129 | |
JPMorgan Chase Bank N.A. | | | 103,185 | | | | — | | | | — | | | | — | | | | 103,185 | |
Royal Bank of Scotland PLC | | | 51,247 | | | | (16,390 | ) | | | — | | | | — | | | | 34,857 | |
State Street Bank and Trust Co. | | | 15,461 | | | | — | | | | — | | | | — | | | | 15,461 | |
UBS AG | | | 89,644 | | | | (24,545 | ) | | | — | | | | — | | | | 65,099 | |
Westpac Banking Corp. | | | 20,790 | | | | — | | | | — | | | | — | | | | 20,790 | |
| | | | |
Total | | $ | 1,454,522 | | | $ | (174,343) | | | | — | | | | — | | | $ | 1,280,179 | |
| | | | |
| | 1 | The amount of derivatives available for offset is limited to the amount of derivative assets and/or liabilities that are subject to an MNA. |
| | 2 | Net amount represents the net amount receivable from the counterparty in the event of default. |
| | 3 | Net amount represents the net amount payable due to the counterparty in the event of default. |
| | | | | | |
| 68 | | BLACKROCK FUNDS | | MARCH 31, 2014 | | |
| | |
| Notes to Financial Statements (continued) | | |
| | | | | | | | | | | | | | | | | | | | |
| Health Sciences Opportunities | | | | | | | | | | | | | | | |
| Counterparty | | Derivative Assets
Subject to an MNA
by Counterparty | | | Derivative
Available
for Offset1 | | | Non-cash
Collateral
Received | | | Cash
Collateral
Received | | | Net Amount of
Derivative Assets2 | |
The Bank of New York Mellon | | $ | 5,697 | | | | — | | | | — | | | | — | | | $ | 5,697 | |
Citibank N.A. | | | 1,356 | | | $ | (1,356 | ) | | | — | | | | — | | | | — | |
JPMorgan Chase Bank N.A. | | | 7,061 | | | | — | | | | — | | | | — | | | | 7,061 | |
Royal Bank of Scotland PLC | | | 13,868 | | | | — | | | | — | | | | — | | | | 13,868 | |
UBS AG | | | 318 | | | | (318 | ) | | | — | | | | — | | | | — | |
| | | | |
Total | | $ | 28,300 | | | $ | (1,674 | ) | | | — | | | | — | | | $ | 26,626 | |
| | | | |
| | | | | | | | | | | | | | | | | | | | |
| Counterparty | | Derivative Liabilities
Subject to an MNA
by Counterparty | | | Derivative
Available
for Offset1 | | | Non-cash
Collateral
Pledged | | | Cash
Collateral
Pledged | | | Net Amount of
Derivative Liabilities3 | |
BNP Paribas S.A. | | $ | 54,388 | | | | — | | | | — | | | | — | | | $ | 54,388 | |
Citibank N.A. | | | 1,645,257 | | | $ | (1,356 | ) | | | — | | | | — | | | | 1,643,901 | |
Deutsche Bank AG | | | 52,147 | | | | — | | | | — | | | | — | | | | 52,147 | |
Goldman Sachs Bank USA | | $ | 242,030 | | | | — | | | | — | | | | — | | | | 242,030 | |
State Street Bank and Trust Co. | | | 11,026 | | | | — | | | | — | | | | — | | | | 11,026 | |
UBS AG | | | 2,525,442 | | | | (318 | ) | | | — | | | | — | | | | 2,525,124 | |
| | | | |
Total | | $ | 4,530,290 | | | $ | (1,674 | ) | | | — | | | | — | | | $ | 4,528,616 | |
| | | | |
| | | | | | | | | | | | | | | | | | | | |
| International Opportunities | |
| Counterparty | | Derivative Assets
Subject to an MNA
by Counterparty | | | Derivative
Available
for Offset1 | | | Non-cash
Collateral
Received | | | Cash
Collateral
Received | | | Net Amount of
Derivative Assets2 | |
Bank of America N.A. | | $ | 227,558 | | | $ | (227,558 | ) | | | — | | | | — | | | | — | |
The Bank of New York Mellon | | | 9,274 | | | | (9,274 | ) | | | — | | | | — | | | | — | |
Barclays Bank PLC | | | 169,777 | | | | (67,791 | ) | | | — | | | | — | | | $ | 101,986 | |
BNP Paribas S.A. | | | 121,246 | | | | (121,246 | ) | | | — | | | | — | | | | — | |
Citibank N.A. | | | 666,420 | | | | (666,420 | ) | | | — | | | | — | | | | — | |
Credit Suisse International | | | 21,029 | | | | (368 | ) | | | — | | | | — | | | | 20,661 | |
Deutsche Bank AG | | | 377,672 | | | | (377,672 | ) | | | — | | | | — | | | | — | |
Goldman Sachs Bank USA | | | 1,033,082 | | | | (63,823 | ) | | | — | | | | — | | | | 969,259 | |
JPMorgan Chase Bank N.A. | | | 57,854 | | | | (57,854 | ) | | | — | | | | — | | | | — | |
Morgan Stanley Capital Services LLC | | | 41,436 | | | | (37,262 | ) | | | — | | | | — | | | | 4,174 | |
Royal Bank of Scotland PLC | | | 14,489 | | | | — | | | | — | | | | — | | | | 14,489 | |
State Street Bank and Trust Co. | | | 200,356 | | | | (49,210 | ) | | | — | | | | — | | | | 151,146 | |
UBS AG | | | 3,189 | | | | (3,189 | ) | | | — | | | | — | | | | — | |
Westpac Banking Corp. | | | 95,794 | | | | (95,794 | ) | | | — | | | | — | | | | — | |
| | | | |
Total | | $ | 3,039,176 | | | $ | (1,777,461 | ) | | | — | | | | — | | | $ | 1,261,715 | |
| | | | |
| | | | | | | | | | | | | | | | | | | | |
| Counterparty | | Derivative Liabilities
Subject to an MNA
by Counterparty | | | Derivative
Available
for Offset1 | | | Non-cash
Collateral
Pledged | | | Cash
Collateral
Pledged | | | Net Amount of
Derivative Liabilities3 | |
Bank of America N.A. | | $ | 1,111,145 | | | $ | (227,558 | ) | | | — | | | | — | | | $ | 883,587 | |
The Bank of New York Mellon | | | 210,795 | | | | (9,274 | ) | | | — | | | | — | | | | 201,521 | |
Barclays Bank PLC | | | 67,791 | | | | (67,791 | ) | | | — | | | | — | | | | — | |
BNP Paribas S.A. | | | 1,292,191 | | | | (121,246 | ) | | | — | | | | — | | | | 1,170,945 | |
Citibank N.A. | | | 952,029 | | | | (666,420 | ) | | | — | | | | — | | | | 285,609 | |
Credit Suisse International | | | 368 | | | | (368 | ) | | | — | | | | — | | | | — | |
Deutsche Bank AG | | | 3,688,673 | | | | (377,672 | ) | | | — | | | | — | | | | 3,311,001 | |
Goldman Sachs Bank USA | | | 63,823 | | | | (63,823 | ) | | | — | | | | — | | | | — | |
Goldman Sachs International | | | 1,740,203 | | | | — | | | | — | | | | — | | | | 1,740,203 | |
JPMorgan Chase Bank N.A. | | | 718,235 | | | | (57,854 | ) | | | — | | | | — | | | | 660,381 | |
Morgan Stanley Capital Services LLC | | | 37,262 | | | | (37,262 | ) | | | — | | | | — | | | | — | |
State Street Bank and Trust Co. | | | 49,210 | | | | (49,210 | ) | | | — | | | | — | | | | — | |
UBS AG | | | 805,991 | | | | (3,189 | ) | | | — | | | | — | | | | 802,802 | |
Westpac Banking Corp. | | | 207,365 | | | | (95,794 | ) | | | — | | | | — | | | | 111,571 | |
| | | | |
Total | | $ | 10,945,081 | | | $ | (1,777,461 | ) | | | — | | | | — | | | $ | 9,167,620 | |
| | | | |
| | 1 | The amount of derivatives available for offset is limited to the amount of derivative assets and/or liabilities that are subject to an MNA. |
| | 2 | Net amount represents the net amount receivable from the counterparty in the event of default. |
| | 3 | Net amount represents the net amount payable due to the counterparty in the event of default. |
| | | | | | |
| | | BLACKROCK FUNDS | | MARCH 31, 2014 | | 69 |
| | |
| Notes to Financial Statements (continued) | | |
| | | | | | | | | | | | | | | | | | | | |
| Science & Technology Opportunities | |
| Counterparty | | Derivative Assets
Subject to an MNA
by Counterparty | | | Derivative
Available
for Offset1 | | | Non-cash
Collateral
Received | | | Cash
Collateral
Received | | | Net Amount of
Derivative Assets2 | |
Bank of America N.A. | | $ | 2,175 | | | | — | | | | — | | | | — | | | $ | 2,175 | |
BNP Paribas S.A. | | | 497 | | | $ | (497 | ) | | | — | | | | — | | | | — | |
Citibank N.A. | | | 757 | | | | (757 | ) | | | — | | | | — | | | | — | |
Deutsche Bank AG | | | 62 | | | | (62 | ) | | | — | | | | — | | | | — | |
Toronto-Dominion Bank | | | 2,133 | | | | (591 | ) | | | — | | | | — | | | | 1,542 | |
| | | | |
Total | | $ | 5,624 | | | $ | (1,907 | ) | | | — | | | | — | | | $ | 3,717 | |
| | | | |
| | | | | | | | | | | | | | | | | | | | |
| Counterparty | | Derivative Liabilities
Subject to an MNA
by Counterparty | | | Derivative
Available
for Offset1 | | | Non-cash
Collateral
Pledged | | | Cash
Collateral
Pledged | | | Net Amount of
Derivative
Liabilities3 | |
Barclays Bank PLC | | $ | 1,992 | | | | — | | | | — | | | | — | | | $ | 1,992 | |
BNP Paribas S.A. | | | 8,484 | | | $ | (497 | ) | | | — | | | | — | | | | 7,987 | |
Citibank N.A. | | | 16,584 | | | | (757 | ) | | | — | | | | — | | | | 15,827 | |
Deutsche Bank AG | | | 8,079 | | | | (62 | ) | | | | | | | | | | | 8,017 | |
Goldman Sachs Bank USA | | | 81,904 | | | | — | | | | | | | | | | | | 81,904 | |
JPMorgan Chase Bank N.A. | | | 226,056 | | | | — | | | | — | | | | — | | | | 226,056 | |
Royal Bank of Scotland PLC | | | 854 | | | | — | | | | — | | | | — | | | | 854 | |
Toronto-Dominion Bank | | | 591 | | | | (591 | ) | | | — | | | | — | | | | — | |
| | | | |
Total | | $ | 344,544 | | | $ | (1,907 | ) | | | — | | | | — | | | $ | 342,637 | |
| | | | |
| | 1 | The amount of derivatives available for offset is limited to the amount of derivative assets and/or liabilities that are subject to an MNA. |
| | 2 | Net amount represents the net amount receivable from the counterparty in the event of default. |
| | 3 | Net amount represents the net amount payable due to the counterparty in the event of default. |
5. Investment Advisory Agreement and Other Transactions with Affiliates:
The PNC Financial Services Group, Inc. is the largest stockholder and an affiliate, for 1940 Act purposes, of BlackRock.
The Trust, on behalf of the Funds, entered into an Investment Advisory Agreement with the Manager, the Funds’ investment advisor, an indirect, wholly owned subsidiary of BlackRock, to provide investment advisory and administration services. The Manager is responsible for the management of each Fund’s portfolio and provides the necessary personnel, facilities, equipment and certain other services necessary to the operations of each Fund. For such services, each Fund pays the Manager a monthly fee based on a percentage of each Fund’s average daily net assets at the following annual rates:
| | | | | | | | | | | | | | | | |
| | | First $1 Billion | | | $1 Billion - $2 Billion | | | $2 Billion - $3 Billion | | | Greater than $3 Billion | |
Global Opportunities and Science & Technology Opportunities | | | 0.900 | % | | | 0.850 | % | | | 0.800 | % | | | 0.750 | % |
Health Sciences Opportunities | | | 0.750 | % | | | 0.700 | % | | | 0.675 | % | | | 0.650 | % |
International Opportunities | | | 1.000 | % | | | 0.950 | % | | | 0.900 | % | | | 0.850 | % |
U.S. Opportunities | | | 1.100 | % | | | 1.050 | % | | | 1.025 | % | | | 1.000 | % |
The Manager voluntarily agreed to waive its investment advisory fees by the amount of investment advisory fees each Fund pays to the Manager indirectly through its investment in affiliated money market funds. However, the Manager does not waive its investment advisory fees by the amount of investment advisory fees paid in connection with each Fund’s investment in other affiliated investment companies, if any. These amounts are included in fees waived by Manager in the Statements of Operations. For the six months ended March 31, 2014, the amounts waived were as follows:
| | | | |
Global Opportunities | | $ | 531 | |
Health Sciences Opportunities | | $ | 25,724 | |
International Opportunities | | $ | 4,178 | |
Science & Technology Opportunities | | $ | 2,530 | |
U.S. Opportunities | | $ | 6,318 | |
The Manager, on behalf of the Fund, entered into a sub-advisory agreement with BlackRock Financial Management, Inc. (“BFM”), an affiliate of the Manager, to serve as sub-advisor for a portion of the assets of Global Opportunities. The Manager pays BFM for services it provides, a monthly fee that is a percentage of the investment advisory fees paid by Global Opportunities to the Manager.
The Trust, on behalf of the Funds, entered into a Distribution Agreement and a Distribution and Service Plan with BlackRock Investments, LLC (“BRIL”), an affiliate of the Manager. Pursuant to the Distribution and Service Plan and in accordance with Rule 12b-1 under the 1940 Act, the Funds pay BRIL
| | | | | | |
| 70 | | BLACKROCK FUNDS | | MARCH 31, 2014 | | |
| | |
| Notes to Financial Statements (continued) | | |
ongoing service and distribution fees. The fees are accrued daily and paid monthly at annual rates based upon the average daily net assets of the shares of each Fund as follows:
| | | | | | | | |
| | | Service
Fee | | | Distribution
Fee | |
Service | | | 0.25 | % | | | — | |
Investor A | | | 0.25 | % | | | — | |
Investor B | | | 0.25 | % | | | 0.75 | % |
Investor C | | | 0.25 | % | | | 0.75 | % |
Class R | | | 0.25 | % | | | 0.25 | % |
Pursuant to sub-agreements with BRIL, broker-dealers and BRIL provide shareholder servicing and distribution services to each Fund. The ongoing service and/or distribution fee compensates BRIL and each broker-dealer for providing shareholder servicing and/or distribution related services to Service, Investor A, Investor B, Investor C and Class R shareholders.
For the six months ended March 31, 2014, the following table shows the class specific service and distribution fees borne directly by each class of each Fund:
| | | | | | | | | | | | | | | | | | | | | | | | |
| | | Service | | | Investor A | | | Investor B | | | Investor C | | | Class R | | | Total | |
Global Opportunities | | | — | | | $ | 264,980 | | | $ | 20,909 | | | $ | 288,741 | | | $ | 36,668 | | | $ | 611,298 | |
Health Sciences Opportunities | | $ | 32,711 | | | $ | 2,247,662 | | | $ | 182,544 | | | $ | 3,332,232 | | | $ | 108,088 | | | $ | 5,903,237 | |
International Opportunities | | $ | 51,539 | | | $ | 989,142 | | | $ | 26,883 | | | $ | 763,783 | | | | — | | | $ | 1,831,347 | |
Science & Technology Opportunities | | $ | 1,594 | | | $ | 146,725 | | | $ | 12,375 | | | $ | 161,689 | | | $ | 11,990 | | | $ | 334,373 | |
U.S. Opportunities | | $ | 194,514 | | | $ | 645,909 | | | $ | 65,973 | | | $ | 1,084,675 | | | | — | | | $ | 1,991,071 | |
Pursuant to written agreements, certain financial intermediaries, some of which may be affiliates, provide the Funds with sub-accounting, recordkeeping, sub-transfer agency and other administrative services with respect to sub-accounts they service. For these services, these entities receive an asset based fee or an annual fee per shareholder account, which will vary depending on share class and/or net assets. For the six months ended March 31, 2014, the Funds paid the following to the affiliates in return for these services, which are included in transfer agent — class specific in the Statements of Operations:
| | | | | | | | | | | | | | | | | | | | |
| | | Institutional | | | Service | | | Investor A | | | Investor C | | | Total | |
Health Sciences Opportunities | | $ | 24 | | | $ | 87 | | | $ | 389 | | | $ | 16 | | | $ | 516 | |
International Opportunities | | $ | 101,570 | | | $ | 2,107 | | | $ | 7,455 | | | | — | | | $ | 111,132 | |
Science & Technology Opportunities | | $ | 3 | | | | — | | | $ | 1,909 | | | | — | | | $ | 1,912 | |
U.S. Opportunities | | $ | 48,935 | | | $ | 63 | | | $ | 4,434 | | | $ | 3 | | | $ | 53,435 | |
The Manager maintains a call center, which is responsible for providing certain shareholder services to the Funds, such as responding to shareholder inquiries and processing transactions based upon instructions from shareholders with respect to the subscription and redemption of Fund shares. For the six months ended March 31, 2014, each Fund reimbursed the Manager the following amounts for costs incurred in running the call center, which are included in transfer agent — class specific in the Statements of Operations:
| | | | | | | | | | | | | | | | | | | | | | | | | | | | |
| | | Institutional | | | Service | | | Investor A | | | Investor B | | | Investor C | | | Class R | | | Total | |
Global Opportunities | | $ | 1,652 | | | | — | | | $ | 2,078 | | | $ | 298 | | | | — | | | $ | 70 | | | $ | 4,098 | |
Health Sciences Opportunities | | $ | 6,504 | | | $ | 62 | | | $ | 23,891 | | | $ | 2,216 | | | $ | 3,424 | | | $ | 381 | | | $ | 36,478 | |
International Opportunities | | $ | 1,909 | | | | — | | | $ | 8,575 | | | $ | 275 | | | $ | 526 | | | | — | | | $ | 11,285 | |
Science & Technology Opportunities | | $ | 3,926 | | | $ | 17 | | | $ | 4,388 | | | $ | 181 | | | $ | 1,085 | | | $ | 131 | | | $ | 9,728 | |
U.S. Opportunities | | | — | | | $ | 69 | | | $ | 6,872 | | | $ | 357 | | | $ | 325 | | | | — | | | $ | 7,623 | |
For the six months ended March 31, 2014, the following table shows the class specific transfer agent fees borne directly by each class of each Fund:
| | | | | | | | | | | | | | | | | | | | | | | | | | | | |
| | | Institutional | | | Service | | | Investor A | | | Investor B | | | Investor C | | | Class R | | | Total | |
Global Opportunities | | $ | 41,318 | | | | — | | | $ | 145,474 | | | $ | 2,976 | | | $ | 49,607 | | | $ | 14,131 | | | $ | 253,506 | |
Health Sciences Opportunities | | $ | 404,248 | | | $ | 16,682 | | | $ | 1,172,609 | | | $ | 34,442 | | | $ | 334,084 | | | $ | 30,867 | | | $ | 1,992,932 | |
International Opportunities | | $ | 487,137 | | | $ | 30,467 | | | $ | 667,959 | | | $ | 9,927 | | | $ | 129,215 | | | | — | | | $ | 1,324,705 | |
Science & Technology Opportunities | | $ | 55,037 | | | $ | 579 | | | $ | 148,909 | | | $ | 4,069 | | | $ | 54,946 | | | $ | 6,232 | | | $ | 269,772 | |
U.S. Opportunities | | $ | 565,676 | | | $ | 127,060 | | | $ | 457,682 | | | $ | 13,004 | | | $ | 158,859 | | | | — | | | $ | 1,322,281 | |
| | | | | | |
| | | BLACKROCK FUNDS | | MARCH 31, 2014 | | 71 |
| | |
| Notes to Financial Statements (continued) | | |
BNY Mellon Investment Servicing (US) Inc. (“BNYMIS”) and the Manager act as co-administrators for the Funds. For these services, the co-administrators receive an administration fee computed daily and payable monthly to each administrator pursuant to separate fee arrangements, based on a percentage of the average daily net assets of each Fund. The combined administration fee, which is shown as administration in the Statements of Operations, is paid at the following annual rates:
| | | | |
| Average Daily Net Assets | | Administration Fee | |
First $500 Million | | | 0.075 | % |
$500 Million - $1 Billion | | | 0.065 | % |
Greater than $1 Billion | | | 0.055 | % |
In addition, each of the share classes is charged an administration fee, which is shown as administration — class specific in the Statements of Operations, based on the following percentages of average daily net assets of each respective class:
| | | | |
| Average Daily Net Assets | | Administration Fee — Class Specific | |
First $500 Million | | | 0.025 | % |
$500 Million - $1 Billion | | | 0.015 | % |
Greater than $1 Billion | | | 0.005 | % |
For the six months ended March 31, 2014, the Funds paid the following to the Manager in return for these services, which are included in administration and administration — class specific in the Statements of Operations:
| | | | |
Global Opportunities | | $ | 125,464 | |
Health Sciences Opportunities | | $ | 937,825 | |
International Opportunities | | $ | 559,577 | |
Science & Technology Opportunities | | $ | 68,639 | |
U.S. Opportunities | | $ | 559,159 | |
For the six months ended March 31, 2014, the following table shows the class specific administration fees borne directly by each class of each Fund:
| | | | | | | | | | | | | | | | | | | | | | | | | | | | |
| | | Institutional | | | Service | | | Investor A | | | Investor B | | | Investor C | | | Class R | | | Total | |
Global Opportunities | | $ | 7,993 | | | | — | | | $ | 26,498 | | | $ | 527 | | | $ | 7,258 | | | $ | 1,833 | | | $ | 44,109 | |
Health Sciences Opportunities | | $ | 88,955 | | | $ | 3,271 | | | $ | 119,748 | | | $ | 4,564 | | | $ | 74,915 | | | $ | 5,404 | | | $ | 296,857 | |
International Opportunities | | $ | 88,067 | | | $ | 5,154 | | | $ | 84,279 | | | $ | 672 | | | $ | 19,095 | | | | — | | | $ | 197,267 | |
Science & Technology Opportunities | | $ | 5,330 | | | $ | 159 | | | $ | 14,674 | | | $ | 309 | | | $ | 4,042 | | | $ | 599 | | | $ | 25,113 | |
U.S. Opportunities | | $ | 76,950 | | | $ | 19,451 | | | $ | 63,681 | | | $ | 1,649 | | | $ | 27,117 | | | | — | | | $ | 188,848 | |
BNYMIS and the Manager may have, at their discretion, voluntarily waived all or any portion of their administration fees for a Fund or a share class which are included in administration fees waived — class specific in the Statements of Operations.
The Manager contractually and/or voluntarily agreed to waive and/or reimburse fees or expenses in order to limit expenses, excluding interest expense, dividend expense, income tax expense, acquired fund fees and expenses and certain other fund expenses, which constitute extraordinary expenses not incurred in the ordinary course of the Funds’ business. The expense limitations as a percentage of average daily net assets are as follows:
| | | | | | | | | | | | | | | | | | | | | | | | |
| | | Global
Opportunities1 | | | Health Sciences
Opportunities | | | International
Opportunities | | | Science & Technology
Opportunities1 | | | U.S.
Opportunities1 | |
| | | Contractual | | | Contractual | | | Contractual1 | | | Voluntary2 | | | Contractual | | | Contractual | |
Institutional | | | 1.06 | % | | | N/A | | | | 1.49 | % | | | 1.24 | % | | | 1.29 | % | | | 0.96 | % |
Service | | | 1.70 | % | | | N/A | | | | 1.80 | % | | | 1.52 | % | | | 1.61 | % | | | 1.36 | % |
Investor A | | | 1.33 | % | | | N/A | | | | 1.98 | % | | | 1.52 | % | | | 1.61 | % | | | 1.36 | % |
Investor B | | | 2.18 | % | | | N/A | | | | 2.75 | % | | | 2.36 | % | | | 2.42 | % | | | 2.15 | % |
Investor C | | | 2.14 | % | | | N/A | | | | 2.75 | % | | | 2.29 | % | | | 2.49 | % | | | 2.12 | % |
Class R | | | 1.72 | % | | | 1.81 | %1 | | | 2.18 | %3 | | | 2.13 | %3 | | | 1.89 | % | | | 2.24 | %3 |
| 1 | The Manager has agreed not to reduce or discontinue this contractual waiver or reimbursement prior to February 1, 2015 unless approved by the Board, including a majority of the Independent Trustees. |
| 2 | The voluntary waiver or reimbursement may be reduced or discontinued at any time. |
| 3 | There were no shares outstanding as of March 31, 2014. |
These amounts waived are included in fees waived by Manager, and shown as administration fees waived — class specific, transfer agent fees waived — class specific and transfer agent fees reimbursed — class specific, respectively, in the Statements of Operations. For the six months ended March 31, 2014, the amounts included in fees waived by Manager were as follows:
| | | | |
U.S. Opportunities | | $ | 1,672,744 | |
| | | | | | |
| 72 | | BLACKROCK FUNDS | | MARCH 31, 2014 | | |
| | |
| Notes to Financial Statements (continued) | | |
Class specific expense waivers and reimbursements are as follows:
| | | | | | | | | | | | | | | | | | | | | | | | | | | | |
| Administration Fees Waived | |
| | | Institutional | | | Service | | | Investor A | | | Investor B | | | Investor C | | | Class R | | | Total | |
Global Opportunities | | $ | 7,993 | | | | — | | | $ | 26,498 | | | $ | 344 | | | $ | 7,258 | | | $ | 824 | | | $ | 42,917 | |
International Opportunities | | | — | | | | — | | | $ | 1,093 | | | $ | 672 | | | $ | 13 | | | | — | | | $ | 1,778 | |
Science & Technology Opportunities | | $ | 4,360 | | | | — | | | $ | 5,288 | | | $ | 159 | | | $ | 271 | | | $ | 1 | | | $ | 10,079 | |
U.S. Opportunities | | $ | 76,950 | | | $ | 19,273 | | | $ | 62,424 | | | $ | 1,449 | | | $ | 14,880 | | | | — | | | $ | 174,976 | |
| | | | | | | | | | | | | | | | | | | | | | | | |
| Transfer Agent Fees Waived | | | | | | | | | | | | | | | | | | |
| | | Institutional | | | Service | | | Investor A | | | Investor B | | | Investor C | | | Total | |
Global Opportunities | | $ | 1,652 | | | | — | | | $ | 2,078 | | | $ | 132 | | | | — | | | $ | 3,862 | |
International Opportunities | | | — | | | | — | | | | — | | | $ | 275 | | | | — | | | $ | 275 | |
Science & Technology Opportunities | | $ | 2,779 | | | | — | | | $ | 1,001 | | | $ | 57 | | | $ | 14 | | | $ | 3,851 | |
U.S. Opportunities | | | — | | | $ | 69 | | | $ | 6,388 | | | $ | 260 | | | $ | 283 | | | $ | 7,000 | |
| | | | | | | | | | | | | | | | | | | | | | | | | | | | |
| Transfer Agent Fees Reimbursed | | | | | | | | | | | | | | | | | | | | | |
| | | Institutional | | | Service | | | Investor A | | | Investor B | | | Investor C | | | Class R | | | Total | |
Global Opportunities | | $ | 34,079 | | | | — | | | $ | 103,821 | | | $ | 9 | | | $ | 19,957 | | | $ | 2,840 | | | $ | 160,706 | |
International Opportunities | | | — | | | | | | | | — | | | $ | 1,989 | | | | — | | | | — | | | $ | 1,989 | |
Science & Technology Opportunities | | $ | 5,788 | | | | — | | | $ | 1,102 | | | $ | 49 | | | $ | 13 | | | | — | | | $ | 6,952 | |
U.S. Opportunities | | $ | 565,662 | | | $ | 11,037 | | | $ | 65,867 | | | $ | 510 | | | $ | 1,182 | | | | — | | | $ | 644,258 | |
If during a Fund’s fiscal year the operating expenses of a share class, that at any time during the prior two fiscal years received a waiver or reimbursement from the Manager, are less than the expense limit for that share class, the Manager is entitled to be reimbursed by such share class up to the lesser of (a) the amount of fees waived or expenses reimbursed during those prior two fiscal years under the agreement and (b) the amount by which the expense limit for that share class exceeds the operating expenses of the share class for the current fiscal year, provided that: (1) the Fund, of which the share class is a part, has more than $50 million in assets for the fiscal year and (2) the Manager or an affiliate continues to serve as the Fund’s investment advisor or administrator. In the event the expense limit for a share class is changed subsequent to a fiscal year in which the Manager becomes entitled to reimbursement for fees waived or reimbursed, the amount available to reimburse the Manager shall be calculated by reference to the expense limit for that share class in effect at the time the Manager became entitled to receive such reimbursement, rather than the subsequently changed expense limit for that share class.
For the six months ended March 31, 2014, the Manager recouped the following Fund level and class specific waivers and/or reimbursements previously recorded by the Funds:
| | | | | | | | | | | | | | | | | | | | | | | | |
| | | Service | | | Investor A | | | Investor B | | | Investor C | | | Class R | | | Total | |
Global Opportunities | | | — | | | | — | | | $ | 12 | | | | — | | | $ | 711 | | | $ | 723 | |
International Opportunities | | $ | 286 | | | | — | | | | — | | | | — | | | | — | | | $ | 286 | |
Science & Technology Opportunities | | | — | | | $ | 15,909 | | | $ | 47 | | | $ | 3,198 | | | $ | 888 | | | $ | 20,042 | |
U.S. Opportunities | | | — | | | | — | | | | — | | | $ | 2,606 | | | | — | | | $ | 2,606 | |
| | | | | | |
| | | BLACKROCK FUNDS | | MARCH 31, 2014 | | 73 |
| | |
| Notes to Financial Statements (continued) | | |
On March 31, 2014, the Fund level and class specific waivers and/or reimbursements subject to possible future recoupment under the expense limitation agreement are as follows:
| | | | | | | | | | | | |
| | | Expiring September 30, | |
| | | 2014 | | | 2015 | | | 2016 | |
Global Opportunities | | | | | | | | | | | | |
Fund Level | | $ | 31,642 | | | $ | 14,155 | | | | — | |
Institutional | | $ | 103,049 | | | $ | 91,262 | | | $ | 43,724 | |
Investor A | | $ | 371,480 | | | $ | 293,364 | | | $ | 132,397 | |
Investor B | | $ | 926 | | | $ | 359 | | | $ | 485 | |
Investor C | | $ | 98,285 | | | $ | 73,264 | | | $ | 27,215 | |
Class R | | $ | 19,644 | | | $ | 12,010 | | | $ | 3,664 | |
Science & Technology Opportunities | | | | | | | | | | | | |
Institutional | | $ | 20,414 | | | $ | 43,356 | | | $ | 12,927 | |
Investor A | | | — | | | $ | 1,675 | | | $ | 7,391 | |
Investor B | | | — | | | | — | | | $ | 265 | |
Investor C | | | — | | | | — | | | $ | 298 | |
Class R | | | — | | | $ | 449 | | | $ | 1 | |
U.S. Opportunities | | | | | | | | | | | | |
Fund Level | | $ | 3,190,512 | | | $ | 2,794,164 | | | $ | 1,672,744 | |
Institutional | | $ | 2,763,643 | | | $ | 1,866,300 | | | $ | 642,612 | |
Service | | | — | | | $ | 3,018 | | | $ | 30,379 | |
Investor A | | | — | | | $ | 8,867 | | | $ | 134,679 | |
Investor B | | $ | 668 | | | $ | 1,502 | | | $ | 2,219 | |
Investor C | | | — | | | $ | 8,964 | | | $ | 16,345 | |
For the six months ended March 31, 2014, affiliates earned underwriting discounts, direct commissions and dealer concessions on sales of each Fund’s Investor A Shares as follows:
| | | | |
Global Opportunities | | $ | 6,101 | |
Health Sciences Opportunities | | $ | 175,352 | |
International Opportunities | | $ | 30,292 | |
Science & Technology Opportunities | | $ | 15,429 | |
U.S. Opportunities | | $ | 5,902 | |
For the six months ended March 31, 2014, affiliates received CDSCs as follows:
| | | | | | | | | | | | |
| | | Investor A | | | Investor B | | | Investor C | |
Global Opportunities | | $ | 3 | | | $ | 531 | | | $ | 817 | |
Health Sciences Opportunities | | $ | 5 | | | $ | 1,836 | | | $ | 40,096 | |
International Opportunities | | $ | 8,375 | | | $ | 2,028 | | | $ | 3,425 | |
Science & Technology Opportunities | | | — | | | $ | 1,684 | | | $ | 1,672 | |
U.S. Opportunities | | | — | | | $ | 2,855 | | | $ | 1,202 | |
The U.S. Securities and Exchange Commission has issued an exemptive order which permits BIM, an affiliate of the Manager, to serve as securities lending agent for the Funds, subject to applicable conditions. As securities lending agent, BIM bears all operational costs directly related to securities lending. The Funds are responsible for expenses in connection with the investment of cash collateral received for securities on loan (the “collateral investment expenses”). The cash collateral is invested in a private investment company managed by the Manager or its affiliates. However, BIM has agreed to cap the collateral investment expenses of the private investment company to an annual rate of 0.04%. The investment advisor to the private investment company will not charge any advisory fees with respect to shares purchased by the Funds.
Securities lending income is equal to the total of income earned from the reinvestment of cash collateral, net of fees and other payments to and from borrowers of securities, and less the collateral investment expenses. Each Fund retains a portion of securities lending income and remits a remaining portion to BIM as compensation for its services as securities lending agent. Pursuant to the securities lending agreement effective February 1, 2014, BIM may lend securities only when the difference between the borrower rebate rate and the risk free rate exceeds a certain level (such securities, the “specials only securities”).
Pursuant to a securities lending agreement effective February 1, 2014, each Fund retains 80% of securities lending income. In addition, commencing the business day following the date that the aggregate securities lending income earned across the Equity-Liquidity Complex in a calendar year exceeds the aggregate securities lending income earned across the Equity-Liquidity Complex through the lending of specials only securities in the calendar year 2013, each Fund, pursuant to the securities lending agreement, will retain for the remainder of the calendar year securities lending income in an amount equal to 85% of securities lending income. Prior to February 1, 2014, each Fund retained 65% of securities lending income and
| | | | | | |
| 74 | | BLACKROCK FUNDS | | MARCH 31, 2014 | | |
| | |
| Notes to Financial Statements (continued) | | |
paid a fee to BIM equal to 35% of such income. The share of securities lending income earned by each Fund is shown as securities lending — affiliated — net in the Statements of Operations. For the six months ended March 31, 2014, each Fund paid BIM the following amounts for securities lending agent services:
| | | | |
Global Opportunities | | $ | 31,888 | |
Health Sciences Opportunities | | $ | 73,077 | |
International Opportunities | | $ | 209,385 | |
Science & Technology Opportunities | | $ | 41,293 | |
U.S. Opportunities | | $ | 183,853 | |
The Funds recorded payments from an affiliate to compensate for foregone securities lending revenue, which is shown as other income — affiliated in the Statements of Operations.
Certain officers and/or trustees of the Trust are officers and/or directors of BlackRock or its affiliates. The Funds reimburse the Manager for a portion of the compensation paid to the Trust’s Chief Compliance Officer, which is included in officer and trustees in the Statements of Operations.
The Funds may purchase securities from, or sell securities to, an affiliated fund provided the affiliation is due solely to having a common investment adviser, common officers, or common trustees. For the six months ended March 31, 2014, the purchase and sale transactions with an affiliated fund in compliance with Rule 17a-7 under the 1940 Act were as follows:
| | | | | | | | |
| | | Purchases | | | Sales | |
Global Opportunities | | $ | 114,720 | | | $ | 35,897 | |
Health Sciences Opportunities | | $ | 9,538,369 | | | $ | 18,767,544 | |
International Opportunities | | $ | 640,520 | | | $ | 194,087 | |
Science & Technology Opportunities | | $ | 447,579 | | | | — | |
U.S. Opportunities | | | — | | | $ | 1,580,711 | |
6. Purchases and Sales:
Purchases and sales of investments, excluding short-term securities, for the six months ended March 31, 2014 were as follows:
| | | | | | | | |
| | | Purchases | | | Sales | |
Global Opportunities | | $ | 219,783,847 | | | $ | 240,530,828 | |
Health Sciences Opportunities | | $ | 1,456,309,167 | | | $ | 1,315,269,938 | |
International Opportunities | | $ | 1,250,178,889 | | | $ | 1,232,096,602 | |
Science & Technology Opportunities | | $ | 91,090,814 | | | $ | 71,592,682 | |
U.S. Opportunities | | $ | 618,014,699 | | | $ | 788,979,800 | |
Transactions in options written for the six months ended March 31, 2014, were as follows:
| | | | | | | | |
| | | Health Sciences Opportunities | |
| | | Puts | |
| | | Contracts | | | Premiums
Received | |
| | | | |
Outstanding options, beginning of period | | | — | | | | — | |
Options written | | | 4,507 | | | $ | 2,248,557 | |
Options expired | | | (1,717 | ) | | | (671,018 | ) |
Options closed | | | (2,790 | ) | | | (1,577,539 | ) |
| | | | |
Outstanding options, end of period | | | — | | | | — | |
| | | | |
| | | | | | | | | |
7. Income Tax Information:
As of September 30, 2013, the Funds had capital loss carryforwards available to offset future realized capital gains through the indicated expiration dates as follows:
| | | | | | | | | | | | |
| Expires September 30, | | Global
Opportunities | | | International
Opportunities | | | Science &
Technology
Opportunities | |
2015 | | | — | | | | — | | | $ | 37,628,326 | |
2017 | | $ | 116,767,555 | | | | — | | | | 4,448,928 | |
2018 | | | 9,946,168 | | | $ | 2,077,859 | | | | — | |
2019 | | | — | | | | — | | | | 783,208 | |
Total | | $ | 126,713,723 | | | $ | 2,077,859 | | | $ | 42,860,462 | |
| | | | |
| | | | | | |
| | | BLACKROCK FUNDS | | MARCH 31, 2014 | | 75 |
| | |
| Notes to Financial Statements (continued) | | |
As of March 31, 2014, gross unrealized appreciation and depreciation based on cost for federal income tax purposes were as follows:
| | | | | | | | | | | | | | | | | | | | |
| | | Global
Opportunities | | | Health Sciences Opportunities | | | International Opportunities | | | Science & Technology Opportunities | | | U.S. Opportunities | |
Tax cost | | $ | 300,516,511 | | | $ | 2,808,859,903 | | | $ | 1,660,314,130 | | | $ | 170,773,025 | | | $ | 1,233,213,889 | |
| | | | |
Gross unrealized appreciation | | $ | 64,345,967 | | | $ | 1,010,345,960 | | | $ | 318,380,102 | | | $ | 62,410,590 | | | $ | 413,760,681 | |
Gross unrealized depreciation | | | (4,898,183 | ) | | | (26,916,565 | ) | | | (32,809,561 | ) | | | (2,313,484 | ) | | | (24,685,239 | ) |
| | | | |
Net unrealized appreciation | | $ | 59,447,784 | | | $ | 983,429,395 | | | $ | 285,570,541 | | | $ | 60,097,106 | | | $ | 389,075,442 | |
| | | | |
8. Bank Borrowings:
The Trust, on behalf of the Funds, along with certain other funds managed by the Manager and its affiliates (“Participating Funds”), is a party to a 364-day, $800 million credit agreement with a group of lenders, under which the Funds may borrow to fund shareholder redemptions. The agreement expires in April 2014. Excluding commitments designated for a certain individual fund, other Participating Funds, including the Funds, can borrow up to an aggregate commitment amount of $500 million, subject to asset coverage and other limitations as specified in the agreement. The credit agreement has the following terms: a fee of 0.065% per annum on unused commitment amounts and interest at a rate equal to the higher of (a) the one-month LIBOR plus 0.80% per annum or (b) the Fed Funds rate plus 0.80% per annum on amounts borrowed. Participating Funds paid administration and arrangement fees which, along with commitment fees, were allocated among such funds based upon portions of the aggregate commitment available to them and relative net assets of Participating Funds. The Funds did not borrow under the credit agreement during the six months ended March 31, 2014.
9. Concentration, Market and Credit Risk:
In the normal course of business, the Funds invest in securities and enter into transactions where risks exist due to fluctuations in the market (market risk) or failure of the issuer of a security to meet all its obligations (issuer credit risk). The value of securities held by the Funds may decline in response to certain events, including those directly involving the issuers whose securities are owned by the Funds; conditions affecting the general economy; overall market changes; local, regional or global political, social or economic instability; and currency and interest rate and price fluctuations. Similar to issuer credit risk, the Funds may be exposed to counterparty credit risk, or the risk that an entity with which the Funds have unsettled or open transactions may fail to or be unable to perform on its commitments. The Funds manage counterparty credit risk by entering into transactions only with counterparties that they believe have the financial resources to honor their obligations and by monitoring the financial stability of those counterparties. Financial assets, which potentially expose the Funds to market, issuer and counterparty credit risks, consist principally of financial instruments and receivables due from counterparties. The extent of the Funds’ exposure to market, issuer and counterparty credit risks with respect to these financial assets is generally approximated by their value recorded in the Statements of Assets and Liabilities, less any collateral held by the Funds.
Global Opportunities and International Opportunities invest a significant portion of their assets in securities of issuers located in Europe or with significant exposure to European issuers or countries. The European
financial markets have recently experienced volatility and adverse trends due to concerns about economic downturns in, or rising government debt levels of several European countries. These events may spread to other countries in Europe and may affect the value and liquidity of certain of Global Opportunities’ and International Opportunities’ investments.
As of March 31, 2014, Health Sciences Opportunities invested a significant portion of its assets in securities in the health care sector. Changes in economic conditions affecting the health care sector would have a greater impact on Health Sciences Opportunities and could affect the value, income and/or liquidity of positions in such securities.
As of March 31, 2014, Science & Technology Opportunities invested a significant portion of its assets in securities in the information technology sector. Changes in economic conditions affecting the information technology sector would have a greater impact on Science & Technology Opportunities and could affect the value, income and/or liquidity of positions in such securities.
As of March 31, 2014, Global Opportunities and International Opportunities invest a substantial amount of its assets in issuers located in a single country or a limited number of countries. When a Fund concentrates its investments in this manner, it assumes the risk that economic, political and social conditions in those countries may have a significant impact on its investment performance. Foreign issuers may not be subject to the same uniform accounting, auditing and financial reporting standards and practices as used in the United States. Foreign securities markets may also be less liquid, more volatile, and less subject to governmental supervision not typically associated with investing in U.S. securities. Please see the Schedule of Investments for concentrations in specific countries.
As of March 31, 2014, the Funds listed below had the following industry classifications:
| | | | | | | | |
| Industry | | Global
Opportunities | | | International
Opportunities | |
Banks | | | 11 | % | | | 11 | % |
Pharmaceuticals | | | 8 | | | | 11 | |
Oil, Gas & Consumable Fuels | | | 5 | | | | — | |
Internet Software & Services | | | 5 | | | | — | |
Electrical Equipment | | | 5 | | | | — | |
Machinery | | | — | | | | 5 | |
Other1 | | | 66 | | | | 73 | |
| | 1 | All other industries held were each less than 5% of long-term investments. |
| | | | | | |
| 76 | | BLACKROCK FUNDS | | MARCH 31, 2014 | | |
| | |
| Notes to Financial Statements (continued) | | |
10. Capital Share Transactions:
Transactions in capital shares for each class were as follows:
| | | | | | | | | | | | | | | | | | |
| | | Six Months Ended
March 31, 2014 | | | | | Year Ended
September 30, 2013 | |
| Global Opportunities | | Shares | | | Amount | | | | | Shares | | | Amount | |
Institutional | | | | | | | | | | | | | | | | | | |
Shares sold | | | 219,075 | | | $ | 3,135,250 | | | | | | 900,536 | | | $ | 10,824,975 | |
Shares issued in reinvestment of dividends | | | — | | | | — | | | | | | 25,716 | | | | 287,006 | |
Shares redeemed | | | (554,145 | ) | | | (7,873,890 | ) | | | | | (1,118,997 | ) | | | (13,606,954 | ) |
| | | | | | | | | | |
Net decrease | | | (335,070 | ) | | $ | (4,738,640 | ) | | | | | (192,745 | ) | | $ | (2,494,973 | ) |
| | | | | | | | | | |
| | | | | | | | | | | | | | | | | | |
Investor A | | | | | | | | | | | | | | | | | | |
Shares sold and automatic conversion of shares | | | 733,503 | | | $ | 10,518,848 | | | | | | 983,153 | | | $ | 12,029,511 | |
Shares issued in reinvestment of dividends | | | — | | | | — | | | | | | 151,938 | | | | 1,686,369 | |
Shares redeemed | | | (1,256,194 | ) | | | (17,995,675 | ) | | | | | (3,717,956 | ) | | | (44,389,095 | ) |
| | | | | | | | | | |
Net decrease | | | (522,691 | ) | | $ | (7,476,827 | ) | | | | | (2,582,865 | ) | | $ | (30,673,215 | ) |
| | | | | | | | | | |
| | | | | | | | | | | | | | | | | | |
Investor B | | | | | | | | | | | | | | | | | | |
Shares sold | | | 3,676 | | | $ | 49,533 | | | | | | 6,005 | | | $ | 69,439 | |
Shares issued in reinvestment of dividends | | | — | | | | — | | | | | | 393 | | | | 4,291 | |
Shares redeemed and automatic conversion of shares | | | (57,209 | ) | | | (794,904 | ) | | | | | (182,593 | ) | | | (2,163,633 | ) |
| | | | | | | | | | |
Net decrease | | | (53,533 | ) | | $ | (745,371 | ) | | | | | (176,195 | ) | | $ | (2,089,903 | ) |
| | | | | | | | | | |
| | | | | | | | | | | | | | | | | | |
Investor C | | | | | | | | | | | | | | | | | | |
Shares sold | | | 187,318 | | | $ | 2,587,558 | | | | | | 240,313 | | | $ | 2,848,497 | |
Shares issued in reinvestment of dividends | | | — | | | | — | | | | | | 8,422 | | | | 91,454 | |
Shares redeemed | | | (331,547 | ) | | | (4,579,784 | ) | | | | | (1,034,608 | ) | | | (11,931,416 | ) |
| | | | | | | | | | |
Net decrease | | | (144,229 | ) | | $ | (1,992,226 | ) | | | | | (785,873 | ) | | $ | (8,991,465 | ) |
| | | | | | | | | | |
| | | | | | | | | | | | | | | | | | |
Class R | | | | | | | | | | | | | | | | | | |
Shares sold | | | 132,611 | | | $ | 1,877,879 | | | | | | 225,687 | | | $ | 2,756,046 | |
Shares issued in reinvestment of dividends | | | — | | | | — | | | | | | 37,846 | | | | 422,279 | |
Shares redeemed | | | (226,123 | ) | | | (3,208,747 | ) | | | | | (518,590 | ) | | | (6,257,839 | ) |
| | | | | | | | | | |
Net decrease | | | (93,512 | ) | | $ | (1,330,868 | ) | | | | | (255,057 | ) | | $ | (3,079,514 | ) |
| | | | | | | | | | |
Total Net Decrease | | | (1,149,035 | ) | | $ | (16,283,932 | ) | | | | | (3,992,735 | ) | | $ | (47,329,070 | ) |
| | | | | | | | | | |
| | | | | | |
| | | BLACKROCK FUNDS | | MARCH 31, 2014 | | 77 |
| | |
| Notes to Financial Statements (continued) | | |
| | | | | | | | | | | | | | | | | | |
| | | Six Months Ended
March 31, 2014 | | | | | Year Ended
September 30, 2013 | |
| Health Sciences Opportunities | | Shares | | | Amount | | | | | Shares | | | Amount | |
Institutional | | | | | | | | | | | | | | | | | | |
Shares sold | | | 3,885,673 | | | $ | 172,723,306 | | | | | | 7,271,943 | | | $ | 270,912,421 | |
Shares issued in reinvestment of dividends and distributions | | | 1,752,835 | | | | 71,375,071 | | | | | | 947,294 | | | | 31,014,483 | |
Shares redeemed | | | (2,149,720 | ) | | | (94,632,773 | ) | | | | | (4,584,992 | ) | | | (164,966,314 | ) |
| | | | | | | | | | |
Net increase | | | 3,488,788 | | | $ | 149,465,604 | | | | | | 3,634,245 | | | $ | 136,960,590 | |
| | | | | | | | | | |
| | | | | | | | | | | | | | | | | | |
Service | | | | | | | | | | | | | | | | | | |
Shares sold | | | 159,308 | | | $ | 6,803,946 | | | | | | 240,670 | | | $ | 8,877,458 | |
Shares issued in reinvestment of dividends and distributions | | | 58,067 | | | | 2,296,543 | | | | | | 32,877 | | | | 1,048,425 | |
Shares redeemed | | | (116,932 | ) | | | (4,981,918 | ) | | | | | (167,877 | ) | | | (6,074,731 | ) |
| | | | | | | | | | |
Net increase | | | 100,443 | | | $ | 4,118,571 | | | | | | 105,670 | | | $ | 3,851,152 | |
| | | | | | | | | | |
| | | | | | | | | | | | | | | | | | |
Investor A | | | | | | | | | | | | | | | | | | |
Shares sold and automatic conversion of shares | | | 8,467,155 | | | $ | 364,241,999 | | | | | | 15,513,462 | | | $ | 573,984,707 | |
Shares issued in reinvestment of dividends and distributions | | | 4,007,405 | | | | 158,051,325 | | | | | | 2,174,190 | | | | 69,160,977 | |
Shares redeemed | | | (6,729,638 | ) | | | (286,901,278 | ) | | | | | (8,808,885 | ) | | | (320,516,414 | ) |
| | | | | | | | | | |
Net increase | | | 5,744,922 | | | $ | 235,392,046 | | | | | | 8,878,767 | | | $ | 322,629,270 | |
| | | | | | | | | | |
| | | | | | | | | | | | | | | | | | |
Investor B | | | | | | | | | | | | | | | | | | |
Shares sold | | | 16,462 | | | $ | 648,455 | | | | | | 40,757 | | | $ | 1,394,319 | |
Shares issued in reinvestment of distributions | | | 87,259 | | | | 3,209,380 | | | | | | 81,716 | | | | 2,433,479 | |
Shares redeemed and automatic conversion of shares | | | (327,793 | ) | | | (13,086,694 | ) | | | | | (406,783 | ) | | | (13,925,331 | ) |
| | | | | | | | | | |
Net decrease | | | (224,072 | ) | | $ | (9,228,859 | ) | | | | | (284,310 | ) | | $ | (10,097,533 | ) |
| | | | | | | | | | |
| | | | | | | | | | | | | | | | | | |
Investor C | | | | | | | | | | | | | | | | | | |
Shares sold | | | 2,537,913 | | | $ | 100,642,391 | | | | | | 4,436,444 | | | $ | 153,562,755 | |
Shares issued in reinvestment of dividends and distributions | | | 1,589,321 | | | | 57,803,090 | | | | | | 835,814 | | | | 24,731,781 | |
Shares redeemed | | | (1,296,936 | ) | | | (51,057,727 | ) | | | | | (2,178,383 | ) | | | (72,667,229 | ) |
| | | | | | | | | | |
Net increase | | | 2,830,298 | | | $ | 107,387,754 | | | | | | 3,093,875 | | | $ | 105,627,307 | |
| | | | | | | | | | |
| | | | | | | | | | | | | | | | | | |
Class R | | | | | | | | | | | | | | | | | | |
Shares sold | | | 607,457 | | | $ | 25,867,238 | | | | | | 527,329 | | | $ | 19,843,444 | |
Shares issued in reinvestment of dividends and distributions | | | 94,950 | | | | 3,718,232 | | | | | | 32,122 | | | | 1,017,311 | |
Shares redeemed | | | (161,776 | ) | | | (6,823,009 | ) | | | | | (243,794 | ) | | | (8,998,067 | ) |
| | | | | | | | | | |
Net increase | | | 540,631 | | | $ | 22,762,461 | | | | | | 315,657 | | | $ | 11,862,688 | |
| | | | | | | | | | |
Total Net Increase | | | 12,481,010 | | | $ | 509,897,577 | | | | | | 15,743,904 | | | $ | 570,833,474 | |
| | | | | | | | | | |
| | | | | | |
| 78 | | BLACKROCK FUNDS | | MARCH 31, 2014 | | |
| | |
| Notes to Financial Statements (continued) | | |
| | | | | | | | | | | | | | | | | | |
| | | Six Months Ended
March 31, 2014 | | | | | Year Ended
September 30, 2013 | |
| International Opportunities | | Shares | | | Amount | | | | | Shares | | | Amount | |
Institutional | | | | | | | | | | | | | | | | | | |
Shares sold | | | 2,771,634 | | | $ | 113,406,005 | | | | | | 5,587,155 | | | $ | 198,989,870 | |
Shares issued in reinvestment of dividends | | | 77,908 | | | | 3,096,053 | | | | | | 348,371 | | | | 11,715,714 | |
Shares redeemed | | | (2,206,664 | ) | | | (90,579,448 | ) | | | | | (10,155,458 | ) | | | (366,236,469 | ) |
| | | | | | | | | | |
Net increase (decrease) | | | 642,878 | | | $ | 25,922,610 | | | | | | (4,219,932 | ) | | $ | (155,530,885 | ) |
| | | | | | | | | | |
| | | | | | | | | | | | | | | | | | |
Service | | | | | | | | | | | | | | | | | | |
Shares sold | | | 68,396 | | | $ | 2,694,636 | | | | | | 199,975 | | | $ | 6,986,076 | |
Shares issued in reinvestment of dividends | | | 3,881 | | | | 148,540 | | | | | | 17,109 | | | | 556,385 | |
Shares redeemed | | | (143,710 | ) | | | (5,605,802 | ) | | | | | (622,329 | ) | | | (21,540,900 | ) |
| | | | | | | | | | |
Net decrease | | | (71,433 | ) | | $ | (2,762,626 | ) | | | | | (405,245 | ) | | $ | (13,998,439 | ) |
| | | | | | | | | | |
| | | | | | | | | | | | | | | | | | |
Investor A | | | | | | | | | | | | | | | | | | |
Shares sold and automatic conversion of shares | | | 2,526,804 | | | $ | 98,890,456 | | | | | | 4,730,422 | | | $ | 163,123,349 | |
Shares issued in reinvestment of dividends | | | 74,728 | | | | 2,832,191 | | | | | | 305,190 | | | | 9,814,892 | |
Shares redeemed | | | (2,477,385 | ) | | | (96,399,240 | ) | | | | | (6,674,726 | ) | | | (228,622,684 | ) |
| | | | | | | | | | |
Net increase (decrease) | | | 124,147 | | | $ | 5,323,407 | | | | | | (1,639,114 | ) | | $ | (55,684,443 | ) |
| | | | | | | | | | |
| | | | | | | | | | | | | | | | | | |
Investor B | | | | | | | | | | | | | | | | | | |
Shares sold | | | 2,238 | | | $ | 81,684 | | | | | | 3,535 | | | $ | 111,956 | |
Shares issued in reinvestment of dividends | | | 389 | | | | 13,713 | | | | | | 1,613 | | | | 48,633 | |
Shares redeemed and automatic conversion of shares | | | (78,564 | ) | | | (2,849,988 | ) | | | | | (186,183 | ) | | | (5,930,072 | ) |
| | | | | | | | | | |
Net decrease | | | (75,937 | ) | | $ | (2,754,591 | ) | | | | | (181,035 | ) | | $ | (5,769,483 | ) |
| | | | | | | | | | |
| | | | | | | | | | | | | | | | | | |
Investor C | | | | | | | | | | | | | | | | | | |
Shares sold | | | 338,431 | | | $ | 12,168,516 | | | | | | 437,479 | | | $ | 13,891,319 | |
Shares issued in reinvestment of dividends | | | 11,153 | | | | 389,466 | | | | | | 34,281 | | | | 1,022,570 | |
Shares redeemed | | | (471,310 | ) | | | (16,877,316 | ) | | | | | (1,256,630 | ) | | | (39,257,153 | ) |
| | | | | | | | | | |
Net decrease | | | (121,726 | ) | | $ | (4,319,334 | ) | | | | | (784,870 | ) | | $ | (24,343,264 | ) |
| | | | | | | | | | |
Total Net Increase (Decrease) | | | 497,929 | | | $ | 21,409,466 | | | | | | (7,230,196 | ) | | $ | (255,326,514 | ) |
| | | | | | | | | | |
| | | | | | |
| | | BLACKROCK FUNDS | | MARCH 31, 2014 | | 79 |
| | |
| Notes to Financial Statements (continued) | | |
| | | | | | | | | | | | | | | | | | |
| | | Six Months Ended
March 31, 2104 | | | | | Year Ended
September 30, 2013 | |
| Science & Technology Opportunities | | Shares | | | Amount | | | | | Shares | | | Amount | |
Institutional | | | | | | | | | | | | | | | | | | |
Shares sold | | | 705,824 | | | $ | 10,146,033 | | | | | | 646,035 | | | $ | 6,597,183 | |
Shares redeemed | | | (232,349 | ) | | | (3,193,962 | ) | | | | | (1,092,435 | ) | | | (10,953,075 | ) |
| | | | | | | | | | |
Net increase (decrease) | | | 473,475 | | | $ | 6,952,071 | | | | | | (446,400 | ) | | $ | (4,355,892 | ) |
| | | | | | | | | | |
| | | | | | | | | | | | | | | | | | |
Service | | | | | | | | | | | | | | | | | | |
Shares sold | | | 88,556 | | | $ | 1,256,191 | | | | | | 11,578 | | | $ | 114,954 | |
Shares redeemed | | | (20,077 | ) | | | (273,602 | ) | | | | | (35,757 | ) | | | (352,108 | ) |
| | | | | | | | | | |
Net increase (decrease) | | | 68,479 | | | $ | 982,589 | | | | | | (24,179 | ) | | $ | (237,154 | ) |
| | | | | | | | | | |
| | | | | | | | | | | | | | | | | | |
Investor A | | | | | | | | | | | | | | | | | | |
Shares sold and automatic conversion of shares | | | 2,337,367 | | | $ | 31,335,884 | | | | | | 1,022,457 | | | $ | 10,053,977 | |
Shares redeemed | | | (798,050 | ) | | | (10,381,779 | ) | | | | | (3,828,731 | ) | | | (36,397,727 | ) |
| | | | | | | | | | |
Net increase (decrease) | | | 1,539,317 | | | $ | 20,954,105 | | | | | | (2,806,274 | ) | | $ | (26,343,750 | ) |
| | | | | | | | | | |
| | | | | | | | | | | | | | | | | | |
Investor B | | | | | | | | | | | | | | | | | | |
Shares sold | | | 40,865 | | | $ | 461,322 | | | | | | 5,932 | | | $ | 52,024 | |
Shares redeemed and automatic conversion of shares | | | (68,746 | ) | | | (799,335 | ) | | | | | (95,224 | ) | | | (833,016 | ) |
| | | | | | | | | | |
Net decrease | | | (27,881 | ) | | $ | (338,013 | ) | | | | | (89,292 | ) | | $ | (780,992 | ) |
| | | | | | | | | | |
| | | | | | | | | | | | | | | | | | |
Investor C | | | | | | | | | | | | | | | | | | |
Shares sold | | | 443,273 | | | $ | 5,311,282 | | | | | | 580,185 | | | $ | 4,978,794 | |
Shares redeemed | | | (226,554 | ) | | | (2,611,850 | ) | | | | | (955,659 | ) | | | (8,454,877 | ) |
| | | | | | | | | | |
Net increase (decrease) | | | 216,719 | | | $ | 2,699,432 | | | | | | (375,474 | ) | | $ | (3,476,083 | ) |
| | | | | | | | | | |
| | | | | | | | | | | | | | | | | | |
Class R | | | | | | | | | | | | | | | | | | |
Shares sold | | | 100,491 | | | $ | 1,356,870 | | | | | | 210,207 | | | $ | 2,108,715 | |
Shares redeemed | | | (141,568 | ) | | | (1,916,063 | ) | | | | | (270,916 | ) | | | (2,738,556 | ) |
| | | | | | | | | | |
Net decrease | | | (41,077 | ) | | $ | (559,193 | ) | | | | | (60,709 | ) | | $ | (629,841 | ) |
| | | | | | | | | | |
Total Net Increase (Decrease) | | | 2,229,032 | | | $ | 30,690,991 | | | | | | (3,802,328 | ) | | $ | (35,823,712 | ) |
| | | | | | | | | | |
| | | | | | |
| 80 | | BLACKROCK FUNDS | | MARCH 31, 2014 | | |
| | |
| Notes to Financial Statements (concluded) | | |
| | | | | | | | | | | | | | | | | | |
| | | Six Months Ended
March 31, 2014 | | | | | Year Ended
September 30, 2013 | |
| U.S. Opportunities | | Shares | | | Amount | | | | | Shares | | | Amount | |
Institutional | | | | | | | | | | | | | | | | | | |
Shares sold | | | 1,209,294 | | | $ | 51,933,708 | | | | | | 4,007,426 | | | $ | 156,939,783 | |
Shares issued in reinvestment of dividends and distributions | | | 3,132,585 | | | | 120,980,318 | | | | | | 938,471 | | | | 33,306,300 | |
Shares redeemed | | | (2,323,423 | ) | | | (99,011,634 | ) | | | | | (25,739,110 | ) | | | (998,504,847 | ) |
| | | | | | | | | | |
Net increase (decrease) | | | 2,018,456 | | | $ | 73,902,392 | | | | | | (20,793,213 | ) | | $ | (808,258,764 | ) |
| | | | | | | | | | |
| | | | | | | | | | | | | | | | | | |
Service | | | | | | | | | | | | | | | | | | |
Shares sold | | | 22,738 | | | $ | 931,684 | | | | | | 56,911 | | | $ | 2,132,995 | |
Shares issued in reinvestment of dividends and distributions | | | 846,209 | | | | 30,945,870 | | | | | | 112,947 | | | | 3,836,814 | |
Shares redeemed | | | (532,369 | ) | | | (21,431,974 | ) | | | | | (1,223,272 | ) | | | (46,343,743 | ) |
| | | | | | | | | | |
Net increase (decrease) | | | 336,578 | | | $ | 10,445,580 | | | | | | (1,053,414 | ) | | $ | (40,373,934 | ) |
| | | | | | | | | | |
| | | | | | | | | | | | | | | | | | |
Investor A | | | | | | | | | | | | | | | | | | |
Shares sold and automatic conversion of shares | | | 893,332 | | | $ | 35,223,685 | | | | | | 1,400,610 | | | $ | 52,695,526 | |
Shares issued in reinvestment of dividends and distributions | | | 2,833,685 | | | | 102,239,143 | | | | | | 391,969 | | | | 13,174,024 | |
Shares redeemed | | | (2,451,818 | ) | | | (97,520,441 | ) | | | | | (7,738,284 | ) | | | (287,998,683 | ) |
| | | | | | | | | | |
Net increase (decrease) | | | 1,275,199 | | | $ | 39,942,387 | | | | | | (5,945,705 | ) | | $ | (222,129,133 | ) |
| | | | | | | | | | |
| | | | | | | | | | | | | | | | | | |
Investor B | | | | | | | | | | | | | | | | | | |
Shares sold | | | 6,421 | | | $ | 210,577 | | | | | | 4,500 | | | $ | 156,314 | |
Shares issued in reinvestment of distributions | | | 91,556 | | | | 2,859,297 | | | | | | 9,883 | | | | 296,795 | |
Shares redeemed and automatic conversion of shares | | | (61,726 | ) | | | (2,102,116 | ) | | | | | (90,701 | ) | | | (3,021,414 | ) |
| | | | | | | | | | |
Net increase (decrease) | | | 36,251 | | | $ | 967,758 | | | | | | (76,318 | ) | | $ | (2,568,305 | ) |
| | | | | | | | | | |
| | | | | | | | | | | | | | | | | | |
Investor C | | | | | | | | | | | | | | | | | | |
Shares sold | | | 178,769 | | | $ | 6,209,869 | | | | | | 251,773 | | | $ | 8,443,541 | |
Shares issued in reinvestment of distributions | | | 1,461,947 | | | | 45,714,858 | | | | | | 164,304 | | | | 4,938,957 | |
Shares redeemed | | | (674,848 | ) | | | (23,604,444 | ) | | | | | (2,258,436 | ) | | | (73,526,723 | ) |
| | | | | | | | | | |
Net increase (decrease) | | | 965,868 | | | $ | 28,320,283 | | | | | | (1,842,359 | ) | | $ | (60,144,225 | ) |
| | | | | | | | | | |
Total Net Increase (Decrease) | | | 4,632,352 | | | $ | 153,578,400 | | | | | | (29,711,009 | ) | | $ | (1,133,474,361 | ) |
| | | | | | | | | | |
11. Subsequent Events:
Management’s evaluation of the impact of all subsequent events on the Funds’ financial statements was completed through the date the financial statements were issued and the following item was noted:
Effective April 24, 2014, the credit agreement was terminated and a new agreement was entered into. The Funds became a party to a 364-day, $1.1 billion credit agreement, which expires in April 2015. Excluding commitments designated for a certain individual fund, the Funds can borrow up to an aggregate commitment amount of $650 million, subject to asset coverage and other limitations as specified in the agreement. The credit agreement has the following terms: a fee of 0.06% per annum on unused commitment amounts and interest at a rate equal to the higher of (a) the one-month LIBOR plus 0.80% per annum or (b) the Fed Funds rate plus 0.80% per annum on amounts borrowed.
| | | | | | |
| | | BLACKROCK FUNDS | | MARCH 31, 2014 | | 81 |
Ronald W. Forbes, Co-Chairman of the Board and Trustee
Rodney D. Johnson, Co-Chairman of the Board and Trustee
Paul L. Audet, Trustee
David O. Beim, Trustee
Henry Gabbay, Trustee
Dr. Matina S. Horner, Trustee
Herbert I. London, Trustee
Ian A. MacKinnon, Trustee
Cynthia A. Montgomery, Trustee
Joseph P. Platt, Trustee
Robert C. Robb, Jr., Trustee
Toby Rosenblatt, Trustee
Kenneth L. Urish, Trustee
Frederick W. Winter, Trustee
John M. Perlowski, President and Chief Executive Officer
Richard Hoerner, CFA, Vice President
Brendan Kyne, Vice President
Neal Andrews, Chief Financial Officer
Jay Fife, Treasurer
Brian Kindelan, Chief Compliance Officer and Anti-Money Laundering Officer
Benjamin Archibald, Secretary
Investment Advisor and Co-Administrator
BlackRock Advisors, LLC
Wilmington, DE 19809
Sub-Advisors
BlackRock Financial Management, Inc.1
New York, NY 10055
Accounting Agent, Co-Administrator and Transfer Agent
BNY Mellon Investment Servicing (US) Inc.
Wilmington, DE 19809
Custodian
The Bank of New York Mellon
New York, NY 10286
Distributor
BlackRock Investments, LLC
New York, NY 10022
Legal Counsel
Sidley Austin LLP
New York, NY 10019
Independent Registered Public Accounting Firm
Deloitte & Touche LLP
Philadelphia, PA 19103
Address of the Trust
100 Bellevue Parkway
Wilmington, DE 19809
| | 1 | For Global Opportunities. |
| | | | | | |
| 82 | | BLACKROCK FUNDS | | MARCH 31, 2014 | | |
Electronic Delivery
Electronic copies of most financial reports and prospectuses are available on the Funds’ website or shareholders can sign up for e-mail notifications of quarterly statements, annual and semi-annual reports and prospectuses by enrolling in the Funds’ electronic delivery program.
To enroll:
Shareholders Who Hold Accounts with Investment Advisors, Banks or Brokerages:
Please contact your financial advisor. Please note that not all investment advisors, banks or brokerages may offer this service.
Shareholders Who Hold Accounts Directly With BlackRock:
| 1) | Access the BlackRock website at |
| | http://www.blackrock.com/ edelivery |
| 2) | Select “eDelivery��� under the “More Information” section |
Householding
The Funds will mail only one copy of shareholder documents, including prospectuses, annual and semi-annual reports and proxy statements, to shareholders with multiple accounts at the same address. This practice is commonly called “householding” and is intended to reduce expenses and eliminate duplicate mailings of shareholder documents. Mailings of your shareholder documents may be householded indefinitely unless you instruct us otherwise. If you do not want the mailing of these documents to be combined with those for other members of your household, please call the Funds at (800) 441-7762.
Availability of Quarterly Schedule of Investments
The Funds file their complete schedule of portfolio holdings with the SEC for the first and third quarters of each fiscal year on Form N-Q. The Funds’ Forms N-Q are available on the SEC’s website at http:// www.sec.gov and may also be reviewed and copied at the SEC’s Public Reference Room in Washington, D.C. Information on how to access documents on the SEC’s website without charge may be obtained by calling (800) SEC-0330. The Funds’ Forms N-Q may also be obtained upon request and without charge by calling (800) 441-7762.
Availability of Proxy Voting Policies and Procedures
A description of the policies and procedures that the Funds use to determine how to vote proxies relating to portfolio securities is available (1) without charge, upon request by calling (800) 441-7762; (2) at http://www.blackrock.com; and (3) on the SEC’s website at http:// www.sec.gov.
Availability of Proxy Voting Record
Information about how the Funds voted proxies relating to securities held in the Funds’ portfolios during the most recent 12-month period ended June 30 is available upon request, and without charge (1) at http://www.blackrock.com or by calling (800) 441-7762 and (2) on the SEC’s website at http://www.sec.gov.
Account Information
Call us at (800) 441-7762 from 8:00 AM to 6:00 PM EST on any business day to get information about your account balances, recent transactions and share prices. You can also reach us on the Web at http:// www.blackrock.com/funds.
Automatic Investment Plans
Investor Class shareholders who want to invest regularly can arrange to have $50 or more automatically deducted from their checking or savings account and invested in any of the BlackRock funds.
Systematic Withdrawal Plans
Investor Class shareholders can establish a systematic withdrawal plan and receive periodic payments of $50 or more from their BlackRock funds, as long as their account balance is at least $10,000.
Retirement Plans
Shareholders may make investments in conjunction with Traditional, Rollover, Roth, Coverdell, Simple IRAs, SEP IRAs and 403(b) Plans.
| | | | | | |
| | | BLACKROCK FUNDS | | MARCH 31, 2014 | | 83 |
| | |
| Additional Information (concluded) | | |
|
| BlackRock Privacy Principles |
BlackRock is committed to maintaining the privacy of its current and former fund investors and individual clients (collectively, “Clients”) and to safeguarding their non-public personal information. The following information is provided to help you understand what personal information BlackRock collects, how we protect that information and why in certain cases we share such information with select parties.
If you are located in a jurisdiction where specific laws, rules or regulations require BlackRock to provide you with additional or different privacy-related rights beyond what is set forth below, then BlackRock will comply with those specific laws, rules or regulations.
BlackRock obtains or verifies personal non-public information from and about you from different sources, including the following: (i) information we receive from you or, if applicable, your financial intermediary, on applications, forms or other documents; (ii) information about your transactions with us, our affiliates, or others; (iii) information we receive from a consumer reporting agency; and (iv) from visits to our websites.
BlackRock does not sell or disclose to non-affiliated third parties any non-public personal information about its Clients, except as permitted by law or as is necessary to respond to regulatory requests or to service Client accounts. These non-affiliated third parties are required to protect the confidentiality and security of this information and to use it only for its intended purpose.
We may share information with our affiliates to service your account or to provide you with information about other BlackRock products or services that may be of interest to you. In addition, BlackRock restricts access to non-public personal information about its Clients to those BlackRock employees with a legitimate business need for the information. BlackRock maintains physical, electronic and procedural safeguards that are designed to protect the non-public personal information of its Clients, including procedures relating to the proper storage and disposal of such information.
| | | | | | |
| 84 | | BLACKROCK FUNDS | | MARCH 31, 2014 | | |
| | |
| A World-Class Mutual Fund Family | | |
BlackRock offers a diverse lineup of open-end mutual funds crossing all investment styles and managed by experts in equity, fixed income and tax-exempt investing.
BlackRock ACWI ex-US Index Fund
BlackRock All-Cap Energy & Resources Portfolio
BlackRock Basic Value Fund
BlackRock Capital Appreciation Fund
BlackRock Commodity Strategies Fund
BlackRock Disciplined Small Cap Core Fund
BlackRock Emerging Markets Dividend Fund
BlackRock Emerging Markets Fund
BlackRock Emerging Markets Long/Short
Equity Fund
BlackRock Energy & Resources Portfolio
BlackRock Equity Dividend Fund
BlackRock EuroFund
BlackRock Flexible Equity Fund
BlackRock Focus Growth Fund
BlackRock Global Dividend Portfolio
BlackRock Global Long/Short Equity Fund
BlackRock Global Opportunities Portfolio
BlackRock Global SmallCap Fund
BlackRock Health Sciences Opportunities Portfolio
BlackRock International Fund
BlackRock International Index Fund
BlackRock International Opportunities Portfolio
BlackRock Large Cap Core Fund
BlackRock Large Cap Core Plus Fund
BlackRock Large Cap Growth Fund
BlackRock Large Cap Value Fund
BlackRock Latin America Fund
BlackRock Long-Horizon Equity Fund
BlackRock Mid-Cap Growth Equity Portfolio
BlackRock Mid-Cap Value Opportunities Fund
BlackRock Natural Resources Trust
BlackRock Pacific Fund
BlackRock Real Estate Securities Fund
BlackRock Russell 1000® Index Fund
BlackRock Science & Technology
Opportunities Portfolio
BlackRock Small Cap Growth Equity Portfolio
BlackRock Small Cap Growth Fund II
BlackRock Small Cap Index Fund
BlackRock S&P 500 Stock Fund
BlackRock U.S. Opportunities Portfolio
BlackRock Value Opportunities Fund
| | | | |
| Taxable Fixed Income Funds | | | | |
BlackRock Bond Index Fund
BlackRock Core Bond Portfolio
BlackRock CoreAlpha Bond Fund
BlackRock CoRI Funds
2015
2017
2019
2021
2023
BlackRock Emerging Markets Flexible Dynamic
Bond Portfolio
BlackRock Floating Rate Income Portfolio
BlackRock Global Long/Short Credit Fund
BlackRock GNMA Portfolio
BlackRock High Yield Bond Portfolio
BlackRock Inflation Protected Bond Portfolio
BlackRock Investment Grade Bond Portfolio
BlackRock Low Duration Bond Portfolio
BlackRock Secured Credit Portfolio
BlackRock Short Obligations Fund
BlackRock Short-Term Treasury Fund
BlackRock Strategic Income Opportunities Portfolio
BlackRock Total Return Fund
BlackRock U.S. Government Bond Portfolio
BlackRock U.S. Mortgage Portfolio
BlackRock Ultra-Short Obligations Fund
BlackRock World Income Fund
| | | | |
| Municipal Fixed Income Funds |
BlackRock California Municipal Bond Fund
BlackRock High Yield Municipal Fund
BlackRock National Municipal Fund
BlackRock New Jersey Municipal Bond Fund
BlackRock New York Municipal Bond Fund
BlackRock Pennsylvania Municipal Bond Fund
BlackRock Short-Term Municipal Fund
BlackRock Strategic Municipal Opportunities Fund
| | | | | | | | | | | | | | |
| BlackRock Balanced Capital Fund | | LifePath Active Portfolios | | LifePath Index Portfolios |
| BlackRock Emerging Market Allocation Portfolio | | 2015 | | | 2040 | | | | | Retirement | | 2040 | | |
| BlackRock Global Allocation Fund | | 2020 | | | 2045 | | | | | 2020 | | 2045 | | |
| BlackRock Managed Volatility Portfolio | | 2025 | | | 2050 | | | | | 2025 | | 2050 | | |
| BlackRock Multi-Asset Income Portfolio | | 2030 | | | 2055 | | | | | 2030 | | 2055 | | |
| BlackRock Multi-Asset Real Return Fund | | 2035 | | | | | | | | 2035 | | | | |
| BlackRock Strategic Risk Allocation Fund | | | | | | | | | | | | | | |
| | | | | | |
| BlackRock Prepared Portfolios | | LifePath Portfolios | | | | | | | | | | | | |
Conservative Prepared Portfolio | | Retirement | | | 2040 | | | | | | | | | |
Moderate Prepared Portfolio | | 2020 | | | 2045 | | | | | | | | | |
Growth Prepared Portfolio | | 2025 | | | 2050 | | | | | | | | | |
Aggressive Growth Prepared Portfolio | | 2030 | | | 2055 | | | | | | | | | |
| | 2035 | | | | | | | | | | | | |
BlackRock mutual funds are currently distributed by BlackRock Investments, LLC. You should consider the investment objectives, risks, charges and expenses of the funds under consideration carefully before investing. Each fund’s prospectus contains this and other information and is available at www.blackrock.com or by calling (800) 441-7762 or from your financial advisor. The prospectus should be read carefully before investing.
| | | | | | |
| | | BLACKROCK FUNDS | | MARCH 31, 2014 | | 85 |
This report is transmitted to shareholders only. It is not authorized for use as an offer of sale or a solicitation of an offer to buy shares of the Funds unless accompanied or preceded by that Fund’s current prospectus. Past performance results shown in this report should not be considered a representation of future performance. Investment returns and principal value of shares will fluctuate so that shares, when redeemed, may be worth more or less than their original cost. Statements and other information herein are as dated and are subject to change.
Investment in foreign securities involves special risks including fluctuating foreign exchange rates, foreign government regulations, differing degrees of liquidity and the possibility of substantial volatility due to adverse political, economic or other developments.

| | |
| |
Eq-Opps-3/14-SAR | |  |
MARCH 31, 2014
| | | | |
SEMI-ANNUAL REPORT (UNAUDITED) | | | | BLACKROCK® |
BlackRock Managed Volatility Portfolio | of BlackRock FundsSM
| | |
| Not FDIC Insured ¡ May Lose Value ¡ No Bank Guarantee | | |
| | | | | | |
| 2 | | BLACKROCK MANAGED VOLATILITY PORTFOLIO | | MARCH 31, 2014 | | |
Shareholder Letter
Dear Shareholder,
One year ago, U.S. financial markets were improving despite a sluggish global economy, as easy monetary policy provided investors with enough conviction to take on more risk in their portfolios. Slow but positive growth in the U.S. was sufficient to support corporate earnings, while uncomfortably high unemployment reinforced expectations that the Federal Reserve would continue to maintain its aggressive monetary stimulus programs.
Sentiment swiftly reversed in May when then-Fed Chairman Bernanke first mentioned the possibility of reducing (or “tapering”) the central bank’s asset purchase programs — comments that were widely misinterpreted as signaling an end to the Fed’s zero-interest-rate policy. U.S. Treasury yields rose sharply, triggering a steep sell-off across fixed income markets. (Bond prices move in the opposite direction of yields.) Global equities also suffered as investors feared the implications of a potential end to a program that had greatly supported the markets. Emerging markets, which are more sensitive to changes in global liquidity, were particularly hurt by the prospect of ebbing cash flows from the U.S. Markets rebounded in late June, however, when the Fed’s tone turned more dovish, and improving economic indicators and better corporate earnings helped extend gains through most of the summer.
Although the tone of economic and financial news was mixed during the autumn, it was a surprisingly positive period for most asset classes. Early on, the Fed defied market expectations with its decision to delay tapering, but higher volatility returned in late September when the U.S. Treasury Department warned that the national debt would soon breach its statutory maximum. The ensuing political brinksmanship led to a partial government shutdown, roiling global financial markets through the first half of October. Equities and other so-called “risk assets” managed to resume their rally when politicians engineered a compromise to reopen the government and extend the debt ceiling.
The remainder of 2013 was generally positive for stock markets in the developed world, although investors continued to grapple with uncertainty about when and how much the Fed would scale back on stimulus. When the Fed ultimately announced its tapering plans in mid-December, markets reacted positively, as this action signaled the Fed’s perception of real improvement in the economy, and investors were finally relieved from the anxiety that had gripped them for quite some time.
The start of the new year brought another turn in sentiment, as heightened risks in emerging markets and mixed U.S. economic data caused global equities to weaken in January while bond markets found renewed strength. Although these headwinds persisted, equities were back on the rise in February as investors were encouraged by a one-year extension of the U.S. debt ceiling and market-friendly comments from the Fed’s new Chairwoman, Janet Yellen. While U.S. economic data pointed to softer growth, investors viewed this trend as temporarily driven by poor winter weather and continued adding risk to their portfolios on the belief that growth would pick up in the coming months. In March, markets focused on decelerating growth in China and tensions between Russia and Ukraine over the disputed region of Crimea. Additionally, investors were caught off guard by a statement from Chairwoman Yellen indicating that the Fed may raise short-term interest rates earlier than the markets had previously forecasted. Bond markets came under pressure as the middle of the yield curve vaulted higher in response to the unexpected shift in forward guidance.
Against a backdrop of modest economic growth, investors over the past year remained highly attuned to potential changes in monetary policy. Despite the fact that markets were gearing up for a modest shift toward tighter conditions from the Fed, equity markets in the developed world generated strong returns for the six- and 12-month periods ended March 31, with stocks in the United States performing particularly well. In contrast, emerging markets were weighed down by concerns about reduced global liquidity, severe currency weakness, high levels of debt and uneven growth.
Interest rate uncertainty posed a headwind for fixed income assets, and higher-quality sectors of the market experienced heightened volatility and poor performance over the reporting period. High yield bonds, however, benefited from income-oriented investors’ search for yield in the overall low-rate environment. Short-term interest rates remained near zero, keeping yields on money market securities close to historic lows.
At BlackRock, we believe investors need to think globally, extend their scope across a broad array of asset classes and be prepared to move freely as market conditions change over time. We encourage you to talk with your financial advisor and visit www.blackrock.com for further insight about investing in today’s world.
Sincerely,

Rob Kapito
President, BlackRock Advisors, LLC

In a modest global growth environment, expectations around monetary policy changes continued to be a key theme in financial market performance.
Rob Kapito
President, BlackRock Advisors, LLC
| | | | | | | | |
| Total Returns as of March 31, 2014 | |
| | | 6-month | | | 12-month | |
U.S. large cap equities (S&P 500® Index) | | | 12.51 | % | | | 21.86 | % |
U.S. small cap equities
(Russell 2000® Index) | | | 9.94 | | | | 24.90 | |
International equities
(MSCI Europe, Australasia, Far East Index) | | | 6.41 | | | | 17.56 | |
Emerging market equities
(MSCI Emerging Markets Index) | | | 1.39 | | | | (1.43 | ) |
3-month Treasury bill
(BofA Merrill Lynch
3-Month U.S. Treasury
Bill Index) | | | 0.03 | | | | 0.07 | |
U.S. Treasury securities
(BofA Merrill Lynch
10-Year U.S. Treasury
Index) | | | 0.85 | | | | (4.38 | ) |
U.S. investment grade
bonds (Barclays U.S.
Aggregate Bond Index) | | | 1.70 | | | | (0.10 | ) |
Tax-exempt municipal
bonds (S&P Municipal Bond Index) | | | 3.91 | | | | 0.31 | |
U.S. high yield bonds
(Barclays U.S. Corporate
High Yield 2% Issuer
Capped Index) | | | 6.66 | | | | 7.53 | |
|
| Past performance is no guarantee of future results. Index performance is shown for illustrative purposes only. You cannot invest directly in an index. | |
| | | | | | | | |
| | | THIS PAGE NOT PART OF YOUR FUND REPORT | | | | | 3 | |
| | |
| Fund Summary as of March 31, 2014 | | |
BlackRock Managed Volatility Portfolio’s (the “Fund”) investment objective is to seek total return.
|
| Portfolio Management Commentary |
How did the Fund perform?
| Ÿ | | For the six-month period ended March 31, 2014, the Fund underperformed its reference benchmark (50% MSCI All Country World Index (“MSCI ACWI”)/50% Citigroup World Government Bond Index (hedged into USD) (“Citigroup WGBI (hedged into USD)”). |
What factors influenced performance?
| Ÿ | | The Fund’s modest overweight to Japanese equities weighed on returns as the country’s stock market underperformed other developed markets during the period. Within U.S. stocks, health care and consumer discretionary positions that were added to the Fund toward the end of the period detracted from performance as both sectors underperformed broad equities during March. Within fixed income, a significant underweight to duration (low sensitivity to interest rate movements) detracted from performance as yields generally fell across developed markets amid signs of softening economic data, most notably in the U.S. (Bond prices fall as yields rise.) Lastly, the Fund held a higher-than-normal allocation to cash given a generally cautious view on valuations in equity and fixed income markets during the period. The cash position hindered relative results as both equities and fixed income assets generated positive returns over the period. |
| Ÿ | | Contributing positively to performance was the Fund’s bias toward developed market equities, which broadly outperformed their emerging market counterparts during the period amid heightened volatility in several emerging market economies. Specifically, overweights in Germany and France buoyed performance as both countries continued to demonstrate economic momentum relative to the rest of the eurozone. In the U.S., overweight positions in financials and information technology (“IT”) had a positive impact on returns as these sectors outperformed broad equities over the period. Additionally, the Fund’s underweight to the Japanese yen was a significant contributor to performance as the currency continued to weaken relative to the U.S. dollar during the period given massive economic stimulus from the Bank of Japan. |
| Ÿ | | The Fund uses derivatives as part of its investment strategy. During the period, the use of foreign currency exchange contracts had a positive impact on performance, most notably due to a short position in the yen. Over the period, the Fund used derivatives to gain equity exposure in Germany, Japan and France. Exposures to French and German equity markets added to performance as both markets moved higher during the |
| | | period. Japanese equities, however, lagged broader international equities. The Fund also held two futures positions in 10-year Australian and Treasury bonds. |
Describe recent portfolio activity.
| Ÿ | | From a broad asset allocation perspective, the Fund significantly reduced exposure to equities throughout the period, most notably in the U.S., given broader macro concerns in several emerging markets and softer-than-expected economic data in the U.S. Following the stock market correction earlier in 2014, U.S. and European equities rallied strongly in February, reaching all-time highs and prompting a decision to take profits and wait for more attractive re-entry points. Despite the general reduction in equity exposure, in February, the Fund added new positions in U.S. health care and French stocks, both overweight relative to the benchmark index, and increased the existing overweights to German and Japanese stocks. |
| Ÿ | | Additionally, as credit markets continued to outpace core fixed income sectors with credit spreads tightening over recent months, the Fund decreased exposure to credit, capturing gains on those positions and rotating into cash. Finally, the Fund added an Australian 10-year bond position in late March, largely driven by attractive valuations relative to the U.S. and the likelihood of slower economic growth in the region resulting in declining yields. |
Describe portfolio positioning at period end.
| Ÿ | | Relative to the reference benchmark, the Fund ended the period underweight in both equities and fixed income, while continuing to hold an allocation to cash and cash equivalents. |
| Ÿ | | Within equities, the Fund continued to hold overweight positions in Germany, France and Japan given recent improvement in Europe’s economic landscape and the likelihood that massive economic stimulus will continue to support risk assets in Japan. In the U.S., the Fund was overweight in financials, health care, IT and consumer discretionary stocks. |
| Ÿ | | In fixed income, the Fund remained underweight in core fixed income in the U.S. and held a long position in Australian bonds. The Fund’s fixed income allocation ended the period with a shorter duration relative to the fixed income portion of the reference benchmark. Additionally, the Fund was underweight in both the yen and euro relative to the benchmark index. |
The views expressed reflect the opinions of BlackRock as of the date of this report and are subject to change based on changes in market, economic or other conditions. These views are not intended to be a forecast of future events and are no guarantee of future results.
| | |
| Ten Largest Holdings | | Percent of
Long-Term
Investments |
| | | | |
Financial Select Sector SPDR Fund | | | 17 | % |
Health Care Select Sector SPDR Fund | | | 9 | |
Technology Select Sector SPDR Fund | | | 8 | |
Consumer Discretionary Select Sector SPDR Fund | | | 6 | |
Government of Japan | | | 6 | |
iShares 1-3 Year Credit Bond ETF | | | 5 | |
PowerShares QQQ Trust Series 1 | | | 3 | |
United Kingdom Gilt | | | 2 | |
Fannie Mae Mortgage-Backed Securities | | | 2 | |
Federal Republic of Germany | | | 2 | |
| | |
| Portfolio Composition | | Percent of
Long-Term
Investments |
| | | | |
Investment Companies | | | 49 | % |
Foreign Government Obligations | | | 18 | |
Corporate Bonds | | | 12 | |
Common Stocks | | | 12 | |
U.S. Government Sponsored Agency Securities | | | 5 | |
Foreign Agency Obligations | | | 3 | |
U.S. Treasury Obligations | | | 1 | |
| | | | | | |
| 4 | | BLACKROCK MANAGED VOLATILITY PORTFOLIO | | MARCH 31, 2014 | | |
|
| Total Return Based on a $10,000 Investment |
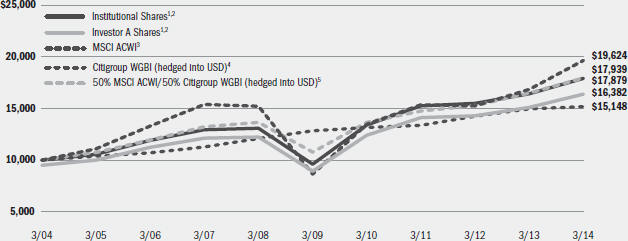
| | 1 | Assuming maximum sales charges, if any, transaction costs and other operating expenses, including investment advisory fees and administration fees, if any. Institutional Shares do not have a sales charge. |
| | 2 | The Fund uses an asset allocation strategy, investing varying percentages of its portfolio in three major categories: stocks, bonds and money market instruments. |
| | 3 | A free float-adjusted market capitalization weighted index that is designed to measure the equity market performance of developed and emerging markets. |
| | 4 | A market capitalization weighted bond index consisting of government bond markets of 23 countries, including the United States. |
| | 5 | This customized weighted index is comprised of the returns of the MSCI All Country World Index (50%) and Citigroup WGBI (hedged into USD) (50%). |
| | | | | | | | | | | | | | | | | | | | | | | | | | | | |
| Performance Summary for the Period Ended March 31, 2014 | | | | | | | | | |
| | | | | | Average Annual Total Returns6 | |
| | | | | | 1 Year | | | 5 Years | | | 10 Years | |
| | | 6-Month Total Returns | | | w/o sales charge | | | w/ sales charge | | | w/o sales charge | | | w/ sales charge | | | w/o sales charge | | | w/ sales charge | |
Institutional | | | 5.27 | % | | | 9.03 | % | | | N/A | | | | 13.24 | % | | | N/A | | | | 5.98 | % | | | N/A | |
Service | | | 5.06 | | | | 8.59 | | | | N/A | | | | 12.93 | | | | N/A | | | | 5.70 | | | | N/A | |
Investor A | | | 5.07 | | | | 8.65 | | | | 2.94 | % | | | 12.90 | | | | 11.69 | % | | | 5.63 | | | | 5.06 | % |
Investor B | | | 4.51 | | | | 7.53 | | | | 3.11 | | | | 11.95 | | | | 11.69 | | | | 4.97 | | | | 4.97 | |
Investor C | | | 4.72 | | | | 7.90 | | | | 6.91 | | | | 12.11 | | | | 12.11 | | | | 4.87 | | | | 4.87 | |
50% MSCI ACWI/50% Citigroup WGBI (hedged into USD) | | | 5.37 | | | | 8.90 | | | | N/A | | | | 10.78 | | | | N/A | | | | 6.02 | | | | N/A | |
MSCI ACWI | | | 8.48 | | | | 16.55 | | | | N/A | | | | 17.80 | | | | N/A | | | | 6.97 | | | | N/A | |
Citigroup WGBI (hedged into USD) | | | 2.19 | | | | 1.45 | | | | N/A | | | | 3.37 | | | | N/A | | | | 4.24 | | | | N/A | |
| | 6 | Assuming maximum sales charges, if any. Average annual total returns with and without sales charges reflect reductions for distribution and service fees. See “About Fund Performance” on page 6 for a detailed description of share classes, including any related sales charges and fees. |
| | | N/A—Not applicable as share class and index do not have a sales charge. |
| | | Past performance is not indicative of future results. |
| | | | | | | | | | | | | | |
| Expense Example |
| | | Actual | | Hypothetical8 | | |
| | | Beginning Account Value October 1, 2013 | | Ending Account Value March 31, 2014 | | Expenses Paid During the Period7 | | Beginning Account Value October 1, 2013 | | Ending Account Value March 31, 2014 | | Expenses Paid During the Period7 | | Annualized Expense Ratio |
Institutional | | $1,000.00 | | $1,052.70 | | $3.99 | | $1,000.00 | | $1,021.04 | | $3.93 | | 0.78% |
Service | | $1,000.00 | | $1,050.60 | | $5.98 | | $1,000.00 | | $1,019.10 | | $5.89 | | 1.17% |
Investor A | | $1,000.00 | | $1,050.70 | | $5.78 | | $1,000.00 | | $1,019.30 | | $5.69 | | 1.13% |
Investor B | | $1,000.00 | | $1,045.10 | | $10.91 | | $1,000.00 | | $1,014.26 | | $10.75 | | 2.14% |
Investor C | | $1,000.00 | | $1,047.20 | | $9.29 | | $1,000.00 | | $1,015.86 | | $9.15 | | 1.82% |
| | 7 | For each class of the Fund, expenses are equal to the annualized expense ratio for the class, multiplied by the average account value over the period, multiplied by 182/ 365 (to reflect the one-half year period shown). The fees and expenses of the underlying funds in which the Fund invests are not included in the Fund’s annualized expense ratio. |
| | 8 | Hypothetical 5% annual return before expenses is calculated by pro rating the number of days in the most recent fiscal half year divided by 365. |
| | | See “Disclosure of Expenses” on page 6 for further information on how expenses were calculated. |
| | | | | | |
| | | BLACKROCK MANAGED VOLATILITY PORTFOLIO | | MARCH 31, 2014 | | 5 |
| Ÿ | | Institutional Shares are not subject to any sales charge. These shares bear no ongoing distribution or service fees and are available only to certain eligible investors. |
| Ÿ | | Service Shares are not subject to any sales charge (front-end load) or deferred sales charge. These shares are subject to a service fee of 0.25% per year (but no distribution fee) and are only available to eligible investors. Prior to January 28, 2005, Service Shares performance results are those of Institutional Shares (which have no distribution or service fees) restated to reflect Service Share fees. |
| Ÿ | | Investor A Shares are subject to a maximum initial sales charge (front-end load) of 5.25% and a service fee of 0.25% per year (but no distribution fee). Certain redemptions of these shares may be subject to a contingent deferred sales charge (“CDSC”) where no initial sales charge was paid at the time of purchase. |
| Ÿ | | Investor B Shares are subject to a maximum CDSC of 4.50% declining to 0% after six years. In addition, these shares are subject to a distribution fee of 0.75% per year and a service fee of 0.25% per year. These shares automatically convert to Investor A Shares after approximately eight years. (There is no initial sales charge for automatic share conversions.) All returns for periods greater than eight years reflect this conversion. These shares are only available through exchanges and dividend reinvestments by existing shareholders and for purchase by certain employer-sponsored retirement plans. |
| Ÿ | | Investor C Shares are subject to a 1.00% CDSC if redeemed within one year of purchase. In addition, these shares are subject to a distribution fee of 0.75% per year and a service fee of 0.25% per year. |
Performance information reflects past performance and does not guarantee future results. Current performance may be lower or higher than the performance data quoted. Refer to www.blackrock.com/funds to obtain performance data current to the most recent month end. Performance results do not reflect the deduction of taxes that a shareholder would pay on fund distributions or the redemption of fund shares. Figures shown in the performance table on the previous page assume reinvestment of all dividends and distributions, if any, at net asset value (“NAV”) on the ex-dividend/payable dates. Investment return and principal value of shares will fluctuate so that shares, when redeemed, may be worth more or less than their original cost. Dividends paid to each class of shares will vary because of the different levels of service, distribution and transfer agency fees applicable to each class, which are deducted from the income available to be paid to shareholders.
Performance for the Fund for periods prior to January 28, 2005 is based on performance of a certain former State Street Research mutual fund that reorganized with the Fund on that date.
BlackRock Advisors, LLC (the “Manager”), the Fund’s investment advisor, waived and/or reimbursed a portion of the Fund’s expenses. Without such waiver and/or reimbursement, the Fund’s performance would have been lower. The Manager is under no obligation to waive or reimburse or to continue waiving or reimbursing its fees after the applicable termination date. See Note 5 of the Notes to Financial Statements for additional information on waivers and reimbursements.
Shareholders of the Fund may incur the following charges: (a) transactional expenses, such as sales charges; and (b) operating expenses, including investment advisory fees, administration fees, service and distribution fees, including 12b-1 fees, acquired fund fees and expenses and other Fund expenses. The expense example on the previous page (which is based on a hypothetical investment of $1,000 invested on October 1, 2013 and held through March 31, 2014) is intended to assist shareholders both in calculating expenses based on an investment in the Fund and in comparing these expenses with similar costs of investing in other mutual funds.
The expense example provides information about actual account values and actual expenses. In order to estimate the expenses a shareholder paid during the period covered by this report, shareholders can divide their account value by $1,000 and then multiply the result by the number corresponding to their share class under the heading entitled “Expenses Paid During the Period.”
The expense example also provides information about hypothetical account values and hypothetical expenses based on the Fund’s actual expense ratio and an assumed rate of return of 5% per year before expenses. In order to assist shareholders in comparing the ongoing expenses of investing in the Fund and other funds, compare the 5% hypothetical example with the 5% hypothetical examples that appear in other funds’ shareholder reports.
The expenses shown in the expense example are intended to highlight shareholders’ ongoing costs only and do not reflect any transactional expenses, such as sales charges, if any. Therefore, the hypothetical example is useful in comparing ongoing expenses only, and will not help shareholders determine the relative total expenses of owning different funds. If these transactional expenses were included, shareholder expenses would have been higher.
| | | | | | |
| 6 | | BLACKROCK MANAGED VOLATILITY PORTFOLIO | | MARCH 31, 2014 | | |
|
| Derivative Financial Instruments |
The Fund may invest in various derivative financial instruments, including financial futures contracts, foreign currency exchange contracts, options and swaps, as specified in Note 4 of the Notes to Financial Statements, which may constitute forms of economic leverage. Such derivative financial instruments are used to obtain exposure to a security, index and/or market without owning or taking physical custody of securities or to hedge market, equity, credit, interest rate, foreign currency exchange rate and/or other risks. Derivative financial instruments involve risks, including the imperfect correlation between the value of a derivative financial instrument and the underlying asset, possible default of the counterparty to the transaction or illiquidity of the derivative financial instrument. The
Fund’s ability to use a derivative financial instrument successfully depends on the investment advisor’s ability to predict pertinent market movements accurately, which cannot be assured. The use of derivative financial instruments may result in losses greater than if they had not been used, may require the Fund to sell or purchase portfolio investments at inopportune times or for distressed values, may limit the amount of appreciation the Fund can realize on an investment, may result in lower dividends paid to shareholders and/or may cause the Fund to hold an investment that it might otherwise sell. The Fund’s investments in these instruments are discussed in detail in the Notes to Financial Statements.
| | | | | | |
| | | BLACKROCK MANAGED VOLATILITY PORTFOLIO | | MARCH 31, 2014 | | 7 |
| | | | |
| Schedule of Investments March 31, 2014 (Unaudited) | | | | |
| | | (Percentages shown are based on Net Assets) | |
| | | | | | | | |
| Asset-Backed Securities | | Par (000) | | | Value | |
Amortizing Residential Collateral Trust,
Series 2002-BC5, Class M2,
1.95%, 7/25/32 (a) | | USD | 11 | | | $ | 6,654 | |
Knollwood CDO Ltd., Series 2004-1A,
Class C, 3.44%, 1/10/39 (a)(b) | | | 133 | | | | 1 | |
Santander Drive Auto Receivables Trust, Series 2011-S1A, Class B,
1.48%, 5/15/17 (b) | | | 22 | | | | 22,475 | |
Total Asset-Backed Securities — 0.0% | | | | | | | 29,130 | |
| | | | | | | | |
| Common Stocks | | Shares | | | | |
Automobiles — 0.3% | | | | | | | | |
Tata Motors Ltd. | | | 188,088 | | | | 1,270,942 | |
Yamaha Motor Co. Ltd. | | | 56,700 | | | | 904,586 | |
| | | | | | | | |
| | | | | | | | 2,175,528 | |
Banks — 1.3% | | | | | | | | |
BNP Paribas SA | | | 17,378 | | | | 1,339,836 | |
Danske Bank A/S | | | 34,621 | | | | 963,323 | |
Erste Group Bank AG | | | 25,936 | | | | 887,262 | |
HSBC Holdings PLC | | | 159,179 | | | | 1,611,743 | |
Mitsubishi UFJ Financial Group, Inc. | | | 293,900 | | | | 1,618,444 | |
Sberbank of Russia — ADR | | | 108,379 | | | | 1,058,863 | |
Société Générale SA | | | 23,404 | | | | 1,440,654 | |
| | | | | | | | |
| | | | | | | | 8,920,125 | |
Beverages — 0.5% | | | | | | | | |
Anheuser-Busch InBev NV | | | 30,001 | | | | 3,159,581 | |
Biotechnology — 0.1% | | | | | | | | |
Genmab A/S (c) | | | 12,394 | | | | 502,688 | |
Capital Markets — 0.3% | | | | | | | | |
Credit Suisse Group AG | | | 55,286 | | | | 1,789,515 | |
Electric Utilities — 0.2% | | | | | | | | |
Enel SpA | | | 238,915 | | | | 1,351,354 | |
Electrical Equipment — 0.3% | | | | | | | | |
Mitsubishi Electric Corp. | | | 72,000 | | | | 810,490 | |
Schneider Electric SA | | | 15,546 | | | | 1,377,792 | |
| | | | | | | | |
| | | | | | | | 2,188,282 | |
Food Products — 0.1% | | | | | | | | |
BRF SA | | | 31,100 | | | | 622,685 | |
| | | | | | | | |
| Common Stocks | |
Shares | | | Value | |
Hotels, Restaurants & Leisure — 0.2% | | | | | | | | |
Carnival PLC | | | 22,294 | | | $ | 848,899 | |
Sands China Ltd. | | | 108,800 | | | | 815,994 | |
| | | | | | | | |
| | | | | | | | 1,664,893 | |
Insurance — 0.2% | | | | | | | | |
Tokio Marine Holdings, Inc. | | | 43,400 | | | | 1,301,583 | |
Internet Software & Services — 0.2% | | | | | | | | |
MercadoLibre, Inc. | | | 5,371 | | | | 510,836 | |
Yandex NV (c) | | | 26,462 | | | | 798,888 | |
| | | | | | | | |
| | | | | | | | 1,309,724 | |
Machinery — 0.2% | | | | | | | | |
Makita Corp. | | | 27,600 | | | | 1,519,480 | |
Railpower Technologies Corp. (Acquired
4/26/04-6/17/04, cost $49,616) (c)(d) | | | 17,600 | | | | — | |
| | | | | | | | |
| | | | | | | | 1,519,480 | |
Media — 0.7% | | | | | | | | |
Grupo Televisa SAB — ADR | | | 53,327 | | | | 1,775,256 | |
ITV PLC | | | 429,974 | | | | 1,373,766 | |
Liberty Global PLC, Series A (c) | | | 21,017 | | | | 874,307 | |
Liberty Global PLC, Series C (c) | | | 21,017 | | | | 855,602 | |
| | | | | | | | |
| | | | | | | | 4,878,931 | |
Metals & Mining — 0.1% | | | | | | | | |
ArcelorMittal | | | 54,805 | | | | 884,508 | |
Oil, Gas & Consumable Fuels — 0.3% | | | | | | | | |
Longview Energy Co. (Acquired 8/13/04,
cost $48,000) (c)(d) | | | 3,200 | | | | 27,264 | |
Matador Resources Co. (Acquired 4/13/06,
cost $8,451) (c)(d) | | | 939 | | | | 22,996 | |
Royal Dutch Shell PLC, Class A | | | 47,402 | | | | 1,731,953 | |
| | | | | | | | |
| | | | | | | | 1,782,213 | |
Paper & Forest Products — 0.0% | | | | | | | | |
Ainsworth Lumber Co. Ltd. (c) | | | 26,991 | | | | 97,172 | |
Ainsworth Lumber Co. Ltd. (b)(c) | | | 19,432 | | | | 69,959 | |
| | | | | | | | |
| | | | | | | | 167,131 | |
Pharmaceuticals — 1.2% | | | | | | | | |
AstraZeneca PLC | | | 30,296 | | | | 1,963,986 | |
Novo Nordisk A/S, Class B | | | 36,102 | | | | 1,643,806 | |
Roche Holding AG | | | 10,010 | | | | 3,010,645 | |
Shire PLC | | | 16,634 | | | | 823,466 | |
Teva Pharmaceutical Industries Ltd. — ADR | | | 18,575 | | | | 981,503 | |
| | | | | | | | |
| | | | | | | | 8,423,406 | |
| | | | | | | | | | |
| Portfolio Abbreviations | | |
ADR | | American Depositary Receipts | | ILS | | Israeli Shekel | | S&P | | Standard & Poor’s |
AUD | | Australian Dollar | | JPY | | Japanese Yen | | SEK | | Swedish Krona |
CAD | | Canadian Dollar | | JSC | | Joint Stock Company | | SGD | | Singapore Dollar |
CDO | | Collateralized Debt Obligation | | KRW | | South Korean Won | | SPDR | | Standard & Poor’s Depositary |
CHF | | Swiss Franc | | LIBOR | | London Interbank Offered Rate | | | | Receipts |
CZK | | Czech Koruna | | MXN | | Mexican Peso | | TBA | | To-be-announced |
DKK | | Danish Krone | | MYR | | Malaysian Ringgit | | THB | | Thai Baht |
ETF | | Exchange Traded Fund | | NOK | | Norwegian Krone | | TRY | | Turkish Lira |
EUR | | Euro | | NZD | | New Zealand Dollar | | TWD | | Taiwan New Dollar |
EURIBOR | | Euro Interbank Offer Rate | | OJSC | | Open Joint Stock Company | | USD | | US Dollar |
GBP | | British Pound | | REIT | | Real Estate Investment Trust | | ZAR | | South African Rand |
See Notes to Financial Statements.
| | | | | | |
| 8 | | BLACKROCK MANAGED VOLATILITY PORTFOLIO | | MARCH 31, 2014 | | |
| | | | |
| Schedule of Investments (continued) | | | | |
| | | (Percentages shown are based on Net Assets) | |
| | | | | | | | |
| Common Stocks | |
Shares | | | Value | |
Semiconductors & Semiconductor Equipment — 0.2% | | | | | |
MediaTek, Inc. | | | 71,000 | | | $ | 1,050,920 | |
Veeco Instruments, Inc. (c) | | | 13,181 | | | | 552,679 | |
| | | | | | | | |
| | | | | | | | 1,603,599 | |
Technology Hardware, Storage & Peripherals — 0.1% | | | | | |
Nokia OYJ (c) | | | 88,966 | | | | 654,563 | |
Textiles, Apparel & Luxury Goods — 0.4% | | | | | |
Cie Financiere Richemont SA | | | 15,090 | | | | 1,441,671 | |
The Swatch Group AG | | | 1,743 | | | | 1,093,442 | |
| | | | | | | | |
| | | | | | | | 2,535,113 | |
Tobacco — 0.5% | | | | | | | | |
Imperial Tobacco Group PLC | | | 50,176 | | | | 2,028,984 | |
Japan Tobacco, Inc. | | | 51,000 | | | | 1,600,758 | |
| | | | | | | | |
| | | | | | | | 3,629,742 | |
Wireless Telecommunication Services — 0.2% | | | | | |
Rogers Communications, Inc., B Shares | | | 34,665 | | | | 1,436,458 | |
Total Common Stocks — 7.6% | | | | | | | 52,501,102 | |
| | | | | | | | |
| Corporate Bonds | | Par
(000) | | | | |
Aerospace & Defense — 0.1% | | | | | | | | |
EADS Finance BV, 2.70%, 4/17/23 (b) | | USD | 500 | | | | 472,417 | |
Auto Components — 0.1% | | | | | | | | |
Continental AG: | | | | | | | | |
3.00%, 7/16/18 | | EUR | 100 | | | | 147,047 | |
3.13%, 9/09/20 | | | 200 | | | | 293,579 | |
Valeo SA, 3.25%, 1/22/24 | | | 100 | | | | 143,331 | |
| | | | | | | | |
| | | | | | | | 583,957 | |
Automobiles — 0.2% | | | | | | | | |
Ford Motor Co., 4.75%, 1/15/43 | | USD | 250 | | | | 241,756 | |
Peugeot SA, 7.38%, 3/06/18 | | EUR | 300 | | | | 469,195 | |
Renault SA, 3.13%, 3/05/21 | | | 75 | | | | 104,449 | |
Volkswagen International Finance NV,
2.00%, 1/14/20 | | | 400 | | | | 561,445 | |
| | | | | | | | |
| | | | | | | | 1,376,845 | |
Banks — 2.9% | | | | | | | | |
Abbey National Treasury Services PLC,
4.25%, 4/12/21 | | | 500 | | | | 812,293 | |
Asian Development Bank, 2.35%, 6/21/27 | | JPY | 20,000 | | | | 227,107 | |
Banca Monte dei Paschi di Siena SpA,
3.63%, 4/01/19 | | EUR | 200 | | | | 275,637 | |
Banco Bilbao Vizcaya Argentaria SA,
3.50%, 12/05/17 | | | 500 | | | | 743,845 | |
Banco de Sabadell SA, 3.38%, 1/23/18 | | | 200 | | | | 293,641 | |
Banco Espirito Santo SA, 4.00%, 1/21/19 | | | 500 | | | | 695,104 | |
Banco Popolare SC, 3.50%, 3/14/19 | | | 225 | | | | 313,454 | |
Bank of Ireland Mortgage Bank: | | | | | | | | |
1.88%, 5/13/17 | | | 300 | | | | 420,517 | |
3.63%, 10/02/20 | | | 200 | | | | 302,465 | |
Bankia SA, 3.50%, 1/17/19 | | | 600 | | | | 849,772 | |
Bankinter SA, 3.88%, 10/30/15 | | | 300 | | | | 431,441 | |
BNP Paribas SA, 2.88%, 11/27/17 | | | 300 | | | | 438,611 | |
BPCE SFH SA, 2.38%, 11/29/23 | | | 200 | | | | 283,641 | |
| | | | | | | | |
| Corporate Bonds | | Par
(000) | | | Value | |
Banks (concluded) | | | | | | | | |
CaixaBank SA: | | | | | | | | |
5.00%, 11/14/23 (a) | | EUR | 200 | | | $ | 290,945 | |
2.60%, 3/21/24 | | | 200 | | | | 277,069 | |
Canadian Imperial Bank of Commerce,
2.60%, 7/02/15 (b) | | USD | 290 | | | | 298,103 | |
Carrefour Banque SA, 2.88%, 9/25/15 | | EUR | 200 | | | | 283,973 | |
Citigroup, Inc.: | | | | | | | | |
5.00%, 9/15/14 | | USD | 140 | | | | 142,711 | |
4.59%, 12/15/15 | | | 700 | | | | 742,454 | |
Credit Agricole SA, 3.13%, 2/05/26 | | EUR | 400 | | | | 568,205 | |
Danske Bank A/S: | | | | | | | | |
3.88%, 5/18/16 | | | 500 | | | | 731,940 | |
3.88%, 10/04/23 (a) | | | 300 | | | | 435,523 | |
Dexia Credit Local SA, 1.25%, 10/18/16 | | USD | 1,660 | | | | 1,664,359 | |
DNB Bank ASA, 3.00%, 9/26/23 (a) | | EUR | 600 | | | | 857,029 | |
European Investment Bank, 2.15%, 1/18/27 | | JPY | 20,000 | | | | 219,771 | |
HSBC Bank Brasil SA — Banco Multiplo,
4.00%, 5/11/16 (b) | | USD | 680 | | | | 705,500 | |
HSBC Holdings PLC, 6.10%, 1/14/42 | | | 150 | | | | 183,017 | |
Hypo Alpe-Adria-Bank International AG, 2.38%, 12/13/22 | | EUR | 1,300 | | | | 1,797,010 | |
ING Bank NV: | | | | | | | | |
3.38%, 1/11/18 | | | 250 | | | | 377,369 | |
4.13%, 11/21/23 (a) | | USD | 330 | | | | 331,237 | |
Intesa Sanpaolo SpA: | | | | | | | | |
3.00%, 1/28/19 | | EUR | 250 | | | | 360,103 | |
3.38%, 1/24/25 | | | 200 | | | | 292,527 | |
3.25%, 2/10/26 | | | 100 | | | | 143,455 | |
Intesa Sanpaolo Vita SpA, 5.35%, 9/18/18 | | | 100 | | | | 151,280 | |
Lloyds Bank PLC: | | | | | | | | |
6.50%, 3/24/20 | | | 300 | | | | 495,635 | |
4.00%, 9/29/20 | | | 250 | | | | 399,660 | |
Russian Agricultural Bank OJSC Via RSHB Capital SA, 5.10%, 7/25/18 | | USD | 200 | | | | 194,980 | |
Société Générale SFH, 2.88%, 3/14/19 | | EUR | 500 | | | | 749,335 | |
Swedbank AB: | | | | | | | | |
1.50%, 3/18/19 | | | 200 | | | | 275,975 | |
3.00%, 12/05/22 (a) | | | 384 | | | | 549,858 | |
UniCredit SpA: | | | | | | | | |
3.00%, 1/31/24 | | | 280 | | | | 398,125 | |
5.75%, 10/28/25 (a) | | | 150 | | | | 224,759 | |
| | | | | | | | |
| | | | | | | | 20,229,435 | |
Capital Markets — 0.6% | | | | | | | | |
Credit Suisse AG/Guernsey, 1.00%, 3/12/19 | | | 525 | | | | 720,131 | |
European Investment Bank, 1.50%, 4/15/21 | | | 1,150 | | | | 1,588,171 | |
The Goldman Sachs Group, Inc.,
5.75%, 1/24/22 | | USD | 700 | | | | 793,743 | |
Morgan Stanley, 3.75%, 2/25/23 | | | 650 | | | | 645,880 | |
UBS AG, 4.75%, 2/12/26 (a) | | EUR | 175 | | | | 247,378 | |
| | | | | | | | |
| | | | | | | | 3,995,303 | |
Chemicals — 0.1% | | | | | | | | |
Brenntag Finance BV, 5.50%, 7/19/18 | | | 400 | | | | 623,362 | |
GCS Holdco Finance I SA, 6.50%, 11/15/18 | | | 100 | | | | 146,204 | |
| | | | | | | | |
| | | | | | | | 769,566 | |
Diversified Financial Services — 0.7% | | | | | |
Adecco International Financial Services BV, 2.75%, 11/15/19 | | | 200 | | | | 287,060 | |
See Notes to Financial Statements.
| | | | | | |
| | | BLACKROCK MANAGED VOLATILITY PORTFOLIO | | MARCH 31, 2014 | | 9 |
| | | | |
| Schedule of Investments (continued) | | | | |
| | | (Percentages shown are based on Net Assets) | |
| | | | | | | | |
| Corporate Bonds | | Par
(000) | | | Value | |
Diversified Financial Services (concluded) | | | | | | | | |
American Honda Finance Corp., 1.88%, 9/04/19 | | EUR | 500 | | | $ | 701,047 | |
Bank of America Corp., 5.70%, 1/24/22 | | USD | 600 | | | | 688,395 | |
Ford Motor Credit Co. LLC, 4.38%, 8/06/23 | | | 300 | | | | 309,525 | |
Fresenius Finance BV, 4.00%, 2/01/24 | | EUR | 99 | | | | 141,869 | |
Imperial Tobacco Finance PLC, 3.38%, 2/26/26 | | | 325 | | | | 451,571 | |
JPMorgan Chase Bank, NA, 6.00%, 10/01/17 | | USD | 445 | | | | 506,908 | |
Macquarie Bank Ltd., 2.50%, 9/18/18 | | EUR | 200 | | | | 285,255 | |
The NASDAQ OMX Group, Inc., 3.88%, 6/07/21 | | | 300 | | | | 441,525 | |
Nationwide Building Society: | | | | | | | | |
3.13%, 4/03/17 | | | 100 | | | | 146,002 | |
4.13%, 3/20/23 (a) | | | 150 | | | | 217,955 | |
Old Mutual PLC, 7.13%, 10/19/16 | | GBP | 200 | | | | 368,550 | |
| | | | | | | | |
| | | | | | | | 4,545,662 | |
Diversified Telecommunication Services — 0.3% | | | | | | | | |
Iliad SA, 4.88%, 6/01/16 | | | 300 | | | | 441,265 | |
OTE PLC, 7.88%, 2/07/18 | | | 300 | | | | 483,558 | |
Verizon Communications, Inc.: | | | | | | | | |
3.50%, 11/01/21 | | USD | 240 | | | | 241,676 | |
2.38%, 2/17/22 | | EUR | 125 | | | | 174,172 | |
3.25%, 2/17/26 | | | 100 | | | | 142,298 | |
6.40%, 2/15/38 | | USD | 200 | | | | 234,838 | |
6.55%, 9/15/43 | | | 250 | | | | 304,234 | |
| | | | | | | | |
| | | | | | | | 2,022,041 | |
Electric Utilities — 0.3% | | | | | | | | |
Alabama Power Co., 3.95%, 6/01/21 | | | 220 | | | | 229,412 | |
Enel Finance International NV, 5.63%, 8/14/24 | | GBP | 100 | | | | 180,404 | |
Energa Finance AB, 3.25%, 3/19/20 | | EUR | 300 | | | | 426,119 | |
ESB Finance Ltd., 6.25%, 9/11/17 | | | 200 | | | | 321,593 | |
Georgia Power Co., 3.00%, 4/15/16 | | USD | 390 | | | | 407,189 | |
MidAmerican Energy Holdings Co., 6.50%, 9/15/37 | | | 150 | | | | 185,505 | |
PacifiCorp, 6.25%, 10/15/37 | | | 100 | | | | 126,328 | |
Perusahaan Listrik Negara PT, 5.25%, 10/24/42 | | | 200 | | | | 162,250 | |
| | | | | | | | |
| | | | | | | | 2,038,800 | |
Food & Staples Retailing — 0.1% | | | | | | | | |
Wal-Mart Stores, Inc., 4.00%, 4/11/43 | | | 500 | | | | 465,375 | |
Food Products — 0.1% | | | | | | | | |
Barry Callebaut Services NV, 5.63%, 6/15/21 | | EUR | 250 | | | | 392,047 | |
Gas Utilities — 0.1% | | | | | | | | |
Gas Natural Finance BV, 3.88%, 1/17/23 | | | 100 | | | | 150,989 | |
KeySpan Gas East Corp., 5.82%, 4/01/41 (b) | | USD | 185 | | | | 217,868 | |
| | | | | | | | |
| | | | | | | | 368,857 | |
Health Care Equipment & Supplies — 0.1% | | | | | | | | |
Covidien International Finance SA, 3.20%, 6/15/22 | | | 500 | | | | 492,021 | |
Health Care Providers & Services — 0.0% | | | | | | | | |
McKesson Corp., 4.88%, 3/15/44 | | | 300 | | | | 304,080 | |
| | | | | | | | |
| Corporate Bonds | | Par
(000) | | | Value | |
Hotels, Restaurants & Leisure — 0.2% | | | | | | | | |
Accor SA, 2.63%, 2/05/21 | | EUR | 500 | | | $ | 691,894 | |
Wyndham Worldwide Corp.: | | | | | | | | |
4.25%, 3/01/22 | | USD | 330 | | | | 333,783 | |
3.90%, 3/01/23 | | | 200 | | | | 195,945 | |
| | | | | | | | |
| | | | | | | | 1,221,622 | |
Industrial Conglomerates — 0.1% | | | | | | | | |
Smiths Group PLC, 4.13%, 5/05/17 | | EUR | 500 | | | | 740,615 | |
Insurance — 0.2% | | | | | | | | |
AIA Group Ltd., 3.13%, 3/13/23 | | USD | 600 | | | | 563,550 | |
Allianz Finance II BV, 5.75%, 7/08/41 (a) | | EUR | 100 | | | | 159,549 | |
Aviva PLC, 6.13%, 11/14/36 (a) | | GBP | 100 | | | | 178,017 | |
Talanx AG, 3.13%, 2/13/23 | | EUR | 100 | | | | 145,515 | |
| | | | | | | | |
| | | | | | | | 1,046,631 | |
IT Services — 0.0% | | | | | | | | |
Computer Sciences Corp., 4.45%, 9/15/22 | | USD | 300 | | | | 306,259 | |
Leisure Products — 0.0% | | | | | | | | |
Mattel, Inc., 5.45%, 11/01/41 | | | 200 | | | | 210,024 | |
Life Sciences Tools & Services — 0.0% | | | | | | | | |
Life Technologies Corp., 6.00%, 3/01/20 | | | 230 | | | | 264,673 | |
Media — 0.1% | | | | | | | | |
Altice Financing SA, 6.50%, 1/15/22 | | EUR | 100 | | | | 146,376 | |
Cyfrowy Polsat Finance AB, 7.13%, 5/20/18 | | | 300 | | | | 436,545 | |
Time Warner Cable, Inc., 4.50%, 9/15/42 | | USD | 6 | | | | 5,508 | |
Viacom, Inc., 5.85%, 9/01/43 | | | 200 | | | | 219,767 | |
| | | | | | | | |
| | | | | | | | 808,196 | |
Metals & Mining — 0.1% | | | | | | | | |
AngloGold Ashanti Holdings PLC, 5.13%, 8/01/22 | | | 200 | | | | 186,476 | |
MMC Norilsk Nickel OJSC via MMC Finance Ltd., 5.55%, 10/28/20 | | | 300 | | | | 294,750 | |
| | | | | | | | |
| | | | | | | | 481,226 | |
Multi-Utilities — 0.1% | | | | | | | | |
Centrica PLC, 6.38%, 3/10/22 | | GBP | 100 | | | | 196,197 | |
Dominion Resources, Inc., 1.95%, 8/15/16 | | USD | 305 | | | | 310,750 | |
Linea Group Holding SpA, 3.88%, 11/28/18 | | EUR | 100 | | | | 141,458 | |
| | | | | | | | |
| | | | | | | | 648,405 | |
Oil, Gas & Consumable Fuels — 0.2% | | | | | | | | |
BP Capital Markets PLC, 3.81%, 2/10/24 | | USD | 400 | | | | 403,577 | |
Enterprise Products Operating LLC: | | | | | | | | |
6.13%, 10/15/39 | | | 125 | | | | 145,832 | |
Series L, 6.30%, 9/15/17 | | | 250 | | | | 288,383 | |
KazMunayGas National Co. JSC, 4.40%, 4/30/23 | | | 350 | | | | 331,153 | |
Rosneft Oil Co. via Rosneft International Finance Ltd., 4.20%, 3/06/22 | | | 300 | | | | 268,170 | |
Vier Gas Transport GmbH, 3.13%, 7/10/23 | | EUR | 150 | | | | 219,054 | |
| | | | | | | | |
| | | | | | | | 1,656,169 | |
Paper & Forest Products — 0.1% | | | | | | | | |
Metsa Board OYJ, 4.00%, 3/13/19 | | | 100 | | | | 137,835 | |
Mondi Finance PLC, 3.38%, 9/28/20 | | | 330 | | | | 479,132 | |
Stora Enso OYJ, 5.50%, 3/07/19 | | | 200 | | | | 305,032 | |
| | | | | | | | |
| | | | | | | | 921,999 | |
See Notes to Financial Statements.
| | | | | | |
| 10 | | BLACKROCK MANAGED VOLATILITY PORTFOLIO | | MARCH 31, 2014 | | |
| | | | |
| Schedule of Investments (continued) | | | | |
| | | (Percentages shown are based on Net Assets) | |
| | | | | | | | |
| Corporate Bonds | | Par
(000) | | | Value | |
Pharmaceuticals — 0.0% | | | | | |
Almirall SA, 4.63%, 4/01/21 | | EUR | 100 | | | $ | 140,130 | |
Professional Services — 0.1% | | | | | | | | |
Experian Finance PLC, 4.75%, 11/23/18 | | GBP | 400 | | | | 734,352 | |
Real Estate Investment Trusts (REITs) — 0.1% | | | | | |
Goodman Funding Pty Ltd., 6.38%, 4/15/21 (b) | | USD | 400 | | | | 452,126 | |
Ventas Realty LP/Ventas Capital Corp.,
4.75%, 6/01/21 | | | 135 | | | | 145,499 | |
| | | | | | | | |
| | | | | | | | 597,625 | |
Road & Rail — 0.1% | | | | | |
National Express Group PLC, 6.63%, 6/17/20 | | GBP | 400 | | | | 778,478 | |
Semiconductors & Semiconductor Equipment — 0.1% | | | | | |
ASML Holding NV, 3.38%, 9/19/23 | | EUR | 200 | | | | 287,418 | |
TSMC Global Ltd., 1.63%, 4/03/18 (b) | | USD | 300 | | | | 290,831 | |
| | | | | | | | |
| | | | | | | | 578,249 | |
Software — 0.0% | | | | | | | | |
Microsoft Corp., 2.63%, 5/02/33 | | EUR | 200 | | | | 264,556 | |
Specialty Retail — 0.1% | | | | | | | | |
Dixons Retail PLC, 8.75%, 9/15/17 | | GBP | 150 | | | | 290,082 | |
O’Reilly Automotive, Inc., 3.80%, 9/01/22 | | USD | 500 | | | | 492,047 | |
| | | | | | | | |
| | | | | | | | 782,129 | |
Technology Hardware, Storage & Peripherals — 0.1% | | | | | |
Apple Inc., 2.40%, 5/03/23 | | | 550 | | | | 510,003 | |
Oberthur Technologies Holding SAS,
9.25%, 4/30/20 | | EUR | 100 | | | | 152,920 | |
| | | | | | | | |
| | | | | | | | 662,923 | |
Textiles, Apparel & Luxury Goods — 0.1% | | | | | |
LVMH Moet Hennessy Louis Vuitton SA,
1.63%, 6/29/17 (b) | | USD | 800 | | | | 805,704 | |
Thrifts & Mortgage Finance — 0.0% | | | | | |
Achmea Hypotheekbank NV, 2.75%, 2/18/21 | | EUR | 150 | | | | 210,385 | |
Transportation Infrastructure — 0.0% | | | | | |
Brisa Concessao Rodoviaria SA, 3.88%, 4/01/21 | | | 100 | | | | 137,697 | |
Manchester Airport Group Funding PLC,
4.75%, 3/31/34 | | GBP | 100 | | | | 167,069 | |
| | | | | | | | |
| | | | | | | | 304,766 | |
Wireless Telecommunication Services — 0.3% | | | | | |
Crown Castle Towers LLC, 6.11%, 1/15/40 (b) | | USD | 500 | | | | 573,154 | |
Play Finance 2 SA, 5.25%, 2/01/19 | | EUR | 100 | | | | 140,521 | |
SK Telecom Co. Ltd., 2.13%, 5/01/18 (b) | | USD | 950 | | | | 940,576 | |
Telefonica Emisiones SAU, 4.71%, 1/20/20 | | EUR | 100 | | | | 156,724 | |
| | | | | | | | |
| | | | | | | | 1,810,975 | |
Total Corporate Bonds — 7.8% | | | | 54,032,497 | |
| | | | | | | | |
| Foreign Agency Obligations | | | | |
Banco Nacional de Desenvolvimento Economicoe Social, 5.75%, 9/26/23 (b) | | USD | 200 | | | | 209,000 | |
CNOOC Curtis Funding No. 1 Pty Ltd.,
4.50%, 10/03/23 (b) | | | 200 | | | | 203,493 | |
European Financial Stability Facility,
1.50%, 1/22/20 | | EUR | 250 | | | | 349,366 | |
Hydro-Quebec, 8.40%, 1/15/22 | | USD | 405 | | | | 531,777 | |
| | | | | | | | |
| Foreign Agency Obligations | | Par
(000) | | | Value | |
Kreditanstalt Für Wiederaufbau: | | | | | | | | |
0.50%, 7/25/16 | | EUR | 1,200 | | | $ | 1,660,800 | |
0.63%, 2/12/18 | | | 3,200 | | | | 4,406,819 | |
Propertize BV, 0.50%, 2/27/17 | | | 500 | | | | 687,754 | |
Province of British Columbia, 4.80%, 6/15/21 | | CAD | 350 | | | | 359,267 | |
Province of Manitoba: | | | | | | | | |
4.30%, 3/01/16 | | | 200 | | | | 191,385 | |
1.75%, 5/30/19 | | USD | 490 | | | | 482,089 | |
Province of Ontario: | | | | | | | | |
4.30%, 3/08/17 | | CAD | 600 | | | | 585,102 | |
6.20%, 6/02/31 | | | 400 | | | | 475,314 | |
Province of Quebec: | | | | | | | | |
4.50%, 12/01/19 | | | 600 | | | | 602,100 | |
5.00%, 12/01/41 | | | 150 | | | | 156,924 | |
Total Foreign Agency Obligations — 1.6% | | | | 10,901,190 | |
| | | | | | | | |
| Foreign Government Obligations | | | | |
Australia — 0.4% | | | | | | | | |
Commonwealth of Australia: | | | | | | | | |
4.75%, 6/15/16 | | AUD | 1,100 | | | | 1,061,510 | |
5.50%, 4/21/23 | | | 250 | | | | 258,194 | |
4.75%, 4/21/27 | | | 150 | | | | 144,839 | |
New South Wales Treasury Corp., 6.00%, 2/01/18 | | | 400 | | | | 404,895 | |
Queensland Treasury Corp., 6.25%, 2/21/20 | | | 400 | | | | 414,700 | |
Treasury Corp. of Victoria, 6.00%, 6/15/20 | | | 250 | | | | 258,109 | |
| | | | | | | | |
| | | | | | | | 2,542,247 | |
Belgium — 0.1% | | | | | | | | |
Kingdom of Belgium: | | | | | | | | |
2.60%, 6/22/24 | | EUR | 120 | | | | 171,100 | |
3.75%, 6/22/45 | | | 350 | | | | 536,763 | |
| | | | | | | | |
| | | | | | | | 707,863 | |
Canada — 0.3% | | | | | | | | |
Canada Housing Trust No. 1: | | | | | | | | |
2.75%, 9/15/14 | | CAD | 400 | | | | 364,725 | |
2.75%, 6/15/16 | | | 400 | | | | 373,659 | |
3.35%, 12/15/20 | | | 250 | | | | 240,570 | |
Government of Canada: | | | | | | | | |
1.75%, 3/01/19 | | | 300 | | | | 272,185 | |
8.00%, 6/01/27 | | | 300 | | | | 435,441 | |
4.00%, 6/01/41 | | | 500 | | | | 537,589 | |
| | | | | | | | |
| | | | | | | | 2,224,169 | |
Colombia — 0.1% | | | | | | | | |
Republic of Colombia, 4.00%, 2/26/24 | | USD | 500 | | | | 495,000 | |
Czech Republic — 0.0% | | | | | | | | |
Czech Republic, 3.85%, 9/29/21 | | CZK | 4,300 | | | | 246,870 | |
Denmark — 0.1% | | | | | | | | |
Kingdom of Denmark, 4.00%, 11/15/19 | | DKK | 3,500 | | | | 757,010 | |
Finland — 0.2% | | | | | | | | |
Republic of Finland: | | | | | | | | |
1.13%, 9/15/18 | | EUR | 20 | | | | 28,066 | |
3.50%, 4/15/21 | | | 700 | | | | 1,105,349 | |
2.00%, 4/15/24 | | | 250 | | | | 348,251 | |
| | | | | | | | |
| | | | | | | | 1,481,666 | |
See Notes to Financial Statements.
| | | | | | |
| | | BLACKROCK MANAGED VOLATILITY PORTFOLIO | | MARCH 31, 2014 | | 11 |
| | | | |
| Schedule of Investments (continued) | | | | |
| | | (Percentages shown are based on Net Assets) | |
| | | | | | | | |
| Foreign Government Obligations | | Par
(000) | | | Value | |
France — 1.1% | | | | | | | | |
France Government Bond OAT,
2.25%, 10/25/22 | | EUR | 3,810 | | | $ | 5,457,254 | |
UNEDIC, 2.38%, 5/25/24 | | | 1,300 | | | | 1,820,476 | |
| | | | | | | | |
| | | | | | | | 7,277,730 | |
Germany — 1.0% | | | | | | | | |
Federal Republic of Germany: | | | | | | | | |
2.25%, 9/04/21 | | | 3,000 | | | | 4,471,098 | |
2.50%, 7/04/44 | | | 1,890 | | | | 2,642,464 | |
| | | | | | | | |
| | | | | | | | 7,113,562 | |
Ireland — 0.1% | | | | | | | | |
Republic of Ireland: | | | | | | | | |
4.50%, 4/18/20 | | | 200 | | | | 313,781 | |
3.40%, 3/18/24 | | | 20 | | | | 28,451 | |
| | | | | | | | |
| | | | | | | | 342,232 | |
Israel — 0.0% | | | | | | | | |
State of Israel, 4.25%, 8/31/16 | | ILS | 1,000 | | | | 308,157 | |
Italy — 0.7% | | | | | | | | |
Buoni Poliennali Del Tesoro, 4.50%, 3/01/24 | | EUR | 3,350 | | | | 5,090,143 | |
Ivory Coast — 0.0% | | | | | | | | |
African Development Bank, 1.63%, 10/02/18 | | USD | 100 | | | | 99,681 | |
Japan — 4.0% | | | | | | | | |
Development Bank of Japan (20 Year),
1.05%, 6/20/23 | | JPY | 50,000 | | | | 502,984 | |
Government of Japan (5 Year): | | | | | | | | |
Series 89, 0.40%, 6/20/15 | | | 150,000 | | | | 1,459,180 | |
Series 102, 0.30%, 12/20/16 | | | 430,000 | | | | 4,187,887 | |
Series 105, 0.20%, 6/20/17 | | | 195,000 | | | | 1,893,953 | |
Government of Japan (10 Year): | | | | | | | | |
Series 300, 1.50%, 3/20/19 | | | 485,000 | | | | 4,999,304 | |
Series 313, 1.30%, 3/20/21 | | | 145,000 | | | | 1,495,382 | |
Series 323, 0.90%, 6/20/22 | | | 290,000 | | | | 2,900,947 | |
Series 325, 0.80%, 9/20/22 | | | 55,000 | | | | 545,330 | |
Government of Japan (20 Year): | | | | | | | | |
Series 94, 2.10%, 3/20/27 | | | 290,000 | | | | 3,234,205 | |
Series 137, 1.70%, 6/20/32 | | | 205,000 | | | | 2,095,000 | |
Series 146, 1.70%, 9/20/33 | | | 30,000 | | | | 301,792 | |
Government of Japan (30 Year): | | | | | | | | |
Series 26, 2.40%, 3/20/37 | | | 100,000 | | | | 1,110,839 | |
Series 36, 2.00%, 3/20/42 | | | 117,000 | | | | 1,210,910 | |
Government of Japan (40 Year), Series 5,
2.00%, 3/20/52 | | | 24,000 | | | | 246,588 | |
Japan Finance Organization for Municipalities: | | | | | | | | |
2.00%, 5/09/16 | | | 100,000 | | | | 1,006,342 | |
2.13%, 3/06/19 (b) | | USD | 396 | | | | 393,834 | |
| | | | | | | | |
| | | | | | | | 27,584,477 | |
Luxembourg — 0.4% | | | | | | | | |
Grand Duchy of Luxembourg, 2.13%, 7/10/23 | | EUR | 2,160 | | | | 3,063,524 | |
Malaysia — 0.1% | | | | | | | | |
Federation of Malaysia, 3.58%, 9/28/18 | | MYR | 1,200 | | | | 365,601 | |
Mexico — 0.1% | | | | | | | | |
United Mexican States: | | | | | | | | |
6.50%, 6/09/22 | | MXN | 7,500 | | | | 592,015 | |
8.30%, 8/15/31 | | USD | 194 | | | | 271,115 | |
| | | | | | | | |
| | | | | | | | 863,130 | |
| | | | | | | | |
| Foreign Government Obligations | | Par
(000) | | | Value | |
Netherlands — 0.6% | | | | | | | | |
Kingdom of the Netherlands: | | | | | | | | |
1.25%, 1/15/19 | | EUR | 1,550 | | | $ | 2,178,798 | |
1.75%, 7/15/23 | | | 1,480 | | | | 2,039,924 | |
| | | | | | | | |
| | | | | | | | 4,218,722 | |
New Zealand — 0.0% | | | | | | | | |
Government of New Zealand, 5.00%, 3/15/19 | | NZD | 300 | | | | 269,465 | |
Norway — 0.0% | | | | | | | | |
Kingdom of Norway, 2.00%, 5/24/23 | | NOK | 800 | | | | 124,787 | |
Poland — 0.2% | | | | | | | | |
Republic of Poland: | | | | | | | | |
1.63%, 1/15/19 | | EUR | 400 | | | | 563,296 | |
5.13%, 4/21/21 | | USD | 200 | | | | 220,850 | |
5.00%, 3/23/22 | | | 250 | | | | 272,813 | |
| | | | | | | | |
| | | | | | | | 1,056,959 | |
Russia — 0.0% | | | | | | | | |
Russian Federation, 7.50%, 3/31/30 (e) | | | 164 | | | | 187,005 | |
Singapore — 0.0% | | | | | | | | |
Republic of Singapore, 2.25%, 6/01/21 | | SGD | 350 | | | | 279,953 | |
Slovenia — 0.2% | | | | | | | | |
Republic of Slovenia, 5.85%, 5/10/23 | | USD | 1,000 | | | | 1,095,650 | |
South Africa — 0.1% | | | | | | | | |
Republic of South Africa: | | | | | | | | |
5.50%, 3/09/20 | | | 100 | | | | 108,600 | |
7.00%, 2/28/31 | | ZAR | 3,000 | | | | 240,761 | |
| | | | | | | | |
| | | | | | | | 349,361 | |
Spain — 0.2% | | | | | | | | |
Kingdom of Spain, 5.15%, 10/31/44 | | EUR | 735 | | | | 1,164,758 | |
Sweden — 0.2% | | | | | | | | |
Kingdom of Sweden: | | | | | | | | |
3.75%, 8/12/17 | | SEK | 6,000 | | | | 1,008,680 | |
3.50%, 6/01/22 | | | 1,000 | | | | 172,398 | |
| | | | | | | | |
| | | | | | | | 1,181,078 | |
Thailand — 0.1% | | | | | | | | |
Kingdom of Thailand, 3.45%, 3/08/19 | | THB | 13,500 | | | | 420,979 | |
Turkey — 0.0% | | | | | | | | |
Republic of Turkey, 8.80%, 11/17/18 | | TRY | 600 | | | | 266,392 | |
United Kingdom — 1.4% | | | | | | | | |
United Kingdom Gilt: | | | | | | | | |
2.75%, 1/22/15 | | GBP | 900 | | | | 1,528,558 | |
1.75%, 1/22/17 | | | 1,500 | | | | 2,545,221 | |
3.75%, 9/07/19 | | | 750 | | | | 1,365,449 | |
5.00%, 3/07/25 | | | 400 | | | | 801,394 | |
4.25%, 6/07/32 | | | 800 | | | | 1,505,987 | |
4.50%, 12/07/42 | | | 930 | | | | 1,838,743 | |
4.25%, 12/07/55 | | | 100 | | | | 195,626 | |
| | | | | | | | |
| | | | | | | | 9,780,978 | |
Total Foreign Government Obligations — 11.7% | | | | 80,959,149 | |
| | | | | | | | |
| | | | | | | |
See Notes to Financial Statements.
| | | | | | |
| 12 | | BLACKROCK MANAGED VOLATILITY PORTFOLIO | | MARCH 31, 2014 | | |
| | | | |
| Schedule of Investments (continued) | | | | |
| | | (Percentages shown are based on Net Assets) | |
| | | | | | | | |
| Investment Companies | |
Shares | | | Value | |
Consumer Discretionary Select Sector SPDR Fund | | | 418,104 | | | $ | 27,059,691 | |
Financial Select Sector SPDR Fund | | | 3,487,473 | | | | 77,910,147 | |
Health Care Select Sector SPDR Fund | | | 710,391 | | | | 41,550,770 | |
iShares 1-3 Year Credit Bond ETF (f) | | | 196,815 | | | | 20,756,110 | |
PowerShares QQQ Trust Series 1 | | | 174,361 | | | | 15,287,972 | |
Technology Select Sector SPDR Fund | | | 1,011,752 | | | | 36,777,185 | |
Total Investment Companies — 31.6% | | | | | | | 219,341,875 | |
| | | | | | | | |
| Non-Agency Mortgage-Backed Securities | | Par
(000) | | | | |
Commercial Mortgage-Backed Securities — 0.1% | | | | | |
Banc of America Commercial Mortgage Trust, Series 2007-1, Class AMFX, 5.48%, 1/15/49 (a) | | USD | 30 | | | | 31,524 | |
COBALT CMBS Commercial Mortgage Trust, Series 2006-C1, Class A4, 5.22%, 8/15/48 | | | 327 | | | | 351,141 | |
Greenwich Capital Commercial Funding Corp., Series 2006-GG7, Class AJ, 5.82%, 7/10/38 (a) | | | 170 | | | | 175,919 | |
JPMorgan Chase Commercial Mortgage Securities Trust, Series 2006-CB14, Class AM, 5.45%, 12/12/44 (a) | | | 180 | | | | 192,302 | |
LB-UBS Commercial Mortgage Trust,
Series 2007-C1, Class AM,
5.46%, 2/15/40 | | | 165 | | | | 181,268 | |
Total Non-Agency Mortgage-Backed Securities — 0.1% | | | | 932,154 | |
| | | | | | | | |
| U.S. Government Sponsored Agency Securities | | | | |
Agency Obligations — 0.3% | | | | | | | | |
Fannie Mae, 6.63%, 11/15/30 | | | 200 | | | | 274,817 | |
Federal Home Loan Bank, 5.63%, 6/13/16 | | | 890 | | | | 984,958 | |
Freddie Mac, 1.00%, 7/30/14 | | | 1,000 | | | | 1,002,762 | |
Small Business Administration Participation Certificates, Series 1997-20F,
Class 1, 7.20%, 6/01/17 | | | 62 | | | | 66,077 | |
Tennessee Valley Authority, 5.25%, 9/15/39 | | | 145 | | | | 164,196 | |
| | | | | | | | |
| | | | | | | | 2,492,810 | |
Mortgage-Backed Securities — 2.8% | | | | | | | | |
Fannie Mae Mortgage-Backed Securities: | | | | | | | | |
2.50%, 4/01/29 (g) | | | 800 | | | | 799,375 | |
3.00%, 4/01/44 (g) | | | 1,830 | | | | 1,766,236 | |
3.50%, 4/01/29-4/01/44 (g) | | | 3,550 | | | | 3,607,203 | |
4.00%, 4/01/29 (g) | | | 450 | | | | 475,787 | |
4.50%, 4/01/44 (g) | | | 450 | | | | 480,023 | |
5.50%, 4/01/44 (g) | | | 300 | | | | 331,277 | |
6.00%, 4/01/44 (g) | | | 900 | | | | 1,003,043 | |
6.50%, 4/01/44 (g) | | | 250 | | | | 281,172 | |
Freddie Mac Mortgage-Backed Securities: | | | | | | | | |
2.50%, 4/01/29 (g) | | | 500 | | | | 499,766 | |
3.00%, 4/01/29-4/01/44 (g) | | | 1,450 | | | | 1,444,340 | |
3.50%, 4/01/44 (g) | | | 300 | | | | 301,453 | |
4.00%, 4/01/44 (g) | | | 1,150 | | | | 1,192,990 | |
4.50%, 4/01/29-4/01/44 (g) | | | 700 | | | | 744,086 | |
5.00%, 4/01/44 (g) | | | 950 | | | | 1,032,160 | |
5.50%, 4/01/44 (g) | | | 300 | | | | 329,906 | |
| | | | | | | | |
| U.S. Government Sponsored Agency Securities | | Par
(000) | | | Value | |
Mortgage-Backed Securities (concluded) | | | | | |
Ginnie Mae Mortgage-Backed Securities: | | | | | | | | |
3.00%, 4/15/44 (g) | | USD | 500 | | | $ | 491,641 | |
4.00%, 4/15/44 (g) | | | 1,400 | | | | 1,470,438 | |
4.50%, 4/15/44 (g) | | | 1,600 | | | | 1,724,500 | |
5.00%, 4/15/44 (g) | | | 1,000 | | | | 1,092,188 | |
5.50%, 4/15/44 (g) | | | 350 | | | | 387,242 | |
| | | | | | | | |
| | | | | | | | 19,454,826 | |
Total U.S. Government Sponsored Agency Securities — 3.1% | | | | 21,947,636 | |
| | | | | | | | |
| U.S. Treasury Obligations | | | | | | |
U.S. Treasury Bonds: | | | | | | | | |
5.25%, 11/15/28 | | | 500 | | | | 625,625 | |
5.38%, 2/15/31 | | | 700 | | | | 895,453 | |
5.00%, 5/15/37 | | | 570 | | | | 715,885 | |
4.38%, 5/15/41 | | | 350 | | | | 404,578 | |
3.00%, 5/15/42 | | | 1,068 | | | | 962,868 | |
U.S. Treasury Notes: | | | | | | | | |
0.25%, 4/30/14 | | | 570 | | | | 570,067 | |
1.00%, 6/30/19 | | | 580 | | | | 555,622 | |
Total U.S. Treasury Obligations — 0.7% | | | | 4,730,098 | |
Total Long-Term Investments (Cost — $418,460,864) — 64.2% | | | | 445,374,831 | |
| | | | | | | | |
| Short-Term Securities | | Shares | | | | |
BlackRock Liquidity Funds, TempFund, Institutional Class, 0.03% (f)(h) | | | 252,758,818 | | | | 252,758,818 | |
Total Short-Term Securities (Cost — $252,758,818) — 36.4% | | | | 252,758,818 | |
| | | | | | | | |
| Options Purchased | | | | | | |
(Cost — $20,479) — 0.0% | | | | | | | 19,766 | |
Total Investments Before Options Written (Cost — $671,240,161) — 100.6% | | | | 698,153,415 | |
| | | | | | | | |
| Options Written | | | | | | |
(Premiums Received — $ 152,235) — (0.0)% | | | | (135,969 | ) |
Total Investments Net of Options Written — 100.6% | | | | 698,017,446 | |
Liabilities in Excess of Other Assets — (0.6)% | | | | (4,070,025 | ) |
| | | | | | | | |
Net Assets — 100.0% | | | | | | $ | 693,947,421 | |
| | | | | | | | |
See Notes to Financial Statements.
| | | | | | |
| | | BLACKROCK MANAGED VOLATILITY PORTFOLIO | | MARCH 31, 2014 | | 13 |
| | |
| Schedule of Investments (continued) | | |
|
| Notes to Schedule of Investments |
| (a) | Variable rate security. Rate shown is as of report date. |
| (b) | Security exempt from registration pursuant to Rule 144A under the Securities Act of 1933, as amended. These securities may be resold in transactions exempt from registration to qualified institutional investors. |
| (c) | Non-income producing security. |
| (d) | Restricted security as to resale. As of report date, the Fund held 0.01% of its net assets, with a current value of $50,260 and an original cost of $106,067, in these securities. |
| (e) | Represents a step-up bond that pays an initial coupon rate for the first period and then a higher coupon rate for the following periods. Rate shown is as of report date. |
| (f) | Investments in issuers considered to be an affiliate of the Fund during the six months ended March 31, 2014, for purposes of Section 2(a)(3) of the Investment Company Act of 1940, as amended, were as follows: |
| | | | | | | | | | | | | | | | | | | | | | | | | | | | |
| Affiliate | | Shares/Beneficial Interest Held at September 30, 2013 | | | Shares Purchased | | | Shares/Beneficial Interest Sold | | | Shares Held at March 31, 2014 | | | Value at March 31, 2014 | | | Income | | | Realized
Gain (Loss) | |
BlackRock Liquidity Funds, TempFund, Institutional Class | | | 153,052,516 | | | | 99,706,302 | 1 | | | — | | | | 252,758,818 | | | $ | 252,758,818 | | | $ | 48,709 | | | | — | |
BlackRock Liquidity Series, LLC, Money Market Series | | $ | 243,001 | | | | — | | | $ | 243,001 | 2 | | | — | | | | — | | | $ | 1,762 | | | | — | |
iShares 1-3 Year Credit Bond ETF | | | 196,815 | | | | — | | | | — | | | | 196,815 | | | $ | 20,756,110 | | | $ | 105,778 | | | | — | |
iShares iBoxx $ High Yield Corporate Bond ETF | | | 127,830 | | | | — | | | | 127,830 | | | | — | | | | — | | | $ | 56,855 | | | $ | 256,111 | |
iShares MSCI Mexico Capped ETF | | | 161,084 | | | | — | | | | 161,084 | | | | — | | | | — | | | $ | 18,298 | | | $ | (462,883 | ) |
| | 1 | Represents net shares purchased. |
| | 2 | Represents beneficial interest sold. |
| (g) | Represents or includes a TBA transaction. Unsettled TBA transactions as of March 31, 2014 were as follows: |
| | | | | | | | |
| Counterparty | | Value | | | Unrealized
Depreciation | |
Barclays Capital, Inc. | | $ | 4,113,185 | | | $ | (880 | ) |
Deutsche Bank Securities, Inc. | | $ | 2,608,912 | | | $ | (5,494 | ) |
Goldman Sachs & Co. | | $ | 8,885,018 | | | $ | (8,326 | ) |
J.P. Morgan Securities LLC | | $ | 480,023 | | | $ | (844 | ) |
Merrill Lynch, Pierce, Fenner & Smith, Inc. | | $ | 264,414 | | | $ | (1,211 | ) |
Morgan Stanley & Co. LLC | | $ | 3,103,274 | | | $ | (824 | ) |
| (h) | Represents the current yield as of report date. |
| Ÿ | | For Fund compliance purposes, the Fund’s industry classifications refer to any one or more of the industry sub-classifications used by one or more widely recognized market indexes or ratings group indexes, and/or as defined by the investment advisor. These definitions may not apply for purposes of this report, which may combine such industry sub-classifications for reporting ease. |
| Ÿ | | Financial futures contracts outstanding as of March 31, 2014 were as follows: |
| | | | | | | | | | | | | | | | | | | | | | |
Contracts Purchased/ (Sold) | | | Issue | | Exchange | | Expiration | | | | | | Notional
Value | | | Unrealized Appreciation (Depreciation) | |
| | 175 | | | CAC 40 10 Euro Index | | NYSE Liffe | | | April 2014 | | | | USD | | | | 10,586,262 | | | $ | 371,074 | |
| | 119 | | | AUD Currency Futures | | Chicago Mercantile | | | June 2014 | | | | USD | | | | 10,977,750 | | | | 355,525 | |
| | 274 | | | Australian Government Bonds (10 Year) | | Sydney | | | June 2014 | | | | USD | | | | 29,361,725 | | | | 171,730 | |
| | 34 | | | CHF Currency Futures | | Chicago Mercantile | | | June 2014 | | | | USD | | | | 4,810,150 | | | | (54,949 | ) |
| | 79 | | | DAX Index | | Eurex | | | June 2014 | | | | USD | | | | 26,083,648 | | | | 1,426,341 | |
| | 437 | | | Euro STOXX 50 Index | | Eurex | | | June 2014 | | | | USD | | | | 18,663,121 | | | | 1,008,326 | |
| | 30 | | | Euro-Schatz | | Eurex | | | June 2014 | | | | USD | | | | 4,563,420 | | | | (4,510 | ) |
| | 24 | | | GBP Currency Futures | | Chicago Mercantile | | | June 2014 | | | | USD | | | | 2,499,300 | | | | 8,763 | |
| | 192 | | | Nikkei 225 Index | | Osaka Securities | | | June 2014 | | | | USD | | | | 27,586,688 | | | | (488,533 | ) |
| | 4 | | | Ultra Treasury Bonds | | Chicago Board of Trade | | | June 2014 | | | | USD | | | | 577,875 | | | | 7,912 | |
| | 12 | | | U.S. Treasury Bonds (30 Year) | | Chicago Board of Trade | | | June 2014 | | | | USD | | | | 1,598,625 | | | | (4,685 | ) |
| | 45 | | | U.S. Treasury Notes (2 Year) | | Chicago Board of Trade | | | June 2014 | | | | USD | | | | 9,880,313 | | | | (10,852 | ) |
See Notes to Financial Statements.
| | | | | | |
| 14 | | BLACKROCK MANAGED VOLATILITY PORTFOLIO | | MARCH 31, 2014 | | |
| | |
| Schedule of Investments (continued) | | |
| Ÿ | | Financial futures contracts outstanding as of March 31, 2014 were as follows: (concluded) |
| | | | | | | | | | | | | | | | | | | | | | | | |
Contracts Purchased/ (Sold) | | | Issue | | Exchange | | | Expiration | | | | | | Notional Value | | | Unrealized Appreciation (Depreciation) | |
| | (16 | ) | | Euro-Bund 8.5 to 10.5-Year
Bond Futures Call Options, Strike Price EUR 142.50 | | | Eurex | | | | April 2014 | | | | USD | | | | 26,451 | | | $ | (10,520 | ) |
| | (16 | ) | | Euro-Bund 8.5 to 10.5-Year
Bond Futures Put Options, Strike Price EUR 142.50 | | | Eurex | | | | April 2014 | | | | USD | | | | 7,054 | | | | 10,820 | |
| | (12 | ) | | Euro-Bund 8.5 to 10.5-Year
Bond Futures Call Options, Strike Price EUR 142.50 | | | Eurex | | | | May 2014 | | | | USD | | | | 25,459 | | | | 731 | |
| | (12 | ) | | Euro-Bund 8.5 to 10.5-Year
Bond Futures Put Options, Strike Price EUR 142.50 | | | Eurex | | | | May 2014 | | | | USD | | | | 10,911 | | | | 1,613 | |
| | (11 | ) | | Canadian Government Bonds (10 Year) | | | Montreal | | | | June 2014 | | | | USD | | | | 1,292,836 | | | | (4,459 | ) |
| | (687 | ) | | E-Mini S&P 500 Futures | | | Chicago Mercantile | | | | June 2014 | | | | USD | | | | 64,045,575 | | | | (848,683 | ) |
| | (11 | ) | | Euro - OAT French Government Bonds | | | Eurex | | | | June 2014 | | | | USD | | | | 2,065,067 | | | | (18,174 | ) |
| | (79 | ) | | EUR Currency Futures | | | Chicago Mercantile | | | | June 2014 | | | | USD | | | | 13,601,825 | | | | 126,630 | |
| | (53 | ) | | Euro-Bobl | | | Eurex | | | | June 2014 | | | | USD | | | | 9,153,995 | | | | (5,387 | ) |
| | (51 | ) | | Euro-Bund | | | Eurex | | | | June 2014 | | | | USD | | | | 10,073,953 | | | | (17,296 | ) |
| | (67 | ) | | FTSE 100 Index Futures | | | NYSE Liffe | | | | June 2014 | | | | USD | | | | 7,308,979 | | | | (98,703 | ) |
| | (8 | ) | | Gilt British | | | NYSE Liffe | | | | June 2014 | | | | USD | | | | 1,460,814 | | | | (2,141 | ) |
| | (55 | ) | | JPY Currency Futures | | | Chicago Mercantile | | | | June 2014 | | | | USD | | | | 666,325,000 | | | | 35,206 | |
| | (3 | ) | | U.S. Treasury Notes (5 Year) | | | Chicago Board of Trade | | | | June 2014 | | | | USD | | | | 356,859 | | | | 286 | |
| | (326 | ) | | U.S. Treasury Notes (10 Year) | | | Chicago Board of Trade | | | | June 2014 | | | | USD | | | | 40,261,000 | | | | 166,881 | |
| | Total | | | | | | | | | | | | | | | | | | | | | $ | 2,122,946 | |
| | | | | | | | | | | | | | | | | | | | | | | | |
| Ÿ | | Forward foreign currency exchange contracts outstanding as of March 31, 2014 were as follows: |
| | | | | | | | | | | | | | | | | | | | | | |
Currency
Purchased | | | Currency
Sold | | | Counterparty | | Settlement Date | | | Unrealized Appreciation (Depreciation) | |
| AUD | | | 1,270,000 | | | | USD | | | | 1,175,258 | | | Royal Bank of Canada | | | 4/03/14 | | | $ | 2,302 | |
| AUD | | | 1,270,000 | | | | USD | | | | 1,174,318 | | | UBS AG | | | 4/03/14 | | | | 3,242 | |
| CAD | | | 5,033,436 | | | | USD | | | | 4,569,620 | | | Royal Bank of Canada | | | 4/03/14 | | | | (16,849 | ) |
| CZK | | | 4,700,000 | | | | USD | | | | 235,437 | | | BNP Paribas S.A. | | | 4/03/14 | | | | 436 | |
| DKK | | | 4,400,000 | | | | USD | | | | 809,344 | | | Deutsche Bank AG | | | 4/03/14 | | | | 2,578 | |
| EUR | | | 49,910,000 | | | | USD | | | | 68,496,484 | | | Deutsche Bank AG | | | 4/03/14 | | | | 261,930 | |
| GBP | | | 7,545,000 | | | | USD | | | | 12,538,085 | | | Barclays Bank PLC | | | 4/03/14 | | | | 40,207 | |
| ILS | | | 1,200,000 | | | | USD | | | | 342,769 | | | Deutsche Bank AG | | | 4/03/14 | | | | 1,305 | |
| JPY | | | 2,884,500,000 | | | | USD | | | | 28,181,605 | | | HSBC Bank PLC | | | 4/03/14 | | | | (234,627 | ) |
| MXN | | | 8,500,000 | | | | USD | | | | 650,019 | | | Credit Suisse International | | | 4/03/14 | | | | 897 | |
| NOK | | | 5,350,000 | | | | USD | | | | 891,183 | | | BNP Paribas S.A. | | | 4/03/14 | | | | 2,197 | |
| NZD | | | 350,000 | | | | USD | | | | 303,800 | | | Westpac Banking Corp. | | | 4/03/14 | | | | (127 | ) |
| SEK | | | 11,400,000 | | | | USD | | | | 1,757,254 | | | BNP Paribas S.A. | | | 4/03/14 | | | | 4,016 | |
| SGD | | | 400,000 | | | | USD | | | | 317,133 | | | Westpac Banking Corp. | | | 4/03/14 | | | | 858 | |
| THB | | | 13,500,000 | | | | USD | | | | 415,538 | | | Citibank N.A. | | | 4/03/14 | | | | 560 | |
| USD | | | 564,999 | | | | AUD | | | | 635,000 | | | Deutsche Bank AG | | | 4/03/14 | | | | (23,781 | ) |
| USD | | | 565,093 | | | | AUD | | | | 635,000 | | | HSBC Bank PLC | | | 4/03/14 | | | | (23,687 | ) |
| USD | | | 565,131 | | | | AUD | | | | 635,000 | | | Royal Bank of Canada | | | 4/03/14 | | | | (23,649 | ) |
| USD | | | 565,180 | | | | AUD | | | | 635,000 | | | Westpac Banking Corp. | | | 4/03/14 | | | | (23,599 | ) |
See Notes to Financial Statements.
| | | | | | |
| | | BLACKROCK MANAGED VOLATILITY PORTFOLIO | | MARCH 31, 2014 | | 15 |
| | |
| Schedule of Investments (continued) | | |
| Ÿ | | Forward foreign currency exchange contracts outstanding as of March 31, 2014 were as follows: (continued) |
| | | | | | | | | | | | | | | | | | | | | | |
Currency
Purchased | | | Currency
Sold | | | Counterparty | | Settlement Date | | | Unrealized Appreciation (Depreciation) | |
| USD | | | 68,884 | | | | CAD | | | | 76,308 | | | JPMorgan Chase Bank N.A. | | | 4/03/14 | | | $ | (137 | ) |
| USD | | | 223,083 | | | | CAD | | | | 247,128 | | | Royal Bank of Canada | | | 4/03/14 | | | | (445 | ) |
| USD | | | 4,227,798 | | | | CAD | | | | 4,710,000 | | | Royal Bank of Canada | | | 4/03/14 | | | | (32,422 | ) |
| USD | | | 234,802 | | | | CZK | | | | 4,700,000 | | | BNP Paribas S.A. | | | 4/03/14 | | | | (1,071 | ) |
| USD | | | 805,471 | | | | DKK | | | | 4,400,000 | | | BNP Paribas S.A. | | | 4/03/14 | | | | (6,451 | ) |
| USD | | | 16,597,567 | | | | EUR | | | | 12,155,000 | | | BNP Paribas S.A. | | | 4/03/14 | | | | (147,745 | ) |
| USD | | | 16,596,364 | | | | EUR | | | | 12,155,000 | | | Deutsche Bank AG | | | 4/03/14 | | | | (148,948 | ) |
| USD | | | 538,640 | | | | EUR | | | | 390,000 | | | Goldman Sachs International | | | 4/03/14 | | | | 1,357 | |
| USD | | | 16,596,388 | | | | EUR | | | | 12,155,000 | | | Goldman Sachs International | | | 4/03/14 | | | | (148,924 | ) |
| USD | | | 123,800 | | | | EUR | | | | 90,000 | | | UBS AG | | | 4/03/14 | | | | (188 | ) |
| USD | | | 1,114,204 | | | | EUR | | | | 810,000 | | | UBS AG | | | 4/03/14 | | | | (1,691 | ) |
| USD | | | 16,595,307 | | | | EUR | | | | 12,155,000 | | | UBS AG | | | 4/03/14 | | | | (150,005 | ) |
| USD | | | 12,546,173 | | | | GBP | | | | 7,545,000 | | | Royal Bank of Canada | | | 4/03/14 | | | | (32,119 | ) |
| USD | | | 341,054 | | | | ILS | | | | 1,200,000 | | | Deutsche Bank AG | | | 4/03/14 | | | | (3,020 | ) |
| USD | | | 28,308,470 | | | | JPY | | | | 2,884,500,000 | | | Credit Suisse International | | | 4/03/14 | | | | 361,491 | |
| USD | | | 635,752 | | | | MXN | | | | 8,500,000 | | | Credit Suisse International | | | 4/03/14 | | | | (15,164 | ) |
| USD | | | 882,252 | | | | NOK | | | | 5,350,000 | | | BNP Paribas S.A. | | | 4/03/14 | | | | (11,128 | ) |
| USD | | | 291,489 | | | | NZD | | | | 350,000 | | | Westpac Banking Corp. | | | 4/03/14 | | | | (12,185 | ) |
| USD | | | 1,742,720 | | | | SEK | | | | 11,400,000 | | | BNP Paribas S.A. | | | 4/03/14 | | | | (18,549 | ) |
| USD | | | 315,588 | | | | SGD | | | | 400,000 | | | HSBC Bank PLC | | | 4/03/14 | | | | (2,403 | ) |
| USD | | | 413,192 | | | | THB | | | | 13,500,000 | | | Citibank N.A. | | | 4/03/14 | | | | (2,906 | ) |
| USD | | | 276,003 | | | | ZAR | | | | 3,000,000 | | | Credit Suisse International | | | 4/03/14 | | | | (8,820 | ) |
| ZAR | | | 3,000,000 | | | | USD | | | | 283,119 | | | Barclays Bank PLC | | | 4/03/14 | | | | 1,704 | |
| USD | | | 1,172,540 | | | | AUD | | | | 1,270,000 | | | Royal Bank of Canada | | | 5/07/14 | | | | (2,263 | ) |
| USD | | | 1,171,607 | | | | AUD | | | | 1,270,000 | | | UBS AG | | | 5/07/14 | | | | (3,196 | ) |
| USD | | | 4,565,972 | | | | CAD | | | | 5,033,436 | | | Royal Bank of Canada | | | 5/07/14 | | | | 16,841 | |
| USD | | | 235,478 | | | | CZK | | | | 4,700,000 | | | BNP Paribas S.A. | | | 5/07/14 | | | | (439 | ) |
| USD | | | 809,538 | | | | DKK | | | | 4,400,000 | | | Deutsche Bank AG | | | 5/07/14 | | | | (2,576 | ) |
| USD | | | 68,493,090 | | | | EUR | | | | 49,910,000 | | | Deutsche Bank AG | | | 5/07/14 | | | | (260,380 | ) |
| USD | | | 358,317 | | | | EUR | | | | 260,000 | | | JPMorgan Chase Bank N.A. | | | 5/07/14 | | | | 154 | |
| USD | | | 12,534,901 | | | | GBP | | | | 7,545,000 | | | Barclays Bank PLC | | | 5/07/14 | | | | (40,250 | ) |
| USD | | | 342,632 | | | | ILS | | | | 1,200,000 | | | Deutsche Bank AG | | | 5/07/14 | | | | (1,324 | ) |
| USD | | | 28,186,562 | | | | JPY | | | | 2,884,500,000 | | | HSBC Bank PLC | | | 5/07/14 | | | | 234,410 | |
| USD | | | 648,333 | | | | MXN | | | | 8,500,000 | | | Credit Suisse International | | | 5/07/14 | | | | (866 | ) |
| USD | | | 890,025 | | | | NOK | | | | 5,350,000 | | | BNP Paribas S.A. | | | 5/07/14 | | | | (2,174 | ) |
| USD | | | 302,995 | | | | NZD | | | | 350,000 | | | Westpac Banking Corp. | | | 5/07/14 | | | | 168 | |
| USD | | | 1,756,305 | | | | SEK | | | | 11,400,000 | | | BNP Paribas S.A. | | | 5/07/14 | | | | (4,017 | ) |
| USD | | | 317,132 | | | | SGD | | | | 400,000 | | | Westpac Banking Corp. | | | 5/07/14 | | | | (864 | ) |
| USD | | | 414,823 | | | | THB | | | | 13,500,000 | | | Citibank N.A. | | | 5/07/14 | | | | (645 | ) |
| USD | | | 281,580 | | | | ZAR | | | | 3,000,000 | | | Barclays Bank PLC | | | 5/08/14 | | | | (1,705 | ) |
| USD | | | 3,475,368 | | | | JPY | | | | 352,159,000 | | | Deutsche Bank AG | | | 6/05/14 | | | | 62,260 | |
| AUD | | | 144,000 | | | | USD | | | | 132,044 | | | Barclays Bank PLC | | | 6/11/14 | | | | 837 | |
| AUD | | | 283,000 | | | | USD | | | | 253,640 | | | Citibank N.A. | | | 6/11/14 | | | | 7,510 | |
| AUD | | | 207,617 | | | | USD | | | | 186,230 | | | Credit Suisse International | | | 6/11/14 | | | | 5,357 | |
| AUD | | | 266,936 | | | | USD | | | | 239,438 | | | Credit Suisse International | | | 6/11/14 | | | | 6,888 | |
See Notes to Financial Statements.
| | | | | | |
| 16 | | BLACKROCK MANAGED VOLATILITY PORTFOLIO | | MARCH 31, 2014 | | |
| | |
| Schedule of Investments (continued) | | |
| Ÿ | | Forward foreign currency exchange contracts outstanding as of March 31, 2014 were as follows: (continued) |
| | | | | | | | | | | | | | | | | | | | | | |
Currency
Purchased | | | Currency
Sold | | | Counterparty | | Settlement Date | | | Unrealized Appreciation (Depreciation) | |
| AUD | | | 291,000 | | | | USD | | | | 259,846 | | | Credit Suisse International | | | 6/11/14 | | | $ | 8,687 | |
| AUD | | | 433,000 | | | | USD | | | | 390,360 | | | Credit Suisse International | | | 6/11/14 | | | | 9,208 | |
| AUD | | | 191,000 | | | | USD | | | | 172,668 | | | HSBC Bank PLC | | | 6/11/14 | | | | 3,585 | |
| AUD | | | 10,000 | | | | USD | | | | 9,193 | | | JPMorgan Chase Bank N.A. | | | 6/11/14 | | | | 35 | |
| AUD | | | 12,000 | | | | USD | | | | 10,862 | | | JPMorgan Chase Bank N.A. | | | 6/11/14 | | | | 212 | |
| AUD | | | 34,000 | | | | USD | | | | 30,775 | | | JPMorgan Chase Bank N.A. | | | 6/11/14 | | | | 600 | |
| AUD | | | 72,000 | | | | USD | | | | 66,077 | | | UBS AG | | | 6/11/14 | | | | 364 | |
| AUD | | | 187,000 | | | | USD | | | | 172,273 | | | UBS AG | | | 6/11/14 | | | | 289 | |
| AUD | | | 270,000 | | | | USD | | | | 240,979 | | | UBS AG | | | 6/11/14 | | | | 8,174 | |
| AUD | | | 145,000 | | | | USD | | | | 132,746 | | | Westpac Banking Corp. | | | 6/11/14 | | | | 1,059 | |
| AUD | | | 190,000 | | | | USD | | | | 171,470 | | | Westpac Banking Corp. | | | 6/11/14 | | | | 3,860 | |
| CAD | | | 143,000 | | | | USD | | | | 127,111 | | | Citibank N.A. | | | 6/11/14 | | | | 2,018 | |
| CAD | | | 66,000 | | | | USD | | | | 58,463 | | | Deutsche Bank AG | | | 6/11/14 | | | | 1,135 | |
| CAD | | | 52,000 | | | | USD | | | | 46,386 | | | Goldman Sachs International | | | 6/11/14 | | | | 570 | |
| CAD | | | 265,000 | | | | USD | | | | 238,595 | | | Royal Bank of Canada | | | 6/11/14 | | | | 701 | |
| CAD | | | 389,000 | | | | USD | | | | 350,239 | | | Royal Bank of Canada | | | 6/11/14 | | | | 1,029 | |
| CAD | | | 15,000 | | | | USD | | | | 13,438 | | | State Street Bank and Trust Co. | | | 6/11/14 | | | | 107 | |
| EUR | | | 134,000 | | | | USD | | | | 184,669 | | | Deutsche Bank AG | | | 6/11/14 | | | | (85 | ) |
| EUR | | | 802,000 | | | | USD | | | | 1,101,096 | | | Deutsche Bank AG | | | 6/11/14 | | | | 3,654 | |
| EUR | | | 146,000 | | | | USD | | | | 201,753 | | | Goldman Sachs International | | | 6/11/14 | | | | (639 | ) |
| EUR | | | 61,000 | | | | USD | | | | 84,028 | | | HSBC Bank PLC | | | 6/11/14 | | | | (1 | ) |
| EUR | | | 29,000 | | | | USD | | | | 39,896 | | | JPMorgan Chase Bank N.A. | | | 6/11/14 | | | | 52 | |
| EUR | | | 148,000 | | | | USD | | | | 205,388 | | | JPMorgan Chase Bank N.A. | | | 6/11/14 | | | | (1,519 | ) |
| EUR | | | 191,000 | | | | USD | | | | 263,677 | | | UBS AG | | | 6/11/14 | | | | (576 | ) |
| GBP | | | 103,000 | | | | USD | | | | 171,217 | | | Goldman Sachs International | | | 6/11/14 | | | | 406 | |
| GBP | | | 8,000 | | | | USD | | | | 13,344 | | | HSBC Bank PLC | | | 6/11/14 | | | | (14 | ) |
| GBP | | | 56,000 | | | | USD | | | | 93,410 | | | HSBC Bank PLC | | | 6/11/14 | | | | (101 | ) |
| GBP | | | 136,000 | | | | USD | | | | 226,615 | | | HSBC Bank PLC | | | 6/11/14 | | | | (6 | ) |
| GBP | | | 219,000 | | | | USD | | | | 365,552 | | | HSBC Bank PLC | | | 6/11/14 | | | | (645 | ) |
| GBP | | | 447,000 | | | | USD | | | | 742,268 | | | UBS AG | | | 6/11/14 | | | | 2,541 | |
| JPY | | | 20,300,000 | | | | USD | | | | 197,696 | | | Barclays Bank PLC | | | 6/11/14 | | | | (943 | ) |
| JPY | | | 40,000,000 | | | | USD | | | | 392,015 | | | Barclays Bank PLC | | | 6/11/14 | | | | (4,325 | ) |
| JPY | | | 20,300,000 | | | | USD | | | | 197,696 | | | BNP Paribas S.A. | | | 6/11/14 | | | | (943 | ) |
| JPY | | | 6,700,000 | | | | USD | | | | 65,083 | | | Citibank N.A. | | | 6/11/14 | | | | (145 | ) |
| JPY | | | 16,400,000 | | | | USD | | | | 159,651 | | | Credit Suisse International | | | 6/11/14 | | | | (698 | ) |
| JPY | | | 53,500,000 | | | | USD | | | | 520,218 | | | Credit Suisse International | | | 6/11/14 | | | | (1,682 | ) |
| JPY | | | 20,400,000 | | | | USD | | | | 199,443 | | | Deutsche Bank AG | | | 6/11/14 | | | | (1,721 | ) |
| JPY | | | 3,800,000 | | | | USD | | | | 36,922 | | | Goldman Sachs International | | | 6/11/14 | | | | (91 | ) |
| JPY | | | 4,100,000 | | | | USD | | | | 40,432 | | | Goldman Sachs International | | | 6/11/14 | | | | (694 | ) |
| JPY | | | 12,300,000 | | | | USD | | | | 121,297 | | | Goldman Sachs International | | | 6/11/14 | | | | (2,083 | ) |
| JPY | | | 16,400,000 | | | | USD | | | | 159,514 | | | Goldman Sachs International | | | 6/11/14 | | | | (562 | ) |
| JPY | | | 17,500,000 | | | | USD | | | | 172,901 | | | Goldman Sachs International | | | 6/11/14 | | | | (3,287 | ) |
| JPY | | | 17,500,000 | | | | USD | | | | 172,919 | | | HSBC Bank PLC | | | 6/11/14 | | | | (3,305 | ) |
| JPY | | | 5,100,000 | | | | USD | | | | 50,000 | | | JPMorgan Chase Bank N.A. | | | 6/11/14 | | | | (570 | ) |
| JPY | | | 20,150,000 | | | | USD | | | | 198,986 | | | JPMorgan Chase Bank N.A. | | | 6/11/14 | | | | (3,687 | ) |
See Notes to Financial Statements.
| | | | | | |
| | | BLACKROCK MANAGED VOLATILITY PORTFOLIO | | MARCH 31, 2014 | | 17 |
| | |
| Schedule of Investments (continued) | | |
| Ÿ | | Forward foreign currency exchange contracts outstanding as of March 31, 2014 were as follows: (continued) |
| | | | | | | | | | | | | | | | | | | | | | |
Currency
Purchased | | | Currency
Sold | | | Counterparty | | Settlement Date | | | Unrealized Appreciation (Depreciation) | |
| JPY | | | 20,400,000 | | | | USD | | | | 198,726 | | | UBS AG | | | 6/11/14 | | | $ | (1,004 | ) |
| NOK | | | 82,000 | | | | USD | | | | 13,690 | | | Barclays Bank PLC | | | 6/11/14 | | | | (34 | ) |
| NOK | | | 1,237,000 | | | | USD | | | | 206,728 | | | Barclays Bank PLC | | | 6/11/14 | | | | (724 | ) |
| NOK | | | 84,000 | | | | USD | | | | 13,967 | | | Deutsche Bank AG | | | 6/11/14 | | | | 22 | |
| NOK | | | 159,000 | | | | USD | | | | 26,501 | | | HSBC Bank PLC | | | 6/11/14 | | | | (22 | ) |
| NOK | | | 710,000 | | | | USD | | | | 119,087 | | | JPMorgan Chase Bank N.A. | | | 6/11/14 | | | | (846 | ) |
| NZD | | | 135,000 | | | | USD | | | | 114,880 | | | Barclays Bank PLC | | | 6/11/14 | | | | 1,587 | |
| NZD | | | 110,000 | | | | USD | | | | 91,896 | | | HSBC Bank PLC | | | 6/11/14 | | | | 3,003 | |
| NZD | | | 531,000 | | | | USD | | | | 443,608 | | | HSBC Bank PLC | | | 6/11/14 | | | | 14,498 | |
| NZD | | | 108,000 | | | | USD | | | | 91,599 | | | Westpac Banking Corp. | | | 6/11/14 | | | | 1,575 | |
| NZD | | | 242,000 | | | | USD | | | | 205,653 | | | Westpac Banking Corp. | | | 6/11/14 | | | | 3,126 | |
| SEK | | | 92,000 | | | | USD | | | | 14,382 | | | BNP Paribas S.A. | | | 6/11/14 | | | | (184 | ) |
| SEK | | | 294,000 | | | | USD | | | | 45,496 | | | Deutsche Bank AG | | | 6/11/14 | | | | (124 | ) |
| SEK | | | 418,000 | | | | USD | | | | 65,765 | | | Deutsche Bank AG | | | 6/11/14 | | | | (1,256 | ) |
| SEK | | | 526,000 | | | | USD | | | | 81,831 | | | Deutsche Bank AG | | | 6/11/14 | | | | (655 | ) |
| SEK | | | 753,000 | | | | USD | | | | 118,561 | | | Deutsche Bank AG | | | 6/11/14 | | | | (2,352 | ) |
| SEK | | | 588,000 | | | | USD | | | | 91,981 | | | HSBC Bank PLC | | | 6/11/14 | | | | (1,237 | ) |
| SEK | | | 6,143,000 | | | | USD | | | | 950,910 | | | HSBC Bank PLC | | | 6/11/14 | | | | (2,876 | ) |
| SEK | | | 1,786,000 | | | | USD | | | | 275,394 | | | JPMorgan Chase Bank N.A. | | | 6/11/14 | | | | 235 | |
| SEK | | | 360,000 | | | | USD | | | | 56,618 | | | UBS AG | | | 6/11/14 | | | | (1,060 | ) |
| USD | | | 113,890 | | | | AUD | | | | 124,000 | | | Bank of America N.A. | | | 6/11/14 | | | | (536 | ) |
| USD | | | 131,386 | | | | AUD | | | | 143,000 | | | Barclays Bank PLC | | | 6/11/14 | | | | (573 | ) |
| USD | | | 131,988 | | | | AUD | | | | 147,000 | | | Barclays Bank PLC | | | 6/11/14 | | | | (3,662 | ) |
| USD | | | 146,244 | | | | AUD | | | | 159,000 | | | BNP Paribas S.A. | | | 6/11/14 | | | | (480 | ) |
| USD | | | 25,352 | | | | AUD | | | | 28,000 | | | Deutsche Bank AG | | | 6/11/14 | | | | (486 | ) |
| USD | | | 95,009 | | | | AUD | | | | 105,000 | | | Deutsche Bank AG | | | 6/11/14 | | | | (1,884 | ) |
| USD | | | 98,693 | | | | AUD | | | | 109,000 | | | Deutsche Bank AG | | | 6/11/14 | | | | (1,891 | ) |
| USD | | | 113,039 | | | | AUD | | | | 126,000 | | | Royal Bank of Canada | | | 6/11/14 | | | | (3,233 | ) |
| USD | | | 238,909 | | | | AUD | | | | 259,000 | | | UBS AG | | | 6/11/14 | | | | (93 | ) |
| USD | | | 509,949 | | | | AUD | | | | 572,000 | | | UBS AG | | | 6/11/14 | | | | (17,887 | ) |
| USD | | | 836,246 | | | | AUD | | | | 938,000 | | | UBS AG | | | 6/11/14 | | | | (29,332 | ) |
| USD | | | 88,510 | | | | CAD | | | | 98,000 | | | Royal Bank of Canada | | | 6/11/14 | | | | 15 | |
| USD | | | 13,540 | | | | CAD | | | | 15,000 | | | State Street Bank and Trust Co. | | | 6/11/14 | | | | (5 | ) |
| USD | | | 45,615 | | | | EUR | | | | 33,000 | | | Bank of America N.A. | | | 6/11/14 | | | | 157 | |
| USD | | | 22,067 | | | | EUR | | | | 16,000 | | | Barclays Bank PLC | | | 6/11/14 | | | | 27 | |
| USD | | | 264,705 | | | | EUR | | | | 191,000 | | | Barclays Bank PLC | | | 6/11/14 | | | | 1,604 | |
| USD | | | 69,046 | | | | EUR | | | | 50,000 | | | Citibank N.A. | | | 6/11/14 | | | | 171 | |
| USD | | | 12,355 | | | | EUR | | | | 9,000 | | | Deutsche Bank AG | | | 6/11/14 | | | | (43 | ) |
| USD | | | 52,858 | | | | EUR | | | | 38,500 | | | Deutsche Bank AG | | | 6/11/14 | | | | (175 | ) |
| USD | | | 130,877 | | | | EUR | | | | 94,000 | | | Deutsche Bank AG | | | 6/11/14 | | | | 1,392 | |
| USD | | | 263,089 | | | | EUR | | | | 190,000 | | | Deutsche Bank AG | | | 6/11/14 | | | | 1,365 | |
| USD | | | 119,843 | | | | EUR | | | | 87,000 | | | HSBC Bank PLC | | | 6/11/14 | | | | 1 | |
| USD | | | 193,920 | | | | EUR | | | | 141,000 | | | JPMorgan Chase Bank N.A. | | | 6/11/14 | | | | (307 | ) |
| USD | | | 121,222 | | | | EUR | | | | 87,000 | | | Royal Bank of Scotland PLC | | | 6/11/14 | | | | 1,380 | |
| USD | | | 39,836 | | | | EUR | | | | 29,000 | | | UBS AG | | | 6/11/14 | | | | (111 | ) |
See Notes to Financial Statements.
| | | | | | |
| 18 | | BLACKROCK MANAGED VOLATILITY PORTFOLIO | | MARCH 31, 2014 | | |
| | |
| Schedule of Investments (continued) | | |
| Ÿ | | Forward foreign currency exchange contracts outstanding as of March 31, 2014 were as follows: (continued) |
| | | | | | | | | | | | | | | | | | | | | | |
Currency
Purchased | | | Currency
Sold | | | Counterparty | | Settlement Date | | | Unrealized Appreciation (Depreciation) | |
| USD | | | 144,727 | | | | EUR | | | | 105,000 | | | UBS AG | | | 6/11/14 | | | $ | 90 | |
| USD | | | 512,829 | | | | EUR | | | | 370,000 | | | UBS AG | | | 6/11/14 | | | | 3,156 | |
| USD | | | 199,377 | | | | GBP | | | | 120,000 | | | Deutsche Bank AG | | | 6/11/14 | | | | (572 | ) |
| USD | | | 232,981 | | | | GBP | | | | 140,000 | | | Deutsche Bank AG | | | 6/11/14 | | | | (292 | ) |
| USD | | | 13,286 | | | | GBP | | | | 8,000 | | | HSBC Bank PLC | | | 6/11/14 | | | | (44 | ) |
| USD | | | 144,479 | | | | GBP | | | | 87,000 | | | HSBC Bank PLC | | | 6/11/14 | | | | (484 | ) |
| USD | | | 145,219 | | | | GBP | | | | 87,000 | | | HSBC Bank PLC | | | 6/11/14 | | | | 256 | |
| USD | | | 207,547 | | | | GBP | | | | 125,000 | | | HSBC Bank PLC | | | 6/11/14 | | | | (733 | ) |
| USD | | | 92,708 | | | | GBP | | | | 56,000 | | | State Street Bank and Trust Co. | | | 6/11/14 | | | | (601 | ) |
| USD | | | 132,831 | | | | GBP | | | | 80,000 | �� | | State Street Bank and Trust Co. | | | 6/11/14 | | | | (468 | ) |
| USD | | | 26,569 | | | | GBP | | | | 16,000 | | | UBS AG | | | 6/11/14 | | | | (91 | ) |
| USD | | | 574,924 | | | | JPY | | | | 58,850,000 | | | BNP Paribas S.A. | | | 6/11/14 | | | | 4,535 | |
| USD | | | 1,127,525 | | | | JPY | | | | 115,415,000 | | | BNP Paribas S.A. | | | 6/11/14 | | | | 8,894 | |
| USD | | | 25,461 | | | | JPY | | | | 2,600,000 | | | Citibank N.A. | | | 6/11/14 | | | | 261 | |
| USD | | | 210,539 | | | | JPY | | | | 21,500,000 | | | Citibank N.A. | | | 6/11/14 | | | | 2,156 | |
| USD | | | 129,833 | | | | JPY | | | | 13,300,000 | | | Credit Suisse International | | | 6/11/14 | | | | 927 | |
| USD | | | 130,399 | | | | JPY | | | | 13,350,000 | | | Deutsche Bank AG | | | 6/11/14 | | | | 1,008 | |
| USD | | | 130,539 | | | | JPY | | | | 13,350,000 | | | Deutsche Bank AG | | | 6/11/14 | | | | 1,148 | |
| USD | | | 392,847 | | | | JPY | | | | 40,650,000 | | | Deutsche Bank AG | | | 6/11/14 | | | | (1,143 | ) |
| USD | | | 393,050 | | | | JPY | | | | 40,650,000 | | | Deutsche Bank AG | | | 6/11/14 | | | | (940 | ) |
| USD | | | 53,130 | | | | JPY | | | | 5,400,000 | | | HSBC Bank PLC | | | 6/11/14 | | | | 792 | |
| USD | | | 171,980 | | | | JPY | | | | 17,500,000 | | | JPMorgan Chase Bank N.A. | | | 6/11/14 | | | | 2,366 | |
| USD | | | 65,625 | | | | JPY | | | | 6,700,000 | | | State Street Bank and Trust Co. | | | 6/11/14 | | | | 687 | |
| USD | | | 52,836 | | | | JPY | | | | 5,400,000 | | | UBS AG | | | 6/11/14 | | | | 498 | |
| USD | | | 236,816 | | | | JPY | | | | 24,100,000 | | | UBS AG | | | 6/11/14 | | | | 3,233 | |
| USD | | | 265,646 | | | | JPY | | | | 27,200,000 | | | UBS AG | | | 6/11/14 | | | | 2,017 | |
| USD | | | 365,798 | | | | MYR | | | | 1,200,000 | | | Barclays Bank PLC | | | 6/11/14 | | | | 162 | |
| USD | | | 119,240 | | | | NOK | | | | 718,000 | | | BNP Paribas S.A. | | | 6/11/14 | | | | (333 | ) |
| USD | | | 685,544 | | | | NOK | | | | 4,128,000 | | | BNP Paribas S.A. | | | 6/11/14 | | | | (1,916 | ) |
| USD | | | 26,425 | | | | NOK | | | | 160,000 | | | Deutsche Bank AG | | | 6/11/14 | | | | (220 | ) |
| USD | | | 53,973 | | | | NOK | | | | 327,000 | | | JPMorgan Chase Bank N.A. | | | 6/11/14 | | | | (484 | ) |
| USD | | | 13,330 | | | | NOK | | | | 80,000 | | | UBS AG | | | 6/11/14 | | | | 7 | |
| USD | | | 5,039 | | | | NZD | | | | 6,000 | | | Barclays Bank PLC | | | 6/11/14 | | | | (137 | ) |
| USD | | | 65,894 | | | | NZD | | | | 77,000 | | | Barclays Bank PLC | | | 6/11/14 | | | | (536 | ) |
| USD | | | 78,950 | | | | NZD | | | | 94,000 | | | Barclays Bank PLC | | | 6/11/14 | | | | (2,146 | ) |
| USD | | | 27,226 | | | | NZD | | | | 32,000 | | | Credit Suisse International | | | 6/11/14 | | | | (381 | ) |
| USD | | | 357,340 | | | | NZD | | | | 420,000 | | | Credit Suisse International | | | 6/11/14 | | | | (5,004 | ) |
| USD | | | 412,694 | | | | NZD | | | | 491,000 | | | Credit Suisse International | | | 6/11/14 | | | | (10,904 | ) |
| USD | | | 99,220 | | | | NZD | | | | 117,000 | | | Royal Bank of Canada | | | 6/11/14 | | | | (1,719 | ) |
| USD | | | 8,408 | | | | NZD | | | | 10,000 | | | UBS AG | | | 6/11/14 | | | | (219 | ) |
| USD | | | 79,876 | | | | NZD | | | | 95,000 | | | UBS AG | | | 6/11/14 | | | | (2,083 | ) |
| USD | | | 101,721 | | | | NZD | | | | 120,000 | | | Westpac Banking Corp. | | | 6/11/14 | | | | (1,806 | ) |
| USD | | | 325,349 | | | | SEK | | | | 2,085,000 | | | Deutsche Bank AG | | | 6/11/14 | | | | 3,576 | |
| USD | | | 53,250 | | | | SEK | | | | 344,000 | | | HSBC Bank PLC | | | 6/11/14 | | | | 161 | |
| USD | | | 126,865 | | | | SEK | | | | 811,000 | | | HSBC Bank PLC | | | 6/11/14 | | | | 1,706 | |
See Notes to Financial Statements.
| | | | | | |
| | | BLACKROCK MANAGED VOLATILITY PORTFOLIO | | MARCH 31, 2014 | | 19 |
| | |
| Schedule of Investments (continued) | | |
| Ÿ | | Forward foreign currency exchange contracts outstanding as of March 31, 2014 were as follows: (concluded) |
| | | | | | | | | | | | | | | | | | | | | | |
Currency
Purchased | | | Currency
Sold | | | Counterparty | | Settlement Date | | | Unrealized Appreciation (Depreciation) | |
| USD | | | 71,099 | | | | SEK | | | | 455,000 | | | JPMorgan Chase Bank N.A. | | | 6/11/14 | | | $ | 880 | |
| USD | | | 90,542 | | | | SEK | | | | 580,000 | | | JPMorgan Chase Bank N.A. | | | 6/11/14 | | | | 1,032 | |
| USD | | | 254,379 | | | | SEK | | | | 1,628,000 | | | JPMorgan Chase Bank N.A. | | | 6/11/14 | | | | 3,134 | |
| USD | | | 274,635 | | | | TRY | | | | 600,000 | | | Deutsche Bank AG | | | 6/11/14 | | | | 201 | |
| Total | | | | | | | | | | | | | | | | | | | | $ | (405,157 | ) |
| | | | | | | | | | | | | | | | | | | | | | |
| Ÿ | | Exchange-traded options purchased as of March 31, 2014 were as follows: |
| | | | | | | | | | | | | | | | | | | | | | | | |
| Description | | Put/
Call | | | Strike Price | | | Expiration Date | | | Contracts | | | Market Value | |
U.S. Treasury Notes (10 Year) | | | Put | | | | USD | | | | 122.00 | | | | 4/25/14 | | | | 115 | | | $ | 19,766 | |
| Ÿ | | Exchange-traded options written as of March 31, 2014 were as follows: |
| | | | | | | | | | | | | | | | | | | | | | | | |
| Description | | Put/
Call | | | Strike Price | | | Expiration
Date | | | Contracts | | | Market
Value | |
U.S. Treasury Notes (10 Year) | | | Call | | | | USD | | | | 124.00 | | | | 4/25/14 | | | | 85 | | | $ | (35,859 | ) |
U.S. Treasury Notes (10 Year) | | | Call | | | | USD | | | | 123.50 | | | | 5/23/14 | | | | 12 | | | | (10,875 | ) |
U.S. Treasury Notes (10 Year) | | | Put | | | | USD | | | | 124.00 | | | | 4/25/14 | | | | 85 | | | | (78,360 | ) |
U.S. Treasury Notes (10 Year) | | | Put | | | | USD | | | | 123.50 | | | | 5/23/14 | | | | 12 | | | | (10,875 | ) |
Total | | | | | | | | | | | | | | | | | | | | | | $ | (135,969 | ) |
| | | | | | | | | | | | | | | | | | | | | | | | |
| Ÿ | | Centrally cleared interest rate swaps outstanding as of March 31, 2014 were as follows: |
| | | | | | | | | | | | | | | | | | | | |
Fixed Rate | | Floating Rate | | Clearinghouse | | Expiration Date | | | Notional Amount (000) | | | Unrealized Appreciation (Depreciation) | |
| 2.38%1 | | 3-month LIBOR | | Chicago Mercantile | | | 2/15/21 | | | | USD | | | | 1,780 | | | $ | 3,491 | |
| 1.73%1 | | 6-month EURIBOR | | Chicago Mercantile | | | 2/15/23 | | | | EUR | | | | 760 | | | | (5,792 | ) |
| 1.71%1 | | 6-month EURIBOR | | Chicago Mercantile | | | 2/15/23 | | | | EUR | | | | 360 | | | | (1,865 | ) |
| Total | | | | | | | | | | | | | | | | | | $ | (4,166 | ) |
| | | | | | | | | | | | | | | | | | | | |
| | 1 | Fund pays the fixed rate and receives the floating rate. |
| Ÿ | | Centrally cleared credit default swaps — buy protection outstanding as of March 31, 2014 were as follows: |
| | | | | | | | | | | | | | | | | | | | | | |
| Index | | Pay Fixed Rate | | | Clearinghouse | | Expiration
Date | | | Notional
Amount
(000) | | | Unrealized
Appreciation
(Depreciation) | |
AXA SA | | | 1.00 | % | | Bank of America N.A. | | | 3/20/19 | | | | EUR | | | | 250 | | | $ | (18 | ) |
AXA SA | | | 1.00 | % | | Bank of America N.A. | | | 3/20/19 | | | | EUR | | | | 130 | | | | (9 | ) |
AXA SA | | | 1.00 | % | | Bank of America N.A. | | | 3/20/19 | | | | EUR | | | | 70 | | | | (5 | ) |
AXA SA | | | 1.00 | % | | Société Générale | | | 3/20/19 | | | | EUR | | | | 50 | | | | 13 | |
Total | | | | | | | | | | | | | | | | | | | | $ | (19 | ) |
| | | | | | | | | | | | | | | | | | | | | | |
See Notes to Financial Statements.
| | | | | | |
| 20 | | BLACKROCK MANAGED VOLATILITY PORTFOLIO | | MARCH 31, 2014 | | |
| | |
| Schedule of Investments (continued) | | |
| Ÿ | | OTC total return swaps outstanding as of March 31, 2014 were as follows: |
| | | | | | | | | | | | | | | | | | | | | | | | | | |
| Reference Entity | | Fixed Amount | | | Counterparty | | Expiration
Date | | | Contract
Amount | | | Market
Value | | | Premiums
Paid
(Received) | | | Unrealized
Appreciation | |
TAIEX Future Contract April 2014 | | TWD | 433,144,964 | 1 | | Deutsche Bank AG | | | 4/16/14 | | | | 248 | | | $ | 93,228 | | | | — | | | $ | 93,228 | |
KOSPI 200 Future Contract June 2014 | | KRW | 14,798,758,000 | 1 | | Credit Suisse International | | | 6/12/14 | | | | 116 | | | | 177,032 | | | | — | | | | 177,032 | |
Total | | | | | | | | | | | | | | | | $ | 270,260 | | | | — | | | $ | 270,260 | |
| | | | | | | | | | | | | | | | | | |
| | 1 | Fund receives the total return of the reference entity and pays the fixed amount. Net payment made at termination. |
| Ÿ | | Fair Value Measurements — Various inputs are used in determining the fair value of investments and derivative financial instruments. These inputs to valuation techniques are categorized into a disclosure hierarchy consisting of three broad levels for financial statement purposes as follows: |
| | Ÿ | | Level 1 — unadjusted price quotations in active markets/exchanges for identical assets or liabilities that the Fund has the ability to access |
| | Ÿ | | Level 2 — other observable inputs (including, but not limited to, quoted prices for similar assets or liabilities in markets that are active, quoted prices for identical or similar assets or liabilities in markets that are not active, inputs other than quoted prices that are observable for the assets or liabilities (such as interest rates, yield curves, volatilities, prepayment speeds, loss severities, credit risks and default rates) or other market–corroborated inputs) |
| | Ÿ | | Level 3 — unobservable inputs based on the best information available in the circumstances, to the extent observable inputs are not available (including the Fund’s own assumptions used in determining the fair value of investments and derivative financial instruments) |
The hierarchy gives the highest priority to unadjusted quoted prices in active markets for identical assets or liabilities (Level 1 measurements) and the lowest priority to unobservable inputs (Level 3 measurements). Accordingly, the degree of judgment exercised in determining fair value is greatest for instruments categorized in Level 3. The inputs used to measure fair value may fall into different levels of the fair value hierarchy. In such cases, for disclosure purposes, the fair value hierarchy classification is determined based on the lowest level input that is significant to the fair value measurement in its entirety.
Changes in valuation techniques may result in transfers into or out of an assigned level within the disclosure hierarchy. In accordance with the Fund’s policy, transfers between different levels of the fair value disclosure hierarchy are deemed to have occurred as of the beginning of the reporting period. The categorization of a value determined for investments and derivative financial instruments is based on the pricing transparency of the investment and derivative financial instrument and is not necessarily an indication of the risks associated with investing in those securities. For information about the Fund’s policy regarding valuation of investments and derivative financial instruments, please refer to Note 2 of the Notes to Financial Statements.
The following tables summarize the Fund’s investments and derivative financial instruments categorized in the disclosure hierarchy as of March 31, 2014:
| | | | | | | | | | | | | | | | |
| | | Level 1 | | | Level 2 | | | Level 3 | | | Total | |
Assets: | | | | | | | | | | | | | | | | |
Investments: | | | | | | | | | | | | | | | | |
Long-Term Investments: | | | | | | | | | | | | | | | | |
Asset-Backed Securities | | | — | | | $ | 29,130 | | | | — | | | $ | 29,130 | |
Common Stocks | | $ | 9,564,249 | | | | 42,909,589 | | | $ | 27,264 | | | | 52,501,102 | |
Corporate Bonds | | | — | | | | 54,032,497 | | | | — | | | | 54,032,497 | |
Foreign Agency Obligations | | | — | | | | 10,901,190 | | | | — | | | | 10,901,190 | |
Foreign Government Obligations | | | — | | | | 79,453,162 | | | | 1,505,987 | | | | 80,959,149 | |
Investment Companies | | | 219,341,875 | | | | — | | | | — | | | | 219,341,875 | |
Non-Agency Mortgage-Backed Securities | | | — | | | | 932,154 | | | | — | | | | 932,154 | |
U.S. Government Sponsored Agency Securities | | | — | | | | 21,947,636 | | | | — | | | | 21,947,636 | |
U.S. Treasury Obligations | | | — | | | | 4,730,098 | | | | — | | | | 4,730,098 | |
Short-Term Securities | | | 252,758,818 | | | | — | | | | — | | | | 252,758,818 | |
Options Purchased | | | 19,766 | | | | — | | | | — | | | | 19,766 | |
Total | | $ | 481,684,708 | | | $ | 214,935,456 | | | $ | 1,533,251 | | | $ | 698,153,415 | |
| | | | |
See Notes to Financial Statements.
| | | | | | |
| | | BLACKROCK MANAGED VOLATILITY PORTFOLIO | | MARCH 31, 2014 | | 21 |
| | |
| Schedule of Investments (concluded) | | |
| | | | | | | | | | | | | | | | |
| | | Level 1 | | | Level 2 | | | Level 3 | | | Total | |
Derivative Financial Instruments1 | | | | | | | | | | | | | | | | |
Assets: | | | | | | | | | | | | | | | | |
Equity contracts | | $ | 2,805,741 | | | $ | 270,260 | | | | — | | | $ | 3,076,001 | |
Foreign currency exchange contracts | | | 526,124 | | | | 1,140,832 | | | | — | | | | 1,666,956 | |
Interest rate contracts | | | 359,973 | | | | — | | | | — | | | | 359,973 | |
Liabilities: | | | | | | | | | | | | | | | | |
Credit contracts | | | — | | | | (19 | ) | | | — | | | | (19 | ) |
Equity contracts | | | (1,435,919 | ) | | | — | | | | — | | | | (1,435,919 | ) |
Foreign currency exchange contracts | | | (54,949 | ) | | | (1,545,989 | ) | | | — | | | | (1,600,938 | ) |
Interest rate contracts | | | (213,993 | ) | | | (4,166 | ) | | | — | | | | (218,159 | ) |
Total | | $ | 1,986,977 | | | $ | (139,082 | ) | | | — | | | $ | 1,847,895 | |
| | | | |
1 Derivative financial instruments are swaps, financial futures contracts, foreign currency exchange contracts and options written. Swaps, financial futures contracts and foreign currency exchange contracts are valued at the unrealized appreciation/depreciation on the instrument and options written are shown at value. | |
The carrying amount for certain of the Fund’s assets and/or liabilities approximates fair value for financial statement purposes. As of March 31, 2014, such assets and/or liabilities are categorized within the disclosure hierarchy as follows:
| | | | | | | | | | | | | | | | |
| | | Level 1 | | | Level 2 | | | Level 3 | | | Total | |
Assets: | | | | | | | | | | | | | | | | |
Cash pledged for financial futures contracts | | $ | 10,990,000 | | | | — | | | | — | | | $ | 10,990,000 | |
Cash pledged for centrally cleared swaps | | | 60,000 | | | | — | | | | — | | | | 60,000 | |
Foreign currency at value | | | 3,614,694 | | | | — | | | | — | | | | 3,614,694 | |
Liabilities: | | | | | | | | | | | | | | | | |
Bank overdraft | | | — | | | $ | (1,012,686 | ) | | | — | | | | (1,012,686 | ) |
Total | | $ | 14,664,694 | | | $ | (1,012,686 | ) | | | — | | | $ | 13,652,008 | |
| | | | |
There were no transfers between levels during the period ended March 31, 2014.
See Notes to Financial Statements.
| | | | | | |
| 22 | | BLACKROCK MANAGED VOLATILITY PORTFOLIO | | MARCH 31, 2014 | | |
| | |
| Statement of Assets and Liabilities | | |
| | | | |
| March 31, 2014 (Unaudited) | | | |
| | | | |
| Assets | | | | |
Investments at value — unaffiliated (cost — $397,732,945) | | $ | 424,638,487 | |
Investments at value — affiliated (cost — $273,507,216) | | | 273,514,928 | |
Cash pledged for financial futures contracts | | | 10,990,000 | |
Cash pledged for centrally cleared swaps | | | 60,000 | |
Foreign currency at value (cost — $3,563,937) | | | 3,614,694 | |
Variation margin receivable on financial futures contracts | | | 397,007 | |
Investments sold receivable | | | 2,435,454 | |
Unrealized appreciation on forward foreign currency exchange contracts | | | 1,140,832 | |
Unrealized appreciation on OTC swaps | | | 270,260 | |
Capital shares sold receivable | | | 434,681 | |
Interest receivable | | | 1,414,548 | |
Dividends receivable — unaffiliated | | | 304,243 | |
Dividends receivable — affiliated | | | 6,470 | |
Securities lending income receivable — affiliated | | | 117 | |
Prepaid expenses | | | 63,213 | |
| | | | |
Total assets | | | 719,284,934 | |
| | | | |
| | | | |
| Liabilities | | | | |
Bank overdraft | | | 1,012,686 | |
Options written at value (premiums received — $152,235) | | | 135,969 | |
Variation margin payable on centrally cleared swaps | | | 9,119 | |
Variation margin payable on financial futures contracts | | | 665,779 | |
Investments purchased payable | | | 20,330,463 | |
Unrealized depreciation on forward foreign currency exchange contracts | | | 1,545,989 | |
Capital shares redeemed payable | | | 507,113 | |
Investment advisory fees payable | | | 351,522 | |
Service and distribution fees payable | | | 154,869 | |
Other affiliates payable | | | 153,973 | |
Deferred tax payable | | | 16,559 | |
Officer’s and Trustees’ fees payable | | | 3,667 | |
Other accrued expenses payable | | | 449,805 | |
| | | | |
Total liabilities | | | 25,337,513 | |
| | | | |
Net Assets | | $ | 693,947,421 | |
| | | | |
| | | | |
| Net Assets Consist of | | | | |
Paid-in capital | | $ | 642,547,732 | |
Undistributed net investment income | | | 5,156,863 | |
Accumulated net realized gain | | | 17,279,640 | |
Net unrealized appreciation/depreciation | | | 28,963,186 | |
| | | | |
Net Assets | | $ | 693,947,421 | |
| | | | |
| | | | |
| Net Asset Value | | | | |
Institutional — Based on net assets of $237,091,248 and 15,529,356 shares outstanding, unlimited shares authorized, $0.001 par value | | $ | 15.27 | |
| | | | |
Service — Based on net assets of $1,723,982 and 113,295 shares outstanding, unlimited shares authorized, $0.001 par value | | $ | 15.22 | |
| | | | |
Investor A — Based on net assets of $365,536,165 and 24,037,862 shares outstanding, unlimited shares authorized, $0.001 par value | | $ | 15.21 | |
| | | | |
Investor B — Based on net assets of $9,861,336 and 658,608 shares outstanding, unlimited shares authorized, $0.001 par value | | $ | 14.97 | |
| | | | |
Investor C — Based on net assets of $79,734,690 and 5,355,828 shares outstanding, unlimited shares authorized, $0.001 par value | | $ | 14.89 | |
| | | | |
See Notes to Financial Statements.
| | | | | | |
| | | BLACKROCK MANAGED VOLATILITY PORTFOLIO | | MARCH 31, 2014 | | 23 |
| | | | |
| Six Months Ended March 31, 2014 (Unaudited) | | | |
| | | | |
| Investment Income | | | | |
Interest | | $ | 1,793,483 | |
Dividends — unaffiliated | | | 2,602,163 | |
Dividends — affiliated | | | 229,640 | |
Foreign taxes withheld | | | (50,614 | ) |
Other income — affiliated | | | 15,791 | |
Securities lending — affiliated — net | | | 1,762 | |
| | | | |
Total income | | | 4,592,225 | |
| | | | |
| | | | |
| Expenses | | | | |
Investment advisory | | | 1,889,969 | |
Service and distribution — class specific | | | 930,348 | |
Transfer agent — class specific | | | 510,902 | |
Administration | | | 248,292 | |
Professional | | | 87,725 | |
Administration — class specific | | | 85,921 | |
Printing | | | 33,301 | |
Registration | | | 34,906 | |
Custodian | | | 15,740 | |
Officer and Trustees | | | 10,373 | |
Miscellaneous | | | 36,828 | |
Recoupment of past waived fees | | | 43,094 | |
Recoupment of past waived fees — class specific | | | 5,575 | |
| | | | |
Total expenses | | | 3,932,974 | |
Less fees waived by Manager | | | (87,168 | ) |
Less administration fees waived — class specific | | | (119 | ) |
| | | | |
Total expenses after fees waived and/or reimbursed | | | 3,845,687 | |
| | | | |
Net investment income | | | 746,538 | |
| | | | |
| | | | |
| Realized and Unrealized Gain (Loss) | | | | |
Net realized gain (loss) from: | | | | |
Investments — unaffiliated | | | 26,527,536 | |
Investments — affiliated | | | (206,772 | ) |
Options written | | | 101,941 | |
Financial futures contracts | | | 4,621,498 | |
Swaps | | | (640,878 | ) |
Foreign currency transactions | | | (1,407,815 | ) |
| | | | |
| | | 28,995,510 | |
| | | | |
Net change in unrealized appreciation/depreciation on: | | | | |
Investments — unaffiliated | | | (137,925 | ) |
Investments — affiliated | | | 1,093,200 | |
Options written | | | 20,010 | |
Financial futures contracts | | | 927,869 | |
Swaps | | | 572,315 | |
Foreign currency translations | | | 1,641,217 | |
| | | | |
| | | 4,116,686 | |
| | | | |
Total realized and unrealized gain | | | 33,112,196 | |
| | | | |
Net Increase in Net Assets Resulting from Operations | | $ | 33,858,734 | |
| | | | |
See Notes to Financial Statements.
| | | | | | |
| 24 | | BLACKROCK MANAGED VOLATILITY PORTFOLIO | | MARCH 31, 2014 | | |
| | |
| Statements of Changes in Net Assets | | |
| | | | | | | | |
| Increase in Net Assets: | | Six Months Ended March 31, 2014
(Unaudited) | | | Year Ended September 30, 2013 | |
| | | | | | | | |
| Operations | | | | | | | | |
Net investment income | | $ | 746,538 | | | $ | 4,868,858 | |
Net realized gain | | | 28,995,510 | | | | 58,547,459 | |
Net change in unrealized appreciation/depreciation | | | 4,116,686 | | | | (16,080,632 | ) |
| | | | |
Net increase in net assets resulting from operations | | | 33,858,734 | | | | 47,335,685 | |
| | | | |
| | | | | | | | |
| Dividends and Distributions to Shareholders From | | | | | | | | |
Net investment income: | | | | | | | | |
Institutional | | | (2,875,794 | ) | | | (854,926 | )1 |
Service | | | (17,512 | ) | | | (20,556 | )1 |
Investor A | | | (3,753,926 | ) | | | (4,326,576 | )1 |
Investor B | | | (78,744 | ) | | | (15,863 | )1 |
Investor C | | | (649,050 | ) | | | (271,036 | )1 |
Net realized gain: | | | | | | | | |
Institutional | | | (19,653,564 | ) | | | (2,193,125 | )1 |
Service | | | (140,882 | ) | | | (70,315 | )1 |
Investor A | | | (30,046,152 | ) | | | (14,426,688 | )1 |
Investor B | | | (927,559 | ) | | | (670,450 | )1 |
Investor C | | | (6,652,735 | ) | | | (3,215,648 | )1 |
| | | | |
Decrease in net assets resulting from dividends and distributions to shareholders | | | (64,795,918 | ) | | | (26,065,183 | ) |
| | | | |
| | | | | | | | |
| Capital Share Transactions | | | | | | | | |
Net increase in net assets derived from capital share transactions | | | 121,810,106 | | | | 24,614,595 | |
| | | | |
| | | | | | | | |
| Net Assets | | | | | | | | |
Total increase in net assets | | | 90,872,922 | | | | 45,885,097 | |
Beginning of period | | | 603,074,499 | | | | 557,189,402 | |
| | | | |
End of period | | $ | 693,947,421 | | | $ | 603,074,499 | |
| | | | |
Undistributed net investment income, end of period | | $ | 5,156,863 | | | $ | 11,785,351 | |
| | | | |
| | 1 | Determined in accordance with federal tax regulations. |
See Notes to Financial Statements.
| | | | | | |
| | | BLACKROCK MANAGED VOLATILITY PORTFOLIO | | MARCH 31, 2014 | | 25 |
| | | | | | | | | | | | | | | | | | | | | | | | | | | | | | | | | | | | | | | | | | | | | | | | |
| | | Institutional | | | Service | |
| | | Six Months
Ended
March 31,
2014
(Unaudited) | | | Year Ended September 30, | | | Six Months
Ended
March 31,
2014
(Unaudited) | | | Year Ended September 30, | |
| | | | 2013 | | | 2012 | | | 2011 | | | 2010 | | | 2009 | | | | 2013 | | | 2012 | | | 2011 | | | 2010 | | | 2009 | |
| Per Share Operating Performance | | | | | | | | | | | | | | | | | | | | | | | | | | | | | |
Net asset value, beginning of period | | $ | 15.95 | | | $ | 15.37 | | | $ | 14.03 | | | $ | 14.31 | | | $ | 13.28 | | | $ | 12.96 | | | $ | 15.90 | | | $ | 15.31 | | | $ | 13.99 | | | $ | 14.27 | | | $ | 13.24 | | | $ | 12.93 | |
| | | | | | | | |
Net investment income1 | | | 0.04 | | | | 0.19 | | | | 0.23 | | | | 0.29 | | | | 0.29 | | | | 0.27 | | | | 0.01 | | | | 0.15 | | | | 0.19 | | | | 0.25 | | | | 0.25 | | | | 0.24 | |
Net realized and unrealized gain (loss) | | | 0.79 | | | | 1.19 | | | | 1.68 | | | | (0.26 | ) | | | 1.02 | | | | 0.45 | | | | 0.78 | | | | 1.19 | | | | 1.67 | | | | (0.26 | ) | | | 1.03 | | | | 0.44 | |
| | | | | | | | |
Net increase (decrease) from investment operations | | | 0.83 | | | | 1.38 | | | | 1.91 | | | | 0.03 | | | | 1.31 | | | | 0.72 | | | | 0.79 | | | | 1.34 | | | | 1.86 | | | | (0.01 | ) | | | 1.28 | | | | 0.68 | |
| | | | | | | | |
Dividends and distributions from: | | | | | | | | | | | | | | | | | | | | | | | | | | | | | | | | | | | | | | | | | | | | | | | | |
Net investment income | | | (0.20 | ) | | | (0.22 | )2 | | | (0.26 | )2 | | | (0.31 | )2 | | | (0.28 | )2 | | | (0.21 | )2 | | | (0.16 | ) | | | (0.17 | )2 | | | (0.23 | )2 | | | (0.27 | )2 | | | (0.25 | )2 | | | (0.18 | )2 |
Net realized gain | | | (1.31 | ) | | | (0.58 | )2 | | | (0.31 | )2 | | | — | | | | — | | | | (0.19 | )2 | | | (1.31 | ) | | | (0.58 | )2 | | | (0.31 | )2 | | | — | | | | — | | | | (0.19 | )2 |
| | | | | | | | |
Total dividends and distributions | | | (1.51 | ) | | | (0.80 | ) | | | (0.57 | ) | | | (0.31 | ) | | | (0.28 | ) | | | (0.40 | ) | | | (1.47 | ) | | | (0.75 | ) | | | (0.54 | ) | | | (0.27 | ) | | | (0.25 | ) | | | (0.37 | ) |
| | | | | | | | |
Net asset value, end of period | | $ | 15.27 | | | $ | 15.95 | | | $ | 15.37 | | | $ | 14.03 | | | $ | 14.31 | | | $ | 13.28 | | | $ | 15.22 | | | $ | 15.90 | | | $ | 15.31 | | | $ | 13.99 | | | $ | 14.27 | | | $ | 13.24 | |
| | | | | | | | |
| | | | | | | | | | | | | | | | | | | | | | | | | | | | | | | | | | | | | | | | | | | | | | | | |
| Total Investment Return3 | | | | | | | | | | | | | | | | | | | | | | | | | | | | | |
Based on net asset value | | | 5.27 | %4 | | | 9.35 | % | | | 13.89 | % | | | 0.06 | % | | | 9.99 | % | | | 6.15 | %5 | | | 5.06 | %4 | | | 9.06 | % | | | 13.53 | % | | | (0.21 | )% | | | 9.74 | % | | | 5.83 | %6 |
| | | | | | | | |
| | | | | | | | | | | | | | | | | | | | | | | | | | | | | | | | | | | | | | | | | | | | | | | | |
| Ratios to Average Net Assets | | | | | | | | | | | | | | | | | | | | | | | | | | | | | |
Total expenses | | | 0.81 | %7,8 | | | 0.91 | %7 | | | 0.95 | %9 | | | 0.94 | % | | | 0.95 | % | | | 0.95 | % | | | 1.20 | %7,8 | | | 1.24 | %7 | | | 1.27 | %9 | | | 1.24 | % | | | 1.27 | % | | | 1.18 | % |
| | | | | | | | |
Total expenses excluding recoupment of past waived fees | | | 0.79 | %7,8 | | | 0.89 | %7 | | | 0.91 | %9 | | | 0.94 | % | | | 0.95 | % | | | 0.95 | % | | | 1.18 | %7,8 | | | 1.23 | %7 | | | 1.27 | %9 | | | 1.24 | % | | | 1.27 | % | | | 1.15 | % |
| | | | | | | | |
Total expenses after fees waived and/or reimbursed and paid indirectly | | | 0.78 | %7,8 | | | 0.87 | %7 | | | 0.90 | %9 | | | 0.90 | % | | | 0.91 | % | | | 0.88 | % | | | 1.17 | %7,8 | | | 1.17 | %7 | | | 1.18 | %9 | | | 1.18 | % | | | 1.19 | % | | | 1.14 | % |
| | | | | | | | |
Total expenses after fees waived and/or reimbursed and paid indirectly and excluding interest expense | | | 0.78 | %7,8 | | | 0.87 | %7 | | | 0.89 | %9 | | | 0.89 | % | | | 0.89 | % | | | 0.88 | % | | | 1.17 | %7,8 | | | 1.17 | %7 | | | 1.17 | %9 | | | 1.17 | % | | | 1.17 | % | | | 1.14 | % |
| | | | | | | | |
Net investment income | | | 0.57 | %7,8 | | | 1.22 | %7 | | | 1.59 | %9 | | | 1.91 | % | | | 2.09 | % | | | 2.43 | % | | | 0.16 | %7,8 | | | 0.95 | %7 | | | 1.30 | %9 | | | 1.63 | % | | | 1.80 | % | | | 2.17 | % |
| | | | | | | | |
| | | | | | | | | | | | | | | | | | | | | | | | | | | | | | | | | | | | | | | | | | | | | | | | |
| Supplemental Data | | | | | | | | | | | | | | | | | | | | | | | | | | | | | |
Net assets, end of period (000) | | $ | 237,091 | | | $ | 132,007 | | | $ | 59,041 | | | $ | 40,259 | | | $ | 39,083 | | | $ | 29,127 | | | $ | 1,724 | | | $ | 1,774 | | | $ | 1,915 | | | $ | 1,676 | | | $ | 1,652 | | | $ | 1,472 | |
| | | | | | | | |
Portfolio turnover | | | 88 | % | | | 192 | % | | | 324 | %10 | | | 401 | %11 | | | 400 | %12 | | | 354 | %13 | | | 88 | % | | | 192 | % | | | 324 | %10 | | | 401 | %11 | | | 400 | %12 | | | 354 | %13 |
| | | | | | | | |
| | 1 | Based on average shares outstanding. |
| | 2 | Determined in accordance with federal income tax regulations. |
| | 3 | Where applicable, assumes the reinvestment of dividends and distributions. |
| | 4 | Aggregate total investment return. |
| | 5 | Includes proceeds received from a settlement of litigation, which impacted the Fund’s total return. Excluding these proceeds, the Fund’s total return would have been 5.92%. |
| | 6 | Includes proceeds received from a settlement of litigation, which impacted the Fund’s total return. Excluding these proceeds, the Fund’s total return would have been 5.60%. |
| | 7 | Ratios do not include expenses incurred indirectly as a result of investments in underlying funds of approximately 0.10%. |
| | 9 | Ratios do not include expenses incurred indirectly as a result of investments in underlying funds of approximately 0.05%. |
| | 10 | Includes mortgage dollar roll transactions; excluding these transactions the portfolio turnover would have been 254%. |
| | 11 | Includes mortgage dollar roll transactions; excluding these transactions the portfolio turnover would have been 236%. |
| | 12 | Includes mortgage dollar roll transactions; excluding these transactions the portfolio turnover would have been 302%. |
| | 13 | Includes mortgage dollar roll transactions; excluding these transactions the portfolio turnover would have been 227%. |
See Notes to Financial Statements.
| | | | | | |
| 26 | | BLACKROCK MANAGED VOLATILITY PORTFOLIO | | MARCH 31, 2014 | | |
| | |
| Financial Highlights (continued) | | |
| | | | | | | | | | | | | | | | | | | | | | | | | | | | | | | | | | | | | | | | | | | | | | | | |
| | | Investor A | | | Investor B | |
| | | Six Months
Ended
March 31,
2014
(Unaudited) | | | Year Ended September 30, | | | Six Months
Ended
March 31,
2014
(Unaudited) | | | Year Ended September 30, | |
| | | | 2013 | | | 2012 | | | 2011 | | | 2010 | | | 2009 | | | | 2013 | | | 2012 | | | 2011 | | | 2010 | | | 2009 | |
| Per Share Operating Performance | | | | | | | | | | | | | | | | | | | | | | | | | | | | | |
Net asset value, beginning of period | | $ | 15.89 | | | $ | 15.30 | | | $ | 13.98 | | | $ | 14.26 | | | $ | 13.23 | | | $ | 12.92 | | | $ | 15.69 | | | $ | 15.10 | | | $ | 13.83 | | | $ | 14.10 | | | $ | 13.08 | | | $ | 12.75 | |
| | | | | | | | |
Net investment income
(loss)1 | | | 0.02 | | | | 0.15 | | | | 0.19 | | | | 0.25 | | | | 0.24 | | | | 0.23 | | | | (0.06 | ) | | | 0.01 | | | | 0.06 | | | | 0.13 | | | | 0.12 | | | | 0.14 | |
Net realized and unrealized gain (loss) | | | 0.77 | | | | 1.19 | | | | 1.66 | | | | (0.26 | ) | | | 1.03 | | | | 0.43 | | | | 0.76 | | | | 1.16 | | | | 1.65 | | | | (0.26 | ) | | | 1.03 | | | | 0.43 | |
| | | | | | | | |
Net increase (decrease) from investment operations | | | 0.79 | | | | 1.34 | | | | 1.85 | | | | (0.01 | ) | | | 1.27 | | | | 0.66 | | | | 0.70 | | | | 1.17 | | | | 1.71 | | | | (0.13 | ) | | | 1.15 | | | | 0.57 | |
| | | | | | | | |
Dividends and distributions from: | | | | | | | | | | | | | | | | | | | | | | | | | | | | | | | | | | | | | | | | | | | | | | | | |
Net investment income | | | (0.16 | ) | | | (0.17 | )2 | | | (0.22 | )2 | | | (0.27 | )2 | | | (0.24 | )2 | | | (0.16 | )2 | | | (0.11 | ) | | | (0.01 | )2 | | | (0.13 | )2 | | | (0.14 | )2 | | | (0.13 | )2 | | | (0.05 | )2 |
Net realized gain | | | (1.31 | ) | | | (0.58 | )2 | | | (0.31 | )2 | | | — | | | | — | | | | (0.19 | )2 | | | (1.31 | ) | | | (0.57 | )2 | | | (0.31 | )2 | | | — | | | | — | | | | (0.19 | )2 |
| | | | | | | | |
Total dividends and distributions | | | (1.47 | ) | | | (0.75 | ) | | | (0.53 | ) | | | (0.27 | ) | | | (0.24 | ) | | | (0.35 | ) | | | (1.42 | ) | | | (0.58 | ) | | | (0.44 | ) | | | (0.14 | ) | | | (0.13 | ) | | | (0.24 | ) |
| | | | | | | | |
Net asset value, end of period | | $ | 15.21 | | | $ | 15.89 | | | $ | 15.30 | | | $ | 13.98 | | | $ | 14.26 | | | $ | 13.23 | | | $ | 14.97 | | | $ | 15.69 | | | $ | 15.10 | | | $ | 13.83 | | | $ | 14.10 | | | $ | 13.08 | |
| | | | | | | | |
| | | | | | | | | | | | | | | | | | | | | | | | | | | | | | | | | | | | | | | | | | | | | | | | |
| Total Investment Return3 | | | | | | | | | | | | | | | | | | | | | | | | | | | | | |
Based on net asset value | | | 5.07 | %4 | | | 9.09 | % | | | 13.51 | % | | | (0.23 | )% | | | 9.70 | % | | | 5.66 | %5 | | | 4.51 | %4 | | | 8.04 | % | | | 12.60 | % | | | (1.01 | )% | | | 8.78 | % | | | 4.93 | %6 |
| | | | | | | | |
| | | | | | | | | | | | | | | | | | | | | | | | | | | | | | | | | | | | | | | | | | | | | | | | |
| Ratios to Average Net Assets | | | | | | | | | | | | | | | | | | | | | | | | | | | | | |
Total expenses | | | 1.16 | %7,8 | | | 1.18 | %7 | | | 1.23 | %9 | | | 1.20 | % | | | 1.23 | % | | | 1.27 | % | | | 2.17 | %7,8 | | | 2.10 | %7 | | | 2.08 | %9 | | | 2.00 | % | | | 2.04 | % | | | 2.07 | % |
| | | | | | | | |
Total expenses excluding recoupment of past waived fees | | | 1.15 | %7,8 | | | 1.18 | %7 | | | 1.23 | %9 | | | 1.20 | % | | | 1.22 | % | | | 1.27 | % | | | 2.15 | %7,8 | | | 2.10 | %7 | | | 2.08 | %9 | | | 2.00 | % | | | 2.02 | % | | | 2.06 | % |
| | | | | | | | |
Total expenses after fees waived and/or reimbursed and paid indirectly | | | 1.13 | %7,8 | | | 1.14 | %7 | | | 1.20 | %9 | | | 1.20 | % | | | 1.22 | % | | | 1.26 | % | | | 2.14 | %7,8 | | | 2.06 | %7 | | | 2.06 | %9 | | | 2.00 | % | | | 2.04 | % | | | 2.04 | % |
| | | | | | | | |
Total expenses after fees waived and/or reimbursed and paid indirectly and excluding interest expense | | | 1.13 | %7,8 | | | 1.14 | %7 | | | 1.19 | %9 | | | 1.19 | % | | | 1.20 | % | | | 1.26 | % | | | 2.14 | %7,8 | | | 2.06 | %7 | | | 2.05 | %9 | | | 1.98 | % | | | 2.02 | % | | | 2.04 | % |
| | | | | | | | |
Net investment income (loss) | | | 0.19 | %7,8 | | | 0.98 | %7 | | | 1.28 | %9 | | | 1.61 | % | | | 1.75 | % | | | 2.04 | % | | | (0.83 | )%7,8 | | | 0.08 | %7 | | | 0.45 | %9 | | | 0.84 | % | | | 0.91 | % | | | 1.27 | % |
| | | | | | | | |
| | | | | | | | | | | | | | | | | | | | | | | | | | | | | | | | | | | | | | | | | | | | | | | | |
| Supplemental Data | | | | | | | | | | | | | | | | | | | | | | | | | | | | | |
Net assets, end of period (000) | | $ | 365,536 | | | $ | 374,715 | | | $ | 390,209 | | | $ | 370,916 | | | $ | 385,511 | | | $ | 361,751 | | | $ | 9,861 | | | $ | 12,730 | | | $ | 19,077 | | | $ | 31,595 | | | $ | 49,315 | | | $ | 69,934 | |
| | | | | | | | |
Portfolio turnover | | | 88 | % | | | 192 | % | | | 324 | %10 | | | 401 | %11 | | | 400 | %12 | | | 354 | %13 | | | 88 | % | | | 192 | % | | | 324 | %10 | | | 401 | %11 | | | 400 | %12 | | | 354 | %13 |
| | | | | | | | |
| | 1 | Based on average shares outstanding. |
| | 2 | Determined in accordance with federal income tax regulations. |
| | 3 | Where applicable, excludes the effects of any sales charges and assumes the reinvestment of dividends and distributions. |
| | 4 | Aggregate total investment return. |
| | 5 | Includes proceeds received from a settlement of litigation, which impacted the Fund’s total return. Excluding these proceeds, the Fund’s total return would have been 5.42%. |
| | 6 | Includes proceeds received from a settlement of litigation, which impacted the Fund’s total return. Excluding these proceeds, the Fund’s total return would have been 4.69%. |
| | 7 | Ratios do not include expenses incurred indirectly as a result of investments in underlying funds of approximately 0.10%. |
| | 9 | Ratios do not include expenses incurred indirectly as a result of investments in underlying funds of approximately 0.05%. |
| | 10 | Includes mortgage dollar roll transactions; excluding these transactions the portfolio turnover would have been 254%. |
| | 11 | Includes mortgage dollar roll transactions; excluding these transactions the portfolio turnover would have been 236%. |
| | 12 | Includes mortgage dollar roll transactions; excluding these transactions the portfolio turnover would have been 302%. |
| | 13 | Includes mortgage dollar roll transactions; excluding these transactions the portfolio turnover would have been 227%. |
See Notes to Financial Statements.
| | | | | | |
| | | BLACKROCK MANAGED VOLATILITY PORTFOLIO | | MARCH 31, 2014 | | 27 |
| | |
| Financial Highlights (concluded) | | |
| | | | | | | | | | | | | | | | | | | | | | | | |
| | | Investor C | |
| | | Six Months
Ended
March 31,
2014 (Unaudited) | | | Year Ended September 30, | |
| | | | 2013 | | | 2012 | | | 2011 | | | 2010 | | | 2009 | |
| Per Share Operating Performance | | | | | | | | | | | | | | | | | | | | | | | | |
Net asset value, beginning of period | | $ | 15.60 | | | $ | 15.02 | | | $ | 13.76 | | | $ | 14.04 | | | $ | 13.04 | | | $ | 12.73 | |
| | | | |
Net investment income1 | | | (0.04 | ) | | | 0.04 | | | | 0.08 | | | | 0.13 | | | | 0.14 | | | | 0.15 | |
Net realized and unrealized gain (loss) | | | 0.77 | | | | 1.17 | | | | 1.64 | | | | (0.25 | ) | | | 1.02 | | | | 0.43 | |
| | | | |
Net increase (decrease) from investment operations | | | 0.73 | | | | 1.21 | | | | 1.72 | | | | (0.12 | ) | | | 1.16 | | | | 0.58 | |
| | | | |
Dividends and distributions from: | | | | | | | | | | | | | | | | | | | | | | | | |
Net investment income | | | (0.13 | ) | | | (0.05 | )2 | | | (0.15 | )2 | | | (0.16 | )2 | | | (0.16 | )2 | | | (0.08 | )2 |
Net realized gain | | | (1.31 | ) | | | (0.58 | )2 | | | (0.31 | )2 | | | — | | | | — | | | | (0.19 | )2 |
| | | | |
Total dividends and distributions | | | (1.44 | ) | | | (0.63 | ) | | | (0.46 | ) | | | (0.16 | ) | | | (0.16 | ) | | | (0.27 | ) |
| | | | |
Net asset value, end of period | | $ | 14.89 | | | $ | 15.60 | | | $ | 15.02 | | | $ | 13.76 | | | $ | 14.04 | | | $ | 13.04 | |
| | | | |
| | | | | | | | | | | | | | | | | | | | | | | | |
| Total Investment Return3 | | | | | | | | | | | | | | | | | | | | | | | | |
Based on net asset value | | | 4.72 | %4 | | | 8.29 | % | | | 12.75 | % | | | (0.94 | )% | | | 8.86 | % | | | 4.99 | %5 |
| | | | |
| | | | | | | | | | | | | | | | | | | | | | | | |
| Ratios to Average Net Assets | | | | | | | | | | | | | | | | | | | | | | | | |
Total expenses | | | 1.85 | %6,7 | | | 1.88 | %6 | | | 1.93 | %8 | | | 1.93 | % | | | 1.94 | % | | | 1.98 | % |
| | | | |
Total expenses excluding recoupment of past waived fees | | | 1.84 | %6,7 | | | 1.88 | %6 | | | 1.93 | %8 | | | 1.93 | % | | | 1.94 | % | | | 1.97 | % |
| | | | |
Total expenses after fees waived and/or reimbursed and paid indirectly | | | 1.82 | %6,7 | | | 1.83 | %6 | | | 1.90 | %8 | | | 1.93 | % | | | 1.94 | % | | | 1.98 | % |
| | | | |
Total expenses after fees waived and/or reimbursed and paid indirectly and excluding interest expense | | | 1.82 | %6,7 | | | 1.83 | %6 | | | 1.90 | %8 | | | 1.92 | % | | | 1.92 | % | | | 1.98 | % |
| | | | |
Net investment income (loss) | | | (0.49 | )%6,7 | | | 0.28 | %6 | | | 0.58 | %8 | | | 0.89 | % | | | 1.05 | % | | | 1.32 | % |
| | | | |
| | | | | | | | | | | | | | | | | | | | | | | | |
| Supplemental Data | | | | | | | | | | | | | | | | | | | | | | | | |
Net assets, end of period (000) | | $ | 79,735 | | | $ | 81,850 | | | $ | 86,947 | | | $ | 81,644 | | | $ | 84,367 | | | $ | 72,063 | |
| | | | |
Portfolio turnover | | | 88 | % | | | 192 | % | | | 324 | %9 | | | 401 | %10 | | | 400 | %11 | | | 354 | %12 |
| | | | |
| | 1 | Based on average shares outstanding. |
| | 2 | Determined in accordance with federal income tax regulations. |
| | 3 | Where applicable, excludes the effects of any sales charges and assumes the reinvestment of dividends and distributions. |
| | 4 | Aggregate total investment return. |
| | 5 | Includes proceeds received from a settlement of litigation, which impacted the Fund’s total return. Excluding these proceeds, the Fund’s total return would have been 4.75%. |
| | 6 | Ratios do not include expenses incurred indirectly as a result of investments in underlying funds of approximately 0.10%. |
| | 8 | Ratios do not include expenses incurred indirectly as a result of investments in underlying funds of approximately 0.05%. |
| | 9 | Includes mortgage dollar roll transactions; excluding these transactions the portfolio turnover would have been 254%. |
| | 10 | Includes mortgage dollar roll transactions; excluding these transactions the portfolio turnover would have been 236%. |
| | 11 | Includes mortgage dollar roll transactions; excluding these transactions the portfolio turnover would have been 302%. |
| | 12 | Includes mortgage dollar roll transactions; excluding these transactions the portfolio turnover would have been 227%. |
See Notes to Financial Statements.
| | | | | | |
| 28 | | BLACKROCK MANAGED VOLATILITY PORTFOLIO | | MARCH 31, 2014 | | |
| | |
| Notes to Financial Statements (Unaudited) | | |
1. Organization:
BlackRock FundsSM (the “Trust”) is registered under the Investment Company Act of 1940, as amended (the “1940 Act”), as a diversified, open-end management investment company. The Trust is organized as a Massachusetts business trust. BlackRock Managed Volatility Portfolio (the “Fund”) is a series of the Trust.
The Fund offers multiple classes of shares. Institutional and Service Shares are sold without a sales charge and only to certain eligible investors. Investor A Shares are generally sold with an initial sales charge, but may be subject to a CDSC for certain redemptions where no initial sales charge was paid at the time of purchase. Investor B and Investor C Shares may be subject to a CDSC. All classes of shares have identical voting, dividend, liquidation and other rights and are subject to the same terms and conditions, except that Service, Investor A, Investor B and Investor C Shares bear certain expenses related to the shareholder servicing of such shares, and Investor B and Investor C Shares also bear certain expenses related to the distribution of such shares. Investor B Shares automatically convert to Investor A Shares after approximately eight years. Investor B Shares are only available through exchanges and dividend reinvestments by existing shareholders and for purchase by certain employer-sponsored retirement plans. Each class has exclusive voting rights with respect to matters relating to its shareholder servicing and distribution expenditures (except that Investor B shareholders may vote on material changes to the Investor A distribution and service plan).
The Fund, together with certain other registered investment companies advised by the Manager or its affiliates, is included in a complex of open-end funds referred to as the Equity-Liquidity Complex.
2. Significant Accounting Policies:
The Fund’s financial statements are prepared in conformity with accounting principles generally accepted in the United States of America (“U.S. GAAP”), which may require management to make estimates and assumptions that affect the reported amounts of assets and liabilities in the financial statements and the reported amounts of increases and decreases in net assets from operations during the reporting period. Actual results could differ from those estimates. The following is a summary of significant accounting policies followed by the Fund:
Valuation: U.S. GAAP defines fair value as the price the Fund would receive to sell an asset or pay to transfer a liability in an orderly transaction between market participants at the measurement date. The Fund determines the fair values of its financial instruments at market value using independent dealers or pricing services under policies approved by the Board of Trustees of the Trust (the “Board”). The BlackRock Global Valuation Methodologies Committee (the “Global Valuation Committee”) is the committee formed by management to develop global pricing policies and procedures and to provide oversight of the pricing function for the Fund for all financial instruments.
The Fund values its bond investments on the basis of last available bid prices or current market quotations provided by dealers or pricing
services. In determining the value of a particular investment, pricing services may use certain information with respect to transactions in such investments, quotations from dealers, pricing matrixes, market transactions in comparable investments, various relationships observed in the market between investments and calculated yield measures. Asset-backed and mortgage-backed securities are valued by independent pricing services using models that consider estimated cash flows of each tranche of the security, establish a benchmark yield and develop an estimated tranche specific spread to the benchmark yield based on the unique attributes of the tranche. Financial futures contracts traded on exchanges are valued at their last sale price. TBA commitments are valued on the basis of last available bid prices or current market quotations provided by pricing services. Swap agreements are valued utilizing quotes received daily by the Fund’s pricing service or through brokers, which are derived using daily swap curves and models that incorporate a number of market data factors, such as discounted cash flows, trades and values of the underlying reference instruments. Certain centrally cleared swaps are valued at the price determined by the relevant exchange or clearinghouse. Investments in open-end registered investment companies are valued at NAV each business day.
Equity investments traded on a recognized securities exchange or the NASDAQ Stock Market (“NASDAQ”) are valued at the last reported sale price that day or the NASDAQ official closing price, if applicable. For equity investments traded on more than one exchange, the last reported sale price on the exchange where the stock is primarily traded is used. Equity investments traded on a recognized exchange for which there were no sales on that day are valued at the last available bid (long positions) or ask (short positions) price.
Securities and other assets and liabilities denominated in foreign currencies are translated into U.S. dollars using exchange rates determined as of the close of business on the New York Stock Exchange (“NYSE”). Foreign currency exchange contracts are valued at the mean between the bid and ask prices and are determined as of the close of business on the NYSE. Interpolated values are derived when the settlement date of the contract is an interim date for which quotations are not available.
Exchange-traded options are valued at the mean between the last bid and ask prices at the close of the options market in which the options trade. An exchange-traded option for which there is no mean price is valued at the last bid (long positions) or ask (short positions) price. If no bid or ask price is available, the prior day’s price will be used, unless it is determined that the prior day’s price no longer reflects the fair value of the option. Over-the-counter (“OTC”) options and swaptions are valued by an independent pricing service using a mathematical model, which incorporates a number of market data factors, such as the trades and prices of the underlying instruments.
The Fund values its investments in BlackRock Liquidity Series, LLC, Money Market Series (the “Money Market Series”) at fair value, which is ordinarily based upon its pro rata ownership in the underlying fund’s net assets. The Money Market Series seeks current income consistent with maintaining liquidity and preserving capital. Although the Money Market Series is not registered under the 1940 Act, its investments will follow the parameters of investments by a money market fund that is subject to
| | | | | | |
| | | BLACKROCK MANAGED VOLATILITY PORTFOLIO | | MARCH 31, 2014 | | 29 |
| | |
| Notes to Financial Statements (continued) | | |
Rule 2a-7 under the 1940 Act. The Fund may withdraw up to 25% of its investment daily, although the manager of the Money Market Series, in its sole discretion, may permit an investor to withdraw more than 25% on any one day.
In the event that the application of these methods of valuation results in a price for an investment that is deemed not to be representative of the market value of such investment, or if a price is not available, the investment will be valued by the Global Valuation Committee, or its delegate, in accordance with a policy approved by the Board as reflecting fair value (“Fair Value Assets”). When determining the price for Fair Value Assets, the Global Valuation Committee, or its delegate, seeks to determine the price that the Fund might reasonably expect to receive from the current sale of that asset in an arm’s-length transaction. Fair value determinations shall be based upon all available factors that the Global Valuation Committee, or its delegate, deems relevant consistent with the principles of fair value measurement, which include the market approach, income approach and/or in the case of recent investments, the cost approach, as appropriate. The market approach generally consists of using comparable market transactions. The income approach generally is used to discount future cash flows to present value and is adjusted for liquidity as appropriate. These factors include but are not limited to: (i) attributes specific to the investment or asset; (ii) the principal market for the investment or asset; (iii) the customary participants in the principal market for the investment or asset; (iv) data assumptions by market participants for the investment or asset, if reasonably available; (v) quoted prices for similar investments or assets in active markets; and (vi) other factors, such as future cash flows, interest rates, yield curves, volatilities, prepayment speeds, loss severities, credit risks, recovery rates, liquidation amounts and/or default rates. Due to the inherent uncertainty of valuations of such investments, the fair values may differ from the values that would have been used had an active market existed. The Global Valuation Committee, or its delegate, employs various methods for calibrating valuation approaches for investments where an active market does not exist, including regular due diligence of the Fund’s pricing vendors, regular reviews of key inputs and assumptions, transactional back-testing or disposition analysis to compare unrealized gains and losses to realized gains and losses, reviews of missing or stale prices and large movements in market values and reviews of any market related activity. The pricing of all Fair Value Assets is subsequently reported to the Board or a committee thereof on a quarterly basis.
Generally, trading in foreign instruments is substantially completed each day at various times prior to the close of business on the NYSE. Occasionally, events affecting the values of such instruments may occur between the foreign market close and the close of business on the NYSE that may not be reflected in the computation of the Fund’s net assets. If events (e.g., a company announcement, market volatility or a natural disaster) occur during such periods that are expected to materially affect the value of such instruments, those instruments may be Fair Value Assets and valued at their fair value, as determined in good faith by the Global Valuation Committee, or its delegate, using a pricing service and/or policies
approved by the Board. Each business day, the Fund uses a pricing service to assist with the valuation of certain foreign exchange-traded equity securities and foreign exchange-traded and OTC options (the “Systematic Fair Value Price”). Using current market factors, the Systematic Fair Value Price is designed to value such foreign securities and foreign options at fair value as of the close of business on the NYSE, which follows the close of the local markets.
Foreign Currency: The Fund’s books and records are maintained in U.S. dollars. Purchases and sales of investment securities are recorded at the rates of exchange prevailing on the respective date of such transactions. Generally, when the U.S. dollar rises in value against a foreign currency, the Fund’s investments denominated in that currency will lose value because that currency is worth fewer U.S. dollars; the opposite effect occurs if the U.S. dollar falls in relative value.
The Fund does not isolate the portion of the results of operations arising as a result of changes in the foreign exchange rates from the changes in the market prices of investments held or sold for financial reporting purposes. Accordingly, the effects of changes in foreign currency exchange rates on investments are not segregated in the Statement of Operations from the effects of changes in market prices of those investments but are included as a component of net realized and unrealized gain (loss) from investments. The Fund reports realized currency gains (losses) on foreign currency related transactions as components of net realized gain (loss) for financial reporting purposes, whereas such components are generally treated as ordinary income for federal income tax purposes.
Segregation and Collateralization: In cases where the Fund enters into certain investments (e.g., financial futures contracts, forward foreign currency exchange contracts, swaps and options written) that would be “senior securities” for 1940 Act purposes, the Fund may segregate or designate on its books and records cash or liquid securities having a market value at least equal to the amount of the Fund’s future obligations under such investments. Doing so allows the investment to be excluded from treatment as a “senior security.” Furthermore, if required by an exchange or counterparty agreement, the Fund may be required to deliver/deposit cash and/or securities to/with an exchange, or broker-dealer or custodian as collateral for certain investments or obligations.
Investment Transactions and Investment Income: For financial reporting purposes, investment transactions are recorded on the dates the transactions are entered into (the trade dates). Realized gains and losses on investment transactions are determined on the identified cost basis. Dividend income is recorded on the ex-dividend date. Dividends from foreign securities where the ex-dividend date may have passed are subsequently recorded when the Fund is informed of the ex-dividend date. Under the applicable foreign tax laws, a withholding tax at various rates may be imposed on capital gains, dividends and interest. Upon notification from issuers, some of the dividend income received from a real estate investment trust may be redesignated as a reduction of cost of the related investment and/or realized gain. Interest income, including
| | | | | | |
| 30 | | BLACKROCK MANAGED VOLATILITY PORTFOLIO | | MARCH 31, 2014 | | |
| | |
| Notes to Financial Statements (continued) | | |
amortization and accretion of premiums and discounts on debt securities, is recognized on the accrual basis. Income, expenses and realized and unrealized gains and losses are allocated daily to each class based on its relative net assets.
Dividends and Distributions: Dividends and distributions paid by the Fund are recorded on the ex-dividend dates. The character and timing of dividends and distributions are determined in accordance with federal income tax regulations, which may differ from U.S. GAAP.
Income Taxes: It is the Fund’s policy to comply with the requirements of the Internal Revenue Code of 1986, as amended, applicable to regulated investment companies, and to distribute substantially all of its taxable income to its shareholders. Therefore, no federal income tax provision is required.
The Fund files U.S. federal and various state and local tax returns. No income tax returns are currently under examination. The statute of limitations on the Fund’s U.S. federal tax returns remains open for each of the four years ended September 30, 2013. The statutes of limitations on the Fund’s state and local tax returns may remain open for an additional year depending upon the jurisdiction.
Management has analyzed tax laws and regulations and their application to the Fund’s facts and circumstances and does not believe there are any uncertain tax positions that require recognition of a tax liability.
Other: Expenses directly related to the Fund or its classes are charged to the Fund or class. Other operating expenses shared by several funds are pro rated among those funds on the basis of relative net assets or other appropriate methods. Expenses directly related to the Fund and other shared expenses pro rated to the Fund are allocated daily to each class based on its relative net assets or other appropriate methods.
The Fund has an arrangement with the custodian whereby fees may be reduced by credits earned on uninvested cash balances, which, if applicable, are shown as fees paid indirectly in the Statement of Operations. The custodian imposes fees on overdrawn cash balances, which can be offset by accumulated credits earned or may result in additional custody charges.
3. Securities and Other Investments:
Asset-Backed and Mortgage-Backed Securities: The Fund may invest in asset-backed securities. Asset-backed securities are generally issued as pass-through certificates, which represent undivided fractional ownership interests in an underlying pool of assets, or as debt instruments, which are also known as collateralized obligations, and are generally issued as the debt of a special purpose entity organized solely for the purpose of owning such assets and issuing such debt. Asset-backed securities are often backed by a pool of assets representing the obligations of a number of different parties. The yield characteristics of certain asset-backed securities may differ from traditional debt securities. One such major difference is that all or a principal part of the obligations may
be prepaid at any time because the underlying assets (i.e., loans) may be prepaid at any time. As a result, a decrease in interest rates in the market may result in increases in the level of prepayments as borrowers, particularly mortgagors, refinance and repay their loans. An increased prepayment rate with respect to an asset-backed security subject to such a prepayment feature will have the effect of shortening the maturity of the security. In addition, the Fund may subsequently have to reinvest the proceeds at lower interest rates. If the Fund has purchased such an asset-backed security at a premium, a faster than anticipated prepayment rate could result in a loss of principal to the extent of the premium paid.
The Fund may purchase certain mortgage pass-through securities. There are a number of important differences among the agencies and instrumentalities of the U.S. government that issue mortgage-related securities and among the securities that they issue. For example, mortgage-related securities guaranteed by Ginnie Mae are guaranteed as to the timely payment of principal and interest by Ginnie Mae and such guarantee is backed by the full faith and credit of the United States. However, mortgage-related securities issued by Freddie Mac and Fannie Mae, including Freddie Mac and Fannie Mae guaranteed mortgage pass-through certificates, which are solely the obligations of Freddie Mac and Fannie Mae, are not backed by or entitled to the full faith and credit of the United States, but are supported by the right of the issuer to borrow from the Treasury.
Collateralized Debt Obligations: The Fund may invest in collateralized debt obligations (“CDOs”), which include collateralized bond obligations (“CBOs”) and collateralized loan obligations (“CLOs”). CBOs and CLOs are types of asset-backed securities. A CDO is an entity that is backed by a diversified pool of debt securities (CBOs) or syndicated bank loans (CLOs). The cash flows of the CDO can be split into multiple segments, called “tranches,” which will vary in risk profile and yield. The riskiest segment is the subordinated or “equity” tranche. This tranche bears the greatest risk of defaults from the underlying assets in the CDO and serves to protect the other, more senior, tranches from default in all but the most severe circumstances. Since it is shielded from defaults by the more junior tranches, a “senior” tranche will typically have higher credit ratings and lower yields than their underlying securities, and often receive investment grade ratings from one or more of the nationally recognized rating agencies. Despite the protection from the more junior tranches, senior tranches can experience substantial losses due to actual defaults, increased sensitivity to future defaults and the disappearance of one or more protecting tranches as a result of changes in the credit profile of the underlying pool of assets.
Multiple Class Pass-Through Securities: The Fund may invest in multiple class pass-through securities, including collateralized mortgage obligations (“CMOs”) and commercial mortgage-backed securities. These multiple class securities may be issued by Ginnie Mae, U.S. government agencies or instrumentalities or by trusts formed by private originators of, or investors in, mortgage loans. In general, CMOs are debt obligations
| | | | | | |
| | | BLACKROCK MANAGED VOLATILITY PORTFOLIO | | MARCH 31, 2014 | | 31 |
| | |
| Notes to Financial Statements (continued) | | |
of a legal entity that are collateralized by, and multiple class pass-through securities represent direct ownership interests in, a pool of residential or commercial mortgage loans or mortgage pass-through securities (the “Mortgage Assets”), the payments on which are used to make payments on the CMOs or multiple pass-through securities. Classes of CMOs include interest only (“IOs”), principal only (“POs”), planned amortization classes and targeted amortization classes. IOs and POs are stripped mortgage-backed securities representing interests in a pool of mortgages, the cash flow from which has been separated into interest and principal components. IOs receive the interest portion of the cash flow while POs receive the principal portion. IOs and POs can be extremely volatile in response to changes in interest rates. As interest rates rise and fall, the value of IOs tends to move in the same direction as interest rates. POs perform best when prepayments on the underlying mortgages rise since this increases the rate at which the principal is returned and the yield to maturity on the PO. When payments on mortgages underlying a PO are slower than anticipated, the life of the PO is lengthened and the yield to maturity is reduced. If the underlying Mortgage Assets experience greater than anticipated pre-payments of principal, the Fund may not fully recoup its initial investment in IOs.
Forward Commitments and When-Issued Delayed Delivery Securities:
The Fund may purchase securities on a when-issued basis and may purchase or sell securities on a forward commitment basis. Settlement of such transactions normally occurs within a month or more after the purchase or sale commitment is made. The Fund may purchase securities under such conditions with the intention of actually acquiring them, but may enter into a separate agreement to sell the securities before the settlement date. Since the value of securities purchased may fluctuate prior to settlement, the Fund may be required to pay more at settlement than the security is worth. In addition, the Fund is not entitled to any of the interest earned prior to settlement. When purchasing a security on a delayed delivery basis, the Fund assumes the rights and risks of ownership of the security, including the risk of price and yield fluctuations. In the event of default by the counterparty, the Fund’s maximum amount of loss is the unrealized appreciation of unsettled when-issued transactions, which is shown in the Schedule of Investments.
TBA Commitments: The Fund may enter into TBA commitments. TBA commitments are forward agreements for the purchase or sale of mortgage-backed securities for a fixed price, with payment and delivery on an agreed upon future settlement date. The specific securities to be delivered are not identified at the trade date. However, delivered securities must meet specified terms, including issuer, rate and mortgage terms. When entering into TBA commitments, the Fund may take possession of or deliver the underlying mortgage-backed securities but can extend the settlement or roll the transaction. TBA commitments involve a risk of loss if the value of the security to be purchased or sold declines or increases, respectively, prior to settlement date.
In order to better define contractual rights and to secure rights that will help the Fund mitigate its counterparty risk, TBA commitments may be entered into by the Fund under Master Securities Forward Transaction
Agreements (each, an “MSFTA”). An MSFTA typically contains, among other things, collateral posting terms and netting provisions in the event of default and/or termination event. The collateral requirements are typically calculated by netting the mark to market amount for each transaction under such agreement and comparing that amount to the value of the collateral currently pledged by the Fund and the counterparty. Cash collateral that has been pledged to cover the obligations of the Fund and cash collateral received from the counterparty, if any, is reported separately on the Statement of Assets and Liabilities as cash pledged as collateral for TBA commitments or cash received as collateral for TBA commitments, respectively. Non-cash collateral pledged by the Fund, if any, is noted in the Schedule of Investments. Typically, the Fund is permitted to sell, repledge or use the collateral it receives; however, the counterparty is not. To the extent amounts due to the Fund are not fully collateralized, contractually or otherwise, the Fund bears the risk of loss from counterparty non-performance.
Securities Lending: The Fund may lend its securities to approved borrowers, such as brokers, dealers and other financial institutions. The borrower pledges collateral consisting of cash, an irrevocable letter of credit issued by a bank, or securities issued or guaranteed by the U.S. government. The initial collateral received by the Fund is required to have a value of at least 102% of the current value of the loaned securities for securities traded on U.S. exchanges and a value of at least 105% for all other securities. The collateral is maintained thereafter, at a value equal to at least 100% of the current market value of the securities on loan. The market value of the loaned securities is determined at the close of each business day of the Fund and any additional required collateral is delivered to the Fund on the next business day. During the term of the loan, the Fund earns dividend or interest income on the securities loaned but does not receive interest income on the securities received as collateral. Loans of securities are terminable at any time and the borrower, after notice, is required to return borrowed securities within the standard time period for settlement of securities transactions.
The market value of securities on loan and the value of the related collateral are shown separately in the Statement of Assets and Liabilities as a component of investments at value, and collateral on securities loaned at value, respectively. As of March 31, 2014, any securities on loan were collateralized by cash. The cash collateral invested by the securities lending agent, BlackRock Investment Management, LLC (“BIM”), if any, is disclosed in the Schedule of Investments.
Securities lending transactions are entered into by the Fund under Master Securities Lending Agreements (each, an “MSLA”) which provide the right, in the event of default (including bankruptcy or insolvency), for the non-defaulting party to liquidate the collateral and calculate a net exposure to the defaulting party or request additional collateral. In the event that a borrower defaults, the Fund, as lender, would offset the market value of the collateral received against the market value of the securities loaned. The value of the collateral is typically greater than that of the market value of the securities loaned, leaving the lender with a net
| | | | | | |
| 32 | | BLACKROCK MANAGED VOLATILITY PORTFOLIO | | MARCH 31, 2014 | | |
| | |
| Notes to Financial Statements (continued) | | |
amount payable to the defaulting party. However, bankruptcy or insolvency laws of a particular jurisdiction may impose restrictions on or prohibitions against such a right of offset in the event of an MSLA counterparty’s bankruptcy or insolvency. Under the MSLA, the borrower can resell or re-pledge the loaned securities, and the Fund can reinvest cash collateral, or, upon an event of default, resell or re-pledge the collateral.
The risks of securities lending include the risk that the borrower may not provide additional collateral when required or may not return the securities when due. To mitigate these risks, the Fund benefits from a borrower default indemnity provided by BIM. BIM’s indemnity allows for full replacement of the securities lent. The Fund could suffer a loss if the value of an investment purchased with cash collateral falls below the market value of loaned securities or if the value of an investment purchased with cash collateral falls below the value of the original cash collateral received.
4. Derivative Financial Instruments:
The Fund engages in various portfolio investment strategies using derivative contracts both to increase the returns of the Fund and/or to economically hedge its exposure to certain risks such as credit risk, equity risk, interest rate risk, forward foreign currency exchange rate risk or other risk (inflation risk). These contracts may be transacted on an exchange or OTC.
Financial Futures Contracts: The Fund purchases and/or sells financial futures contracts and options on financial futures contracts to gain exposure to, or economically hedge against, changes in interest rates (interest rate risk), changes in the value of equity securities (equity risk) or foreign currencies (foreign currency exchange rate risk). Financial futures contracts are agreements between the Fund and a counterparty to buy or sell a specific quantity of an underlying instrument at a specified price and at a specified date. Depending on the terms of the particular contract, financial futures contracts are settled either through physical delivery of the underlying instrument on the settlement date or by payment of a cash settlement amount on the settlement date.
Upon entering into a financial futures contract, the Fund is required to deposit initial margin with the broker in the form of cash or securities in an amount that varies depending on a contract’s size and risk profile. The initial margin deposit must then be maintained at an established level over the life of the contract. Securities deposited as initial margin are designated on the Schedule of Investments and cash deposited, if any, is recorded on the Statement of Assets and Liabilities as cash pledged for financial futures contracts. Pursuant to the contract, the Fund agrees to receive from or pay to the broker an amount of cash equal to the daily fluctuation in value of the contract. Such receipts or payments are known as variation margin. Variation margin is recorded by the Fund as unrealized appreciation or depreciation and, if applicable, as a receivable or payable for variation margin in the Statement of Assets and Liabilities.
When the contract is closed, the Fund records a realized gain or loss equal to the difference between the value of the contract at the time it
was opened and the value at the time it was closed. The use of financial futures contracts involves the risk of an imperfect correlation in the movements in the price of financial futures contracts, interest or foreign currency exchange rates and the underlying assets.
Forward Foreign Currency Exchange Contracts: The Fund enters into forward foreign currency exchange contracts as an economic hedge against either specific transactions or portfolio instruments or to obtain exposure to, or hedge exposure away from, foreign currencies (foreign currency exchange rate risk). A forward foreign currency exchange contract is an agreement between two parties to buy and sell a currency at a set exchange rate on a future date. Forward foreign currency exchange contracts, when used by the Fund, help to manage the overall exposure to the currencies in which some of the investments held by the Fund are denominated. The contract is marked-to-market daily and the change in market value is recorded by the Fund as an unrealized gain or loss. When the contract is closed, the Fund records a realized gain or loss equal to the difference between the value at the time it was opened and the value at the time it was closed. The use of forward foreign currency exchange contracts involves the risk that the value of a foreign currency exchange contract changes unfavorably due to movements in the value of the referenced foreign currencies.
Options: The Fund purchases and writes call and put options to increase or decrease its exposure to underlying instruments (including equity risk and interest rate risk) and/or, in the case of options written, to generate gains from options premiums. A call option gives the purchaser (holder) of the option the right (but not the obligation) to buy, and obligates the seller (writer) to sell (when the option is exercised) the underlying instrument at the exercise or strike price at any time or at a specified time during the option period. A put option gives the holder the right to sell and obligates the writer to buy the underlying instrument at the exercise or strike price at any time or at a specified time during the option period. When the Fund purchases (writes) an option, an amount equal to the premium paid (received) by the Fund is reflected as an asset (liability). The amount of the asset (liability) is subsequently marked-to-market to reflect the current market value of the option purchased (written). When an instrument is purchased or sold through an exercise of an option, the related premium paid (or received) is added to (or deducted from) the basis of the instrument acquired or deducted from (or added to) the proceeds of the instrument sold. When an option expires (or the Fund enters into a closing transaction), the Fund realizes a gain or loss on the option to the extent of the premiums received or paid (or gain or loss to the extent the cost of the closing transaction exceeds the premiums received or paid). When the Fund writes a call option, such option is “covered,” meaning that the Fund holds the underlying instrument subject to being called by the option counterparty. When the Fund writes a put option, such option is covered by cash in an amount sufficient to cover the obligation.
Options on swaps (swaptions) are similar to options on securities except that instead of selling or purchasing the right to buy or sell a security, the writer or purchaser of the swap option is granting or buying the right
| | | | | | |
| | | BLACKROCK MANAGED VOLATILITY PORTFOLIO | | MARCH 31, 2014 | | 33 |
| | |
| Notes to Financial Statements (continued) | | |
to enter into a previously agreed upon interest rate or credit default swap agreement (interest rate risk and/or credit risk) at any time before the expiration of the option.
The Fund also purchases or sells listed or OTC foreign currency options, foreign currency futures and related options on foreign currency futures as a short or long hedge against possible variations in foreign exchange rates or to gain exposure to foreign currencies (foreign currency exchange rate risk). When foreign currency is purchased or sold through an exercise of a foreign currency option, the related premium paid (or received) is added to (or deducted from) the basis of the foreign currency acquired or deducted from (or added to) the proceeds of the foreign currency sold (receipts from the foreign currency purchased). Such transactions may be effected with respect to hedges on non-U.S. dollar denominated instruments owned by the Fund but not yet delivered, or committed or anticipated to be purchased by the Fund.
In purchasing and writing options, the Fund bears the risk of an unfavorable change in the value of the underlying instrument or the risk that the Fund may not be able to enter into a closing transaction due to an illiquid market. Exercise of a written option could result in the Fund purchasing or selling a security when it otherwise would not, or at a price different from the current market value.
Swaps: The Fund enters into swap agreements, in which the Fund and a counterparty agree either to make periodic net payments on a specified notional amount or a net payment upon termination. Swap agreements are privately negotiated in the OTC market and may be entered into as a bilateral contract (“OTC swaps”) or centrally cleared (“centrally cleared swaps”). Swaps are marked-to-market daily and changes in value are recorded as unrealized appreciation (depreciation).
For OTC swaps, any upfront premiums paid are recorded as assets and any upfront fees received are recorded as liabilities and are shown as swap premiums paid and swap premiums received, respectively, in the Statement of Assets and Liabilities and amortized over the term of the OTC swap. Payments received or made by the Fund for OTC swaps are recorded in the Statement of Operations as realized gains or losses, respectively. When an OTC swap is terminated, the Fund will record a realized gain or loss equal to the difference between the proceeds from (or cost of) the closing transaction and the Fund’s basis in the contract, if any. Generally, the basis of the contracts is the premium received or paid.
In a centrally cleared swap, immediately following execution of the swap agreement, the swap agreement is novated to a central counterparty (the “CCP”) and the Fund’s counterparty on the swap agreement becomes the CCP. The Fund is required to interface with the CCP through a broker. Upon entering into a centrally cleared swap, the Fund is required to deposit initial margin with the broker in the form of cash or securities in an amount that varies depending on the size and risk profile of the particular swap. Securities deposited as initial margin are designated on the Schedule of Investments and cash deposited is recorded on the Statement of Assets and Liabilities as cash pledged for centrally cleared swaps. The daily change in valuation of centrally cleared swaps is recorded as a receivable or payable for variation margin in the Statement of Assets and Liabilities. Payments received from (paid to) the
counterparty, including at termination, are recorded as realized gain (loss) in the Statement of Operations.
Swap transactions involve, to varying degrees, elements of interest rate, credit and market risk in excess of the amounts recognized in the Statement of Assets and Liabilities. Such risks involve the possibility that there will be no liquid market for these agreements, that the counterparty to the agreements may default on its obligation to perform or disagree as to the meaning of the contractual terms in the agreements, and that there may be unfavorable changes in interest rates and/or market values associated with these transactions.
| Ÿ | | Credit default swaps — The Fund enters into credit default swaps to manage its exposure to the market or certain sectors of the market, to reduce its risk exposure to defaults of corporate and/or sovereign issuers or to create exposure to corporate and/or sovereign issuers to which it is not otherwise exposed (credit risk). The Fund may either buy or sell (write) credit default swaps on single-name issuers (corporate or sovereign), a combination or basket of single-name issuers or traded indexes. Credit default swaps on single-name issuers are agreements in which the protection buyer pays fixed periodic payments to the seller in consideration for a guarantee from the protection seller to make a specific payment should a negative credit event take place with respect to the referenced entity (e.g., bankruptcy, failure to pay, obligation accelerators, repudiation, moratorium or restructuring). Credit default swaps on traded indexes are agreements in which the buyer pays fixed periodic payments to the seller in consideration for a guarantee from the seller to make a specific payment should a write-down, principal or interest shortfall or default of all or individual underlying securities included in the index occur. As a buyer, if an underlying credit event occurs, the Fund will either (i) receive from the seller an amount equal to the notional amount of the swap and deliver the referenced security or underlying securities comprising the index, or (ii) receive a net settlement of cash equal to the notional amount of the swap less the recovery value of the security or underlying securities comprising the index. As a seller (writer), if an underlying credit event occurs, the Fund will either pay the buyer an amount equal to the notional amount of the swap and take delivery of the referenced security or underlying securities comprising the index or pay a net settlement of cash equal to the notional amount of the swap less the recovery value of the security or underlying securities comprising the index. |
| Ÿ | | Total return swaps — The Fund enters into total return swaps to obtain exposure to a security or market without owning such security or investing directly in that market or to transfer the risk/return of one market (e.g., fixed income) to another market (e.g., equity) (equity risk and/or interest rate risk). Total return swaps are agreements in which there is an exchange of cash flows whereby one party commits to make payments based on the total return (coupons plus capital gains/losses) of an underlying instrument in exchange for fixed or floating rate interest payments. To the extent the total return of the instrument or index underlying the transaction exceeds or falls |
| | | | | | |
| 34 | | BLACKROCK MANAGED VOLATILITY PORTFOLIO | | MARCH 31, 2014 | | |
| | |
| Notes to Financial Statements (continued) | | |
| | short of the offsetting interest rate obligation, the Fund will receive a payment from or make a payment to the counterparty. |
| Ÿ | | Interest rate swaps — The Fund enters into interest rate swaps to gain or reduce exposure to interest rates or to manage duration, the yield curve or interest rate risk by economically hedging the value of the fixed rate bonds which may decrease when interest rates rise (interest rate risk). Interest rate swaps are agreements in which one party pays a stream of interest payments, either fixed or floating, for another party’s stream of interest payments, either fixed or floating, on the same notional amount for a specified period of time. Interest rate floors, which are a type of interest rate swap, are agreements in which one party agrees to make payments to the other party to the extent that interest rates fall below a specified rate or floor in return for a premium. In more complex swaps, the notional principal amount may decline (or amortize) over time. |
| Ÿ | | Forward swaps — The Fund may enter into forward interest rate swaps and forward total return swaps. In a forward swap, the Fund and the counterparty agree to make either periodic net payments beginning on a specified future effective date or a net payment at termination, unless terminated earlier. |
The following is a summary of the Fund’s derivative financial instruments categorized by risk exposure:
| | | | | | |
| Fair Values of Derivative Financial Instruments as of March 31, 2014 | |
| | | Derivative Assets | |
| | | Statement of Assets and Liabilities Location | | Value | |
Interest rate contracts | | Net unrealized appreciation/depreciation1 ; Investments at value2 | | $ | 383,230 | |
Forward foreign currency exchange contracts | | Net unrealized appreciation/depreciation1 ; Unrealized appreciation on forward foreign currency exchange contracts | | | 1,666,956 | |
Credit contracts | | Net unrealized appreciation/depreciation1 | | | 13 | |
| | Net unrealized appreciation/depreciation1 ; | | | | |
Equity contracts | | Unrealized appreciation on OTC swaps | | | 3,076,001 | |
| | | |
Total | | | | $ | 5,126,200 | |
| | | | | | |
| | | | | | |
| | | Derivative Liabilities | |
| | | Statement of Assets and Liabilities Location | | Value | |
Interest rate contracts | | Net unrealized appreciation/depreciation1 ; Options written at value | | $ | 221,650 | |
Forward foreign currency exchange contracts | | Net unrealized appreciation/depreciation1 ; Unrealized depreciation on forward foreign currency exchange contracts | | | 1,600,938 | |
Credit contracts | | Net unrealized appreciation/depreciation1 | | | 32 | |
Equity contracts | | Net unrealized appreciation/depreciation1 | | | 1,435,919 | |
| | | |
Total | | | | $ | 3,258,539 | |
| | | | | | |
| | 1 | Includes cumulative appreciation/depreciation on financial futures contracts and centrally cleared swaps, if any, as reported in the Schedule of Investments. Only current day’s variation margin is reported within the Statement of Assets and Liabilities. |
| | 2 | Includes options purchased at value as reported in the Schedule of Investments. |
| | | | |
The Effect of Derivative Financial Instruments in the Statement of Operations
Six Months Ended March 31, 2014 | |
| Net Realized Gain (Loss) From | |
Interest rate contracts: | | | | |
Financial futures contracts | | $ | (887,048 | ) |
Swaps | | | (577,211 | ) |
Options | | | 101,941 | |
Foreign currency exchange contracts: | | | | |
Financial futures contracts | | | 819,769 | |
Foreign currency transactions | | | (1,560,388 | ) |
Credit contracts: | | | | |
Swaps | | | (22,186 | ) |
Equity contracts: | | | | |
Financial futures contracts | | | 4,688,777 | |
Swaps | | | (41,481 | ) |
| | | | |
Total | | $ | 2,522,173 | |
| | | | |
| | | | |
| Net Change in Unrealized Appreciation/Depreciation on | |
Interest rate contracts: | | | | |
Financial futures contracts | | $ | 700,867 | |
Swaps | | | 302,283 | |
Options1 | | | 19,297 | |
Foreign currency exchange contracts: | | | | |
Financial futures contracts | | | 266,887 | |
Foreign currency translations | | | 1,683,860 | |
Credit contracts: | | | | |
Swaps | | | (228 | ) |
Equity contracts: | | | | |
Financial futures contracts | | | (39,885 | ) |
Swaps | | | 270,260 | |
| | | | |
Total | | $ | 3,203,341 | |
| | | | |
| | 1 | Options purchased are included in the net change in unrealized appreciation/ depreciation on investments. |
For the six months ended March 31, 2014, the average quarterly balances of outstanding derivative financial instruments were as follows:
| | | | |
Financial futures contracts: | | | | |
Average number of contracts purchased | | | 1,748 | |
Average number of contracts sold | | | 834 | |
Average notional value of contracts purchased | | $ | 167,762,505 | |
Average notional value of contracts sold | | $ | 90,063,440 | |
Forward foreign currency exchange contracts: | | | | |
Average number of contracts - USD purchased | | | 98 | |
Average number of contracts - USD sold | | | 74 | |
Average USD amounts purchased | | $ | 253,077,726 | |
Average USD amounts sold | | $ | 131,667,111 | |
Options: | | | | |
Average number of option contracts purchased | | | 58 | |
Average number of option contracts written | | | 156 | |
Average notional value of option contracts purchased | | $ | 7,015,000 | |
Average notional value of option contracts written | | $ | 19,315,000 | |
Credit default swaps: | | | | |
Average number of contracts - buy protection | | | 2 | |
Average notional value - buy protection | | $ | 344,414 | |
Interest rate swaps: | | | | |
Average number of contracts - pays fixed rate | | | 3 | |
Average notional value - pays fixed rate | | $ | 5,323,684 | |
Total return swaps: | | | | |
Average number of contracts | | | 1 | |
Average notional value | | $ | 2,692,816 | |
| | | | | | |
| | | BLACKROCK MANAGED VOLATILITY PORTFOLIO | | MARCH 31, 2014 | | 35 |
| | |
| Notes to Financial Statements (continued) | | |
Counterparty Credit Risk: A derivative contract may suffer a mark-to-market loss if the value of the contract decreases due to an unfavorable change in the market rates or values of the underlying instrument. Losses can also occur if the counterparty does not perform under the contract.
The Fund’s risk of loss from counterparty credit risk on OTC derivatives is generally limited to the aggregate unrealized gain netted against any collateral held by the Fund. For OTC options purchased, the Fund bears the risk of loss of the amount of the premiums paid plus the positive change in market values net of any collateral held by the Fund should the counterparty fail to perform under the contracts. Options written by the Fund do not typically give rise to counterparty credit risk, as options written generally obligate the Fund, and not the counterparty, to perform.
With exchange-traded purchased options and futures and centrally cleared swaps, there is less counterparty credit risk to the Fund since the exchange or clearinghouse, as counterparty to such instruments, guarantees against a possible default. The clearinghouse stands between the buyer and the seller of the contract; therefore, credit risk is limited to failure of the clearinghouse. While offset rights may exist under applicable law, a Fund does not have a contractual right of offset against a clearing broker or clearinghouse in the event of a default (including the bankruptcy or insolvency) of the clearing broker or clearinghouse. Additionally, credit risk exists in exchange-traded futures and centrally cleared swaps with respect to initial and variation margin that is held in a clearing broker’s customer accounts. While clearing brokers are required to segregate customer margin from their own assets, in the event that a clearing broker becomes insolvent or goes into bankruptcy and at that time there is a shortfall in the aggregate amount of margin held by the clearing broker for all its clients, typically the shortfall would be allocated on a pro rata basis across all the clearing broker’s customers, potentially resulting in losses to the Fund.
In order to better define its contractual rights and to secure rights that will help the Fund mitigate its counterparty risk, the Fund may enter into an International Swaps and Derivatives Association, Inc. Master Agreement (“ISDA Master Agreement”) or similar agreement with its derivative contract counterparties. An ISDA Master Agreement is a bilateral agreement between the Fund and a counterparty that governs certain OTC derivatives and typically contains, among other things, collateral posting terms and netting provisions in the event of a default and/or termination event. Under an ISDA Master Agreement, the Fund may, under certain circumstances, offset with the counterparty certain derivative financial
instruments’ payables and/or receivables with collateral held and/or posted and create one single net payment. The provisions of the ISDA Master Agreement typically permit a single net payment in the event of default including the bankruptcy or insolvency of the counterparty. Bankruptcy or insolvency laws of a particular jurisdiction may impose restrictions on or prohibitions against the right of offset in bankruptcy, insolvency or other events. In addition, certain ISDA Master Agreements allow counterparties to OTC derivatives to terminate derivative contracts prior to maturity in the event the Fund’s net assets decline by a stated percentage or the Fund fails to meet the terms of its ISDA Master Agreements, which would cause the Fund to accelerate payment of any net liability owed to the counterparty.
Collateral Requirements: For derivatives traded under an ISDA Master Agreement, the collateral requirements are typically calculated by netting the mark-to-market amount for each transaction under such agreement and comparing that amount to the value of any collateral currently pledged by the Fund and the counterparty.
Cash collateral that has been pledged to cover obligations of the Fund and cash collateral received from the counterparty, if any, is reported separately on the Statement of Assets and Liabilities as cash pledged as collateral and cash received as collateral, respectively. Non-cash collateral pledged by the Fund, if any, is noted in the Schedule of Investments. Generally, the amount of collateral due from or to a party has to exceed a minimum transfer amount threshold (typically either $250,000 or $500,000) before a transfer is required, which is determined at the close of business of the Fund and any additional required collateral is delivered to/pledged by the Fund on the next business day. Typically, the Fund and counterparties are not permitted to sell, re-pledge or use the collateral they receive. To the extent amounts due to the Fund from its counterparties are not fully collateralized, contractually or otherwise, the Fund bears the risk of loss from counterparty non-performance. The Fund attempts to mitigate counterparty risk by entering into agreements only with counterparties that it believes have the financial resources to honor their obligations and by monitoring the financial stability of those counterparties.
For financial reporting purposes, the Fund does not offset derivative assets and derivative liabilities that are subject to netting arrangements, if any, in the Statement of Assets and Liabilities.
At March 31, 2014, the Fund’s derivative assets and liabilities (by type) are as follows:
| | | | | | | | |
| | | Assets | | | Liabilities | |
Derivative Financial Instruments: | | | | | | | | |
Financial futures contracts | | $ | 397,007 | | | $ | 665,779 | |
Forward foreign currency exchange contracts | | | 1,140,832 | | | | 1,545,989 | |
Options1 | | | 19,766 | | | | 135,969 | |
Swaps-Centrally cleared | | | — | | | | 9,119 | |
Swaps-OTC2 | | | 270,260 | | | | — | |
| |
Total derivative assets and liabilities in the Statement of Assets and Liabilities | | $ | 1,827,865 | | | $ | 2,356,856 | |
| | | | |
| | | | | | |
| 36 | | BLACKROCK MANAGED VOLATILITY PORTFOLIO | | MARCH 31, 2014 | | |
| | |
| Notes to Financial Statements (continued) | | |
| | | | | | | | |
| | | Assets | | | Liabilities | |
Derivative Financial Instruments: | | | | | | | | |
Derivatives not subject to a Master Netting Agreement or similar agreement (“MNA”) | | $ | (416,773 | ) | | $ | (810,867 | ) |
| |
Total derivative assets and liabilities subject to an MNA | | $ | 1,411,092 | | | $ | 1,545,989 | |
| | | | |
| 1 | Includes options purchased at value which is included in Investments at value — unaffiliated in the Statement of Assets and Liabilities and reported in the Schedule of Investments. |
| 2 | Includes unrealized appreciation/depreciation on OTC swaps in the Statement of Assets and Liabilities. |
The following tables present the Fund’s derivative assets and/or liabilities by counterparty net of amounts available for offset under an MNA and net of the related collateral received and pledged by the Fund as of March 31, 2014:
| | | | | | | | | | | | | | | | | | | | |
| Counterparty | | Derivative Assets Subject to an MNA by Counterparty | | | Derivatives Available for Offset1 | | | Non-cash Collateral Received | | | Cash Collateral Received | | | Net Amount of Derivative Assets2 | |
Bank of America N.A. | | $ | 157 | | | $ | (157 | ) | | | — | | | | — | | | | — | |
Barclays Bank PLC | | | 46,128 | | | | (46,128 | ) | | | — | | | | — | | | | — | |
BNP Paribas S.A. | | | 20,078 | | | | (20,078 | ) | | | — | | | | — | | | | — | |
Citibank N.A. | | | 12,676 | | | | (3,696 | ) | | | — | | | | — | | | $ | 8,980 | |
Credit Suisse International | | | 570,487 | | | | (43,519 | ) | | | — | | | | — | | | | 526,968 | |
Deutsche Bank AG | | | 434,802 | | | | (434,802 | ) | | | — | | | | — | | | | — | |
Goldman Sachs International | | | 2,333 | | | | (2,333 | ) | | | — | | | | — | | | | — | |
HSBC Bank PLC | | | 258,412 | | | | (258,412 | ) | | | — | | | | — | | | | — | |
JPMorgan Chase Bank N.A. | | | 8,700 | | | | (7,550 | ) | | | — | | | | — | | | | 1,150 | |
Royal Bank of Canada | | | 20,888 | | | | (20,888 | ) | | | — | | | | — | | | | — | |
Royal Bank of Scotland PLC | | | 1,380 | | | | — | | | | — | | | | — | | | | 1,380 | |
State Street Bank and Trust Co. | | | 794 | | | | (794 | ) | | | — | | | | — | | | | — | |
UBS AG | | | 23,611 | | | | (23,611 | ) | | | — | | | | — | | | | — | |
Westpac Banking Corp. | | | 10,646 | | | | (10,646 | ) | | | — | | | | — | | | | — | |
| |
| | $ | 1,411,092 | | | $ | (872,614 | ) | | | — | | | | — | | | $ | 538,478 | |
| | | | |
| | | | | | | | | | | | | | | | | | | | |
| Counterparty | | Derivative Liabilities Subject to an MNA by Counterparty | | | Derivatives Available for Offset1 | | | Non-cash Collateral Received | | | Cash Collateral Received | | | Net Amount of Derivative Liabilities3 | |
Bank of America N.A. | | $ | 536 | | | $ | (157 | ) | | | — | | | | — | | | $ | 379 | |
Barclays Bank PLC | | | 55,035 | | | | (46,128 | ) | | | — | | | | — | | | | 8,907 | |
BNP Paribas S.A. | | | 195,430 | | | | (20,078 | ) | | | — | | | | — | | | | 175,352 | |
Citibank N.A. | | | 3,696 | | | | (3,696 | ) | | | — | | | | — | | | | — | |
Credit Suisse International | | | 43,519 | | | | (43,519 | ) | | | — | | | | — | | | | — | |
Deutsche Bank AG | | | 453,868 | | | | (434,802 | ) | | | — | | | | — | | | | 19,066 | |
Goldman Sachs International | | | 156,280 | | | | (2,333 | ) | | | — | | | | — | | | | 153,947 | |
HSBC Bank PLC | | | 270,185 | | | | (258,412 | ) | | | — | | | | — | | | | 11,773 | |
JPMorgan Chase Bank N.A. | | | 7,550 | | | | (7,550 | ) | | | — | | | | — | | | | — | |
Royal Bank of Canada | | | 112,699 | | | | (20,888 | ) | | | — | | | | — | | | | 91,811 | |
State Street Bank and Trust Co. | | | 1,074 | | | | (794 | ) | | | — | | | | — | | | | 280 | |
UBS AG | | | 207,536 | | | | (23,611 | ) | | | — | | | | — | | | | 183,925 | |
Westpac Banking Corp. | | | 38,581 | | | | (10,646 | ) | | | — | | | | — | | | | 27,935 | |
| |
| | $ | 1,545,989 | | | $ | (872,614 | ) | | | — | | | | — | | | $ | 673,375 | |
| | | | |
| 1 | The amount of derivatives available for offset is limited to the amount of derivative assets and/or liabilities that are subject to an MNA. |
| 2 | Net amount represents the net amount receivable from the counterparty in the event of default. |
| 3 | Net amount represents the net amount payable due to the counterparty in the event of default. |
| | | | | | |
| | | BLACKROCK MANAGED VOLATILITY PORTFOLIO | | MARCH 31, 2014 | | 37 |
| | |
| Notes to Financial Statements (continued) | | |
5. Investment Advisory Agreement and Other Transactions with Affiliates:
The PNC Financial Services Group, Inc. is the largest stockholder and an affiliate, for 1940 Act purposes, of BlackRock.
The Trust, on behalf of the Fund, entered into an Investment Advisory Agreement with the Manager, the Fund’s investment advisor, an indirect, wholly owned subsidiary of BlackRock, to provide investment advisory and administration services. The Manager is responsible for the management of the Fund’s portfolio and provides the necessary personnel, facilities, equipment and certain other services necessary to the operations of the Fund. For such services, the Fund pays the Manager a monthly fee based on a percentage of the Fund’s average daily net assets at the following annual rates:
| | | | |
| Average Daily Net Assets | | Investment Advisory Fee | |
First $1 Billion | | | 0.550 | % |
$1 Billion - $2 Billion | | | 0.500 | % |
$2 Billion - $3 Billion | | | 0.475 | % |
Greater than $3 Billion | | | 0.450 | % |
The Manager voluntarily agreed to waive its investment advisory fees by the amount of investment advisory fees the Fund pays to the Manager indirectly through its investment in affiliated money market funds. In addition, the Manager has contractually agreed to waive the management fee on assets estimated to be attributed to the Fund’s investments in other equity and fixed-income mutual funds managed by the Manager or its affiliates, if any. This amount is shown as fees waived by Manager in the Statement of Operations. For the six months ended March 31, 2014, the amount waived was $87,168.
The Manager, on behalf of the Fund, entered into separate sub-advisory agreements with BlackRock International Limited (“BIL”), BlackRock (Hong Kong) Limited (“BHK”), BlackRock (Singapore) Limited (“BSL”) and BlackRock Financial Management, Inc. (“BFM”), each an affiliate of the Manager. The Manager pays BIL, BHK, BSL and BFM, for services they provide, a monthly fee that is a percentage of the investment advisory fees paid by the Fund to the Manager. Effective March 20, 2014, BlackRock Asset Management North Asia Limited, an affiliate of the Manager, replaced BHK as sub-advisor to the Fund.
The Trust, on behalf of the Fund, entered into a Distribution Agreement and a Distribution and Service Plan with BlackRock Investments, LLC (“BRIL”), an affiliate of the Manager. Pursuant to the Distribution and Service Plan and in accordance with Rule 12b-1 under the 1940 Act, the Fund pays BRIL ongoing service and distribution fees. The fees are accrued daily and paid monthly at annual rates based upon the average daily net assets of the shares of the Fund as follows:
| | | | | | | | |
| | | Service Fee | | | Distribution Fee | |
Service | | | 0.25 | % | | | — | |
Investor A | | | 0.25 | % | | | — | |
Investor B | | | 0.25 | % | | | 0.75 | % |
Investor C | | | 0.25 | % | | | 0.75 | % |
Pursuant to sub-agreements with BRIL, broker-dealers and BRIL provide shareholder servicing and distribution services to the Fund. The ongoing service and/or distribution fee compensates BRIL and each broker-dealer for providing shareholder servicing and/or distribution related services to Service, Investor A, Investor B and Investor C shareholders.
For the six months ended March 31, 2014, the following table shows the class specific service and distribution fees borne directly by each class of the Fund:
| | | | |
Service | | $ | 2,215 | |
Investor A | | | 465,367 | |
Investor B | | | 56,927 | |
Investor C | | | 405,839 | |
| | | | |
Total | | $ | 930,348 | |
| | | | |
Pursuant to written agreements, certain financial intermediaries, some of which may be affiliates, provide the Fund with sub-accounting, recordkeeping, sub-transfer agency and other administrative services with respect to sub-accounts they service. For these services, these entities receive an asset based fee or an annual fee per shareholder account, which will vary depending on share class and/or net assets. For the six months ended March 31, 2014, the Fund paid the following to affiliates in return for these services, which are included in transfer agent — class specific in the Statement of Operations:
| | | | |
Institutional | | $ | 18,562 | |
Service | | $ | 1,395 | |
Investor A | | $ | 5,568 | |
The Manager maintains a call center, which is responsible for providing certain shareholder services to the Fund, such as responding to shareholder inquiries and processing transactions based upon instructions from shareholders with respect to the subscription and redemption of Fund shares. For the six months ended March 31, 2014, the Fund reimbursed the Manager the following amounts for costs incurred in running the call center, which are included in transfer agent — class specific in the Statement of Operations:
| | | | |
Institutional | | $ | 626 | |
Service | | | 73 | |
Investor A | | | 49,258 | |
Investor B | | | 3,696 | |
Investor C | | | 2,191 | |
| | | | |
Total | | $ | 55,844 | |
| | | | |
For the six months ended March 31, 2014, the following table shows the class specific transfer agent fees borne directly by each class of the Fund:
| | | | |
Institutional | | $ | 86,864 | |
Service | | | 1,913 | |
Investor A | | | 346,823 | |
Investor B | | | 24,990 | |
Investor C | | | 50,312 | |
| | | | |
Total | | $ | 510,902 | |
| | | | |
| | | | | | |
| 38 | | BLACKROCK MANAGED VOLATILITY PORTFOLIO | | MARCH 31, 2014 | | |
| | |
| Notes to Financial Statements (continued) | | |
BNY Mellon Investment Servicing (US) Inc. (“BNYMIS”) and the Manager act as co-administrators for the Fund. For these services, the co-administrators receive an administration fee computed daily and payable monthly to each administrator pursuant to separate fee arrangements, based on a percentage of the average daily net assets of the Fund. The combined administration fee, which is shown as administration in the Statement of Operations, is paid at the following annual rates:
| | | | |
| Average Daily Net Assets | | Administration Fee | |
First $500 Million | | | 0.075 | % |
$500 Million - $1 Billion | | | 0.065 | % |
Greater than $1 Billion | | | 0.055 | % |
In addition, each of the share classes is charged an administration fee, which is shown as administration — class specific in the Statement of Operations, based on the following percentages of average daily net assets of each respective class:
| | | | |
| Average Daily Net Assets | | Administration Fee — Class Specific | |
First $500 Million | | | 0.025 | % |
$500 Million - $1 Billion | | | 0.015 | % |
Greater than $1 Billion | | | 0.005 | % |
For the six months ended March 31, 2014, the Fund paid $241,047 to the Manager in return for these services, which is included in administration and administration — class specific in the Statement of Operations.
For the six months ended March 31, 2014, the following table shows the class specific administration fees borne directly by each class of the Fund:
| | | | |
Institutional | | $ | 27,594 | |
Service | | | 221 | |
Investor A | | | 46,537 | |
Investor B | | | 1,423 | |
Investor C | | | 10,146 | |
| | | | |
Total | | $ | 85,921 | |
| | | | |
BNYMIS and the Manager may have, at their discretion, voluntarily waived all or any portion of their administration fees for the Fund or a share class which are included in administration fees waived – class specific in the Statement of Operations.
The Manager contractually agreed to waive and/or reimburse fees or expenses in order to limit expenses, excluding interest expense, dividend expense, income tax expense, acquired fund fees and expenses and certain other fund expenses, which constitute extraordinary expenses not incurred in the ordinary course of the Fund’s business. The expense limitations as a percentage of average daily net assets are as follows:
| | | | |
Institutional | | | 0.89 | % |
Service | | | 1.17 | % |
Investor A | | | 1.37 | % |
Investor B | | | 2.14 | % |
Investor C | | | 2.14 | % |
The Manager has agreed not to reduce or discontinue this contractual waiver or reimbursement prior to February 1, 2015 unless approved by the Board, including a majority of the Independent Trustees.
Class specific expense waivers or reimbursements are as follows:
| | | | | | | | | | | | |
| | | Share Classes | |
| | | Service | | | Investor B | | | Total | |
Administration Fees Waived | | $ | 18 | | | $ | 101 | | | $ | 119 | |
If during the Fund’s fiscal year the operating expenses of a share class, that at any time during the prior two fiscal years received a waiver or reimbursement from the Manager, are less than the expense limit for that share class, the Manager is entitled to be reimbursed by such share class up to the lesser of (a) the amount of fees waived or expenses reimbursed during those prior two fiscal years under the agreement and (b) the amount by which the expense limit for that share class exceeds the operating expenses of the share class for the current fiscal year, provided that: (1) the Fund has more than $50 million in assets for the fiscal year and (2) the Manager or an affiliate continues to serve as the Fund’s investment advisor or administrator. In the event the expense limit for a share class is changed subsequent to a fiscal year in which the Manager becomes entitled to reimbursement for fees waived or reimbursed, the amount available to reimburse the Manager shall be calculated by reference to the expense limit for that share class in effect at the time the Manager became entitled to receive such reimbursement, rather than the subsequently changed expense limit for that share class.
For the six months ended March 31, 2014, the Manager recouped waivers previously recorded of $43,094, $5,313, $70 and $192 for Fund Level, Institutional Shares, Service Shares and Investor B Shares, respectively.
On March 31, 2014, the Fund level and class specific waivers and/or reimbursements subject to possible future recoupment under the expense limitation agreement are as follows:
| | | | | | | | | | | | |
| | | Expires September 30, | |
| | | 2014 | | | 2015 | | | 2016 | |
Fund Level | | | — | | | $ | 3,009 | | | | — | |
Service | | $ | 1,056 | | | $ | 557 | | | $ | 18 | |
Investor B | | | — | | | $ | 158 | | | $ | 101 | |
For the six months ended March 31, 2014, affiliates earned underwriting discounts, direct commissions and dealer concessions on sales of the Fund’s Investor A Shares of $7,674.
For the six months ended March 31, 2014, affiliates received CDSCs as follows:
| | | | |
Investor A | | $ | 361 | |
Investor B | | $ | 2,538 | |
Investor C | | $ | 1,147 | |
| | | | | | |
| | | BLACKROCK MANAGED VOLATILITY PORTFOLIO | | MARCH 31, 2014 | | 39 |
| | |
| Notes to Financial Statements (continued) | | |
The U.S. Securities and Exchange Commission has issued an exemptive order which permits BIM, an affiliate of the Manager, to serve as securities lending agent for the Fund, subject to applicable conditions. As securities lending agent, BIM bears all operational costs directly related to securities lending. The Fund is responsible for expenses in connection with the investment of cash collateral received for securities on loan (the “collateral investment expenses”). The cash collateral is invested in a private investment company managed by the Manager or its affiliates. However, BIM has agreed to cap the collateral investment expenses of the private investment company to an annual rate of 0.04%. The investment advisor to the private investment company will not charge any advisory fees with respect to shares purchased by the Fund.
Securities lending income is equal to the total of income earned from the reinvestment of cash collateral, net of fees and other payments to and from borrowers of securities, and less the collateral investment expenses. The Fund retains a portion of securities lending income and remits a remaining portion to BIM as compensation for its services as securities lending agent. Pursuant to the securities lending agreement effective February 1, 2014, BIM may lend securities only when the difference between the borrower rebate rate and the risk free rate exceeds a certain level (such securities, the “specials only securities”).
Pursuant to a securities lending agreement effective February 1, 2014, the Fund retains 80% of securities lending income. In addition, commencing the business day following the date that the aggregate securities lending income earned across the Equity-Liquidity Complex in a calendar year exceeds the aggregate securities lending income earned across the Equity-Liquidity Complex through the lending of specials only securities in the calendar year 2013, the Fund, pursuant to the securities lending agreement, will retain for the remainder of the calendar year securities lending income in an amount equal to 85% of securities lending income. Prior to February 1, 2014, the Fund retained 65% of securities lending income and paid a fee to BIM equal to 35% of such income. The share of securities lending income earned by the Fund is shown as securities lending — affiliated – net in the Statement of Operations. For the six months ended March 31, 2014, the Fund paid BIM $1,051 for securities lending agent services.
The Fund recorded payments from an affiliate to compensate for foregone securities lending revenue, which is shown as other income — affiliated in the Statement of Operations.
Certain officers and/or trustees of the Trust are officers and/or directors of BlackRock or its affiliates. The Fund reimburses the Manager for a portion of the compensation paid to the Trust’s Chief Compliance Officer, which is included in officer and trustees in the Statement of Operations.
The Fund may purchase securities from, or sell securities to, an affiliated fund provided the affiliation is due solely due to having a common investment adviser, common officers, or common trustees. Sales transactions for the Fund with an affiliated fund in compliance with Rule 17a-7 under the 1940 Act for the six months ended March 31, 2014, were $103,819.
6. Purchases and Sales:
Purchases and sales of investments, including paydowns, TBA transactions and excluding short-term securities, for the six months ended March 31, 2014, were $393,197,566 and $428,989,314, respectively.
Transactions in options written for the six months ended March 31, 2014, were as follows:
| | | | | | | | | | | | | | | | |
| | | Calls | | | Puts | |
| | | Contracts | | | Premiums
Received | | | Contracts | | | Premiums
Received | |
| | | | | | | | |
Outstanding options, beginning of period | | | 29 | | | $ | 29,347 | | | | 29 | | | $ | 37,143 | |
Options written | | | 479 | | | | 421,324 | | | | 479 | | | | 384,727 | |
Options closed | | | (411 | ) | | | (375,119 | ) | | | (411 | ) | | | (345,187 | ) |
| | | | | | | | |
Outstanding options, end of period | | | 97 | | | $ | 75,552 | | | | 97 | | | $ | 76,683 | |
| | | | | | | | |
7. Income Tax Information:
As of March 31, 2014, gross unrealized appreciation and depreciation based on cost for federal income tax purposes were as follows:
| | | | |
Tax cost | | $ | 671,501,774 | |
| | | | |
Gross unrealized appreciation | | $ | 36,134,291 | |
Gross unrealized depreciation | | | (9,482,650 | ) |
| | | | |
Net unrealized appreciation | | $ | 26,651,641 | |
| | | | |
8. Borrowings:
The Trust, on behalf of the Fund, along with certain other funds managed by the Manager and its affiliates (“Participating Funds”), is a party to a 364-day, $800 million credit agreement with a group of lenders, under which the Fund may borrow to fund shareholder redemptions. The agreement expires in April 2014. Excluding commitments designated for a certain individual fund, other Participating Funds, including the Fund, can borrow up to an aggregate commitment amount of $500 million, subject to asset coverage and other limitations as specified in the agreement. The credit agreement has the following terms: a fee of 0.065% per annum on unused commitment amounts and interest at a rate equal to the higher of (a) the one-month LIBOR plus 0.80% per annum or (b) the Fed Funds rate plus 0.80% per annum on amounts borrowed. Participating Funds paid administration and arrangement fees which, along with commitment fees, were allocated among such funds based upon portions of the aggregate commitment available to them and relative net assets of Participating Funds. The Fund did not borrow under the credit agreement during the six months ended March 31, 2014.
9. Concentration, Market and Credit Risk:
In the normal course of business, the Fund invests in securities and enters into transactions where risks exist due to fluctuations in the market (market risk) or failure of the issuer of a security to meet all its obligations (issuer credit risk). The value of securities held by the Fund may decline in response to certain events, including those directly involving the issuers whose securities are owned by the Fund; conditions affecting the general economy; overall market changes; local, regional or global
| | | | | | |
| 40 | | BLACKROCK MANAGED VOLATILITY PORTFOLIO | | MARCH 31, 2014 | | |
| | |
| Notes to Financial Statements (continued) | | |
political, social or economic instability; and currency and interest rate and price fluctuations. Similar to issuer credit risk, the Fund may be exposed to counterparty credit risk, or the risk that an entity with which the Fund has unsettled or open transactions may fail to or be unable to perform on its commitments. The Fund manages counterparty credit risk by entering into transactions only with counterparties that it believes have the financial resources to honor their obligations and by monitoring
the financial stability of those counterparties. Financial assets, which potentially expose the Fund to market, issuer and counterparty credit risks, consist principally of financial instruments and receivables due from counterparties. The extent of the Fund’s exposure to market, issuer and counterparty credit risks with respect to these financial assets is generally approximated by their value recorded in the Statement of Assets and Liabilities, less any collateral held by the Fund.
10. Capital Share Transactions:
Transactions in capital shares for each class were as follows:
| | | | | | | | | | | | | | | | | | |
| | | Six Months Ended
March 31, 2014 | | | | | Year Ended
September 30, 2013 | |
| | | Shares | | | Amount | | | | | Shares | | | Amount | |
Institutional | | | | | | | | | | | | | | | | | | |
Shares sold | | | 8,063,588 | | | $ | 129,856,113 | | | | | | 5,399,210 | | | $ | 85,173,661 | |
Shares issued in reinvestment of dividends | | | 1,321,435 | | | | 20,101,427 | | | | | | 191,428 | | | | 2,878,727 | |
Shares redeemed | | | (2,132,426 | ) | | | (33,256,826 | ) | | | | | (1,155,843 | ) | | | (17,865,866 | ) |
| | | | | | | | | | |
Net increase | | | 7,252,597 | | | $ | 116,700,714 | | | | | | 4,434,795 | | | $ | 70,186,522 | |
| | | | | | | | | | |
| | | | | | | | | | | | | | | | | | |
Service | | | | | | | | | | | | | | | | | | |
Shares sold | | | 2,585 | | | $ | 41,921 | | | | | | 3,454 | | | $ | 52,993 | |
Shares issued in reinvestment of dividends | | | 10,119 | | | | 153,456 | | | | | | 5,836 | | | | 87,401 | |
Shares redeemed | | | (10,976 | ) | | | (174,222 | ) | | | | | (22,814 | ) | | | (351,502 | ) |
| | | | | | | | | | |
Net increase (decrease) | | | 1,728 | | | $ | 21,155 | | | | | | (13,524 | ) | | $ | (211,108 | ) |
| | | | | | | | | | |
| | | | | | | | | | | | | | | | | | |
Investor A | | | | | | | | | | | | | | | | | | |
Shares sold and automatic conversion of shares | | | 492,180 | | | $ | 7,692,720 | | | | | | 1,134,995 | | | $ | 17,477,082 | |
Shares issued in reinvestment of dividends | | | 2,177,839 | | | | 33,005,202 | | | | | | 1,224,911 | | | | 18,341,023 | |
Shares redeemed | | | (2,219,806 | ) | | | (34,631,542 | ) | | | | | (4,276,680 | ) | | | (65,889,375 | ) |
| | | | | | | | | | |
Net increase (decrease) | | | 450,213 | | | $ | 6,066,380 | | | | | | (1,916,774 | ) | | $ | (30,071,270 | ) |
| | | | | | | | | | |
| | | | | | | | | | | | | | | | | | |
Investor B | | | | | | | | | | | | | | | | | | |
Shares sold | | | 4,329 | | | $ | 66,775 | | | | | | 11,692 | | | $ | 178,376 | |
Shares issued in reinvestment of dividends | | | 65,575 | | | | 980,348 | | | | | | 45,316 | | | | 669,151 | |
Shares redeemed and automatic conversion of shares | | | (222,681 | ) | | | (3,438,518 | ) | | | | | (509,365 | ) | | | (7,763,294 | ) |
| | | | | | | | | | |
Net decrease | | | (152,777 | ) | | $ | (2,391,395 | ) | | | | | (452,357 | ) | | $ | (6,915,767 | ) |
| | | | | | | | | | |
| | | | | | | | | | | | | | | | | | |
Investor C | | | | | | | | | | | | | | | | | | |
Shares sold | | | 145,021 | | | $ | 2,196,849 | | | | | | 357,660 | | | $ | 5,416,805 | |
Shares issued in reinvestment of dividends | | | 468,294 | | | | 6,958,846 | | | | | | 227,187 | | | | 3,333,431 | |
Shares redeemed | | | (504,912 | ) | | | (7,742,443 | ) | | | | | (1,127,929 | ) | | | (17,124,018 | ) |
| | | | | | | | | | |
Net increase (decrease) | | | 108,403 | | | $ | 1,413,252 | | | | | | (543,082 | ) | | $ | (8,373,782 | ) |
| | | | | | | | | | |
Total Net Increase | | | 7,660,164 | | | $ | 121,810,106 | | | | | | 1,509,058 | | | $ | 24,614,595 | |
| | | | | | | | | | |
| | | | | | |
| | | BLACKROCK MANAGED VOLATILITY PORTFOLIO | | MARCH 31, 2014 | | 41 |
| | |
| Notes to Financial Statements (concluded) | | |
11. Subsequent Events:
Management’s evaluation of the impact of all subsequent events on the Fund’s financial statements was completed through the date the financial statements were issued and the following item was noted:
Effective April 24, 2014, the credit agreement was terminated and a new agreement was entered into. The Fund became a party to a 364-day,
$1.1 billion credit agreement, which expires in April 2015. Excluding commitments designated for a certain individual fund, the Fund can borrow up to an aggregate commitment amount of $650 million, subject to asset coverage and other limitations as specified in the agreement. The credit agreement has the following terms: a fee of 0.06% per annum on unused commitment amounts and interest at a rate equal to the higher of (a) the one-month LIBOR plus 0.80% per annum or (b) the Fed Funds rate plus 0.80% per annum on amounts borrowed.
| | | | | | |
| 42 | | BLACKROCK MANAGED VOLATILITY PORTFOLIO | | MARCH 31, 2014 | | |
Ronald W. Forbes, Co-Chairman of the Board and Trustee
Rodney D. Johnson, Co-Chairman of the Board and Trustee
Paul L. Audet, Trustee
David O. Beim, Trustee
Henry Gabbay, Trustee
Dr. Matina S. Horner, Trustee
Herbert I. London, Trustee
Ian A. MacKinnon, Trustee
Cynthia A. Montgomery, Trustee
Joseph P. Platt, Trustee
Robert C. Robb, Jr., Trustee
Toby Rosenblatt, Trustee
Kenneth L. Urish, Trustee
Frederick W. Winter, Trustee
John M. Perlowski, President and Chief Executive Officer
Richard Hoerner, CFA, Vice President
Brendan Kyne, Vice President
Neal Andrews, Chief Financial Officer
Jay Fife, Treasurer
Brian Kindelan, Chief Compliance Officer and Anti-Money Laundering Officer
Benjamin Archibald, Secretary
Investment Advisor and Co-Administrator
BlackRock Advisors, LLC
Wilmington, DE 19809
Sub-Advisors
BlackRock Financial Management, Inc.
New York, NY 10055
BlackRock International Limited
Edinburgh, EH3 8BL, United Kingdom
BlackRock Asset Management North Asia Limited
Hong Kong
BlackRock (Singapore) Limited
079912 Singapore
Accounting Agent, Co-Administrator and Transfer Agent
BNY Mellon Investment Servicing (US) Inc.
Wilmington, DE 19809
Custodian
The Bank of New York Mellon
New York, NY 10286
Distributor
BlackRock Investments, LLC
New York, NY 10022
Legal Counsel
Sidley Austin LLP
New York, NY 10019
Independent Registered Public Accounting Firm
Deloitte & Touche LLP
Philadelphia, PA 19103
Address of the Trust
100 Bellevue Parkway
Wilmington, DE 19809
| | | | | | |
| | | BLACKROCK MANAGED VOLATILITY PORTFOLIO | | MARCH 31, 2014 | | 43 |
Electronic Delivery
Electronic copies of most financial reports and prospectuses are available on the Fund’s websites or shareholders can sign up for e-mail notifications of quarterly statements, annual and semi-annual reports and prospectuses by enrolling in the Fund’s electronic delivery program.
To enroll:
Shareholders Who Hold Accounts with Investment Advisors, Banks or Brokerages:
Please contact your financial advisor. Please note that not all investment advisors, banks or brokerages may offer this service.
Shareholders Who Hold Accounts Directly With BlackRock:
| 1) | Access the BlackRock website at |
| | http://www.blackrock.com/ edelivery |
| 2) | Select “eDelivery” under the “More Information” section |
Householding
The Fund will mail only one copy of shareholder documents, including prospectuses, annual and semi-annual reports and proxy statements, to shareholders with multiple accounts at the same address. This practice is commonly called “householding” and is intended to reduce expenses and eliminate duplicate mailings of shareholder documents. Mailings of your shareholder documents may be householded indefinitely unless you instruct us otherwise. If you do not want the mailing of these documents to be combined with those for other members of your household, please call the Fund at (800) 441-7762.
Availability of Quarterly Schedule of Investments
The Fund files its complete schedule of portfolio holdings with the SEC for the first and third quarters of each fiscal year on Form N-Q. The Fund’s Forms N-Q are available on the SEC’s website at http:// www.sec.gov and may also be reviewed and copied at the SEC’s Public Reference Room in Washington, D.C. Information on how to access documents on the SEC’s website without charge may be obtained by calling (800) SEC-0330. The Fund’s Forms N-Q may also be obtained upon request and without charge by calling (800) 441-7762.
Availability of Proxy Voting Policies and Procedures
A description of the policies and procedures that the Fund uses to determine how to vote proxies relating to portfolio securities is available (1) without charge, upon request, by calling (800) 441-7762; (2) at http://www.blackrock.com; and (3) on the SEC’s website at http:// www.sec.gov.
Availability of Proxy Voting Record
Information about how the Fund voted proxies relating to securities held in the Fund’s portfolios during the most recent 12-month period ended June 30 is available upon request and without charge (1) at http:// www.blackrock.com or by calling (800) 441-7762 and (2) on the SEC’s website at http://www.sec.gov.
Account Information
Call us at (800) 441-7762 from 8:00 AM to 6:00 PM EST on any business day to get information about your account balances, recent transactions and share prices. You can also reach us on the Web at http:// www.blackrock.com/funds.
Automatic Investment Plans
Investor Class shareholders who want to invest regularly can arrange to have $50 or more automatically deducted from their checking or savings account and invested in any of the BlackRock funds.
Systematic Withdrawal Plans
Investor Class shareholders can establish a systematic withdrawal plan and receive periodic payments of $50 or more from their BlackRock funds, as long as their account balance is at least $10,000.
Retirement Plans
Shareholders may make investments in conjunction with Traditional, Rollover, Roth, Coverdell, Simple IRAs, SEP IRAs and 403(b) Plans.
| | | | | | |
| 44 | | BLACKROCK MANAGED VOLATILITY PORTFOLIO | | MARCH 31, 2014 | | |
| | |
| Additional Information (concluded) | | |
|
| BlackRock Privacy Principles |
BlackRock is committed to maintaining the privacy of its current and former fund investors and individual clients (collectively, “Clients”) and to safeguarding their non-public personal information. The following information is provided to help you understand what personal information BlackRock collects, how we protect that information and why in certain cases we share such information with select parties.
If you are located in a jurisdiction where specific laws, rules or regulations require BlackRock to provide you with additional or different privacy-related rights beyond what is set forth below, then BlackRock will comply with those specific laws, rules or regulations.
BlackRock obtains or verifies personal non-public information from and about you from different sources, including the following: (i) information we receive from you or, if applicable, your financial intermediary, on applications, forms or other documents; (ii) information about your transactions with us, our affiliates, or others; (iii) information we receive from a consumer reporting agency; and (iv) from visits to our websites.
BlackRock does not sell or disclose to non-affiliated third parties any non-public personal information about its Clients, except as permitted by law or as is necessary to respond to regulatory requests or to service Client accounts. These non-affiliated third parties are required to protect the confidentiality and security of this information and to use it only for its intended purpose.
We may share information with our affiliates to service your account or to provide you with information about other BlackRock products or services that may be of interest to you. In addition, BlackRock restricts access to non-public personal information about its Clients to those BlackRock employees with a legitimate business need for the information. BlackRock maintains physical, electronic and procedural safeguards that are designed to protect the non-public personal information of its Clients, including procedures relating to the proper storage and disposal of such information.
| | | | | | |
| | | BLACKROCK MANAGED VOLATILITY PORTFOLIO | | MARCH 31, 2014 | | 45 |
| | |
| A World-Class Mutual Fund Family | | |
BlackRock offers a diverse lineup of open-end mutual funds crossing all investment styles and managed by experts in equity, fixed income and tax-exempt investing.
| | | | |
| BlackRock ACWI ex-US Index Fund | | BlackRock Global Dividend Portfolio | | BlackRock Mid-Cap Value Opportunities Fund |
| BlackRock All-Cap Energy & Resources Portfolio | | BlackRock Global Long/Short Equity Fund | | BlackRock Natural Resources Trust |
| BlackRock Basic Value Fund | | BlackRock Global Opportunities Portfolio | | BlackRock Pacific Fund |
| BlackRock Capital Appreciation Fund | | BlackRock Global SmallCap Fund | | BlackRock Real Estate Securities Fund |
| BlackRock Commodity Strategies Fund | | BlackRock Health Sciences Opportunities Portfolio | | BlackRock Russell 1000® Index Fund |
| BlackRock Disciplined Small Cap Core Fund | | BlackRock International Fund | | BlackRock Science & Technology |
| BlackRock Emerging Markets Dividend Fund | | BlackRock International Index Fund | | Opportunities Portfolio |
| BlackRock Emerging Markets Fund | | BlackRock International Opportunities Portfolio | | BlackRock Small Cap Growth Equity Portfolio |
| BlackRock Emerging Markets Long/Short | | BlackRock Large Cap Core Fund | | BlackRock Small Cap Growth Fund II |
| Equity Fund | | BlackRock Large Cap Core Plus Fund | | BlackRock Small Cap Index Fund |
| BlackRock Energy & Resources Portfolio | | BlackRock Large Cap Growth Fund | | BlackRock S&P 500 Stock Fund |
| BlackRock Equity Dividend Fund | | BlackRock Large Cap Value Fund | | BlackRock U.S. Opportunities Portfolio |
| BlackRock EuroFund | | BlackRock Latin America Fund | | BlackRock Value Opportunities Fund |
| BlackRock Flexible Equity Fund | | BlackRock Long-Horizon Equity Fund | | |
| BlackRock Focus Growth Fund | | BlackRock Mid-Cap Growth Equity Portfolio | | |
|
| Taxable Fixed Income Funds |
| | | | |
| BlackRock Bond Index Fund | | BlackRock Emerging Markets Flexible Dynamic | | BlackRock Secured Credit Portfolio |
| BlackRock Core Bond Portfolio | | Bond Portfolio | | BlackRock Short Obligations Fund |
| BlackRock CoreAlpha Bond Fund | | BlackRock Floating Rate Income Portfolio | | BlackRock Short-Term Treasury Fund |
| BlackRock CoRI Funds | | BlackRock Global Long/Short Credit Fund | | BlackRock Strategic Income |
2015 | | BlackRock GNMA Portfolio | | Opportunities Portfolio |
2017 | | BlackRock High Yield Bond Portfolio | | BlackRock Total Return Fund |
2019 | | BlackRock Inflation Protected Bond Portfolio | | BlackRock U.S. Government Bond Portfolio |
2021 | | BlackRock Investment Grade Bond Portfolio | | BlackRock U.S. Mortgage Portfolio |
2023 | | BlackRock Low Duration Bond Portfolio | | BlackRock Ultra-Short Obligations Fund |
| | | | BlackRock World Income Fund |
|
| Municipal Fixed Income Funds |
| | | | |
| BlackRock California Municipal Bond Fund | | BlackRock New Jersey Municipal Bond Fund | | BlackRock Short-Term Municipal Fund |
| BlackRock High Yield Municipal Fund | | BlackRock New York Municipal Bond Fund | | BlackRock Strategic Municipal |
| BlackRock National Municipal Fund | | BlackRock Pennsylvania Municipal Bond Fund | | Opportunities Fund |
| | | | | | | | | | | | | | |
| BlackRock Balanced Capital Fund | | LifePath Active Portfolios | | LifePath Index Portfolios |
| BlackRock Emerging Market Allocation Portfolio | | 2015 | | | 2040 | | | | | Retirement | | 2040 | | |
| BlackRock Global Allocation Fund | | 2020 | | | 2045 | | | | | 2020 | | 2045 | | |
| BlackRock Managed Volatility Portfolio | | 2025 | | | 2050 | | | | | 2025 | | 2050 | | |
| BlackRock Multi-Asset Income Portfolio | | 2030 | | | 2055 | | | | | 2030 | | 2055 | | |
| BlackRock Multi-Asset Real Return Fund | | 2035 | | | | | | | | 2035 | | | | |
| BlackRock Strategic Risk Allocation Fund | | | | | | | | | | | | | | |
| | | | | | |
| BlackRock Prepared Portfolios | | LifePath Portfolios | | | | | | | | | | | | |
Conservative Prepared Portfolio | | Retirement | | | 2040 | | | | | | | | | |
Moderate Prepared Portfolio | | 2020 | | | 2045 | | | | | | | | | |
Growth Prepared Portfolio | | 2025 | | | 2050 | | | | | | | | | |
Aggressive Growth Prepared Portfolio | | 2030 | | | 2055 | | | | | | | | | |
| | 2035 | | | | | | | | | | | | |
BlackRock mutual funds are currently distributed by BlackRock Investments, LLC. You should consider the investment objectives, risks, charges and expenses of the funds under consideration carefully before investing. Each fund’s prospectus contains this and other information and is available at www.blackrock.com or by calling (800) 441-7762 or from your financial advisor. The prospectus should be read carefully before investing.
| | | | | | |
| 46 | | BLACKROCK MANAGED VOLATILITY PORTFOLIO | | MARCH 31, 2014 | | |
| | |
This report is transmitted to shareholders only. It is not authorized for use as an offer of sale or a solicitation of an offer to buy shares of the Fund unless accompanied or preceded by the Fund’s current prospectus. Past performance results shown in this report should not be considered a representation of future performance. Investment returns and principal value of shares will fluctuate so that shares, when redeemed, may be worth more or less than their original cost. Statements and other information herein are as dated and are subject to change. Investment in foreign securities involves special risks including fluctuating foreign exchange rates, foreign government regulations, differing degrees of liquidity and the possibility of substantial volatility due to adverse political, economic or other developments. | |  |
| | |
| MV-3/14-SAR | |  |
| | |
| |
| Item 2 – | | Code of Ethics – Not Applicable to this semi-annual report |
| |
| Item 3 – | | Audit Committee Financial Expert – Not Applicable to this semi-annual report |
| |
| Item 4 – | | Principal Accountant Fees and Services – Not Applicable to this semi-annual report |
| |
| Item 5 – | | Audit Committee of Listed Registrants – Not Applicable |
| |
| Item 6 – | | Investments |
| | (a) The registrant’s Schedule of Investments is included as part of the Report to Stockholders filed under Item 1 of this Form. |
| | (b) Not Applicable due to no such divestments during the semi-annual period covered since the previous Form N-CSR filing. |
| |
| Item 7 – | | Disclosure of Proxy Voting Policies and Procedures for Closed-End Management Investment Companies – Not Applicable |
| |
| Item 8 – | | Portfolio Managers of Closed-End Management Investment Companies – Not Applicable |
| |
| Item 9 – | | Purchases of Equity Securities by Closed-End Management Investment Company and Affiliated Purchasers – Not Applicable |
| |
| Item 10 – | | Submission of Matters to a Vote of Security Holders – There have been no material changes to these procedures. |
| |
| Item 11 – | | Controls and Procedures |
| |
| | (a) – The registrant’s principal executive and principal financial officers, or persons performing similar functions, have concluded that the registrant’s disclosure controls and procedures (as defined in Rule 30a-3(c) under the Investment Company Act of 1940, as amended (the “1940 Act”)) are effective as of a date within 90 days of the filing of this report based on the evaluation of these controls and procedures required by Rule 30a-3(b) under the 1940 Act and Rule 15d-15(b) under the Securities Exchange Act of 1934, as amended. |
| |
| | (b) – There were no changes in the registrant’s internal control over financial reporting (as defined in Rule 30a-3(d) under the 1940 Act) that occurred during the second fiscal quarter of the period covered by this report that have materially affected, or are reasonably likely to materially affect, the registrant’s internal control over financial reporting. |
| |
| Item 12 – | | Exhibits attached hereto |
| |
| | (a)(1) – Code of Ethics – Not Applicable to this semi-annual report |
| |
| | (a)(2) – Certifications – Attached hereto |
| |
| | (a)(3) – Not Applicable |
| |
| | (b) – Certifications – Attached hereto |
2
Pursuant to the requirements of the Securities Exchange Act of 1934 and the Investment Company Act of 1940, the registrant has duly caused this report to be signed on its behalf by the undersigned, thereunto duly authorized.
| | |
| BlackRock Funds |
| |
| By: | | /s/ John M. Perlowski |
| | John M. Perlowski |
| | Chief Executive Officer (principal executive officer) of |
| | BlackRock Funds |
|
| Date: June 2, 2014 |
Pursuant to the requirements of the Securities Exchange Act of 1934 and the Investment Company Act of 1940, this report has been signed below by the following persons on behalf of the registrant and in the capacities and on the dates indicated.
| | |
| By: | | /s/ John M. Perlowski |
| | John M. Perlowski |
| | Chief Executive Officer (principal executive officer) of |
| | BlackRock Funds |
|
| Date: June 2, 2014 |
| |
| By: | | /s/ Neal J. Andrews |
| | Neal J. Andrews |
| | Chief Financial Officer (principal financial officer) of |
| | BlackRock Funds |
|
| Date: June 2, 2014 |
3