UNITED STATES
SECURITIES AND EXCHANGE COMMISSION
Washington, D.C. 20549
FORM N-CSR
CERTIFIED SHAREHOLDER REPORT OF REGISTERED MANAGEMENT INVESTMENT
COMPANIES
Investment Company Act file number: 811-05742
Name of Fund: BlackRock Funds
BlackRock Disciplined Small Cap Core Fund
Fund Address: 100 Bellevue Parkway, Wilmington, DE 19809
Name and address of agent for service: John M. Perlowski, Chief Executive Officer, BlackRock Funds, 55 East 52nd Street, New York, NY 10055
Registrant’s telephone number, including area code: (800) 441-7762
Date of fiscal year end: 05/31/2015
Date of reporting period: 11/30/2014
Item 1 – Report to Stockholders
NOVEMBER 30, 2014
| | | | |
SEMI-ANNUAL REPORT (UNAUDITED) | | | | BLACKROCK® |
| | | | |
| | BlackRock Disciplined Small Cap Core Fund | | of BlackRock FundsSM |
| | | | |
| | BlackRock Small Cap Growth Fund II | | of BlackRock Series, Inc. |
| | |
| Not FDIC Insured ¡ May Lose Value ¡ No Bank Guarantee | | |
| | | | |
| | | |
| | |  | | Shareholders can sign up for e-mail notifications of quarterly statements, annual and semi-annual shareholder reports and prospectuses by enrolling in the electronic delivery program. Electronic copies of shareholder reports and prospectuses are also available on BlackRock’s website. TO ENROLL IN ELECTRONIC DELIVERY: Shareholders Who Hold Accounts with Investment Advisors, Banks or Brokerages: Please contact your financial advisor. Please note that not all investment advisors, banks or brokerages may offer this service. Shareholders Who Hold Accounts Directly with BlackRock: 1. Access the BlackRock website at blackrock.com 2. Select “Access Your Account” 3. Next, select “eDelivery” in the “Related Resources” box and follow the sign-up instructions |
| | | | | | |
| 2 | | SEMI-ANNUAL REPORT | | NOVEMBER 30, 2014 | | |
| | |
| What’s Happened in the Markets |
Dear Shareholder,
Financial markets generally had a strong first half of 2014 even as the U.S. Federal Reserve gradually reduced (or “tapered”) their asset purchase programs. The year got off to a rocky start, however, as a number of developing economies showed signs of stress and U.S. economic data weakened. Equities declined in January while bond markets found renewed strength from investors seeking relatively safer assets. Although these headwinds persisted, equities were back on the rise in February as investors were assuaged by increasing evidence that the soft patch in U.S. data had been temporary and weather-related, and forecasts pointed to growth picking up later in the year.
In the months that followed, interest rates trended lower and bond prices climbed higher in the modest growth environment. Financial markets exhibited a remarkably low level of volatility despite rising tensions in Russia and Ukraine and signs of decelerating growth in China. Investors focused on signs of improvement in the U.S. recovery, stronger corporate earnings, increased merger-and-acquisition activity and, perhaps most importantly, reassurance that the Fed had no imminent plans to increase short-term interest rates.
In the low-yield environment, more investors turned to equities, pushing major stock indices to record levels. However, investors eventually became wary of high valuations and began shedding stocks that had experienced significant price appreciation in 2013. A broad rotation into cheaper valuations resulted in the strongest performers of 2013 struggling most in 2014, and vice versa. Especially hard hit were U.S. small cap and European stocks, where earnings growth had not kept pace with their rising market prices. In contrast, emerging markets benefited from the trend after having suffered heavy selling pressure earlier in the year.
Volatility ticked up in the middle of the summer as geopolitical tensions escalated and investors feared that better U.S. economic indicators may compel the Fed to increase short-term interest rates sooner than previously anticipated. Global credit markets tightened as the U.S. dollar strengthened, ultimately putting a strain on investor flows. Most asset classes declined in the third quarter, particularly the riskier and higher valued segments such as U.S. small cap and international stocks. In fixed income markets, high yield bonds struggled. U.S. large cap stocks and municipal bonds held their ground as investors were drawn to these more stable segments.
In the final two months of the period, U.S. markets outperformed other parts of the world, driven largely by stronger economic growth versus other developed countries, most notably in Europe. The divergence of central bank policy came into focus as the European Central Bank and the Bank of Japan took aggressive measures to stimulate growth while the Fed moved toward tighter policy. U.S. equities benefited from the foreign central bank flows, while lower rates in Europe and Japan helped support demand for higher quality long-term U.S. bonds offering relatively attractive yields.
At BlackRock, we believe investors need to think globally, extend their scope across a broad array of asset classes and be prepared to move freely as market conditions change over time. We encourage you to talk with your financial advisor and visit blackrock.com for further insight about investing in today’s markets.
Sincerely,

Rob Kapito
President, BlackRock Advisors, LLC

Rob Kapito
President, BlackRock Advisors, LLC
| | | | | | | | |
| Total Returns as of November 30, 2014 | |
| | | 6-month | | | 12-month | |
U.S. large cap equities
(S&P 500® Index) | | | 8.58 | % | | | 16.86 | % |
U.S. small cap equities
(Russell 2000® Index) | | | 4.09 | | | | 3.99 | |
International equities
(MSCI Europe, Australasia, Far East Index) | | | (5.07 | ) | | | (0.02 | ) |
Emerging market equities
(MSCI Emerging Markets Index) | | | (0.82 | ) | | | 1.06 | |
3-month Treasury bill
(BofA Merrill Lynch
3-Month U.S. Treasury
Bill Index) | | | 0.02 | | | | 0.05 | |
U.S. Treasury securities
(BofA Merrill Lynch
10-Year U.S. Treasury Index) | | | 3.61 | | | | 8.09 | |
U.S. investment grade
bonds (Barclays U.S.
Aggregate Bond Index) | | | 1.92 | | | | 5.27 | |
Tax-exempt municipal
bonds (S&P Municipal Bond Index) | | | 2.35 | | | | 8.34 | |
U.S. high yield bonds
(Barclays U.S. Corporate
High Yield 2% Issuer
Capped Index) | | | (0.59 | ) | | | 4.52 | |
|
| Past performance is no guarantee of future results. Index performance is shown for illustrative purposes only. You cannot invest directly in an index. | |
| | | | | | |
| | | THIS PAGE NOT PART OF YOUR FUND REPORT | | | | 3 |
| | | | |
| Fund Summary as of November 30, 2014 | | | BlackRock Disciplined Small Cap Core Fund | |
BlackRock Disciplined Small Cap Core Fund’s (the “Fund”) investment objective is to seek capital appreciation over the long term.
|
| Portfolio Management Commentary |
How did the Fund perform?
| Ÿ | | For the six-month period ended November 30, 2014, the Fund underperformed its benchmark, the Russell 2000® Index. |
What factors influenced performance?
| Ÿ | | The Fund’s underperformance was attributable mostly to stock selection within the industrials and energy sectors. Holdings of companies with significant revenues from oil & gas production declined due to the drop in oil prices based on a weakening global growth outlook, cuts in oil demand forecasts, steadfast overseas oil production and continued domestic production from both shale and offshore drilling. Within energy, an exploration & production company BPZ Resources, Inc. was impacted by falling oil prices and a failure to meet third-quarter earnings estimates. Within industrials, a position in MRC Global, Inc., a supplier of pipe, valves and fittings to domestic exploration & production companies, depreciated as the decline in oil prices overshadowed better-than-expected second- and third-quarter earnings. |
| Ÿ | | Stock selection within the consumer discretionary and consumer staples sectors contributed the most to performance. Within consumer discretionary, a position in footwear retailer Skechers U.S.A., Inc. rose after the company beat second-quarter earnings and revenue estimates. The |
company also provided a positive outlook, citing continued product strength in its domestic and international markets. In addition, a position in bagel shop chain Einstein Noah Restaurant Group, Inc. rose after the company agreed to be purchased at a premium by JAB Beech, Inc., the owner of Peet’s Coffee & Tea, Inc. Within consumer staples, a position in poultry producer Pilgrim’s Pride Corp. appreciated over the period given better-than-expected second- and third-quarter earnings and revenues resulting from continued strong demand for poultry, as well as healthy consolidation among U.S. food producers.
Describe recent portfolio activity.
| Ÿ | | During the six-month period, the Fund increased its overall weightings in the consumer discretionary and information technology (“IT”) sectors and decreased its overall weightings in the energy and industrials sectors. |
Describe portfolio positioning at period end.
| Ÿ | | Relative to the Russell 2000® Index, the Fund ended the period with its largest sector overweight in IT and its most significant underweight in consumer staples. |
The views expressed reflect the opinions of BlackRock as of the date of this report and are subject to change based on changes in market, economic or other conditions. These views are not intended to be a forecast of future events and are no guarantee of future results.
| | | | |
| Ten Largest Holdings | | Percent of
Long-Term Investments | |
DuPont Fabros Technology, Inc. | | | 2 | % |
Manhattan Associates, Inc. | | | 2 | |
Prosperity Bancshares, Inc. | | | 2 | |
Team Health Holdings, Inc. | | | 2 | |
Benchmark Electronics, Inc. | | | 2 | |
Brinker International, Inc. | | | 2 | |
Health Net, Inc. | | | 2 | |
Texas Capital Bancshares, Inc. | | | 2 | |
Skechers U.S.A., Inc., Class A | | | 2 | |
Boise Cascade Co. | | | 2 | |
| | | | |
| Sector Allocation | | Percent of Long-Term Investments | |
Financials | | | 23 | % |
Information Technology | | | 20 | |
Consumer Discretionary | | | 15 | |
Health Care | | | 14 | |
Industrials | | | 14 | |
Materials | | | 4 | |
Energy | | | 4 | |
Telecommunication Services | | | 2 | |
Utilities | | | 2 | |
Consumer Staples | | | 2 | |
For Fund compliance purposes, the Fund’s sector classifications refer to any one or more of the sector sub-classifications used by one or more widely recognized market indexes or ratings group indexes, and/or as defined by the investment advisor. These definitions may not apply for purposes of this report, which may combine such sector sub-classifications for reporting ease.
| | | | | | |
| 4 | | SEMI-ANNUAL REPORT | | NOVEMBER 30, 2014 | | |
| | | | |
| | | | BlackRock Disciplined Small Cap Core Fund | |
|
| Total Return Based on a $10,000 Investment |
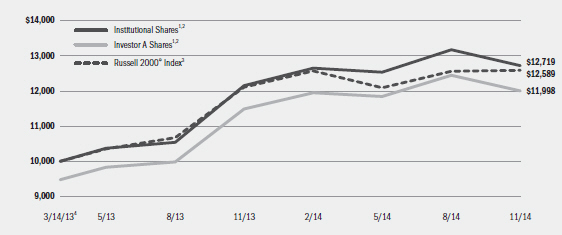
| | 1 | Assuming maximum sales charges, if any, transaction costs and other operating expenses, including investment advisory fees and administration fees, if any. Institutional Shares do not have a sales charge. |
| | 2 | Under normal circumstances, the Fund seeks to invest at least 80% of its net assets plus any borrowings for investment purposes in equity securities or other financial instruments that are components of, or have market capitalizations similar to, the securities included in the Russell 2000® Index. |
| | 3 | An index that measures the performance of approximately 2,000 of the smallest companies in the Russell 3000® Index. |
| | 4 | Commencement of operations. |
| | | | | | | | | | | | | | | | | | | | |
| Performance Summary for the Period Ended November 30, 2014 | |
| | | | | | Average Annual Total Returns5 | |
| | | | | | 1 Year | | | Since Inception6 | |
| | | 6-Month
Total Returns | | | w/o sales
charge | | | w/ sales
charge | | | w/o sales
charge | | | w/ sales
charge | |
Institutional | | | 1.49 | % | | | 4.68 | % | | | N/A | | | | 15.05 | % | | | N/A | |
Investor A | | | 1.34 | | | | 4.48 | | | | (1.01 | )% | | | 14.76 | | | | 11.21 | % |
Investor C | | | 1.09 | | | | 3.70 | | | | 2.79 | | | | 13.93 | | | | 13.93 | |
Russell 2000® Index | | | 4.09 | | | | 3.99 | | | | N/A | | | | 14.40 | | | | N/A | |
| | 5 | | Assuming maximum sales charges, if any. Average annual total returns with and without sales charges reflect reductions for distribution and service fees. See “About Fund Performance” on page 8 for a detailed description of share classes, including any related sales charges and fees. |
| | 6 | | The Fund commenced operations on March 14, 2013. |
| | | | N/A—Not applicable as share class and index do not have a sales charge. |
| | | | Past performance is not indicative of future results. |
| | | | | | | | | | | | | | | | | | | | | | | | | | | | |
| Expense Example | |
| | | Actual | | | Hypothetical8 | | | | |
| | | Beginning
Account Value
June 1, 2014 | | | Ending
Account Value
November 30, 2014 | | | Expenses Paid
During the Period7 | | | Beginning
Account Value
June 1, 2014 | | | Ending
Account Value
November 30, 2014 | | | Expenses Paid
During the Period7 | | | Annualized
Expense Ratio | |
Institutional | | | $1,000.00 | | | | $1,014.90 | | | | $3.59 | | | | $1,000.00 | | | | $1,021.51 | | | | $3.60 | | | | 0.71 | % |
Investor A | | | $1,000.00 | | | | $1,013.40 | | | | $4.85 | | | | $1,000.00 | | | | $1,020.26 | | | | $4.86 | | | | 0.96 | % |
Investor C | | | $1,000.00 | | | | $1,010.90 | | | | $8.62 | | | | $1,000.00 | | | | $1,016.50 | | | | $8.64 | | | | 1.71 | % |
| | 7 | | For each class of the Fund, expenses are equal to the annualized expense ratio for the class, multiplied by the average account value over the period, multiplied by 183/ 365 (to reflect the one-half year period shown). |
| | 8 | | Hypothetical 5% annual return before expenses is calculated by prorating the number of days in the most recent half year divided by 365. |
| | | | See “Disclosure of Expenses” on page 8 for further information on how expenses were calculated. |
| | | | | | |
| | | SEMI-ANNUAL REPORT | | NOVEMBER 30, 2014 | | 5 |
| | | | |
| Fund Summary as of November 30, 2014 | | | BlackRock Small Cap Growth Fund II | |
BlackRock Small Cap Growth Fund II’s (the “Fund”) investment objective is to seek long-term capital growth. In other words, the Fund tries to choose investments that will increase in value. Current income from dividends and interest will not be an important consideration in selecting portfolio securities.
|
| Portfolio Management Commentary |
How did the Fund perform?
| Ÿ | | For the six-month period ended November 30, 2014, through its investment in BlackRock Master Small Cap Growth Portfolio (the “Master Portfolio”), the Fund underperformed its benchmark, the Russell 2000® Growth Index. |
What factors influenced performance?
| Ÿ | | The underperformance of the Master Portfolio was attributable mostly to stock selection within the energy and health care sectors. Within energy, a position in oil and natural gas exploration & production company Bonanza Creek Energy, Inc. was the largest detractor from performance. Shares of the company fell considerably over the period due to disappointing second- and third-quarter earnings, as well as the drop in oil prices caused by a weakening global growth outlook, cuts in oil demand forecasts and steady oil production. A position in oil & gas equipment & services company Basic Energy Services, Inc. was also affected by falling crude oil prices, as well as lower-than-expected third-quarter earnings. Within health care, a position in heart implant manufacturer Thoratec Corp. fell sharply after the company failed to meet second-quarter revenue estimates and provided disappointing fiscal year 2014 earnings and revenue guidance. The company has seen a notable drop in market share, accompanied by broader weakness across its peer group due to product delays and weak growth in implant demand. |
| Ÿ | | Stock selection within the information technology (“IT”) and consumer discretionary sectors contributed the most to performance. Within IT, a position in touch-screen technology provider Synaptics, Inc. rose sharply on news that it would acquire Japan-based display chipmaker Renesas SP Driver, thereby combining products in high demand from leading phone and tablet manufacturers. A position in web-based real estate company Move, Inc. appreciated considerably after the company agreed to be acquired by media giant News Corp. at a premium. Within consumer discretionary, a position in footwear retailer Skechers U.S.A., Inc. rose after the company beat second-quarter earnings and revenue estimates and provided a positive outlook, citing continued product strength in its domestic and international markets. |
Describe recent portfolio activity.
| Ÿ | | During the six-month period, the Master Portfolio increased its overall weightings in the IT and health care sectors and decreased its overall weightings in the energy and industrials sectors. |
Describe portfolio positioning at period end.
| Ÿ | | Relative to the Russell 2000® Growth Index, the Master Portfolio ended the period with its largest sector overweight in IT and its most significant underweight in consumer discretionary. |
The views expressed reflect the opinions of BlackRock as of the date of this report and are subject to change based on changes in market, economic or other conditions. These views are not intended to be a forecast of future events and are no guarantee of future results.
| | | | | | |
| 6 | | SEMI-ANNUAL REPORT | | NOVEMBER 30, 2014 | | |
| | | | |
| | | | BlackRock Small Cap Growth Fund II | |
|
| Total Return Based on a $10,000 Investment |
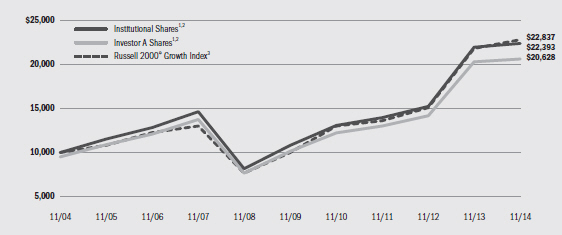
| | 1 | Assuming maximum sales charges, if any, transaction costs and other operating expenses, including administration fees, if any. Institutional Shares do not have a sales charge. |
| | 2 | The Fund invests all of its assets in the Master Portfolio. The Master Portfolio will, under normal circumstances, invest at least 80% of its net assets (plus any borrowings for investment purposes) in equity securities of small cap companies and at least 80% of its net assets (plus any borrowings for investment purposes) in securities or instruments of issuers located in the United States. |
| | 3 | The unmanaged Russell 2000® Growth Index measures performance of the small-cap growth segment of the U.S. equity universe. It includes those Russell 2000® Index companies with higher price-to-value ratios and higher forecasted growth values. |
| | | | | | | | | | | | | | | | | | | | | | | | | | | | |
| Performance Summary for the Period Ended November 30, 2014 | | | | | |
| | | | | | Average Annual Total Returns4 | |
| | | | | | 1 Year | | | 5 Years | | | 10 Years | |
| | | 6-Month
Total Returns | | | w/o sales
charge | | | w/ sales
charge | | | w/o sales
charge | | | w/ sales
charge | | | w/o sales
charge | | | w/ sales
charge | |
Institutional | | | 2.52 | % | | | 1.95 | % | | | N/A | | | | 15.69 | % | | | N/A | | | | 8.40 | % | | | N/A | |
Investor A | | | 2.46 | | | | 1.60 | | | | (3.74 | )% | | | 15.32 | | | | 14.09 | % | | | 8.09 | | | | 7.51 | % |
Investor B | | | 1.70 | | | | 0.65 | | | | (2.97 | ) | | | 14.09 | | | | 13.85 | | | | 7.18 | | | | 7.18 | |
Investor C | | | 1.97 | | | | 0.79 | | | | (0.01 | ) | | | 14.29 | | | | 14.29 | | | | 7.11 | | | | 7.11 | |
Class R | | | 2.19 | | | | 1.35 | | | | N/A | | | | 14.97 | | | | N/A | | | | 7.73 | | | | N/A | |
Russell 2000® Growth Index | | | 6.56 | | | | 4.66 | | | | N/A | | | | 18.04 | | | | N/A | | | | 8.61 | | | | N/A | |
| | 4 | | Assuming maximum sales charges, if any. Average annual total returns with and without sales charges reflect reductions for distribution and service fees. See “About Fund Performance” on page 8 for a detailed description of share classes, including any related sales charges and fees. |
| | | | N/A—Not applicable as share class and index do not have a sales charge. |
| | | | Past performance is not indicative of future results. |
| | | | | | | | | | | | | | |
| Expense Example |
| | | Actual | | Hypothetical6 | | |
| | | Beginning
Account Value
June 1, 2014 | | Ending
Account Value
November 30, 2014 | | Expenses Paid
During the Period5 | | Beginning Account Value
June 1, 2014 | | Ending
Account Value
November 30, 2014 | | Expenses Paid
During the Period5 | | Annualized
Expense Ratio |
Institutional | | $1,000.00 | | $1,025.20 | | $5.74 | | $1,000.00 | | $1,019.40 | | $5.72 | | 1.13% |
Investor A | | $1,000.00 | | $1,024.60 | | $7.00 | | $1,000.00 | | $1,018.15 | | $6.98 | | 1.38% |
Investor B | | $1,000.00 | | $1,017.00 | | $12.74 | | $1,000.00 | | $1,012.43 | | $12.71 | | 2.52% |
Investor C | | $1,000.00 | | $1,019.70 | | $11.59 | | $1,000.00 | | $1,013.59 | | $11.56 | | 2.29% |
Class R | | $1,000.00 | | $1,021.90 | | $8.77 | | $1,000.00 | | $1,016.39 | | $8.74 | | 1.73% |
| | 5 | | For each class of the Fund, expenses are equal to the annualized expense ratio for the class, multiplied by the average account value over the period, multiplied by 183/ 365 (to reflect the one-half year period shown). Because the Fund invests all of its assets in the Master Portfolio, the expense table reflects the net expenses of both the Fund and the Master Portfolio in which it invests. |
| | 6 | | Hypothetical 5% annual return before expenses is calculated by prorating the number of days in the most recent fiscal half year divided by 365. |
| | | | See “Disclosure of Expenses” on page 8 for further information on how expenses were calculated. |
| | | | | | |
| | | SEMI-ANNUAL REPORT | | NOVEMBER 30, 2014 | | 7 |
| Ÿ | | Institutional Shares are not subject to any sales charge. These shares bear no ongoing distribution or service fees and are available only to certain eligible investors. |
| Ÿ | | Investor A Shares are subject to a maximum initial sales charge (front-end load) of 5.25% and a service fee of 0.25% per year (but no distribution fee). Certain redemptions of these shares may be subject to a contingent deferred sales charge (“CDSC”) where no initial sales charge was paid at the time of purchase. These shares are generally available through financial intermediaries. |
| Ÿ | | Investor B Shares (available only in BlackRock Small Cap Growth Fund II) are subject to a maximum CDSC of 4.50% declining to 0% after six years. In addition, these shares are subject to a distribution fee of 0.75% per year and a service fee of 0.25% per year. These shares automatically convert to Investor A Shares after approximately eight years. (There is no initial sales charge for automatic share conversions.) All returns for periods greater than eight years reflect this conversion. These shares are only available through exchanges and distribution reinvestments by current holders and for purchase by certain employer-sponsored retirement plans. |
| Ÿ | | Investor C Shares are subject to a 1.00% CDSC if redeemed within one year of purchase. In addition, these shares are subject to a distribution fee of 0.75% per year and a service fee of 0.25% per year. These shares are generally available through financial intermediaries. |
| Ÿ | | Class R Shares (available only in BlackRock Small Cap Growth Fund II) are not subject to any sales charge (front-end load) or deferred sales |
charge. These shares are subject to a distribution fee of 0.25% per year and a service fee of 0.25% per year. These shares are available only to certain employer-sponsored retirement plans.
Performance information reflects past performance and does not guarantee future results. Current performance may be lower or higher than the performance data quoted. Refer to www.blackrock.com/funds to obtain performance data current to the most recent month end. Performance results do not reflect the deduction of taxes that a shareholder would pay on fund distributions or the redemption of fund shares. Figures shown in each of the performance tables on the previous pages assume reinvestment of all distributions, if any, at net asset value (“NAV”) on the ex-dividend date. Investment return and principal value of shares will fluctuate so that shares, when redeemed, may be worth more or less than their original cost. Distributions paid to each class of shares will vary because of the different levels of service, distribution and transfer agency fees applicable to each class, which are deducted from the income available to be paid to shareholders.
BlackRock Advisors, LLC (the “Manager”), BlackRock Disciplined Small Cap Core Fund’s investment advisor, has contractually agreed to waive and/or reimburse a portion of the Fund’s expenses. Without such waiver and/or reimbursement, the Fund’s performance would have been lower. The Manager is under no obligation to continue waiving or reimbursing its fees after the applicable termination date of such agreement. See Note 5 of the Notes to Financial Statements for additional information on waivers and/or reimbursements.
Shareholders of the Funds may incur the following charges: (a) transactional expenses, such as sales charges and (b) operating expenses, including investment advisory fees, administration fees, service and distribution fees, including 12b-1 fees, acquired fund fees and expenses and other Fund expenses. The expense examples shown on the previous pages (which are based on a hypothetical investment of $1,000 invested on June 1, 2014 and held through November 30, 2014) are intended to assist shareholders both in calculating expenses based on an investment in each Fund and in comparing these expenses with similar costs of investing in other mutual funds.
The expense examples provide information about actual account values and actual expenses. In order to estimate the expenses a shareholder paid during the period covered by this report, shareholders can divide their account value by $1,000 and then multiply the result by the number corresponding to their Fund and share class under the headings entitled “Expenses Paid During the Period.”
The expense examples also provide information about hypothetical account values and hypothetical expenses based on a Fund’s actual expense ratio and an assumed rate of return of 5% per year before expenses. In order to assist shareholders in comparing the ongoing expenses of investing in these Funds and other funds, compare the 5% hypothetical example with the 5% hypothetical examples that appear in shareholder reports on other funds.
The expenses shown in the expense examples are intended to highlight shareholders’ ongoing costs only and do not reflect any transactional expenses, such as sales charges, if any. Therefore, the hypothetical examples are useful in comparing ongoing expenses only, and will not help shareholders determine the relative total expenses of owning different funds. If these transactional expenses were included, shareholder expenses would have been higher.
|
| Derivative Financial Instruments |
BlackRock Disciplined Small Cap Core Fund and the Master Portfolio may invest in various derivative financial instruments. Derivative financial instruments are used to obtain exposure to a security, index and/or market without owning or taking physical custody of securities or to manage market and/or equity risks. Derivative financial instruments may give rise to a form of economic leverage. Derivative financial instruments also involve risks, including the imperfect correlation between the value of a derivative financial instrument and the underlying asset, possible default of the counterparty to the transaction or illiquidity of the derivative financial instrument. The Fund’s and Master Portfolio’s ability to use a derivative financial instrument successfully depends on the
investment advisor’s ability to predict pertinent market movements accurately, which cannot be assured. The use of derivative financial instruments may result in losses greater than if they had not been used, may require the Fund and Master Portfolio to sell or purchase portfolio investments at inopportune times or for distressed values, may limit the amount of appreciation the Fund and Master Portfolio can realize on an investment, may result in lower distributions paid to shareholders and/or may cause the Fund and Master Portfolio to hold an investment that it might otherwise sell. The Fund’s and Master Portfolio’s investments in these instruments are discussed in detail in the Fund’s and Master Portfolio’s Notes to Financial Statements.
| | | | | | |
| 8 | | SEMI-ANNUAL REPORT | | NOVEMBER 30, 2014 | | |
| | | | |
| Schedule of Investments November 30, 2014 (Unaudited) | | | BlackRock Disciplined Small Cap Core Fund | |
| | | (Percentages shown are based on Net Assets) | |
| | | | | | | | |
| Common Stocks | | Shares | | | Value | |
Aerospace & Defense — 0.8% | | | | | | | | |
API Technologies Corp. (a) | | | 862 | | | $ | 1,814 | |
Ducommun, Inc. (a) | | | 279 | | | | 6,947 | |
Taser International, Inc. (a) | | | 1,246 | | | | 26,764 | |
Vectrus, Inc. (a) | | | 829 | | | | 23,428 | |
| | | | | | | | |
| | | | | | | | 58,953 | |
Airlines — 1.0% | | | | | | | | |
American Airlines Group, Inc. | | | 609 | | | | 29,555 | |
JetBlue Airways Corp. (a) | | | 1,550 | | | | 22,677 | |
Virgin America, Inc. (a) | | | 532 | | | | 20,046 | |
| | | | | | | | |
| | | | | | | | 72,278 | |
Auto Components — 2.5% | | | | | | | | |
Lear Corp. | | | 190 | | | | 18,223 | |
Tenneco, Inc. (a) | | | 1,044 | | | | 56,741 | |
Tower International, Inc. (a) | | | 3,989 | | | | 101,839 | |
| | | | | | | | |
| | | | | | | | 176,803 | |
Banks — 6.0% | | | | | | | | |
Access National Corp. | | | 717 | | | | 12,533 | |
Banco Latinoamericano de Comercio Exterior SA (a) | | | 260 | | | | 8,369 | |
The Bank of Kentucky Financial Corp. | | | 26 | | | | 1,212 | |
Cascade Bancorp (a) | | | 614 | | | | 2,996 | |
Central Pacific Financial Corp. | | | 427 | | | | 8,173 | |
Chemical Financial Corp. | | | 119 | | | | 3,447 | |
CoBiz Financial, Inc. | | | 161 | | | | 1,848 | |
First Busey Corp. | | | 3,359 | | | | 22,001 | |
First Citizens BancShares, Inc., Class A | | | 14 | | | | 3,550 | |
First Interstate BancSystem, Inc., Class A | | | 99 | | | | 2,784 | |
First Merchants Corp. | | | 491 | | | | 10,532 | |
Glacier Bancorp, Inc. | | | 2,069 | | | | 56,649 | |
Green Bancorp, Inc. (a) | | | 236 | | | | 3,750 | |
Heartland Financial U.S.A., Inc. | | | 98 | | | | 2,457 | |
MidWestOne Financial Group, Inc. | | | 64 | | | | 1,761 | |
OmniAmerican Bancorp, Inc. | | | 597 | | | | 16,041 | |
Pacific Continental Corp. | | | 394 | | | | 5,461 | |
Preferred Bank | | | 73 | | | | 1,863 | |
Prosperity Bancshares, Inc. | | | 2,376 | | | | 133,484 | |
Sierra Bancorp | | | 100 | | | | 1,587 | |
Texas Capital Bancshares, Inc. (a) | | | 2,266 | | | | 124,925 | |
Umpqua Holdings Corp. | | | 161 | | | | 2,735 | |
West Bancorporation, Inc. | | | 83 | | | | 1,296 | |
Wintrust Financial Corp. | | | 59 | | | | 2,637 | |
| | | | | | | | |
| | | | | | | | 432,091 | |
Biotechnology — 5.0% | | | | | | | | |
Acorda Therapeutics, Inc. (a) | | | 566 | | | | 20,631 | |
Alder Biopharmaceuticals, Inc. (a) | | | 621 | | | | 10,135 | |
Ardelyx, Inc. (a) | | | 167 | | | | 4,471 | |
BioSpecifics Technologies Corp. (a) | | | 357 | | | | 13,537 | |
Biota Pharmaceuticals, Inc. (a) | | | 2,886 | | | | 6,378 | |
Cepheid, Inc. (a) | | | 65 | | | | 3,580 | |
China Biologic Products, Inc. (a) | | | 206 | | | | 14,107 | |
Concert Pharmaceuticals, Inc. (a) | | | 353 | | | | 4,448 | |
Cytokinetics, Inc. (a) | | | 2,513 | | | | 11,736 | |
Dyax Corp. (a) | | | 1,266 | | | | 17,775 | |
| | | | | | | | |
| Common Stocks | | Shares | | | Value | |
Biotechnology (concluded) | | | | | | | | |
Emergent Biosolutions, Inc. (a) | | | 702 | | | $ | 17,452 | |
Enanta Pharmaceuticals, Inc. (a) | | | 368 | | | | 17,274 | |
Enzon Pharmaceuticals, Inc. | | | 8,768 | | | | 9,557 | |
Fibrocell Science, Inc. (a) | | | 2,697 | | | | 7,282 | |
Ignyta, Inc. (a) | | | 149 | | | | 1,015 | |
Isis Pharmaceuticals, Inc. (a) | | | 485 | | | | 25,118 | |
Kindred Biosciences, Inc. (a) | | | 874 | | | | 8,408 | |
Ligand Pharmaceuticals, Inc. (a) | | | 338 | | | | 18,201 | |
Loxo Oncology, Inc. (a) | | | 482 | | | | 4,965 | |
MacroGenics, Inc. (a) | | | 610 | | | | 17,239 | |
Myriad Genetics, Inc. (a) | | | 123 | | | | 4,124 | |
NPS Pharmaceuticals, Inc. (a) | | | 913 | | | | 30,293 | |
OncoGenex Pharmaceutical, Inc. (a) | | | 1,222 | | | | 2,578 | |
PDL BioPharma, Inc. | | | 2,081 | | | | 17,189 | |
Prothena Corp. PLC (a) | | | 189 | | | | 4,581 | |
Puma Biotechnology, Inc. (a) | | | 55 | | | | 12,486 | |
Rigel Pharmaceuticals, Inc. (a) | | | 3,910 | | | | 8,367 | |
Sage Therapeutics, Inc. (a) | | | 147 | | | | 5,812 | |
Sorrento Therapeutics, Inc. (a) | | | 1,293 | | | | 4,978 | |
Trevena, Inc. (a) | | | 389 | | | | 2,031 | |
United Therapeutics Corp. (a) | | | 90 | | | | 11,931 | |
Versartis, Inc. (a) | | | 330 | | | | 5,947 | |
Vitae Pharmaceuticals, Inc. (a) | | | 869 | | | | 17,684 | |
| | | | | | | | |
| | | | | | | | 361,310 | |
Building Products — 0.1% | | | | | | | | |
Apogee Enterprises, Inc. | | | 221 | | | | 9,996 | |
Capital Markets — 1.3% | | | | | | | | |
Evercore Partners, Inc., Class A | | | 577 | | | | 29,139 | |
GFI Group, Inc. | | | 326 | | | | 1,623 | |
Manning & Napier, Inc. | | | 3,537 | | | | 54,151 | |
Medley Management, Inc., Class A (a) | | | 418 | | | | 6,981 | |
RCS Capital Corp., Class A | | | 479 | | | | 4,766 | |
| | | | | | | | |
| | | | | | | | 96,660 | |
Chemicals — 1.0% | | | | | | | | |
Codexis, Inc. (a) | | | 538 | | | | 1,211 | |
Kraton Performance Polymers, Inc. (a) | | | 673 | | | | 12,383 | |
OM Group, Inc. | | | 718 | | | | 19,537 | |
Trinseo SA (a) | | | 2,320 | | | | 35,635 | |
| | | | | | | | |
| | | | | | | | 68,766 | |
Commercial Services & Supplies — 1.0% | | | | | | | | |
ARC Document Solutions, Inc. (a) | | | 263 | | | | 2,533 | |
Atento SA (a) | | | 1,403 | | | | 15,475 | |
Hudson Technologies, Inc. (a) | | | 441 | | | | 1,491 | |
Metalico, Inc. (a) | | | 452 | | | | 173 | |
SP Plus Corp. (a) | | | 568 | | | | 11,803 | |
Viad Corp. | | | 1,575 | | | | 37,847 | |
| | | | | | | | |
| | | | | | | | 69,322 | |
Communications Equipment — 2.9% | | | | | | | | |
Aruba Networks, Inc. (a) | | | 3,062 | | | | 57,290 | |
Calix, Inc. (a) | | | 4,624 | | | | 49,014 | |
Emulex Corp. (a) | | | 4,485 | | | | 24,264 | |
Polycom, Inc. (a) | | | 278 | | | | 3,661 | |
Sonus Networks, Inc. (a) | | | 20,017 | | | | 74,063 | |
| | | | | | | | | | |
| Portfolio Abbreviations |
| REIT | | Real Estate Investment Trust | | | | | | | | |
| CVR | | Contingent Value Rights | | | | | | | | |
See Notes to Financial Statements.
| | | | | | |
| | | SEMI-ANNUAL REPORT | | NOVEMBER 30, 2014 | | 9 |
| | | | |
| Schedule of Investments (continued) | | | BlackRock Disciplined Small Cap Core Fund | |
| | | (Percentages shown are based on Net Assets) | |
| | | | | | | | |
| Common Stocks | | Shares | | | Value | |
Communications Equipment (concluded) | | | | | | | | |
Westell Technologies, Inc., Class A (a) | | | 762 | | | $ | 998 | |
| | | | | | | | |
| | | | | | | | 209,290 | |
Construction & Engineering — 0.9% | | | | | | | | |
Argan, Inc. | | | 440 | | | | 13,979 | |
Furmanite Corp. (a) | | | 3,117 | | | | 19,793 | |
Pike Corp. (a) | | | 117 | | | | 1,399 | |
Tutor Perini Corp. (a) | | | 1,058 | | | | 26,715 | |
| | | | | | | | |
| | | | | | | | 61,886 | |
Consumer Finance — 0.5% | | | | | | | | |
Cash America International, Inc. | | | 35 | | | | 854 | |
Consumer Portfolio Services, Inc. (a) | | | 4,595 | | | | 33,635 | |
Enova International, Inc. (a) | | | 32 | | | | 736 | |
JG Wentworth Co. (a) | | | 128 | | | | 1,220 | |
| | | | | | | | |
| | | | | | | | 36,445 | |
Containers & Packaging — 0.2% | | | | | | | | |
Graphic Packaging Holding Co. (a) | | | 972 | | | | 12,101 | |
Distributors — 1.0% | | | | | | | | |
Core-Mark Holding Co., Inc. | | | 1,159 | | | | 69,667 | |
Diversified Consumer Services — 2.3% | | | | | | | | |
Ascent Capital Group, Inc., Class A (a) | | | 707 | | | | 38,051 | |
Collectors Universe, Inc. | | | 937 | | | | 20,623 | |
LifeLock, Inc. (a) | | | 1,614 | | | | 26,647 | |
National American University Holdings, Inc. | | | 5,560 | | | | 17,069 | |
ServiceMaster Global Holdings, Inc. (a) | | | 1,102 | | | | 28,938 | |
Steiner Leisure Ltd. (a) | | | 739 | | | | 32,716 | |
| | | | | | | | |
| | | | | | | | 164,044 | |
Diversified Financial Services — 0.3% | | | | | | | | |
Marlin Business Services Corp. | | | 234 | | | | 4,362 | |
MicroFinancial, Inc. | | | 1,958 | | | | 16,995 | |
| | | | | | | | |
| | | | | | | | 21,357 | |
Diversified Telecommunication Services — 2.0% | | | | | | | | |
IDT Corp., Class B | | | 1,263 | | | | 21,395 | |
Inteliquent, Inc. | | | 2,924 | | | | 53,860 | |
Intelsat SA (a) | | | 1,022 | | | | 17,997 | |
Premiere Global Services, Inc. (a) | | | 2,507 | | | | 26,449 | |
Vonage Holdings Corp. (a) | | | 6,923 | | | | 23,607 | |
| | | | | | | | |
| | | | | | | | 143,308 | |
Electric Utilities — 0.7% | | | | | | | | |
Cleco Corp. | | | 253 | | | | 13,594 | |
Otter Tail Corp. | | | 357 | | | | 10,274 | |
Portland General Electric Co. | | | 651 | | | | 24,002 | |
| | | | | | | | |
| | | | | | | | 47,870 | |
Electrical Equipment — 1.7% | | | | | | | | |
EnerSys, Inc. | | | 1,544 | | | | 93,767 | |
General Cable Corp. | | | 734 | | | | 10,100 | |
SL Industries, Inc. (a) | | | 38 | | | | 1,463 | |
TCP International Holdings Ltd. (a) | | | 2,998 | | | | 16,639 | |
| | | | | | | | |
| | | | | | | | 121,969 | |
Electronic Equipment, Instruments & Components — 4.1% | | | | | |
Anixter International, Inc. | | | 261 | | | | 22,681 | |
Benchmark Electronics, Inc. (a) | | | 5,341 | | | | 127,009 | |
DTS, Inc. (a) | | | 399 | | | | 12,868 | |
Kimball Electronics, Inc. (a) | | | 1,232 | | | | 13,552 | |
Newport Corp. (a) | | | 2,073 | | | | 36,506 | |
| | | | | | | | |
| Common Stocks | | Shares | | | Value | |
Electronic Equipment, Instruments & Components (concluded) | |
OSI Systems, Inc. (a) | | | 163 | | | $ | 11,503 | |
Radisys Corp. (a) | | | 10,031 | | | | 24,074 | |
Vishay Precision Group, Inc. (a) | | | 2,769 | | | | 46,325 | |
| | | | | | | | |
| | | | | | | | 294,518 | |
Energy Equipment & Services — 1.6% | | | | | | | | |
Basic Energy Services, Inc. (a) | | | 1,167 | | | | 10,421 | |
C&J Energy Services, Inc. (a) | | | 2,950 | | | | 44,693 | |
CHC Group Ltd. (a) | | | 1,696 | | | | 7,802 | |
Enservco Corp. (a) | | | 7,496 | | | | 15,592 | |
Forbes Energy Services Ltd. (a) | | | 271 | | | | 539 | |
Helix Energy Solutions Group, Inc. (a) | | | 388 | | | | 8,874 | |
Independence Contract Drilling, Inc. (a) | | | 319 | | | | 2,201 | |
North Atlantic Drilling Ltd. (a) | | | 2,179 | | | | 5,295 | |
Parker Drilling Co. (a) | | | 2,958 | | | | 10,501 | |
TGC Industries, Inc. (a) | | | 4,501 | | | | 12,040 | |
| | | | | | | | |
| | | | | | | | 117,958 | |
Food Products — 1.4% | | | | | | | | |
Chiquita Brands International, Inc. (a) | | | 200 | | | | 2,892 | |
Freshpet, Inc. (a) | | | 105 | | | | 1,755 | |
Omega Protein Corp. (a) | | | 1,773 | | | | 17,996 | |
Pilgrim’s Pride Corp. (a)(b) | | | 2,325 | | | | 75,097 | |
Sanderson Farms, Inc. (b) | | | 58 | | | | 5,035 | |
| | | | | | | | |
| | | | | | | | 102,775 | |
Gas Utilities — 1.0% | | | | | | | | |
New Jersey Resources Corp. | | | 796 | | | | 46,088 | |
Southwest Gas Corp. | | | 404 | | | | 23,388 | |
| | | | | | | | |
| | | | | | | | 69,476 | |
Health Care Equipment & Supplies — 2.9% | | | | | | | | |
Align Technology, Inc. (a) | | | 135 | | | | 7,681 | |
Alphatec Holdings, Inc. (a) | | | 5,428 | | | | 6,948 | |
Anika Therapeutics, Inc. (a) | | | 543 | | | | 22,203 | |
Greatbatch, Inc. (a) | | | 766 | | | | 37,971 | |
ICU Medical, Inc. (a) | | | 302 | | | | 25,274 | |
Natus Medical, Inc. (a) | | | 163 | | | | 5,579 | |
STERIS Corp. | | | 781 | | | | 49,789 | |
Symmetry Medical, Inc. (a) | | | 6,060 | | | | 54,601 | |
| | | | | | | | |
| | | | | | | | 210,046 | |
Health Care Providers & Services — 5.0% | | | | | | | | |
Alliance HealthCare Services, Inc. (a) | | | 314 | | | | 7,071 | |
AMN Healthcare Services, Inc. (a) | | | 489 | | | | 8,372 | |
Centene Corp. (a) | | | 116 | | | | 11,457 | |
CorVel Corp. (a) | | | 118 | | | | 4,090 | |
Five Star Quality Care, Inc. (a) | | | 3,268 | | | | 14,379 | |
Health Net, Inc. (a) | | | 2,433 | | | | 125,008 | |
Team Health Holdings, Inc. (a) | | | 2,330 | | | | 133,183 | |
VCA, Inc. (a) | | | 1,195 | | | | 56,559 | |
| | | | | | | | |
| | | | | | | | 360,119 | |
Hotels, Restaurants & Leisure — 2.6% | | | | | | | | |
BFC Financial Corp., Class A (a) | | | 6,426 | | | | 24,097 | |
Brinker International, Inc. | | | 2,250 | | | | 126,743 | |
Diamond Resorts International, Inc. (a) | | | 764 | | | | 18,474 | |
Hyatt Hotels Corp., Class A (a) | | | 91 | | | | 5,363 | |
Monarch Casino & Resort, Inc. (a) | | | 100 | | | | 1,656 | |
SeaWorld Entertainment, Inc. | | | 366 | | | | 6,109 | |
Vail Resorts, Inc. | | | 57 | | | | 4,995 | |
| | | | | | | | |
| | | | | | | | 187,437 | |
See Notes to Financial Statements.
| | | | | | |
| 10 | | SEMI-ANNUAL REPORT | | NOVEMBER 30, 2014 | | |
| | | | |
| Schedule of Investments (continued) | | | BlackRock Disciplined Small Cap Core Fund | |
| | | (Percentages shown are based on Net Assets) | |
| | | | | | | | |
| Common Stocks | | Shares | | | Value | |
Household Durables — 0.5% | | | | | | | | |
Nova Lifestyle, Inc. (a) | | | 3,763 | | | $ | 14,977 | |
Skullcandy, Inc. (a) | | | 201 | | | | 1,905 | |
ZAGG, Inc. (a) | | | 2,894 | | | | 16,496 | |
| | | | | | | | |
| | | | | | | | 33,378 | |
Independent Power and Renewable Electricity Producers — 0.0% | |
Dynegy, Inc. (a) | | | 35 | | | | 1,160 | |
TerraForm Power, Inc., Class A (a) | | | 48 | | | | 1,591 | |
| | | | | | | | |
| | | | | | | | 2,751 | |
Insurance — 4.1% | | | | | | | | |
AMERISAFE, Inc. | | | 141 | | | | 5,878 | |
CNO Financial Group, Inc. | | | 2,619 | | | | 45,413 | |
Fidelity & Guaranty Life | | | 4,090 | | | | 102,373 | |
Maiden Holdings Ltd. (a) | | | 8,491 | | | | 110,892 | |
National Western Life Insurance Co., Class A | | | 88 | | | | 22,603 | |
Symetra Financial Corp. | | | 336 | | | | 7,614 | |
Universal Insurance Holdings, Inc. | | | 139 | | | | 2,697 | |
| | | | | | | | |
| | | | | | | | 297,470 | |
Internet & Catalog Retail — 0.4% | | | | | | | | |
Liberty Ventures, Series A | | | 385 | | | | 14,106 | |
Orbitz Worldwide, Inc. (a) | | | 243 | | | | 1,857 | |
U.S. Auto Parts Network, Inc. (a) | | | 5,335 | | | | 13,444 | |
| | | | | | | | |
| | | | | | | | 29,407 | |
Internet Software & Services — 2.5% | | | | | | | | |
Aerohive Networks, Inc. (a) | | | 1,148 | | | | 5,591 | |
Blucora, Inc. (a) | | | 668 | | | | 9,492 | |
Constant Contact, Inc. (a) | | | 774 | | | | 25,294 | |
Conversant, Inc. (a) | | | 286 | | | | 10,016 | |
IntraLinks Holdings, Inc. (a) | | | 399 | | | | 4,341 | |
Limelight Networks, Inc. (a) | | | 2,810 | | | | 7,671 | |
LogMeIn, Inc. (a) | | | 830 | | | | 41,973 | |
Marchex, Inc., Class B | | | 1,002 | | | | 3,637 | |
MeetMe, Inc. (a)(b) | | | 3,292 | | | | 5,712 | |
Monster Worldwide, Inc. (a) | | | 7,642 | | | | 33,243 | |
NIC, Inc. | | | 399 | | | | 7,190 | |
Rightside Group Ltd. (a) | | | 598 | | | | 4,850 | |
support.com, Inc. (a) | | | 358 | | | | 737 | |
Synacor, Inc. (a) | | | 375 | | | | 611 | |
TechTarget, Inc. (a) | | | 1,443 | | | | 14,603 | |
Travelzoo, Inc. (a) | | | 163 | | | | 2,140 | |
Tremor Video, Inc. (a) | | | 1,128 | | | | 2,764 | |
| | | | | | | | |
| | | | | | | | 179,865 | |
IT Services — 1.6% | | | | | | | | |
Forrester Research, Inc. | | | 160 | | | | 6,354 | |
Global Cash Access Holdings, Inc. (a) | | | 7,733 | | | | 54,904 | |
Lionbridge Technologies, Inc. (a) | | | 3,082 | | | | 15,626 | |
Sapient Corp. (a) | | | 478 | | | | 11,807 | |
Syntel, Inc. (a) | | | 178 | | | | 7,921 | |
VeriFone Systems, Inc. (a) | | | 448 | | | | 15,976 | |
| | | | | | | | |
| | | | | | | | 112,588 | |
Life Sciences Tools & Services — 0.2% | | | | | | | | |
Harvard Bioscience, Inc. (a) | | | 2,719 | | | | 13,377 | |
INC Research Holdings, Inc., Class A (a) | | | 146 | | | | 3,561 | |
| | | | | | | | |
| | | | | | | | 16,938 | |
Machinery — 3.1% | | | | | | | | |
Blount International, Inc. (a) | | | 4,373 | | | | 71,805 | |
| | | | | | | | |
| Common Stocks | | Shares | | | Value | |
Machinery (concluded) | | | | | | | | |
The Eastern Co. | | | 357 | | | $ | 6,005 | |
Global Brass & Copper Holdings, Inc. | | | 3,540 | | | | 43,365 | |
The Greenbrier Cos., Inc. (b) | | | 1,263 | | | | 70,071 | |
Hyster-Yale Materials Handling, Inc. | | | 249 | | | | 18,279 | |
John Bean Technologies Corp. | | | 221 | | | | 6,705 | |
Supreme Industries, Inc., Class A | | | 635 | | | | 4,547 | |
| | | | | | | | |
| | | | | | | | 220,777 | |
Marine — 0.3% | | | | | | | | |
Scorpio Bulkers, Inc. (a) | | | 7,040 | | | | 23,021 | |
Media — 1.4% | | | | | | | | |
Crown Media Holdings, Inc., Class A (a) | | | 503 | | | | 1,700 | |
Harte-Hanks, Inc. | | | 2,449 | | | | 14,988 | |
MDC Partners, Inc., Class A | | | 421 | | | | 9,291 | |
Sizmek, Inc. (a) | | | 1,688 | | | | 9,672 | |
Time, Inc. | | | 974 | | | | 23,318 | |
Townsquare Media, Inc., Class A (a) | | | 762 | | | | 9,510 | |
Tribune Publishing Co. | | | 1,449 | | | | 30,559 | |
| | | | | | | | |
| | | | | | | | 99,038 | |
Metals & Mining — 0.2% | | | | | | | | |
Gold Reserve, Inc. (a) | | | 2,118 | | | | 8,260 | |
Ryerson Holding Corp. (a) | | | 585 | | | | 6,312 | |
TimkenSteel Corp. | | | 70 | | | | 2,493 | |
| | | | | | | | |
| | | | | | | | 17,065 | |
Oil, Gas & Consumable Fuels — 1.8% | | | | | | | | |
Adams Resources & Energy, Inc. | | | 97 | | | | 4,296 | |
American Eagle Energy Corp. (a) | | | 604 | | | | 568 | |
Apco Oil and Gas International, Inc. (a) | | | 3 | | | | 42 | |
Bill Barrett Corp. (a) | | | 1,177 | | | | 11,923 | |
BPZ Resources, Inc. (a) | | | 15,827 | | | | 9,496 | |
Callon Petroleum Co. (a) | | | 3,694 | | | | 18,138 | |
Comstock Resources, Inc. | | | 74 | | | | 656 | |
Jones Energy, Inc., Class A (a) | | | 3,837 | | | | 38,946 | |
Kodiak Oil & Gas Corp. (a) | | | 1,135 | | | | 8,320 | |
Northern Oil and Gas, Inc. (a) | | | 967 | | | | 8,403 | |
Stone Energy Corp. (a) | | | 1,292 | | | | 20,414 | |
U.S. Energy Corp. Wyoming (a) | | | 4,367 | | | | 7,249 | |
W&T Offshore, Inc. | | | 562 | | | | 4,232 | |
| | | | | | | | |
| | | | | | | | 132,683 | |
Paper & Forest Products — 2.4% | | | | | | | | |
Boise Cascade Co. (a) | | | 3,218 | | | | 114,850 | |
Clearwater Paper Corp. (a) | | | 60 | | | | 3,976 | |
Domtar Corp. | | | 1,405 | | | | 57,183 | |
| | | | | | | | |
| | | | | | | | 176,009 | |
Pharmaceuticals — 1.0% | | | | | | | | |
Akorn, Inc. (a) | | | 559 | | | | 22,399 | |
Auxilium Pharmaceuticals, Inc. (a) | | | 214 | | | | 7,396 | |
Cumberland Pharmaceuticals, Inc. (a) | | | 1,621 | | | | 8,381 | |
Furiex Pharmaceuticals, Inc. — CVR | | | 11 | | | | 110 | |
POZEN, Inc. | | | 1,313 | | | | 11,673 | |
Sagent Pharmaceuticals, Inc. (a) | | | 244 | | | | 7,035 | |
SciClone Pharmaceuticals, Inc. (a) | | | 1,359 | | | | 11,538 | |
| | | | | | | | |
| | | | | | | | 68,532 | |
Professional Services — 2.2% | | | | | | | | |
CRA International, Inc. (a) | | | 500 | | | | 14,875 | |
GP Strategies Corp. (a) | | | 63 | | | | 1,910 | |
Heidrick & Struggles International, Inc. | | | 181 | | | | 3,624 | |
See Notes to Financial Statements.
| | | | | | |
| | | SEMI-ANNUAL REPORT | | NOVEMBER 30, 2014 | | 11 |
| | | | |
| Schedule of Investments (continued) | | | BlackRock Disciplined Small Cap Core Fund | |
| | | (Percentages shown are based on Net Assets) | |
| | | | | | | | |
| Common Stocks | | Shares | | | Value | |
Professional Services (concluded) | | | | | | | | |
Hill International, Inc. (a) | | | 591 | | | $ | 2,157 | |
ICF International, Inc. (a) | | | 145 | | | | 5,623 | |
Kforce, Inc. | | | 1,077 | | | | 25,137 | |
Korn/Ferry International (a) | | | 538 | | | | 14,607 | |
On Assignment, Inc. (a) | | | 152 | | | | 4,671 | |
RPX Corp. (a) | | | 6,511 | | | | 85,424 | |
| | | | | | | | |
| | | | | | | | 158,028 | |
Real Estate Investment Trusts (REITs) — 7.6% | | | | | | | | |
American Assets Trust, Inc. | | | 360 | | | | 14,148 | |
Armada Hoffler Properties, Inc. | | | 564 | | | | 5,352 | |
Chatham Lodging Trust | | | 1,619 | | | | 43,324 | |
Chesapeake Lodging Trust | | | 1,762 | | | | 59,661 | |
CyrusOne, Inc. | | | 122 | | | | 3,349 | |
DuPont Fabros Technology, Inc. | | | 4,428 | | | | 144,308 | |
Equity LifeStyle Properties, Inc. | | | 515 | | | | 25,549 | |
Excel Trust, Inc. | | | 380 | | | | 4,982 | |
The Geo Group, Inc. | | | 1,870 | | | | 75,342 | |
Lexington Realty Trust | | | 1,848 | | | | 20,328 | |
New Residential Investment Corp. | | | 1,816 | | | | 23,535 | |
NorthStar Realty Finance Corp. | | | 1,567 | | | | 28,629 | |
Pebblebrook Hotel Trust | | | 98 | | | | 4,231 | |
PS Business Parks, Inc. | | | 727 | | | | 59,171 | |
RLJ Lodging Trust | | | 190 | | | | 6,257 | |
Washington Prime Group, Inc. | | | 717 | | | | 12,354 | |
Western Asset Mortgage Capital Corp. | | | 1,145 | | | | 17,919 | |
| | | | | | | | |
| | | | | | | | 548,439 | |
Real Estate Management & Development — 0.3% | | | | | | | | |
AV Homes, Inc. (a) | | | 269 | | | | 4,027 | |
Forestar Group, Inc. (a) | | | 1,150 | | | | 18,400 | |
| | | | | | | | |
| | | | | | | | 22,427 | |
Road & Rail — 2.0% | | | | | | | | |
Ryder System, Inc. | | | 734 | | | | 70,112 | |
Swift Transportation Co. (a) | | | 2,491 | | | | 72,413 | |
| | | | | | | | |
| | | | | | | | 142,525 | |
Semiconductors & Semiconductor Equipment — 4.1% | | | | | | | | |
Alpha & Omega Semiconductor Ltd. (a) | | | 137 | | | | 1,175 | |
Ambarella, Inc. (a)(b) | | | 623 | | | | 34,265 | |
Amkor Technology, Inc. (a) | | | 5,755 | | | | 38,501 | |
AXT, Inc. (a) | | | 819 | | | | 2,105 | |
Cirrus Logic, Inc. (a) | | | 2,252 | | | | 41,189 | |
Inphi Corp. (a) | | | 583 | | | | 8,564 | |
International Rectifier Corp. (a) | | | 304 | | | | 12,124 | |
IXYS Corp. | | | 944 | | | | 10,790 | |
Magnachip Semiconductor Corp. (a) | | | 234 | | | | 2,850 | |
MaxLinear, Inc., Class A (a) | | | 4,063 | | | | 29,660 | |
OmniVision Technologies, Inc. (a) | | | 88 | | | | 2,544 | |
Pericom Semiconductor Corp. (a) | | | 2,806 | | | | 35,664 | |
RF Micro Devices, Inc. (a) | | | 1,160 | | | | 16,948 | |
Sigma Designs, Inc. (a) | | | 342 | | | | 1,560 | |
Silicon Image, Inc. (a) | | | 185 | | | | 1,023 | |
Spansion, Inc., Class A (a) | | | 2,426 | | | | 56,696 | |
STR Holdings, Inc. (a) | | | 997 | | | | 1,137 | |
| | | | | | | | |
| | | | | | | | 296,795 | |
| | | | | | | | |
| Common Stocks | | Shares | | | Value | |
Software — 4.5% | | | | | | | | |
Aspen Technology, Inc. (a) | | | 2,941 | | | $ | 110,993 | |
AVG Technologies NV (a) | | | 1,620 | | | | 31,817 | |
Aware, Inc. | | | 392 | | | | 1,729 | |
Globant SA (a) | | | 200 | | | | 2,760 | |
Manhattan Associates, Inc. (a) | | | 3,431 | | | | 135,730 | |
Net 1 UEPS Technologies, Inc. (a) | | | 1,334 | | | | 16,355 | |
TubeMogul, Inc. (a) | | | 128 | | | | 2,043 | |
VASCO Data Security International, Inc. (a) | | | 493 | | | | 14,691 | |
Verint Systems, Inc. (a) | | | 177 | | | | 10,654 | |
| | | | | | | | |
| | | | | | | | 326,772 | |
Specialty Retail — 2.2% | | | | | | | | |
Aaron’s, Inc. (a) | | | 1,773 | | | | 50,318 | |
Haverty Furniture Cos., Inc. | | | 248 | | | | 5,223 | |
Kirkland’s, Inc. (a) | | | 406 | | | | 8,818 | |
Murphy U.S.A., Inc. (a) | | | 701 | | | | 44,668 | |
New York & Co., Inc. (a) | | | 11,757 | | | | 32,332 | |
West Marine, Inc. (a) | | | 1,223 | | | | 13,367 | |
| | | | | | | | |
| | | | | | | | 154,726 | |
Technology Hardware, Storage & Peripherals — 0.3% | | | | | | | | |
Avid Technology, Inc. (a) | | | 564 | | | | 6,796 | |
Imation Corp. (a) | | | 509 | | | | 1,614 | |
QLogic Corp. (a) | | | 827 | | | | 9,544 | |
| | | | | | | | |
| | | | | | | | 17,954 | |
Textiles, Apparel & Luxury Goods — 2.6% | | | | | | | | |
Deckers Outdoor Corp. (a) | | | 646 | | | | 62,481 | |
Skechers U.S.A., Inc., Class A (a) | | | 2,018 | | | | 123,925 | |
| | | | | | | | |
| | | | | | | | 186,406 | |
Thrifts & Mortgage Finance — 2.8% | | | | | | | | |
EverBank Financial Corp. | | | 2,360 | | | | 44,462 | |
Heritage Financial Group, Inc. | | | 1,032 | | | | 21,703 | |
Home Loan Servicing Solutions Ltd. (a) | | | 438 | | | | 8,558 | |
HomeStreet, Inc. | | | 5,305 | | | | 86,525 | |
Ladder Capital Corp., Class A (a) | | | 1,216 | | | | 22,995 | |
MGIC Investment Corp. (a) | | | 532 | | | | 4,953 | |
Radian Group, Inc. | | | 366 | | | | 6,240 | |
Tree.com, Inc. (a) | | | 211 | | | | 9,550 | |
| | | | | | | | |
| | | | | | | | 204,986 | |
Trading Companies & Distributors — 1.1% | | | | | | | | |
MRC Global, Inc. (a) | | | 2,341 | | | | 47,312 | |
Watsco, Inc. | | | 165 | | | | 16,747 | |
Willis Lease Finance Corp. (a) | | | 588 | | | | 12,812 | |
| | | | | | | | |
| | | | | | | | 76,871 | |
Water Utilities — 0.3% | | | | | | | | |
American States Water Co. | | | 647 | | | | 22,574 | |
Wireless Telecommunication Services — 0.0% | | | | | | | | |
Leap Wireless International, Inc. (a) | | | 216 | | | | 544 | |
Total Common Stocks — 99.3% | | | | | | | 7,145,014 | |
See Notes to Financial Statements.
| | | | | | |
| 12 | | SEMI-ANNUAL REPORT | | NOVEMBER 30, 2014 | | |
| | | | |
| Schedule of Investments (continued) | | | BlackRock Disciplined Small Cap Core Fund | |
| | | (Percentages shown are based on Net Assets) | |
| | | | | | | | |
| Other Interests (c) | | Beneficial
Interest
(000) | | | Value | |
Professional Services — 0.0% | | | | | | | | |
The Dolan Co., Escrow (a) | | $ | 2 | | | $ | 39 | |
| | | | | | | | |
| Warrants (d) | | Shares | | | | |
Real Estate Management & Development — 0.0% | | | | | |
Tejon Ranch Co. (Issued/Exercisable 8/07/13,
1 Share for 1 Warrant, Expires 8/31/16,
Strike Price $40) | | | 8 | | | | 14 | |
Total Long-Term Investments (Cost — $6,723,001) — 99.3% | | | | 7,145,067 | |
| | | | | | | | |
| Short-Term Securities | | Shares | | | Value | |
BlackRock Liquidity Funds, TempFund,
Institutional Class, 0.07% (e)(f) | | | 109,988 | | | $ | 109,988 | |
| | | Beneficial
Interest
(000) | | | | |
BlackRock Liquidity Series, LLC, Money Market
Series, 0.19% (e)(f)(g) | | $ | 197 | | | | 197,011 | |
Total Short-Term Securities (Cost — $306,999) — 4.2% | | | | | | | 306,999 | |
Total Investments (Cost — $7,030,000) — 103.5% | | | | 7,452,066 | |
Liabilities in Excess of Other Assets — (3.5)% | | | | | | | (255,005 | ) |
| | | | | | | | |
Net Assets — 100.0% | | | | | | $ | 7,197,061 | |
| | | | | | | | |
|
| Notes to Schedule of Investments |
| (a) | Non-income producing security. |
| (b) | Security, or a portion of security, is on loan. |
| (c) | Other interests represent beneficial interests in liquidation trusts and other reorganization or private entities. |
| (d) | Warrants entitle the Fund to purchase a predetermined number of shares of common stock and are non-income producing. The purchase price and number of shares are subject to adjustment under certain conditions until the expiration date of the warrants, if any. |
| (e) | Investments in issuers considered to be affiliates of the Fund during the six months ended November 30, 2014, for purposes of Section 2(a)(3) of the Investment Company Act of 1940, as amended, were as follows: |
| | | | | | | | | | | | | | | | |
| Affiliate | | Shares/Beneficial
Interest Held at
May 31, 2014 | | | Net
Activity | | | Shares/Beneficial
Interest Held at
November 30, 2014 | | | Income | |
BlackRock Liquidity Funds, TempFund, Institutional Class | | | 116,410 | | | | (6,422 | ) | | | 109,988 | | | $ | 28 | |
BlackRock Liquidity Series, LLC, Money Market Series | | $ | 2,821 | | | $ | 194,190 | | | $ | 197,011 | | | $ | 801 | |
| (f) | Represents the current yield as of report date. |
| (g) | Security was purchased with the cash collateral from loaned securities. The Fund may withdraw up to 25% of its investment daily, although the manager of the BlackRock Liquidity Series, LLC, Money Market Series, in its sole discretion, may permit an investor to withdraw more than 25% on any one day. |
| Ÿ | | For Fund compliance purposes, the Fund’s industry classifications refer to any one or more of the industry sub-classifications used by one or more widely recognized market indexes or ratings group indexes, and/or as defined by the investment advisor. These definitions may not apply for purposes of this report, which may combine such industry sub-classifications for reporting ease. |
| Ÿ | | Financial futures contracts outstanding as of November 30, 2014 were as follows: |
| | | | | | | | | | | | | | | | | | |
Contracts Purchased | | | Issue | | Exchange | | Expiration | | | Notional
Value | | | Unrealized
Appreciation | |
| | 1 | | | E-Mini Russell 2000 Futures | | InterContinental Exchange | | | December 2014 | | | $ | 117,160 | | | $ | 10,817 | |
| Ÿ | | Fair Value Measurements — Various inputs are used in determining the fair value of investments and derivative financial instruments. These inputs to valuation techniques are categorized into a disclosure hierarchy consisting of three broad levels for financial statement purposes. The hierarchy gives the highest priority to unadjusted quoted prices in active markets for identical assets or liabilities (Level 1 measurements) and the lowest priority to unobservable inputs (Level 3 measurements). Accordingly, the degree of judgment exercised in determining fair value is greatest for instruments categorized in Level 3. The inputs used to measure fair value may fall into different levels of the fair value hierarchy. In such cases, for disclosure purposes, the fair value hierarchy classification is determined based on the lowest level input that is significant to the fair value measurement in its entirety. The categorization of a value determined for investments and derivative financial instruments is based on the pricing transparency of the investment and derivative financial instrument and is not necessarily an indication of the risks associated with investing in those securities. The three levels of the fair value hierarchy are as follows: |
| | Ÿ | | Level 1 — unadjusted quoted prices in active markets/exchanges for identical assets or liabilities that the Fund has the ability to access |
See Notes to Financial Statements.
| | | | | | |
| | | SEMI-ANNUAL REPORT | | NOVEMBER 30, 2014 | | 13 |
| | | | |
| Schedule of Investments (concluded) | | | BlackRock Disciplined Small Cap Core Fund | |
| | Ÿ | | Level 2 — other observable inputs (including, but not limited to, quoted prices for similar assets or liabilities in markets that are active, quoted prices for identical or similar assets or liabilities in markets that are not active, inputs other than quoted prices that are observable for the assets or liabilities (such as interest rates, yield curves, volatilities, prepayment speeds, loss severities, credit risks and default rates) or other market–corroborated inputs) |
| | Ÿ | | Level 3 — unobservable inputs based on the best information available in the circumstances, to the extent observable inputs are not available (including the Fund’s own assumptions used in determining the fair value of investments and derivative financial instruments) |
Changes in valuation techniques may result in transfers into or out of an assigned level within the disclosure hierarchy. In accordance with the Fund’s policy, transfers between different levels of the fair value disclosure hierarchy are deemed to have occurred as of the beginning of the reporting period. For information about the Fund’s policy regarding valuation of investments and derivative financial instruments, refer to Note 2 of the Notes to Financial Statements.
The following tables summarize the Fund’s investments and derivative financial instruments categorized in the disclosure hierarchy as of November 30, 2014:
| | | | | | | | | | | | | | | | |
| | | Level 1 | | | Level 2 | | | Level 3 | | | Total | |
Assets: | | | | | | | | | | | | | | | | |
Investments: | | | | | | | | | | | | | | | | |
Long-Term Investments: | | | | | | | | | | | | | | | | |
Common Stocks1 | | $ | 7,144,360 | | | | — | | | $ | 654 | | | $ | 7,145,014 | |
Other Interests | | | — | | | | — | | | | 39 | | | | 39 | |
Warrants | | | 14 | | | | — | | | | — | | | | 14 | |
Short-Term Securities | | | 109,988 | | | $ | 197,011 | | | | — | | | | 306,999 | |
| | | | |
Total | | $ | 7,254,362 | | | $ | 197,011 | | | $ | 693 | | | $ | 7,452,066 | |
| | | | |
1 See above Schedule of Investments for values in each industry. Investments categorized as Level 3 are included in Pharmaceuticals and Wireless Telecommunications Services. | | | | | |
| | | Level 1 | | | Level 2 | | | Level 3 | | | Total | |
Derivative Financial Instruments2 | | | | | | | | | | | | | | | | |
Assets: | | | | | | | | | | | | | | | | |
Equity contracts | | $ | 10,817 | | | | — | | | | — | | | $ | 10,817 | |
2 Derivative financial instruments are financial futures contracts, which are valued at the unrealized appreciation/depreciation on the instrument. | | | | | |
The Fund may hold assets and/or liabilities in which the fair value approximates the carrying amount for financial statement purposes. As of November 30, 2014, such assets and/or liabilities are categorized within the disclosure hierarchy as follows: | | | | | |
| | | Level 1 | | | Level 2 | | | Level 3 | | | Total | |
Assets: | | | | | | | | | | | | | | | | |
Cash pledged for financial futures contracts | | $ | 16,000 | | | | — | | | | — | | | $ | 16,000 | |
Liabilities: | | | | | | | | | | | | | | | | |
Collateral on securities loaned at value | | | — | | | $ | (197,011 | ) | | | — | | | | (197,011 | ) |
| | | | |
Total | | $ | 16,000 | | | $ | (197,011 | ) | | | — | | | $ | (181,011 | ) |
| | | | |
There were no transfers between levels during the six months ended November 30, 2014.
See Notes to Financial Statements.
| | | | | | |
| 14 | | SEMI-ANNUAL REPORT | | NOVEMBER 30, 2014 | | |
| | |
| Statements of Assets and Liabilities | | |
| | | | | | | | |
| November 30, 2014 (Unaudited) | | BlackRock
Disciplined Small
Cap Core Fund | | | BlackRock
Small Cap
Growth Fund II | |
| | | | | | | | |
| Assets | | | | | | | | |
Investments at value — unaffiliated (including securities loaned at value of $177,560) (cost — $6,723,001) | | $ | 7,145,067 | | | | — | |
Investments at value — affiliated (cost — $306,999) | | | 306,999 | | | | — | |
Investments at value — Master Portfolio (cost — $203,780,132) | | | — | | | $ | 222,258,422 | |
Cash pledged for financial futures contracts | | | 16,000 | | | | — | |
Withdrawals receivable from the Master Portfolio | | | — | | | | 445,887 | |
Securities lending income receivable — affiliated | | | 383 | | | | — | |
Capital shares sold receivable | | | — | | | | 90,392 | |
Receivable from Manager | | | 12,878 | | | | — | |
Dividends receivable — unaffiliated | | | 3,779 | | | | — | |
Dividends receivable — affiliated | | | 9 | | | | — | |
Prepaid expenses | | | 19,592 | | | | 47,326 | |
| | | | |
Total assets | | | 7,504,707 | | | | 222,842,027 | |
| | | | |
| | | | | | | | |
| Liabilities | | | | | | | | |
Collateral on securities loaned at value | | | 197,011 | | | | — | |
Deferred foreign capital gain tax payable | | | 110 | | | | — | |
Variation margin payable on financial futures contracts | | | 1,910 | | | | — | |
Capital shares redeemed payable | | | — | | | | 536,279 | |
Professional fees payable | | | 51,889 | | | | 30,768 | |
Pricing fees payable | | | 24,910 | | | | — | |
Custodian fees payable | | | 19,993 | | | | — | |
Officers’ and Trustees’/Directors’ fees payable | | | 1,809 | | | | 40 | |
Service and distribution fees payable | | | 363 | | | | 63,509 | |
Transfer agent fees payable | | | 32 | | | | 154,436 | |
Administration fees payable | | | — | | | | 36,593 | |
Other affiliates payable | | | — | | | | 1,771 | |
Other accrued expenses payable | | | 9,619 | | | | 31,169 | |
| | | | |
Total liabilities | | | 307,646 | | | | 854,565 | |
| | | | |
Net Assets | | $ | 7,197,061 | | | $ | 221,987,462 | |
| | | | |
| | | | | | | | |
| Net Assets Consist of | | | | | | | | |
Paid-in capital | | $ | 6,635,260 | | | $ | 198,444,197 | |
Undistributed (accumulated) net investment income (loss) | | | 13,572 | | | | (870,216 | ) |
Undistributed net realized gain | | | 115,456 | | | | — | |
Undistributed net realized gain allocated from the Master Portfolio | | | — | | | | 5,935,191 | |
Net unrealized appreciation/depreciation | | | 432,773 | | | | — | |
Net unrealized appreciation/depreciation allocated from the Master Portfolio | | | — | | | | 18,478,290 | |
| | | | |
Net Assets | | $ | 7,197,061 | | | $ | 221,987,462 | |
| | | | |
See Notes to Financial Statements.
| | | | | | |
| | | SEMI-ANNUAL REPORT | | NOVEMBER 30, 2014 | | 15 |
| | |
| Statements of Assets and Liabilities (concluded) | | |
| | | | | | | | |
| November 30, 2014 (Unaudited) | | BlackRock
Disciplined Small
Cap Core Fund | | | BlackRock
Small Cap
Growth Fund II | |
| | | | | | | | |
| Net Asset Value | | | | | | | | |
Institutional | | | | | | | | |
Net assets | | $ | 5,799,617 | | | $ | 75,607,702 | |
| | | | |
Shares outstanding | | | 520,548 | 1 | | | 5,571,903 | 2 |
| | | | |
Net asset value | | $ | 11.14 | | | $ | 13.57 | |
| | | | |
| | | | | | | | |
Investor A | | | | | | | | |
Net assets | | $ | 1,266,720 | | | $ | 75,733,636 | |
| | | | |
Shares outstanding | | | 113,989 | 1 | | | 5,886,756 | 2 |
| | | | |
Net asset value | | $ | 11.11 | | | $ | 12.87 | |
| | | | |
| | | | | | | | |
Investor B | | | | | | | | |
Net assets | | | — | | | $ | 1,048,136 | |
| | | | |
Shares outstanding | | | — | | | | 98,559 | 2 |
| | | | |
Net asset value | | | — | | | $ | 10.63 | |
| | | | |
| | | | | | | | |
Investor C | | | | | | | | |
Net assets | | $ | 130,724 | | | $ | 43,965,736 | |
| | | | |
Shares outstanding | | | 11,855 | 1 | | | 4,162,713 | 2 |
| | | | |
Net asset value | | $ | 11.03 | | | $ | 10.56 | |
| | | | |
| | | | | | | | |
Class R | | | | | | | | |
Net assets | | | — | | | $ | 25,632,252 | |
| | | | |
Shares outstanding | | | — | | | | 2,165,906 | 2 |
| | | | |
Net asset value | | | — | | | $ | 11.83 | |
| | | | |
| | 1 | | Unlimited number of shares authorized, $0.001 par value. |
| | 2 | | 100 million shares authorized, $0.0001 par value. |
See Notes to Financial Statements.
| | | | | | |
| 16 | | SEMI-ANNUAL REPORT | | NOVEMBER 30, 2014 | | |
| | | | | | | | |
| Six Months Ended November 30, 2014 (Unaudited) | | BlackRock
Disciplined Small
Cap Core Fund | | | BlackRock
Small Cap
Growth Fund II | |
| | | | | | | | |
| Investment Income | | | | | | | | |
Dividends — unaffiliated | | $ | 41,095 | | | | — | |
Securities lending — affiliated — net | | | 801 | | | | — | |
Dividends — affiliated | | | 28 | | | | — | |
Foreign taxes withheld | | | (12 | ) | | | — | |
Net investment income allocated from the Master Portfolio: | | | | | | | | |
Dividends — unaffiliated | | | — | | | $ | 713,467 | |
Securities lending — affiliated — net | | | — | | | | 144,508 | |
Dividends — affiliated | | | — | | | | 380 | |
Foreign taxes withheld | | | — | | | | (68 | ) |
Expenses | | | — | | | | (907,192 | ) |
Fees waived | | | — | | | | 183,287 | |
| | | | |
Total income | | | 41,912 | | | | 134,382 | |
| | | | |
| | | | | | | | |
| Expenses | | | | | | | | |
Professional | | | 48,923 | | | | 33,839 | |
Custodian | | | 21,373 | | | | — | |
Investment advisory | | | 16,059 | | | | — | |
Registration | | | 15,487 | | | | 36,859 | |
Pricing | | | 13,587 | | | | — | |
Printing | | | 10,179 | | | | 16,984 | |
Administration | | | 2,677 | | | | 228,002 | |
Service and distribution — class specific | | | 1,979 | | | | 398,295 | |
Officers and Trustees/Directors | | | 1,264 | | | | 50 | |
Transfer agent — class specific | | | 1,142 | | | | 292,807 | |
Administration — class specific | | | 892 | | | | — | |
Miscellaneous | | | 4,791 | | | | 9,692 | |
| | | | |
Total expenses | | | 138,353 | | | | 1,016,528 | |
Less fees waived and/or reimbursed by Manager | | | (106,610 | ) | | | — | |
Less administration fees waived | | | (2,677 | ) | | | — | |
Less administration fees waived — class specific | | | (827 | ) | | | — | |
Less transfer agent fees reimbursed — class specific | | | (999 | ) | | | — | |
| | | | |
Total expenses after fees waived and/or reimbursed | | | 27,240 | | | | 1,016,528 | |
| | | | |
Net investment income (loss) | | | 14,672 | | | | (882,146 | ) |
| | | | |
| | | | | | | | |
| Realized and Unrealized Gain (Loss) | | | | | | | | |
Net realized gain (loss) from: | | | | | | | | |
Investments | | | 137,848 | | | | — | |
Financial futures contracts | | | (331 | ) | | | — | |
Investments and financial futures contracts allocated from the Master Portfolio | | | — | | | | 7,735,382 | |
| | | | |
| | | 137,517 | | | | 7,735,382 | |
| | | | |
Net change in unrealized appreciation/depreciation on: | | | | | | | | |
Investments | | | (56,343 | )1 | | | — | |
Financial futures contracts | | | 8,790 | | | | — | |
Investments and financial futures contracts allocated from the Master Portfolio | | | — | | | | (1,631,609 | ) |
| | | | |
| | | (47,553 | ) | | | (1,631,609 | ) |
| | | | |
Net realized and unrealized gain | | | 89,964 | | | | 6,103,773 | |
| | | | |
Net Increase in Net Assets Resulting from Operations | | $ | 104,636 | | | $ | 5,221,627 | |
| | | | |
| | 1 | | Net of ($110) foreign capital gain tax. |
See Notes to Financial Statements.
| | | | | | |
| | | SEMI-ANNUAL REPORT | | NOVEMBER 30, 2014 | | 17 |
| | |
| Statements of Changes in Net Assets | | |
| | | | | | | | | | | | | | | | |
| | | BlackRock Disciplined
Small Cap Core Fund | | | BlackRock Small Cap
Growth Fund II | |
| Increase (Decrease) in Net Assets: | | Six Months Ended
November 30, 2014
(Unaudited) | | | Year Ended
May 31, 2014 | | | Six Months
Ended
November 30,
2014
(Unaudited) | | | Year Ended
May 31, 2014 | |
| | | | | | | | | | | | | | | | |
| Operations | | | | | | | | | | | | | | | | |
Net investment income (loss) | | $ | 14,672 | | | $ | 34,302 | | | $ | (882,146 | ) | | $ | (2,058,841 | ) |
Net realized gain | | | 137,517 | | | | 730,831 | | | | 7,735,382 | | | | 47,784,879 | |
Net change in unrealized appreciation/depreciation | | | (47,553 | ) | | | 352,393 | | | | (1,631,609 | ) | | | (1,607,784 | ) |
| | | | | | | | |
Net increase in net assets resulting from operations | | | 104,636 | | | | 1,117,526 | | | | 5,221,627 | | | | 44,118,254 | |
| | | | | | | | |
| | | | | | | | | | | | | | | | |
| Distributions to Shareholders From1 | | | | | | | | | | | | | | | | |
Net investment income: | | | | | | | | | | | | | | | | |
Institutional | | | — | | | | (74,355 | ) | | | — | | | | — | |
Investor A | | | — | | | | (1,244 | ) | | | — | | | | — | |
Investor C | | | — | | | | (401 | ) | | | — | | | | — | |
Net realized gain: | | | | | | | | | | | | | | | | |
Institutional | | | (432,478 | ) | | | (275,293 | ) | | | (7,226,476 | ) | | | (15,959,070 | ) |
Investor A | | | (64,919 | ) | | | (5,149 | ) | | | (7,779,738 | ) | | | (18,003,108 | ) |
Investor B | | | — | | | | — | | | | (131,700 | ) | | | (505,040 | ) |
Investor C | | | (7,777 | ) | | | (2,615 | ) | | | (5,263,803 | ) | | | (11,680,736 | ) |
Class R | | | — | | | | — | | | | (2,975,033 | ) | | | (7,688,189 | ) |
| | | | | | | | |
Decrease in net assets resulting from distributions to shareholders | | | (505,174 | ) | | | (359,057 | ) | | | (23,376,750 | ) | | | (53,836,143 | ) |
| | | | | | | | |
| | | | | | | | | | | | | | | | |
| Capital Share Transactions | | | | | | | | | | | | | | | | |
Net increase in net assets derived from capital share transactions | | | 502,628 | | | | 1,114,412 | | | | 8,548,895 | | | | 25,396,774 | |
| | | | | | | | |
| | | | | | | | | | | | | | | | |
| Net Assets | | | | | | | | | | | | | | | | |
Total increase (decrease) in net assets | | | 102,090 | | | | 1,872,881 | | | | (9,606,228 | ) | | | 15,678,885 | |
Beginning of period | | | 7,094,971 | | | | 5,222,090 | | | | 231,593,690 | | | | 215,914,805 | |
| | | | | | | | |
End of period | | $ | 7,197,061 | | | $ | 7,094,971 | | | $ | 221,987,462 | | | $ | 231,593,690 | |
| | | | | | | | |
Undistributed (distributions in excess of/accumulated) net investment income (loss), end of period | | $ | 13,572 | | | $ | (1,100 | ) | | $ | (870,216 | ) | | $ | 11,930 | |
| | | | | | | | |
| | 1 | | Distributions for annual periods determined in accordance with federal income tax regulations. |
See Notes to Financial Statements.
| | | | | | |
| 18 | | SEMI-ANNUAL REPORT | | NOVEMBER 30, 2014 | | |
| | | | |
| Financial Highlights | | | BlackRock Disciplined Small Cap Core Fund | |
| | | | | | | | | | | | | | | | | | | | | | | | | | | | | | | | | | | | |
| | | Institutional | | | Investor A | | | Investor C | |
| | | Six Months
Ended
November 30,
2014
(Unaudited) | | | Year Ended May 31, 2014 | | | Period
March 14,
20131 to
May 31,
2013 | | | Six Months
Ended
November 30,
2014
(Unaudited) | | | Year
Ended
May 31,
2014 | | | Period
March 14,
20131 to
May 31,
2013 | | | Six Months
Ended
November 30,
2014
(Unaudited) | | | Year Ended May 31, 2014 | | | Period
March 14, 20131 to May 31,
2013 | |
| | | | | | | | | | | | | | | | | | | | | | | | | | | | | | | | | | | | |
| Per Share Operating Performance | | | | | | | | | | | | | | | | | | | | | | | | | | | | | | | | | | | | |
Net asset value, beginning of period | | $ | 11.80 | | | $ | 10.37 | | | $ | 10.00 | | | $ | 11.78 | | | $ | 10.37 | | | $ | 10.00 | | | $ | 11.71 | | | $ | 10.35 | | | $ | 10.00 | |
| | | | | | | | | | | | |
Net investment income (loss)2 | | | 0.03 | | | | 0.07 | | | | 0.02 | | | | 0.01 | | | | (0.01 | ) | | | 0.01 | | | | (0.03 | ) | | | (0.06 | ) | | | (0.00 | )3 |
Net realized and unrealized gain | | | 0.15 | | | | 2.06 | | | | 0.35 | | | | 0.15 | | | | 2.10 | | | | 0.36 | | | | 0.16 | | | | 2.05 | | | | 0.35 | |
| | | | | | | | | | | | |
Net increase from investment operations | | | 0.18 | | | | 2.13 | | | | 0.37 | | | | 0.16 | | | | 2.09 | | | | 0.37 | | | | 0.13 | | | | 1.99 | | | | 0.35 | |
| | | | | | | | | | | | |
Distributions from:4 | | | | | | | | | | | | | | | | | | | | | | | | | | | | | | | | | | | | |
Net investment income | | | — | | | | (0.15 | ) | | | — | | | | — | | | | (0.13 | ) | | | — | | | | — | | | | (0.08 | ) | | | — | |
Net realized gain | | | (0.84 | ) | | | (0.55 | ) | | | — | | | | (0.83 | ) | | | (0.55 | ) | | | — | | | | (0.81 | ) | | | (0.55 | ) | | | — | |
| | | | | | | | | | | | |
Total distributions | | | (0.84 | ) | | | (0.70 | ) | | | — | | | | (0.83 | ) | | | (0.68 | ) | | | — | | | | (0.81 | ) | | | (0.63 | ) | | | — | |
| | | | | | | | | | | | |
Net asset value, end of period | | $ | 11.14 | | | $ | 11.80 | | | $ | 10.37 | | | $ | 11.11 | | | $ | 11.78 | | | $ | 10.37 | | | $ | 11.03 | | | $ | 11.71 | | | $ | 10.35 | |
| | | | | | | | | | | | |
| | | | | | | | | | | | | | | | | | | | | | | | | | | | | | | | | | | | |
| Total Return5 | | | | | | | | | | | | | | | | | | | | | | | | | | | | | | | | | | | | |
Based on net asset value | | | 1.49 | %6 | | | 20.85 | % | | | 3.70 | %6 | | | 1.34 | %6 | | | 20.49 | % | | | 3.70 | %6 | | | 1.09 | %6 | | | 19.53 | % | | | 3.50 | %6 |
| | | | | | | | | | | | |
| | | | | | | | | | | | | | | | | | | | | | | | | | | | | | | | | | | | |
| Ratios to Average Net Assets | | | | | | | | | | | | | | | | | | | | | | | | | | | | | | | | | | | | |
Total expenses | | | 3.80 | %7 | | | 6.26 | % | | | 7.68 | %7,8 | | | 4.18 | %7 | | | 8.25 | % | | | 8.16 | %7,8 | | | 4.94 | %7 | | | 7.86 | % | | | 8.91 | %7,8 |
| | | | | | | | | | | | |
Total expenses after fees waived and/or reimbursed | | | 0.71 | %7,9 | | | 0.71 | %10 | | | 0.70 | %7 | | | 0.96 | %7,9 | | | 0.95 | % | | | 0.95 | %7 | | | 1.71 | %7,9 | | | 1.71 | %10 | | | 1.70 | %7 |
| | | | | | | | | | | | |
Net investment income (loss) | | | 0.47 | %7 | | | 0.61 | % | | | 0.93 | %7 | | | 0.21 | %7 | | | (0.11 | )% | | | 0.67 | %7 | | | (0.53 | )%7 | | | (0.53 | )% | | | (0.08 | )%7 |
| | | | | | | | | | | | |
| | | | | | | | | | | | | | | | | | | | | | | | | | | | | | | | | | | | |
| Supplemental Data | | | | | | | | | | | | | | | | | | | | | | | | | | | | | | | | | | | | |
Net assets, end of period (000) | | $ | 5,800 | | | $ | 6,095 | | | $ | 5,181 | | | $ | 1,267 | | | $ | 899 | | | $ | 21 | | | $ | 131 | | | $ | 101 | | | $ | 21 | |
| | | | | | | | | | | | |
Portfolio turnover rate | | | 84 | % | | | 145 | % | | | 67 | % | | | 84 | % | | | 145 | % | | | 67 | % | | | 84 | % | | | 145 | % | | | 67 | % |
| | | | | | | | | | | | |
| | 1 | | Commencement of operations. |
| | 2 | | Based on average shares outstanding. |
| | 3 | | Amount is greater than $(0.005) per share. |
| | 4 | | Distributions for annual periods determined in accordance with federal income tax regulations. |
| | 5 | | Where applicable, excludes the effects of any sales charges and assumes the reinvestment of distributions. |
| | 6 | | Aggregate total return. |
| | 8 | | Organization costs were not annualized in the calculation of the expense ratios. If these expenses were annualized, the total expenses for Institutional, Investor A and Investor C would have been 8.75%, 9.23% and 9.98%, respectively. |
| | 9 | | Includes certain tax expenses. Excluding such tax expenses, total expenses after fees waived and/or reimbursed would have been 0.70%, 0.95% and 1.70% for Institutional, Investor A and Investor C, respectively. |
| | 10 | | Includes certain tax expenses. Excluding such tax expenses, total expenses after fees waived and/or reimbursed would have been 0.70% and 1.70% for Institutional and Investor C, respectively. |
See Notes to Financial Statements.
| | | | | | |
| | | SEMI-ANNUAL REPORT | | NOVEMBER 30, 2014 | | 19 |
| | | | |
| Financial Highlights | | | BlackRock Small Cap Growth Fund II | |
| | | | | | | | | | | | | | | | | | | | | | | | |
| | | Institutional | |
| | | Six Months
Ended
November 30, 2014 (Unaudited) | | | Year Ended May 31, | |
| | | | 2014 | | | 2013 | | | 2012 | | | 2011 | | | 2010 | |
| | | | | | | | | | | | | | | | | | | | | | | | |
| Per Share Operating Performance | | | | | |
Net asset value, beginning of period | | $ | 14.63 | | | $ | 15.20 | | | $ | 13.22 | | | $ | 15.67 | | | $ | 11.64 | | | $ | 9.27 | |
| | | | |
Net investment loss1 | | | (0.03 | ) | | | (0.06 | ) | | | (0.01 | ) | | | (0.12 | ) | | | (0.13 | ) | | | (0.11 | ) |
Net realized and unrealized gain (loss) | | | 0.38 | | | | 3.00 | | | | 3.72 | | | | (2.03 | ) | | | 4.16 | 2 | | | 2.48 | 2 |
| | | | |
Net increase (decrease) from investment operations | | | 0.35 | | | | 2.94 | | | | 3.71 | | | | (2.15 | ) | | | 4.03 | | | | 2.37 | |
| | | | |
Distributions from net realized gain3 | | | (1.41 | ) | | | (3.51 | ) | | | (1.73 | ) | | | (0.30 | ) | | | — | | | | — | |
| | | | |
Net asset value, end of period | | $ | 13.57 | | | $ | 14.63 | | | $ | 15.20 | | | $ | 13.22 | | | $ | 15.67 | | | $ | 11.64 | |
| | | | |
| | | | | | | | | | | | | | | | | | | | | | | | |
| Total Return4 | | | | | |
Based on net asset value | | | 2.52 | %5 | | | 21.70 | % | | | 30.95 | % | | | (13.97 | )% | | | 34.62 | %6 | | | 25.57 | %7 |
| | | | |
| | | | | | | | | | | | | | | | | | | | | | | | |
| Ratios to Average Net Assets8 | | | | | |
Total expenses | | | 1.13 | %9,10 | | | 1.14 | %10 | | | 1.26 | %11 | | | 1.29 | %12 | | | 1.24 | %12 | | | 1.31 | % |
| | | | |
Net investment loss | | | (0.38 | )%9 | | | (0.41 | )% | | | (0.04 | )% | | | (0.84 | )% | | | (0.99 | )% | | | (1.03 | )% |
| | | | |
| | | | | | | | | | | | | | | | | | | | | | | | |
| Supplemental Data | | | | | |
Net assets, end of period (000) | | $ | 75,608 | | | $ | 74,962 | | | $ | 65,186 | | | $ | 58,673 | | | $ | 155,169 | | | $ | 106,530 | |
| | | | |
Portfolio turnover rate of the Master Portfolio | | | 83 | % | | | 152 | % | | | 165 | % | | | 143 | % | | | 127 | % | | | 114 | % |
| | | | |
| | 1 | | Based on average shares outstanding. |
| | 2 | | Includes redemption fees, which are less than $0.005 per share. |
| | 3 | | Distributions for annual periods determined in accordance with federal income tax regulations. |
| | 4 | | Where applicable, assumes the reinvestment of distributions. |
| | 5 | | Aggregate total return. |
| | 6 | | Includes redemption fees received by the Fund, which had no impact on the Fund’s total return. |
| | 7 | | Includes redemption fees received by the Fund, which had an impact of 0.01%. |
| | 8 | | Includes the Fund’s share of the Master Portfolio’s allocated net expenses and/or net investment loss. |
| | 10 | | Includes the Fund’s share of the Master Portfolio’s allocated fees waived of 0.16%. |
| | 11 | | Includes the Fund’s share of the Master Portfolio’s allocated fees waived of 0.01%. |
| | 12 | | Includes the Fund’s share of the Master Portfolio’s allocated fees waived of less than 0.01%. |
See Notes to Financial Statements.
| | | | | | |
| 20 | | SEMI-ANNUAL REPORT | | NOVEMBER 30, 2014 | | |
| | | | |
| Financial Highlights (continued) | | | BlackRock Small Cap Growth Fund II | |
| | | | | | | | | | | | | | | | | | | | | | | | |
| | | Investor A | |
| | | Six Months
Ended
November 30,
2014 (Unaudited) | | | Year Ended May 31, | |
| | | | 2014 | | | 2013 | | | 2012 | | | 2011 | | | 2010 | |
| | | | | | | | | | | | | | | | | | | | | | | | |
| Per Share Operating Performance | | | | | |
Net asset value, beginning of period | | $ | 13.93 | | | $ | 14.63 | | | $ | 12.81 | | | $ | 15.22 | | | $ | 11.34 | | | $ | 9.06 | |
| | | | |
Net investment loss1 | | | (0.04 | ) | | | (0.13 | ) | | | (0.05 | ) | | | (0.14 | ) | | | (0.16 | ) | | | (0.14 | ) |
Net realized and unrealized gain (loss) | | | 0.36 | | | | 2.88 | | | | 3.57 | | | | (1.97 | ) | | | 4.04 | 2 | | | 2.42 | 2 |
| | | | |
Net increase (decrease) from investment operations | | | 0.32 | | | | 2.75 | | | | 3.52 | | | | (2.11 | ) | | | 3.88 | | | | 2.28 | |
| | | | |
Distributions from net realized gain3 | | | (1.38 | ) | | | (3.45 | ) | | | (1.70 | ) | | | (0.30 | ) | | | — | | | | — | |
| | | | |
Net asset value, end of period | | $ | 12.87 | | | $ | 13.93 | | | $ | 14.63 | | | $ | 12.81 | | | $ | 15.22 | | | $ | 11.34 | |
| | | | |
| | | | | | | | | | | | | | | | | | | | | | | | |
| Total Return4 | | | | | |
Based on net asset value | | | 2.46 | %5 | | | 21.08 | % | | | 30.45 | % | | | (14.12 | )% | | | 34.22 | %6 | | | 25.17 | %7 |
| | | | |
| | | | | | | | | | | | | | | | | | | | | | | | |
| Ratios to Average Net Assets8 | | | | | |
Total expenses | | | 1.38 | %9,10 | | | 1.62 | %10 | | | 1.62 | %11 | | | 1.57 | %12 | | | 1.53 | %12 | | | 1.57 | % |
| | | | |
Net investment loss | | | (0.63 | )%9 | | | (0.88 | )% | | | (0.34 | )% | | | (1.11 | )% | | | (1.28 | )% | | | (1.29 | )% |
| | | | |
| | | | | | | | | | | | | | | | | | | | | | | | |
| Supplemental Data | | | | | |
Net assets, end of period (000) | | $ | 75,734 | | | $ | 80,144 | | | $ | 73,799 | | | $ | 75,467 | | | $ | 219,005 | | | $ | 184,897 | |
| | | | |
Portfolio turnover rate of the Master Portfolio | | | 83 | % | | | 152 | % | | | 165 | % | | | 143 | % | | | 127 | % | | | 114 | % |
| | | | |
| | 1 | | Based on average shares outstanding. |
| | 2 | | Includes redemption fees, which are less than $0.005 per share. |
| | 3 | | Distributions for annual periods determined in accordance with federal income tax regulations. |
| | 4 | | Where applicable, excludes the effects of any sales charges and assumes the reinvestment of distributions. |
| | 5 | | Aggregate total return. |
| | 6 | | Includes redemption fees received by the Fund, which had no impact on the Fund’s total return. |
| | 7 | | Includes redemption fees received by the Fund, which had an impact of 0.01%. |
| | 8 | | Includes the Fund’s share of the Master Portfolio’s allocated net expenses and/or net investment loss. |
| | 10 | | Includes the Fund’s share of the Master Portfolio’s allocated fees waived of 0.16%. |
| | 11 | | Includes the Fund’s share of the Master Portfolio’s allocated fees waived of 0.02%. |
| | 12 | | Includes the Fund’s share of the Master Portfolio’s allocated fees waived of less than 0.01%. |
See Notes to Financial Statements.
| | | | | | |
| | | SEMI-ANNUAL REPORT | | NOVEMBER 30, 2014 | | 21 |
| | | | |
| Financial Highlights (continued) | | | BlackRock Small Cap Growth Fund II | |
| | | | | | | | | | | | | | | | | | | | | | | | |
| | | Investor B | |
| | | Six Months
Ended
November 30,
2014 (Unaudited) | | | Year Ended May 31, | |
| | | | 2014 | | | 2013 | | | 2012 | | | 2011 | | | 2010 | |
| | | | | | | | | | | | | | | | | | | | | | | | |
| Per Share Operating Performance | | | | | |
Net asset value, beginning of period | | $ | 11.80 | | | $ | 12.79 | | | $ | 11.43 | | | $ | 13.77 | | | $ | 10.38 | | | $ | 8.39 | |
| | | | |
Net investment loss1 | | | (0.10 | ) | | | (0.19 | ) | | | (0.17 | ) | | | (0.27 | ) | | | (0.28 | ) | | | (0.25 | ) |
Net realized and unrealized gain (loss) | | | 0.28 | | | | 2.48 | | | | 3.14 | | | | (1.77 | ) | | | 3.67 | 2 | | | 2.24 | 2 |
| | | | |
Net increase (decrease) from investment operations | | | 0.18 | | | | 2.29 | | | | 2.97 | | | | (2.04 | ) | | | 3.39 | | | | 1.99 | |
| | | | |
Distributions from net realized gain3 | | | (1.35 | ) | | | (3.28 | ) | | | (1.61 | ) | | | (0.30 | ) | | | — | | | | — | |
| | | | |
Net asset value, end of period | | $ | 10.63 | | | $ | 11.80 | | | $ | 12.79 | | | $ | 11.43 | | | $ | 13.77 | | | $ | 10.38 | |
| | | | |
| | | | | | | | | | | | | | | | | | | | | | | | |
| Total Return4 | | | | | |
Based on net asset value | | | 1.70 | %5 | | | 20.29 | % | | | 28.99 | % | | | (15.12 | )% | | | 32.66 | %6 | | | 23.72 | %7 |
| | | | |
| | | | | | | | | | | | | | | | | | | | | | | | |
| Ratios to Average Net Assets8 | | | | | |
Total expenses | | | 2.52 | %9,10 | | | 2.40 | %9,10 | | | 2.79 | %11 | | | 2.72 | %12 | | | 2.71 | %12 | | | 2.78 | % |
| | | | |
Net investment loss | | | (1.77 | )%9 | | | (1.53 | )% | | | (1.50 | )% | | | (2.30 | )% | | | (2.46 | )% | | | (2.50 | )% |
| | | | |
| | | | | | | | | | | | | | | | | | | | | | | | |
| Supplemental Data | | | | | |
Net assets, end of period (000) | | $ | 1,048 | | | $ | 1,217 | | | $ | 2,350 | | | $ | 4,587 | | | $ | 8,363 | | | $ | 10,713 | |
| | | | |
Portfolio turnover rate of the Master Portfolio | | | 83 | % | | | 152 | % | | | 165 | % | | | 143 | % | | | 127 | % | | | 114 | % |
| | | | |
| | 1 | | Based on average shares outstanding. |
| | 2 | | Includes redemption fees, which are less than $0.005 per share. |
| | 3 | | Distributions for annual periods determined in accordance with federal income tax regulations. |
| | 4 | | Where applicable, excludes the effects of any sales charges and assumes the reinvestment of distributions. |
| | 5 | | Aggregate total return. |
| | 6 | | Includes redemption fees received by the Fund, which had no impact on the Fund’s total return. |
| | 7 | | Includes redemption fees received by the Fund, which had an impact of 0.01%. |
| | 8 | | Includes the Fund’s share of the Master Portfolio’s allocated net expenses and/or net investment loss. |
| | 10 | | Includes the Fund’s share of the Master Portfolio’s allocated fees waived of 0.16%. |
| | 11 | | Includes the Fund’s share of the Master Portfolio’s allocated fees waived of 0.01%. |
| | 12 | | Includes the Fund’s share of the Master Portfolio’s allocated fees waived of less than 0.01%. |
See Notes to Financial Statements.
| | | | | | |
| 22 | | SEMI-ANNUAL REPORT | | NOVEMBER 30, 2014 | | |
| | | | |
| Financial Highlights (continued) | | | BlackRock Small Cap Growth Fund II | |
| | | | | | | | | | | | | | | | | | | | | | | | |
| | | Investor C | |
| | | Six Months
Ended
November 30,
2014 (Unaudited) | | | Year Ended May 31, | |
| | | | 2014 | | | 2013 | | | 2012 | | | 2011 | | | 2010 | |
| | | | | | | | | | | | | | | | | | | | | | | | |
| Per Share Operating Performance | | | | | |
Net asset value, beginning of period | | $ | 11.71 | | | $ | 12.79 | | | $ | 11.44 | | | $ | 13.76 | | | $ | 10.35 | | | $ | 8.35 | |
| | | | |
Net investment loss1 | | | (0.08 | ) | | | (0.19 | ) | | | (0.15 | ) | | | (0.25 | ) | | | (0.26 | ) | | | (0.23 | ) |
Net realized and unrealized gain (loss) | | | 0.29 | | | | 2.47 | | | | 3.15 | | | | (1.77 | ) | | | 3.67 | 2 | | | 2.23 | 2 |
| | | | |
Net increase (decrease) from investment operations | | | 0.21 | | | | 2.28 | | | | 3.00 | | | | (2.02 | ) | | | 3.41 | | | | 2.00 | |
| | | | |
Distributions from net realized gain3 | | | (1.36 | ) | | | (3.36 | ) | | | (1.65 | ) | | | (0.30 | ) | | | — | | | | — | |
| | | | |
Net asset value, end of period | | $ | 10.56 | | | $ | 11.71 | | | $ | 12.79 | | | $ | 11.44 | | | $ | 13.76 | | | $ | 10.35 | |
| | | | |
| | | | | | | | | | | | | | | | | | | | | | | | |
| Total Return4 | | | | | |
Based on net asset value | | | 1.97 | %5 | | | 20.24 | % | | | 29.31 | % | | | (14.98 | )% | | | 32.95 | %6 | | | 23.95 | %7 |
| | | | |
| | | | | | | | | | | | | | | | | | | | | | | | |
| Ratios to Average Net Assets8 | | | | | |
Total expenses | | | 2.29 | %9,10 | | | 2.30 | %9,10 | | | 2.52 | %11 | | | 2.52 | %12 | | | 2.48 | %12 | | | 2.59 | % |
| | | | |
Net investment loss | | | (1.54 | )%9 | | | (1.55 | )% | | | (1.29 | )% | | | (2.10 | )% | | | (2.24 | )% | | | (2.32 | )% |
| | | | |
| | | | | | | | | | | | | | | | | | | | | | | | |
| Supplemental Data | | | | | |
Net assets, end of period (000) | | $ | 43,966 | | | $ | 45,686 | | | $ | 43,649 | | | $ | 40,529 | | | $ | 62,040 | | | $ | 60,833 | |
| | | | |
Portfolio turnover rate of the Master Portfolio | | | 83 | % | | | 152 | % | | | 165 | % | | | 143 | % | | | 127 | % | | | 114 | % |
| | | | |
| | 1 | | Based on average shares outstanding. |
| | 2 | | Includes redemption fees, which are less than $0.005 per share. |
| | 3 | | Distributions for annual periods determined in accordance with federal income tax regulations. |
| | 4 | | Where applicable, excludes the effects of any sales charges and assumes the reinvestment of distributions. |
| | 5 | | Aggregate total return. |
| | 6 | | Includes redemption fees received by the Fund, which had no impact on the Fund’s total return. |
| | 7 | | Includes redemption fees received by the Fund, which had an impact of 0.01%. |
| | 8 | | Includes the Fund’s share of the Master Portfolio’s allocated net expenses and/or net investment loss. |
| | 10 | | Includes the Fund’s share of the Master Portfolio’s allocated fees waived of 0.16%. |
| | 11 | | Includes the Fund’s share of the Master Portfolio’s allocated fees waived of 0.02%. |
| | 12 | | Includes the Fund’s share of the Master Portfolio’s allocated fees waived of less than 0.01%. |
See Notes to Financial Statements.
| | | | | | |
| | | SEMI-ANNUAL REPORT | | NOVEMBER 30, 2014 | | 23 |
| | | | |
| Financial Highlights (concluded) | | | BlackRock Small Cap Growth Fund II | |
| | | | | | | | | | | | | | | | | | | | | | | | |
| | | Class R | |
| | | Six Months
Ended
November 30,
2014 (Unaudited) | | | Year Ended May 31, | |
| | | | 2014 | | | 2013 | | | 2012 | | | 2011 | | | 2010 | |
| | | | | | | | | | | | | | | | | | | | | | | | |
| Per Share Operating Performance | | | | | |
Net asset value, beginning of period | | $ | 12.95 | | | $ | 13.80 | | | $ | 12.19 | | | $ | 14.55 | | | $ | 10.88 | | | $ | 8.72 | |
| | | | |
Net investment loss1 | | | (0.06 | ) | | | (0.12 | ) | | | (0.08 | ) | | | (0.19 | ) | | | (0.20 | ) | | | (0.17 | ) |
Net realized and unrealized gain (loss) | | | 0.32 | | | | 2.70 | | | | 3.38 | | | | (1.87 | ) | | | 3.87 | 2 | | | 2.33 | 2 |
| | | | |
Net increase (decrease) from investment operations | | | 0.26 | | | | 2.58 | | | | 3.30 | | | | (2.06 | ) | | | 3.67 | | | | 2.16 | |
| | | | |
Distributions from net realized gain3 | | | (1.38 | ) | | | (3.43 | ) | | | (1.69 | ) | | | (0.30 | ) | | | — | | | | — | |
| | | | |
Net asset value, end of period | | $ | 11.83 | | | $ | 12.95 | | | $ | 13.80 | | | $ | 12.19 | | | $ | 14.55 | | | $ | 10.88 | |
| | | | |
| | | | | | | | | | | | | | | | | | | | | | | | |
| Total Return4 | | | | | |
Based on net asset value | | | 2.19 | %5 | | | 21.07 | % | | | 30.05 | % | | | (14.43 | )% | | | 33.73 | %6 | | | 24.77 | %7 |
| | | | |
| | | | | | | | | | | | | | | | | | | | | | | | |
| Ratios to Average Net Assets8 | | | | | |
Total expenses | | | 1.73 | %9,10 | | | 1.67 | %10 | | | 1.89 | %11 | | | 1.91 | %12 | | | 1.90 | %12 | | | 1.96 | % |
| | | | |
Net investment loss | | | (0.98 | )%9 | | | (0.92 | )% | | | (0.60 | )% | | | (1.49 | )% | | | (1.65 | )% | | | (1.69 | )% |
| | | | |
| | | | | | | | | | | | | | | | | | | | | | | | |
| Supplemental Data | | | | | |
Net assets, end of period (000) | | $ | 25,632 | | | $ | 29,585 | | | $ | 30,932 | | | $ | 37,237 | | | $ | 59,251 | | | $ | 52,704 | |
| | | | |
Portfolio turnover rate of the Master Portfolio | | | 83 | % | | | 152 | % | | | 165 | % | | | 143 | % | | | 127 | % | | | 114 | % |
| | | | |
| | 1 | | Based on average shares outstanding. |
| | 2 | | Includes redemption fees, which are less than $0.005 per share. |
| | 3 | | Distributions for annual periods determined in accordance with federal income tax regulations. |
| | 4 | | Where applicable, assumes the reinvestment of distributions. |
| | 5 | | Aggregate total return. |
| | 6 | | Includes redemption fees received by the Fund, which had no impact on the Fund’s total return. |
| | 7 | | Includes redemption fees received by the Fund, which had an impact of 0.01%. |
| | 8 | | Includes the Fund’s share of the Master Portfolio’s allocated net expenses and/or net investment loss. |
| | 10 | | Includes the Fund’s share of the Master Portfolio’s allocated fees waived of 0.16%. |
| | 11 | | Includes the Fund’s share of the Master Portfolio’s allocated fees waived of 0.01%. |
| | 12 | | Includes the Fund’s share of the Master Portfolio’s allocated fees waived of less than 0.01%. |
See Notes to Financial Statements.
| | | | | | |
| 24 | | SEMI-ANNUAL REPORT | | NOVEMBER 30, 2014 | | |
| | |
| Notes to Financial Statements (Unaudited) | | |
1. Organization:
BlackRock Disciplined Small Cap Core Fund (“Disciplined Small Cap Core Fund”), a series of BlackRock FundsSM (the “Trust”), and BlackRock Small Cap Growth Fund II (“Small Cap Growth Fund II”), a series of BlackRock Series, Inc. (the “Corporation”) (collectively, the “Funds” or individually, a “Fund”), are each registered under the Investment Company Act of 1940, as amended (the “1940 Act”), as a diversified, open-end management investment company. The Trust is organized as a Massachusetts business trust. The Corporation is organized as a Maryland corporation. Small Cap Growth Fund II seeks to achieve its investment objective by investing all of its assets in BlackRock Master Small Cap Growth Portfolio (the “Master Portfolio”) of BlackRock Master LLC (the “Master LLC”), an affiliate of Small Cap Growth Fund II, which has the same investment objective and strategies as Small Cap Growth Fund II. The value of Small Cap Growth Fund II’s investment in the Master Portfolio reflects Small Cap Growth Fund II’s proportionate interest in the net assets of the Master Portfolio. The performance of Small Cap Growth Fund II is directly affected by the performance of the Master Portfolio. The percentage of the Master Portfolio owned by Small Cap Growth Fund II at November 30, 2014 was 100%. As such, the financial statements of the Master Portfolio, including the Schedule of Investments, are included elsewhere in this report and should be read in conjunction with Small Cap Growth Fund II’s financial statements.
Each Fund offers multiple classes of shares. All classes of shares have identical voting, dividend, liquidation and other rights and are subject to the same terms and conditions, except that each bears certain expenses and may have a conversion privilege as outlined below. Institutional Shares are sold only to certain eligible investors. Investor B and Class R Shares are only available through exchanges and distribution reinvestments by current holders and for purchase by certain employer-sponsored retirement plans. Investor A and Investor C shares are generally available through financial intermediaries. Each class has exclusive voting rights with respect to matters relating to its shareholder servicing and distribution expenditures (except that Investor B shareholders may vote on material changes to the Investor A distribution and service plan). For distribution and service fee breakdown see Note 5.
| | | | | | |
| Share Name | | Initial Sales Charge | | CDSC | | Conversion |
Institutional Shares | | No | | No | | None |
Investor A Shares | | Yes | | No1 | | None |
Investor B Shares | | No | | Yes | | To Investor A Shares after 8 years |
Investor C Shares | | No | | Yes | | None |
Class R Shares | | No | | No | | None |
| | 1 | | Investor A Shares may be subject to a CDSC for certain redemptions where no initial sales charge was paid at the time of purchase. |
Disciplined Small Cap Core Fund, together with certain other registered investment companies advised by the Manager or its affiliates, are included in a complex of open-end funds referred to as the Equity-Liquidity Complex.
2. Significant Accounting Policies:
The Funds’ financial statements are prepared in conformity with accounting principles generally accepted in the United States of America (“U.S. GAAP”), which may require management to make estimates and assumptions that affect the reported amounts of assets and liabilities in the financial statements and the reported amounts of increases and decreases in net assets from operations during the reporting period. Actual results could differ from those estimates. Each Fund is considered an investment company under U.S. GAAP and follows the accounting and reporting guidance applicable to investment companies. The following is a summary of significant accounting policies followed by the Funds:
Valuation: Disciplined Small Cap Core Fund’s investments are valued at fair value as of the close of trading on the New York Stock Exchange (“NYSE”) (generally 4:00 p.m., Eastern time) (or if the reporting date falls on a day the NYSE is closed, investments are valued at fair value as of the report date). U.S. GAAP defines fair value as the price the Funds would receive to sell an asset or pay to transfer a liability in an orderly transaction between market participants at the measurement date. Disciplined Small Cap Core Fund determines the fair values of its financial instruments at market value using independent dealers or pricing services under policies approved by the Board of Trustees of the Trust (the “Board”). The BlackRock Global Valuation Methodologies Committee (the “Global Valuation Committee”) is the committee formed by management to develop global pricing policies and procedures and to provide oversight of the pricing function for Disciplined Small Cap Core Fund for all financial instruments.
Small Cap Growth Fund II’s policy is to fair value its financial instruments at market value. Small Cap Growth Fund II records its investment in the Master Portfolio at fair value based on Small Cap Growth Fund II’s proportionate interest in the net assets of the Master Portfolio. Valuation of securities held by the Master Portfolio is discussed in Note 2 of the Master Portfolio’s Notes to Financial Statements, which are included elsewhere in this report.
Disciplined Small Cap Core Fund’s equity investments traded on a recognized securities exchange are valued at the official close each day, if available. For equity investments traded on more than one exchange, the official close price on the exchange where the stock is primarily traded is used. Equity investments traded on a recognized exchange for which there were no sales on that day may be valued at the last available bid (long positions)
| | | | | | |
| | | SEMI-ANNUAL REPORT | | NOVEMBER 30, 2014 | | 25 |
| | |
| Notes to Financial Statements (continued) | | |
or ask (short positions) price. Financial futures contracts traded on exchanges are valued at their last sale price. Investments in open-end registered investment companies are valued at NAV each business day.
Disciplined Small Cap Core Fund values its investment in BlackRock Liquidity Series, LLC, Money Market Series (the “Money Market Series”) at fair value, which is ordinarily based upon its pro rata ownership in the underlying fund’s net assets. The Money Market Series seeks current income consistent with maintaining liquidity and preserving capital. Although the Money Market Series is not registered under the 1940 Act, its investments will follow the parameters of investments by a money market fund that is subject to Rule 2a-7 under the 1940 Act. Disciplined Small Cap Core Fund may withdraw up to 25% of its investment daily, although the manager of the Money Market Series, in its sole discretion, may permit an investor to withdraw more than 25% on any one day.
In the event that the application of these methods of valuation results in a price for an investment that is deemed not to be representative of the market value of such investment, or if a price is not available, the investment will be valued by the Global Valuation Committee, or its delegate, in accordance with a policy approved by the Board as reflecting fair value (“Fair Value Investments”). When determining the price for Fair Value Investments, the Global Valuation Committee, or its delegate, seeks to determine the price that Disciplined Small Cap Core Fund might reasonably expect to receive or pay from the current sale or purchase of that asset or liability in an arm’s-length transaction. Fair value determinations shall be based upon all available factors that the Global Valuation Committee, or its delegate, deems relevant consistent with the principles of fair value measurement, which include the market approach, income approach and/or in the case of recent investments, the cost approach, as appropriate. The market approach generally consists of using comparable market transactions. The income approach generally is used to discount future cash flows to present value and is adjusted for liquidity as appropriate. These factors include but are not limited to: (i) attributes specific to the investment or asset; (ii) the principal market for the investment or asset; (iii) the customary participants in the principal market for the investment or asset; (iv) data assumptions by market participants for the investment or asset, if reasonably available; (v) quoted prices for similar investments or assets in active markets; and (vi) other factors, such as future cash flows, interest rates, yield curves, volatilities, prepayment speeds, loss severities, credit risks, recovery rates, liquidation amounts and/or default rates. Due to the inherent uncertainty of valuations of such investments, the fair values may differ from the values that would have been used had an active market existed. The Global Valuation Committee, or its delegate, employs various methods for calibrating valuation approaches for investments where an active market does not exist, including regular due diligence of the Disciplined Small Cap Core Fund’s pricing vendors, regular reviews of key inputs and assumptions, transactional back-testing or disposition analysis to compare unrealized gains and losses to realized gains and losses, reviews of missing or stale prices and large movements in market values and reviews of any market related activity. The pricing of all Fair Value Investments is subsequently reported to the Board or a committee thereof on a quarterly basis.
Segregation and Collateralization: In cases where Disciplined Small Cap Core Fund enters into certain investments (e.g., financial futures contracts) that would be “senior securities” for 1940 Act purposes, Disciplined Small Cap Core Fund may segregate or designate on its books and records cash or liquid securities having a market value at least equal to the amount of Disciplined Small Cap Core Fund’s future obligations under such investments. Doing so allows the investment to be excluded from treatment as a “senior security.” Furthermore, if required by an exchange or counterparty agreement, Disciplined Small Cap Core Fund may be required to deliver/deposit cash and/or securities to/with an exchange, or broker-dealer or custodian as collateral for certain investments or obligations.
Investment Transactions and Investment Income: For Disciplined Small Cap Core Fund, for financial reporting purposes, investment transactions are recorded on the dates the transactions are entered into (the trade dates). Realized gains and losses on investment transactions are determined on the identified cost basis. Dividend income is recorded on the ex-dividend date. Upon notification from issuers, some of the dividend income received from a real estate investment trust may be redesignated as a reduction of cost of the related investment and/or realized gain. For Small Cap Growth Fund II, for financial reporting purposes, contributions to and withdrawals from the Master Portfolio are accounted on a trade date basis. Small Cap Growth Fund II records daily its proportionate share of the Master Portfolio’s income, expenses and realized and unrealized gains and losses. In addition, Small Cap Growth Fund II accrues its own expenses. Income, expenses and realized and unrealized gains and losses are allocated daily to each class based on its relative net assets.
Distributions: Distributions paid by the Funds are recorded on the ex-dividend dates. The character and timing of distributions are determined in accordance with federal income tax regulations, which may differ from U.S. GAAP.
Recent Accounting Standard: In June 2014, the Financial Accounting Standards Board issued guidance to improve the financial reporting of reverse repurchase agreements and other similar transactions. The guidance will require expanded disclosure for entities that enter into reverse repurchase agreements and similar transactions accounted for as secured borrowings. It is effective for financial statements with fiscal years beginning on or after December 15, 2014 and interim periods within those fiscal years. Management is evaluating the impact, if any, of this guidance on the Funds’ financial statement disclosures.
| | | | | | |
| 26 | | SEMI-ANNUAL REPORT | | NOVEMBER 30, 2014 | | |
| | |
| Notes to Financial Statements (continued) | | |
Other: Expenses directly related to a Fund or its classes are charged to that Fund or the applicable class. Other operating expenses shared by several funds are prorated among those funds on the basis of relative net assets or other appropriate methods. Expenses directly related to the Funds and other shared expenses prorated to the Funds are allocated daily to each class based on its relative net assets or other appropriate methods.
Disciplined Small Cap Core Fund has an arrangement with the custodian whereby fees may be reduced by credits earned on uninvested cash balances, which, if applicable, are shown as fees paid indirectly in the Statements of Operations. The custodian imposes fees on overdrawn cash balances, which can be offset by accumulated credits earned or may result in additional custody charges.
3. Securities and Other Investments:
Securities Lending: Disciplined Small Cap Core Fund may lend its securities to approved borrowers, such as brokers, dealers and other financial institutions. The borrower pledges and maintains with Disciplined Small Cap Core Fund collateral consisting of cash, an irrevocable letter of credit issued by a bank, or securities issued or guaranteed by the U.S. government. The initial collateral received by Disciplined Small Cap Core Fund is required to have a value of at least 102% of the current value of the loaned securities for securities traded on U.S. exchanges and a value of at least 105% for all other securities. The collateral is maintained thereafter at a value equal to at least 100% of the current market value of the securities on loan. The market value of the loaned securities is determined at the close of each business day of Disciplined Small Cap Core Fund and any additional required collateral is delivered to Disciplined Small Cap Core Fund on the next business day. During the term of the loan, Disciplined Small Cap Core Fund is entitled to all distributions made on or in respect of the loaned securities. Loans of securities are terminable at any time and the borrower, after notice, is required to return borrowed securities within the standard time period for settlement of securities transactions.
The market value of securities on loan and the value of the related collateral are shown separately in the Statements of Assets and Liabilities as a component of investments at value — unaffiliated, and collateral on securities loaned at value, respectively. As of November 30, 2014, any securities on loan were collateralized by cash. The cash collateral invested by the securities lending agent, BlackRock Investment Management, LLC (“BIM”), if any, is disclosed in the Schedule of Investments.
Securities lending transactions are entered into by Disciplined Small Cap Core Fund under Master Securities Lending Agreements (each, an “MSLA”) which provide the right, in the event of default (including bankruptcy or insolvency), for the non-defaulting party to liquidate the collateral and calculate a net exposure to the defaulting party or request additional collateral. In the event that a borrower defaults, Disciplined Small Cap Core Fund, as lender, would offset the market value of the collateral received against the market value of the securities loaned. When the value of the collateral is greater than that of the market value of the securities loaned, the lender is left with a net amount payable to the defaulting party. However, bankruptcy or insolvency laws of a particular jurisdiction may impose restrictions on or prohibitions against such a right of offset in the event of an MSLA counterparty’s bankruptcy or insolvency. Under the MSLA, the borrower can resell or re-pledge the loaned securities, and Disciplined Small Cap Core Fund can reinvest cash collateral, or, upon an event of default, resell or re-pledge the collateral.
The following table is a summary of Disciplined Small Cap Core Fund’s securities lending agreements by counterparty, which are subject to offset under an MSLA as of November 30, 2014:
| | | | | | | | | | |
| Counterparty | | Securities Loaned
at Value | | | Cash Collateral
Received1 | | | Net Amount |
JP Morgan Securities LLC | | $ | 95,585 | | | $ | (95,585 | ) | | — |
Morgan Stanley | | | 80,240 | | | | (80,240 | ) | | — |
SG Americas Securities LLC | | | 1,735 | | | | (1,735 | ) | | — |
| | | |
Total | | $ | 177,560 | | | $ | (177,560 | ) | | — |
| | | |
| | 1 | | Collateral with a value of $197,011 has been received in connection with securities lending agreements. Excess of collateral received from the individual counterparty is not shown for financial reporting purposes. |
The risks of securities lending include the risk that the borrower may not provide additional collateral when required or may not return the securities when due. To mitigate these risks, Disciplined Small Cap Core Fund benefits from a borrower default indemnity provided by BIM. BIM’s indemnity allows for full replacement of the securities lent if the collateral received does not cover the value on the securities loaned in the event of borrower default. Disciplined Small Cap Core Fund could suffer a loss if the value of an investment purchased with cash collateral falls below the market value of loaned securities or if the value of an investment purchased with cash collateral falls below the value of the original cash collateral received.
4. Derivative Financial Instruments:
Disciplined Small Cap Core Fund engages in various portfolio investment strategies using derivative contracts both to increase the returns of Disciplined Small Cap Core Fund and/or to economically hedge its exposure to certain risks such as equity risk. These contracts may be transacted on an exchange or over-the-counter (“OTC”).
| | | | | | |
| | | SEMI-ANNUAL REPORT | | NOVEMBER 30, 2014 | | 27 |
| | |
| Notes to Financial Statements (continued) | | |
Financial Futures Contracts: Disciplined Small Cap Core Fund purchases and/or sells financial futures contracts to gain exposure to, or economically hedge against, changes in the value of equity securities (equity risk). Financial futures contracts are agreements between Disciplined Small Cap Core Fund and a counterparty to buy or sell a specific quantity of an underlying instrument at a specified price and at a specified date. Depending on the terms of the particular contract, financial futures contracts are settled either through physical delivery of the underlying instrument on the settlement date or by payment of a cash settlement amount on the settlement date.
Upon entering into a financial futures contract, Disciplined Small Cap Core Fund is required to deposit initial margin with the broker in the form of cash or securities in an amount that varies depending on a contract’s size and risk profile. The initial margin deposit must then be maintained at an established level over the life of the contract. Securities deposited as initial margin are designated on the Schedule of Investments and cash deposited, if any, is recorded on the Statements of Assets and Liabilities as cash pledged for financial futures contracts. Pursuant to the contract, Disciplined Small Cap Core Fund agrees to receive from or pay to the broker an amount of cash equal to the daily fluctuation in value of the contract. Such receipts or payments are known as variation margin. Variation margin is recorded by Disciplined Small Cap Core Fund as unrealized appreciation or depreciation and, if applicable, as a receivable or payable for variation margin in the Statements of Assets and Liabilities.
When the contract is closed, Disciplined Small Cap Core Fund records a realized gain or loss equal to the difference between the value of the contract at the time it was opened and the value at the time it was closed. The use of financial futures contracts involves the risk of an imperfect correlation in the movements in the price of financial futures contracts and the underlying assets.
The following is a summary of Disciplined Small Cap Core Fund’s derivative financial instruments categorized by risk exposure:
|
| Fair Values of Derivative Financial Instruments as of November 30, 2014 |
| | | | |
| | | | Value |
| | | Statements of Assets and Liabilities Location | | Derivative
Assets |
| Equity contracts | | Net unrealized appreciation/depreciation1 | | $ 10,817 |
| | 1 | | Includes cumulative appreciation/depreciation on financial futures contracts as reported in the Schedule of Investments. Only current day’s variation margin is reported within the Statements of Assets and Liabilities. |
|
The Effect of Derivative Financial Instruments in the Statements of Operations Six Months Ended November 30, 2014 |
| | | | |
| | | Net Realized Loss From | | Net Change in Unrealized Appreciation/Depreciation on |
Equity contracts:
Financial futures contracts | | $(331) | | $8,790 |
For the six months ended November 30, 2014, the average quarterly balances of outstanding derivative financial instruments for Disciplined Small Cap Core Fund were as follows:
| | | | |
Financial futures contracts: | | | | |
Average number of contracts purchased | | | 1 | |
Average notional value of contracts purchased | | $ | 117,250 | |
Counterparty Credit Risk: A derivative contract may suffer a mark-to-market loss if the value of the contract decreases due to an unfavorable change in the market rates or values of the underlying instrument. Losses can also occur if the counterparty does not perform under the contract.
Disciplined Small Cap Core Fund’s risk of loss from counterparty credit risk on OTC derivatives is generally limited to the aggregate unrealized gain netted against any collateral held by Disciplined Small Cap Core Fund.
With exchange-traded futures, there is less counterparty credit risk to Disciplined Small Cap Core Fund since the exchange or clearinghouse, as counterparty to such instrument, guarantees against a possible default. The clearinghouse stands between the buyer and the seller of the contract; therefore, credit risk is limited to failure of the clearinghouse. While offset rights may exist under applicable law, Disciplined Small Cap Core Fund does not have a contractual right of offset against a clearing broker or clearinghouse in the event of a default (including the bankruptcy or insolvency) of the clearing broker or clearinghouse. Additionally, credit risk exists in exchange-traded futures with respect to initial and variation margin that is held in a clearing broker’s customer accounts. While clearing brokers are required to segregate customer margin from their own assets, in the event that a clearing broker becomes insolvent or goes into bankruptcy and at that time there is a shortfall in the aggregate amount of margin held by the clearing broker for all its clients, typically the shortfall would be allocated on a pro rata basis across all the clearing broker’s customers, potentially resulting in losses to Disciplined Small Cap Core Fund.
| | | | | | |
| 28 | | SEMI-ANNUAL REPORT | | NOVEMBER 30, 2014 | | |
| | |
| Notes to Financial Statements (continued) | | |
5. Investment Advisory Agreement and Other Transactions with Affiliates:
The PNC Financial Services Group, Inc. is the largest stockholder and an affiliate, for 1940 Act purposes, of BlackRock, Inc. (“BlackRock”).
The Trust, on behalf of Disciplined Small Cap Core Fund, entered into an Investment Advisory Agreement with the Manager, Disciplined Small Cap Core Fund’s investment advisor, an indirect, wholly owned subsidiary of BlackRock, to provide investment advisory services. The Manager is responsible for the management of Disciplined Small Cap Core Fund’s portfolio and provides the personnel, facilities, equipment and certain other services necessary to the operations of Disciplined Small Cap Core Fund. For such services, Disciplined Small Cap Core Fund pays the Manager a monthly fee based on a percentage of Disciplined Small Cap Core Fund’s average daily net assets at the following annual rates:
| | | | |
| Average Daily Net Assets | | Investment Advisory Fee | |
First $1 Billion | | | 0.45 | % |
$1 Billion - $3 Billion | | | 0.42 | % |
$3 Billion - $5 Billion | | | 0.41 | % |
$5 Billion - $10 Billion | | | 0.39 | % |
Greater than $10 Billion | | | 0.38 | % |
The Manager voluntarily agreed to waive its investment advisory fees by the amount of investment advisory fees Disciplined Small Cap Core Fund pays to the Manager indirectly through its investment in affiliated money market funds. However, the Manager does not waive its investment advisory fees by the amount of investment advisory fees paid in connection with Disciplined Small Cap Core Fund’s investments in other affiliated investment companies, if any. This amount is included in fees waived and/or reimbursed by Manager in the Statements of Operations. For the six months ended November 30, 2014, the amount waived was $44.
With respect to Disciplined Small Cap Core Fund, Prior to July 1, 2014, BlackRock Fund Advisors (“BFA”), an affiliate of the Manager, served as a sub-advisor to the Fund pursuant to sub-advisory agreements with the Manager, and received for its services a monthly fee from the Manager at an annual rate equal to a percentage of the investment advisory fees paid by each Fund to the Manager under the Investment Advisory Agreements. Effective July 1, 2014, the sub-advisory agreements between the Manager and BFA, with respect to the Fund, was terminated.
The Corporation, on behalf of Small Cap Growth Fund II, entered into an Administration Agreement with BlackRock Advisors, LLC (in such capacity, the “Administrator”), an indirect, wholly owned subsidiary of BlackRock, to provide administrative services (other than investment advice and related portfolio activities). For such services, Small Cap Growth Fund II pays the Administrator a monthly fee at an annual rate of 0.20% of the average daily value of Small Cap Growth Fund II’s net assets. Small Cap Growth Fund II does not pay an investment advisory fee or investment management fee.
Each Fund entered into a Distribution Agreement and a Distribution and Service Plan with BlackRock Investments, LLC (“BRIL”), an affiliate of the Manager/Administrator. Pursuant to the Distribution and Service Plan and in accordance with Rule 12b-1 under the 1940 Act, the Funds pay BRIL ongoing service and distribution fees. The fees are accrued daily and paid monthly at annual rates based upon the average daily net assets of the relevant share class of each Fund as follows:
| | | | | | | | | | | | | | | | |
| | | Investor A | | | Investor B | | | Investor C | | | Class R | |
Service Fee | | | 0.25 | % | | | 0.25 | % | | | 0.25 | % | | | 0.25 | % |
Distribution Fee | | | — | | | | 0.75 | % | | | 0.75 | % | | | 0.25 | % |
Pursuant to sub-agreements with BRIL, broker-dealers and BRIL provide shareholder servicing and distribution services to each Fund. The ongoing service and/or distribution fee compensates BRIL and each broker-dealer for providing shareholder servicing and/or distribution related services to Investor A, Investor B, Investor C and Class R shareholders.
For the six months ended November 30, 2014, the following table shows the class specific service and distribution fees borne directly by each class of each Fund:
| | | | | | | | | | | | | | | | | | | | |
| | | Investor A | | | Investor B | | | Investor C | | | Class R | | | Total | |
Disciplined Small Cap Core Fund | | $ | 1,338 | | | | — | | | $ | 641 | | | | — | | | $ | 1,979 | |
Small Cap Growth Fund II | | $ | 97,934 | | | $ | 5,631 | | | $ | 225,907 | | | $ | 68,823 | | | $ | 398,295 | |
| | | | | | |
| | | SEMI-ANNUAL REPORT | | NOVEMBER 30, 2014 | | 29 |
| | |
| Notes to Financial Statements (continued) | | |
Pursuant to written agreements, certain financial intermediaries, some of which may be affiliates, provide the Funds with sub-accounting, recordkeeping, sub-transfer agency and other administrative services with respect to sub-accounts they service. For these services, these entities receive an asset based fee or an annual fee per shareholder account, which will vary depending on share class and/or net assets.
The Manager maintains a call center, which is responsible for providing certain shareholder services to the Funds, such as responding to shareholder inquiries and processing transactions based upon instructions from shareholders with respect to the subscription and redemption of Fund shares. For the six months ended November 30, 2014, each Fund reimbursed the Manager the following amounts for costs incurred in running the call center, which are included in transfer agent — class specific in the Statements of Operations:
| | | | | | | | | | | | | | | | | | | | | | | | |
| | | Institutional | | | Investor A | | | Investor B | | | Investor C | | | Class R | | | Total | |
Disciplined Small Cap Core Fund | | $ | 30 | | | $ | 32 | | | | — | | | $ | 5 | | | | — | | | $ | 67 | |
Small Cap Growth Fund II | | $ | 69 | | | $ | 631 | | | $ | 28 | | | $ | 272 | | | $ | 58 | | | $ | 1,058 | |
For the six months ended November 30, 2014, the following table shows the class specific transfer agent fees borne directly by each class of each Fund:
| | | | | | | | | | | | | | | | | | | | | | | | |
| | | Institutional | | | Investor A | | | Investor B | | | Investor C | | | Class R | | | Total | |
Disciplined Small Cap Core Fund | | $ | 213 | | | $ | 826 | | | | — | | | $ | 103 | | | | — | | | $ | 1,142 | |
Small Cap Growth Fund II | | $ | 80,982 | | | $ | 81,898 | | | $ | 3,382 | | | $ | 83,467 | | | $ | 43,078 | | | $ | 292,807 | |
BNY Mellon Investment Servicing (US) Inc. (“BNYMIS”) and the Manager act as co-administrators for Disciplined Small Cap Core Fund. For these services, the co-administrators receive an administration fee computed daily and payable monthly to each administrator pursuant to separate fee arrangements, based on a percentage of the average daily net assets of Disciplined Small Cap Core Fund. The combined administration fee, which is shown as administration in the Statements of Operations, is paid at the following annual rates. In addition, each of Disciplined Small Cap Core Fund’s share classes is charged an administration fee, which is shown as administration — class specific in the Statements of Operations, based on the following percentages of average daily net assets of each respective class:
| | | | | | | | |
| Average Daily Net Assets | | Administration Fee | | | Administration Fee —
Class Specific | |
First $500 Million | | | 0.075 | % | | | 0.025 | % |
$500 Million - $1 Billion | | | 0.065 | % | | | 0.015 | % |
Greater than $1 Billion | | | 0.055 | % | | | 0.005 | % |
For the six months ended November 30, 2014, the following table shows the class specific administration fees borne directly by each class of Disciplined Small Cap Core Fund:
| | | | | | |
| Institutional | | Investor A | | Investor C | | Total |
$743 | | $133 | | $16 | | $892 |
BNYMIS and the Manager may have, at their discretion, voluntarily waived all or any portion of their administration fees for Disciplined Small Cap Core Fund or a share class, which are included in administration fees waived and administration fees waived – class specific in the Statements of Operations.
With respect to Disciplined Small Cap Core Fund, the Manager contractually agreed to waive and/or reimburse fees or expenses in order to limit expenses, excluding interest expense, dividend expense, tax expense, acquired fund fees and expenses and certain other fund expenses, which constitute extraordinary expenses not incurred in the ordinary course of Disciplined Small Cap Core Fund’s business. The expense limitations as a percentage of average daily net assets are as follows: 0.70% for Institutional; 0.95% for Investor A and 1.70% for Investor C. The Manager has agreed not to reduce or discontinue this contractual waiver or reimbursement prior to October 1, 2015 unless approved by the Board, including a majority of the independent Trustees.
These amounts waived or reimbursed are included in fees waived and/or reimbursed by Manager, and shown as administration fees waived, administration fees waived — class specific and transfer agent fees reimbursed — class specific, respectively, in the Statements of Operations. For the six months ended November 30, 2014, the amount included in fees waived and/or reimbursed by Manager was $106,566 for Disciplined Small Cap Core Fund.
| | | | | | |
| 30 | | SEMI-ANNUAL REPORT | | NOVEMBER 30, 2014 | | |
| | |
| Notes to Financial Statements (continued) | | |
Class specific waivers and reimbursements are as follows for Disciplined Small Cap Core Fund:
| | | | | | | | | | | | | | | | |
| | | Institutional | | | Investor A | | | Investor C | | | Total | |
Administration Fees Waived | | $ | 678 | | | $ | 133 | | | $ | 16 | | | $ | 827 | |
Transfer Agent Fees Reimbursed | | $ | 109 | | | $ | 788 | | | $ | 102 | | | $ | 999 | |
If during Disciplined Small Cap Core Fund’s fiscal year the operating expenses of a share class, that at any time during the prior two fiscal years received a waiver or reimbursement from the Manager, are less than the expense limit for that share class, the Manager is entitled to be reimbursed by such share class up to the lesser of (a) the amount of fees waived or expenses reimbursed during those prior two fiscal years under the agreement and (b) the amount by which the expense limit for that share class exceeds the operating expenses of the share class for the current fiscal year, provided that: (1) Disciplined Small Cap Core Fund has more than $50 million in assets for the fiscal year and (2) the Manager or an affiliate continues to serve as Disciplined Small Cap Core Fund’s investment advisor or administrator. In the event the expense limit for a share class is changed subsequent to a fiscal year in which the Manager becomes entitled to reimbursement for fees waived or reimbursed, the amount available to reimburse the Manager shall be calculated by reference to the expense limit for that share class in effect at the time the Manager became entitled to receive such reimbursement, rather than the subsequently changed expense limit for that share class.
On November 30, 2014, Disciplined Small Cap Core Fund’s Fund level and class specific waivers and/or reimbursements subject to possible future recoupment under the expense limitation agreement are as follows:
| | | | | | | | | | | | |
| | | Expiring May 31, | |
| | | 2015 | | | 2016 | | | 2017 | |
Fund Level | | $ | 71,590 | | | $ | 342,873 | | | $ | 109,243 | |
Institutional | | $ | 252 | | | $ | 1,565 | | | $ | 787 | |
Investor A | | $ | 11 | | | $ | 378 | | | $ | 921 | |
Investor C | | $ | 11 | | | $ | 123 | | | $ | 118 | |
For the six months ended November 30, 2014, affiliates earned underwriting discounts, direct commissions and dealer concessions on sales of Disciplined Small Cap Core Fund’s Investor A Shares of $161 and Small Cap Growth Fund II’s Investor A Shares of $3,508.
For the six months ended November 30, 2014, affiliates received CDSCs in the amount of $108 for Disciplined Small Cap Core Fund’s Investor C Shares and $187, $116 and $970 for Small Cap Growth Fund II’s Investor A, Investor B and Investor C Shares, respectively.
The U.S. Securities and Exchange Commission has issued an exemptive order which permits BIM, an affiliate of the Manager, to serve as securities lending agent for Disciplined Small Cap Core Fund, subject to applicable conditions. As securities lending agent, BIM bears all operational costs directly related to securities lending. Disciplined Small Cap Core Fund is responsible for expenses in connection with the investment of cash collateral received for securities on loan (the “collateral investment expenses”). The cash collateral is invested in a private investment company managed by the Manager or its affiliates. However, BIM has agreed to cap the collateral investment expenses of the private investment company to an annual rate of 0.04%. The investment advisor to the private investment company will not charge any advisory fees with respect to shares purchased by Disciplined Small Cap Core Fund.
Securities lending income is equal to the total of income earned from the reinvestment of cash collateral, net of fees and other payments to and from borrowers of securities, and less the collateral investment expenses. Disciplined Small Cap Core Fund retains a portion of securities lending income and remits a remaining portion to BIM as compensation for its services as securities lending agent. Pursuant to a securities lending agreement, BIM may lend securities only when the difference between the borrower rebate rate and the risk free rate exceeds a certain level (such securities, the “specials only securities”).
Pursuant to such agreement, Disciplined Small Cap Core Fund retains 80% of securities lending income. In addition, commencing the business day following the date that the aggregate securities lending income earned across the Equity-Liquidity Complex in a calendar year exceeds the aggregate securities lending income earned across the Equity-Liquidity Complex through the lending of specials only securities in the calendar year 2013, Disciplined Small Cap Core Fund, pursuant to the securities lending agreement, will retain for the remainder of the calendar year, securities lending income in an amount equal to 85% of securities lending income. The share of securities lending income earned by Disciplined Small Cap Core Fund is shown as securities lending — affiliated — net in the Statements of Operations. For the six months ended November 30, 2014, Disciplined Small Cap Core Fund paid BIM $159 for securities lending agent services.
| | | | | | |
| | | SEMI-ANNUAL REPORT | | NOVEMBER 30, 2014 | | 31 |
| | |
| Notes to Financial Statements (continued) | | |
Certain officers and/or trustees/directors of the Trust/Corporation are officers and/or directors of BlackRock or its affiliates. The Funds reimburse the Manager/Administrator for a portion of the compensation paid to the Trust’s/Corporation’s Chief Compliance Officer, which is included in officer and trustees in the Statements of Operations.
6. Purchases and Sales:
For the six months ended November 30, 2014, purchases and sales of investments, excluding short-term securities, were $5,977,005 and $5,931,872, respectively, for Disciplined Small Cap Core Fund.
7. Income Tax Information:
It is the Funds’ policy to comply with the requirements of the Internal Revenue Code of 1986, as amended, applicable to regulated investment companies, and to distribute substantially all of their taxable income to their shareholders. Therefore, no federal income tax provision is required.
Each Fund files U.S. federal and various state and local tax returns. No income tax returns are currently under examination. The statute of limitations on Small Cap Growth Fund II’s U.S. federal tax returns remains open for each of the four years ended May 31, 2014. The statutes of limitations on Disciplined Small Cap Core Fund’s U.S. federal, state and local tax returns remain open for the year ended May 31, 2014 and the period ended May 31, 2013. The statutes of limitations on Small Cap Growth Fund II’s state and local tax returns may remain open for an additional year depending upon the jurisdiction.
Management has analyzed tax laws and regulations and their application to the Funds’ facts and circumstances and does not believe that there are any uncertain tax positions that require recognition of a tax liability.
As of November 30, 2014, gross unrealized appreciation and depreciation based on cost for federal income tax purposes for Disciplined Small Cap Core Fund were as follows:
| | | | |
Tax cost | | $ | 7,051,134 | |
| | | | |
Gross unrealized appreciation | | $ | 777,774 | |
Gross unrealized depreciation | | | (376,842 | ) |
| | | | |
Net unrealized appreciation | | $ | 400,932 | |
| | | | |
| | | | | |
8. Bank Borrowings:
The Trust, on behalf of Disciplined Small Cap Core Fund, along with certain other funds managed by the Manager and its affiliates (“Participating Funds”), is a party to a 364-day, $1.1 billion credit agreement with a group of lenders, under which Disciplined Small Cap Core Fund may borrow to fund shareholder redemptions. Excluding commitments designated for certain funds, the Participating Funds, including Disciplined Small Cap Core Fund, can borrow up to an aggregate commitment amount of $650 million, subject to asset coverage and other limitations as specified in the agreement. Effective November 25, 2014, the credit agreement was amended to an aggregate commitment amount of $2.1 billion, of which, the Participating Funds, including the Fund, can borrow up to $1.6 billion, subject to asset coverage and other limitations as specified in the agreement. The agreement expires in April 2015. The credit agreement has the following terms: a fee of 0.06% per annum on unused commitment amounts and interest at a rate equal to the higher of (a) the one-month LIBOR plus 0.80% per annum or (b) the Fed Funds rate plus 0.80% per annum on amounts borrowed. Participating Funds paid administration, legal and arrangement fees, which are included in miscellaneous expenses in the Statements of Operations, along with commitment fees, were allocated among such funds based upon portions of the aggregate commitment available to them and relative net assets of Participating Funds. Disciplined Small Cap Core Fund did not borrow under the credit agreement during the six months ended November 30, 2014.
9. Principal Risks:
In the normal course of business, Disciplined Small Cap Core Fund invests in securities and enters into transactions where risks exist due to fluctuations in the market (market risk) or failure of the issuer of a security to meet all its obligations (issuer credit risk). The value of securities held by Disciplined Small Cap Core Fund may decline in response to certain events, including those directly involving the issuers whose securities are owned by Disciplined Small Cap Core Fund; conditions affecting the general economy; overall market changes; local, regional or global political, social or economic instability; and currency and interest rate and price fluctuations. Similar to issuer credit risk, Disciplined Small Cap Core Fund may be exposed to counterparty credit risk, or the risk that an entity with which Disciplined Small Cap Core Fund has unsettled or open transactions may fail to or be unable to perform on its commitments. Disciplined Small Cap Core Fund manages counterparty credit risk by entering into transactions only with counterparties that it believes have the financial resources to honor their obligations and by monitoring the financial stability of those counterparties.
| | | | | | |
| 32 | | SEMI-ANNUAL REPORT | | NOVEMBER 30, 2014 | | |
| | |
| Notes to Financial Statements (continued) | | |
Financial assets, which potentially expose Disciplined Small Cap Core Fund to market, issuer and counterparty credit risks, consist principally of financial instruments and receivables due from counterparties. The extent of Disciplined Small Cap Core Fund’s exposure to market, issuer and counterparty credit risks with respect to these financial assets is generally approximated by their value recorded in the Statements of Assets and Liabilities, less any collateral held by Disciplined Small Cap Core Fund.
As of November 30, 2014, Disciplined Small Cap Core Fund invested a significant portion of its assets in securities in the financials sector. Changes in economic conditions affecting such sector would have a greater impact on Disciplined Small Cap Core Fund and could affect the value, income and/or liquidity of positions in such securities.
10. Capital Share Transactions:
Transactions in capital shares for each class were as follows:
| | | | | | | | | | | | | | | | | | |
| | | Six Months Ended
November 30, 2014 | | | | | Year Ended
May 31, 2014 | |
| Disciplined Small Cap Core Fund | | Shares | | | Amount | | | | | Shares | | | Amount | |
Institutional | | | | | | | | | | | | | | | | | | |
Shares sold | | | 2,471 | | | $ | 29,110 | | | | | | 18,667 | | | $ | 218,938 | |
Shares issued in reinvestment of distributions | | | 1,632 | | | | 18,159 | | | | | | 311 | | | | 3,499 | |
Shares redeemed | | | (159 | ) | | | (1,765 | ) | | | | | (1,894 | ) | | | (23,046 | ) |
| | | | | | | | | | |
Net increase | | | 3,944 | | | $ | 45,504 | | | | | | 17,084 | | | $ | 199,391 | |
| | | | | | | | | | |
| | | | | | | | | | | | | | | | | | |
Investor A | | | | | | | | | | | | | | | | | | |
Shares sold | | | 36,451 | | | $ | 408,838 | | | | | | 80,009 | | | $ | 907,645 | |
Shares issued in reinvestment of distributions | | | 5,705 | | | | 63,266 | | | | | | 447 | | | | 5,029 | |
Shares redeemed | | | (4,514 | ) | | | (51,860 | ) | | | | | (6,109 | ) | | | (71,358 | ) |
| | | | | | | | | | |
Net increase | | | 37,642 | | | $ | 420,244 | | | | | | 74,347 | | | $ | 841,316 | |
| | | | | | | | | | |
| | | | | | | | | | | | | | | | | | |
Investor C | | | | | | | | | | | | | | | | | | |
Shares sold | | | 6,542 | | | $ | 72,806 | | | | | | 6,592 | | | $ | 73,119 | |
Shares issued in reinvestment of distributions | | | 561 | | | | 6,166 | | | | | | 156 | | | | 1,749 | |
Shares redeemed | | | (3,892 | ) | | | (42,092 | ) | | | | | (104 | ) | | | (1,163 | ) |
| | | | | | | | | | |
Net increase | | | 3,211 | | | $ | 36,880 | | | | | | 6,644 | | | $ | 73,705 | |
| | | | | | | | | | |
Total Net Increase | | | 44,797 | | | $ | 502,628 | | | | | | 98,075 | | | $ | 1,114,412 | |
| | | | | | | | | | |
| | | | | | |
| | | SEMI-ANNUAL REPORT | | NOVEMBER 30, 2014 | | 33 |
| | |
| Notes to Financial Statements (concluded) | | �� |
| | | | | | | | | | | | | | | | | | |
| | | Six Months Ended
November 30, 2014 | | | | | Year Ended
May 31, 2014 | |
| Small Cap Growth Fund II | | Shares | | | Amount | | | | | Shares | | | Amount | |
Institutional | | | | | | | | | | | | | | | | | | |
Shares sold | | | 796,803 | | | $ | 10,997,972 | | | | | | 1,426,953 | | | $ | 21,322,564 | |
Shares issued in reinvestment of distributions | | | 503,614 | | | | 6,743,359 | | | | | | 1,061,970 | | | | 14,965,230 | |
Shares redeemed | | | (853,130 | ) | | | (11,711,767 | ) | | | | | (1,652,073 | ) | | | (24,682,147 | ) |
| | | | | | | | | | |
Net increase | | | 447,287 | | | $ | 6,029,564 | | | | | | 836,850 | | | $ | 11,605,647 | |
| | | | | | | | | | |
| | | | | | | | | | | | | | | | | | |
Investor A | | | | | | | | | | | | | | | | | | |
Shares sold and automatic conversion of shares | | | 577,133 | | | $ | 7,546,466 | | | | | | 1,513,268 | | | $ | 21,501,182 | |
Shares issued in reinvestment of distributions | | | 586,467 | | | | 7,412,875 | | | | | | 1,268,035 | | | | 17,099,291 | |
Shares redeemed | | | (1,030,310 | ) | | | (13,442,239 | ) | | | | | (2,071,749 | ) | | | (29,406,267 | ) |
| | | | | | | | | | |
Net increase | | | 133,290 | | | $ | 1,517,102 | | | | | | 709,554 | | | $ | 9,194,206 | |
| | | | | | | | | | |
| | | | | | | | | | | | | | | | | | |
Investor B | | | | | | | | | | | | | | | | | | |
Shares sold | | | 4,698 | | | $ | 85,653 | | | | | | 25,505 | | | $ | 313,310 | |
Shares issued in reinvestment of distributions | | | 12,034 | | | | 125,749 | | | | | | 40,034 | | | | 461,097 | |
Shares redeemed and automatic conversion of shares | | | (21,365 | ) | | | (238,683 | ) | | | | | (145,996 | ) | | | (1,776,191 | ) |
| | | | | | | | | | |
Net decrease | | | (4,633 | ) | | $ | (27,281 | ) | | | | | (80,457 | ) | | $ | (1,001,784 | ) |
| | | | | | | | | | |
| | | | | | | | | | | | | | | | | | |
Investor C | | | | | | | | | | | | | | | | | | |
Shares sold | | | 308,595 | | | $ | 3,350,725 | | | | | | 654,324 | | | $ | 7,904,289 | |
Shares issued in reinvestment of distributions | | | 458,070 | | | | 4,754,633 | | | | | | 900,979 | | | | 10,337,401 | |
Shares redeemed | | | (504,622 | ) | | | (5,424,993 | ) | | | | | (1,067,161 | ) | | | (12,844,888 | ) |
| | | | | | | | | | |
Net increase | | | 262,043 | | | $ | 2,680,365 | | | | | | 488,142 | | | $ | 5,396,802 | |
| | | | | | | | | | |
| | | | | | | | | | | | | | | | | | |
Class R | | | | | | | | | | | | | | | | | | |
Shares sold | | | 198,398 | | | $ | 2,383,712 | | | | | | 796,132 | | | $ | 10,621,900 | |
Shares issued in reinvestment of distributions | | | 255,351 | | | | 2,974,837 | | | | | | 611,265 | | | | 7,687,705 | |
Shares redeemed | | | (572,926 | ) | | | (7,009,404 | ) | | | | | (1,363,036 | ) | | | (18,107,702 | ) |
| | | | | | | | | | |
Net increase (decrease) | | | (119,177 | ) | | $ | (1,650,855 | ) | | | | | 44,361 | | | $ | 201,903 | |
| | | | | | | | | | |
Total Net Increase | | | 718,810 | | | $ | 8,548,895 | | | | | | 1,998,450 | | | $ | 25,396,774 | |
| | | | | | | | | | |
At November 30, 2014, 496,000 Institutional Shares, 2,000 Investor A Shares and 2,000 Investor C Shares of Disciplined Small Cap Core Fund were owned by affiliates.
11. Subsequent Events:
Management has evaluated the impact of all subsequent events on the Funds through the date the financial statements were issued and has determined that there were no subsequent events requiring adjustment or additional disclosure in the financial statements.
| | | | | | |
| 34 | | SEMI-ANNUAL REPORT | | NOVEMBER 30, 2014 | | |
| | |
| Master Portfolio Information | | BlackRock Master Small Cap Growth Portfolio |
| | | | |
| Ten Largest Holdings | | Percent of
Long-Term Investments | |
Team Health Holdings, Inc. | | | 2 | % |
Aspen Technology, Inc. | | | 2 | |
Manhattan Associates, Inc. | | | 2 | |
Skechers U.S.A., Inc., Class A | | | 2 | |
DuPont Fabros Technology, Inc. | | | 2 | |
Boise Cascade Co. | | | 2 | |
LogMeIn, Inc. | | | 2 | |
EnerSys, Inc. | | | 2 | |
Syntel, Inc. | | | 2 | |
Texas Capital Bancshares, Inc. | | | 2 | |
| | | | |
| Sector Allocation | | Percent of
Long-Term Investments | |
Information Technology | | | 28 | % |
Health Care | | | 23 | |
Consumer Discretionary | | | 16 | |
Industrials | | | 14 | |
Financials | | | 8 | |
Materials | | | 4 | |
Energy | | | 3 | |
Consumer Staples | | | 2 | |
Telecommunication Services | | | 2 | |
For Master Portfolio compliance purposes, the Master Portfolio’s sector classifications refer to any one or more of the sector sub-classifications used by one or more widely recognized market indexes or ratings group indexes, and/or as defined by the investment advisor. These definitions may not apply for purposes of this report, which may combine such sector sub-classifications for reporting ease.
| | | | | | |
| | | SEMI-ANNUAL REPORT | | NOVEMBER 30, 2014 | | 35 |
| | | | |
| Schedule of Investments November 30, 2014 (Unaudited) | | | BlackRock Master Small Cap Growth Portfolio | |
| | | (Percentages shown are based on Net Assets) | |
| | | | | | | | |
| Common Stocks | | Shares | | | Value | |
Aerospace & Defense — 0.7% | | | | | | | | |
Ducommun, Inc. (a) | | | 25,109 | | | $ | 625,214 | |
Taser International, Inc. (a) | | | 41,022 | | | | 881,153 | |
| | | | | | | | |
| | | | | | | | 1,506,367 | |
Air Freight & Logistics — 0.0% | | | | | | | | |
Radiant Logistics, Inc. (a) | | | 349 | | | | 1,351 | |
Airlines — 1.6% | | | | | | | | |
American Airlines Group, Inc. | | | 3,493 | | | | 169,515 | |
JetBlue Airways Corp. (a) | | | 188,082 | | | | 2,751,640 | |
Virgin America, Inc. (a) | | | 16,442 | | | | 619,535 | |
| | | | | | | | |
| | | | | | | | 3,540,690 | |
Auto Components — 3.2% | | | | | | | | |
Gentherm, Inc. (a) | | | 9,980 | | | | 376,146 | |
Lear Corp. | | | 836 | | | | 80,181 | |
Stoneridge, Inc. (a) | | | 16,396 | | | | 178,061 | |
Tenneco, Inc. (a) | | | 58,585 | | | | 3,184,095 | |
Tower International, Inc. (a) | | | 125,948 | | | | 3,215,452 | |
| | | | | | | | |
| | | | | | | | 7,033,935 | |
Banks — 1.9% | | | | | | | | |
CommunityOne Bancorp (a) | | | 4,630 | | | | 48,245 | |
Glacier Bancorp, Inc. | | | 7,963 | | | | 218,027 | |
Texas Capital Bancshares, Inc. (a) | | | 67,206 | | | | 3,705,067 | |
Umpqua Holdings Corp. | | | 10,724 | | | | 182,201 | |
West Bancorporation, Inc. | | | 257 | | | | 4,014 | |
| | | | | | | | |
| | | | | | | | 4,157,554 | |
Biotechnology — 9.1% | | | | | | | | |
ACADIA Pharmaceuticals, Inc. (a) | | | 7,226 | | | | 215,841 | |
Acorda Therapeutics, Inc. (a) | | | 23,193 | | | | 845,385 | |
Actinium Pharmaceuticals, Inc. (a) | | | 7,763 | | | | 44,560 | |
Adamas Pharmaceuticals, Inc. (a) | | | 2,065 | | | | 30,335 | |
Agios Pharmaceuticals, Inc. (a) | | | 462 | | | | 46,574 | |
Alder Biopharmaceuticals, Inc. (a) | | | 27,254 | | | | 444,785 | |
Amicus Therapeutics, Inc. | | | 42,707 | | | | 338,666 | |
Ardelyx, Inc. (a) | | | 1,299 | | | | 34,774 | |
ArQule, Inc. (a) | | | 18,374 | | | | 24,254 | |
Auspex Pharmaceuticals, Inc. (a) | | | 1,768 | | | | 42,839 | |
BIND Therapeutics, Inc. (a)(b) | | | 18,423 | | | | 119,749 | |
BioSpecifics Technologies Corp. (a) | | | 12,123 | | | | 459,704 | |
Biota Pharmaceuticals, Inc. (a) | | | 3,187 | | | | 7,043 | |
Celldex Therapeutics, Inc. (a) | | | 4,654 | | | | 94,383 | |
Cepheid, Inc. (a) | | | 11,608 | | | | 639,369 | |
China Biologic Products, Inc. (a) | | | 6,343 | | | | 434,369 | |
Clovis Oncology, Inc. (a) | | | 310 | | | | 14,750 | |
Concert Pharmaceuticals, Inc. (a) | | | 11,563 | | | | 145,694 | |
Cytokinetics, Inc. (a) | | | 50,863 | | | | 237,530 | |
Dyax Corp. (a) | | | 67,741 | | | | 951,084 | |
Emergent Biosolutions, Inc. (a) | | | 19,223 | | | | 477,884 | |
Enanta Pharmaceuticals, Inc. (a) | | | 12,491 | | | | 586,328 | |
Enzon Pharmaceuticals, Inc. | | | 153,792 | | | | 167,633 | |
Exact Sciences Corp. (b) | | | 7,434 | | | | 184,512 | |
Fibrocell Science, Inc. (a) | | | 1,419 | | | | 3,831 | |
GTx, Inc. (a)(b) | | | 22,242 | | | | 14,235 | |
| | | | | | | | |
| Common Stocks | | Shares | | | Value | |
Biotechnology (concluded) | | | | | | | | |
Harvard Apparatus Regenerative Technology, Inc. (a) | | | 21,561 | | | $ | 72,876 | |
Hyperion Therapeutics, Inc. (a) | | | 20,424 | | | | 418,488 | |
Ignyta, Inc. (a) | | | 1,766 | | | | 12,026 | |
Immune Design Corp. (a) | | | 1,211 | | | | 38,522 | |
Infinity Pharmaceuticals, Inc. (a) | | | 9,971 | | | | 149,665 | |
Inovio Pharmaceuticals, Inc. (a)(b) | | | 13,337 | | | | 129,102 | |
Ironwood Pharmaceuticals, Inc. (a) | | | 6,092 | | | | 84,313 | |
Isis Pharmaceuticals, Inc. (a) | | | 35,640 | | | | 1,845,796 | |
Keryx Biopharmaceuticals, Inc. (a) | | | 2,021 | | | | 32,134 | |
Kindred Biosciences, Inc. (a) | | | 18,689 | | | | 179,788 | |
Kite Pharma, Inc. (a)(b) | | | 10,592 | | | | 444,652 | |
Ligand Pharmaceuticals, Inc. (a) | | | 13,402 | | | | 721,698 | |
Loxo Oncology, Inc. (a) | | �� | 4,914 | | | | 50,614 | |
MacroGenics, Inc. (a) | | | 21,235 | | | | 600,101 | |
MannKind Corp. (b) | | | 4,873 | | | | 29,969 | |
Merrimack Pharmaceuticals, Inc. (a) | | | 71,152 | | | | 651,752 | |
MiMedx Group, Inc. (a) | | | 2,034 | | | | 22,496 | |
Momenta Pharmaceuticals, Inc. (a) | | | 21,892 | | | | 256,793 | |
Myriad Genetics, Inc. (a)(b) | | | 1,765 | | | | 59,180 | |
Neurocrine Biosciences, Inc. (a) | | | 1,808 | | | | 36,033 | |
NPS Pharmaceuticals, Inc. (a) | | | 39,340 | | | | 1,305,301 | |
OncoGenex Pharmaceutical, Inc. (a) | | | 47,282 | | | | 99,765 | |
Ophthotech Corp. (a) | | | 380 | | | | 16,397 | |
Opko Health, Inc. (a)(b) | | | 11,093 | | | | 92,959 | |
Otonomy, Inc. (a) | | | 2,961 | | | | 71,094 | |
PDL BioPharma, Inc. | | | 96,814 | | | | 799,684 | |
Peregrine Pharmaceuticals, Inc. (a)(b) | | | 106,151 | | | | 157,103 | |
Prothena Corp. PLC (a) | | | 13,254 | | | | 321,277 | |
Puma Biotechnology, Inc. (a) | | | 6,354 | | | | 1,442,485 | |
Receptos, Inc. (a) | | | 2,444 | | | | 330,673 | |
Repligen Corp. (a) | | | 15,133 | | | | 346,092 | |
Rigel Pharmaceuticals, Inc. (a) | | | 110,593 | | | | 236,669 | |
Sage Therapeutics, Inc. (a) | | | 6,310 | | | | 249,497 | |
Sangamo Biosciences, Inc. (a) | | | 52,844 | | | | 638,356 | |
Sorrento Therapeutics, Inc. (a) | | | 12,143 | | | | 46,751 | |
Spectrum Pharmaceuticals, Inc. (a) | | | 64,858 | | | | 467,626 | |
Synageva BioPharma Corp. (a) | | | 1,190 | | | | 96,628 | |
T2 Biosystems, Inc. (a) | | | 845 | | | | 15,142 | |
Targacept, Inc. (a) | | | 7,630 | | | | 18,541 | |
Threshold Pharmaceuticals, Inc. (a) | | | 13,203 | | | | 38,289 | |
Trevena, Inc. (a) | | | 17,459 | | | | 91,136 | |
United Therapeutics Corp. (a) | | | 1,101 | | | | 145,960 | |
Versartis, Inc. (a)(b) | | | 6,143 | | | | 110,697 | |
Vitae Pharmaceuticals, Inc. (a) | | | 25,818 | | | | 525,396 | |
Xencor, Inc. (a) | | | 3,698 | | | | 41,455 | |
| | | | | | | | |
| | | | | | | | 20,147,082 | |
Building Products — 0.1% | | | | | | | | |
PGT, Inc. (a) | | | 34,308 | | | | 322,838 | |
Capital Markets — 1.2% | | | | | | | | |
Evercore Partners, Inc., Class A | | | 37,485 | | | | 1,892,993 | |
Marcus & Millichap, Inc. (a) | | | 8,058 | | | | 250,040 | |
RCS Capital Corp., Class A | | | 20,569 | | | | 204,662 | |
Westwood Holdings Group, Inc. | | | 4,747 | | | | 282,874 | |
| | | | | | | | |
| | | | | | | | 2,630,569 | |
| | | | | | | | | | |
| Portfolio Abbreviations |
| ADR | | American Depositary Receipts | | CVR | | Contingent Value Rights | | REIT | | Real Estate Investment Trust |
See Notes to Financial Statements.
| | | | | | |
| 36 | | SEMI-ANNUAL REPORT | | NOVEMBER 30, 2014 | | |
| | | | |
| Schedule of Investments (continued) | | | BlackRock Master Small Cap Growth Portfolio | |
| | | (Percentages shown are based on Net Assets) | |
| | | | | | | | |
| Common Stocks | | Shares | | | Value | |
Chemicals — 0.7% | | | | | | | | |
Landec Corp. (a) | | | 4,741 | | | $ | 62,297 | |
OM Group, Inc. | | | 10,152 | | | | 276,236 | |
PolyOne Corp. | | | 20,877 | | | | 778,712 | |
Taminco Corp. (a) | | | 2,717 | | | | 70,397 | |
Trinseo SA (a) | | | 23,227 | | | | 356,767 | |
| | | | | | | | |
| | | | | | | | 1,544,409 | |
Commercial Services & Supplies — 0.4% | | | | | | | | |
Atento SA (a) | | | 44,592 | | | | 491,850 | |
Cenveo, Inc. (a) | | | 13,244 | | | | 24,899 | |
Hudson Technologies, Inc. (a) | | | 15,500 | | | | 52,390 | |
Performant Financial Corp. (a) | | | 30,239 | | | | 205,625 | |
SP Plus Corp. (a) | | | 10,230 | | | | 212,579 | |
| | | | | | | | |
| | | | | | | | 987,343 | |
Communications Equipment — 3.2% | | | | | | | | |
Aruba Networks, Inc. (a) | | | 123,080 | | | | 2,302,827 | |
Aviat Networks, Inc. (a) | | | 45,693 | | | | 68,996 | |
Calix, Inc. (a) | | | 72,239 | | | | 765,733 | |
Comtech Telecommunications Corp. | | | 1,963 | | | | 77,911 | |
Emulex Corp. (a) | | | 3,885 | | | | 21,018 | |
Plantronics, Inc. | | | 6,455 | | | | 336,757 | |
Polycom, Inc. (a) | | | 16,617 | | | | 218,846 | |
ShoreTel, Inc. (a) | | | 129,685 | | | | 970,044 | |
Sonus Networks, Inc. (a) | | | 648,513 | | | | 2,399,498 | |
| | | | | | | | |
| | | | | | | | 7,161,630 | |
Construction & Engineering — 0.1% | | | | | | | | |
MasTec, Inc. (a) | | | 5,064 | | | | 122,042 | |
Consumer Finance — 0.2% | | | | | | | | |
JG Wentworth Co. (a) | | | 44,343 | | | | 422,589 | |
Containers & Packaging — 1.0% | | | | | | | | |
Graphic Packaging Holding Co. (a) | | | 175,636 | | | | 2,186,668 | |
Distributors — 0.5% | | | | | | | | |
Core-Mark Holding Co., Inc. | | | 15,905 | | | | 956,050 | |
Pool Corp. | | | 698 | | | | 41,468 | |
| | | | | | | | |
| | | | | | | | 997,518 | |
Diversified Consumer Services — 2.0% | | | | | | | | |
Ascent Capital Group, Inc., Class A (a) | | | 8,951 | | | | 481,743 | |
Collectors Universe, Inc. | | | 19,917 | | | | 438,373 | |
K12, Inc. (a) | | | 5,846 | | | | 67,229 | |
LifeLock, Inc. (a) | | | 105,868 | | | | 1,747,881 | |
National American University Holdings, Inc. | | | 3,824 | | | | 11,740 | |
ServiceMaster Global Holdings, Inc. (a) | | | 33,443 | | | | 878,213 | |
Steiner Leisure Ltd. (a) | | | 20,624 | | | | 913,024 | |
| | | | | | | | |
| | | | | | | | 4,538,203 | |
Diversified Financial Services — 0.0% | | | | | | | | |
Marlin Business Services Corp. | | | 2,156 | | | | 40,188 | |
Diversified Telecommunication Services — 1.4% | | | | | | | | |
IDT Corp., Class B | | | 12,846 | | | | 217,611 | |
Inteliquent, Inc. | | | 85,275 | | | | 1,570,765 | |
Intelsat SA (a) | | | 33,516 | | | | 590,217 | |
Premiere Global Services, Inc. (a) | | | 40,295 | | | | 425,112 | |
Vonage Holdings Corp. (a) | | | 120,001 | | | | 409,203 | |
| | | | | | | | |
| | | | | | | | 3,212,908 | |
Electrical Equipment — 1.8% | | | | | | | | |
EnerSys, Inc. | | | 66,497 | | | | 4,038,363 | |
| | | | | | | | |
| Common Stocks | | Shares | | | Value | |
Electronic Equipment, Instruments & Components — 3.8% | |
Anixter International, Inc. | | | 25,669 | | | $ | 2,230,636 | |
Cognex Corp. (a) | | | 29,330 | | | | 1,194,024 | |
DTS, Inc. (a) | | | 4,306 | | | | 138,869 | |
Kimball Electronics, Inc. (a) | | | 6,899 | | | | 75,889 | |
Methode Electronics, Inc. | | | 383 | | | | 14,841 | |
Newport Corp. (a) | | | 114,102 | | | | 2,009,336 | |
OSI Systems, Inc. (a) | | | 20,360 | | | | 1,436,805 | |
Radisys Corp. (a) | | | 17,489 | | | | 41,974 | |
RealD, Inc. (a) | | | 118,983 | | | | 1,362,355 | |
| | | | | | | | |
| | | | | | | | 8,504,729 | |
Energy Equipment & Services — 0.9% | | | | | | | | |
Basic Energy Services, Inc. (a) | | | 63,069 | | | | 563,206 | |
C&J Energy Services, Inc. (a) | | | 23,510 | | | | 356,177 | |
CHC Group Ltd. (a) | | | 85,483 | | | | 393,222 | |
Enservco Corp. (a) | | | 707 | | | | 1,471 | |
Matrix Service Co. (a) | | | 28,497 | | | | 601,857 | |
North Atlantic Drilling Ltd. (a) | | | 16,157 | | | | 39,261 | |
Pioneer Energy Services Corp. (a) | | | 9,985 | | | | 60,309 | |
| | | | | | | | |
| | | | | | | | 2,015,503 | |
Food & Staples Retailing — 0.0% | | | | | | | | |
Natural Grocers by Vitamin Cottage, Inc. (a) | | | 1 | | | | 22 | |
Food Products — 1.4% | | | | | | | | |
Freshpet, Inc. (a) | | | 3,222 | | | | 53,840 | |
Lancaster Colony Corp. | | | 1,323 | | | | 124,230 | |
Omega Protein Corp. (a) | | | 18,888 | | | | 191,713 | |
Pilgrim’s Pride Corp. (a)(b) | | | 43,819 | | | | 1,415,354 | |
Sanderson Farms, Inc. (b) | | | 14,882 | | | | 1,291,906 | |
Seaboard Corp. (a) | | | 20 | | | | 69,000 | |
| | | | | | | | |
| | | | | | | | 3,146,043 | |
Gas Utilities — 0.0% | | | | | | | | |
Southwest Gas Corp. | | | 1,709 | | | | 98,934 | |
Health Care Equipment & Supplies — 4.9% | | | | | | | | |
Align Technology, Inc. (a) | | | 24,608 | | | | 1,400,195 | |
Anika Therapeutics, Inc. (a) | | | 35,488 | | | | 1,451,104 | |
DexCom, Inc. (a) | | | 6,436 | | | | 331,197 | |
Exactech, Inc. (a) | | | 1,033 | | | | 22,912 | |
Greatbatch, Inc. (a) | | | 3,133 | | | | 155,303 | |
ICU Medical, Inc. (a) | | | 9,098 | | | | 761,412 | |
Natus Medical, Inc. (a) | | | 5,305 | | | | 181,590 | |
STERIS Corp. | | | 47,678 | | | | 3,039,473 | |
SurModics, Inc. (a) | | | 14,372 | | | | 301,956 | |
Symmetry Medical, Inc. (a) | | | 186,720 | | | | 1,682,347 | |
TearLab Corp. (a) | | | 703 | | | | 1,958 | |
Thoratec Corp. (a) | | | 28,092 | | | | 876,189 | |
Utah Medical Products, Inc. | | | 1,136 | | | | 65,968 | |
Zeltiq Aesthetics, Inc. (a) | | | 26,340 | | | | 720,926 | |
| | | | | | | | |
| | | | | | | | 10,992,530 | |
Health Care Providers & Services — 5.5% | | | | | | | | |
AAC Holdings, Inc. (a) | | | 570 | | | | 16,450 | |
Adeptus Health, Inc., Class A (a) | | | 664 | | | | 20,212 | |
Alliance HealthCare Services, Inc. (a) | | | 2,797 | | | | 62,988 | |
AMN Healthcare Services, Inc. (a) | | | 59,290 | | | | 1,015,045 | |
Centene Corp. (a) | | | 16,527 | | | | 1,632,372 | |
CorVel Corp. (a) | | | 22,207 | | | | 769,695 | |
Five Star Quality Care, Inc. (a) | | | 42,656 | | | | 187,686 | |
Health Net, Inc. (a) | | | 48,816 | | | | 2,508,166 | |
HealthEquity, Inc. (a) | | | 7,146 | | | | 177,435 | |
See Notes to Financial Statements.
| | | | | | |
| | | SEMI-ANNUAL REPORT | | NOVEMBER 30, 2014 | | 37 |
| | | | |
| Schedule of Investments (continued) | | | BlackRock Master Small Cap Growth Portfolio | |
| | | (Percentages shown are based on Net Assets) | |
| | | | | | | | |
| Common Stocks | | Shares | | | Value | |
Health Care Providers & Services (concluded) | | | | | | | | |
HealthSouth Corp. | | | 29,433 | | | $ | 1,210,579 | |
Skilled Healthcare Group, Inc., Class A (a) | | | 2,763 | | | | 19,286 | |
Team Health Holdings, Inc. (a) | | | 81,948 | | | | 4,684,148 | |
| | | | | | | | |
| | | | | | | | 12,304,062 | |
Health Care Technology — 0.7% | | | | | | | | |
Omnicell, Inc. (a) | | | 47,761 | | | | 1,537,904 | |
Hotels, Restaurants & Leisure — 3.2% | | | | | | | | |
BFC Financial Corp., Class A (a) | | | 4,253 | | | | 15,949 | |
Brinker International, Inc. | | | 35,165 | | | | 1,980,844 | |
Diamond Resorts International, Inc. (a) | | | 42,656 | | | | 1,031,422 | |
Intrawest Resorts Holdings, Inc. (a) | | | 2,229 | | | | 23,895 | |
Jack in the Box, Inc. | | | 37,777 | | | | 2,814,387 | |
Papa John’s International, Inc. | | | 820 | | | | 43,280 | |
Red Lion Hotels Corp. (a) | | | 7,229 | | | | 42,796 | |
SeaWorld Entertainment, Inc. | | | 1,732 | | | | 28,907 | |
Speedway Motorsports, Inc. | | | 1 | | | | 20 | |
Vail Resorts, Inc. | | | 11,590 | | | | 1,015,748 | |
| | | | | | | | |
| | | | | | | | 6,997,248 | |
Household Durables — 0.6% | | | | | | | | |
GoPro, Inc., Class A (a)(b) | | | 4,313 | | | | 336,285 | |
TRI Pointe Homes, Inc. (a) | | | 48,020 | | | | 732,785 | |
ZAGG, Inc. (a) | | | 58,301 | | | | 332,316 | |
| | | | | | | | |
| | | | | | | | 1,401,386 | |
Independent Power and Renewable Electricity Producers — 0.0% | | | | | |
TerraForm Power, Inc., Class A (a) | | | 101 | | | | 3,348 | |
Insurance — 0.1% | | | | | | | | |
AmTrust Financial Services, Inc. | | | 429 | | | | 22,016 | |
Hallmark Financial Services, Inc. (a) | | | 22,668 | | | | 267,256 | |
Heritage Insurance Holdings, Inc. (a) | | | 1,176 | | | | 20,404 | |
| | | | | | | | |
| | | | | | | | 309,676 | |
Internet & Catalog Retail — 0.7% | | | | | | | | |
1-800-Flowers.com, Inc., Class A (a) | | | 31,447 | | | | 268,872 | |
Liberty Ventures, Series A | | | 3,226 | | | | 118,201 | |
Orbitz Worldwide, Inc. (a) | | | 75,929 | | | | 580,098 | |
Shutterfly, Inc. (a) | | | 10,346 | | | | 442,395 | |
U.S. Auto Parts Network, Inc. (a) | | | 19,837 | | | | 49,989 | |
| | | | | | | | |
| | | | | | | | 1,459,555 | |
Internet Software & Services — 4.5% | | | | | | | | |
Bankrate, Inc. (a) | | | 11,243 | | | | 131,431 | |
Blucora, Inc. (a) | | | 86,571 | | | | 1,230,174 | |
Constant Contact, Inc. (a) | | | 26,584 | | | | 868,765 | |
Conversant, Inc. (a) | | | 17,113 | | | | 599,297 | |
Limelight Networks, Inc. (a) | | | 74,870 | | | | 204,395 | |
LogMeIn, Inc. (a) | | | 80,445 | | | | 4,068,104 | |
MeetMe, Inc. (a) | | | 2,214 | | | | 3,841 | |
Monster Worldwide, Inc. (a) | | | 15,605 | | | | 67,882 | |
NIC, Inc. | | | 100,467 | | | | 1,810,415 | |
Spark Networks, Inc. (a)(b) | | | 20,043 | | | | 77,366 | |
support.com, Inc. (a) | | | 63,038 | | | | 129,858 | |
Synacor, Inc. (a) | | | 9,528 | | | | 15,531 | |
TechTarget, Inc. (a) | | | 3,674 | | | | 37,181 | |
Travelzoo, Inc. (a) | | | 27,088 | | | | 355,665 | |
Tremor Video, Inc. (a) | | | 15,975 | | | | 39,139 | |
TrueCar, Inc. (a) | | | 16,684 | | | | 319,665 | |
| | | | | | | | |
| Common Stocks | | Shares | | | Value | |
Internet Software & Services (concluded) | | | | | | | | |
Zix Corp. (a) | | | 16,519 | | | $ | 52,200 | |
| | | | | | | | |
| | | | | | | | 10,010,909 | |
IT Services — 3.0% | | | | | | | | |
Forrester Research, Inc. | | | 754 | | | | 29,941 | |
Global Cash Access Holdings, Inc. (a) | | | 139,122 | | | | 987,766 | |
Lionbridge Technologies, Inc. (a) | | | 55,744 | | | | 282,622 | |
Planet Payment, Inc. (a) | | | 16,202 | | | | 26,247 | |
Sapient Corp. (a) | | | 29,270 | | | | 722,969 | |
Syntel, Inc. (a) | | | 87,496 | | | | 3,893,572 | |
VeriFone Systems, Inc. (a) | | | 19,233 | | | | 685,849 | |
| | | | | | | | |
| | | | | | | | 6,628,966 | |
Leisure Products — 0.1% | | | | | | | | |
Nautilus, Inc. (a) | | | 18,289 | | | | 234,648 | |
Life Sciences Tools & Services — 0.2% | | | | | | | | |
Harvard Bioscience, Inc. (a) | | | 56,827 | | | | 279,589 | |
INC Research Holdings, Inc., Class A (a) | | | 4,475 | | | | 109,145 | |
pSivida Corp. (a) | | | 13 | | | | 56 | |
| | | | | | | | |
| | | | | | | | 388,790 | |
Machinery — 3.8% | | | | | | | | |
Blount International, Inc. (a) | | | 53,080 | | | | 871,574 | |
Global Brass & Copper Holdings, Inc. | | | 72,447 | | | | 887,476 | |
The Greenbrier Cos., Inc. (b) | | | 42,892 | | | | 2,379,648 | |
Hyster-Yale Materials Handling, Inc. | | | 12,241 | | | | 898,612 | |
John Bean Technologies Corp. | | | 26,760 | | | | 811,898 | |
Luxfer Holdings PLC — ADR | | | 129,101 | | | | 1,937,806 | |
Wabash National Corp. (a) | | | 51,473 | | | | 555,394 | |
Woodward, Inc. | | | 1,292 | | | | 66,771 | |
Xerium Technologies, Inc. (a) | | | 2,502 | | | | 35,578 | |
| | | | | | | | |
| | | | | | | | 8,444,757 | |
Marine — 0.0% | | | | | | | | |
Scorpio Bulkers, Inc. (a) | | | 6,304 | | | | 20,614 | |
Media — 0.6% | | | | | | | | |
Crown Media Holdings, Inc., Class A (a) | | | 39,577 | | | | 133,770 | |
MDC Partners, Inc., Class A | | | 2,390 | | | | 52,747 | |
Townsquare Media, Inc., Class A (a) | | | 25,534 | | | | 318,664 | |
Tribune Publishing Co. | | | 44,031 | | | | 928,614 | |
| | | | | | | | |
| | | | | | | | 1,433,795 | |
Metals & Mining — 0.0% | | | | | | | | |
Ryerson Holding Corp. (a) | | | 5,705 | | | | 61,557 | |
Worthington Industries, Inc. | | | 747 | | | | 28,169 | |
| | | | | | | | |
| | | | | | | | 89,726 | |
Oil, Gas & Consumable Fuels — 1.9% | | | | | | | | |
Adams Resources & Energy, Inc. | | | 401 | | | | 17,760 | |
American Eagle Energy Corp. (a) | | | 7,559 | | | | 7,105 | |
Bill Barrett Corp. (a) | | | 27,740 | | | | 281,006 | |
Bonanza Creek Energy, Inc. (a) | | | 22,817 | | | | 621,079 | |
BPZ Resources, Inc. (a) | | | 91,597 | | | | 54,958 | |
Callon Petroleum Co. (a) | | | 11,982 | | | | 58,832 | |
Cloud Peak Energy, Inc. (a) | | | 1,354 | | | | 15,801 | |
Gastar Exploration, Inc. (a) | | | 4,003 | | | | 11,809 | |
Jones Energy, Inc., Class A (a) | | | 22,812 | | | | 231,542 | |
Kodiak Oil & Gas Corp. (a) | | | 68,388 | | | | 501,284 | |
Matador Resources Co. (a) | | | 48,590 | | | | 854,698 | |
Northern Oil and Gas, Inc. (a) | | | 9,999 | | | | 86,891 | |
Parsley Energy, Inc., Class A (a) | | | 50,637 | | | | 640,052 | |
Sprague Resources LP (a) | | | 833 | | | | 18,717 | |
See Notes to Financial Statements.
| | | | | | |
| 38 | | SEMI-ANNUAL REPORT | | NOVEMBER 30, 2014 | | |
| | | | |
| Schedule of Investments (continued) | | | BlackRock Master Small Cap Growth Portfolio | |
| | | (Percentages shown are based on Net Assets) | |
| | | | | | | | |
| Common Stocks | | Shares | | | Value | |
Oil, Gas & Consumable Fuels (concluded) | | | | | | | | |
Stone Energy Corp. (a) | | | 1,477 | | | $ | 23,337 | |
U.S. Energy Corp. Wyoming (a) | | | 4,681 | | | | 7,770 | |
W&T Offshore, Inc. | | | 6,350 | | | | 47,815 | |
Warren Resources, Inc. (a) | | | 24,266 | | | | 49,745 | |
Western Refining, Inc. | | | 17,911 | | | | 736,321 | |
| | | | | | | | |
| | | | | | | | 4,266,522 | |
Paper & Forest Products — 2.3% | | | | | | | | |
Boise Cascade Co. (a) | | | 116,835 | | | | 4,169,841 | |
Clearwater Paper Corp. (a) | | | 10,167 | | | | 673,665 | |
Domtar Corp. | | | 6,037 | | | | 245,706 | |
| | | | | | | | |
| | | | | | | | 5,089,212 | |
Pharmaceuticals — 1.9% | | | | | | | | |
Achaogen, Inc. (a) | | | 1,662 | | | | 15,324 | |
Actavis PLC (a) | | | 1,930 | | | | 2,239 | |
Akorn, Inc. (a) | | | 62,612 | | | | 2,508,863 | |
Auxilium Pharmaceuticals, Inc. (a) | | | 12,837 | | | | 443,647 | |
Catalent, Inc. | | | 8,738 | | | | 251,567 | |
Furiex Pharmaceuticals, Inc. — CVR | | | 1,957 | | | | 19,570 | |
POZEN, Inc. | | | 7,426 | | | | 66,017 | |
Prestige Brands Holdings, Inc. (a) | | | 1,912 | | | | 63,956 | |
Sagent Pharmaceuticals, Inc. (a) | | | 15,519 | | | | 447,413 | |
SciClone Pharmaceuticals, Inc. (a) | | | 46,676 | | | | 396,279 | |
Sucampo Pharmaceuticals, Inc., Class A (a) | | | 7,825 | | | | 91,709 | |
| | | | | | | | |
| | | | | | | | 4,306,584 | |
Professional Services — 2.7% | | | | | | | | |
GP Strategies Corp. (a) | | | 517 | | | | 15,675 | |
Kforce, Inc. | | | 108,518 | | | | 2,532,810 | |
Korn/Ferry International (a) | | | 13,417 | | | | 364,272 | |
On Assignment, Inc. (a) | | | 33,759 | | | | 1,037,414 | |
RPX Corp. (a) | | | 160,848 | | | | 2,110,326 | |
| | | | | | | | |
| | | | | | | | 6,060,497 | |
Real Estate Investment Trusts (REITs) — 3.1% | | | | | | | | |
Chatham Lodging Trust | | | 1,649 | | | | 44,127 | |
DuPont Fabros Technology, Inc. | | | 134,204 | | | | 4,373,708 | |
LaSalle Hotel Properties | | | 12,526 | | | | 505,675 | |
NorthStar Realty Finance Corp. | | | 45,411 | | | | 829,659 | |
Pebblebrook Hotel Trust | | | 1,601 | | | | 69,115 | |
PS Business Parks, Inc. | | | 5,072 | | | | 412,810 | |
RLJ Lodging Trust | | | 8,986 | | | | 295,909 | |
Western Asset Mortgage Capital Corp. | | | 16,195 | | | | 253,452 | |
| | | | | | | | |
| | | | | | | | 6,784,455 | |
Real Estate Management & Development — 0.4% | | | | | | | | |
Altisource Portfolio Solutions SA (a) | | | 1,327 | | | | 69,376 | |
Forestar Group, Inc. (a) | | | 49,396 | | | | 790,336 | |
| | | | | | | | |
| | | | | | | | 859,712 | |
Road & Rail — 1.4% | | | | | | | | |
Swift Transportation Co. (a) | | | 105,372 | | | | 3,063,164 | |
Semiconductors & Semiconductor Equipment — 6.5% | | | | | | | | |
Advanced Energy Industries, Inc. (a) | | | 5,326 | | | | 108,810 | |
Ambarella, Inc. (a)(b) | | | 64,367 | | | | 3,540,185 | |
Amkor Technology, Inc. (a) | | | 26,101 | | | | 174,616 | |
Cabot Microelectronics Corp. (a) | | | 41,928 | | | | 1,983,194 | |
Cirrus Logic, Inc. (a) | | | 45,319 | | | | 828,884 | |
Inphi Corp. (a) | | | 55,274 | | | | 811,975 | |
Intermolecular, Inc. (a) | | | 79,791 | | | | 172,349 | |
MaxLinear, Inc., Class A (a) | | | 62,921 | | | | 459,323 | |
| | | | | | | | |
| Common Stocks | | Shares | | | Value | |
Semiconductors & Semiconductor Equipment (concluded) | |
Microsemi Corp. (a) | | | 44,693 | | | $ | 1,215,650 | |
Pericom Semiconductor Corp. (a) | | | 8,903 | | | | 113,157 | |
RF Micro Devices, Inc. (a) | | | 59,871 | | | | 874,715 | |
Semtech Corp. (a) | | | 13,306 | | | | 338,771 | |
Silicon Image, Inc. (a) | | | 156,707 | | | | 866,590 | |
Silicon Laboratories, Inc. (a) | | | 647 | | | | 29,341 | |
Spansion, Inc., Class A (a) | | | 106,224 | | | | 2,482,455 | |
Tessera Technologies, Inc. | | | 11,141 | | | | 380,799 | |
| | | | | | | | |
| | | | | | | | 14,380,814 | |
Software — 6.4% | | | | | | | | |
Advent Software, Inc. | | | 7,562 | | | | 238,430 | |
Aspen Technology, Inc. (a) | | | 122,000 | | | | 4,604,280 | |
AVG Technologies NV (a) | | | 91,261 | | | | 1,792,366 | |
Aware, Inc. | | | 11,797 | | | | 52,025 | |
Infoblox, Inc. (a) | | | 2,106 | | | | 37,908 | |
Manhattan Associates, Inc. (a) | | | 114,604 | | | | 4,533,734 | |
Monotype Imaging Holdings, Inc. | | | 2,004 | | | | 55,391 | |
Net 1 UEPS Technologies, Inc. (a) | | | 43,936 | | | | 538,655 | |
QAD, Inc., Class A | | | 8,809 | | | | 172,833 | |
Qualys, Inc. (a) | | | 8,634 | | | | 306,421 | |
SolarWinds, Inc. (a) | | | 512 | | | | 26,583 | |
TubeMogul, Inc. (a)(b) | | | 4,075 | | | | 65,037 | |
VASCO Data Security International, Inc. (a) | | | 42,909 | | | | 1,278,688 | |
Verint Systems, Inc. (a) | | | 9,454 | | | | 569,036 | |
Viggle, Inc. | | | 3,779 | | | | 6,575 | |
| | | | | | | | |
| | | | | | | | 14,277,962 | |
Specialty Retail — 1.9% | | | | | | | | |
Aaron’s, Inc. (a) | | | 44,569 | | | | 1,264,868 | |
Abercrombie & Fitch Co., Class A | | | 4,182 | | | | 120,651 | |
ANN, Inc. (a) | | | 26,280 | | | | 965,264 | |
Boot Barn Holdings, Inc. (a) | | | 6,567 | | | | 141,847 | |
Chico’s FAS, Inc. | | | 5,807 | | | | 92,157 | |
Haverty Furniture Cos., Inc. | | | 24,962 | | | | 525,700 | |
Kirkland’s, Inc. (a) | | | 25,847 | | | | 561,397 | |
Murphy U.S.A., Inc. (a) | | | 2,786 | | | | 177,524 | |
New York & Co., Inc. (a) | | | 21,065 | | | | 57,929 | |
Outerwall, Inc. (a) | | | 2,046 | | | | 143,793 | |
Sears Hometown and Outlet Stores, Inc. (a) | | | 5 | | | | 66 | |
West Marine, Inc. (a) | | | 3,738 | | | | 40,856 | |
The Wet Seal, Inc., Class A (a)(b) | | | 156,096 | | | | 49,951 | |
| | | | | | | | |
| | | | | | | | 4,142,003 | |
Technology Hardware, Storage & Peripherals — 0.3% | | | | | | | | |
Immersion Corp. (a) | | | 34,629 | | | | 300,233 | |
Quantum Corp. (a) | | | 177,158 | | | | 279,910 | |
| | | | | | | | |
| | | | | | | | 580,143 | |
Textiles, Apparel & Luxury Goods — 3.4% | | | | | | | | |
Columbia Sportswear Co. | | | 4,631 | | | | 208,627 | |
Deckers Outdoor Corp. (a) | | | 26,092 | | | | 2,523,618 | |
Iconix Brand Group, Inc. (a) | | | 8,972 | | | | 362,558 | |
Skechers U.S.A., Inc., Class A (a) | | | 71,319 | | | | 4,379,700 | |
| | | | | | | | |
| | | | | | | | 7,474,503 | |
Thrifts & Mortgage Finance — 0.9% | | | | | | | | |
Heritage Financial Group, Inc. | | | 4,597 | | | | 96,675 | |
Home Loan Servicing Solutions Ltd. (a) | | | 18,566 | | | | 362,780 | |
HomeStreet, Inc. | | | 52,421 | | | | 854,986 | |
MGIC Investment Corp. (a) | | | 12,429 | | | | 115,714 | |
See Notes to Financial Statements.
| | | | | | |
| | | SEMI-ANNUAL REPORT | | NOVEMBER 30, 2014 | | 39 |
| | | | |
| Schedule of Investments (continued) | | | BlackRock Master Small Cap Growth Portfolio | |
| | | (Percentages shown are based on Net Assets) | |
| | | | | | | | |
| Common Stocks | | Shares | | | Value | |
Thrifts & Mortgage Finance (concluded) | | | | | | | | |
Tree.com, Inc. (a) | | | 12,348 | | | $ | 558,870 | |
| | | | | | | | |
| | | | | | | | 1,989,025 | |
Tobacco — 0.7% | | | | | | | | |
Vector Group Ltd. | | | 73,980 | | | | 1,609,065 | |
Trading Companies & Distributors — 1.3% | | | | | | | | |
Air Lease Corp. | | | 12,683 | | | | 482,334 | |
MRC Global, Inc. (a) | | | 49,408 | | | | 998,536 | |
Watsco, Inc. | | | 12,600 | | | | 1,278,900 | |
Willis Lease Finance Corp. (a) | | | 3,171 | | | | 69,096 | |
| | | | | | | | |
| | | | | | | | 2,828,866 | |
Water Utilities — 0.3% | | | | | | | | |
American States Water Co. | | | 18,132 | | | | 632,625 | |
Wireless Telecommunication Services — 0.0% | | | | | |
Leap Wireless International, Inc. (a) | | | 3,374 | | | | 8,502 | |
Total Common Stocks — 98.5% | | | | | | | 218,969,046 | |
| | | | | | | | |
| Other Interests (c) | | Beneficial
Interest
(000) | | | | |
Professional Services — 0.0% | | | | | | | | |
The Dolan Co., Escrow (a) | | $ | 9 | | | | 177 | |
| | | | | | | | |
| Preferred Stocks | | Shares | | | | |
Consumer Finance — 0.2% | | | | | | | | |
LendingClub Corp. (Acquired 4/15/14, cost $338,865) (a)(d) | | | 16,658 | | | | 347,546 | |
Household Durables — 0.1% | | | | | | | | |
AliphCom (Acquired 6/03/14, cost $249,993) (a)(d) | | | 22,187 | | | | 250,564 | |
Software — 0.5% | | | | | | | | |
Apigee Corp., Series H (Acquired 4/15/14, cost $89,907) (a)(d) | | | 30,896 | | | | 89,907 | |
MongoDB: | | | | | | | | |
Series C (Acquired 12/19/13, cost $379,504) (a)(d) | | | 15,128 | | | | 362,769 | |
Series D (Acquired 12/19/13, cost $118,056) (a)(d) | | | 4,706 | | | | 112,850 | |
Series E (Acquired 12/19/13, cost $4,168) (a)(d) | | | 166 | | | | 3,981 | |
Palantir Technologies, Inc. (Acquired 2/06/14, cost $500,000) (a)(d) | | | 81,566 | | | | 500,000 | |
Total Preferred Stocks — 0.8% | | | | | | | 1,667,617 | |
| | | | | | | | |
| Warrants (e) | | Shares | | | Value | |
Pharmaceuticals — 0.0% | | | | | | | | |
Alexza Pharmaceuticals, Inc.
(Issued/Exercisable 5/06/11, 1 Share for 1 Warrant, Expires 5/06/16, Strike Price $17.70) | | | 222,516 | | | | — | |
Real Estate Management & Development — 0.0% | | | | | |
Tejon Ranch Co. (Issued/Exercisable 8/07/13, 1 Share for 1 Warrant, Expires 8/31/16, Strike Price $40) | | | 547 | | | $ | 957 | |
Total Warrants — 0.0% | | | | | | | 957 | |
Total Long-Term Investments (Cost — $202,157,756) — 99.3% | | | | 220,637,797 | |
| | | | | | | | |
| Short-Term Securities | | | | | | |
BlackRock Liquidity Funds, TempFund, Institutional Class, 0.07% (f)(g) | | | 1,965,748 | | | | 1,965,748 | |
| | | Beneficial
Interest
(000) | | | | |
BlackRock Liquidity Series, LLC, Money Market
Series, 0.19% (f)(g)(h) | | $ | 8,893 | | | | 8,893,117 | |
Total Short-Term Securities (Cost — $10,858,865) — 4.9% | | | | 10,858,865 | |
Total Investments (Cost — $213,016,621) — 104.2% | | | | 231,496,662 | |
Liabilities in Excess of Other Assets — (4.2)% | | | | | | | (9,238,240 | ) |
| | | | | | | | |
Net Assets — 100.0% | | | | | | $ | 222,258,422 | |
| | | | | | | | |
See Notes to Financial Statements.
| | | | | | |
| 40 | | SEMI-ANNUAL REPORT | | NOVEMBER 30, 2014 | | |
| | | | |
| Schedule of Investments (continued) | | | BlackRock Master Small Cap Growth Portfolio | |
|
| Notes to Schedule of Investments |
| (a) | Non-income producing security. |
| (b) | Security, or a portion of security, is on loan. |
| (c) | Other interests represent beneficial interests in liquidation trusts and other reorganization or private entities. |
| (d) | Restricted security as to resale. As of report date, the Master Portfolio held 0.8% of its net assets, with a current value of $1,667,617 and an original cost of $1,680,493 in this security. |
| (e) | Warrants entitle the Master Portfolio to purchase a predetermined number of shares of common stock and are non-income producing. The purchase price and number of shares are subject to adjustment under certain conditions until the expiration date of the warrants, if any. |
| (f) | Investments in issuers considered to be affiliates of the Master Portfolio during the six months ended November 30, 2014, for purposes of Section 2(a)(3) of the Investment Company Act of 1940, as amended, were as follows: |
| | | | | | | | | | | | | | | | |
| Affiliate | | Shares/ Beneficial
Interest Held at
May 31, 2014 | | | Net
Activity | | | Shares/ Beneficial
Interest Held at
November 30, 2014 | | | Income | |
BlackRock Liquidity Funds, TempFund, Institutional Class | | | 5,280,302 | | | | (3,314,554 | ) | | | 1,965,748 | | | $ | 380 | |
BlackRock Liquidity Series, LLC, Money Market Series | | $ | 3,271,075 | | | $ | 5,622,042 | | | $ | 8,893,117 | | | $ | 144,508 | |
| (g) | Represents the current yield as of report date. |
| (h) | Security was purchased with the cash collateral from loaned securities. The Master Portfolio may withdraw up to 25% of its investment daily, although the manager of the BlackRock Liquidity Series, LLC, Money Market Series, in its sole discretion, may permit an investor to withdraw more than 25% on any one day. |
| Ÿ | | For Master Portfolio compliance purposes, the Master Portfolio’s industry classifications refer to any one or more of the industry sub-classifications used by one or more widely recognized market indexes or ratings group indexes, and/or as defined by the investment advisor. These definitions may not apply for purposes of this report, which may combine such industry sub-classifications for reporting ease. |
| Ÿ | | Financial futures contracts outstanding as of November 30, 2014 were as follows: |
| | | | | | | | | | | | | | | | | | | | |
Contracts
Purchased | | | Issue | | Exchange | | | Expiration | | | Notional
Value | | | Unrealized
Depreciation | |
| | 20 | | | E-Mini Russell 2000 Futures | | | InterContinental Exchange | | | | December 2014 | | | $ | 2,343,200 | | | $ | (1,751 | ) |
| Ÿ | | Fair Value Measurements — Various inputs are used in determining the fair value of investments and derivative financial instruments. These inputs to valuation techniques are categorized into a disclosure hierarchy consisting of three broad levels for financial statement purposes. The hierarchy gives the highest priority to unadjusted quoted prices in active markets for identical assets or liabilities (Level 1 measurements) and the lowest priority to unobservable inputs (Level 3 measurements). Accordingly, the degree of judgment exercised in determining fair value is greatest for instruments categorized in Level 3. The inputs used to measure fair value may fall into different levels of the fair value hierarchy. In such cases, for disclosure purposes, the fair value hierarchy classification is determined based on the lowest level input that is significant to the fair value measurement in its entirety. The categorization of a value determined for investments and derivative financial instruments is based on the pricing transparency of the investment and derivative financial instrument and is not necessarily an indication of the risks associated with investing in those securities. The three levels of the fair value hierarchy are as follows: |
| | Ÿ | | Level 1 — unadjusted quoted prices in active markets/exchanges for identical assets or liabilities that the Master Portfolio has the ability to access |
| | Ÿ | | Level 2 — other observable inputs (including, but not limited to, quoted prices for similar assets or liabilities in markets that are active, quoted prices for identical or similar assets or liabilities in markets that are not active, inputs other than quoted prices that are observable for the assets or liabilities (such as interest rates, yield curves, volatilities, prepayment speeds, loss severities, credit risks and default rates) or other market–corroborated inputs) |
| | Ÿ | | Level 3 — unobservable inputs based on the best information available in the circumstances, to the extent observable inputs are not available (including the Master Portfolio’s own assumptions used in determining the fair value of investments and derivative financial instruments) |
Changes in valuation techniques may result in transfers into or out of an assigned level within the disclosure hierarchy. In accordance with the Master Portfolio’s policy, transfers between different levels of the fair value disclosure hierarchy are deemed to have occurred as of the beginning of the reporting period. For information about the Master Portfolio’s policy regarding valuation of investments and derivative financial instruments, refer to Note 2 of the Notes to Financial Statements.
See Notes to Financial Statements.
| | | | | | |
| | | SEMI-ANNUAL REPORT | | NOVEMBER 30, 2014 | | 41 |
| | | | |
| Schedule of Investments (continued) | | | BlackRock Master Small Cap Growth Portfolio | |
The following tables summarize the Master Portfolio’s investments and derivative financial instruments categorized in the disclosure hierarchy as of November 30, 2014:
| | | | | | | | | | | | | | | | | | | | |
| | | Level 1 | | Level 2 | | Level 3 | | Total |
Assets: | | | | | | | | | | | | | | | | | | | | |
Investments: | | | | | | | | | | | | | | | | | | | | |
Long-Term Investments: | | | | | | | | | | | | | | | | | | | | |
Common Stocks: | | | | | | | | | | | | | | | | | | | | |
Aerospace & Defense | | | $ | 1,506,367 | | | | | — | | | | | — | | | | $ | 1,506,367 | |
Air Freight & Logistics | | | | 1,351 | | | | | — | | | | | — | | | | | 1,351 | |
Airlines | | | | 3,540,690 | | | | | — | | | | | — | | | | | 3,540,690 | |
Auto Components | | | | 7,033,935 | | | | | — | | | | | — | | | | | 7,033,935 | |
Banks | | | | 4,157,554 | | | | | — | | | | | — | | | | | 4,157,554 | |
Biotechnology | | | | 20,147,082 | | | | | — | | | | | — | | | | | 20,147,082 | |
Building Products | | | | 322,838 | | | | | — | | | | | — | | | | | 322,838 | |
Capital Markets | | | | 2,630,569 | | | | | — | | | | | — | | | | | 2,630,569 | |
Chemicals | | | | 1,544,409 | | | | | — | | | | | — | | | | | 1,544,409 | |
Commercial Services & Supplies | | | | 987,343 | | | | | — | | | | | — | | | | | 987,343 | |
Communications Equipment | | | | 7,161,630 | | | | | — | | | | | — | | | | | 7,161,630 | |
Construction & Engineering | | | | 122,042 | | | | | — | | | | | — | | | | | 122,042 | |
Consumer Finance | | | | 422,589 | | | | | — | | | | | — | | | | | 422,589 | |
Containers & Packaging | | | | 2,186,668 | | | | | — | | | | | — | | | | | 2,186,668 | |
Distributors | | | | 997,518 | | | | | — | | | | | — | | | | | 997,518 | |
Diversified Consumer Services | | | | 4,538,203 | | | | | — | | | | | — | | | | | 4,538,203 | |
Diversified Financial Services | | | | 40,188 | | | | | — | | | | | — | | | | | 40,188 | |
Diversified Telecommunication Services | | | | 3,212,908 | | | | | — | | | | | — | | | | | 3,212,908 | |
Electrical Equipment | | | | 4,038,363 | | | | | — | | | | | — | | | | | 4,038,363 | |
Electronic Equipment, Instruments & Components | | | | 8,504,729 | | | | | — | | | | | — | | | | | 8,504,729 | |
Energy Equipment & Services | | | | 2,015,503 | | | | | — | | | | | — | | | | | 2,015,503 | |
Food & Staples Retailing | | | | 22 | | | | | — | | | | | — | | | | | 22 | |
Food Products | | | | 3,146,043 | | | | | — | | | | | — | | | | | 3,146,043 | |
Gas Utilities | | | | 98,934 | | | | | — | | | | | — | | | | | 98,934 | |
Health Care Equipment & Supplies | | | | 10,992,530 | | | | | — | | | | | — | | | | | 10,992,530 | |
Health Care Providers & Services | | | | 12,304,062 | | | | | — | | | | | — | | | | | 12,304,062 | |
Health Care Technology | | | | 1,537,904 | | | | | — | | | | | — | | | | | 1,537,904 | |
Hotels, Restaurants & Leisure | | | | 6,997,248 | | | | | — | | | | | — | | | | | 6,997,248 | |
Household Durables | | | | 1,401,386 | | | | | — | | | | | — | | | | | 1,401,386 | |
Independent Power and Renewable Electricity Producers | | | | 3,348 | | | | | — | | | | | — | | | | | 3,348 | |
Insurance | | | | 309,676 | | | | | — | | | | | — | | | | | 309,676 | |
Internet & Catalog Retail | | | | 1,459,555 | | | | | — | | | | | — | | | | | 1,459,555 | |
Internet Software & Services | | | | 10,010,909 | | | | | — | | | | | — | | | | | 10,010,909 | |
IT Services | | | | 6,628,966 | | | | | — | | | | | — | | | | | 6,628,966 | |
Leisure Products | | | | 234,648 | | | | | — | | | | | — | | | | | 234,648 | |
Life Sciences Tools & Services | | | | 388,790 | | | | | — | | | | | — | | | | | 388,790 | |
Machinery | | | | 8,444,757 | | | | | — | | | | | — | | | | | 8,444,757 | |
Marine | | | | 20,614 | | | | | — | | | | | — | | | | | 20,614 | |
Media | | | | 1,433,795 | | | | | — | | | | | — | | | | | 1,433,795 | |
Metals & Mining | | | | 89,726 | | | | | — | | | | | — | | | | | 89,726 | |
Oil, Gas & Consumable Fuels | | | | 4,266,522 | | | | | — | | | | | — | | | | | 4,266,522 | |
Paper & Forest Products | | | | 5,089,212 | | | | | — | | | | | — | | | | | 5,089,212 | |
Pharmaceuticals | | | | 4,284,775 | | | | $ | 2,239 | | | | $ | 19,570 | | | | | 4,306,584 | |
Professional Services | | | | 6,060,497 | | | | | — | | | | | — | | | | | 6,060,497 | |
Real Estate Investment Trusts (REITs) | | | | 6,784,455 | | | | | — | | | | | — | | | | | 6,784,455 | |
Real Estate Management & Development | | | | 859,712 | | | | | — | | | | | — | | | | | 859,712 | |
Road & Rail | | | | 3,063,164 | | | | | — | | | | | — | | | | | 3,063,164 | |
Semiconductors & Semiconductor Equipment | | | | 14,380,814 | | | | | — | | | | | — | | | | | 14,380,814 | |
Software | | | | 14,271,387 | | | | | — | | | | | 6,575 | | | | | 14,277,962 | |
Specialty Retail | | | | 4,142,003 | | | | | — | | | | | — | | | | | 4,142,003 | |
Technology Hardware, Storage & Peripherals | | | | 580,143 | | | | | — | | | | | — | | | | | 580,143 | |
Textiles, Apparel & Luxury Goods | | | | 7,474,503 | | | | | — | | | | | — | | | | | 7,474,503 | |
Thrifts & Mortgage Finance | | | | 1,989,025 | | | | | — | | | | | — | | | | | 1,989,025 | |
Tobacco | | | | 1,609,065 | | | | | — | | | | | — | | | | | 1,609,065 | |
Trading Companies & Distributors | | | | 2,828,866 | | | | | — | | | | | — | | | | | 2,828,866 | |
Water Utilities | | | | 632,625 | | | | | — | | | | | — | | | | | 632,625 | |
Wireless Telecommunication Services | | | | — | | | | | — | | | | | 8,502 | | | | | 8,502 | |
See Notes to Financial Statements.
| | | | | | |
| 42 | | SEMI-ANNUAL REPORT | | NOVEMBER 30, 2014 | | |
| | | | |
| Schedule of Investments (concluded) | | | BlackRock Master Small Cap Growth Portfolio | |
| | | | | | | | | | | | | | | | | | | | |
| | | Level 1 | | Level 2 | | Level 3 | | Total |
Other Interests: | | | | | | | | | | | | | | | | | | | | |
Professional Services | | | | — | | | | | — | | | | $ | 177 | | | | $ | 177 | |
Preferred Stocks: | | | | | | | | | | | | | | | | | | | | |
Consumer Finance | | | | — | | | | | — | | | | | 347,546 | | | | | 347,546 | |
Household Durables | | | | — | | | | | — | | | | | 250,564 | | | | | 250,564 | |
Software | | | | — | | | | | — | | | | | 1,069,507 | | | | | 1,069,507 | |
Warrants: | | | | | | | | | | | | | | | | | | | | |
Real Estate Management & Development | | | | — | | | | | — | | | | | 957 | | | | | 957 | |
Short-Term Securities | | | $ | 1,965,748 | | | | $ | 8,893,117 | | | | | — | | | | | 10,858,865 | |
| | | | | |
Total | | | $ | 220,898,865 | | | | $ | 8,895,356 | | | | $ | 1,702,441 | | | | $ | 231,496,662 | |
| | | | | |
| | | | | | | | | | | | | | | | | | | | |
| | | Level 1 | | Level 2 | | Level 3 | | Total |
Derivative Financial Instruments2 | | | | | | | | | | | | | | | | | | | | |
Liabilities: | | | | | | | | | | | | | | | | | | | | |
Equity contracts | | | $ | (1,751 | ) | | | | — | | | | | — | | | | $ | (1,751 | ) |
2 Derivative financial instruments are financial futures contracts, which are valued at the unrealized appreciation/depreciation on the instrument. | |
|
| The Master Portfolio may hold assets and/or liabilities in which the fair value approximates the carrying amount for financial statement purposes. As of November 30, 2014, such assets and/or liabilities are categorized within the disclosure hierarchy as follows: | |
| | | | | | | | | | | | | | | | | | | | |
| | | Level 1 | | Level 2 | | Level 3 | | Total |
Assets: | | | | | | | | | | | | | | | | | | | | |
Cash pledged for financial futures contracts | | | $ | 113,000 | | | | | — | | | | | — | | | | $ | 113,000 | |
Liabilities: | | | | | | | | | | | | | | | | | | | | |
Bank overdraft | | | | — | | | | $ | (48,712 | ) | | | | — | | | | | (48,712 | ) |
Collateral on securities loaned at value | | | | — | | | | | (8,893,117 | ) | | | | — | | | | | (8,893,117 | ) |
| | | | | |
Total | | | $ | 113,000 | | | | $ | (8,941,829 | ) | | | | — | | | | $ | (8,828,829 | ) |
| | | | | |
There were no transfers between levels during the six months ended November 30, 2014.
See Notes to Financial Statements.
| | | | | | |
| | | SEMI-ANNUAL REPORT | | NOVEMBER 30, 2014 | | 43 |
| | | | |
| Statement of Assets and Liabilities | | | BlackRock Master Small Cap Growth Portfolio | |
| | | | |
| November 30, 2014 (Unaudited) | | | |
| | | | |
| Assets | | | | |
Investments at value — unaffiliated (including securities loaned at value of $8,155,152) (cost — $202,157,756) | | $ | 220,637,797 | |
Investments at value — affiliated (cost — $10,858,865) | | | 10,858,865 | |
Cash pledged for financial futures contracts | | | 113,000 | |
Investments sold receivable | | | 938,881 | |
Dividends receivable — unaffiliated | | | 81,116 | |
Dividends receivable — affiliated | | | 106 | |
Securities lending income receivable — affiliated | | | 45,502 | |
Prepaid expenses | | | 1,259 | |
| | | | |
Total assets | | | 232,676,526 | |
| | | | |
| | | | |
| Liabilities | | | | |
Bank overdraft | | | 48,712 | |
Collateral on securities loaned at value | | | 8,893,117 | |
Variation margin payable on financial futures contracts | | | 38,095 | |
Investments purchased payable | | | 819,125 | |
Withdrawals payable to investors | | | 445,887 | |
Investment advisory fees payable | | | 98,823 | |
Directors’ fees payable | | | 3,092 | |
Other affiliates payable | | | 1,090 | |
Other accrued expenses payable | | | 70,163 | |
| | | | |
Total liabilities | | | 10,418,104 | |
| | | | |
Net Assets | | $ | 222,258,422 | |
| | | | |
| | | | |
| Net Assets Consist of | | | | |
Investors’ capital | | $ | 203,780,132 | |
Net unrealized appreciation/depreciation | | | 18,478,290 | |
| | | | |
Net Assets | | $ | 222,258,422 | |
| | | | |
See Notes to Financial Statements.
| | | | | | |
| 44 | | SEMI-ANNUAL REPORT | | NOVEMBER 30, 2014 | | |
| | | | |
| Statement of Operations | | | BlackRock Master Small Cap Growth Portfolio | |
| | | | |
| Six Months Ended November 30, 2014 (Unaudited) | | | |
| | | | |
| Investment Income | | | | |
Dividends — unaffiliated | | $ | 713,467 | |
Securities lending — affiliated — net | | | 144,508 | |
Dividends — affiliated | | | 380 | |
Foreign taxes withheld | | | (68 | ) |
| | | | |
Total income | | | 858,287 | |
| | | | |
| | | | |
| Expenses | | | | |
Investment advisory | | | 798,944 | |
Accounting services | | | 31,500 | |
Custodian | | | 30,063 | |
Professional | | | 26,928 | |
Directors | | | 4,229 | |
Printing | | | 2,344 | |
Miscellaneous | | | 13,184 | |
| | | | |
Total expenses | | | 907,192 | |
Less fees waived by Manager | | | (183,287 | ) |
| | | | |
Total expenses after fees waived | | | 723,905 | |
| | | | |
Net investment income | | | 134,382 | |
| | | | |
| | | | |
| Realized and Unrealized Gain (Loss) | | | | |
Net realized gain from: | | | | |
Investments | | | 7,614,012 | |
Financial futures contracts | | | 121,370 | |
| | | | |
| | | 7,735,382 | |
| | | | |
Net change in unrealized appreciation/depreciation on: | | | | |
Investments | | | (1,493,737 | ) |
Financial futures contracts | | | (137,872 | ) |
| | | | |
| | | (1,631,609 | ) |
| | | | |
Net realized and unrealized gain | | | 6,103,773 | |
| | | | |
Net Increase in Net Assets Resulting from Operations | | $ | 6,238,155 | |
| | | | |
See Notes to Financial Statements.
| | | | | | |
| | | SEMI-ANNUAL REPORT | | NOVEMBER 30, 2014 | | 45 |
| | | | |
| Statements of Changes in Net Assets | | | BlackRock Master Small Cap Growth Portfolio | |
| | | | | | | | |
| Increase (Decrease) in Net Assets: | | Six Months
Ended
November 30,
2014
(Unaudited) | | | Year Ended
May 31, 2014 | |
| | | | | | | | |
| Operations | | | | | | | | |
Net investment income | | $ | 134,382 | | | $ | 238,333 | |
Net realized gain | | | 7,735,382 | | | | 47,784,879 | |
Net change in unrealized appreciation/depreciation | | | (1,631,609 | ) | | | (1,607,784 | ) |
| | | | |
Net increase in net assets resulting from operations | | | 6,238,155 | | | | 46,415,428 | |
| | | | |
| | | | | | | | |
| Capital Transactions | | | | | | | | |
Proceeds from contributions | | | 24,364,528 | | | | 61,663,245 | |
Value of withdrawals | | | (40,231,956 | ) | | | (92,380,088 | ) |
| | | | |
Net decrease in net assets derived from capital transactions | | | (15,867,428 | ) | | | (30,716,843 | ) |
| | | | |
| | | | | | | | |
| Net Assets | | | | | | | | |
Total increase (decrease) in net assets | | | (9,629,273 | ) | | | 15,698,585 | |
Beginning of period | | | 231,887,695 | | | | 216,189,110 | |
| | | | |
End of period | | $ | 222,258,422 | | | $ | 231,887,695 | |
| | | | |
| | | | |
| Financial Highlights | | | BlackRock Master Small Cap Growth Portfolio | |
| | | | | | | | | | | | | | | | | | | | | | | | |
| | | Six Months
Ended
November 30,
2014
(Unaudited) | | | Year Ended May 31, | |
| | | | 2014 | | | 2013 | | | 2012 | | | 2011 | | | 2010 | |
| | | | | | | | | | | | | | | | | | | | | | | | |
| Total Return | | | | | |
Total return | | | 2.76 | %1 | | | 22.22 | % | | | 31.47 | % | | | (13.48 | )% | | | 35.13 | % | | | 26.12 | % |
| | | | |
| | | | | | | | | | | | | | | | | | | | | | | | |
| Ratios to Average Net Assets | | | | | |
Total expenses | | | 0.79 | %2 | | | 0.80 | % | | | 0.79 | % | | | 0.77 | % | | | 0.76 | % | | | 0.77 | % |
| | | | |
Total expenses after fees waived | | | 0.63 | %2 | | | 0.64 | % | | | 0.77 | % | | | 0.77 | % | | | 0.76 | % | | | 0.77 | % |
| | | | |
Net investment income (loss) | | | 0.12 | %2 | | | 0.10 | % | | | 0.47 | % | | | (0.32 | )% | | | (0.51 | )% | | | (0.50 | )% |
| | | | |
| | | | | | | | | | | | | | | | | | | | | | | | |
| Supplemental Data | | | | | |
Net assets, end of period (000) | | $ | 222,258 | | | $ | 231,888 | | | $ | 216,189 | | | $ | 216,838 | | | $ | 504,292 | | | $ | 416,087 | |
| | | | |
Portfolio turnover rate | | | 83 | % | | | 152 | % | | | 165 | % | | | 143 | % | | | 127 | % | | | 114 | % |
| | | | |
| | 1 | | Aggregate total return. |
See Notes to Financial Statements.
| | | | | | |
| 46 | | SEMI-ANNUAL REPORT | | NOVEMBER 30, 2014 | | |
| | | | |
| Notes to Financial Statements (Unaudited) | | | BlackRock Master Small Cap Growth Portfolio | |
1. Organization:
BlackRock Master Small Cap Growth Portfolio (the “Master Portfolio”), a series of BlackRock Master LLC (the “Master LLC”), is registered under the Investment Company Act of 1940, as amended (the “1940 Act”), as a diversified, open-end management investment company. The Master LLC is organized as a Delaware limited liability company. The Limited Liability Company Agreement of the Master LLC permits the Board of Directors of the Master LLC (the “Board”) to issue non-transferable interests in the Master LLC, subject to certain limitations.
The Master Portfolio, together with certain other registered investment companies advised by BlackRock Advisors, LLC (the “Manager”) or its affiliates, is included in a complex of open-end funds referred to as the Equity-Liquidity Complex.
2. Significant Accounting Policies:
The Master Portfolio’s financial statements are prepared in conformity with accounting principles generally accepted in the United States of America (“U.S. GAAP”), which may require management to make estimates and assumptions that affect the reported amounts of assets and liabilities in the financial statements and the reported amounts of increases and decreases in net assets from operations during the reporting period. Actual results could differ from those estimates. The Master Portfolio is considered an investment company under U.S. GAAP and follows the accounting and reporting guidance applicable to investment companies. The following is a summary of significant accounting policies followed by the Master Portfolio:
Valuation: The Master Portfolio’s investments are valued at fair value as of the close of trading on the New York Stock Exchange (“NYSE”) (generally 4:00 p.m., Eastern time) (or if the reporting date falls on a day the NYSE is closed, investments are valued at fair value as of the report date). U.S. GAAP defines fair value as the price the Master Portfolio would receive to sell an asset or pay to transfer a liability in an orderly transaction between market participants at the measurement date. The Master Portfolio determines the fair values of its financial instruments at market value using independent dealers or pricing services under policies approved by the Board. The BlackRock Global Valuation Methodologies Committee (the “Global Valuation Committee”) is the committee formed by management to develop global pricing policies and procedures and to provide oversight of the pricing function for the Master Portfolio for all financial instruments.
Equity investments traded on a recognized securities exchange are valued at the official close each day, if available. For equity investments traded on more than one exchange, the official close price on the exchange where the stock is primarily traded is used. Equity investments traded on a recognized exchange for which there were no sales on that day may be valued at the last available bid (long positions) or ask (short positions) price. Financial futures contracts traded on exchanges are valued at their last sale price. Investments in open-end registered investment companies are valued at NAV each business day.
The Master Portfolio values its investment in BlackRock Liquidity Series, LLC, Money Market Series (the “Money Market Series”) at fair value, which is ordinarily based upon its pro rata ownership in the underlying fund’s net assets. The Money Market Series seeks current income consistent with maintaining liquidity and preserving capital. Although the Money Market Series is not registered under the 1940 Act, its investments will follow the parameters of investments by a money market fund that is subject to Rule 2a-7 under the 1940 Act. The Master Portfolio may withdraw up to 25% of its investment daily, although the manager of the Money Market Series, in its sole discretion, may permit an investor to withdraw more than 25% on any one day.
In the event that the application of these methods of valuation results in a price for an investment that is deemed not to be representative of the market value of such investment, or if a price is not available, the investment will be valued by the Global Valuation Committee, or its delegate, in accordance with a policy approved by the Board as reflecting fair value (“Fair Value Investments”). When determining the price for Fair Value Investments, the Global Valuation Committee, or its delegate, seeks to determine the price that the Master Portfolio might reasonably expect to receive or pay from the current sale or purchase of that asset or liability in an arm’s-length transaction. Fair value determinations shall be based upon all available factors that the Global Valuation Committee, or its delegate, deems relevant consistent with the principles of fair value measurement, which include the market approach, income approach and/or in the case of recent investments, the cost approach, as appropriate. The market approach generally consists of using comparable market transactions. The income approach generally is used to discount future cash flows to present value and is adjusted for liquidity as appropriate. These factors include but are not limited to: (i) attributes specific to the investment or asset; (ii) the principal market for the investment or asset; (iii) the customary participants in the principal market for the investment or asset; (iv) data assumptions by market participants for the investment or asset, if reasonably available; (v) quoted prices for similar investments or assets in active markets; and (vi) other factors, such as future cash flows, interest rates, yield curves, volatilities, prepayment speeds, loss severities, credit risks, recovery rates, liquidation amounts and/or default rates. Due to the inherent uncertainty of valuations of such investments, the fair values may differ from the values that would have been used had an active market existed. The Global Valuation Committee, or its delegate, employs various methods for calibrating valuation approaches for investments where an active market does not exist, including regular due diligence of the Master Portfolio’s pricing vendors, regular reviews of key inputs and assumptions, transactional back-testing or disposition analysis to compare unrealized gains and losses to realized gains and losses,
| | | | | | |
| | | SEMI-ANNUAL REPORT | | NOVEMBER 30, 2014 | | 47 |
| | |
| Notes to Financial Statements (continued) | | BlackRock Master Small Cap Growth Portfolio |
reviews of missing or stale prices and large movements in market values and reviews of any market related activity. The pricing of all Fair Value Investments is subsequently reported to the Board or a committee thereof on a quarterly basis.
Segregation and Collateralization: In cases where the Master Portfolio enters into certain investments (e.g., financial futures contracts) that would be “senior securities” for 1940 Act purposes, the Master Portfolio may segregate or designate on its books and records cash or liquid securities having a market value at least equal to the amount of the Master Portfolio’s future obligations under such investments. Doing so allows the investment to be excluded from treatment as a “senior security.” Furthermore, if required by an exchange or counterparty agreement, the Master Portfolio may be required to deliver/deposit cash and/or securities to/with an exchange, or broker-dealer or custodian as collateral for certain investments or obligations.
Investment Transactions and Investment Income: For financial reporting purposes, investment transactions are recorded on the dates the transactions are entered into (the trade dates). Realized gains and losses on investment transactions are determined on the identified cost basis. Dividend income is recorded on the ex-dividend date. Dividends from foreign securities where the ex-dividend date may have passed are subsequently recorded when the Master Portfolio is informed of the ex-dividend date. Under the applicable foreign tax laws, a withholding tax at various rates may be imposed on capital gains, dividends and interest. Upon notification from issuers, some of the dividend income received from a real estate investment trust may be redesignated as a reduction of cost of the related investment and/or realized gain.
Recent Accounting Standard: In June 2014, the Financial Accounting Standards Board issued guidance to improve the financial reporting of reverse repurchase agreements and other similar transactions. The guidance will require expanded disclosure for entities that enter into reverse repurchase agreements and similar transactions accounted for as secured borrowings. It is effective for financial statements with fiscal years beginning on or after December 15, 2014 and interim periods within those fiscal years. Management is evaluating the impact, if any, of this guidance on the Master Portfolio’s financial statement disclosures.
Other: Expenses directly related to the Master Portfolio are charged to the Master Portfolio. Other operating expenses shared by several funds are prorated among those funds on the basis of relative net assets or other appropriate methods.
The Master Portfolio has an arrangement with the custodian whereby fees may be reduced by credits earned on uninvested cash balances, which, if applicable, are shown as fees paid indirectly in the Statement of Operations. The custodian imposes fees on overdrawn cash balances, which can be offset by accumulated credits earned or may result in additional custody charges.
3. Securities and Other Investments:
Securities Lending: The Master Portfolio may lend its securities to approved borrowers, such as brokers, dealers and other financial institutions. The borrower pledges and maintains with the Master Portfolio collateral consisting of cash, an irrevocable letter of credit issued by a bank, or securities issued or guaranteed by the U.S. government. The initial collateral received by the Master Portfolio is required to have a value of at least 102% of the current value of the loaned securities for securities traded on U.S. exchanges and a value of at least 105% for all other securities. The collateral is maintained thereafter, at a value equal to at least 100% of the current market value of the securities on loan. The market value of the loaned securities is determined at the close of each business day of the Master Portfolio and any additional required collateral is delivered to the Master Portfolio on the next business day. During the term of the loan, the Master Portfolio is entitled to all distributions made on or in respect of the loaned securities. Loans of securities are terminable at any time and the borrower, after notice, is required to return borrowed securities within the standard time period for settlement of securities transactions.
The market value of securities on loan and the value of the related collateral are shown separately in the Statement of Assets and Liabilities as a component of investments at value — unaffiliated, and collateral on securities loaned at value, respectively. As of November 30, 2014, any securities on loan were collateralized by cash. The cash collateral invested by the securities lending agent, BlackRock Investment Management, LLC (“BIM”), if any, is disclosed in the Schedule of Investments.
Securities lending transactions are entered into by the Master Portfolio under Master Securities Lending Agreements (each, an “MSLA”) which provide the right, in the event of default (including bankruptcy or insolvency), for the non-defaulting party to liquidate the collateral and calculate a net exposure to the defaulting party or request additional collateral. In the event that a borrower defaults, the Master Portfolio, as lender, would offset the market value of the collateral received against the market value of the securities loaned. When the value of the collateral is greater than that of the market value of the securities loaned, the lender is left with a net amount payable to the defaulting party. However, bankruptcy or insolvency laws of a particular jurisdiction may impose restrictions on or prohibitions against such a right of offset in the event of an MSLA counterparty’s bankruptcy or insolvency. Under the MSLA, the borrower can resell or re-pledge the loaned securities, and the Master Portfolio can reinvest cash collateral, or, upon an event of default, resell or re-pledge the collateral.
| | | | | | |
| 48 | | SEMI-ANNUAL REPORT | | NOVEMBER 30, 2014 | | |
| | |
| Notes to Financial Statements (continued) | | BlackRock Master Small Cap Growth Portfolio |
The following table is a summary of the Master Portfolio’s securities lending agreements by counterparty, which are subject to offset under an MSLA as of November 30, 2014:
| | | | | | | | | | |
| Counterparty | | Securities Loaned
at Value | | | Cash Collateral
Received1 | | | Net Amount |
Barclays Capital Inc. | | $ | 2,028,507 | | | $ | (2,028,507 | ) | | — |
Credit Suisse Securities (USA) LLC | | | 85,767 | | | | (85,767 | ) | | — |
Deutsche Bank Securities Inc. | | | 34,392 | | | | (34,392 | ) | | — |
Goldman Sachs & Co. | | | 1,493,550 | | | | (1,493,550 | ) | | — |
JP Morgan Securities LLC | | | 127,744 | | | | (127,744 | ) | | — |
Merrill Lynch, Pierce, Fenner & Smith Inc. | | | 60,828 | | | | (60,828 | ) | | — |
Morgan Stanley | | | 4,118,953 | | | | (4,118,953 | ) | | — |
National Financial Services LLC | | | 27,020 | | | | (27,020 | ) | | — |
SG Americas Securities LLC | | | 110,000 | | | | (110,000 | ) | | — |
UBS Securities LLC | | | 68,391 | | | | (68,391 | ) | | — |
| | | |
Total | | $ | 8,155,152 | | | $ | (8,155,152 | ) | | — |
| | | |
| | 1 | | Collateral with a value of $8,893,117 has been received in connection with securities lending agreements. Excess of collateral received from the individual counterparty is not shown for financial reporting purposes. |
The risks of securities lending include the risk that the borrower may not provide additional collateral when required or may not return the securities when due. To mitigate these risks, the Master Portfolio benefits from a borrower default indemnity provided by BIM. BIM’s indemnity allows for full replacement of the securities lent if the collateral received does not cover the value on the securities loaned in the event of borrower default. The Master Portfolio could suffer a loss if the value of an investment purchased with cash collateral falls below the market value of loaned securities or if the value of an investment purchased with cash collateral falls below the value of the original cash collateral received.
4. Derivative Financial Instruments:
The Master Portfolio engages in various portfolio investment strategies using derivative contracts both to increase the returns of the Master Portfolio and/or to economically hedge its exposure to certain risks such as equity risk. These contracts may be transacted on an exchange or over-the-counter (“OTC”).
Financial Futures Contracts: The Master Portfolio purchases and/or sells financial futures contracts to gain exposure to, or economically hedge against, changes in the value of equity securities (equity risk). Financial futures contracts are agreements between the Master Portfolio and a counterparty to buy or sell a specific quantity of an underlying instrument at a specified price and at a specified date. Depending on the terms of the particular contract, financial futures contracts are settled either through physical delivery of the underlying instrument on the settlement date or by payment of a cash settlement amount on the settlement date.
Upon entering into a financial futures contract, the Master Portfolio is required to deposit initial margin with the broker in the form of cash or securities in an amount that varies depending on a contract’s size and risk profile. The initial margin deposit must then be maintained at an established level over the life of the contract. Securities deposited as initial margin are designated on the Schedule of Investments and cash deposited, if any, is recorded on the Statement of Assets and Liabilities as cash pledged for financial futures contracts. Pursuant to the contract, the Master Portfolio agrees to receive from or pay to the broker an amount of cash equal to the daily fluctuation in value of the contract. Such receipts or payments are known as variation margin. Variation margin is recorded by the Master Portfolio as unrealized appreciation or depreciation and, if applicable, as a receivable or payable for variation margin in the Statement of Assets and Liabilities.
When the contract is closed, the Master Portfolio records a realized gain or loss equal to the difference between the value of the contract at the time it was opened and the value at the time it was closed. The use of financial futures contracts involves the risk of an imperfect correlation in the movements in the price of financial futures contracts and the underlying assets.
| | | | | | |
| | | SEMI-ANNUAL REPORT | | NOVEMBER 30, 2014 | | 49 |
| | |
| Notes to Financial Statements (continued) | | BlackRock Master Small Cap Growth Portfolio |
The following is a summary of the Master Portfolio’s derivative financial instruments categorized by risk exposure:
| | | | | | |
| Fair Values of Derivative Financial Instruments as of November 30, 2014 | |
| | | | | Value | |
| | Statement of Assets and Liabilities Location | |
| Derivative
Liabilities |
|
Equity contracts | | Net unrealized appreciation/depreciation1 | | $ | 1,751 | |
| | 1 | | Includes cumulative appreciation/depreciation on financial futures contracts as reported in the Schedule of Investments. Only current day’s variation margin is reported within the Statement of Assets and Liabilities. |
| | | | |
The Effect of Derivative Financial Instruments in the Statement of Operations Six Months Ended November 30, 2014 |
| | | Net Realized Gain From | | Net Change in Unrealized Appreciation/Depreciation on |
Equity contracts: | | | | |
Financial futures contracts | | $ 121,370 | | $ (137,872) |
For the six months ended November 30, 2014, the average quarterly balances of outstanding derivative financial instruments were as follows:
| | | | |
Financial futures contracts: | | | | |
Average number of contracts purchased | | | 21 | |
Average notional value of contracts purchased | | $ | 2,403,670 | |
Counterparty Credit Risk: A derivative contract may suffer a mark-to-market loss if the value of the contract decreases due to an unfavorable change in the market rates or values of the underlying instrument. Losses can also occur if the counterparty does not perform under the contract.
With exchange-traded futures, there is less counterparty credit risk to the Master Portfolio since the exchange or clearinghouse, as counterparty to such instruments, guarantees against a possible default. The clearinghouse stands between the buyer and the seller of the contract; therefore, credit risk is limited to failure of the clearinghouse. While offset rights may exist under applicable law, the Master Portfolio does not have a contractual right of offset against a clearing broker or clearinghouse in the event of a default (including the bankruptcy or insolvency) of the clearing broker or clearinghouse. Additionally, credit risk exists in exchange-traded futures with respect to initial and variation margin that is held in a clearing broker’s customer accounts. While clearing brokers are required to segregate customer margin from their own assets, in the event that a clearing broker becomes insolvent or goes into bankruptcy and at that time there is a shortfall in the aggregate amount of margin held by the clearing broker for all its clients, typically the shortfall would be allocated on a pro rata basis across all the clearing broker’s customers, potentially resulting in losses to the Master Portfolio.
5. Investment Advisory Agreement and Other Transactions with Affiliates:
The PNC Financial Services Group, Inc. is the largest stockholder and an affiliate, for 1940 Act purposes, of BlackRock, Inc. (“BlackRock”).
The Master LLC, on behalf of the Master Portfolio, entered into an Investment Advisory Agreement with the Manager, the Master Portfolio’s investment advisor, an indirect, wholly owned subsidiary of BlackRock, to provide investment advisory and administration services. The Manager is responsible for the management of the Master Portfolio’s portfolio and provides the necessary personnel, facilities, equipment and certain other services necessary to the operations of the Master Portfolio. For such services, the Master Portfolio pays the Manager a monthly fee based on a percentage of the Master Portfolio’s average daily net assets at the following annual rates:
| | | | |
| Average Daily Net Assets | | Investment Advisory Fee | |
First $1 Billion | | | 0.70 | % |
$1 Billion - $3 Billion | | | 0.66 | % |
$3 Billion - $5 Billion | | | 0.63 | % |
$5 Billion - $10 Billion | | | 0.61 | % |
Greater than $10 Billion | | | 0.60 | % |
The Manager entered into a contractual agreement to waive 0.16% of its investment advisory fees as a percentage of the Master Portfolio’s average daily net assets until October 1, 2015. The contractual agreement may be terminated upon 90 days’ notice by a majority of the independent Directors of the Master LLC or by a vote of a majority of the outstanding voting securities of the Master Portfolio. For the six months ended November 30, 2014, the Manager waived $182,616 of investment advisory fees, which is included in fees waived by Manager in the Statement of Operations.
The Manager voluntarily agreed to waive its investment advisory fees by the amount of investment advisory fees the Master Portfolio pays to the Manager indirectly through its investment in affiliated money market funds. However, the Manager does not waive its investment advisory fees by the
| | | | | | |
| 50 | | SEMI-ANNUAL REPORT | | NOVEMBER 30, 2014 | | |
| | |
| Notes to Financial Statements (continued) | | BlackRock Master Small Cap Growth Portfolio |
amount of investment advisory fees paid in connection with the Master Portfolio’s investments in other affiliated investment companies, if any. This amount is included in fees waived by Manager in the Statement of Operations. For the six months ended November 30, 2014, the amount waived was $671.
Prior to July 1, 2014, BlackRock Capital Management (“BCM”), an affiliate of the Manager, served as a sub-advisor to the Master Portfolio pursuant to sub-advisory agreements with the Manager, and received for its services a monthly fee from the Manager at an annual rate equal to a percentage of the investment advisory fees paid by each Fund to the Manager under the Investment Advisory Agreements. Effective July 1, 2014, the sub-advisory agreements between the Manager and BCM, with respect to each Fund, expired.
For the six months ended November 30, 2014, the Master Portfolio reimbursed the Manager $1,256 for certain accounting services, which is included in accounting services in the Statement of Operations.
The U.S. Securities and Exchange Commission has issued an exemptive order which permits BIM, an affiliate of the Manager, to serve as securities lending agent for the Master Portfolio, subject to applicable conditions. As securities lending agent, BIM bears all operational costs directly related to securities lending. The Master Portfolio is responsible for expenses in connection with the investment of cash collateral received for securities on loan (the “collateral investment expenses”). The cash collateral is invested in a private investment company managed by the Manager or its affiliates. However, BIM has agreed to cap the collateral investment expenses of the private investment company to an annual rate of 0.04%. The investment advisor to the private investment company will not charge any advisory fees with respect to shares purchased by the Master Portfolio.
Securities lending income is equal to the total of income earned from the reinvestment of cash collateral, net of fees and other payments to and from borrowers of securities, and less the collateral investment expenses. The Master Portfolio retains a portion of securities lending income and remits a remaining portion to BIM as compensation for its services as securities lending agent. Pursuant to a securities lending agreement, BIM may lend securities only when the difference between the borrower rebate rate and the risk free rate exceeds a certain level (such securities, the “specials only securities”).
Pursuant to such agreement, the Master Portfolio retains 80% of securities lending income. In addition, commencing the business day following the date that the aggregate securities lending income earned across the Equity-Liquidity Complex in a calendar year exceeds the aggregate securities lending income earned across the Equity-Liquidity Complex through the lending of specials only securities in the calendar year 2013, the Master Portfolio, pursuant to the securities lending agreement, will retain for the remainder of the calendar year, securities lending income in an amount equal to 85% of securities lending income. The share of securities lending income earned by the Master Portfolio is shown as securities lending — affiliated — net in the Statement of Operations. For the six months ended November 30, 2014, the Master Portfolio paid BIM $28,638 for securities lending agent services.
Certain officers and/or directors of the Master LLC are officers and/or directors of BlackRock or its affiliates.
6. Purchases and Sales:
For the six months ended November 30, 2014, purchases and sales of investments, excluding short-term securities were $188,436,554 and $200,393,461, respectively.
7. Income Tax Information:
The Master Portfolio is disregarded as an entity separate from its owner for tax purposes. As such, the owner of the Master Portfolio is treated as the owner of the net assets, income, expenses and realized and unrealized gains and losses of the Master Portfolio. Therefore, no federal tax provision is required. It is intended that the Master Portfolio’s assets will be managed so the owner of the Master Portfolio can satisfy the requirements of Subchapter M of the Internal Revenue Code of 1986, as amended.
As of November 30, 2014, gross unrealized appreciation and depreciation based on cost for federal income tax purposes were as follows:
| | | | |
Tax cost | | $ | 214,668,743 | |
| | | | |
Gross unrealized appreciation | | $ | 28,269,034 | |
Gross unrealized depreciation | | | (11,441,115 | ) |
| | | | |
Net unrealized appreciation | | $ | 16,827,919 | |
| | | | |
| | | | | |
| | | | | | |
| | | SEMI-ANNUAL REPORT | | NOVEMBER 30, 2014 | | 51 |
| | |
| Notes to Financial Statements (concluded) | | BlackRock Master Small Cap Growth Portfolio |
8. Bank Borrowings:
The Master Portfolio, along with certain other funds managed by the Manager and its affiliates (“Participating Funds”), is a party to a 364-day, $1.1 billion credit agreement with a group of lenders, under which the Master Portfolio may borrow to fund shareholder redemptions. Excluding commitments designated for certain funds, the Participating Funds, including the Master Portfolio, can borrow up to an aggregate commitment amount of $650 million, subject to asset coverage and other limitations as specified in the agreement. Effective November 25, 2014, the credit agreement was amended to an aggregate commitment amount of $2.1 billion, of which, the Participating Funds, including the Master Portfolio, can borrow up to $1.6 billion, subject to asset coverage and other limitations as specified in the agreement. The agreement expires in April 2015. The credit agreement has the following terms: a fee of 0.06% per annum on unused commitment amounts and interest at a rate equal to the higher of (a) the one-month LIBOR plus 0.80% per annum or (b) the Fed Funds rate plus 0.80% per annum on amounts borrowed. Participating Funds paid administration, legal and arrangement fees, which are included in miscellaneous expenses in the Statement of Operations, and along with commitment fees, were allocated among such funds based upon portions of the aggregate commitment available to them and relative net assets of Participating Funds. The Master Portfolio did not borrow under the credit agreement during the six months ended November 30, 2014.
9. Principal Risks:
In the normal course of business, the Master Portfolio invests in securities and enters into transactions where risks exist due to fluctuations in the market (market risk) or failure of the issuer of a security to meet all its obligations (issuer credit risk). The value of securities held by the Master Portfolio may decline in response to certain events, including those directly involving the issuers whose securities are owned by the Master Portfolio; conditions affecting the general economy; overall market changes; local, regional or global political, social or economic instability; and currency and interest rate and price fluctuations. Similar to issuer credit risk, the Master Portfolio may be exposed to counterparty credit risk, or the risk that an entity with which the Master Portfolio has unsettled or open transactions may fail to or be unable to perform on its commitments. The Master Portfolio manages counterparty credit risk by entering into transactions only with counterparties that it believes have the financial resources to honor their obligations and by monitoring the financial stability of those counterparties. Financial assets, which potentially expose the Master Portfolio to market, issuer and counterparty credit risks, consist principally of financial instruments and receivables due from counterparties. The extent of the Master Portfolio’s exposure to market, issuer and counterparty credit risks with respect to these financial assets is generally approximated by their value recorded in the Statement of Assets and Liabilities, less any collateral held by the Master Portfolio.
As of November 30, 2014, the Master Portfolio invested a significant portion of its assets in securities in the information technology and health care sectors. Changes in economic conditions affecting such sectors would have a greater impact on the Master Portfolio and could affect the value, income and/or liquidity of positions in such securities.
10. Subsequent Events:
Management has evaluated the impact of all subsequent events on the Master Portfolio through the date the financial statements were issued and has determined that there were no subsequent events requiring adjustment or additional disclosure in the financial statements.
| | | | | | |
| 52 | | SEMI-ANNUAL REPORT | | NOVEMBER 30, 2014 | | |
| | |
| Officers and Directors/Trustees | | |
Ronald W. Forbes, Co-Chairman of the Board and Director/Trustee
Rodney D. Johnson, Co-Chairman of the Board and Director/Trustee
Paul L. Audet, Director/Trustee
David O. Beim, Director/Trustee
Henry Gabbay, Director/Trustee
Frank J. Fabozzi, Director/Trustee
Dr. Matina S. Horner, Director/Trustee
Herbert I. London, Director/Trustee
Ian A. MacKinnon, Director/Trustee
Cynthia A. Montgomery, Director/Trustee
Joseph P. Platt, Director/Trustee
Robert C. Robb, Jr., Director/Trustee
Toby Rosenblatt, Director/Trustee
Kenneth L. Urish, Director/Trustee
Frederick W. Winter, Director/Trustee
John M. Perlowski, President and Chief Executive Officer
Richard Hoerner, CFA, Vice President4
Jennifer McGovern, Vice President
Neal Andrews, Chief Financial Officer
Jay Fife, Treasurer
Charles Park, Chief Compliance Officer and Anti-Money Laundering Officer
Benjamin Archibald, Secretary
Investment Advisor and Co-Administrator
BlackRock Advisors, LLC1
Wilmington, DE 19809
Accounting Agent, Co-Administrator and Transfer Agent
BNY Mellon Investment Servicing (US) Inc.1
Wilmington, DE 19809
Custodians
Brown Brothers Harriman & Co.2
Boston, MA 02109
The Bank of New York Mellon3
New York, NY 10286
Distributor
BlackRock Investments, LLC
New York, NY 10022
Legal Counsel
Sidley Austin LLP
New York, NY 10019
Independent Registered Public Accounting Firm
Deloitte & Touche LLP
Philadelphia, PA 19103
Address of the Fund/Trust
100 Bellevue Parkway
Wilmington, DE 19809
Effective September 10, 2014, Brendan Kyne resigned as a Vice President of the Master LLC/Trust/Corporation and Jennifer McGovern became a Vice President of the Master LLC/Trust/Corporation.
Effective December 31, 2014, Paul L. Audet and Henry Gabbay resigned as Directors/Trustees of the Master LLC/Trust/Corporation and Ronald W. Forbes resigned as Director/Trustee of the Master LLC/Trust/Corporation and Co-Chair of the Board. Effective January 1, 2015, Collette Chilton, Barbara G. Novick and Mark Stalnecker were appointed to serve as Directors/Trustees of the Master LLC/Trust/ Corporation.
| | 1 | | Co-Administrator for BlackRock Disciplined Small Cap Core Fund. |
| | 2 | | For BlackRock Master Small Cap Growth Portfolio. |
| | 3 | | For BlackRock Disciplined Small Cap Core Fund. |
| | | | | | |
| | | SEMI-ANNUAL REPORT | | NOVEMBER 30, 2014 | | 53 |
Householding
The Funds will mail only one copy of shareholder documents, including prospectuses, annual and semi-annual reports and proxy statements, to shareholders with multiple accounts at the same address. This practice is commonly called “householding” and is intended to reduce expenses and eliminate duplicate mailings of shareholder documents. Mailings of your shareholder documents may be householded indefinitely unless you instruct us otherwise. If you do not want the mailing of these documents to be combined with those for other members of your household, please call the Funds at (800) 441-7762.
Availability of Quarterly Schedule of Investments
The Funds/Master Portfolio file their complete schedule of portfolio holdings with the SEC for the first and third quarters of each fiscal year on Form N-Q. The Funds’/Master Portfolio’s Forms N-Q are available on the SEC’s website at http://www.sec.gov and may also be reviewed and copied at the SEC’s Public Reference Room in Washington, D.C. Information on how to access documents on the SEC’s website without charge may be obtained by calling (800) SEC-0330. The Funds’/Master Portfolio’s Forms N-Q may also be obtained upon request and without charge by calling (800) 441-7762.
Availability of Proxy Voting Policies and Procedures
A description of the policies and procedures that the Funds/Master Portfolio use to determine how to vote proxies relating to portfolio securities is available (1) without charge, upon request, by calling (800) 441-7762; (2) at http://www.blackrock.com; and (3) on the SEC’s website at http://www.sec.gov.
Availability of Proxy Voting Record
Information about how the Funds/Master Portfolio voted proxies relating to securities held in the Funds’/Master Portfolio’s portfolios during the most recent 12-month period ended June 30 is available upon request and without charge (1) at http://www.blackrock.com or by calling (800) 441-7762 and (2) on the SEC’s website at http://www.sec.gov.
BlackRock’s Mutual Fund Family
BlackRock offers a diverse lineup of open-end mutual funds crossing all investment styles and managed by experts in equity, fixed income and tax-exempt investing. Visit BlackRock online at http://www.blackrock.com for more information.
Account Information
Call us at (800) 441-7762 from 8:00 AM to 6:00 PM EST on any business day to get information about your account balances, recent transactions and share prices. You can also reach us on the Web at http://www.blackrock.com/funds.
Automatic Investment Plans
Investor Class shareholders who want to invest regularly can arrange to have $50 or more automatically deducted from their checking or savings account and invested in any of the BlackRock funds.
Systematic Withdrawal Plans
Investor Class shareholders can establish a systematic withdrawal plan and receive periodic payments of $50 or more from their BlackRock funds, as long as their account balance is at least $10,000.
Retirement Plans
Shareholders may make investments in conjunction with Traditional, Rollover, Roth, Coverdell, Simple IRAs, SEP IRAs and 403(b) Plans.
| | | | | | |
| 54 | | SEMI-ANNUAL REPORT | | NOVEMBER 30, 2014 | | |
| | |
| Additional Information (concluded) | | |
|
| BlackRock Privacy Principles |
BlackRock is committed to maintaining the privacy of its current and former fund investors and individual clients (collectively, “Clients”) and to safeguarding their non-public personal information. The following information is provided to help you understand what personal information BlackRock collects, how we protect that information and why in certain cases we share such information with select parties.
If you are located in a jurisdiction where specific laws, rules or regulations require BlackRock to provide you with additional or different privacy-related rights beyond what is set forth below, then BlackRock will comply with those specific laws, rules or regulations.
BlackRock obtains or verifies personal non-public information from and about you from different sources, including the following: (i) information we receive from you or, if applicable, your financial intermediary, on applications, forms or other documents; (ii) information about your transactions with us, our affiliates, or others; (iii) information we receive from a consumer reporting agency; and (iv) from visits to our websites.
BlackRock does not sell or disclose to non-affiliated third parties any non-public personal information about its Clients, except as permitted by law or as is necessary to respond to regulatory requests or to service Client accounts. These non-affiliated third parties are required to protect the confidentiality and security of this information and to use it only for its intended purpose.
We may share information with our affiliates to service your account or to provide you with information about other BlackRock products or services that may be of interest to you. In addition, BlackRock restricts access to non-public personal information about its Clients to those BlackRock employees with a legitimate business need for the information. BlackRock maintains physical, electronic and procedural safeguards that are designed to protect the non-public personal information of its Clients, including procedures relating to the proper storage and disposal of such information.
| | | | | | |
| | | SEMI-ANNUAL REPORT | | NOVEMBER 30, 2014 | | 55 |
| | |
This report is intended for existing shareholders. It is not authorized for use as an offer of sale or a solicitation of an offer to buy shares of the Funds unless preceded or accompanied by that Fund’s current prospectus. Past performance results shown in this report should not be considered a representation of future performance. Investment returns and principal value of shares will fluctuate so that shares, when redeemed, may be worth more or less than their original cost. Statements and other information herein are as dated and are subject to change. | |  |
| | |
SC2-11/14-SAR | |  |
| | |
| Item 2 – | | Code of Ethics – Not Applicable to this semi-annual report |
| |
| Item 3 – | | Audit Committee Financial Expert – Not Applicable to this semi-annual report |
| |
| Item 4 – | | Principal Accountant Fees and Services – Not Applicable to this semi-annual report |
| |
| Item 5 – | | Audit Committee of Listed Registrants – Not Applicable |
| |
| Item 6 – | | Investments |
| | (a) The registrant’s Schedule of Investments is included as part of the Report to Stockholders filed under Item 1 of this Form. |
| | (b) Not Applicable due to no such divestments during the semi-annual period covered since the previous Form N-CSR filing. |
| |
| Item 7 – | | Disclosure of Proxy Voting Policies and Procedures for Closed-End Management Investment Companies – Not Applicable |
| |
| Item 8 – | | Portfolio Managers of Closed-End Management Investment Companies – Not Applicable |
| |
| Item 9 – | | Purchases of Equity Securities by Closed-End Management Investment Company and Affiliated Purchasers – Not Applicable |
| |
| Item 10 – | | Submission of Matters to a Vote of Security Holders –There have been no material changes to these procedures. |
| |
| Item 11 – | | Controls and Procedures |
| |
| | (a) – The registrant’s principal executive and principal financial officers, or persons performing similar functions, have concluded that the registrant’s disclosure controls and procedures (as defined in Rule 30a-3(c) under the Investment Company Act of 1940, as amended (the “1940 Act”)) are effective as of a date within 90 days of the filing of this report based on the evaluation of these controls and procedures required by Rule 30a-3(b) under the 1940 Act and Rule 15d-15(b) under the Securities Exchange Act of 1934, as amended. |
| |
| | (b) – There were no changes in the registrant’s internal control over financial reporting (as defined in Rule 30a-3(d) under the 1940 Act) that occurred during the second fiscal quarter of the period covered by this report that have materially affected, or are reasonably likely to materially affect, the registrant’s internal control over financial reporting. |
| |
| Item 12 – | | Exhibits attached hereto |
| |
| | (a)(1) – Code of Ethics – Not Applicable to this semi-annual report |
| |
| | (a)(2) – Certifications – Attached hereto |
| |
| | (a)(3) – Not Applicable |
| |
| | (b) – Certifications – Attached hereto |
2
Pursuant to the requirements of the Securities Exchange Act of 1934 and the Investment Company Act of 1940, the registrant has duly caused this report to be signed on its behalf by the undersigned, thereunto duly authorized.
BlackRock Funds
| | |
| By: | | /s/ John M. Perlowski |
| | John M. Perlowski |
| | Chief Executive Officer (principal executive officer) of BlackRock Funds |
| |
| Date: | | February 2, 2015 |
Pursuant to the requirements of the Securities Exchange Act of 1934 and the Investment Company Act of 1940, this report has been signed below by the following persons on behalf of the registrant and in the capacities and on the dates indicated.
| | |
| By: | | /s/ John M. Perlowski |
| | John M. Perlowski |
| | Chief Executive Officer (principal executive officer) of BlackRock Funds |
| |
| Date: | | February 2, 2015 |
| |
| By: | | /s/ Neal J. Andrews |
| | Neal J. Andrews |
| | Chief Financial Officer (principal financial officer) of BlackRock Funds |
| |
| Date: | | February 2, 2015 |
3