UNITED STATES
SECURITIES AND EXCHANGE COMMISSION
Washington, D.C. 20549
FORM N-CSR
CERTIFIED SHAREHOLDER REPORT OF REGISTERED MANAGEMENT INVESTMENT COMPANIES
Investment Company Act file number: 811-05742
Name of Fund: BlackRock Funds
BlackRock Commodity Strategies Fund
BlackRock Global Long/Short Credit Fund
BlackRock Macro Themes Fund
BlackRock Multi-Asset Real Return Fund
BlackRock Short Obligations Fund
BlackRock Short-Term Treasury Fund
BlackRock Strategic Risk Allocation Fund
BlackRock Ultra-Short Obligations Fund
Fund Address: 100 Bellevue Parkway, Wilmington, DE 19809
Name and address of agent for service: John M. Perlowski, Chief Executive Officer, BlackRock Funds, 55 East 52nd Street, New York, NY 10055
Registrant’s telephone number, including area code: (800) 441-7762
Date of fiscal year end: 07/31/2015
Date of reporting period: 01/31/2015
Item 1 – Report to Stockholders
JANUARY 31, 2015
| | | | |
SEMI-ANNUAL REPORT (UNAUDITED) | | | | BLACKROCK® |
BlackRock FundsSM
„ BlackRock Commodity Strategies Fund
„ BlackRock Global Long/Short Credit Fund
„ BlackRock Macro Themes Fund
| | |
| Not FDIC Insured ¡ May Lose Value ¡ No Bank Guarantee | | |
| | |
| |

| | Shareholders can sign up for e-mail notifications of quarterly statements, annual and semi-annual shareholder reports and prospectuses by enrolling in the electronic delivery program. Electronic copies of shareholder reports and prospectuses are also available on BlackRock’s website. |
| | TO ENROLL IN ELECTRONIC DELIVERY: |
| | Shareholders Who Hold Accounts with Investment Advisors, Banks or Brokerages: Please contact your financial advisor. Please note that not all investment advisors, banks or brokerages may offer this service. |
| | Shareholders Who Hold Accounts Directly with BlackRock: 1. Access the BlackRock website at blackrock.com 2. Select “Access Your Account” 3. Next, select “eDelivery” in the “Related Resources” box and follow the sign-up instructions |
| | | | | | |
| 2 | | BLACKROCK FUNDS | | JANUARY 31, 2015 | | |
Dear Shareholder,
Market volatility, while remaining below the long-term average level, increased over the course of 2014 and into 2015, driven largely by higher valuations in risk assets (such as equities and high yield bonds), escalating geopolitical risks, uneven global economic growth and expectations around policy moves from the world’s largest central banks. Surprisingly, U.S. interest rates trended lower through the period even as the U.S. Federal Reserve (the “Fed”) gradually reduced its bond buying program, which ultimately ended in October.
The first half of 2014 was generally a strong period for most asset classes; however, volatility ticked up in the summer as geopolitical tensions intensified in Ukraine and the Middle East and investors feared that better U.S. economic indicators may compel the Fed to increase short-term interest rates sooner than previously anticipated. Global credit markets tightened as the U.S. dollar strengthened versus other currencies, ultimately putting a strain on investor flows, and financial markets broadly weakened in the third quarter.
Several themes dominated the markets in the fourth quarter that resulted in the strong performance of U.S. markets versus other areas of the world. Economic growth strengthened considerably in the United States while the broader global economy showed signs of slowing. The European Central Bank and the Bank of Japan took aggressive measures to stimulate growth while the Fed moved toward tighter policy, causing further strengthening in the U.S. dollar. Fixed income investors piled into U.S. Treasuries where yields, although persistently low, were comparatively higher than yields on international sovereign debt, while equity investors favored the relative stability of U.S.-based companies amid rising global risks.
Oil prices, which had been gradually declining since mid-summer, suddenly plummeted in the fourth quarter due to a global supply-and-demand imbalance. Energy stocks sold off sharply and oil-exporting economies struggled, mainly within emerging markets. Conversely, the consumer sectors benefited from lower oil prices as savings at the gas pumps freed up discretionary income for other goods and services.
These trends shifted at the beginning of 2015. U.S. equity markets starkly underperformed international markets due to stretched valuations and uncertainty around the Fed’s pending rate hike. In addition, the stronger U.S. dollar began to hurt earnings of large cap companies. The energy sector continued to struggle, although oil prices showed signs of stabilizing toward the end of January as suppliers became more disciplined in their exploration and production efforts.
At BlackRock, we believe investors need to think globally, extend their scope across a broad array of asset classes and be prepared to move freely as market conditions change over time. We encourage you to talk with your financial advisor and visit blackrock.com for further insight about investing in today’s markets.
Sincerely,

Rob Kapito
President, BlackRock Advisors, LLC

Rob Kapito
President, BlackRock Advisors, LLC
| | | | | | | | |
| Total Returns as of January 31, 2015 | |
| | | 6-month | | | 12-month | |
U.S large cap equities
(S&P 500® Index) | | | 4.37 | % | | | 14.22 | % |
U.S. small cap equities
(Russell 2000® Index) | | | 4.72 | | | | 4.41 | |
International equities
(MSCI Europe, Australasia, Far East Index) | | | (6.97 | ) | | | (0.43 | ) |
Emerging market equities
(MSCI Emerging Markets Index) | | | (9.05 | ) | | | 5.23 | |
3-month Treasury bill
(BofA Merrill Lynch
3-Month U.S. Treasury
Bill Index) | | | 0.01 | | | | 0.03 | |
U.S. Treasury securities
(BofA Merrill Lynch
10- Year U.S. Treasury
Index) | | | 9.29 | | | | 12.25 | |
U.S. investment grade
bonds (Barclays U.S.
Aggregate Bond Index) | | | 4.36 | | | | 6.61 | |
Tax-exempt municipal
bonds (S&P Municipal Bond Index) | | | 4.51 | | | | 8.81 | |
U.S. high yield bonds
(Barclays U.S. Corporate
High Yield 2% Issuer
Capped Index) | | | (0.89 | ) | | | 2.41 | |
|
| Past performance is no guarantee of future results. Index performance is shown for illustrative purposes only. You cannot invest directly in an index. | |
| | | | | | |
| | | THIS PAGE NOT PART OF YOUR FUND REPORT | | | | 3 |
| | | | |
| Fund Summary as of January 31, 2015 | | | BlackRock Commodity Strategies Fund | |
BlackRock Commodity Strategies Fund’s (the “Fund”) investment objective is to seek total return.
|
| Portfolio Management Commentary |
How did the Fund perform?
| Ÿ | | For the six-month period ended January 31, 2015, the Fund outperformed its benchmark, the Bloomberg Commodity Index Total ReturnSM. |
What factors influenced performance?
| Ÿ | | Commodities and natural resources equities came under pressure during the period. The combination of slower-than-expected global economic growth and ample commodity supply set the stage for a steep decline in commodity prices during the second half of 2014. While the plunge in crude oil dominated headlines, the price weakness was widespread across the commodity complex. Industrial metals were particularly weak during the period. |
| Ÿ | | In the stock market, the metals & mining industry was the hardest hit of the natural resources sectors. Exposure to this market segment was the largest drag on relative performance, with a number of copper producers among the Fund’s most significant laggards. |
| Ÿ | | The Fund’s position in energy stocks also detracted from returns given the sector’s weak performance during the six-month period. |
| Ÿ | | Agriculture-related equities outperformed in an otherwise difficult period for commodities and natural resources equities. Agricultural equities as a whole were flat, but a number of the Fund’s holdings generated strong absolute returns. Notable outperformers included grain handlers and transporters that benefited from bumper harvests, as well as some lumber companies that were well positioned to benefit from a pick-up in North American construction activity. |
| Ÿ | | The Fund’s position in gold-related equities contributed positively due to the strong rally in gold shares in January. Gold benefited from rising |
| | | demand for “safe haven” assets, and gold stocks showed heightened sensitivity to the metal’s rise. |
| Ÿ | | The Fund’s commodity futures linked strategy generated outperformance, with positioning in crude oil, natural gas and coffee contributing strongly at various points during the period. |
Describe recent portfolio activity.
| Ÿ | | During the six-month period, the Fund sought to maintain generally equal weightings between the equity and derivatives strategies, as well as balanced and broad equity exposure across commodity sectors. The Fund rebalanced its strategy allocations in January 2015. This resulted in a reduction in the Fund’s position in mining stocks and an increase in its allocation to agriculture stocks. |
| Ÿ | | The Fund maintained a position in cash and cash equivalents, predominantly comprised of U.S. Treasury bills, as collateral against the Fund’s exposure to commodity-linked notes. The Fund’s cash balance did not have a material impact on performance. |
Describe portfolio positioning at period end.
| Ÿ | | The Fund ended the period with approximately 50% of net assets allocated to the commodity-related equity strategy and 50% allocated to the commodity-linked derivatives strategy (including collateral held against the commodity-linked note exposure). Aggregating both strategies, the Fund was overweight relative to the benchmark index in energy and underweight in agriculture and precious metals. |
The views expressed reflect the opinions of BlackRock as of the date of this report and are subject to change based on changes in market, economic or other conditions. These views are not intended to be a forecast of future events and are no guarantee of future results.
| | |
| Ten Largest Holdings | | Percent of
Long-Term Investments |
| | | | |
Exxon Mobil Corp. | | | 4 | % |
Royal Dutch Shell PLC, B Shares | | | 4 | |
Chevron Corp. | | | 4 | |
Citigroup, Inc. 1-month LIBOR, 3/02/16* | | | 4 | |
Bank of America Corp. 3-month LIBOR, 1/25/16* | | | 3 | |
PowerShares DB Commodity Index Tracking Fund | | | 3 | |
ConocoPhillips | | | 2 | |
Anadarko Petroleum Corp. | | | 2 | |
Total SA | | | 2 | |
Monsanto Co. | | | 2 | |
| | * | | Represents a commodity-linked note. |
| | |
| Portfolio Composition | | Percent of
Long-Term Investments |
| | | | |
Common Stocks | | | 75 | % |
Commodity-Linked Notes | | | 20 | |
Investment Companies | | | 5 | |
| | | | | | |
| 4 | | BLACKROCK FUNDS | | JANUARY 31, 2015 | | |
| | | | |
| | | | BlackRock Commodity Strategies Fund | |
|
| Total Return Based on a $10,000 Investment |
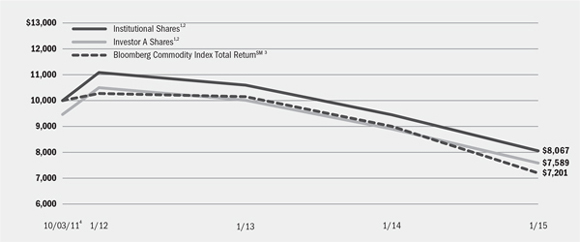
| | 1 | Assuming maximum sales charges, if any, transaction costs and other operating expenses, including investment advisory fees and administration fees, if any. Institutional Shares do not have a sales charge. |
| | 2 | The Fund utilizes two strategies and under normal circumstances expects to invest approximately 50% of its total assets in each strategy; provided, however, that from time to time, Fund management may alter the weightings if it deems it prudent to do so based on market conditions, trends or movements or other similar factors. |
| | 3 | An unmanaged commodity index currently composed of futures contracts on 20 physical commodities, and assumes that the futures positions are fully collateralized. Prior to July 1, 2014, the Bloomberg Commodity Index Total ReturnSM was known as the Dow Jones-UBS Commodity Index Total ReturnSM. |
| | 4 | Commencement of operations. |
| | | | | | | | | | | | | | | | | | | | |
| Performance Summary for the Period Ended January 31, 2015 | |
| | | | | | Average Annual Total Returns5 | |
| | | | | | 1 Year | | | Since Inception6 | |
| | | 6-Month
Total Returns | | | w/o sales
charge | | | w/ sales
charge | | | w/o sales
charge | | | w/ sales
charge | |
Institutional | | | (20.61 | )% | | | (14.65 | )% | | | N/A | | | | (6.25 | )% | | | N/A | |
Investor A | | | (20.81 | ) | | | (14.85 | ) | | | (19.32 | )% | | | (6.45 | ) | | | (7.95 | )% |
Investor C | | | (21.06 | ) | | | (15.45 | ) | | | (16.29 | ) | | | (7.16 | ) | | | (7.16 | ) |
Bloomberg Commodity Index Total ReturnSM | | | (21.16 | ) | | | (20.02 | ) | | | N/A | | | | (9.40 | ) | | | N/A | |
| | 5 | | Assuming maximum sales charges, if any. Average annual total returns with and without sales charges reflect reductions for distribution and service fees. See “About Fund Performance” on page 9 for a detailed description of share classes, including any related sales charges and fees. |
| | 6 | | The Fund commenced operations on October 3, 2011. |
| | | | N/A—Not applicable as share class and index do not have a sales charge. |
| | | | Past performance is not indicative of future results. |
| | | | | | | | | | | | | | |
| Expense Example |
| | | Actual | | Hypothetical8 | | Annualized Expense Ratio |
| | Beginning Account Value
August 1, 2014 | | Ending Account Value
January 31, 2015 | | Expenses Paid
During the Period7 | | Beginning Account Value
August 1, 2014 | | Ending Account Value
January 31, 2015 | | Expenses Paid
During the Period7 | |
Institutional | | $1,000.00 | | $793.90 | | $5.79 | | $1,000.00 | | $1,018.75 | | $6.51 | | 1.28% |
Investor A | | $1,000.00 | | $791.90 | | $6.77 | | $1,000.00 | | $1,017.64 | | $7.63 | | 1.50% |
Investor C | | $1,000.00 | | $789.40 | | $10.15 | | $1,000.00 | | $1,013.86 | | $11.42 | | 2.25% |
| | 7 | | For each class of the Fund, expenses are equal to the annualized expense ratio for the class, multiplied by the average account value over the period, multiplied by 184/365 (to reflect the one-half year period shown). The fees and expenses of the underlying funds in which the Fund invests are not included in the Fund’s annualized expense ratio. |
| | 8 | | Hypothetical 5% annual return before expenses is calculated by prorating the number of days in the most recent fiscal half year divided by 365. |
| | | | See “Disclosure of Expenses” on page 9 for further information on how expenses were calculated. |
| | | | | | |
| | | BLACKROCK FUNDS | | JANUARY 31, 2015 | | 5 |
| | | | |
| Fund Summary as of January 31, 2015 | | | BlackRock Global Long/Short Credit Fund | |
BlackRock Global Long/Short Credit Fund’s (the “Fund”) investment objective is to seek absolute total returns over a complete market cycle.
|
| Portfolio Management Commentary |
How did the Fund perform?
| Ÿ | | For the six-month period ended January 31, 2015, the Fund underperformed its benchmark, the BofA Merrill Lynch 3-Month U.S. Treasury Bill Index. |
What factors influenced performance?
| Ÿ | | Long positions in European high yield bonds detracted from returns as the sector experienced substantial volatility during the period. Additionally, short positions in indices providing exposure to credit default swaps on European crossover (issues straddling the line between investment grade and speculative quality) and senior financial issues detracted from performance, as the credit default swaps indices outperformed cash bonds. Within U.S. investment grade credit, long positions in financials and industrials detracted as these markets experienced technical pressure. A small tactical allocation to energy bonds and loans detracted given the severe downward move in oil prices. Likewise, a trade designed to benefit from what the investment advisor viewed as the mispricing of a Brazilian quasi-sovereign issue detracted, as the name is highly correlated to oil. Finally, broad market hedges expressed through U.S. equity put options detracted given the outperformance of equities during the period. |
| Ÿ | | The largest positive contributor to returns was positioning throughout the capital structure in European bank debt, which involved taking profits on senior positions and re-deploying assets to subordinated bonds, which outperformed. Absolute return strategies within U.S. industrial sectors were also a notable contributor to performance. These strategies included tactical positioning within technology issuers in the telecommunication services and semiconductor sectors, a short position in a U.S. capital goods issuer, and an event-related long position in a specialty pharmaceutical company. Positions in U.S. and European bank loans and collateralized loan obligations (CLOs) provided income and in some cases modest price appreciation, as did exposure to enhanced equipment trust certificates which have benefited recently from strong airline earnings releases. Despite a difficult environment for high yield, security selection within the sector proved beneficial as the Fund held higher quality issues which outperformed. In Europe, the Fund benefited from positions in investment grade credit which rallied substantially as low interest rates generated demand for incremental income from higher quality issues. Finally, European hedges were additive, most notably the use of equity put options to minimize the impact of market volatility during the fourth quarter. |
| Ÿ | | As part of its investment strategy, the Fund uses derivatives to manage duration (sensitivity to interest rate movements) and currency risk. The Fund may also employ credit derivatives in order to express a positive or negative view on a particular issuer or sector, or to manage overall credit risk. During the period, the Fund’s derivative holdings had a net positive impact on performance, attributable to currency-related positions. |
Describe recent portfolio activity.
| Ÿ | | Over the course of the period, the regional allocation was shifted to favor European credit. Within Europe, the Fund initially made tactical changes with capital preservation as a primary consideration. This included using equity put options and subsequently moving back to credit index short positions based on our assessment of relative value. In addition, the Fund exited a number of investment grade bond positions including Spanish covered bonds in financials. This capital was redeployed into more attractively valued subordinated debt of European banks and high yield cash bonds. The Fund transitioned from a net short position in sovereign debt to a long position via purchases of Spanish and Italian government bonds, based on the view that the European Central Bank (“ECB”) would announce further bond purchases directly impacting sovereign credit. |
| Ÿ | | In the United States, the Fund initially added to high yield and investment grade bonds on market weakness; however, these positions were trimmed in order to reduce credit exposure. Eventually, the Fund moved to a net short position in investment grade credit and added broad credit hedges. Late in the period, the Fund reduced exposure to U.S. bank loans and CLOs on concerns over liquidity, technical pressures and changing regulations. The Fund implemented a number of event-related trades in U.S. and European issuers, and tactically traded opportunities in the U.S. technology and healthcare sectors. Finally, the Fund employed several long, short and paired trades in the energy sector with an eye toward the relative balance sheet strength and asset quality of companies in the oil & gas exploration & production sector. |
| Ÿ | | The Fund’s cash exposure had no material impact on performance as the Fund may express long and short positions via the credit default swap market, which does not require a cash outlay like that of traditional cash bonds. |
Describe portfolio positioning at period end.
| Ÿ | | As of period end, the investment advisor continues to monitor the divergence in the ECB’s monetary policy versus that of the U.S. Federal Reserve and other central banks. The Fund’s positioning at period end reflected a preference for European versus the U.S. credit markets. In Europe we continue to see value in subordinated bank debt and high yield cash bonds while tactically managing exposure to sovereigns. In the United States, the Fund is tilted toward high yield versus investment grade credit and is actively seeking absolute return opportunities (long, short and paired trades) within industrial sectors. |
| Ÿ | | The Fund ended the period with a net long credit position in Europe at 30% of net assets, 14% in the U.S., 2% in Asia, and 46% overall given continued strong credit fundamentals and recent spread widening. |
The views expressed reflect the opinions of BlackRock as of the date of this report and are subject to change based on changes in market, economic or other conditions. These views are not intended to be a forecast of future events and are no guarantee of future results.
| | | | | | |
| 6 | | BLACKROCK FUNDS | | JANUARY 31, 2015 | | |
| | | | |
| | | | BlackRock Global Long/Short Credit Fund | |
|
| Total Return Based on a $10,000 Investment |
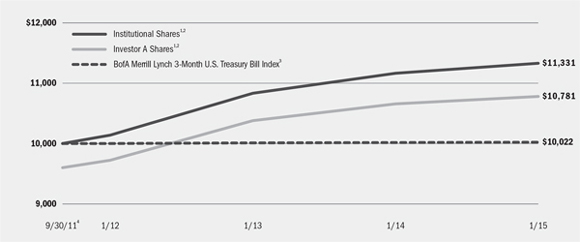
| | 1 | Assuming maximum sales charges, if any, transaction costs and other operating expenses, including investment advisory fees and administration fees, if any. Institutional Shares do not have a sales charge. |
| | 2 | The Fund seeks to provide absolute total returns over a complete market cycle through diversified long and short exposure to the global fixed income markets. Under normal circumstances the Fund invests at least 80% of its total assets in credit-related instruments. |
| | 3 | An unmanaged index that tracks 3-month U.S. Treasury securities. |
| | 4 | Commencement of operations. |
| | | | | | | | | | | | | | | | | | | | | | | | | | | | |
| Performance Summary for the Period Ended January 31, 2015 | | | | | | | | | |
| | | | | | | | | | | | Average Annual Total Returns5 | |
| | | | | | | | | | | | 1 Year | | | Since Inception6 | |
| | | Standardized
30-Day Yield | | | Unsubsidized
30-Day Yield | | | 6-Month
Total Returns | | | w/o sales
charge | | | w/ sales
charge | | | w/o sales
charge | | | w/ sales
charge | |
Institutional | | | 3.64 | % | | | 3.63 | % | | | (0.57 | )% | | | 1.47 | % | | | N/A | | | | 3.81 | % | | | N/A | |
Investor A | | | 3.19 | | | | 3.19 | | | | (0.77 | ) | | | 1.14 | | | | (2.90 | )% | | | 3.54 | | | | 2.28 | % |
Investor C | | | 2.64 | | | | 2.63 | | | | (1.10 | ) | | | 0.42 | | | | (0.55 | ) | | | 2.79 | | | | 2.79 | |
BofA Merrill Lynch 3-Month U.S. Treasury Bill Index | | | — | | | | — | | | | 0.01 | | | | 0.03 | | | | N/A | | | | 0.07 | | | | N/A | |
| | 5 | | Assuming maximum sales charges, if any. Average annual total returns with and without sales charges reflect reductions for distribution and service fees. See “About Fund Performance” on page 9 for a detailed description of share classes, including any related sales charges and fees. |
| | 6 | | The Fund commenced operations on September 30, 2011. |
| | | | N/A—Not applicable as share class and index do not have a sales charge. |
| | | | Past performance is not indicative of future results. |
| | | | | | | | | | | | | | | | | | |
| Expense Example | | | | |
| | | Actual | | Hypothetical9 |
| | | | | | | Including
Interest Expense | | Excluding
Interest Expense | | | | Including Interest Expense | | Excluding Interest Expense |
| | | Beginning
Account Value
August 1, 2014 | | Ending Account Value
January 31, 2015 | | Expenses Paid
During the Period7 | | Expenses Paid
During the Period8 | | Beginning
Account Value
August 1, 2014 | | Ending Account Value
January 31, 2015 | | Expenses Paid
During the Period7 | | Ending Account Value
January 31, 2015 | | Expenses Paid
During the Period8 |
Institutional | | $1,000.00 | | $994.30 | | $7.79 | | 5.13 | | $1,000.00 | | $1,017.39 | | $7.88 | | $1,020.06 | | $5.19 |
Investor A | | $1,000.00 | | $992.30 | | $9.39 | | 6.78 | | $1,000.00 | | $1,015.78 | | $9.50 | | $1,018.40 | | $6.87 |
Investor C | | $1,000.00 | | $989.00 | | $12.88 | | 10.28 | | $1,000.00 | | $1,012.25 | | $13.03 | | $1,014.87 | | $10.41 |
| | 7 | | For each class of the Fund, expenses are equal to the annualized expense ratio for the class (1.55% for Institutional, 1.87% for Investor A and 2.57% for Investor C), multiplied by the average account value over the period, multiplied by 184/365 (to reflect the one-half year period shown). The fees and expenses of the underlying funds in which the Fund invests are not included in the Fund’s annualized expense ratio. |
| | 8 | | For each class of the Fund, expenses are equal to the annualized expense ratio for the class (1.02% for Institutional, 1.35% for Investor A and 2.05% for Investor C), multiplied by the average account value over the period, multiplied by 184/365 (to reflect the one-half year period shown). The fees and expenses of the underlying funds in which the Fund invests are not included in the Fund’s annualized expense ratio. |
| | 9 | | Hypothetical 5% annual return before expenses is calculated by prorating the number of days in the most recent fiscal half year divided by 365. |
| | | | See “Disclosure of Expenses” on page 9 for further information on how expenses were calculated. |
| | | | | | |
| | | BLACKROCK FUNDS | | JANUARY 31, 2015 | | 7 |
| | | | |
| Fund Summary as of January 31, 2015 | | | BlackRock Macro Themes Fund | |
BlackRock Macro Themes Fund’s (the “Fund”) investment objective is to seek total return.
| | |
| Ten Largest Holdings | | Percent of
Long-Term Investments |
| | | | |
U.S. Treasury Bonds | | | 8 | % |
Portugal Obrigacoes do Tesouro OT | | | 5 | |
Health Care Select Sector SPDR Fund | | | 5 | |
Italy Buoni Poliennali Del Tesoro | | | 4 | |
ETFS Physical PM Basket | | | 4 | |
Republic of Colombia | | | 4 | |
Brazil Notas do Tesouro Nacional, Series B | | | 3 | |
Financial Select Sector SPDR Fund | | | 3 | |
Hellenic Republic | | | 3 | |
Republic of Indonesia | | | 3 | |
| | |
| Portfolio Composition | | Percent of
Long-Term Investments |
| | | | |
Corporate Bonds | | | 47 | % |
Foreign Government Obligations | | | 28 | |
Investment Companies | | | 15 | |
U.S. Treasury Obligations | | | 8 | |
Foreign Agency Obligations | | | 2 | |
| | | | | | | | | | | | | | |
| Expense Example |
| | | Actual | | Hypothetical2 | | |
| | | Beginning Account Value
December 4, 2014 | | Ending Account Value
January 31, 2015 | | Expenses Paid
During the Period1 | | Beginning Account Value
December 4, 2014 | | Ending Account Value
January 31, 2015 | | Expenses Paid
During the Period1 | | Annualized Expense Ratio |
Institutional | | $1,000.00 | | $997.30 | | $1.90 | | $1,000.00 | | $1,006.04 | | $1.91 | | 1.20% |
Investor A | | $1,000.00 | | $997.00 | | $2.30 | | $1,000.00 | | $1,005.64 | | $2.31 | | 1.45% |
Investor C | | $1,000.00 | | $996.10 | | $3.49 | | $1,000.00 | | $1,004.45 | | $3.50 | | 2.20% |
| | 1 | | For each class of the Fund, expenses are equal to the annualized expense ratio for the class, multiplied by the average account value over the period, multiplied by 58/365 (to reflect the period from December 4, 2014, the commencement of operations, to January 31, 2015). The fees and expenses of the underlying funds in which the Fund invests are not included in the Fund’s annualized expense ratio. |
| | 2 | | Hypothetical 5% annual return before expenses is calculated by prorating the number of days in the most recent fiscal period divided by 365. |
| | | | See “Disclosure of Expenses” on page 9 for further information on how expenses were calculated. |
| | | | | | |
| 8 | | BLACKROCK FUNDS | | JANUARY 31, 2015 | | |
| | |
The Benefits and Risks of Leveraging | | |
BlackRock Global Long/Short Credit Fund may utilize leverage to seek to enhance yield and net asset value (“NAV”). However, these objectives cannot be achieved in all interest rate environments.
BlackRock Global Long/Short Credit Fund may utilize leverage by entering into reverse repurchase agreements. In general, the concept of leveraging is based on the premise that the financing cost of leverage, which is based on short-term interest rates, is normally lower than the income earned on its longer-term portfolio investments purchased with the proceeds from leverage. To the extent that the total assets of BlackRock Global Long/Short Credit Fund (including the assets obtained from leverage) are invested in higher-yielding portfolio investments, BlackRock Global Long/Short Credit Fund’s shareholders benefit from the incremental net income.
The interest earned on securities purchased with the proceeds from leverage is distributed to BlackRock Global Long/Short Credit Fund shareholders, and the value of these portfolio holdings is reflected in BlackRock Global Long/Short Credit Fund’s per share NAV. However, in order to benefit shareholders, the return on assets purchased with leverage proceeds must exceed the ongoing costs associated with the leverage. If interest and other ongoing costs of leverage exceed BlackRock Global Long/Short Credit Fund’s return on assets purchased with leverage proceeds, income to shareholders is lower than if BlackRock Global Long/Short Credit Fund had not used leverage.
Furthermore, the value of BlackRock Global Long/Short Credit Fund’s portfolio investments generally varies inversely with the direction of long-term interest rates, although other factors can also influence the value of portfolio investments. As a result, changes in interest rates can influence BlackRock Global Long/Short Credit Fund’s NAV positively or negatively in addition to the impact on BlackRock Global Long/Short Credit Fund performance from leverage. Changes in the direction of interest rates are difficult to predict accurately, and there is no assurance that a Fund’s leveraging strategy will be successful.
The use of leverage also generally causes greater changes in BlackRock Global Long/Short Credit Fund’s NAV and distribution rates than a comparable fund that does not use leverage. In a declining market, leverage is likely to cause a greater decline in the NAV of BlackRock Global Long/Short Credit Fund’s shares than if BlackRock Global Long/Short Credit Fund were not leveraged. In addition, BlackRock Global Long/Short Credit Fund may be required to sell portfolio securities at inopportune times or at distressed values in order to comply with regulatory requirements applicable to the use of leverage or as required by the terms of leverage instruments, which may cause BlackRock Global Long/Short Credit Fund to incur losses. The use of leverage may limit BlackRock Global Long/Short Credit Fund’s ability to invest in certain types of securities or use certain types of hedging strategies. BlackRock Global Long/Short Credit Fund incurs expenses in connection with the use of leverage, all of which are borne by BlackRock Global Long/Short Credit Fund shareholders and may reduce income.
| Ÿ | | Institutional Shares are not subject to any sales charge. These shares bear no ongoing distribution or service fees and are available only to certain eligible investors. |
| Ÿ | | Investor A Shares are subject to a maximum initial sales charge (front-end load) of 5.25% for BlackRock Commodity Strategies Fund and BlackRock Macro Themes Fund and 4.00% for BlackRock Global Long/Short Credit Fund. These shares are subject to a service fee of 0.25% per year (but no distribution fee). Certain redemptions of these shares may be subject to a contingent deferred sales charge (“CDSC”) where no initial sales charge was paid at the time of purchase. These shares are generally available through financial intermediaries. |
| Ÿ | | Investor C Shares are subject to a 1.00% CDSC if redeemed within one year of purchase. In addition, these shares are subject to a distribution fee of 0.75% per year and a service fee of 0.25% per year. These shares are generally available through financial intermediaries. |
Performance information reflects past performance and does not guarantee future results. Current performance may be lower or higher than the performance data quoted. Refer to www.blackrock.com/funds to obtain performance data current to the most recent month end. Performance results do not reflect the deduction of taxes that a shareholder
would pay on fund distributions or the redemption of fund shares. Figures shown in the performance tables on the previous pages assume reinvestment of all distributions, if any, at net asset value (“NAV”) on the ex-dividend/payable dates. Investment return and principal value of shares will fluctuate so that shares, when redeemed, may be worth more or less than their original cost. Distributions paid to each class of shares will vary because of the different levels of service, distribution and transfer agency fees applicable to each class, which are deducted from the income available to be paid to shareholders.
BlackRock Advisors, LLC (the “Manager”), the Funds’ investment advisor, has contractually agreed to waive and/or reimburse a portion of each Fund’s expenses. Without such waiver and/or reimbursement, each Fund’s performance would have been lower. The Manager is under no obligation to continue waiving and/or reimbursing its fees after the applicable termination date of such agreement. See Note 5 of the Notes to Financial Statements for additional information on waivers and/or reimbursements. The standardized 30-day yield includes the effects of any waivers and/or reimbursements. The unsubsidized 30-day yield excludes the effects of any waiver and/or reimbursements.
| | | | | | |
| | | BLACKROCK FUNDS | | JANUARY 31, 2015 | | 9 |
Shareholders of the Funds may incur the following charges: (a) transactional expenses, such as sales charges; and (b) operating expenses, including investment advisory fees, administration fees, service and distribution fees, including 12b-1 fees, acquired fund fees and expenses and other Fund expenses. The expense examples on the previous pages (which are based on a hypothetical investment of $1,000 invested on August 1, 2014 or commencement of operations and held through January 31, 2015) are intended to assist shareholders both in calculating expenses based on an investment in each Fund and in comparing these expenses with similar costs of investing in other mutual funds.
The expense examples provide information about actual account values and actual expenses. In order to estimate the expenses a shareholder paid during the period covered by this report, shareholders can divide their account value by $1,000 and then multiply the result by the number corresponding to their Fund and share class under the headings entitled “Expenses Paid During the Period.”
The expense examples also provide information about hypothetical account values and hypothetical expenses based on a Fund’s actual expense ratio and an assumed rate of return of 5% per year before expenses. In order to assist shareholders in comparing the ongoing expenses of investing in these Funds and other funds, compare the 5% hypothetical examples with the 5% hypothetical examples that appear in shareholder reports of other funds.
The expenses shown in the expense examples are intended to highlight shareholders’ ongoing costs only and do not reflect any transactional expenses, such as sales charges, if any. Therefore, the hypothetical examples are useful in comparing ongoing expenses only, and will not help shareholders determine the relative total expenses of owning different funds. If these transactional expenses were included, shareholder expenses would have been higher.
| | |
| Derivative Financial Instruments | | |
The Funds may invest in various derivative financial instruments. Derivative financial instruments are used to obtain exposure to a security, index and/or market without owning or taking physical custody of securities or to manage market, equity, credit, interest rate, foreign currency exchange rate, commodity and/or other risks. Derivative financial instruments may give rise to a form of economic leverage. Derivative financial instruments also involve risks, including the imperfect correlation between the value of a derivative financial instrument and the underlying asset, possible default of the counterparty to the transaction or illiquidity of the derivative
financial instrument. The Funds’ ability to use a derivative financial instrument successfully depends on the investment advisor’s ability to predict pertinent market movements accurately, which cannot be assured. The use of derivative financial instruments may result in losses greater than if they had not been used, may limit the amount of appreciation a Fund can realize on an investment and/or may result in lower distributions paid to shareholders. The Funds’ investments in these instruments are discussed in detail in the Notes to Financial Statements.
| | | | | | |
| 10 | | BLACKROCK FUNDS | | JANUARY 31, 2015 | | |
|
| BlackRock Global Long/Short Credit Fund’s Portfolio Information |
| | | | | | | | | | | | |
| | | Percent of Total Investments1 | |
| Geographic Allocation | | Long | | | Short | | | Total | |
United States | | | 38 | % | | | 16 | % | | | 54 | % |
Italy | | | 8 | | | | — | | | | 8 | |
Spain | | | 7 | | | | — | | | | 7 | |
United Kingdom | | | 5 | | | | — | | | | 5 | |
Ireland | | | 4 | | | | — | | | | 4 | |
France | | | 4 | | | | — | | | | 4 | |
Netherlands | | | 3 | | | | — | | | | 3 | |
Denmark | | | 3 | | | | — | | | | 3 | |
Cayman Islands | | | 3 | | | | — | | | | 3 | |
Germany | | | 2 | | | | — | | | | 2 | |
Portugal | | | 2 | | | | — | | | | 2 | |
Other2 | | | 4 | | | | 1 | | | | 5 | |
Total | | | 83 | % | | | 17 | % | | | 100 | % |
| | 1 | | Total investments include the gross market values of long and short positions and exclude short-term securities. |
| | 2 | | Includes holdings within countries that are 1% or less of long-term investments. Please refer to the Schedule of Investments for such countries. |
| | |
| Credit Quality Allocation3 | | Percent of Long-Term Investments |
| | | | |
AAA/Aaa4 | | | 16 | |
AA/Aa | | | 1 | |
A | | | 11 | |
BBB/Baa | | | 25 | |
BB/Ba | | | 29 | |
B | | | 17 | |
CCC/Caa | | | 1 | |
| | 3 | | For financial reporting purposes, credit quality ratings shown above reflect the highest rating assigned by either Standard & Poor’s (“S&P”) or Moody’s Investors Service if ratings differ. These rating agencies are independent, nationally recognized statistical rating organizations and are widely used. Investment grade ratings are credit ratings of BBB/Baa or higher. Below investment grade ratings are credit ratings of BB/Ba or lower. Investments designated N/R are not rated by either rating agency. Unrated investments do not necessarily indicate low credit quality. Credit quality ratings are subject to change. |
| | 4 | | The investment advisor evaluates the credit quality of not-rated investments based upon certain factors including, but not limited to, credit ratings for similar investments and financial analysis of sectors, individual investments and/or issuers. Using this approach, the investment advisor has deemed not-rated U.S. Government Sponsored Agency Securities and U.S. Treasury Obligations as AAA/Aaa. |
| | | | | | |
| | | BLACKROCK FUNDS | | JANUARY 31, 2015 | | 11 |
| | | | |
| Consolidated Schedule of Investments January 31, 2015 (Unaudited) | | | BlackRock Commodity Strategies Fund | |
| | | (Percentages shown are based on Net Assets) | |
| | | | | | | | | | | | |
| Commodity-Linked Notes | | | | | Par (000) | | | Value | |
Bank of America Corp. 3-month LIBOR (Indexed to the Bloomberg Commodity Index Total ReturnSM, multiplied by 3), 1/25/16 | | | USD | | | | 10,000 | | | $ | 8,111,679 | |
Citigroup, Inc. 1-month LIBOR (Indexed to the Dow Jones-UBS Commodity Index Curve CompositeSM, multiplied by 3), 1/08/16 | | | | | | | 5,000 | | | | 3,863,060 | |
Citigroup, Inc. 1-month LIBOR (Indexed to the Dow Jones-UBS Commodity Index Curve CompositeSM, multiplied by 3), 3/02/16 | | | | | | | 14,000 | | | | 8,912,848 | |
JPMorgan Chase Bank, N.A. 3-month LIBOR (Indexed to the Dow Jones-JM Enhanced Beta Select Alternative Benchmark Total ReturnSM, multiplied by 3), 1/04/16 | | | | | | | 5,000 | | | | 3,297,020 | |
JPMorgan Chase Bank, N.A. 3-month LIBOR (Indexed to the Dow Jones-JM Enhanced Beta Select Alternative Benchmark Total ReturnSM, multiplied by 3), 1/11/16 | | | | | | | 5,000 | | | | 3,577,701 | |
JPMorgan Chase Bank, N.A. 3-month LIBOR (Indexed to the Dow Jones-JM Enhanced Beta Select Alternative Benchmark Total ReturnSM, multiplied by 3), 1/15/16 | | | | | | | 5,000 | | | | 3,996,745 | |
JPMorgan Chase Bank, N.A. 3-month LIBOR (Indexed to the Dow Jones-JM Enhanced Beta Select Alternative Benchmark Total ReturnSM, multiplied by 3), 12/04/15 | | | | | | | 5,000 | | | | 3,108,185 | |
UBS AG 3-month LIBOR (Indexed to the Bloomberg Commodity Index Total ReturnSM, multiplied by 3), 1/04/16 | | | | | | | 5,000 | | | | 3,503,650 | |
UBS AG 3-month LIBOR (Indexed to the Bloomberg Commodity Index Total ReturnSM, multiplied by 3), 1/19/16 | | | | | | | 5,000 | | | | 4,214,218 | |
UBS AG 3-month LIBOR (Indexed to the Bloomberg Commodity Index Total ReturnSM, multiplied by 3), 12/24/15 | | | | | | | 6,000 | | | | 3,807,188 | |
UBS AG 3-month LIBOR (Indexed to the Bloomberg Commodity Index Total ReturnSM, multiplied by 3), 2/29/16 | | | | | | | 4,000 | | | | 4,000,000 | |
Total Commodity-Linked Notes — 12.5% | | | | | | | | | | | 50,392,294 | |
| | | | | | | | | | | | |
| Common Stocks | | | | | Shares | | | | |
Biotechnology — 0.1% | | | | | | | | | | | | |
Genus PLC | | | | | | | 29,802 | | | | 549,428 | |
Chemicals — 4.5% | | | | | | | | | | | | |
Agrinos AS (a) | | | | | | | 66,903 | | | | 12,989 | |
Agrium, Inc. | | | | | | | 12,482 | | | | 1,331,205 | |
Auriga Industries A/S, Class B | | | | | | | 5,507 | | | | 260,591 | |
CF Industries Holdings, Inc. | | | | | | | 7,698 | | | | 2,350,815 | |
Israel Chemicals Ltd. | | | | | | | 72,816 | | | | 523,245 | |
Johnson Matthey PLC | | | | | | | 7,890 | | | | 385,986 | |
Monsanto Co. | | | | | | | 36,408 | | | | 4,295,416 | |
The Mosaic Co. | | | | | | | 36,928 | | | | 1,798,024 | |
| | | | | | | | |
| Common Stocks | | Shares | | | Value | |
Chemicals (concluded) | | | | | | | | |
Potash Corp. of Saskatchewan, Inc. | | | 75,969 | | | $ | 2,773,729 | |
Syngenta AG, Registered Shares | | | 6,242 | | | | 2,033,231 | |
Umicore SA | | | 23,364 | | | | 978,504 | |
Uralkali OJSC — GDR, Registered Shares | | | 34,328 | | | | 426,385 | |
Yara International ASA | | | 16,644 | | | | 866,526 | |
| | | | | | | | |
| | | | | | | | 18,036,646 | |
Energy Equipment & Services — 0.9% | | | | | | | | |
Halliburton Co. | | | 21,100 | | | | 843,789 | |
Schlumberger Ltd. | | | 32,408 | | | | 2,670,095 | |
| | | | | | | | |
| | | | | | | | 3,513,884 | |
Food & Staples Retailing — 0.3% | | | | | | | | |
The Andersons, Inc. | | | 11,442 | | | | 514,661 | |
Fyffes PLC | | | 280,872 | | | | 356,422 | |
Total Produce PLC | | | 436,914 | | | | 508,522 | |
| | | | | | | | |
| | | | | | | | 1,379,605 | |
Food Products — 5.1% | | | | | | | | |
Adecoagro SA (a) | | | 70,736 | | | | 548,911 | |
Archer-Daniels-Midland Co. | | | 74,898 | | | | 3,492,494 | |
Astra Agro Lestari Tbk PT | | | 208,000 | | | | 380,176 | |
BRF SA — ADR | | | 96,742 | | | | 2,294,720 | |
Bunge Ltd. | | | 29,126 | | | | 2,607,651 | |
Darling Ingredients, Inc. (a) | | | 20,804 | | | | 353,252 | |
First Resources Ltd. | | | 624,000 | | | | 857,082 | |
Glanbia PLC | | | 52,011 | | | | 837,376 | |
GrainCorp Ltd., Class A | | | 37,202 | | | | 256,790 | |
Hormel Foods Corp. | | | 5,202 | | | | 266,446 | |
Ingredion, Inc. | | | 15,604 | | | | 1,258,307 | |
Kernel Holding SA (a) | | | 8,322 | | | | 69,893 | |
New Britain Palm Oil Ltd. | | | 31,415 | | | | 329,803 | |
Origin Enterprises PLC (a) | | | 70,736 | | | | 628,260 | |
Pilgrim’s Pride Corp. | | | 34,328 | | | | 932,005 | |
Scandi Standard AB (a) | | | 57,923 | | | | 365,798 | |
Select Harvests Ltd. | | | 50,523 | | | | 259,404 | |
SunOpta, Inc. (a) | | | 20,804 | | | | 217,610 | |
Tyson Foods, Inc., Class A | | | 81,138 | | | | 3,167,627 | |
Wilmar International Ltd. | | | 691,000 | | | | 1,639,875 | |
| | | | | | | | |
| | | | | | | | 20,763,480 | |
Household Durables — 0.0% | | | | | | | | |
TRI Pointe Homes, Inc. | | | 6,091 | | | | 87,284 | |
Machinery — 0.4% | | | | | | | | |
Deere & Co. | | | 8,010 | | | | 682,372 | |
Kubota Corp. | | | 62,000 | | | | 920,415 | |
| | | | | | | | |
| | | | | | | | 1,602,787 | |
Metals & Mining — 13.9% | | | | | | | | |
African Barrick Gold PLC | | | 150,506 | | | | 639,048 | |
African Rainbow Minerals Ltd. | | | 28,625 | | | | 287,865 | |
Agnico-Eagle Mines Ltd. | | | 73,626 | | | | 2,482,205 | |
| | | | | | | | | | | | | | |
| ADR | | American Depositary Receipts | | COP | | Colombian Peso | | INR | | Indian Rupee | | REIT | | Real Estate Investment Trust |
| AKA | | Also Known As | | DKK | | Danish Krone | | JPY | | Japanese Yen | | S&P | | Standard & Poor’s |
| ASX | | Australian Securities Exchange | | ETF | | Exchange Traded Fund | | KRW | | Korean Won | | SEK | | Swedish Krona |
| AUD | | Australian Dollar | | EUR | | Euro | | LIBOR | | London Interbank Offered Rate | | SGD | | Singapore Dollar |
| BRL | | Brazilian Real | | EURIBOR | | Euro Interbank Offered Rate | | LP | | Limited Partnership | | SPDR | | Standard & Poor’s Depositary Receipts |
| CAD | | Canadian Dollar | | FKA | | Formerly Known As | | MXN | | Mexican Peso | | THB | | Thai Baht |
| CDO | | Collateralized Debt Obligation | | FTSE | | Financial Times Stock Exchange | | MYR | | Malaysian Ringgit | | TRY | | Turkish Lira |
| CHF | | Swiss Franc | | GBP | | British Pound | | NOK | | Norwegian Krone | | TWD | | Taiwan New Dollar |
| CLO | | Collateralized Loan Obligation | | GDR | | Global Depositary Receipts | | NZD | | New Zealand Dollar | | USD | | U.S. Dollar |
| CLP | | Chilean Peso | | HUF | | Hungarian Forint | | OTC | | Over-the-counter | | ZAR | | South African Rand |
| CNH | | Chinese Yuan | | IDR | | Indonesian Rupiah | | PIK | | Payment-in-kind | | | | |
| CNY | | Chinese Yuan Offshore | | ILS | | Israeli Shekel | | PLN | | Polish Zloty | | | | |
See Notes to Financial Statements.
| | | | | | |
| 12 | | BLACKROCK FUNDS | | JANUARY 31, 2015 | | |
| | | | |
| Consolidated Schedule of Investments (continued) | | | BlackRock Commodity Strategies Fund | |
| | | (Percentages shown are based on Net Assets) | |
| | | | | | | | |
| Common Stocks | | Shares | | | Value | |
Metals & Mining (concluded) | | | | | | | | |
Alamos Gold, Inc. | | | 78,487 | | | $ | 418,778 | |
Alumina Ltd. | | | 451,601 | | | | 675,964 | |
Anglo American PLC | | | 30,840 | | | | 515,142 | |
AngloGold Ashanti Ltd. | | | 50,847 | | | | 616,718 | |
Aurubis AG | | | 8,151 | | | | 441,891 | |
Barrick Gold Corp. | | | 34,576 | | | | 442,166 | |
BHP Billiton PLC | | | 124,988 | | | | 2,714,816 | |
Boliden AB | | | 75,266 | | | | 1,175,786 | |
Centamin PLC | | | 403,384 | | | | 407,516 | |
Century Aluminum Co. (a) | | | 24,599 | | | | 568,483 | |
Eldorado Gold Corp. | | | 453,995 | | | | 2,179,405 | |
First Majestic Silver Corp. (a) | | | 61,016 | | | | 376,938 | |
First Quantum Minerals Ltd. | | | 74,023 | | | | 675,161 | |
Fortescue Metals Group Ltd. | | | 108,020 | | | | 195,872 | |
Franco-Nevada Corp. | | | 45,253 | | | | 2,611,476 | |
Freeport-McMoRan, Inc. | | | 42,435 | | | | 713,332 | |
Fresnillo PLC | | | 180,855 | | | | 2,442,906 | |
Glencore PLC | | | 720,136 | | | | 2,685,094 | |
Gold Fields Ltd. — ADR | | | 170,000 | | | | 1,003,000 | |
Goldcorp, Inc. | | | 164,741 | | | | 3,978,832 | |
HudBay Minerals, Inc. | | | 176,015 | | | | 1,281,293 | |
Iluka Resources Ltd. | | | 64,521 | | | | 350,392 | |
Industrias Penoles SAB de CV | | | 34,067 | | | | 679,067 | |
Kinross Gold Corp. | | | 146,600 | | | | 497,242 | |
Lundin Mining Corp. (a) | | | 419,192 | | | | 1,491,106 | |
MAG Silver Corp. (a) | | | 68,300 | | | | 506,324 | |
Metals X Ltd. | | | 154,379 | | | | 131,839 | |
Nevsun Resources Ltd. | | | 145,393 | | | | 502,302 | |
New Gold, Inc. (a) | | | 260,000 | | | | 1,139,687 | |
Newcrest Mining Ltd. | | | 220,000 | | | | 2,375,447 | |
Northern Star Resources Ltd. | | | 280,000 | | | | 405,096 | |
Nyrstar NV | | | 240,855 | | | | 906,037 | |
Osisko Gold Royalties Ltd. | | | 31,000 | | | | 416,928 | |
OZ Minerals Ltd. | | | 54,011 | | | | 161,335 | |
Petra Diamonds Ltd. | | | 142,370 | | | | 328,266 | |
Polymetal International PLC | | | 30,359 | | | | 273,388 | |
Randgold Resources Ltd. — ADR | | | 46,979 | | | | 4,005,430 | |
Rio Tinto PLC | | | 88,290 | | | | 3,879,741 | |
Romarco Minerals, Inc. (a) | | | 406,776 | | | | 182,468 | |
Royal Gold, Inc. | | | 34,982 | | | | 2,534,796 | |
Silver Wheaton Corp. | | | 84,926 | | | | 1,950,885 | |
Sirius Resources NL | | | 118,958 | | | | 230,503 | |
Sociedad Minera Cerro Verde SAA | | | 18,201 | | | | 400,422 | |
Tahoe Resources, Inc. | | | 30,978 | | | | 422,726 | |
Teck Resources Ltd., Class B | | | 45,895 | | | | 594,139 | |
Trevali Mining Corp. (a) | | | 771,153 | | | | 594,735 | |
Vale SA — ADR, Preference Shares | | | 61,615 | | | | 385,710 | |
Volcan Cia Minera SAA, Class B | | | 837,855 | | | | 131,299 | |
Western Areas Ltd. | | | 65,354 | | | | 202,461 | |
Yamana Gold, Inc. | | | 185,963 | | | | 769,785 | |
| | | | | | | | |
| | | | | | | | 55,979,243 | |
Oil, Gas & Consumable Fuels — 20.9% | | | | | | | | |
Anadarko Petroleum Corp. | | | 56,613 | | | | 4,628,113 | |
BG Group PLC | | | 67,730 | | | | 903,377 | |
BP PLC | | | 295,600 | | | | 1,898,950 | |
Cabot Oil & Gas Corp. | | | 66,400 | | | | 1,759,600 | |
Cairn Energy PLC (a) | | | 203,100 | | | | 585,337 | |
Cameco Corp. | | | 43,661 | | | | 614,353 | |
Canadian Natural Resources Ltd. | | | 41,400 | | | | 1,200,264 | |
Chevron Corp. | | | 90,450 | | | | 9,273,839 | |
China Shenhua Energy Co. Ltd., H Shares | | | 286,500 | | | | 786,453 | |
Cimarex Energy Co. | | | 15,400 | | | | 1,589,280 | |
ConocoPhillips | | | 93,850 | | | | 5,910,673 | |
CONSOL Energy, Inc. | | | 28,637 | | | | 829,041 | |
Devon Energy Corp. | | | 56,900 | | | | 3,429,363 | |
| | | | | | | | |
| Common Stocks | | Shares | | | Value | |
Oil, Gas & Consumable Fuels (concluded) | | | | | | | | |
Enbridge, Inc. | | | 64,400 | | | $ | 3,119,399 | |
EnCana Corp. | | | 149,300 | | | | 1,825,861 | |
EOG Resources, Inc. | | | 33,000 | | | | 2,937,990 | |
EQT Corp. | | | 18,800 | | | | 1,399,472 | |
Exxon Mobil Corp. | | | 113,932 | | | | 9,959,935 | |
Genel Energy PLC (a) | | | 55,200 | | | | 515,882 | |
Green Plains, Inc. | | | 5,202 | | | | 121,779 | |
Imperial Oil Ltd. | | | 27,000 | | | | 1,003,762 | |
Kosmos Energy Ltd. | | | 144,221 | | | | 1,264,818 | |
Marathon Oil Corp. | | | 87,800 | | | | 2,335,480 | |
Murphy Oil Corp. | | | 24,500 | | | | 1,100,295 | |
Noble Energy, Inc. | | | 49,600 | | | | 2,367,904 | |
Oil Search Ltd. | | | 256,950 | | | | 1,546,268 | |
Phillips 66 | | | 24,969 | | | | 1,755,820 | |
Pioneer Natural Resources Co. | | | 10,900 | | | | 1,640,777 | |
Range Resources Corp. | | | 33,050 | | | | 1,529,223 | |
Royal Dutch Shell PLC, B Shares | | | 302,390 | | | | 9,573,691 | |
Southwestern Energy Co. (a) | | | 42,100 | | | | 1,043,659 | |
Statoil ASA | | | 95,279 | | | | 1,595,570 | |
Total SA | | | 84,700 | | | | 4,347,682 | |
| | | | | | | | |
| | | | | | | | 84,393,910 | |
Paper & Forest Products — 0.3% | | | | | | | | |
Canfor Corp. | | | 19,764 | | | | 387,752 | |
Interfor Corp. | | | 21,324 | | | | 372,545 | |
Louisiana-Pacific Corp. | | | 14,563 | | | | 238,396 | |
| | | | | | | | |
| | | | | | | | 998,693 | |
Real Estate Investment Trusts (REITs) — 0.2% | | | | | | | | |
Weyerhaeuser Co. | | | 22,885 | | | | 820,427 | |
Total Common Stocks — 46.6% | | | | | | | 188,125,387 | |
| | | | | | | | |
| Investment Companies | | | | | | |
ELEMENTSSM Linked to the Rogers International Commodity Index — Total Return (a)(b) | | | 315,000 | | | | 1,867,950 | |
ETFS All Commodities DJ-UBSCISM (a)(b) | | | 185,000 | | | | 1,865,725 | |
PowerShares DB Commodity Index Tracking
Fund (a)(b) | | | 441,000 | | | | 7,673,400 | |
Total Investment Companies — 2.8% | | | | | | | 11,407,075 | |
| | | | | | | | |
| Preferred Stocks | | | | | | |
Food Products — 0.1% | | | | | | | | |
Tyson Foods, Inc., 4.75% | | | 10,085 | | | | 487,811 | |
Total Long-Term Investments | | | | | | | | |
(Cost — $281,766,405) — 62.0% | | | | | | | 250,412,567 | |
| | | | | | | | |
| Short-Term Securities | | | | | | |
Money Market Funds — 2.3% | | | | | | | | |
BlackRock Liquidity Funds, TempFund, Institutional Class, 0.06% (c)(d) | | | 9,144,893 | | | | 9,144,893 | |
See Notes to Financial Statements.
| | | | | | |
| | | BLACKROCK FUNDS | | JANUARY 31, 2015 | | 13 |
| | | | |
| Consolidated Schedule of Investments (continued) | | | BlackRock Commodity Strategies Fund | |
| | | (Percentages shown are based on Net Assets) | |
| | | | | | | | | | | | |
| Short-Term Securities | | | | | Par (000) | | | Value | |
U.S. Treasury Bills — 32.1% | | | | | | | | | | | | |
0.02%, 2/12/15 (e) | | | USD | | | | 17,000 | | | $ | 16,999,949 | |
0.03%, 3/05/15 (e) | | | | | | | 2,000 | | | | 1,999,974 | |
0.04%, 3/05/15 (e) | | | | | | | 27,000 | | | | 26,999,645 | |
0.04%, 4/09/15 (e) | | | | | | | 30,000 | | | | 29,999,730 | |
0.03%, 5/07/15 (e) | | | | | | | 2,000 | | | | 1,999,874 | |
0.05%, 5/07/15 (e) | | | | | | | 10,000 | | | | 9,999,370 | |
0.05%, 6/04/15 (e) | | | | | | | 5,000 | | | | 4,999,620 | |
0.07%, 6/04/15 (e) | | | | | | | 16,000 | | | | 15,998,784 | |
0.05%, 7/09/15 (e) | | | | | | | 5,000 | | | | 4,999,345 | |
0.07%, 7/09/15 (e) | | | | | | | 16,000 | | | | 15,997,904 | |
| | | | | | | | | | | | |
| | | | | | | | | | | | 129,994,195 | |
Total Short-Term Securities (Cost — $139,128,592) — 34.4% | | | | 139,139,088 | |
| | | | |
| | | Value | |
Total Investments (Cost — $420,894,997) — 96.4% | | $ | 389,551,655 | |
Other Assets Less Liabilities — 3.6% | | | 14,668,865 | |
| | | | |
Net Assets — 100.0% | | $ | 404,220,520 | |
| | | | |
|
| Notes to Consolidated Schedule of Investments |
| (a) | Non-income producing security. |
| (b) | Security is held by a wholly owned subsidiary. See Note 1 of the Notes to Financial Statements for details on the wholly owned subsidiary. |
| (c) | During the six months ended January 31, 2015, investments in issuers considered to be an affiliate of the Fund for purposes of Section 2(a)(3) of the Investment Company Act of 1940, as amended, were as follows: |
| | | | | | | | | | | | | | | | |
| Affiliate | | Shares/Beneficial
Interest Held at
July 31, 2014 | | | Net
Activity | | | Shares/Beneficial
Interest Held at
January 31, 2015 | | | Income | |
BlackRock Liquidity Funds, TempFund, Institutional Class | | | 12,539,789 | | | | (3,394,896 | ) | | | 9,144,893 | | | $ | 6,772 | |
BlackRock Liquidity Series, LLC Money Market Series | | $ | 39,840 | | | $ | (39,840 | ) | | | — | | | $ | 2,822 | |
| (d) | Represents the current yield as of report date. |
| (e) | Rate shown reflects the discount rate at the time of purchase. |
| Ÿ | | For Fund compliance purposes, the Fund’s industry classifications refer to any one or more of the industry sub-classifications used by one or more widely recognized market indexes or ratings group indexes, and/or as defined by the investment advisor. These definitions may not apply for purposes of this report, which may combine such industry sub-classifications for reporting ease. |
| Ÿ | | Fair Value Measurements — Various inputs are used in determining the fair value of investments. These inputs to valuation techniques are categorized into a disclosure hierarchy consisting of three broad levels for financial statement purposes. The hierarchy gives the highest priority to unadjusted quoted prices in active markets for identical assets or liabilities (Level 1 measurements) and the lowest priority to unobservable inputs (Level 3 measurements). Accordingly, the degree of judgment exercised in determining fair value is greatest for instruments categorized in Level 3. The inputs used to measure fair value may fall into different levels of the fair value hierarchy. In such cases, for disclosure purposes, the fair value hierarchy classification is determined based on the lowest level input that is significant to the fair value measurement in its entirety. The categorization of a value determined for investments is based on the pricing transparency of the investment and is not necessarily an indication of the risks associated with investing in those securities. The three levels of the fair value hierarchy are as follows: |
| | Ÿ | | Level 1 — unadjusted quoted prices in active markets/exchanges for identical assets or liabilities that the Fund has the ability to access |
| | Ÿ | | Level 2 — other observable inputs (including, but not limited to, quoted prices for similar assets or liabilities in markets that are active, quoted prices for identical or similar assets or liabilities in markets that are not active, inputs other than quoted prices that are observable for the assets or liabilities (such as interest rates, yield curves, volatilities, prepayment speeds, loss severities, credit risks and default rates) or other market-corroborated inputs) |
| | Ÿ | | Level 3 — unobservable inputs based on the best information available in the circumstances, to the extent observable inputs are not available (including the Fund’s own assumptions used in determining the fair value of investments) |
See Notes to Financial Statements.
| | | | | | |
| 14 | | BLACKROCK FUNDS | | JANUARY 31, 2015 | | |
| | | | |
| Consolidated Schedule of Investments (continued) | | | BlackRock Commodity Strategies Fund | |
Changes in valuation techniques may result in transfers into or out of an assigned level within the disclosure hierarchy. In accordance with the Fund’s policy, transfers between different levels of the fair value disclosure hierarchy are deemed to have occurred as of the beginning of the reporting period. For information about the Fund’s policy regarding valuation of investments, refer to Note 2 of the Notes to Financial Statements.
As of January 31, 2015, the following table summarizes the Fund’s investments categorized in the disclosure hierarchy:
| | | | | | | | | | | | | | | | |
| |
| | | Level 1 | | | Level 2 | | | Level 3 | | | Total | |
| |
Assets: | | | | | | | | | | | | | | | | |
Investments: | | | | | | | | | | | | | | | | |
Long-Term Investments: | | | | | | | | | | | | | | | | |
Commodity-Linked Notes | | | — | | | $ | 23,636,735 | | | $ | 26,755,559 | | | $ | 50,392,294 | |
Common Stocks: | | | | | | | | | | | | | | | | |
Biotechnology | | $ | 549,428 | | | | — | | | | — | | | | 549,428 | |
Chemicals | | | 12,988,563 | | | | 5,048,083 | | | | — | | | | 18,036,646 | |
Energy Equipment & Services | | | 3,513,884 | | | | — | | | | — | | | | 3,513,884 | |
Food & Staples Retailing | | | 1,379,605 | | | | — | | | | — | | | | 1,379,605 | |
Food Products | | | 16,097,086 | | | | 4,666,394 | | | | — | | | | 20,763,480 | |
Household Durables | | | 87,284 | | | | — | | | | — | | | | 87,284 | |
Machinery | | | 682,372 | | | | 920,415 | | | | — | | | | 1,602,787 | |
Metals & Mining | | | 35,481,205 | | | | 20,498,038 | | | | — | | | | 55,979,243 | |
Oil, Gas & Consumable Fuels | | | 62,640,700 | | | | 21,753,210 | | | | — | | | | 84,393,910 | |
Paper & Forest Products | | | 998,693 | | | | — | | | | — | | | | 998,693 | |
Real Estate Investment Trusts (REITs) | | | 820,427 | | | | — | | | | — | | | | 820,427 | |
Investment Companies | | | 11,407,075 | | | | — | | | | — | | | | 11,407,075 | |
Preferred Stocks | | | 487,811 | | | | — | | | | — | | | | 487,811 | |
Short-Term Securities: | | | | | | | | | | | | | | | | |
Money Market Funds | | | 9,144,893 | | | | — | | | | — | | | | 9,144,893 | |
U.S. Treasury Bills | | | — | | | | 129,994,195 | | | | — | | | | 129,994,195 | |
| |
Total | | $ | 156,279,026 | | | $ | 206,517,070 | | | $ | 26,755,559 | | | $ | 389,551,655 | |
| | | | |
The Fund may hold assets and/or liabilities in which the fair value approximates the carrying amount for financial statement purposes. As of January 31, 2015, cash of $13,894,719 is categorized as Level 1 within the disclosure hierarchy. | |
| |
| | | Transfers into
Level 1 | | | Transfers out
of Level 1 1 | | | Transfers into
Level 2 1 | | | Transfers out
of Level 2 | |
| |
Assets: | | | | | | | | | | | | | | | | |
Long-Term Investments: | | | | | | | | | | | | | | | | |
Common Stocks: | | | | | | | | | | | | | | | | |
Chemicals | | | — | | | $ | (709,661 | ) | | $ | 709,661 | | | | — | |
Food Products | | | — | | | | (2,805,965 | ) | | | 2,805,965 | | | | — | |
Metals & Mining | | | — | | | | (18,870,512 | ) | | | 18,870,512 | | | | — | |
Oil, Gas & Consumable Fuels | | | — | | | | (15,239,290 | ) | | | 15,239,290 | | | | — | |
| |
Total | | | — | | | $ | (37,625,428 | ) | | $ | 37,625,428 | | | | — | |
| | | | |
1 External pricing service used to reflect any significant market movements between the time the Fund valued such foreign securities and the earlier closing of foreign markets. | |
See Notes to Financial Statements.
| | | | | | |
| | | BLACKROCK FUNDS | | JANUARY 31, 2015 | | 15 |
| | | | |
| Consolidated Schedule of Investments (concluded) | | | BlackRock Commodity Strategies Fund | |
A reconciliation of Level 3 investments is presented when the Fund had a significant amount of Level 3 investments at the beginning and/or end of the period in relation to net assets. The following table is a reconciliation of Level 3 investments for which significant unobservable inputs were used in determining fair value:
| | | | |
| | | Commodity-Linked
Notes | |
Assets: | |
Opening Balance, as of July 31, 2014 | | $ | 29,554,915 | |
Transfers into Level 3 | | | — | |
Transfers out of Level 3 | | | — | |
Accrued discounts/premiums | | | — | |
Net realized gain (loss) | | | (14,366,997 | ) |
Net change in unrealized appreciation/depreciation1,2 | | | (9,799,356 | ) |
Purchases | | | 41,000,000 | |
Sales | | | (19,633,003 | ) |
Closing Balance, as of January 31, 2015 | | $ | 26,755,559 | |
| | | | |
Net change in unrealized appreciation/depreciation on investments still held at January 31, 20151 | | $ | (12,244,441 | ) |
| | | | |
| | 1 | | Included in the related net change in unrealized appreciation/depreciation in the Statements of Operations. |
| | 2 | | Any difference between Net change in unrealized appreciation/depreciation and Net change in unrealized appreciation/depreciation on investments still held at January 31, 2015, is generally due to investments no longer held or categorized as Level 3 at period end. |
The Fund’s investments that are categorized as Level 3 were valued utilizing third party pricing information without adjustment. Such valuations are based on unobservable inputs. A significant change in third party information could result in a significantly lower or higher value of such Level 3 investments.
See Notes to Financial Statements.
| | | | | | |
| 16 | | BLACKROCK FUNDS | | JANUARY 31, 2015 | | |
| | | | |
| Schedule of Investments January 31, 2015 (Unaudited) | | | BlackRock Global Long/Short Credit Fund | |
| | | (Percentages shown are based on Net Assets) | |
| | | | | | | | | | | | |
| Asset-Backed Securities | | | | | Par (000) | | | Value | |
Cayman Islands — 3.0% | | | | | | | | | | | | |
ACAS CLO Ltd., Series 2014-1A, Class C, 3.13%, 7/18/26 (a)(b) | | | USD | | | | 1,795 | | | $ | 1,706,248 | |
Adams Mill CLO Ltd., Series 2014-1A, Class D1, 3.70%, 7/15/26 (a)(b) | | | | | | | 767 | | | | 709,475 | |
Adirondack Park CLO Ltd., Series 2013-1A, Class D, 3.90%, 4/15/24 (a)(b) | | | | | | | 1,000 | | | | 948,359 | |
ALM VI Ltd.: | | | | | | | | | | | | |
Series 2012-6A, Class A2,
2.74%, 6/14/23 (a)(b) | | | | | | | 3,930 | | | | 3,938,911 | |
Series 2012-6A, Class C,
4.99%, 6/14/23 (a)(b) | | | | | | | 2,000 | | | | 1,999,891 | |
ALM VII Ltd., Series 2012-7A, Class C, 4.76%, 10/19/24 (a)(b) | | | | | | | 7,360 | | | | 7,359,887 | |
ALM VIII Ltd.: | | | | | | | | | | | | |
Series 2013-8A, Class B,
3.01%, 1/20/26 (a)(b) | | | | | | | 1,520 | | | | 1,453,723 | |
Series 2013-8A, Class D,
4.76%, 1/20/26 (a)(b) | | | | | | | 3,355 | | | | 2,867,818 | |
ALM XIV Ltd.: | | | | | | | | | | | | |
Series 2014-14A, Class B,
3.18%, 7/28/26 (a)(b) | | | | | | | 2,290 | | | | 2,218,798 | |
Series 2014-14A, Class C,
3.68%, 7/28/26 (a)(b) | | | | | | | 2,625 | | | | 2,442,349 | |
Apidos CLO XII, Series 2013-12A, Class D, 3.28%, 4/15/25 (a)(b) | | | | | | | 1,500 | | | | 1,376,504 | |
Apidos CLO XVI, Series 2013-16A, Class B, 3.03%, 1/19/25 (a)(b) | | | | | | | 1,313 | | | | 1,265,510 | |
Apidos CLO XVII, Series 2014-17A, Class B, 3.08%, 4/17/26 (a)(b) | | | | | | | 1,580 | | | | 1,526,178 | |
Apidos CLO XVIII, Series 2014-18A, Class C, 3.88%, 7/22/26 (a)(b) | | | | | | | 1,380 | | | | 1,305,119 | |
Ares XXV CLO Ltd., Series 2012-3X, Class C, 3.40%, 1/17/24 (b) | | | | | | | 1,300 | | | | 1,275,069 | |
Atlas Senior Loan Fund IV Ltd., Series 2013-2A, Class A3L, 2.93%, 2/17/26 (a)(b) | | | | | | | 1,800 | | | | 1,695,747 | |
Atlas Senior Loan Fund V Ltd.: | | | | | | | | | | | | |
Series 2014-1A, Class C,
3.25%, 7/16/26 (a)(b) | | | | | | | 500 | | | | 483,455 | |
Series 2014-1A, Class D,
3.70%, 7/16/26 (a)(b) | | | | | | | 980 | | | | 899,967 | |
Avalon IV Capital Ltd., Series 2012-1AR, Class CR, 3.08%, 4/17/23 (a)(b) | | | | | | | 1,185 | | | | 1,165,376 | |
Babson CLO Ltd.: | | | | | | | | | | | | |
Series 2012-2A, Class C,
4.48%, 5/15/23 (a)(b) | | | | | | | 1,285 | | | | 1,278,215 | |
Series 2013-IIA, Class B1,
2.90%, 1/18/25 (a)(b) | | | | | | | 2,500 | | | | 2,379,978 | |
Battalion CLO IV Ltd., Series 2013-4A, Class C, 3.58%, 10/22/25 (a)(b) | | | | | | | 1,750 | | | | 1,617,753 | |
Benefit Street Partners CLO IV Ltd., Series 2014-IVA, Class C, 3.73%, 7/20/26 (a)(b) | | | | | | | 1,000 | | | | 920,629 | |
Benefit Street Partners CLO Ltd.: | | | | | | | | | | | | |
Series 2012-IA, Class C,
4.75%, 10/15/23 (a)(b) | | | | | | | 1,620 | | | | 1,592,914 | |
Series 2013-IIIA, Class C,
3.50%, 1/20/26 (a)(b) | | | | | | | 1,070 | | | | 973,034 | |
Bluemountain CLO Ltd., Series 2011-1A, Class D, 4.23%, 8/16/22 (a)(b) | | | | | | | 2,000 | | | | 1,994,936 | |
Carlyle Global Market Strategies CLO Ltd.: | | | | | | | | | | | | |
Series 2011-1A, Class E,
5.68%, 8/10/21 (a)(b) | | | | | | | 4,600 | | | | 4,589,952 | |
Series 2012-2AR, Class ER,
6.33%, 7/20/23 (a)(b) | | | | | | | 4,435 | | | | 4,401,942 | |
Series 2012-3A, Class C,
4.75%, 10/04/24 (a)(b) | | | | | | | 3,495 | | | | 3,485,518 | |
Cedar Funding III CLO Ltd.: | | | | | | | | | | | | |
Series 2014-3A, Class C,
3.03%, 5/20/26 (a)(b) | | | | | | | 1,320 | | | | 1,245,563 | |
| | | | | | | | | | | | |
| Asset-Backed Securities | | | | | Par (000) | | | Value | |
Cayman Islands (continued) | | | | | | | | | | | | |
Series 2014-3A, Class D,
3.79%, 5/20/26 (a)(b) | | | USD | | | | 1,105 | | | $ | 1,020,456 | |
Cent CLO 21 Ltd., Series 2014-21A, Class C, 3.73%, 7/27/26 (a)(b) | | | | | | | 1,750 | | | | 1,619,719 | |
CIFC Funding Ltd.: | | | | | | | | | | | | |
Series 2012-1AR, Class B1R,
4.38%, 8/14/24 (a)(b) | | | | | | | 1,500 | | | | 1,466,822 | |
Series 2014-1A, Class D,
3.50%, 4/18/25 (a)(b) | | | | | | | 850 | | | | 771,524 | |
Series 2014-2A, Class B1L,
3.73%, 5/24/26 (a)(b) | | | | | | | 1,355 | | | | 1,250,130 | |
Series 2014-3A, Class C1,
2.95%, 7/22/26 (a)(b) | | | | | | | 886 | | | | 847,780 | |
Series 2014-3A, Class D,
3.55%, 7/22/26 (a)(b) | | | | | | | 791 | | | | 727,935 | |
Series 2014-4A, Class C1,
3.18%, 10/17/26 (a)(b) | | | | | | | 2,850 | | | | 2,739,069 | |
Series 2014-4A, Class D,
3.68%, 10/17/26 (a)(b) | | | | | | | 3,250 | | | | 2,988,443 | |
Dryden 34 Senior Loan Fund, Series 2014-34A, Class C, 3.09%, 10/15/26 (a)(b) | | | | | | | 1,000 | | | | 961,263 | |
Eaton Vance CLO Ltd., Series 2014-1A, Class INC, 0.00%, 7/15/26 (a) | | | | | | | 4,000 | | | | 3,172,268 | |
ECP CLO Ltd., Series 2013-5A, Class C, 3.76%, 1/20/25 (a)(b) | | | | | | | 1,750 | | | | 1,629,980 | |
Flatiron CLO Ltd.: | | | | | | | | | | | | |
Series 2013-1A, Class A1,
1.63%, 1/17/26 (a)(b) | | | | | | | 3,205 | | | | 3,171,158 | |
Series 2013-1A, Class C,
3.83%, 1/17/26 (a)(b) | | | | | | | 3,000 | | | | 2,837,124 | |
Fraser Sullivan CLO VII Ltd., Series 2012-7X, Class SUB, 0.00%, 4/20/23 | | | | | | | 2,500 | | | | 2,050,000 | |
Galaxy XII CLO Ltd., Series 2012-12A, Class B, 2.83%, 5/19/23 (a)(b) | | | | | | | 1,895 | | | | 1,912,883 | |
Galaxy XV CLO Ltd., Series 2013-15A, Class C, 2.83%, 4/15/25 (a)(b) | | | | | | | 1,000 | | | | 953,248 | |
Galaxy XVIII CLO Ltd.: | | | | | | | | | | | | |
Series 2014-18A, Class B,
2.28%, 10/15/26 (a)(b) | | | | | | | 2,260 | | | | 2,218,462 | |
Series 2014-18A, Class C1,
3.23%, 10/15/26 (a)(b) | | | | | | | 2,000 | | | | 1,948,438 | |
Gramercy Park CLO Ltd., Series 2012-1AR, Class DR, 5.73%, 7/17/23 (a)(b) | | | | | | | 1,000 | | | | 984,995 | |
ING Investment Management CLO Ltd.: | | | | | | | | | | | | |
Series 2012-1RA, Class CR,
3.93%, 3/14/22 (a)(b) | | | | | | | 2,350 | | | | 2,329,851 | |
Series 2012-3A, Class D,
5.00%, 10/15/22 (a)(b) | | | | | | | 2,321 | | | | 2,296,934 | |
Series 2013-3A, Class B,
2.93%, 1/18/26 (a)(b) | | | | | | | 2,520 | | | | 2,408,316 | |
Jamestown CLO IV Ltd., Series 2014-4A, Class C, 3.73%, 7/15/26 (a)(b) | | | | | | | 1,375 | | | | 1,281,910 | |
KKR Financial CLO Ltd., Series 2013-1A, Class A1, 1.40%, 7/15/25 (a)(b) | | | | | | | 1,640 | | | | 1,605,157 | |
LCM X LP: | | | | | | | | | | | | |
Series -10AR, Class CR,
3.08%, 4/15/22 (a)(b) | | | | | | | 645 | | | | 637,985 | |
Series -10AR, Class DR,
3.98%, 4/15/22 (a)(b) | | | | | | | 2,000 | | | | 1,981,381 | |
Madison Park Funding Ltd., Series 2012-9A, Class D, 4.58%, 8/15/22 (a)(b) | | | | | | | 1,500 | | | | 1,491,944 | |
Madison Park Funding VIII Ltd.: | | | | | | | | | | | | |
Series 2012-8AR, Class CR,
3.06%, 4/22/22 (a)(b) | | | | | | | 1,252 | | | | 1,236,503 | |
Series 2012-8AR, Class DR,
4.11%, 4/22/22 (a)(b) | | | | | | | 864 | | | | 845,430 | |
Madison Park Funding X Ltd., Series 2012-10A, Class D, 4.51%, 1/20/25 (a)(b) | | | | | | | 2,630 | | | | 2,601,075 | |
See Notes to Financial Statements.
| | | | | | |
| | | BLACKROCK FUNDS | | JANUARY 31, 2015 | | 17 |
| | | | |
| Schedule of Investments (continued) | | | BlackRock Global Long/Short Credit Fund | |
| | | (Percentages shown are based on Net Assets) | |
| | | | | | | | | | | | |
| Asset-Backed Securities | | | | | Par
(000) | | | Value | |
Cayman Islands (continued) | | | | | | | | | | | | |
Madison Park Funding XI Ltd., Series 2013-11A, Class C, 3.01%, 10/23/25 (a)(b) | | | USD | | | | 2,680 | | | $ | 2,570,927 | |
Mountain Hawk II CLO Ltd., Series 2013-2A, Class A1, 1.39%, 7/22/24 (a)(b) | | | | | | | 2,320 | | | | 2,267,796 | |
Neuberger Berman CLO XII Ltd., Series 2012-12AR, Class DR, 4.23%, 7/25/23 (a)(b) | | | | | | | 2,000 | | | | 1,975,918 | |
Neuberger Berman CLO XVII Ltd., Series 2014-17A, Class D, 3.71%, 8/04/25 (a)(b) | | | | | | | 568 | | | | 525,754 | |
Oaktree CLO Ltd., Series 2014-1A, Class A2A,
2.28%, 2/13/25 (a)(b) | | | | | | | 3,470 | | | | 3,390,493 | |
Octagon Investment Partners XIX Ltd., Series 2014-1A, Class D, 3.75%, 4/15/26 (a)(b) | | | | | | | 2,500 | | | | 2,335,701 | |
Octagon Investment Partners XVII Ltd., Series 2013-1A, Class D, 3.43%, 10/25/25 (a)(b) | | | | | | | 1,000 | | | | 919,505 | |
Octagon Investment Partners XVIII Ltd., Series 2013-1A, Class C, 3.93%, 12/16/24 (a)(b) | | | | | | | 1,000 | | | | 949,049 | |
Octagon Investment Partners XX Ltd., Series 2014-1A, Class D, 3.88%, 8/12/26 (a)(b) | | | | | | | 1,175 | | | | 1,101,553 | |
OHA Credit Partners VI Ltd., Series 2012-6A, Class D, 4.73%, 5/15/23 (a)(b) | | | | | | | 3,200 | | | | 3,208,366 | |
OHA Credit Partners VII Ltd., Series 2012-7A, Class A, 1.65%, 11/20/23 (a)(b) | | | | | | | 3,350 | | | | 3,325,086 | |
OZLM Funding IV Ltd., Series 2013-4A, Class C, 3.43%, 7/22/25 (a)(b) | | | | | | | 1,000 | | | | 916,212 | |
OZLM VII Ltd.: | | | | | | | | | | | | |
Series 2014-7A, Class B1,
3.11%, 7/17/26 (a)(b) | | | | | | | 430 | | | | 412,064 | |
Series 2014-7A, Class C,
3.86%, 7/17/26 (a)(b) | | | | | | | 1,062 | | | | 989,313 | |
OZLM VIII Ltd.: | | | | | | | | | | | | |
Series 2014-8A, Class B,
3.28%, 10/17/26 (a)(b) | | | | | | | 3,000 | | | | 2,913,662 | |
Series 2014-8A, Class C,
3.78%, 10/17/26 (a)(b) | | | | | | | 2,000 | | | | 1,851,492 | |
Palmer Square CLO Ltd.: | | | | | | | | | | | | |
Series 2014-1A, Class B,
2.78%, 10/17/22 (a)(b) | | | | | | | 2,005 | | | | 1,954,426 | |
Series 2014-1A, Class C,
4.08%, 10/17/22 (a)(b) | | | | | | | 1,215 | | | | 1,197,970 | |
Race Point V CLO Ltd., Series 2011-5AR, Class DR, 3.98%, 12/15/22 (a)(b) | | | | | | | 1,645 | | | | 1,641,364 | |
Rait Preferred Funding II Ltd., Series 2007-2A, Class A1T, 0.46%, 6/25/45 (a)(b) | | | | | | | 3,372 | | | | 3,102,067 | |
Regatta IV Funding Ltd.: | | | | | | | | | | | | |
Series 2014-1A, Class C,
3.18%, 7/25/26 (a)(b) | | | | | | | 550 | | | | 531,159 | |
Series 2014-1A, Class D,
3.77%, 7/25/26 (a)(b) | | | | | | | 660 | | | | 611,671 | |
Seneca Park CLO Ltd., Series 2014-1A, Class D, 3.72%, 7/17/26 (a)(b) | | | | | | | 1,435 | | | | 1,346,122 | |
Silver Spring CLO Ltd., Series 2014-1A, Class D, 3.71%, 10/15/26 (a)(b) | | | | | | | 2,000 | | | | 1,832,051 | |
Steele Creek CLO Ltd.: | | | | | | | | | | | | |
Series 2014-1A, Class B,
2.48%, 8/21/26 (a)(b) | | | | | | | 1,110 | | | | 1,076,878 | |
Series 2014-1A, Class C,
3.43%, 8/21/26 (a)(b) | | | | | | | 1,110 | | | | 1,078,920 | |
| | | | | | | | | | | | |
| Asset-Backed Securities | | | | | Par
(000) | | | Value | |
Cayman Islands (concluded) | | | | | | | | | | | | |
Sudbury Mill CLO Ltd., Series 2013-1A, Class C, 3.23%, 1/17/26 (a)(b) | | | USD | | | | 2,500 | | | $ | 2,418,232 | |
TICP CLO II Ltd.: | | | | | | | | | | | | |
Series 2014-2A, Class A1A,
1.68%, 7/26/26 (a)(b) | | | | | | | 3,400 | | | | 3,367,204 | |
Series 2014-2A, Class B,
3.23%, 7/26/26 (a)(b) | | | | | | | 870 | | | | 839,785 | |
Tyron Park CLO Ltd., Series 2013-1A, Class C, 3.73%, 7/15/25 (a)(b) | | | | | | | 1,000 | | | | 941,847 | |
Venture XIII CLO Ltd., Series 2013-13A, Class D, 3.78%, 6/10/25 (a)(b) | | | | | | | 500 | | | | 469,428 | |
Venture XVI CLO Ltd., Series 2014-16A, Class A3L, 2.98%, 4/15/26 (a)(b) | | | | | | | 1,750 | | | | 1,671,982 | |
Venture XVII CLO Ltd., Series 2014-17A, Class C, 3.10%, 7/15/26 (a)(b) | | | | | | | 1,163 | | | | 1,107,967 | |
Venture XVIII CLO Ltd., Series 2014-18A, Class C, 3.39%, 10/15/26 (a)(b) | | | | | | | 1,457 | | | | 1,420,190 | |
Voya CLO Ltd., Series 2014-3A, Class C,
3.83%, 7/25/26 (a)(b) | | | | | | | 1,850 | | | | 1,743,336 | |
Washington Mill CLO Ltd., Series 2014-1A, Class D, 3.68%, 4/20/26 (a)(b) | | | | | | | 1,640 | | | | 1,517,179 | |
WhiteHorse IX Ltd.: | | | | | | | | | | | | |
Series 2014-9A, Class B1,
2.32%, 7/17/26 (a)(b) | | | | | | | 2,248 | | | | 2,193,804 | |
Series 2014-9A, Class C,
2.92%, 7/17/26 (a)(b) | | | | | | | 980 | | | | 918,482 | |
| | | | | | | | | | | | |
| | | | | | | | | | | | 177,741,956 | |
Ireland — 2.8% | | | | | | | | | | | | |
ALME Loan Funding: | | | | | | | | | | | | |
Series 2014-2X, Class A,
1.69%, 8/15/27 (b) | | | EUR | | | | 25,370 | | | | 28,682,652 | |
Series 2014-2X, Class E,
5.39%, 8/15/27 (b) | | | | | | | 5,710 | | | | 5,936,963 | |
Series 2014-2X, Class F,
6.14%, 8/15/27 (b) | | | | | | | 3,825 | | | | 3,769,315 | |
Arbour CLO Ltd.: | | | | | | | | | | | | |
Series 2014-1X, Class E,
5.36%, 6/16/27 (b) | | | | | | | 5,313 | | | | 5,520,028 | |
Series 2014-1X, Class F,
6.11%, 6/16/27 (b) | | | | | | | 2,883 | | | | 2,836,226 | |
Avoca CLO XI Ltd., Series 2014-11X, Class A, 1.47%, 7/15/27 (b) | | | | | | | 18,800 | | | | 21,228,395 | |
Avoca CLO XIII Ltd., Series 13A, Class E, 5.69%, 1/21/28 (a)(b) | | | | | | | 3,530 | | | | 3,689,715 | |
Cordatus, Series 2014-3X, Class A1, 1.52%, 7/08/27 (b) | | | | | | | 21,280 | | | | 23,923,298 | |
CVC Cordatus Loan Fund IV Ltd.: | | | | | | | | | | | | |
Series 4X, Class E, 6.11%, 1/22/28 (b) | | | | | | | 8,800 | | | | 9,297,595 | |
Series 4X, Class F, 6.71%, 1/22/28 (b) | | | | | | | 4,400 | | | | 4,275,899 | |
Series 4X, Class SUB,
0.21%, 1/22/28 (b) | | | | | | | 21,100 | | | | 22,173,884 | |
Sorrento Park CLO Ltd., Series 2014-1X, Class E, 6.46%, 11/16/27 (a)(b) | | | | | | | 4,200 | | | | 4,268,174 | |
St. Pauls CLO, Series 2014-4X, Class A1
1.46%, 4/25/28 (b) | | | | | | | 25,750 | | | | 29,033,346 | |
| | | | | | | | | | | | |
| | | | | | | | | | | | 164,635,490 | |
Italy — 0.8% | | | | | | | | | | | | |
Arianna SPV Srl: | | | | | | | | | | | | |
Series 2014-1, Class A, 3.60%, 10/20/30 | | | | | | | 23,350 | | | | 27,543,905 | |
Series 2014-1, Class B, 5.50%, 10/20/30 | | | | | | | 5,200 | | | | 6,253,844 | |
Berica PMI Srl, Series 2013-1, Class A1X, 2.72%, 5/31/57 (b) | | | | | | | 5,117 | | | | 5,863,889 | |
See Notes to Financial Statements.
| | | | | | |
| 18 | | BLACKROCK FUNDS | | JANUARY 31, 2015 | | |
| | | | |
| Schedule of Investments (continued) | | | BlackRock Global Long/Short Credit Fund | |
| | | (Percentages shown are based on Net Assets) | |
| | | | | | | | | | | | |
| Asset-Backed Securities | | | | | Par
(000) | | | Value | |
Italy (concluded) | | | | | | | | | | | | |
Colombo Srl, Series 2014-1, Class B
0.65%, 8/28/26 (b) | | | EUR | | | | 5,871 | | | $ | 6,526,146 | |
| | | | | | | | | | | | |
| | | | | | | | | | | | 46,187,784 | |
Netherlands — 1.0% | | | | | | | | | | | | |
Jubilee CDO VIII BV: | | | | | | | | | | | | |
Series 2014-11X, Class A,
1.83%, 4/15/27 (b) | | | | | | | 18,830 | | | | 21,278,533 | |
Series VIII-X, Class SUB,
5.17%, 1/15/24 (b) | | | | | | | 11,440 | | | | 5,683,204 | |
North Westerly CLO IV BV: | | | | | | | | | | | | |
Series 2014-IV-X, Class A-1,
0.00%, 1/15/26 (b) | | | | | | | 6,166 | | | | 5,597,385 | |
Series 2014-IV-X, Class A-1,
1.62%, 1/15/26 (b) | | | | | | | 25,100 | | | | 28,332,656 | |
| | | | | | | | | | | | |
| | | | | | | | | | | | 60,891,778 | |
Portugal — 0.5% | | | | | | | | | | | | |
TAGUS-Sociedade de Titularizacao de Creditos SA/Volta II Electricity Receivables, Series 2, Class SNR, 2.98%, 2/16/18 | | | | | | | 24,478 | | | | 27,808,863 | |
United Kingdom — 0.1% | | | | | | | | | | | | |
Ludgate Funding PLC, Series 2007-1, Class A1A, 0.00%, 1/01/61 | | | GBP | | | | 1,190 | | | | 6,040,338 | |
United States — 1.6% | | | | | | | | | | | | |
Carlyle Global Market Strategies CLO Ltd., Series 2012-4A, Class D, 4.73%, 1/20/25 (a)(b) | | | USD | | | | 726 | | | | 723,979 | |
Commercial Mortgage Pass Through Certificates, Series 2014-KYO, Class F,
3.66%, 6/11/27 (a)(b) | | | | | | | 21,235 | | | | 21,129,802 | |
Countrywide Asset-Backed Certificates, Series 2006-BC5, Class 2A3, 0.34%, 3/25/37 (b) | | | | | | | 9,318 | | | | 8,775,387 | |
Credit Acceptance Auto Loan Trust: | | | | | | | | | | | | |
Series 2015-1A, Class B, 2.61%, 1/17/23 (a) | | | | | | | 4,240 | | | | 4,253,636 | |
Series 2015-1A, Class C, 3.30%, 7/17/23 (a) | | | | | | | 1,500 | | | | 1,505,509 | |
Series 2014-2A, Class B, 2.67%, 9/15/22 (a) | | | | | | | 2,000 | | | | 2,001,000 | |
DCP Rights LLC, Series 2014-1A, Class A,
5.46%, 10/25/44 (a) | | | | | | | 4,730 | | | | 4,827,926 | |
Navient Private Education Loan Trust: | | | | | | | | | | | | |
Series 2015-AA, Class A3,
1.86%, 11/15/30 (a)(b) | | | | | | | 4,705 | | | | 4,704,751 | |
Series 2015-AA, Class B,
3.50%, 12/15/44 (a) | | | | | | | 1,400 | | | | 1,340,709 | |
Series 2014-CTA, Class A,
0.87%, 9/16/24 (a)(b) | | | | | | | 1,207 | | | | 1,204,195 | |
Series 2014-CTA, Class B,
1.92%, 10/17/44 (a)(b) | | | | | | | 1,500 | | | | 1,481,100 | |
OneMain Financial Issuance Trust: | | | | | | | | | | | | |
Series 2015-1A, Class A, 3.19%, 3/18/26 (a) | | | | | | | 4,710 | | | | 4,708,503 | |
Series 2015-1A, Class B, 3.85%, 3/18/26 (a) | | | | | | | 4,710 | | | | 4,708,883 | |
Series 2014-1A, Class A, 2.43%, 6/18/24 (a) | | | | | | | 6,590 | | | | 6,645,567 | |
Series 2014-2A, Class A, 2.47%, 9/18/24 (a) | | | | | | | 4,000 | | | | 4,003,120 | |
Series 2014-2A, Class B, 3.02%, 9/18/24 (a) | | | | | | | 1,000 | | | | 997,030 | |
Pinnacle Park CLO Ltd., Series 2014-1A, Class D, 3.75%, 4/15/26 (a)(b) | | | | | | | 1,550 | | | | 1,455,396 | |
| | | | | | | | | | | | |
| Asset-Backed Securities | | | | | Par (000) | | | Value | |
United States (concluded) | | | | | | | | | | | | |
Santander Drive Auto Receivables Trust: | | | | | | | | | | | | |
Series 2014-3, Class C,
2.13%, 8/17/20 | | | USD | | | | 1,500 | | | $ | 1,503,366 | |
Series 2014-3, Class D,
2.65%, 8/17/20 | | | | | | | 5,000 | | | | 4,987,085 | |
Series 2014-4, Class D,
3.10%, 11/16/20 | | | | | | | 1,250 | | | | 1,262,877 | |
SLM Private Education Loan Trust: | | | | | | | | | | | | |
Series 2011-B, Class A3,
2.42%, 6/16/42 (a)(b) | | | | | | | 9,870 | | | | 10,439,035 | |
Series 2013-B, Class B,
3.00%, 5/16/44 (a) | | | | | | | 5,640 | | | | 5,596,414 | |
| | | | | | | | | | | | |
| | | | | | | | | | | | 98,255,270 | |
Total Asset-Backed Securities — 9.8% | | | | | | | | | | | 581,561,479 | |
| | | | | | | | | | | | |
| Common Stocks | | | | | Shares | | | | |
Canada — 0.0% | | | | | | | | | | | | |
Amaya, Inc. (c) | | | | | | | 15,000 | | | | 388,605 | |
France — 0.0% | | | | | | | | | | | | |
Société Générale SA | | | | | | | 73,037 | | | | 2,957,513 | |
Germany — 0.4% | | | | | | | | | | | | |
Commerzbank AG (c) | | | | | | | 357,689 | | | | 4,312,671 | |
Volkswagen AG, Preference Shares | | | | | | | 86,289 | | | | 19,335,460 | |
| | | | | | | | | | | | |
| | | | | | | | | | | | 23,648,131 | |
Greece — 0.1% | | | | | | | | | | | | |
Hellenic Telecommunications Organization SA (c) | | | | | | | 534,072 | | | | 4,417,609 | |
National Bank of Greece SA (c) | | | | | | | 1,038,215 | | | | 1,085,189 | |
| | | | | | | | | | | | |
| | | | | | | | | | | | 5,502,798 | |
Luxembourg — 0.0% | | | | | | | | | | | | |
Concrete Investment II SCA (c) | | | | | | | 21,824 | | | | 3,329,235 | |
Concrete Investment II SCA-Stapled (c) | | | | | | | 21,824 | | | | — | |
| | | | | | | | | | | | |
| | | | | | | | | | | | 3,329,235 | |
Netherlands — 0.1% | | | | | | | | | | | | |
NXP Semiconductor NV (c) | | | | | | | 59,600 | | | | 4,728,664 | |
Spain — 0.2% | | | | | | | | | | | | |
Abengoa Yield PLC | | | | | | | 193,578 | | | | 6,372,588 | |
CaixaBank SA | | | | | | | 969,927 | | | | 4,234,991 | |
| | | | | | | | | | | | |
| | | | | | | | | | | | 10,607,579 | |
United Kingdom — 0.3% | | | | | | | | | | | | |
Barclays PLC | | | | | | | 4,400,865 | | | | 15,520,889 | |
United States — 0.7% | | | | | | | | | | | | |
The ADT Corp. | | | | | | | 108,850 | | | | 3,744,440 | |
Apple, Inc. | | | | | | | 95,280 | | | | 11,163,005 | |
eBay, Inc. (c) | | | | | | | 248,675 | | | | 13,179,775 | |
EMC Corp. | | | | | | | 193,728 | | | | 5,023,367 | |
Freescale Semiconductor Ltd. (c) | | | | | | | 104,950 | | | | 3,367,846 | |
Oracle Corp. | | | | | | | 70,050 | | | | 2,934,395 | |
Vantage Drilling Co. (c) | | | | | | | 596,570 | | | | 232,662 | |
The Western Union Co. | | | | | | | 144,378 | | | | 2,454,426 | |
| | | | | | | | | | | | |
| | | | | | | | | | | | 42,099,916 | |
Total Common Stocks — 1.8% | | | | | | | | | | | 108,783,330 | |
See Notes to Financial Statements.
| | | | | | |
| | | BLACKROCK FUNDS | | JANUARY 31, 2015 | | 19 |
| | | | |
| Schedule of Investments (continued) | | | BlackRock Global Long/Short Credit Fund | |
| | | (Percentages shown are based on Net Assets) | |
| | | | | | | | | | | | |
| Corporate Bonds | | | | | Par
(000) | | | Value | |
Australia — 0.4% | | | | | | | | | | | | |
QBE Insurance Group Ltd., 6.75%, 12/02/44 (b) | | | USD | | | | 1,000 | | | $ | 1,031,100 | |
Virgin Australia Trust: | | | | | | | | | | | | |
Series 2013-1, Class B, 6.00%, 4/23/22 (a) | | | | | | | 4,143 | | | | 4,277,510 | |
Series 2013-1, Class C, 7.13%, 10/23/18 (a) | | | | | | | 9,335 | | | | 9,428,538 | |
Series 2013-1, Class D, 8.50%, 10/23/16 (a) | | | | | | | 7,882 | | | | 7,961,291 | |
Westpac Banking Corp., 2.25%, 7/30/18 | | | | | | | 682 | | | | 697,157 | |
| | | | | | | | | | | | |
| | | | | | | | | | | | 23,395,596 | |
Barbados — 0.1% | | | | | | | | | | | | |
Columbus International, Inc., 7.38%, 3/30/21 (a) | | | | | | | 7,265 | | | | 7,473,869 | |
Brazil — 0.5% | | | | | | | | | | | | |
Petrobras Global Finance BV: | | | | | | | | | | | | |
4.88%, 3/17/20 | | | | | | | 4,050 | | | | 3,574,125 | |
5.38%, 10/01/29 | | | GBP | | | | 2,405 | | | | 2,792,854 | |
6.63%, 1/16/34 | | | | | | | 6,460 | | | | 8,089,831 | |
7.25%, 3/17/44 | | | USD | | | | 14,735 | | | | 12,708,790 | |
| | | | | | | | | | | | |
| | | | | | | | | | | | 27,165,600 | |
Canada — 0.8% | | | | | | | | | | | | |
Air Canada, 6.75%, 10/01/19 (a) | | | | | | | 8,000 | | | | 8,490,000 | |
Air Canada Pass-Through Trust: | | | | | | | | | | | | |
Series 2013-1, Class B, 5.38%, 11/15/22 (a) | | | | | | | 1,846 | | | | 1,910,971 | |
Series 2013-1, Class C, 6.63%, 5/15/18 (a) | | | | | | | 3,045 | | | | 3,122,343 | |
Barrick Gold Corp., 4.10%, 5/01/23 | | | | | | | 14,202 | | | | 14,196,802 | |
Canadian Natural Resources Ltd., 3.90%, 2/01/25 | | | | | | | 9,580 | | | | 9,486,499 | |
New Red Finance, Inc., 6.00%, 4/01/22 (a) | | | | | | | 8,490 | | | | 8,702,250 | |
NOVA Chemicals Corp., 5.00%, 5/01/25 (a) | | | | | | | 2,160 | | | | 2,241,000 | |
| | | | | | | | | | | | |
| | | | | | | | | | | | 48,149,865 | |
Chile — 0.0% | | | | | | | | | | | | |
VTR Finance BV, 6.88%, 1/15/24 (a) | | | | | | | 1,196 | | | | 1,199,050 | |
China — 0.4% | | | | | | | | | | | | |
Alibaba Group Holding Ltd., 4.50%, 11/28/34 | | | | | | | 2,200 | | | | 2,316,037 | |
CDBL Funding 1, 4.25%, 12/02/24 | | | | | | | 4,350 | | | | 4,338,316 | |
China Shenhua Overseas Capital Co. Ltd.: | | | | | | | | | | | | |
3.13%, 1/20/20 | | | | | | | 3,000 | | | | 3,026,400 | |
3.88%, 1/20/25 | | | | | | | 1,500 | | | | 1,515,313 | |
CITIC Ltd., 6.80%, 1/17/23 | | | | | | | 1,500 | | | | 1,780,050 | |
Eastern Creation II Investment Holdings Ltd.,
3.60%, 1/20/20 | | | | | | | 3,650 | | | | 3,629,889 | |
Huarong Finance II Co. Ltd., 5.69%, 1/16/25 | | | | | | | 2,500 | | | | 2,612,818 | |
Jingneng Clean Energy Investment Holdings Ltd., 4.30%, 12/23/17 | | | CNH | | | | 6,000 | | | | 947,750 | |
Shui ON Development Holding Lt, 9.00%, 11/17/17 | | | USD | | | | 1,000 | | | | 991,795 | |
| | | | | | | | | | | | |
| | | | | | | | | | | | 21,158,368 | |
Czech Republic — 0.1% | | | | | | | | | | | | |
CE Energy AS, 7.00%, 2/01/21 | | | EUR | | | | 5,565 | | | | 6,374,886 | |
RPG BYTY SRO, 6.75%, 5/01/20 | | | | | | | 952 | | | | 1,102,068 | |
| | | | | | | | | | | | |
| | | | | | | | | | | | 7,476,954 | |
Finland — 0.1% | | | | | | | | | | | | |
Citycon Oyj, 3.75%, 6/24/20 | | | | | | | 6,380 | | | | 8,096,175 | |
France — 2.8% | | | | | | | | | | | | |
3AB Optique Developement SAS, 5.63%, 4/15/19 | | | | | | | 6,360 | | | | 6,216,552 | |
| | | | | | | | | | | | |
| Corporate Bonds | | | | | Par
(000) | | | Value | |
France (concluded) | | | | | | | | | | | | |
Alcatel-Lucent USA, Inc.: | | | | | | | | | | | | |
4.63%, 7/01/17 (a) | | | USD | | | | 2,790 | | | $ | 2,835,337 | |
6.75%, 11/15/20 (a) | | | | | | | 5,790 | | | | 6,007,125 | |
AXA SA, 3.88% (b)(d) | | | EUR | | | | 10,525 | | | | 12,606,856 | |
BNP Paribas Cardif SA, 4.03% (b)(d) | | | | | | | 14,000 | | | | 16,445,808 | |
BNP Paribas SA, 2.63%, 10/14/27 | | | | | | | 20,775 | | | | 24,056,706 | |
Credit Agricole SA, 3.88%, 4/15/24 (a) | | | USD | | | | 19,025 | | | | 20,561,098 | |
Kerneos Corporate SAS: | | | | | | | | | | | | |
4.83%, 3/01/21 (b) | | | EUR | | | | 2,336 | | | | 2,618,339 | |
5.75%, 3/01/21 | | | | | | | 3,048 | | | | 3,581,992 | |
Lion/Seneca France 2, 7.88%, 4/15/19 | | | | | | | 9,210 | | | | 8,117,655 | |
Numericable SFR SAS: | | | | | | | | | | | | |
4.88%, 5/15/19 (a) | | | USD | | | | 7,500 | | | | 7,500,000 | |
5.38%, 5/15/22 | | | EUR | | | | 16,118 | | | | 19,260,515 | |
5.63%, 5/15/24 | | | | | | | 11,802 | | | | 14,132,100 | |
6.25%, 5/15/24 (a) | | | USD | | | | 4,305 | | | | 4,455,675 | |
SGD Group SAS, 5.63%, 5/15/19 | | | EUR | | | | 7,974 | | | | 8,780,807 | |
THOM Europe SAS, 7.38%, 7/15/19 | | | | | | | 6,470 | | | | 7,201,399 | |
| | | | | | | | | | | | |
| | | | | | | | | | | | 164,377,964 | |
Germany — 4.5% | | | | | | | | | | | | |
Bayerische Landesbank, 0.89%, 2/07/19 (b) | | | | | | | 3,950 | | | | 4,162,194 | |
Commerzbank AG: | | | | | | | | | | | | |
7.75%, 3/16/21 | | | | | | | 21,400 | | | | 30,092,444 | |
8.13%, 9/19/23 (a) | | | USD | | | | 7,614 | | | | 9,079,695 | |
Deutsche Raststaetten Gruppe IV GmbH,
6.75%, 12/30/20 | | | | | | | 2,787 | | | | 3,385,492 | |
FTE Verwaltungs GmbH, 9.00%, 7/15/20 | | | EUR | | | | 4,980 | | | | 5,723,488 | |
HSH Nordbank AG: | | | | | | | | | | | | |
0.88%, 2/14/17 (b) | | | | | | | 19,143 | | | | 17,845,976 | |
0.92%, 2/14/17 (b) | | | | | | | 16,875 | | | | 15,779,315 | |
Mahle GmbH, 2.50%, 5/14/21 | | | | | | | 5,700 | | | | 6,648,098 | |
Pfleiderer GmbH, 7.88%, 8/01/19 | | | | | | | 4,818 | | | | 5,141,066 | |
Schaeffler Holding Finance BV: | | | | | | | | | | | | |
6.25% (6.25% Cash or 6.50% PIK), 11/15/19 (a)(e) | | | USD | | | | 3,202 | | | | 3,354,095 | |
6.75% (6.75% Cash or 7.00% PIK), 11/15/22 (a)(e) | | | | | | | 4,069 | | | | 4,353,830 | |
Trionista Holdco GmbH, 5.00%, 4/30/20 | | | EUR | | | | 1,688 | | | | 1,982,488 | |
Unitymedia Hessen GmbH & Co. KG/Unitymedia NRW GmbH: | | | | | | | | | | | | |
5.13%, 1/21/23 | | | | | | | 1,020 | | | | 1,239,039 | |
5.63%, 4/15/23 | | | | | | | 2,526 | | | | 3,113,942 | |
4.00%, 1/15/25 | | | | | | | 18,948 | | | | 22,117,919 | |
6.25%, 1/15/29 | | | | | | | 4,489 | | | | 5,750,999 | |
Volkswagen International Finance NV: | | | | | | | | | | | | |
5.50%, 11/09/15 (f) | | | | | | | 69,300 | | | | 93,993,842 | |
5.50%, 11/09/15 (a)(f) | | | | | | | 4,200 | | | | 5,547,098 | |
1.63%, 1/16/30 | | | | | | | 10,650 | | | | 12,471,894 | |
Xefin Lux SCA, 3.83%, 6/01/19 (b) | | | | | | | 12,605 | | | | 14,300,556 | |
| | | | | | | | | | | | |
| | | | | | | | | | | | 266,083,470 | |
Greece — 0.0% | | | | | | | | | | | | |
Intralot Capital Luxembourg SA, 6.00%, 5/15/21 | | | | | | | 1,690 | | | | 1,604,140 | |
Guernsey — 0.1% | | | | | | | | | | | | |
Doric Nimrod Air Alpha Pass-Through Trust, Series 2013-1, Class A, 5.25%, 5/30/23 (a) | | | USD | | | | 3,972 | | | | 4,150,401 | |
Hong Kong — 0.2% | | | | | | | | | | | | |
CNPC General Capital Ltd., 1.95%, 11/25/17 | | | | | | | 1,650 | | | | 1,639,037 | |
Double Rosy Ltd., 3.63%, 11/18/19 | | | | | | | 4,100 | | | | 4,100,000 | |
Haitong International Finance 2015,
4.64%, 7/22/20 | | | | | | | 1,500 | | | | 1,506,858 | |
King Power Capital Ltd., 5.63%, 11/03/24 | | | | | | | 1,200 | | | | 1,280,340 | |
See Notes to Financial Statements.
| | | | | | |
| 20 | | BLACKROCK FUNDS | | JANUARY 31, 2015 | | |
| | | | |
| Schedule of Investments (continued) | | | BlackRock Global Long/Short Credit Fund | |
| | | (Percentages shown are based on Net Assets) | |
| | | | | | | | | | | | |
| Corporate Bonds | | | | | Par
(000) | | | Value | |
Hong Kong (concluded) | | | | | | | | | | | | |
Noble Group Ltd., 6.75%, 1/29/20 | | | USD | | | | 550 | | | $ | 594,000 | |
| | | | | | | | | | | | |
| | | | | | | | | | | | 9,120,235 | |
India — 0.2% | | | | | | | | | | | | |
Delhi International Airport (P), 6.50%, 2/03/22 | | | | | | | 1,050 | | | | 1,077,563 | |
GCX Ltd., 7.00%, 8/01/19 | | | | | | | 1,500 | | | | 1,530,096 | |
JSW Steel Ltd., 4.88%, 11/12/19 | | | | | | | 1,500 | | | | 1,455,750 | |
Samvardhana Motherson Automotive Systems Group BV, 4.13%, 7/15/21 | | | EUR | | | | 6,574 | | | | 7,332,681 | |
Tata Motors Ltd., 4.63%, 4/30/20 | | | USD | | | | 1,800 | | | | 1,872,000 | |
| | | | | | | | | | | | |
| | | | | | | | | | | | 13,268,090 | |
Indonesia — 0.0% | | | | | | | | | | | | |
Pertamina Persero PT: | | | | | | | | | | | | |
6.00%, 5/03/42 | | | | | | | 600 | | | | 613,500 | |
6.45%, 5/30/44 | | | | | | | 400 | | | | 437,000 | |
| | | | | | | | | | | | |
| | | | | | | | | | | | 1,050,500 | |
Ireland — 2.2% | | | | | | | | | | | | |
Allied Irish Banks PLC, 2.75%, 4/16/19 | | | EUR | | | | 22,205 | | | | 26,668,733 | |
Ardagh Packaging Finance PLC/Ardagh Holdings USA, Inc., 4.25%, 1/15/22 | | | | | | | 8,159 | | | | 9,173,528 | |
Bank of Ireland: | | | | | | | | | | | | |
3.25%, 1/15/19 | | | | | | | 32,528 | | | | 39,653,534 | |
4.25%, 6/11/24 (b) | | | | | | | 35,242 | | | | 40,487,043 | |
DEPFA Bank PLC, 0.78%, 12/15/15 (b) | | | | | | | 13,960 | | | | 15,380,356 | |
| | | | | | | | | | | | |
| | | | | | | | | | | | 131,363,194 | |
Italy — 6.9% | | | | | | | | | | | | |
A2A SpA, 4.38%, 1/10/21 | | | | | | | 3,000 | | | | 3,982,265 | |
Astaldi SpA, 7.13%, 12/01/20 | | | | | | | 7,757 | | | | 9,181,723 | |
Banca Monte dei Paschi di Siena SpA: | | | | | | | | | | | | |
2.88%, 4/16/21 | | | | | | | 19,675 | | | | 24,413,688 | |
2.88%, 7/16/24 | | | | | | | 16,600 | | | | 20,629,706 | |
Banco Popolare SC, 3.50%, 3/14/19 | | | | | | | 13,724 | | | | 16,500,871 | |
Buzzi Unicem SpA, 1.38%, 7/17/19 (f) | | | | | | | 3,800 | | | | 4,545,177 | |
FGA Capital Ireland PLC, 2.63%, 4/17/19 | | | | | | | 6,950 | | | | 8,292,926 | |
Intesa Sanpaolo SpA: | | | | | | | | | | | | |
3.50%, 1/17/22 | | | | | | | 10,630 | | | | 13,750,052 | |
6.63%, 9/13/23 | | | | | | | 11,995 | | | | 17,090,801 | |
3.93%, 9/15/26 | | | | | | | 8,990 | | | | 10,827,121 | |
IVS F. SpA, 7.13%, 4/01/20 | | | | | | | 854 | | | | 1,008,441 | |
Meccanica Holdings USA, Inc.: | | | | | | | | | | | | |
6.25%, 7/15/19 (a) | | | USD | | | | 2,205 | | | | 2,414,475 | |
7.38%, 7/15/39 (a) | | | | | | | 6,850 | | | | 7,295,250 | |
6.25%, 1/15/40 (a) | | | | | | | 9,890 | | | | 9,642,750 | |
Mediobanca SpA, 2.25%, 3/18/19 | | | EUR | | | | 14,625 | | | | 17,317,824 | |
Snai SpA, 7.63%, 6/15/18 | | | | | | | 2,475 | | | | 2,867,214 | |
Telecom Italia Capital SA: | | | | | | | | | | | | |
6.38%, 11/15/33 | | | USD | | | | 6,733 | | | | 7,136,980 | |
6.00%, 9/30/34 | | | | | | | 5,657 | | | | 5,812,567 | |
7.72%, 6/04/38 | | | | | | | 3,875 | | | | 4,456,250 | |
Telecom Italia Finance SA: | | | | | | | | | | | | |
6.13%, 11/15/16 (f) | | | EUR | | | | 33,600 | | | | 50,857,892 | |
7.75%, 1/24/33 | | | | | | | 13,060 | | | | 20,925,087 | |
Telecom Italia SpA: | | | | | | | | | | | | |
4.50%, 1/25/21 | | | | | | | 14,755 | | | | 18,577,118 | |
5.88%, 5/19/23 | | | GBP | | | | 5,650 | | | | 9,601,480 | |
UniCredit SpA: | | | | | | | | | | | | |
3.25%, 1/14/21 | | | EUR | | | | 22,694 | | | | 28,403,402 | |
6.95%, 10/31/22 | | | | | | | 2,920 | | | | 3,950,279 | |
5.75%, 10/28/25 (b) | | | | | | | 39,720 | | | | 49,035,277 | |
Unione di Banche Italiane SCpA,
2.88%, 2/18/19 | | | | | | | 15,000 | | | | 18,127,345 | |
| | | | | | | | | | | | |
| Corporate Bonds | | | | | Par
(000) | | | Value | |
Italy (concluded) | | | | | | | | | | | | |
Wind Acquisition Finance SA: | | | | | | | | | | | | |
4.00%, 7/15/20 | | | EUR | | | | 17,261 | | | $ | 19,311,738 | |
4.07%, 7/15/20 (b) | | | | | | | 6,740 | | | | 7,426,369 | |
| | | | | | | | | | | | |
| | | | | | | | | | | | 413,382,068 | |
Jamaica — 0.0% | | | | | | | | | | | | |
Digicel Ltd., 6.00%, 4/15/21 (a) | | | USD | | | | 2,735 | | | | 2,564,063 | |
Luxembourg — 1.5% | | | | | | | | | | | | |
Aguila 3 SA, 7.88%, 1/31/18 (a) | | | | | | | 2,233 | | | | 2,199,505 | |
Altice Financing SA: | | | | | | | | | | | | |
6.50%, 1/15/22 (a) | | | | | | | 3,975 | | | | 4,054,500 | |
5.25%, 2/15/23 | | | EUR | | | | 2,575 | | | | 2,909,736 | |
6.63%, 2/15/23 (a) | | | USD | | | | 2,879 | | | | 2,879,000 | |
Altice Finco SA, 7.63%, 2/15/25 (a) | | | | | | | 1,872 | | | | 1,890,720 | |
Altice SA: | | | | | | | | | | | | |
7.25%, 5/15/22 | | | EUR | | | | 22,580 | | | | 26,854,830 | |
7.75%, 5/15/22 (a) | | | USD | | | | 4,405 | | | | 4,559,175 | |
6.25%, 2/15/25 | | | EUR | | | | 8,705 | | | | 9,836,603 | |
7.63%, 2/15/25 (a) | | | USD | | | | 2,582 | | | | 2,620,730 | |
Aperam SA, 0.63%, 7/08/21 (f) | | | | | | | 11,600 | | | | 11,107,000 | |
Bilbao Luxembourg SA, 10.50% (10.50% Cash or 11.25% PIK), 12/01/18 (e) | | | EUR | | | | 5,149 | | | | 6,036,273 | |
Intralot Finance Luxembourg SA, 9.75%, 8/15/18 | | | | | | | 8,770 | | | | 9,994,288 | |
Servus Luxembourg Holding SCA, 7.75%, 6/15/18 | | | | | | | 1,092 | | | | 1,301,796 | |
Telenet Finance V Luxembourg SCA,
6.25%, 8/15/22 | | | | | | | 957 | | | | 1,168,058 | |
| | | | | | | | | | | | |
| | | | | | | | | | | | 87,412,214 | |
Mexico — 0.6% | | | | | | | | | | | | |
Cemex Finance LLC, 5.25%, 4/01/21 | | | | | | | 16,502 | | | | 19,299,821 | |
Cemex SAB de CV: | | | | | | | | | | | | |
4.75%, 1/11/22 | | | | | | | 10,795 | | | | 12,320,274 | |
5.70%, 1/11/25 (a) | | | USD | | | | 6,705 | | | | 6,185,363 | |
| | | | | | | | | | | | |
| | | | | | | | | | | | 37,805,458 | |
Netherlands — 1.1% | | | | | | | | | | | | |
Achmea BV, 6.00%, 4/04/43 (b) | | | EUR | | | | 3,612 | | | | 4,776,031 | |
Atrium European Real Estate Ltd., 4.00%, 4/20/20 | | | | | | | 3,570 | | | | 4,326,406 | |
Constellium NV, 8.00%, 1/15/23 (a) | | | USD | | | | 4,020 | | | | 3,989,850 | |
Hema Bondco I BV: | | | | | | | | | | | | |
5.33%, 6/15/19 (b) | | | EUR | | | | 9,855 | | | | 8,750,745 | |
6.25%, 6/15/19 | | | | | | | 3,788 | | | | 3,520,645 | |
Hema Bondco II BV, 8.50%, 12/15/19 | | | | | | | 692 | | | | 449,625 | |
NXP BV/NXP Funding LLC: | | | | | | | | | | | | |
3.75%, 6/01/18 (a) | | | USD | | | | 12,510 | | | | 12,510,000 | |
5.75%, 2/15/21 (a) | | | | | | | 3,300 | | | | 3,473,250 | |
NXP Semiconductors NV, 1.00%, 12/01/19 (a) | | | | | | | 10,200 | | | | 10,952,250 | |
TMF Group Holding BV, 9.88%, 12/01/19 | | | EUR | | | | 2,250 | | | | 2,637,831 | |
Ziggo Bonds Finance BV, 4.63%, 1/15/25 | | | | | | | 7,391 | | | | 8,497,946 | |
| | | | | | | | | | | | |
| | | | | | | | | | | | 63,884,579 | |
Poland — 0.1% | | | | | | | | | | | | |
Play Finance 1 SA, 6.50%, 8/01/19 | | | | | | | 5,065 | | | | 6,088,863 | |
Portugal — 1.2% | | | | | | | | | | | | |
Banco Espirito Santo SA: | | | | | | | | | | | | |
2.63%, 5/08/17 | | | | | | | 6,100 | | | | 6,691,417 | |
4.75%, 1/15/18 | | | | | | | 18,300 | | | | 21,087,847 | |
4.00%, 1/21/19 | | | | | | | 16,200 | | | | 18,444,470 | |
Galp Energia SGPS SA: | | | | | | | | | | | | |
4.13%, 1/25/19 | | | | | | | 9,500 | | | | 11,331,028 | |
See Notes to Financial Statements.
| | | | | | |
| | | BLACKROCK FUNDS | | JANUARY 31, 2015 | | 21 |
| | | | |
| Schedule of Investments (continued) | | | BlackRock Global Long/Short Credit Fund | |
| | | (Percentages shown are based on Net Assets) | |
| | | | | | | | | | | | |
| Corporate Bonds | | | | | Par
(000) | | | Value | |
Portugal (concluded) | | | | | | | | | | | | |
3.00%, 1/14/21 | | | EUR | | | | 12,800 | | | $ | 14,731,513 | |
| | | | | | | | | | | | |
| | | | | | | | | | | | 72,286,275 | |
South Korea — 0.0% | | | | | | | | | | | | |
Korea East-West Power Co. Ltd., 2.96%, 6/02/20 | | | USD | | | | 2,500 | | | | 2,540,495 | |
Spain — 4.2% | | | | | | | | | | | | |
Abengoa Finance SAU, 6.00%, 3/31/21 | | | EUR | | | | 13,744 | | | | 14,132,887 | |
Abengoa Yield PLC, 7.00%, 11/15/19 (a) | | | USD | | | | 1,768 | | | | 1,794,520 | |
Aldesa Financial Services SA, 7.25%, 4/01/21 | | | EUR | | | | 2,873 | | | | 2,621,528 | |
AyT Cedulas Cajas Global, 4.00%, 3/24/21 | | | | | | | 4,200 | | | | 5,585,541 | |
Bankia SA: | | | | | | | | | | | | |
3.50%, 1/17/19 | | | | | | | 39,900 | | | | 48,773,304 | |
4.00%, 5/22/24 (b) | | | | | | | 57,600 | | | | 64,128,295 | |
BPE Financiaciones SA: | | | | | | | | | | | | |
2.50%, 2/01/17 | | | | | | | 9,800 | | | | 11,352,124 | |
2.00%, 2/03/20 | | | | | | | 22,300 | | | | 25,382,327 | |
CaixaBank SA: | | | | | | | | | | | | |
4.50%, 11/22/16 (f) | | | | | | | 12,000 | | | | 11,996,474 | |
5.00%, 11/14/23 (b) | | | | | | | 17,700 | | | | 21,664,519 | |
Cirsa Funding Luxembourg SA, 8.75%, 5/15/18 | | | | | | | 6,243 | | | | 7,257,375 | |
PortAventura Entertainment Barcelona BV,
7.25%, 12/01/20 | | | | | | | 9,086 | | | | 10,627,466 | |
Telefonica SA, 6.00%, 7/24/17 (f) | | | | | | | 18,500 | | | | 24,155,612 | |
| | | | | | | | | | | | |
| | | | | | | | | | | | 249,471,972 | |
Switzerland — 0.7% | | | | | | | | | | | | |
Credit Suisse AG, 5.75%, 9/18/25 (b) | | | | | | | 2,950 | | | | 3,833,887 | |
Gategroup Finance Luxembourg SA,
6.75%, 3/01/19 | | | | | | | 4,456 | | | | 5,287,019 | |
Selecta Group BV, 6.50%, 6/15/20 | | | | | | | 334 | | | | 362,246 | |
UBS AG: | | | | | | | | | | | | |
4.75%, 5/22/23 (b) | | | USD | | | | 3,340 | | | | 3,450,307 | |
5.13%, 5/15/24 | | | | | | | 13,800 | | | | 14,141,357 | |
4.75%, 2/12/26 (b) | | | EUR | | | | 11,150 | | | | 13,764,409 | |
| | | | | | | | | | | | |
| | | | | | | | | | | | 40,839,225 | |
United Kingdom — 3.0% | | | | | | | | | | | | |
AA Bond Co. Ltd., 9.50%, 7/31/19 | | | GBP | | | | 2,430 | | | | 4,026,089 | |
Annington Finance No. 4 PLC, 1.53%, 1/10/23 (b) | | | | | | | 845 | | | | 1,260,951 | |
Annington Finance No. 5 PLC, 13.00% (13.00% Cash or 13.50% PIK), 1/15/23 (e) | | | | | | | 6,279 | | | | 11,727,596 | |
Barclays Bank PLC, 7.63%, 11/21/22 | | | USD | | | | 3,169 | | | | 3,535,416 | |
Boparan Finance PLC: | | | | | | | | | | | | |
4.38%, 7/15/21 | | | EUR | | | | 1,201 | | | | 1,163,978 | |
5.50%, 7/15/21 | | | GBP | | | | 500 | | | | 643,150 | |
CNH Industrial Finance Europe SA,
2.75%, 3/18/19 | | | EUR | | | | 9,925 | | | | 11,393,136 | |
Debenhams PLC, 5.25%, 7/15/21 | | | GBP | | | | 1,126 | | | | 1,662,044 | |
Enterprise Funding Ltd., 3.50%, 9/10/20 (f) | | | | | | | 4,600 | | | | 6,309,274 | |
House of Fraser Funding PLC, 8.88%, 8/15/18 | | | | | | | 1,189 | | | | 1,889,377 | |
IDH Finance PLC, 6.00%, 12/01/18 | | | | | | | 4,790 | | | | 7,265,230 | |
International Consolidated Airlines Group SA, 1.75%, 5/31/18 (f) | | | EUR | | | | 9,100 | | | | 17,837,834 | |
Jaguar Land Rover Automotive PLC,
8.25%, 3/15/20 | | | GBP | | | | 3,520 | | | | 5,858,507 | |
Marks & Spencer PLC, 4.75%, 6/12/25 | | | | | | | 1,060 | | | | 1,825,560 | |
Pension Insurance Corp. PLC, 6.50%, 7/03/24 | | | | | | | 2,925 | | | | 4,661,951 | |
Priory Group No. 3 PLC, 7.00%, 2/15/18 | | | | | | | 1,374 | | | | 2,141,622 | |
Punch Taverns Finance B Ltd.: | �� | | | | | | | | | | | |
Series A3, 7.37%, 9/30/21 | | | | | | | 946 | | | | 1,510,246 | |
Series A6, 5.94%, 9/30/22 | | | | | | | 3,963 | | | | 5,909,403 | |
Punch Taverns Finance PLC: | | | | | | | | | | | | |
0.56%, 7/15/21 (b) | | | | | | | 11,125 | | | | 15,080,390 | |
6.06%, 10/15/27 (a)(b) | | | | | | | 10,514 | | | | 15,044,532 | |
| | | | | | | | | | | | |
| Corporate Bonds | | | | | Par
(000) | | | Value | |
United Kingdom (concluded) | | | | | | | | | | | | |
Silk Bidco AS, 7.50%, 2/01/22 | | | EUR | | | | 5,730 | | | $ | 6,474,869 | |
The Unique Pub Finance Co. PLC: | | | | | | | | | | | | |
6.54%, 3/30/21 | | | GBP | | | | 3,373 | | | | 5,181,611 | |
7.40%, 3/28/24 | | | | | | | 3,366 | | | | 5,171,338 | |
5.66%, 6/30/27 | | | | | | | 10,648 | | | | 15,838,271 | |
Virgin Media Secured Finance PLC,
6.00%, 4/15/21 | | | | | | | 2,732 | | | | 4,341,277 | |
Vougeot Bidco PLC, 7.88%, 7/15/20 | | | | | | | 6,659 | | | | 10,531,317 | |
Voyage Care BondCo PLC: | | | | | | | | | | | | |
6.50%, 8/01/18 | | | | | | | 1,126 | | | | 1,734,148 | |
11.00%, 2/01/19 | | | | | | | 5,000 | | | | 8,058,202 | |
| | | | | | | | | | | | |
| | | | | | | | | | | | 178,077,319 | |
United States — 23.1% | | | | | | | | | | | | |
Actavis Funding SCS: | | | | | | | | | | | | |
3.85%, 6/15/24 | | | USD | | | | 17,150 | | | | 17,561,651 | |
4.85%, 6/15/44 | | | | | | | 1,681 | | | | 1,754,413 | |
Actavis, Inc., 3.25%, 10/01/22 | | | | | | | 8,850 | | | | 8,790,670 | |
The ADT Corp.: | | | | | | | | | | | | |
2.25%, 7/15/17 | | | | | | | 1,050 | | | | 1,019,025 | |
4.13%, 4/15/19 | | | | | | | 1,568 | | | | 1,566,040 | |
5.25%, 3/15/20 | | | | | | | 4,954 | | | | 5,028,310 | |
Advanced Micro Devices, Inc., 6.75%, 3/01/19 | | | | | | | 1,750 | | | | 1,662,500 | |
AECOM: | | | | | | | | | | | | |
5.75%, 10/15/22 (a) | | | | | | | 3,942 | | | | 4,124,317 | |
5.88%, 10/15/24 (a) | | | | | | | 2,475 | | | | 2,583,281 | |
Ally Financial, Inc.: | | | | | | | | | | | | |
3.75%, 11/18/19 | | | | | | | 5,000 | | | | 4,962,500 | |
5.13%, 9/30/24 | | | | | | | 5,925 | | | | 6,139,781 | |
8.00%, 11/01/31 | | | | | | | 2,441 | | | | 3,151,941 | |
American Airlines Pass-Through Trust: | | | | | | | | | | | | |
Series 2001-1, Class A-1,
6.98%, 5/23/21 | | | | | | | 13,358 | | | | 14,026,387 | |
Series 2011-1, Class B,
7.00%, 1/31/18 (a) | | | | | | | 3,713 | | | | 3,963,687 | |
Series 2013-1, Class C,
6.13%, 7/15/18 (a) | | | | | | | 12,304 | | | | 12,734,640 | |
Series 2013-2, Class C,
6.00%, 1/15/17 (a) | | | | | | | 33,510 | | | | 34,012,650 | |
American Capital Ltd., 6.50%, 9/15/18 (a) | | | | | | | 10,775 | | | | 11,246,406 | |
AmSurg Corp., 5.63%, 7/15/22 (a) | | | | | | | 8,133 | | | | 8,407,489 | |
Anadarko Petroleum Corp., 0.00%, 10/10/36 (g) | | | | | | | 41,630 | | | | 16,287,737 | |
Anixter, Inc., 5.13%, 10/01/21 | | | | | | | 10,000 | | | | 10,237,500 | |
Antero Resources Corp., 5.13%, 12/01/22 (a) | | | | | | | 4,750 | | | | 4,548,125 | |
AT&T, Inc., 0.00%, 11/27/22 (a)(g) | | | | | | | 50,000 | | | | 40,591,800 | |
Bank of America Corp., 3.30%, 1/11/23 | | | | | | | 40,000 | | | | 40,871,080 | |
Belden, Inc., 5.50%, 4/15/23 | | | EUR | | | | 6,240 | | | | 7,377,283 | |
Beverage Packaging Holdings Luxembourg II SA/Beverage Packaging Holdings II IS, 6.00%, 6/15/17 (a) | | | USD | | | | 2,995 | | | | 2,940,701 | |
Blackstone CQP Holdco LP, 9.30%, 3/31/19 | | | | | | | 9,899 | | | | 9,799,527 | |
BMC Software Finance, Inc., 8.13%, 7/15/21 (a) | | | | | | | 1,264 | | | | 1,104,420 | |
Brocade Communications Systems, Inc.,
4.63%, 1/15/23 | | | | | | | 2,100 | | | | 2,063,724 | |
Building Materials Corp. of America,
5.38%, 11/15/24 (a) | | | | | | | 7,590 | | | | 7,703,850 | |
California Resources Corp.: | | | | | | | | | | | | |
5.50%, 9/15/21 (a) | | | | | | | 7,000 | | | | 5,880,000 | |
6.00%, 11/15/24 (a) | | | | | | | 11,778 | | | | 9,584,347 | |
Calpine Corp.: | | | | | | | | | | | | |
5.38%, 1/15/23 | | | | | | | 8,581 | | | | 8,666,810 | |
5.75%, 1/15/25 | | | | | | | 9,078 | | | | 9,259,560 | |
CCOH Safari LLC: | | | | | | | | | | | | |
5.50%, 12/01/22 | | | | | | | 5,941 | | | | 6,022,689 | |
5.75%, 12/01/24 | | | | | | | 8,117 | | | | 8,228,609 | |
See Notes to Financial Statements.
| | | | | | |
| 22 | | BLACKROCK FUNDS | | JANUARY 31, 2015 | | |
| | | | |
| Schedule of Investments (continued) | | | BlackRock Global Long/Short Credit Fund | |
| | | (Percentages shown are based on Net Assets) | |
| | | | | | | | | | | | |
| Corporate Bonds | | | | | Par
(000) | | | Value | |
United States (continued) | | | | | | | | | | | | |
CDK Global, Inc., 4.50%, 10/15/24 (a) | | | USD | | | | 9,000 | | | $ | 9,445,311 | |
CDW LLC/CDW Finance Corp., 5.50%, 12/01/24 | | | | | | | 7,034 | | | | 7,086,755 | |
CIT Group, Inc.: | | | | | | | | | | | | |
5.00%, 5/15/17 | | | | | | | 750 | | | | 772,031 | |
4.25%, 8/15/17 | | | | | | | 2,650 | | | | 2,682,595 | |
Citigroup, Inc., 3.75%, 6/16/24 | | | | | | | 40,000 | | | | 42,133,400 | |
CommScope, Inc.: | | | | | | | | | | | | |
5.00%, 6/15/21 (a) | | | | | | | 1,171 | | | | 1,127,088 | |
5.50%, 6/15/24 (a) | | | | | | | 1,203 | | | | 1,162,399 | |
Concho Resources, Inc., 5.50%, 4/01/23 | | | | | | | 4,060 | | | | 4,060,000 | |
Consol Energy, Inc., 5.88%, 4/15/22 | | | | | | | 3,208 | | | | 2,782,940 | |
Constellation Brands, Inc., 3.88%, 11/15/19 | | | | | | | 2,834 | | | | 2,915,477 | |
Continental Airlines Pass-Through Certificates: | | | | | | | | | | | | |
Series 2012-2, Class A, 4.00%, 4/29/26 | | | | | | | 2,651 | | | | 2,756,930 | |
Series 2012-3, Class C, 6.13%, 4/29/18 | | | | | | | 4,500 | | | | 4,725,000 | |
Continental Resources, Inc., 4.90%, 6/01/44 | | | | | | | 730 | | | | 625,493 | |
Cox Communications, Inc., 3.85%, 2/01/25 (a) | | | | | | | 25,000 | | | | 26,052,175 | |
Dish DBS Corp., 5.88%, 11/15/24 (a) | | | | | | | 4,896 | | | | 4,920,480 | |
DR Horton, Inc., 3.75%, 3/01/19 | | | | | | | 5,175 | | | | 5,155,594 | |
Dynegy Finance I, Inc./Dynegy Finance II, Inc.: | | | | | | | | | | | | |
6.75%, 11/01/19 (a) | | | | | | | 9,980 | | | | 10,254,450 | |
7.38%, 11/01/22 (a) | | | | | | | 9,895 | | | | 10,216,587 | |
Eastman Chemical Co., 4.65%, 10/15/44 | | | | | | | 20,000 | | | | 21,913,620 | |
Endo Finance LLC/Endo Ltd./Endo Finco, Inc., 6.00%, 2/01/25 (a) | | | | | | | 2,278 | | | | 2,327,831 | |
Equinix, Inc.: | | | | | | | | | | | | |
5.38%, 1/01/22 | | | | | | | 6,456 | | | | 6,681,960 | |
5.75%, 1/01/25 | | | | | | | 4,554 | | | | 4,736,160 | |
Fifth Third Bancorp, 5.10% (b)(d) | | | | | | | 20,000 | | | | 18,550,000 | |
Florida East Coast Holdings Corp.,
6.75%, 5/01/19 (a) | | | | | | | 7,000 | | | | 6,912,500 | |
Forest Laboratories, Inc., 5.00%, 12/15/21 (a)(h) | | | | | | | 23,250 | | | | 25,434,779 | |
Freeport-McMoRan, Inc.: | | | | | | | | | | | | |
4.00%, 11/14/21 | | | | | | | 2,883 | | | | 2,725,729 | |
4.55%, 11/14/24 | | | | | | | 18,421 | | | | 16,835,928 | |
Freescale Semiconductor, Inc., 5.00%, 5/15/21 (a) | | | | | | | 4,250 | | | | 4,345,625 | |
Frontier Communications Corp., 6.25%, 9/15/21 | | | | | | | 3,810 | | | | 3,924,300 | |
Gannett Co., Inc.: | | | | | | | | | | | | |
4.88%, 9/15/21 (a) | | | | | | | 5,890 | | | | 5,890,000 | |
5.50%, 9/15/24 (a) | | | | | | | 3,075 | | | | 3,105,750 | |
Gates Global LLC/Gates Global Co., 5.75%, 7/15/22 | | | EUR | | | | 1,500 | | | | 1,545,222 | |
General Motors Co., 5.20%, 4/01/45 | | | USD | | | | 6,300 | | | | 7,028,759 | |
General Motors Financial Co., Inc., 3.15%, 1/15/20 | | | | | | | 4,023 | | | | 4,077,202 | |
Genworth Holdings, Inc.: | | | | | | | | | | | | |
6.52%, 5/22/18 | | | | | | | 13,765 | | | | 13,904,178 | |
7.70%, 6/15/20 | | | | | | | 5,235 | | | | 5,281,790 | |
7.20%, 2/15/21 | | | | | | | 16,908 | | | | 16,315,747 | |
4.90%, 8/15/23 | | | | | | | 3,300 | | | | 2,670,842 | |
The Goldman Sachs Group, Inc.: | | | | | | | | | | | | |
4.00%, 3/03/24 | | | | | | | 40,000 | | | | 42,814,600 | |
3.50%, 1/23/25 | | | | | | | 11,460 | | | | 11,771,592 | |
Greektown Holdings LLC/Greektown Mothership Corp., 8.88%, 3/15/19 (a) | | | | | | | 2,415 | | | | 2,433,113 | |
HCA, Inc.: | | | | | | | | | | | | |
4.25%, 10/15/19 | | | | | | | 10,185 | | | | 10,477,819 | |
5.38%, 2/01/25 | | | | | | | 2,819 | | | | 2,896,523 | |
5.25%, 4/15/25 | | | | | | | 11,685 | | | | 12,736,650 | |
HD Supply, Inc.: | | | | | | | | | | | | |
11.00%, 4/15/20 | | | | | | | 2,620 | | | | 2,986,800 | |
7.50%, 7/15/20 | | | | | | | 1,999 | | | | 2,093,953 | |
5.25%, 12/15/21 (a) | | | | | | | 10,006 | | | | 10,306,180 | |
| | | | | | | | | | | | |
| Corporate Bonds | | | | | Par
(000) | | | Value | |
United States (continued) | | | | | | | | | | | | |
HealthSouth Corp., 5.75%, 11/01/24 | | | USD | | | | 1,281 | | | $ | 1,322,633 | |
Hospira, Inc., 5.20%, 8/12/20 | | | | | | | 7,720 | | | | 8,474,769 | |
Huntington Ingalls Industries, Inc.,
5.00%, 12/15/21 (a) | | | | | | | 5,333 | | | | 5,532,987 | |
Huntsman International LLC, 5.13%, 11/15/22 (a) | | | | | | | 1,425 | | | | 1,421,437 | |
Icahn Enterprises LP/Icahn Enterprises Finance Corp., 5.88%, 2/01/22 | | | | | | | 5,186 | | | | 5,302,685 | |
Infor Software Parent LLC/Infor Software Parent, Inc., 7.13% (7.13 Cash or 7.88 PIK), 5/01/21 (a) | | | | | | | 4,950 | | | | 4,974,750 | |
Ingersoll-Rand Luxembourg Finance SA,
3.55%, 11/01/24 | | | | | | | 8,600 | | | | 8,823,660 | |
iStar Financial, Inc.: | | | | | | | | | | | | |
4.00%, 11/01/17 | | | | | | | 1,920 | | | | 1,876,800 | |
5.00%, 7/01/19 | | | | | | | 1,345 | | | | 1,321,463 | |
Jefferies Group LLC, 6.50%, 1/20/43 | | | | | | | 7,851 | | | | 8,081,607 | |
JPMorgan Chase & Co.: | | | | | | | | | | | | |
6.10% (b)(d) | | | | | | | 8,160 | | | | 8,343,600 | |
3.20%, 1/25/23 | | | | | | | 40,000 | | | | 40,936,080 | |
Kinder Morgan Energy Partners LP: | | | | | | | | | | | | |
3.50%, 3/01/21 | | | | | | | 17,260 | | | | 17,438,348 | |
5.80%, 3/01/21 | | | | | | | 3,300 | | | | 3,705,059 | |
KLA-Tencor Corp., 4.65%, 11/01/24 | | | | | | | 34,455 | | | | 36,686,616 | |
Lennar Corp, 4.50%, 11/15/19 | | | | | | | 6,751 | | | | 6,751,000 | |
Level 3 Financing, Inc., 6.13%, 1/15/21 | | | | | | | 8,108 | | | | 8,412,050 | |
Mallinckrodt International Finance SA/Mallinckrodt CB LLC, 5.75%, 8/01/22 (a) | | | | | | | 5,900 | | | | 6,091,750 | |
Micron Technology, Inc.: | | | | | | | | | | | | |
5.25%, 8/01/23 (a) | | | | | | | 9,836 | | | | 9,842,147 | |
5.50%, 2/01/25 (a) | | | | | | | 17,830 | | | | 17,919,150 | |
Morgan Stanley: | | | | | | | | | | | | |
2.38%, 3/31/21 | | | EUR | | | | 15,200 | | | | 18,352,914 | |
3.88%, 4/29/24 | | | USD | | | | 40,000 | | | | 42,473,320 | |
4.30%, 1/27/45 | | | | | | | 11,560 | | | | 12,119,758 | |
MSCI, Inc., 5.25%, 11/15/24 (a) | | | | | | | 4,284 | | | | 4,466,070 | |
Newfield Exploration Co., 5.75%, 1/30/22 | | | | | | | 1,900 | | | | 1,876,250 | |
Nexteer Automotive Group Ltd., 5.88%, 11/15/21 (a) | | | | | | | 600 | | | | 604,500 | |
Northwest Florida Timber Finance LLC,
4.75%, 3/04/29 (a) | | | | | | | 8,970 | | | | 8,123,232 | |
Nuance Communications, Inc., 5.38%, 8/15/20 (a) | | | | | | | 3,954 | | | | 3,993,540 | |
Omnicare, Inc.: | | | | | | | | | | | | |
4.75%, 12/01/22 | | | | | | | 674 | | | | 697,590 | |
5.00%, 12/01/24 | | | | | | | 426 | | | | 443,040 | |
Owens-Brockway Glass Container, Inc.,
5.00%, 1/15/22 (a) | | | | | | | 5,100 | | | | 5,297,625 | |
QVC, Inc.: | | | | | | | | | | | | |
3.13%, 4/01/19 | | | | | | | 3,420 | | | | 3,463,752 | |
4.85%, 4/01/24 | | | | | | | 18,129 | | | | 19,200,805 | |
Radian Group, Inc., 5.50%, 6/01/19 | | | | | | | 15,000 | | | | 15,375,000 | |
Realogy Group LLC, 7.63%, 1/15/20 (a) | | | | | | | 2,265 | | | | 2,431,931 | |
Regency Energy Partners LP/Regency Energy Finance Corp., 5.00%, 10/01/22 | | | | | | | 6,300 | | | | 6,583,500 | |
Reliance Industries Limited, 4.13%, 1/28/25 | | | | | | | 1,300 | | | | 1,314,625 | |
Reynolds American, Inc., 4.75%, 11/01/42 | | | | | | | 6,267 | | | | 6,417,471 | |
Rhino Bondco SpA, 7.25%, 11/15/20 | | | EUR | | | | 6,690 | | | | 7,785,320 | |
Royal Capital BV, 6.38% (d) | | | USD | | | | 2,150 | | | | 2,219,875 | |
RSP Permian, Inc., 6.63%, 10/01/22 (a) | | | | | | | 3,130 | | | | 3,110,437 | |
Sabine Pass Liquefaction LLC: | | | | | | | | | | | | |
5.63%, 2/01/21 | | | | | | | 6,635 | | | | 6,643,294 | |
6.25%, 3/15/22 | | | | | | | 2,628 | | | | 2,723,265 | |
5.75%, 5/15/24 | | | | | | | 2,000 | | | | 2,010,000 | |
Sabine Pass LNG LP, 7.50%, 11/30/16 | | | | | | | 2,755 | | | | 2,899,637 | |
Salix Pharmaceuticals Ltd., 6.00%, 1/15/21 (a) | | | | | | | 8,600 | | | | 9,159,000 | |
See Notes to Financial Statements.
| | | | | | |
| | | BLACKROCK FUNDS | | JANUARY 31, 2015 | | 23 |
| | | | |
| Schedule of Investments (continued) | | | BlackRock Global Long/Short Credit Fund | |
| | | (Percentages shown are based on Net Assets) | |
| | | | | | | | | | | | |
| Corporate Bonds | | | | | Par
(000) | | | Value | |
United States (concluded) | | | | | | | | | | | | |
Sanchez Energy Corp., 6.13%, 1/15/23 (a) | | | USD | | | | 3,986 | | | $ | 3,527,610 | |
SBA Communications Corp.,
4.88%, 7/15/22 (a) | | | | | | | 4,425 | | | | 4,303,313 | |
Sealed Air Corp., 5.13%, 12/01/24 (a) | | | | | | | 4,896 | | | | 5,024,520 | |
Sprint Communications, Inc.,
9.00%, 11/15/18 (a) | | | | | | | 2,339 | | | | 2,695,697 | |
Sprint Corp.: | | | | | | | | | | | | |
7.88%, 9/15/23 | | | | | | | 8,830 | | | | 8,951,413 | |
7.13%, 6/15/24 | | | | | | | 2,655 | | | | 2,581,987 | |
Steel Dynamics, Inc., 5.13%, 10/01/21 (a) | | | | | | | 5,050 | | | | 5,163,625 | |
Synchrony Financial, 2.70%, 2/03/20 | | | | | | | 8,215 | | | | 8,276,046 | |
Tenet Healthcare Corp.: | | | | | | | | | | | | |
5.00%, 3/01/19 (a) | | | | | | | 6,812 | | | | 6,829,030 | |
6.00%, 10/01/20 | | | | | | | 3,227 | | | | 3,493,227 | |
8.13%, 4/01/22 | | | | | | | 5,385 | | | | 6,071,587 | |
TerraForm Power Operating LLC,
5.88%, 2/01/23 (a) | | | | | | | 7,853 | | | | 8,019,876 | |
Tesoro Logistics LP/Tesoro Logistics Finance Corp., 6.25%, 10/15/22 (a) | | | | | | | 2,003 | | | | 2,033,045 | |
T-Mobile USA, Inc.: | | | | | | | | | | | | |
6.63%, 4/28/21 | | | | | | | 2,395 | | | | 2,486,609 | |
6.73%, 4/28/22 | | | | | | | 1,190 | | | | 1,233,137 | |
6.00%, 3/01/23 | | | | | | | 1,342 | | | | 1,372,195 | |
6.50%, 1/15/24 | | | | | | | 2,310 | | | | 2,396,625 | |
6.38%, 3/01/25 | | | | | | | 5,775 | | | | 5,876,063 | |
TransDigm, Inc.: | | | | | | | | | | | | |
6.00%, 7/15/22 | | | | | | | 3,770 | | | | 3,760,575 | |
6.50%, 7/15/24 | | | | | | | 5,115 | | | | 5,178,937 | |
Twitter, Inc., 1.00%, 9/15/21 (a) | | | | | | | 2,510 | | | | 2,237,037 | |
U.S. Airways Pass-Through Trust: | | | | | | | | | | | | |
Series 2012-1, Class B,
8.00%, 4/01/21 | | | | | | | 895 | | | | 1,009,634 | |
Series 2012-2, Class B,
6.75%, 12/03/22 | | | | | | | 2,768 | | | | 2,982,625 | |
Series 2012-2, Class C,
5.45%, 6/03/18 (h) | | | | | | | 12,800 | | | | 12,992,000 | |
Series 2013-1, Class B,
5.38%, 11/15/21 | | | | | | | 6,924 | | | | 7,114,489 | |
Ultra Petroleum Corp., 5.75%, 12/15/18 (a) | | | | | | | 1,882 | | | | 1,722,030 | |
Union Pacific Railroad Co. Pass Through Trust, 3.23%, 5/14/26 | | | | | | | 8,080 | | | | 8,297,186 | |
United Airlines Pass-Through Trust: | | | | | | | | | | | | |
Series 2013-1, Class A,
4.30%, 2/15/27 | | | | | | | 5,950 | | | | 6,158,250 | |
Series 2014-2, Class B,
4.63%, 9/03/22 | | | | | | | 8,940 | | | | 8,895,300 | |
Valeant Pharmaceuticals International, Inc.: | | | | | | | | | | | | |
6.75%, 8/15/18 (a) | | | | | | | 5,664 | | | | 6,025,080 | |
5.50%, 3/01/23 (a) | | | | | | | 1,702 | | | | 1,744,550 | |
Verizon Communications, Inc.,
5.15%, 9/15/23 (h) | | | | | | | 40,000 | | | | 45,864,440 | |
Weyerhaeuser Real Estate Co.: | | | | | | | | | | | | |
4.38%, 6/15/19 (a)(h) | | | | | | | 3,235 | | | | 3,081,337 | |
5.88%, 6/15/24 (a) | | | | | | | 2,195 | | | | 2,112,687 | |
Whiting Petroleum Corp.: | | | | | | | | | | | | |
5.00%, 3/15/19 | | | | | | | 940 | | | | 900,050 | |
5.75%, 3/15/21 | | | | | | | 1,415 | | | | 1,346,019 | |
The Williams Cos., Inc., 4.55%, 6/24/24 (h) | | | | | | | 30,000 | | | | 27,847,740 | |
Wise Metals Group LLC/Wise Alloys Finance Corp., 8.75%, 12/15/18 (a)(h) | | | | | | | 6,189 | | | | 6,583,549 | |
WPX Energy, Inc., 6.00%, 1/15/22 | | | | | | | 2,850 | | | | 2,764,500 | |
WR Grace & Co-Conn, 5.13%, 10/01/21 (a) | | | | | | | 2,000 | | | | 2,080,000 | |
| | | | | | | | | | | | |
| | | | | | | | | | | | 1,379,581,269 | |
| | | | | | | | | | | | |
| Corporate Bonds | | | | | Par
(000) | | | Value | |
Venezuela — 0.0% | | | | | | | | | | | | |
Petroleos de Venezuela SA: | | | | | | | | | | | | |
5.25%, 4/12/17 | | | USD | | | | 4,700 | | | $ | 1,740,997 | |
6.00%, 11/15/26 | | | | | | | 4,200 | | | | 1,299,270 | |
| | | | | | | | | | | | |
| | | | | | | | | | | | 3,040,267 | |
Total Corporate Bonds — 54.8% | | | | | | | | | | | 3,272,107,538 | |
| | | | | | | | | | | | |
| Floating Rate Loan Interests | | | | | | | | | |
Canada — 0.0% | | | | | | | | | | | | |
Ceva Logistics Canada, ULC (FKA TNT Canada ULC), Canadian Term Loan, 6.50%, 3/19/21 | | | | | | | 130 | | | | 118,774 | |
Cayman Islands — 0.2% | | | | | | | | | | | | |
Avago Technologies Cayman Ltd. (Avago Technologies Holdings Luxembourg S.à r.l.), Term Loan, 3.75%, 5/06/21 | | | | | | | 13,656 | | | | 13,625,648 | |
Denmark — 0.4% | | | | | | | | | | | | |
Nassa Midco AS, Facility B (EUR),
4.25%, 7/09/21 | | | EUR | | | | 18,950 | | | | 21,069,926 | |
France — 0.2% | | | | | | | | | | | | |
Numericable SFR SAS, Euro Denominated Tranche B-1 Loan, 4.50%, 5/21/20 | | | | | | | 12,280 | | | | 13,899,923 | |
Germany — 0.4% | | | | | | | | | | | | |
Auris Luxembourg III S.à r.l., Facility B1 (EUR), 4.50%, 1/17/22 | | | | | | | 6,800 | | | | 7,731,066 | |
IVG Immobilien AG: | | | | | | | | | | | | |
Facility A-1 Loan, 4.75%, 6/02/17 | | | | | | | 2,096 | | | | 2,368,862 | |
Facility A-2 Loan, 9.52%, 6/02/17 | | | | | | | 3,108 | | | | 3,511,916 | |
Schaeffler AG (FKA INA Beteiligungsgesellschaftmit beschränkter Haftung), Facility B-EUR, 4.25%, 5/15/20 | | | | | | | 11,420 | | | | 12,947,252 | |
| | | | | | | | | | | | |
| | | | | | | | | | | | 26,559,096 | |
Italy — 0.2% | | | | | | | | | | | | |
Sit SpA, Medium-Term Facility B,
5.58%, 4/30/20 | | | | | | | 12,000 | | | | 13,288,736 | |
Luxembourg — 0.2% | | | | | | | | | | | | |
Altice Financing SA, Term Loan,
5.25%, 1/29/22 | | | | | | | 3,690 | | | | 4,180,104 | |
Intelsat Jackson Holdings S.A., Tranche B-2 Term Loan, 3.75%, 6/28/19 | | | USD | | | | 1,196 | | | | 1,180,995 | |
IVG Immobilien AG: | | | | | | | | | | | | |
Facility A2, 2.02%, 6/02/17 | | | EUR | | | | 38 | | | | 43,258 | |
Facility A3, 2.02%, 6/02/17 | | | | | | | 10 | | | | 10,815 | |
Tranche B, 2.02%, 6/02/17 | | | | | | | 68 | | | | 76,946 | |
Tranche C, 2.02%, 6/02/17 | | | | | | | 100 | | | | 113,231 | |
Mallinckrodt International Finance SA, Initial Term B Loan, 3.25%, 3/19/21 | | | USD | | | | 3,513 | | | | 3,438,297 | |
Oxea Finance & Cy SCA (Oxea Finance LLC): | | | | | | | | | | | | |
Term Loan (Second Lien),
8.25%, 7/15/20 | | | | | | | 320 | | | | 298,400 | |
Tranche B-2 Term Loan (First Lien),
4.25%, 1/15/20 | | | | | | | 2,617 | | | | 2,486,031 | |
| | | | | | | | | | | | |
| | | | | | | | | | | | 11,828,077 | |
Netherlands — 1.2% | | | | | | | | | | | | |
Action Holding BV (FKA Peer Holdings BV), Term B (A2), 4.75%, 1/13/21 | | | EUR | | | | 10,810 | | | | 12,226,724 | |
Amaya Holdings BV, Initial Term B Loan (First Lien), 5.00%, 8/01/21 | | | USD | | | | 4,713 | | | | 4,612,278 | |
Ceva Intercompany BV, Dutch BV Term Loan, 6.50%, 3/19/21 | | | | | | | 753 | | | | 688,891 | |
Charger OpCo BV, Term B-1 EUR Loan, 3.50%, 7/23/21 | | | EUR | | | | 22,230 | | | | 25,107,973 | |
Ziggo BV: | | | | | | | | | | | | |
EUR B1 Facility, 3.75%, 1/15/22 | | | | | | | 8,158 | | | | 9,149,318 | |
See Notes to Financial Statements.
| | | | | | |
| 24 | | BLACKROCK FUNDS | | JANUARY 31, 2015 | | |
| | | | |
| Schedule of Investments (continued) | | | BlackRock Global Long/Short Credit Fund | |
| | | (Percentages shown are based on Net Assets) | |
| | | | | | | | | | | | |
| Floating Rate Loan Interests | | | | | Par
(000) | | | Value | |
Netherlands (concluded) | | | | | | | | | | | | |
EUR B2 Facility, 3.50%, 1/15/22 | | | EUR | | | | 5,255 | | | $ | 5,894,120 | |
EUR B3 Facility, 3.75%, 1/15/22 | | | | | | | 14,766 | | | | 16,560,424 | |
| | | | | | | | | | | | |
| | | | | | | | | | | | 74,239,728 | |
Spain — 0.3% | | | | | | | | | | | | |
Livister Investments, S.L.U., Facility B,
5.02%, 6/28/21 | | | | | | | 14,570 | | | | 16,422,861 | |
United Kingdom — 1.8% | | | | | | | | | | | | |
Bestway UK Holdco Ltd., Facility B,
5.25%, 10/06/21 | | | GBP | | | | 11,170 | | | | 16,830,378 | |
Ceva Group PLC (FKA Louis No.1 PLC/TNT Logistics), Pre-Funded L/C Loan,
6.50%, 3/19/21 | | | USD | | | | 719 | | | | 658,195 | |
Ceva Logistics U.S. Holdings, Inc. (FKA Louis U.S. Holdco, Inc.), U.S. Term Loan, 6.50%, 3/19/21 | | | | | | | 1,038 | | | | 950,195 | |
Iglo Foods Midco Ltd., Facility B2, 5.25%, 6/30/20 | | | GBP | | | | 6,345 | | | | 9,236,053 | |
Nelson Bidco Ltd.: | | | | | | | | | | | | |
Initial Term Loan (First Lien),,
5.23%, 12/10/21 | | | | | | | 19,590 | | | | 29,482,085 | |
Initial Term Loan (Second Lien),,
5.24%, 12/09/22 | | | | | | | 9,800 | | | | 14,705,466 | |
Saga Mid Co. Ltd., Facility A, 2.25%, 4/25/19 | | | | | | | 9,080 | | | | 12,855,769 | |
Virgin Media Investment Holdings Ltd.: | | | | | | | | | | | | |
B Facility, 3.50%, 6/07/20 | | | USD | | | | 515 | | | | 506,400 | |
E Facility, 4.25%, 6/30/23 | | | GBP | | | | 7,970 | | | | 11,912,268 | |
Yellow Maple Holding BV, Facility B3,
5.22%, 9/17/21 | | | | | | | 5,250 | | | | 7,877,928 | |
| | | | | | | | | | | | |
| | | | | | | | | | | | 105,014,737 | |
United States — 5.6% | | | | | | | | | | | | |
Accudyne Industries Borrower SCA/Accudyne Industries LLC (FKA Silver II U.S. Holdings, LLC), Refinancing Term Loan,
4.00%, 12/13/19 | | | USD | | | | 915 | | | | 855,306 | |
Activision Blizzard, Inc., Term Loan,
3.25%, 10/12/20 | | | | | | | 2,640 | | | | 2,635,554 | |
Advantage Sales & Marketing, Inc.: | | | | | | | | | | | | |
Delayed Draw Term Loan,
4.25%, 7/23/21 | | | | | | | 150 | | | | 147,938 | |
Initial Term Loan (First Lien),
4.25%, 7/23/21 | | | | | | | 4,494 | | | | 4,438,126 | |
Alliance Laundry Systems LLC, Initial Term Loan (First Lien), 4.25%, 12/10/18 | | | | | | | 247 | | | | 243,529 | |
Alliant Holdings I, LLC, Initial Term Loan,
4.25%, 12/20/19 | | | | | | | 451 | | | | 446,583 | |
Allied Security Holdings LLC, Closing Date Term Loan (First Lien), 4.25%, 2/12/21 | | | | | | | 3,627 | | | | 3,571,959 | |
American Builders & Contractors Supply Co., Inc., Term B Loan, 3.50%, 4/16/20 | | | | | | | 1,299 | | | | 1,266,098 | |
American Capital, Ltd. (FKA American Capital Strategies, Ltd.), Term B Loan,
3.50%, 8/22/17 | | | | | | | 215 | | | | 214,002 | |
American Energy — Marcellus, LLC, Initial Loan (Second Lien), 8.50%, 8/04/21 | | | | | | | 12,577 | | | | 9,401,058 | |
American Renal Holdings, Inc., Term B Loan (First Lien), 4.50%, 8/20/19 | | | | | | | 973 | | | | 958,007 | |
Ardagh Holdings USA, Inc. (Ardagh Packaging Finance SA), New Term Loan,
4.00%, 12/17/19 | | | | | | | 4,218 | | | | 4,139,035 | |
Arysta LifeScience SPC LLC, Initial Term Loan (First Lien), 4.50%, 5/29/20 | | | | | | | 1,704 | | | | 1,701,627 | |
Ascend Performance Materials Operations LLC, Term B Loan, 6.75%, 4/10/18 | | | | | | | 195 | | | | 165,325 | |
Axalta Coating Systems Dutch Holding B BV (Axalta Coating Systems U.S. Holdings, Inc.), Refinanced Term B Loan, 3.75%, 2/01/20 | | | | | | | 1,144 | | | | 1,119,640 | |
| | | | | | | | | | | | |
| Floating Rate Loan Interests | | | | | Par
(000) | | | Value | |
United States (continued) | | | | | | | | | | | | |
B.C. Unlimited Liability Co./New Red Finance, Inc. (FKA Burger King/Tim Horton’s), Term B Loan, 4.50%, 12/12/21 | | | USD | | | | 9,990 | | | $ | 9,993,796 | |
B/E Aerospace, Inc., Term Loan, 4.00%, 12/16/21 | | | | | | | 2,065 | | | | 2,064,133 | |
Berry Plastics Corp., Term E Loan, 3.75%, 1/06/21 | | | | | | | 2,107 | | | | 2,075,445 | |
Biomet, Inc., Dollar Term B-2 Loan, 3.67%, 7/25/17 | | | | | | | 1,701 | | | | 1,696,984 | |
BJ’s Wholesale Club, Inc., New 2013 (November) Replacement Loan (First Lien), 4.50%, 9/26/19 | | | | | | | 1,402 | | | | 1,378,892 | |
Boyd Gaming Corp., Term B Loan, 4.00%, 8/14/20 | | | | | | | 2,765 | | | | 2,716,301 | |
Brand Energy & Infrastructure Services, Inc. (FKA FR Brand Acquisition Corp.), Initial Term Loan, 4.75%, 11/26/20 | | | | | | | 4,583 | | | | 4,314,570 | |
Bright Horizons Family Solutions LLC (FKA Bright Horizons Family Solutions, Inc.), Term B Loan, 3.75%, 1/30/20 | | | | | | | 2,592 | | | | 2,564,621 | |
Caesars Entertainment Operating Co., Inc. (FKA Harrah’s Operating Co., Inc.), Term B-7 Loan, 9.75%, 1/28/18 | | | | | | | 5,069 | | | | 4,514,859 | |
Caesars Entertainment Resort Properties, LLC, Term B Loan, 7.00%, 10/11/20 | | | | | | | 10,072 | | | | 9,589,719 | |
Capsugel Holdings US, Inc., Initial Term Loan, 3.50%, 8/01/18 | | | | | | | 1,747 | | | | 1,730,674 | |
Catalent Pharma Solutions, Inc. (FKA Cardinal Health 409, Inc.), Dollar Term Loan, 4.25%, 5/20/21 | | | | | | | 3,483 | | | | 3,470,417 | |
CCC Information Services, Inc. (FKA CCC Holdings, Inc.), Term Loan, 4.00%, 12/20/19 | | | | | | | 461 | | | | 453,115 | |
Cengage Learning Acquisitions, Inc. (FKA TL Acquisitions, Inc.), Term Loan, 7.00%, 3/31/20 | | | | | | | 10,708 | | | | 10,633,219 | |
Ceridian HCM Holding, Inc., Initial Term Loan,
4.50%, 9/15/20 | | | | | | | 1,107 | | | | 1,085,082 | |
Charter Communications Operating LLC (AKA CCO Safari LLC), Term G Loan, 4.25%, 9/10/21 | | | | | | | 16,950 | | | | 17,015,766 | |
CHS/Community Health Systems, Inc., 2021 Term D Loan, 4.25%, 1/27/21 | | | | | | | 7,044 | | | | 7,035,750 | |
Connolly Intermediate, Inc., Initial Term Loan (First Lien), 5.00%, 5/14/21 | | | | | | | 3,930 | | | | 3,922,900 | |
Continental Building Products LLC, First Lien Term Loan, 4.00%, 8/28/20 | | | | | | | 2,120 | | | | 2,077,999 | |
CPG International, Inc., Term Loan, 4.75%, 9/30/20 | | | | | | | 2,721 | | | | 2,675,211 | |
Dell International LLC, Term C Loan, 3.75%, 10/29/18 | | | | | | | 13,885 | | | | 13,865,279 | |
DJO Finance LLC (ReAble Therapeutics Finance LLC), New Tranche B Term Loan,
4.25%, 9/15/17 | | | | | | | 175 | | | | 174,492 | |
Dynegy, Inc., Tranche B-2 Term Loan, 4.00%, 4/23/20 | | | | | | | 1,167 | | | | 1,153,183 | |
Energy Future Intermediate Holding Co. LLC (EFIH Finance, Inc.), Term Loan,
4.25%, 6/19/16 | | | | | | | 3,665 | | | | 3,659,283 | |
Evergreen Acqco 1 LP, New Term Loan,
5.00%, 7/09/19 | | | | | | | 978 | | | | 940,844 | |
EWT Holdings III Corp. (FKA WTG Holdings III Corp.), Term Loan (First Lien), 4.75%, 1/15/21 | | | | | | | 1,901 | | | | 1,867,536 | |
First Data Corp.: | | | | | | | | | | | | |
2017 Second New Dollar Term Loan,,
3.67%, 3/24/17 | | | | | | | 730 | | | | 721,240 | |
See Notes to Financial Statements.
| | | | | | |
| | | BLACKROCK FUNDS | | JANUARY 31, 2015 | | 25 |
| | | | |
| Schedule of Investments (continued) | | | BlackRock Global Long/Short Credit Fund | |
| | | (Percentages shown are based on Net Assets) | |
| | | | | | | | | | | | |
| Floating Rate Loan Interests | | | | | Par
(000) | | | Value | |
United States (continued) | | | | | | | | | | | | |
2018 New Dollar Term Loan, 3.67%, 3/23/18 | | | USD | | | | 16,340 | | | $ | 16,028,560 | |
2018B Second New Term Loan, 3.67%, 9/24/18 | | | | | | | 1,005 | | | | 986,156 | |
Freescale Semiconductor, Inc.: | | | | | | | | | | | | |
Tranche B-4 Term Loan, 4.25%, 2/28/20 | | | | | | | 1,037 | | | | 1,021,067 | |
Tranche B-5 Term Loan, 5.00%, 1/15/21 | | | | | | | 1,200 | | | | 1,200,148 | |
Gates Global LLC, Initial Dollar Term Loan, 4.25%, 7/05/21 | | | | | | | 8,943 | | | | 8,710,080 | |
Generac Power Systems, Inc., Term B Loan, 3.25%, 5/31/20 | | | | | | | 1,242 | | | | 1,214,055 | |
Grifols Worldwide Operations Ltd., U.S. Tranche B Term Loam, 3.17%, 2/27/21 | | | | | | | 9,002 | | | | 8,886,210 | |
HD Supply, Inc., Term Loan 2014, 4.00%, 6/28/18 | | | | | | | 1,403 | | | | 1,389,313 | |
Hilton Worldwide Finance LLC, Initial Term Loan, 3.50%, 10/26/20 | | | | | | | 10,235 | | | | 10,101,640 | |
IMS Health, Inc., Term B Dollar Loan, 3.50%, 3/17/21 | | | | | | | 8,386 | | | | 8,218,445 | |
Infor (U.S.), Inc. (FKA Lawson Software, Inc.), Tranche B-5 Term Loan, 3.75%, 6/03/20 | | | | | | | 2,840 | | | | 2,769,324 | |
Interactive Data Corp., Term Loan, 4.75%, 5/02/21 | | | | | | | 4,826 | | | | 4,802,828 | |
J. Crew Group, Inc., Initial Loan, 4.00%, 3/05/21 | | | | | | | 5,816 | | | | 5,253,701 | |
La Quinta Intermediate Holdings LLC, Initial Term Loan, 4.00%, 4/14/21 | | | | | | | 8,805 | | | | 8,716,479 | |
Las Vegas Sands LLC, Term B Loan, 3.25%, 12/19/20 | | | | | | | 5,346 | | | | 5,305,370 | |
Level 3 Financing, Inc.: | | | | | | | | | | | | |
Tranche B 2020 Term Loan, 4.00%, 1/15/20 | | | | | | | 405 | | | | 401,120 | |
Tranche B 2022 Term Loan, 4.50%, 1/31/22 | | | | | | | 11,885 | | | | 11,890,586 | |
MacDermid, Inc., Tranche B Term Loan (First Lien), 4.00%, 6/07/20 | | | | | | | 1,133 | | | | 1,128,502 | |
MGM Resorts International (MGM Grand Detroit, LLC), Term B Loan, 3.50%, 12/20/19 | | | | | | | 833 | | | | 819,464 | |
Michaels Stores, Inc., Term B Loan, 3.75%, 1/28/20 | | | | | | | 1,307 | | | | 1,281,610 | |
NEP/NCP Holdco, Inc., Amendment No. 3 Incremental Term Loan (First Lien), 4.25%, 1/22/20 | | | | | | | 177 | | | | 171,264 | |
Northwest Airlines, Inc.: | | | | | | | | | | | | |
Term B757-200 Loan, 1.56%, 9/10/18 | | | | | | | 369 | | | | 351,328 | |
Term B757-200 Loan, 1.56%, 9/10/18 | | | | | | | 367 | | | | 348,792 | |
Term B757-300 Loan, 2.18%, 3/10/17 | | | | | | | 376 | | | | 363,819 | |
Term B757-300 Loan, 2.18%, 3/10/17 | | | | | | | 374 | | | | 362,743 | |
Term B757-300 Loan, 1.56%, 3/10/17 | | | | | | | 364 | | | | 346,255 | |
Offshore Group Investment Ltd. (Vantage Drilling Co.), Second Term Loan, 5.75%, 3/28/19 | | | | | | | 257 | | | | 155,707 | |
Ortho-Clinical Diagnostics Holdings Luxembourg S.à r.l., Initial Term Loan, 4.75%, 6/30/21 | | | | | | | 3,731 | | | | 3,578,269 | |
Par Pharmaceutical Companies, Inc. (Par Pharmaceutical, Inc.), Term B-2 Loan, 4.00%, 9/30/19 | | | | | | | 2,278 | | | | 2,236,643 | |
Party City Holdings, Inc., 2014 Replacement Term Loan, 4.00%, 7/27/19 | | | | | | | 5,363 | | | | 5,241,926 | |
PetCo Animal Supplies, Inc., New Loans, 4.00%, 11/24/17 | | | | | | | 196 | | | | 193,714 | |
Pinnacle Entertainment, Inc., Tranche B-2 Term Loan, 3.75%, 8/13/20 | | | | | | | 1,067 | | | | 1,051,706 | |
Pinnacle Foods Finance LLC, Tranche H Term Loan, 3.00%, 4/29/20 | | | | | | | 1,353 | | | | 1,322,774 | |
Realogy Group LLC (FKA Realogy Corp.), Extended Synthetic Commitment, 0.02%, 10/10/16 | | | | | | | 6 | | | | 6,021 | |
| | | | | | | | | | | | |
| Floating Rate Loan Interests | | | | | Par
(000) | | | Value | |
United States (concluded) | | | | | | | | | | | | |
Rexnord LLC/RBS Global, Inc., Term B Loan, 4.00%, 8/21/20 | | | USD | | | | 2,372 | | | $ | 2,330,941 | |
Rite Aid Corp., Tranche 1 Term Loan (Second Lien), 5.75%, 8/21/20 | | | | | | | 360 | | | | 360,677 | |
ROC Finance LLC, Funded Term B Loan, 5.00%, 6/20/19 | | | | | | | 405 | | | | 376,534 | |
Sabre GLBL, Inc. (FKA Sabre, Inc.), Term B Loan, 4.00%, 2/19/19 | | | | | | | 4,962 | | | | 4,883,787 | |
Salix Pharmaceuticals Ltd., Term Loan, 4.25%, 1/02/20 | | | | | | | 10,398 | | | | 10,340,992 | |
Sequa Corp., Initial Term Loan, 5.25%, 6/19/17 | | | | | | | 1,505 | | | | 1,440,214 | |
The ServiceMaster Co. LLC, Initial Term Loan, 4.25%, 7/01/21 | | | | | | | 8,633 | | | | 8,517,330 | |
Spin Holdco, Inc., Initial Term Loan (First Lien), 4.25%, 11/14/19 | | | | | | | 4,367 | | | | 4,292,085 | |
Surgery Center Holdings, Inc., Initial Term Loan (First Lien), 5.25%, 11/03/20 | | | | | | | 2,219 | | | | 2,160,786 | |
TIBCO Software, Inc., Term Loan, 6.50%, 12/04/20 | | | | | | | 5,710 | | | | 5,571,533 | |
Travelport Finance (Luxembourg) S.à r.l., Initial Term Loan, 6.00%, 9/02/21 | | | | | | | 11,160 | | | | 11,164,687 | |
Tribune Co., Initial Term Loan, 4.00%, 12/27/20 | | | | | | | 323 | | | | 318,302 | |
Univision Communications, Inc., Replacement First-Lien Term Loan, 4.00%, 3/01/20 | | | | | | | 6,562 | | | | 6,459,922 | |
WESCO Distribution, Inc., Tranche B-1 Loan, 3.75%, 12/12/19 | | | | | | | 142 | | | | 141,407 | |
Wilsonart LLC, Initial Term Loan, 4.00%, 10/31/19 | | | | | | | 2,592 | | | | 2,538,340 | |
Yellow Maple Holding BV, Facility B1, 4.19%, 9/19/21 | | | EUR | | | | 9,195 | | | | 10,407,652 | |
| | | | | | | | | | | | |
| | | | | | | | | | | | 331,855,905 | |
Total Floating Rate Loan Interests — 10.5% | | | | | | | | | | | 627,923,411 | |
| | | | | | | | | | | | |
| Foreign Government Obligations | | | | | | | | | |
Croatia — 0.1% | | | | | | | | | | | | |
Republic of Croatia, 3.88%, 5/30/22 | | | | | | | 3,700 | | | | 4,337,767 | |
Ghana — 0.0% | | | | | | | | | | | | |
Republic of Ghana, 8.13%, 1/18/26 | | | USD | | | | 1,180 | | | | 1,038,400 | |
Greece — 0.1% | | | | | | | | | | | | |
Hellenic Republic, 2.00%, 2/24/24 (i) | | | EUR | | | | 9,880 | | | | 6,377,789 | |
Hungary — 0.1% | | | | | | | | | | | | |
Hungary Government International Bond, 5.38%, 3/25/24 | | | USD | | | | 4,500 | | | | 5,127,750 | |
Indonesia — 0.2% | | | | | | | | | | | | |
Republic of Indonesia: | | | | | | | | | | | | |
2.88%, 7/08/21 | | | EUR | | | | 3,700 | | | | 4,306,409 | |
5.88%, 1/15/24 | | | USD | | | | 2,500 | | | | 2,893,750 | |
4.13%, 1/15/25 | | | | | | | 610 | | | | 626,775 | |
6.75%, 1/15/44 | | | | | | | 4,100 | | | | 5,289,000 | |
5.13%, 1/15/45 | | | | | | | 505 | | | | 535,300 | |
| | | | | | | | | | | | |
| | | | | | | | | | | | 13,651,234 | |
Italy — 1.1% | | | | | | | | | | | | |
Buoni Poliennali Del Tesoro: | | | | | | | | | | | | |
5.50%, 11/01/22 | | | EUR | | | | 4,910 | | | | 7,214,220 | |
2.50%, 12/01/24 | | | | | | | 48,760 | | | | 59,484,930 | |
| | | | | | | | | | | | |
| | | | | | | | | | | | 66,699,150 | |
Portugal — 0.2% | | | | | | | | | | | | |
Republic of Portugal, 5.13%, 10/15/24 | | | USD | | | | 12,875 | | | | 14,164,045 | |
See Notes to Financial Statements.
| | | | | | |
| 26 | | BLACKROCK FUNDS | | JANUARY 31, 2015 | | |
| | | | |
| Schedule of Investments (continued) | | | BlackRock Global Long/Short Credit Fund | |
| | | (Percentages shown are based on Net Assets) | |
| | | | | | | | | | | | |
| Foreign Government Obligations | | | | | Par
(000) | | | Value | |
Romania — 0.1% | | | | | | | | | | | | |
Republic of Romanian, 3.63%, 4/24/24 | | | EUR | | | | 3,500 | | | $ | 4,498,791 | |
Russia — 0.2% | | | | | | | | | | | | |
Russia Federation, 7.50%, 3/31/30 (i) | | | USD | | | | 8,777 | | | | 8,826,116 | |
Serbia — 0.1% | | | | | | | | | | | | |
Republic of Serbia, 5.88%, 12/03/18 | | | | | | | 4,600 | | | | 4,858,704 | |
Slovenia — 0.1% | | | | | | | | | | | | |
Republic of Slovenia, 4.63%, 9/09/24 | | | EUR | | | | 3,400 | | | | 4,911,973 | |
Spain — 1.8% | | | | | | | | | | | | |
Spain Government Bonds: | | | | | | | | | | | | |
3.80%, 4/30/24 | | | | | | | 26,000 | | | | 35,425,353 | |
2.75%, 10/31/24 | | | | | | | 38,000 | | | | 47,952,156 | |
1.60%, 4/30/25 | | | | | | | 20,290 | | | | 23,073,868 | |
| | | | | | | | | | | | |
| | | | | | | | | | | | 106,451,377 | |
Venezuela — 0.0% | | | | | | | | | | | | |
Bolivarian Republic of Venezuela, 11.75%, 10/21/26 | | | USD | | | | 1,500 | | | | 536,250 | |
Total Foreign Government Obligations — 4.1% | | | | 241,479,346 | |
| | | | | | | | | | | | |
| Non-Agency Mortgage-Backed Securities | | | | | | | | | |
Collateralized Mortgage Obligations — 0.4% | |
Italy — 0.1% | | | | | | | | | | | | |
Berica 8 Residential MBS Series, Series 2014-8, Class A, 0.62%, 3/31/48 (b) | | | | | | | 6,522 | | | | 7,235,990 | |
United Kingdom — 0.3% | | | | | | | | | | | | |
Gemgarto, Series 2012-1, Class A1, 3.51%, 5/14/45 (b) | | | GBP | | | | 172 | | | | 265,126 | |
Granite Master Issuer PLC: | | | | | | | | | | | | |
Series 2006-2, Class A5, 0.20%, 12/20/54 (b) | | | EUR | | | | 2,784 | | | | 3,133,181 | |
Series 2007-2, Class 3A2, 0.22%, 12/17/54 (b) | | | | | | | 3,036 | | | | 3,416,128 | |
Lanark Master Issuer PLC, Series 2012-2X, Class 2A, 2.19%, 12/22/54 (b) | | | GBP | | | | 890 | | | | 1,375,165 | |
Paragon Mortgages No. 13 PLC, Series 2006-13X, Class A2C, 0.43%, 1/15/39 (b) | | | USD | | | | 6,192 | | | | 5,754,223 | |
Residential Mortgage Securities PLC, Series 2012-26, Class A1, 2.81%, 2/14/41 (b) | | | GBP | | | | 932 | | | | 1,454,347 | |
Silk Road Finance Number Three PLC, Series 2012-1, Class A, 1.91%, 6/21/55 (b) | | | | | | | 433 | | | | 658,671 | |
| | | | | | | | | | | | |
| | | | | | | | | | | | 16,056,841 | |
Commercial Mortgage-Backed Securities — 0.8% | | | | | | | | | |
Ireland — 0.1% | | | | | | | | | | | | |
German Residential Funding PLC,
Series 2013-1, Class E, 4.23%, 8/27/24 | | | EUR | | | | 3,686 | | | | 4,404,335 | |
United States — 0.7% | | | | | | | | | | | | |
Banc of America Commercial Mortgage Trust, Series 2007-3, Class AJ, 5.59%, 6/10/49 (b) | | | USD | | | | 4,000 | | | | 4,175,236 | |
CDGJ Commercial Mortgage Trust, Series 2014-BXCH, Class EPA, 4.40%, 12/15/27 (a)(b) | | | | | | | 4,700 | | | | 4,703,036 | |
COMM PAT Mortgage Trust: | | | | | | | | | | | | |
Series 2014-PAT, Class E, 3.31%, 8/15/27 (a)(b) | | | | | | | 1,000 | | | | 991,057 | |
Series 2014-PAT, Class F, 2.60%, 8/15/27 (a)(b) | | | | | | | 2,000 | | | | 1,892,384 | |
Series 2014-PAT, Class G, 1.75%, 8/15/27 (a)(b) | | | | | | | 2,000 | | | | 1,778,760 | |
| | | | | | | | | | | | |
| Non-Agency Mortgage-Backed Securities | | | | | Par
(000) | | | Value | |
Commercial Mortgage-Backed Securities (concluded) | |
United States (concluded) | |
Credit Suisse Commercial Mortgage Trust, Series 2007-C4, Class AJ, 5.90%, 9/15/39 (b) | | | USD | | | | 3,300 | | | $ | 3,470,240 | |
Credit Suisse First Boston Mortgage Securities Corp., Series 2005-C2, Class AMFX, 4.88%, 4/15/37 | | | | | | | 1,000 | | | | 1,000,860 | |
Hilton USA Trust, Series 2013-HLT, Class EFX, 5.22%, 11/05/30 (a)(b) | | | | | | | 4,673 | | | | 4,798,746 | |
LB-UBS Commercial Mortgage Trust: | | | | | | | | | | | | |
Series 2006-C4, Class B, 5.86%, 6/15/38 (b) | | | | | | | 4,710 | | | | 4,865,812 | |
Series 2007-C1, Class AJ, 5.48%, 2/15/40 | | | | | | | 11,270 | | | | 11,766,421 | |
Wachovia Bank Commercial Mortgage Trust, Series 2007-C33, Class AJ, 5.94%, 2/15/51 (b) | | | | | | | 5,211 | | | | 5,489,382 | |
| | | | | | | | | | | | |
| | | | | | | | | | | | 44,931,934 | |
Total Non-Agency Mortgage-Backed Securities — 1.2% | | | | 72,629,100 | |
| | | | | | | | | | | | |
| Preferred Securities | | | | | | | | | |
Capital Trusts | | | | | | | | | | | | |
China — 0.1% | | | | | | | | | | | | |
Industrial & Commercial Bank of China Ltd., 6.00% (b)(d) | | | | | | | 3,000 | | | | 3,105,000 | |
France — 1.5% | | | | | | | | | | | | |
Credit Agricole Assurances SA, 4.35% (b)(d) | | | | | | | 24,000 | | | | 28,041,945 | |
Electricite de France SA: | | | | | | | | | | | | |
4.25% (b)(d) | | | | | | | 9,900 | | | | 12,305,641 | |
5.00% (b)(d) | | | | | | | 7,700 | | | | 10,125,740 | |
5.88% (b)(d) | | | GBP | | | | 7,300 | | | | 12,369,717 | |
Orange SA: | | | | | | | | | | | | |
4.00% (b)(d) | | | EUR | | | | 3,450 | | | | 4,167,422 | |
4.25% (b)(d) | | | | | | | 9,900 | | | | 12,025,967 | |
5.00% (b)(d) | | | | | | | 7,225 | | | | 9,192,493 | |
| | | | | | | | | | | | |
| | | | | | | | | | | | 88,228,925 | |
Germany — 0.5% | | | | | | | | | | | | |
Deutsche Annington Finance BV, 4.13%, 12/31/49 (b)(d) | | | | | | | 11,600 | | | | 13,665,024 | |
HSH Nordbank AG, 0.00% (d) | | | | | | | 25,485 | | | | 8,545,630 | |
Merck KGaA, 3.00%, 12/12/74 (b) | | | | | | | 9,275 | | | | 10,810,318 | |
| | | | | | | | | | | | |
| | | | | | | | | | | | 33,020,972 | |
Italy — 0.3% | | | | | | | | | | | | |
Enel SpA: | | | | | | | | | | | | |
6.50%, 1/10/74 (b) | | | USD | | | | 9,900 | | | | 12,589,823 | |
5.00%, 1/15/75 (b) | | | | | | | 2,720 | | | | 3,356,460 | |
UniCredit SpA, 6.75% (b)(d) | | | | | | | 2,750 | | | | 3,033,682 | |
| | | | | | | | | | | | |
| | | | | | | | | | | | 18,979,965 | |
Spain — 1.6% | | | | | | | | | | | | |
Banco Bilbao Vizcaya Argentaria SA: | | | | | | | | | | | | |
7.00% (b)(d) | | | EUR | | | | 13,400 | | | | 15,616,369 | |
9.00% (b)(d) | | | USD | | | | 9,000 | | | | 9,777,150 | |
Banco Popular Espanol SA, 11.50% (b)(d) | | | EUR | | | | 13,300 | | | | 17,471,129 | |
Banco Santander SA, 6.25% (b)(d) | | | | | | | 11,200 | | | | 12,650,244 | |
Gas Natural Fenosa Finance BV, 4.13% (b)(d) | | | | | | | 8,500 | | | | 10,128,424 | |
Telefonica Europe BV: | | | | | | | | | | | | |
4.20% (b)(d) | | | | | | | 16,400 | | | | 19,347,315 | |
5.00% (b)(d) | | | | | | | 9,900 | | | | 12,041,942 | |
| | | | | | | | | | | | |
| | | | | | | | | | | | 97,032,573 | |
See Notes to Financial Statements.
| | | | | | |
| | | BLACKROCK FUNDS | | JANUARY 31, 2015 | | 27 |
| | | | |
| Schedule of Investments (continued) | | | BlackRock Global Long/Short Credit Fund | |
| | | (Percentages shown are based on Net Assets) | |
| | | | | | | | | | | | |
| Preferred Securities | | | | | Par (000) | | | Value | |
Capital Trusts (concluded) | | | | | | | | | | | | |
Sweden — 0.2% | | | | | | | | | | | | |
Volvo Treasury AB, 4.50%, 6/10/75 (b) | | | EUR | | | | 10,575 | | | $ | 12,248,435 | |
Switzerland — 0.3% | | | | | | | | | | | | |
Credit Suisse Group AG, 6.25% (a)(b)(d) | | | USD | | | | 17,450 | | | | 16,815,693 | |
United Kingdom — 0.9% | | | | | | | | | | | | |
Barclays Bank PLC: | | | | | | | | | | | | |
8.00% (b)(d) | | | EUR | | | | 12,785 | | | | 15,494,387 | |
8.25% (b)(d) | | | USD | | | | 10,230 | | | | 10,662,923 | |
Coventry Building Society, 6.38% (b)(d) | | | GBP | | | | 3,600 | | | | 5,296,543 | |
HBOS Capital Funding LP, 6.85% (b)(d) | | | USD | | | | 4,341 | | | | 4,368,131 | |
Lloyds Banking Group PLC, 6.38% (b)(d) | | | EUR | | | | 15,614 | | | | 18,351,708 | |
| | | | | | | | | | | | |
| | | | | | | | | | | | 54,173,692 | |
United States — 3.5% | | | | | | | | | | | | |
Bank of America Corp.: | | | | | | | | | | | | |
5.13% (b)(d) | | | USD | | | | 14,875 | | | | 14,531,016 | |
6.25% (b)(d) | | | | | | | 15,385 | | | | 15,732,855 | |
6.50% (b)(d) | | | | | | | 20,000 | | | | 20,943,740 | |
Citigroup, Inc.: | | | | | | | | | | | | |
5.90% (b)(d) | | | | | | | 7,374 | | | | 7,364,783 | |
5.95% (b)(d) | | | | | | | 9,206 | | | | 9,194,493 | |
JPMorgan Chase & Co.: | | | | | | | | | | | | |
5.00% (b)(d) | | | | | | | 10,000 | | | | 9,900,000 | |
6.75% (b)(d) | | | | | | | 25,341 | | | | 27,106,938 | |
Morgan Stanley, 5.45% (b)(d) | | | | | | | 26,340 | | | | 26,770,132 | |
NBCUniversal Enterprise, Inc., 5.25% (a)(d) | | | | | | | 4,000 | | | | 4,250,400 | |
State Street Capital Trust IV, 1.24%, 6/15/37 (b) | | | | | | | 23,965 | | | | 19,653,697 | |
Voya Financial, Inc., 5.65%, 5/15/53 (b)(h) | | | | | | | 46,090 | | | | 46,320,450 | |
Wells Fargo & Co., 5.88% (b)(d) | | | | | | | 6,645 | | | | 6,944,025 | |
| | | | | | | | | | | | |
| | | | | | | | | | | | 208,712,529 | |
Total Capital Trusts — 8.9% | | | | | | | | | | | 532,317,784 | |
| | | | | | | | | | | | |
| Preferred Stocks | | | | | Shares | | | | |
Netherlands — 0.4% | | | | | | | | | | | | |
RBS Capital Funding Trust V, 5.90% (c)(d) | | | | | | | 72,103 | | | | 1,762,197 | |
RBS Capital Funding Trust VI, 6.25% (d) | | | | | | | 151,363 | | | | 3,725,043 | |
RBS Capital Funding Trust VII, Series G,
6.08% (c)(d) | | | | | | | 728,691 | | | | 17,852,930 | |
| | | | | | | | | | | | |
| | | | | | | | | | | | 23,340,170 | |
United Kingdom — 0.1% | | | | | | | | | | | | |
Royal Bank of Scotland Group PLC,: | | | | | | | | | | | | |
6.12% (d) | | | | | | | 19,117 | | | | 468,558 | |
6.60% (d) | | | | | | | 95,580 | | | | 2,416,262 | |
| | | | | | | | | | | | |
| | | | | | | | | | | | 2,884,820 | |
United States — 1.2% | | | | | | | | | | | | |
Citigroup, Inc., 6.88% (d) | | | | | | | 1,302,000 | | | | 34,997,760 | |
The Goldman Sachs Group, Inc., 6.38% (d) | | | | | | | 493,000 | | | | 12,985,620 | |
SCE Trust III, 5.75% (d) | | | | | | | 80,000 | | | | 2,189,600 | |
Wells Fargo & Co., 5.85% (b)(d) | | | | | | | 552 | | | | 14,228,700 | |
United Technologies Corp., 7.50%, 8/01/15 (c) | | | | | | | 194,935 | | | | 11,684,404 | |
| | | | | | | | | | | | |
| | | | | | | | | | | | 76,086,084 | |
Total Preferred Stocks — 1.7% | | | | | | | | | | | 102,311,074 | |
Total Preferred Securities — 10.6% | | | | | | | | | | | 634,628,858 | |
| | | | | | | | | | | | |
| U.S. Treasury Obligations | | | | | Par
(000) | | | Value | |
U.S. Treasury Bonds: | | | | | | | | | | | | |
3.38%, 5/15/44 (h) | | | USD | | | | 35,175 | | | $ | 43,685,697 | |
3.13%, 8/15/44 (j)(k) | | | | | | | 99,911 | | | | 118,566,282 | |
U.S. Treasury Notes: | | | | | | | | | | | | |
1.00%, 9/15/17 | | | | | | | 3,940 | | | | 3,972,320 | |
0.88%, 1/15/18 (j) | | | | | | | 92,615 | | | | 92,904,422 | |
1.63%, 12/31/19 (j) | | | | | | | 3,890 | | | | 3,972,056 | |
1.25%, 1/31/20 | | | | | | | 149,680 | | | | 150,124,363 | |
2.13%, 12/31/21 | | | | | | | 30,410 | | | | 31,702,425 | |
2.25%, 11/15/24 (j) | | | | | | | 172,053 | | | | 180,870,711 | |
Total U.S. Treasury Obligations — 10.5% | | | | | | | | | | | 625,798,276 | |
Total Long-Term Investments (Cost — $6,433,721,614) — 103.3% | | | | | | | | | | | 6,164,911,338 | |
| | | | | | | | | | | | |
| Short-Term Securities | | | | | | | | | |
Borrowed Bond Agreements — 20.4% | | | | | | | | | | | | |
Barclays Bank PLC, (1.25)%, Open
(Purchased on 1/12/15 to be repurchased at $2,485,721, collateralized by Nigeria Government International Bonds, 6.38% due at 7/12/23, par and fair value of USD 2,700,000 and $2,491,182, respectively) (m) | | | | | | | 2,487 | | | | 2,487,189 | |
Barclays Bank PLC, (0.30)%, Open
(Purchased on 12/17/14 to be repurchased at EUR 4,215,161, collateralized by Buoni Poliennali Del Tesoro, 4.50% due at 3/01/26, par and fair value of EUR 3,250,000 and $4,672,242, respectively) (m) | | | EUR | | | | 4,217 | | | | 4,764,896 | |
Barclays Capital, Inc., (0.25)%, Open
(Purchased on 1/26/15 to be repurchased at $2,861,619, collateralized by Rio Tinto Finance USA PLC, 4.13% due at 8/21/42, par and fair value of USD 2,775,000 and $2,779,240, respectively) (m) | | | USD | | | | 2,862 | | | | 2,861,719 | |
Barclays Capital, Inc., (0.15)%, Open
(Purchased on 1/13/15 to be repurchased at $1,740,237, collateralized by United Rentals North America, Inc., 5.75% due at 11/15/24, par and fair value of USD 1,700,000 and $1,725,500, respectively) (m) | | | | | | | 1,740 | | | | 1,740,375 | |
Barclays Capital, Inc., (0.15)%, Open
(Purchased on 1/29/15 to be repurchased at $27,803,802, collateralized by Royal Bank of Canada, 2.15% due at 3/15/19, par and fair value of USD 27,060,000 and $27,681,216, respectively) (m) | | | | | | | 27,804 | | | | 27,804,150 | |
Barclays Capital, Inc., (0.15)%, Open
(Purchased on 12/16/14 to be repurchased at $24,244,039, collateralized by Potash Corp. of Saskatchewan, Inc., 5.63% due at 12/01/40, par and fair value of USD 19,999,000 and $25,947,543, respectively) (m) | | | | | | | 24,249 | | | | 24,248,787 | |
Barclays Capital, Inc., (0.10)%, Open
(Purchased on 1/12/15 to be repurchased at $22,143,770, collateralized by Citigroup, Inc., 5.88% due at 1/30/42, par and fair value of USD 17,200,000 and $22,406,784, respectively) (m) | | | | | | | 22,145 | | | | 22,145,000 | |
Barclays Capital, Inc., (0.10)%, Open
(Purchased on 1/23/15 to be repurchased at $4,128,803, collateralized by Standard Chartered PLC, 5.70% due at 3/26/44, par and fair value of USD 3,775,000 and $4,272,488, respectively) (m) | | | | | | | 4,129 | | | | 4,128,906 | |
See Notes to Financial Statements.
| | | | | | |
| 28 | | BLACKROCK FUNDS | | JANUARY 31, 2015 | | |
| | | | |
| Schedule of Investments (continued) | | | BlackRock Global Long/Short Credit Fund | |
| | | (Percentages shown are based on Net Assets) | |
| | | | | | | | | | | | |
| Short-Term Securities | | | | | Par
(000) | | | Value | |
Borrowed Bond Agreements (continued) | |
Barclays Capital, Inc., (0.10)%, Open
(Purchased on 1/26/15 to be repurchased at $2,339,492, collateralized by Chesapeake Energy Corp., 4.88% due at 4/15/22, par and fair value of USD 2,325,000 and $2,293,031, respectively) (m) | | | USD | | | | 2,340 | | | $ | 2,339,531 | |
Barclays Capital, Inc., (0.10)%, Open
(Purchased on 1/29/15 to be repurchased at $10,351,076, collateralized by Kinder Morgan, Inc., 4.30% due at 6/01/25, par and fair value of USD 9,870,000 and $10,305,356, respectively) (m) | | | | | | | 10,351 | | | | 10,351,163 | |
Barclays Capital, Inc., (0.10)%, Open
(Purchased on 10/14/14 to be repurchased at $5,579,195, collateralized by Wells Fargo & Co., 5.90%, par and fair value of USD 5,265,000 and $5,409,788, respectively) (m) | | | | | | | 5,581 | | | | 5,580,900 | |
Barclays Capital, Inc., (0.10)%, Open
(Purchased on 10/16/14 to be repurchased at $10,505,277, collateralized by Pfizer, Inc., 3.40% due at 5/15/24, par and fair value of USD 10,080,000 and $10,875,110, respectively) (m) | | | | | | | 10,508 | | | | 10,508,400 | |
Barclays Capital, Inc., (0.10)%, Open
(Purchased on 10/23/14 to be repurchased at $19,794,500, collateralized by International Business Machines Corp., 4.00% due at 6/20/42, par and fair value of USD 20,000,000 and $21,024,600, respectively) (m) | | | | | | | 19,800 | | | | 19,800,000 | |
Barclays Capital, Inc., (0.10)%, Open
(Purchased on 11/24/14 to be repurchased at $11,903,968, collateralized by AT&T, Inc., 4.35% due at 6/15/45, par and fair value of USD 12,500,000 and $12,425,200, respectively) (m) | | | | | | | 11,906 | | | | 11,906,250 | |
Barclays Capital, Inc., (0.10)%, Open
(Purchased on 12/04/14 to be repurchased at $1,354,107, collateralized by Apache Corp., 4.75% due at 4/15/43, par and fair value of USD 1,420,000 and $1,429,618, respectively) (m) | | | | | | | 1,354 | | | | 1,354,325 | |
Barclays Capital, Inc., (0.10)%, Open
(Purchased on 12/19/14 to be repurchased at $20,172,702, collateralized by Bank of America Corp., 3.30% due at 1/11/23, par and fair value of USD 20,000,000 and $20,435,540, respectively) (m) | | | | | | | 20,175 | | | | 20,175,000 | |
BNP Paribas Securities Corp., 0.10%, 2/02/15
(Purchased on 1/30/15 to be repurchased at $192,639, collateralized by U.S. Treasury Bonds, 3.00% due at 11/15/44, par and fair value of USD 165,000 and $191,451, respectively) | | | | | | | 193 | | | | 192,638 | |
BNP Paribas Securities Corp., 0.13%, Open
(Purchased on 1/30/15 to be repurchased at $70,831,543, collateralized by U.S. Treasury Notes, 2.13% due at 12/31/21, par and fair value of USD 68,025,000 and $70,916,063, respectively) (m) | | | | | | | 70,831 | | | | 70,831,031 | |
Citigroup Global Markets, Inc., (1.25)%, Open
(Purchased on 5/06/14 to be repurchased at $3,245,401, collateralized by Standard Chartered PLC, 5.30% due at 1/09/43, par and fair value of USD 3,200,000 and $3,415,869, respectively) (m) | | | | | | | 3,276 | | | | 3,276,000 | |
| | | | | | | | | | | | |
| Short-Term Securities | | | | | Par
(000) | | | Value | |
Borrowed Bond Agreements (continued) | |
Citigroup Global Markets, Inc., (1.00)%, Open
(Purchased on 11/12/14 to be repurchased at $2,561,564, collateralized by Motorola Solutions, Inc., 4.00% due at 9/01/24, par and fair value of USD 2,545,000 and $2,662,582, respectively) (m) | | | USD | | | | 2,567 | | | $ | 2,567,269 | |
Citigroup Global Markets, Inc., (0.75)%, Open
(Purchased on 12/01/14 to be repurchased at $2,918,725, collateralized by AT&T, Inc., 3.90% due at 3/11/24, par and fair value of USD 2,800,000 and $2,971,948, respectively) (m) | | | | | | | 2,923 | | | | 2,922,500 | |
Citigroup Global Markets, Inc., (0.35)%, Open
(Purchased on 11/21/14 to be repurchased at $9,768,158, collateralized by Standard Chartered PLC, 5.20% due at 1/26/24, par and fair value of USD 9,200,000 and $9,965,008, respectively) (m) | | | | | | | 9,775 | | | | 9,775,000 | |
Citigroup Global Markets, Inc., (0.10)%, Open
(Purchased on 1/12/15 to be repurchased at $20,319,371, collateralized by The Goldman Sachs Group, Inc., 4.80% due at 7/08/44, par and fair value of USD 18,600,000 and $21,082,561, respectively) (m) | | | | | | | 20,321 | | | | 20,320,500 | |
Citigroup Global Markets, Inc., (0.10)%, Open
(Purchased on 1/13/15 to be repurchased at $1,310,331, collateralized by Iron Mountain, Inc., 5.75% due at 8/15/24, par and fair value of USD 1,260,000 and $1,275,750, respectively) (m) | | | | | | | 1,310 | | | | 1,310,400 | |
Citigroup Global Markets, Inc., (0.10)%, Open
(Purchased on 1/23/15 to be repurchased at $3,286,418, collateralized by BHP Billiton Finance USA Ltd., 5.00% due at 9/30/43, par and fair value of USD 2,800,000 and $3,282,504, respectively) (m) | | | | | | | 3,287 | | | | 3,286,500 | |
Citigroup Global Markets, Inc., (0.10)%, Open
(Purchased on 10/01/14 to be repurchased at $24,658,412, collateralized by Morgan Stanley, 2.38% due at 7/23/19, par and fair value of USD 24,916,000 and $25,120,311, respectively) (m) | | | | | | | 24,667 | | | | 24,666,840 | |
Citigroup Global Markets, Inc., (0.10)%, Open
(Purchased on 10/01/14 to be repurchased at $50,045,395, collateralized by Wells Fargo & Co., 2.13% due at 4/22/19, par and fair value of USD 50,000,000 and $50,684,200, respectively) (m) | | | | | | | 50,063 | | | | 50,062,500 | |
Citigroup Global Markets, Inc., (0.10)%, Open
(Purchased on 10/02/14 to be repurchased at $5,437,357, collateralized by Pfizer, Inc., 3.40% due at 5/15/24, par and fair value of USD 5,230,000 and $5,642,542, respectively) (m) | | | | | | | 5,439 | | | | 5,439,200 | |
Citigroup Global Markets, Inc., (0.10)%, Open
(Purchased on 10/14/14 to be repurchased at $8,502,014, collateralized by Pfizer, Inc., 3.40% due at 5/15/24, par and fair value of USD 8,090,000 and $8,728,140, respectively) (m) | | | | | | | 8,505 | | | | 8,504,613 | |
Citigroup Global Markets, Inc., (0.10)%, Open
(Purchased on 10/30/14 to be repurchased at $30,779,461, collateralized by Anheuser-Busch InBev Finance, Inc., 3.70% due at 2/01/24, par and fair value of USD 30,000,000 and $32,431,770, respectively) (m) | | | | | | | 30,788 | | | | 30,787,500 | |
See Notes to Financial Statements.
| | | | | | |
| | | BLACKROCK FUNDS | | JANUARY 31, 2015 | | 29 |
| | | | |
| Schedule of Investments (continued) | | | BlackRock Global Long/Short Credit Fund | |
| | | (Percentages shown are based on Net Assets) | |
| | | | | | | | | | | | |
| Short-Term Securities | | | | | Par
(000) | | | Value | |
Borrowed Bond Agreements (continued) | |
Citigroup Global Markets, Inc., (0.10)%, Open
(Purchased on 11/06/13 to be repurchased at $4,968,754, collateralized by International Business Machines Corp., 3.38% due at 8/01/23, par and fair value of USD 5,000,000 and $5,295,690, respectively) (m) | | | USD | | | | 4,975 | | | $ | 4,975,000 | |
Citigroup Global Markets, Inc., (0.10)%, Open
(Purchased on 11/14/14 to be repurchased at $3,880,458, collateralized by BAE Systems Holdings, Inc., 3.80% due at 10/07/24, par and fair value of USD 3,862,000 and $4,129,872, respectively) (m) | | | | | | | 3,881 | | | | 3,881,310 | |
Citigroup Global Markets, Inc., (0.10)%, Open
(Purchased on 11/21/14 to be repurchased at $5,502,418, collateralized by Freeport-McMoRan, Inc., 5.45% due at 3/15/43, par and fair value of USD 5,746,000 and $4,812,867, respectively) (m) | | | | | | | 5,504 | | | | 5,503,519 | |
Citigroup Global Markets, Inc., (0.10)%, Open
(Purchased on 12/04/14 to be repurchased at $4,973,435, collateralized by Noble Energy, Inc., 5.05% due at 11/15/44, par and fair value of USD 5,050,000 and $5,139,218, respectively) (m) | | | | | | | 4,974 | | | | 4,974,250 | |
Citigroup Global Markets, Inc., (0.10)%, Open
(Purchased on 12/17/14 to be repurchased at $7,592,780, collateralized by Amazon.com, Inc., 3.80% due at 12/05/24, par and fair value of USD 7,500,000 and $7,935,968, respectively) (m) | | | | | | | 7,594 | | | | 7,593,750 | |
Citigroup Global Markets, Inc., (0.10)%, Open
(Purchased on 12/18/14 to be repurchased at $2,462,192, collateralized by Sunoco Logistics Partners Operations LP, 5.35% due at 5/15/45, par and fair value of USD 2,500,000 and $2,670,773, respectively) (m) | | | | | | | 2,463 | | | | 2,462,500 | |
Citigroup Global Markets, Inc., (0.10)%, Open
(Purchased on 12/23/14 to be repurchased at $1,465,806, collateralized by Eastman Chemical Co., 3.60% due at 8/15/22, par and fair value of USD 1,425,000 and $1,492,981, respectively) (m) | | | | | | | 1,466 | | | | 1,465,969 | |
Citigroup Global Markets, Inc., (0.10)%, Open
(Purchased on 9/30/14 to be repurchased at $2,739,144, collateralized by Pfizer, Inc., 4.40% due at 5/15/44, par and fair value of USD 2,670,000 and $3,094,097, respectively) (m) | | | | | | | 2,740 | | | | 2,740,087 | |
Credit Suisse Securities (USA) LLC, (0.15)%, Open
(Purchased on 1/13/15 to be repurchased at $2,661,539, collateralized by Freescale Semiconductor, Inc., 6.00% due at 1/15/22, par and fair value of USD 2,535,000 and $2,687,100, respectively) (m) | | | | | | | 2,662 | | | | 2,661,750 | |
Credit Suisse Securities (USA) LLC, (0.15)%, Open (Purchased on 10/01/14 to be repurchased at $49,849,647, collateralized by Bank of America Corp., 2.65% due at 4/01/19, par and fair value of USD 50,000,000 and $51,066,000, respectively) (m) | | | | | | | 49,875 | | | | 49,875,000 | |
Credit Suisse Securities (USA) LLC, (0.15)%, Open (Purchased on 10/08/14 to be repurchased at $25,071,876, collateralized by Morgan Stanley, 2.38% due at 7/23/19, par and fair value of USD 25,084,000 and $25,289,689, respectively) (m) | | | | | | | 25,084 | | | | 25,084,000 | |
| | | | | | | | | | | | |
| Short-Term Securities | | | | | Par
(000) | | | Value | |
Borrowed Bond Agreements (continued) | |
Credit Suisse Securities (USA) LLC, (0.15)%, Open
(Purchased on 10/27/14 to be repurchased at $11,170,483, collateralized by Citigroup, Inc., 5.50% due at 9/13/25, par and fair value of USD 10,000,000 and $11,314,140, respectively) (m) | | | USD | | | | 11,175 | | | $ | 11,175,000 | |
Credit Suisse Securities (USA) LLC, 0.00%, 12/31/22
(Purchased on 10/29/14 to be repurchased at $4,925,000, collateralized by Microsoft Corp., 2.38% due at 5/01/23, par and fair value of USD 5,000,000 and $5,104,540, respectively) | | | | | | | 4,925 | | | | 4,925,000 | |
Credit Suisse Securities (USA) LLC, 0.10%, Open
(Purchased on 11/19/14 to be repurchased at $193,450,420, collateralized by U.S. Treasury Notes, 2.38% due at 8/15/24, par and fair value of USD 191,733,000 and $203,656,492, respectively) (m) | | | | | | | 193,411 | | | | 193,410,652 | |
Credit Suisse Securities (USA) LLC, 0.15%, 12/31/22
(Purchased on 12/18/14 to be repurchased at $14,706,712, collateralized by U.S. Treasury Notes, 1.50% due at 12/31/18, par and fair value of USD 14,490,000 and $14,754,892, respectively) | | | | | | | 14,617 | | | | 14,616,996 | |
Deutsche Bank Securities, Inc., (0.15)%, Open
(Purchased on 10/08/14 to be repurchased at $5,207,391, collateralized by Westpac Banking Corp., 2.25% due at 7/30/18, par and fair value of USD 5,114,000 and $5,227,658, respectively) (m) | | | | | | | 5,210 | | | | 5,209,887 | |
Deutsche Bank Securities, Inc., (0.15)%, Open
(Purchased on 10/28/14 to be repurchased at $11,946,269, collateralized by Amazon.com, Inc., 2.50% due at 11/29/22, par and fair value of USD 12,580,000 and $12,334,136, respectively) (m) | | | | | | | 11,951 | | | | 11,951,000 | |
Deutsche Bank Securities, Inc., (0.15)%, Open
(Purchased on 11/18/14 to be repurchased at $5,254,607, collateralized by Energy Transfer Partners LP, 4.65% due at 6/01/21, par and fair value of USD 5,000,000 and $5,355,330, respectively) (m) | | | | | | | 5,256 | | | | 5,256,250 | |
Deutsche Bank Securities, Inc., 0.04%, Open
(Purchased on 1/14/15 to be repurchased at $8,674,617, collateralized by U.S. Treasury Bonds, 3.00% due at 11/15/44, par and fair value of USD 7,685,000 and $8,916,998, respectively) (m) | | | | | | | 8,674 | | | | 8,674,444 | |
J.P. Morgan Securities LLC, (0.15)%, Open (Purchased on 1/23/15 to be repurchased at $26,082,334, collateralized by Wells Fargo & Co., 4.10% due at 6/03/26, par and fair value of USD 24,990,000 and $26,454,739, respectively) (m) | | | | | | | 26,083 | | | | 26,083,313 | |
J.P. Morgan Securities LLC, (0.10)%, Open
(Purchased on 1/12/15 to be repurchased at $17,998,375, collateralized by Bank of America Corp., 5.00% due at 1/21/44, par and fair value of USD 15,500,000 and $18,366,183, respectively) (m) | | | | | | | 17,999 | | | | 17,999,375 | |
See Notes to Financial Statements.
| | | | | | |
| 30 | | BLACKROCK FUNDS | | JANUARY 31, 2015 | | |
| | | | |
| Schedule of Investments (continued) | | | BlackRock Global Long/Short Credit Fund | |
| | | (Percentages shown are based on Net Assets) | |
| | | | | | | | | | | | |
| Short-Term Securities | | | | | Par
(000) | | | Value | |
Borrowed Bond Agreements (continued) | | | | | | | | | | | | |
J.P. Morgan Securities LLC, (0.10)%, Open
(Purchased on 12/04/14 to be repurchased at $17,261,171, collateralized by Verizon Communications, Inc., 6.40% due at 9/15/33, par and fair value of USD 14,018,000 and $18,131,568, respectively) (m) | | | USD | | | | 17,264 | | | $ | 17,264,000 | |
J.P. Morgan Securities LLC, (0.10)%, Open
(Purchased on 12/18/14 to be repurchased at $50,431,195, collateralized by Citigroup, Inc., 2.50% due at 7/29/19, par and fair value of USD 50,000,000 and $50,741,550, respectively) (m) | | | | | | | 50,438 | | | | 50,437,500 | |
J.P. Morgan Securities LLC, (0.10)%, Open
(Purchased on 12/30/14 to be repurchased at $20,461,081, collateralized by Bank of America Corp., 4.25% due at 10/22/26, par and fair value of USD 20,000,000 and $20,767,800, respectively) (m) | | | | | | | 20,463 | | | | 20,462,900 | |
J.P. Morgan Securities LLC, (0.05)%, Open
(Purchased on 11/24/14 to be repurchased at $16,513,890, collateralized by Verizon Communications, Inc., 6.40% due at 9/15/33, par and fair value of USD 13,482,000 and $17,438,280, respectively) (m) | | | | | | | 16,515 | | | | 16,515,450 | |
JPMorgan Chase Bank N.A., (0.50)%, Open
(Purchased on 1/12/15 to be repurchased at $2,607,650, collateralized by Ecuador Government International Bonds, 7.95% due at 6/20/24, par and fair value of USD 3,000,000 and $2,655,000, respectively) (m) | | | | | | | 2,608 | | | | 2,608,266 | |
JPMorgan Chase Bank N.A., (0.18)%, Open
(Purchased on 12/16/14 to be repurchased at EUR 12,217,754, collateralized by Federal Republic of Germany, 0.75% due at 2/24/17, par and fair value of EUR 11,877,000 and $13,669,367, respectively) (m) | | | EUR | | | | 12,221 | | | | 13,809,103 | |
JPMorgan Chase Bank N.A., (0.18)%, Open
(Purchased on 12/16/14 to be repurchased at EUR 6,204,697, collateralized by Federal Republic of Germany, 2.50% due at 1/04/21, par and fair value of EUR 5,295,000 and $6,868,135, respectively) (m) | | | | | | | 6,206 | | | | 7,012,852 | |
Merrill Lynch, Pierce, Fenner & Smith, Inc., (0.18)%, Open
(Purchased on 1/12/15 to be repurchased at $20,853,539, collateralized by Morgan Stanley, 6.38% due at 7/24/42, par and fair value of USD 14,700,000 and $20,014,476, respectively) (m) | | | USD | | | | 20,856 | | | | 20,855,625 | |
Merrill Lynch, Pierce, Fenner & Smith, Inc., (0.18)%, Open
(Purchased on 11/24/14 to be repurchased at $2,521,005, collateralized by International Paper Co., 3.65% due at 6/15/24, par and fair value of USD 2,500,000 and $2,589,418, respectively) (m) | | | | | | | 2,522 | | | | 2,521,875 | |
Merrill Lynch, Pierce, Fenner & Smith, Inc., (0.15)%, Open
(Purchased on 10/08/14 to be repurchased at $6,906,410, collateralized by Standard Chartered PLC, 5.70% due at 3/26/44, par and fair value of USD 6,225,000 and $7,045,362, respectively) (m) | | | | | | | 6,910 | | | | 6,909,750 | |
Merrill Lynch, Pierce, Fenner & Smith, Inc., (0.15)%, Open
(Purchased on 5/01/14 to be repurchased at $4,794,500, collateralized by Amazon.com, Inc., 2.50% due at 11/29/22, par and fair value of USD 5,000,000 and $4,902,280, respectively) (m) | | | | | | | 4,800 | | | | 4,800,000 | |
| | | | | | | | | | | | |
| Short-Term Securities | | | | | Par
(000) | | | Value | |
Borrowed Bond Agreements (concluded) | | | | | | | | | | | | |
Merrill Lynch, Pierce, Fenner & Smith, Inc., 0.10%, Open
(Purchased on 11/19/14 to be repurchased at $85,209,475, collateralized by U.S. Treasury Notes, 2.13% due at 9/30/21, par and fair value of USD 84,453,000 and $87,982,882, respectively) (m) | | | USD | | | | 85,192 | | | $ | 85,191,957 | |
Merrill Lynch, Pierce, Fenner & Smith, Inc., 0.10%, Open
(Purchased on 12/09/14 to be repurchased at $18,959,587, collateralized by U.S. Treasury Notes, 2.00% due at 10/31/21, par and fair value of USD 18,839,000 and $19,464,511, respectively) (m) | | | | | | | 18,957 | | | | 18,956,739 | |
RBC Capital Markets, LLC, (1.50)%, Open
(Purchased on 5/06/14 to be repurchased at $3,863,333, collateralized by Standard Chartered PLC, 5.30% due at 1/09/43, par and fair value of USD 3,775,000 and $4,029,658, respectively) (m) | | | | | | | 3,907 | | | | 3,907,125 | |
RBC Capital Markets, LLC, (0.30)%, Open
(Purchased on 12/19/14 to be repurchased at $9,227,615, collateralized by Molson Coors Brewing Co., 3.50% due at 5/01/22, par and fair value of USD 9,050,000 and $9,477,784, respectively) (m) | | | | | | | 9,231 | | | | 9,231,000 | |
RBC Capital Markets, LLC, (0.25)%, Open
(Purchased on 1/21/15 to be repurchased at $10,884,468, collateralized by Canadian Natural Resources Ltd., 3.90% due at 2/01/25, par and fair value of USD 10,940,000 and $10,833,226, respectively) (m) | | | | | | | 10,885 | | | | 10,885,300 | |
RBC Capital Markets, LLC, (0.10)%, Open
(Purchased on 1/08/15 to be repurchased at $21,998,533, collateralized by Walgreens Boots Alliance, Inc., 4.80% due at 11/18/44, par and fair value of USD 20,000,000 and $22,723,980, respectively) (m) | | | | | | | 22,000 | | | | 22,000,000 | |
RBC Capital Markets, LLC, (0.10)%, Open
(Purchased on 1/12/15 to be repurchased at $17,939,003, collateralized by JPMorgan Chase & Co., 4.85% due at 2/01/44, par and fair value of USD 15,600,000 and $18,384,928, respectively) (m) | | | | | | | 17,940 | | | | 17,940,000 | |
RBC Capital Markets, LLC, (0.10)%, Open
(Purchased on 1/26/15 to be repurchased at $1,171,484, collateralized by CIT Group, Inc., 5.00% due at 8/01/23, par and fair value of USD 1,100,000 and $1,157,750, respectively) (m) | | | | | | | 1,172 | | | | 1,171,500 | |
RBC Capital Markets, LLC, (0.10)%, Open
(Purchased on 11/18/14 to be repurchased at $4,973,964, collateralized by Noble Energy, Inc., 3.90% due at 11/15/24, par and fair value of USD 5,000,000 and $5,048,600, respectively) (m) | | | | | | | 4,975 | | | | 4,975,000 | |
RBC Capital Markets, LLC, (0.10)%, Open
(Purchased on 11/21/14 to be repurchased at $11,883,123, collateralized by Citigroup, Inc., 4.50% due at 1/14/22, par and fair value of USD 10,805,000 and $12,101,395, respectively) (m) | | | | | | | 11,886 | | | | 11,885,500 | |
RBC Capital Markets, LLC, (0.10)%, Open
(Purchased on 12/04/14 to be repurchased at $49,991,944, collateralized by The Goldman Sachs Group, Inc., 2.55% due at 10/23/19, par and fair value of USD 50,000,000 and $50,686,550, respectively) (m) | | | | | | | 50,000 | | | | 50,000,000 | |
See Notes to Financial Statements.
| | | | | | |
| | | BLACKROCK FUNDS | | JANUARY 31, 2015 | | 31 |
| | | | |
| Schedule of Investments (continued) | | | BlackRock Global Long/Short Credit Fund | |
| | | (Percentages shown are based on Net Assets) | |
| | | | | | | | | | | | |
| Short-Term Securities | | | | | | | |
Value | |
Total Short-Term Securities (Cost — $1,218,478,017) — 20.4% | | | $ | 1,215,999,576 | |
| | | | | | | | | | | | |
| Options Purchased | | | | | | | | | |
(Cost — $2,645,591) — 0.0% | | | | 2,162,110 | |
Total Investments Before Options Written, Borrowed Bonds and Investments Sold Short (Cost — $7,654,845,222) — 123.7% | | | | 7,383,073,024 | |
| | | | | | | | | | | | |
| Options Written | | | | | | | | | |
(Premiums Received — $302,542) — (0.0)% | | | | (166,000 | ) |
| | | | | | | | | | | | |
| | | | |
| Borrowed Bonds | | | | | Par
(000) | | | | |
Corporate Bonds — (13.6)% | | | | | | | | | | | | |
Amazon.com, Inc.: | | | | | | | | | | | | |
2.50%, 11/29/22 | | | USD | | | | 17,580 | | | | (17,236,416 | ) |
3.80%, 12/05/24 | | | | | | | 7,500 | | | | (7,935,968 | ) |
Anheuser-Busch InBev Finance, Inc., 3.70%, 2/01/24 | | | | | | | 30,000 | | | | (32,431,770 | ) |
Apache Corp., 4.75%, 4/15/43 | | | | | | | 1,420 | | | | (1,429,618 | ) |
AT&T, Inc.: | | | | | | | | | | | | |
3.90%, 3/11/24 | | | | | | | 2,800 | | | | (2,971,948 | ) |
4.35%, 6/15/45 | | | | | | | 12,500 | | | | (12,425,200 | ) |
BAE Systems Holdings, Inc., 3.80%, 10/07/24 | | | | | | | 3,862 | | | | (4,129,872 | ) |
Bank of America Corp.: | | | | | | | | | | | | |
2.65%, 4/01/19 | | | | | | | 50,000 | | | | (51,066,000 | ) |
3.30%, 1/11/23 | | | | | | | 20,000 | | | | (20,435,540 | ) |
4.25%, 10/22/26 | | | | | | | 20,000 | | | | (20,767,800 | ) |
5.00%, 1/21/44 | | | | | | | 15,500 | | | | (18,366,183 | ) |
BHP Billiton Finance USA Ltd., 5.00%, 9/30/43 | | | | | | | 2,800 | | | | (3,282,504 | ) |
Canadian Natural Resources Ltd., 3.90%, 2/01/25 | | | | | | | 10,940 | | | | (10,833,226 | ) |
Chesapeake Energy Corp., 4.88%, 4/15/22 | | | | | | | 2,325 | | | | (2,293,031 | ) |
CIT Group, Inc., 5.00%, 8/01/23 | | | | | | | 1,100 | | | | (1,157,750 | ) |
Citigroup, Inc.: | | | | | | | | | | | | |
2.50%, 7/29/19 | | | | | | | 50,000 | | | | (50,741,550 | ) |
4.50%, 1/14/22 | | | | | | | 10,805 | | | | (12,101,395 | ) |
5.50%, 9/13/25 | | | | | | | 10,000 | | | | (11,314,140 | ) |
5.88%, 1/30/42 | | | | | | | 17,200 | | | | (22,406,784 | ) |
Eastman Chemical Co., 3.60%, 8/15/22 | | | | | | | 1,425 | | | | (1,492,981 | ) |
Energy Transfer Partners LP, 4.65%, 6/01/21 | | | | | | | 5,000 | | | | (5,355,330 | ) |
Freeport-McMoRan, Inc., 5.45%, 3/15/43 | | | | | | | 5,746 | | | | (4,812,867 | ) |
Freescale Semiconductor, Inc., 6.00%, 1/15/22 | | | | | | | 2,535 | | | | (2,687,100 | ) |
The Goldman Sachs Group, Inc.: | | | | | | | | | | | | |
2.55%, 10/23/19 | | | | | | | 50,000 | | | | (50,686,550 | ) |
4.80%, 7/08/44 | | | | | | | 18,600 | | | | (21,082,561 | ) |
International Business Machines Corp.: | | | | | | | | | | | | |
3.38%, 8/01/23 | | | | | | | 5,000 | | | | (5,295,690 | ) |
4.00%, 6/20/42 | | | | | | | 20,000 | | | | (21,024,600 | ) |
International Paper Co., 3.65%, 6/15/24 | | | | | | | 2,500 | | | | (2,589,418 | ) |
Iron Mountain, Inc., 5.75%, 8/15/24 | | | | | | | 1,260 | | | | (1,275,750 | ) |
JPMorgan Chase & Co., 4.85%, 2/01/44 | | | | | | | 15,600 | | | | (18,384,928 | ) |
Kinder Morgan, Inc., 4.30%, 6/01/25 | | | | | | | 9,870 | | | | (10,305,356 | ) |
Microsoft Corp., 2.38%, 5/01/23 | | | | | | | 5,000 | | | | (5,104,540 | ) |
Molson Coors Brewing Co., 3.50%, 5/01/22 | | | | | | | 9,050 | | | | (9,477,784 | ) |
Morgan Stanley: | | | | | | | | | | | | |
2.38%, 7/23/19 | | | | | | | 50,000 | | | | (50,410,000 | ) |
6.38%, 7/24/42 | | | | | | | 14,700 | | | | (20,014,476 | ) |
Motorola Solutions, Inc., 4.00%, 9/01/24 | | | | | | | 2,545 | | | | (2,662,582 | ) |
| | | | | | | | | | | | |
| Borrowed Bonds | | | | | Par (000) | | | Value | |
Corporate Bonds (concluded) | | | | | | | | | | | | |
Noble Energy, Inc.: | | | | | | | | | | | | |
3.90%, 11/15/24 | | | USD | | | | 5,000 | | | $ | (5,048,600 | ) |
5.05%, 11/15/44 | | | | | | | 5,050 | | | | (5,139,218 | ) |
Pfizer, Inc.: | | | | | | | | | | | | |
3.40%, 5/15/24 | | | | | | | 23,400 | | | | (25,245,792 | ) |
4.40%, 5/15/44 | | | | | | | 2,670 | | | | (3,094,097 | ) |
Potash Corp. of Saskatchewan, Inc., 5.63%, 12/01/40 | | | | | | | 19,999 | | | | (25,947,543 | ) |
Rio Tinto Finance USA PLC, 4.13%, 8/21/42 | | | | | | | 2,775 | | | | (2,779,240 | ) |
Royal Bank of Canada, 2.15%, 3/15/19 | | | | | | | 27,060 | | | | (27,681,216 | ) |
Standard Chartered PLC: | | | | | | | | | | | | |
5.20%, 1/26/24 | | | | | | | 9,200 | | | | (9,965,008 | ) |
5.30%, 1/09/43 | | | | | | | 6,975 | | | | (7,445,527 | ) |
5.70%, 3/26/44 | | | | | | | 10,000 | | | | (11,317,850 | ) |
Sunoco Logistics Partners Operations LP, 5.35%, 5/15/45 | | | | | | | 2,500 | | | | (2,670,773 | ) |
United Rentals North America, Inc., 5.75%, 11/15/24 | | | | | | | 1,700 | | | | (1,725,500 | ) |
Verizon Communications, Inc., 6.40%, 9/15/33 | | | | | | | 27,500 | | | | (35,569,848 | ) |
Walgreens Boots Alliance, Inc., 4.80%, 11/18/44 | | | | | | | 20,000 | | | | (22,723,980 | ) |
Wells Fargo & Co.: | | | | | | | | | | | | |
2.13%, 4/22/19 | | | | | | | 50,000 | | | | (50,684,200 | ) |
4.10%, 6/03/26 | | | | | | | 24,990 | | | | (26,454,739 | ) |
5.90% (b)(d) | | | | | | | 5,265 | | | | (5,409,788 | ) |
Westpac Banking Corp., 2.25%, 7/30/18 | | | | | | | 5,114 | | | | (5,227,658 | ) |
| | | | | | | | | | | | |
| | | | | | | | | | | | (810,119,785 | ) |
Foreign Government Obligations — (0.5)% | | | | | | | | | | | | |
Buoni Poliennali Del Tesoro, 4.50%, 3/01/26 | | | EUR | | | | 3,250 | | | | (4,672,242 | ) |
Ecuador Government International Bonds, 7.95%, 6/20/24 | | | USD | | | | 3,000 | | | | (2,655,000 | ) |
Federal Republic of Germany: | | | | | | | | | | | | |
0.75%, 2/24/17 | | | EUR | | | | 11,877 | | | | (13,669,367 | ) |
2.50%, 1/04/21 | | | | | | | 5,295 | | | | (6,868,135 | ) |
Nigeria Government International Bonds, 6.38%, 7/12/23 | | | USD | | | | 2,700 | | | | (2,491,182 | ) |
| | | | | | | | | | | | |
| | | | | | | | | | | | (30,355,926 | ) |
U.S. Treasury Obligations — (6.8)% | | | | | | | | | | | | |
U.S. Treasury Bonds, 3.00%, 11/15/44 | | | | | | | 7,850 | | | | (9,108,449 | ) |
U.S. Treasury Notes: | | | | | | | | | | | | |
1.50%, 12/31/18 | | | | | | | 14,490 | | | | (14,754,892 | ) |
2.00%, 10/31/21 | | | | | | | 18,839 | | | | (19,464,511 | ) |
2.13%, 9/30/21-12/31/21 | | | | | | | 152,478 | | | | (158,898,945 | ) |
2.38%, 8/15/24 | | | | | | | 191,733 | | | | (203,656,492 | ) |
| | | | | | | | | | | | |
| | | | | | | | | | | | (405,883,289 | ) |
Total Borrowed Bonds (Proceeds — $1,207,395,297) — (20.9)% | | | | (1,246,359,000 | ) |
| | | | | | | | | | | | |
| Investments Sold Short | | | | | Shares | | | | |
Common Stocks — (0.4)% | | | | | | | | | | | | |
Amazon.com, Inc. (c) | | | | | | | 7,650 | | | | (2,712,155 | ) |
Antero Resources Corp. | | | | | | | 8,450 | | | | (292,793 | ) |
California Resources Corp. | | | | | | | 180,200 | | | | (922,624 | ) |
Caterpillar, Inc. | | | | | | | 43,140 | | | | (3,449,906 | ) |
Cheniere Energy, Inc. | | | | | | | 4,825 | | | | (344,409 | ) |
Citigroup, Inc. | | | | | | | 37,700 | | | | (1,770,015 | ) |
Concho Resources, Inc. (c) | | | | | | | 4,900 | | | | (543,165 | ) |
Ford Motor Co. | | | | | | | 16,750 | | | | (246,393 | ) |
Genworth Financial, Inc., Class A (c) | | | | | | | 113,980 | | | | (795,580 | ) |
Hewlett-Packard Co. | | | | | | | 113,960 | | | | (4,117,375 | ) |
See Notes to Financial Statements.
| | | | | | |
| 32 | | BLACKROCK FUNDS | | JANUARY 31, 2015 | | |
| | | | |
| Schedule of Investments (continued) | | | BlackRock Global Long/Short Credit Fund | |
| | | (Percentages shown are based on Net Assets) | |
| | | | | | | | | | | | |
| Investments Sold Short | | | | | Shares | | | Value | |
Common Stocks (concluded) | | | | | | | | | | | | |
JPMorgan Chase & Co. | | | | | | | 25,000 | | | $ | (1,359,500 | ) |
Kinder Morgan, Inc. | | | | | | | 25,500 | | | | (1,046,775 | ) |
PowerShares Senior Loan Portfolio | | | | | | | 202,000 | | | | (4,841,940 | ) |
SPDR S&P Oil & Gas Exploration & Production ETF | | | | | | | 60,000 | | | | (2,770,800 | ) |
Union Pacific Corp. | | | | | | | 7,275 | | | | (852,703 | ) |
Whiting Petroleum Corp. (c) | | | | | | | 3,600 | | | | (108,072 | ) |
WPX Energy, Inc. | | | | | | | 30,000 | | | | (319,800 | ) |
| | | | | | | | | | | | |
| | | | | | | | | | | | (26,494,005 | ) |
| | | | | | | | | | | | |
| Corporate Bonds — (0.1)% | | | | | Par (000) | | | | |
Chesapeake Energy Corp., 4.88%, 04/15/22 | | | USD | | | | 321 | | | | (316,586 | ) |
Kinder Morgan, Inc., 4.30%, 06/01/25 | | | | | | | 3,510 | | | | (3,664,823 | ) |
| | | | | | | | | | | | |
| | | | | | | | | | | | (3,981,409 | ) |
| | | | | | | | | | |
| Investment Companies — (0.4)% | | | | Shares | | | Value | |
Financial Select Sector SPDR Fund | | | | | 213,000 | | | $ | (4,901,130 | ) |
iShares iBoxx $ High Yield Corporate Bond ETF (l) | | | | | 76,725 | | | | (6,922,897 | ) |
iShares U.S. Preferred Stock ETF (l) | | | | | 270,000 | | | | (10,789,194 | ) |
Market Vector Semiconductor ETF | | | | | 14,000 | | | | (737,660 | ) |
| | | | | | | | | | |
| | | | | | | | | | (23,350,881 | ) |
Total Investments Sold Short (Proceeds — $54,958,457) — (0.9)% | | | | | | | | | (53,826,295 | ) |
Total Investments Net of Options Written, Borrowed Bonds and Investments Sold Short — 101.9% | | | | 6,082,721,729 | |
Liabilities in Excess of Other Assets — (1.9)% | | | | (111,782,463 | ) |
| | | | | | | | | | |
Net Assets — 100.0% | | | | | | | | $ | 5,970,939,266 | |
| | | | | | | | | | |
|
| Notes to Schedule of Investments |
| (a) | Security exempt from registration pursuant to Rule 144A under the Securities Act of 1933, as amended. These securities may be resold in transactions exempt from registration to qualified institutional investors. |
| (b) | Variable rate security. Rate shown is as of report date. |
| (c) | Non-income producing security. |
| (d) | Security is perpetual in nature and has no stated maturity date. |
| (e) | Represents a payment-in-kind security which may pay interest/dividends in additional par/shares and/or in cash. Rates shown are the current rate and possible payment rates. |
| (h) | All or a portion of security has been pledged as collateral in connection with outstanding borrowed bonds. |
| (i) | Represents a step-up bond that pays an initial coupon rate for the first period and then a higher coupon rate for the following periods. Rate shown is as of report date. |
| (j) | All or a portion of security has been pledged as collateral in connection with outstanding reverse repurchase agreements. |
| (k) | All or a portion of security has been pledged as collateral in connection with outstanding OTC derivatives. |
| (l) | During the six months ended January 31, 2015, investments in issuers considered to be an affiliate of the Fund for purposes of Section 2(a)(3) of the Investment Company Act of 1940, as amended, were as follows: |
| | | | | | | | | | | | | | | | | | | | | | | | |
| Affiliate | | Shares Held at
July 31, 2014 | | | Shares
Sold | | | Shares Held at
January 31, 2015 | | | Value at
January 31, 2015 | | | Income/
(Expense) | | | Realized
Gain | |
BlackRock Liquidity Funds, TempFund, Institutional Class | | | 668,356,706 | | | | (668,356,706 | )1 | | | — | | | | — | | | $ | 93,613 | | | $ | 47,877 | |
iShares iBoxx $ High Yield Corporate Bond ETF | | | — | | | | (76,725 | ) | | | (76,725 | ) | | $ | (6,922,897 | ) | | $ | (39,144 | ) | | | — | |
iShares U.S. Preferred Stock ETF | | | — | | | | (270,000 | ) | | | (270,000 | ) | | $ | (10,789,194 | ) | | $ | (101,928 | ) | | | — | |
| | 1 | | Represents net shares sold. |
| (m) | The amount to be repurchased assumes the maturity will terminate on the day after the report date. |
| Ÿ | | As of January 31, 2015, reverse repurchase agreements outstanding were as follows: |
| | | | | | | | | | | | | | | | |
| Counterparty | | Interest
Rate | | | Trade
Date | | Maturity
Date | | Face
Value | | | Face Value
Including
Accrued Interest | |
Credit Suisse Securities (USA) LLC | | | 0.00 | % | | 1/30/15 | | 2/02/15 | | $ | 201,906,229 | | | $ | 201,906,229 | |
J.P Morgan Securities LLC | | | 0.12 | % | | 1/30/15 | | 2/02/15 | | | 60,150,000 | | | | 60,150,602 | |
Merrill Lynch, Pierce, Fenner & Smith, Inc. | | | 0.00 | % | | 1/30/15 | | 2/02/15 | | | 48,314,219 | | | | 48,314,219 | |
Merrill Lynch, Pierce, Fenner & Smith, Inc. | | | 0.10 | % | | 1/30/15 | | 2/02/15 | | | 7,230,000 | | | | 7,230,060 | |
Total | | | | | | | | | | $ | 317,600,448 | | | $ | 317,601,110 | |
| | | | | | | | | | | | |
See Notes to Financial Statements.
| | | | | | |
| | | BLACKROCK FUNDS | | JANUARY 31, 2015 | | 33 |
| | | | |
| Schedule of Investments (continued) | | | BlackRock Global Long/Short Credit Fund | |
| Ÿ | | As of January 31, 2015, financial futures contracts outstanding were as follows: |
| | | | | | | | | | | | | | | | | | | | |
Contracts
Long/ (Short) | | | Issue | | Exchange | | Expiration | | | | | Notional Value | | | Unrealized
Appreciation
(Depreciation) | |
| | (354 | ) | | E-Mini S&P 500 Futures | | Chicago Mercantile | | March 2015 | | | USD | | | | 35,194,680 | | | $ | 651,981 | |
| | 355 | | | Euro STOXX 50 Index | | Eurex | | March 2015 | | | USD | | | | 13,434,449 | | | | 241,057 | |
| | (2,663 | ) | | Euro STOXX Banks Index | | Eurex | | March 2015 | | | USD | | | | 19,439,274 | | | | 583,326 | |
| | (4,305 | ) | | Euro-Bobl | | Eurex | | March 2015 | | | USD | | | | 636,730,982 | | | | (6,717,084 | ) |
| | (2,859 | ) | | Euro-Bund | | Eurex | | March 2015 | | | USD | | | | 514,934,019 | | | | (14,541,337 | ) |
| | | | Euro-Bund 8.5 to 10.5-Year Bond Futures Put | | | | | | | | | | | | | | | | |
| | 1,536 | | | Options, Strike Price EUR 153 | | Eurex | | March 2015 | | | USD | | | | 17,357 | | | | (744,947 | ) |
| | | | Euro-Bund 8.5 to 10.5-Year Bond Futures Put | | | | | | | | | | | | | | | | |
| | 1,179 | | | Options, Strike Price EUR 153.50 | | Eurex | | March 2015 | | | USD | | | | 13,323 | | | | (737,519 | ) |
| | (563 | ) | | Euro-Schatz | | Eurex | | March 2015 | | | USD | | | | 70,763,074 | | | | (196,635 | ) |
| | (411 | ) | | Long Gilt British | | NYSE Liffe | | March 2015 | | | USD | | | | 76,681,806 | | | | (4,397,210 | ) |
| | (137 | ) | | NASDAQ 100 E-Mini Futures | | Chicago Mercantile | | March 2015 | | �� | USD | | | | 11,347,025 | | | | 157,624 | |
| | (72 | ) | | Russell 2000 Mini Index Futures | | NYSE Liffe | | March 2015 | | | USD | | | | 8,360,640 | | | | (28,183 | ) |
| | (255 | ) | | U.S. Treasury Bonds (30 Year) | | Chicago Board of Trade | | March 2015 | | | USD | | | | 38,576,719 | | | | (2,603,218 | ) |
| | (10 | ) | | U.S. Treasury Notes (2 Year) | | Chicago Board of Trade | | March 2015 | | | USD | | | | 2,197,656 | | | | (8,486 | ) |
| | (368 | ) | | U.S. Treasury Notes (5 Year) | | Chicago Board of Trade | | March 2015 | | | USD | | | | 44,654,500 | | | | (791,308 | ) |
| | (883 | ) | | U.S. Treasury Notes (10 Year) | | Chicago Board of Trade | | March 2015 | | | USD | | | | 115,562,625 | | | | (3,776,115 | ) |
| | (330 | ) | | U.S. Ultra Treasury Bonds | | Chicago Board of Trade | | March 2015 | | | USD | | | | 59,049,375 | | | | (6,882,961 | ) |
| | Total | | | | | | | | | | | | | | | | | $ | (39,791,015 | ) |
| | | | | | | | | | | | | | | | | | | | |
| Ÿ | | As of January 31, 2015, forward foreign currency exchange contracts outstanding were as follows: |
| | | | | | | | | | | | | | | | | | | | | | |
Currency
Purchased | | | Currency
Sold | | | Counterparty | | Settlement
Date | | | Unrealized
Appreciation
(Depreciation) | |
| EUR | | | 27,650,000 | | | | USD | | | | 32,769,840 | | | JPMorgan Chase Bank N.A. | | | 2/04/15 | | | $ | (1,524,201 | ) |
| EUR | | | 1,900,000 | | | | USD | | | | 2,267,177 | | | JPMorgan Chase Bank N.A. | | | 2/04/15 | | | | (120,099 | ) |
| EUR | | | 7,800,000 | | | | USD | | | | 8,821,630 | | | JPMorgan Chase Bank N.A. | | | 2/04/15 | | | | (7,309 | ) |
| EUR | | | 300,000 | | | | USD | | | | 340,093 | | | The Bank of New York Mellon | | | 2/04/15 | | | | (1,081 | ) |
| EUR | | | 10,800,000 | | | | USD | | | | 12,894,142 | | | UBS AG | | | 2/04/15 | | | | (689,697 | ) |
| EUR | | | 1,247,000 | | | | USD | | | | 1,408,785 | | | UBS AG | | | 2/04/15 | | | | 376 | |
| USD | | | 21,480,963 | | | | EUR | | | | 18,536,000 | | | BNP Paribas S.A. | | | 2/04/15 | | | | 534,519 | |
| USD | | | 161,035,974 | | | | EUR | | | | 134,871,000 | | | Citibank N.A. | | | 2/04/15 | | | | 8,626,190 | |
| USD | | | 104,759,907 | | | | EUR | | | | 88,887,000 | | | Deutsche Bank AG | | | 2/04/15 | | | | 4,313,936 | |
| USD | | | 16,227,989 | | | | EUR | | | | 14,395,000 | | | Goldman Sachs Bank USA | | | 2/04/15 | | | | (38,954 | ) |
| USD | | | 82,530,400 | | | | EUR | | | | 71,000,000 | | | HSBC Bank PLC | | | 2/04/15 | | | | 2,297,476 | |
| USD | | | 12,800,312 | | | | EUR | | | | 10,650,000 | | | Morgan Stanley Capital Services LLC | | | 2/04/15 | | | | 765,373 | |
| USD | | | 825,243 | | | | EUR | | | | 726,000 | | | State Street Bank and Trust Co. | | | 2/04/15 | | | | 4,833 | |
| USD | | | 183,404 | | | | EUR | | | | 161,000 | | | The Bank of New York Mellon | | | 2/04/15 | | | | 1,468 | |
| USD | | | 5,864,495 | | | | GBP | | | | 3,869,000 | | | Citibank N.A. | | | 2/04/15 | | | | 37,168 | |
| USD | | | 327,200,621 | | | | EUR | | | | 288,596,000 | | | Citibank N.A. | | | 3/04/15 | | | | 997,661 | |
| USD | | | 2,253,190,500 | | | | EUR | | | | 1,800,000,000 | | | Citibank N.A. | | | 3/06/15 | | | | 218,591,005 | |
| USD | | | 157,761,600 | | | | GBP | | | | 100,000,000 | | | Citibank N.A. | | | 3/06/15 | | | | 7,175,450 | |
| GBP | | | 2,300,000 | | | | USD | | | | 3,451,825 | | | Morgan Stanley Capital Services LLC | | | 4/21/15 | | | | 10,469 | |
| USD | | | 202,484 | | | | CAD | | | | 252,000 | | | BNP Paribas S.A. | | | 4/21/15 | | | | 4,370 | |
| USD | | | 206,732 | | | | CAD | | | | 248,000 | | | Royal Bank of Canada | | | 4/21/15 | | | | 11,763 | |
| USD | | | 116,579,853 | | | | GBP | | | | 76,853,000 | | | Bank of America N.A. | | | 4/21/15 | | | | 889,574 | |
| USD | | | 5,651,288 | | | | GBP | | | | 3,763,000 | | | Citibank N.A. | | | 4/21/15 | | | | (13,325 | ) |
| Total | | | | | | | | | | | | | | | | | | | | $ | 241,866,965 | |
| | | | | | | | | | | | | | | | | | | | | | |
See Notes to Financial Statements.
| | | | | | |
| 34 | | BLACKROCK FUNDS | | JANUARY 31, 2015 | | |
| | | | |
| Schedule of Investments (continued) | | | BlackRock Global Long/Short Credit Fund | |
| Ÿ | | As of January 31, 2015, exchange-traded options purchased were as follows: |
| | | | | | | | | | | | | | | | | | | | |
| Description | | Put/
Call | | | Strike
Price | | | Expiration
Date | | | Contracts | | | Value | |
eBay, Inc. | | | Call | | | | 60.00 | | | | 2/20/15 | | | | 500 | | | $ | 3,500 | |
EMC Corp. | | | Call | | | | 29.00 | | | | 2/20/15 | | | | 1,250 | | | | 5,000 | |
PowerShares QQQ Trust, Series 1 | | | Call | | | | 106.00 | | | | 2/20/15 | | | | 306 | | | | 5,967 | |
PowerShares QQQ Trust, Series 1 | | | Call | | | | 108.00 | | | | 2/20/15 | | | | 306 | | | | 1,683 | |
Barrick Gold Corp. | | | Call | | | | 20.00 | | | | 1/15/16 | | | | 2,704 | | | | 131,144 | |
Ford Motor Co. | | | Put | | | | 14.00 | | | | 2/20/15 | | | | 1,250 | | | | 13,750 | |
Ford Motor Co. | | | Put | | | | 14.50 | | | | 2/20/15 | | | | 1,000 | | | | 26,000 | |
Market Vectors Semiconductor ETF | | | Put | | | | 52.00 | | | | 2/20/15 | | | | 750 | | | | 75,000 | |
Micron Technology, Inc. | | | Put | | | | 30.00 | | | | 2/20/15 | | | | 750 | | | | 105,750 | |
Micron Technology, Inc. | | | Put | | | | 28.00 | | | | 2/20/15 | | | | 750 | | | | 37,500 | |
PowerShares QQQ Trust, Series 1 | | | Put | | | | 88.00 | | | | 2/20/15 | | | | 612 | | | | 6,426 | |
Health Care Select Sector SPDR ETF | | | Put | | | | 67.50 | | | | 2/27/15 | | | | 650 | | | | 44,525 | |
JPMorgan Chase & Co. | | | Put | | | | 54.00 | | | | 2/27/15 | | | | 1,500 | | | | 154,500 | |
Union Pacific Corp. | | | Put | | | | 110.00 | | | | 2/27/15 | | | | 250 | | | | 14,750 | |
Caterpillar, Inc. | | | Put | | | | 83.00 | | | | 3/06/15 | | | | 500 | | | | 186,250 | |
Hewlett-Packard Co. | | | Put | | | | 38.50 | | | | 3/06/15 | | | | 500 | | | | 152,500 | |
PowerShares QQQ Trust, Series 1 | | | Put | | | | 101.50 | | | | 3/06/15 | | | | 1,250 | | | | 330,000 | |
Bank of America Corp. | | | Put | | | | 15.00 | | | | 3/20/15 | | | | 3,000 | | | | 150,000 | |
Citigroup, Inc. | | | Put | | | | 46.00 | | | | 3/20/15 | | | | 1,000 | | | | 120,000 | |
Micron Technology, Inc. | | | Put | | | | 28.00 | | | | 3/20/15 | | | | 1,000 | | | | 102,500 | |
Wells Fargo & Co. | | | Put | | | | 50.00 | | | | 3/20/15 | | | | 1,000 | | | | 90,000 | |
Total | | | | | | | | | | | | | | | | | | $ | 1,756,745 | |
| | | | | | | | | | | | | | | | | | | | |
| Ÿ | | As of January 31, 2015, OTC interest rate swaptions purchased were as follows: |
| | | | | | | | | | | | | | | | | | | | | | | | | | | | | | | | |
| Description | | Counterparty | | Put/
Call | | | Exercise Rate | | | Pay/Receive
Exercise Rate | | Floating Rate
Index | | | Expiration
Date | | | Notional
Amount (000) | | | Value | |
10-Year Interest Rate Swap | | JPMorgan Chase Bank N.A. | | | Put | | | | 2.50 | % | | Pay | | | 3-month LIBOR | | | | 4/15/15 | | | | USD | | | | 155,000 | | | $ | 168,004 | |
5-Year Interest Rate Swap | | JPMorgan Chase Bank N.A. | | | Put | | | | 2.00 | % | | Pay | | | 3-month LIBOR | | | | 4/15/15 | | | | USD | | | | 265,000 | | | | 237,361 | |
Total | | | | | | | | | | | | | | | | | | | | | | | | | | | | | | $ | 405,365 | |
| | | | | | | | | | | | | | | | | | | | | | | | | | | | | | | | |
| Ÿ | | As of January 31, 2015, exchange-traded options written were as follows: |
| | | | | | | | | | | | | | | | | | | | |
| Description | | Put/
Call | | | Strike
Price | | | Expiration
Date | | | Contracts | | | Value | |
Micron Technology, Inc. | | | Put | | | | 25.00 | | | | 2/20/15 | | | | 750 | | | $ | (6,000 | ) |
Micron Technology, Inc. | | | Put | | | | 26.00 | | | | 2/20/15 | | | | 750 | | | | (12,000 | ) |
JPMorgan Chase & Co. | | | Put | | | | 50.00 | | | | 2/27/15 | | | | 1,500 | | | | (28,500 | ) |
Union Pacific Corp. | | | Put | | | | 100.00 | | | | 2/27/15 | | | | 250 | | | | (3,500 | ) |
Bank of America Corp. | | | Put | | | | 13.00 | | | | 3/20/15 | | | | 3,000 | | | | (18,000 | ) |
Citigroup, Inc. | | | Put | | | | 43.00 | | | | 3/20/15 | | | | 1,000 | | | | (40,000 | ) |
Micron Technology, Inc. | | | Put | �� | | | 25.00 | | | | 3/20/15 | | | | 1,000 | | | | (34,000 | ) |
Wells Fargo & Co. | | | Put | | | | 45.00 | | | | 3/20/15 | | | | 1,000 | | | | (24,000 | ) |
Total | | | | | | | | | | | | | | | | | | $ | (166,000 | ) |
| | | | | | | | | | | | | | | | | | | | |
| Ÿ | | As of January 31, 2015, centrally cleared credit default swaps — buy protection outstanding were as follows: |
| | | | | | | | | | | | | | | | | | | | |
| Index | | Pay
Fixed Rate | | | Clearinghouse | | Expiration
Date | | Notional
Amount (000) | | | Unrealized
Appreciation
(Depreciation) | |
CDX.NA.HY Series 23 Version 1 | | | 5.00 | % | | Chicago Mercantile | | 12/20/19 | | | USD | | | | 73,800 | | | $ | (322,963 | ) |
CDX.NA.IG Series 23 Version 1 | | | 1.00 | % | | Chicago Mercantile | | 12/20/19 | | | USD | | | | 186,000 | | | | (203,676 | ) |
iTraxx Europe Crossover Series 22 Version 1 | | | 5.00 | % | | InterContinental Exchange | | 12/20/19 | | | EUR | | | | 207,760 | | | | 35,947 | |
See Notes to Financial Statements.
| | | | | | |
| | | BLACKROCK FUNDS | | JANUARY 31, 2015 | | 35 |
| | | | |
| Schedule of Investments (continued) | | | BlackRock Global Long/Short Credit Fund | |
As of January 31, 2015, centrally cleared credit default swaps — buy protection outstanding were as follows: (concluded)
| | | | | | | | | | | | | | | | | | | | |
| Index | | Pay
Fixed Rate | | | Clearinghouse | | Expiration
Date | | Notional
Amount (000) | | | Unrealized
Appreciation
(Depreciation) | |
iTraxx Europe Series 22 Version 1 | | | 1.00 | % | | InterContinental Exchange | | 12/20/19 | | | EUR | | | | 83,500 | | | $ | 58,019 | |
iTraxx Sub Financials Series 22 Version 1 | | | 1.00 | % | | InterContinental Exchange | | 12/20/19 | | | EUR | | | | 45,400 | | | | (211,225 | ) |
Total | | | | | | | | | | | | | | | | | | $ | (643,898 | ) |
| | | | | | | | | | | | | | | | | | | | |
| Ÿ | | As of January 31, 2015, centrally cleared credit default swaps — sold protection outstanding were as follows: |
| | | | | | | | | | | | | | | | | | | | | | | | |
| Index | | Receive
Fixed Rate | | | Clearinghouse | | Expiration
Date | | Credit
Rating1 | | | Notional
Amount (000)2 | | | Unrealized
Appreciation
(Depreciation) | |
iTraxx Europe Crossover Series 21 Version 1 | | | 5.00 | % | | InterContinental Exchange | | 6/20/19 | | | BB- | | | | EUR | | | | 26,383 | | | $ | (52,599 | ) |
iTraxx Europe Series 21 Version 1 | | | 1.00 | % | | InterContinental Exchange | | 6/20/19 | | | A- | | | | EUR | | | | 22,298 | | | | 34,911 | |
Total | | | | | | | | | | | | | | | | | | | | | | $ | (17,688 | ) |
| | | | | | | | | | | | | | | | | | | | | | | | |
| | 1 | | Using S&P’s rating of the issuer or the underlying securities of the index, as applicable. |
| | 2 | | The maximum potential amount the Fund may pay should a negative credit event take place as defined under the terms of the agreement. |
| Ÿ | | As of January 31, 2015, centrally cleared interest rate swaps outstanding were as follows: |
| | | | | | | | | | | | | | | | | | |
Fixed Rate | | Floating Rate | | Clearinghouse | | Expiration
Date | | Notional
Amount (000) | | | Unrealized
Appreciation
(Depreciation) | |
| 0.81%1 | | 3-month LIBOR | | Chicago Mercantile | | 9/23/16 | | | USD | | | | 5,000 | | | $ | (31,353 | ) |
| 1.03%1 | | 3-month LIBOR | | Chicago Mercantile | | 4/07/17 | | | USD | | | | 8,000 | | | | (73,717 | ) |
| 1.01%1 | | 3-month LIBOR | | Chicago Mercantile | | 4/28/17 | | | USD | | | | 9,000 | | | | (72,165 | ) |
| 0.92%1 | | 3-month LIBOR | | Chicago Mercantile | | 5/16/17 | | | USD | | | | 5,000 | | | | (23,358 | ) |
| 1.03%1 | | 3-month LIBOR | | Chicago Mercantile | | 6/16/17 | | | USD | | | | 3,000 | | | | (18,808 | ) |
| 1.30%1 | | 3-month LIBOR | | Chicago Mercantile | | 9/23/17 | | | USD | | | | 3,250 | | | | (50,174 | ) |
| 1.10%1 | | 3-month LIBOR | | Chicago Mercantile | | 1/26/18 | | | USD | | | | 5,700 | | | | (20,649 | ) |
| 1.02%1 | | 3-month LIBOR | | Chicago Mercantile | | 1/30/18 | | | USD | | | | 12,000 | | | | (12,487 | ) |
| 1.89%1 | | 3-month LIBOR | | Chicago Mercantile | | 9/11/19 | | | USD | | | | 5,000 | | | | (170,825 | ) |
| 1.99%1 | | 3-month LIBOR | | Chicago Mercantile | | 9/23/19 | | | USD | | | | 7,500 | | | | (289,294 | ) |
| 1.78%1 | | 3-month LIBOR | | Chicago Mercantile | | 12/23/19 | | | USD | | | | 6,000 | | | | (137,445 | ) |
| 1.44%2 | | 3-month LIBOR | | Chicago Mercantile | | 1/22/20 | | | USD | | | | 2,790 | | | | 13,213 | |
| 1.44%1 | | 3-month LIBOR | | Chicago Mercantile | | 1/22/20 | | | USD | | | | 2,480 | | | | (11,957 | ) |
| 2.38%1 | | 3-month LIBOR | | Chicago Mercantile | | 9/23/21 | | | USD | | | | 1,000 | | | | (61,490 | ) |
| 2.69%1 | | 3-month LIBOR | | Chicago Mercantile | | 6/20/24 | | | USD | | | | 35,000 | | | | (2,914,991 | ) |
| 1.92%1 | | 3-month LIBOR | | Chicago Mercantile | | 1/22/25 | | | USD | | | | 4,230 | | | | (43,238 | ) |
| 1.92%1 | | 3-month LIBOR | | Chicago Mercantile | | 1/22/25 | | | USD | | | | 920 | | | | (9,447 | ) |
| 3.37%1 | | 3-month LIBOR | | Chicago Mercantile | | 6/20/44 | | | USD | | | | 9,200 | | | | (2,536,642 | ) |
| Total | | | | | | | | | | | | | | | | $ | (6,464,827 | ) |
| | | | | | | | | | | | | | | | | | |
| | 1 | | Fund pays the fixed rate and receives the floating rate. |
| | 2 | | Fund pays the floating rate and receives the fixed rate. |
| Ÿ | | As of January 31, 2015, OTC credit default swaps — buy protection outstanding were as follows: |
| | | | | | | | | | | | | | | | | | | | | | | | | | | | |
| Issuer/Index | | Pay
Fixed Rate | | | Counterparty | | Expiration
Date | | Notional
Amount (000) | | | Value | | | Premiums
Paid
(Received) | | | Unrealized
Appreciation
(Depreciation) | |
AK Steel Corp. | | | 5.00 | % | | Citibank N.A. | | 12/20/16 | | | USD | | | | 1,900 | | | $ | (12,052 | ) | | $ | (35,666 | ) | | $ | 23,614 | |
AK Steel Corp. | | | 5.00 | % | | JPMorgan Chase Bank N.A. | | 12/20/16 | | | USD | | | | 1,000 | | | | (6,343 | ) | | | (21,119 | ) | | | 14,776 | |
Anadarko Petroleum Corp. | | | 1.00 | % | | Citibank N.A. | | 12/20/16 | | | USD | | | | 32,070 | | | | (344,784 | ) | | | (262,133 | ) | | | (82,651 | ) |
CDX.NA.IG Series 17 Version 1 | | | 1.00 | % | | Credit Suisse International | | 12/20/16 | | | USD | | | | 4,000 | | | | (62,098 | ) | | | 35,370 | | | | (97,468 | ) |
CDX.NA.IG Series 17 Version 1 | | | 1.00 | % | | Morgan Stanley Capital Services LLC | | 12/20/16 | | | USD | | | | 1,000 | | | | (18,484 | ) | | | 402 | | | | (18,886 | ) |
AK Steel Corp. | | | 5.00 | % | | Citibank N.A. | | 3/20/17 | | | USD | | | | 1,000 | | | | (216 | ) | | | (13,789 | ) | | | 13,573 | |
AK Steel Corp. | | | 5.00 | % | | Citibank N.A. | | 3/20/17 | | | USD | | | | 300 | | | | (64 | ) | | | (4,622 | ) | | | 4,558 | |
See Notes to Financial Statements.
| | | | | | |
| 36 | | BLACKROCK FUNDS | | JANUARY 31, 2015 | | |
| | | | |
| Schedule of Investments (continued) | | | BlackRock Global Long/Short Credit Fund | |
As of January 31, 2015, OTC credit default swaps — buy protection outstanding were as follows: (continued)
| | | | | | | | | | | | | | | | | | | | | | | | | | | | |
| Issuer/Index | | Pay
Fixed Rate | | | Counterparty | | Expiration
Date | | Notional Amount (000) | | | Value | | | Premiums
Paid
(Received) | | | Unrealized
Appreciation
(Depreciation) | |
Jaguar Land Rover Automotive PLC | | | 5.00 | % | | Credit Suisse International | | 3/20/17 | | | EUR | | | | 1,440 | | | $ | (164,548 | ) | | $ | (154,902 | ) | | $ | (9,646 | ) |
Jaguar Land Rover Automotive PLC | | | 5.00 | % | | Credit Suisse International | | 3/20/17 | | | EUR | | | | 1,390 | | | | (158,834 | ) | | | (146,517 | ) | | | (12,317 | ) |
Jaguar Land Rover Automotive PLC | | | 5.00 | % | | Credit Suisse International | | 3/20/17 | | | EUR | | | | 1,390 | | | | (158,834 | ) | | | (146,517 | ) | | | (12,317 | ) |
Republic of Ireland | | | 1.00 | % | | Citibank N.A. | | 3/20/17 | | | USD | | | | 500 | | | | (9,262 | ) | | | 40,122 | | | | (49,384 | ) |
EDP — Energias do Brasil SA | | | 5.00 | % | | Citibank N.A. | | 9/20/17 | | | EUR | | | | 10,162 | | | | (1,379,657 | ) | | | (1,481,067 | ) | | | 101,410 | |
EDP — Energias do Brasil SA | | | 5.00 | % | | Goldman Sachs International | | 9/20/17 | | | EUR | | | | 4,100 | | | | (556,655 | ) | | | (602,685 | ) | | | 46,030 | |
Peugeot SA | | | 5.00 | % | | Barclays Bank PLC | | 9/20/17 | | | EUR | | | | 184 | | | | (23,138 | ) | | | 10,509 | | | | (33,647 | ) |
Peugeot SA | | | 5.00 | % | | Citibank N.A. | | 9/20/17 | | | EUR | | | | 1,070 | | | | (134,548 | ) | | | 66,373 | | | | (200,921 | ) |
Finmeccanica SpA | | | 5.00 | % | | BNP Paribas S.A. | | 12/20/17 | | | EUR | | | | 450 | | | | (66,453 | ) | | | (12,860 | ) | | | (53,593 | ) |
Marks & Spencer Group PLC | | | 1.00 | % | | Credit Suisse International | | 3/20/18 | | | EUR | | | | 1,320 | | | | (21,263 | ) | | | 43,019 | | | | (64,282 | ) |
Republic of Italy | | | 1.00 | % | | Barclays Bank PLC | | 3/20/18 | | | USD | | | | 6,750 | | | | (77,178 | ) | | | 259,364 | | | | (336,542 | ) |
Genworth Holdings, Inc. | | | 1.00 | % | | Citibank N.A. | | 6/20/18 | | | USD | | | | 9,000 | | | | 793,513 | | | | 536,047 | | | | 257,466 | |
Genworth Holdings, Inc. | | | 1.00 | % | | Credit Suisse International | | 6/20/18 | | | USD | | | | 1,612 | | | | 142,127 | | | | 93,612 | | | | 48,515 | |
Genworth Holdings, Inc. | | | 1.00 | % | | Credit Suisse International | | 6/20/18 | | | USD | | | | 1,611 | | | | 142,039 | | | | 92,609 | | | | 49,430 | |
Genworth Holdings, Inc. | | | 1.00 | % | | Credit Suisse International | | 6/20/18 | | | USD | | | | 1,540 | | | | 135,779 | | | | 108,494 | | | | 27,285 | |
iTraxx Europe Series 9 3-6% | | | 5.00 | % | | Citibank N.A. | | 6/20/18 | | | EUR | | | | 10,350 | | | | (1,169,790 | ) | | | 964,325 | | | | (2,134,115 | ) |
Republic of France | | | 0.25 | % | | Barclays Bank PLC | | 6/20/18 | | | USD | | | | 6,590 | | | | 2,314 | | | | 80,107 | | | | (77,793 | ) |
Republic of France | | | 0.25 | % | | Citibank N.A. | | 6/20/18 | | | USD | | | | 7,125 | | | | 2,501 | | | | 98,092 | | | | (95,591 | ) |
Republic of France | | | 0.25 | % | | JPMorgan Chase Bank N.A. | | 6/20/18 | | | USD | | | | 7,135 | | | | 2,505 | | | | 75,419 | | | | (72,914 | ) |
The Dow Chemical Co. | | | 1.00 | % | | JPMorgan Chase Bank N.A. | | 9/20/18 | | | USD | | | | 5,000 | | | | (90,177 | ) | | | (16,887 | ) | | | (73,290 | ) |
Peugeot SA | | | 5.00 | % | | Barclays Bank PLC | | 9/20/18 | | | EUR | | | | 1,254 | | | | (190,899 | ) | | | 32,717 | | | | (223,616 | ) |
Peugeot SA | | | 5.00 | % | | BNP Paribas S.A. | | 9/20/18 | | | EUR | | | | 10,880 | | | | (1,656,289 | ) | | | 283,845 | | | | (1,940,134 | ) |
Abbott Laboratories | | | 1.00 | % | | JPMorgan Chase Bank N.A. | | 12/20/18 | | | USD | | | | 15,000 | | | | (489,147 | ) | | | (397,606 | ) | | | (91,541 | ) |
Boston Scientific Corp. | | | 1.00 | % | | Credit Suisse International | | 12/20/18 | | | USD | | | | 15,000 | | | | (357,121 | ) | | | (144,546 | ) | | | (212,575 | ) |
Cardinal Health, Inc. | | | 1.00 | % | | Barclays Bank PLC | | 12/20/18 | | | USD | | | | 15,000 | | | | (501,216 | ) | | | (345,076 | ) | | | (156,140 | ) |
Dell, Inc. | | | 1.00 | % | | Goldman Sachs Bank USA | | 12/20/18 | | | USD | | | | 4,000 | | | | 12,208 | | | | 81,033 | | | | (68,825 | ) |
Dell, Inc. | | | 1.00 | % | | Goldman Sachs International | | 12/20/18 | | | USD | | | | 2,000 | | | | 6,104 | | | | 40,519 | | | | (34,415 | ) |
International Business Machines Corp. | | | 1.00 | % | | Goldman Sachs International | | 12/20/18 | | | USD | | | | 15,000 | | | | (392,542 | ) | | | (345,076 | ) | | | (47,466 | ) |
iTraxx Sub Financials Series 20 Version 1 | | | 1.00 | % | | Barclays Bank PLC | | 12/20/18 | | | EUR | | | | 17,690 | | | | (396,215 | ) | | | (88,143 | ) | | | (308,072 | ) |
iTraxx Sub Financials Series 20 Version 1 | | | 1.00 | % | | Citibank N.A. | | 12/20/18 | | | EUR | | | | 37,890 | | | | (848,649 | ) | | | (185,101 | ) | | | (663,548 | ) |
Microsoft Corp. | | | 1.00 | % | | Credit Suisse International | | 12/20/18 | | | USD | | | | 11,841 | | | | (383,684 | ) | | | (263,069 | ) | | | (120,615 | ) |
Microsoft Corp. | | | 1.00 | % | | Goldman Sachs International | | 12/20/18 | | | USD | | | | 3,159 | | | | (102,354 | ) | | | (71,445 | ) | | | (30,909 | ) |
Marks & Spencer Group PLC | | | 1.00 | % | | Barclays Bank PLC | | 3/20/19 | | | EUR | | | | 1,680 | | | | (17,097 | ) | | | 39,799 | | | | (56,896 | ) |
Sony Corp. | | | 1.00 | % | | JPMorgan Chase Bank N.A. | | 3/20/19 | | | JPY | | | | 2,000,000 | | | | (177,113 | ) | | | 1,045,655 | | | | (1,222,768 | ) |
Federal Republic of Brazil | | | 1.00 | % | | Bank of America N.A. | | 6/20/19 | | | USD | | | | 14,735 | | | | 522,776 | | | | 506,371 | | | | 16,405 | |
Federal Republic of Brazil | | | 1.00 | % | | Citibank N.A. | | 6/20/19 | | | USD | | | | 13,910 | | | | 493,506 | | | | 555,872 | | | | (62,366 | ) |
GDF Suez | | | 1.00 | % | | Bank of America N.A. | | 6/20/19 | | | EUR | | | | 11,095 | | | | (373,519 | ) | | | (314,503 | ) | | | (59,016 | ) |
GDF Suez | | | 1.00 | % | | Citibank N.A. | | 6/20/19 | | | EUR | | | | 6,355 | | | | (213,944 | ) | | | (164,891 | ) | | | (49,053 | ) |
GDF Suez | | | 1.00 | % | | Deutsche Bank AG | | 6/20/19 | | | EUR | | | | 6,350 | | | | (213,776 | ) | | | (180,000 | ) | | | (33,776 | ) |
GKN Holdings PLC | | | 1.00 | % | | Bank of America N.A. | | 6/20/19 | | | EUR | | | | 1,085 | | | | (21,576 | ) | | | (8,786 | ) | | | (12,790 | ) |
GKN Holdings PLC | | | 1.00 | % | | Barclays Bank PLC | | 6/20/19 | | | EUR | | | | 1,305 | | | | (25,951 | ) | | | (9,803 | ) | | | (16,148 | ) |
GKN Holdings PLC | | | 1.00 | % | | BNP Paribas S.A. | | 6/20/19 | | | EUR | | | | 1,825 | | | | (36,292 | ) | | | (13,709 | ) | | | (22,583 | ) |
See Notes to Financial Statements.
| | | | | | |
| | | BLACKROCK FUNDS | | JANUARY 31, 2015 | | 37 |
| | | | |
| Schedule of Investments (continued) | | | BlackRock Global Long/Short Credit Fund | |
As of January 31, 2015, OTC credit default swaps — buy protection outstanding were as follows: (continued)
| | | | | | | | | | | | | | | | | | | | | | | | | | | | |
| Issuer/Index | | Pay
Fixed Rate | | | Counterparty | | Expiration
Date | | Notional
Amount (000) | | | Value | | | Premiums
Paid
(Received) | | | Unrealized
Appreciation
(Depreciation) | |
GKN Holdings PLC | | | 1.00 | % | | Citibank N.A. | | 6/20/19 | | | EUR | | | | 1,685 | | | $ | (33,508 | ) | | $ | (13,542 | ) | | $ | (19,966 | ) |
iTraxx Sub Financials Series 21 Version 1 | | | 1.00 | % | | Citibank N.A. | | 6/20/19 | | | EUR | | | | 45,410 | | | | (954,244 | ) | | | (599,416 | ) | | | (354,828 | ) |
iTraxx Sub Financials Series 21 Version 1 | | | 1.00 | % | | Citibank N.A. | | 6/20/19 | | | EUR | | | | 42,450 | | | | (906,815 | ) | | | (415,793 | ) | | | (491,022 | ) |
iTraxx Sub Financials Series 21 Version 1 | | | 1.00 | % | | Citibank N.A. | | 6/20/19 | | | EUR | | | | 42,210 | | | | (901,688 | ) | | | (422,553 | ) | | | (479,135 | ) |
iTraxx Sub Financials Series 21 Version 1 | | | 1.00 | % | | Citibank N.A. | | 6/20/19 | | | EUR | | | | 40,268 | | | | (860,155 | ) | | | (426,297 | ) | | | (433,858 | ) |
iTraxx Sub Financials Series 21 Version 1 | | | 1.00 | % | | Deutsche Bank AG | | 6/20/19 | | | EUR | | | | 42,210 | | | | (901,688 | ) | | | (584,678 | ) | | | (317,010 | ) |
Kohl’s Corp. | | | 1.00 | % | | JPMorgan Chase Bank N.A. | | 6/20/19 | | | USD | | | | 16,036 | | | | (114,907 | ) | | | 282,423 | | | | (397,330 | ) |
Radian Group, Inc. | | | 5.00 | % | | JPMorgan Chase Bank N.A. | | 6/20/19 | | | USD | | | | 8,750 | | | | (1,012,894 | ) | | | (910,401 | ) | | | (102,493 | ) |
Radian Group, Inc. | | | 5.00 | % | | JPMorgan Chase Bank N.A. | | 6/20/19 | | | USD | | | | 6,600 | | | | (764,012 | ) | | | (703,273 | ) | | | (60,739 | ) |
Carlsberg Breweries A/S | | | 1.00 | % | | Citibank N.A. | | 9/20/19 | | | EUR | | | | 4,465 | | | | 19,594 | | | | (51,237 | ) | | | 70,831 | |
Carlsberg Breweries A/S | | | 1.00 | % | | Goldman Sachs International | | 9/20/19 | | | EUR | | | | 2,115 | | | | 9,317 | | | | (26,892 | ) | | | 36,209 | |
The Clorox Co. | | | 1.00 | % | | Goldman Sachs Bank USA | | 9/20/19 | | | USD | | | | 7,575 | | | | (172,243 | ) | | | (142,400 | ) | | | (29,843 | ) |
Expedia, Inc. | | | 1.00 | % | | Citibank N.A. | | 9/20/19 | | | USD | | | | 4,500 | | | | (47,697 | ) | | | 4,155 | | | | (51,852 | ) |
Expedia, Inc. | | | 1.00 | % | | Goldman Sachs International | | 9/20/19 | | | USD | | | | 3,000 | | | | (31,798 | ) | | | (930 | ) | | | (30,868 | ) |
Ford Motor Co. | | | 5.00 | % | | Goldman Sachs International | | 9/20/19 | | | USD | | | | 3,115 | | | | (607,221 | ) | | | (571,308 | ) | | | (35,913 | ) |
Ford Motor Co. | | | 5.00 | % | | JPMorgan Chase Bank N.A. | | 9/20/19 | | | USD | | | | 3,175 | | | | (618,917 | ) | | | (596,059 | ) | | | (22,858 | ) |
Ford Motor Co. | | | 5.00 | % | | JPMorgan Chase Bank N.A. | | 9/20/19 | | | USD | | | | 2,780 | | | | (541,918 | ) | | | (514,435 | ) | | | (27,483 | ) |
Fortum Oyj | | | 1.00 | % | | Credit Suisse International | | 9/20/19 | | | EUR | | | | 6,655 | | | | (196,880 | ) | | | (171,602 | ) | | | (25,278 | ) |
Fortum Oyj | | | 1.00 | % | | Credit Suisse International | | 9/20/19 | | | EUR | | | | 4,185 | | | | (123,808 | ) | | | (107,912 | ) | | | (15,896 | ) |
Fortum Oyj | | | 1.00 | % | | Deutsche Bank AG | | 9/20/19 | | | EUR | | | | 6,655 | | | | (196,881 | ) | | | (171,687 | ) | | | (25,194 | ) |
Fortum Oyj | | | 1.00 | % | | Deutsche Bank AG | | 9/20/19 | | | EUR | | | | 4,935 | | | | (145,996 | ) | | | (130,353 | ) | | | (15,643 | ) |
Fortum Oyj | | | 1.00 | % | | Deutsche Bank AG | | 9/20/19 | | | EUR | | | | 4,190 | | | | (123,956 | ) | | | (110,675 | ) | | | (13,281 | ) |
Gilead Sciences, Inc. | | | 1.00 | % | | Credit Suisse International | | 9/20/19 | | | USD | | | | 11,110 | | | | (266,313 | ) | | | (307,530 | ) | | | 41,217 | |
Gilead Sciences, Inc. | | | 1.00 | % | | Credit Suisse International | | 9/20/19 | | | USD | | | | 8,030 | | | | (192,483 | ) | | | (222,274 | ) | | | 29,791 | |
Gilead Sciences, Inc. | | | 1.00 | % | | Credit Suisse International | | 9/20/19 | | | USD | | | | 6,970 | | | | (167,075 | ) | | | (192,933 | ) | | | 25,858 | |
Republic of Portugal | | | 1.00 | % | | BNP Paribas S.A. | | 9/20/19 | | | USD | | | | 12,875 | | | | 292,293 | | | | 351,170 | | | | (58,877 | ) |
Ally Financial, Inc. | �� | | 5.00 | % | | Credit Suisse International | | 12/20/19 | | | USD | | | | 2,500 | | | | (393,256 | ) | | | (369,857 | ) | | | (23,399 | ) |
Arrow Electronics, Inc. | | | 1.00 | % | | Bank of America N.A. | | 12/20/19 | | | USD | | | | 7,650 | | | | (111,260 | ) | | | 60,626 | | | | (171,886 | ) |
Arrow Electronics, Inc. | | | 1.00 | % | | Barclays Bank PLC | | 12/20/19 | | | USD | | | | 10,000 | | | | (145,438 | ) | | | 15,593 | | | | (161,031 | ) |
Arrow Electronics, Inc. | | | 1.00 | % | | JPMorgan Chase Bank N.A. | | 12/20/19 | | | USD | | | | 30,000 | | | | (436,314 | ) | | | (177,423 | ) | | | (258,891 | ) |
Caterpillar, Inc. | | | 1.00 | % | | Credit Suisse International | | 12/20/19 | | | USD | | | | 7,500 | | | | (166,007 | ) | | | (174,575 | ) | | | 8,568 | |
Caterpillar, Inc. | | | 1.00 | % | | Credit Suisse International | | 12/20/19 | | | USD | | | | 5,090 | | | | (112,663 | ) | | | (115,785 | ) | | | 3,122 | |
Caterpillar, Inc. | | | 1.00 | % | | Credit Suisse International | | 12/20/19 | | | USD | | | | 5,000 | | | | (110,671 | ) | | | (118,626 | ) | | | 7,955 | |
Caterpillar, Inc. | | | 1.00 | % | | Goldman Sachs International | | 12/20/19 | | | USD | | | | 5,000 | | | | (110,671 | ) | | | (114,246 | ) | | | 3,575 | |
Caterpillar, Inc. | | | 1.00 | % | | JPMorgan Chase Bank N.A. | | 12/20/19 | | | USD | | | | 10,000 | | | | (221,343 | ) | | | (238,370 | ) | | | 17,027 | |
Caterpillar, Inc. | | | 1.00 | % | | JPMorgan Chase Bank N.A. | | 12/20/19 | | | USD | | | | 7,500 | | | | (166,007 | ) | | | (192,208 | ) | | | 26,201 | |
Ford Motor Co. | | | 5.00 | % | | Citibank N.A. | | 12/20/19 | | | USD | | | | 2,500 | | | | (478,723 | ) | | | (447,634 | ) | | | (31,089 | ) |
Freescale Semiconductor Ltd. | | | 5.00 | % | | Barclays Bank PLC | | 12/20/19 | | | USD | | | | 1,250 | | | | (157,275 | ) | | | (47,225 | ) | | | (110,050 | ) |
Freescale Semiconductor Ltd. | | | 5.00 | % | | Citibank N.A. | | 12/20/19 | | | USD | | | | 2,150 | | | | (270,513 | ) | | | (136,234 | ) | | | (134,279 | ) |
Freescale Semiconductor Ltd. | | | 5.00 | % | | Credit Suisse International | | 12/20/19 | | | USD | | | | 4,000 | | | | (503,280 | ) | | | (294,186 | ) | | | (209,094 | ) |
Freescale Semiconductor Ltd. | | | 5.00 | % | | Goldman Sachs International | | 12/20/19 | | | USD | | | | 2,000 | | | | (251,640 | ) | | | (97,349 | ) | | | (154,291 | ) |
Hewlett-Packard Co. | | | 1.00 | % | | Credit Suisse International | | 12/20/19 | | | USD | | | | 12,500 | | | | (190,160 | ) | | | (27,314 | ) | | | (162,846 | ) |
See Notes to Financial Statements.
| | | | | | |
| 38 | | BLACKROCK FUNDS | | JANUARY 31, 2015 | | |
| | | | |
| Schedule of Investments (continued) | | | BlackRock Global Long/Short Credit Fund | |
As of January 31, 2015, OTC credit default swaps — buy protection outstanding were as follows: (concluded)
| | | | | | | | | | | | | | | | | | | | | | | | | | | | |
| Issuer/Index | | Pay Fixed Rate | | | Counterparty | | Expiration
Date | | Notional
Amount (000) | | | Market
Value | | | Premiums
Paid
(Received) | | | Unrealized
Appreciation
(Depreciation) | |
Lennar Corp. | | | 5.00 | % | | Goldman Sachs International | | 12/20/19 | | | USD | | | | 4,000 | | | $ | (536,920 | ) | | $ | (517,673 | ) | | $ | (19,247 | ) |
Navient Corp. | | | 1.00 | % | | JPMorgan Chase Bank N.A. | | 12/20/19 | | | USD | | | | 2,000 | | | | 151,476 | | | | 132,620 | | | | 18,856 | |
Southwest Airlines Co. | | | 1.00 | % | | BNP Paribas S.A. | | 12/20/19 | | | USD | | | | 5,000 | | | | (119,140 | ) | | | (87,672 | ) | | | (31,468 | ) |
Southwest Airlines Co. | | | 1.00 | % | | Credit Suisse International | | 12/20/19 | | | USD | | | | 10,000 | | | | (238,280 | ) | | | (161,943 | ) | | | (76,337 | ) |
Valero Energy Corp. | | | 1.00 | % | | Goldman Sachs International | | 12/20/19 | | | USD | | | | 2,708 | | | | 17,083 | | | | (5,949 | ) | | | 23,032 | |
Casino Guichard Perrachon SA | | | 1.00 | % | | Bank of America N.A. | | 3/20/20 | | | EUR | | | | 1,520 | | | | (11,527 | ) | | | 103 | | | | (11,630 | ) |
Casino Guichard Perrachon SA | | | 1.00 | % | | Citibank N.A. | | 3/20/20 | | | EUR | | | | 3,060 | | | | (23,205 | ) | | | 2,101 | | | | (25,306 | ) |
Caterpillar, Inc. | | | 1.00 | % | | Barclays Bank PLC | | 3/20/20 | | | USD | | | | 10,000 | | | | (216,002 | ) | | | (160,688 | ) | | | (55,314 | ) |
Caterpillar, Inc. | | | 1.00 | % | | JPMorgan Chase Bank N.A. | | 3/20/20 | | | USD | | | | 7,500 | | | | (162,001 | ) | | | (135,928 | ) | | | (26,073 | ) |
ConocoPhillips | | | 1.00 | % | | Bank of America N.A. | | 3/20/20 | | | USD | | | | 2,700 | | | | (56,233 | ) | | | (54,500 | ) | | | (1,733 | ) |
ConocoPhillips | | | 1.00 | % | | Goldman Sachs International | | 3/20/20 | | | USD | | | | 4,100 | | | | (88,921 | ) | | | (101,313 | ) | | | 12,392 | |
Federal Republic of Brazil | | | 1.00 | % | | Bank of America N.A. | | 3/20/20 | | | USD | | | | 4,000 | | | | 204,925 | | | | 155,487 | | | | 49,438 | |
Genworth Holdings, Inc. | | | 1.00 | % | | Citibank N.A. | | 3/20/20 | | | USD | | | | 5,647 | | | | 892,513 | | | | 861,396 | | | | 31,117 | |
Gilead Sciences, Inc. | | | 1.00 | % | | JPMorgan Chase Bank N.A. | | 3/20/20 | | | USD | | | | 4,200 | | | | (95,549 | ) | | | (128,556 | ) | | | 33,007 | |
Staples, Inc. | | | 1.00 | % | | Morgan Stanley Capital
Services LLC | | 3/20/20 | | | USD | | | | 4,500 | | | | 160,593 | | | | 137,383 | | | | 23,210 | |
Transocean Ltd. | | | 5.00 | % | | Barclays Bank PLC | | 3/20/20 | | | USD | | | | 3,400 | | | | 345,087 | | | | 459,662 | | | | (114,575 | ) |
United Mexican States | | | 1.00 | % | | BNP Paribas S.A. | | 3/20/20 | | | USD | | | | 20,000 | | | | 112,164 | | | | (45,358 | ) | | | 157,522 | |
The Western Union Co. | | | 1.00 | % | | Credit Suisse International | | 3/20/20 | | | USD | | | | 14,000 | | | | 365,180 | | | | 265,516 | | | | 99,664 | |
The Western Union Co. | | | 1.00 | % | | Credit Suisse International | | 3/20/20 | | | USD | | | | 7,640 | | | | 199,284 | | | | 144,896 | | | | 54,388 | |
Genworth Holdings, Inc. | | | 1.00 | % | | Citibank N.A. | | 6/20/20 | | | USD | | | | 1,611 | | | | 254,709 | | | | 201,685 | | | | 53,024 | |
Genworth Holdings, Inc. | | | 1.00 | % | | Goldman Sachs International | | 6/20/20 | | | USD | | | | 2,218 | | | | 350,680 | | | | 262,283 | | | | 88,397 | |
Genworth Holdings, Inc. | | | 1.00 | % | | JPMorgan Chase Bank N.A. | | 6/20/20 | | | USD | | | | 1,408 | | | | 222,614 | | | | 179,850 | | | | 42,764 | |
Total | | | | | | | | | | | | | | | | | | $ | (20,254,974 | ) | | $ | (8,168,686 | ) | | $ | (12,086,288 | ) |
| | | | | | | | | | | | | | | | | | | | |
| Ÿ | | As of January 31, 2015, OTC credit default swaps — sold protection outstanding were as follows: |
| | | | | | | | | | | | | | | | | | | | | | | | | | | | | | | | |
| Issuer/Index | | Receive
Fixed Rate | | | Counterparty | | Expiration
Date | | Credit
Rating1 | | | Notional
Amount
(000)2 | | | Value | | | Premiums
Paid
(Received) | | | Unrealized
Appreciation
(Depreciation) | |
CDX.NA.IG Series 17 Version 1 | | | 1.00 | % | | Credit Suisse International | | 12/20/16 | | | BBB+ | | | | USD | | | | 5,000 | | | $ | 77,622 | | | $ | (35,991 | ) | | $ | 113,613 | |
Republic of Italy | | | 1.00 | % | | Barclays Bank PLC | | 3/20/18 | | | BBB- | | | | EUR | | | | 5,050 | | | | 76,477 | | | | (197,299 | ) | | | 273,776 | |
Republic of Italy | | | 1.00 | % | | Barclays Bank PLC | | 3/20/18 | | | BBB- | | | | USD | | | | 59 | | | | 675 | | | | (2,971 | ) | | | 3,646 | |
Bayerische Landesbank | | | 1.00 | % | | Barclays Bank PLC | | 12/20/18 | | | N/R | | | | EUR | | | | 8,870 | | | | 164,454 | | | | 22,258 | | | | 142,196 | |
General Motors Co. | | | 5.00 | % | | Bank of America N.A. | | 12/20/18 | | | BBB- | | | | USD | | | | 4,000 | | | | 586,880 | | | | 488,210 | | | | 98,670 | |
General Motors Co. | | | 5.00 | % | | Barclays Bank PLC | | 12/20/18 | | | BBB- | | | | USD | | | | 4,450 | | | | 652,904 | | | | 506,738 | | | | 146,166 | |
iTraxx Sub Financials Series 20 Version 1 | | | 5.00 | % | | Barclays Bank PLC | | 12/20/18 | | | BBB | | | | EUR | | | | 14,150 | | | | 2,674,756 | | | | 2,688,528 | | | | (13,772 | ) |
iTraxx Sub Financials Series 20 Version 1 | | | 5.00 | % | | Citibank N.A. | | 12/20/18 | | | BBB | | | | EUR | | | | 20,210 | | | | 3,820,270 | | | | 3,805,254 | | | | 15,016 | |
iTraxx Sub Financials Series 20 Version 1 | | | 5.00 | % | | Deutsche Bank AG | | 12/20/18 | | | BBB | | | | EUR | | | | 10,120 | | | | 1,912,970 | | | | 1,914,132 | | | | (1,162 | ) |
CNH Industrial NV | | | 5.00 | % | | Citibank N.A. | | 3/20/19 | | | BB+ | | | | EUR | | | | 2,950 | | | | 465,121 | | | | 503,503 | | | | (38,382 | ) |
CNH Industrial NV | | | 5.00 | % | | Citibank N.A. | | 3/20/19 | | | BB+ | | | | EUR | | | | 2,950 | | | | 465,120 | | | | 513,282 | | | | (48,162 | ) |
Aastrom Biosciences, Inc. | | | 5.00 | % | | Barclays Bank PLC | | 6/20/19 | | | B+ | | | | EUR | | | | 608 | | | | 1,523 | | | | 10,519 | | | | (8,996 | ) |
Aastrom Biosciences, Inc. | | | 5.00 | % | | Credit Suisse International | | 6/20/19 | | | B+ | | | | EUR | | | | 912 | | | | 2,284 | | | | 6,147 | | | | (3,863 | ) |
Aastrom Biosciences, Inc. | | | 5.00 | % | | Credit Suisse International | | 6/20/19 | | | B+ | | | | EUR | | | | 600 | | | | 1,503 | | | | 20,749 | | | | (19,246 | ) |
Aastrom Biosciences, Inc. | | | 5.00 | % | | Deutsche Bank AG | | 6/20/19 | | | B+ | | | | EUR | | | | 597 | | | | 1,495 | | | | 22,190 | | | | (20,695 | ) |
Aastrom Biosciences, Inc. | | | 5.00 | % | | Goldman Sachs International | | 6/20/19 | | | B+ | | | | EUR | | | | 923 | | | | 2,311 | | | | 31,920 | | | | (29,609 | ) |
General Motors Co. | | | 5.00 | % | | Deutsche Bank AG | | 6/20/19 | | | BBB- | | | | USD | | | | 5,000 | | | | 784,628 | | | | 688,905 | | | | 95,723 | |
See Notes to Financial Statements.
| | | | | | |
| | | BLACKROCK FUNDS | | JANUARY 31, 2015 | | 39 |
| | | | |
| Schedule of Investments (continued) | | | BlackRock Global Long/Short Credit Fund | |
As of January 31, 2015, OTC credit default swaps — sold protection outstanding were as follows: (continued)
| | | | | | | | | | | | | | | | | | | | | | | | | | | | | | | | |
| Issuer/Index | | Receive
Fixed Rate | | | Counterparty | | Expiration
Date | | Credit
Rating1 | | | Notional
Amount (000)2 | | | Value | | | Premiums
Paid
(Received) | | | Unrealized
Appreciation
(Depreciation) | |
Amkor Technology, Inc. | | | 5.00 | % | | Citibank N.A. | | 9/20/19 | | | BB | | | | USD | | | | 3,500 | | | $ | 310,642 | | | $ | 293,817 | | | $ | 16,825 | |
ArcelorMittal | | | 1.00 | % | | Barclays Bank PLC | | 9/20/19 | | | BB+ | | | | EUR | | | | 2,133 | | | | (210,453 | ) | | | (175,613 | ) | | | (34,840 | ) |
ArcelorMittal | | | 1.00 | % | | Barclays Bank PLC | | 9/20/19 | | | BB+ | | | | EUR | | | | 2,130 | | | | (210,206 | ) | | | (168,333 | ) | | | (41,873 | ) |
ArcelorMittal | | | 1.00 | % | | Citibank N.A. | | 9/20/19 | | | BB+ | | | | EUR | | | | 4,265 | | | | (420,905 | ) | | | (346,708 | ) | | | (74,197 | ) |
ArcelorMittal | | | 1.00 | % | | Credit Suisse International | | 9/20/19 | | | BB+ | | | | EUR | | | | 4,260 | | | | (420,412 | ) | | | (336,665 | ) | | | (83,747 | ) |
Cable & Wireless Communications PLC | | | 5.00 | % | | Citibank N.A. | | 9/20/19 | | | B+ | | | | EUR | | | | 950 | | | | 170,620 | | | | 144,800 | | | | 25,820 | |
Eileme 2 AB | | | 5.00 | % | | Citibank N.A. | | 9/20/19 | | | B+ | | | | EUR | | | | 1,583 | | | | 335,967 | | | | 302,522 | | | | 33,445 | |
The Goodyear Tire & Rubber Co. | | | 5.00 | % | | Goldman Sachs Bank USA | | 9/20/19 | | | B+ | | | | USD | | | | 2,500 | | | | 341,055 | | | | 263,348 | | | | 77,707 | |
Hellenic Telecommunications Organization SA | | | 5.00 | % | | Citibank N.A. | | 9/20/19 | | | BB | | | | EUR | | | | 632 | | | | (8,907 | ) | | | 94,996 | | | | (103,903 | ) |
Hellenic Telecommunications Organization SA | | | 5.00 | % | | Goldman Sachs International | | 9/20/19 | | | BB | | | | EUR | | | | 960 | | | | (13,537 | ) | | | 140,288 | | | | (153,825 | ) |
The Hertz Corp. | | | 5.00 | % | | Barclays Bank PLC | | 9/20/19 | | | B | | | | USD | | | | 2,500 | | | | 212,765 | | | | 251,483 | | | | (38,718 | ) |
The Hertz Corp. | | | 5.00 | % | | Citibank N.A. | | 9/20/19 | | | B | | | | USD | | | | 2,780 | | | | 236,594 | | | | 271,440 | | | | (34,846 | ) |
The Hertz Corp. | | | 5.00 | % | | Goldman Sachs Bank USA | | 9/20/19 | | | B | | | | USD | | | | 2,545 | | | | 216,595 | | | | 282,387 | | | | (65,792 | ) |
Sabre Holdings Corp. | | | 5.00 | % | | Barclays Bank PLC | | 9/20/19 | | | B- | | | | USD | | | | 2,000 | | | | 220,421 | | | | 168,484 | | | | 51,937 | |
Sabre Holdings Corp. | | | 5.00 | % | | Deutsche Bank AG | | 9/20/19 | | | B- | | | | USD | | | | 3,000 | | | | 330,632 | | | | 260,292 | | | | 70,340 | |
Sabre Holdings Corp. | | | 5.00 | % | | Deutsche Bank AG | | 9/20/19 | | | B- | | | | USD | | | | 3,000 | | | | 330,631 | | | | 265,788 | | | | 64,843 | |
Sabre Holdings Corp. | | | 5.00 | % | | Goldman Sachs International | | 9/20/19 | | | B- | | | | USD | | | | 3,000 | | | | 330,631 | | | | 271,647 | | | | 58,984 | |
TVN Finance Corp. III AB | | | 5.00 | % | | Citibank N.A. | | 9/20/19 | | | B+ | | | | EUR | | | | 1,583 | | | | 340,521 | | | | 251,297 | | | | 89,224 | |
Abengoa SA | | | 5.00 | % | | Citibank N.A. | | 12/20/19 | | | B | | | | EUR | | | | 91 | | | | (16,209 | ) | | | (18,572 | ) | | | 2,363 | |
Abengoa SA | | | 5.00 | % | | Credit Suisse International | | 12/20/19 | | | B | | | | EUR | | | | 1,950 | | | | (348,341 | ) | | | (504,601 | ) | | | 156,260 | |
Abengoa SA | | | 5.00 | % | | Credit Suisse International | | 12/20/19 | | | B | | | | EUR | | | | 1,370 | | | | (244,731 | ) | | | (379,216 | ) | | | 134,485 | |
Abengoa SA | | | 5.00 | % | | Credit Suisse International | | 12/20/19 | | | B | | | | EUR | | | | 1,370 | | | | (244,732 | ) | | | (295,655 | ) | | | 50,923 | |
AK Steel Corp. | | | 5.00 | % | | Citibank N.A. | | 12/20/19 | | | B- | | | | USD | | | | 1,900 | | | | (284,326 | ) | | | (189,365 | ) | | | (94,961 | ) |
AK Steel Corp. | | | 5.00 | % | | JPMorgan Chase Bank N.A. | | 12/20/19 | | | B- | | | | USD | | | | 1,000 | | | | (149,645 | ) | | | (92,644 | ) | | | (57,001 | ) |
Altice Finco SA | | | 5.00 | % | | Citibank N.A. | | 12/20/19 | | | B- | | | | EUR | | | | 1,630 | | | | 106,963 | | | | 24,212 | | | | 82,751 | |
Amkor Technology, Inc. | | | 5.00 | % | | Barclays Bank PLC | | 12/20/19 | | | BB | | | | USD | | | | 2,000 | | | | 165,096 | | | | 130,675 | | | | 34,421 | |
Amkor Technology, Inc. | | | 5.00 | % | | Barclays Bank PLC | | 12/20/19 | | | BB | | | | USD | | | | 2,000 | | | | 165,096 | | | | 148,922 | | | | 16,174 | |
Amkor Technology, Inc. | | | 5.00 | % | | Barclays Bank PLC | | 12/20/19 | | | BB | | | | USD | | | | 1,270 | | | | 104,836 | | | | 94,706 | | | | 10,130 | |
Amkor Technology, Inc. | | | 5.00 | % | | Goldman Sachs Bank USA | | 12/20/19 | | | BB | | | | USD | | | | 1,010 | | | | 83,373 | | | | 71,790 | | | | 11,583 | |
Amkor Technology, Inc. | | | 5.00 | % | | Goldman Sachs International | | 12/20/19 | | | BB | | | | USD | | | | 1,500 | | | | 123,822 | | | | 111,771 | | | | 12,051 | |
ArcelorMittal | | | 1.00 | % | | Citibank N.A. | | 12/20/19 | | | BB+ | | | | EUR | | | | 3,255 | | | | (359,017 | ) | | | (255,600 | ) | | | (103,417 | ) |
Barrick Gold Corp. | | | 1.00 | % | | JPMorgan Chase Bank N.A. | | 12/20/19 | | | BBB | | | | USD | | | | 7,600 | | | | (191,618 | ) | | | (255,365 | ) | | | 63,747 | |
Devon Energy Corp. | | | 1.00 | % | | BNP Paribas S.A. | | 12/20/19 | | | BBB+ | | | | USD | | | | 1,842 | | | | 1,626 | | | | 2,448 | | | | (822 | ) |
Devon Energy Corp. | | | 1.00 | % | | BNP Paribas S.A. | | 12/20/19 | | | BBB+ | | | | USD | | | | 1,589 | | | | 1,398 | | | | (167 | ) | | | 1,565 | |
General Motors Co. | | | 5.00 | % | | Barclays Bank PLC | | 12/20/19 | | | BBB- | | | | USD | | | | 1,750 | | | | 288,178 | | | | 277,390 | | | | 10,788 | |
General Motors Co. | | | 5.00 | % | | Deutsche Bank AG | | 12/20/19 | | | BBB- | | | | USD | | | | 4,000 | | | | 658,693 | | | | 624,797 | | | | 33,896 | |
General Motors Co. | | | 5.00 | % | | Deutsche Bank AG | | 12/20/19 | | | BBB- | | | | USD | | | | 2,000 | | | | 329,347 | | | | 309,867 | | | | 19,480 | |
HCA, Inc. | | | 5.00 | % | | Goldman Sachs International | | 12/20/19 | | | B+ | | | | USD | | | | 2,500 | | | | 345,992 | | | | 277,632 | | | | 68,360 | |
The Hertz Corp. | | | 5.00 | % | | Goldman Sachs International | | 12/20/19 | | | B | | | | USD | | | | 2,000 | | | | 158,962 | | | | 131,766 | | | | 27,196 | |
Republic of Italy | | | 1.00 | % | | HSBC Bank PLC | | 12/20/19 | | | BBB- | | | | USD | | | | 23,580 | | | | (18,232 | ) | | | (584,269 | ) | | | 566,037 | |
Republic of Italy | | | 1.00 | % | | Morgan Stanley Capital
Services LLC | | 12/20/19 | | | BBB- | | | | USD | | | | 12,940 | | | | (10,006 | ) | | | (314,958 | ) | | | 304,952 | |
Sabre Holdings Corp. | | | 5.00 | % | | Barclays Bank PLC | | 12/20/19 | | | B- | | | | USD | | | | 2,610 | | | | 281,127 | | | | 159,422 | | | | 121,705 | |
Sabre Holdings Corp. | | | 5.00 | % | | Barclays Bank PLC | | 12/20/19 | | | B- | | | | USD | | | | 2,000 | | | | 215,423 | | | | 114,956 | | | | 100,467 | |
Sabre Holdings Corp. | | | 5.00 | % | | Barclays Bank PLC | | 12/20/19 | | | B- | | | | USD | | | | 2,000 | | | | 215,423 | | | | 123,122 | | | | 92,301 | |
AK Steel Corp. | | | 5.00 | % | | Citibank N.A. | | 3/20/20 | | | B- | | | | USD | | | | 1,000 | | | | (162,479 | ) | | | (121,691 | ) | | | (40,788 | ) |
See Notes to Financial Statements.
| | | | | | |
| 40 | | BLACKROCK FUNDS | | JANUARY 31, 2015 | | |
| | | | |
| Schedule of Investments (continued) | | | BlackRock Global Long/Short Credit Fund | |
As of January 31, 2015, OTC credit default swaps — sold protection outstanding were as follows: (concluded)
| | | | | | | | | | | | | | | | | | | | | | | | | | | | | | | | |
| Issuer/Index | | Receive
Fixed Rate | | | Counterparty | | Expiration
Date | | Credit
Rating1 | | | Notional
Amount
(000)2 | | | Market
Value | | | Premiums
Paid
(Received) | | | Unrealized
Appreciation
(Depreciation) | |
AK Steel Corp. | | | 5.00 | % | | Citibank N.A. | | 3/20/20 | | | B- | | | | USD | | | | 300 | | | $ | (48,744 | ) | | $ | (35,785 | ) | | $ | (12,959 | ) |
Apache Corp. | | | 1.00 | % | | BNP Paribas S.A. | | 3/20/20 | | | A- | | | | USD | | | | 1,400 | | | | (48,170 | ) | | | (76,877 | ) | | | 28,707 | |
Apache Corp. | | | 1.00 | % | | BNP Paribas S.A. | | 3/20/20 | | | A- | | | | USD | | | | 1,400 | | | | (48,170 | ) | | | (67,898 | ) | | | 19,728 | |
BHP Billiton Ltd. | | | 1.00 | % | | Deutsche Bank AG | | 3/20/20 | | | A+ | | | | USD | | | | 1,400 | | | | 12,775 | | | | 14,849 | | | | (2,074 | ) |
BHP Billiton Ltd. | | | 1.00 | % | | Deutsche Bank AG | | 3/20/20 | | | A+ | | | | USD | | | | 1,400 | | | | 12,774 | | | | 16,082 | | | | (3,308 | ) |
Chesapeake Energy Corp. | | | 5.00 | % | | JPMorgan Chase Bank N.A. | | 3/20/20 | | | BB+ | | | | USD | | | | 825 | | | | 58,923 | | | | 63,155 | | | | (4,232 | ) |
Chesapeake Energy Corp. | | | 5.00 | % | | JPMorgan Chase Bank N.A. | | 3/20/20 | | | BB+ | | | | USD | | | | 500 | | | | 37,621 | | | | 30,065 | | | | 7,556 | |
Chesapeake Energy Corp. | | | 5.00 | % | | Morgan Stanley Capital
Services LLC | | 3/20/20 | | | BB+ | | | | USD | | | | 1,000 | | | | 75,240 | | | | 74,935 | | | | 305 | |
Chesapeake Energy Corp. | | | 5.00 | % | | Morgan Stanley Capital
Services LLC | | 3/20/20 | | | BB+ | | | | USD | | | | 321 | | | | 24,197 | | | | 24,918 | | | | (721 | ) |
Federal of Malaysia | | | 1.00 | % | | HSBC Bank PLC | | 3/20/20 | | | A- | | | | USD | | | | 4,000 | | | | (62,139 | ) | | | (98,544 | ) | | | 36,405 | |
Tenet Healthcare Corp. | | | 5.00 | % | | Citibank N.A. | | 3/20/20 | | | CCC+ | | | | USD | | | | 1,800 | | | | 107,645 | | | | 81,655 | | | | 25,990 | |
Tenet Healthcare Corp. | | | 5.00 | % | | Citibank N.A. | | 3/20/20 | | | CCC+ | | | | USD | | | | 1,800 | | | | 107,645 | | | | 150,423 | | | | (42,778 | ) |
Tenet Healthcare Corp. | | | 5.00 | % | | Goldman Sachs International | | 3/20/20 | | | CCC+ | | | | USD | | | | 1,800 | | | | 107,645 | | | | 124,787 | | | | (17,142 | ) |
Tenet Healthcare Corp. | | | 5.00 | % | | Goldman Sachs International | | 3/20/20 | | | CCC+ | | | | USD | | | | 1,800 | | | | 107,645 | | | | 144,347 | | | | (36,702 | ) |
Tenet Healthcare Corp. | | | 5.00 | % | | JPMorgan Chase Bank N.A. | | 3/20/20 | | | CCC+ | | | | USD | | | | 1,800 | | | | 107,645 | | | | 153,436 | | | | (45,791 | ) |
Tenet Healthcare Corp. | | | 5.00 | % | | Morgan Stanley Capital
Services LLC | | 3/20/20 | | | CCC+ | | | | USD | | | | 1,800 | | | | 107,645 | | | | 133,193 | | | | (25,548 | ) |
Transocean Ltd. | | | 1.00 | % | | Barclays Bank PLC | | 3/20/20 | | | BBB- | | | | USD | | | | 3,400 | | | | (879,655 | ) | | | (882,023 | ) | | | 2,368 | |
United Rentals, Inc. | | | 5.00 | % | | Goldman Sachs International | | 3/20/20 | | | BB- | | | | USD | | | | 900 | | | | 106,177 | | | | 100,584 | | | | 5,593 | |
United Rentals, Inc. | | | 5.00 | % | | Goldman Sachs International | | 3/20/20 | | | BB- | | | | USD | | | | 800 | | | | 94,379 | | | | 89,408 | | | | 4,971 | |
Glencore Xstrata PLC | | | 1.00 | % | | BNP Paribas S.A. | | 6/20/21 | | | BBB | | | | EUR | | | | 2,057 | | | | (201,439 | ) | | | (236,441 | ) | | | 35,002 | |
Glencore Xstrata PLC | | | 1.00 | % | | Citibank N.A. | | 6/20/21 | | | BBB | | | | EUR | | | | 4,113 | | | | (402,877 | ) | | | (486,741 | ) | | | 83,864 | |
Republic of France | | | 0.25 | % | | Barclays Bank PLC | | 6/20/23 | | | AA | | | | USD | | | | 4,035 | | | | (148,090 | ) | | | (261,805 | ) | | | 113,715 | |
Republic of France | | | 0.25 | % | | Citibank N.A. | | 6/20/23 | | | AA | | | | USD | | | | 4,350 | | | | (159,652 | ) | | | (298,067 | ) | | | 138,415 | |
Republic of France | | | 0.25 | % | | JPMorgan Chase Bank N.A. | | 6/20/23 | | | AA | | | | USD | | | | 4,350 | | | | (159,652 | ) | | | (276,960 | ) | | | 117,308 | |
Total | | | | | | | | | | | | | | | | | | | | | | $ | 13,909,034 | | | $ | 11,293,413 | | | $ | 2,615,621 | |
| | | | | | | | | | | | | | | | | | | | | | | | |
| | 1 | | Using S&P’s rating of the issuer or the underlying securities of the index, as applicable. |
| | 2 | | The maximum potential amount the Fund may pay should a negative credit event take place as defined under the terms of the agreement. |
| Ÿ | | As of January 31, 2015, OTC total return swaps outstanding were as follows: |
| | | | | | | | | | | | | | | | | | | | | | | | | | | | |
| Reference Entity | | Floating Rate | | Counterparty | | Expiration
Date | | | Notional
Amount (000) | | | Value | | | Premiums
Paid
(Received) | | | Unrealized
Appreciation
(Depreciation) | |
Volkswagen AG | | 3-month EURIBOR
minus 0.25%1 | | BNP Paribas S.A. | | | 2/02/15 | | | | EUR | | | | 39,680 | | | $ | (361,542 | ) | | | — | | | $ | (361,542 | ) |
PowerShares QQQ Trust Series 1 | | 3-month LIBOR
minus 0.15%1 | | Bank of America N.A. | | | 2/26/15 | | | | USD | | | | 55,500 | | | | 224,542 | | | | — | | | | 224,542 | |
Volkswagen AG | | 3-month EURIBOR
minus 0.10%1 | | JPMorgan Chase Bank N.A. | | | 4/02/15 | | | | EUR | | | | 75,228 | | | | (591,613 | ) | | | — | | | | (591,613 | ) |
Volkswagen AG | | 3-month EURIBOR
minus 0.10%1 | | JPMorgan Chase Bank N.A. | | | 4/02/15 | | | | EUR | | | | 42,000 | | | | (292,245 | ) | | | — | | | | (292,245 | ) |
Volkswagen AG | | 3-month EURIBOR
minus 0.10%1 | | JPMorgan Chase Bank N.A. | | | 4/02/15 | | | | EUR | | | | 38,786 | | | | (298,904 | ) | | | — | | | | (298,904 | ) |
See Notes to Financial Statements.
| | | | | | |
| | | BLACKROCK FUNDS | | JANUARY 31, 2015 | | 41 |
| | | | |
| Schedule of Investments (continued) | | | BlackRock Global Long/Short Credit Fund | |
| | As of January 31, 2015, OTC total return swaps outstanding were as follows: (continued) |
| | | | | | | | | | | | | | | | | | | | | | | | | | |
| Reference Entity | | Floating Rate | | Counterparty | | Expiration
Date | | Notional Amount (000) | | | Value | | | Premiums
Paid
(Received) | | | Unrealized
Appreciation
(Depreciation) | |
Volkswagen AG | | 3-month EURIBOR
minus 0.10%1 | | JPMorgan Chase Bank N.A. | | 4/02/15 | | | EUR | | | | 4,505 | | | $ | 6,019 | | | | — | | | $ | 6,019 | |
Telecom Italia SpA | | 3-month EURIBOR
minus 0.40%1 | | Citibank N.A. | | 5/04/15 | | | EUR | | | | 7,935,753 | | | | (837,920 | ) | | | — | | | | (837,920 | ) |
Telecom Italia SpA | | 3-month EURIBOR
minus 0.40%1 | | Citibank N.A. | | 5/07/15 | | | EUR | | | | 7,989,134 | | | | (843,359 | ) | | | — | | | | (843,359 | ) |
Volkswagen AG | | 3-month EURIBOR
minus 0.40%1 | | Bank of America N.A. | | 5/22/15 | | | EUR | | | | 66,422 | | | | (540,941 | ) | | | — | | | | (540,941 | ) |
Volkswagen AG | | 3-month EURIBOR
minus 0.20%1 | | Bank of America N.A. | | 5/22/15 | | | EUR | | | | 66,422 | | | | (574,102 | ) | | | — | | | | (574,102 | ) |
Telecom Italia SpA | | 3-month EURIBOR
minus 0.25%1 | | BNP Paribas S.A. | | 6/11/15 | | | EUR | | | | 1,101,883 | | | | (42,421 | ) | | | — | | | | (42,421 | ) |
Telecom Italia SpA | | 3-month EURIBOR
minus 0.25%1 | | BNP Paribas S.A. | | 6/12/15 | | | EUR | | | | 2,931,246 | | | | (109,669 | ) | | | — | | | | (109,669 | ) |
Repsol SA | | 3-month EURIBOR
minus 0.50%1 | | Citibank N.A. | | 7/17/15 | | | EUR | | | | 13,363 | | | | (236,845 | ) | | | — | | | | (236,845 | ) |
Repsol SA | | 0.00% Fixed1 | | Citibank N.A. | | 7/17/15 | | | EUR | | | | 393 | | | | (6,966 | ) | | | — | | | | (6,966 | ) |
Telecom Italia SpA | | 3-month EURIBOR
minus 0.30%1 | | BNP Paribas S.A. | | 7/17/15 | | | EUR | | | | 16,133,721 | | | | (2,830,173 | ) | | | — | | | | (2,830,173 | ) |
Market Vector Semiconductor ETF | | 3-month LIBOR
minus 0.30%1 | | Bank of America N.A. | | 7/23/15 | | | USD | | | | 40,000 | | | | 96,782 | | | | — | | | | 96,782 | |
Caterpillar, Inc. | | 3-month LIBOR
minus 0.30%1 | | Bank of America N.A. | | 7/25/15 | | | USD | | | | 14,285 | | | | 86,560 | | | | — | | | | 86,560 | |
SPDR S&P Oil & Gas Exploration & Production ETF | | 3-month LIBOR
minus 1.00%1 | | BNP Paribas S.A. | | 8/03/15 | | | USD | | | | 51,750 | | | | 676,665 | | | | — | | | | 676,665 | |
iShares U.S. Preferred Stock ETF | | 3-month LIBOR
minus 1.50%1 | | Bank of America N.A. | | 8/04/15 | | | USD | | | | 31,925 | | | | (31,972 | ) | | | — | | | | (31,972 | ) |
iShares U.S. Preferred Stock ETF | | 3-month LIBOR
minus 1.50%1 | | Deutsche Bank AG | | 8/07/15 | | | USD | | | | 38,140 | | | | (34,995 | ) | | | — | | | | (34,995 | ) |
iShares U.S. Preferred Stock ETF | | 3-month LIBOR
minus 1.75%1 | | Deutsche Bank AG | | 9/14/15 | | | USD | | | | 38,250 | | | | (42,182 | ) | | | — | | | | (42,182 | ) |
United Technologies Corp. | | 3-month LIBOR
minus 0.30%1 | | Bank of America N.A. | | 9/15/15 | | | USD | | | | 9,250 | | | | (26,631 | ) | | | — | | | | (26,631 | ) |
APERAM SA | | 3-month EURIBOR
minus 0.25%1 | | BNP Paribas S.A. | | 9/18/15 | | | EUR | | | | 27,913 | | | | 120,370 | �� | | | — | | | | 120,370 | |
Caterpillar, Inc. | | 1-month LIBOR
minus 0.35%1 | | JPMorgan Chase Bank N.A. | | 9/18/15 | | | USD | | | | 9,625 | | | | 221,512 | | | | — | | | | 221,512 | |
United Technologies Corp. | | 3-month LIBOR
minus 0.30%1 | | Bank of America N.A. | | 9/28/15 | | | USD | | | | 9,206 | | | | 22,590 | | | | — | | | | 22,590 | |
APERAM SA | | 3-month EURIBOR
minus 0.35%1 | | JPMorgan Chase Bank N.A. | | 9/30/15 | | | EUR | | | | 6,744 | | | | 13,772 | | | | — | | | | 13,772 | |
Caterpillar, Inc. | | 3-month LIBOR
minus 0.30%1 | | Bank of America N.A. | | 10/05/15 | | | USD | | | | 15,350 | | | | 96,671 | | | | — | | | | 96,671 | |
iShares iBoxx $ High Yield Corporate Bond ETF | | 1-month LIBOR1 | | Bank of America N.A. | | 10/13/15 | | | USD | | | | 27,500 | | | | (6,405 | ) | | | — | | | | (6,405 | ) |
iShares iBoxx $ High Yield Corporate Bond ETF | | 1-month LIBOR1 | | Bank of America N.A. | | 10/13/15 | | | USD | | | | 22,000 | | | | (5,124 | ) | | | — | | | | (5,124 | ) |
PowerShares QQQ Trust Series 1 | | 3-month LIBOR
minus 0.10%1 | | Bank of America N.A. | | 10/13/15 | | | USD | | | | 30,000 | | | | 12,820 | | | | — | | | | 12,820 | |
See Notes to Financial Statements.
| | | | | | |
| 42 | | BLACKROCK FUNDS | | JANUARY 31, 2015 | | |
| | | | |
| Schedule of Investments (continued) | | | BlackRock Global Long/Short Credit Fund | |
As of January 31, 2015, OTC total return swaps outstanding were as follows: (continued)
| | | | | | | | | | | | | | | | | | | | | | | | | | |
| Reference Entity | | Floating Rate | | Counterparty | | Expiration Date | | Notional Amount (000) | | | Value | | | Premiums Paid (Received) | | | Unrealized Appreciation (Depreciation) | |
International Airlines Group SA | | 3-month LIBOR
minus 0.25%1 | | JPMorgan Chase Bank N.A. | | 10/21/15 | | | GBP | | | | 428,206 | | | $ | (1,142,881 | ) | | | — | | | $ | (1,142,881 | ) |
International Airlines Group SA | | 3-month LIBOR
minus 0.25%1 | | JPMorgan Chase Bank N.A. | | 10/21/15 | | | GBP | | | | 79,218 | | | | (56,796 | ) | | | — | | | | (56,796 | ) |
International Airlines Group SA | | 3-month LIBOR
minus 0.25%1 | | JPMorgan Chase Bank N.A. | | 10/21/15 | | | GBP | | | | 51,385 | | | | (26,680 | ) | | | — | | | | (26,680 | ) |
American Airlines Group, Inc. | | 3-month LIBOR
minus 0.25%1 | | BNP Paribas S.A. | | 10/23/15 | | | USD | | | | 19,250 | | | | 127,244 | | | | — | | | | 127,244 | |
Hewlett-Packard Co. | | 3-month LIBOR
minus 0.30%1 | | Bank of America N.A. | | 10/30/15 | | | USD | | | | 14,125 | | | | (14,705 | ) | | | — | | | | (14,705 | ) |
International Airlines Group SA | | 3-month LIBOR
minus 0.25%1 | | BNP Paribas S.A. | | 11/04/15 | | | GBP | | | | 247,027 | | | | (469,256 | ) | | | — | | | | (469,256 | ) |
iShares iBoxx $ High Yield Corporate Bond ETF | | 1-month LIBOR
minus 0.35%1 | | Bank of America N.A. | | 11/05/15 | | | USD | | | | 16,250 | | | | (23,899 | ) | | | — | | | | (23,899 | ) |
Genworth Holdings, Inc. | | 3-month LIBOR
minus 0.30%1 | | Bank of America N.A. | | 11/09/15 | | | USD | | | | 115,000 | | | | 106,759 | | | | — | | | | 106,759 | |
Telecom Italia SpA | | 3-month EURIBOR
minus 0.25%1 | | JPMorgan Chase Bank N.A. | | 11/10/15 | | | EUR | | | | 12,307,018 | | | | (2,465,925 | ) | | | — | | | | (2,465,925 | ) |
Telecom Italia SpA | | 3-month EURIBOR
minus 0.30%1 | | JPMorgan Chase Bank N.A. | | 11/10/15 | | | EUR | | | | 866,801 | | | | (120,514 | ) | | | — | | | | (120,514 | ) |
Bankia SA | | 3-month EURIBOR
minus 0.40%1 | | JPMorgan Chase Bank N.A. | | 11/12/15 | | | EUR | | | | 2,766,159 | | | | 207,998 | | | | — | | | | 207,998 | |
Bankia SA | | 3-month EURIBOR
minus 0.40%1 | | JPMorgan Chase Bank N.A. | | 11/12/15 | | | EUR | | | | 2,606,546 | | | | 572,051 | | | | — | | | | 572,051 | |
Bankia SA | | 3-month EURIBOR
minus 0.40%1 | | JPMorgan Chase Bank N.A. | | 11/12/15 | | | EUR | | | | 741,339 | | | | 176,839 | | | | — | | | | 176,839 | |
Bankia SA | | 3-month EURIBOR
minus 0.40%1 | | JPMorgan Chase Bank N.A. | | 11/12/15 | | | EUR | | | | 631,729 | | | | 61,060 | | | | — | | | | 61,060 | |
Bankia SA | | 3-month EURIBOR
minus 0.40%1 | | JPMorgan Chase Bank N.A. | | 11/12/15 | | | EUR | | | | 482,704 | | | | 45,037 | | | | — | | | | 45,037 | |
Bankia SA | | 3-month EURIBOR
minus 0.40%1 | | JPMorgan Chase Bank N.A. | | 11/12/15 | | | EUR | | | | 289,718 | | | | 71,968 | | | | — | | | | 71,968 | |
Bankia SA | | 3-month EURIBOR
minus 0.40%1 | | JPMorgan Chase Bank N.A. | | 11/12/15 | | | EUR | | | | 242,857 | | | | 46,713 | | | | — | | | | 46,713 | |
Bankia SA | | 3-month EURIBOR
minus 0.40%1 | | JPMorgan Chase Bank N.A. | | 11/12/15 | | | EUR | | | | 189,093 | | | | 37,099 | | | | — | | | | 37,099 | |
Repsol SA | | 3-month EURIBOR
minus 0.20%1 | | Goldman Sachs International | | 11/12/15 | | | EUR | | | | 507,494 | | | | 983,784 | | | | — | | | | 983,784 | |
iShares iBoxx $ High Yield Corporate Bond ETF | | 1-month LIBOR1 | | Bank of America N.A. | | 11/13/15 | | | USD | | | | 17,500 | | | | (4,112 | ) | | | — | | | | (4,112 | ) |
International Airlines Group SA | | 3-month LIBOR
minus 0.25%1 | | BNP Paribas S.A. | | 11/16/15 | | | GBP | | | | 862,398 | | | | (1,549,090 | ) | | | — | | | | (1,549,090 | ) |
International Airlines Group SA | | 3-month LIBOR
minus 0.25%1 | | BNP Paribas S.A. | | 11/16/15 | | | GBP | | | | 87,407 | | | | (165,646 | ) | | | — | | | | (165,646 | ) |
iShares iBoxx $ High Yield Corporate Bond ETF | | 1-month LIBOR1 | | Bank of America N.A. | | 11/17/15 | | | USD | | | | 35,000 | | | | (28,906 | ) | | | — | | | | (28,906 | ) |
Genworth Holdings, Inc. | | 3-month LIBOR
minus 0.30%1 | | Bank of America N.A. | | 11/18/15 | | | USD | | | | 50,000 | | | | 118,222 | | | | — | | | | 118,222 | |
See Notes to Financial Statements.
| | | | | | |
| | | BLACKROCK FUNDS | | JANUARY 31, 2015 | | 43 |
| | | | |
| Schedule of Investments (continued) | | | BlackRock Global Long/Short Credit Fund | |
As of January 31, 2015, OTC total return swaps outstanding were as follows: (concluded)
| | | | | | | | | | | | | | | | | | | | | | | | | | |
| Reference Entity | | Floating Rate | | Counterparty | | Expiration
Date | | Notional Amount (000) | | | Market Value | | | Premiums Paid (Received) | | | Unrealized Appreciation (Depreciation) | |
International Airlines Group SA | | 3-month LIBOR
minus 0.25%1 | | BNP Paribas S.A. | | 11/27/15 | | | GBP | | | | 74,936 | | | $ | (90,686 | ) | | | — | | | $ | (90,686 | ) |
California Resources Corp. | | 3-month LIBOR
minus 0.30%1 | | Bank of America N.A. | | 12/01/15 | | | USD | | | | 70,500 | | | | 138,199 | | | | — | | | | 138,199 | |
Antero Resources Corp. | | 3-month LIBOR
minus 0.90%1 | | Bank of America N.A. | | 12/07/15 | | | USD | | | | 1,180 | | | | 8,867 | | | | — | | | | 8,867 | |
Energy Select Sector SPDR Fund | | 1-month LIBOR
plus 0.21%1 | | Goldman Sachs International | | 12/09/15 | | | USD | | | | 5,350 | | | | 4,423 | | | | — | | | | 4,423 | |
Antero Resources Corp. | | 3-month LIBOR
minus 0.90%1 | | Bank of America N.A. | | 12/10/15 | | | USD | | | | 2,550 | | | | 11,247 | | | | — | | | | 11,247 | |
PowerShares Senior Loan | | 3-month LIBOR
minus 0.05%1 | | Bank of America N.A. | | 12/11/15 | | | USD | | | | 175,000 | | | | (40,817 | ) | | | — | | | | (40,817 | ) |
PowerShares Senior Loan | | 3-month LIBOR
minus 0.05%1 | | Bank of America N.A. | | 12/12/15 | | | USD | | | | 42,000 | | | | (15,456 | ) | | | — | | | | (15,456 | ) |
Energy Select Sector SPDR Fund | | 1-month LIBOR
minus 0.25%1 | | Goldman Sachs International | | 12/15/15 | | | USD | | | | 8,853 | | | | (23,837 | ) | | | — | | | | (23,837 | ) |
Bankia SA | | 3-month EURIBOR
minus 0.50%1 | | JPMorgan Chase Bank N.A. | | 12/17/15 | | | EUR | | | | 1,725,726 | | | | 160,750 | | | | — | | | | 160,750 | |
Bankia SA | | 3-month EURIBOR
minus 0.50%1 | | JPMorgan Chase Bank N.A. | | 12/17/15 | | | EUR | | | | 879,462 | | | | 115,709 | | | | — | | | | 115,709 | |
Genworth Holdings, Inc. | | 3-month LIBOR
minus 0.30%1 | | Bank of America N.A. | | 12/18/15 | | | USD | | | | 95,910 | | | | 79,759 | | | | — | | | | 79,759 | |
Volkswagen AG | | 3-month EURIBOR
minus 0.43%1 | | BNP Paribas S.A. | | 1/16/16 | | | EUR | | | | 43,711 | | | | — | | | | — | | | | — | |
APERAM SA | | 3-month EURIBOR
minus 0.50%1 | | JPMorgan Chase Bank N.A. | | 1/18/16 | | | EUR | | | | 34,390 | | | | 45,303 | | | | — | | | | 45,303 | |
Repsol SA | | 3-month EURIBOR
minus 0.30%1 | | BNP Paribas S.A. | | 1/18/16 | | | EUR | | | | 13,716 | | | | (6,594 | ) | | | — | | | | (6,594 | ) |
California Resources Corp. | | 3-month LIBOR
minus 0.30%1 | | Bank of America N.A. | | 1/29/16 | | | USD | | | | 105,000 | | | | — | | | | — | | | | — | |
Total | | | | | | | | | | | | | | | | $ | (9,262,475 | ) | | | — | | | $ | (9,262,475 | ) |
| | | | | | | | | | | | | | | | | | |
| | 1 | | Fund pays the total return of the reference entity and receives the fixed rate. Net payment made at termination. |
| Ÿ | | Fair Value Measurements — Various inputs are used in determining the fair value of investments and derivative financial instruments. These inputs to valuation techniques are categorized into a disclosure hierarchy consisting of three broad levels for financial statement purposes. The hierarchy gives the highest priority to unadjusted quoted prices in active markets for identical assets or liabilities (Level 1 measurements) and the lowest priority to unobservable inputs (Level 3 measurements). Accordingly, the degree of judgment exercised in determining fair value is greatest for instruments categorized in Level 3. The inputs used to measure fair value may fall into different levels of the fair value hierarchy. In such cases, for disclosure purposes, the fair value hierarchy classification is determined based on the lowest level input that is significant to the fair value measurement in its entirety. The categorization of a value determined for investments and derivative financial instruments is based on the pricing transparency of the investment and derivative financial instrument and is not necessarily an indication of the risks associated with investing in those securities. The three levels of the fair value hierarchy are as follows: |
| | Ÿ | | Level 1 — unadjusted quoted prices in active markets/exchanges for identical assets or liabilities that the Fund has the ability to access |
| | Ÿ | | Level 2 — other observable inputs (including, but not limited to, quoted prices for similar assets or liabilities in markets that are active, quoted prices for identical or similar assets or liabilities in markets that are not active, inputs other than quoted prices that are observable for the assets or liabilities (such as interest rates, yield curves, volatilities, prepayment speeds, loss severities, credit risks and default rates) or other market–corroborated inputs) |
| | Ÿ | | Level 3 — unobservable inputs based on the best information available in the circumstances, to the extent observable inputs are not available (including the Fund’s own assumptions used in determining the fair value of investments and derivative financial instruments) |
Changes in valuation techniques may result in transfers into or out of an assigned level within the disclosure hierarchy. In accordance with the Fund’s policy, transfers between different levels of the fair value disclosure hierarchy are deemed to have occurred as of the beginning of the reporting period. For information about the Fund’s policy regarding valuation of investments and derivative financial instruments, refer to Note 2 of the Notes to Financial Statements.
See Notes to Financial Statements.
| | | | | | |
| 44 | | BLACKROCK FUNDS | | JANUARY 31, 2015 | | |
| | | | |
| Schedule of Investments (continued) | | | BlackRock Global Long/Short Credit Fund | |
| | | | | | | | | | | | | | | | | | | | |
As of January 31, 2015, the following tables summarize the Fund’s investments and derivative financial instruments categorized in the disclosure hierarchy: | |
| | | Level 1 | | Level 2 | | Level 3 | | Total |
Assets: | | | | | | | | | | | | | | | | | | | | |
Investments: | | | | | | | | | | | | | | | | | | | | |
Long-Term Investments: | | | | | | | | | | | | | | | | | | | | |
Asset-Backed Securities | | | | — | | | | $ | 487,231,693 | | | | $ | 94,329,786 | | | | $ | 581,561,479 | |
Common Stocks | | | $ | 53,589,773 | | | | | 51,864,322 | | | | | 3,329,235 | | | | | 108,783,330 | |
Corporate Bonds | | | | — | | | | | 3,254,184,779 | | | | | 17,922,759 | | | | | 3,272,107,538 | |
Floating Rate Loan Interests | | | | — | | | | | 601,658,389 | | | | | 26,265,022 | | | | | 627,923,411 | |
Foreign Government Obligations | | | | — | | | | | 241,479,346 | | | | | — | | | | | 241,479,346 | |
Non-Agency Mortgage-Backed Securities | | | | — | | | | | 72,629,100 | | | | | — | | | | | 72,629,100 | |
Preferred Securities | | | | 100,548,877 | | | | | 534,079,981 | | | | | — | | | | | 634,628,858 | |
U.S. Treasury Obligations | | | | — | | | | | 625,798,276 | | | | | — | | | | | 625,798,276 | |
Short-Term Securities: | | | | | | | | | | | | | | | | | | | | |
Borrowed Bond Agreements | | | | — | | | | | 1,215,999,576 | | | | | — | | | | | 1,215,999,576 | |
Options Purchased: | | | | | | | | | | | | | | | | | | | | |
Equity Contracts | | | | 1,756,745 | | | | | — | | | | | — | | | | | 1,756,745 | |
Interest Rate Contracts | | | | — | | | | | 405,365 | | | | | — | | | | | 405,365 | |
Liabilities: | | | | | | | | | | | | | | | | | | | | |
Investments: | | | | | | | | | | | | | | | | | | | | |
Borrowed Bonds | | | | — | | | | | (1,246,359,000 | ) | | | | — | | | | | (1,246,359,000 | ) |
Investments Sold Short | | | | (49,844,886 | ) | | | | (3,981,409 | ) | | | | — | | | | | (53,826,295 | ) |
Total | | | $ | 106,050,509 | | | | $ | 5,834,990,418 | | | | $ | 141,846,802 | | | | $ | 6,082,887,729 | |
| | | | | |
| | | | | | | | | | | | | | | | | | | | |
| | | Level 1 | | Level 2 | | Level 3 | | Total |
Derivative Financial Instruments1 | | | | | | | | | | | | | | | | | | | | |
Assets: | | | | | | | | | | | | | | | | | | | | |
Credit contracts | | | | — | | | | $ | 5,608,597 | | | | | — | | | | $ | 5,608,597 | |
Equity contracts | | | $ | 1,633,988 | | | | | 4,016,246 | | | | | — | | | | | 5,650,234 | |
Foreign currency exchange contracts | | | | — | | | | | 244,261,631 | | | | | — | | | | | 244,261,631 | |
Interest rate contracts | | | | — | | | | | 13,213 | | | | | — | | | | | 13,213 | |
Commodity contracts | | | | — | | | | | 681,088 | | | | | — | | | | | 681,088 | |
Liabilities: | | | | | | | | | | | | | | | | | | | | |
Credit contracts | | | | — | | | | | (15,740,850 | ) | | | | — | | | | | (15,740,850 | ) |
Equity contracts | | | | (194,183 | ) | | | | (13,811,253 | ) | | | | — | | | | | (14,005,436 | ) |
Foreign currency exchange contracts | | | | — | | | | | (2,394,666 | ) | | | | — | | | | | (2,394,666 | ) |
Interest rate contracts | | | | (41,396,820 | ) | | | | (6,602,759 | ) | | | | — | | | | | (47,999,579 | ) |
Commodity contracts | | | | — | | | | | (23,837 | ) | | | | — | | | | | (23,837 | ) |
| | | | | |
Total | | | $ | (39,957,015 | ) | | | $ | 216,007,410 | | | | | — | | | | $ | 176,050,395 | |
| | | | | |
1 Derivative financial instruments are swaps, financial futures contracts, forward foreign currency exchange contracts and options written. Swaps, financial futures contracts and forward foreign currency exchange contracts are valued at the unrealized appreciation/depreciation on the instrument and options written are shown at value. | |
|
| The Fund may hold assets and/or liabilities in which the fair value approximates the carrying amount, for financial statement purposes. As of January 31, 2015, such assets and/or liabilities are categorized within the disclosure hierarchy as follows: | |
| | | | | | | | | | | | | | | | | | | | |
| | | Level 1 | | Level 2 | | Level 3 | | Total |
Assets: | | | | | | | | | | | | | | | | | | | | |
Foreign currency at value | | | $ | 126,256 | | | | | — | | | | | — | | | | $ | 126,256 | |
Cash pledged as collateral for OTC derivatives | | | | 14,970,000 | | | | | — | | | | | — | | | | | 14,970,000 | |
Cash pledged as collateral for borrowed bond agreements | | | | 651,000 | | | | | — | | | | | — | | | | | 651,000 | |
Cash pledged for centrally cleared swaps. | | | | 18,295,000 | | | | | — | | | | | — | | | | | 18,295,000 | |
Cash pledged for financial futures contracts. | | | | 22,585,000 | | | | | — | | | | | — | | | | | 22,585,000 | |
Liabilities: | | | | | | | | | | | | | | | | | | | | |
Bank overdraft | | | | — | | | | $ | (16,804,488 | ) | | | | — | | | | | (16,804,488 | ) |
Reverse repurchase agreements | | | | — | | | | | (317,601,110 | ) | | | | — | | | | | (317,601,110 | ) |
Cash received as collateral for OTC derivatives. | | | | — | | | | | (4,248,000 | ) | | | | — | | | | | (4,248,000 | ) |
Total | | | $ | 56,627,256 | | | | $ | (338,653,598 | ) | | | | — | | | | $ | (282,026,342 | ) |
| | | | | |
During the six months ended January 31, 2015, there were no transfers between Level 1 and Level 2. | |
See Notes to Financial Statements.
| | | | | | |
| | | BLACKROCK FUNDS | | JANUARY 31, 2015 | | 45 |
| | | | |
| Schedule of Investments (concluded) | | | BlackRock Global Long/Short Credit Fund | |
A reconciliation of Level 3 investments is presented when the Fund had a significant amount of Level 3 investments at the beginning and/or end of the period in relation to net assets. The following table is a reconciliation of Level 3 investments for which significant unobservable inputs were used in determining fair value:
| | | | | | | | | | | | | | | | | | | | |
| | | Asset-Backed
Securities | | | Common Stocks | | | Corporate Bonds | | | Floating Rate
Loan Interests | | | Total | |
Assets: | | | | | | | | | | | | | | | | | | | | |
Opening Balance, as of July 31, 2014 | | $ | 140,944,922 | | | | — | | | $ | 53,742,855 | | | $ | 52,324,472 | | | $ | 247,012,249 | |
Transfers into Level 31 | | | 36,051,964 | | | | — | | | | — | | | | 5,313,597 | | | | 41,365,561 | |
Transfers out of Level 32 | | | (118,199,471 | ) | | | — | | | | (35,621,163 | ) | | | (6,936,868 | ) | | | (160,757,502 | ) |
Accrued discounts/premiums | | | 59,927 | | | | — | | | | (812 | ) | | | 48,562 | | | | 107,677 | |
Net realized gain (loss) | | | (240,661 | ) | | | — | | | | — | | | | (3,215 | ) | | | (243,876 | ) |
Net change in unrealized appreciation/depreciation3,4 | | | (11,633,104 | ) | | $ | (468,885 | ) | | | (1,333,844 | ) | | | (3,763,321 | ) | | | (17,199,154 | ) |
Purchases | | | 54,941,012 | | | | 3,798,120 | | | | 1,135,723 | | | | 242,095 | | | | 60,116,950 | |
Sales | | | (7,594,803 | ) | | | — | | | | — | | | | (20,960,300 | ) | | | (28,555,103 | ) |
Closing Balance, as of January 31, 2015 | | $ | 94,329,786 | | | $ | 3,329,235 | | | $ | 17,922,759 | | | $ | 26,265,022 | | | $ | 141,846,802 | |
| | | | |
Net change in unrealized appreciation/depreciation on investments still held at January 31, 20154 | | $ | (11,664,540 | ) | | $ | (468,885 | ) | | $ | (1,333,844 | ) | | $ | (3,844,013 | ) | | $ | (17,311,282 | ) |
| | | | |
| | 1 | | As of July 31, 2014, the Fund used observable inputs in determining the value of certain investments. As of January 31, 2015, the Fund used significant unobservable inputs in determining the value of the same investments. As a result, investments with a beginning of period value of $41,365,561 transferred from Level 2 to Level 3 in the disclosure hierarchy. |
| | 2 | | As of July 31, 2014, the Fund used significant unobservable inputs in determining the value of certain investments. As of January 31, 2015, the Fund used observable inputs in determining the value of the same investments. As a result, investments with a beginning of period value of $160,757,502 transferred from Level 3 to Level 2 in the disclosure hierarchy. |
| | 3 | | Included in the related net change in unrealized appreciation/depreciation in the Statements of Operations. |
| | 4 | | Any difference between Net change in unrealized appreciation/depreciation and Net change in unrealized appreciation/depreciation on investments still held at January 31, 2015, is generally due to investments no longer held or categorized as Level 3 at period end. |
The Fund’s investments that are categorized as Level 3 were valued utilizing third party pricing information without adjustment. Such valuations are based on unobservable inputs. A significant change in third party information could result in a significantly lower or higher value of such Level 3 investments.
See Notes to Financial Statements.
| | | | | | |
| 46 | | BLACKROCK FUNDS | | JANUARY 31, 2015 | | |
| | | | |
| Consolidated Schedule of Investments January 31, 2015 (Unaudited) | | | BlackRock Macro Themes Fund | |
| | | (Percentages shown are based on Net Assets) | |
| | | | | | | | | | | | |
| Corporate Bonds | | | | | Par (000) | | | Value | |
Aerospace & Defense — 0.4% | | | | | | | | | | | | |
L-3 Communications Corp., 5.20%, 10/15/19 | | | USD | | | | 110 | | | $ | 123,178 | |
Automobiles — 1.1% | | | | | | | | | | | | |
BMW Finance NV, 0.50%, 9/05/18 | | | EUR | | | | 50 | | | | 56,869 | |
Renault SA: | | | | | | | | | | | | |
4.63%, 9/18/17 | | | | | | | 90 | | | | 111,420 | |
3.13%, 3/05/21 | | | | | | | 40 | | | | 50,167 | |
Volkswagen International Finance NV, 0.67%, 4/15/19 (a) | | | | | | | 100 | | | | 114,119 | |
| | | | | | | | | | | | |
| | | | | | | | | | | | 332,575 | |
Banks — 9.9% | | | | | | | | | | | | |
Abbey National Treasury Services PLC, 2.00%, 1/14/19 | | | | | | | 100 | | | | 118,947 | |
Bank of America Corp., 5.75%, 12/01/17 | | | USD | | | | 110 | | | | 122,073 | |
Bank of Ireland, 2.00%, 5/08/17 | | | EUR | | | | 100 | | | | 115,488 | |
Bankia SA, 3.50%, 1/17/19 | | | | | | | 100 | | | | 122,239 | |
Barclays Bank PLC, 6.05%, 12/04/17 | | | USD | | | | 110 | | | | 121,663 | |
BNP Paribas SA, 5.43%, 9/07/17 | | | EUR | | | | 90 | | | | 114,140 | |
BPCE SA: | | | | | | | | | | | | |
2.13%, 3/17/21 | | | | | | | 100 | | | | 121,581 | |
2.75%, 7/08/26 (a) | | | | | | | 100 | | | | 116,203 | |
Citigroup, Inc., 5.50%, 9/13/25 | | | USD | | | | 40 | | | | 45,257 | |
Commerzbank AG, 6.38%, 3/22/19 | | | EUR | | | | 30 | | | | 39,329 | |
Cooperatieve Centrale Raiffeisen-Boerenleenbank BA, 3.75%, 11/09/20 | | | | | | | 50 | | | | 63,489 | |
Credit Agricole SA, 1.88%, 10/18/17 | | | | | | | 100 | | | | 117,712 | |
Deutsche Bank AG, 1.25%, 9/08/21 | | | | | | | 100 | | | | 115,668 | |
HSBC Holdings PLC, 3.38%, 1/10/24 (a) | | | | | | | 100 | | | | 120,765 | |
ICICI Bank Ltd., 4.75%, 11/25/16 | | | USD | | | | 200 | | | | 209,459 | |
ING Bank NV, 6.13%, 5/29/23 (a) | | | EUR | | | | 80 | | | | 103,608 | |
Intesa Sanpaolo SpA, 5.00%, 9/23/19 | | | | | | | 50 | | | | 63,048 | |
JPMorgan Chase Bank N.A., 0.76%, 5/31/17 (a) | | | | | | | 50 | | | | 56,358 | |
Lloyds Bank PLC, 10.75%, 12/16/21 (a) | | | GBP | | | | 60 | | | | 104,377 | |
Nordea Bank AB, 4.50%, 3/26/20 | | | EUR | | | | 80 | | | | 105,392 | |
The Royal Bank of Scotland PLC, 4.35%, 1/23/17 | | | | | | | 100 | | | | 119,047 | |
Santander Holdings USA, Inc., 3.45%, 8/27/18 | | | USD | | | | 110 | | | | 115,004 | |
Santander International Debt SAU, 4.00%, 3/27/17 | | | EUR | | | | 100 | | | | 121,486 | |
Société Générale SA, 4.75%, 3/02/21 | | | | | | | 100 | | | | 140,514 | |
Svenska Handelsbanken AB, 2.66%, 1/15/24 (a) | | | | | | | 100 | | | | 118,603 | |
UniCredit SpA, 5.75%, 9/26/17 | | | | | | | 90 | | | | 113,438 | |
Unione di Banche Italiane SCpA, 2.75%, 4/28/17 | | | | | | | 100 | | | | 117,848 | |
Wells Fargo & Co., 5.61%, 1/15/44 | | | USD | | | | 20 | | | | 25,015 | |
| | | | | | | | | | | | |
| | | | | | | | | | | | 2,967,751 | |
Capital Markets — 1.1% | | | | | | | | | | | | |
The Goldman Sachs Group, Inc.: | | | | | | | | | | | | |
6.13%, 5/14/17 | | | GBP | | | | 20 | | | | 32,855 | |
6.25%, 9/01/17 | | | USD | | | | 110 | | | | 122,556 | |
Morgan Stanley: | | | | | | | | | | | | |
4.75%, 3/22/17 | | | | | | | 110 | | | | 117,476 | |
4.88%, 11/01/22 | | | | | | | 60 | | | | 65,212 | |
| | | | | | | | | | | | |
| | | | | | | | | | | | 338,099 | |
Chemicals — 0.4% | | | | | | | | | | | | |
Clariant Finance Luxembourg SA, 5.63%, 1/24/17 | | | EUR | | | | 100 | | | | 123,507 | |
Construction Materials — 0.4% | | | | | | | | | | | | |
HeidelbergCement Finance Luxembourg SA, 8.00%, 1/31/17 | | | | | | | 80 | | | | 102,740 | |
| | | | | | | | | | | | |
| Corporate Bonds | | | | | Par (000) | | | Value | |
Diversified Financial Services — 0.8% | | | | | | | | | | | | |
General Electric Capital Corp., 4.38%, 9/16/20 | | | USD | | | | 50 | | | $ | 55,922 | |
General Motors Financial Co., Inc., 3.00%, 9/25/17 | | | | | | | 180 | | | | 183,375 | |
| | | | | | | | | | | | |
| | | | | | | | | | | | 239,297 | |
Diversified Telecommunication Services — 0.4% | | | | | | | | | | | | |
Verizon Communications, Inc., 2.63%, 2/21/20 | | | | | | | 120 | | | | 121,382 | |
Energy Equipment & Services — 0.1% | | | | | | | | | | | | |
SESI LLC, 7.13%, 12/15/21 | | | | | | | 40 | | | | 40,100 | |
Food & Staples Retailing — 0.2% | | | | | | | | | | | | |
Casino Guichard Perrachon SA, 4.38%, 2/08/17 | | | EUR | | | | 50 | | | | 60,961 | |
Health Care Equipment & Supplies — 0.1% | | | | | | | | | | | | |
Medtronic, Inc., 3.50%, 3/15/25 | | | USD | | | | 30 | | | | 31,758 | |
Health Care Providers & Services — 0.3% | | | | | | | | | | | | |
Anthem, Inc., 2.30%, 7/15/18 | | | | | | | 90 | | | | 91,716 | |
Insurance — 0.4% | | | | | | | | | | | | |
American International Group, Inc., 5.45%, 5/18/17 | | | | | | | 110 | | | | 120,142 | |
IT Services — 0.2% | | | | | | | | | | | | |
Fidelity National Information Services, Inc., 3.50%, 4/15/23 | | | | | | | 50 | | | | 51,082 | |
Media — 1.6% | | | | | | | | | | | | |
COX Communications, Inc., 6.25%, 6/01/18 | | | | | | | 50 | | | | 56,909 | |
DIRECTV Holdings LLC/DIRECTV Financing Co., Inc., 4.60%, 2/15/21 | | | | | | | 60 | | | | 65,844 | |
The Interpublic Group of Cos., Inc., 3.75%, 2/15/23 | | | | | | | 30 | | | | 30,989 | |
NBCUniversal Enterprise, Inc., 1.66%, 4/15/18 | | | | | | | 100 | | | | 100,854 | |
SKY PLC, 2.50%, 9/15/26 | | | EUR | | | | 100 | | | | 122,913 | |
WPP Finance SA, 6.38%, 11/06/20 | | | GBP | | | | 50 | | | | 93,018 | |
| | | | | | | | | | | | |
| | | | | | | | | | | | 470,527 | |
Metals & Mining — 0.9% | | | | | | | | | | | | |
Alcoa, Inc., 6.75%, 7/15/18 | | | USD | | | | 50 | | | | 56,750 | |
Barrick Gold Corp., 4.10%, 5/01/23 | | | | | | | 60 | | | | 59,978 | |
BHP Billiton Finance USA Ltd., 3.85%, 9/30/23 | | | | | | | 60 | | | | 64,526 | |
Freeport-McMoRan, Inc.: | | | | | | | | | | | | |
2.15%, 3/01/17 | | | | | | | 70 | | | | 69,553 | |
4.55%, 11/14/24 | | | | | | | 30 | | | | 27,419 | |
| | | | | | | | | | | | |
| | | | | | | | | | | | 278,226 | |
Multiline Retail — 0.2% | | | | | | | | | | | | |
Dollar General Corp., 4.13%, 7/15/17 | | | | | | | 50 | | | | 52,623 | |
Multi-Utilities — 0.1% | | | | | | | | | | | | |
DTE Energy Co., 3.85%, 12/01/23 | | | | | | | 30 | | | | 32,669 | |
Oil, Gas & Consumable Fuels — 0.7% | | | | | | | | | | | | |
Devon Energy Corp., 3.25%, 5/15/22 | | | | | | | 30 | | | | 30,378 | |
Kinder Morgan Energy Partners LP, 4.25%, 9/01/24 | | | | | | | 20 | | | | 20,734 | |
Kinder Morgan, Inc.: | | | | | | | | | | | | |
2.00%, 12/01/17 | | | | | | | 60 | | | | 59,875 | |
3.05%, 12/01/19 | | | | | | | 60 | | | | 60,551 | |
Williams Partners LP, 3.90%, 1/15/25 | | | | | | | 50 | | | | 48,376 | |
| | | | | | | | | | | | |
| | | | | | | | | | | | 219,914 | |
Pharmaceuticals — 1.9% | | | | | | | | | | | | |
Actavis Funding SCS, 1.30%, 6/15/17 | | | | | | | 90 | | | | 89,169 | |
AstraZeneca PLC, 0.88%, 11/24/21 | | | EUR | | | | 100 | | | | 114,469 | |
Forest Laboratories, Inc., 5.00%, 12/15/21 | | | USD | | | | 30 | | | | 32,819 | |
See Notes to Financial Statements.
| | | | | | |
| | | BLACKROCK FUNDS | | JANUARY 31, 2015 | | 47 |
| | | | |
| Consolidated Schedule of Investments (continued) | | | BlackRock Macro Themes Fund | |
| | | (Percentages shown are based on Net Assets) | |
| | | | | | | | | | | | |
| Corporate Bonds | | | | | Par (000) | | | Value | |
Pharmaceuticals (concluded) | | | | | | | | | | | | |
Novartis Finance SA, 0.75%, 11/09/21 | | | EUR | | | | 100 | | | $ | 114,560 | |
Roche Holdings, Inc., 2.88%, 9/29/21 | | | USD | | | | 200 | | | | 208,497 | |
| | | | | | | | | | | | |
| | | | | | | | | | | | 559,514 | |
Real Estate Investment Trusts (REITs) — 1.3% | | | | | | | | | | | | |
American Tower Corp., 3.45%, 9/15/21 | | | | | | | 120 | | | | 122,755 | |
Hammerson PLC, 2.75%, 9/26/19 | | | EUR | | | | 100 | | | | 123,415 | |
HCP, Inc., 3.88%, 8/15/24 | | | USD | | | | 30 | | | | 31,347 | |
Ventas Realty LP: | | | | | | | | | | | | |
1.25%, 4/17/17 | | | | | | | 30 | | | | 29,961 | |
3.75%, 5/01/24 | | | | | | | 60 | | | | 62,706 | |
| | | | | | | | | | | | |
| | | | | | | | | | | | 370,184 | |
Road & Rail — 0.2% | | | | | | | | | | | | |
Penske Truck Leasing Co. LP/PTL Finance Corp., 3.75%, 5/11/17 | | | | | | | 60 | | | | 62,726 | |
Semiconductors & Semiconductor Equipment — 0.5% | | | | | |
ASML Holding NV, 3.38%, 9/19/23 | | | EUR | | | | 100 | | | | 134,543 | |
Software — 0.8% | | | | | | | | | | | | |
Amadeus Finance BV, 0.63%, 12/02/17 | | | | | | | 100 | | | | 113,673 | |
SAP SE, 0.38%, 11/20/18 (a) | | | | | | | 100 | | | | 113,448 | |
| | | | | | | | | | | | |
| | | | | | | | | | | | 227,121 | |
Specialty Retail — 0.6% | | | | | | | | | | | | |
Lowe’s Cos., Inc., 3.88%, 9/15/23 | | | USD | | | | 60 | | | | 66,147 | |
QVC, Inc.: | | | | | | | | | | | | |
3.13%, 4/01/19 | | | | | | | 60 | | | | 60,768 | |
4.45%, 2/15/25 | | | | | | | 60 | | | | 61,342 | |
| | | | | | | | | | | | |
| | | | | | | | | | | | 188,257 | |
Tobacco — 0.2% | | | | | | | | | | | | |
Reynolds American, Inc., 4.85%, 9/15/23 | | | | | | | 60 | | | | 66,781 | |
Wireless Telecommunication Services — 0.5% | | | | | | | | | | | | |
Eutelsat SA, 4.13%, 3/27/17 | | | EUR | | | | 50 | | | | 60,925 | |
Vodafone Group PLC: | | | | | | | | | | | | |
1.63%, 3/20/17 | | | USD | | | | 60 | | | | 60,407 | |
2.50%, 9/26/22 | | | | | | | 30 | | | | 29,253 | |
| | | | | | | | | | | | |
| | | | | | | | | | | | 150,585 | |
Total Corporate Bonds — 25.3% | | | | | | | | | | | 7,557,958 | |
| | | | | | | | | | | | |
| Foreign Agency Obligations | | | | | | | | | |
Brazil — 0.6% | | | | | | | | | | | | |
Petrobras International Finance Co.: | | | | | | | | | | | | |
3.88%, 1/27/16 | | | | | | | 60 | | | | 58,386 | |
5.75%, 1/20/20 | | | | | | | 120 | | | | 111,287 | |
| | | | | | | | | | | | |
| | | | | | | | | | | | 169,673 | |
Luxembourg — 0.6% | | | | | | | | | | | | |
Gazprom OAO Via Gaz Capital SA, 4.30%, 11/12/15 | | | | | | | 200 | | | | 197,700 | |
Total Foreign Agency Obligations — 1.2% | | | | | | | | | | | 367,373 | |
| | | | | | | | | | | | |
| | | | | | | | | | |
| | | | | | | | | | | | |
| Foreign Government Obligations | | | | | Par (000) | | | Value | |
Brazil — 2.3% | | | | | | | | | | | | |
Brazil Notas do Tesouro Nacional, Series B, 6.00%, 8/15/22 | | | BRL | | | | 600 | | | $ | 573,869 | |
Federal Republic of Brazil, 2.88%, 4/01/21 | | | EUR | | | | 100 | | | | 117,519 | |
| | | | | | | | | | | | |
| | | | | | | | | | | | 691,388 | |
Canada — 0.9% | | | | | | | | | | | | |
Province of Quebec Canada, 3.50%, 12/01/22 | | | CAD | | | | 295 | | | | 263,454 | |
Colombia — 2.0% | | | | | | | | | | | | |
Republic of Colombia, 4.00%, 2/26/24 | | | USD | | | | 578 | | | | 599,675 | |
Greece — 1.5% | | | | | | | | | | | | |
Hellenic Republic: | | | | | | | | | | | | |
4.75%, 4/17/19 | | | EUR | | | | 287 | | | | 227,325 | |
2.00%, 2/24/23 (b) | | | | | | | 16 | | | | 10,613 | |
2.00%, 2/24/24 (b) | | | | | | | 17 | | | | 10,656 | |
2.00%, 2/24/25 (b) | | | | | | | 17 | | | | 10,948 | |
2.00%, 2/24/26 (b) | | | | | | | 18 | | | | 10,689 | |
2.00%, 2/24/27 (b) | | | | | | | 19 | | | | 10,645 | |
2.00%, 2/24/28 (b) | | | | | | | 19 | | | | 10,706 | |
2.00%, 2/24/29 (b) | | | | | | | 20 | | | | 10,809 | |
2.00%, 2/24/30 (b) | | | | | | | 20 | | | | 11,098 | |
2.00%, 2/24/31 (b) | | | | | | | 20 | | | | 11,085 | |
2.00%, 2/24/32 (b) | | | | | | | 20 | | | | 11,303 | |
2.00%, 2/24/33 (b) | | | | | | | 21 | | | | 11,401 | |
2.00%, 2/24/34 (b) | | | | | | | 21 | | | | 11,469 | |
2.00%, 2/24/35 (b) | | | | | | | 21 | | | | 11,568 | |
2.00%, 2/24/36 (b) | | | | | | | 21 | | | | 11,728 | |
2.00%, 2/24/37 (b) | | | | | | | 21 | | | | 11,873 | |
2.00%, 2/24/38 (b) | | | | | | | 21 | | | | 11,792 | |
2.00%, 2/24/39 (b) | | | | | | | 21 | | | | 11,804 | |
2.00%, 2/24/40 (b) | | | | | | | 21 | | | | 11,800 | |
2.00%, 2/24/41 (b) | | | | | | | 21 | | | | 11,728 | |
2.00%, 2/24/42 (b) | | | | | | | 21 | | | | 11,823 | |
| | | | | | | | | | | | |
| | | | | | | | | | | | 452,863 | |
Indonesia — 1.5% | | | | | | | | | | | | |
Republic of Indonesia: | | | | | | | | | | | | |
11.63%, 3/04/19 | | | USD | | | | 164 | | | | 219,555 | |
2.88%, 7/08/21 | | | EUR | | | | 200 | | | | 232,779 | |
| | | | | | | | | | | | |
| | | | | | | | | | | | 452,334 | |
Italy — 2.2% | | | | | | | | | | | | |
Italy Buoni Poliennali Del Tesoro: | | | | | | | | | | | | |
2.15%, 11/12/17 | | | | | | | 90 | | | | 105,838 | |
4.50%, 5/01/23 | | | | | | | 397 | | | | 553,982 | |
| | | | | | | | | | | | |
| | | | | | | | | | | | 659,820 | |
Portugal — 2.8% | | | | | | | | | | | | |
Portugal Obrigacoes do Tesouro OT: | | | | | | | | | | | | |
3.88%, 2/15/30 | | | | | | | 219 | | | | 270,836 | |
4.10%, 2/15/45 | | | | | | | 465 | | | | 580,441 | |
| | | | | | | | | | | | |
| | | | | | | | | | | | 851,277 | |
Russia — 0.2% | | | | | | | | | | | | |
Russia Federation, 7.50%, 3/31/30 (b) | | | USD | | | | 66 | | | | 65,866 | |
Slovenia — 0.8% | | | | | | | | | | | | |
Republic of Slovenia, 5.85%, 5/10/23 | | | | | | | 200 | | | | 236,516 | |
See Notes to Financial Statements.
| | | | | | |
| 48 | | BLACKROCK FUNDS | | JANUARY 31, 2015 | | |
| | | | |
| Consolidated Schedule of Investments (continued) | | | BlackRock Macro Themes Fund | |
| | | (Percentages shown are based on Net Assets) | |
| | | | | | | | | | | | |
| Foreign Government Obligations | | | | | Par (000) | | | Value | |
Spain — 0.6% | | | | | | | | | | | | |
Kingdom of Spain: | | | | | | | | | | | | |
1.80%, 11/30/24 | | | EUR | | | | 20 | | | $ | 25,466 | |
5.15%, 10/31/44 | | | | | | | 80 | | | | 140,124 | |
| | | | | | | | | | | | |
| | | | | | | | | | | | 165,590 | |
Turkey — 0.4% | | | | | | | | | | | | |
Republic of Turkey, 7.50%, 7/14/17 | | | USD | | | | 100 | | | | 111,875 | |
Total Foreign Government Obligations — 15.2% | | | | | | | | | | | 4,550,658 | |
| | | | | | | | | | | | |
| Investment Companies | | | | | Shares | | | | |
ETFS Nickel (c)(d) | | | | | | | 13,970 | | | | 220,656 | |
ETFS Physical PM Basket (c)(d) | | | | | | | 6,379 | | | | 612,416 | |
Financial Select Sector SPDR Fund | | | | | | | 21,472 | | | | 494,071 | |
Health Care Select Sector SPDR Fund (d) | | | | | | | 10,670 | | | | 739,111 | |
Morgan Stanley Emerging Markets Domestic Debt Fund, Inc. | | | | | | | 26,064 | | | | 274,193 | |
Total Investment Companies — 7.8% | | | | | | | | | | | 2,340,447 | |
| | | | | | | | | | | | |
| | | | | | | | | | |
| | | | | | | | | | | | |
| U.S. Treasury Obligations — 4.5% | | | | | Par (000) | | | Value | |
U.S. Treasury Bonds, 3.63%, 2/15/44 | | | USD | | | | 1,029 | | | $ | 1,331,782 | |
Total Long-Term Investments
(Cost — $16,784,466) — 54.0% | | | | | | | | 16,148,218 | |
| | | | | | | | | | | | |
| Short-Term Securities | | | | | Shares | | | | |
BlackRock Liquidity Funds, TempFund, Institutional Class, 0.06% (d)(e)(f) | | | | 12,920,516 | | | | 12,920,516 | |
Total Short-Term Securities
(Cost — $12,920,516) — 43.3% | | | | 12,920,516 | |
| | | |
| Options Purchased | | | | | | | | | |
(Cost — $244,590) — 0.5% | | | | | | | | | | | 155,149 | |
Total Investments Before Options Written
(Cost — $29,949,572) — 97.8% | | | | | | | | 29,223,883 | |
| | | | | | | | | | | | |
| Options Written | | | | | | | | | |
(Premiums Received — $ 128,727) — (0.3)% | | | | | | | | | | | (91,724 | ) |
Total Investments Net of Options Written
(Cost — $29,820,845) — 97.5% | | | | 29,132,159 | |
Other Assets Less Liabilities — 2.5% | | | | | | | | | | | 759,542 | |
| | | | | | | | | | | | |
Net Assets — 100.0% | | | | | | | | | | $ | 29,891,701 | |
| | | | | | | | | | | | |
|
| Notes to Schedule of Investments |
| (a) | Variable rate security. Rate shown is as of report date. |
| (b) | Represents a step-up bond that pays an initial coupon rate for the first period and then a higher coupon rate for the following periods. Rate shown is as of report date. |
| (c) | Non-income producing security. |
| (d) | All or a portion of security is held by a wholly owned subsidiary. See Note 1 of the Notes to Financial Statements for details on the wholly owned subsidiary. |
| (e) | During the period ended January 31, 2015, investments in issuers considered to be an affiliate of the Fund for purposes of Section 2(a)(3) of the Investment Company Act of 1940, as amended, were as follows: |
| | | | | | | | | | | | |
| Affiliate | | Net
Activity | | | Shares Held at
January 31, 2015 | | | Income | |
BlackRock Liquidity Funds, TempFund, Institutional Class | | | 12,920,516 | | | | 12,920,516 | | | $ | 1,497 | |
| (f) | Represents the current yield as of report date. |
| Ÿ | | As of January 31, 2015, financial futures contracts outstanding were as follows: |
| | | | | | | | | | | | | | | | | | | | |
Contracts
Long/
(Short) | | | Issue | | Exchange | | Expiration | | | | | Notional
Value | | | Unrealized
Appreciation
(Depreciation) | |
| | (8 | ) | | Hang Seng China Enterprises Index | | Hong Kong | | February 2015 | | | USD | | | | 607,200 | | | $ | 21,096 | |
| | (35 | ) | | OMX Stockholm 30 Index | | Stockholm | | February 2015 | | | USD | | | | 665,064 | | | | (45,258 | ) |
| | 49 | | | SGX CNX Nifty Index | | Singapore | | February 2015 | | | USD | | | | 870,142 | | | | (7,840 | ) |
| | (2 | ) | | Canadian Government Bonds (10 Year) | | Montreal | | March 2015 | | | USD | | | | 229,291 | | | | (2,001 | ) |
| | (3 | ) | | DAX Index Futures | | Eurex | | March 2015 | | | USD | | | | 906,397 | | | | (63,836 | ) |
| | 10 | | | DAX Midcap Index Futures | | Eurex | | March 2015 | | | USD | | | | 1,049,482 | | | | 4,045 | |
| | (10 | ) | | E-Mini Industrial Select Sector Futures
Index | | Chicago Mercantile | | March 2015 | | | USD | | | | 544,100 | | | | 4,273 | |
| | 11 | | | E-Mini Nasdaq 100 Futures | | Chicago Mercantile | | March 2015 | | | USD | | | | 911,075 | | | | (22,657 | ) |
| | (8 | ) | | E-Mini S&P 500 Futures | | Chicago Mercantile | | March 2015 | | | USD | | | | 795,400 | | | | 3,233 | |
| | (11 | ) | | Euro STOXX 600 Basic Resources Index | | Eurex | | March 2015 | | | USD | | | | 233,994 | | | | 639 | |
| | (12 | ) | | Euro STOXX 600 Industrial Goods &
Services Index | | Eurex | | March 2015 | | | USD | | | | 293,912 | | | | 2,243 | |
| | (44 | ) | | Euro STOXX 600 Oil & Gas Index | | Eurex | | March 2015 | | | USD | | | | 722,180 | | | | 10,609 | |
| | 53 | | | Euro STOXX Banks Index | | Eurex | | March 2015 | | | USD | | | | 386,888 | | | | (26,006 | ) |
| | 33 | | | Euro STOXX Utilities Index | | Eurex | | March 2015 | | | USD | | | | 544,058 | | | | 20,820 | |
| | (3 | ) | | Euro-Bobl | | Eurex | | March 2015 | | | USD | | | | 443,715 | | | | (5,020 | ) |
| | (3 | ) | | Euro-Bund | | Eurex | | March 2015 | | | USD | | | | 540,329 | | | | (22,207 | ) |
See Notes to Financial Statements.
| | | | | | |
| | | BLACKROCK FUNDS | | JANUARY 31, 2015 | | 49 |
| | | | |
| Consolidated Schedule of Investments (continued) | | | BlackRock Macro Themes Fund | |
| | As of January 31, 2015, financial futures contracts outstanding were as follows: (concluded) |
| | | | | | | | | | | | | | | | | | | | |
Contracts
Long/
(Short) | | | Issue | | Exchange | | Expiration | | | | | Notional
Value | | | Unrealized
Appreciation
(Depreciation) | |
| | (13 | ) | | FTSE 100 Index | | London | | March 2015 | | | USD | | | | 1,313,080 | | | $ | (70,924 | ) |
| | 1 | | | Gilt British | | NYSE Liffe | | March 2015 | | | USD | | | | 186,574 | | | | 10,271 | |
| | (22 | ) | | Mini MSCI Emerging Markets Index | | Intercontinental Exchange | | March 2015 | | | USD | | | | 1,046,650 | | | | (3,249 | ) |
| | (260 | ) | | Mini-Futures Euro STOXX Volatility Index | | Eurex | | March 2015 | | | USD | | | | 694,834 | | | | (51,174 | ) |
| | 8 | | | SGX Nikkei 225 Index | | Singapore | | March 2015 | | | USD | | | | 601,209 | | | | 2,071 | |
| | (12 | ) | | U.S. Treasury Notes (10 Year) | | Chicago Board of Trade | | March 2015 | | | USD | | | | 1,570,500 | | | | (52,701 | ) |
| | 11 | | | U.S. Treasury Notes (2 Year) | | Chicago Board of Trade | | March 2015 | | | USD | | | | 2,417,422 | | | | 9,097 | |
| | 7 | | | U.S. Treasury Notes (5 Year) | | Chicago Board of Trade | | March 2015 | | | USD | | | | 849,406 | | | | 19,406 | |
| | 1 | | | Ultra Treasury Bonds | | Chicago Board of Trade | | March 2015 | | | USD | | | | 178,937 | | | | 19,343 | |
| | 260 | | | Mini-Futures Euro STOXX Volatility Index | | Eurex | | June 2015 | | | USD | | | | 678,675 | | | | 31,824 | |
| | (7 | ) | | Three Month Sterling | | NYSE Liffe | | December 2016 | | | USD | | | | 1,303,697 | | | | (1,721 | ) |
| | Total | | | | | | | | | | | | | | | | | $ | (215,624 | ) |
| | | | | | | | | | | | | | | | | | | | |
| Ÿ | | As of January 31, 2015, forward foreign currency exchange contracts outstanding were as follows: |
| | | | | | | | | | | | | | | | | | | | | | |
Currency
Purchased | | | Currency
Sold | | | Counterparty | | Settlement
Date | | | Unrealized
Appreciation
(Depreciation) | |
| EUR | | | 155,000 | | | | USD | | | | 177,703 | | | Bank of America N.A. | | | 2/04/15 | | | $ | (2,547 | ) |
| USD | | | 4,692,420 | | | | EUR | | | | 3,930,000 | | | Citibank N.A. | | | 2/04/15 | | | | 251,358 | |
| USD | | | 34,204 | | | | EUR | | | | 29,000 | | | UBS AG | | | 2/04/15 | | | | 1,432 | |
| USD | | | 232,940 | | | | GBP | | | | 153,000 | | | JPMorgan Chase Bank N.A. | | | 2/04/15 | | | | 2,498 | |
| AUD | | | 59,000 | | | | USD | | | | 45,794 | | | Deutsche Bank AG | | | 2/12/15 | | | | 223 | |
| CAD | | | 36,000 | | | | USD | | | | 29,756 | | | Deutsche Bank AG | | | 2/12/15 | | | | (1,431 | ) |
| EUR | | | 52,000 | | | | USD | | | | 60,372 | | | JPMorgan Chase Bank N.A. | | | 2/12/15 | | | | (1,606 | ) |
| EUR | | | 54,000 | | | | USD | | | | 61,344 | | | UBS AG | | | 2/12/15 | | | | (318 | ) |
| INR | | | 1,600,000 | | | | USD | | | | 25,848 | | | Deutsche Bank AG | | | 2/12/15 | | | | (81 | ) |
| INR | | | 1,600,000 | | | | USD | | | | 25,967 | | | UBS AG | | | 2/12/15 | | | | (200 | ) |
| NOK | | | 230,000 | | | | USD | | | | 30,277 | | | Deutsche Bank AG | | | 2/12/15 | | | | (518 | ) |
| NOK | | | 229,000 | | | | USD | | | | 29,433 | | | Goldman Sachs International | | | 2/12/15 | | | | 197 | |
| NOK | | | 235,000 | | | | USD | | | | 30,159 | | | JPMorgan Chase Bank N.A. | | | 2/12/15 | | | | 1,112 | |
| USD | | | 32,581 | | | | AUD | | | | 40,000 | | | Deutsche Bank AG | | | 2/12/15 | | | | 1,465 | |
| USD | | | 36,842 | | | | AUD | | | | 45,000 | | | Deutsche Bank AG | | | 2/12/15 | | | | 1,837 | |
| USD | | | 32,474 | | | | AUD | | | | 41,000 | | | Goldman Sachs International | | | 2/12/15 | | | | 581 | |
| USD | | | 29,190 | | | | CAD | | | | 35,000 | | | Deutsche Bank AG | | | 2/12/15 | | | | 1,651 | |
| USD | | | 30,611 | | | | CAD | | | | 37,000 | | | Royal Bank of Canada | | | 2/12/15 | | | | 1,498 | |
| USD | | | 60,218 | | | | CHF | | | | 54,000 | | | UBS AG | | | 2/12/15 | | | | 1,369 | |
| USD | | | 28,946 | | | | EUR | | | | 25,000 | | | Deutsche Bank AG | | | 2/12/15 | | | | 693 | |
| USD | | | 30,155 | | | | EUR | | | | 27,000 | | | Goldman Sachs International | | | 2/12/15 | | | | (358 | ) |
| USD | | | 28,259 | | | | EUR | | | | 25,000 | | | JPMorgan Chase Bank N.A. | | | 2/12/15 | | | | (452 | ) |
| USD | | | 66,706 | | | | JPY | | | | 7,915,000 | | | Deutsche Bank AG | | | 2/12/15 | | | | (704 | ) |
| USD | | | 67,726 | | | | JPY | | | | 8,000,000 | | | Goldman Sachs International | | | 2/12/15 | | | | (408 | ) |
| USD | | | 60,276 | | | | NOK | | | | 459,000 | | | JPMorgan Chase Bank N.A. | | | 2/12/15 | | | | 886 | |
| USD | | | 29,736 | | | | TRY | | | | 70,000 | | | Deutsche Bank AG | | | 2/12/15 | | | | 1,198 | |
| USD | | | 29,706 | | | | TRY | | | | 70,000 | | | Goldman Sachs International | | | 2/12/15 | | | | 1,169 | |
| USD | | | 4,301,512 | | | | EUR | | | | 3,794,000 | | | Citibank N.A. | | | 3/04/15 | | | | (56,411 | ) |
| USD | | | 230,289 | | | | GBP | | | | 153,000 | | | UBS AG | | | 3/04/15 | | | | (1,729 | ) |
| INR | | | 19,266,000 | | | | USD | | | | 300,000 | | | JPMorgan Chase Bank N.A. | | | 3/05/15 | | | | 8,947 | |
| INR | | | 18,817,500 | | | | USD | | | | 300,000 | | | Morgan Stanley & Co. International PLC | | | 3/05/15 | | | | 1,755 | |
| CHF | | | 604,308 | | | | USD | | | | 708,201 | | | Credit Suisse International | | | 3/06/15 | | | | (48,879 | ) |
| CHF | | | 296,099 | | | | USD | | | | 340,187 | | | JPMorgan Chase Bank N.A. | | | 3/06/15 | | | | (17,132 | ) |
See Notes to Financial Statements.
| | | | | | |
| 50 | | BLACKROCK FUNDS | | JANUARY 31, 2015 | | |
| | | | |
| Consolidated Schedule of Investments (continued) | | | BlackRock Macro Themes Fund | |
As of January 31, 2015, forward foreign currency exchange contracts outstanding were as follows: (continued)
| | | | | | | | | | | | | | | | | | | | | | |
Currency Purchased | | | Currency
Sold | | | Counterparty | | Settlement
Date | | | Unrealized
Appreciation
(Depreciation) | |
| CNY | | | 16,657,650 | | | | USD | | | | 2,700,000 | | | HSBC Bank PLC | | | 3/06/15 | | | $ | (45,488 | ) |
| COP | | | 716,400,000 | | | | USD | | | | 300,000 | | | Morgan Stanley & Co. International PLC | | | 3/06/15 | | | | (7,403 | ) |
| DKK | | | 3,867,252 | | | | USD | | | | 593,241 | | | JPMorgan Chase Bank N.A. | | | 3/06/15 | | | | (5,330 | ) |
| EUR | | | 965,000 | | | | USD | | | | 1,200,174 | | | BNP Paribas S.A. | | | 3/06/15 | | | | (109,403 | ) |
| EUR | | | 1,200,000 | | | | USD | | | | 1,492,444 | | | JPMorgan Chase Bank N.A. | | | 3/06/15 | | | | (136,045 | ) |
| EUR | | | 480,000 | | | | USD | | | | 596,978 | | | JPMorgan Chase Bank N.A. | | | 3/06/15 | | | | (54,418 | ) |
| HUF | | | 304,148,700 | | | | USD | | | | 1,177,934 | | | Bank of America N.A. | | | 3/06/15 | | | | (73,174 | ) |
| HUF | | | 115,461,000 | | | | USD | | | | 450,000 | | | Bank of America N.A. | | | 3/06/15 | | | | (30,611 | ) |
| IDR | | | 7,479,000,000 | | | | USD | | | | 600,000 | | | JPMorgan Chase Bank N.A. | | | 3/06/15 | | | | (12,940 | ) |
| JPY | | | 69,840,840 | | | | USD | | | | 600,000 | | | JPMorgan Chase Bank N.A. | | | 3/06/15 | | | | (5,039 | ) |
| KRW | | | 659,850,000 | | | | USD | | | | 600,000 | | | Morgan Stanley & Co. International PLC | | | 3/06/15 | | | | 2,566 | |
| MXN | | | 17,571,402 | | | | USD | | | | 1,200,000 | | | Citibank N.A. | | | 3/06/15 | | | | (30,380 | ) |
| MXN | | | 8,901,194 | | | | USD | | | | 600,000 | | | Citibank N.A. | | | 3/06/15 | | | | (7,502 | ) |
| MYR | | | 4,810,725 | | | | USD | | | | 1,350,000 | | | Goldman Sachs International | | | 3/06/15 | | | | (27,830 | ) |
| NOK | | | 2,100,000 | | | | USD | | | | 298,393 | | | JPMorgan Chase Bank N.A. | | | 3/06/15 | | | | (26,842 | ) |
| NZD | | | 975,961 | | | | USD | | | | 750,000 | | | JPMorgan Chase Bank N.A. | | | 3/06/15 | | | | (42,300 | ) |
| NZD | | | 387,677 | | | | USD | | | | 300,000 | | | JPMorgan Chase Bank N.A. | | | 3/06/15 | | | | (18,883 | ) |
| PLN | | | 1,524,860 | | | | USD | | | | 450,000 | | | JPMorgan Chase Bank N.A. | | | 3/06/15 | | | | (38,844 | ) |
| PLN | | | 1,567,845 | | | | USD | | | | 450,000 | | | JPMorgan Chase Bank N.A. | | | 3/06/15 | | | | (27,253 | ) |
| SEK | | | 2,197,440 | | | | USD | | | | 283,521 | | | JPMorgan Chase Bank N.A. | | | 3/06/15 | | | | (17,863 | ) |
| THB | | | 49,650,000 | | | | USD | | | | 1,500,000 | | | Goldman Sachs International | | | 3/06/15 | | | | 14,362 | |
| USD | | | 600,000 | | | | AUD | | | | 729,263 | | | Citibank N.A. | | | 3/06/15 | | | | 33,504 | |
| USD | | | 450,000 | | | | AUD | | | | 540,845 | | | JPMorgan Chase Bank N.A. | | | 3/06/15 | | | | 29,868 | |
| USD | | | 450,000 | | | | BRL | | | | 1,239,030 | | | Morgan Stanley & Co. International PLC | | | 3/06/15 | | | | (7,434 | ) |
| USD | | | 600,000 | | | | CAD | | | | 753,872 | | | Morgan Stanley & Co. International PLC | | | 3/06/15 | | | | 7,007 | |
| USD | | | 1,492,444 | | | | CHF | | | | 1,443,680 | | | JPMorgan Chase Bank N.A. | | | 3/06/15 | | | | (82,665 | ) |
| USD | | | 600,000 | | | | CLP | | | | 368,910,000 | | | Bank of America N.A. | | | 3/06/15 | | | | 19,813 | |
| USD | | | 2,700,000 | | | | CNY | | | | 16,640,100 | | | Citibank N.A. | | | 3/06/15 | | | | 48,285 | |
| USD | | | 300,000 | | | | COP | | | | 713,775,000 | | | Goldman Sachs International | | | 3/06/15 | | | | 8,475 | |
| USD | | | 1,177,934 | | | | EUR | | | | 965,000 | | | Bank of America N.A. | | | 3/06/15 | | | | 87,162 | |
| USD | | | 708,201 | | | | EUR | | | | 600,000 | | | Credit Suisse International | | | 3/06/15 | | | | 30,001 | |
| USD | | | 340,187 | | | | EUR | | | | 300,000 | | | JPMorgan Chase Bank N.A. | | | 3/06/15 | | | | 1,087 | |
| USD | | | 593,241 | | | | EUR | | | | 520,000 | | | JPMorgan Chase Bank N.A. | | | 3/06/15 | | | | 5,468 | |
| USD | | | 1,450,000 | | | | EUR | | | | 1,288,133 | | | JPMorgan Chase Bank N.A. | | | 3/06/15 | | | | (6,019 | ) |
| USD | | | 1,800,000 | | | | EUR | | | | 1,448,358 | | | JPMorgan Chase Bank N.A. | | | 3/06/15 | | | | 162,874 | |
| USD | | | 1,500,000 | | | | GBP | | | | 967,462 | | | JPMorgan Chase Bank N.A. | | | 3/06/15 | | | | 43,137 | |
| USD | | | 1,200,174 | | | | HUF | | | | 297,138,747 | | | BNP Paribas S.A. | | | 3/06/15 | | | | 120,877 | |
| USD | | | 450,000 | | | | HUF | | | | 112,558,500 | | | Goldman Sachs International | | | 3/06/15 | | | | 41,154 | |
| USD | | | 300,000 | | | | IDR | | | | 3,820,500,000 | | | JPMorgan Chase Bank N.A. | | | 3/06/15 | | | | 112 | |
| USD | | | 300,000 | | | | IDR | | | | 3,815,700,000 | | | Morgan Stanley & Co. International PLC | | | 3/06/15 | | | | 489 | |
| USD | | | 150,000 | | | | ILS | | | | 595,274 | | | JPMorgan Chase Bank N.A. | | | 3/06/15 | | | | (1,414 | ) |
| USD | | | 450,000 | | | | ILS | | | | 1,761,672 | | | JPMorgan Chase Bank N.A. | | | 3/06/15 | | | | 1,899 | |
| USD | | | 300,000 | | | | JPY | | | | 35,030,610 | | | Deutsche Bank AG | | | 3/06/15 | | | | 1,581 | |
| USD | | | 300,000 | | | | JPY | | | | 34,959,951 | | | Deutsche Bank AG | | | 3/06/15 | | | | 2,183 | |
| USD | | | 1,200,000 | | | | KRW | | | | 1,344,000,000 | | | HSBC Bank PLC | | | 3/06/15 | | | | (27,323 | ) |
| USD | | | 450,000 | | | | MXN | | | | 6,670,688 | | | JPMorgan Chase Bank N.A. | | | 3/06/15 | | | | 5,973 | |
| USD | | | 900,000 | | | | MYR | | | | 3,133,800 | | | HSBC Bank PLC | | | 3/06/15 | | | | 38,713 | |
| USD | | | 450,000 | | | | MYR | | | | 1,584,675 | | | JPMorgan Chase Bank N.A. | | | 3/06/15 | | | | 14,471 | |
See Notes to Financial Statements.
| | | | | | |
| | | BLACKROCK FUNDS | | JANUARY 31, 2015 | | 51 |
| | | | |
| Consolidated Schedule of Investments (continued) | | | BlackRock Macro Themes Fund | |
As of January 31, 2015, forward foreign currency exchange contracts outstanding were as follows: (concluded)
| | | | | | | | | | | | | | | | | | | | | | |
Currency Purchased | | | Currency Sold | | | Counterparty | | Settlement
Date | | | Unrealized
Appreciation
(Depreciation) | |
| USD | | | 283,521 | | | | NOK | | | | 2,100,000 | | | JPMorgan Chase Bank N.A. | | | 3/06/15 | | | $ | 11,970 | |
| USD | | | 900,000 | | | | PLN | | | | 3,363,678 | | | JPMorgan Chase Bank N.A. | | | 3/06/15 | | | | (6,967 | ) |
| USD | | | 298,393 | | | | SEK | | | | 2,230,731 | | | JPMorgan Chase Bank N.A. | | | 3/06/15 | | | | 28,711 | |
| USD | | | 596,978 | | | | SEK | | | | 4,457,658 | | | JPMorgan Chase Bank N.A. | | | 3/06/15 | | | | 58,074 | |
| USD | | | 900,000 | | | | SEK | | | | 6,785,750 | | | JPMorgan Chase Bank N.A. | | | 3/06/15 | | | | 79,644 | |
| USD | | | 900,000 | | | | SGD | | | | 1,183,901 | | | Goldman Sachs International | | | 3/06/15 | | | | 25,511 | |
| USD | | | 1,500,000 | | | | THB | | | | 49,719,900 | | | Goldman Sachs International | | | 3/06/15 | | | | (16,494 | ) |
| USD | | | 450,000 | | | | TRY | | | | 1,024,633 | | | JPMorgan Chase Bank N.A. | | | 3/06/15 | | | | 34,182 | |
| USD | | | 1,500,000 | | | | TWD | | | | 46,635,000 | | | HSBC Bank PLC | | | 3/06/15 | | | | 20,099 | |
| USD | | | 450,000 | | | | TWD | | | | 14,274,000 | | | JPMorgan Chase Bank N.A. | | | 3/06/15 | | | | (2,967 | ) |
| USD | | | 300,000 | | | | TWD | | | | 9,403,800 | | | JPMorgan Chase Bank N.A. | | | 3/06/15 | | | | 1,583 | |
| USD | | | 450,000 | | | | ZAR | | | | 5,329,572 | | | Citibank N.A. | | | 3/06/15 | | | | (5,222 | ) |
| USD | | | 450,000 | | | | ZAR | | | | 5,326,237 | | | Citibank N.A. | | | 3/06/15 | | | | (4,937 | ) |
| USD | | | 269,029 | | | | CAD | | | | 334,000 | | | Standard Chartered Bank | | | 4/21/15 | | | | 6,451 | |
| Total | | | | | | | | | | | | | | | | | | | | $ | 255,391 | |
| | | | | | | | | | | | | | | | | | | | | | |
| Ÿ | | As of January 31, 2015, exchange-traded options purchased were as follows: |
| | | | | | | | | | | | | | | | | | | | | | | | |
| Description | | Put/
Call | | | Strike Price | | | Expiration
Date | | | Contracts | | | Value | |
IBEX 35 Mini-Index Future | | | Call | | | | EUR | | | | 11,200.00 | | | | 3/20/15 | | | | 68 | | | $ | 6,224 | |
EURO STOXX 50 Index | | | Call | | | | EUR | | | | 4,000.00 | | | | 12/15/17 | | | | 11 | | | | 21,106 | |
S&P 500 Index | | | Put | | | | USD | | | | 2,020.00 | | | | 2/20/15 | | | | 7 | | | | 32,760 | |
S&P/ASX 200 Index | | | Put | | | | AUD | | | | 5,350.00 | | | | 3/19/15 | | | | 34 | | | | 12,864 | |
Total | | | | | | | | | | | | | | | | | | | | | | $ | 72,954 | |
| | | | | | | | | | | | | | | | | | | | | | | | |
| Ÿ | | As of January 31, 2015, OTC options purchased were as follows: |
| | | | | | | | | | | | | | | | | | | | | | | | | | | | | | | | | | |
| Description | | Counterparty | | Put/
Call | | | Strike Price | | | Expiration
Date | | | Contracts | | | Notional
Amount
(000) | | | Value | |
USD Currency | | Barclays Bank PLC | | | Call | | | | CHF | | | | 0.94 | | | | 02/13/15 | | | | — | | | | USD | | | | 1,800 | | | $ | 11,568 | |
EUR Currency | | JPMorgan Chase Bank N.A. | | | Call | | | | USD | | | | 1.21 | | | | 03/13/15 | | | | — | | | | EUR | | | | 2,500 | | | | 1,442 | |
KOSPI 200 Index | | Société Générale | | | Call | | | | KRW | | | | 255.00 | | | | 04/09/15 | | | | 13 | | | | | | | | — | | | | 24,072 | |
USD Currency | | Barclays Bank PLC | | | Put | | | | CHF | | | | 0.82 | | | | 02/13/15 | | | | — | | | | USD | | | | 1,800 | | | | 80 | |
iPath S&P 500 VIX ST Futures ETN | | Citibank N.A. | | | Put | | | | USD | | | | 26.00 | | | | 03/20/15 | | | | 10,900 | | | | | | | | — | | | | 3,107 | |
USD Currency | | Morgan Stanley & Co. International PLC | | | Put | | | | CNY | | | | 6.13 | | | | 06/12/15 | | | | — | | | | USD | | | | 1,500 | | | | 1,241 | |
iPath S&P 500 VIX ST Futures ETN | | Citibank N.A. | | | Put | | | | USD | | | | 30.00 | | | | 06/19/15 | | | | 12,000 | | | | | | | | — | | | | 37,500 | |
USD Currency | | HSBC Bank PLC | | | Put | | | | CNH | | | | 6.21 | | | | 07/10/15 | | | | — | | | | USD | | | | 1,500 | | | | 3,185 | |
Total | | | | | | | | | | | | | | | | | | | | | | | | | | | | | | | | $ | 82,195 | |
| | | | | | | | | | | | | | | | | | | | | | | | | | | | | | | | | | |
| Ÿ | | As of January 31, 2015, exchange-traded options written were as follows: |
| | | | | | | | | | | | | | | | | | | | | | | | |
| Description | | Put/
Call | | | Strike Price | | | Expiration
Date | | | Contracts | | | Value | |
IBEX 35 Mini-Index Future | | | Call | | | | EUR | | | | 12,000.00 | | | | 3/20/15 | | | | 68 | | | $ | (538 | ) |
S&P 500 Index | | | Put | | | | USD | | | | 1,900.00 | | | | 2/20/15 | | | | 7 | | | | (8,155 | ) |
S&P/ASX 200 Index | | | Put | | | | AUD | | | | 5,150.00 | | | | 3/19/15 | | | | 34 | | | | (6,194 | ) |
IBEX 35 Mini-Index Future | | | Put | | | | EUR | | | | 9,500.00 | | | | 3/20/15 | | | | 68 | | | | (8,298 | ) |
Total | | | | | | | | | | | | | | | | | | | | | | $ | (23,185 | ) |
| | | | | | | | | | | | | | | | | | | | | | | | |
See Notes to Financial Statements.
| | | | | | |
| 52 | | BLACKROCK FUNDS | | JANUARY 31, 2015 | | |
| | | | |
| Consolidated Schedule of Investments (continued) | | | BlackRock Macro Themes Fund | |
| Ÿ | | As of January 31, 2015, OTC options written outstanding were as follows: |
| | | | | | | | | | | | | | | | | | | | | | | | | | | | | | | | | | |
| Description | | Counterparty | | Put/
Call | | | Strike Price | | | Expiration
Date | | | Contracts | | | Notional
Amount (000) | | | Value | |
USD Currency | | Barclays Bank PLC | | | Call | | | | CHF | | | | 0.90 | | | | 02/13/15 | | | | — | | | | USD | | | | 1,800 | | | $ | (48,865 | ) |
EUR Currency | | JPMorgan Chase Bank N.A. | | | Call | | | | USD | | | | 1.24 | | | | 03/13/15 | | | | — | | | | EUR | | | | 2,500 | | | | (253 | ) |
KOSPI 200 Index | | Société Générale | | | Call | | | | KRW | | | | 270.00 | | | | 04/09/15 | | | | 13 | | | | | | | | — | | | | (4,042 | ) |
USD Currency | | Barclays Bank PLC | | | Put | | | | CHF | | | | 0.85 | | | | 02/13/15 | | | | — | | | | USD | | | | 1,800 | | | | (745 | ) |
iPath S&P 500 VIX ST Futures ETN | | Citibank N.A. | | | Put | | | | USD | | | | 22.00 | | | | 03/20/15 | | | | 10,900 | | | | | | | | — | | | | (654 | ) |
iPath S&P 500 VIX ST Futures ETN | | Citibank N.A. | | | Put | | | | USD | | | | 25.00 | | | | 06/19/15 | | | | 12,000 | | | | | | | | — | | | | (13,980 | ) |
Total | | | | | | | | | | | | | | | | | | | | | | | | | | | | | | | | $ | (68,539 | ) |
| | | | | | | | | | | | | | | | | | | | | | | | | | | | | | | | | | |
| Ÿ | | As of January 31, 2015, OTC interest rate swaps outstanding were as follows: |
| | | | | | | | | | | | | | | | | | | | | | | | | | | | |
Fixed Rate | | Floating Rate | | Counterparty | | Expiration
Date | | | Notional
Amount (000) | | | Value | | | Premiums
Paid
(Received) | | | Unrealized
Appreciation | |
4.06%1 | | 3-month New
Zealand Bank Bill
Rate | | Citibank N.A. | | | 12/08/19 | | | | NZD | | | | 5,000 | | | $ | 78,878 | | | | — | | | $ | 78,878 | |
| | 1 | | Fund pays the floating rate and receives the fixed rate. |
| Ÿ | | As of January 31, 2015, OTC total return swaps outstanding were as follows: |
| | | | | | | | | | | | | | | | | | | | | | | | | | | | |
| Reference Entity | | Floating Rate | | Counterparty | | Expiration
Date | | | Contract
Amount/
Notional
Amount
(000) | | | Value | | | Premiums
Paid
(Received) | | | Unrealized
Appreciation
(Depreciation) | |
MLBX WUDC Total Return Performance Index | | USD 299,578 | | Bank of America N.A. | | | 11/18/15 | | | | USD | | | | 303 | | | $ | 3,928 | | | | — | | | $ | 3,928 | |
MLBX WUDC Total Return Performance Index | | USD 304,144 | | Bank of America N.A. | | | 11/18/15 | | | | USD | | | | 303 | | | | (638 | ) | | | — | | | | (638 | ) |
MSCI Brazil Net Returns Index | | 3-month LIBOR
minus 0.35% | | Bank of America N.A. | | | 12/18/15 | | | | USD | | | | 289 | | | | 9,731 | | | | — | | | | 9,731 | |
MSCI Brazil Net Returns Index | | 3-month LIBOR
minus 0.35% | | Bank of America N.A. | | | 1/07/16 | | | | USD | | | | 145 | | | | 6,243 | | | | — | | | | 6,243 | |
U.S. Treasury Notes (10 Year) Futures March 2015 | | USD 65,164,700 | | Bank of America N.A. | | | 2/25/15 | | | | | | | | 5 | 1 | | | 2,728 | | | | — | | | | 2,728 | |
U.S. Treasury Notes (5 Year) Futures March 2015 | | USD 165,962,580 | | Bank of America N.A. | | | 2/25/15 | | | | | | | | 14 | 1 | | | (39,187 | ) | | | — | | | | (39,187 | ) |
CITI DYNAVO2X USD HP Performance Index | | USD 750,000 | | Citibank N.A. | | | 6/19/15 | | | | USD | | | | 750 | | | | (7,284 | ) | | | — | | | | (7,284 | ) |
CITI DYNAVOL EM Series II Performance Index | | USD 600,000 | | Citibank N.A. | | | 11/13/15 | | | | USD | | | | 600 | | | | (1,214 | ) | | | — | | | | (1,214 | ) |
Emerging Lifestyle Trends Index | | 6-month LIBOR
plus 0.12% | | Citibank N.A. | | | 9/04/15 | | | | USD | | | | 1,451 | | | | (27,410 | ) | | | — | | | | (27,410 | ) |
Dow Jones US Select Home Builders Index | | 3-month LIBOR
plus 0.45% | | JPMorgan Chase Bank N.A. | | | 3/30/15 | | | | USD | | | | 446 | | | | (6,795 | ) | | | — | | | | (6,795 | ) |
JP European Basket Index | | 3-month LIBOR
plus 0.35% | | JPMorgan Chase Bank N.A. | | | 8/19/15 | | | | EUR | | | | 901 | | | | 81,014 | | | | — | | | | 81,014 | |
JP European Basket Index | | 3-month LIBOR
plus 0.35% | | JPMorgan Chase Bank N.A. | | | 8/19/15 | | | | EUR | | | | 378 | | | | 38,507 | | | | — | | | | 38,507 | |
JPEBEUOB Performance Shell Index | | 3-month LIBOR
plus 0.39% | | JPMorgan Chase Bank N.A. | | | 1/14/16 | | | | USD | | | | 723 | | | | — | | | | — | | | | — | |
JPEBRUUK Performance Shell Index | | 3-month LIBOR
plus 0.30% | | JPMorgan Chase Bank N.A. | | | 3/16/15 | | | | GBP | | | | 737 | | | | 11,626 | | | | — | | | | 11,626 | |
See Notes to Financial Statements.
| | | | | | |
| | | BLACKROCK FUNDS | | JANUARY 31, 2015 | | 53 |
| | | | |
| Consolidated Schedule of Investments (continued) | | | BlackRock Macro Themes Fund | |
As of January 31, 2015, OTC total return swaps outstanding were as follows: (concluded)
| | | | | | | | | | | | | | | | | | | | | | | | | | | | |
| Reference Entity | | Floating Rate | | Counterparty | | Expiration
Date | | | Contract
Amount/
Notional
Amount
(000) | | | Value | | | Premiums
Paid
(Received) | | | Unrealized
Appreciation
(Depreciation) | |
JPEBRUUK Performance Shell Index | | 3-month LIBOR
plus 0.30% | | JPMorgan Chase Bank N.A. | | | 3/16/15 | | | | GBP | | | | 449 | | | | (1,404 | ) | | | — | | | $ | (1,404 | ) |
NYSE ARCA Gold Miners Index Net Total Return Index | | 3-month LIBOR | | JPMorgan Chase Bank N.A. | | | 11/18/15 | | | | USD | | | | 351 | | | $ | 45,194 | | | | — | | | $ | 45,194 | |
VOLNETPREMIUMGLOB4STRAT Performance Index | | USD 756,466 | | Morgan Stanley & Co.
International PLC | | | 6/19/15 | | | | USD | | | | 729 | | | | (22,712 | ) | | | — | | | | (22,712 | ) |
Total | | | | | | | | | | | | | | | | | | $ | 92,327 | | | | — | | | $ | 92,327 | |
| | | | | | | | | | | | | | | | | | | | |
| Ÿ | | For Fund compliance purposes, the Fund’s industry classifications refer to any one or more of the industry sub-classifications used by one or more widely recognized market indexes or ratings group indexes, and/or as defined by the investment advisor. These definitions may not apply for purposes of this report, which may combine such industry sub-classifications for reporting ease. |
| Ÿ | | Fair Value Measurements — Various inputs are used in determining the fair value of investments and derivative financial instruments. These inputs to valuation techniques are categorized into a disclosure hierarchy consisting of three broad levels for financial statement purposes. The hierarchy gives the highest priority to unadjusted quoted prices in active markets for identical assets or liabilities (Level 1 measurements) and the lowest priority to unobservable inputs (Level 3 measurements). Accordingly, the degree of judgment exercised in determining fair value is greatest for instruments categorized in Level 3. The inputs used to measure fair value may fall into different levels of the fair value hierarchy. In such cases, for disclosure purposes, the fair value hierarchy classification is determined based on the lowest level input that is significant to the fair value measurement in its entirety. The categorization of a value determined for investments and derivative financial instruments is based on the pricing transparency of the investment and derivative financial instrument and is not necessarily an indication of the risks associated with investing in those securities. The three levels of the fair value hierarchy are as follows: |
| | Ÿ | | Level 1 — unadjusted quoted prices in active markets/exchanges for identical assets or liabilities that the Fund has the ability to access |
| | Ÿ | | Level 2 — other observable inputs (including, but not limited to, quoted prices for similar assets or liabilities in markets that are active, quoted prices for identical or similar assets or liabilities in markets that are not active, inputs other than quoted prices that are observable for the assets or liabilities (such as interest rates, yield curves, volatilities, prepayment speeds, loss severities, credit risks and default rates) or other market–corroborated inputs) |
| | Ÿ | | Level 3 — unobservable inputs based on the best information available in the circumstances, to the extent observable inputs are not available (including the Fund’s own assumptions used in determining the fair value of investments and derivative financial instruments) |
Changes in valuation techniques may result in transfers into or out of an assigned level within the disclosure hierarchy. In accordance with the Fund’s policy, transfers between different levels of the fair value disclosure hierarchy are deemed to have occurred as of the beginning of the reporting period. For information about the Fund’s policy regarding valuation of investments and derivative financial instruments, refer to Note 2 of the Notes to Financial Statements.
As of January 31, 2015, the following tables summarize the Fund’s investments and derivative financial instruments categorized in the disclosure hierarchy:
| | | | | | | | | | | | | | |
| | | Level 1 | | | Level 2 | | | Level 3 | | Total | |
Assets: | | | | | | | | | | | | | | |
Investments: | | | | | | | | | | | | | | |
Long-Term Investments: | | | | | | | | | | | | | | |
Corporate Bonds. | | | — | | | $ | 7,557,958 | | | — | | $ | 7,557,958 | |
Foreign Agency Obligations | | | — | | | | 367,373 | | | — | | | 367,373 | |
Foreign Government Obligations | | | — | | | | 4,550,658 | | | — | | | 4,550,658 | |
Investment Companies. | | $ | 2,340,447 | | | | — | | | — | | | 2,340,447 | |
U.S. Treasury Obligations | | | — | | | | 1,331,782 | | | — | | | 1,331,782 | |
Short-Term Securities: | | | | | | | | | | | | | | |
Money Market Funds | | | 12,920,516 | | | | — | | | — | | | 12,920,516 | |
Options Purchased: | | | | | | | | | | | | | | |
Equity Contracts | | | 72,954 | | | | 64,679 | | | — | | | 137,633 | |
Foreign Currency Exchange Contracts | | | — | | | | 17,516 | | | — | | | 17,516 | |
Total | | $ | 15,333,917 | | | $ | 13,889,966 | | | — | | $ | 29,223,883 | |
| | | | |
See Notes to Financial Statements.
| | | | | | |
| 54 | | BLACKROCK FUNDS | | JANUARY 31, 2015 | | |
| | | | |
| Consolidated Schedule of Investments (concluded) | | | BlackRock Macro Themes Fund | |
| | | | | | | | | | | | | | | | | | | | |
| | | Level 1 | | Level 2 | | Level 3 | | Total |
Derivative Financial Instruments1 | | | | | | | | | | | | | | | | | | | | |
Assets: | | | | | | | | | | | | | | | | | | | | |
Equity contracts | | | $ | 100,853 | | | | $ | 196,243 | | | | | — | | | | $ | 297,096 | |
Foreign currency exchange contracts | | | | — | | | | | 1,267,155 | | | | | — | | | | | 1,267,155 | |
Interest rate contracts | | | | 58,117 | | | | | 81,606 | | | | | — | | | | | 139,723 | |
Liabilities: | | | | | | | | | | | | | | | | | | | | |
Equity contracts | | | | (314,129 | ) | | | | (86,133 | ) | | | | — | | | | | (400,262 | ) |
Foreign currency exchange contracts | | | | — | | | | | (1,061,627 | ) | | | | — | | | | | (1,061,627 | ) |
Interest rate contracts | | | | (83,650 | ) | | | | (39,187 | ) | | | | — | | | | | (122,837 | ) |
| | | | | |
Total | | | $ | (238,809 | ) | | | $ | 358,057 | | | | | — | | | | $ | 119,248 | |
| | | | | |
1 Derivative financial instruments are swaps, financial futures contracts, forward foreign currency exchange contracts and options written. Swaps, financial futures contracts and forward foreign currency exchange contracts are valued at the unrealized appreciation/depreciation on the instrument and options written are shown at value. | |
|
| The Fund may hold assets in which the fair value approximates the carrying amount for financial statement purposes. As of January 31, 2015, such assets are categorized within the disclosure hierarchy as follows: | |
| | | | | | | | | | | | | | | | | | | | |
| | | Level 1 | | Level 2 | | Level 3 | | Total |
Assets: | | | | | | | | | | | | | | | | | | | | |
Cash | | | $ | 8,159 | | | | | — | | | | | — | | | | $ | 8,159 | |
Foreign currency at value | | | | 129,960 | | | | | — | | | | | — | | | | | 129,960 | |
Cash pledged for financial futures contracts | | | | 510,000 | | | | | — | | | | | — | | | | | 510,000 | |
| | | | | |
Total | | | $ | 648,119 | | | | | — | | | | | — | | | | $ | 648,119 | |
| | | | | |
See Notes to Financial Statements.
| | | | | | |
| | | BLACKROCK FUNDS | | JANUARY 31, 2015 | | 55 |
| | |
Statements of Assets and Liabilities | | |
| | | | | | | | | | | | |
| January 31, 2015 (Unaudited) | | BlackRock
Commodity
Strategies Fund1 | | | BlackRock
Global Long/Short
Credit Fund | | | BlackRock
Macro Themes
Fund1 | |
| | | | | | | | | | | | |
| Assets | | | | | | | | | | | | |
Investments at value — unaffiliated2 | | $ | 380,406,762 | | | $ | 7,383,073,024 | | | $ | 16,303,367 | |
Investments at value — affiliated3 | | | 9,144,893 | | | | — | | | | 12,920,516 | |
Cash | | | 13,894,719 | | | | — | | | | 8,159 | |
Foreign currency at value4 | | | — | | | | 126,256 | | | | 129,960 | |
Cash pledged as collateral for OTC derivatives | | | — | | | | 14,970,000 | | | | — | |
Cash pledged as collateral for borrowed bond agreements | | | — | | | | 651,000 | | | | — | |
Cash pledged for centrally cleared swaps | | | — | | | | 18,295,000 | | | | — | |
Cash pledged for financial futures contracts | | | — | | | | 22,585,000 | | | | 510,000 | |
Variation margin receivable on centrally cleared swaps | | | — | | | | 869,390 | | | | — | |
Variation margin receivable on financial futures contracts | | | — | | | | 1,076,294 | | | | 71,103 | |
Investments sold receivable | | | 1,461,378 | | | | 294,357,953 | | | | 61,191 | |
Swap premiums paid | | | — | | | | 26,896,861 | | | | — | |
Unrealized appreciation on forward foreign currency exchange contracts | | | — | | | | 244,261,631 | | | | 1,267,155 | |
Principal paydowns receivable | | | — | | | | 903 | | | | — | |
Unrealized appreciation on OTC swaps | | | — | | | | 10,177,054 | | | | 277,849 | |
Capital shares sold receivable | | | 4,497,789 | | | | 17,751,103 | | | | — | |
Dividends receivable — unaffiliated | | | 296,961 | | | | 516,712 | | | | 668 | |
Interest receivable | | | 10,857 | | | | 59,770,704 | | | | 187,623 | |
Dividends receivable — affiliated | | | 657 | | | | 1,475 | | | | — | |
Securities lending income receivable — affiliated | | | 222 | | | | — | | | | — | |
Deferred offering costs | | | — | | | | — | | | | 159,205 | |
Prepaid expenses | | | 30,017 | | | | 572,892 | | | | 1,281 | |
| | | | |
Total assets | | | 409,744,255 | | | | 8,095,953,252 | | | | 31,898,077 | |
| | | | |
| | | | | | | | | | | | |
| Liabilities | | | | | | | | | | | | |
Bank overdraft | | | — | | | | 16,804,488 | | | | — | |
Foreign bank overdraft5 | | | — | | | | 2,493,814 | | | | — | |
Options written at value6 | | | — | | | | 166,000 | | | | 91,724 | |
Investments sold short — unaffiliated7 | | | — | | | | 36,114,204 | | | | — | |
Investments sold short — affiliated8 | | | — | | | | 17,712,091 | | | | — | |
Borrowed bonds at value9 | | | — | | | | 1,246,359,000 | | | | — | |
Reverse repurchase agreements | | | — | | | | 317,601,110 | | | | — | |
Cash received as collateral for OTC derivatives | | | — | | | | 4,248,000 | | | | — | |
Variation margin payable on financial futures contracts | | | — | | | | 5,362,143 | | | | 65,746 | |
Investments purchased payable | | | 4,826,941 | | | | 368,897,055 | | | | 578,811 | |
Swap premiums received | | | — | | | | 23,772,134 | | | | — | |
Unrealized depreciation on forward foreign currency exchange contracts | | | — | | | | 2,394,666 | | | | 1,011,764 | |
Unrealized depreciation on OTC swaps | | | — | | | | 28,910,196 | | | | 106,644 | |
Interest expense payable | | | — | | | | 9,964,913 | | | | — | |
Dividends on short sales payable | | | — | | | | 54,563 | | | | — | |
Capital shares redeemed payable | | | 162,254 | | | | 37,240,204 | | | | — | |
Swaps payable | | | — | | | | 192,734 | | | | — | |
Investment advisory fees payable | | | 371,761 | | | | 4,554,650 | | | | 194 | |
Offering costs payable | | | — | | | | — | | | | 135,037 | |
Service and distribution fees payable | | | 8,585 | | | | 586,826 | | | | 25 | |
Other affiliates payable | | | 21,114 | | | | 271,448 | | | | 1,108 | |
Officer’s and Trustees’ fees payable | | | 2,575 | | | | 11,735 | | | | 554 | |
Other accrued expenses payable | | | 130,505 | | | | 1,302,012 | | | | 14,769 | |
| | | | |
Total liabilities | | | 5,523,735 | | | | 2,125,013,986 | | | | 2,006,376 | |
| | | | |
Net Assets | | $ | 404,220,520 | | | $ | 5,970,939,266 | | | $ | 29,891,701 | |
| | | | |
| | | | | | | | | | | | |
| Net Assets Consist of | | | | | | | | | | | | |
Paid-in capital | | $ | 519,860,042 | | | $ | 6,152,954,367 | | | $ | 30,000,000 | |
Accumulated (distributions in excess of) net investment income (loss) | | | (1,400,527 | ) | | | (159,680,259 | ) | | | (22,874 | ) |
Accumulated net realized gain (loss) | | | (82,888,925 | ) | | | 112,907,187 | | | | 413,565 | |
Net unrealized appreciation/depreciation | | | (31,350,070 | ) | | | (135,242,029 | ) | | | (498,990 | ) |
| | | | |
Net Assets | | $ | 404,220,520 | | | $ | 5,970,939,266 | | | $ | 29,891,701 | |
| | | | |
1 Consolidated Statement of Assets and Liabilities. | | | | | | | | | | | | |
2 Investments at cost — unaffiliated | | $ | 411,750,104 | | | $ | 7,654,845,222 | | | $ | 17,029,056 | |
3 Investments at cost — affiliated | | $ | 9,144,893 | | | | — | | | $ | 12,920,516 | |
4 Foreign currency at cost | | | — | | | $ | 128,321 | | | $ | 130,279 | |
5 Foreign bank overdraft at cost | | | — | | | $ | 2,498,080 | | | | — | |
6 Premiums received | | | — | | | $ | 302,542 | | | $ | 128,727 | |
7 Proceeds received from investments sold short — unaffiliated | | | — | | | $ | 37,432,835 | | | | — | |
8 Proceeds received from investments sold short — affiliated | | | — | | | $ | 17,525,622 | | | | — | |
9 Proceeds received from borrowed bonds | | | — | | | $ | 1,207,395,297 | | | | — | |
See Notes to Financial Statements.
| | | | | | |
| 56 | | BLACKROCK FUNDS | | JANUARY 31, 2015 | | |
| | |
Statements of Assets and Liabilities (concluded) | | |
| | | | | | | | | | | | |
| January 31, 2015 (Unaudited) | | BlackRock
Commodity
Strategies Fund1 | | | BlackRock Global Long/Short Credit Fund | | | BlackRock
Macro Themes
Fund1 | |
| | | | | | | | | | | | |
| Net Asset Value | | | | | | | | | | | | |
Institutional | | | | | | | | | | | | |
Net assets | | $ | 386,093,941 | | | $ | 4,457,225,530 | | | $ | 29,841,892 | |
| | | | |
Shares outstanding2 | | | 49,202,494 | | | | 427,463,505 | | | | 2,995,000 | |
| | | | |
Net asset value | | $ | 7.85 | | | $ | 10.43 | | | $ | 9.96 | |
| | | | |
| | | | | | | | | | | | |
Investor A | | | | | | | | | | | | |
Net assets | | $ | 11,661,117 | | | $ | 1,144,175,070 | | | $ | 24,908 | |
| | | | |
Shares outstanding2 | | | 1,494,546 | | | | 109,887,512 | | | | 2,500 | |
| | | | |
Net asset value | | $ | 7.80 | | | $ | 10.41 | | | $ | 9.96 | |
| | | | |
| | | | | | | | | | | | |
Investor C | | | | | | | | | | | | |
Net assets | | $ | 6,465,462 | | | $ | 369,538,666 | | | $ | 24,901 | |
| | | | |
Shares outstanding2 | | | 849,374 | | | | 35,704,015 | | | | 2,500 | |
| | | | |
Net asset value | | $ | 7.61 | | | $ | 10.35 | | | $ | 9.96 | |
| | | | |
| | 1 | | Consolidated Statement of Assets and Liabilities. |
| | 2 | | Unlimited number of shares authorized, $0.001 par value. |
See Notes to Financial Statements.
| | | | | | |
| | | BLACKROCK FUNDS | | JANUARY 31, 2015 | | 57 |
| | | | | | | | | | | | |
| Six Months Ended January 31, 2015 (Unaudited) | | BlackRock
Commodity
Strategies Fund1 | | | BlackRock
Global Long/Short
Credit Fund | | | BlackRock
Macro Themes
Fund1,2 | |
| | | | | | | | | | | | |
| Investment Income | | | | | | | | | |
Interest | | $ | 119,814 | | | $ | 132,883,068 | | | $ | 72,606 | |
Dividends — unaffiliated | | | 2,256,712 | | | | — | | | | — | |
Dividends — affiliated | | | 6,772 | | | | 93,613 | | | | 1,497 | |
Securities lending — affiliated — net | | | 2,822 | | | | — | | | | — | |
Foreign taxes withheld | | | (97,550 | ) | | | — | | | | — | |
| | | | |
Total income | | | 2,288,570 | | | | 132,976,681 | | | | 74,103 | |
| | | | |
| | | | | | | | | | | | |
| Expenses | | | | | | | | | | | | |
Investment advisory | | | 2,437,582 | | | | 29,091,688 | | | | 40,322 | |
Administration | | | 157,552 | | | | 1,896,192 | | | | 4,345 | |
Service and distribution — class specific | | | 62,118 | | | | 3,588,601 | | | | 50 | |
Administration — class specific | | | 51,300 | | | | 378,059 | | | | 1,059 | |
Professional | | | 58,078 | | | | 69,285 | | | | 14,207 | |
Transfer agent — class specific | | | 49,761 | | | | 2,410,354 | | | | 93 | |
Registration | | | 24,354 | | | | 396,045 | | | | 912 | |
Custodian | | | 13,334 | | | | 218,183 | | | | 3,253 | |
Printing | | | 17,064 | | | | 49,926 | | | | 1,416 | |
Officer and Trustees | | | 7,518 | | | | 92,365 | | | | 788 | |
Organization and offering | | | — | | | | — | | | | 84,937 | |
Miscellaneous | | | 16,124 | | | | 107,699 | | | | 2,581 | |
Recoupment of past waived fees — class specific | | | — | | | | 14,806 | | | | — | |
| | | | |
Total expenses excluding interest and dividend expense | | | 2,894,785 | | | | 38,313,203 | | | | 153,963 | |
Interest expense | | | — | | | | 17,429,944 | | | | — | |
Dividend expense — unaffiliated | | | — | | | | 139,084 | | | | — | |
Dividend expense — affiliated | | | — | | | | 141,072 | | | | — | |
| | | | |
Total expenses | | | 2,894,785 | | | | 56,023,303 | | | | 153,963 | |
Less fees waived by Manager | | | (92,772 | ) | | | (202,929 | ) | | | (39,525 | ) |
Less administration fees waived | | | — | | | | — | | | | (1,400 | ) |
Less administration fees waived — class specific | | | (3,045 | ) | | | (58 | ) | | | (983 | ) |
Less transfer agent fees waived — class specific | | | (712 | ) | | | — | | | | (3 | ) |
Less transfer agent fees reimbursed — class specific | | | (26,967 | ) | | | — | | | | (77 | ) |
Less expenses reimbursed by Manager | | | — | | | | — | | | | (55,000 | ) |
| | | | |
Total expenses after fees waived and/or reimbursed | | | 2,771,289 | | | | 55,820,316 | | | | 56,975 | |
| | | | |
Net investment income (loss) | | | (482,719 | ) | | | 77,156,365 | | | | 17,128 | |
| | | | |
| | | | | | | | | | | | |
| Realized and Unrealized Gain (Loss) | | | | | | | | | | | | |
Net realized gain (loss) from: | | | | | | | | | | | | |
Investments | | | (48,801,724 | ) | | | 157,880,988 | | | | 81,025 | |
Capital gain distributions received from affiliated investment companies | | | — | | | | 47,877 | | | | — | |
Options written | | | — | | | | (4,303,633 | ) | | | 87,428 | |
Financial futures contracts | | | — | | | | (51,608,851 | ) | | | 87,258 | |
Swaps | | | — | | | | (21,820,684 | ) | | | (19,761 | ) |
Foreign currency transactions | | | (19,750 | ) | | | 84,631,996 | | | | 177,615 | |
Borrowed bonds | | | — | | | | (48,868,857 | ) | | | — | |
| | | | |
| | | (48,821,474 | ) | | | 115,958,836 | | | | 413,565 | |
| | | | |
Net change in unrealized appreciation/depreciation on: | | | | | | | | | | | | |
Investments | | | (48,005,390 | ) | | | (368,731,424 | ) | | | (725,689 | ) |
Options written | | | — | | | | 316,236 | | | | 37,003 | |
Financial futures contracts | | | — | | | | (4,261,629 | ) | | | (215,624 | ) |
Swaps | | | — | | | | (27,706,916 | ) | | | 171,205 | |
Foreign currency translations | | | (8,654 | ) | | | 166,550,903 | | | | 234,115 | |
Unfunded loan commitments | | | — | | | | 430,505 | | | | — | |
Short sales — unaffiliated | | | — | | | | 1,318,631 | | | | — | |
Short sales — affiliated | | | — | | | | (186,469 | ) | | | — | |
Borrowed bonds | | | — | | | | (9,645,600 | ) | | | — | |
| | | | |
| | | (48,014,044 | ) | | | (241,915,763 | ) | | | (498,990 | ) |
| | | | |
Net realized and unrealized loss | | | (96,835,518 | ) | | | (125,956,927 | ) | | | (85,425 | ) |
| | | | |
Net Decrease in Net Assets Resulting from Operations | | $ | (97,318,237 | ) | | $ | (48,800,562 | ) | | $ | (68,297 | ) |
| | | | |
| | 1 | | Consolidated Statement of Operations. |
| | 2 | | For the period December 4, 2014 (commencement of operations) to January 31, 2015. |
See Notes to Financial Statements.
| | | | | | |
| 58 | | BLACKROCK FUNDS | | JANUARY 31, 2015 | | |
| | |
| Statements of Changes in Net Assets | | |
| | | | | | | | | | | | | | | | |
| | | BlackRock
Commodity
Strategies Fund1 | | | BlackRock
Global Long/Short
Credit Fund | |
| Increase (Decrease) in Net Assets: | | Six Months
Ended
January 31,
2015
(Unaudited) | | | Year Ended
July 31, 2014 | | | Six Months
Ended
January 31, 2015 (Unaudited) | | | Year Ended
July 31, 2014 | |
| | | | | | | | | | | | | | | | |
| Operations | | | | | | | | | | | | | | | | |
Net investment income (loss) | | $ | (482,719 | ) | | $ | (1,070,635 | ) | | $ | 77,156,365 | | | $ | 77,389,133 | |
Net realized gain (loss) | | | (48,821,474 | ) | | | (4,104,940 | ) | | | 115,958,836 | | | | 4,709,967 | |
Net change in unrealized appreciation/depreciation | | | (48,014,044 | ) | | | 36,847,376 | | | | (241,915,763 | ) | | | 100,575,647 | |
| | | | | | | | |
Net increase (decrease) in net assets resulting from operations | | | (97,318,237 | ) | | | 31,671,801 | | | | (48,800,562 | ) | | | 182,674,747 | |
| | | | | | | | |
| | | | | | | | | | | | | | | | |
| Distributions to Shareholders From2 | | | | | | | | | | | | | | | | |
Net investment income: | | | | | | | | | | | | | | | | |
Institutional | | | (89,086 | ) | | | — | | | | (154,488,940 | ) | | | (34,807,025 | ) |
Investor A | | | — | | | | — | | | | (35,435,750 | ) | | | (17,923,048 | ) |
Investor C | | | — | | | | — | | | | (10,075,167 | ) | | | (1,108,893 | ) |
Net realized gain: | | | | | | | | | | | | | | | | |
Institutional | | | — | | | | — | | | | (55,897,505 | ) | | | — | |
Investor A | | | — | | | | — | | | | (13,695,239 | ) | | | — | |
Investor C | | | — | | | | — | | | | (4,396,025 | ) | | | — | |
| | | | | | | | |
Decrease in net assets resulting from distributions to shareholders | | | (89,086 | ) | | | — | | | | (273,988,626 | ) | | | (53,838,966 | ) |
| | | | | | | | |
| | | | | | | | | | | | | | | | |
| Capital Share Transactions | | | | | | | | | | | | | | | | |
Net increase (decrease) in net assets derived from capital share transactions | | | 57,276,480 | | | | 6,201,400 | | | | (295,308,461 | ) | | | 4,057,411,538 | |
| | | | | | | | |
| | | | | | | | | | | | | | | | |
| Net Assets | | | | | | | | | | | | | | | | |
Total increase (decrease) in net assets | | | (40,130,843 | ) | | | 37,873,201 | | | | (618,097,649 | ) | | | 4,186,247,319 | |
Beginning of period | | | 444,351,363 | | | | 406,478,162 | | | | 6,589,036,915 | | | | 2,402,789,596 | |
| | | | | | | | |
End of period | | $ | 404,220,520 | | | $ | 444,351,363 | | | $ | 5,970,939,266 | | | $ | 6,589,036,915 | |
| | | | | | | | |
Distributions in excess of net investment income, at end of period | | $ | (1,400,527 | ) | | $ | (828,722 | ) | | $ | (159,680,259 | ) | | $ | (36,884,644 | ) |
| | | | | | | | |
| | 1 | | Consolidated Statement of Changes in Net Assets. |
| | 2 | | Distributions for annual periods determined in accordance with federal income tax regulations. |
See Notes to Financial Statements.
| | | | | | |
| | | BLACKROCK FUNDS | | JANUARY 31, 2015 | | 59 |
| | |
| Statements of Changes in Net Assets (concluded) | | |
| | | | |
| | | BlackRock
Macro Themes
Fund1 | |
| Increase in Net Assets: | | Period
December 4, 20142
to January 31, 2015
(Unaudited) | |
| | | | |
| Operations | | | | |
Net investment income | | $ | 17,128 | |
Net realized gain | | | 413,565 | |
Net change in unrealized appreciation/depreciation | | | (498,990 | ) |
| | | | |
Net decrease in net assets resulting from operations | | | (68,297 | ) |
| | | | |
| | | | |
| Distributions to Shareholders From3 | | | | |
Net investment income: | | | | |
Institutional | | | (39,974 | ) |
Investor A | | | (26 | ) |
Investor C | | | (2 | ) |
| | | | |
Decrease in net assets resulting from distributions to shareholders | | | (40,002 | ) |
| | | | |
| | | | |
| Capital Share Transactions | | | | |
Net increase in net assets derived from capital share transactions | | | 30,000,000 | |
| | | | |
| | | | |
| Net Assets | | | | |
Total increase in net assets | | | 29,891,701 | |
Beginning of period | | | — | |
| | | | |
End of period | | $ | 29,891,701 | |
| | | | |
Accumulated net investment loss, at end of period | | $ | (22,874 | ) |
| | | | |
| | 1 | | Consolidated Statement of Changes in Net Assets. |
| | 2 | | Commencement of operations. |
| | 3 | | Distributions for annual periods determined in accordance with federal income tax regulations. |
See Notes to Financial Statements.
| | | | | | |
| 60 | | BLACKROCK FUNDS | | JANUARY 31, 2015 | | |
| | | | |
| Consolidated Financial Highlights | | | BlackRock Commodity Strategies Fund | |
| | | | | | | | | | | | | | | | |
| | | Institutional | |
| | | Six Months
Ended
January 31,
2015
(Unaudited) | | | Year Ended July 31, | | | Period
October 3,
20111 to
July 31,
2012 | |
| | | 2014 | | | 2013 | | |
| Per Share Operating Performance | | | | | | | | | | | | | | | | |
Net asset value, beginning of period | | $ | 9.89 | | | $ | 9.17 | | | $ | 9.93 | | | $ | 10.00 | |
| | | | |
Net investment loss2 | | | (0.01 | ) | | | (0.02 | ) | | | (0.03 | ) | | | (0.01 | ) |
Net realized and unrealized gain (loss) | | | (2.03 | ) | | | 0.74 | | | | (0.73 | ) | | | 0.22 | |
| | | | |
Net increase (decrease) from investment operations | | | (2.04 | ) | | | 0.72 | | | | (0.76 | ) | | | 0.21 | |
| | | | |
Distributions from:3 | | | | | | | | | | | | | | | | |
Net investment income | | | (0.00 | )4 | | | — | | | | (0.00 | )4 | | | (0.01 | ) |
Net realized gain | | | — | | | | — | | | | — | | �� | | (0.27 | ) |
| | | | |
Total distributions | | | (0.00 | )4 | | | — | | | | (0.00 | )4 | | | (0.28 | ) |
| | | | |
Net asset value, end of period | | $ | 7.85 | | | $ | 9.89 | | | $ | 9.17 | | | $ | 9.93 | |
| | | | |
| | | | | | | | | | | | | | | | |
| Total Return5 | | | | | | | | | | | | | | | | |
Based on net asset value | | | (20.61 | )%6 | | | 7.85 | % | | | (7.63 | )% | | | 2.00 | %6 |
| | | | |
| | | | | | | | | | | | | | | | |
| Ratios to Average Net Assets | | | | | | | | | | | | | | | | |
Total expenses7 | | | 1.32 | %8 | | | 1.33 | % | | | 1.38 | % | | | 1.87 | %8,9 |
| | | | |
Total expenses excluding recoupment of past waived and/or reimbursed fees7 | | | 1.32 | %8 | | | 1.33 | % | | | 1.38 | % | | | 1.87 | %8,9 |
| | | | |
Total expenses after fees waived and/or reimbursed7 | | | 1.28 | %8 | | | 1.29 | % | | | 1.29 | % | | | 1.30 | %8 |
| | | | |
Net investment loss7 | | | (0.20 | )%8 | | | (0.22 | )% | | | (0.24 | %) | | | (0.08 | )%8 |
| | | | |
| | | | | | | | | | | | | | | | |
| Supplemental Data | | | | | | | | | | | | | | | | |
Net assets, end of period (000) | | $ | 386,094 | | | $ | 413,506 | | | $ | 378,747 | | | $ | 62,974 | |
| | | | |
Portfolio turnover rate | | | 35 | % | | | 71 | % | | | 63 | % | | | 127 | % |
| | | | |
| | 1 | | Commencement of operations. |
| | 2 | | Based on average shares outstanding. |
| | 3 | | Distributions for annual periods determined in accordance with federal income tax regulations. |
| | 4 | | Amount is greater than $(0.005) per share. |
| | 5 | | Where applicable, assumes the reinvestment of distributions. |
| | 6 | | Aggregate total return. |
| | 7 | | Excludes expenses incurred indirectly as a result of investments in underlying funds as follows: |
| | | | | | | | | | | | | | | | |
| | | | |
| | | Six Months
Ended
January 31,
2015
(Unaudited) | | | Year Ended July 31, | | | Period
October 3,
20111 to
July 31,
2012 | |
| | | 2014 | | | 2013 | | |
Investments in underlying funds | | | 0.02 | % | | | 0.05 | % | | | 0.01 | % | | | — | |
| | 9 | | Organization costs were not annualized in the calculation of the expense ratios. If these expenses were annualized, the total expenses would have been 1.89%. |
See Notes to Financial Statements.
| | | | | | |
| | | BLACKROCK FUNDS | | JANUARY 31, 2015 | | 61 |
| | | | |
| Consolidated Financial Highlights (continued) | | | BlackRock Commodity Strategies Fund | |
| | | | | | | | | | | | | | | | |
| | | Investor A | |
| | | Six Months
Ended
January 31,
2015
(Unaudited) | | | Year Ended July 31, | | | Period
October 3,
20111 to
July 31,
2012 | |
| | | | 2014 | | | 2013 | | |
| Per Share Operating Performance | | | | | | | | | | | | | | | | |
Net asset value, beginning of period | | $ | 9.85 | | | $ | 9.15 | | | $ | 9.93 | | | $ | 10.00 | |
| | | | |
Net investment loss2 | | | (0.02 | ) | | | (0.04 | ) | | | (0.04 | ) | | | (0.02 | ) |
Net realized and unrealized gain (loss) | | | (2.03 | ) | | | 0.74 | | | | (0.74 | ) | | | 0.22 | |
| | | | |
Net increase (decrease) from investment operations | | | (2.05 | ) | | | 0.70 | | | | (0.78 | ) | | | 0.20 | |
| | | | |
Distributions from:3 | | | | | | | | | | | | | | | | |
Net investment income | | | — | | | | — | | | | — | | | | (0.00 | )4 |
Net realized gain | | | — | | | | — | | | | — | | | | (0.27 | ) |
| | | | |
Total distributions | | | — | | | | — | | | | — | | | | (0.27 | ) |
| | | | |
Net asset value, end of period | | $ | 7.80 | | | $ | 9.85 | | | $ | 9.15 | | | $ | 9.93 | |
| | | | |
| | | | | | | | | | | | | | | | |
| Total Return5 | | | | | | | | | | | | | | | | |
Based on net asset value | | | (20.81 | )%6 | | | 7.65 | % | | | (7.86 | )% | | | 1.97 | %6 |
| | | | |
| | | | | | | | | | | | | | | | |
| Ratios to Average Net Assets | | | | | | | | | | | | | | | | |
Total expenses7 | | | 1.83 | %8 | | | 1.78 | % | | | 1.79 | % | | | 2.08 | %8,9 |
| | | | |
Total expenses excluding recoupment of past waived and/or reimbursed fees7 | | | 1.83 | %8 | | | 1.78 | % | | | 1.79 | % | | | 2.08 | %8,9 |
| | | | |
Total expenses after fees waived and/or reimbursed7 | | | 1.50 | %8 | | | 1.50 | % | | | 1.50 | % | | | 1.50 | %8 |
| | | | |
Net investment loss7 | | | (0.38 | )%8 | | | (0.43 | )% | | | (0.39 | %) | | | (0.26 | )%8 |
| | | | |
| | | | | | | | | | | | | | | | |
| Supplemental Data | | | | | | | | | | | | | | | | |
Net assets, end of period (000) | | $ | 11,661 | | | $ | 21,402 | | | $ | 17,399 | | | $ | 15,274 | |
| | | | |
Portfolio turnover rate | | | 35 | % | | | 71 | % | | | 63 | % | | | 127 | % |
| | | | |
| | 1 | | Commencement of operations. |
| | 2 | | Based on average shares outstanding. |
| | 3 | | Distributions for annual periods determined in accordance with federal income tax regulations. |
| | 4 | | Amount is greater than $(0.005) per share. |
| | 5 | | Where applicable, excludes the effects of any sales charges and assumes the reinvestment of distributions. |
| | 6 | | Aggregate total return. |
| | 7 | | Excludes expenses incurred indirectly as a result of investments in underlying funds as follows: |
| | | | | | | | | | | | | | | | |
| | | | |
| | | Six Months
Ended
January 31,
2015
(Unaudited) | | | Year Ended July 31, | | | Period
October 3,
20111 to
July 31,
2012 | |
| | | 2014 | | | 2013 | | |
Investments in underlying funds | | | 0.02 | % | | | 0.05 | % | | | 0.01 | % | | | — | |
| | 9 | | Organization costs were not annualized in the calculation of the expense ratios. If these expenses were annualized, the total expenses would have been 2.08%. |
See Notes to Financial Statements.
| | | | | | |
| 62 | | BLACKROCK FUNDS | | JANUARY 31, 2015 | | |
| | | | |
| Consolidated Financial Highlights (concluded) | | | BlackRock Commodity Strategies Fund | |
| | | | | | | | | | | | | | | | |
| | | Investor C | |
| | | Six Months
Ended
January 31,
2015
(Unaudited) | | | Year Ended July 31, | | | Period
October 3,
20111 to
July 31,
2012 | |
| | | | 2014 | | | 2013 | | |
| Per Share Operating Performance | | | | | | | | | | | | | | | | |
Net asset value, beginning of period | | $ | 9.64 | | | $ | 9.02 | | | $ | 9.87 | | | $ | 10.00 | |
| | | | |
Net investment loss2 | | | (0.05 | ) | | | (0.11 | ) | | | (0.11 | ) | | | (0.08 | ) |
Net realized and unrealized gain (loss) | | | (1.98 | ) | | | 0.73 | | | | (0.74 | ) | | | 0.22 | |
| | | | |
Net increase (decrease) from investment operations | | | (2.03 | ) | | | 0.62 | | | | (0.85 | ) | | | 0.14 | |
| | | | |
Distributions from:3 | | | | | | | | | | | | | | | | |
Net investment income | | | — | | | | — | | | | — | | | | — | |
Net realized gain | | | — | | | | — | | | | — | | | | (0.27 | ) |
| | | | |
Total distributions | | | — | | | | — | | | | — | | | | (0.27 | ) |
| | | | |
Net asset value, end of period | | $ | 7.61 | | | $ | 9.64 | | | $ | 9.02 | | | $ | 9.87 | |
| | | | |
| | | | | | | | | | | | | | | | |
| Total Return4 | | | | | | | | | | | | | | | | |
Based on net asset value | | | (21.06 | )%5 | | | 6.87 | % | | | (8.61 | )% | | | 1.29 | %5 |
| | | | |
| | | | | | | | | | | | | | | | |
| Ratios to Average Net Assets | | | | | | | | | | | | | | | | |
Total expenses6 | | | 2.47 | %7 | | | 2.43 | % | | | 2.49 | % | | | 2.85 | %7,8 |
| | | | |
Total expenses excluding recoupment of past waived and/or reimbursed fees6 | | | 2.47 | %7 | | | 2.43 | % | | | 2.49 | % | | | 2.85 | %7,8 |
| | | | |
Total expenses after fees waived and/or reimbursed6 | | | 2.25 | %7 | | | 2.25 | % | | | 2.25 | % | | | 2.24 | %7 |
| | | | |
Net investment loss6 | | | (1.16 | )%7 | | | (1.17 | )% | | | (1.14 | )% | | | (0.97 | )%7 |
| | | | |
| | | | | | | | | | | | | | | | |
| Supplemental Data | | | | | | | | | | | | | | | | |
Net assets, end of period (000) | | $ | 6,465 | | | $ | 9,443 | | | $ | 10,332 | | | $ | 8,651 | |
| | | | |
Portfolio turnover rate | | | 35 | % | | | 71 | % | | | 63 | % | | | 127 | % |
| | | | |
| | 1 | | Commencement of operations. |
| | 2 | | Based on average shares outstanding. |
| | 3 | | Distributions for annual periods determined in accordance with federal income tax regulations. |
| | 4 | | Where applicable, excludes the effects of any sales charges and assumes the reinvestment of distributions. |
| | 5 | | Aggregate total return. |
| | 6 | | Excludes expenses incurred indirectly as a result of investments in underlying funds as follows: |
| | | | | | | | | | | | | | | | |
| | | | |
| | | Six Months
Ended
January 31,
2015
(Unaudited) | | | Year Ended July 31, | | | Period
October 3,
20111 to
July 31,
2012 | |
| | | | 2014 | | | 2013 | | |
Investments in underlying funds | | | 0.02 | % | | | 0.05 | % | | | 0.01 | % | | | — | |
| | 8 | | Organization costs were not annualized in the calculation of the expense ratios. If these expenses were annualized, the total expenses would have been 2.85%. |
See Notes to Financial Statements.
| | | | | | |
| | | BLACKROCK FUNDS | | JANUARY 31, 2015 | | 63 |
| | | | |
| Financial Highlights | | | BlackRock Global Long/Short Credit Fund | |
| | | | | | | | | | | | | | | | |
| | | Institutional | |
| | | Six Months
Ended
January 31,
2015
(Unaudited) | | | Year Ended July 31, | | | Period
September 30,
20111 to
July 31, 2012 | |
| | | | 2014 | | | 2013 | | |
| Per Share Operating Performance | | | | | | | | | | | | | | | | |
Net asset value, beginning of period | | $ | 10.95 | | | $ | 10.63 | | | $ | 10.32 | | | $ | 10.00 | |
| | | | |
Net investment income2 | | | 0.16 | | | | 0.20 | | | | 0.15 | | | | 0.06 | |
Net realized and unrealized gain (loss) | | | (0.22 | ) | | | 0.26 | | | | 0.41 | | | | 0.30 | |
| | | | |
Net increase (decrease) from investment operations | | | (0.06 | ) | | | 0.46 | | | | 0.56 | | | | 0.36 | |
| | | | |
Distributions from:3 | | | | | | | | | | | | | | | | |
Net investment income | | | (0.34 | ) | | | (0.14 | ) | | | (0.13 | ) | | | (0.03 | ) |
Net realized gain | | | (0.12 | ) | | | — | | | | (0.11 | ) | | | (0.01 | ) |
Return of capital | | | — | | | | — | | | | (0.01 | ) | | | — | |
| | | | |
Total distributions | | | (0.46 | ) | | | (0.14 | ) | | | (0.25 | ) | | | (0.04 | ) |
| | | | |
Net asset value, end of period | | $ | 10.43 | | | $ | 10.95 | | | $ | 10.63 | | | $ | 10.32 | |
| | | | |
| | | | | | | | | | | | | | | | |
| Total Return4 | | | | | | | | | | | | | | | | |
Based on net asset value | | | (0.57 | )%5 | | | 4.36 | % | | | 5.45 | % | | | 3.55 | %5 |
| | | | |
| | | | | | | | | | | | | | | | |
| Ratios to Average Net Assets | | | | | | | | | | | | | | | | |
Total expenses6 | | | 1.55 | %7 | | | 1.61 | % | | | 1.56 | % | | | 1.73 | %7,8 |
| | | | |
Total expenses excluding recoupment of past waived and/or reimbursed fees6 | | | 1.55 | %7 | | | 1.61 | % | | | 1.54 | % | | | 1.73 | %7,8 |
| | | | |
Total expenses after fees waived and/or reimbursed6 | | | 1.55 | %7 | | | 1.59 | % | | | 1.53 | % | | | 1.46 | %7 |
| | | | |
Total expenses after fees waived, reimbursed and excluding interest and dividend expense6 | | | 1.02 | %7 | | | 1.03 | % | | | 1.18 | % | | | 1.20 | %7 |
| | | | |
Net investment income6 | | | 2.45 | %7 | | | 1.83 | % | | | 1.38 | % | | | 0.70 | %7 |
| | | | |
| | | | | | | | | | | | | | | | |
| Supplemental Data | | | | | | | | | | | | | | | | |
Net assets, end of period (000) | | $ | 4,457,226 | | | $ | 4,623,194 | | | $ | 1,335,924 | | | $ | 133,444 | |
| | | | |
Portfolio turnover rate | | | 104 | % | | | 207 | % | | | 185 | % | | | 355 | % |
| | | | |
| | 1 | | Commencement of operations. |
| | 2 | | Based on average shares outstanding. |
| | 3 | | Distributions for annual periods determined in accordance with federal income tax regulations. |
| | 4 | | Where applicable, assumes the reinvestment of distributions. |
| | 5 | | Aggregate total return. |
| | 6 | | Excludes expenses incurred indirectly as a result of investments in underlying funds as follows: |
| | | | | | | | | | | | | | | | |
| | | | |
| | | Six Months
Ended
January 31,
2015
(Unaudited) | | | Year Ended July 31, | | | Period
September 30,
20111 to
July 31, 2012 | |
| | | | 2014 | | | 2013 | | |
Investments in underlying funds | | | 0.02 | % | | | 0.05 | % | | | — | | | | — | |
| | 8 | | Organization costs were not annualized in the calculation of the expense ratios. If these expenses were annualized, the total expenses would have been 1.75%. |
See Notes to Financial Statements.
| | | | | | |
| 64 | | BLACKROCK FUNDS | | JANUARY 31, 2015 | | |
| | | | |
| Financial Highlights (continued) | | | BlackRock Global Long/Short Credit Fund | |
| | | | | | | | | | | | | | | | |
| | | Investor A | |
| | | Six Months
Ended
January 31,
2015
(Unaudited) | | | Year Ended July 31, | | | Period
September 30,
20111 to
July 31, 2012 | |
| | | | 2014 | | | 2013 | | |
| Per Share Operating Performance | | | | | | | | | | | | | | | | |
Net asset value, beginning of period | | $ | 10.93 | | | $ | 10.61 | | | $ | 10.30 | | | $ | 10.00 | |
| | | | |
Net investment income2 | | | 0.14 | | | | 0.16 | | | | 0.12 | | | | 0.06 | |
Net realized and unrealized gain (loss) | | | (0.23 | ) | | | 0.27 | | | | 0.42 | | | | 0.28 | |
| | | | |
Net increase (decrease) from investment operations | | | (0.09 | ) | | | 0.43 | | | | 0.54 | | | | 0.34 | |
| | | | |
Distributions from:3 | | | | | | | | | | | | | | | | |
Net investment income | | | (0.31 | ) | | | (0.11 | ) | | | (0.11 | ) | | | (0.03 | ) |
Net realized gain | | | (0.12 | ) | | | — | | | | (0.11 | ) | | | (0.01 | ) |
Return of capital | | | — | | | | — | | | | (0.01 | ) | | | — | |
| | | | |
Total distributions | | | (0.43 | ) | | | (0.11 | ) | | | (0.23 | ) | | | (0.04 | ) |
| | | | |
Net asset value, end of period | | $ | 10.41 | | | $ | 10.93 | | | $ | 10.61 | | | $ | 10.30 | |
| | | | |
| | | | | | | | | | | | | | | | |
| Total Return4 | | | | | | | | | | | | | | | | |
Based on net asset value | | | (0.77 | )%5 | | | 4.09 | % | | | 5.23 | % | | | 3.32 | %5 |
| | | | |
| | | | | | | | | | | | | | | | |
| Ratios to Average Net Assets | | | | | | | | | | | | | | | | |
Total expenses6 | | | 1.88 | %7 | | | 1.91 | % | | | 1.79 | % | | | 1.93 | %7,8 |
| | | | |
Total expenses excluding recoupment of past waived and/or reimbursed fees6 | | | 1.88 | %7 | | | 1.91 | % | | | 1.77 | % | | | 1.93 | %7,8 |
| | | | |
Total expenses after fees waived and/or reimbursed6 | | | 1.87 | %7 | | | 1.89 | % | | | 1.75 | % | | | 1.66 | %7 |
| | | | |
Total expenses after fees waived, reimbursed and excluding interest and dividend expense6 | | | 1.35 | %7 | | | 1.32 | % | | | 1.40 | % | | | 1.39 | %7 |
| | | | |
Net investment income6 | | | 2.10 | %7 | | | 1.48 | % | | | 1.11 | % | | | 0.67 | %7 |
| | | | |
| | | | | | | | | | | | | | | | |
| Supplemental Data | | | | | | | | | | | | | | | | |
Net assets, end of period (000) | | $ | 1,144,175 | | | $ | 1,575,812 | | | $ | 910,247 | | | $ | 71,053 | |
| | | | |
Portfolio turnover rate | | | 104 | % | | | 207 | % | | | 185 | % | | | 355 | % |
| | | | |
| | 1 | | Commencement of operations. |
| | 2 | | Based on average shares outstanding. |
| | 3 | | Distributions for annual periods determined in accordance with federal income tax regulations. |
| | 4 | | Where applicable, excludes the effects of any sales charges and assumes the reinvestment of distributions. |
| | 5 | | Aggregate total return. |
| | 6 | | Excludes expenses incurred indirectly as a result of investments in underlying funds as follows: |
| | | | | | | | | | | | | | | | |
| | | | |
| | | Six Months
Ended
January 31,
2015
(Unaudited) | | | Year Ended July 31, | | | Period
September 30,
20111 to
July 31, 2012 | |
| | | | 2014 | | | 2013 | | |
Investments in underlying funds | | | 0.02 | % | | | 0.05 | % | | | — | | | | — | |
| | 8 | | Organization costs were not annualized in the calculation of the expense ratios. If these expenses were annualized, the total expenses would have been 1.93%. |
See Notes to Financial Statements.
| | | | | | |
| | | BLACKROCK FUNDS | | JANUARY 31, 2015 | | 65 |
| | | | |
| Financial Highlights (concluded) | | | BlackRock Global Long/Short Credit Fund | |
| | | | | | | | | | | | | | | | |
| | | Investor C | |
| | | Six Months
Ended
January 31,
2015
(Unaudited) | | | Year Ended July 31, | | | Period
September 30,
20111 to
July 31, 2012 | |
| | | | 2014 | | | 2013 | | |
| Per Share Operating Performance | | | | | | | | | | | | | | | | |
Net asset value, beginning of period | | $ | 10.87 | | | $ | 10.56 | | | $ | 10.26 | | | $ | 10.00 | |
| | | | |
Net investment income (loss)2 | | | 0.11 | | | | 0.08 | | | | 0.04 | | | | (0.01 | ) |
Net realized and unrealized gain (loss) | | | (0.23 | ) | | | 0.27 | | | | 0.41 | | | | 0.29 | |
| | | | |
Net increase (decrease) from investment operations | | | (0.12 | ) | | | 0.35 | | | | 0.45 | | | | 0.28 | |
| | | | |
Distributions from:3 | | | | | | | | | | | | | | | | |
Net investment income | | | (0.28 | ) | | | (0.04 | ) | | | (0.03 | ) | | | (0.01 | ) |
Net realized gain | | | (0.12 | ) | | | — | | | | (0.11 | ) | | | (0.01 | ) |
Return of capital | | | — | | | �� | — | | | | (0.01 | ) | | | — | |
| | | | |
Total distributions | | | (0.40 | ) | | | (0.04 | ) | | | (0.15 | ) | | | (0.02 | ) |
| | | | |
Net asset value, end of period | | $ | 10.35 | | | $ | 10.87 | | | $ | 10.56 | | | $ | 10.26 | |
| | | | |
| | | | | | | | | | | | | | | | |
| Total Return4 | | | | | | | | | | | | | | | | |
Based on net asset value | | | (1.10 | )%5 | | | 3.31 | % | | | 4.39 | % | | | 2.79 | %5 |
| | | | |
| | | | | | | | | | | | | | | | |
| Ratios to Average Net Assets | | | | | | | | | | | | | | | | |
Total expenses6 | | | 2.58 | %7 | | | 2.63 | % | | | 2.50 | % | | | 2.66 | %7,8 |
| | | | |
Total expenses excluding recoupment of past waived and/or reimbursed fees6 | | | 2.58 | %7 | | | 2.63 | % | | | 2.48 | % | | | 2.66 | %7,8 |
| | | | |
Total expenses after fees waived and/or reimbursed6 | | | 2.57 | %7 | | | 2.62 | % | | | 2.47 | % | | | 2.40 | %7 |
| | | | |
Total expenses after fees waived, reimbursed and excluding interest and dividend expense6 | | | 2.05 | %7 | | | 2.05 | % | | | 2.12 | % | | | 2.14 | %7 |
| | | | |
Net investment income (loss)6 | | | 1.42 | %7 | | | 0.76 | % | | | 0.39 | % | | | (0.16 | )%7 |
| | | | |
| | | | | | | | | | | | | | | | |
| Supplemental Data | | | | | | | | | | | | | | | | |
Net assets, end of period (000) | | $ | 369,539 | | | $ | 390,031 | | | $ | 156,619 | | | $ | 13,132 | |
| | | | |
Portfolio turnover rate | | | 104 | % | | | 207 | % | | | 185 | % | | | 355 | % |
| | | | |
| | 1 | | Commencement of operations. |
| | 2 | | Based on average shares outstanding. |
| | 3 | | Distributions for annual periods determined in accordance with federal income tax regulations. |
| | 4 | | Where applicable, excludes the effects of any sales charges and assumes the reinvestment of distributions. |
| | 5 | | Aggregate total return. |
| | 6 | | Excludes expenses incurred indirectly as a result of investments in underlying funds as follows: |
| | | | | | | | | | | | | | | | |
| | | | |
| | | Six Months
Ended
January 31,
2015
(Unaudited) | | | Year Ended July 31, | | | Period
September 30,
20111 to
July 31, 2012 | |
| | | | 2014 | | | 2013 | | |
Investments in underlying funds | | | 0.02 | % | | | 0.05 | % | | | — | | | | — | |
| | 8 | | Organization costs were not annualized in the calculation of the expense ratios. If these expenses were annualized, the total expenses would have been 2.66%. |
See Notes to Financial Statements.
| | | | | | |
| 66 | | BLACKROCK FUNDS | | JANUARY 31, 2015 | | |
| | | | |
| Financial Highlights | | | BlackRock Macro Themes Fund | |
| | | | | | | | | | | | |
| | | Period December 4, 20141 to January 31, 2015 (Unaudited) | |
| | | Institutional | | | Investor A | | | Investor C | |
| | | | | | | | | | | | |
| Per Share Operating Performance | | | | | | | | | | | | |
Net asset value, beginning of period | | $ | 10.00 | | | $ | 10.00 | | | $ | 10.00 | |
| | | | |
Net investment income (loss)2 | | | 0.01 | | | | 0.00 | 3 | | | (0.01 | ) |
Net realized and unrealized loss | | | (0.04 | ) | | | (0.03 | ) | | | (0.03 | ) |
| | | | |
Net decrease from investment operations | | | (0.03 | ) | | | (0.03 | ) | | | (0.04 | ) |
| | | | |
Distributions from net investment income | | | (0.01 | ) | | | (0.01 | ) | | | (0.00 | )4 |
| | | | |
Net asset value, end of period | | $ | 9.96 | | | $ | 9.96 | | | $ | 9.96 | |
| | | | |
| | | | | | | | | | | | |
| Total Returns5,6 | | | | | | | | | | | | |
Based on net asset value | | | (0.27 | )% | | | (0.30 | )% | | | (0.39 | )% |
| | | | |
| | | | | | | | | | | | |
| Ratios to Average Net Assets7 | | | | | | | | | | | | |
Total expenses8,9 | | | 2.27 | % | | | 2.85 | % | | | 3.60 | % |
| | | | |
Total expenses after fees waived and/or reimbursed9 | | | 1.20 | % | | | 1.45 | % | | | 2.20 | % |
| | | | |
Net investment income (loss)9 | | | 0.36 | % | | | 0.11 | % | | | (0.64 | )% |
| | | | |
| | | | | | | | | | | | |
| Supplemental Data | | | | | | | | | | | | |
Net assets, end of period (000) | | $ | 29,842 | | | $ | 25 | | | $ | 25 | |
| | | | |
Portfolio turnover rate | | | 24 | % | | | 24 | % | | | 24 | % |
| | | | |
| | 1 | | Commencement of operations. |
| | 2 | | Based on average shares outstanding. |
| | 3 | | Amount is less than $0.005 per share. |
| | 4 | | Amount is greater than $(0.005) per share. |
| | 5 | | Where applicable, excludes the effects of any sales charges and assumes the reinvestment of distributions. |
| | 6 | | Aggregate total return. |
| | 8 | | Organization costs were not annualized in the calculation of the expense ratios. If these expenses were annualized, the total expenses for Institutional, Investor A and Investor C would have been 3.24%, 3.83% and 4.57%, respectively. |
| | 9 | | Excludes expenses incurred indirectly as a result of investments in underlying funds as follows: |
| | | | |
| | | | |
| | | Period Ended
December 4, 2014 January 31, 2015
(Unaudited) | |
Investments in underlying funds | | | 0.11 | % |
See Notes to Financial Statements.
| | | | | | |
| | | BLACKROCK FUNDS | | JANUARY 31, 2015 | | 67 |
| | |
Notes to Financial Statements (Unaudited) | | |
1. Organization:
BlackRock FundsSM (the “Trust”) is registered under the Investment Company Act of 1940, as amended (the “1940 Act”), as an open-end management investment company. The Trust is organized as a Massachusetts business trust. The following are referred to herein collectively as the “Funds” or individually, a “Fund”:
| | | | |
| Fund Name | | Herein Referred To As | | Diversification Classification |
BlackRock Commodity Strategies Fund | | Commodity Strategies | | Non-diversified |
BlackRock Global Long/Short Credit Fund | | Global Long/Short Credit | | Diversified |
BlackRock Macro Themes Fund | | Macro Themes | | Non-diversified |
Each Fund offers multiple classes of shares. All classes of shares have identical voting, dividend, liquidation and other rights and are subject to the same terms and conditions, except that each bears certain expenses and may have a conversion privilege as outlined below. Institutional Shares are sold only to certain eligible investors. Investor A and Investor C Shares are generally available through financial intermediaries. Each class has exclusive voting rights with respect to matters relating to its shareholder servicing and distribution expenditures. For distribution and service fee breakdown see Note 5.
| | | | | | |
| Share Class | | Initial Sales Charge | | CDSC | | Conversion Privilege |
Institutional Shares | | No | | No | | None |
Investor A Shares | | Yes | | No1 | | None |
Investor C Shares | | No | | Yes | | None |
| | 1 | | Investor A Shares may be subject to a CDSC where no initial sales charge was paid at the time of purchase. |
The Funds, together with certain other registered investment companies advised by the Manager or its affiliates, are included in a complex of open-end funds referred to as the Equity-Liquidity Complex.
Basis of Consolidation: The accompanying consolidated financial statements of Commodity Strategies and Macro Themes include the accounts of BlackRock Cayman Commodity Strategies Fund, Ltd. (“Cayman Commodity Strategies”) and BlackRock Cayman Macro Themes Fund, Ltd. (“Cayman Macro Themes”) (the “Subsidiaries”), respectively, which are wholly owned subsidiaries of each respective Fund and primarily invest in commodity-related instruments and/or other derivatives. The Subsidiaries enable the Funds to hold these commodity-related instruments and other derivatives and satisfy regulated investment company tax requirements. Each Fund may invest up to 25% of its total assets in its respective Subsidiary. The accompanying Consolidated Schedules of Investments and consolidated financial statements of each Fund include the positions and accounts, respectively, of its Subsidiary. The net assets of Cayman Commodity Strategies at January 31, 2015 were $11,407,075 representing 2.8% of Commodity Strategies’ consolidated net assets. Intercompany accounts and transactions, if any, have been eliminated. The Subsidiaries are subject to the same investment policies and restrictions that apply to the Funds, except that the Subsidiaries may invest without limitation in commodity-related instruments.
The following table shows a summary of the selected financial information of Cayman Macro Themes included in the consolidated financial statements:
| | | | |
| Consolidated Statements of Assets and Liabilities | | | |
Total assets | | $ | 6,422,131 | |
Total liabilities | | | (298,041 | ) |
| | | | |
| Net assets | | $6,124,090 | |
Consolidated Statements of Operations | | | | |
Net investment income | | $ | 254 | |
Net realized gain (loss) from: | | | | |
Investments - unaffiliated | | | (83,879 | ) |
Options written | | | 87,428 | |
Financial futures contracts | | | 84,262 | |
Swaps | | | (19,721 | ) |
Foreign currency transactions | | | (1,568 | ) |
| | | | |
| | | 66,522 | |
| | | | |
| | | | | |
| | | | | | |
| 68 | | BLACKROCK FUNDS | | JANUARY 31, 2015 | | |
| | |
| Notes to Financial Statements (continued) | | |
| | | | |
Net change in unrealized appreciation/depreciation | | | | |
Investments - unaffiliated | | $ | (110,734 | ) |
Options written | | | 37,003 | |
Financial futures contracts | | | (190,091 | ) |
Swaps | | | 171,205 | |
Foreign currency translations | | | (69 | ) |
| | | | |
| | | (92,686 | ) |
| | | | |
Net decrease in net assets resulting from operations | | $ | (25,910 | ) |
Consolidated Statements of Changes in Net Assets | | | | |
Net investment income | | $ | 254 | |
Net realized gain | | | 66,522 | |
Net change in unrealized appreciation/ depreciation | | | (92,686 | ) |
| | | | |
Net decrease in net assets resulting from operations | | $ | (25,910 | ) |
2. Significant Accounting Policies:
The Funds’ financial statements are prepared in conformity with accounting principles generally accepted in the United States of America (“U.S. GAAP”), which may require management to make estimates and assumptions that affect the reported amounts of assets and liabilities in the financial statements and the reported amounts of increases and decreases in net assets from operations during the reporting period. Actual results could differ from those estimates. Each Fund is considered an investment company under U.S. GAAP and follows the accounting and reporting guidance applicable to investment companies. The following is a summary of significant accounting policies followed by the Funds:
Valuation: The Funds’ investments are valued at fair value as of the close of trading on the New York Stock Exchange (“NYSE”) (generally 4:00 p.m., Eastern time) (or if the reporting date falls on a day the NYSE is closed, investments are valued at fair value as of the report date). U.S. GAAP defines fair value as the price the Funds would receive to sell an asset or pay to transfer a liability in an orderly transaction between market participants at the measurement date. The Funds determine the fair values of their financial instruments at market value using independent dealers or pricing services under policies approved by the Board of Trustees of the Trust (the “Board”). The BlackRock Global Valuation Methodologies Committee (the “Global Valuation Committee”) is the committee formed by management to develop global pricing policies and procedures and to provide oversight of the pricing function for the Funds for all financial instruments.
Bond investments are valued on the basis of last available bid prices or current market quotations provided by dealers or pricing services. Floating rate loan interests are valued at the mean of the bid prices from one or more brokers or dealers as obtained from a pricing service. In determining the value of a particular investment, pricing services may use certain information with respect to transactions in such investments, quotations from dealers, pricing matrixes, market transactions in comparable investments, various relationships observed in the market between investments and calculated yield measures. Asset-backed and mortgage-backed securities are valued by independent pricing services using models that consider estimated cash flows of each tranche of the security, establish a benchmark yield and develop an estimated tranche-specific spread to the benchmark yield based on the unique attributes of the tranche. Financial futures contracts traded on exchanges are valued at their last sale price. Commodity-Linked Notes are valued utilizing quotes received daily by the Funds’ pricing service or through brokers. The Funds’ pricing service utilize valuation models, which incorporate a number of transaction specific data factors, such as the performance return multiple and upfront interest paid, as well as the price of the underlying index. Swap agreements are valued utilizing quotes received daily by the Funds’ pricing service or through brokers, which are derived using daily swap curves and models that incorporate a number of market data factors, such as discounted cash flows, trades and values of the underlying reference instruments. Certain centrally cleared swaps are valued at the price determined by the relevant exchange or clearinghouse. Investments in open-end registered investment companies are valued at NAV each business day.
Equity investments traded on a recognized securities exchange are valued at the official close each day, if available. For equity investments traded on more than one exchange, the official close price on the exchange where the stock is primarily traded is used. Equity investments traded on a recognized exchange for which there were no sales on that day may be valued at the last available bid (long positions) or ask (short positions) price.
Securities and other assets and liabilities denominated in foreign currencies are translated into U.S. dollars using exchange rates determined as of the close of business on the NYSE. Forward foreign currency exchange contracts are valued at the mean between the bid and ask prices and are determined as of the close of business on the NYSE. Interpolated values are derived when the settlement date of the contract is an interim date for which quotations are not available.
Exchange-traded options are valued at the mean between the last bid and ask prices at the close of the options market in which the options trade. An exchange-traded option for which there is no mean price is valued at the last bid (long positions) or ask (short positions) price. If no bid or ask price is available, the prior day’s price will be used, unless it is determined that the prior day’s price no longer reflects the fair value of the option. Over-the-counter (“OTC”) options and options on swaps (“swaptions”) are valued by an independent pricing service using a mathematical model, which incorporates a number of market data factors, such as the trades and prices of the underlying instruments.
| | | | | | |
| | | BLACKROCK FUNDS | | JANUARY 31, 2015 | | 69 |
| | |
| Notes to Financial Statements (continued) | | |
Commodity Strategies values its investment in BlackRock Liquidity Series, LLC, Money Market Series (the “Money Market Series”) at fair value, which is ordinarily based upon its pro rata ownership in the underlying fund’s net assets. The Money Market Series seeks current income consistent with maintaining liquidity and preserving capital. Although the Money Market Series is not registered under the 1940 Act, its investments will follow the parameters of investments by a money market fund that is subject to Rule 2a-7 under the 1940 Act. Commodity Strategies may withdraw up to 25% of its investment daily, although the manager of the Money Market Series, in its sole discretion, may permit an investor to withdraw more than 25% on any one day.
In the event that the application of these methods of valuation results in a price for an investment that is deemed not to be representative of the market value of such investment, or if a price is not available, the investment will be valued by the Global Valuation Committee, or its delegate, in accordance with a policy approved by the Board as reflecting fair value (“Fair Value Investments”). When determining the price for Fair Value Investments, the Global Valuation Committee, or its delegate, seeks to determine the price that each Fund might reasonably expect to receive or pay from the current sale or purchase of that asset or liability in an arm’s-length transaction. Fair value determinations shall be based upon all available factors that the Global Valuation Committee, or its delegate, deems relevant consistent with the principles of fair value measurement, which include the market approach, income approach and/or in the case of recent investments, the cost approach, as appropriate. The market approach generally consists of using comparable market transactions. The income approach generally is used to discount future cash flows to present value and is adjusted for liquidity as appropriate. These factors include but are not limited to: (i) attributes specific to the investment or asset; (ii) the principal market for the investment or asset; (iii) the customary participants in the principal market for the investment or asset; (iv) data assumptions by market participants for the investment or asset, if reasonably available; (v) quoted prices for similar investments or assets in active markets; and (vi) other factors, such as future cash flows, interest rates, yield curves, volatilities, prepayment speeds, loss severities, credit risks, recovery rates, liquidation amounts and/or default rates. Due to the inherent uncertainty of valuations of such investments, the fair values may differ from the values that would have been used had an active market existed. The Global Valuation Committee, or its delegate, employs various methods for calibrating valuation approaches for investments where an active market does not exist, including regular due diligence of the Funds’ pricing vendors, regular reviews of key inputs and assumptions, transactional back-testing or disposition analysis to compare unrealized gains and losses to realized gains and losses, reviews of missing or stale prices and large movements in market values and reviews of any market related activity. The pricing of all Fair Value Investments is subsequently reported to the Board or a committee thereof on a quarterly basis.
Generally, trading in foreign instruments is substantially completed each day at various times prior to the close of business on the NYSE. Occasionally, events affecting the values of such instruments may occur between the foreign market close and the close of business on the NYSE that may not be reflected in the computation of each Fund’s net assets. If events (e.g., a company announcement, market volatility or a natural disaster) occur during such periods that are expected to materially affect the value of such instruments, those instruments may be Fair Value Investments and be valued at their fair value, as determined in good faith by the Global Valuation Committee, or its delegate, using a pricing service and/or policies approved by the Board. Each business day, the Funds use a pricing service to assist with the valuation of certain foreign exchange-traded equity securities and foreign exchange-traded and OTC options (the “Systematic Fair Value Price”). Using current market factors, the Systematic Fair Value Price is designed to value such foreign securities and foreign options at fair value as of the close of business on the NYSE, which follows the close of the local markets.
Foreign Currency: The Funds’ books and records are maintained in U.S. dollars. Purchases and sales of investment securities are recorded at the rates of exchange prevailing on the respective date of such transactions. Generally, when the U.S. dollar rises in value against a foreign currency, the Funds’ investments denominated in that currency will lose value because that currency is worth fewer U.S. dollars; the opposite effect occurs if the U.S. dollar falls in relative value.
The Funds do not isolate the portion of the results of operations arising as a result of changes in the foreign exchange rates from the changes in the market prices of investments held or sold for financial reporting purposes. Accordingly, the effects of changes in foreign currency exchange rates on investments are not segregated in the Statements of Operations from the effects of changes in market prices of those investments, but are included as a component of net realized and unrealized gain (loss) from investments. The Funds report realized currency gains (losses) on foreign currency related transactions as components of net realized gain (loss) for financial reporting purposes, whereas such components are generally treated as ordinary income for federal income tax purposes.
Segregation and Collateralization: In cases where a Fund enters into certain investments (e.g., financial futures contracts, forward foreign currency exchange contracts, options written, swaps or short sales), or certain borrowings (e.g., reverse repurchase transactions) that would be “senior securities” for 1940 Act purposes, such Fund may segregate or designate on its books and records cash or liquid securities having a market value at least equal to the amount of such Fund’s future obligations under such investments or borrowings. Doing so allows the investment or borrowing to be excluded from treatment as a “senior security.” Furthermore, if required by an exchange or counterparty agreement, such Fund may be required to deliver/deposit cash and/or securities to/with an exchange, or broker-dealer or custodian as collateral for certain investments or obligations.
Investment Transactions and Investment Income: For financial reporting purposes, investment transactions are recorded on the dates the transactions are entered into (the trade dates). Realized gains and losses on investment transactions are determined on the identified cost basis. Dividend income is recorded on the ex-dividend date. Dividends from foreign securities where the ex-dividend date may have passed are subsequently recorded when
| | | | | | |
| 70 | | BLACKROCK FUNDS | | JANUARY 31, 2015 | | |
| | |
| Notes to Financial Statements (continued) | | |
the Funds are informed of the ex-dividend date. Under the applicable foreign tax laws, a withholding tax at various rates may be imposed on capital gains, dividends and interest. Upon notification from issuers, some of the dividend income received from a real estate investment trust may be redesignated as a reduction of cost of the related investment and/or realized gain. Interest income, including amortization and accretion of premiums and discounts on debt securities, is recognized on the accrual basis. Income, expenses and realized and unrealized gains and losses are allocated daily to each class based on its relative net assets.
Distributions: Distributions paid by the Funds are recorded on the ex-dividend date. The portion of distributions that exceeds a Fund’s current and accumulated earnings and profits, which are measured on a tax basis, will constitute a non-taxable return of capital. The character and timing of distributions are determined in accordance with federal income tax regulations, which may differ from U.S. GAAP.
Net income and realized gains from investments held by the Subsidiaries are treated as ordinary income for tax purposes. Accordingly, the net investment income (loss) and realized gains (losses) reported in Commodity Strategies’ and Macro Themes’ financial statements presented under U.S. GAAP for such investments held by the Subsidiaries may differ significantly from distributions. As such, any net gain will pass through to Commodity Strategies or Macro Themes, as applicable, as ordinary income for federal income tax purposes. If a net loss is realized by the Subsidiaries in any taxable year, the loss will generally not be available to offset Commodity Strategies’ or Macro Themes’, ordinary income and/or capital gains, as applicable, for that year.
Organization and Offering Costs: Upon commencement of operations, organization costs associated with the establishment of Macro Themes were expensed by Macro Themes and reimbursed by the Manager. The Manager reimbursed Macro Themes $55,000, which is shown as expenses reimbursed by Manager in the Statements of Operations. Offering costs are amortized over a 12-month period beginning with the commencement of operations.
Recent Accounting Standard: In June 2014, the Financial Accounting Standards Board issued guidance to improve the financial reporting of reverse repurchase agreements and other similar transactions. The guidance will require expanded disclosure for entities that enter into reverse repurchase agreements and similar transactions accounted for as secured borrowings. It is effective for financial statements with fiscal years beginning on or after December 15, 2014 and interim periods within those fiscal years. Management is evaluating the impact, if any, of this guidance on the Funds’ financial statement disclosures.
Other: Expenses directly related to a Fund or its classes are charged to that Fund or the applicable class. Other operating expenses shared by several funds are prorated among those funds on the basis of relative net assets or other appropriate methods. Expenses directly related to the Funds and other shared expenses prorated to the Funds are allocated daily to each class based on its relative net assets or other appropriate methods.
The Funds have an arrangement with the custodian whereby fees may be reduced by credits earned on uninvested cash balances, which, if applicable, are shown as fees paid indirectly in the Statements of Operations. The custodian imposes fees on overdrawn cash balances, which can be offset by accumulated credits earned or may result in additional custody charges.
3. Securities and Other Investments:
Asset-Backed and Mortgage-Backed Securities: Global Long/Short Credit may invest in asset-backed securities. Asset-backed securities are generally issued as pass-through certificates, which represent undivided fractional ownership interests in an underlying pool of assets, or as debt instruments, which are also known as collateralized obligations, and are generally issued as the debt of a special purpose entity organized solely for the purpose of owning such assets and issuing such debt. Asset-backed securities are often backed by a pool of assets representing the obligations of a number of different parties. The yield characteristics of certain asset-backed securities may differ from traditional debt securities. One such major difference is that all or a principal part of the obligations may be prepaid at any time because the underlying assets (i.e., loans) may be prepaid at any time. As a result, a decrease in interest rates in the market may result in increases in the level of prepayments as borrowers, particularly mortgagors, refinance and repay their loans. An increased prepayment rate with respect to an asset-backed security subject to such a prepayment feature will have the effect of shortening the maturity of the security. In addition, Global Long/Short Credit may subsequently have to reinvest the proceeds at lower interest rates. If Global Long/Short Credit has purchased such an asset-backed security at a premium, a faster than anticipated prepayment rate could result in a loss of principal to the extent of the premium paid.
Global Long/Short Credit may purchase certain mortgage pass-through securities. There are a number of important differences among the agencies and instrumentalities of the U.S. Government that issue mortgage-related securities and among the securities that they issue. For example, mortgage-related securities guaranteed by Ginnie Mae are guaranteed as to the timely payment of principal and interest by Ginnie Mae and such guarantee is backed by the full faith and credit of the United States. However, mortgage-related securities issued by Freddie Mac and Fannie Mae, including Freddie Mac and Fannie Mae guaranteed mortgage pass-through certificates, which are solely the obligations of Freddie Mac and Fannie Mae, are not backed by or entitled to the full faith and credit of the United States, but are supported by the right of the issuer to borrow from the U.S. Treasury.
| | | | | | |
| | | BLACKROCK FUNDS | | JANUARY 31, 2015 | | 71 |
| | |
| Notes to Financial Statements (continued) | | |
Collateralized Debt Obligations: Global Long/Short Credit may invest in collateralized debt obligations (“CDOs”), which include collateralized bond obligations (“CBOs”) and collateralized loan obligations (“CLOs”). CBOs and CLOs are types of asset-backed securities. A CDO is an entity that is backed by a diversified pool of debt securities (CBOs) or syndicated bank loans (CLOs). The cash flows of the CDO can be split into multiple segments, called “tranches,” which will vary in risk profile and yield. The riskiest segment is the subordinated or “equity” tranche. This tranche bears the greatest risk of defaults from the underlying assets in the CDO and serves to protect the other, more senior, tranches from default in all but the most severe circumstances. Since it is shielded from defaults by the more junior tranches, a “senior” tranche will typically have higher credit ratings and lower yields than their underlying securities, and often receive investment grade ratings from one or more of the nationally recognized rating agencies. Despite the protection from the more junior tranches, senior tranches can experience substantial losses due to actual defaults, increased sensitivity to future defaults and the disappearance of one or more protecting tranches as a result of changes in the credit profile of the underlying pool of assets.
Multiple Class Pass-Through Securities: Global Long/Short Credit may invest in multiple class pass-through securities, including collateralized mortgage obligations (“CMOs”) and commercial mortgage-backed securities. These multiple class securities may be issued by Ginnie Mae, U.S. Government agencies or instrumentalities or by trusts formed by private originators of, or investors in, mortgage loans. In general, CMOs are debt obligations of a legal entity that are collateralized by, and multiple class pass-through securities represent direct ownership interests in, a pool of residential or commercial mortgage loans or mortgage pass-through securities (the “Mortgage Assets”), the payments on which are used to make payments on the CMOs or multiple pass-through securities. Classes of CMOs include interest only (“IOs”), principal only (“POs”), planned amortization classes and targeted amortization classes. IOs and POs are stripped mortgage-backed securities representing interests in a pool of mortgages, the cash flow from which has been separated into interest and principal components. IOs receive the interest portion of the cash flow while POs receive the principal portion. IOs and POs can be extremely volatile in response to changes in interest rates. As interest rates rise and fall, the value of IOs tends to move in the same direction as interest rates. POs perform best when prepayments on the underlying mortgages rise since this increases the rate at which the principal is returned and the yield to maturity on the PO. When payments on mortgages underlying a PO are slower than anticipated, the life of the PO is lengthened and the yield to maturity is reduced. If the underlying Mortgage Assets experience greater than anticipated prepayments of principal, Global Long/Short Credit may not fully recoup its initial investment in IOs.
Inflation-Indexed Bonds: Macro Themes may invest in inflation-indexed bonds. Inflation-indexed bonds are fixed income securities whose principal value is periodically adjusted according to the rate of inflation. If the index measuring inflation rises or falls, the principal value of inflation-indexed bonds will be adjusted upward or downward, and consequently the interest payable on these securities (calculated with respect to a larger or smaller principal amount) will be increased or reduced, respectively. Any upward or downward adjustment in the principal amount of an inflation-indexed bond will be included as interest income in the Statements of Operations, even though investors do not receive their principal until maturity. Repayment of the original bond principal upon maturity (as adjusted for inflation) is guaranteed in the case of U.S. Treasury inflation-indexed bonds. For bonds that do not provide a similar guarantee, the adjusted principal value of the bond repaid at maturity may be less than the original principal.
Zero-Coupon Bonds: Global Long/Short Credit may invest in zero-coupon bonds, which are normally issued at a significant discount from face value and do not provide for periodic interest payments. Zero-coupon bonds may experience greater volatility in market value than similar maturity debt obligations which provide for regular interest payments.
Commodity-Linked Notes: Commodity Strategies may invest in commodity-linked notes to provide exposure to the investment returns of the commodities markets, without investing directly in commodities. In a commodity-linked note, Commodity Strategies purchases a note and, in return, the issuer typically provides for an interest payment and a principal payment at maturity linked to the price movement of the underlying commodity index less an agreed-upon fee. These notes may be issued by U.S. and foreign banks, brokerage firms, insurance companies and other corporations. Performance of a particular commodity index will affect the value of the commodity-linked note. The value of the commodity-linked note is generally based on a multiple of the performance of the index. The multiple (or leverage) will increase the volatility of the note’s value relative to the change in the underlying index. In addition to credit, interest rate and counterparty risk typically associated with traditional debt investments, commodity-linked notes are subject to risks affecting the underlying commodity index. The value of the commodity-linked notes may fluctuate by changes in overall market movements, volatility of the underlying benchmark, changes in interest rates or factors affecting a particular industry or commodity, such as drought, floods, weather, livestock disease, embargoes, tariffs and international economic, political and regulatory developments. The commodity-linked notes have an automatic redemption feature if the underlying index declines from the original trade date by the amount specified in the agreement. Commodity Strategies has the option to request prepayment from the issuer at any time. The value of the commodity-linked note, which is marked-to-market daily, is recorded on the Consolidated Statements of Assets and Liabilities. The daily change in value, including any fees to be paid, is included in net change in unrealized appreciation/depreciation on investments on the Consolidated Statements of Operations. Interest accruals are included in interest income on the Consolidated Statements of Operations. Commodity Strategies realizes a gain or loss when a commodity-linked note is sold or matures.
| | | | | | |
| 72 | | BLACKROCK FUNDS | | JANUARY 31, 2015 | | |
| | |
| Notes to Financial Statements (continued) | | |
Capital Trusts and Trust Preferred Securities: Global Long/Short Credit may invest in capital trusts and/or trust preferred securities. These securities are typically issued by corporations, generally in the form of interest-bearing notes with preferred securities characteristics, or by an affiliated business trust of a corporation, generally in the form of beneficial interests in subordinated debentures or similarly structured securities. The securities can be structured as either fixed or adjustable coupon securities that can have either a perpetual or stated maturity date. For trust preferred securities, the issuing bank or corporation will pay interest to the trust, which will then be distributed to holders of the trust preferred securities as a dividend. Dividends can be deferred without creating an event of default or acceleration, although maturity cannot take place unless all cumulative payment obligations have been met. The deferral of payments does not affect the purchase or sale of these securities in the open market. Payments on these securities are treated as interest rather than dividends for federal income tax purposes. These securities generally are rated below that of the issuing company’s senior debt securities and are freely callable at the issuer’s option.
Preferred Stock: Global Long/Short Credit may invest in preferred stock. Preferred stock has a preference over common stock in liquidation (and generally in receiving dividends as well) but is subordinated to the liabilities of the issuer in all respects. As a general rule, the market value of preferred stock with a fixed dividend rate and no conversion element varies inversely with interest rates and perceived credit risk, while the market price of convertible preferred stock generally also reflects some element of conversion value. Because preferred stock is junior to debt securities and other obligations of the issuer, deterioration in the credit quality of the issuer will cause greater changes in the value of a preferred stock than in a more senior debt security with similar stated yield characteristics. Unlike interest payments on debt securities, preferred stock dividends are payable only if declared by the issuer’s board of directors. Preferred stock also may be subject to optional or mandatory redemption provisions.
Floating Rate Loan Interests: Global Long/Short Credit may invest in floating rate loan interests. The floating rate loan interests held by Global Long/ Short Credit are typically issued to companies (the “borrower”) by banks, other financial institutions, and privately and publicly offered corporations (the “lender”). Floating rate loan interests are generally non-investment grade, often involve borrowers whose financial condition is troubled or uncertain and companies that are highly leveraged. Global Long/Short Credit may invest in obligations of borrowers who are in bankruptcy proceedings. Floating rate loan interests may include fully funded term loans or revolving lines of credit. Floating rate loan interests are typically senior in the corporate capital structure of the borrower. Floating rate loan interests generally pay interest at rates that are periodically determined by reference to a base lending rate plus a premium. The base lending rates are generally the lending rate offered by one or more European banks, such as the London Interbank Offered Rate (“LIBOR”), the prime rate offered by one or more U.S. banks or the certificate of deposit rate. Floating rate loan interests may involve foreign borrowers, and investments may be denominated in foreign currencies. Global Long/Short Credit considers these investments to be investments in debt securities for purposes of its investment policies.
When Global Long/Short Credit purchases a floating rate loan interest, it may receive a facility fee and when it sells a floating rate loan interest, it may pay a facility fee. On an ongoing basis, Global Long/Short Credit may receive a commitment fee based on the undrawn portion of the underlying line of credit amount of a floating rate loan interest. Facility and commitment fees are typically amortized to income over the term of the loan or term of the commitment, respectively. Consent and amendment fees are recorded to income as earned. Prepayment penalty fees, which may be received by Global Long/Short Credit upon the prepayment of a floating rate loan interest by a borrower, are recorded as realized gains. Global Long/Short Credit may invest in multiple series or tranches of a loan. A different series or tranche may have varying terms and carry different associated risks.
Floating rate loan interests are usually freely callable at the borrower’s option. Global Long/Short Credit may invest in such loans in the form of participations in loans (“Participations”) or assignments (“Assignments”) of all or a portion of loans from third parties. Participations typically will result in Global Long/Short Credit having a contractual relationship only with the lender, not with the borrower. Global Long/Short Credit will have the right to receive payments of principal, interest and any fees to which it is entitled only from the lender selling the Participation and only upon receipt by the lender of the payments from the borrower. In connection with purchasing Participations, Global Long/Short Credit generally will have no right to enforce compliance by the borrower with the terms of the loan agreement, nor any rights of offset against the borrower, and Global Long/Short Credit may not benefit directly from any collateral supporting the loan in which it has purchased the Participation. As a result, Global Long/Short Credit will assume the credit risk of both the borrower and the lender that is selling the Participation. Global Long/Short Credit’s investment in loan participation interests involves the risk of insolvency of the financial intermediaries who are parties to the transactions. In the event of the insolvency of the lender selling the Participation, Global Long/Short Credit may be treated as a general creditor of the lender and may not benefit from any offset between the lender and the borrower. Assignments typically result in Global Long/Short Credit having a direct contractual relationship with the borrower, and Global Long/ Short Credit may enforce compliance by the borrower with the terms of the loan agreement.
| | | | | | |
| | | BLACKROCK FUNDS | | JANUARY 31, 2015 | | 73 |
| | |
| Notes to Financial Statements (continued) | | |
In connection with floating rate loan interests, Global Long/Short Credit may also enter into unfunded floating rate loan interests (“commitments”). In connection with these commitments, Global Long/Short Credit earns a commitment fee, typically set as a percentage of the commitment amount. Such fee income, which is included in interest income in the Statements of Operations, is recognized ratably over the commitment period. Unfunded floating rate loan interests are marked-to-market daily, and any unrealized appreciation or depreciation is included in the Statements of Assets and Liabilities and Statements of Operations. As of January 31, 2015, Global Long/Short Credit had no outstanding unfunded floating rate loan interests.
Borrowed Bond Agreements: Global Long/Short Credit may enter into borrowed bond agreements. In a borrowed bond agreement, Global Long/Short Credit borrows a bond from a counterparty in exchange for cash collateral. The borrowed bond agreement contains a commitment that the security and the cash will be returned to the counterparty and Global Long/Short Credit at a mutually agreed upon date. Certain agreements have no stated maturity and can be terminated by either party at any time. Borrowed bond agreements are entered into primarily in connection with short sales of bonds. Earnings on cash collateral and compensation to the lender of the bond are based on agreed upon rates between Global Long/Short Credit and the counterparty. The value of the underlying cash collateral approximates the market value and accrued interest of the borrowed bond. To the extent that a borrowed bond transaction exceeds one business day, the value of the cash collateral in the possession of the counterparty is monitored on a daily basis to ensure the adequacy of the collateral. As the market value of the borrowed bond changes, the cash collateral is periodically increased or decreased with a frequency and in amounts prescribed in the borrowed bond agreement. Full realization of the collateral by Global Long/ Short Credit may be limited if the value of an investment purchased with the cash collateral by the lender decreases. Global Long/Short Credit may also experience delays in gaining access to the collateral.
Reverse Repurchase Agreements: Global Long/Short Credit may enter into reverse repurchase agreements with qualified third party broker-dealers. In a reverse repurchase agreement, Global Long/Short Credit sells securities to a bank or broker-dealer and agrees to repurchase the same securities at a mutually agreed upon date and price. During the term of the reverse repurchase agreement, Global Long/Short Credit continues to receive the principal and interest payments on the securities sold. Certain agreements have no stated maturity and can be terminated by either party at any time. Interest on the value of the reverse repurchase agreements issued and outstanding is based upon competitive market rates determined at the time of issuance. Global Long/Short Credit may utilize reverse repurchase agreements when it is anticipated that the interest income to be earned from the investment of the proceeds of the transaction is greater than the interest expense of the transaction. Reverse repurchase agreements involve leverage risk and also the risk that the market value of the securities to be repurchased may decline below the repurchase price.
For financial reporting purposes, cash received in exchange for securities delivered plus accrued interest due to the counterparty is recorded as a liability in the Statements of Assets and Liabilities at face value including accrued interest. Due to the short term nature of the reverse repurchase agreements, face value approximates fair value. Interest payments made by Global Long/Short Credit to the counterparties are recorded as a component of interest expense in the Statements of Operations. In periods of increased demand for the security, Global Long/Short Credit may receive a fee for use of the security by the counterparty, which may result in interest income to Global Long/Short Credit.
For the six months ended January 31, 2015, the average amount of reverse repurchase agreements outstanding and the daily weighted average interest rate for Global Long/Short Credit were $27,964,202 and (0.03)%, respectively.
Borrowed bond agreements and reverse repurchase transactions are entered into by Global Long/Short Credit under Master Repurchase Agreements (each, an “MRA”), which permit Global Long/Short Credit, under certain circumstances, including an event of default (such as bankruptcy or insolvency), to offset payables and/or receivables under the MRA with collateral held and/or posted to the counterparty and create one single net payment due to or from Global Long/Short Credit. With borrowed bond agreements and reverse repurchase transactions, typically Global Long/Short Credit and the counterparties are permitted to sell, re-pledge, or use the collateral associated with the transaction. Bankruptcy or insolvency laws of a particular jurisdiction may impose restrictions on or prohibitions against such a right of offset in the event of the MRA counterparty’s bankruptcy or insolvency. Pursuant to the terms of the MRA, Global Long/Short Credit receives or posts securities as collateral with a market value in excess of the repurchase price to be paid or received by Global Long/Short Credit upon the maturity of the transaction. Upon a bankruptcy or insolvency of the MRA counterparty, Global Long/Short Credit is considered an unsecured creditor with respect to excess collateral and, as such, the return of excess collateral may be delayed.
| | | | | | |
| 74 | | BLACKROCK FUNDS | | JANUARY 31, 2015 | | |
| | |
| Notes to Financial Statements (continued) | | |
As of January 31, 2015, the following table is a summary of Global Long/Short Credit’s open borrowed bond agreements and reverse repurchase agreements by counterparty which are subject to offset under an MRA on a net basis:
| | | | | | | | | | | | | | | | | | | | | | | | | | | | | | | | |
| Counterparty | | Borrowed
Bond
Agreements1 | | | Reverse
Repurchase
Agreements | | | Borrowed Bonds at Value including Accrued Interest2 | | | Net Amount
before Collateral | | | Non-cash
Collateral
Pledged | | | Cash
Collateral
Pledged | | | Net Collateral
(Received)
Pledged | | | Net Exposure
Due (to)/from
Counterparty3 | |
Barclays Bank PLC | | $ | 7,252,085 | | | | — | | | $ | (7,250,405 | ) | | $ | 1,680 | | | | — | | | | — | | | | — | | | $ | 1,680 | |
Barclays Capital, Inc. | | | 164,944,506 | | | | — | | | | (170,005,281 | ) | | | (5,060,775 | ) | | $ | 5,252,628 | | | | — | | | $ | 5,252,628 | | | | 191,853 | |
BNP Paribas Securities Corp. | | | 71,023,669 | | | | — | | | | (71,240,039 | ) | | | (216,370 | ) | | | — | | | | — | | | | — | | | | (216,370 | ) |
Citigroup Global Markets, Inc. | | | 196,515,207 | | | | — | | | | (203,491,132 | ) | | | (6,975,925 | ) | | | 5,814,879 | | | | — | | | | 5,814,879 | | | | (1,161,046 | ) |
Credit Suisse Securities (USA) LLC | | | 301,748,398 | | | $ | (201,906,229 | ) | | | (316,772,192 | ) | | | (216,930,023 | ) | | | 216,220,709 | | | | — | | | | 216,220,709 | | | | (709,314 | ) |
Deutsche Bank Securities, Inc. | | | 31,091,581 | | | | — | | | | (31,982,097 | ) | | | (890,516 | ) | | | 510,822 | | | | — | | | | 510,822 | | | | (379,694 | ) |
J.P. Morgan Securities LLC | | | 148,762,538 | | | | (60,150,602 | ) | | | (153,030,259 | ) | | | (64,418,323 | ) | | | 62,793,378 | | | $ | 651,000 | | | | 63,444,378 | | | | (973,945 | ) |
JPMorgan Chase Bank N.A. | | | 23,430,221 | | | | — | | | | (23,342,261 | ) | | | 87,960 | | | | — | | | | — | | | | — | | | | 87,960 | 4 |
Merrill Lynch, Pierce, Fenner & Smith, Inc. | | | 139,235,946 | | | | (55,544,279 | ) | | | (142,897,093 | ) | | | (59,205,426 | ) | | | 58,911,170 | | | | — | | | | 58,911,170 | | | | (294,256 | ) |
RBC Capital Markets, LLC | | | 131,995,425 | | | | — | | | | (136,280,832 | ) | | | (4,285,407 | ) | | | 2,855,582 | | | | — | | | | 2,855,582 | | | | (1,429,825 | ) |
| | | | |
Total | | $ | 1,215,999,576 | | | $ | (317,601,110 | ) | | $ | (1,256,291,591 | ) | | $ | (357,893,125 | ) | | $ | 352,359,168 | | | $ | 651,000 | | | $ | 353,010,168 | | | $ | (4,882,957 | ) |
| | | | |
| | 1 | | Included in Investments at value — unaffiliated in the Statements of Assets and Liabilities. |
| | 2 | | Includes accrued interest on borrowed bonds in the amount of $9,932,591 which is included in interest expense payable in the Statements of Assets and Liabilities. |
| | 3 | | Net exposure represents the net receivable (payable) that would be due from/to the counterparty in the event of default. |
| | 4 | | Net receivable is subject to set-off provision with net payable under the ISDA Master Agreement. |
When Global Long/Short Credit enters into an MRA and an ISDA and/or MSLA with the same counterparty, the agreements may contain a set-off provision allowing a fund to offset a net amount payable with a net amount receivable upon default of the counterparty. Bankruptcy or insolvency laws of a particular jurisdiction may restrict or prohibit the right of offset in bankruptcy, insolvency or other events. For example, regardless of the contractual rights included in an MRA, such laws may prohibit Global Long/Short Credit from setting off amounts owed to a defaulting counterparty under an MRA against amounts owed to Global Long/Short Credit by affiliates of the defaulting counterparty. However, the insolvency regimes of many jurisdictions generally permit set-off of simultaneous payables and receivables with the same legal entity under certain types of financial contracts. These rules would apply upon a default of the legal entity, regardless of the existence of a contractual set-off right in those contracts.
In the event the counterparty of securities under an MRA files for bankruptcy or becomes insolvent, Global Long/Short Credit’s use of the proceeds from the agreement may be restricted while the counterparty, or its trustee or receiver, determines whether or not to enforce Global Long/Short Credit’s obligation to repurchase the securities.
Short Sales (Borrowed Bonds): Global Long/Short Credit may enter into short sale transactions in which Global Long/Short Credit sells a security it does not hold in anticipation of a decline in the market price of that security. When Global Long/Short Credit makes a short sale, it will borrow the security sold short (borrowed bond) and deliver the security to the counterparty to which it sold the security short. An amount equal to the proceeds received by Global Long/Short Credit is reflected as an asset and an equivalent liability. The amount of the liability is subsequently marked-to-market to reflect the market value of the short sale. Global Long/Short Credit is required to repay the counterparty interest on the security sold short, which is shown as interest expense in the Statements of Operations. Global Long/Short Credit is exposed to market risk based on the amount, if any, that the market value of the security increases beyond the market value at which the position was sold. Thus, a short sale of a security involves the risk that instead of declining, the price of the security sold short will rise. The short sale of securities involves the possibility of a theoretically unlimited loss since there is a theoretically unlimited potential for the market price of the security sold short to increase. A gain, limited to the price at which Global Long/Short Credit sold the security short, or a loss, unlimited as to the dollar amount, will be recognized upon the termination of a short sale if the market price is either less than or greater than the proceeds originally received. There is no assurance Global Long/Short Credit will be able to close out a short position at a particular time or at an acceptable price.
| | | | | | |
| | | BLACKROCK FUNDS | | JANUARY 31, 2015 | | 75 |
| | |
| Notes to Financial Statements (continued) | | |
Short Sales (Investments Sold Short): Global Long/Short Credit may enter into short sale transactions in which Global Long/Short Credit sells a security it does not hold in anticipation of a decline in the market price of that security. When Global Long/Short Credit makes a short sale, it will borrow the security sold short and deliver cash to the counterparty to which it sold the security short. An amount equal to the proceeds received by the Fund is reflected as an asset and an equivalent liability. The amount of the liability is subsequently marked-to-market to reflect the market value of the short sale. Global Long/Short Credit is required to repay the counterparty any dividends received on the security sold short, which is shown as dividend expense in the Statement of Operations. Global Long/Short Credit may pay a fee on the assets borrowed from the counterparty, which is shown as stock loan fees in the Statement of Operations. Global Long/Short Credit maintains a segregated account of securities or deposits cash with the broker-dealer as collateral for the short sales. Global Long/Short Credit may receive interest on the cash collateral deposited with the broker-dealer. Global Long/Short Credit is exposed to market risk based on the amount, if any, that the market value of the security increases beyond the market value at which the position was sold. Thus, a short sale of a security involves the risk that instead of declining, the price of the security sold short will rise. The short sale of securities involves the possibility of a theoretically unlimited loss since there is a theoretically unlimited potential for the market price of the security sold short to increase. A gain, limited to the price at which Global Long/Short Credit sold the security short, or a loss, unlimited as to the dollar amount, will be recognized upon the termination of a short sale if the market price is either less than or greater than the proceeds originally received. There is no assurance Global Long/Short Credit will be able to close out a short position at a particular time or at an acceptable price.
Securities Lending: Commodity Strategies may lend its securities to approved borrowers, such as brokers, dealers and other financial institutions. The borrower pledges and maintains with Commodity Strategies collateral consisting of cash, an irrevocable letter of credit issued by a bank, or securities issued or guaranteed by the U.S. government. The initial collateral received by Commodity Strategies is required to have a value of at least 102% of the current value of the loaned securities for securities traded on U.S. exchanges and a value of at least 105% for all other securities. The collateral is maintained thereafter at a value equal to at least 100% of the current market value of the securities on loan. The market value of the loaned securities is determined at the close of each business day of Commodity Strategies and any additional required collateral is delivered to Commodity Strategies on the next business day. During the term of the loan, Commodity Strategies is entitled to all distributions made on or in respect of the loaned securities. Loans of securities are terminable at any time and the borrower, after notice, is required to return borrowed securities within the standard time period for settlement of securities transactions.
The market value of securities on loan and the value of the related collateral are shown separately in the Statements of Assets and Liabilities as a component of investments at value — unaffiliated, and collateral on securities loaned at value, respectively. As of January 31, 2015, any securities on loan were collateralized by cash. The cash collateral invested by the securities lending agent, BlackRock Investment Management, LLC (“BIM”), if any, is disclosed in the Schedules of Investments.
Securities lending transactions are entered into by Commodity Strategies under Master Securities Lending Agreements (each, an “MSLA”) which provide the right, in the event of default (including bankruptcy or insolvency), for the non-defaulting party to liquidate the collateral and calculate a net exposure to the defaulting party or request additional collateral. In the event that a borrower defaults, Commodity Strategies, as lender, would offset the market value of the collateral received against the market value of the securities loaned. When the value of the collateral is greater than that of the market value of the securities loaned, the lender is left with a net amount payable to the defaulting party. However, bankruptcy or insolvency laws of a particular jurisdiction may impose restrictions on or prohibitions against such a right of offset in the event of an MSLA counterparty’s bankruptcy or insolvency. Under the MSLA, the borrower can resell or re-pledge the loaned securities, and Commodity Strategies can reinvest cash collateral, or, upon an event of default, resell or re-pledge the collateral.
The risks of securities lending include the risk that the borrower may not provide additional collateral when required or may not return the securities when due. To mitigate these risks, Commodity Strategies benefits from a borrower default indemnity provided by BIM. BIM’s indemnity allows for full replacement of the securities lent if the collateral received does not cover the value on the securities loaned in the event of borrower default. Commodity Strategies could suffer a loss if the value of an investment purchased with cash collateral falls below the market value of loaned securities or if the value of an investment purchased with cash collateral falls below the value of the original cash collateral received.
4. Derivative Financial Instruments:
The Funds engage in various portfolio investment strategies using derivative contracts both to increase the returns of the Funds and/or to economically hedge their exposure to certain risks such as credit risk, equity risk, interest rate risk or foreign currency exchange rate risk. These contracts may be transacted on an exchange or OTC.
| | | | | | |
| 76 | | BLACKROCK FUNDS | | JANUARY 31, 2015 | | |
| | |
| Notes to Financial Statements (continued) | | |
Financial Futures Contracts: Global Long/Short Credit and Macro Themes invest in long and/or short positions in financial futures contracts and options on financial futures contracts to gain exposure to, or economically hedge against, changes in interest rates (interest rate risk) or changes in the value of equity securities (equity risk). Financial futures contracts are agreements between Global Long/Short Credit and Macro Themes and a counterparty to buy or sell a specific quantity of an underlying instrument at a specified price and at a specified date. Depending on the terms of the particular contract, financial futures contracts are settled either through physical delivery of the underlying instrument on the settlement date or by payment of a cash settlement amount on the settlement date.
Upon entering into a financial futures contract, Global Long/Short Credit and Macro Themes are required to deposit initial margin with the broker in the form of cash or securities in an amount that varies depending on a contract’s size and risk profile. The initial margin deposit must then be maintained at an established level over the life of the contract. Securities deposited as initial margin are designated on the Schedules of Investments and cash deposited, if any, is recorded on the Statements of Assets and Liabilities as cash pledged for financial futures contracts. Pursuant to the contract, Global Long/Short Credit and Macro Themes agree to receive from or pay to the broker an amount of cash equal to the daily fluctuation in value of the contract. Such receipts or payments are known as variation margin. Variation margin is recorded by Global Long/Short Credit and Macro Themes as unrealized appreciation or depreciation and, if applicable, as a receivable or payable for variation margin in the Statements of Assets and Liabilities.
When the contract is closed, Global Long/Short Credit and Macro Themes record a realized gain or loss equal to the difference between the value of the contract at the time it was opened and the value at the time it was closed. The use of financial futures contracts involves the risk of an imperfect correlation in the movements in the price of financial futures contracts or interest rates and the underlying assets.
Forward Foreign Currency Exchange Contracts: The Funds enter into forward foreign currency exchange contracts as an economic hedge against either specific transactions or portfolio instruments or to obtain exposure to, or hedge exposure away from, foreign currencies (foreign currency exchange rate risk). A forward foreign currency exchange contract is an agreement between two parties to buy and sell a currency at a set exchange rate on a future date. Forward foreign currency exchange contracts, when used by the Funds, help to manage the overall exposure to the currencies in which some of the investments held by the Funds are denominated. The contract is marked-to-market daily and the change in market value is recorded by the Funds as an unrealized gain or loss. When the contract is closed, the Funds record a realized gain or loss equal to the difference between the value at the time it was opened and the value at the time it was closed. The use of forward foreign currency exchange contracts involves the risk that the value of a forward foreign currency exchange contract changes unfavorably due to movements in the value of the referenced foreign currencies.
Options: Global Long/Short Credit and Macro Themes purchase and write call and put options to increase or decrease their exposure to underlying instruments (including credit risk and/or equity risk) and/or, in the case of options written, to generate gains from options premiums. A call option gives the purchaser (holder) of the option the right (but not the obligation) to buy, and obligates the seller (writer) to sell (when the option is exercised) the underlying instrument at the exercise or strike price at any time or at a specified time during the option period. A put option gives the holder the right to sell and obligates the writer to buy the underlying instrument at the exercise or strike price at any time or at a specified time during the option period. When Global Long/Short Credit or Macro Themes purchase (write) an option, an amount equal to the premium paid (received) by Global Long/ Short Credit or Macro Themes are reflected as an asset (liability). The amount of the asset (liability) is subsequently marked-to-market to reflect the current market value of the option purchased (written). When an instrument is purchased or sold through an exercise of an option, the related premium paid (or received) is added to (or deducted from) the basis of the instrument acquired or deducted from (or added to) the proceeds of the instrument sold. When an option expires (or Global Long/Short Credit or Macro Themes enter into a closing transaction), Global Long/Short Credit or Macro Themes realize a gain or loss on the option to the extent of the premiums received or paid (or gain or loss to the extent the cost of the closing transaction exceeds the premiums received or paid). When Global Long/Short Credit or Macro Themes write a call option, such option is “covered,” meaning that Global Long/Short Credit or Macro Themes hold the underlying instrument subject to being called by the option counterparty. When Global Long/ Short Credit or Macro Themes write a put option, such option is covered by cash in an amount sufficient to cover the obligation.
Options on swaps (“swaptions”) are similar to options on securities except that instead of selling or purchasing the right to buy or sell a security, the writer or purchaser of the swaptions is granting or buying the right to enter into a previously agreed upon interest rate or credit default swap agreement (interest rate risk and/or credit risk) at any time before the expiration of the option.
| | | | | | |
| | | BLACKROCK FUNDS | | JANUARY 31, 2015 | | 77 |
| | |
| Notes to Financial Statements (continued) | | |
Global Long/Short Credit and Macro Themes also purchase or sell listed or OTC foreign currency options, foreign currency futures and related options on foreign currency futures as a short or long hedge against possible variations in foreign exchange rates or to gain exposure to foreign currencies (foreign currency exchange rate risk). When foreign currency is purchased or sold through an exercise of a foreign currency option, the related premium paid (or received) is added to (or deducted from) the basis of the foreign currency acquired or deducted from (or added to) the proceeds of the foreign currency sold (receipts from the foreign currency purchased). Such transactions may be effected with respect to hedges on non-U.S. dollar denominated instruments owned by Global Long/Short Credit or Macro Themes but not yet delivered, or committed or anticipated to be purchased by Global Long/Short Credit or Macro Themes.
In purchasing and writing options, Global Long/Short Credit or Macro Themes bear the risk of an unfavorable change in the value of the underlying instrument or the risk that Global Long/Short Credit or Macro Themes may not be able to enter into a closing transaction due to an illiquid market. Exercise of a written option could result in Global Long/Short Credit or Macro Themes purchasing or selling a security when it otherwise would not, or at a price different from the current market value.
For the six months ended January 31, 2015, transactions in options written including swaptions and currency options were as follows:
| | | | | | | | | | | | | | | | | | | | | | | | |
| Global Long/Short Credit | | | | | | |
| | | Calls | | | Puts | |
| | | Contracts | | | Notional Value
(000)1 | | | Premiums
Received | | | Contracts | | | Notional Value
(000)1 | | | Premiums
Received | |
| | | | | |
Outstanding options, beginning of period | | | 1,500 | | | | — | | | $ | 52,440 | | | | 3,706 | | | | — | | | $ | 291,269 | |
Options written | | | 2,000 | | | | — | | | | 171,995 | | | | 76,907 | | | | — | | | | 5,125,556 | |
Options expired | | | (1,000 | ) | | | — | | | | (100,035 | ) | | | (26,798 | ) | | | — | | | | (1,452,429 | ) |
Options closed | | | (2,500 | ) | | | — | | | | (124,400 | ) | | | (44,565 | ) | | | — | | | | (3,661,854 | ) |
| | | | | | | | |
Outstanding options, end of period | | | — | | | | — | | | | — | | | | 9,250 | | | | — | | | $ | 302,542 | |
| | | | | | | | |
| | | | | | | | | | | | | | | | | | | | | | | | |
| Macro Themes | | | | | | |
Outstanding options, beginning of period | | | — | | | | — | | | | — | | | | — | | | | — | | | | — | |
Options written | | | 11,826 | | | | 54,300 | | | $ | 158,143 | | | | 34,626 | | | | 1,800 | | | $ | 170,349 | |
Options expired | | | — | | | | (50,000 | ) | | | (46,250 | ) | | | (28 | ) | | | — | | | | (5,217 | ) |
Options closed | | | (11,745 | ) | | | — | | | | (79,481 | ) | | | (11,589 | ) | | | — | | | | (68,817 | ) |
| | | | | | | | |
Outstanding options, end of period | | | 81 | | | | 4,300 | | | $ | 32,412 | | | | 23,009 | | | | 1,800 | | | $ | 96,315 | |
| | | | | | | | |
| | | | | | | | | | | | | | | | | | | | | | | | |
| | | | | | | | | | | | | | | | | | | | | | | | | |
| | 1 | | Amount shown is in currency in which the transaction was denominated. |
Swaps: Global Long/Short Credit and Macro Themes enter into swap agreements in which Global Long/Short Credit and Macro Themes and a counterparty agree either to make periodic net payments on a specified notional amount or a net payment upon termination. Swap agreements are privately negotiated in the OTC market and may be entered into as a bilateral contract (“OTC swaps”) or centrally cleared (“centrally cleared swaps”). Swaps are marked-to-market daily and changes in value are recorded as unrealized appreciation (depreciation).
For OTC swaps, any upfront premiums paid are recorded as assets and any upfront fees received are recorded as liabilities and are shown as swap premiums paid and swap premiums received, respectively, in the Statements of Assets and Liabilities and amortized over the term of the OTC swap. Payments received or made by Global Long/Short Credit and Macro Themes for OTC swaps are recorded in the Statements of Operations as realized gains or losses, respectively. When an OTC swap is terminated, Global Long/Short Credit and Macro Themes will record a realized gain or loss equal to the difference between the proceeds from (or cost of) the closing transaction and Global Long/Short Credit and Macro Themes’ basis in the contract, if any. Generally, the basis of the contract is the premium received or paid.
| | | | | | |
| 78 | | BLACKROCK FUNDS | | JANUARY 31, 2015 | | |
| | |
| Notes to Financial Statements (continued) | | |
In a centrally cleared swap, immediately following execution of the swap agreement, the swap agreement is novated to a central counterparty (the “CCP”) and Global Long/Short Credit’s or Macro Themes’ counterparty on the swap agreement becomes the CCP. Global Long/Short Credit and Macro Themes are required to interface with the CCP through a broker. Upon entering into a centrally cleared swap, Global Long/Short Credit and Macro Themes are required to deposit initial margin with the broker in the form of cash or securities in an amount that varies depending on the size and risk profile of the particular swap. Securities deposited as initial margin are designated on the Schedules of Investments and cash deposited is recorded on the Statements of Assets and Liabilities as cash pledged for centrally cleared swaps. The daily change in valuation of centrally cleared swaps is recorded as a receivable or payable for variation margin in the Statements of Assets and Liabilities. Payments received from (paid to) the counterparty, including at termination, are recorded as realized gain (loss) in the Statements of Operations.
Swap transactions involve, to varying degrees, elements of interest rate, credit and market risk in excess of the amounts recognized in the Statements of Assets and Liabilities. Such risks involve the possibility that there will be no liquid market for these agreements, that the counterparty to the agreements may default on its obligation to perform or disagree as to the meaning of the contractual terms in the agreements, and that there may be unfavorable changes in interest rates and/or market values associated with these transactions.
| Ÿ | | Credit default swaps — Global Long/Short Credit enters into credit default swaps to manage its exposure to the market or certain sectors of the market, to reduce its risk exposure to defaults of corporate and/or sovereign issuers or to create exposure to corporate and/or sovereign issuers to which it is not otherwise exposed (credit risk). Global Long/Short Credit may either buy or sell (write) credit default swaps on single-name issuers (corporate or sovereign), a combination or basket of single-name issuers or traded indexes. Credit default swaps on single-name issuers are agreements in which the protection buyer pays fixed periodic payments to the seller in consideration for a guarantee from the protection seller to make a specific payment should a negative credit event take place with respect to the referenced entity (e.g., bankruptcy, failure to pay, obligation accelerators, repudiation, moratorium or restructuring). Credit default swaps on traded indexes are agreements in which the buyer pays fixed periodic payments to the seller in consideration for a guarantee from the seller to make a specific payment should a write-down, principal or interest shortfall or default of all or individual underlying securities included in the index occur. As a buyer, if an underlying credit event occurs, Global Long/Short Credit will either (i) receive from the seller an amount equal to the notional amount of the swap and deliver the referenced security or underlying securities comprising the index, or (ii) receive a net settlement of cash equal to the notional amount of the swap less the recovery value of the security or underlying securities comprising the index. As a seller (writer), if an underlying credit event occurs, Global Long/Short Credit will either pay the buyer an amount equal to the notional amount of the swap and take delivery of the referenced security or underlying securities comprising the index or pay a net settlement of cash equal to the notional amount of the swap less the recovery value of the security or underlying securities comprising the index. |
| Ÿ | | Total return swaps — Global Long/Short Credit and Macro Themes enter into total return swaps to obtain exposure to a security or market without owning such security or investing directly in that market or to transfer the risk/return of one market (e.g., fixed income) to another market (e.g., equity or commodity prices) (equity risk, commodity price risk and/or interest rate risk). Total return swaps are agreements in which there is an exchange of cash flows whereby one party commits to make payments based on the total return (coupons plus capital gains/losses) of an underlying instrument in exchange for fixed or floating rate interest payments. To the extent the total return of the instrument or index underlying the transaction exceeds or falls short of the offsetting interest rate obligation, Global Long/Short Credit and Macro Themes will receive a payment from or make a payment to the counterparty. |
| Ÿ | | Interest rate swaps — Global Long/Short Credit and Macro Themes enter into interest rate swaps to gain or reduce exposure to interest rates or to manage duration, the yield curve or interest rate risk by economically hedging the value of the fixed rate bonds, which may decrease when interest rates rise (interest rate risk). Interest rate swaps are agreements in which one party pays a stream of interest payments, either fixed or floating, for another party’s stream of interest payments, either fixed or floating, on the same notional amount for a specified period of time. In more complex swaps, the notional principal amount may decline (or amortize) over time. |
| | | | | | |
| | | BLACKROCK FUNDS | | JANUARY 31, 2015 | | 79 |
| | |
| Notes to Financial Statements (continued) | | |
The following is a summary of the Funds’ derivative financial instruments categorized by risk exposure:
| | | | | | | | | | | | | | | | | | | | |
| Fair Values of Derivative Financial Instruments as of January 31, 2015 | |
| | | | | Global Long/Short Credit | | | | | Macro Themes | |
| | | | | Value | |
| | | Statements of Assets and Liabilities Location | | Derivative
Assets | | | Derivative
Liabilities | | | | | Derivative
Assets | | | Derivative
Liabilities | |
Interest rate contracts | | Net unrealized appreciation/depreciation1 | | $ | 418,578 | | | $ | 47,999,579 | | | | | $ | 139,723 | | | $ | 122,837 | |
Foreign currency exchange contracts | | Unrealized appreciation/depreciation on forward foreign currency exchange contracts | | | 244,261,631 | | | | 2,394,666 | | | | | | 1,284,671 | | | | 1,061,627 | |
Credit contracts | | Net unrealized appreciation/depreciation1; Unrealized appreciation/depreciation on OTC swaps; Swap premiums received/paid; Investments at value — unaffiliated2 | | | 32,505,458 | | | | 39,512,984 | | | | | | — | | | | — | |
Equity contracts | | Net unrealized appreciation/depreciation1; Unrealized appreciation/depreciation on OTC swaps; Investments at value — unaffiliated2 | | | 7,406,979 | | | | 14,005,436 | | | | | | 434,729 | | | | 400,262 | |
Commodity contracts | | Unrealized appreciation/depreciation on OTC swaps | | | 681,088 | | | | 23,837 | | | | | | — | | | | — | |
Total | | | | $ | 285,273,734 | | | $ | 103,936,502 | | | | | $ | 1,859,123 | | | $ | 1,584,726 | |
| | | | | | |
| | 1 | | Includes cumulative appreciation/depreciation on financial futures contracts and centrally cleared swaps, if any, as reported in the Schedules of Investments. Only current day’s variation margin is reported within the Statements of Assets and Liabilities. |
| | 2 | | Includes options purchased at value as reported in the Schedules of Investments. |
| | | | | | | | | | | | | | | | | | | | | | | | | | |
The Effect of Derivative Financial Instruments in the Statements of Operations Period Ended January 31, 2015 | |
| | | Net Realized Gain (Loss) from | | | | | Net Change in Unrealized
Appreciation/Depreciation on | |
| | | Commodity
Strategies | | | Global
Long/Short
Credit | | | Macro
Themes | | | | | Commodity
Strategies | | | Global
Long/Short
Credit | | | Macro
Themes | |
Interest rate contracts: | | | | | | | | | | | | | | | | | | | | | | | | | | |
Financial futures contracts | | | — | | | $ | (53,135,735 | ) | | $ | 87,258 | | | | | | — | | | $ | (7,556,046 | ) | | $ | (25,533 | ) |
Swaps | | | — | | | | (35,610,771 | ) | | | (21,489 | ) | | | | | — | | | | (199,570 | ) | | | 42,419 | |
Options3 | | | — | | | | (2,093,662 | ) | | | — | | | | | | — | | | | (416,136 | ) | | | (23,014 | ) |
Foreign currency exchange contracts: | | | | | | | | | | | | | | | | | | | | | | | | | | |
Foreign currency transactions/translations | | $ | 90 | | | | 242,922,664 | | | | 183,964 | | | | | | | | | | 195,782,522 | | | | 255,391 | |
Options3 | | | — | | | | — | | | | — | | | | | | — | | | | — | | | | (26,640 | ) |
Credit contracts: | | | | | | | | | | | | | | | | | | | | | | | | | | |
Swaps | | | — | | | | (3,012,963 | ) | | | — | | | | | | — | | | | (6,354,977 | ) | | | — | |
Options3 | | | — | | | | (831,259 | ) | | | — | | | | | | — | | | | — | | | | — | |
Equity contracts: | | | | | | | | | | | | | | | | | | | | | | | | | | |
Financial futures contracts | | | — | | | | 1,526,884 | | | | — | | | | | | — | | | | 3,294,417 | | | | (190,091 | ) |
Swaps | | | — | | | | 16,803,050 | | | | 1,728 | | | | | | — | | | | (21,809,620 | ) | | | 128,786 | |
Options3 | | | — | | | | 3,151,968 | | | | 14,799 | | | | | | — | | | | (418,780 | ) | | | (13,966 | ) |
Commodity contracts: | | | | | | | | | | | | | | | | | | | | | | | | | | |
Swaps | | | — | | | | — | | | | — | | | | | | — | | | | 657,251 | | | | — | |
| | | | |
Total | | $ | 90 | | | $ | 169,720,176 | | | $ | 266,260 | | | | | | — | | | $ | 162,979,061 | | | $ | 147,352 | |
| | | | |
| | 3 | | Options purchased are included in the net realized gain (loss) from investments and net change in unrealized appreciation/depreciation on investments. |
| | | | | | |
| 80 | | BLACKROCK FUNDS | | JANUARY 31, 2015 | | |
| | |
| Notes to Financial Statements (continued) | | |
For the period ended January 31, 2015, the average quarterly balances of outstanding derivative financial instruments were as follows:
| | | | | | | | | | | | |
| | | Commodity
Strategies | | | Global
Long/Short
Credit | | | Macro
Themes | |
Financial futures contracts: | | | | | | | | | | | | |
Average notional value of contracts - long | | | — | | | $ | 6,732,565 | | | $ | 8,673,868 | |
Average notional value of contracts - short | | | — | | | $ | 1,600,143,911 | | | $ | 11,910,343 | |
Interest rate swaps: | | | | | | | | | | | | |
Average notional value - pays fixed rate | | | — | | | $ | 234,838,394 | | | | — | |
Average notional value - receives fixed rate | | | — | | | | — | | | $ | 3,637,740 | |
Forward foreign currency exchange contracts: | | | | | | | | | | | | |
Average amounts purchased - in USD | | | — | | | $ | 1,516,031,598 | | | $ | 40,514,893 | |
Average amounts sold - in USD | | $ | 325,423 | 4 | | $ | 167,221,414 | | | $ | 19,657,726 | |
Options: | | | | | | | | | | | | |
Average value of option contracts purchased | | | — | | | $ | 1,496,949 | | | $ | 155,149 | |
Average value of option contracts written | | | — | | | $ | 137,623 | | | $ | 91,724 | |
Average notional value of swaption contracts purchased | | | — | | | $ | 355,275,149 | | | | — | |
Credit default swaps: | | | | | | | | | | | | |
Average notional value - buy protection | | | — | | | $ | 1,708,843,920 | | | | — | |
Average notional value - sell protection | | | — | | | $ | 376,743,015 | | | | — | |
Total return swaps: | | | | | | | | | | | | |
Average notional value | | | — | | | $ | 343,655,245 | | | $ | 10,896,562 | |
| | 4 | | Actual amounts for the period are shown due to limited outstanding derivative financial instruments as of each quarter. |
Counterparty Credit Risk: A derivative contract may suffer a mark-to-market loss if the value of the contract decreases due to an unfavorable change in the market rates or values of the underlying instrument. Losses can also occur if the counterparty does not perform under the contract.
Global Long/Short Credit’s and Macro Themes’ risk of loss from counterparty credit risk on OTC derivatives is generally limited to the aggregate unrealized gain netted against any collateral held by Global Long/Short Credit and Macro Themes. For OTC options purchased, Global Long/Short Credit and Macro Themes bear the risk of loss of the amount of the premiums paid plus the positive change in market values net of any collateral held by Global Long/Short Credit and Macro Themes should the counterparty fail to perform under the contracts. Options written by Global Long/Short Credit and Macro Themes do not typically give rise to counterparty credit risk, as options written generally obligates Global Long/Short Credit and Macro Themes, and not the counterparty, to perform.
With exchange-traded options purchased and futures and centrally cleared swaps, there is less counterparty credit risk to the Funds since the exchange or clearinghouse, as counterparty to such instruments, guarantees against a possible default. The clearinghouse stands between the buyer and the seller of the contract; therefore, credit risk is limited to failure of the clearinghouse. While offset rights may exist under applicable law, the Funds do not have a contractual right of offset against a clearing broker or clearinghouse in the event of a default (including the bankruptcy or insolvency) of the clearing broker or clearinghouse. Additionally, credit risk exists in exchange-traded futures and centrally cleared swaps with respect to initial and variation margin that is held in a clearing broker’s customer accounts. While clearing brokers are required to segregate customer margin from their own assets, in the event that a clearing broker becomes insolvent or goes into bankruptcy and at that time there is a shortfall in the aggregate amount of margin held by the clearing broker for all its clients, typically the shortfall would be allocated on a pro rata basis across all the clearing broker’s customers, potentially resulting in losses to the Funds.
In order to better define its contractual rights and to secure rights that will help the Funds mitigate their counterparty risk, a Fund may enter into an International Swaps and Derivatives Association, Inc. Master Agreement (“ISDA Master Agreement”) or similar agreement with its counterparties. An ISDA Master Agreement is a bilateral agreement between each Fund and a counterparty that governs certain OTC derivatives and typically contains, among other things, collateral posting terms and netting provisions in the event of a default and/or termination event. Under an ISDA Master Agreement, the Funds may, under certain circumstances, offset with the counterparty certain derivative financial instruments’ payables and/or receivables with collateral held and/or posted and create one single net payment. The provisions of the ISDA Master Agreement typically permit a single net payment in the event of default including the bankruptcy or insolvency of the counterparty. Bankruptcy or insolvency laws of a particular jurisdiction may restrict or prohibit the right of offset in bankruptcy, insolvency or other events. In addition, certain ISDA Master Agreements allow counterparties to terminate derivative contracts prior to maturity in the event a Fund’s net assets decline by a stated percentage or a Fund fails to meet the terms of its ISDA Master Agreements. The result would cause a Fund to accelerate payment of any net liability owed to the counterparty.
Collateral Requirements: For derivatives traded under an ISDA Master Agreement, the collateral requirements are typically calculated by netting the mark-to-market amount for each transaction under such agreement and comparing that amount to the value of any collateral currently pledged by the Funds and the counterparty.
| | | | | | |
| | | BLACKROCK FUNDS | | JANUARY 31, 2015 | | 81 |
| | |
| Notes to Financial Statements (continued) | | |
Cash collateral that has been pledged to cover obligations of the Funds and cash collateral received from the counterparty, if any, is reported separately on the Statements of Assets and Liabilities as cash pledged as collateral and cash received as collateral, respectively. Non-cash collateral pledged by the Funds, if any, is noted in the Schedules of Investments. Generally, the amount of collateral due from or to a party has to exceed a minimum transfer amount threshold (typically either $250,000 or $500,000) before a transfer is required, which is determined at the close of business of the Funds. Any additional required collateral is delivered to/pledged by the Funds on the next business day. Typically, the Funds and counterparties are not permitted to sell, re-pledge or use the collateral they receive. To the extent amounts due to the Funds from its counterparties are not fully collateralized, the Funds bear the risk of loss from counterparty non-performance. Likewise, to the extent the Funds have delivered collateral to a counterparty and stands ready to perform under the terms of its agreements with such counterparty, the Funds bear the risk of loss from a counterparty in the amount of the value of the collateral in the event the counterparty fails to return such collateral.
For financial reporting purposes, the Funds do not offset derivative assets and derivative liabilities that are subject to netting arrangements, if any, in the Statements of Assets and Liabilities.
As of January 31, 2015, the Funds’ derivative assets and liabilities (by type) are as follows:
| | | | | | | | | | | | | | | | |
| | | Global Long/Short Credit | | | Macro Themes | |
| | | Assets | | | Liabilities | | | Assets | | | Liabilities | |
Derivative Financial Instruments: | | | | | | | | | | | | | | | | |
Financial futures contracts | | $ | 1,076,294 | | | $ | 5,362,143 | | | $ | 71,103 | | | $ | 65,746 | |
Forward foreign currency exchange contracts | | | 244,261,631 | | | | 2,394,666 | | | | 1,267,155 | | | | 1,011,764 | |
Options | | | 2,162,110 | 1 | | | 166,000 | | | | 155,149 | 1 | | | 91,724 | |
Swaps — Centrally cleared | | | 869,390 | | | | — | | | | — | | | | — | |
Swaps — OTC2 | | | 37,073,915 | | | | 52,682,330 | | | | 277,849 | | | | 106,644 | |
| | | | |
Total derivative assets and liabilities in the Statements of Assets and Liabilities | | $ | 285,443,340 | | | $ | 60,605,139 | | | $ | 1,771,256 | | | $ | 1,275,878 | |
Derivatives not subject to a Master Netting Agreement or similar agreement (“MNA”) | | | (3,702,429 | ) | | | (5,528,143 | ) | | | (144,057 | ) | | | (88,931 | ) |
| | | | |
Total derivatives assets and liabilities subject to an MNA | | $ | 281,740,911 | | | $ | 55,076,996 | | | $ | 1,627,199 | | | $ | 1,186,947 | |
| | | | |
| | 1 | | Includes options purchased at value which are included as Investments at value — unaffiliated in the Statements of Assets and Liabilities and reported in the Schedules of Investments. |
| | 2 | | Includes unrealized appreciation/depreciation on OTC swaps and swap premiums paid/received in the Statements of Assets and Liabilities. |
As of January 31, 2015, the following tables present the Funds’ derivative assets and liabilities by counterparty net of amounts available for offset under an MNA and net of the related collateral received and pledged by the Funds:
| | | | | | | | | | | | | | | | | | | | |
| Global Long/Short Credit | | | | | | | | | | | | | | | |
| | | Gross Amounts Not Offset in the Statements of Assets and Liabilities
and Subject to an MNA | |
| Counterparty | | Derivative Assets
Subject to an MNA
by Counterparty | | | Derivatives
Available
for Offset1 | | | Non-cash
Collateral
Received2 | | | Cash
Collateral
Received2 | | | Net Amount of
Derivative Assets3 | |
Bank of America N.A | | $ | 3,267,902 | | | $ | (1,947,914 | ) | | | — | | | | — | | | $ | 1,319,988 | |
The Bank of New York Mellon | | | 1,468 | | | | (1,081 | ) | | | — | | | | — | | | | 387 | |
Barclays Bank PLC | | | 6,714,744 | | | | (4,127,002 | ) | | $ | (1,739,742 | ) | | $ | (848,000 | ) | | | — | |
BNP Paribas S.A. | | | 2,343,155 | | | | (2,343,155 | ) | | | — | | | | — | | | | — | |
Citibank N.A. | | | 246,264,149 | | | | (14,304,276 | ) | | | — | | | | — | | | | 231,959,873 | |
Credit Suisse International | | | 1,661,486 | | | | (1,661,486 | ) | | | — | | | | — | | | | — | |
Deutsche Bank AG | | | 8,715,120 | | | | (1,686,713 | ) | | | — | | | | (2,700,000 | ) | | | 4,328,407 | |
Goldman Sachs Bank USA | | | 787,848 | | | | (345,814 | ) | | | — | | | | (442,034 | ) | | | — | |
Goldman Sachs International | | | 3,101,949 | | | | (3,069,090 | ) | | | — | | | | — | | | | 32,859 | |
HSBC Bank PLC | | | 2,899,918 | | | | (682,813 | ) | | | (1,774,026 | ) | | | — | | | | 443,079 | |
JPMorgan Chase Bank N.A. | | | 4,491,060 | | | | (4,491,060 | ) | | | — | | | | — | | | | — | |
Morgan Stanley Capital Services LLC | | | 1,475,140 | | | | (360,113 | ) | | | — | | | | (200,000 | ) | | | 915,027 | |
Royal Bank of Canada | | | 11,763 | | | | — | | | | — | | | | — | | | | 11,763 | |
State Street Bank and Trust Co. | | | 4,833 | | | | — | | | | — | | | | — | | | | 4,833 | |
UBS AG | | | 376 | | | | (376 | ) | | | — | | | | — | | | | — | |
| | | | |
Total | | $ | 281,740,911 | | | $ | (35,020,893 | ) | | $ | (3,513,768 | ) | | $ | (4,190,034 | ) | | $ | 239,016,216 | |
| | | | |
| | | | | | |
| 82 | | BLACKROCK FUNDS | | JANUARY 31, 2015 | | |
| | |
| Notes to Financial Statements (continued) | | |
| | | | | | | | | | | | | | | | | | | | |
| Counterparty | | Derivative Liabilities
Subject to an MNA by Counterparty | | | Derivatives
Available
for Offset1 | | | Non-cash
Collateral
Pledged4 | | | Cash
Collateral
Pledged4 | | | Net Amount of
Derivative
Liabilities5 | |
Bank of America N.A. | | $ | 1,947,914 | | | $ | (1,947,914 | ) | | | — | | | | — | | | | — | |
The Bank of New York Mellon | | | 1,081 | | | | (1,081 | ) | | | — | | | | — | | | | — | |
Barclays Bank PLC | | | 4,127,002 | | | | (4,127,002 | ) | | | — | | | | — | | | | — | |
BNP Paribas S.A. | | | 8,273,536 | | | | (2,343,155 | ) | | $ | (2,540,381 | ) | | $ | (3,390,000 | ) | | | — | |
Citibank N.A. | | | 14,304,276 | | | | (14,304,276 | ) | | | — | | | | — | | | | — | |
Credit Suisse International | | | 5,821,142 | | | | (1,661,486 | ) | | | — | | | | (4,120,000 | ) | | $ | 39,656 | |
Deutsche Bank AG | | | 1,686,713 | | | | (1,686,713 | ) | | | — | | | | — | | | | — | |
Goldman Sachs Bank USA | | | 345,814 | | | | (345,814 | ) | | | — | | | | — | | | | — | |
Goldman Sachs International | | | 3,069,090 | | | | (3,069,090 | ) | | | — | | | | — | | | | — | |
HSBC Bank PLC | | | 682,813 | | | | (682,813 | ) | | | — | | | | | | | | — | |
JPMorgan Chase Bank N.A. | | | 13,767,805 | | | | (4,491,060 | ) | | | (3,789,912 | ) | | | (4,900,000 | ) | | | 586,833 | 6 |
Morgan Stanley Capital Services LLC | | $ | 360,113 | | | | (360,113 | ) | | | — | | | | — | | | | — | |
UBS AG | | | 689,697 | | | | (376 | ) | | | — | | | | — | | | | 689,321 | |
| | | | |
Total | | $ | 55,076,996 | | | $ | (35,020,893 | ) | | $ | (6,330,293 | ) | | $ | (12,410,000 | ) | | $ | 1,315,810 | |
| | | | |
| | | | | | | | | | | | | | | | | | | | |
| Macro Themes | | | | | | | | | | | | | | | |
| | | Gross Amounts Not Offset in the Statements of Assets and
Liabilities and Subject to an MNA | |
| Counterparty | | Derivative Assets
Subject to MNA by
Counterparty | | | Derivatives
Available
for Offset1 | | | Non-cash
Collateral
Received | | | Cash
Collateral
Received | | | Net Amount of
Derivative Assets3 | |
Bank of America N.A | | $ | 129,605 | | | $ | (129,605 | ) | | | — | | | | — | | | | — | |
Barclays Bank PLC | | | 11,648 | | | | (11,648 | ) | | | — | | | | — | | | | — | |
BNP Paribas S.A. | | | 120,877 | | | | (109,403 | ) | | | — | | | | — | | | $ | 11,474 | |
Citibank N.A. | | | 452,632 | | | | (154,994 | ) | | | — | | | | — | | | | 297,638 | |
Credit Suisse International | | | 30,001 | | | | (30,001 | ) | | | — | | | | — | | | | — | |
Deutsche Bank AG | | | 10,831 | | | | (2,734 | ) | | | — | | | | — | | | | 8,097 | |
Goldman Sachs International | | | 91,449 | | | | (45,090 | ) | | | — | | | | — | | | | 46,359 | |
HSBC Bank PLC | | | 61,997 | | | | (61,997 | ) | | | — | | | | — | | | | — | |
JPMorgan Chase Bank N.A. | | | 670,279 | | | | (513,431 | ) | | | — | | | | — | | | | 156,848 | |
Morgan Stanley & Co. International PLC | | | 13,058 | | | | (13,058 | ) | | | — | | | | — | | | | — | |
Royal Bank of Canada | | | 1,498 | | | | — | | | | — | | | | — | | | | 1,498 | |
Société Générale | | | 24,072 | | | | (4,042 | ) | | | — | | | | — | | | | 20,030 | |
Standard Chartered Bank | | | 6,451 | | | | — | | | | — | | | | — | | | | 6,451 | |
UBS AG | | | 2,801 | | | | (2,247 | ) | | | — | | | | — | | | | 554 | |
| | | | |
Total | | $ | 1,627,199 | | | $ | (1,078,250 | ) | | | — | | | | — | | | $ | 548,949 | |
| | | | |
| | | | | | | | | | | | | | | | | | | | |
| Counterparty | | Derivative Liabilities
Subject to MNA by
Counterparty | | | Derivatives
Available
for Offset1 | | | Non-cash
Collateral
Pledged | | | Cash
Collateral
Pledged | | | Net Amount of
Derivative
Liabilities5 | |
Bank of America N.A. | | $ | 146,157 | | | $ | (129,605 | ) | | | — | | | | — | | | $ | 16,552 | |
Barclays Bank PLC | | | 49,610 | | | | (11,648 | ) | | | — | | | | — | | | | 37,962 | |
BNP Paribas S.A. | | | 109,403 | | | | (109,403 | ) | | | — | | | | — | | | | — | |
Citibank N.A. | | | 154,994 | | | | (154,994 | ) | | | — | | | | — | | | | — | |
Credit Suisse International | | | 48,879 | | | | (30,001 | ) | | | — | | | | — | | | | 18,878 | |
Deutsche Bank AG | | | 2,734 | | | | (2,734 | ) | | | — | | | | — | | | | — | |
Goldman Sachs International | | | 45,090 | | | | (45,090 | ) | | | — | | | | — | | | | — | |
HSBC Bank PLC | | | 72,811 | | | | (61,997 | ) | | | — | | | | — | | | | 10,814 | |
JPMorgan Chase Bank N.A. | | | 513,431 | | | | (513,431 | ) | | | — | | | | — | | | | — | |
Morgan Stanley & Co. International PLC | | | 37,549 | | | | (13,058 | ) | | | — | | | | — | | | | 24,491 | |
Société Générale | | | 4,042 | | | | (4,042 | ) | | | — | | | | — | | | | — | |
UBS AG | | | 2,247 | | | | (2,247 | ) | | | — | | | | — | | | | — | |
| | | | |
Total | | $ | 1,186,947 | | | $ | (1,078,250 | ) | | | — | | | | — | | | $ | 108,697 | |
| | | | |
| | 1 | | The amount of derivatives available for offset is limited to the amount of assets and/or liabilities that are subject to an MNA. |
| | 2 | | Excess of collateral received from the individual counterparty may not be shown for financial reporting purposes. |
| | 3 | | Net amount represents the net amount receivable from the counterparty in the event of default. |
| | 4 | | Excess of collateral pledged from the individual counterparty may not be shown for financial reporting purposes. |
| | | | | | |
| | | BLACKROCK FUNDS | | JANUARY 31, 2015 | | 83 |
| | |
| Notes to Financial Statements (continued) | | |
| | 5 | | Net amount represents the net amount payable due to the counterparty in the event of default. |
| | 6 | | Net payable is subject to set-off provision with net receivable under the MRA. |
5. Investment Advisory Agreement and Other Transactions with Affiliates:
The PNC Financial Services Group, Inc. is the largest stockholder and an affiliate, for 1940 Act purposes, of BlackRock, Inc. (“BlackRock”).
The Trust, on behalf of the Funds, entered into an Investment Advisory Agreement with the Manager, the Funds’ investment advisor, an indirect, wholly owned subsidiary of BlackRock, to provide investment advisory services. The Manager is responsible for the management of each Fund’s portfolio and provides the necessary personnel, facilities, equipment and certain other services to the operations of each Fund. For such services, each Fund pays the Manager a monthly fee based on a percentage of each Fund’s average daily net assets at the following annual rates:
| | | | | | | | | | | | |
| | | Commodity
Strategies | | | Global
Long/Short
Credit | | | Macro
Themes | |
| Average Daily Net Assets | | Investment Advisory Fee | |
First $1 Billion | | | 1.15 | % | | | 0.95 | % | | | 0.85 | % |
$1 Billion - $3 Billion | | | 1.08 | % | | | 0.89 | % | | | 0.80 | % |
$3 Billion - $5 Billion | | | 1.04 | % | | | 0.86 | % | | | 0.77 | % |
$5 Billion - $10 Billion | | | 1.00 | % | | | 0.83 | % | | | 0.74 | % |
Greater than $10 Billion | | | 0.98 | % | | | 0.81 | % | | | 0.72 | % |
The Manager voluntarily agreed to waive its investment advisory fees by the amount of investment advisory fees each Fund pays to the Manager indirectly through its investment in affiliated money market funds. However the Manager does not waive its investment advisory fees by the amount of investment advisory fees paid in connection with each Fund’s investments in other affiliated investment companies, if any. These amounts are included in fees waived by Manager in the Statements of Operations. For the period ended January 31, 2015, the Manager waived $3,881, $202,929 and $540 for Commodity Strategies, Global Long/Short Credit and Macro Themes, respectively.
For Commodity Strategies and Macro Themes, the Manager provides investment management and other services to the Subsidiaries. The Manager does not receive separate compensation from the Subsidiaries for providing investment management or administrative services. However, Commodity Strategies and Macro Themes pay the Manager based on the applicable Fund’s net assets, which includes the assets of the Subsidiaries.
With respect to each Fund, the Manager entered into separate sub-advisory agreements with BlackRock International Limited (“BIL”), an affiliate of the Manager. With respect to Global Long/Short Credit, the Manager has also entered into a separate sub-advisory agreement with BlackRock (Singapore) Limited (“BRS”), which is also an affiliate of the Manager. The Manager pays BIL and BRS, as applicable, for services they provide, a monthly fee that is a percentage of the investment advisory fees paid by each Fund to the Manager.
The Trust, on behalf of the Funds, entered into a Distribution Agreement and Distribution and Service Plan with BlackRock Investments, LLC (“BRIL”), an affiliate of the Manager. Pursuant to the Distribution and Service Plan and in accordance with Rule 12b-1 under the 1940 Act, each Fund pays BRIL ongoing service and distribution fees. The fees are accrued daily and paid monthly at annual rates based upon the average daily net assets of the relevant share class of each Fund as follows:
| | | | | | | | |
| | | Investor A | | | Investor C | |
Service Fee | | | 0.25 | % | | | 0.25 | % |
Distribution Fee | | | — | | | | 0.75 | % |
Pursuant to sub-agreements with BRIL, broker-dealers and BRIL provide shareholder servicing and distribution services to each Fund. The ongoing service and/or distribution fee compensates BRIL and each broker-dealer for providing shareholder servicing and/or distribution related services to Investor A and Investor C shareholders.
For the period ended January 31, 2015, the following table shows the class specific service and distribution fees borne directly by each class of each Fund:
| | | | | | | | | | | | |
| | | Investor A | | | Investor C | | | Total | |
Commodity Strategies | | $ | 20,973 | | | $ | 41,145 | | | $ | 62,118 | |
Global Long/Short Credit | | $ | 1,607,119 | | | $ | 1,981,482 | | | $ | 3,588,601 | |
Macro Themes | | $ | 10 | | | $ | 40 | | | $ | 50 | |
Pursuant to written agreements, certain financial intermediaries, some of which may be affiliates, provide the Funds with sub-accounting, recordkeeping, sub-transfer agency and other administrative services with respect to sub-accounts they service. For these services, these entities receive an asset-based fee or an annual fee per shareholder account, which will vary depending on share class and/or net assets. For the six months
| | | | | | |
| 84 | | BLACKROCK FUNDS | | JANUARY 31, 2015 | | |
| | |
| Notes to Financial Statements (continued) | | |
ended January 31, 2015, Global Long/Short Credit paid the following amounts to affiliates of BlackRock in return for these services, which are included in transfer agent — class specific in the Statements of Operations:
| | | | | | | | | | | | | | | | |
| | | Institutional | | | Investor A | | | Investor C | | | Total | |
Global Long/Short Credit | | $ | 86,280 | | | $ | 62 | | | $ | 34 | | | $ | 86,376 | |
The Manager maintains a call center, which is responsible for providing certain shareholder services to the Funds, such as responding to shareholder inquiries and processing transactions based upon instructions from shareholders with respect to the subscription and redemption of Fund shares. For the period ended January 31, 2015, each Fund reimbursed the Manager the following amounts for costs incurred in running the call center, which are included in transfer agent — class specific in the Statements of Operations:
| | | | | | | | | | | | | | | | |
| | | Institutional | | | Investor A | | | Investor C | | | Total | |
Commodity Strategies | | $ | 739 | | | $ | 571 | | | $ | 141 | | | $ | 1,451 | |
Global Long/Short Credit | | $ | 4,909 | | | $ | 5,970 | | | $ | 2,019 | | | $ | 12,898 | |
Macro Themes | | $ | 2 | | | $ | 1 | | | $ | 1 | | | $ | 4 | |
For the period ended January 31, 2015, the following table shows the class specific transfer agent fees borne directly by each class of each Fund:
| | | | | | | | | | | | | | | | |
| | | Institutional | | | Investor A | | | Investor C | | | Total | |
Commodity Strategies | | $ | 21,727 | | | $ | 21,893 | | | $ | 6,141 | | | $ | 49,761 | |
Global Long/Short Credit | | $ | 1,447,992 | | | $ | 827,615 | | | $ | 134,747 | | | $ | 2,410,354 | |
Macro Themes | | $ | 67 | | | $ | 13 | | | $ | 13 | | | $ | 93 | |
Effective January 1, 2015, the Trust, on behalf of the Funds, entered into an Administration Agreement with the Manager, an indirect, wholly owned subsidiary of BlackRock, to provide administrative services. For these services, the Manager receives an administration fee computed daily and payable monthly, based on a percentage of the average daily net assets of each Fund. The administration fee, which is shown as administration in the Statements of Operations, is paid at the annual rates below. In addition, each of the share classes is charged an administration fee, which is shown as administration — class specific in the Statements of Operations, at an annual rate of 0.02% for Commodity Strategies and Macro Themes and 0.15% for Global Long/Short Credit of the average daily net assets of each respective class:
| | | | |
| Average Daily Net Assets | | Administration Fee | |
First $500 Million | | | 0.425 | % |
$500 Million - $1 Billion | | | 0.040 | % |
$1 Billion - $2 Billion | | | 0.038 | % |
$2 Billion - $4 Billion | | | 0.035 | % |
$4 Billion - $13 Billion | | | 0.032 | % |
Greater than $13 Billion | | | 0.030 | % |
Prior January 1, 2015, BNY Mellon Investment Servicing (U.S.) Inc. (“BNYMIS”) and the Manager acted as co-administrators for the Funds. For these services, the co-administrators received an administration fee computed daily and payable monthly to each administrator pursuant to separate fee arrangements, based on a percentage of the average daily net assets of each Fund. The combined administration fee, which is shown as administration in the Statements of Operations, was paid at the annual rates below. In addition, each of the share classes was charged an administration fee, which was shown as administration — class specific in the Statements of Operations, based on the following percentages of average daily net assets of each respective class:
| | | | | | | | |
| Average Daily Net Assets | | Administration Fee | | | Administration Fee —
Class Specific | |
First $500 Million | | | 0.075 | % | | | 0.025 | % |
$500 Million - $1 Billion | | | 0.065 | % | | | 0.015 | % |
Greater than $1 Billion | | | 0.055 | % | | | 0.005 | % |
For the period ended January 31, 2015, the Funds paid the following to the Manager in return for these services, which are included in administration and administration — class specific in the Statements of Operations:
| | | | |
Commodity Strategies | | $ | 149,056 | |
Global Long/Short Credit | | $ | 1,600,443 | |
Macro Themes | | $ | 3,511 | |
| | | | | | |
| | | BLACKROCK FUNDS | | JANUARY 31, 2015 | | 85 |
| | |
| Notes to Financial Statements (continued) | | |
For the period ended January 31, 2015, the following table shows the class specific administration fees borne directly by each class of each Fund:
| | | | | | | | | | | | | | | | |
| | | Institutional | | | Investor A | | | Investor C | | | Total | |
Commodity Strategies | | $ | 48,255 | | | $ | 2,045 | | | $ | 1,000 | | | $ | 51,300 | |
Global Long/Short Credit | | $ | 226,657 | | | $ | 105,119 | | | $ | 46,283 | | | $ | 378,059 | |
Macro Themes | | $ | 1,057 | | | $ | 1 | | | $ | 1 | | | $ | 1,059 | |
BNYMIS and the Manager may have, at their discretion, voluntarily waived all or any portion of their administration fees for a Fund or a share class, which are included in administration fees waived — class specific in the Statements of Operations. The Manager did not waive any of their administration fees for Macro Themes.
The Manager contractually agreed to waive and/or reimburse fees or expenses in order to limit expenses, excluding interest expense, dividend expense, tax expense, acquired fund fees and expenses and certain other fund expenses, which constitute extraordinary expenses not incurred in the ordinary course of the Funds’ business. The expense limitations as a percentage of average daily net assets are as follows:
| | | | | | | | | | | | |
| | | Institutional | | | Investor A | | | Investor C | |
Commodity Strategies1 | | | 1.30 | % | | | 1.50 | % | | | 2.25 | % |
Global Long/Short Credit1 | | | 1.20 | % | | | 1.40 | % | | | 2.15 | % |
Macro Themes2 | | | 1.20 | % | | | 1.45 | % | | | 2.20 | % |
| | 1 | | The Manager has agreed not to reduce or discontinue this contractual waiver or reimbursement prior to December 1, 2015 unless approved by the Board, including a majority of the independent Trustees. |
| | 2 | | The Manager has agreed not to reduce or discontinue this contractual waiver or reimbursement prior to December 1, 2016, unless approved by the Board, including a majority of the independent Trustees. |
These amounts waived or reimbursed are included in fees waived by Manager, and shown as administration fees waived — class specific, transfer agent fees waived — class specific and transfer agent fees reimbursed — class specific, respectively, in the Statements of Operations. For the period ended January 31, 2015, the Manager waived $88,891 and $38,985 of investment advisory fees for Commodity Strategies and Macro Themes, respectively, which is included in fees waived by Manager.
Class specific expense waivers or reimbursements are as follows:
| | | | | | | | | | | | | | | | |
| Administration Fees Waived | | | | | | | | | | | | |
| | | Institutional | | | Investor A | | | Investor C | | | Total | |
Commodity Strategies | | | — | | | $ | 2,045 | | | $ | 1,000 | | | $ | 3,045 | |
Global Long/Short Credit | | | — | | | $ | 58 | | | | — | | | $ | 58 | |
Macro Themes | | $ | 981 | | | $ | 1 | | | $ | 1 | | | $ | 983 | |
| | | | | | | | | | | | | | | | |
| Transfer Agent Fees Waived | | | | | | | | | | | | |
| | | Institutional | | | Investor A | | | Investor C | | | Total | |
Commodity Strategies | | | — | | | $ | 571 | | | $ | 141 | | | $ | 712 | |
Macro Themes | | $ | 1 | | | $ | 1 | | | $ | 1 | | | $ | 3 | |
| | | | | | | | | | | | | | | | |
| Transfer Agent Fees Reimbursed | | | | | | | | | | | | |
| | | Institutional | | | Investor A | | | Investor C | | | Total | |
Commodity Strategies | | | — | | | $ | 21,049 | | | $ | 5,918 | | | $ | 26,967 | |
Macro Themes | | $ | 53 | | | $ | 12 | | | $ | 12 | | | $ | 77 | |
If during the Funds’ fiscal year the operating expenses of a share class, that at any time during the prior two fiscal years received a waiver or reimbursement from the Manager, are less than the expense limit for that share class, the Manager is entitled to be reimbursed by such share class up to the lesser of (a) the amount of fees waived or expenses reimbursed during those prior two fiscal years under the agreement and (b) the amount by which the expense limit for that share class exceeds the operating expenses of the share class for the current fiscal year, provided that: (1) the Fund, of which the share class is a part, has more than $50 million in assets for the fiscal year and (2) the Manager or an affiliate continues to serve as the Fund’s investment advisor or administrator. In the event the expense limit for a share class is changed subsequent to a fiscal year in which the Manager becomes entitled to reimbursement for fees waived or reimbursed, the amount available to reimburse the Manager shall be calculated by reference to the expense limit for that share class in effect at the time the Manager became entitled to receive such reimbursement, rather than the subsequently changed expense limit for that share class.
For the six months ended January 31, 2015, the Manager recouped waivers and/or reimbursements previously recorded of $14,806 for Global Long/ Short Credit Investor A Shares.
| | | | | | |
| 86 | | BLACKROCK FUNDS | | JANUARY 31, 2015 | | |
| | |
| Notes to Financial Statements (continued) | | |
On January 31, 2015, the Fund level and class specific waivers and/or reimbursements subject to possible future recoupment under the expense limitation agreement are as follows:
| | | | | | | | | | | | |
| | | Expires July 31, | |
| | | 2015 | | | 2016 | | | 2017 | |
Commodity Strategies | | | | | | | | | | | | |
Fund Level | | $ | 269,119 | | | $ | 172,275 | | | $ | 88,891 | |
Investor A | | $ | 31,851 | | | $ | 43,837 | | | $ | 23,665 | |
Investor C | | $ | 12,821 | | | $ | 13,297 | | | $ | 7,059 | |
Global Long/Short Credit | | | | | | | | | | | | |
Investor A | | | — | | | | — | | | $ | 58 | |
Macro Themes | | | | | | | | | | | | |
Fund Level | | | — | | | | — | | | $ | 38,985 | |
Institutional | | | — | | | | — | | | $ | 1,035 | |
Investor A | | | — | | | | — | | | $ | 14 | |
Investor C | | | — | | | | — | | | $ | 14 | |
For the period ended January 31, 2015, affiliates earned underwriting discounts, direct commissions and dealer concessions on sales of each Fund’s Investor A Shares as follows:
| | | | |
Commodity Strategies | | $ | 1,135 | |
Global Long/Short Credit | | $ | 29,300 | |
For the period ended January 31, 2015, affiliates received CDSCs as follows:
| | | | | | | | |
| | | Investor A | | | Investor C | |
Commodity Strategies | | $ | 1,431 | | | $ | 622 | |
Global Long/Short Credit | | $ | 42,610 | | | $ | 64,779 | |
The U.S. Securities and Exchange Commission has issued an exemptive order which permits BIM, an affiliate of the Manager, to serve as securities lending agent for Commodity Strategies, subject to applicable conditions. As securities lending agent, BIM bears all operational costs directly related to securities lending. Commodity Strategies is responsible for expenses in connection with the investment of cash collateral received for securities on loan (the “collateral investment expenses”). The cash collateral is invested in a private investment company managed by the Manager or its affiliates. However, BIM has agreed to cap the collateral investment expenses of the private investment company to an annual rate of 0.04%. The investment advisor to the private investment company will not charge any advisory fees with respect to shares purchased by Commodity Strategies.
Securities lending income is equal to the total of income earned from the reinvestment of cash collateral, net of fees and other payments to and from borrowers of securities, and less the collateral investment expenses. Commodity Strategies retains a portion of securities lending income and remits a remaining portion to BIM as compensation for its services as securities lending agent. Pursuant to a securities lending agreement, BIM may lend securities only when the difference between the borrower rebate rate and the risk free rate exceeds a certain level (such securities, the “specials only securities”).
Pursuant to such agreement, Commodity Strategies retains 80% of securities lending income. In addition, commencing the business day following the date that the aggregate securities lending income earned across certain funds in the Equity-Liquidity Complex in a calendar year exceeds a specified threshold, Commodity Strategies, pursuant to the securities lending agreement, will retain for the remainder of the calendar year securities lending income in an amount equal to 85% of securities lending income. The share of securities lending income earned by Commodity Strategies is shown as securities lending — affiliated — net in the Statements of Operations. For the six months ended January 31, 2015, Commodity Strategies paid BIM $516 for securities lending agent services.
Certain officers and/or trustees of the Trust are officers and/or directors of BlackRock or its affiliates. The Funds reimburse the Manager for a portion of the compensation paid to the Trust’s Chief Compliance Officer, which is included in officer and trustees in the Statements of Operations.
Global Long/Short Credit may purchase securities from, or sell securities to, an affiliated fund provided the affiliation is due solely to having a common investment advisor, common officers, or common trustees. For the six months ended January 31, 2015, the purchase and sale transactions with an affiliated fund in compliance with Rule 17a-7 under the 1940 Act were $2,896,657 and $6,555,675, respectively.
| | | | | | |
| | | BLACKROCK FUNDS | | JANUARY 31, 2015 | | 87 |
| | |
Notes to Financial Statements (continued) | | |
6. Purchases and Sales:
For the period ended January 31, 2015, purchases and sales of investments, excluding short-term securities, were as follows:
| | | | | | | | | | | | |
| Purchases | | Commodity
Strategies | | | Global
Long/Short Credit | | | Macro
Themes | |
Non-U.S. Government Securities | | $ | 135,693,303 | | | $ | 4,007,387,218 | | | $ | 14,420,722 | |
U.S. Government Securities | | | — | | | | 3,133,217,128 | | | | 5,078,172 | |
| | | | |
Total Purchases | | $ | 135,693,303 | | | $ | 7,140,604,346 | | | $ | 19,498,894 | |
| | | | |
| | | | | | | | | | | | |
| Sales | | Commodity
Strategies | | | Global
Long/Short Credit | | | Macro
Themes | |
Non-U.S. Government Securities | | $ | 90,044,332 | | | $ | 3,152,352,762 | | | $ | 785,282 | |
U.S. Government Securities | | | — | | | | 3,045,945,543 | | | | 2,234,035 | |
| | | | |
Total Sales | | $ | 90,044,332 | | | $ | 6,198,298,305 | | | $ | 3,019,317 | |
| | | | |
7. Income Tax Information:
It is the Funds’ policy to comply with the requirements of the Internal Revenue Code of 1986, as amended, applicable to regulated investment companies, and to distribute substantially all of its taxable income to its shareholders. Therefore, no federal income tax provision is required.
The Funds file U.S. federal and various state and local tax returns. No income tax returns are currently under examination. The statute of limitations on Commodity Strategies’ and Global Long/Short Credit’s U.S. federal tax returns remains open for each of the two years ended July 31, 2014 and the period ended July 31, 2012. The statutes of limitations on Commodity Strategies’ and Global Long/Short Credit’s state and local tax returns may remain open for an additional year depending upon the jurisdiction.
Management has analyzed tax laws and regulations and their application to the Funds’ facts and circumstances and does not believe that there are any uncertain tax positions that require recognition of a tax liability.
As of July 31, 2014, Commodity Strategies has capital loss carryforwards, with no expiration date, available to offset future realized capital gains of $26,728,889.
As of January 31, 2015, gross unrealized appreciation and depreciation based on cost for federal income tax purposes were as follows:
| | | | | | | | | | | | |
| | | Commodity
Strategies | | | Global
Long/Short Credit | | | Macro
Themes | |
Tax cost | | $ | 423,735,361 | | | $ | 7,657,106,046 | | | $ | 29,949,572 | |
| | | | |
Gross unrealized appreciation | | $ | 13,152,040 | | | $ | 97,483,083 | | | $ | 157,192 | |
Gross unrealized depreciation | | | (47,335,746 | ) | | | (371,516,105 | ) | | | (882,881 | ) |
| | | | |
Net unrealized depreciation | | $ | (34,183,706 | ) | | $ | (274,033,022 | ) | | $ | (725,689 | ) |
| | | | |
8. Bank Borrowings:
The Trust, on behalf of the Funds, along with certain other funds managed by the Manager and its affiliates (“Participating Funds”), was a party to a 364-day, $1.1 billion credit agreement with a group of lenders, under which the Funds may borrow to fund shareholder redemptions. Excluding commitments designated for a certain individual fund, the Participating Funds, including the Funds, could borrow up to an aggregate commitment amount of $650 million, subject to asset coverage and other limitations as specified in the agreement. Effective November 25, 2014, the credit agreement was amended to an aggregate commitment amount of $2.1 billion, of which, the Participating Funds, including the Funds, can borrow up to $1.6 billion at any time outstanding, subject to asset coverage and other limitations as specified in the agreement. The agreement terminates on April 23, 2015, unless otherwise extended to November 24, 2015 or renewed for a period of 364 days from April 23, 2015. The credit agreement has the following terms: a fee of 0.06% per annum on unused commitment amounts and interest at a rate equal to the higher of (a) the one-month LIBOR (but in any event, not less than 0.00%) on the date the loan is made plus 0.80% per annum or (b) the Fed Funds rate (but in any event, not less than 0.00%) in effect from time to time plus 0.80% per annum on amounts borrowed. Participating Funds paid administration, legal and arrangement fees, which are included in miscellaneous expenses in the Statements of Operations, and along with commitment fees, were allocated among such funds based upon portions of the aggregate commitment available to them and relative net assets of Participating Funds. During the period ended January 31, 2015, the Funds did not borrow under the credit agreement.
| | | | | | |
| 88 | | BLACKROCK FUNDS | | JANUARY 31, 2015 | | |
| | |
Notes to Financial Statements (continued) | | |
9. Principal Risks:
In the normal course of business, the Funds invest in securities and enter into transactions where risks exist due to fluctuations in the market (market risk) or failure of the issuer of a security to meet all its obligations (issuer credit risk). The value of securities held by the Funds may decline in response to certain events, including those directly involving the issuers whose securities are owned by the Funds; conditions affecting the general economy; overall market changes; local, regional or global political, social or economic instability; and currency and interest rate and price fluctuations. Similar to issuer credit risk, the Funds may be exposed to counterparty credit risk, or the risk that an entity with which the Funds have unsettled or open transactions may fail to or be unable to perform on its commitments. The Funds manage counterparty credit risk by entering into transactions only with counterparties that they believe have the financial resources to honor their obligations and by monitoring the financial stability of those counterparties. Financial assets, which potentially expose the Funds to market, issuer and counterparty credit risks, consist principally of financial instruments and receivables due from counterparties. The extent of the Funds’ exposure to market, issuer and counterparty credit risks with respect to these financial assets is generally approximated by their value recorded in the Statements of Assets and Liabilities, less any collateral held by the Funds.
The Funds invest a significant portion of their assets in fixed income securities and/or use derivatives tied to the fixed-income markets. See the Schedules of Investments for these securities and/or derivatives. Changes in market interest rates or economic conditions, may affect the value and/or liquidity of such investments. Interest rate risk is the risk that prices of bonds and other fixed-income securities will increase as interest rates fall and decrease as interest rates rise. The Funds may be subject to a greater risk of rising interest rates due to the current period of historically low rates.
Commodity Strategies invested a significant portion of its assets in securities in the materials and energy sectors. Changes in economic conditions affecting such sectors would have a greater impact on Commodity Strategies and could affect the value, income and/or liquidity of positions in such securities.
Global Long/Short Credit invests a substantial amount of its assets in issuers located in a single country or a limited number of countries. When Global Long/Short Credit concentrates its investments in this manner, it assumes the risk that economic, political and social conditions in those countries may have a significant impact on its investment performance. Foreign issuers may not be subject to the same uniform accounting, auditing and financial reporting standards and practices as used in the United States. Foreign securities markets may also be less liquid, more volatile, and less subject to governmental supervision not typically associated with investing in U.S. securities. Investment percentages in specific countries are presented in the Schedules of Investments.
Global Long/Short Credit invests a significant portion of its assets in securities of issuers located in Europe or with significant exposure to European issuers or countries. The European financial markets have recently experienced volatility and adverse trends due to concerns about economic downturns in, or rising government debt levels of, several European countries. These events may spread to other countries in Europe and may affect the value and liquidity of certain of Global Long/Short Credit’s investments.
10. Capital Share Transactions:
Transactions in capital shares for each class were as follows:
| | | | | | | | | | | | | | | | | | |
| | | Six Months Ended
January 31, 2015 | | | | | Year Ended
July 31, 2014 | |
| Commodity Strategies | | Shares | | | Amount | | | | | Shares | | | Amount | |
| Institutional | | | | | | | | | | | | | | |
Shares sold | | | 11,625,489 | | | $ | 101,101,561 | | | | | | 5,519,070 | | | $ | 52,962,816 | |
Shares issued in reinvestment of distributions | | | 10,565 | | | | 85,894 | | | | | | — | | | | — | |
Shares redeemed | | | (4,229,794 | ) | | | (36,973,569 | ) | | | | | (5,026,906 | ) | | | (48,055,065 | ) |
| | | | | | | | | | |
Net increase | | | 7,406,260 | | | $ | 64,213,886 | | | | | | 492,164 | | | $ | 4,907,751 | |
| | | | | | | | | | |
| | | | | | |
| | | BLACKROCK FUNDS | | JANUARY 31, 2015 | | 89 |
| | |
Notes to Financial Statements (continued) | | |
| | | | | | | | | | | | | | | | | | |
| | | Six Months Ended
January 31, 2015 | | | | | Year Ended
July 31, 2014 | |
| Commodity Strategies (concluded) | | Shares | | | Amount | | | | | Shares | | | Amount | |
Investor A | | | | | | | | | | | | | | | | | | |
Shares sold | | | 475,670 | | | $ | 4,221,906 | | | | | | 1,040,468 | | | $ | 10,086,311 | |
Shares redeemed | | | (1,154,740 | ) | | | (10,099,536 | ) | | | | | (769,365 | ) | | | (7,276,514 | ) |
| | | | | | | | | | |
Net increase (decrease) | | | (679,070 | ) | | $ | (5,877,630 | ) | | | | | 271,103 | | | $ | 2,809,797 | |
| | | | | | | | | | |
| | | | | | | | | | | | | | | | | | |
Investor C | | | | | | | | | | | | | | | | | | |
Shares sold | | | 129,494 | | | $ | 1,086,345 | | | | | | 215,852 | | | $ | 2,040,247 | |
Shares redeemed | | | (259,483 | ) | | | (2,146,121 | ) | | | | | (381,703 | ) | | | (3,556,395 | ) |
| | | | | | | | | | |
Net decrease | | | (129,989 | ) | | $ | (1,059,776 | ) | | | | | (165,851 | ) | | $ | (1,516,148 | ) |
| | | | | | | | | | |
Total Net Increase | | | 6,597,201 | | | $ | 57,276,480 | | | | | | 597,416 | | | $ | 6,201,400 | |
| | | | | | | | | | |
| | | | | | | | | | | | | | | | | | |
| Global Long/Short Credit | | | | | | | | | | | | | | |
| Institutional | | | | | | | | | | | | | | |
Shares sold | | | 134,596,164 | | | $ | 1,455,908,812 | | | | | | 384,031,586 | | | $ | 4,166,759,625 | |
Shares issued in reinvestment of distributions | | | 12,664,770 | | | | 131,333,669 | | | | | | 1,670,787 | | | | 18,154,119 | |
Shares redeemed | | | (141,947,205 | ) | | | (1,509,629,529 | ) | | | | | (89,252,890 | ) | | | (969,404,048 | ) |
| | | | | | | | | | |
Net increase | | | 5,313,729 | | | $ | 77,612,952 | | | | | | 296,449,483 | | | $ | 3,215,509,696 | |
| | | | | | | | | | |
| | | | | | | | | | | | | | | | | | |
Investor A | | | | | | | | | | | | | | | | | | |
Shares sold | | | 19,568,932 | | | $ | 210,722,214 | | | | | | 164,828,164 | | | $ | 1,776,057,015 | |
Shares issued in reinvestment of distributions | | | 4,355,177 | | | | 45,119,633 | | | | | | 1,569,048 | | | | 17,013,161 | |
Shares redeemed | | | (58,175,149 | ) | | | (627,314,182 | ) | | | | | (108,029,505 | ) | | | (1,176,975,951 | ) |
| | | | | | | | | | |
Net increase (decrease) | | | (34,251,040 | ) | | $ | (371,472,335 | ) | | | | | 58,367,707 | | | $ | 616,094,225 | |
| | | | | | | | | | |
| | | | | | | | | | | | | | | | | | |
Investor C | | | | | | | | | | | | | | | | | | |
Shares sold | | | 5,195,891 | | | $ | 55,615,024 | | | | | | 24,979,292 | | | $ | 268,221,216 | |
Shares issued in reinvestment of distributions | | | 817,592 | | | | 8,421,197 | | | | | | 56,255 | | | | 608,565 | |
Shares redeemed | | | (6,184,374 | ) | | | (65,485,299 | ) | | | | | (3,990,693 | ) | | | (43,022,164 | ) |
| | | | | | | | | | |
Net increase (decrease) | | | (170,891 | ) | | $ | (1,449,078 | ) | | | | | 21,044,854 | | | $ | 225,807,617 | |
| | | | | | | | | | |
Total Net Increase (Decrease) | | | (29,108,202 | ) | | $ | (295,308,461 | ) | | | | | 375,862,044 | | | $ | 4,057,411,538 | |
| | | | | | | | | | |
| | | | | | |
| 90 | | BLACKROCK FUNDS | | JANUARY 31, 2015 | | |
| | |
Notes to Financial Statements (concluded) | | |
| | | | | | | | |
| | | Period from
December 4, 20141 to
January 31, 2015 | |
| Macro Themes | | Shares | | | Amount | |
Institutional | | | | | | | | |
Shares sold | | | 2,995,000 | | | $ | 29,950,000 | |
| | | | |
Net increase | | | 2,995,000 | | | $ | 29,950,000 | |
| | | | |
| | | | | | | | |
Investor A | | | | | | | | |
Shares sold | | | 2,500 | | | $ | 25,000 | |
| | | | |
Net increase | | | 2,500 | | | $ | 25,000 | |
| | | | |
| | | | | | | | |
Investor C | | | | | | | | |
Shares sold | | | 2,500 | | | $ | 25,000 | |
| | | | |
Net increase | | | 2,500 | | | $ | 25,000 | |
| | | | |
Total Net Increase | | | 3,000,000 | | | $ | 30,000,000 | |
| | | | |
| | 1 | | Commencement of operations. |
At January 31, 2015, shares owned by affiliates of Macro Themes were as follows:
| | | | | | | | | | |
| Institutional | | | Investor A | | | Investor C | |
| | 2,995,000 | | | | 2,500 | | | | 2,500 | |
11. Subsequent Events:
Management has evaluated the impact of all subsequent events on the Funds through the date the financial statements were issued and has determined that there were no subsequent events requiring adjustment or additional disclosure in the financial statements.
| | | | | | |
| | | BLACKROCK FUNDS | | JANUARY 31, 2015 | | 91 |
| | |
Disclosure of Sub-Advisory Agreement | | |
The Board of Trustees (the “Board,” and the members of which are referred to as “Board Members”) of BlackRock FundsSM (the “Trust”) met in person on September 18-19, 2014 (the “September Meeting”) to consider the initial approval of the sub-advisory agreement (the “Sub-Advisory Agreement”) between BlackRock Advisors, LLC (the “Manager”), the Trust’s investment advisor, and BlackRock (Singapore) Limited with respect to BlackRock Global Long/Short Credit Fund (the “Fund”), a series of the Trust. The Sub-Advisory Agreement was substantially the same as the sub-advisory agreement previously approved with respect to the Fund.
The Board consists of fifteen individuals, thirteen of whom are not “interested persons” of the Trust as defined in the Investment Company Act of 1940, as amended (the “1940 Act”) (the “Independent Board Members”). Pursuant to the 1940 Act, the Board is required to consider the initial approval of the Sub-Advisory Agreement.
At the September Meeting, the Board reviewed materials relating to its consideration of the proposed Sub-Advisory Agreement. The Trust’s investment advisory agreement (the “Advisory Agreement”) with the Manager on behalf of the Fund and the sub-advisory agreement between the Manager and BlackRock International Limited with respect to the Fund were most recently approved by the Board at an in-person meeting on May 28-30, 2014 (the “May Meeting”). A discussion of the basis for the Board’s approval of these agreements at the May Meeting is included in the Fund’s annual shareholder report for the fiscal year ended July 31, 2014. The factors considered by the Board at the September Meeting in connection with approval of the proposed Sub-Advisory Agreement were substantially the same as the factors considered at the May Meeting.
Following discussion, all the Board Members present at the September Meeting, including all the Independent Board Members present, approved the Sub-Advisory Agreement between the Manager and BlackRock (Singapore) Limited with respect to the Fund for a two-year term beginning on the effective date of the Sub-Advisory Agreement. Based upon its evaluation of all of the aforementioned factors in their totality, the Board, including the Independent Board Members, was satisfied that the terms of the Sub-Advisory Agreement were fair and reasonable and in the best interest of the Fund and its shareholders. In arriving at its decision to approve the Sub-Advisory Agreement, the Board did not identify any single factor or group of factors as all-important or controlling, but considered all factors together, and different Board Members may have attributed different weights to the various factors considered. The Independent Board Members were also assisted by the advice of independent legal counsel in making this determination.
| | | | | | |
| 92 | | BLACKROCK FUNDS | | JANUARY 31, 2015 | | |
| | |
Disclosure of Investment Advisory Agreement and Sub-Advisory Agreement | | |
The Board of Trustees (the “Board,” and the members of which are referred to as “Board Members”) of BlackRock FundsSM (the “Trust”) met in person on September 18-19, 2014 (the “Meeting”) to consider the approval of the Trust’s proposed investment advisory agreement (the “Advisory Agreement”) with BlackRock Advisors, LLC (the “Manager”) on behalf of BlackRock Macro Themes Fund (the “Fund”), a portfolio of the Trust. The Advisory Agreement was the same agreement that had previously been approved by the Board with respect to other portfolios of the Trust. The Board also considered the approval of the proposed sub-advisory agreement (the “Sub-Advisory Agreement”) between the Manager and BlackRock International Limited (the “Sub-Advisor”) with respect to the Fund. The Sub-Advisory Agreement was substantially the same as the sub-advisory agreement previously approved with respect to certain other portfolios of the Trust. The Manager and the Sub-Advisor are referred to herein as “BlackRock.” The Advisory Agreement and the Sub-Advisory Agreement are referred to herein as the “Agreements.” The Fund commenced operations in December 2014.
Activities and Composition of the Board
The Board consists of fifteen individuals, thirteen of whom are not “interested persons” of the Trust as defined in the Investment Company Act of 1940, as amended (the “1940 Act”) (the “Independent Board Members”). The Board Members are responsible for the oversight of the operations of the Fund and perform the various duties imposed on the directors of investment companies by the 1940 Act. The Independent Board Members have retained independent legal counsel to assist them in connection with their duties. The Co-Chairs of the Board are each Independent Board Members. The Board has established five standing committees: an Audit Committee, a Governance and Nominating Committee, a Compliance Committee, a Performance Oversight and Contract Committee and an Executive Committee, each of which is chaired by an Independent Board Member and composed of Independent Board Members (except for the Executive Committee, which also has one interested Board Member).
The Agreements
Pursuant to the 1940 Act, the Board is required to consider the initial approval of the Agreements. In connection with this process, the Board assessed, among other things, the nature, scope and quality of the services to be provided to the Fund by BlackRock, its personnel and its affiliates, including (as applicable) investment management; administrative and shareholder services; oversight of fund service providers; marketing services, risk oversight, compliance and assistance in meeting applicable legal and regulatory requirements.
Board Considerations in Approving the Agreements
The Approval Process: At the Meeting, the Board reviewed materials relating to its consideration of the Agreements. The Board considered all factors it believed relevant with respect to the Trust and the Fund, including, among other factors: (a) the nature, extent and quality of the services to be provided by BlackRock; (b) the investment performance of BlackRock portfolio management; (c) the advisory fee and the cost of the services to be provided and profits to be realized by BlackRock and its affiliates from their relationship with the Fund; (d) economies of scale; (e) fall out benefits to BlackRock and its affiliates from their relationship with the Fund; (f) possible alternatives to the proposed Agreements; (g) the policies and practices of BlackRock with respect to portfolio transactions for the Fund; (h) BlackRock’s portfolio compliance systems and capabilities; and (i) other factors deemed relevant by the Board Members.
In determining to approve the Agreements, the Board met with the relevant investment advisory personnel from BlackRock and considered all information it deemed reasonably necessary to evaluate the terms of the Agreements. The Board received materials in advance of the Meetings relating to its consideration of the Agreements, including fees and estimated expense ratios of each class of the Fund, and for a representative class of the Fund, as compared with the fees and expense ratios of a peer group of funds. Both the peer group and the funds within the peer group (collectively, the “Peer Group”) were selected by Lipper, Inc. (“Lipper”), which is not affiliated with BlackRock1. The Board also received (a) information regarding BlackRock’s economic outlook for the Fund and its general investment outlook for the markets; (b) information regarding fees paid to service providers that are affiliates of BlackRock; and (c) information outlining the legal duties of the Board under the 1940 Act with respect to the consideration and approval of the Agreements. The Board also noted information received at prior Board meetings concerning compliance records and regulatory matters relating to BlackRock.
The Board also considered other matters it deemed important to the approval process, such as payments made to BlackRock or its affiliates relating to the distribution of Fund shares and securities lending, services related to the valuation and pricing of Fund portfolio holdings, direct and indirect benefits to BlackRock and its affiliates from their relationship with the Fund and advice from independent legal counsel with respect to the review process and materials submitted for the Board’s review. The Board noted the willingness of BlackRock personnel to engage in open, candid discussions with the Board. The Board did not identify any particular information as determinative, and each Board Member may have attributed different weights to the various items considered.
A. Nature, Extent and Quality of the Services: The Board, including the Independent Board Members, reviewed the nature, extent and quality of services to be provided by BlackRock, including the investment advisory services to be provided to the Fund. The Board received information concerning the investment philosophy and investment process to be used by BlackRock in managing the Fund, as well as a description of the capabilities, personnel and services of BlackRock. In connection with this review, the Board considered BlackRock’s in-house research capabilities as well as other
| | 1 | | Funds are ranked by Lipper in quartiles, ranging from first to fourth, where first is the most desirable quartile position and fourth is the least desirable. |
| | | | | | |
| | | BLACKROCK FUNDS | | JANUARY 31, 2015 | | 93 |
| | |
Disclosure of Investment Advisory Agreement and Sub-Advisory Agreement (continued) | | |
resources available to its personnel. The Board considered the scope of the services provided by BlackRock to the Fund under the Agreements relative to services typically provided by third parties to other funds. The Board noted that the standard of care applicable under the Agreements was comparable to that found generally in investment company advisory agreements. The Board concluded that the scope of BlackRock’s services to be provided to the Fund was consistent with the Fund’s operational requirements, including, in addition to seeking to meet its investment objective, compliance with investment restrictions, tax and reporting requirements and related shareholder services.
The Board, including the Independent Board Members, also considered the quality of the administrative and non-investment advisory services to be provided by BlackRock and its affiliates to the Fund. The Board evaluated the procedures of BlackRock designed to fulfill its fiduciary duty to the Fund with respect to possible conflicts of interest, including BlackRock’s code of ethics (regulating the personal trading of BlackRock’s officers and employees), the procedures by which BlackRock allocates trades among its various investment advisory clients, the integrity of the systems in place to ensure compliance with the foregoing and the record of BlackRock in these matters. The Board also noted information received at prior Board meetings concerning standards of BlackRock with respect to the execution of portfolio transactions.
The Board considered, among other factors, with respect to BlackRock: the number, education and experience of investment personnel generally and the Fund’s portfolio management team; investments by portfolio managers in the funds they manage; portfolio trading capabilities; use of technology; commitment to compliance; credit analysis capabilities; risk analysis and oversight capabilities; and the approach to training and retaining portfolio managers and other research, advisory and management personnel. The Board reviewed BlackRock’s compensation structure with respect to the Fund’s portfolio management team and BlackRock’s ability to attract and retain high-quality talent and create performance incentives. The Board also considered the business reputation of BlackRock and its financial resources and concluded that BlackRock would be able to meet any reasonably foreseeable obligation under the Agreements.
In addition to advisory services, the Board considered the quality of the administrative and non-investment advisory services to be provided to the Fund. The Board noted that BlackRock and its affiliates will provide the Fund with certain administrative, shareholder and other services (in addition to any such services provided to the Fund by third parties) and officers and other personnel as are necessary for the operations of the Fund. In particular, BlackRock and its affiliates will provide the Fund with the following administrative services, including, among others: (i) preparing disclosure documents, such as the prospectus, the summary prospectus, the statement of additional information and periodic shareholder reports; (ii) oversight of daily accounting and pricing; (iii) overseeing and coordinating the activities of other service providers; (iv) organizing Board meetings and preparing the materials for such Board meetings; (v) providing legal and compliance support; (vi) furnishing analytical and other support to assist the Board in its consideration of strategic issues such as the merger or consolidation of certain open-end funds; and (vii) performing other administrative functions necessary for the operation of the Fund, such as tax reporting, fulfilling regulatory filing requirements and call center services. The Board reviewed the structure and duties of BlackRock’s fund administration, shareholder services, legal and compliance departments and considered BlackRock’s policies and procedures for assuring compliance with applicable laws and regulations.
B. The Investment Performance of the Fund and BlackRock: The Board, including the Independent Board Members, previously received and considered information about BlackRock’s investment performance for other funds. The Board, however, did not consider the performance history of the Fund because the Fund was newly organized and had not yet commenced operations as of the date of the Meetings.
C. Consideration of the Advisory Fees and the Cost of the Services and Profits to be Realized by BlackRock and its Affiliates from their Relationship with the Fund: In connection with the initial approval of the Agreements, the Board, including the Independent Board Members, reviewed the Fund’s contractual management fee ratio compared with the other funds in the Fund’s Lipper category. The contractual management fee rate represents a combination of the advisory fee and any administrative fees, before taking into account any reimbursements or fee waivers. The Board also compared the Fund’s estimated total expense ratio, as well as estimated actual management fee rate, to those of other funds in its Lipper category. The total expense ratio represents a fund’s total net operating expenses, including any 12b-1 or non 12b-1 service fees. The total expense ratio gives effect to any expense reimbursements or fee waivers that benefit a fund, and the actual management fee rate gives effect to any management fee reimbursements or waivers that benefit a fund. Additionally, the Board noted information received at prior Board meetings concerning the services provided and the fees charged by BlackRock and its affiliates to other types of clients with similar investment mandates, as applicable, including institutional accounts.
The Board noted that the Fund’s contractual management fee rate ranked in the third quartile, and that the estimated actual management fee and the estimated total expense ratio each ranked in the third quartile, relative to the Fund’s Peers. The Board also noted that the Fund has an advisory fee arrangement that includes breakpoints that adjust the fee rate downward as the size of the Fund increases above certain contractually specified levels. The Board also noted that BlackRock has contractually agreed to a cap on the Fund’s total net operating expenses as a percentage of the Fund’s average daily net assets on a class-by-class basis.
Following consideration of this information, the Board, including the independent Board Members, concluded that the fees to be paid pursuant to the Agreements were fair and reasonable in light of the services provided.
| | | | | | |
| 94 | | BLACKROCK FUNDS | | JANUARY 31, 2015 | | |
| | |
| Disclosure of Investment Advisory Agreement and Sub-Advisory Agreement (concluded) | | |
As the Fund had not commenced operations as of the date of the Meeting, BlackRock was not able to provide the Board with specific information concerning the expected profits to be realized by BlackRock and its affiliates from their relationships with the Fund. BlackRock, however, will provide the Board with such information at future meetings.
D. Economies of Scale: The Board, including the Independent Board Members, considered the extent to which economies of scale might be realized as the assets of the Fund increase. The Board noted the existence of breakpoints in the advisory fee based upon the asset level of the Fund. Further, the Board noted the existence of expense caps.
E. Other Factors Deemed Relevant by the Board Members: The Board, including the Independent Board Members, also took into account other ancillary or “fall-out” benefits that BlackRock or its affiliates may derive from their respective relationships with the Fund, both tangible and intangible, such as BlackRock’s ability to leverage its investment professionals who manage other portfolios and risk management personnel, an increase in BlackRock’s profile in the investment advisory community, and the engagement of BlackRock’s affiliates as service providers to the Fund, including for administrative, distribution, securities lending and cash management services. The Board also considered BlackRock’s overall operations and its efforts to expand the scale of, and improve the quality of, its operations. The Board also noted that BlackRock may use and benefit from third party research obtained by soft dollars generated by certain registered fund transactions to assist in managing all or a number of its other client accounts. The Board further noted that it had considered the investment by BlackRock’s funds in ETFs without any offset against the management fees payable by the funds to BlackRock.
The Board, including the Independent Board Members, concluded that these ancillary benefits that BlackRock and its affiliates could receive with regard to providing investment advisory and other services to the Fund were consistent with those generally available to other mutual fund sponsors.
Conclusion
The Board, including a majority of the Independent Board Members, approved the Advisory Agreement between the Manager and the Trust on behalf of the Fund and the Sub-Advisory Agreement between the Manager and the Sub-Advisor with respect to the Fund, each for a two-year term beginning on the effective date of the Agreements. Based upon its evaluation of all of the aforementioned factors in their totality, the Board, including a majority of the Independent Board Members, was satisfied that the terms of the Agreements were fair and reasonable and in the best interest of the Fund and its shareholders. In arriving at a decision to approve the Agreements, the Board did not identify any single factor or group of factors as all-important or controlling, but considered all factors together, and different Board Members may have attributed different weights to the various factors considered. The Independent Board Members were also assisted by the advice of independent legal counsel in making this determination.
| | | | | | |
| | | BLACKROCK FUNDS | | JANUARY 31, 2015 | | 95 |
Rodney D. Johnson, Chair of the Board and Trustee
David O. Beim, Trustee
Collette Chilton, Trustee
Frank J. Fabozzi, Trustee
Dr. Matina S. Horner, Trustee
Herbert I. London, Trustee
Ian A. MacKinnon, Trustee
Cynthia A. Montgomery, Trustee
Barbara G. Novick, Trustee
Joseph P. Platt, Trustee
Robert C. Robb, Jr., Trustee
Toby Rosenblatt, Trustee
Mark Stalnecker, Trustee
Kenneth L. Urish, Trustee
Frederick W. Winter, Trustee
John M. Perlowski, President and Chief Executive Officer
Richard Hoerner, CFA, Vice President
Jennifer McGovern, Vice President
Neal Andrews, Chief Financial Officer
Jay Fife, Treasurer
Charles Park, Chief Compliance Officer and Anti-Money Laundering Compliance Officer
Benjamin Archibald, Secretary
Effective September 19, 2014, Brendan Kyne resigned as a Vice President of the Trust and Jennifer McGovern became a Vice President of the Trust.
Effective December 31, 2014, Paul L. Audet and Henry Gabbay resigned as Trustees of the Trust and Ronald W. Forbes resigned as a Trustee of the Trust and Co-Chair of the Board. Effective January 1, 2015, Collette Chilton, Barbara G. Novick and Mark Stalnecker were appointed to serve as Trustees of the Trust.
Effective March 1, 2015, Charles Park resigned as Anti-Money Laundering Compliance Officer of the Trust and Fernanda Piedra became Anti-Money Laundering Compliance Officer of the Trust.
| | | | | | |
| | | | |
Investment Advisor and Administrator BlackRock Advisors, LLC Wilmington, DE 19809 | | Sub-Advisors BlackRock International Limited Edinburgh, EH3 8BL United Kingdom BlackRock (Singapore) Limited1 079912 Singapore | | Custodian The Bank of New York Mellon New York, NY 10286 | | Distributor BlackRock Investments, LLC New York, NY 10022 |
| | | | | | |
Accounting Agent and Transfer Agent BNY Mellon Investment Servicing (US) Inc. Wilmington, DE 19809 | | Legal Counsel Sidley Austin LLP New York, NY 10019 | | Independent Registered Public Accounting Firm PricewaterhouseCoopers LLP Philadelphia, PA 19103 | | Address of the Trust 100 Bellevue Parkway Wilmington, DE 19809 |
| | 1 | | For Global Long/Short Credit. |
| | | | | | |
| 96 | | BLACKROCK FUNDS | | JANUARY 31, 2015 | | |
Householding
The Funds will mail only one copy of shareholder documents, including prospectuses, annual and semi-annual reports and proxy statements, to shareholders with multiple accounts at the same address. This practice is commonly called “householding” and is intended to reduce expenses and eliminate duplicate mailings of shareholder documents. Mailings of your shareholder documents may be householded indefinitely unless you instruct us otherwise. If you do not want the mailing of these documents to be combined with those for other members of your household, please call the Funds at (800) 441-7762.
Availability of Quarterly Schedule of Investments
The Funds file their complete schedule of portfolio holdings with the SEC for the first and third quarters of each fiscal year on Form N-Q. The Funds’ Forms N-Q are available on the SEC’s website at http://www.sec.gov and may also be reviewed and copied at the SEC’s Public Reference Room in Washington, DC. Information on how to access documents on the SEC’s website without charge may be obtained by calling (800) SEC-0330. The Funds’ Forms N-Q may also be obtained upon request and without charge by calling (800) 441-7762.
Availability of Proxy Voting Policies and Procedures
A description of the policies and procedures that the Funds use to determine how to vote proxies relating to portfolio securities is available upon request and without charge, (1) by calling (800) 441-7762; (2) at http://www.blackrock.com; and (3) on the SEC’s website at http://www.sec.gov.
Availability of Proxy Voting Record
Information about how the Funds voted proxies relating to securities held in the Funds’ portfolios during the most recent 12-month period ended June 30 is available upon request and without charge (1) at http://www.blackrock.com or by calling (800) 441-7762 and (2) on the SEC’s website at http://www.sec.gov.
BlackRock’s Mutual Fund Family
BlackRock offers a diverse lineup of open-end mutual funds crossing all investment styles and managed by experts in equity, fixed income and tax-exempt investing. Visit http://www.blackrock.com for more information.
Account Information
Call us at (800) 441-7762 from 8:00 AM to 6:00 PM EST on any business day to get information about your account balances, recent transactions and share prices. You can also reach us on the Web at http://www.blackrock.com/funds.
Automatic Investment Plans
Investor Class shareholders who want to invest regularly can arrange to have $50 or more automatically deducted from their checking or savings account and invested in any of the BlackRock funds.
Systematic Withdrawal Plans
Investor Class shareholders can establish a systematic withdrawal plan and receive periodic payments of $50 or more from their BlackRock funds, as long as their account balance is at least $10,000.
Retirement Plans
Shareholders may make investments in conjunction with Traditional, Rollover, Roth, Coverdell, Simple IRAs, SEP IRAs and 403(b) Plans.
| | | | | | |
| | | BLACKROCK FUNDS | | JANUARY 31, 2015 | | 97 |
| | |
| Additional Information (concluded) | | |
|
| BlackRock Privacy Principles |
BlackRock is committed to maintaining the privacy of its current and former fund investors and individual clients (collectively, “Clients”) and to safeguarding their non-public personal information. The following information is provided to help you understand what personal information BlackRock collects, how we protect that information and why in certain cases we share such information with select parties.
If you are located in a jurisdiction where specific laws, rules or regulations require BlackRock to provide you with additional or different privacy-related rights beyond what is set forth below, then BlackRock will comply with those specific laws, rules or regulations.
BlackRock obtains or verifies personal non-public information from and about you from different sources, including the following: (i) information we receive from you or, if applicable, your financial intermediary, on applications, forms or other documents; (ii) information about your transactions with us, our affiliates, or others; (iii) information we receive from a consumer reporting agency; and (iv) from visits to our websites.
BlackRock does not sell or disclose to non-affiliated third parties any non-public personal information about its Clients, except as permitted by law or as is necessary to respond to regulatory requests or to service Client accounts. These non-affiliated third parties are required to protect the confidentiality and security of this information and to use it only for its intended purpose.
We may share information with our affiliates to service your account or to provide you with information about other BlackRock products or services that may be of interest to you. In addition, BlackRock restricts access to non-public personal information about its Clients to those BlackRock employees with a legitimate business need for the information. BlackRock maintains physical, electronic and procedural safeguards that are designed to protect the non-public personal information of its Clients, including procedures relating to the proper storage and disposal of such information.
| | | | | | |
| 98 | | BLACKROCK FUNDS | | JANUARY 31, 2015 | | |
This report is intended for current holders. It is not authorized for use as an offer of sale or a solicitation of an offer to buy shares of the Funds unless preceded or accompanied by the Funds’ current prospectus. Past performance results shown in this report should not be considered a representation of future performance. Investment returns and principal value of shares will fluctuate so that shares, when redeemed, may be worth more or less than their original cost. Statements and other information herein are as dated and are subject to change.

| | |
| |
CSGLSCMT-1/15-SAR | | 
|
JANUARY 31, 2015
| | | | |
SEMI-ANNUAL REPORT (UNAUDITED) | | | | BLACKROCK® |
BlackRock FundsSM
„ BlackRock Multi-Asset Real Return Fund
„ BlackRock Strategic Risk Allocation Fund
| | |
| Not FDIC Insured ¡ May Lose Value ¡ No Bank Guarantee | | |
| | |

| | Shareholders can sign up for e-mail notifications of quarterly statements, annual and semi-annual shareholder reports and prospectuses by enrolling in the electronic delivery program. Electronic copies of shareholder reports and prospectuses are also available on BlackRock’s website. TO ENROLL IN ELECTRONIC DELIVERY: Shareholders Who Hold Accounts with Investment Advisors, Banks or Brokerages: Please contact your financial advisor. Please note that not all investment advisors, banks or brokerages may offer this service. Shareholders Who Hold Accounts Directly with BlackRock: 1. Access the BlackRock website at blackrock.com 2. Select "Access Your Account" 3. Next, select "eDelivery" in the "Related Resources" box and follow the sign-up instructions |
| | | | | | |
| 2 | | BLACKROCK FUNDS | | JANUARY 31, 2015 | | |
Dear Shareholder,
Market volatility, while remaining below the long-term average level, increased over the course of 2014 and into 2015, driven largely by higher valuations in risk assets (such as equities and high yield bonds), escalating geopolitical risks, uneven global economic growth and expectations around policy moves from the world’s largest central banks. Surprisingly, U.S. interest rates trended lower through the period even as the U.S. Federal Reserve (the “Fed”) gradually reduced its bond buying program, which ultimately ended in October.
The first half of 2014 was generally a strong period for most asset classes; however, volatility ticked up in the summer as geopolitical tensions intensified in Ukraine and the Middle East and investors feared that better U.S. economic indicators may compel the Fed to increase short-term interest rates sooner than previously anticipated. Global credit markets tightened as the U.S. dollar strengthened versus other currencies, ultimately putting a strain on investor flows, and financial markets broadly weakened in the third quarter.
Several themes dominated the markets in the fourth quarter that resulted in the strong performance of U.S. markets versus other areas of the world. Economic growth strengthened considerably in the United States while the broader global economy showed signs of slowing. The European Central Bank and the Bank of Japan took aggressive measures to stimulate growth while the Fed moved toward tighter policy, causing further strengthening in the U.S. dollar. Fixed income investors piled into U.S. Treasuries where yields, although persistently low, were comparatively higher than yields on international sovereign debt, while equity investors favored the relative stability of U.S.-based companies amid rising global risks.
Oil prices, which had been gradually declining since mid-summer, suddenly plummeted in the fourth quarter due to a global supply-and-demand imbalance. Energy stocks sold off sharply and oil-exporting economies struggled, mainly within emerging markets. Conversely, the consumer sectors benefited from lower oil prices as savings at the gas pumps freed up discretionary income for other goods and services.
These trends shifted at the beginning of 2015. U.S. equity markets starkly underperformed international markets due to stretched valuations and uncertainty around the Fed’s pending rate hike. In addition, the stronger U.S. dollar began to hurt earnings of large cap companies. The energy sector continued to struggle, although oil prices showed signs of stabilizing toward the end of January as suppliers became more disciplined in their exploration and production efforts.
At BlackRock, we believe investors need to think globally, extend their scope across a broad array of asset classes and be prepared to move freely as market conditions change over time. We encourage you to talk with your financial advisor and visit blackrock.com for further insight about investing in today’s markets.
Sincerely,

Rob Kapito
President, BlackRock Advisors, LLC

Rob Kapito
President, BlackRock Advisors, LLC
| | | | | | | | |
| Total Returns as of January 31, 2015 | |
| | | 6-month | | | 12-month | |
U.S. large cap equities
(S&P 500® Index) | | | 4.37 | % | | | 14.22 | % |
U.S. small cap equities
(Russell 2000® Index) | | | 4.72 | | | | 4.41 | |
International equities
(MSCI Europe, Australasia,
Far East Index) | | | (6.97 | ) | | | (0.43 | ) |
Emerging market equities
(MSCI Emerging Markets
Index) | | | (9.05 | ) | | | 5.23 | |
3-month Treasury bill
(BofA Merrill Lynch
3-Month U.S. Treasury
Bill Index) | | | 0.01 | | | | 0.03 | |
U.S. Treasury securities
(BofA Merrill Lynch
10- Year U.S. Treasury
Index) | | | 9.29 | | | | 12.25 | |
U.S. investment grade
bonds (Barclays U.S.
Aggregate Bond Index) | | | 4.36 | | | | 6.61 | |
Tax-exempt municipal
bonds (S&P Municipal
Bond Index) | | | 4.51 | | | | 8.81 | |
U.S. high yield bonds
(Barclays U.S. Corporate
High Yield 2% Issuer
Capped Index) | | | (0.89 | ) | | | 2.41 | |
|
| Past performance is no guarantee of future results. Index performance is shown for illustrative purposes only. You cannot invest directly in an index. | |
| | | | | | |
| | | THIS PAGE NOT PART OF YOUR FUND REPORT | | | | 3 |
| | | | |
Fund Summary as of January 31, 2015 | | | BlackRock Multi-Asset Real Return Fund | |
BlackRock Multi-Asset Real Return Fund’s (the “Fund”) investment objective is to seek to generate returns in excess of the actual rate of inflation over a complete market cycle.
|
| Portfolio Management Commentary |
How did the Fund perform?
| Ÿ | | For the six-month period ended January 31, 2015, the Fund underperformed both benchmarks, the Barclays U.S. Treasury Inflation Protected Securities (“TIPS”) Index and the U.S. Consumer Price Index. |
What factors influenced performance?
| Ÿ | | A precipitous drop in oil prices, amid slower global growth trends, led to negative returns across most energy-related areas of the market, which ultimately proved to be the largest detractor from the Fund’s performance. In particular, allocations to broad-based commodities, direct exposure to Brent oil (i.e., light sweet crude) and energy equities all produced double-digit losses during the period. |
| Ÿ | | The most significant contributors to performance included exposure to health care and financials stocks, as both sectors produced positive returns during a challenging period for risk assets. |
Describe recent portfolio activity.
| Ÿ | | In September, the Fund reduced exposure to energy-related securities by one third and increased its positioning within health care and financials to be more aligned with positive U.S. growth expectations and a weaker global commodities outlook. In December, the Fund introduced an equity wage basket (i.e., stocks positioned to benefit from wage inflation and |
| | increasing economic activity in the United States) by selling some energy and health care exposure. |
| Ÿ | | The Fund employs derivatives as part of its investment strategy. At the end of the period, derivative positions included total return swaps on the S&P GSCI Commodity Index and Bloomberg Brent Crude Commodity Sub-Index in order to gain broad commodities and oil-related exposure. These derivative positions detracted from performance as commodities moved broadly lower over the period. The Fund also currently holds U.S. duration managed risk positions and holdings in a high yield credit default swap, which expresses a clear view on high yield credit without any underlying interest rate exposure. Neither of these positions had a material impact on performance during the period. |
| Ÿ | | Cash was used to offset the Fund’s derivative exposure. The Fund’s cash balance did not have a material impact on performance. |
Describe Fund positioning at period end.
| Ÿ | | At period end, the Fund was allocated across a number of diverse asset classes. In fixed income, the Fund held TIPS. The Fund also held allocations in equities, commodities, real estate investment trusts and master limited partnerships, while maintaining a small cash position. |
The views expressed reflect the opinions of BlackRock as of the date of this report and are subject to change based on changes in market, economic or other conditions. These views are not intended to be a forecast of future events and are no guarantee of future results.
| | |
| Portfolio Composition | | Percent of Long-Term Investments |
| | |
Investment Companies | | 51% |
U.S. Treasury Obligations | | 32 |
Common Stocks | | 17 |
| | |
| Ten Largest Holdings | | Percent of
Long-Term Investments |
| | |
U.S. Treasury Inflation Indexed Notes | | 24% |
BlackRock Floating Rate Income Portfolio, Institutional Class | | 23 |
Financial Select Sector SPDR Fund | | 10 |
Health Care Select Sector SPDR Fund | | 9 |
U.S. Treasury Inflation Indexed Bonds | | 9 |
iShares Gold Trust | | 5 |
Energy Select Sector SPDR Fund | | 4 |
Shell Midstream Partners LP | | —1 |
Enterprise Products Partners LP | | —1 |
Magellan Midstream Partners LP | | —1 |
1 Less than 1% of long-term investments. |
| | | | | | |
| 4 | | BLACKROCK FUNDS | | JANUARY 31, 2015 | | |
| | | | |
| | | | BlackRock Multi-Asset Real Return Fund | |
|
| Total Return Based on a $10,000 Investment |
| | 1 | Assuming maximum sales charges, if any, transaction costs and other operating expenses, including investment advisory fees and administration fees, if any. Institutional Shares do not have a sales charge. |
| | 2 | The Fund uses an asset allocation strategy, investing varying percentages of its portfolio in the following major categories: TIPS, equity securities, commodity-related securities, REITs, MLPs and bonds. |
| | 3 | An unmanaged index that measures the performance of the inflation-protected public obligations of the U.S. Treasury. |
| | 4 | A measure of the average change over time in the prices paid by urban consumers for a market basket of consumer goods and services. |
| | 5 | Commencement of operations. |
|
| Performance Summary for the Period Ended January 31, 2015 |
| | | | | | | | | | | | | | | | | | | | |
| | | | | | Average Annual Total Returns6 | |
| | | | | | 1 Year | | | Since Inception7 | |
| | | 6-Month
Total Returns | | | w/o sales
charge | | | w/ sales
charge | | | w/o sales
charge | | | w/ sales
charge | |
Institutional | | | (6.18 | )% | | | (2.43 | )% | | | N/A | | | | 1.30 | % | | | N/A | |
Investor A | | | (6.40 | ) | | | (2.83 | ) | | | (7.93 | )% | | | 0.98 | | | | (1.59 | )% |
Investor C | | | (6.65 | ) | | | (3.44 | ) | | | (4.38 | ) | | | 0.30 | | | | 0.30 | |
Barclays U.S. TIPS Index | | | 0.98 | | | | 4.83 | | | | N/A | | | | (1.33 | ) | | | N/A | |
U.S. Consumer Price Index | | | (1.48 | ) | | | 0.82 | | | | N/A | | | | 0.95 | | | | N/A | |
| | 6 | | Assuming maximum sales charges, if any. Average annual total returns with and without sales charges reflect reductions for distribution and service fees. See “About Fund Performance” on page 8 for a detailed description of share classes, including any related sales charges and fees. |
| | 7 | | The Fund commenced operations on December 27, 2012. |
| | | | N/A—Not applicable as share class and index do not have a sales charge. |
| | | | Past performance is not indicative of future results. |
| | | | | | | | | | | | | | | | | | | | | | | | | | | | |
| | | Actual | | | Hypothetical9 | | | | |
| | | Beginning
Account Value
August 1, 2014 | | | Ending
Account Value
January 31, 2015 | | | Expenses Paid
During the Period8 | | | Beginning
Account Value
August 1, 2014 | | | Ending
Account Value
January 31, 2015 | | | Expenses Paid
During the Period8 | | | Annualized
Expense Ratio | |
Institutional | | | $1,000.00 | | | | $938.20 | | | | $3.91 | | | | $1,000.00 | | | | $1,021.17 | | | | $4.08 | | | | 0.80 | % |
Investor A | | | $1,000.00 | | | | $936.00 | | | | $5.12 | | | | $1,000.00 | | | | $1,019.91 | | | | $5.35 | | | | 1.05 | % |
Investor C | | | $1,000.00 | | | | $933.50 | | | | $8.77 | | | | $1,000.00 | | | | $1,016.13 | | | | $9.15 | | | | 1.80 | % |
| | 8 | | For each class of the Fund, expenses are equal to the annualized expense ratio for the class, multiplied by the average account value over the period, multiplied by 184/365 (to reflect the one-half year period shown). |
| | 9 | | Hypothetical 5% annual return before expenses is calculated by prorating the number of days in the most recent fiscal period divided by 365. |
| | | | See “Disclosure of Expenses” on page 8 for further information on how expenses were calculated. |
| | | | | | |
| | | BLACKROCK FUNDS | | JANUARY 31, 2015 | | 5 |
| | | | |
Fund Summary as of January 31, 2015 | | | BlackRock Strategic Risk Allocation Fund | |
BlackRock Strategic Risk Allocation Fund’s (the “Fund”) investment objective is to seek total return.
|
| Portfolio Management Commentary |
How did the Fund perform?
| Ÿ | | For the six-month period ended January 31, 2015, the Fund’s Institutional Shares returned 2.65%, while the Investor A Shares returned 2.58% and Investor C Shares returned 2.14%. For the same period, a blend of 60% MSCI World Index (hedged)/50% Barclays U.S. Aggregate Bond Index returned 4.30%. |
What factors influenced performance?
| Ÿ | | The Fund has a global multi-asset strategy designed to balance sources of risk and return more optimally than traditional asset allocation portfolios. The Fund will determine the appropriate allocation across classes by seeking a balance of exposure to risks such as interest rate, credit, inflation, liquidity, economic and emerging market risks. |
| Ÿ | | The performance of the blend of 60% MSCI World Index Hedged USD Net/40% Barclays U.S. Aggregate Bond Index is primarily determined by the performance of equity markets. Measured in terms of risk rather than dollars, the comparative index has an allocation of approximately 90% in equities and 10% in bonds. |
| Ÿ | | The Fund’s commodities exposure negatively impacted the Fund’s return for the period, driven in large part by a sharp decline in crude oil prices. Emerging market debt and emerging market equities also detracted from performance. Volatility strategies detracted to a lesser degree. |
| Ÿ | | From an asset class perspective, the largest positive contributor to performance was exposure to nominal and inflation-linked government debt, followed by large and small cap equities. In addition, the Fund made substantial gains from its currency hedging policy as the dollar rallied strongly over other currencies. |
| Ÿ | | The Fund uses derivatives as a part of its investment strategy. Derivatives are used by the Fund as a means of taking long-term positions in global markets and to achieve and/or manage various risk exposures, which may include economic, interest rate, emerging markets, credit, inflation and liquidity risks. During the period, the Fund’s derivatives positions designed to protect against any rapid rise in U.S. interest rates had a negative impact on returns as rates declined. |
| Ÿ | | The Fund held cash in reserve in order to meet any potential margin calls. The cash balance did not have a material impact on performance. |
Describe recent portfolio activity.
| Ÿ | | From a broad perspective, the Fund reduced overall exposure to risk between mid-October and mid-January in response to higher volatility and falling investor sentiment in the wake of the collapse in oil prices and the prospect of a global economic slowdown. The investment team returned the Fund’s risk level to its long-term target around the time the European Central Bank announced plans for purchases of government bonds in support of the region’s economy. |
Describe Fund positioning at period end.
| Ÿ | | As of period end, the Fund maintained its full target risk allocation. The Fund was positioned with the view that risks and opportunities are very balanced between the possibility of accelerating growth on the one hand and of substantial economic shocks, especially out of Europe, on the other. The Fund continued to have protection in place against possible spikes in U.S. interest rates. Equities represented about 43% of total risk, followed by real assets at 24%, developed and emerging bonds at 22% and credit at 11%. |
The views expressed reflect the opinions of BlackRock as of the date of this report and are subject to change based on changes in market, economic or other conditions. These views are not intended to be a forecast of future events and are no guarantee of future results.
| | |
| Portfolio Composition | | Percent of
Long-Term Investments |
| | |
Foreign Government Obligations | | 57% |
U.S. Treasury Obligations | | 31 |
Investment Companies | | 12 |
| | |
| Portfolio Holdings | | Percent of
Long-Term Investments |
| | |
U.S. Treasury Notes | | 31% |
Sweden Inflation Linked Bond | | 15 |
Australia Government Inflation Linked Bond | | 13 |
iShares TIPS Bond ETF | | 12 |
Republic of France Inflation Linked Bond | | 11 |
Canadian Government Bond | | 7 |
United Kingdom Gilt Inflation Linked Bond | | 7 |
Deutsche Bundesrepublik Inflation Linked Bond | | 4 |
| | | | | | |
| 6 | | BLACKROCK FUNDS | | JANUARY 31, 2015 | | |
| | | | |
| | | | BlackRock Strategic Risk Allocation Fund | |
|
| Total Return Based on a $10,000 Investment |
| | 1 | Assuming maximum sales charges, if any, transaction costs and other operating expenses, including investment advisory fees and administration fees, if any. Institutional Shares do not have a sales charge. |
| | 2 | The Fund invests in a broad range of global asset classes, such as equity securities, fixed and floating rate debt instruments, derivatives, other investment companies, REITs and commodity-related instruments. |
| | 3 | This customized weighted index is comprised of the returns of the 60% MSCI World Index Hedged USD Net/40% Barclays U.S. Aggregate Bond Index. |
| | 4 | An index composed of the following 23 developed market country indices: Australia, Austria, Belgium, Canada, Denmark, Finland, France, Ger-many, Hong Kong, Ireland, Israel, Italy, Japan, Netherlands, New Zealand, Norway, Portugal, Singapore, Spain, Sweden, Switzerland, the United Kingdom, and the United States and calculated with net dividends reinvested daily on the ex-dividends date 100% hedged to USD using 1-month forward exchange rates. |
| | 5 | A widely recognized unmanaged market-weighted index, comprised of investment-grade corporate bonds rated BBB or better, mortgages and U.S. Treasury and U.S. Government agency issues with at least one year to maturity. |
| | 6 | Commencement of operations. |
|
| Performance Summary for the Period Ended January 31, 2015 |
| | | | | | | | | | | | | | | | | | | | |
| | | | | | Average Annual Total Returns7 | |
| | | | | | 1 Year | | | Since Inception8 | |
| | | 6-Month
Total Returns | | | w/o sales
charge | | | w/ sales
charge | | | w/o sales
charge | | | w/ sales
charge | |
Institutional | | | 2.65 | % | | | 10.88 | % | | | N/A | | | | 3.90 | % | | | N/A | |
Investor A | | | 2.58 | | | | 10.58 | | | | 4.78 | % | | | 3.67 | | | | 1.04 | % |
Investor C | | | 2.14 | | | | 9.69 | | | | 8.69 | | | | 2.82 | | | | 2.82 | |
60% MSCI World Index Hedged USD Net/40% Barclays U.S. Aggregate Bond Index | | | 4.30 | | | | 10.27 | | | | N/A | | | | 11.59 | | | | N/A | |
MSCI World Index Hedged USD Net | | | 4.23 | | | | 12.71 | | | | N/A | | | | 17.70 | | | | N/A | |
Barclays U.S. Aggregate Bond Index | | | 4.36 | | | | 6.61 | | | | N/A | | | | 2.78 | | | | N/A | |
| | 7 | | Assuming maximum sales charges, if any. Average annual total returns with and without sales charges reflect reductions for distribution and service fees. See “About Fund Performance” on page 8 for a detailed description of share classes, including any related sales charges and fees. |
| | 8 | | The Fund commenced operations on December 27, 2012. |
| | | | N/A—Not applicable as share class and index do not have a sales charge. |
| | | | Past performance is not indicative of future results. |
| | | | | | | | | | | | | | | | | | | | | | | | | | | | |
| | | Actual | | | Hypothetical10 | | | | |
| | | Beginning
Account Value
August 1, 2014 | | | Ending
Account Value
January 31, 2015 | | | Expenses Paid
During the Period9 | | | Beginning
Account Value
August 1, 2014 | | | Ending
Account Value
January 31, 2015 | | | Expenses Paid
During the Period9 | | | Annualized
Expense Ratio | |
Institutional | | | $1,000.00 | | | | $1,026.50 | | | | $5.11 | | | | $1,000.00 | | | | $1,020.16 | | | | $5.09 | | | | 1.00 | % |
Investor A | | | $1,000.00 | | | | $1,025.80 | | | | $6.38 | | | | $1,000.00 | | | | $1,018.90 | | | | $6.36 | | | | 1.25 | % |
Investor C | | | $1,000.00 | | | | $1,021.40 | | | | $10.19 | | | | $1,000.00 | | | | $1,015.12 | | | | $10.16 | | | | 2.00 | % |
| | 9 | | For each class of the Fund, expenses are equal to the annualized expense ratio for the class, multiplied by the average account value over the period, multiplied by 184/ 365 (to reflect the one-half year period shown). |
| | 10 | | Hypothetical 5% annual return before expenses is calculated by prorating the number of days in the most recent fiscal period divided by 365. |
| | | | See “Disclosure of Expenses” on page 8 for further information on how expenses were calculated. |
| | | | | | |
| | | BLACKROCK FUNDS | | JANUARY 31, 2015 | | 7 |
| Ÿ | | Institutional Shares are not subject to any sales charge. These shares bear no ongoing distribution or service fees and are available only to certain eligible investors. |
| Ÿ | | Investor A Shares are subject to a maximum initial sales charge (front-end load) of 5.25% and a service fee of 0.25% per year (but no distribution fee). Certain redemptions of these shares may be subject to a contingent deferred sales charge (“CDSC”) where no initial sales charge was paid at the time of purchase. These shares are generally available through financial intermediaries. |
| Ÿ | | Investor C Shares are subject to a 1.00% CDSC if redeemed within one year of purchase. In addition, these shares are subject to a distribution fee of 0.75% per year and a service fee of 0.25% per year. These shares are generally available through financial intermediaries. |
Performance information reflects past performance and does not guarantee future results. Current performance may be lower or higher than the performance data quoted. Refer to www.blackrock.com/funds to obtain performance data current to the most recent month end. Performance results do not reflect the deduction of taxes that a shareholder would pay on fund distributions or the redemption of fund shares.
Figures shown in the performance tables on the previous pages assume reinvestment of all distributions, if any, at net asset value (“NAV”) on the ex-dividend date. Investment return and principal value of shares will fluctuate so that shares, when redeemed, may be worth more or less than their original cost. Distributions paid to each class of shares will vary because of the different levels of service, distribution and transfer agency fees applicable to each class, which are deducted from the income available to be paid to shareholders.
BlackRock Advisors, LLC (the “Manager”), the Funds’ investment advisor, has contractually agreed to waive and/or reimburse a portion of each Fund’s expenses. Without such waiver and/or reimbursement, each Fund’s performance would have been lower. The Manager is under no obligation to continue waiving and/or reimbursing its fees after the applicable termination date of such agreement. See Note 5 of the Notes to Consolidated Financial Statements for additional information on waivers and/or reimbursements.
Shareholders of the Funds may incur the following charges: (a) transactional expenses, such as sales charges; and (b) operating expenses, including investment advisory fees, administration fees, service and distribution fees, including 12b-1 fees, acquired fund fees and expenses and other Fund expenses. The expense examples shown on the previous pages (which are based on a hypothetical investment of $1,000 invested on August 1, 2014 and held through January 31, 2015) are intended to assist shareholders both in calculating expenses based on an investment in each Fund and in comparing these expenses with similar costs of investing in other mutual funds.
The expense examples provide information about actual account values and actual expenses. In order to estimate the expenses a shareholder paid during the period covered by this report, shareholders can divide their account value by $1,000 and then multiply the result by the number corresponding to their Fund and share class under the headings entitled “Expenses Paid During the Period.”
The expense examples also provide information about hypothetical account values and hypothetical expenses based on a Fund’s actual expense ratio and an assumed rate of return of 5% per year before expenses. In order to assist shareholders in comparing the ongoing expenses of investing in these Funds and other funds, compare the 5% hypothetical examples with the 5% hypothetical examples that appear in shareholder reports of other funds.
The expenses shown in the expense examples are intended to highlight shareholders’ ongoing costs only and do not reflect any transactional expenses, such as sales charges, if any. Therefore, the hypothetical examples are useful in comparing ongoing expenses only, and will not help shareholders determine the relative total expenses of owning different funds. If these transactional expenses were included, shareholder expenses would have been higher.
| | | | | | |
| 8 | | BLACKROCK FUNDS | | JANUARY 31, 2015 | | |
| | |
Derivative Financial Instruments | | |
The Funds may invest in various derivative financial instruments. Derivative financial instruments are used to obtain exposure to a security, index and/or market without owning or taking physical custody of securities or to manage market, equity, credit, interest rate, foreign currency exchange rate, commodity and/or other risks. Derivative financial instruments may give rise to a form of economic leverage. Derivative financial instruments also involve risks, including the imperfect correlation between the value of a derivative financial instrument and the underlying asset, possible default of the counterparty to the transaction or illiquidity of the derivative financial instrument. The Funds’ ability to use a derivative financial
instrument successfully depends on the investment advisor’s ability to predict pertinent market movements accurately, which cannot be assured. The use of derivative financial instruments may result in losses greater than if they had not been used, may limit the amount of appreciation a Fund can realize on an investment, and/or may result in lower distributions paid to shareholders. The Funds’ investments in these instruments are discussed in detail in the Notes to Consolidated Financial Statements.
| | | | | | |
| | | BLACKROCK FUNDS | | JANUARY 31, 2015 | | 9 |
| | | | |
| Consolidated Schedule of Investments January 31, 2015 (Unaudited) | | | BlackRock Multi-Asset Real Return Fund | |
| | | (Percentages shown are based on Net Assets) | |
| | | | | | | | |
| Common Stocks | | Shares | | | Value | |
Air Freight & Logistics — 0.0% | | | | | | | | |
CH Robinson Worldwide, Inc. | | | 235 | | | $ | 16,737 | |
Automobiles — 0.1% | | | | | | | | |
Ford Motor Co. | | | 2,010 | | | | 29,567 | |
General Motors Co. | | | 644 | | | | 21,007 | |
Harley-Davidson, Inc. | | | 316 | | | | 19,497 | |
| | | | | | | | |
| | | | | | | | 70,071 | |
Banks — 0.1% | | | | | | | | |
Bank of America Corp. | | | 2,483 | | | | 37,617 | |
Citigroup, Inc. | | | 519 | | | | 24,367 | |
JPMorgan Chase & Co. | | | 709 | | | | 38,555 | |
| | | | | | | | |
| | | | | | | | 100,539 | |
Beverages — 0.0% | | | | | | | | |
Monster Beverage Corp. (a) | | | 138 | | | | 16,139 | |
Biotechnology — 0.2% | | | | | | | | |
Alexion Pharmaceuticals, Inc. (a) | | | 32 | | | | 5,864 | |
Amgen, Inc. | | | 112 | | | | 17,053 | |
Biogen Idec, Inc. (a) | | | 66 | | | | 25,685 | |
Celgene Corp. (a) | | | 222 | | | | 26,454 | |
Gilead Sciences, Inc. (a) | | | 536 | | | | 56,189 | |
Regeneron Pharmaceuticals, Inc. (a) | | | 10 | | | | 4,167 | |
| | | | | | | | |
| | | | | | | | 135,412 | |
Capital Markets — 0.1% | | | | | | | | |
Affiliated Managers Group, Inc. (a) | | | 15 | | | | 3,083 | |
Ameriprise Financial, Inc. | | | 91 | | | | 11,370 | |
Franklin Resources, Inc. | | | 226 | | | | 11,646 | |
The Goldman Sachs Group, Inc. | | | 456 | | | | 78,619 | |
| | | | | | | | |
| | | | | | | | 104,718 | |
Chemicals — 0.2% | | | | | | | | |
CF Industries Holdings, Inc. | | | 75 | | | | 22,904 | |
The Dow Chemical Co. | | | 803 | | | | 36,263 | |
LyondellBasell Industries NV, Class A | | | 733 | | | | 57,973 | |
Monsanto Co. | | | 110 | | | | 12,978 | |
The Mosaic Co. | | | 326 | | | | 15,873 | |
| | | | | | | | |
| | | | | | | | 145,991 | |
Communications Equipment — 0.1% | | | | | | | | |
Cisco Systems, Inc. | | | 1,282 | | | | 33,800 | |
QUALCOMM, Inc. | | | 765 | | | | 47,782 | |
| | | | | | | | |
| | | | | | | | 81,582 | |
Consumer Finance — 0.0% | | | | | | | | |
American Express Co. | | | 31 | | | | 2,501 | |
| | | | | | | | |
| Common Stocks | | Shares | | | Value | |
Diversified Consumer Services — 0.0% | | | | | | | | |
H&R Block, Inc. | | | 379 | | | $ | 12,992 | |
Diversified Financial Services — 0.1% | | | | | | | | |
Berkshire Hathaway, Inc., Class B (a) | | | 60 | | | | 8,635 | |
CME Group, Inc. | | | 330 | | | | 28,149 | |
Intercontinental Exchange, Inc. | | | 7 | | | | 1,440 | |
The NASDAQ OMX Group, Inc. | | | 37 | | | | 1,687 | |
| | | | | | | | |
| | | | | | | | 39,911 | |
Diversified Telecommunication Services — 0.0% | | | | | | | | |
Verizon Communications, Inc. | | | 647 | | | | 29,574 | |
Electric Utilities — 0.0% | | | | | | | | |
NextEra Energy, Inc. | | | 354 | | | | 38,671 | |
Food & Staples Retailing — 0.2% | | | | | | | | |
Costco Wholesale Corp. | | | 723 | | | | 103,382 | |
CVS Health Corp. | | | 259 | | | | 25,423 | |
Sysco Corp. | | | 950 | | | | 37,211 | |
| | | | | | | | |
| | | | | | | | 166,016 | |
Food Products — 0.1% | | | | | | | | |
Archer-Daniels-Midland Co. | | | 1,148 | | | | 53,531 | |
The JM Smucker Co. | | | 257 | | | | 26,510 | |
Kraft Foods Group, Inc. | | | 395 | | | | 25,809 | |
| | | | | | | | |
| | | | | | | | 105,850 | |
Health Care Equipment & Supplies — 0.0% | | | | | | | | |
Intuitive Surgical, Inc. (a) | | | 10 | | | | 4,945 | |
Health Care Providers & Services — 0.4% | | | | | | | | |
Aetna, Inc. | | | 237 | | | | 21,761 | |
AmerisourceBergen Corp. | | | 762 | | | | 72,428 | |
Anthem, Inc. | | | 234 | | | | 31,581 | |
Cardinal Health, Inc. | | | 420 | | | | 34,940 | |
Express Scripts Holding Co. (a) | | | 458 | | | | 36,965 | |
McKesson Corp. | | | 277 | | | | 58,904 | |
UnitedHealth Group, Inc. | | | 37 | | | | 3,931 | |
| | | | | | | | |
| | | | | | | | 260,510 | |
Household Durables — 0.0% | | | | | | | | |
DR Horton, Inc. | | | 716 | | | | 17,556 | |
Lennar Corp., Class A | | | 14 | | | | 629 | |
PulteGroup, Inc. | | | 308 | | | | 6,342 | |
| | | | | | | | |
| | | | | | | | 24,527 | |
Household Products — 0.1% | | | | | | | | |
The Procter & Gamble Co. | | | 561 | | | | 47,287 | |
| | | | | | | | | | |
| ASX | | Australian Securities Exchange | | HKD | | Hong Kong Dollar | | S&P | | Standard & Poor’s |
| AUD | | Australian Dollar | | INR | | Indian Rupee | | SEK | | Swedish Krona |
| BRL | | Brazilian Real | | JPY | | Japanese Yen | | SGD | | Singapore Dollar |
| CAD | | Canadian Dollar | | KRW | | Korean Won | | SPDR | | Standard & Poor’s Depositary Receipts |
| CBOE | | Chicago Board Option Exchange | | LIBOR | | London Interbank Offered Rate | | SPI | | Share Price Index Futures |
| CHF | | Swiss Franc | | LP | | Limited Partnership | | TIPS | | Treasury Inflation Protected Securities |
| ETF | | Exchange-Traded Fund | | MYR | | Malaysian Ringgit | | TOPIX | | Tokyo Stock Price Index |
| EUR | | Euro | | PHP | | Philippine Peso | | TWD | | Taiwan New Dollar |
| FTSE | | Financial Times Stock Exchange | | REIT | | Real Estate Investment Trust | | USD | | U.S. Dollar |
| GBP | | British Pound | | RUB | | Russian Ruble | | | | |
See Notes to Consolidated Financial Statements.
| | | | | | |
| 10 | | BLACKROCK FUNDS | | JANUARY 31, 2015 | | |
| | | | |
| Consolidated Schedule of Investments (continued) | | | BlackRock Multi-Asset Real Return Fund | |
| | | (Percentages shown are based on Net Assets) | |
| | | | | | | | |
| Common Stocks | | Shares | | | Value | |
Independent Power and Renewable Electricity Producers — 0.1% | |
NextEra Energy Partners LP | | | 1,080 | | | $ | 43,297 | |
NRG Energy, Inc. | | | 51 | | | | 1,258 | |
| | | | | | | | |
| | | | | | | | 44,555 | |
Industrial Conglomerates — 0.1% | |
General Electric Co. | | | 2,668 | | | | 63,739 | |
Insurance — 0.4% | |
ACE Ltd. | | | 114 | | | | 12,307 | |
Aflac, Inc. | | | 1,785 | | | | 101,888 | |
American International Group, Inc. | | | 240 | | | | 11,729 | |
The Chubb Corp. | | | 284 | | | | 27,804 | |
Genworth Financial, Inc., Class A (a) | | | 766 | | | | 5,347 | |
Lincoln National Corp. | | | 284 | | | | 14,194 | |
MetLife, Inc. | | | 266 | | | | 12,369 | |
Torchmark Corp. | | | 903 | | | | 45,213 | |
XL Group PLC | | | 1,131 | | | | 39,008 | |
| | | | | | | | |
| | | | | | | | 269,859 | |
Internet & Catalog Retail — 0.1% | |
Amazon.com, Inc. (a) | | | 93 | | | | 32,971 | |
Netflix, Inc. (a) | | | 61 | | | | 26,950 | |
The Priceline Group, Inc. (a) | | | 11 | | | | 11,104 | |
| | | | | | | | |
| | | | | | | | 71,025 | |
Internet Software & Services — 0.2% | |
Facebook, Inc., Class A (a) | | | 538 | | | | 40,840 | |
Google, Inc., Class A (a) | | | 127 | | | | 68,269 | |
Google, Inc., Class C (a) | | | 118 | | | | 63,073 | |
| | | | | | | | |
| | | | | | | | 172,182 | |
IT Services — 0.2% | |
MasterCard, Inc., Class A | | | 463 | | | | 37,980 | |
Visa, Inc., Class A | | | 328 | | | | 83,610 | |
| | | | | | | | |
| | | | | | | | 121,590 | |
Leisure Products — 0.0% | |
Hasbro, Inc. | | | 56 | | | | 3,076 | |
Machinery — 0.1% | |
PACCAR, Inc. | | | 654 | | | | 39,312 | |
Pentair PLC | | | 220 | | | | 13,598 | |
| | | | | | | | |
| | | | | | | | 52,910 | |
Media — 0.2% | |
DIRECTV (a) | | | 383 | | | | 32,662 | |
Discovery Communications, Inc., Class C (a) | | | 53 | | | | 1,478 | |
Scripps Networks Interactive, Inc., Class A | | | 168 | | | | 11,943 | |
Time Warner, Inc. | | | 102 | | | | 7,949 | |
Twenty-First Century Fox, Inc., Class A | | | 962 | | | | 31,900 | |
Viacom, Inc., Class B | | | 464 | | | | 29,891 | |
| | | | | | | | |
| | | | | | | | 115,823 | |
Multiline Retail — 0.0% | |
Kohl’s Corp. | | | 205 | | | | 12,243 | |
Multi-Utilities — 0.0% | |
Public Service Enterprise Group, Inc. | | | 112 | | | | 4,780 | |
Oil, Gas & Consumable Fuels — 4.8% | |
Access Midstream Partners LP | | | 3,990 | | | | 206,483 | |
Anadarko Petroleum Corp. | | | 206 | | | | 16,841 | |
Antero Midstream Partners LP (a) | | | 1,600 | | | | 37,520 | |
Apache Corp. | | | 46 | | | | 2,878 | |
Cabot Oil & Gas Corp. | | | 50 | | | | 1,325 | |
| | | | | | | | |
| Common Stocks | | Shares | | | Value | |
Oil, Gas & Consumable Fuels (concluded) | |
Chevron Corp. | | | 628 | | | $ | 64,389 | |
ConocoPhillips | | | 327 | | | | 20,594 | |
Delek Logistics Partners LP | | | 2,860 | | | | 101,930 | |
Dominion Midstream Partners LP | | | 5,000 | | | | 174,250 | |
Enable Midstream Partners LP | | | 1,940 | | | | 34,493 | |
Energy Transfer Partners LP (a) | | | 1,770 | | | | 108,678 | |
Enterprise Products Partners LP | | | 8,180 | | | | 281,719 | |
EOG Resources, Inc. | | | 606 | | | | 53,952 | |
EQT Midstream Partners LP | | | 1,810 | | | | 153,579 | |
Exxon Mobil Corp. | | | 1,650 | | | | 144,243 | |
Genesis Energy LP | | | 2,660 | | | | 115,258 | |
Kinder Morgan, Inc. | | | 3,070 | | | | 126,023 | |
Magellan Midstream Partners LP | | | 3,320 | | | | 257,366 | |
Marathon Oil Corp. | | | 886 | | | | 23,568 | |
Marathon Petroleum Corp. | | | 67 | | | | 6,204 | |
MarkWest Energy Partners LP | | | 3,190 | | | | 187,987 | |
MPLX LP | | | 2,420 | | | | 192,487 | |
Murphy Oil Corp. | | | 61 | | | | 2,740 | |
ONEOK Partners LP | | | 1,570 | | | | 64,904 | |
ONEOK, Inc. | | | 413 | | | | 18,184 | |
PBF Logistics LP | | | 1,400 | | | | 31,920 | |
Phillips 66 | | | 565 | | | | 39,731 | |
Phillips 66 Partners LP | | | 780 | | | | 56,488 | |
Plains All American Pipeline LP | | | 3,630 | | | | 180,012 | |
QEP Midstream Partners LP | | | 1,772 | | | | 27,643 | |
QEP Resources, Inc. | | | 98 | | | | 1,982 | |
Rose Rock Midstream LP | | | 570 | | | | 24,316 | |
Shell Midstream Partners LP | | | 8,100 | | | | 324,162 | |
Sunoco Logistics Partners LP | | | 4,220 | | | | 176,058 | |
Targa Resources Partners LP | | | 1,620 | | | | 72,981 | |
Tesoro Corp. | | | 92 | | | | 7,519 | |
Tesoro Logistics LP | | | 1,841 | | | | 101,273 | |
Valero Energy Corp. | | | 335 | | | | 17,715 | |
Valero Energy Partners LP | | | 1,180 | | | | 58,941 | |
| | | | | | | | |
| | | | | | | | 3,518,336 | |
Pharmaceuticals — 0.2% | |
AbbVie, Inc. | | | 382 | | | | 23,054 | |
Bristol-Myers Squibb Co. | | | 143 | | | | 8,619 | |
Johnson & Johnson | | | 483 | | | | 48,368 | |
Merck & Co., Inc. | | | 333 | | | | 20,073 | |
Pfizer, Inc. | | | 1,072 | | | | 33,500 | |
| | | | | | | | |
| | | | | | | | 133,614 | |
Real Estate Investment Trusts (REITs) — 4.8% | |
Alexandria Real Estate Equities, Inc. | | | 498 | | | | 48,565 | |
Allied Properties Real Estate Investment Trust | | | 2,094 | | | | 65,916 | |
American Realty Capital Properties, Inc. | | | 2,079 | | | | 19,262 | |
American Tower Corp. | | | 290 | | | | 28,116 | |
Astro Japan Property Group | | | 7,197 | | | | 28,014 | |
AvalonBay Communities, Inc. | | | 711 | | | | 122,996 | |
Boston Properties, Inc. | | | 1,578 | | | | 219,026 | |
The British Land Co. PLC | | | 9,792 | | | | 122,028 | |
Camden Property Trust | | | 701 | | | | 54,012 | |
Canadian Real Estate Investment Trust | | | 798 | | | | 30,282 | |
CBL & Associates Properties, Inc. | | | 1,390 | | | | 28,662 | |
CyrusOne, Inc. | | | 1,597 | | | | 44,796 | |
Derwent London PLC | | | 1,211 | | | | 59,177 | |
EPR Properties | | | 797 | | | | 51,853 | |
Equity One, Inc. | | | 2,214 | | | | 60,309 | |
Equity Residential | | | 1,484 | | | | 115,173 | |
See Notes to Consolidated Financial Statements.
| | | | | | |
| | | BLACKROCK FUNDS | | JANUARY 31, 2015 | | 11 |
| | | | |
| Consolidated Schedule of Investments (continued) | | | BlackRock Multi-Asset Real Return Fund | |
| | | (Percentages shown are based on Net Assets) | |
| | | | | | | | |
| Common Stocks | | Shares | | | Value | |
Real Estate Investment Trusts (REITs) (concluded) | | | | | | | | |
Essex Property Trust, Inc. | | | 364 | | | $ | 82,282 | |
Extra Space Storage, Inc. | | | 1,549 | | | | 102,234 | |
Federal Realty Investment Trust | | | 548 | | | | 78,786 | |
Federation Centres | | | 16,505 | | | | 38,712 | |
Fonciere Des Regions | | | 720 | | | | 73,754 | |
Goodman Group | | | 10,321 | | | | 48,928 | |
Gramercy Property Trust, Inc. | | | 5,883 | | | | 40,710 | |
HCP, Inc. | | | 865 | | | | 40,906 | |
Health Care REIT, Inc. | | | 1,869 | | | | 153,165 | |
Healthcare Trust of America, Inc., Class A | | | 1,230 | | | | 36,236 | |
Host Hotels & Resorts, Inc. | | | 1,934 | | | | 44,269 | |
Kenedix Residential Investment Corp. | | | 33 | | | | 95,616 | |
Kilroy Realty Corp. | | | 570 | | | | 42,266 | |
The Link REIT | | | 11,500 | | | | 77,794 | |
The Macerich Co. | | | 586 | | | | 50,402 | |
McKay Securities PLC | | | 8,249 | | | | 28,577 | |
Medical Properties Trust, Inc. | | | 2,042 | | | | 31,386 | |
MID Reit, Inc. | | | 8 | | | | 20,462 | |
Mirvac Group | | | 33,779 | | | | 50,524 | |
National Health Investors, Inc. | | | 609 | | | | 45,529 | |
Parkway Properties, Inc. | | | 1,828 | | | | 33,452 | |
Pebblebrook Hotel Trust | | | 1,398 | | | | 64,923 | |
Prologis, Inc. | | | 2,034 | | | | 91,815 | |
Public Storage | | | 174 | | | | 34,946 | |
Rexford Industrial Realty, Inc. | | | 3,745 | | | | 59,995 | |
RLJ Lodging Trust | | | 1,500 | | | | 51,105 | |
Sekisui House Reit, Inc. | | | 24 | | | | 29,226 | |
Shaftesbury PLC | | | 4,170 | | | | 48,776 | |
SIA Reit, Inc. | | | 2 | | | | 8,779 | |
Simon Property Group, Inc. | | | 1,226 | | | | 243,557 | |
SL Green Realty Corp. | | | 490 | | | | 61,740 | |
Spirit Realty Capital, Inc. | | | 2,268 | | | | 29,166 | |
STAG Industrial, Inc. | | | 988 | | | | 25,886 | |
Starts Proceed Investment Corp. | | | 18 | | | | 33,302 | |
Sunstone Hotel Investors, Inc. | | | 3,899 | | | | 66,478 | |
Taubman Centers, Inc. | | | 724 | | | | 59,332 | |
Unibail-Rodamco SE | | | 207 | | | | 58,303 | |
Vastned Retail NV | | | 712 | | | | 35,300 | |
Ventas, Inc. | | | 1,563 | | | | 124,743 | |
Weingarten Realty Investors | | | 1,734 | | | | 64,990 | |
Westfield Corp. | | | 9,224 | | | | 70,362 | |
| | | | | | | | |
| | | | | | | | 3,576,901 | |
Real Estate Management & Development — 1.3% | | | | | | | | |
Ayala Land, Inc. | | | 69,100 | | | | 56,277 | |
Croesus Retail Trust | | | 50,000 | | | | 34,928 | |
Franshion Properties China Ltd. | | | 108,000 | | | | 31,709 | |
Global Logistic Properties Ltd. | | | 65,000 | | | | 121,276 | |
Kenedix, Inc. | | | 5,000 | | | | 22,488 | |
Kennedy Wilson Europe Real Estate PLC | | | 2,802 | | | | 43,892 | |
Kungsleden AB | | | 5,350 | | | | 40,985 | |
LEG Immobilien AG (a) | | | 1,053 | | | | 80,629 | |
Mitsubishi Estate Co. Ltd. | | | 6,000 | | | | 120,725 | |
Nomura Real Estate Holdings, Inc. | | | 2,400 | | | | 40,384 | |
Peet Ltd. | | | 42,557 | | | | 34,293 | |
Sponda OYJ | | | 9,710 | | | | 44,719 | |
ST Modwen Properties PLC | | | 7,015 | | | | 44,187 | |
Sumitomo Realty & Development Co. Ltd. | | | 2,000 | | | | 63,794 | |
Sun Hung Kai Properties Ltd. | | | 7,000 | | | | 113,906 | |
The Wharf Holdings Ltd. | | | 8,000 | | | | 64,810 | |
| | | | | | | | |
| | | | | | | | 959,002 | |
| | | | | | | | |
| Common Stocks | | Shares | | | Value | |
Road & Rail — 0.0% | | | | | | | | |
Union Pacific Corp. | | | 203 | | | $ | 23,794 | |
Semiconductors & Semiconductor Equipment — 0.1% | | | | | |
Avago Technologies Ltd. | | | 400 | | | | 41,152 | |
Intel Corp. | | | 353 | | | | 11,663 | |
| | | | | | | | |
| | | | | | | | 52,815 | |
Software — 0.1% | | | | | | | | |
Microsoft Corp. | | | 1,574 | | | | 63,590 | |
Specialty Retail — 0.1% | | | | | | | | |
AutoNation, Inc. (a) | | | 386 | | | | 23,013 | |
CarMax, Inc. (a) | | | 298 | | | | 18,506 | |
GameStop Corp., Class A | | | 59 | | | | 2,080 | |
L Brands, Inc. | | | 84 | | | | 7,109 | |
Staples, Inc. | | | 362 | | | | 6,172 | |
Tractor Supply Co. | | | 87 | | | | 7,062 | |
| | | | | | | | |
| | | | | | | | 63,942 | |
Technology Hardware, Storage & Peripherals — 0.3% | | | | | |
Apple, Inc. | | | 1,659 | | | | 194,368 | |
SanDisk Corp. | | | 82 | | | | 6,225 | |
| | | | | | | | |
| | | | | | | | 200,593 | |
Textiles, Apparel & Luxury Goods — 0.0% | | | | | | | | |
NIKE, Inc., Class B | | | 369 | | | | 34,040 | |
Thrifts & Mortgage Finance — 0.0% | | | | | | | | |
Hudson City Bancorp, Inc. | | | 326 | | | | 2,924 | |
Tobacco — 0.3% | | | | | | | | |
Altria Group, Inc. | | | 2,484 | | | | 131,900 | |
Lorillard, Inc. | | | 204 | | | | 13,384 | |
Reynolds American, Inc. | | | 797 | | | | 54,156 | |
| | | | | | | | |
| | | | | | | | 199,440 | |
Total Common Stocks — 15.1% | | | | | | | 11,164,746 | |
| | | | | | | | |
| Investment Companies | | | | | | |
Equity Funds — 24.8% | | | | | | | | |
Energy Select Sector SPDR Fund | | | 30,545 | | | | 2,307,675 | |
Financial Select Sector SPDR Fund | | | 290,148 | | | | 6,676,305 | |
Health Care Select Sector SPDR Fund | | | 90,324 | | | | 6,256,743 | |
iShares Gold Trust (a)(b)(c) | | | 248,203 | | | | 3,085,163 | |
| | | | | | | | |
| | | | | | | | 18,325,886 | |
Fixed Income Funds — 21.1% | | | | | | | | |
BlackRock Floating Rate Income Portfolio, Institutional Class (c) | | | 1,501,263 | | | | 15,327,895 | |
iShares TIPS Bond ETF (c) | | | 1,728 | | | | 199,809 | |
| | | | | | | | |
| | | | | | | | 15,527,704 | |
Total Investment Companies — 45.9% | | | | | | | 33,853,590 | |
| | | | | | | | |
| | | | | | | |
See Notes to Consolidated Financial Statements.
| | | | | | |
| 12 | | BLACKROCK FUNDS | | JANUARY 31, 2015 | | |
| | | | |
| Consolidated Schedule of Investments (continued) | | | BlackRock Multi-Asset Real Return Fund | |
| | | (Percentages shown are based on Net Assets) | |
| | | | | | | | | | | | |
| U.S. Treasury Obligations | | | | | Par
(000) | | | Value | |
U.S. Treasury Inflation Indexed Bonds: | | | | | | | | | | | | |
2.38%, 1/15/25-1/15/27 | | | USD | | | | 953 | | | $ | 1,180,728 | |
2.00%, 1/15/26 | | | | | | | 440 | | | | 529,308 | |
1.75%, 1/15/28 | | | | | | | 350 | | | | 415,153 | |
3.63%, 4/15/28 | | | | | | | 299 | | | | 429,352 | |
2.50%, 1/15/29 | | | | | | | 341 | | | | 443,077 | |
3.88%, 4/15/29 | | | | | | | 359 | | | | 536,780 | |
3.38%, 4/15/32 | | | | | | | 140 | | | | 208,801 | |
2.13%, 2/15/40-2/15/41 | | | | | | | 423 | | | | 589,756 | |
0.75%, 2/15/42 | | | | | | | 418 | | | | 439,987 | |
0.63%, 2/15/43 | | | | | | | 308 | | | | 315,460 | |
1.38%, 2/15/44 | | | | | | | 469 | | | | 576,915 | |
U.S. Treasury Inflation Indexed Notes: | | | | | | | | | | | | |
0.13%, 4/15/16-7/15/24 | | | | | | | 7,918 | | | | 8,029,382 | |
2.50%, 7/15/16 | | | | | | | 444 | | | | 465,560 | |
2.38%, 1/15/17 | | | | | | | 386 | | | | 408,865 | |
2.63%, 7/15/17 | | | | | | | 330 | | | | 358,645 | |
1.63%, 1/15/18 | | | | | | | 350 | | | | 372,100 | |
1.38%, 7/15/18-1/15/20 | | | | | | | 787 | | | | 847,336 | |
2.13%, 1/15/19 | | | | | | | 319 | | | | 351,170 | |
1.88%, 7/15/19 | | | | | | | 365 | | | | 402,733 | |
1.25%, 7/15/20 | | | | | | | 677 | | | | 734,618 | |
1.13%, 1/15/21 | | | | | | | 777 | | | | 836,163 | |
0.63%, 7/15/21-1/15/24 | | | | | | | 1,755 | | | | 1,847,131 | |
| | | | | | | | | | | | |
| U.S. Treasury Obligations | | | | | Par (000) | | | Value | |
0.38%, 7/15/23 | | | USD | | | | 934 | | | $ | 967,266 | |
0.25%, 1/15/25 | | | | | | | 335 | | | | 340,845 | |
Total U.S. Treasury Obligations — 29.3% | | | | | | | | 21,627,131 | |
Total Long-Term Investments (Cost — $65,402,013) — 90.3% | | | | | | | | 66,645,467 | |
| | | | | | | | | | | | |
| Short-Term Securities | | | | | Shares | | | | |
BlackRock Liquidity Funds, TempFund, Institutional Class, 0.06% (c)(d) | | | | | | | 5,032,753 | | | | 5,032,753 | |
Total Short-Term Securities (Cost — $5,032,753) — 6.8% | | | | 5,032,753 | |
Total Investments (Cost — $70,434,766) — 97.1% | | | | 71,678,220 | |
Other Assets Less Liabilities — 2.9% | | | | 2,134,438 | |
| | | | | | | | | | | | |
Net Assets — 100.0% | | | $ | 73,812,658 | |
| | | | | | | | | | | | |
|
| Notes to Consolidated Schedule of Investments |
| (a) | Non-income producing security. |
| (b) | All or a portion of security is held by a wholly owned subsidiary. See Note 1 of the Notes to Consolidated Financial Statements for details on the wholly owned subsidiary. |
| (c) | During the six months ended January 31, 2015, investments in issuers considered to be affiliates of the Fund for purposes of Section 2(a)(3) of the Investment Company Act of 1940, as amended, were as follows: |
| | | | | | | | | | | | | | | | | | | | | | | | | | | | |
| Affiliate | | Shares/
Beneficial Interest
Held at
July 31, 2014 | | | Shares
Purchased | | | Shares/Beneficial
Interest Sold | | | Shares Held at
January 31, 2015 | | | Value at
January 31, 2015 | | | Income | | | Realized
Gain (Loss) | |
BlackRock Floating Rate Income Portfolio, Institutional Class | | | 1,465,343 | | | | 35,920 | | | | — | | | | 1,501,263 | | | $ | 15,327,895 | | | $ | 371,457 | | | | — | |
BlackRock Liquidity Funds, TempFund, Institutional Class | | | 18,058,622 | | | | — | | | | (13,025,869 | )1 | | | 5,032,753 | | | $ | 5,032,753 | | | $ | 2,834 | | | | — | |
BlackRock Liquidity Series, LLC, Money Market Series | | $ | 95,250 | | | | — | | | $ | (95,250 | )1 | | | — | | | | — | | | $ | 1,349 | | | | — | |
iShares S&P GSCI Commodity Indexed Trust | | | 10,765 | | | | 27,812 | | | | (38,577 | ) | | | — | | | | — | | | | — | | | $ | (238,935 | ) |
iShares TIPS Bond ETF | | | 1,728 | | | | — | | | | — | | | | 1,728 | | | $ | 199,809 | | | $ | 1,053 | | | | — | |
iShares Gold Trust | | | 248,203 | | | | — | | | | — | | | | 248,203 | | | $ | 3,085,163 | | | | — | | | | — | |
iShares iBoxx $ High Yield Corporate Bond ETF | | | 2,304 | | | | — | | | | (2,304 | ) | | | — | | | | — | | | $ | 1,983 | | | $ | (5,826 | ) |
| | 1 | | Represents net shares/beneficial interest sold. |
| (d) | Represents the current yield as of report date. |
| Ÿ | | As of January 31, 2015, financial futures contracts outstanding were as follows: |
| | | | | | | | | | | | | | | | | | | | | | |
Contracts
Short | | | Issue | | Exchange | | Expiration | | | Notional Value | | | Unrealized
Depreciation | |
| | (57 | ) | | U.S. Treasury Notes (10 Year) | | Chicago Board of Trade | | | March 2015 | | | | USD | | | | 7,459,875 | | | $ | (271,116 | ) |
See Notes to Consolidated Financial Statements.
| | | | | | |
| | | BLACKROCK FUNDS | | JANUARY 31, 2015 | | 13 |
| | | | |
| Consolidated Schedule of Investments (continued) | | | BlackRock Multi-Asset Real Return Fund | |
| Ÿ | | As of January 31, 2015, forward foreign currency exchange contracts outstanding were as follows: |
| | | | | | | | | | | | | | | | | | | | | | |
Currency Purchased | | | | | Currency Sold | | | Counterparty | | Settlement
Date | | | Unrealized
Appreciation
(Depreciation) | |
| CAD | | | 35,000 | | | | | USD | | | 28,072 | | | Bank of America N.A. | | | 4/22/15 | | | $ | (528 | ) |
| CHF | | | 31,853 | | | | | USD | | | 37,505 | | | Morgan Stanley Capital Services LLC | | | 4/22/15 | | | | (2,674 | ) |
| EUR | | | 29,483 | | | | | USD | | | 34,022 | | | HSBC Bank PLC | | | 4/22/15 | | | | (681 | ) |
| GBP | | | 31,868 | | | | | USD | | | 48,200 | | | State Street Bank and Trust Co. | | | 4/22/15 | | | | (228 | ) |
| HKD | | | 110,486 | | | | | USD | | | 14,250 | | | HSBC Bank PLC | | | 4/22/15 | | | | 2 | |
| JPY | | | 2,111,652 | | | | | USD | | | 18,000 | | | HSBC Bank PLC | | | 4/22/15 | | | | — | |
| JPY | | | 8,504,000 | | | | | USD | | | 72,483 | | | HSBC Bank PLC | | | 4/22/15 | | | | 8 | |
| SEK | | | 80,864 | | | | | USD | | | 9,964 | | | HSBC Bank PLC | | | 4/22/15 | | | | (183 | ) |
| USD | | | 16,100 | | | | | AUD | | | 19,742 | | | Goldman Sachs International | | | 4/22/15 | | | | 812 | |
| USD | | | 6,067 | | | | | GBP | | | 4,000 | | | BNP Paribas S.A. | | | 4/22/15 | | �� | | 46 | |
| USD | | | 127,811 | | | | | GBP | | | 84,504 | | | HSBC Bank PLC | | | 4/22/15 | | | | 605 | |
| USD | | | 40,364 | | | | | JPY | | | 4,755,000 | | | JPMorgan Chase Bank N.A. | | | 4/22/15 | | | | (169 | ) |
| USD | | | 47,823 | | | | | MYR | | | 171,545 | | | Standard Chartered Bank | | | 4/22/15 | | | | 863 | |
| USD | | | 50,498 | | | | | PHP | | | 2,280,000 | | | Standard Chartered Bank | | | 4/22/15 | | | | (1,029 | ) |
| USD | | | 25,247 | | | | | SGD | | | 33,522 | | | HSBC Bank PLC | | | 4/22/15 | | | | 494 | |
| Total | | | | | | | | | | | | | | | | | | | | $ | (2,662 | ) |
| | | | | | | | | | | | | | | | | | | | | | |
| Ÿ | | As of January 31, 2015, centrally cleared credit default swaps — sold protection outstanding were as follows: |
| | | | | | | | | | | | | | | | | | | | | | | | |
| Index | | Receive
Fixed Rate | | | Clearinghouse | | Expiration
Date | | Credit
Rating1 | | | Notional
Amount
(000)2 | | | Unrealized
Depreciation | |
CDX.NA.HY Series 23 Version 1 | | | 5.00 | % | | Chicago Mercantile | | 12/20/19 | | | B+ | | | | USD | | | | 5,643 | | | $ | (23,630 | ) |
| | 1 | | Using S&P’s rating of the issuer or the underlying securities of the index, as applicable. |
| | 2 | | The maximum potential amount the Fund may pay should a negative credit event take place as defined under the terms of the agreement. |
| Ÿ | | As of January 31, 2015, OTC total return swaps outstanding were as follows: |
| | | | | | | | | | | | | | | | | | | | | | | | | | |
| Reference Entity | | Fixed Amount | | | Counterparty | | Expiration
Date | | Notional Amount (000) | | | Value | | | Premiums
Paid
(Received) | | | Unrealized
Depreciation | |
Bloomberg Brent Crude Subindex1 | | USD | 1,558,557 | 2 | | JPMorgan Chase Bank N.A. | | 6/30/15 | | USD | | | 1,559 | | | $ | (185,008 | ) | | | — | | | $ | (185,008 | ) |
S&P GSCI Excess Return on the Commodity Index1 | | USD | 5,268,861 | 2 | | JPMorgan Chase Bank N.A. | | 6/30/15 | | USD | | | 5,269 | | | | (465,341) | | | | — | | | | (465,341 | ) |
Total | | | | | | | | | | | | | | | | $ | (650,349 | ) | | | — | | | $ | (650,349 | ) |
| | | | | | | | | | | | | | | | | | |
| | 1 | | All or a portion of security is held by a wholly owned subsidiary. See Note 1 of the Notes to Consolidated Financial Statements for details on the wholly owned subsidiary. |
| | 2 | | Fund receives the total return of the reference entity and pays the fixed amount. Net payment made at termination. |
See Notes to Consolidated Financial Statements.
| | | | | | |
| 14 | | BLACKROCK FUNDS | | JANUARY 31, 2015 | | |
| | | | |
| Consolidated Schedule of Investments (concluded) | | | BlackRock Multi-Asset Real Return Fund | |
| Ÿ | | Fair Value Measurements — Various inputs are used in determining the fair value of investments and derivative financial instruments. These inputs to valuation techniques are categorized into a disclosure hierarchy consisting of three broad levels for financial statement purposes. The hierarchy gives the highest priority to unadjusted quoted prices in active markets for identical assets or liabilities (Level 1 measurements) and the lowest priority to unobservable inputs (Level 3 measurements). Accordingly, the degree of judgment exercised in determining fair value is greatest for instruments categorized in Level 3. The inputs used to measure fair value may fall into different levels of the fair value hierarchy. In such cases, for disclosure purposes, the fair value hierarchy classification is determined based on the lowest level input that is significant to the fair value measurement in its entirety. The categorization of a value determined for investments and derivative financial instruments is based on the pricing transparency of the investment and derivative financial instrument and is not necessarily an indication of the risks associated with investing in those securities. The three levels of the fair value hierarchy are as follows: |
| | Ÿ | | Level 1 — unadjusted quoted prices in active markets/exchanges for identical assets or liabilities that the Fund has the ability to access |
| | Ÿ | | Level 2 — other observable inputs (including, but not limited to, quoted prices for similar assets or liabilities in markets that are active, quoted prices for identical or similar assets or liabilities in markets that are not active, inputs other than quoted prices that are observable for the assets or liabilities (such as interest rates, yield curves, volatilities, prepayment speeds, loss severities, credit risks and default rates) or other market–corroborated inputs) |
| | Ÿ | | Level 3 — unobservable inputs based on the best information available in the circumstances, to the extent observable inputs are not available (including the Fund’s own assumptions used in determining the fair value of investments and derivative financial instruments) |
Changes in valuation techniques may result in transfers into or out of an assigned level within the disclosure hierarchy. In accordance with the Fund’s policy, transfers between different levels of the fair value disclosure hierarchy are deemed to have occurred as of the beginning of the reporting period. For information about the Fund’s policy regarding valuation of investments and derivative financial instruments, refer to Note 2 of the Notes to Consolidated Financial Statements.
As of January 31, 2015, the following tables summarize the Fund’s investments and derivative financial instruments categorized in the disclosure hierarchy:
| | | | | | | | | | | | | | | | | | | | |
| | | Level 1 | | Level 2 | | Level 3 | | Total |
Assets: | | | | | | | | | | | | | | | | | | | | |
Investments: | | | | | | | | | | | | | | | | | | | | |
Long-Term Investments: | | | | | | | | | | | | | | | | | | | | |
Common Stocks | | | $ | 9,486,934 | | | | $ | 1,677,812 | | | | | — | | | | $ | 11,164,746 | |
Investment Companies | | | | 33,853,590 | | | | | — | | | | | — | | | | | 33,853,590 | |
U.S. Treasury Obligations | | | | — | | | | | 21,627,131 | | | | | — | | | | | 21,627,131 | |
Short-Term Securities | | | | 5,032,753 | | | | | — | | | | | — | | | | | 5,032,753 | |
| | | | | |
Total | | | $ | 48,373,277 | | | | $ | 23,304,943 | | | | | — | | | | $ | 71,678,220 | |
| | | | | |
| | | | | | | | | | | | | | | | | | | | |
| | | Level 1 | | Level 2 | | Level 3 | | Total |
Derivative Financial Instruments1 | | | | | | | | | | | | | | | | | | | | |
Assets: | | | | | | | | | | | | | | | | | | | | |
Foreign currency exchange contracts | | | | — | | | | $ | 2,830 | | | | | — | | | | $ | 2,830 | |
Liabilities: | | | | | | | | | | | | | | | | | | | | |
Commodity contracts | | | | — | | | | | (650,349 | ) | | | | — | | | | | (650,349 | ) |
Credit contracts | | | | — | | | | | (23,630 | ) | | | | — | | | | | (23,630 | ) |
Foreign currency exchange contracts | | | | — | | | | | (5,492 | ) | | | | — | | | | | (5,492 | ) |
Interest rate contracts | | | $ | (271,116 | ) | | | | — | | | | | — | | | | | (271,116 | ) |
| | | | | |
Total | | | $ | (271,116 | ) | | | $ | (676,641 | ) | | | | — | | | | $ | (947,757 | ) |
| | | | | |
1 Derivative financial instruments are swaps, financial futures contracts and forward foreign currency exchange contracts which are valued at the unrealized appreciation/ depreciation on the instrument. The Fund may hold assets in which the fair value approximates the carrying amount for financial statement purposes. As of January 31, 2015, such assets are categorized within the disclosure hierarchy as follows: | |
| | | | | | | | | | | | | | | | | | | | |
| | | Level 1 | | Level 2 | | Level 3 | | Total |
Assets: | | | | | | | | | | | | | | | | | | | | |
Cash | | | $ | 1,663,983 | | | | | — | | | | | — | | | | $ | 1,663,983 | |
Foreign currency at value | | | | 57,968 | | | | | — | | | | | — | | | | | 57,968 | |
Cash pledged for financial futures contracts | | | | 78,000 | | | | | — | | | | | — | | | | | 78,000 | |
Cash pledged as collateral for OTC derivatives | | | | 800,000 | | | | | — | | | | | — | | | | | 800,000 | |
Cash pledged for centrally cleared swaps | | | | 275,000 | | | | | — | | | | | — | | | | | 275,000 | |
| | | | | |
Total | | | $ | 2,874,951 | | | | | — | | | | | — | | | | $ | 2,874,951 | |
| | | | | |
During the six months ended January 31, 2015, there were no transfers between levels.
See Notes to Consolidated Financial Statements.
| | | | | | |
| | | BLACKROCK FUNDS | | JANUARY 31, 2015 | | 15 |
| | | | |
| Consolidated Schedule of Investments January 31, 2015 (Unaudited) | | | BlackRock Strategic Risk Allocation Fund | |
| | | (Percentages shown are based on Net Assets) | |
| | | | | | | | | | | | |
| Foreign Government Obligations | | | | | Par
(000) | | | Value | |
Australia — 8.4% | | | | | | | | | | | | |
Australia Government Inflation Linked Bond: | | | | | | | | | | | | |
1.00%, 11/21/18 | | | AUD | | | | 744 | | | $ | 610,594 | |
4.00%, 8/20/20 | | | | | | | 313 | | | | 472,851 | |
1.25%, 2/21/22 | | | | | | | 399 | | | | 354,345 | |
3.00%, 9/20/25 | | | | | | | 296 | | | | 339,183 | |
2.50%, 9/20/30 | | | | | | | 255 | | | | 290,064 | |
2.00%, 8/21/35 | | | | | | | 391 | | | | 401,257 | |
| | | | | | | | | | | | |
| | | | | | | | | | | | 2,468,294 | |
Canada — 4.9% | | | | | | | | | | | | |
Canadian Government Inflation Linked Bond: | | | | | | | | | | | | |
4.25%, 12/01/26 | | | CAD | | | | 400 | | | | 486,959 | |
4.00%, 12/01/31 | | | | | | | 302 | | | | 403,574 | |
2.00%, 12/01/41 | | | | | | | 156 | | | | 182,577 | |
1.50%, 12/01/44 | | | | | | | 232 | | | | 253,543 | |
1.25%, 12/01/47 | | | | | | | 98 | | | | 103,692 | |
| | | | | | | | | | | | |
| | | | | | | | | | | | 1,430,345 | |
France — 6.9% | | | | | | | | | | | | |
Republic of France Inflation Linked Bond: | | | | | | | | | | | | |
0.45%, 7/25/16 | | | EUR | | | | 367 | | | | 418,705 | |
0.10%, 7/25/21 | | | | | | | 163 | | | | 193,621 | |
1.10%, 7/25/22 | | | | | | | 470 | | | | 596,850 | |
1.85%, 7/25/27 | | | | | | | 367 | | | | 531,613 | |
0.70%, 7/25/30 | | | | | | | 210 | | | | 273,722 | |
| | | | | | | | | | | | |
| | | | | | | | | | | | 2,014,511 | |
Germany — 2.4% | | | | | | | | | | | | |
Deutsche Bundesrepublik Inflation Linked Bond: | | | | | | | | | | | | |
0.75%, 4/15/18 | | | | | | | 195 | | | | 226,818 | |
1.75%, 4/15/20 | | | | | | | 148 | | | | 187,597 | |
0.10%, 4/15/23 | | | | | | | 152 | | | | 183,428 | |
0.50%, 4/15/30 | | | | | | | 76 | | | | 101,238 | |
| | | | | | | | | | | | |
| | | | | | | | | | | | 699,081 | |
Sweden — 10.0% | | | | | | | | | | | | |
Sweden Inflation Linked Bond: | | | | | | | | | | | | |
0.50%, 6/01/17 | | | SEK | | | | 3,525 | | | | 452,073 | |
4.00%, 12/01/20 | | | | | | | 2,590 | | | | 506,330 | |
0.25%, 6/01/22 | | | | | | | 4,235 | | | | 543,472 | |
1.00%, 6/01/25 | | | | | | | 5,875 | | | | 815,655 | |
3.50%, 12/01/28 | | | | | | | 2,750 | | | | 629,588 | |
| | | | | | | | | | | | |
| | | | | | | | | | | | 2,947,118 | |
United Kingdom — 4.7% | | | | | | | | | | | | |
United Kingdom Gilt Inflation Linked Bond: | | | | | | | | | | | | |
0.13%, 3/22/24 | | | GBP | | | | 184 | | | | 306,189 | |
0.13%, 3/22/29 | | | | | | | 105 | | | | 182,450 | |
| | | | | | | | | | | | |
| Foreign Government Obligations | | | | | Par (000) | | | Value | |
United Kingdom (concluded) | | | | | | | | | | | | |
0.75%, 3/22/34 | | | GBP | | | | 116 | | | $ | 235,560 | |
1.13%, 11/22/37 | | | | | | | 46 | | | | 105,998 | |
0.13%, 3/22/44 | | | | | | | 160 | | | | 322,547 | |
0.75%, 11/22/47 | | | | | | | 93 | | | | 229,401 | |
| | | | | | | | | | | | |
| | | | | | | | | | | | 1,382,145 | |
Total Foreign Government Obligations — 37.3% | | | | | | | | 10,941,494 | |
| | | | | | | | | | | | |
| Investment Companies | | | | | Shares | | | | |
Fixed Income Funds — 8.1% | | | | | | | | | | | | |
iShares TIPS Bond ETF (a) | | | | | | | 20,416 | | | | 2,360,702 | |
| | | | | | | | | | | | |
| U.S. Treasury Obligations — 20.7% | | | | | Par (000) | | | | |
U.S. Treasury Notes, 4.13%, 5/15/15 (b) | | | USD | | | | 6,000 | | | | 6,068,436 | |
Total Long-Term Investments (Cost — $19,879,821) — 66.1% | | | | | | | | 19,370,632 | |
| | | | | | | | | | | | |
| Short-Term Securities | | | | | Shares | | | | |
BlackRock Liquidity Funds, TempFund, Institutional Class, 0.06% (a)(c)(d) | | | | | | | 9,020,003 | | | | 9,020,003 | |
Total Short-Term Securities (Cost — $9,020,003) — 30.8% | | | | | | | | | �� | | 9,020,003 | |
| | | | | | | | | | | | |
| Options Purchased | | | | | | | | | |
(Cost — $126,000) — 0.0% | | | | | | | | | | | 54 | |
Total Investments before Options Written (Cost — $29,025,824) — 96.9% | | | | | | | | | | | 28,390,689 | |
| | | | | | | | | | | | |
| Options Written | | | | | | | | | |
(Premiums Received — $62,160) — (2.1)% | | | | | | | | | | | (595,638 | ) |
Total Investments Net of Options Written — 94.8% | | | | | | | | 27,795,051 | |
Other Assets Less Liabilities — 5.2% | | | | | | | | | | | 1,511,640 | |
| | | | | | | | | | | | |
Net Assets — 100.0% | | | | | | | | | | $ | 29,306,691 | |
| | | | | | | | | | | | |
|
| Notes to Consolidated Schedule of Investments |
| (a) | During the six months ended January 31, 2015, investments in issuers considered to be affiliates of the Fund for purposes of Section 2(a)(3) of the Investment Company Act of 1940, as amended, were as follows: |
| | | | | | | | | | | | | | | | | | | | | | | | | | | | |
| Affiliate | | Shares Held at
July 31, 2014 | | | Shares
Purchased | | | Shares Sold | | | Shares Held at
January 31, 2015 | | | Value at
January 31, 2015 | | | Income | | | Realized
Gain | |
BlackRock Liquidity Funds, TempFund, Institutional Class | | | 15,083,019 | | | | — | | | | (6,063,016 | )1 | | | 9,020,003 | | | $ | 9,020,003 | | | $ | 2,721 | | | $ | 1,033 | |
iShares TIPS Bond ETF | | | 16,748 | | | | 3,668 | | | | — | | | | 20,416 | | | $ | 2,360,702 | | | $ | 10,208 | | | | — | |
| | 1 | | Represents net shares sold. |
| (b) | All or a portion of security has been pledged as collateral in connection with outstanding OTC derivatives. |
See Notes to Consolidated Financial Statements.
| | | | | | |
| 16 | | BLACKROCK FUNDS | | JANUARY 31, 2015 | | |
| | | | |
| Consolidated Schedule of Investments (continued) | | | BlackRock Strategic Risk Allocation Fund | |
| (c) | All or a portion of security is held by a wholly owned subsidiary. See Note 1 of the Notes to Consolidated Financial Statements for details on the wholly owned subsidiary. |
| (d) | Represents the current yield as of report date. |
| Ÿ | | As of January 31, 2015, financial futures contracts outstanding were as follows: |
| | | | | | | | | | | | | | | | | | | | | | |
Contracts
Long/
(Short) | | | Issue | | Exchange | | | Expiration | | Notional Value | | | Unrealized
Appreciation
(Depreciation) | |
| | 1 | | | ASX SPI 200 Index Futures1 | | | Sydney | | | March 2015 | | | USD | | | | 107,861 | | | $ | 8,368 | |
| | 37 | | | Australian Government Bond (10 Year) | | | Sydney | | | March 2015 | | | USD | | | | 3,796,005 | | | | 147,505 | |
| | 1 | | | E-mini Russell 2000 Index Futures1 | | | New York | | | March 2015 | | | USD | | | | 116,120 | | | | 2,354 | |
| | 12 | | | E-mini S&P 500 Index Futures1 | | | Chicago Mercantile | | | March 2015 | | | USD | | | | 1,193,040 | | | | (4,912 | ) |
| | 13 | | | EURO STOXX 50 Index Futures1 | | | Eurex | | | March 2015 | | | USD | | | | 491,966 | | | | 51,318 | |
| | 2 | | | FTSE 100 Index Futures1 | | | NYSE Liffe | | | March 2015 | | | USD | | | | 202,012 | | | | 17,757 | |
| | 31 | | | Japanese Government Bond (10 Year) | | | Singapore | | | March 2015 | | | USD | | | | 3,911,232 | | | | 23,291 | |
| | 6 | | | mini MSCI Emerging Markets Index Futures1 | | | New York | | | March 2015 | | | USD | | | | 285,450 | | | | 198 | |
| | 2 | | | TOPIX Index Futures1 | | | Tokyo | | | March 2015 | | | USD | | | | 240,909 | | | | 1,029 | |
| | (22 | ) | | CBOE Volatility Index Futures1 | | | Chicago Board of Trade | | | April 2015 | | | USD | | | | 446,600 | | | | (7,715 | ) |
| | Total | | | | | | | | | | | | | | | | | | | $ | 239,193 | |
| | | | | | | | | | | | | | | | | | | | | | |
| | 1 | | All or a portion of security is held by a wholly owned subsidiary. See Note 1 of the Notes to Consolidated Financial Statements for details on the wholly owned subsidiary. |
| Ÿ | | As of January 31, 2015, forward foreign currency exchange contracts outstanding were as follows: |
| | | | | | | | | | | | | | | | | | | | | | |
Currency Purchased | | | | | Currency Sold | | | Counterparty | | Settlement
Date | | | Unrealized
Appreciation
(Depreciation) | |
| USD | | | 580,821 | 1 | | | | AUD | | | 681,788 | | | Deutsche Bank AG | | | 3/03/15 | | | $ | 51,086 | |
| USD | | | 99,273 | 1 | | | | AUD | | | 128,000 | | | JPMorgan Chase Bank N.A. | | | 3/03/15 | | | | (180 | ) |
| USD | | | 403,050 | | | | | AUD | | | 494,000 | | | JPMorgan Chase Bank N.A. | | | 3/03/15 | | | | 19,222 | |
| USD | | | 2,018,848 | | | | | AUD | | | 2,472,000 | | | JPMorgan Chase Bank N.A. | | | 3/03/15 | | | | 98,155 | |
| USD | | | 462,208 | 1 | | | | BRL | | | 1,201,000 | | | JPMorgan Chase Bank N.A. | | | 3/03/15 | | | | 18,381 | |
| USD | | | 202,614 | 1 | | | | CAD | | | 229,474 | | | Deutsche Bank AG | | | 3/03/15 | | | | 22,104 | |
| USD | | | 243,980 | 1 | | | | CAD | | | 309,000 | | | JPMorgan Chase Bank N.A. | | | 3/03/15 | | | | 914 | |
| USD | | | 1,478,203 | | | | | CAD | | | 1,756,000 | | | JPMorgan Chase Bank N.A. | | | 3/03/15 | | | | 96,891 | |
| USD | | | 768,048 | | | | | EUR | | | 650,000 | | | Deutsche Bank AG | | | 3/03/15 | | | | 33,354 | |
| USD | | | 2,833,132 | 1 | | | | EUR | | | 2,279,491 | | | Deutsche Bank AG | | | 3/03/15 | | | | 256,626 | |
| USD | | | 222,356 | 1 | | | | EUR | | | 196,000 | | | JPMorgan Chase Bank N.A. | | | 3/03/15 | | | | 817 | |
| USD | | | 205,784 | | | | | EUR | | | 174,000 | | | JPMorgan Chase Bank N.A. | | | 3/03/15 | | | | 9,112 | |
| USD | | | 98,183 | | | | | GBP | | | 65,000 | | | Deutsche Bank AG | | | 3/03/15 | | | | 299 | |
| USD | | | 1,428,536 | 1 | | | | GBP | | | 913,121 | | | Deutsche Bank AG | | | 3/03/15 | | | | 53,469 | |
| USD | | | 128,244 | 1 | | | | GBP | | | 85,000 | | | JPMorgan Chase Bank N.A. | | | 3/03/15 | | | | 243 | |
| USD | | | 343,790 | | | | | GBP | | | 227,000 | | | JPMorgan Chase Bank N.A. | | | 3/03/15 | | | | 1,951 | |
| USD | | | 287,669 | 1 | | | | INR | | | 18,039,000 | | | Citibank N.A. | | | 3/03/15 | | | | (1,736 | ) |
| USD | | | 612,257 | 1 | | | | JPY | | | 72,118,633 | | | Deutsche Bank AG | | | 3/03/15 | | | | (2,082 | ) |
| USD | | | 209,673 | | | | | JPY | | | 24,915,000 | | | JPMorgan Chase Bank N.A. | | | 3/03/15 | | | | (2,564 | ) |
| USD | | | 475,411 | 1 | | | | KRW | | | 530,478,000 | | | Goldman Sachs International | | | 3/03/15 | | | | (9,072 | ) |
| USD | | | 115,823 | 1 | | | | MYR | | | 391,000 | | | Credit Suisse International | | | 3/03/15 | | | | 8,332 | |
| USD | | | 300,172 | 1 | | | | RUB | | | 13,967,000 | | | Deutsche Bank AG | | | 3/03/15 | | | | 100,660 | |
| USD | | | 117,002 | | | | | SEK | | | 967,000 | | | JPMorgan Chase Bank N.A. | | | 3/03/15 | | | | 102 | |
| USD | | | 2,990,540 | | | | | SEK | | | 24,076,000 | | | JPMorgan Chase Bank N.A. | | | 3/03/15 | | | | 79,997 | |
| USD | | | 396,624 | 1 | | | | TWD | | | 12,240,000 | | | Citibank N.A. | | | 3/03/15 | | | | 8,209 | |
| Total | | | | | | | | | | | | | | | | | | | | $ | 844,290 | |
| | | | | | | | | | | | | | | | | | | | | | |
| | 1 | | All or a portion of security is held by a wholly owned subsidiary. See Note 1 of the Notes to Consolidated Financial Statements for details on the wholly owned subsidiary. |
See Notes to Consolidated Financial Statements.
| | | | | | |
| | | BLACKROCK FUNDS | | JANUARY 31, 2015 | | 17 |
| | | | |
| Consolidated Schedule of Investments (continued) | | | BlackRock Strategic Risk Allocation Fund | |
| Ÿ | | As of January 31, 2015, OTC interest rate swaptions purchased were as follows: |
| | | | | | | | | | | | | | | | | | | | | | | | | | |
| Description | | Counterparty | | Put/
Call | | | Exercise Rate | | | Pay/Receive
Exercise Rate | | Floating Rate
Index | | Expiration
Date | | Notional
Amount
(000) | | | Value | |
10-Year Interest Rate Swap | | JPMorgan Chase Bank N.A. | | | Put | | | | 3.00 | % | | Pay | | 3-month LIBOR | | 3/12/15 | | USD | | | 8,400 | | | $ | 54 | |
| Ÿ | | As of January 31, 2015, OTC interest rate swaptions written were as follows: |
| | | | | | | | | | | | | | | | | | | | | | | | | | |
| Description | | Counterparty | | Put/
Call | | | Exercise Rate | | | Pay/Receive
Exercise Rate | | Floating Rate
Index | | Expiration
Date | | Notional
Amount
(000) | | | Value | |
10-Year Interest Rate Swap | | JPMorgan Chase Bank N.A. | | | Call | | | | 2.60 | % | | Pay | | 3-month LIBOR | | 3/12/15 | | USD | | | 8,400 | | | $ | (595,638 | ) |
| Ÿ | | As of January 31, 2015, centrally cleared credit default swaps — sold protection outstanding were as follows: |
| | | | | | | | | | | | | | | | | | | | | | | | |
| Index | | Receive
Fixed Rate | | | Clearinghouse | | Expiration
Date | | Credit
Rating1 | | | Notional Amount (000)2 | | | Unrealized
Appreciation
(Depreciation) | |
CDX.NA.HY Series 23 Version 1 | | | 5.00 | % | | Chicago Mercantile | | 12/20/19 | | | B+ | | | | USD | | | | 2,632 | | | $ | (11,942 | ) |
CDX.NA.IG Series 23 Version 1 | | | 1.00 | % | | Chicago Mercantile | | 12/20/19 | | | BBB+ | | | | USD | | | | 6,838 | | | | (10,936 | ) |
iTraxx Europe Crossover Series 22 Version 1 | | | 5.00 | % | | InterContinental Exchange | | 12/20/19 | | | B+ | | | | EUR | | | | 793 | | | | 22,508 | |
iTraxx Europe Series 22 Version 1 | | | 1.00 | % | | InterContinental Exchange | | 12/20/19 | | | A- | | | | EUR | | | | 5,589 | | | | 18,766 | |
Total | | | | | | | | | | | | | | | | | | | | | | $ | 18,396 | |
| | | | | | | | | | | | | | | | | | | | | | | | |
| Ÿ | | As of January 31, 2015, OTC credit default swaps — buy protection outstanding were as follows: |
| | | | | | | | | | | | | | | | | | | | | | | | | | | | |
| Index | | Pay
Fixed Rate | | | Counterparty | | Expiration
Date | | Notional
Amount
(000) | | | Value | | | Premiums
Paid | | | Unrealized
Appreciation | |
CDX.EM Series 22 Version 1 | | | 1.00 | % | | Bank of America N.A. | | 12/20/19 | | | USD | | | | 657 | | | $ | 81,008 | | | $ | 73,572 | | | $ | 7,436 | |
| Ÿ | | As of January 31, 2015, OTC credit default swaps — sold protection outstanding were as follows: |
| | | | | | | | | | | | | | | | | | | | | | | | | | | | | | | | |
| Index | | Receive
Fixed Rate | | | Counterparty | | Expiration
Date | | Credit
Rating1 | | | Notional
Amount
(000)2 | | | Value | | | Premiums
Received | | | Unrealized
Depreciation | |
CDX.EM Series 22 Version 1 | | | 1.00 | % | | JPMorgan Chase Bank N.A. | | 12/20/19 | | | BBB- | | | | USD | | | | 4,011 | | | $ | (494,556 | ) | | $ | (325,996 | ) | | $ | (168,560 | ) |
CDX.EM Series 22 Version 1 | | | 1.00 | % | | JPMorgan Chase Bank N.A. | | 12/20/19 | | | BBB- | | | | USD | | | | 750 | | | | (92,474 | ) | | | (79,367 | ) | | | (13,107 | ) |
Total | | | | | | | | | | | | | | | | | | | | | | $ | (587,030 | ) | | $ | (405,363 | ) | | $ | (181,667 | ) |
| | | | | | | | | | | | | | | | | | | | | | | | |
| | 1 | | Using S&P’s rating of the issuer or the underlying securities of the index, as applicable. |
| | 2 | | The maximum potential amount the Fund may pay should a negative credit event take place as defined under the terms of the agreement. |
See Notes to Consolidated Financial Statements.
| | | | | | |
| 18 | | BLACKROCK FUNDS | | JANUARY 31, 2015 | | |
| | | | |
| Consolidated Schedule of Investments (continued) | | | BlackRock Strategic Risk Allocation Fund | |
| Ÿ | | As of January 31, 2015, OTC total return swaps outstanding were as follows: |
| | | | | | | | | | | | | | | | | | | | | | |
| Reference Entity | | Fixed Notional Amount/ Fixed Rate/
Floating Rate | | Counterparty | | Expiration
Date | | Contract Amount/
Notional
Amount
(000) | | | Value | | | Premiums
Paid
(Received) | | | Unrealized
Appreciation (Depreciation) | |
| Canadian (10 Year) Bond Futures March 2015 | | CAD 4,370,4002 | | Bank of America N.A. | | 2/23/15 | | | 30 | 4 | | $ | 231,423 | | | | — | | | $ | 231,423 | |
| Canadian (10 Year) Bond Futures March 2015 | | CAD 437,0402 | | Bank of America N.A. | | 2/23/15 | | | 3 | 4 | | | 18,145 | | | | — | | | | 18,145 | |
| Canadian (10 Year) Bond Futures March 2015 | | CAD 145,6802 | | Bank of America N.A. | | 2/23/15 | | | 1 | 4 | | | 4,702 | | | | — | | | | 4,702 | |
| Long Gilt Futures March 2015 | | GBP 123,8702 | | Bank of America N.A. | | 2/24/15 | | | 1 | 4 | | | 4,473 | | | | — | | | | 4,473 | |
| U.S. Treasury (10 Year) Notes Futures March 2015 | | USD 3,795,3752 | | Bank of America N.A. | | 2/25/15 | | | 29 | 4 | | | 141,352 | | | | — | | | | 141,352 | |
| U.S. Treasury (10 Year) Notes Futures March 2015 | | USD 261,7502 | | Bank of America N.A. | | 2/25/15 | | | 2 | 4 | | | 8,468 | | | | — | | | | 8,468 | |
| Euro-Bund Futures March 2015 | | EUR 3,028,4102 | | Bank of America N.A. | | 3/04/15 | | | 19 | 4 | | | 134,404 | | | | — | | | | 134,404 | |
| Euro-Bund Futures March 2015 | | EUR 159,3902 | | Bank of America N.A. | | 3/04/15 | | | 1 | 4 | | | 4,951 | | | | — | | | | 4,951 | |
| Euro-Bund Futures March 2015 | | EUR 159,3902 | | Bank of America N.A. | | 3/04/15 | | | 1 | 4 | | | 3,142 | | | | — | | | | 3,142 | |
| Long Gilt Futures March 2015 | | GBP 2,353,5302 | | Bank of America N.A. | | 3/27/15 | | | 19 | 4 | | | 219,926 | | | | — | | | | 219,926 | |
| FTSE EPRA/NAREIT Developed Index1 | | 3-month LIBOR minus 0.08%3 | | JPMorgan Chase Bank
N.A. | | 6/19/15 | | USD | 1,110 | | | | 55,254 | | | | — | | | | 55,254 | |
| FTSE EPRA/NAREIT Developed Index1 | | 3-month LIBOR minus 0.22%3 | | JPMorgan Chase Bank
N.A. | | 6/19/15 | | USD | 406 | | | | 6,746 | | | | — | | | | 6,746 | |
| MSCI Emerging Markets, Net Return Index1 | | 3-month LIBOR plus 0.03%3 | | BNP Paribas S.A. | | 6/19/15 | | USD | 2,263 | | | | 43,914 | | | | — | | | | 43,914 | |
| MSCI World Small Cap Net Total Return Index1 | | 3-month LIBOR minus 0.07%3 | | JPMorgan Chase Bank
N.A. | | 6/19/15 | | USD | 2,041 | | | | (25,002 | ) | | | — | | | | (25,002 | ) |
| MSCI World Small Cap Net Total Return Index1 | | 3-month LIBOR minus 0.11%3 | | JPMorgan Chase Bank
N.A. | | 6/19/15 | | USD | 684 | | | | (2,988 | ) | | | — | | | | (2,988 | ) |
| S&P GSCI Excess Return on the Commodity Index1 | | USD 1,809,9032 | | BNP Paribas S.A. | | 6/19/15 | | USD | 1,810 | | | | (75,650 | ) | | | — | | | | (75,650 | ) |
| S&P GSCI Light Energy Official Close Index1 | | USD 1,254,1682 | | BNP Paribas S.A. | | 6/19/15 | | USD | 1,254 | | | | (334,202 | ) | | | — | | | | (334,202 | ) |
Total | | | | | | | | | | | | $ | 439,058 | | | | — | | | $ | 439,058 | |
| | | | | | | | | | | | | | |
| | 1 | | All or a portion of security is held by a wholly owned subsidiary. See Note 1 of the Notes to Consolidated Financial Statements for details on the wholly owned subsidiary. |
| | 2 | | Fund receives the total return of the reference entity and pays the fixed amount. Net payment made at termination. |
| | 3 | | Fund receives the total return of the reference entity and pays the floating amount. Net payment made at termination. |
| Ÿ | | Fair Value Measurements — Various inputs are used in determining the fair value of investments and derivative financial instruments. These inputs to valuation techniques are categorized into a disclosure hierarchy consisting of three broad levels for financial statement purposes. The hierarchy gives the highest priority to unadjusted quoted prices in active markets for identical assets or liabilities (Level 1 measurements) and the lowest priority to unobservable inputs (Level 3 measurements). Accordingly, the degree of judgment exercised in determining fair value is greatest for instruments categorized in Level 3. The inputs used to measure fair value may fall into different levels of the fair value |
See Notes to Consolidated Financial Statements.
| | | | | | |
| | | BLACKROCK FUNDS | | JANUARY 31, 2015 | | 19 |
| | | | |
| Consolidated Schedule of Investments (concluded) | | | BlackRock Strategic Risk Allocation Fund | |
| | hierarchy. In such cases, for disclosure purposes, the fair value hierarchy classification is determined based on the lowest level input that is significant to the fair value measurement in its entirety. The categorization of a value determined for investments and derivative financial instruments is based on the pricing transparency of the investment and derivative financial instrument and is not necessarily an indication of the risks associated with investing in those securities. The three levels of the fair value hierarchy are as follows: |
| | Ÿ | | Level 1 — unadjusted quoted prices in active markets/exchanges for identical assets or liabilities that the Fund has the ability to access |
| | Ÿ | | Level 2 — other observable inputs (including, but not limited to, quoted prices for similar assets or liabilities in markets that are active, quoted prices for identical or similar assets or liabilities in markets that are not active, inputs other than quoted prices that are observable for the assets or liabilities (such as interest rates, yield curves, volatilities, prepayment speeds, loss severities, credit risks and default rates) or other market–corroborated inputs) |
| | Ÿ | | Level 3 — unobservable inputs based on the best information available in the circumstances, to the extent observable inputs are not available (including the Fund’s own assumptions used in determining the fair value of investments and derivative financial instruments) |
Changes in valuation techniques may result in transfers into or out of an assigned level within the disclosure hierarchy. In accordance with the Fund’s policy, transfers between different levels of the fair value disclosure hierarchy are deemed to have occurred as of the beginning of the reporting period. For information about the Fund’s policy regarding valuation of investments and derivative financial instruments, refer to Note 2 of the Notes to Consolidated Financial Statements.
As of January 31, 2015, the following tables summarize the Fund’s investments and derivative financial instruments categorized in the disclosure hierarchy:
| | | | | | | | | | | | | | | | | | | | |
| | | Level 1 | | Level 2 | | Level 3 | | Total |
Assets: | | | | | | | | | | | | | | | | | | | | |
Investments: | | | | | | | | | | | | | | | | | | | | |
Long-Term Investments: | | | | | | | | | | | | | | | | | | | | |
Foreign Government Obligations | | | | — | | | | $ | 10,941,494 | | | | | — | | | | $ | 10,941,494 | |
Investment Companies | | | $ | 2,360,702 | | | | | — | | | | | — | | | | | 2,360,702 | |
U.S. Treasury Obligations | | | | — | | | | | 6,068,436 | | | | | — | | | | | 6,068,436 | |
Short-Term Securities | | | | 9,020,003 | | | | | — | | | | | — | | | | | 9,020,003 | |
Options Purchased: | | | | | | | | | | | | | | | | | | | | |
Interest Rate Contracts | | | | — | | | | | 54 | | | | | — | | | | | 54 | |
| | | | | |
Total | | | $ | 11,380,705 | | | | $ | 17,009,984 | | | | | — | | | | $ | 28,390,689 | |
| | | | | |
| | | | | | | | | | | | | | | | | | | | |
| | | Level 1 | | Level 2 | | Level 3 | | Total |
Derivative Financial Instruments1 | | | | | | | | | | | | | | | | | | | | |
Assets: | | | | | | | | | | | | | | | | | | | | |
Credit contracts | | | | — | | | | $ | 48,710 | | | | | — | | | | $ | 48,710 | |
Equity contracts | | | $ | 81,024 | | | | | 105,914 | | | | | — | | | | | 186,938 | |
Foreign currency exchange contracts | | | | — | | | | | 859,924 | | | | | — | | | | | 859,924 | |
Interest rate contracts | | | | 170,796 | | | | | 770,986 | | | | | — | | | | | 941,782 | |
Liabilities: | | | | | | | | | | | | | | | | | | | | |
Commodity contracts | | | | — | | | | | (409,852 | ) | | | | — | | | | | (409,852 | ) |
Credit contracts | | | | — | | | | | (204,545 | ) | | | | — | | | | | (204,545 | ) |
Equity contracts | | | | (12,627 | ) | | | | (27,990 | ) | | | | — | | | | | (40,617 | ) |
Foreign currency exchange contracts | | | | — | | | | | (15,634 | ) | | | | — | | | | | (15,634 | ) |
Interest rate contracts | | | | — | | | | | (595,638 | ) | | | | — | | | | | (595,638 | ) |
| | | | | |
Total | | | $ | 239,193 | | | | $ | 531,875 | | | | | — | | | | $ | 771,068 | |
| | | | | |
| | 1 | | Derivative financial instruments are swaps, financial futures contracts, forward foreign currency exchange contracts and options written. Swaps, financial futures contracts and forward foreign currency exchange contracts are valued at the unrealized appreciation/depreciation on the instrument and options written are shown at value. |
The Fund may hold assets in which the fair value approximates the carrying amount for financial statement purposes. As of January 31, 2015, such assets are categorized within the disclosure hierarchy as follows:
| | | | | | | | | | | | | | | | | | | | |
| | | | | | | | | | | | | | | | |
| | | Level 1 | | Level 2 | | Level 3 | | Total |
Assets: | | | | | | | | | | | | | | |
Foreign currency at value | | | $ | 51,877 | | | — | | — | | | $ | 51,877 | |
Cash pledged for financial futures contracts | | | | 302,000 | | | — | | — | | | | 302,000 | |
Cash pledged for centrally cleared swaps | | | | 385,000 | | | — | | — | | | | 385,000 | |
| | | | | |
Total | | | $ | 738,877 | | | — | | — | | | $ | 738,877 | |
| | | | | |
During the six months ended January 31, 2015, there were no transfers between levels.
See Notes to Consolidated Financial Statements.
| | | | | | |
| 20 | | BLACKROCK FUNDS | | JANUARY 31, 2015 | | |
| | |
Consolidated Statements of Assets and Liabilities | | |
| | | | | | | | |
| January 31, 2015 (Unaudited) | | BlackRock
Multi-Asset Real
Return Fund | | | BlackRock
Strategic Risk
Allocation Fund | |
| | | | | | | | |
| Assets | | | | | | | | |
Investments at value — unaffiliated1 | | $ | 48,032,600 | | | $ | 17,009,984 | |
Investments at value — affiliated2 | | | 23,645,620 | | | | 11,380,705 | |
Cash | | | 1,663,983 | | | | — | |
Cash pledged for financial futures contracts | | | 78,000 | | | | 302,000 | |
Cash pledged as collateral for OTC derivatives | | | 800,000 | | | | — | |
Cash pledged for centrally cleared swaps | | | 275,000 | | | | 385,000 | |
Foreign currency at value3 | | | 57,968 | | | | 51,877 | |
Variation margin receivable on financial futures contracts | | | 160 | | | | 17,742 | |
Investments sold receivable | | | 522,975 | | | | — | |
Swap premiums paid | | | — | | | | 73,572 | |
Unrealized appreciation on forward foreign currency exchange contracts | | | 2,830 | | | | 859,924 | |
Unrealized appreciation on OTC swaps | | | — | | | | 884,336 | |
Capital shares sold receivable | | | 377,922 | | | | — | |
Interest receivable | | | 26,610 | | | | 92,739 | |
Receivable from Manager | | | 3,916 | | | | 308 | |
Dividends receivable — unaffiliated | | | 26,932 | | | | — | |
Dividends receivable — affiliated | | | — | | | | 631 | |
Prepaid expenses | | | 51,174 | | | | 27,916 | |
| | | | |
Total assets | | | 75,565,690 | | | | 31,086,734 | |
| | | | |
| | | | | | | | |
| Liabilities | | | | | | | | |
Options written at value4 | | | — | | | | 595,638 | |
Variation margin payable on financial futures contracts | | | 39,188 | | | | 58,715 | |
Variation margin payable on centrally cleared swaps | | | 10,424 | | | | 9,201 | |
Investments purchased payable | | | 673,638 | | | | — | |
Swap premiums received | | | — | | | | 405,363 | |
Unrealized depreciation on forward foreign currency exchange contracts | | | 5,492 | | | | 15,634 | |
Unrealized depreciation on OTC swaps | | | 650,349 | | | | 619,509 | |
Capital shares redeemed payable | | | 283,729 | | | | — | |
Service and distribution fees payable | | | 2,669 | | | | 918 | |
Investment advisory fees payable | | | 20,216 | | | | 5,911 | |
Professional fees payable | | | 45,420 | | | | 43,210 | |
Officer’s and Trustees’ fees payable | | | 1,318 | | | | 1,212 | |
Other affiliates payable | | | 2,514 | | | | 921 | |
Other accrued expenses payable | | | 18,075 | | | | 23,811 | |
| | | | |
Total liabilities | | | 1,753,032 | | | | 1,780,043 | |
| | | | |
Net Assets | | $ | 73,812,658 | | | $ | 29,306,691 | |
| | | | |
| | | | | | | | |
| Net Assets Consist of | | | | | | | | |
Paid-in capital | | $ | 78,943,668 | | | $ | 29,186,505 | |
Distributions in excess of net investment income | | | (251,814 | ) | | | (1,011,287 | ) |
Accumulated net realized gain (loss) | | | (5,174,793 | ) | | | 944,075 | |
Net unrealized appreciation/depreciation | | | 295,597 | | | | 187,398 | |
| | | | |
Net Assets | | $ | 73,812,658 | | | $ | 29,306,691 | |
| | | | |
1 Investments at cost — unaffiliated | | $ | 46,389,623 | | | $ | 17,562,612 | |
2 Investments at cost — affiliated | | $ | 24,045,143 | | | $ | 11,463,212 | |
3 Foreign currency at cost | | $ | 57,659 | | | $ | 60,248 | |
4 Premiums received | | | — | | | $ | 62,160 | |
See Notes to Consolidated Financial Statements.
| | | | | | |
| | | BLACKROCK FUNDS | | JANUARY 31, 2015 | | 21 |
| | |
| Consolidated Statements of Assets and Liabilities (concluded) | | |
| | | | | | | | |
| January 31, 2015 (Unaudited) | | BlackRock Multi-Asset Real
Return Fund | | | BlackRock
Strategic Risk
Allocation Fund | |
| | | | | | | | |
| Net Asset Value | | | | | | | | |
Institutional | | | | | | | | |
Net assets | | $ | 67,891,564 | | | $ | 26,936,436 | |
| | | | |
Shares outstanding5 | | | 7,052,121 | | | | 2,693,628 | |
| | | | |
Net asset value | | $ | 9.63 | | | $ | 10.00 | |
| �� | | | |
Investor A | | | | | | | | |
Net assets | | $ | 3,708,987 | | | $ | 1,420,031 | |
| | | | |
Shares outstanding5 | | | 386,257 | | | | 142,203 | |
| | | | |
Net asset value | | $ | 9.60 | | | $ | 9.99 | |
| | | | |
Investor C | | | | | | | | |
Net assets | | $ | 2,212,107 | | | $ | 950,224 | |
| | | | |
Shares outstanding5 | | | 231,960 | | | | 95,745 | |
| | | | |
Net asset value | | $ | 9.54 | | | $ | 9.92 | |
| | | | |
| | 5 | | Unlimited number of shares authorized, $0.001 par value. |
See Notes to Consolidated Financial Statements.
| | | | | | |
| 22 | | BLACKROCK FUNDS | | JANUARY 31, 2015 | | |
| | |
| Consolidated Statements of Operations | | |
| | | | | | | | |
| Six Months Ended January 31, 2015 (Unaudited) | | BlackRock
Multi-Asset Real
Return Fund | | | BlackRock
Strategic Risk
Allocation Fund | |
| | | | | | | | |
| Investment Income | | | | | |
Dividends — affiliated | | $ | 377,327 | | | $ | 12,929 | |
Dividends — unaffiliated | | | 270,237 | | | | 47 | |
Interest1 | | | (150,952 | )2 | | | (1,171 | )2 |
Securities lending — affiliated — net | | | 1,349 | | | | — | |
Foreign taxes withheld | | | (1,038 | ) | | | — | |
| | | | |
Total income | | | 496,923 | | | | 11,805 | |
| | | | |
| | | | | | | | |
| Expenses | | | | | |
Investment advisory | | | 230,967 | | | | 106,018 | |
Professional | | | 53,779 | | | | 49,696 | |
Administration | | | 29,287 | | | | 11,486 | |
Registration | | | 43,479 | | | | 18,591 | |
Printing | | | 16,998 | | | | 12,110 | |
Service and distribution — class specific | | | 18,735 | | | | 3,974 | |
Administration — class specific | | | 9,309 | | | | 3,410 | |
Officer and Trustees | | | 2,565 | | | | 1,974 | |
Transfer agent — class specific | | | 19,511 | | | | 1,670 | |
Custodian | | | 2,578 | | | | 1,295 | |
Miscellaneous | | | 5,580 | | | | 10,106 | |
| | | | |
Total expenses | | | 432,788 | | | | 220,330 | |
Less fees waived by Manager. | | | (79,646 | ) | | | (69,677 | ) |
Less administration fees waived — class specific | | | (9,263 | ) | | | (3,402 | ) |
Less transfer agent fees waived — class specific | | | (285 | ) | | | (154 | ) |
Less transfer agent fees reimbursed — class specific | | | (17,363 | ) | | | (1,445 | ) |
| | | | |
Total expenses after fees waived and reimbursed | | | 326,231 | | | | 145,652 | |
| | | | |
Net investment income (loss) | | | 170,692 | | | | (133,847 | ) |
| | | | |
| | | | | | | | |
| Realized and Unrealized Gain (Loss) | | | | | |
Net realized gain (loss) from: | | | | | | | | |
Investments — unaffiliated | | | (368,561 | ) | | | (52,260 | ) |
Investments — affiliated | | | (244,761 | ) | | | — | |
Capital gain distributions received from affiliated investment companies | | | — | | | | 1,033 | |
Options written | | | — | | | | 63,700 | |
Financial futures contracts | | | (26,878 | ) | | | 186,480 | |
Swaps | | | (4,502,302 | ) | | | 576,400 | |
Foreign currency transactions | | | (730 | ) | | | 635,574 | |
| | | | |
| | | (5,143,232 | ) | | | 1,410,927 | |
| | | | |
Net change in unrealized appreciation/depreciation on: | | | | | | | | |
Investments — unaffiliated | | | 807,705 | | | | (477,973 | ) |
Investments — affiliated | | | (387,446 | ) | | | 22,365 | |
Options written | | | — | | | | (578,974 | ) |
Financial futures contracts | | | (271,116 | ) | | | 165,982 | |
Swaps | | | (59,712 | ) | | | (379,288 | ) |
Foreign currency translations | | | (3,353 | ) | | | 729,302 | |
| | | | |
| | | 86,078 | | | | (518,586 | ) |
| | | | |
Total realized and unrealized gain (loss) | | | (5,057,154 | ) | | | 892,341 | |
| | | | |
Net Increase (Decrease) in Net Assets Resulting from Operations | | $ | (4,886,462 | ) | | $ | 758,494 | |
| | | | |
| | 1 | | Includes monthly inflationary and deflationary adjustments to income. See Note 3 of the Notes to Consolidated Financial Statements. |
| | 2 | | Includes amortization of bond premiums and deflationary adjustments for U.S. Treasury and Foreign Government Inflation Bonds which exceeded the aggregate of interest accrued to income for the period. |
See Notes to Consolidated Financial Statements.
| | | | | | |
| | | BLACKROCK FUNDS | | JANUARY 31, 2015 | | 23 |
| | |
| Consolidated Statements of Changes in Net Assets | | |
| | | | | | | | | | | | | | | | |
| | | BlackRock
Multi-Asset Real
Return Fund | | | BlackRock
Strategic Risk
Allocation Fund | |
| Increase (Decrease) in Net Assets: | | Six Months
Ended
January 31, 2015
(Unaudited) | | | Year Ended
July 31, 2014 | | | Six Months
Ended
January 31, 2015
(Unaudited) | | | Year Ended
July 31, 2014 | |
| | | | | | | | | | | | | | | | |
| Operations | | | | | | | | | | | | | | | | |
Net investment income (loss) | | $ | 170,692 | | | $ | 744,419 | | | $ | (133,847 | ) | | $ | (179,103 | ) |
Net realized gain (loss) | | | (5,143,232 | ) | | | 1,816,414 | | | | 1,410,927 | | | | 1,542,637 | |
Net change in unrealized appreciation/depreciation | | | 86,078 | | | | (101,691 | ) | | | (518,586 | ) | | | 1,188,536 | |
| | | | | | | | |
Net increase (decrease) in net assets resulting from operations | | | (4,886,462 | ) | | | 2,459,142 | | | | 758,494 | | | | 2,552,070 | |
| | | | | | | | |
| | | | | | | | | | | | | | | | |
| Distributions to Shareholders From1 | | | | | | | | | | | | | | | | |
Net investment income: | | | | | | | | | | | | | | | | |
Institutional | | | (1,177,037 | ) | | | (306,813 | ) | | | (937,282 | ) | | | (974,578 | ) |
Investor A | | | (52,779 | ) | | | (32,232 | ) | | | (43,538 | ) | | | (14,165 | ) |
Investor C | | | (20,189 | ) | | | (10,956 | ) | | | (19,182 | ) | | | (11,257 | ) |
Net realized gain: | | | | | | | | | | | | | | | | |
Institutional | | | (1,400,718 | ) | | | (116,804 | ) | | | (65,224 | ) | | | — | |
Investor A | | | (76,175 | ) | | | (12,783 | ) | | | (3,192 | ) | | | — | |
Investor C | | | (46,178 | ) | | | (5,147 | ) | | | (1,627 | ) | | | — | |
| | | | | | | | |
Decrease in net assets resulting from distributions to shareholders | | | (2,773,076 | ) | | | (484,735 | ) | | | (1,070,045 | ) | | | (1,000,000 | ) |
| | | | | | | | |
| | | | | | | | | | | | | | | | |
| Capital Share Transactions | | | | | | | | | | | | | | | | |
Net increase in net assets derived from capital share transactions | | | 4,447,652 | | | | 62,399,149 | | | | 1,877,880 | | | | 1,092,625 | |
| | | | | | | | |
| | | | | | | | | | | | | | | | |
| Net Assets | | | | | | | | | | | | | | | | |
Total increase (decrease) in net assets | | | (3,211,886 | ) | | | 64,373,556 | | | | 1,566,329 | | | | 2,644,695 | |
Beginning of period | | | 77,024,544 | | | | 12,650,988 | | | | 27,740,362 | | | | 25,095,667 | |
| | | | | | | | |
End of period | | $ | 73,812,658 | | | $ | 77,024,544 | | | $ | 29,306,691 | | | $ | 27,740,362 | |
| | | | | | | | |
Undistributed (distributions in excess of) net investment income, end of period | | $ | (251,814 | ) | | $ | 827,499 | | | $ | (1,011,287 | ) | | $ | 122,562 | |
| | | | | | | | |
| | 1 | | Distributions for annual periods determined in accordance with federal income tax regulations. |
See Notes to Consolidated Financial Statements.
| | | | | | |
| 24 | | BLACKROCK FUNDS | | JANUARY 31, 2015 | | |
| | | | |
| Consolidated Financial Highlights | | | BlackRock Multi-Asset Real Return Fund | |
| | | | | | | | | | | | | | | | | | | | | | | | | | |
| | | Institutional | | | | | Investor A | |
| | | Six Months
Ended
January 31,
2015 (Unaudited) | | | Year
Ended
July 31,
2014 | | | Period
December 27,
20121 to July 31, 2013 | | | | | Six Months
Ended
January 31,
2015
(Unaudited) | | | Year
Ended
July 31,
2014 | | | Period
December 27,
20121 to July 31, 2013 | |
| Per Share Operating Performance | | | | | | | | | | | | | | | | | | | | | | | | | | |
Net asset value, beginning of period | | $ | 10.66 | | | $ | 10.47 | | | $ | 10.00 | | | | | $ | 10.62 | | | $ | 10.45 | | | $ | 10.00 | |
| | | | | | | | | | |
Net investment income2 | | | 0.03 | | | | 0.18 | | | | 0.09 | | | | | | 0.01 | | | | 0.15 | | | | 0.08 | |
Net realized and unrealized gain (loss) | | | (0.69 | ) | | | 0.29 | | | | 0.38 | | | | | | (0.69 | ) | | | 0.30 | | | | 0.37 | |
| | | | | | | | | | |
Net increase (decrease) from investment operations | | | (0.66 | ) | | | 0.47 | | | | 0.47 | | | | | | (0.68 | ) | | | 0.45 | | | | 0.45 | |
| | | | | | | | | | |
Distributions from:3 | | | | | | | | | | | | | | | | | | | | | | | | | | |
Net investment income | | | (0.17 | ) | | | (0.20 | ) | | | — | | | | | | (0.14 | ) | | | (0.20 | ) | | | — | |
Net realized gain | | | (0.20 | ) | | | (0.08 | ) | | | — | | | | | | (0.20 | ) | | | (0.08 | ) | | | — | |
| | | | | | | | | | |
Total distributions | | | (0.37 | ) | | | (0.28 | ) | | | — | | | | | | (0.34 | ) | | | (0.28 | ) | | | — | |
| | | | | | | | | | |
Net asset value, end of period | | $ | 9.63 | | | $ | 10.66 | | | $ | 10.47 | | | | | $ | 9.60 | | | $ | 10.62 | | | $ | 10.45 | |
| | | | | | | | | | |
| | | | | | | | | | | | | | | | | | | | | | | | | | |
| Total Return4 | | | | | | | | | | | | | | | | | | | | | | | | | | |
Based on net asset value | | | (6.18 | )%5 | | | 4.61 | % | | | 4.70 | %5 | | | | | (6.40 | )%5 | | | 4.34 | % | | | 4.50 | %5 |
| | | | | | | | | | |
| | | | | | | | | | | | | | | | | | | | | | | | | | |
| Ratios to Average Net Assets | | | | | | | | | | | | | | | | | | | | | | | | | | |
Total expenses6 | | | 1.07 | %7 | | | 1.28 | % | | | 3.48 | %7,8 | | | | | 1.40 | %7 | | | 1.65 | % | | | 3.73 | %7,8 |
| | | | | | | | | | |
Total expenses after fees waived and reimbursed6 | | | 0.80 | %7 | | | 0.80 | % | | | 0.79 | %7 | | | | | 1.05 | %7 | | | 1.05 | % | | | 1.05 | %7 |
| | | | | | | | | | |
Net investment income6 | | | 0.49 | %7 | | | 1.73 | % | | | 1.47 | %7 | | | | | 0.25 | %7 | | | 1.40 | % | | | 1.34 | %7 |
| | | | | | | | | | |
| | | | | | | | | | | | | | | | | | | | | | | | | | |
| Supplemental Data | | | | | | | | | | | | | | | | | | | | | | | | | | |
Net assets, end of period (000) | | $ | 67,892 | | | $ | 65,182 | | | $ | 11,915 | | | | | $ | 3,709 | | | $ | 9,533 | | | $ | 464 | |
| | | | | | | | | | |
Portfolio turnover rate | | | 19 | % | | | 140 | % | | | 40 | % | | | | | 19 | % | | | 140 | % | | | 40 | % |
| | | | | | | | | | |
| | 1 | | Commencement of operations. |
| | 2 | | Based on average shares outstanding. |
| | 3 | | Distributions for annual periods determined in accordance with federal income tax regulations. |
| | 4 | | Where applicable, excludes the effects of any sales charges and assumes the reinvestment of distributions. |
| | 5 | | Aggregate total return. |
| | 6 | | Excludes expenses incurred indirectly as a result of investments in underlying funds as follows: |
| | | | | | |
| | | Six Months Ended January 31, 2015 (Unaudited) | | Year Ended July 31, 2014 | | Period December 27, 2012 to July 31, 2013 |
Investments in underlying funds | | 0.23% | | 0.35% | | 0.41% |
| | 8 | | Organization costs were not annualized in the calculation of the expense ratios. If these expenses were annualized, the total expenses for Institutional and Investor A would have been 3.60% and 3.85%, respectively. |
See Notes to Consolidated Financial Statements.
| | | | | | |
| | | BLACKROCK FUNDS | | JANUARY 31, 2015 | | 25 |
| | | | |
Consolidated Financial Highlights (concluded) | | | BlackRock Multi-Asset Real Return Fund | |
| | | | | | | | | | | | |
| | | Investor C | |
| | | Six Months
Ended
January 31,
2015
(Unaudited) | | | Year
Ended
July 31,
2014 | | | Period
December 27,
20121 to July 31, 2013 | |
| Per Share Operating Performance | | | | | | | | | | | | |
Net asset value, beginning of period | | $ | 10.53 | | | $ | 10.41 | | | $ | 10.00 | |
| | | | |
Net investment income (loss)2 | | | (0.03 | ) | | | 0.09 | | | | 0.04 | |
Net realized and unrealized gain (loss) | | | (0.67 | ) | | | 0.28 | | | | 0.37 | |
| | | | |
Net increase (decrease) from investment operations | | | (0.70 | ) | | | 0.37 | | | | 0.41 | |
| | | | |
Distributions from:3 | | | | | | | | | | | | |
Net investment income | | | (0.09 | ) | | | (0.17 | ) | | | — | |
Net realized gain | | | (0.20 | ) | | | (0.08 | ) | | | — | |
| | | | |
Total distributions | | | (0.29 | ) | | | (0.25 | ) | | | — | |
| | | | |
Net asset value, end of period | | $ | 9.54 | | | $ | 10.53 | | | $ | 10.41 | |
| | | | |
| | | | | | | | | | | | |
| Total Return4 | | | | | | | | | | | | |
Based on net asset value | | | (6.65 | )%5 | | | 3.56 | % | | | 4.10 | %5 |
| | | | |
| | | | | | | | | | | | |
| Ratios to Average Net Assets | | | | | | | | | | | | |
Total expenses6 | | | 2.10 | %7 | | | 2.41 | % | | | 4.42 | %7,8 |
| | | | |
Total expenses after fees waived and reimbursed6 | | | 1.80 | %7 | | | 1.80 | % | | | 1.79 | %7 |
| | | | |
Net investment income (loss)6 | | | (0.50 | )%7 | | | 0.87 | % | | | 0.66 | %7 |
| | | | |
| | | | | | | | | | | | |
| Supplemental Data | | | | | | | | | | | | |
Net assets, end of period (000) | | $ | 2,212 | | | $ | 2,310 | | | $ | 271 | |
| | | | |
Portfolio turnover rate | | | 19 | % | | | 140 | % | | | 40 | % |
| | | | |
| | 1 | | Commencement of operations. |
| | 2 | | Based on average shares outstanding. |
| | 3 | | Distributions for annual periods determined in accordance with federal income tax regulations. |
| | 4 | | Where applicable, excludes the effects of any sales charges and assumes the reinvestment of distributions. |
| | 5 | | Aggregate total return. |
| | 6 | | Excludes expenses incurred indirectly as a result of investments in underlying funds as follows: |
| | | | | | |
| | | Six Months Ended January 31, 2015 (Unaudited) | | Year Ended July 31, 2014 | | Period December 27, 2012 to July 31, 2013 |
Investments in underlying funds | | 0.23% | | 0.35% | | 0.41% |
| | 8 | | Organization costs were not annualized in the calculation of the expense ratios. If these expenses were annualized, the total expenses for Investor C would have been 4.54%. |
See Notes to Consolidated Financial Statements.
| | | | | | |
| 26 | | BLACKROCK FUNDS | | JANUARY 31, 2015 | | |
| | | | |
| Consolidated Financial Highlights | | | BlackRock Strategic Risk Allocation Fund | |
| | | | | | | | | | | | | | | | | | | | | | | | | | |
| | | Institutional | | | | | Investor A | |
| | | Six Months
Ended July 31,
2014 (Unaudited) | | | Year
Ended
January 31,
2015 | | | Period
December 27,
20121 to July 31, 2013 | | | | | Six Months
Ended
January 31,
2015
(Unaudited) | | | Year
Ended
July 31,
2014 | | | Period
December 27,
20121 to July 31, 2013 | |
| Per Share Operating Performance | | | | | | | | | | | | | | | | | | | | | | | | | | |
Net asset value, beginning of period | | $ | 10.11 | | | $ | 9.54 | | | $ | 10.00 | | | | | $ | 10.09 | | | $ | 9.53 | | | $ | 10.00 | |
| | | | | | | | | | |
Net investment loss2 | | | (0.05 | ) | | | (0.07 | ) | | | (0.02 | ) | | | | | (0.06 | ) | | | (0.08 | ) | | | (0.02 | ) |
Net realized and unrealized gain (loss) | | | 0.31 | | | | 1.02 | | | | (0.40 | ) | | | | | 0.31 | | | | 1.00 | | | | (0.41 | ) |
| | | | | | | | | | |
Net increase (decrease) from investment operations | | | 0.26 | | | | 0.95 | | | | (0.42 | ) | | | | | 0.25 | | | | 0.92 | | | | (0.43 | ) |
| | | | | | | | | | |
Distributions from:3 | | | | | | | | | | | | | | | | | | | | | | | | | | |
Net investment income | | | (0.35 | ) | | | (0.38 | ) | | | (0.04 | ) | | | | | (0.33 | ) | | | (0.36 | ) | | | (0.04 | ) |
Net realized gain | | | (0.02 | ) | | | — | | | | — | | | | | | (0.02 | ) | | | — | | | | — | |
| | | | | | | | | | |
Total distributions | | | (0.37 | ) | | | (0.38 | ) | | | (0.04 | ) | | | | | (0.35 | ) | | | (0.36 | ) | | | (0.04 | ) |
| | | | | | | | | | |
Net asset value, end of period | | $ | 10.00 | | | $ | 10.11 | | | $ | 9.54 | | | | | $ | 9.99 | | | $ | 10.09 | | | $ | 9.53 | |
| | | | | | | | | | |
| | | | | | | | | | | | | | | | | | | | | | | | | | |
| Total Return4 | | | | | | | | | | | | | | | | | | | | | | | | | | |
Based on net asset value | | | 2.65 | %5 | | | 10.24 | % | | | (4.25 | )%5 | | | | | 2.58 | %5 | | | 9.92 | % | | | (4.35 | )%5 |
| | | | | | | | | | |
| | | | | | | | | | | | | | | | | | | | | | | | | | |
| Ratios to Average Net Assets | | | | | | | | | | | | | | | | | | | | | | | | | | |
Total expenses6 | | | 1.52 | %7 | | | 1.69 | % | | | 2.36 | %7,8 | | | | | 1.88 | %7 | | | 2.09 | % | | | 2.38 | %7,8 |
| | | | | | | | | | |
Total expenses after fees waived and reimbursed6 | | | 1.00 | %7 | | | 1.00 | % | | | 0.99 | %7 | | | | | 1.25 | %7 | | | 1.25 | % | | | 1.24 | %7 |
| | | | | | | | | | |
Net investment loss6 | | | (0.92 | )%7 | | | (0.67 | )% | | | (0.35 | )%7 | | | | | (1.18 | )%7 | | | (0.81 | )% | | | (0.30 | )%7 |
| | | | | | | | | | |
| | | | | | | | | | | | | | | | | | | | | | | | | | |
| Supplemental Data | | | | | | | | | | | | | | | | | | | | | | | | | | |
Net assets, end of period (000) | | $ | 26,936 | | | $ | 26,325 | | | $ | 24,404 | | | | | $ | 1,420 | | | $ | 1,014 | | | $ | 378 | |
| | | | | | | | | | |
Portfolio turnover rate | | | 94 | % | | | 77 | % | | | 59 | % | | | | | 94 | % | | | 77 | % | | | 59 | % |
| | | | | | | | | | |
| | 1 | | Commencement of operations. |
| | 2 | | Based on average shares outstanding. |
| | 3 | | Distributions for annual periods determined in accordance with federal income tax regulations. |
| | 4 | | Where applicable, excludes the effects of any sales charges and assumes the reinvestment of distributions. |
| | 5 | | Aggregate total return. |
| | 6 | | Excludes expenses incurred indirectly as a result of investments in underlying funds as follows: |
| | | | | | |
| | | Six Months Ended January 31, 2015 (Unaudited) | | Year Ended July 31, 2014 | | Period December 27, 2012 to July 31, 2013 |
Investments in underlying funds | | 0.11% | | 0.10% | | 0.18% |
| | 8 | | Organization costs were not annualized in the calculation of the expense ratios. If these expenses were annualized, the total expenses for Institutional and Investor A would have been 2.57% and 2.59%, respectively. |
See Notes to Consolidated Financial Statements.
| | | | | | |
| | | BLACKROCK FUNDS | | JANUARY 31, 2015 | | 27 |
| | | | |
| Consolidated Financial Highlights (concluded) | | | BlackRock Strategic Risk Allocation Fund | |
| | | | | | | | | | | | |
| | | Investor C | |
| | | Six Months
Ended
January 31,
2015
(Unaudited) | | | Year
Ended
July 31,
2014 | | | Period
December 27,
20121 to July 31, 2013 | |
| Per Share Operating Performance | | | | | | | | | | | | |
Net asset value, beginning of period | | $ | 10.02 | | | $ | 9.48 | | | $ | 10.00 | |
| | | | |
Net investment loss2 | | | (0.10 | ) | | | (0.16 | ) | | | (0.06 | ) |
Net realized and unrealized gain (loss) | | | 0.31 | | | | 1.00 | | | | (0.42 | ) |
| | | | |
Net increase (decrease) from investment operations | | | 0.21 | | | | 0.84 | | | | (0.48 | ) |
| | | | |
Distributions from:3 | | | | | | | | | | | | |
Net investment income | | | (0.29 | ) | | | (0.30 | ) | | | (0.04 | ) |
Net realized gains | | | (0.02 | ) | | | — | | | | — | |
| | | | |
Total distributions | | | (0.31 | ) | | | (0.30 | ) | | | (0.04 | ) |
| | | | |
Net asset value, end of period | | $ | 9.92 | | | $ | 10.02 | | | $ | 9.48 | |
| | | | |
| | | | | | | | | | | | |
| Total Return4 | | | | | | | | | | | | |
Based on net asset value | | | 2.14 | %5 | | | 9.09 | % | | | (4.86 | )%5 |
| | | | |
| | | | | | | | | | | | |
| Ratios to Average Net Assets | | | | | | | | | | | | |
Total expenses6 | | | 2.60 | %7 | | | 2.80 | % | | | 3.00 | %7,8 |
| | | | |
Total expenses after fees waived and reimbursed6 | | | 2.00 | %7 | | | 2.00 | % | | | 1.98 | %7 |
| | | | |
Net investment loss6 | | | (1.96 | )%7 | | | (1.67 | )% | | | (0.98 | )%7 |
| | | | |
| | | | | | | | | | | | |
| Supplemental Data | | | | | | | | | | | | |
Net assets, end of period (000) | | $ | 950 | | | $ | 402 | | | $ | 313 | |
| | | | |
Portfolio turnover rate | | | 94 | % | | | 77 | % | | | 59 | % |
| | | | |
| | 1 | | Commencement of operations. |
| | 2 | | Based on average shares outstanding. |
| | 3 | | Distributions for annual periods determined in accordance with federal income tax regulations. |
| | 4 | | Where applicable, excludes the effects of any sales charges and assumes the reinvestment of distributions. |
| | 5 | | Aggregate total return. |
| | 6 | | Excludes expenses incurred indirectly as a result of investments in underlying funds as follows: |
| | | | | | | | | | | | |
| | | Six Months Ended January 31, 2015 (Unaudited) | | | Year Ended July 31, 2014 | | | Period December 27, 2012 to July 31, 2013 | |
Investments in underlying funds | | | 0.11 | % | | | 0.10 | % | | | 0.18 | % |
| | 8 | | Organization costs were not annualized in the calculation of the expense ratios. If these expenses were annualized, the total expenses for Investor C would have been 3.21%. |
See Notes to Consolidated Financial Statements.
| | | | | | |
| 28 | | BLACKROCK FUNDS | | JANUARY 31, 2015 | | |
| | |
Notes to Consolidated Financial Statements (Unaudited) | | |
1. Organization:
BlackRock FundsSM (the “Trust”) is registered under the Investment Company Act of 1940, as amended (the “1940 Act”), as an open-end management investment company. The Trust is organized as a Massachusetts business trust. The following are referred to herein collectively as the “Funds” or individually, a “Fund”:
| | | | |
| Fund Name | | Herein Referred To As | | Diversification Classification |
BlackRock Multi-Asset Real Return Fund | | Multi-Asset Real Return | | Diversified |
BlackRock Strategic Risk Allocation Fund | | Strategic Risk Allocation | | Non-diversified |
Each Fund offers multiple classes of shares. All classes of shares have identical voting, dividend, liquidation and other rights and are subject to the same terms and conditions, except that each bears certain expenses and may have a conversion privilege as outlined below. Institutional Shares are sold only to certain eligible investors. Investor A and Investor C Shares are generally available through financial intermediaries. Each class has exclusive voting rights with respect to matters relating to its shareholder servicing and distribution expenditures. For distribution and service fee breakdown see Note 5.
| | | | | | |
| Share Class | | Initial Sales Charge | | CDSC | | Conversion Privilege |
Institutional Shares | | No | | No | | None |
Investor A Shares | | Yes | | No1 | | None |
Investor C Shares | | No | | Yes | | None |
| | 1 | | Investor A Shares may be subject to a CDSC for certain redemptions where no initial sales charge was paid at the time of purchase. |
As of January 31, 2015, Strategic Risk Allocation’s investment in BlackRock Liquidity Funds, TempFund was 31% of the Fund’s net assets. The financial statements of BlackRock Liquidity Funds, TempFund, including the Schedules of Investments, can be read in conjunction with Strategic Risk Allocation’s financial statements. BlackRock Liquidity Funds, TempFund financial statements are included in filings under BlackRock Liquidity Funds, which are available, without charge, on the U.S. Securities and Exchange Commission’s (“SEC’s”) website at http://www.sec.gov.
The Funds, together with certain other registered investment companies advised by the Manager or its affiliates, are included in a complex of open-end funds referred to as the Equity-Liquidity Complex.
Basis of Consolidation: The accompanying consolidated financial statements of Multi-Asset Real Return and Strategic Risk Allocation include the accounts of BlackRock Cayman Multi-Asset Real Return Fund, Ltd. (“Cayman Multi-Asset Real Return”) and BlackRock Cayman Strategic Risk Allocation Fund, Ltd. (“Cayman Strategic Risk Allocation”) (the “Subsidiaries”), which are wholly owned subsidiaries of each respective Fund and primarily invest in commodity-related instruments and other derivatives. The Subsidiaries enable the Funds to hold these commodity-related instruments and other derivatives and satisfy regulated investment company tax requirements. Each Fund may invest up to 25% of its total assets in its respective Subsidiary. The accompanying Consolidated Schedules of Investments and consolidated financial statements of each Fund include the positions and accounts, respectively, of its Subsidiary. Intercompany accounts and transactions, if any, have been eliminated. The Subsidiaries are subject to the same investment policies and restrictions that apply to the Funds, except that the Subsidiaries may invest without limitation in commodity-related instruments.
The following table shows a summary of the selected financial information of each Subsidiary included in the consolidated financial statements:
| | | | | | | | |
| | | Cayman
Multi-Asset
Real Return | | | Cayman
Strategic Risk
Allocation | |
Consolidated Statements of Assets and Liabilities | | | | | | | | |
Total assets | | $ | 4,898,601 | | | $ | 5,817,890 | |
Total liabilities | | | — | | | | 57,839 | |
| | | | |
Net assets | | $ | 4,898,601 | | | $ | 5,760,051 | |
Consolidated Statements of Operations | | | | | | | | |
Net investment income | | $ | 84 | | | $ | 1,083 | |
Net realized gain (loss) from: | | | | | | | | |
Investments – affiliated | | | (238,935 | ) | | | — | |
Financial futures contracts | | | — | | | | (90,532 | ) |
Swaps | | | (4,587,363 | ) | | | (266,172 | ) |
Foreign currency transactions | | | — | | | | 577,802 | |
| | | | |
| | | (4,826,298 | ) | | | 221,098 | |
| | | | |
| | | | | | |
| | | BLACKROCK FUNDS | | JANUARY 31, 2015 | | 29 |
| | |
| Notes to Consolidated Financial Statements (continued) | | |
| | | | | | | | |
| | | Cayman
Multi-Asset
Real Return | | | Cayman
Strategic Risk
Allocation | |
Net change in unrealized appreciation/depreciation | | | | | | | | |
Investments – affiliated | | $ | 7,213 | | | | — | |
Financial futures contracts | | | — | | | $ | 88,637 | |
Swaps | | | (86,609 | ) | | | (664,477 | ) |
Foreign currency translations | | | — | | | | 460,910 | |
| | | | |
| | | (79,396 | ) | | | (114,930 | ) |
| | | | |
Net increase (decrease) in net assets resulting from operations | | $ | (4,905,610 | ) | | $ | 107,251 | |
Consolidated Statements of Changes in Net Assets | | | | | | | | |
Net investment income | | $ | 84 | | | $ | 2,289 | |
Net realized gain (loss) | | | (4,574,303 | ) | | | 956,880 | |
Net change in unrealized appreciation/depreciation | | | (610,977 | ) | | | 106,898 | |
| | | | |
Net increase (decrease) in net assets resulting from operations | | $ | (5,185,196 | ) | | $ | 1,066,067 | |
2. Significant Accounting Policies:
The Funds’ consolidated financial statements are prepared in conformity with accounting principles generally accepted in the United States of America (“U.S. GAAP”), which may require management to make estimates and assumptions that affect the reported amounts of assets and liabilities in the consolidated financial statements and the reported amounts of increases and decreases in net assets from operations during the reporting period. Actual results could differ from those estimates. Each Fund is considered an investment company under U.S. GAAP and follows the accounting and reporting guidance applicable to investment companies. The following is a summary of significant polices followed by the Funds:
Valuation: The Funds’ investments are valued at fair value as of the close of trading on the New York Stock Exchange (“NYSE”) (generally 4:00 p.m., Eastern time) (or if the reporting date falls on a day the NYSE is closed, investments are valued at fair value as of the report date). U.S. GAAP defines fair value as the price the Funds would receive to sell an asset or pay to transfer a liability in an orderly transaction between market participants at the measurement date. The Funds determine the fair values of their financial instruments at market value using independent dealers or pricing services under policies approved by the Board of Trustees of the Trust (the “Board”). The BlackRock Global Valuation Methodologies Committee (the “Global Valuation Committee”) is the committee formed by management to develop global pricing policies and procedures and to provide oversight of the pricing function for the Funds for all financial instruments.
Bond investments are valued on the basis of last available bid prices or current market quotations provided by dealers or pricing services. In determining the value of a particular investment, pricing services may use certain information with respect to transactions in such investments, quotations from dealers, pricing matrixes, market transactions in comparable investments, various relationships observed in the market between investments and calculated yield measures. Financial futures contracts traded on exchanges are valued at their last sale price. Swap agreements are valued utilizing quotes received daily by the Funds’ pricing service or through brokers, which are derived using daily swap curves and models that incorporate a number of market data factors, such as discounted cash flows, trades and values of the underlying reference instruments. Certain centrally cleared swaps are valued at the price determined by the relevant exchange or clearinghouse. Investments in open-end registered investment companies are valued at NAV each business day.
Equity investments traded on a recognized securities exchange are valued at the official close each day, if available. For equity investments traded on more than one exchange, the official close price on the exchange where the stock is primarily traded is used. Equity investments traded on a recognized exchange for which there were no sales on that day may be valued at the last available bid (long positions) or ask (short positions) price.
Securities and other assets and liabilities denominated in foreign currencies are translated into U.S. dollars using exchange rates determined as of the close of business on the NYSE. Forward foreign currency exchange contracts are valued at the mean between the bid and ask prices and are determined as of the close of business on the NYSE. Interpolated values are derived when the settlement date of the contract is an interim date for which quotations are not available.
Over-the-counter (“OTC”) options and options on swaps (“swaptions”) are valued by an independent pricing service using a mathematical model, which incorporates a number of market data factors, such as the trades and prices of the underlying instruments.
Multi-Asset Real Return values its investment in BlackRock Liquidity Series, LLC, Money Market Series (the “Money Market Series”) at fair value, which is ordinarily based upon its pro rata ownership in the underlying fund’s net assets. The Money Market Series seeks current income consistent with
| | | | | | |
| 30 | | BLACKROCK FUNDS | | JANUARY 31, 2015 | | |
| | |
| Notes to Consolidated Financial Statements (continued) | | |
maintaining liquidity and preserving capital. Although the Money Market Series is not registered under the 1940 Act, its investments will follow the parameters of investments by a money market fund that is subject to Rule 2a-7 under the 1940 Act. The Fund may withdraw up to 25% of its investment daily, although the manager of the Money Market Series, in its sole discretion, may permit an investor to withdraw more than 25% on any one day.
In the event that the application of these methods of valuation results in a price for an investment that is deemed not to be representative of the market value of such investment, or if a price is not available, the investment will be valued by the Global Valuation Committee, or its delegate, in accordance with a policy approved by the Board as reflecting fair value (“Fair Value Investments”). When determining the price for Fair Value Investments, the Global Valuation Committee, or its delegate, seeks to determine the price that each Fund might reasonably expect to receive or pay from the current sale or purchase of that asset or liability in an arm’s-length transaction. Fair value determinations shall be based upon all available factors that the Global Valuation Committee, or its delegate, deems relevant consistent with the principles of fair value measurement. The pricing of all Fair Value Investments is subsequently reported to the Board or a committee thereof on a quarterly basis.
Generally, trading in foreign instruments is substantially completed each day at various times prior to the close of business on the NYSE. Occasionally, events affecting the values of such instruments may occur between the foreign market close and the close of business on the NYSE that may not be reflected in the computation of each Fund’s net assets. If events (e.g., a company announcement, market volatility or a natural disaster) occur during such periods that are expected to materially affect the value of such instruments, those instruments may be Fair Value Investments and be valued at their fair value, as determined in good faith by the Global Valuation Committee, or its delegate, using a pricing service and/or policies approved by the Board. Each business day, the Funds use a pricing service to assist with the valuation of certain foreign exchange-traded and OTC options (the “Systematic Fair Value Price”). Using current market factors, the Systematic Fair Value Price is designed to value such foreign securities and foreign options at fair value as of the close of business on the NYSE, which follows the close of the local markets.
Foreign Currency: The Funds’ books and records are maintained in U.S. dollars. Purchases and sales of investment securities are recorded at the rates of exchange prevailing on the respective date of such transactions. Generally, when the U.S. dollar rises in value against a foreign currency, the Funds’ investments denominated in that currency will lose value because that currency is worth fewer U.S. dollars; the opposite effect occurs if the U.S. dollar falls in relative value.
The Funds do not isolate the portion of the results of operations arising as a result of changes in the foreign exchange rates from the changes in the market prices of investments held or sold for financial reporting purposes. Accordingly, the effects of changes in foreign currency exchange rates on investments are not segregated in the Consolidated Statements of Operations from the effects of changes in market prices of those investments but are included as a component of net realized and unrealized gain (loss) from investments. The Funds report realized currency gains (losses) on foreign currency related transactions as components of net realized gain (loss) for financial reporting purposes, whereas such components are generally treated as ordinary income for federal income tax purposes.
Segregation and Collateralization: In cases where a Fund enters into certain investments (e.g., financial futures contracts, forward foreign currency exchange contracts, options written and swaps) that would be “senior securities” for 1940 Act purposes, the Fund may segregate or designate on its books and records cash or liquid securities having a market value at least equal to the amount of the Fund’s future obligations under such investments. Doing so allows the investment to be excluded from treatment as a “senior security.” Furthermore, if required by an exchange or counterparty agreement, the Fund may be required to deliver/deposit cash and/or securities to/with an exchange, or broker-dealer or custodian as collateral for certain investments or obligations.
Investment Transactions and Investment Income: For financial reporting purposes, investment transactions are recorded on the dates the transactions are entered into (the trade dates). Realized gains and losses on investment transactions are determined on the identified cost basis. Dividend income is recorded on the ex-dividend date. Dividends from foreign securities where the ex-dividend date may have past are subsequently recorded when the Funds are informed of the ex-dividend date. Under the applicable foreign tax laws, a withholding tax at various rates may be imposed on capital gains, dividends and interest. Upon notification from issuers, some of the dividend income received from a real estate investment trust may be redesignated as a reduction of cost of the related investment and/or realized gain. Interest income, including amortization and accretion of premiums and discounts on debt securities, is recognized on the accrual basis. Income, expenses and realized and unrealized gains and losses are allocated daily to each class based on its relative net assets.
Distributions: Distributions paid by the Funds are recorded on the ex-dividend date. The character and timing of distributions are determined in accordance with federal income tax regulations, which may differ from U.S. GAAP.
| | | | | | |
| | | BLACKROCK FUNDS | | JANUARY 31, 2015 | | 31 |
| | |
| Notes to Consolidated Financial Statements (continued) | | |
Net income and realized gains from investments held by the Subsidiaries are treated as ordinary income for tax purposes. Accordingly, the net investment income (loss) and realized gains (losses) reported in the Funds’ consolidated financial statements presented under U.S. GAAP for such investments held by the Subsidiaries may differ significantly from distributions. As such, any net gain will pass through to the Funds as ordinary income for federal income tax purposes. If a net loss is realized by the Subsidiaries in any taxable year, the loss will generally not be available to offset the Funds’ ordinary income and/or capital gains for that year.
Recent Accounting Standard: In June 2014, the Financial Accounting Standards Board issued guidance to improve the financial reporting of reverse repurchase agreements and other similar transactions. The guidance will require expanded disclosure for entities that enter into reverse repurchase agreements and similar transactions accounted for as secured borrowings. It is effective for financial statements with fiscal years beginning on or after December 15, 2014 and interim periods within those fiscal years. Management is evaluating the impact, if any, of this guidance on the Funds’ financial statement disclosures.
Other: Expenses directly related to a Fund or its classes are charged to that Fund or the applicable class. Other operating expenses shared by several funds are prorated among those funds on the basis of relative net assets or other appropriate methods. Expenses directly related to the Funds and other shared expenses prorated to the Funds are allocated daily to each class based on its relative net assets or other appropriate methods.
The Funds have an arrangement with the custodian whereby fees may be reduced by credits earned on uninvested cash balances, which, if applicable, are shown as fees paid indirectly in the Consolidated Statements of Operations. The custodian imposes fees on overdrawn cash balances, which can be offset by accumulated credits earned or may result in additional custody charges.
3. Securities and Other Investments:
Inflation-Indexed Bonds: The Funds may invest in inflation-indexed bonds. Inflation-indexed bonds are fixed income securities whose principal value is periodically adjusted according to the rate of inflation. If the index measuring inflation rises or falls, the principal value of inflation-indexed bonds will be adjusted upward or downward, and consequently the interest payable on these securities (calculated with respect to a larger or smaller principal amount) will be increased or reduced, respectively. Any upward or downward adjustment in the principal amount of an inflation-indexed bond will be included as interest income in the Consolidated Statements of Operations, even though investors do not receive their principal until maturity. Repayment of the original bond principal upon maturity (as adjusted for inflation) is guaranteed in the case of U.S. Treasury inflation-indexed bonds. For bonds that do not provide a similar guarantee, the adjusted principal value of the bond repaid at maturity may be less than the original principal.
Securities Lending: Multi-Asset Real Return may lend its securities to approved borrowers, such as brokers, dealers and other financial institutions. The borrower pledges and maintains with the Fund collateral consisting of cash, an irrevocable letter of credit issued by a bank, or securities issued or guaranteed by the U.S. government. The initial collateral received by Multi-Asset Real Return is required to have a value of at least 102% of the current value of the loaned securities for securities traded on U.S. exchanges and a value of at least 105% for all other securities. The collateral is maintained thereafter at a value equal to at least 100% of the current market value of the securities on loan. The market value of the loaned securities is determined at the close of each business day of the Fund and any additional required collateral is delivered to the Fund on the next business day. During the term of the loan, Multi-Asset Real Return is entitled to all distributions made on or in respect of the loaned securities. Loans of securities are terminable at any time and the borrower, after notice, is required to return borrowed securities within the standard time period for settlement of securities transactions.
The market value of securities on loan and the value of the related collateral are shown separately in the Consolidated Statements of Assets and Liabilities as a component of investments at value, and collateral on securities loaned at value, respectively. As of January 31, 2015, any securities on loan were collateralized by cash. The cash collateral invested by the securities lending agent, BlackRock Investment Management, LLC (“BIM”), if any, is disclosed in the Consolidated Schedules of Investments.
Securities lending transactions are entered into by Multi-Asset Real Return under Master Securities Lending Agreements (each, an “MSLA”) which provide the right, in the event of default (including bankruptcy or insolvency), for the non-defaulting party to liquidate the collateral and calculate a net exposure to the defaulting party or request additional collateral. In the event that a borrower defaults, Multi-Asset Real Return, as lender, would offset the market value of the collateral received against the market value of the securities loaned. When the value of the collateral is greater than that of the market value of the securities loaned, the lender is left with a net amount payable to the defaulting party. However, bankruptcy or insolvency laws of a particular jurisdiction may impose restrictions on or prohibitions against such a right of offset in the event of an MSLA counterparty’s bankruptcy or insolvency. Under the MSLA, the borrower can resell or re-pledge the loaned securities, and Multi-Asset Real Return can reinvest cash collateral, or, upon an event of default, resell or re-pledge the collateral.
| | | | | | |
| 32 | | BLACKROCK FUNDS | | JANUARY 31, 2015 | | |
| | |
| Notes to Consolidated Financial Statements (continued) | | |
The risks of securities lending include the risk that the borrower may not provide additional collateral when required or may not return the securities when due. To mitigate these risks, Multi-Asset Real Return benefits from a borrower default indemnity provided by BIM. BIM’s indemnity allows for full replacement of the securities lent if the collateral received does not cover the value on the securities loaned in the event of borrower default. Multi-Asset Real Return could suffer a loss if the value of an investment purchased with cash collateral falls below the market value of loaned securities or if the value of an investment purchased with cash collateral falls below the value of the original cash collateral received.
4. Derivative Financial Instruments:
The Funds engage in various portfolio investment strategies using derivative contracts both to increase the returns of the Funds and/or to economically hedge their exposure to certain risks such as credit risk, equity risk, interest rate risk, foreign currency exchange rate risk, commodity price risk or other risk (e.g. inflation risk). These contracts may be transacted on an exchange or OTC.
Financial Futures Contracts: The Funds invest in long and/or short positions in financial futures contracts and options on financial futures contracts to gain exposure to, or economically hedge against, changes in interest rates (interest rate risk) or changes in the value of equity securities (equity risk). Financial futures contracts are agreements between the Fund and a counterparty to buy or sell a specific quantity of an underlying instrument at a specified price and at a specified date. Depending on the terms of the particular contract, financial futures contracts are settled either through physical delivery of the underlying instrument on the settlement date or by payment of a cash settlement amount on the settlement date.
Upon entering into a financial futures contract, the Fund is required to deposit initial margin with the broker in the form of cash or securities in an amount that varies depending on a contract’s size and risk profile. The initial margin deposit must then be maintained at an established level over the life of the contract. Securities deposited as initial margin are designated on the Consolidated Schedules of Investments and cash deposited, if any, is recorded on the Consolidated Statements of Assets and Liabilities as cash pledged for financial futures contracts. Pursuant to the contract, the Fund agrees to receive from or pay to the broker an amount of cash equal to the daily fluctuation in value of the contract. Such receipts or payments are known as variation margin. Variation margin is recorded by the Fund as unrealized appreciation or depreciation, and, if applicable, as a receivable or payable for the variation margin in the Consolidated Statements of Assets and Liabilities.
When the contract is closed, the Fund records a realized gain or loss equal to the difference between the value of the contract at the time it was opened and the value at the time it was closed. The use of financial futures contracts involves the risk of an imperfect correlation in the movements in the price of financial futures contracts, interest or foreign currency exchange rates and the underlying assets.
Forward Foreign Currency Exchange Contracts: The Funds enter into forward foreign currency exchange contracts as an economic hedge against either specific transactions or portfolio instruments or to obtain exposure to, or hedge exposure away from, foreign currencies (foreign currency exchange rate risk). A forward foreign currency exchange contract is an agreement between two parties to buy and sell a currency at a set exchange rate on a future date. Forward foreign currency exchange contracts, when used by the Funds, help to manage the overall exposure to the currencies in which some of the investments held by the Funds are denominated. The contract is marked-to-market daily and the change in market value is recorded by the Funds as an unrealized gain or loss. When the contract is closed, the Funds record a realized gain or loss equal to the difference between the value at the time it was opened and the value at the time it was closed. The use of forward foreign currency exchange contracts involves the risk that the value of a forward foreign currency exchange contract changes unfavorably due to movements in the value of the referenced foreign currencies.
Options: Strategic Risk Allocation purchases and writes call and put options to increase or decrease its exposure to underlying instruments (including interest rate risk) and/or, in the case of options written, to generate gains from options premiums. A call option gives the purchaser (holder) of the option the right (but not the obligation) to buy, and obligates the seller (writer) to sell (when the option is exercised), the underlying instrument at the exercise or strike price at any time or at a specified time during the option period. A put option gives the holder the right to sell and obligates the writer to buy the underlying instrument at the exercise or strike price at any time or at a specified time during the option period. When the Fund purchases (writes) an option, an amount equal to the premium paid (received) by the Fund is reflected as an asset (liability). The amount of the asset (liability) is subsequently marked-to-market to reflect the current market value of the option purchased (written). When an instrument is purchased or sold through an exercise of an option, the related premium paid (or received) is added to (or deducted from) the basis of the instrument acquired or deducted from (or added to) the proceeds of the instrument sold. When an option expires (or the Fund enters into a closing transaction), the Fund realizes a gain or loss on the option to the extent of the premiums received or paid (or gain or loss to the extent the cost of the closing transaction exceeds the premiums received or paid). When the Fund writes a call option, such option is “covered,” meaning that the Fund holds the underlying instrument subject to being called by the option counterparty. When the Fund writes a put option, such option is covered by cash in an amount sufficient to cover the obligation.
| | | | | | |
| | | BLACKROCK FUNDS | | JANUARY 31, 2015 | | 33 |
| | |
Notes to Consolidated Financial Statements (continued) | | |
Options on swaps (“swaptions”) are similar to options on securities except that instead of selling or purchasing the right to buy or sell a security, the writer or purchaser of the swaptions is granting or buying the right to enter into a previously agreed upon interest rate or credit default swap agreement (interest rate risk and/or credit risk) at any time before the expiration of the option.
In purchasing and writing options, the Fund bears the risk of an unfavorable change in the value of the underlying instrument or the risk that the Fund may not be able to enter into a closing transaction due to an illiquid market. Exercise of a written option could result in the Fund purchasing or selling a security when it otherwise would not, or at a price different from the current market value.
For the six months ended January 31, 2015 for Strategic Risk Allocation, transactions in options written were as follows:
| | | | | | | | |
| | | | Calls | |
| | | | |
| | | Notional
(000) | | | Premiums
Received | |
| | | | |
Outstanding options, beginning of period | | $ | 13,400 | | | $ | 93,800 | |
Options written | | | 8,400 | | | | 62,160 | |
Options closed | | | (13,400 | ) | | | (93,800 | ) |
| | | | |
Outstanding options, end of period | | $ | 8,400 | | | $ | 62,160 | |
| | | | |
| | | | | | | | | |
Swaps: The Funds enter into swap agreements, in which a Fund and a counterparty agree either to make periodic net payments on a specified notional amount or a net payment upon termination. Swap agreements are privately negotiated in the OTC market and may be entered into as a bilateral contract (“OTC swaps”) or centrally cleared (“centrally cleared swaps”). Swaps are marked-to-market daily and changes in value are recorded as unrealized appreciation (depreciation).
For OTC swaps, any upfront premiums paid are recorded as assets and any upfront fees received are recorded as liabilities and are shown as swap premiums paid and swap premiums received, respectively, in the Consolidated Statements of Assets and Liabilities and amortized over the term of the OTC swap. Payments received or made by the Funds for OTC swaps are recorded in the Consolidated Statements of Operations as realized gains or losses, respectively. When an OTC swap is terminated, the Funds will record a realized gain or loss equal to the difference between the proceeds from (or cost of) the closing transaction and the Funds’ basis in the contract, if any. Generally, the basis of the contracts is the premium received or paid.
In a centrally cleared swap, immediately following execution of the swap agreement, the swap agreement is novated to a central counterparty (the “CCP”) and the Funds’ counterparty on the swap agreement becomes the CCP. The Funds are required to interface with the CCP through a broker. Upon entering into a centrally cleared swap, the Funds are required to deposit initial margin with the broker in the form of cash or securities in an amount that varies depending on the size and risk profile of the particular swap. Securities deposited as initial margin are designated on the Consolidated Schedules of Investments and cash deposited is recorded on the Consolidated Statements of Assets and Liabilities as cash pledged for centrally cleared swaps. The daily change in valuation of centrally cleared swaps is recorded as a receivable or payable for variation margin in the Consolidated Statements of Assets and Liabilities. Payments received from (paid to) the counterparty, including at termination, are recorded as realized gain (loss) in the Consolidated Statements of Operations.
Swap transactions involve, to varying degrees, elements of interest rate, credit and market risk in excess of the amounts recognized in the Consolidated Statements of Assets and Liabilities. Such risks involve the possibility that there will be no liquid market for these agreements, that the counterparty to the agreements may default on its obligation to perform or disagree as to the meaning of the contractual terms in the agreements, and that there may be unfavorable changes in interest rates and/or market values associated with these transactions.
| Ÿ | | Credit default swaps — The Funds enter into credit default swaps to manage their exposure to the market or certain sectors of the market, to reduce their risk exposure to defaults of corporate and/or sovereign issuers or to create exposure to corporate and/or sovereign issuers to which they are not otherwise exposed (credit risk). The Funds may either buy or sell (write) credit default swaps on single-name issuers (corporate or sovereign), a combination or basket of single-name issuers or traded indexes. Credit default swaps on single-name issuers are agreements in which the protection buyer pays fixed periodic payments to the seller in consideration for a guarantee from the protection seller to make a specific payment should a negative credit event take place with respect to the referenced entity (e.g., bankruptcy, failure to pay, obligation accelerators, repudiation, moratorium or restructuring). Credit default swaps on traded indexes are agreements in which the buyer pays fixed periodic payments to the seller in consideration for a guarantee from the seller to make a specific payment should a write-down, principal or interest shortfall or default of all or individual underlying securities included in the index occur. As a buyer, if an underlying credit event occurs, the Funds will either (i) receive from the seller an amount equal to the notional amount of the swap and deliver the referenced security or underlying securities comprising the index, or (ii) receive a net settlement of cash equal to the notional amount of the swap less the recovery value of the security or underlying securities comprising the index. As a seller (writer), if an underlying credit event occurs, the Funds will either pay the buyer an amount equal to the notional amount of the |
| | | | | | |
| 34 | | BLACKROCK FUNDS | | JANUARY 31, 2015 | | |
| | |
Notes to Consolidated Financial Statements (continued) | | |
| | swap and take delivery of the referenced security or underlying securities comprising the index or pay a net settlement of cash equal to the notional amount of the swap less the recovery value of the security or underlying securities comprising the index. |
| Ÿ | | Total return swaps — The Funds enter into total return swaps to obtain exposure to a security or market without owning such security or investing directly in that market or to transfer the risk/return of one market (e.g., fixed income) to another market (e.g., equity or commodity prices) (equity risk, commodity price risk and/or interest rate risk). Total return swaps are agreements in which there is an exchange of cash flows whereby one party commits to make payments based on the total return (coupons plus capital gains/losses) of an underlying instrument in exchange for fixed or floating rate interest payments. To the extent the total return of the instrument or index underlying the transaction exceeds or falls short of the offsetting interest rate obligation, the Funds will receive a payment from or make a payment to the counterparty. |
The following is a summary of the Funds’ derivative financial instruments categorized by risk exposure:
| | | | | | | | | | | | | | | | | | |
| Fair Values of Derivative Financial Instruments as of January 31, 2015 | |
| | | | | Multi-Asset
Real Return | | | Strategic Risk
Allocation | |
| | | | | Value | |
| | | Consolidated Statements of Assets and Liabilities Location | | Derivative
Assets | | | Derivative
Liabilities | | | Derivative
Assets | | | Derivative
Liabilities | |
| | Net unrealized appreciation/depreciation1 ; | | | | | | | | | | | | | | | | |
Interest rate contracts | | Unrealized appreciation/depreciation on OTC swaps1 | | | — | | | $ | 271,116 | | | $ | 941,836 | | | $ | 595,638 | |
Foreign currency exchange contracts | | Unrealized appreciation/depreciation on forward foreign currency exchange contracts | | $ | 2,830 | | | | 5,492 | | | | 859,924 | | | | 15,634 | |
Credit contracts | | Unrealized appreciation on OTC swaps1 ; Swap premiums paid | | | — | | | | 23,630 | | | | 122,282 | | | | 609,908 | |
| | Net unrealized appreciation/depreciation1 ; | | | | | | | | | | | | | | | | |
Equity contracts | | Unrealized appreciation on OTC swaps1 | | | — | | | | — | | | | 186,938 | | | | 40,617 | |
Commodity contracts | | Unrealized appreciation on OTC swaps1 | | | — | | | | 650,349 | | | | — | | | | 409,852 | |
Total | | | | $ | 2,830 | | | $ | 950,587 | | | $ | 2,110,980 | | | $ | 1,671,649 | |
| | | | | | |
| | | | | |
| | | | | | | | | | | | | | | | | | | |
| | 1 | | Includes cumulative appreciation/depreciation on financial futures contracts and centrally cleared swaps, if any, as reported in the Consolidated Schedules of Investments. Only current day’s variation margin is reported within the Consolidated Statements of Assets and Liabilities. |
| | | | | | | | | | | | | | | | | | |
The Effect of Derivative Financial Instruments in the Consolidated Statements of Operations
Six Months Ended January 31, 2015 | |
| | | Multi-Asset
Real Return | | | Strategic Risk
Allocation | | | | | Multi-Asset Real Return | | | Strategic Risk
Allocation | |
| | | Net Realized Gain (Loss) From | | | | | Net Change in Unrealized
Appreciation/Depreciation on | |
Interest rate contracts: | | | | | | | | | | | | | | | | | | |
Financial futures contracts | | $ | (26,878 | ) | | $ | 277,012 | | | | | $ | (271,116 | ) | | $ | 77,337 | |
Swaps | | | — | | | | 621,327 | | | | | | — | | | | 633,517 | |
Options1 | | | — | | | | 11,440 | | | | | | — | | | | (674,598 | ) |
Foreign currency exchange contracts: | | | | | | | | | | | | | | | | | | |
Foreign currency transactions/translations | | | 6,396 | | | | 741,127 | | | | | | (3,371 | ) | | | 744,361 | |
Credit contracts: | | | | | | | | | | | | | | | | | | |
Swaps | | | 85,061 | | | | 221,245 | | | | | | 26,897 | | | | (348,328 | ) |
Equity contracts: | | | | | | | | | | | | | | | | | | |
Financial futures contracts | | | — | | | | (90,532 | ) | | | | | — | | | | 88,645 | |
Swaps | | | — | | | | 20,457 | | | | | | — | | | | (290,487 | ) |
Commodity contracts: | | | | | | | | | | | | | | | | | | |
Swaps | | | (4,587,363 | ) | | | (286,629 | ) | | | | | (86,609 | ) | | | (373,990 | ) |
| | | | | | | | | | |
Total | | $ | (4,522,784 | ) | | $ | 1,515,447 | | | | | $ | (334,199 | ) | | $ | (143,543 | ) |
| | | | |
| | | | | |
| | | | | | | | | | | | | | | | | | | |
| | 1 | | Options purchased are included in the net realized gain (loss) from investments and net change in unrealized appreciation/depreciation on investments. |
| | | | | | |
| | | BLACKROCK FUNDS | | JANUARY 31, 2015 | | 35 |
| | |
| Notes to Consolidated Financial Statements (continued) | | |
For the six months ended January 31, 2015, the average quarterly balances of outstanding derivative financial instruments were as follows:
| | | | | | | | |
| | | Multi-Asset
Real Return | | | Strategic Risk
Allocation | |
Financial futures contracts: | | | | | | | | |
Average notional value of contracts - long | | | — | | | $ | 9,358,866 | |
Average notional value of contracts - short | | $ | 3,729,938 | | | $ | 341,040 | |
Forward foreign currency exchange contracts: | | | | | | | | |
Average amounts purchased - in USD | | $ | 340,635 | | | $ | 12,642,437 | |
Average amounts sold - in USD | | $ | 313,800 | | | | — | |
Options: | | | | | | | | |
Average notional value of swaption contracts purchased | | | — | | | $ | 8,400,000 | |
Average notional value of swaption contracts written | | | — | | | $ | 8,400,000 | |
Credit default swaps: | | | | | | | | |
Average notional value - buy protection | | | — | | | $ | 328,500 | |
Average notional value - sell protection | | $ | 5,616,000 | | | $ | 22,397,640 | |
Total return swaps: | | | | | | | | |
Average notional value | | $ | 8,092,147 | | | $ | 24,023,677 | |
Counterparty Credit Risk: A derivative contract may suffer a mark-to-market loss if the value of the contract decreases due to an unfavorable change in the market rates or values of the underlying instrument. Losses can also occur if the counterparty does not perform under the contract.
A Fund’s risk of loss from counterparty credit risk on OTC derivatives is generally limited to the aggregate unrealized gain netted against any collateral held by such Fund.
For OTC options purchased, each Fund bears the risk of loss of the amount of premiums paid plus the positive change in market values net of any collateral held by such Fund should the counterparty fail to perform under the contracts. Options written by the Funds do not typically give rise to counterparty credit risk, as options written generally obligate the Funds, and not the counterparty, to perform.
With exchange traded futures and centrally cleared swaps, there is less counterparty credit risk to the Funds since the exchange or clearinghouse, as counterparty to such instruments, guarantees against a possible default. The clearinghouse stands between the buyer and the seller of the contract; therefore, the credit risk is limited to failure of the clearinghouse. While offset rights may exist under applicable law, a Fund does not have a contractual right of offset against a clearing broker or clearinghouse in the event of a default (including the bankruptcy or insolvency) of the clearing broker or clearinghouse. Additionally, credit risk exists in exchange-traded futures and centrally cleared swaps with respect to initial and variation margin that is held in a clearing broker’s customer accounts. While clearing brokers are required to segregate customer margin from their own assets, in the event that a clearing broker becomes insolvent or goes into bankruptcy and at that time there is a shortfall in the aggregate amount of margin held by the clearing broker for all its clients, typically the shortfall would be allocated on a pro rata basis across all the clearing broker’s customers, potentially resulting in losses to the Funds.
In order to better define its contractual rights and to secure rights that will help the Funds mitigate their counterparty risk, a Fund may enter into an International Swaps and Derivatives Association, Inc. Master Agreement (“ISDA Master Agreement”) or similar agreement with its counterparties. An ISDA Master Agreement is a bilateral agreement between each Fund and a counterparty that governs certain OTC derivatives and typically contains, among other things, collateral posting terms and netting provisions in the event of a default and/or termination event. Under an ISDA Master Agreement, each Fund may, under certain circumstances, offset with the counterparty certain derivative financial instruments’ payables and/or receivables with collateral held and/or posted and create one single net payment. The provisions of the ISDA Master Agreement typically permit a single net payment in the event of default including the bankruptcy or insolvency of the counterparty. Bankruptcy or insolvency laws of a particular jurisdiction may restrict or prohibit the right of offset in bankruptcy, insolvency or other events. In addition, certain ISDA Master Agreements allow counterparties to terminate derivative contracts prior to maturity in the event a Fund’s net assets decline by a stated percentage or the Fund fails to meet the terms of its ISDA Master Agreements. The result would cause the Fund to accelerate payment of any net liability owed to the counterparty.
Collateral Requirements: For derivatives traded under an ISDA Master Agreement, the collateral requirements are typically calculated by netting the mark-to-market amount for each transaction under such agreement and comparing that amount to the value of any collateral currently pledged by the Funds and the counterparty.
Cash collateral that has been pledged to cover obligations of the Funds and cash collateral received from the counterparty, if any, is reported separately on the Consolidated Statements of Assets and Liabilities as cash pledged as collateral and cash received as collateral, respectively. Non-cash collateral pledged by the Funds, if any, is noted in the Consolidated Schedules of Investments. Generally, the amount of collateral due from or to a party has
| | | | | | |
| 36 | | BLACKROCK FUNDS | | JANUARY 31, 2015 | | |
| | |
Notes to Consolidated Financial Statements (continued) | | |
to exceed a minimum transfer amount threshold (typically either $250,000 or $500,000) before a transfer is required, which is determined at the close of business of the Funds. Any additional required collateral is delivered to/pledged by the Funds on the next business day. Typically, the Funds and counterparties are not permitted to sell, re-pledge or use the collateral they receive. To the extent amounts due to the Funds from their counterparties are not fully collateralized, the Funds bear the risk of loss from counterparty non-performance. Likewise, to the extent a Fund has delivered collateral to a counterparty and stands ready to perform under the terms of its agreement with such counterparty, a Fund bears the risk of loss from a counterparty in the amount of the value of the collateral in the event the counterparty fails to return such collateral.
For financial reporting purposes, the Funds do not offset derivative assets and derivative liabilities that are subject to netting arrangements, if any, in the Consolidated Statements of Assets and Liabilities.
As of January 31, 2015, the Funds’ derivative assets and liabilities (by type) are as follows:
| | | | | | | | | | | | | | | | |
| | | Multi-Asset
Real Return | | | Strategic Risk
Allocation | |
| | | Assets | | | Liabilities | | | Assets | | | Liabilities | |
Derivative Financial Instruments: | | | | | | | | | | | | | | | | |
Financial futures contracts | | $ | 160 | | | $ | 39,188 | | | $ | 17,742 | | | $ | 58,715 | |
Forward foreign currency exchange contracts | | | 2,830 | | | | 5,492 | | | | 859,924 | | | | 15,634 | |
Options | | | — | | | | — | | | | 54 | 1 | | | 595,638 | |
Swaps - centrally cleared | | | — | | | | 10,424 | | | | — | | | | 9,201 | |
Swaps - OTC2 | | | — | | | | 650,349 | | | | 957,908 | | | | 1,024,872 | |
| | | | |
Total derivative assets and liabilities in the Consolidated Statements of Assets and Liabilities | | $ | 2,990 | | | $ | 705,453 | | | $ | 1,835,628 | | | $ | 1,704,060 | |
Derivatives not subject to a Master Netting Agreement or similar agreement (“MNA”) | | | (160 | ) | | | (49,612 | ) | | | (17,742 | ) | | | (67,916 | ) |
| | | | |
Total derivative assets and liabilities subject to an MNA | | $ | 2,830 | | | $ | 655,841 | | | $ | 1,817,886 | | | $ | 1,636,144 | |
| | | | |
| | 1 | | Includes options purchased at value which are included in Investments at value — unaffiliated in the Consolidated Statements of Assets and Liabilities and reported in the Consolidated Schedules of Investments. |
| | 2 | | Includes unrealized appreciation/depreciation on OTC swaps and swap premiums paid/received, if any, in the Consolidated Statements of Assets and Liabilities. |
As of January 31, 2015, the following tables present the Funds’ derivative assets and/or liabilities by counterparty net of amounts available for offset under an MNA and net of the related collateral received/pledged by the Funds:
| | | | | | | | | | | | | | | | | | |
| Multi-Asset Real Return | | | | | | | | | | | | | | |
| Counterparty | | Derivative Assets
Subject to an MNA by
Counterparty | | | Derivatives Available
for Offset1 | | | Non-cash
Collateral
Received | | Cash
Collateral
Received | | | Net Amount of
Derivative Assets2 | |
BNP Paribas S.A. | | $ | 46 | | | | — | | | — | | | — | | | $ | 46 | |
Goldman Sachs International | | | 812 | | | | — | | | — | | | — | | | | 812 | |
HSBC Bank PLC | | | 1,109 | | | $ | (864 | ) | | — | | | — | | | | 245 | |
Standard Chartered Bank | | | 863 | | | | (863 | ) | | — | | | — | | | | — | |
| | | | |
Total | | $ | 2,830 | | | $ | (1,727 | ) | | — | | | — | | | $ | 1,103 | |
| | | | |
| | | | | | | | | | | | | | | | | | |
| Counterparty | | Derivative Liabilities
Subject to an MNA by
Counterparty | | | Derivatives Available
for Offset1 | | | Non-cash
Collateral
Pledged | | Cash
Collateral
Pledged | | | Net Amount of
Derivative Liabilities3 | |
Bank of America N.A. | | $ | 528 | | | | — | | | — | | | — | | | $ | 528 | |
HSBC Bank PLC | | | 864 | | | $ | (864 | ) | | — | | | — | | | | — | |
JPMorgan Chase Bank N.A. | | | 650,518 | | | | — | | | — | | $ | (650,518 | ) | | | — | |
Morgan Stanley Capital Services LLC | | | 2,674 | | | | — | | | — | | | — | | | | 2,674 | |
Standard Chartered Bank | | | 1,029 | | | | (863 | ) | | — | | | — | | | | 166 | |
State Street Bank and Trust Co. | | | 228 | | | | — | | | — | | | — | | | | 228 | |
| | | | |
Total | | $ | 655,841 | | | $ | (1,727 | ) | | — | | $ | (650,518 | ) | | $ | 3,596 | |
| | | | |
| | | | | | |
| | | BLACKROCK FUNDS | | JANUARY 31, 2015 | | 37 |
| | |
| Notes to Consolidated Financial Statements (continued) | | |
| | | | | | | | | | | | | | | | |
Strategic Risk Allocation | | | | | | | | | | | | | | | | |
| Counterparty | | Derivative Assets
Subject to an MNA by
Counterparty | | | Derivatives
Available for Offset1 | | | Non-cash
Collateral
Received | | Cash
Collateral
Received | | Net Amount of
Derivative Assets2 | |
Bank of America N.A | | $ | 851,994 | | | | — | | | — | | — | | $ | 851,994 | |
BNP Paribas S.A | | | 43,914 | | | $ | (43,914 | ) | | — | | — | | | — | |
Citibank N.A | | | 8,209 | | | | (1,736 | ) | | — | | — | | | 6,473 | |
Credit Suisse International | | | 8,332 | | | | — | | | — | | — | | | 8,332 | |
Deutsche Bank AG | | | 517,598 | | | | (2,082 | ) | | — | | — | | | 515,516 | |
JPMorgan Chase Bank N.A | | | 387,839 | | | | (387,839 | ) | | — | | — | | | — | |
| | | | |
Total | | $ | 1,817,886 | | | $ | (435,571 | ) | | — | | — | | $ | 1,382,315 | |
| | | | |
| | | | | | | | | | | | | | | | |
| Counterparty | | Derivative Liabilities
Subject to an MNA by
Counterparty | | | Derivatives
Available
for Offset1 | | | Non-cash
Collateral
Pledged | | Cash
Collateral
Pledged | | Net Amount of
Derivative
Liabilities3 | |
BNP Paribas S.A | | $ | 409,852 | | | $ | (43,914 | ) | | — | | — | | $ | 365,938 | |
Citibank N.A | | | 1,736 | | | | (1,736 | ) | | — | | — | | | — | |
Deutsche Bank AG | | | 2,082 | | | | (2,082 | ) | | — | | — | | | — | |
Goldman Sachs International | | | 9,072 | | | | — | | | — | | — | | | 9,072 | |
JPMorgan Chase Bank N.A | | | 1,213,402 | | | | (387,839 | ) | | $(825,563) | | — | | | — | |
| | | | |
Total | | $ | 1,636,144 | | | $ | (435,571 | ) | | $(825,563) | | — | | $ | 375,010 | |
| | | | |
| | 1 | | The amount of derivatives available for offset is limited to the amount of assets and/or liabilities that are subject to an MNA. |
| | 2 | | Net amount represents the net amount receivable from the counterparty in the event of default. |
| | 3 | | Net amount represents the net amount payable due to the counterparty in the event of default. |
5. Investment Advisory Agreement and Other Transactions with Affiliates:
The PNC Financial Services Group, Inc. is the largest stockholder and an affiliate, for 1940 Act purposes, of BlackRock, Inc. (“BlackRock”).
The Trust, on behalf of the Funds, entered into an Investment Advisory Agreement with the Manager, the Funds’ investment advisor, an indirect, wholly owned subsidiary of BlackRock, to provide investment advisory and administration services. The Manager is responsible for the management of each Fund’s portfolio and provides the necessary personnel, facilities, equipment and certain other services to the operations of each Fund. For such services, each Fund pays the Manager a monthly fee based on a percentage of each Fund’s average daily net assets at the following annual rates:
| | | | | | | | |
| | | Multi-Asset
Real Return | | | Strategic Risk
Allocation | |
| Average Daily Net Assets | | Investment Advisory Fee | |
First $1 Billion | | | 0.60 | % | | | 0.75 | % |
$1 Billion - $3 Billion | | | 0.56 | % | | | 0.71 | % |
$3 Billion - $5 Billion | | | 0.54 | % | | | 0.68 | % |
$5 Billion - $10 Billion | | | 0.52 | % | | | 0.65 | % |
Greater than $10 Billion | | | 0.51 | % | | | 0.64 | % |
The Manager voluntarily agreed to waive its investment advisory fees by the amount of investment advisory fees each Fund pays to the Manager indirectly through its investment in affiliated money market funds. In addition, for Multi-Asset Real Return, the Manager has contractually agreed to waive the management fee on assets estimated to be attributed to the Fund’s investments in other equity and fixed income mutual funds managed by BlackRock or its affiliates. However, for Strategic Risk Allocation, the Manager does not waive its investment advisory fees by the amount of investment advisory fees paid in connection with the Fund’s investments in other affiliated investment companies, if any. These amounts are included in fees waived by Manager in the Consolidated Statements of Operations. For the six months ended January 31, 2015, the amounts waived were as follows:
| | | | |
Multi-Asset Real Return | | $ | 50,293 | |
Strategic Risk Allocation | | $ | 4,208 | |
The Manager provides investment management and other services to the Subsidiaries. The Manager does not receive separate compensation from the Subsidiaries for providing investment management or administrative services. However, the Funds pay the Manager based on each Fund’s net assets, which includes the assets of the Subsidiaries.
With respect to each Fund, the Manager entered into separate sub-advisory agreements with BlackRock International Limited (“BIL”), an affiliate of the Manager. With respect to Multi-Asset Real Return, the Manager has also entered into a separate sub-advisory agreement with BlackRock (Singapore)
| | | | | | |
| 38 | | BLACKROCK FUNDS | | JANUARY 31, 2015 | | |
| | |
Notes to Consolidated Financial Statements (continued) | | |
Limited (“BRS”), which is also an affiliate of the Manager. The Manager pays BIL and BRS, as applicable, for services they provide a monthly fee that is a percentage of the investment advisory fees paid by the Funds to the Manager.
The Trust, on behalf of the Funds, entered into a Distribution Agreement and Distribution and Service Plan with BlackRock Investments, LLC (“BRIL”), an affiliate of the Manager. Pursuant to the Distribution and Service Plan and in accordance with Rule 12b-1 under the 1940 Act, the Funds pay BRIL ongoing service and distribution fees. The fees are accrued daily and paid monthly at annual rates based upon the average daily net assets of the relevant share class of each Fund as follows:
| | | | | | | | |
| | | Service
Fee | | | Distribution
Fee | |
Investor A | | | 0.25 | % | | | — | |
Investor C | | | 0.25 | % | | | 0.75 | % |
Pursuant to sub-agreements with BRIL, broker-dealers and BRIL provide shareholder servicing and distribution services to each Fund. The ongoing service and/or distribution fee compensates BRIL and each broker-dealer for providing shareholder servicing and/or distribution related services to Investor A and Investor C shareholders.
For the six months ended January 31, 2015, the following table shows the class specific service and distribution fees borne directly by each class of each Fund:
| | | | | | | | | | | | |
| | | Investor A | | | Investor C | | | Total | |
Multi-Asset Real Return | | $ | 6,868 | | | $ | 11,867 | | | $ | 18,735 | |
Strategic Risk Allocation | | $ | 1,554 | | | $ | 2,420 | | | $ | 3,974 | |
Pursuant to written agreements, certain financial intermediaries, some of which may be affiliates, provide the Funds with sub-accounting, recordkeeping, sub-transfer agency and other administrative services with respect to sub-accounts they service. For these services, these entities receive an asset-based fee or an annual fee per shareholder account, which will vary depending on share class and/or net assets.
The Manager maintains a call center, which is responsible for providing certain shareholder services to the Funds, such as responding to shareholder inquiries and processing transactions based upon instructions from shareholders with respect to the subscription and redemption of Fund shares. For the six months ended January 31, 2015, each Fund reimbursed the Manager the following amounts for costs incurred in running the call center, which are included in transfer agent — class specific in the Consolidated Statements of Operations:
| | | | | | | | | | | | | | | | |
| | | Institutional | | | Investor A | | | Investor C | | | Total | |
Multi-Asset Real Return | | $ | 135 | | | $ | 100 | | | $ | 51 | | | $ | 286 | |
Strategic Risk Allocation | | $ | 114 | | | $ | 21 | | | $ | 20 | | | $ | 155 | |
For the six months ended January 31, 2015, the following table shows the class specific transfer agent fees borne directly by each class of each Fund:
| | | | | | | | | | | | | | | | |
| | | Institutional | | | Investor A | | | Investor C | | | Total | |
Multi-Asset Real Return | | $ | 14,888 | | | $ | 3,724 | | | $ | 899 | | | $ | 19,511 | |
Strategic Risk Allocation | | $ | 768 | | | $ | 698 | | | $ | 204 | | | $ | 1,670 | |
Effective January 1, 2015, the Trust, on behalf of the Funds, entered into an Administration Agreement with the Manager, an indirect, wholly-owned subsidiary of BlackRock, to provide administrative services. For these services, the Manager receives an administration fee computed daily and payable monthly, based on a percentage of the average daily net assets of the Funds. The administration fee, which is shown as administration in the Consolidated Statements of Operations, is paid at the annual rates below. In addition, each of the share classes is charged an administration fee, which is shown as administration – class specific in the Consolidated Statements of Operations, at an annual rate of 0.02% of the average daily net assets of each respective class:
| | | | |
| Average Daily Net Assets | | Administration Fee | |
First $500 Million | | | 0.0425 | % |
$500 Million - $1 Billion | | | 0.0400 | % |
$1 Billion - $2 Billion | | | 0.0375 | % |
$2 Billion - $4 Billion | | | 0.0350 | % |
$4 Billion - $13 Billion | | | 0.0325 | % |
Greater than $13 Billion | | | 0.0300 | % |
| | | | | | |
| | | BLACKROCK FUNDS | | JANUARY 31, 2015 | | 39 |
| | |
Notes to Consolidated Financial Statements (continued) | | |
Prior to January 1, 2015, BNY Mellon Investment Servicing (US) Inc. (“BNYMIS”) and the Manager acted as co-administrators for the Funds. For these services, the co-administrators received an administration fee computed daily and payable monthly to each administrator pursuant to separate fee arrangements, based on a percentage of the average daily net assets of each Fund. The combined administration fee, which is shown as administration in the Consolidated Statements of Operations, was paid at the annual rates shown below. In addition, each of the share classes was charged an administration fee, which is shown as administration — class specific in the Consolidated Statements of Operations, based on the following percentages of average daily net assets of each respective class:
| | | | | | | | |
| Average Daily Net Assets | | Administration Fee | | | Administration Fee - Class Specific | |
First $500 Million | | | 0.075 | % | | | 0.025 | % |
$500 Million - $1 Billion | | | 0.065 | % | | | 0.015 | % |
Greater than $1 Billion | | | 0.055 | % | | | 0.005 | % |
For the six months ended January 31, 2015, the Funds paid the following to the Manager in return for these services, which are included in administration and administration — class specific in the Consolidated Statements of Operations:
| | | | |
Multi-Asset Real Return | | $ | 23,839 | |
Strategic Risk Allocation | | $ | 5,012 | |
For the six months ended January 31, 2015, the following table shows the class specific administration fees borne directly by each class of each Fund:
| | | | | | | | | | | | | | | | |
| | | Institutional | | | Investor A | | | Investor C | | | Total | |
Multi-Asset Real Return | | $ | 8,352 | | | $ | 671 | | | $ | 286 | | | $ | 9,309 | |
Strategic Risk Allocation | | $ | 3,203 | | | $ | 150 | | | $ | 57 | | | $ | 3,410 | |
BNYMIS and the Manager may have, at their discretion, voluntarily waived all or any portion of their administration fees for a Fund or a share class, which are included in administration fees waived and administration fees waived — class specific in the Consolidated Statements of Operations.
The Manager contractually agreed to waive and/or reimburse fees or expenses in order to limit expenses, excluding interest expense, dividend expense, tax expense, acquired fund fees and expenses and certain other fund expenses, which constitute extraordinary expenses not incurred in the ordinary course of the Funds’ business. The Manager has agreed not to reduce or discontinue this contractual waiver or reimbursement prior to December 1, 2015 unless approved by the Board, including a majority of the independent trustees. The expense limitations as a percentage of average daily net assets are as follows:
| | | | | | | | | | | | |
| | | Institutional | | | Investor A | | | Investor C | |
Multi-Asset Real Return | | | 0.80 | % | | | 1.05 | % | | | 1.80 | % |
Strategic Risk Allocation | | | 1.00 | % | | | 1.25 | % | | | 2.00 | % |
These amounts waived or reimbursed are included in fees waived by Manager and shown as administration fees waived — class specific, transfer agent fees waived — class specific and transfer agent fees reimbursed — class specific, respectively, in the Consolidated Statements of Operations. For the six months ended January 31, 2015, the amounts included in fees waived by Manager were as follows:
| | | | |
Multi-Asset Real Return | | $ | 29,353 | |
Strategic Risk Allocation | | $ | 65,469 | |
Class specific expense waivers or reimbursements are as follows:
| | | | | | | | | | | | | | | | |
| Administration Fees Waived | | | | | | | | | | | | |
| | | Institutional | | | Investor A | | | Investor C | | | Total | |
Multi-Asset Real Return | | $ | 8,307 | | | $ | 671 | | | $ | 285 | | | $ | 9,263 | |
Strategic Risk Allocation | | $ | 3,197 | | | $ | 150 | | | $ | 55 | | | $ | 3,402 | |
| | | | | | | | | | | | | | | | |
| Transfer Agent Fees Waived | | | | | | | | | | | | |
| | | Institutional | | | Investor A | | | Investor C | | | Total | |
Multi-Asset Real Return | | $ | 135 | | | $ | 100 | | | $ | 50 | | | $ | 285 | |
Strategic Risk Allocation | | $ | 114 | | | $ | 21 | | | $ | 19 | | | $ | 154 | |
| | | | | | |
| 40 | | BLACKROCK FUNDS | | JANUARY 31, 2015 | | |
| | |
Notes to Consolidated Financial Statements (continued) | | |
| | | | | | | | | | | | | | | | |
| Transfer Agent Fees Reimbursed | | Institutional | | | Investor A | | | Investor C | | | Total | |
Multi-Asset Real Return | | $ | 13,048 | | | $ | 3,493 | | | $ | 822 | | | $ | 17,363 | |
Strategic Risk Allocation | | $ | 602 | | | $ | 666 | | | $ | 177 | | | $ | 1,445 | |
If during the Funds’ fiscal year the operating expenses of a share class, that at any time during the prior two fiscal years received a waiver or reimbursement from the Manager, are less than the expense limit for that share class, the Manager is entitled to be reimbursed by such share class up to the lesser of (a) the amount of fees waived or expenses reimbursed during those prior two fiscal years under the agreement and (b) the amount by which the expense limit for that share class exceeds the operating expenses of the share class for the current fiscal year, provided that: (1) the Fund, of which the share class is a part, has more than $50 million in assets for the fiscal year and (2) the Manager or an affiliate continues to serve as the Fund’s investment advisor or administrator. In the event the expense limit for a share class is changed subsequent to a fiscal year in which the Manager becomes entitled to reimbursement for fees waived or reimbursed, the amount available to reimburse the Manager shall be calculated by reference to the expense limit for that share class in effect at the time the Manager became entitled to receive such reimbursement, rather than the subsequently changed expense limit for that share class.
On January 31, 2015, the Fund level and class specific waivers and/or reimbursements subject to possible future recoupment under the expense limitation agreement are as follows:
| | | | | | | | | | | | |
| | | Expiring July 31, | |
| | | 2015 | | | 2016 | | | 2017 | |
Multi-Asset Real Return | | | | | | | | | | | | |
Fund Level | | $ | 141,165 | | | $ | 115,838 | | | $ | 29,353 | |
Institutional | | $ | 1,544 | | | $ | 25,915 | | | $ | 21,490 | |
Investor A | | $ | 184 | | | $ | 2,291 | | | $ | 4,264 | |
Investor C | | $ | 47 | | | $ | 1,234 | | | $ | 1,157 | |
Strategic Risk Allocation | | | | | | | | | | | | |
Fund Level | | $ | 148,224 | | | $ | 162,792 | | | $ | 65,469 | |
Institutional | | $ | 3,482 | | | $ | 6,827 | | | $ | 3,913 | |
Investor A | | $ | 236 | | | $ | 640 | | | $ | 837 | |
Investor C | | $ | 108 | | | $ | 480 | | | $ | 251 | |
For the six months ended January 31, 2015, affiliates earned underwriting discounts, direct commissions and dealer concessions on sales of each Fund’s Investor A Shares as follows:
| | | | |
Multi-Asset Real Return | | $ | 1,390 | |
Strategic Risk Allocation | | $ | 690 | |
For the six months ended January 31, 2015, affiliates received CDSCs as follows:
| | | | |
| | | Investor C | |
Multi-Asset Real Return | | $ | 2,184 | |
The SEC has issued an exemptive order which permits BIM, an affiliate of the Manager, to serve as securities lending agent for Multi-Asset Real Return, subject to applicable conditions. As securities lending agent, BIM bears all operational costs directly related to securities lending. Multi-Asset Real Return is responsible for expenses in connection with the investment of cash collateral received for securities on loan (the “collateral investment expenses”). The cash collateral is invested in a private investment company managed by the Manager or its affiliates. However, BIM has agreed to cap the collateral investment expenses of the private investment company to an annual rate of 0.04%. The investment advisor to the private investment company will not charge any advisory fees with respect to shares purchased by Multi-Asset Real Return.
Securities lending income is equal to the total of income earned from the reinvestment of cash collateral, net of fees and other payments to and from borrowers of securities, and less the collateral investment expenses. Multi-Asset Real Return retains a portion of securities lending income and remits a remaining portion to BIM as compensation for its services as securities lending agent. Pursuant to a securities lending agreement, BIM may lend securities only when the difference between the borrower rebate rate and the risk free rate exceeds a certain level (such securities, the “specials only securities”).
Pursuant to such agreement, Multi-Asset Real Return retains 80% of securities lending income. In addition, commencing the business day following the date that the aggregate securities lending income earned across certain funds in the Equity-Liquidity Complex in a calendar year exceeds a specified
| | | | | | |
| | | BLACKROCK FUNDS | | JANUARY 31, 2015 | | 41 |
| | |
Notes to Consolidated Financial Statements (continued) | | |
threshold, Multi-Asset Real Return, pursuant to the securities lending agreement, will retain for the remainder of the calendar year securities lending income in an amount equal to 85% of securities lending income.
The share of securities lending income earned by Multi-Asset Real Return is shown as securities lending — affiliated – net in the Consolidated Statements of Operations. For the six months ended January 31, 2015, Multi-Asset Real Return paid BIM $242 for securities lending agent services.
Certain officers and/or trustees of the Trust are officers and/or directors of BlackRock or its affiliates. The Funds reimburse the Manager for a portion of the compensation paid to the Trust’s Chief Compliance Officer, which is included in officer and trustees in the Consolidated Statements of Operations.
6. Purchases and Sales:
For the six months ended January 31, 2015, purchases and sales of investments, excluding short-term securities were as follows:
| | | | | | | | |
| Purchases | | Multi-Asset
Real Return | | | Strategic Risk
Allocation | |
Non-U.S. Government Securities | | $ | 11,179,814 | | | $ | 7,679,159 | |
U.S. Government Securities | | | 7,826,884 | | | | — | |
Total Purchases | | $ | 19,006,698 | | | $ | 7,679,159 | |
| | | | | | | | |
| | | | | | | | | |
| Sales | | Multi-Asset
Real Return | | | Strategic Risk
Allocation | |
Non-U.S. Government Securities | | $ | 10,447,710 | | | | — | |
U.S. Government Securities | | | 1,960,229 | | | $ | 6,142,500 | |
Total Sales | | $ | 12,407,939 | | | $ | 6,142,500 | |
7. Income Tax Information:
It is the Funds’ policy to comply with the requirements of the Internal Revenue Code of 1986, as amended, applicable to regulated investment companies, and to distribute substantially all of their taxable income to their shareholders. Therefore, no federal income tax provision is required.
Each Fund files U.S. federal and various state and local tax returns. No income tax returns are currently under examination. The statute of limitations on the Funds’ U.S. federal tax returns remains open for the year ended July 31, 2014 and the period ended July 31, 2013.
Management has analyzed tax laws and regulations and their application to the Funds’ facts and circumstances and does not believe that there are any uncertain tax positions that require recognition of a tax liability.
As of July 31, 2014, Strategic Risk Allocation had capital loss carryforwards of $126,696, with no expiration dates, available to offset future realized capital gains.
As of January 31, 2015, gross unrealized appreciation and depreciation based on cost for federal income tax purposes were as follows:
| | | | | | | | |
| | | Multi-Asset
Real Return | | | Strategic Risk
Allocation | |
Tax cost | | $ | 70,529,127 | | | $ | 29,046,883 | |
| | | | |
Gross unrealized appreciation | | $ | 2,714,694 | | | $ | 95,718 | |
Gross unrealized depreciation | | | (1,565,601 | ) | | | (751,912 | ) |
| | | | |
Net unrealized appreciation (depreciation) | | $ | 1,149,093 | | | $ | (656,194 | ) |
| | | | |
| | |
| | | | | | | | | |
8. Bank Borrowings:
The Trust, on behalf of the Funds, along with certain other funds managed by the Manager and its affiliates (“Participating Funds”), was a party to a 364-day, $1.1 billion credit agreement with a group of lenders, under which the Funds may borrow to fund shareholder redemptions. Excluding commitments designated for a certain individual fund, the Participating Funds, including the Funds, could borrow up to an aggregate commitment amount of $650 million, subject to asset coverage and other limitations as specified in the agreement. Effective November 25, 2014, the credit agreement was amended to an aggregate commitment amount of $2.1 billion, of which the Participating Funds, including the Funds, can borrow up to $1.6 billion at any time outstanding, subject to asset coverage and other limitations as specified in the agreement. The agreement terminates on April 23, 2015, unless otherwise extended to November 24, 2015 or renewed for a period of 364 days from April 23, 2015. The amended agreement has the following terms: a fee of 0.06% per annum on unused commitment amounts and interest at a rate equal to the higher of (a) one-month LIBOR (but in any event, not less than 0.00%) on the date the loan is made plus 0.80% per annum or (b) the Fed Funds rate (but in any event, not less than 0.00%) in
| | | | | | |
| 42 | | BLACKROCK FUNDS | | JANUARY 31, 2015 | | |
| | |
| Notes to Consolidated Financial Statements (continued) | | |
effect from time to time plus 0.80% per annum on amounts borrowed. Participating Funds paid administration, legal and arrangement fees, which are included in miscellaneous expenses in the Consolidated Statements of Operations, and along with commitment fees, were allocated among such funds based upon portions of the aggregate commitment available to them and relative net assets of Participating Funds. During the six months ended January 31, 2015, the Funds did not borrow under the credit agreement.
9. Principal Risks:
In the normal course of business, the Funds invest in securities and enter into transactions where risks exist due to fluctuations in the market (market risk) or failure of the issuer of a security to meet all its obligations (issuer credit risk). The value of securities held by the Funds may decline in response to certain events, including those directly involving the issuers whose securities are owned by the Funds; conditions affecting the general economy; overall market changes; local, regional or global political, social or economic instability; and currency, interest rate and price fluctuations. Similar to issuer credit risk, the Funds may be exposed to counterparty credit risk, or the risk that an entity with which the Funds have unsettled or open transactions may fail to or be unable to perform on its commitments. The Funds manage counterparty credit risk by entering into transactions only with counterparties that they believe have the financial resources to honor their obligations and by monitoring the financial stability of those counterparties. Financial assets, which potentially expose the Funds to market, issuer and counterparty credit risks, consist principally of financial instruments and receivables due from counterparties. The extent of the Funds’ exposure to market, issuer and counterparty credit risks with respect to these financial assets is generally approximated by their value recorded in the Consolidated Statements of Assets and Liabilities, less any collateral held by the Funds.
The Funds invest a significant portion of their assets in fixed-income securities and/or use derivatives tied to the fixed income markets. See the Consolidated Schedules of Investments for these securities and/or derivatives. Changes in market interest rates or economic conditions, may affect the value and/or liquidity of such investments. Interest rate risk is the risk that prices of bonds and other fixed-income securities will increase as interest rates fall and decrease as interest rates rise. The Funds may be subject to a greater risk of rising interest rates due to the current period of historically low rates.
10. Capital Share Transactions:
Transactions in capital shares for each class were as follows:
| | | | | | | | | | | | | | | | | | |
| | | Six Months Ended
January 31, 2015 | | | | | Year
Ended
July 31, 2014 | |
| Multi-Asset Real Return | | Shares | | | Amount | | | | | Shares | | | Amount | |
Institutional | | | | | | | | | | | | | | | | | | |
Shares sold | | | 1,829,782 | | | $ | 18,793,667 | | | | | | 6,543,666 | | | $ | 67,658,896 | |
Shares issued in reinvestment of distributions | | | 85,893 | | | | 834,881 | | | | | | 13,735 | | | | 140,916 | |
Shares redeemed | | | (980,590 | ) | | | (9,924,706 | ) | | | | | (1,578,527 | ) | | | (16,556,251 | ) |
| | | | | | | | | | |
Net increase | | | 935,085 | | | $ | 9,703,842 | | | | | | 4,978,874 | | | $ | 51,243,561 | |
| | | | | | | | | | |
| | | | | | | | | | | | | | | | | | |
Investor A | | | | | | | | | | | | | | | | | | |
Shares sold | | | 123,219 | | | $ | 1,277,735 | | | | | | 887,110 | | | $ | 9,483,968 | |
Shares issued in reinvestment of distributions | | | 12,726 | | | | 123,435 | | | | | | 4,080 | | | | 41,776 | |
Shares redeemed | | | (647,433 | ) | | | (6,791,556 | ) | | | | | (37,860 | ) | | | (401,380 | ) |
| | | | | | | | | | |
Net increase (decrease) | | | (511,488 | ) | | $ | (5,390,386 | ) | | | | | 853,330 | | | $ | 9,124,364 | |
| | | | | | | | | | |
| | | | | | | | | | | | | | | | | | |
Investor C | | | | | | | | | | | | | | | | | | |
Shares sold | | | 41,678 | | | $ | 427,258 | | | | | | 218,668 | | | $ | 2,297,974 | |
Shares issued in reinvestment of distributions | | | 6,861 | | | | 66,138 | | | | | | 1,445 | | | | 14,731 | |
Shares redeemed | | | (36,027 | ) | | | (359,200 | ) | | | | | (26,742 | ) | | | (281,481 | ) |
| | | | | | | | | | |
Net increase | | | 12,512 | | | $ | 134,196 | | | | | | 193,371 | | | $ | 2,031,224 | |
| | | | | | | | | | |
Total Net Increase | | | 436,109 | | | $ | 4,447,652 | | | | | | 6,025,575 | | | $ | 62,399,149 | |
| | | | | | | | | | |
| | | | | | |
| | | BLACKROCK FUNDS | | JANUARY 31, 2015 | | 43 |
| | |
Notes to Consolidated Financial Statements (concluded) | | |
| | | | | | | | | | | | | | | | |
| | | Six Months Ended
January 31, 2015 | | | Year Ended
July 31, 2014 | |
| Strategic Risk Allocation | | Shares | | | Amount | | | Shares | | | Amount | |
Institutional | | | | | | | | | | | | | | | | |
Shares sold | | | 126,762 | | | $ | 1,284,870 | | | | 85,934 | | | $ | 819,969 | |
Shares issued in reinvestment of distributions | | | 2,482 | | | | 24,495 | | | | 3,190 | | | | 29,857 | |
Shares redeemed | | | (40,157 | ) | | | (408,929 | ) | | | (43,453 | ) | | | (424,370 | ) |
| | | | | | | | |
Net increase | | | 89,087 | | | $ | 900,436 | | | | 45,671 | | | $ | 425,456 | |
| | | | | | | | |
| | | | | | | | | | | | | | | | |
Investor A | | | | | | | | | | | | | | | | |
Shares sold | | | 48,710 | | | $ | 492,467 | | | | 75,618 | | | $ | 745,267 | |
Shares issued in reinvestment of distributions | | | 4,653 | | | | 45,839 | | | | 1,417 | | | | 13,269 | |
Shares redeemed | | | (11,664 | ) | | | (117,031 | ) | | | (16,248 | ) | | | (158,256 | ) |
| | | | | | | | |
Net increase | | | 41,699 | | | $ | 421,275 | | | | 60,787 | | | $ | 600,280 | |
| | | | | | | | |
| | | | | | | | | | | | | | | | |
Investor C | | | | | | | | | | | | | | | | |
Shares sold | | | 62,586 | | | $ | 625,630 | | | | 9,724 | | | $ | 94,045 | |
Shares issued in reinvestment of distributions | | | 1,985 | | | | 19,449 | | | | 1,060 | | | | 9,896 | |
Shares redeemed | | | (8,913 | ) | | | (88,910 | ) | | | (3,768 | ) | | | (37,052 | ) |
| | | | | | | | |
Net increase | | | 55,658 | | | $ | 556,169 | | | | 7,016 | | | $ | 66,889 | |
| | | | | | | | |
Total Net Increase | | | 186,444 | | | $ | 1,877,880 | | | | 113,474 | | | $ | 1,092,625 | |
| | | | | | | | |
At January 31, 2015, shares owned by affiliates of Strategic Risk Allocation were as follows:
| | | | | | | | | | | | |
| | | Institutional | | | Investor A | | | Investor C | |
Shares | | | 2,504,182 | | | | 2,509 | | | | 2,509 | |
| | | | | | | | | | | | | |
11. Subsequent Events:
Management has evaluated the impact of all subsequent events on the Funds through the date the consolidated financial statements were issued and has determined that there were no subsequent events requiring adjustment or additional disclosure in the consolidated financial statements.
| | | | | | |
| 44 | | BLACKROCK FUNDS | | JANUARY 31, 2015 | | |
| | |
| Disclosure of Sub-Advisory Agreements | | |
The Board of Trustees (the “Board,” and the members of which are referred to as “Board Members”) of BlackRock FundsSM (the “Trust”) met in person on September 18-19, 2014 (the “September Meeting”) to consider the initial approval of (a) the sub-advisory agreement between BlackRock Advisors, LLC (the “Manager”), the Trust’s investment advisor, and BlackRock International Limited (“BIL”) with respect to BlackRock Multi-Asset Real Return Fund (the “Fund”), a series of the Trust (the “BIL Sub-Advisory Agreement”) and (b) the sub-advisory agreement between the Manager and BlackRock (Singapore) Limited (“BRS”) with respect to the Fund (the “BRS Sub-Advisory Agreement,” and together with the BIL Sub-Advisory Agreement, the “Sub-Advisory Agreements”). The Sub-Advisory Agreements were substantially the same as the sub-advisory agreement previously approved with respect to the Fund.
The Board consists of fifteen individuals, thirteen of whom are not “interested persons” of the Trust as defined in the Investment Company Act of 1940, as amended (the “1940 Act”) (the “Independent Board Members”). Pursuant to the 1940 Act, the Board is required to consider the initial approval of the Sub-Advisory Agreements.
At the September Meeting, the Board reviewed materials relating to its consideration of the proposed Sub-Advisory Agreements. The Trust’s investment advisory agreement (the “Advisory Agreement”) with the Manager on behalf of the Fund was most recently approved by the Board at an in-person meeting on May 28-30, 2014 (the “May Meeting”). A discussion of the basis for the Board’s approval of the Advisory Agreement at the May Meeting is included in the Fund’s annual shareholder report for the fiscal year ended July 31, 2014. The factors considered by the Board at the September Meeting in connection with approval of the proposed Sub-Advisory Agreements were substantially the same as the factors considered at the May Meeting.
Following discussion, all the Board Members present at the September Meeting, including all the Independent Board Members present, approved the BIL Sub-Advisory Agreement between the Manager and BIL with respect to the Fund and the BRS Sub-Advisory Agreement between the Manager and BRS with respect to the Fund, each for a two-year term beginning on the effective date of the Sub-Advisory Agreements. Based upon its evaluation of all of the aforementioned factors in their totality, the Board, including the Independent Board Members, was satisfied that the terms of the Sub-Advisory Agreements were fair and reasonable and in the best interest of the Fund and its shareholders. In arriving at its decision to approve the Sub-Advisory Agreements, the Board did not identify any single factor or group of factors as all-important or controlling, but considered all factors together, and different Board Members may have attributed different weights to the various factors considered. The Independent Board Members were also assisted by the advice of independent legal counsel in making this determination.
| | | | | | |
| | | BLACKROCK FUNDS | | JANUARY 31, 2015 | | 45 |
Rodney D. Johnson, Chair of the Board and Trustee
David O. Beim, Trustee
Frank J. Fabozzi, Trustee
Collette Chilton, Trustee
Dr. Matina S. Horner, Trustee
Herbert I. London, Trustee
Ian A. MacKinnon, Trustee
Cynthia A. Montgomery, Trustee
Joseph P. Platt, Trustee
Robert C. Robb, Jr., Trustee
Toby Rosenblatt, Trustee
Mark Stalnecker, Trustee
Kenneth L. Urish, Trustee
Frederick W. Winter, Trustee
Barbara G. Novick, Trustee
John M. Perlowski, President and Chief Executive Officer
Richard Hoerner, CFA, Vice President
Jennifer McGovern, Vice President
Neal Andrews, Chief Financial Officer
Jay Fife, Treasurer
Charles Park, Chief Compliance Officer and Anti-Money Laundering Compliance Officer
Benjamin Archibald, Secretary
Effective September 19, 2014, Brendan Kyne resigned as a Vice President of the Trust and Jennifer McGovern became a Vice President of the Trust.
Effective December 31, 2014, Paul L. Audet and Henry Gabbay resigned as Trustees of the Trust and Ronald W. Forbes resigned as a Trustee of the Trust and Co-Chair of the Board. Effective January 1, 2015, Collette Chilton, Barbara G. Novick and Mark Stalnecker were appointed to serve as Trustees of the Trust.
Effective March 1, 2015, Charles Park resigned as Anti-Money Laundering Compliance Officer of the Trust and Fernanda Piedra became Anti-Money Laundering Compliance Officer of the Trust.
| | | | | | |
| | | | |
Investment Advisor and Administrator BlackRock Advisors, LLC Wilmington, DE 19809 | | Sub-Advisors BlackRock International Limited Edinburgh, United Kingdom EH3 8BL BlackRock (Singapore) Limited1 079912 Singapore | | Accounting Agent and Transfer Agent BNY Mellon Investment Servicing (US) Inc. Wilmington, DE 19809 | | Custodian The Bank of New York Mellon New York, NY 10286 |
| | | | | | |
Distributor BlackRock Investments, LLC New York, NY 10022 | | Legal Counsel Sidley Austin LLP New York, NY 10019 | | Independent Registered Public Accounting Firm Deloitte & Touche LLP Philadelphia, PA 19103 | | Address of the Trust 100 Bellevue Parkway Wilmington, DE 19809 |
| | 1 | | For Multi-Asset Real Return. |
| | | | | | |
| 46 | | BLACKROCK FUNDS | | JANUARY 31, 2015 | | |
Householding
The Funds will mail only one copy of shareholder documents, including prospectuses, annual and semi-annual reports and proxy statements, to shareholders with multiple accounts at the same address. This practice is commonly called “householding” and is intended to reduce expenses and eliminate duplicate mailings of shareholder documents. Mailings of your shareholder documents may be householded indefinitely unless you instruct us otherwise. If you do not want the mailing of these documents to be combined with those for other members of your household, please call the Funds at (800) 441-7762.
Availability of Quarterly Schedule of Investments
The Funds file their complete schedule of portfolio holdings with the SEC for the first and third quarters of each fiscal year on Form N-Q. The Funds’ Forms N-Q are available on the SEC’s website at http://www.sec.gov and may also be reviewed and copied at the SEC’s Public Reference Room in Washington, DC. Information on how to access documents on the SEC’s website without charge may be obtained by calling (800) SEC-0330. The Funds’ Forms N-Q may also be obtained upon request and without charge by calling (800) 441-7762.
Availability of Proxy Voting Policies and Procedures
A description of the policies and procedures that the Funds use to determine how to vote proxies relating to portfolio securities is available upon request and without charge, (1) by calling (800) 441-7762; (2) at http://www.blackrock.com; and (3) on the SEC’s website at http://www.sec.gov.
Availability of Proxy Voting Record
Information about how the Funds voted proxies relating to securities held in the Funds’ portfolios during the most recent 12-month period ended June 30 is available upon request and without charge (1) at http://www.blackrock.com or by calling (800) 441-7762 and (2) on the SEC’s website at http://www.sec.gov.
BlackRock’s Mutual Fund Family
BlackRock offers a diverse lineup of open-end mutual funds crossing all investment styles and managed by experts in equity, fixed income and tax-exempt investing. Visit http://www.blackrock.com for more information.
Account Information
Call us at (800) 441-7762 from 8:00 AM to 6:00 PM EST on any business day to get information about your account balances, recent transactions and share prices. You can also reach us on the Web at http://www.blackrock.com/funds.
Automatic Investment Plans
Investor Class shareholders who want to invest regularly can arrange to have $50 or more automatically deducted from their checking or savings account and invested in any of the BlackRock funds.
Systematic Withdrawal Plans
Investor Class shareholders can establish a systematic withdrawal plan and receive periodic payments of $50 or more from their BlackRock funds, as long as their account balance is at least $10,000.
Retirement Plans
Shareholders may make investments in conjunction with Traditional, Rollover, Roth, Coverdell, Simple IRAs, SEP IRAs and 403(b) Plans.
| | | | | | |
| | | BLACKROCK FUNDS | | JANUARY 31, 2015 | | 47 |
| | |
| Additional Information (concluded) | | |
|
| BlackRock Privacy Principles |
BlackRock is committed to maintaining the privacy of its current and former fund investors and individual clients (collectively, “Clients”) and to safeguarding their non-public personal information. The following information is provided to help you understand what personal information BlackRock collects, how we protect that information and why in certain cases we share such information with select parties.
If you are located in a jurisdiction where specific laws, rules or regulations require BlackRock to provide you with additional or different privacy-related rights beyond what is set forth below, then BlackRock will comply with those specific laws, rules or regulations.
BlackRock obtains or verifies personal non-public information from and about you from different sources, including the following: (i) information we receive from you or, if applicable, your financial intermediary, on applications, forms or other documents; (ii) information about your transactions with us, our affiliates, or others; (iii) information we receive from a consumer reporting agency; and (iv) from visits to our websites.
BlackRock does not sell or disclose to non-affiliated third parties any non-public personal information about its Clients, except as permitted by law or as is necessary to respond to regulatory requests or to service Client accounts. These non-affiliated third parties are required to protect the confidentiality and security of this information and to use it only for its intended purpose.
We may share information with our affiliates to service your account or to provide you with information about other BlackRock products or services that may be of interest to you. In addition, BlackRock restricts access to non-public personal information about its Clients to those BlackRock employees with a legitimate business need for the information. BlackRock maintains physical, electronic and procedural safeguards that are designed to protect the non-public personal information of its Clients, including procedures relating to the proper storage and disposal of such information.
| | | | | | |
| 48 | | BLACKROCK FUNDS | | JANUARY 31, 2015 | | |
| | |
This report is intended for current holders. It is not authorized for use as an offer of sale or a solicitation of an offer to buy shares of a Fund unless preceded or accompanied by that Fund’s current prospectus. Past performance results shown in this report should not be considered a representation of future performance. Investment returns and principal value of shares will fluctuate so that shares, when redeemed, may be worth more or less than their original cost. Statements and other information herein are as dated and are subject to change. | |  |
| | |
MRRSRA-1/15-SAR | |  |
JANUARY 31, 2015
| | | | |
SEMI-ANNUAL REPORT (UNAUDITED) | | | | BLACKROCK® |
BlackRock FundsSM
„ BlackRock Short Obligations Fund
„ BlackRock Short-Term Treasury Fund
„ BlackRock Ultra-Short Obligations Fund
| | |
| Not FDIC Insured ¡ May Lose Value ¡ No Bank Guarantee | | |
| | |

| | Shareholders can sign up for e-mail notifications of quarterly statements, annual and semi-annual shareholder reports and prospectuses by enrolling in the electronic delivery program. Electronic copies of shareholder reports and prospectuses are also available on BlackRock’s website. TO ENROLL IN ELECTRONIC DELIVERY: Shareholders Who Hold Accounts with Investment Advisors, Banks or Brokerages: Please contact your financial advisor. Please note that not all investment advisors, banks or brokerages may offer this service. Shareholders Who Hold Accounts Directly with BlackRock: 1. Access the BlackRock website at blackrock.com 2. Select "Access Your Account" 3. Next, select "eDelivery" in the "Related Resources" box and follow the sign-up instructions |
| | | | | | |
| 2 | | BLACKROCK FUNDS | | JANUARY 31, 2015 | | |
Dear Shareholder,
Market volatility, while remaining below the long-term average level, increased over the course of 2014 and into 2015, driven largely by higher valuations in risk assets (such as equities and high yield bonds), escalating geopolitical risks, uneven global economic growth and expectations around policy moves from the world’s largest central banks. Surprisingly, U.S. interest rates trended lower through the period even as the U.S. Federal Reserve (the “Fed”) gradually reduced its bond buying program, which ultimately ended in October.
The first half of 2014 was generally a strong period for most asset classes; however, volatility ticked up in the summer as geopolitical tensions intensified in Ukraine and the Middle East and investors feared that better U.S. economic indicators may compel the Fed to increase short-term interest rates sooner than previously anticipated. Global credit markets tightened as the U.S. dollar strengthened versus other currencies, ultimately putting a strain on investor flows, and financial markets broadly weakened in the third quarter.
Several themes dominated the markets in the fourth quarter that resulted in the strong performance of U.S. markets versus other areas of the world. Economic growth strengthened considerably in the United States while the broader global economy showed signs of slowing. The European Central Bank and the Bank of Japan took aggressive measures to stimulate growth while the Fed moved toward tighter policy, causing further strengthening in the U.S. dollar. Fixed income investors piled into U.S. Treasuries where yields, although persistently low, were comparatively higher than yields on international sovereign debt, while equity investors favored the relative stability of U.S.-based companies amid rising global risks.
Oil prices, which had been gradually declining since mid-summer, suddenly plummeted in the fourth quarter due to a global supply-and-demand imbalance. Energy stocks sold off sharply and oil-exporting economies struggled, mainly within emerging markets. Conversely, the consumer sectors benefited from lower oil prices as savings at the gas pumps freed up discretionary income for other goods and services.
These trends shifted at the beginning of 2015. U.S. equity markets starkly underperformed international markets due to stretched valuations and uncertainty around the Fed’s pending rate hike. In addition, the stronger U.S. dollar began to hurt earnings of large cap companies. The energy sector continued to struggle, although oil prices showed signs of stabilizing toward the end of January as suppliers became more disciplined in their exploration and production efforts.
At BlackRock, we believe investors need to think globally, extend their scope across a broad array of asset classes and be prepared to move freely as market conditions change over time. We encourage you to talk with your financial advisor and visit blackrock.com for further insight about investing in today’s markets.
Sincerely,

Rob Kapito
President, BlackRock Advisors, LLC

Rob Kapito
President, BlackRock Advisors, LLC
| | | | | | | | |
| Total Returns as of January 31, 2015 | |
| | | 6-month | | | 12-month | |
U.S. large cap equities
(S&P 500® Index) | | | 4.37 | % | | | 14.22 | % |
U.S. small cap equities
(Russell 2000® Index) | | | 4.72 | | | | 4.41 | |
International equities
(MSCI Europe, Australasia,
Far East Index) | | | (6.97 | ) | | | (0.43 | ) |
Emerging market equities (MSCI Emerging Markets Index) | | | (9.05 | ) | | | 5.23 | |
3-month Treasury bill
(BofA Merrill Lynch
3-Month U.S. Treasury
Bill Index) | | | 0.01 | | | | 0.03 | |
U.S. Treasury securities
(BofA Merrill Lynch
10- Year U.S. Treasury
Index) | | | 9.29 | | | | 12.25 | |
U.S. investment grade
bonds (Barclays U.S.
Aggregate Bond Index) | | | 4.36 | | | | 6.61 | |
Tax-exempt municipal
bonds (S&P Municipal Bond Index) | | | 4.51 | | | | 8.81 | |
U.S. high yield bonds
(Barclays U.S.Corporate
High Yield 2% Issuer
Capped Index) | | | (0.89 | ) | | | 2.41 | |
|
Past performance is no guarantee of future results. Index performance is shown for illustrative purposes only. You cannot invest directly in an index. | |
| | | | | | |
| | | THIS PAGE NOT PART OF YOUR FUND REPORT | | | | 3 |
| | | | |
Fund Summary as of January 31, 2015 | | | BlackRock Short Obligations Fund | |
BlackRock Short Obligations Fund’s (the “Fund”) investment objective is to seek current income consistent with preservation of capital.
|
| Portfolio Management Commentary |
How did the Fund perform?
| Ÿ | | For the six-month period ended January 31, 2015, the Fund outperformed its benchmark, the BofA Merrill Lynch 6-Month U.S. Treasury Bill Index. |
What factors influenced performance?
| Ÿ | | The Fund’s relative outperformance was attributable to its non-benchmark allocation to spread sectors such as corporate bonds and asset-backed securities. In addition, the Fund benefited from maintaining a spread duration overweight (greater sensitivity to changes in credit spreads) relative to the benchmark. |
| Ÿ | | There were no detractors from the Fund’s performance relative to the benchmark index during the period. |
Describe recent portfolio activity.
| Ÿ | | There were no changes to the Fund’s portfolio during the six-month period. |
Describe Fund positioning at period end.
| Ÿ | | The Fund continued to maintain non-benchmark exposure to credit securities and a duration (level of sensitivity to changes in interest rates) neutral to the benchmark. As of period end, 58.5% of the Fund’s net assets were invested in floating rate securities. |
The views expressed reflect the opinions of BlackRock as of the date of this report and are subject to change based on changes in market, economic or other conditions. These views are not intended to be a forecast of future events and are no guarantee of future results.
| | | | |
| Portfolio Composition | | Percent of Net Assets | |
Corporate Bonds | | | 68 | % |
Certificates of Deposit | | | 10 | |
Repurchase Agreements | | | 10 | |
Commercial Paper | | | 7 | |
Asset-Backed Securities | | | 5 | |
| | | | |
| Maturity Breakdown | | Percent of
Net Assets | |
1-7 days | | | 5 | % |
8-14 days | | | 2 | |
15-30 days | | | 4 | |
31-60 days | | | 11 | |
61-90 days | | | 8 | |
91-120 days | | | 5 | |
121-150 days | | | 2 | |
> 150 days | | | 63 | |
| | | | | | |
| 4 | | BLACKROCK FUNDS | | JANUARY 31, 2015 | | |
| | |
| | | BlackRock Short Obligations Fund |
|
| Total Return Based on a $10,000 Investment |
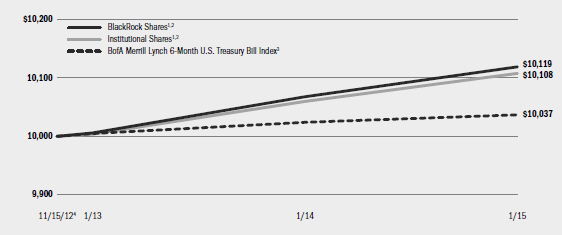
| | 1 | Assuming transaction costs and other operating expenses, including investment advisory fees and administration fees, if any. BlackRock and Institutional Shares do not have a sales charge. |
| | 2 | Under normal market conditions, the Fund will invest in U.S. dollar denominated investment grade and short-term fixed and floating rate debt securities maturing in three years or less (with certain exceptions) and will maintain a dollar-weighted average maturity of 180 days or less and a dollar-weighted average life of 365 days or less. |
| | 3 | An unmanaged index that tracks 6-Month U.S. Treasury securities. |
| | 4 | Commencement of operations. |
| | | | | | | | | | | | | | | | | | | | |
| Performance Summary for the Period Ended January 31, 2015 | | | | | | | | | | | | | |
| | | | | | | | | | | | Average Annual Total Returns | |
| | | Standardized 30-Day Yield5 | | | Unsubsidized 30-Day Yield5 | | | 6-Month Total Returns | | | 1 Year | | | Since Inception6 | |
BlackRock | | | 0.62 | % | | | (0.51 | )% | | | 0.17 | % | | | 0.50 | % | | | 0.53 | % |
Institutional | | | 0.60 | | | | (0.51 | ) | | | 0.25 | | | | 0.48 | | | | 0.49 | |
BofA Merrill Lynch 6-Month U.S. Treasury Bill Index | | | — | | | | — | | | | 0.08 | | | | 0.13 | | | | 0.17 | |
| | 5 | | The standardized 30-day yield includes the effects of any waivers and/or reimbursements. The unsubsidized 30-day yield excludes the effects of any waivers and/or reimbursements. |
| | 6 | | The Fund commenced operations on November 15, 2012. |
| | | | Past performance is not indicative of future results. |
| | | | | | | | | | | | | | | | | | | | | | | | | | | | |
| | | Actual | | | Hypothetical7 | | | | |
| | | Beginning
Account Value
August 1, 2014 | | | Ending
Account Value
January 31, 2015 | | | Expenses Paid
During the Period8 | | | Beginning
Account Value
August 1, 2014 | | | Ending
Account Value
January 31, 2015 | | | Expenses Paid
During the Period8 | | | Annualized
Expense Ratio | |
BlackRock Short Obligations Fund | | | | | | | | | | | | | | | | | | | | | | | | | |
BlackRock | | | $1,000.00 | | | | $1,001.70 | | | | $0.50 | | | | $1,000.00 | | | | $1,024.70 | | | | $0.51 | | | | 0.10% | |
Institutional | | | $1,000.00 | | | | $1,002.50 | | | | $0.66 | | | | $1,000.00 | | | | $1,024.55 | | | | $0.66 | | | | 0.13% | |
| | 7 | | Hypothetical 5% annual return before expenses is calculated by prorating the number of days in the most recent fiscal period divided by 365. |
| | 8 | | For each class of the Fund, expenses are equal to the annualized expense ratio for the class, multiplied by the average account value over the period, multiplied by 184/365 (to reflect the one-half year period shown). |
| | | | See “Disclosure of Expenses” on page 10 for further information on how expenses were calculated. |
| | | | | | |
| | | BLACKROCK FUNDS | | JANUARY 31, 2015 | | 5 |
| | | | |
Fund Summary as of January 31, 2015 | | | BlackRock Short-Term Treasury Fund | |
BlackRock Short-Term Treasury Fund’s (the “Fund”) investment objective is to seek current income consistent with liquidity and preservation of capital.
|
| Portfolio Management Commentary |
How did the Fund perform?
| Ÿ | | For the six-month period ended January 31, 2015, the Fund matched the return of its benchmark, the BofA Merrill Lynch 0-3 Month U.S. Treasury Bill Index. |
What factors influenced performance?
| Ÿ | | The Fund invests in U.S. Treasury bills, Treasury notes with maturities less than 13 months and ultra-short-dated repurchase agreements. The Fund’s duration positioning (level of sensitivity to interest rate movements), its systematic securities trading and its allocations in repurchase agreements were the main contributors to performance over the period. |
| Ÿ | | The Fund’s increased liquidity profile favoring Treasury bills over Treasury notes detracted from performance given liquidity differentials between the asset classes. Additionally, the Fund’s low level of exposure to nine- |
| | month to 12-month fixed rate securities detracted from returns as these securities performed strongly throughout the period. |
Describe recent portfolio activity.
| Ÿ | | During the six-month period, the Fund reduced its repurchase agreement allocation while increasing floating rate exposure. Fixed rate purchases were extended over the period to an eight-month maturity limit, compared to the previous six-month tenure limit. |
Describe Fund positioning at period end.
| Ÿ | | As of period end, the Fund’s duration, which stood at 88 days, was higher in comparison to the benchmark. The Fund maintained non-benchmark positions in U.S. Treasury floating rate notes and repurchase agreements collateralized by U.S. Treasury obligations. |
The views expressed reflect the opinions of BlackRock as of the date of this report and are subject to change based on changes in market, economic or other conditions. These views are not intended to be a forecast of future events and are no guarantee of future results.
| | | | |
| Portfolio Composition | | Percent of
Net Assets | |
U.S. Treasury Obligations | | | 89 | % |
Repurchase Agreements | | | 13 | |
Liabilities in Excess of Other Assets | | | (2 | ) |
| | | | |
| Maturity Breakdown | | Percent of
Net Assets | |
1-7 days | | | 15 | % |
8-14 days | | | — | |
15-30 days | | | 8 | |
31-60 days | | | 8 | |
61-90 days | | | 11 | |
91-120 days | | | 21 | |
121-150 days | | | 1 | |
> 150 days | | | 36 | |
| | | | | | |
| 6 | | BLACKROCK FUNDS | | JANUARY 31, 2015 | | |
| | | | |
| | | | BlackRock Short-Term Treasury Fund | |
|
| Total Return Based on a $10,000 Investment |
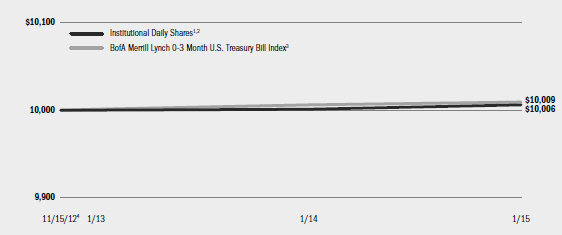
| | 1 | Assuming transaction costs and other operating expenses, including investment advisory fees and administration fees, if any. Institutional Daily Shares do not have a sales charge. |
| | 2 | Under normal market conditions, the Fund will invest at least 80% of its net assets, plus the amount of any borrowings for investment purposes, in U.S. Treasury bills, notes, trust receipts and direct obligations of the United States, including securities only guaranteed by the U.S. Treasury and repurchase agreements secured by direct Treasury obligations. |
| | 3 | An index that measures total return on cash; including price and interest income, based on short-term government Treasury bills of about 90-day maturity. |
| | 4 | Commencement of operations. |
| | | | | | | | | | | | | | | | | | | | |
| Performance Summary for the Period Ended January 31, 2015 | | | | | | | | | | | | | | | | | |
| | | | | | | | | | | | Average Annual Total Returns | |
| | | Standardized 30-Day Yield5 | | | Unsubsidized
30-Day Yield5 | | | 6-Month
Total Returns | | | 1 Year | | | Since Inception6 | |
Institutional Daily | | | 0.03 | % | | | (1.33 | )% | | | 0.01 | % | | | 0.05 | % | | | 0.03 | % |
BofA Merrill Lynch 0-3 Month U.S. Treasury Bill Index | | | — | | | | — | | | | 0.01 | | | | 0.02 | | | | 0.04 | |
| | 5 | | The standardized 30-day yield includes the effects of any waivers and/or reimbursements. The unsubsidized 30-day yield excludes the effects of any waivers and/or reimbursements. |
| | 6 | | The Fund commenced operations on November 15, 2012. |
| | | | Past performance is not indicative of future results. |
| | | | | | | | | | | | | | | | | | | | | | | | | | | | |
| | | Actual | | | Hypothetical7 | | | | |
| | | Beginning
Account Value
August 1, 2014 | | | Ending
Account Value
January 31, 2015 | | | Expenses Paid
During the Period8 | | | Beginning
Account Value
August 1, 2014 | | | Ending
Account Value
January 31, 2015 | | | Expenses Paid
During the Period8 | | | Annualized
Expense Ratio | |
BlackRock Short-Term Treasury Fund | | | | | | | | | | | | | | | | | | | | | |
Institutional Daily | | | $1,000.00 | | | | $1,000.10 | | | | $0.30 | | | | $1,000.00 | | | | $1,024.90 | | | | $0.31 | | | | 0.06% | |
| | 7 | | Hypothetical 5% annual return before expenses is calculated by prorating the number of days in the most recent fiscal period divided by 365. |
| | 8 | | For each class of the Fund, expenses are equal to the annualized expense ratio for the class, multiplied by the average account value over the period, multiplied by 184/365 (to reflect the one-half year period shown). |
| | | | See “Disclosure of Expenses” on page 10 for further information on how expenses were calculated. |
| | | | | | |
| | | BLACKROCK FUNDS | | JANUARY 31, 2015 | | 7 |
| | | | |
| Fund Summary as of January 31, 2015 | | | BlackRock Ultra-Short Obligations Fund | |
BlackRock Ultra-Short Obligations Fund’s (the “Fund”) investment objective is to seek current income consistent with preservation of capital.
|
| Portfolio Management Commentary |
How did the Fund perform?
| Ÿ | | For the six-month period ended January 31, 2015, the Fund outperformed its benchmark, the BofA Merrill Lynch 3-Month U.S. Treasury Bill Index. |
What factors influenced performance?
| Ÿ | | The Fund’s relative outperformance was attributable to its non-benchmark allocation to spread sectors such as corporate bonds and money market securities including repurchase agreements. In addition, the Fund benefited from maintaining a spread duration overweight (greater sensitivity to changes in credit spreads) relative to the benchmark during the period. |
| Ÿ | | There were no detractors from the Fund’s performance relative to the benchmark index during the period. |
Describe recent portfolio activity.
| Ÿ | | During the period, the Fund maintained a floating rate credit overweight. There were no changes to overall portfolio holdings. |
Describe Fund positioning at period end.
| Ÿ | | The Fund continued to maintain non-benchmark exposure to credit securities with a concentration in high-quality bank obligations. As of period end, 34.5% of the Fund’s net assets were invested in floating rate securities. The Fund’s duration (level of sensitivity to changes in interest rates) was slightly lower than the benchmark. |
The views expressed reflect the opinions of BlackRock as of the date of this report and are subject to change based on changes in market, economic or other conditions. These views are not intended to be a forecast of future events and are no guarantee of future results.
| | | | |
| Portfolio Composition | | Percent of
Net Assets | |
Corporate Bonds | | | 61 | % |
Commercial Paper | | | 15 | |
Repurchase Agreements | | | 15 | |
Certificates of Deposit | | | 10 | |
Liabilities in Excess of Other Assets | | | (1 | ) |
| | | | |
| Maturity Breakdown | | Percent of
Net Assets | |
1-7 days | | | 10 | % |
8-14 days | | | 4 | |
15-30 days | | | 14 | |
31-60 days | | | 26 | |
61-90 days | | | 6 | |
91-120 days | | | 7 | |
121-150 days | | | 12 | |
> 150 days | | | 21 | |
| | | | | | |
| 8 | | BLACKROCK FUNDS | | JANUARY 31, 2015 | | |
| | |
| | | BlackRock Ultra-Short Obligations Fund |
|
| Total Return Based on a $10,000 Investment |
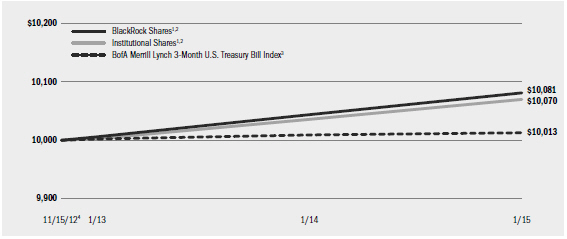
| | 1 | Assuming transaction costs and other operating expenses, including investment advisory fees and administration fees, if any. BlackRock and Institutional Shares do not have a sales charge. |
| | 2 | Under normal market conditions, the Fund invests in a broad range of U.S. dollar-denominated money market instruments, including government, U.S. and foreign bank and commercial obligations and repurchase agreements. |
| | 3 | An unmanaged index that tracks 3-month U.S. Treasury securities. |
| | 4 | Commencement of operations. |
| | | | | | | | | | | | | | | | | | | | |
| Performance Summary for the Period Ended January 31, 2015 | |
| | | | | | | | | | | | Average Annual Total Returns | |
| | | Standardized
30-Day Yield5 | | | Unsubsidized
30-Day Yield5 | | | 6-Month
Total Returns | | | 1 Year | | | Since Inception6 | |
BlackRock | | | 0.57 | % | | | (0.61 | )% | | | 0.19 | % | | | 0.36 | % | | | 0.36 | % |
Institutional | | | 0.55 | | | | (0.61 | ) | | | 0.18 | | | | 0.33 | | | | 0.32 | |
BofA Merrill Lynch 3-Month U.S. Treasury Bill Index | | | — | | | | — | | | | 0.01 | | | | 0.03 | | | | 0.06 | |
| | 5 | | The standardized 30-day yield includes the effects of any waivers and/or reimbursements. The unsubsidized 30-day yield excludes the effects of any waivers and/or reimbursements. |
| | 6 | | The Fund commenced operations on November 15, 2012. |
| | | | Past performance is not indicative of future results. |
| | | | | | | | | | | | | | | | | | | | | | | | | | | | |
| | | Actual | | | Hypothetical7 | | | | |
| | | Beginning
Account Value
August 1, 2014 | | | Ending
Account Value
January 31, 2015 | | | Expenses Paid
During the Period8 | | | Beginning
Account Value
August 1, 2014 | | | Ending
Account Value
January 31, 2015 | | | Expenses Paid
During the Period8 | | | Annualized
Expense Ratio | |
BlackRock Ultra-Short Obligations Fund | | | | | | | | | | | | | | | | | | | | | | | | | |
BlackRock | | | $1,000.00 | | | | $1,001.90 | | | | $0.50 | | | | $1,000.00 | | | | $1,024.70 | | | | $0.51 | | | | 0.10% | |
Institutional | | | $1,000.00 | | | | $1,001.80 | | | | $0.66 | | | | $1,000.00 | | | | $1,024.55 | | | | $0.66 | | | | 0.13% | |
| | 7 | | Hypothetical 5% annual return before expenses is calculated by prorating the number of days in the most recent fiscal period divided by 365. |
| | 8 | | For each class of the Fund, expenses are equal to the annualized expense ratio for the class, multiplied by the average account value over the period, multiplied by 184/365 (to reflect the one-half year period shown). |
| | | | See “Disclosure of Expenses” on page 10 for further information on how expenses were calculated. |
| | | | | | |
| | | BLACKROCK FUNDS | | JANUARY 31, 2015 | | 9 |
| Ÿ | | BlackRock, Institutional and Institutional Daily Shares are not subject to any sales charge. These shares bear no ongoing distribution or service fees and are available only to eligible investors. Prior to July 9, 2013, BlackRock Short Obligations and BlackRock Ultra-Short Obligations Funds’ Institutional Shares performance results are those of BlackRock Shares restated to reflect Institutional Shares fees. |
Refer to www.blackrock.com/cash to obtain performance data current to the most recent month-end. Performance information reflects past performance and does not guarantee future results. Current performance may be lower or higher than the performance data quoted. Performance results do not reflect the deduction of taxes that a shareholder would pay on fund distributions or the redemption of fund shares. Figures shown in each of the performance charts on the previous pages assume reinvestment of all dividends and distributions, if any, at net asset value
(“NAV”) on the ex-dividend/payable dates. Investment return and principal value of shares will fluctuate so that shares, when redeemed, may be worth more or less than their original cost.
BlackRock Advisors, LLC (the “Manager”), the Funds’ investment advisor, waived and/or reimbursed a portion of each Fund’s expenses. Without such waiver and/or reimbursement, a Fund’s performance would have been lower. The Manager is under no obligation to waive or reimburse or to continue waiving or reimbursing its fees after the applicable termination date. See Note 4 of the Notes to Financial Statements for additional information on waivers and reimbursements. The standardized 30-day yield includes the effects of any waivers and/or reimbursements. The unsubsidized 30-day yield excludes the effects of any waivers and/or reimbursements.
Shareholders of the Funds may incur the following charges: (a) transactional expenses and (b) operating expenses, including investment advisory fees, administration fees, service and distribution fees, including 12b-1 fees, acquired fund fees and expenses, and other Fund expenses. The expense examples on the previous pages (which are based on a hypothetical investment of $1,000 invested on August 1, 2014 and held through January 31, 2015) are intended to assist shareholders both in calculating expenses based on an investment in the Funds and in comparing these expenses with similar costs of investing in other mutual funds.
The expense examples provide information about actual account values and actual expenses. In order to estimate the expenses a shareholder paid during the period covered by this report, shareholders can divide their account value by $1,000 and then multiply the result by the number corresponding to their Fund and share class under the headings entitled “Expenses Paid During the Period.”
The expense examples also provide information about hypothetical account values and hypothetical expenses based on each Fund’s actual expense ratios and an assumed rate of return of 5% per year before expenses. In order to assist shareholders in comparing the ongoing expenses of investing in these Funds and other funds, compare the 5% hypothetical example with the 5% hypothetical examples that appear in other funds’ shareholder reports.
The expenses shown in the expense examples are intended to highlight shareholders’ ongoing costs only and do not reflect any transactional expenses, such as sales charges, if any. Therefore, the hypothetical examples are useful in comparing ongoing expenses only, and will not help shareholders determine the relative total expenses of owning different funds. If these transactional expenses were included, shareholder expenses would have been higher.
| | | | | | |
| 10 | | BLACKROCK FUNDS | | JANUARY 31, 2015 | | |
| | | | |
| Schedule of Investments January 31, 2015 (Unaudited) | | | BlackRock Short Obligations Fund | |
| | | (Percentages shown are based on Net Assets) | |
| | | | | | | | |
| Asset-Backed Securities | | Par (000) | | | Value | |
CarMax Auto Owner Trust, 0.46%, 4/17/17 | | $ | 167 | | | $ | 167,183 | |
CNH Equipment Trust, 0.48%, 8/15/17 | | | 200 | | | | 199,955 | |
Honda Auto Receivables Owner Trust, 0.41%, 9/21/16 | | | 159 | | | | 158,995 | |
Hyundai Auto Receivables Trust, 0.46%, 1/16/17 | | | 125 | | | | 125,304 | |
Mercedes-Benz Auto Lease Trust, 0.48%, 6/15/16 | | | 209 | | | | 209,252 | |
Volkswagen Auto Loan Enhanced Trust, 0.42%, 3/20/17 | | | 179 | | | | 178,947 | |
Volkswagen Credit Auto Master Trust, 0.52%, 7/22/19 (a)(b) | | | 100 | | | | 99,756 | |
Total Asset-Backed Securities — 4.6% | | | | | | | 1,139,392 | |
| | | | | | | | |
| Corporate Bonds | | | | | | |
Aerospace & Defense — 1.2% | | | | | | | | |
The Boeing Co., 0.36%, 10/30/17 (b) | | | 300 | | | | 300,286 | |
Automobiles — 4.1% | | | | | | | | |
Daimler Finance North America LLC, 2.63%, 9/15/16 (a) | | | 500 | | | | 513,135 | |
Volkswagen International Finance NV, 2.88%, 4/01/16 (a) | | | 500 | | | | 512,465 | |
| | | | | | | | |
| | | | | | | | 1,025,600 | |
Banks — 33.7% | | | | | | | | |
Australia & New Zealand Banking Group Ltd.: | | | | | | | | |
0.43%, 5/07/15 (a)(b) | | | 400 | | | | 400,188 | |
0.63%, 1/10/17 (a)(b) | | | 250 | | | | 250,378 | |
Bank of Tokyo-Mitsubishi Ufj Ltd., 2.45%, 9/11/15 (a) | | | 400 | | | | 404,143 | |
Banque Federative du Credit Mutuel SA,
1.11%, 1/20/17 (a)(b) | | | 500 | | | | 502,901 | |
BP Capital Markets PLC, 0.56%, 11/06/15 (b) | | | 500 | | | | 500,666 | |
BPCE S.A.: | | | | | | | | |
0.75%, 7/15/15 (b) | | | 300 | | | | 300,394 | |
1.08%, 2/10/17 (b) | | | 250 | | | | 251,397 | |
Commonwealth Bank of Australia: | | | | | | | | |
1.95%, 3/16/15 | | | 350 | | | | 350,677 | |
1.04%, 9/18/15 (a)(b) | | | 300 | | | | 301,452 | |
Cooperatieve Centrale Raiffeisen- Boerenleenbank BA, 0.72%, 3/18/16 (b) | | | 500 | | | | 501,845 | |
Deutsche Bank AG, 3.45%, 3/30/15 | | | 500 | | | | 502,253 | |
ING Bank NV, 0.49%, 2/24/15 (a)(b) | | | 500 | | | | 500,046 | |
JPMorgan Chase & Co., 4.75%, 3/01/15 | | | 250 | | | | 250,832 | |
JPMorgan Chase Bank NA, 0.50%, 7/30/15 (b) | | | 250 | | | | 250,160 | |
Macquarie Bank Ltd.: | | | | | | | | |
0.69%, 6/15/16 (a)(b) | | | 275 | | | | 275,290 | |
0.89%, 10/27/17 (a)(b) | | | 250 | | | | 249,986 | |
Suncorp Metway Ltd., 0.70%, 5/23/16 (a)(b) | | | 500 | | | | 500,750 | |
Svenska Handelsbanken AB: | | | | | | | | |
0.68%, 3/21/16 (b) | | | 500 | | | | 501,877 | |
0.72%, 9/23/16 (b) | | | 250 | | | | 250,934 | |
Toronto-Dominion Bank, 2.38%, 10/19/16 | | | 500 | | | | 513,417 | |
Wells Fargo & Co., 1.25%, 2/13/15 | | | 375 | | | | 375,086 | |
Wells Fargo Bank N.A., 0.54%, 7/20/15 (b) | | | 500 | | | | 500,531 | |
| | | | | | | | |
| | | | | | | | 8,435,203 | |
| | | | | | | | |
| Corporate Bonds | | Par
(000) | | | Value | |
Diversified Financial Services — 4.8% | | | | | | | | |
American Express Credit Corp., 1.34%, 6/12/15 (b) | | $ | 625 | | | $ | 627,204 | |
Shell International Finance BV, 0.44%, 11/15/16 (b) | | | 375 | | | | 375,198 | |
Toyota Motor Credit Corp., 0.39%, 9/18/15 (b) | | | 200 | | | | 200,161 | |
| | | | | | | | |
| | | | | | | | 1,202,563 | |
Diversified Telecommunication Services — 3.7% | | | | | | | | |
AT&T, Inc., 0.62%, 2/12/16 (b) | | | 500 | | | | 500,132 | |
Deutsche Telekom International Finance Bv, 5.75%, 3/23/16 | | | 250 | | | | 263,642 | |
Verizon Communications, Inc., 2.50%, 9/15/16 | | | 166 | | | | 169,868 | |
| | | | | | | | |
| | | | | | | | 933,642 | |
Food Products — 1.5% | | | | | | | | |
General Mills, Inc., 0.55%, 1/29/16 (b) | | | 250 | | | | 249,730 | |
Kellogg Co., 0.46%, 2/13/15 (b) | | | 125 | | | | 124,999 | |
| | | | | | | | |
| | | | | | | | 374,729 | |
Health Care Providers & Services — 2.0% | | | | | | | | |
Principal Life Global Funding II, 0.61%, 5/27/16 (a)(b) | | | 500 | | | | 501,250 | |
Insurance — 2.5% | | | | | | | | |
Prudential Financial Inc, 4.75%, 9/17/15 | | | 600 | | | | 614,744 | |
Manufacturing — 3.0% | | | | | | | | |
Cooper US Inc, 2.38%, 1/15/16 | | | 250 | | | | 254,067 | |
Tyco Electronics Group SA, 0.45%, 1/29/16 (b) | | | 500 | | | | 499,901 | |
| | | | | | | | |
| | | | | | | | 753,968 | |
Metals & Mining — 3.0% | | | | | | | | |
Rio Tinto Finance USA Ltd., 2.50%, 5/20/16 | | | 250 | | | | 255,118 | |
Rio Tinto Finance USA PLC, 1.08%, 6/17/16 (b) | | | 500 | | | | 501,641 | |
| | | | | | | | |
| | | | | | | | 756,759 | |
Oil, Gas & Consumable Fuels — 3.2% | | | | | | | | |
Devon Energy Corp., 0.69%, 12/15/15 (b) | | | 250 | | | | 249,737 | |
Total Capital Canada Ltd., 0.63%, 1/15/16 (b) | | | 300 | | | | 300,850 | |
TransCanada Pipelines Ltd., 0.94%, 6/30/16 (b) | | | 250 | | | | 250,705 | |
| | | | | | | | |
| | | | | | | | 801,292 | |
Pharmaceuticals — 1.0% | | | | | | | | |
Bayer AG, 0.50%, 10/07/16 (a)(b) | | | 250 | | | | 250,073 | |
Pipelines (No Natural Gas) — 2.3% | | | | | | | | |
Enterprise Products Operating LLC, 1.25%, 8/13/15 | | | 575 | | | | 575,891 | |
Wireless Telecommunication Services — 2.0% | | | | | | | | |
America Movil Sab de CV, 2.38%, 9/08/16 | | | 250 | | | | 254,757 | |
Vodafone Group PLC, 0.62%, 2/19/16 (b) | | | 250 | | | | 250,095 | |
| | | | | | | | |
| | | | | | | | 504,852 | |
Total Corporate Bonds — 68.0% | | | | 17,030,852 | |
Total Long-Term Investments (Cost — $18,154,187) — 72.6% | | | | 18,170,244 | |
| | | | | | | | |
| | | | | | | |
See Notes to Financial Statements.
| | | | | | |
| | | BLACKROCK FUNDS | | JANUARY 31, 2015 | | 11 |
| | | | |
| Schedule of Investments (continued) | | | BlackRock Short Obligations Fund | |
| | | (Percentages shown are based on Net Assets) | |
| | | | | | | | |
Short-Term Securities | | | | | | | | |
| Certificates of Deposit | | Par
(000) | | | Value | |
Yankee (c) — 10.0% | | | | | | | | |
Barclays Bank PLC, New York, 0.55%, 5/01/15 (b) | | $ | 250 | | | $ | 249,982 | |
Credit Industriel et Commercial, New York,
0.54%, 4/14/15 (b) | | | 500 | | | | 499,978 | |
Credit Suisse, New York: | | | | | | | | |
0.43%, 8/24/15 (b) | | | 250 | | | | 250,038 | |
0.65%, 12/07/15 (b) | | | 500 | | | | 500,245 | |
Sumitomo Mitsui Banking Corp., New York,
0.66%, 4/01/15 (b) | | | 1,000 | | | | 1,000,358 | |
Total Certificates of Deposit — 10.0% | | | | | | | 2,500,601 | |
| | | | | | | | |
| Commercial Paper (d) | | | | | | |
Daimler Finance NA LLC, 0.60%, 2/26/15 | | | 250 | | | | 249,955 | |
Nissan Motor Acceptance Corp., 0.40%, 4/20/15 | | | 550 | | | | 549,630 | |
Sabmiller Holdings, 0.44%, 3/31/15 | | | 250 | | | | 249,879 | |
Vodafone Group PLC: | | | | | | | | |
0.44%, 4/10/15 | | | 500 | | | | 499,711 | |
0.55%, 4/10/15 | | | 250 | | | | 249,856 | |
Total Commercial Paper — 7.2% | | | | | | | 1,799,031 | |
| | | | | | | | |
| Money Market Funds — 0.1% | | Shares | | | | |
BlackRock Liquidity Funds, TempFund, Institutional Class, 0.06% (e)(f) | | | 40,314 | | | | 40,314 | |
| | | | | | | | |
| Repurchase Agreements | | Par
(000) | | | | |
Barclays Capital Inc., 0.72%, 5/18/15
(Purchased on 11/18/14 to be repurchased at $752,715, collateralized by various corporate/debt obligations, 4.00% to 10.00% due from 3/01/17 to 10/15/24, aggregate original par and fair value of $919,721 and $900,001, respectively) | | | 750 | | | | 751,158 | |
Total Value of Barclays Capital Inc.
(Collateral value of $900,001) | | | | | | | 751,158 | |
| | | | | | | | |
| Repurchase Agreements | | Par
(000) | | | Value | |
Mizuho Securities USA, Inc., 1.14%, 2/02/15 (g)
(Purchased on 3/04/13 to be repurchased at $255,542, collateralized by various U.S. government sponsored agency obligations, 0.02% to 0.25% due from 9/12/21 to 3/11/41, aggregate original par and fair value of $3,194,029 and $267,884, respectively) | | $ | 250 | | | $ | 250,000 | |
Total Value of Mizuho Securities USA, Inc.
(Collateral value of $267,884) | | | | | | | 250,000 | |
Morgan Stanley & Co. LLC, 0.41%, 3/16/15 (g)
(Purchased on 12/14/14 to be repurchased at $550,220, collateralized by Freddie Mac Participation Certificate, 4.50% due at 12/16/52, original par and fair value of $410,553 and $588,500, respectively) | | | 550 | | | | 550,000 | |
Total Value of Morgan Stanley & Co. LLC
(Collateral value of $588,500) | | | | | | | 550,000 | |
RBS Securities Inc., 1.00%, 2/04/15
(Purchased on 1/05/15 to be repurchased at $900,750, collateralized by various corporate/debt and U.S. government sponsored agency obligations, 0.18% to 2.20% due from 9/12/21 to 3/11/41, aggregate original par and fair value of $2,049,624,762 and $1,125,002, respectively) | | | 900 | | | | 900,000 | |
Total Value of RBS Securities Inc.
(Collateral value of $1,125,002) | | | | | | | 900,000 | |
Total Repurchase Agreements — 9.8% | | | | | | | 2,451,158 | |
Total Short-Term Securities (Cost — $6,789,387) — 27.1% | | | | 6,791,104 | |
Total Investments (Cost — $24,943,574) — 99.7% | | | | 24,961,348 | |
Other Assets Less Liabilities — 0.3% | | | | | | | 70,704 | |
| | | | | | | | |
Net Assets — 100.0% | | | | | | $ | 25,032,052 | |
| | | | | | | | |
|
| Notes to Schedule of Investments |
| (a) | Security exempt from registration pursuant to Rule 144A under the Securities Act of 1933, as amended. These securities may be resold in transactions exempt from registration to qualified institutional investors. |
| (b) | Variable rate security. Rate shown is as of report date. |
| (c) | Issuer is a U.S. branch of a foreign domiciled bank. |
| (d) | Rates shown are discount rates or a range of discount rates at the time of purchase. |
See Notes to Financial Statements.
| | | | | | |
| 12 | | BLACKROCK FUNDS | | JANUARY 31, 2015 | | |
| | | | |
| Schedule of Investments (concluded) | | | BlackRock Short Obligations Fund | |
| (e) | During the period ended January 31, 2015, investments in issuers considered to be an affiliate of the Fund for purposes of Section 2(a)(3) of the Investment Company Act of 1940, as amended, were as follows: |
| | | | | | | | | | | | | | | | |
| Affiliate | | Shares Held at
July 31, 2014 | | | Net
Activity
(Shares) | | | Shares Held at
January 31, 2015 | | | Income | |
BlackRock Liquidity Funds, TempFund, Institutional Class | | | — | | | | 40,314 | | | | 40,314 | | | $ | 13 | |
| (f) | Represents the current yield as of report date. |
| (g) | Variable rate security. Rate shown is as of report date and maturity shown is the date the principal owed can be recovered through demand. |
| Ÿ | | For Fund compliance purposes, the Fund’s industry classifications refer to any one or more of the industry sub-classifications used by one or more widely recognized market indexes or ratings group indexes and/or as defined by Fund management. These definitions may not apply for purposes of this report, which may combine industry sub-classifications for reporting ease. |
| Ÿ | | Fair Value Measurements — Various inputs are used in determining the fair value of investments. These inputs to valuation techniques are categorized into a disclosure hierarchy consisting of three broad levels for financial statement purposes. The hierarchy gives the highest priority to unadjusted quoted prices in active markets for identical assets or liabilities (Level 1 measurements) and the lowest priority to unobservable inputs (Level 3 measurements). Accordingly, the degree of judgment exercised in determining fair value is greatest for instruments categorized in Level 3. The inputs used to measure fair value may fall into different levels of the fair value hierarchy. In such cases, for disclosure purposes, the fair value hierarchy classification is determined based on the lowest level input that is significant to the fair value measurement in its entirety. The categorization of a value determined for investments is based on the pricing transparency of the investment and is not necessarily an indication of the risks associated with investing in those securities. The three levels of the fair value hierarchy are as follows: |
| | Ÿ | | Level 1 — unadjusted quoted prices in active markets/exchanges for identical assets or liabilities that the Fund has the ability to access |
| | Ÿ | | Level 2 — other observable inputs (including, but not limited to, quoted prices for similar assets or liabilities in markets that are active, quoted prices for identical or similar assets or liabilities in markets that are not active, inputs other than quoted prices that are observable for the assets or liabilities (such as interest rates, yield curves, volatilities, prepayment speeds, loss severities, credit risks and default rates) or other market–corroborated inputs) |
| | Ÿ | | Level 3 — unobservable inputs based on the best information available in the circumstances, to the extent observable inputs are not available (including the Fund’s own assumptions used in determining the fair value of investments) |
Changes in valuation techniques may result in transfers into or out of an assigned level within the disclosure hierarchy. In accordance with the Fund’s policy, transfers between different levels of the fair value disclosure hierarchy are deemed to have occurred as of the beginning of the reporting period. For information about the Fund’s policy regarding valuation of investments, please refer to Note 2 of the Notes to Financial Statements.
As of January 31, 2015, the following table summarizes the Fund’s investments categorized in the disclosure hierarchy:
| | | | | | | | | | | | | | |
| | | Level 1 | | | Level 2 | | | Level 3 | | Total | |
Assets: | | | | | | | | | | | | | | |
Investments:1 | | | | | | | | | | | | | | |
Long-Term Investments | | | — | | | $ | 18,170,244 | | | — | | $ | 18,170,244 | |
Short-Term Securities | | | $40,314 | | | | 6,750,790 | | | — | | | 6,791,104 | |
Total | | $ | 40,314 | | | $ | 24,921,034 | | | — | | $ | 24,961,348 | |
| | | | |
1 See above Schedule of Investments for values in each security type. | | | | |
During the period ended January 31, 2015, there were no transfers between levels.
See Notes to Financial Statements.
| | | | | | |
| | | BLACKROCK FUNDS | | JANUARY 31, 2015 | | 13 |
| | | | |
| Schedule of Investments January 31, 2015 (Unaudited) | | | BlackRock Short-Term Treasury Fund | |
| | | (Percentages shown are based on Net Assets) | |
| | | | | | | | |
| Money Market Funds — 0.0% | |
Shares | | | Value | |
BlackRock Liquidity Funds, T-Fund, Institutional
Class, 0.03% (a)(b) | | | 438 | | | $ | 438 | |
| | | | | | | | |
| U.S. Treasury Obligations | | Par
(000) | | | | |
U.S. Treasury Bills: (c) | | | | | | | | |
0.05%, 2/26/15 | | $ | 768 | | | | 767,996 | |
0.05%, 3/05/15 | | | 500 | | | | 499,997 | |
0.05%, 3/19/15 | | | 500 | | | | 499,996 | |
0.13%, 4/02/15 | | | 200 | | | | 199,998 | |
0.05%, 4/23/15 | | | 500 | | | | 499,992 | |
0.06%, 5/14/15 | | | 1,000 | | | | 999,958 | |
0.07%, 5/21/15 | | | 500 | | | | 499,966 | |
0.07%, 5/28/15 | | | 700 | | | | 699,961 | |
0.16%, 6/25/15 | | | 100 | | | | 99,989 | |
0.11%-0.13%, 7/02/15 | | | 1,000 | | | | 999,854 | |
0.13%, 7/09/15 | | | 1,500 | | | | 1,499,803 | |
0.09%, 7/16/15 | | | 500 | | | | 499,903 | |
0.08%, 7/30/15 | | | 1,000 | | | | 999,703 | |
U.S. Treasury Notes: | | | | | | | | |
0.25%-2.25%, 1/31/15 | | | 269 | | | | 269,000 | |
2.38%, 2/28/15 | | | 500 | | | | 500,801 | |
2.50%, 3/31/15 | | | 250 | | | | 250,947 | |
0.13%, 4/30/15 | | | 1,000 | | | | 999,844 | |
4.13%, 5/15/15 | | | 1,000 | | | | 1,011,406 | |
1.75%, 7/31/15 | | | 116 | | | | 116,952 | |
0.38%, 8/31/15 | | | 125 | | | | 125,190 | |
0.07%, 1/31/16(d) | | | 138 | | | | 137,981 | |
0.09%, 4/30/16(d) | | | 180 | | | | 179,995 | |
0.09%, 7/31/16(d) | | | 288 | | | | 287,994 | |
0.07%, 10/31/16(d) | | | 365 | | | | 364,826 | |
0.10%, 1/31/17(d) | | | 300 | | | | 299,461 | |
Total U.S. Treasury Obligations — 88.8% | | | | 13,311,513 | |
| | | | | | | | |
| | | | | | | |
| | | | | | | | |
| Repurchase Agreements | | Par
(000) | | | Value | |
Morgan Stanley & Co. LLC, 0.06%, 2/02/15
(Purchased on 1/30/15 to be repurchased at $994,005, collateralized by U.S. Treasury Note, 1.75% due at 9/30/19, original par and fair value of $986,000 and $1,013,968, respectively) | | $ | 994 | | | $ | 994,000 | |
Total Value of Morgan Stanley & Co. LLC
(Collateral value of $1,013,968) | | | | 994,000 | |
TD Securities (USA) LLC, 0.05%, 2/02/15
(Purchased on 1/30/15 to be repurchased at $1,000,004, collateralized by U.S. Treasury Note, 0.88% due at 12/31/16, original par and fair value of $1,012,200 and $1,020,051, respectively) | | | 1,000 | | | | 1,000,000 | |
Total Value of TD Securities (USA) LLC
(Collateral value of $1,020,051) | | | | 1,000,000 | |
Total Repurchase Agreements — 13.3% | | | | | | | 1,994,000 | |
Total Investments (Cost — $15,305,386) — 102.1% | | | | 15,305,951 | |
Liabilities in Excess of Other Assets — (2.1)% | | | | (309,590 | ) |
| | | | | | | | |
Net Assets — 100.0% | | | $ | 14,996,361 | |
| | | | | | | | |
|
| Notes to Schedule of Investments |
| (a) | Represents the current yield as of report date. |
| (b) | During the period ended January 31, 2015, investments in issuers considered to be an affiliate of the Fund for purposes of Section 2(a)(3) of the Investment Company Act of 1940, as amended, were as follows: |
| | | | | | | | | | | | | | | | |
| Affiliate | | Shares Held at
July 31, 2014 | | | Net
Activity
(Shares) | | | Shares Held at
January 31, 2015 | | | Income | |
BlackRock Liquidity Funds, T-Fund, Institutional Class | | | 1,980 | | | | (1,542 | ) | | | 438 | | | | — | |
| (c) | Rates shown are discount rates or a range of discount rates at the time of purchase. |
| (d) | Variable rate security. Rate shown is as of report date. |
See Notes to Financial Statements.
| | | | | | |
| 14 | | BLACKROCK FUNDS | | JANUARY 31, 2015 | | |
| | | | |
| Schedule of Investments (concluded) | | | BlackRock Short-Term Treasury Fund | |
| Ÿ | | Fair Value Measurements — Various inputs are used in determining the fair value of investments. These inputs to valuation techniques are categorized into a disclosure hierarchy consisting of three broad levels for financial statement purposes. The hierarchy gives the highest priority to unadjusted quoted prices in active markets for identical assets or liabilities (Level 1 measurements) and the lowest priority to unobservable inputs (Level 3 measurements). Accordingly, the degree of judgment exercised in determining fair value is greatest for instruments categorized in Level 3. The inputs used to measure fair value may fall into different levels of the fair value hierarchy. In such cases, for disclosure purposes, the fair value hierarchy classification is determined based on the lowest level input that is significant to the fair value measurement in its entirety. The categorization of a value determined for investments is based on the pricing transparency of the investment and is not necessarily an indication of the risks associated with investing in those securities. The three levels of the fair value hierarchy are as follows: |
| | Ÿ | | Level 1 — unadjusted quoted prices in active markets/exchanges for identical assets or liabilities that the Fund has the ability to access |
| | Ÿ | | Level 2 — other observable inputs (including, but not limited to, quoted prices for similar assets or liabilities in markets that are active, quoted prices for identical or similar assets or liabilities in markets that are not active, inputs other than quoted prices that are observable for the assets or liabilities (such as interest rates, yield curves, volatilities, prepayment speeds, loss severities, credit risks and default rates) or other market–corroborated inputs) |
| | Ÿ | | Level 3 — unobservable inputs based on the best information available in the circumstances, to the extent observable inputs are not available (including the Fund’s own assumptions used in determining the fair value of investments) |
Changes in valuation techniques may result in transfers into or out of an assigned level within the disclosure hierarchy. In accordance with the Fund’s policy, transfers between different levels of the fair value disclosure hierarchy are deemed to have occurred as of the beginning of the reporting period. For information about the Fund’s policy regarding valuation of investments, please refer to Note 2 of the Notes to Financial Statements.
As of January 31, 2015, the following table summarizes the Fund’s investments categorized in the disclosure hierarchy:
| | | | | | | | | | | | |
| | | Level 1 | | Level 2 | | | Level 3 | | Total | |
Assets: | | | | | | | | | | | | |
Investments: | | | | | | | | | | | | |
Short-Term Securities1 | | $438 | | $ | 15,305,513 | | | — | | $ | 15,305,951 | |
1 See above Schedule of Investments for values in each security type. | | | | | | | | | | | | |
During the period ended January 31, 2015, there were no transfers between levels.
See Notes to Financial Statements.
| | | | | | |
| | | BLACKROCK FUNDS | | JANUARY 31, 2015 | | 15 |
| | | | |
| Schedule of Investments January 31, 2015 (Unaudited) | | | BlackRock Ultra-Short Obligations Fund | |
| | | (Percentages shown are based on Net Assets) | |
| | | | | | | | |
| Corporate Bonds | | Par
(000) | | | Value | |
Banks — 22.1% | | | | | | | | |
Bank of America Corp, 3.70%, 9/01/15 | | $ | 590 | | | $ | 600,227 | |
Bank of America Corp., 4.50%, 4/01/15 | | | 490 | | | | 493,072 | |
Bank of Tokyo-Mitsubishi Ufj Ltd., 2.45%, 9/11/15 (a) | | | 750 | | | | 757,769 | |
Deutsche Bank AG, 3.45%, 3/30/15 | | | 750 | | | | 753,379 | |
Deutsche Bank AG London, 3.25%, 1/11/16 | | | 275 | | | | 281,066 | |
ING Bank NV: | | | | | | | | |
0.49%, 2/24/15 (a)(b) | | | 750 | | | | 750,069 | |
2.00%, 9/25/15 (a) | | | 200 | | | | 201,588 | |
Macquarie Bank Ltd., 3.45%, 7/27/15 | | | 280 | | | | 283,917 | |
National Australia Bank Ltd., 1.60%, 8/07/15 | | | 250 | | | | 251,346 | |
Societe Generale SA, 3.10%, 9/14/15 (a) | | | 650 | | | | 659,629 | |
Wells Fargo & Co., 1.17%, 6/26/15 (b) | | | 500 | | | | 501,813 | |
| | | | | | | | |
| | | | | | | | 5,533,875 | |
Beverages — 3.5% | | | | | | | | |
Pepsico Inc, 0.75%, 3/05/15 | | | 860 | | | | 860,328 | |
Chemicals — 2.2% | | | | | | | | |
Ecolab, Inc.: | | | | | | | | |
4.88%, 2/15/15 | | | 300 | | | | 300,497 | |
1.00%, 8/09/15 | | | 250 | | | | 250,496 | |
| | | | | | | | |
| | | | | | | | 550,993 | |
Diversified Financial Services — 14.9% | | | | | | | | |
American Express Credit Corp.: | | | | | | | | |
1.34%, 6/12/15 (b) | | | 250 | | | | 250,882 | |
2.75%, 9/15/15 | | | 500 | | | | 506,717 | |
American Honda Finance Corp., 1.45%, 2/27/15 (a) | | | 910 | | | | 910,678 | |
ANZ New Zealand International Ltd., 1.13%, 5/28/15 (b) | | | 500 | | | | 501,243 | |
Caterpillar Financial Services Corp.: | | | | | | | | |
4.75%, 2/17/15 | | | 500 | | | | 500,816 | |
4.63%, 6/01/15 | | | 400 | | | | 405,561 | |
General Electric Capital Corp.: | | | | | | | | |
1.09%, 5/28/15 (b) | | | 500 | | | | 501,307 | |
3.50%, 6/29/15 | | | 150 | | | | 151,947 | |
| | | | | | | | |
| | | | | | | | 3,729,151 | |
Diversified Telecommunication Services — 8.6% | | | | | | | | |
AT&T, Inc., 0.62%, 2/12/16 (b) | | | 750 | | | | 750,198 | |
British Telecommunications PLC, 2.00%, 6/22/15 | | | 500 | | | | 502,684 | |
Verizon Communications, Inc., 0.44%, 3/06/15 (a)(b) | | | 890 | | | | 890,048 | |
| | | | | | | | |
| | | | | | | | 2,142,930 | |
Food Products — 4.3% | | | | | | | | |
Kellogg Co., 0.46%, 2/13/15 (b) | | | 1,062 | | | | 1,061,994 | |
Insurance — 1.0% | | | | | | | | |
Prudential Financial Inc, 4.75%, 9/17/15 | | | 250 | | | | 256,143 | |
Metals & Mining — 2.0% | | | | | | | | |
Rio Tinto Finance USA PLC, 1.13%, 3/20/15 | | | 500 | | | | 500,404 | |
Oil, Gas & Consumable Fuels — 1.8% | | | | | | | | |
BP Capital Markets PLC, 3.88%, 3/10/15 | | | 450 | | | | 451,571 | |
| | | | | | | | |
| Corporate Bonds | | Par
(000) | | | Value | |
Specialty Retail — 1.0% | | | | | | | | |
Walgreen Co., 1.00%, 3/13/15 | | $ | 260 | | | $ | 260,164 | |
Total Long-Term Investments (Cost — $15,347,012) — 61.4% | | | | 15,347,553 | |
| | | | | | | | |
| Short-Term Securities | | | | | | |
Certificates of Deposit | | | | | | | | |
Domestic — 1.0% | | | | | | | | |
Citibank N.A., 0.38%, 8/12/15 (b) | | | 250 | | | | 249,958 | |
Yankee (c) — 8.6% | | | | | | | | |
Barclays Bank PLC, New York, 0.55%, 5/01/15 (b) | | | 250 | | | | 249,982 | |
Canadian Imperial Bank of Commerce, New York, 0.33%, 6/01/15 (b) | | | 250 | | | | 250,000 | |
Credit Agricole CIB, New York, 0.44%, 6/01/15 | | | 500 | | | | 500,202 | |
Credit Industriel et Commercial, New York,
0.54%, 4/14/15 (b) | | | 500 | | | | 499,978 | |
Sumitomo Mitsui Banking Corp., New York,
0.66%, 4/01/15 (b) | | | 650 | | | | 650,233 | |
Total Certificates of Deposit — 9.6% | | | | | | | 2,400,353 | |
| | | | | | | | |
| Commercial Paper | | | | | | |
Credit Agricole CIB, 0.35%, 3/09/15 (d) | | | 275 | | | | 275,032 | |
Daimler Finance North America LLC,
0.61%, 2/02/15 (d) | | | 400 | | | | 399,992 | |
Hyundai Capital America, 0.40%, 2/05/15 (d) | | | 1,000 | | | | 999,962 | |
Macquarie Bank Ltd., 0.56%, 1/04/16 (b) | | | 250 | | | | 249,974 | |
Nissan Motor Acceptance Corp., 0.40%, 4/20/15 (d) | | | 250 | | | | 249,832 | |
Sabmiller Holdings, 0.44%, 3/31/15 (d) | | | 500 | | | | 499,758 | |
Virginia Electric and Power Company,
0.40%, 3/02/15 (d) | | | 408 | | | | 407,922 | |
Vodafone Group PLC: | | | | | | | | |
0.55%, 4/10/15 (d) | | | 250 | | | | 249,856 | |
0.56%, 6/02/15 (d) | | | 500 | | | | 499,397 | |
Total Commercial Paper — 15.3% | | | | | | | 3,831,725 | |
| | | | | | | | |
| Money Market Funds — 0.0% | | Shares | | | | |
BlackRock Liquidity Funds, TempFund, Institutional
Class, 0.06% (e)(f) | | | 782 | | | | 782 | |
| | | | | | | | |
| | | | | | | |
See Notes to Financial Statements.
| | | | | | |
| 16 | | BLACKROCK FUNDS | | JANUARY 31, 2015 | | |
| | | | |
| Schedule of Investments (continued) | |
| BlackRock Ultra-Short Obligations Fund
(Percentages shown are based on Net Assets) |
|
| | | | | | | | |
| Repurchase Agreements | | Par
(000) | | | Value | |
Barclays Capital Inc., 0.72%, 5/18/15
(Purchased on 11/18/14 to be repurchased at $752,715, collateralized by various corporate/debt obligations, 3.50% to 11.00%, due from 7/18/16 to 1/11/25, aggregate original par and fair value of $1,135,914 and $900,000, respectively) | | $ | 750 | | | $ | 751,158 | |
Total Value of Barclays Capital Inc.
(Collateral value of $900,000) | | | | 751,158 | |
Citigroup Global Markets, Inc., 0.62%, 3/06/15 (g)
(Purchased on 9/04/14 to be repurchased at $501,576, collateralized by U.S. Treasury Bond, 3.13%, due at 8/15/44, original par and fair value of $430,000 and $510,041, respectively) | | | 500 | | | | 500,000 | |
Total Value of Citigroup Global Markets, Inc.
(Collateral value of $510,041) | | | | 500,000 | |
J.P. Morgan Securities LLC, 0.53%, 2/18/15
(Purchased on 11/19/14 to be repurchased at $751,005, collateralized by various corporate/debt obligations, 0.00%, due from 7/3/27 to 10/18/28, aggregate original par and fair value of $895,000 and $900,189, respectively) | | | 750 | | | | 750,129 | |
Total Value of J.P. Morgan Securities LLC
(Collateral value of $900,189) | | | | 750,129 | |
| | | | | | | | |
| Repurchase Agreements | | Par
(000) | | | Value | |
Mizuho Securities USA, Inc., 1.14%, 2/02/15 (g)
(Purchased on 3/04/13 to be repurchased at $255,542, collateralized by various U.S. government sponsored agency obligations, 2.12% to 4.00%, due from 7/15/26 to 3/25/42, aggregate original par and fair value of $3,194,029 and $276,884, respectively) | | $ | 250 | | | $ | 250,000 | |
Total Value of Mizuho Securities USA, Inc.
(Collateral value of $276,884) | | | | 250,000 | |
Morgan Stanley & Co. LLC, 0.41%, 3/16/15 (g)
(Purchased on 12/16/14 to be repurchased at $500,513, collateralized by various U.S. government sponsored agency obligations, 0.00% to 6.00%, due from 6/16/43 to 8/15/43, aggregate original par and fair value of $799,469 and $535,001, respectively) | | | 500 | | | | 500,000 | |
Total Value of Morgan Stanley & Co. LLC
(Collateral value of $535,001) | | | | 500,000 | |
RBS Securities Inc., 1.00%, 2/04/15
(Purchased on 1/05/15 to be repurchased at $850,708, collateralized by various U.S. government sponsored agency obligations, 0.00% to 5.70%, due from 2/12/17 to 9/16/40, aggregate original par and fair value of $470,189,482 and $1,062,536, respectively) | | | 850 | | | | 850,000 | |
Total Value of RBS Securities Inc.
(Collateral value of $1,062,536) | | | | 850,000 | |
Total Repurchase Agreements — 14.4% | | | | | | | 3,601,287 | |
Total Short-Term Securities (Cost — $9,832,091) — 39.3% | | | | 9,834,147 | |
Total Investments (Cost — $25,179,103) — 100.7% | | | | 25,181,700 | |
Liabilities in Excess of Other Assets — (0.7)% | | | | (181,563 | ) |
| | | | | | | | |
Net Assets — 100.0% | | | $ | 25,000,137 | |
| | | | | | | | |
|
| Notes to Schedule of Investments |
| (a) | Security exempt from registration pursuant to Rule 144A under the Securities Act of 1933, as amended. These securities may be resold in transactions exempt from registration to qualified institutional investors. |
| (b) | Variable rate security. Rate shown is as of report date. |
| (c) | Issuer is a U.S. branch of a foreign domiciled bank. |
| (d) | Rates shown are discount rates or a range of discount rates at the time of purchase. |
| (e) | During the period ended January 31, 2015, investments in issuers considered to be an affiliate of the Fund for purposes of Section 2(a)(3) of the Investment Company Act of 1940, as amended, were as follows: |
| | | | | | | | | | | | | | | | |
| Affiliate | | Shares Held at
July 31, 2014 | | | Net
Activity
(Shares) | | | Shares Held at
January 31, 2015 | | | Income | |
BlackRock Liquidity Funds, TempFund, Institutional Class | | | 47,834 | | | | (47,052 | ) | | | 782 | | | $ | 77 | |
| (f) | Represents the current yield as of report date. |
| (g) | Variable rate security. Rate shown is as of report date and maturity shown is the date the principal owed can be recovered through demand. |
See Notes to Financial Statements.
| | | | | | |
| | | BLACKROCK FUNDS | | JANUARY 31, 2015 | | 17 |
| | | | |
| Schedule of Investments (concluded) | | | BlackRock Ultra-Short Obligations Fund | |
| Ÿ | | For Fund compliance purposes, the Fund’s industry classifications refer to any one or more of the industry sub-classifications used by one or more widely recognized market indexes or ratings group indexes and/or as defined by Fund management. These definitions may not apply for purposes of this report, which may combine industry sub-classifications for reporting ease. |
| Ÿ | | Fair Value Measurements — Various inputs are used in determining the fair value of investments. These inputs to valuation techniques are categorized into a disclosure hierarchy consisting of three broad levels for financial statement purposes. The hierarchy gives the highest priority to unadjusted quoted prices in active markets for identical assets or liabilities (Level 1 measurements) and the lowest priority to unobservable inputs (Level 3 measurements). Accordingly, the degree of judgment exercised in determining fair value is greatest for instruments categorized in Level 3. The inputs used to measure fair value may fall into different levels of the fair value hierarchy. In such cases, for disclosure purposes, the fair value hierarchy classification is determined based on the lowest level input that is significant to the fair value measurement in its entirety. The categorization of a value determined for investments is based on the pricing transparency of the investment and is not necessarily an indication of the risks associated with investing in those securities. The three levels of the fair value hierarchy are as follows: |
| | Ÿ | | Level 1 — unadjusted quoted prices in active markets/exchanges for identical assets or liabilities that the Fund has the ability to access |
| | Ÿ | | Level 2 — other observable inputs (including, but not limited to, quoted prices for similar assets or liabilities in markets that are active, quoted prices for identical or similar assets or liabilities in markets that are not active, inputs other than quoted prices that are observable for the assets or liabilities (such as interest rates, yield curves, volatilities, prepayment speeds, loss severities, credit risks and default rates) or other market–corroborated inputs) |
| | Ÿ | | Level 3 — unobservable inputs based on the best information available in the circumstances, to the extent observable inputs are not available (including the Fund’s own assumptions used in determining the fair value of investments) |
Changes in valuation techniques may result in transfers into or out of an assigned level within the disclosure hierarchy. In accordance with the Fund’s policy, transfers between different levels of the fair value disclosure hierarchy are deemed to have occurred as of the beginning of the reporting period. For information about the Fund’s policy regarding valuation of investments, please refer to Note 2 of the Notes to Financial Statements.
As of January 31, 2015, the following table summarizes the Fund’s investments categorized in the disclosure hierarchy:
| | | | | | | | | | | | | | |
| | | Level 1 | | | Level 2 | | | Level 3 | | Total | |
Assets: | | | | | | | | | | | | | | |
Investments:1 | | | | | | | | | | | | | | |
Long-Term Investments | | | — | | | $ | 15,347,553 | | | — | | $ | 15,347,553 | |
Short-Term Securities | | | $782 | | | | 9,833,365 | | | — | | | 9,834,147 | |
Total | | $ | 782 | | | $ | 25,180,918 | | | — | | $ | 25,181,700 | |
| | | | |
1 See above Schedule of Investments for values in each security type. | | | | |
The Fund may hold assets and/or liabilities in which the fair value approximates the carrying amount for financial statement purposes. As of January 31, 2015, cash of $862,949 is categorized as Level 1 within the disclosure hierarchy.
During the period ended January 31, 2015, there were no transfers between levels.
See Notes to Financial Statements.
| | | | | | |
| 18 | | BLACKROCK FUNDS | | JANUARY 31, 2015 | | |
| | |
| Statements of Assets and Liabilities | | |
| | | | | | | | | | | | |
| January 31, 2015 (Unaudited) | | BlackRock
Short
Obligations
Fund | | | BlackRock
Short-Term
Treasury
Fund | | | BlackRock
Ultra-Short
Obligations
Fund | |
| | | | | | | | | | | | |
| Assets | | | | | | | | | | | | |
Investments at value — unaffiliated1 | | $ | 22,469,876 | | | $ | 13,311,513 | | | $ | 21,579,631 | |
Investments at value — affiliated2 | | | 40,314 | | | | 438 | | | | 782 | |
Repurchase agreements at value3 | | | 2,451,158 | | | | 1,994,000 | | | | 3,601,287 | |
Cash | | | — | | | | — | | | | 862,949 | |
Interest receivable | | | 70,913 | | | | 19,176 | | | | 108,190 | |
Receivable from Manager | | | 17,709 | | | | 14,036 | | | | 18,816 | |
Prepaid expenses | | | 18,350 | | | | 19,373 | | | | 18,350 | |
| | | | |
Total assets | | | 25,068,320 | | | | 15,358,536 | | | | 26,190,005 | |
| | | | |
| | | | | | | | | | | | |
| Liabilities | | | | | | | | | | | | |
Investments purchased payable | | | — | | | | 299,962 | | | | 1,146,959 | |
Professional fees payable | | | 9,885 | | | | 44,349 | | | | 19,096 | |
Income dividends payable | | | 11,625 | | | | 127 | | | | 8,324 | |
Printing fees payable | | | 4,108 | | | | 3,147 | | | | 4,109 | |
Custodian fees payable | | | 1,478 | | | | 5,762 | | | | 2,196 | |
Officer’s and Trustees’ fees payable | | | 1,175 | | | | 1,223 | | | | 1,178 | |
Other affiliates payable | | | 64 | | | | 56 | | | | 69 | |
Other accrued expenses payable | | | 7,933 | | | | 7,549 | | | | 7,937 | |
| | | | |
Total liabilities | | | 36,268 | | | | 362,175 | | | | 1,189,868 | |
| | | | |
Net Assets | | $ | 25,032,052 | | | $ | 14,996,361 | | | $ | 25,000,137 | |
| | | | |
| | | | | | | | | | | | |
| Net Assets Consist of | | | | | | | | | | | | |
Paid-in capital | | $ | 24,986,680 | | | $ | 14,991,823 | | | $ | 24,980,346 | |
Undistributed net investment income | | | 23,019 | | | | 2,780 | | | | 21,102 | |
Accumulated net realized gain | | | 5,547 | | | | 1,149 | | | | 806 | |
Net unrealized appreciation/depreciation | | | 16,806 | | | | 609 | | | | (2,117 | ) |
| | | | |
Net Assets | | $ | 25,032,052 | | | $ | 14,996,361 | | | $ | 25,000,137 | |
| | | | |
1 Investments at cost — unaffiliated | | $ | 22,453,260 | | | $ | 13,310,948 | | | $ | 21,578,321 | |
2 Investments at cost — affiliated | | $ | 40,314 | | | $ | 438 | | | $ | 782 | |
3 Repurchase agreements at cost | | $ | 2,450,000 | | | $ | 1,994,000 | | | $ | 3,600,000 | |
See Notes to Financial Statements.
| | | | | | |
| | | BLACKROCK FUNDS | | JANUARY 31, 2015 | | 19 |
| | |
| Statements of Assets and Liabilities (concluded) | | |
| | | | | | | | | | | | |
| January 31, 2015 (Unaudited) | | BlackRock
Short
Obligations
Fund | | | BlackRock
Short-Term
Treasury
Fund | | | BlackRock
Ultra-Short
Obligations
Fund | |
| | | | | | | | | | | | |
| Net Asset Value | | | | | | | | | | | | |
BlackRock | | | | | | | | | | | | |
Net assets | | $ | 15,018,925 | | | | — | | | $ | 15,000,717 | |
| | | | |
Shares outstanding4 | | | 1,500,450 | | | | — | | | | 1,500,060 | |
| | | | |
Net asset value | | $ | 10.01 | | | | — | | | $ | 10.00 | |
| | | | |
| | | | | | | | | | | | |
Institutional | | | | | | | | | | | | |
Net assets | | $ | 10,013,127 | | | | — | | | $ | 9,999,420 | |
| | | | |
Shares outstanding4 | | | 1,000,801 | | | | — | | | | 1,000,000 | |
| | | | |
Net asset value | | $ | 10.01 | | | | — | | | $ | 10.00 | |
| | | | |
| | | | | | | | | | | | |
Institutional Daily | | | | | | | | | | | | |
Net assets | | | — | | | $ | 14,996,361 | | | | — | |
| | | | |
Shares outstanding4 | | | — | | | | 1,500,000 | | | | — | |
| | | | |
Net asset value | | | — | | | $ | 10.00 | | | | — | |
| | | | |
| | 4 | | Unlimited number of shares authorized, $ 0.001 par value. |
See Notes to Financial Statements.
| | | | | | |
| 20 | | BLACKROCK FUNDS | | JANUARY 31, 2015 | | |
| | | | | | | | | | | | |
| Six Months Ended January 31, 2015 | | BlackRock
Short
Obligations
Fund | | | BlackRock
Short-Term
Treasury
Fund | | | BlackRock
Ultra-Short
Obligations
Fund | |
| | | | | | | | | | | | |
| Investment Income | | | | | | | | | | | | |
Interest — unaffiliated | | $ | 78,397 | | | $ | 5,114 | | | $ | 55,460 | |
Interest — affiliated | | | 13 | | | | — | | | | 77 | |
| | | | |
Total Income | | | 78,410 | | | | 5,114 | | | | 55,537 | |
| | | | |
| | | | | | | | | | | | |
| Expenses | | | | | | | | | | | | |
Investment advisory | | | 31,555 | | | | 18,899 | | | | 31,512 | |
Professional | | | 40,604 | | | | 44,001 | | | | 51,483 | |
Administration | | | 9,912 | | | | 6,388 | | | | 9,898 | |
Administration — BlackRock | | | 1,829 | | | | — | | | | 1,827 | |
Administration — Institutional | | | 1,220 | | | | — | | | | 1,218 | |
Administration — Institutional Daily | | | — | | | | 1,826 | | | | — | |
Registration | | | 13,197 | | | | 13,417 | | | | 13,197 | |
Officer and Trustees | | | 1,883 | | | | 1,792 | | | | 1,884 | |
Custodian | | | 631 | | | | 9,609 | | | | 3,082 | |
Transfer agent — BlackRock | | | 30 | | | | — | | | | 33 | |
Transfer agent — Institutional | | | 30 | | | | — | | | | 29 | |
Transfer agent — Institutional Daily | | | — | | | | 30 | | | | — | |
Printing | | | 15,419 | | | | 8,937 | | | | 15,413 | |
Miscellaneous | | | 4,045 | | | | 3,829 | | | | 3,976 | |
| | | | |
Total expenses | | | 120,355 | | | | 108,728 | | | | 133,552 | |
Less fees waived by Manager | | | (31,555 | ) | | | (18,899 | ) | | | (31,512 | ) |
Less administration fees waived | | | (8,776 | ) | | | (5,256 | ) | | | (8,763 | ) |
Less administration fees waived — BlackRock | | | (1,829 | ) | | | — | | | | (1,827 | ) |
Less administration fees waived — Institutional Daily | | | — | | | | (1,826 | ) | | | — | |
Less transfer agent fees waived — BlackRock | | | (12 | ) | | | — | | | | (12 | ) |
Less transfer agent fees waived — Institutional Daily | | | — | | | | (19 | ) | | | — | |
Less transfer agent fees reimbursed — BlackRock | | | (18 | ) | | | — | | | | (21 | ) |
Less transfer agent fees reimbursed — Institutional Daily | | | — | | | | (11 | ) | | | — | |
Less expenses reimbursed by Manager | | | (63,990 | ) | | | (78,385 | ) | | | (77,255 | ) |
| | | | |
Total expenses after fees waived and reimbursed | | | 14,175 | | | | 4,332 | | | | 14,162 | |
| | | | |
Net investment income | | | 64,235 | | | | 782 | | | | 41,375 | |
| | | | |
| | | | | | | | | | | | |
| Realized and Unrealized Gain (Loss) | | | | | | | | | | | | |
Net realized gain from investments | | | 4,101 | | | | 390 | | | | 376 | |
Net change in unrealized appreciation/depreciation | | | (21,299 | ) | | | (313 | ) | | | (4,101 | ) |
| | | | |
Net realized and unrealized gain (loss) | | | (17,198 | ) | | | 77 | | | | (3,725 | ) |
| | | | |
Net Increase in Net Assets Resulting from Operations | | $ | 47,037 | | | $ | 859 | | | $ | 37,650 | |
| | | | |
See Notes to Financial Statements.
| | | | | | |
| | | BLACKROCK FUNDS | | JANUARY 31, 2015 | | 21 |
| | |
| Statements of Changes in Net Assets | | |
| | | | | | | | | | | | | | | | |
| | | BlackRock
Short
Obligations
Fund | | | BlackRock
Short-Term
Treasury
Fund | |
| Increase (Decrease) in Net Assets: | | Six Months
Ended
January 31,
2015
(Unaudited) | | | Year Ended
July 31, 2014 | | | Six Months
Ended
January 31,
2015 (Unaudited) | | | Year Ended
July 31, 2014 | |
| | | | | | | | | | | | | | | | |
| Operations | | | | | | | | | | | | | | | | |
Net investment income | | $ | 64,235 | | | $ | 119,416 | | | $ | 782 | | | $ | 1,518 | |
Net realized gain | | | 4,101 | | | | 1,446 | | | | 390 | | | | 759 | |
Net change in unrealized appreciation/depreciation | | | (21,299 | ) | | | 18,722 | | | | (313 | ) | | | (814 | ) |
| | | | | | | | |
Net increase in net assets resulting from operations | | | 47,037 | | | | 139,584 | | | | 859 | | | | 1,463 | |
| | | | | | | | |
| | | | | | | | | | | | | | | | |
| Distributions to Shareholders From1 | | | | | | | | | | | | | | | | |
Net investment income: | | | | | | | | | | | | | | | | |
BlackRock | | | (39,287 | ) | | | (72,341 | ) | | | — | | | | — | |
Institutional | | | (24,948 | ) | | | (45,436 | ) | | | — | | | | — | |
Institutional Daily | | | — | | | | — | | | | (782 | ) | | | (6,902 | ) |
Net realized gain: | | | | | | | | | | | | | | | | |
BlackRock | | | — | | | | (1,007 | ) | | | — | | | | — | |
Institutional | | | — | | | | (632 | ) | | | — | | | | — | |
Institutional Daily | | | — | | | | — | | | | — | | | | (16 | ) |
| | | | | | | | |
Decrease in net assets resulting from distributions to shareholders | | | (64,235 | ) | | | (119,416 | ) | | | (782 | ) | | | (6,918 | ) |
| | | | | | | | |
| | | | | | | | | | | | | | | | |
| Capital Share Transactions | | | | | | | | | | | | | | | | |
Net increase in net assets derived from capital share transactions | | | 8,013 | | | | — | | | | — | | | | — | |
| | | | | | | | |
| | | | | | | | | | | | | | | | |
| Net Assets | | | | | | | | | | | | | | | | |
Total increase (decrease) in net assets | | | (9,185 | ) | | | 20,168 | | | | 77 | | | | (5,455 | ) |
Beginning of period | | | 25,041,237 | | | | 25,021,069 | | | | 14,996,284 | | | | 15,001,739 | |
| | | | | | | | |
End of period | | $ | 25,032,052 | | | $ | 25,041,237 | | | $ | 14,996,361 | | | $ | 14,996,284 | |
| | | | | | | | |
Undistributed net investment income, end of period | | $ | 23,019 | | | $ | 23,019 | | | $ | 2,780 | | | $ | 2,780 | |
| | | | | | | | |
| | 1 | | Distributions for annual periods determined in accordance with federal income tax regulations. |
See Notes to Financial Statements.
| | | | | | |
| 22 | | BLACKROCK FUNDS | | JANUARY 31, 2015 | | |
| | |
| Statements of Changes in Net Assets (concluded) | | |
| | | | | | | | |
| | | BlackRock
Ultra-Short
Obligations
Fund | |
| Increase (Decrease) in Net Assets: | | Six Months
Ended
January 31,
2015
(Unaudited) | | | Year Ended
July 31, 2014 | |
| | | | | | | | |
| Operations | | | | | | | | |
Net investment income | | $ | 41,375 | | | $ | 87,646 | |
Net realized gain | | | 376 | | | | 430 | |
Net change in unrealized appreciation/depreciation | | | (4,101 | ) | | | (1,054 | ) |
| | | | |
Net increase in net assets resulting from operations | | | 37,650 | | | | 87,022 | |
| | | | |
| | | | | | | | |
| Distributions to Shareholders From1 | | | | | | | | |
Net investment income: | | | | | | | | |
BlackRock | | | (25,499 | ) | | | (53,281 | ) |
Institutional | | | (15,876 | ) | | | (32,917 | ) |
Net realized gain: | | | | | | | | |
BlackRock | | | — | | | | (895 | ) |
Institutional | | | — | | | | (553 | ) |
| | | | |
Decrease in net assets resulting from distributions to shareholders | | | (41,375 | ) | | | (87,646 | ) |
| | | | |
| | | | | | | | |
| Capital Share Transactions | | | | | | | | |
Net increase (decrease) in net assets derived from capital share transactions | | | — | | | | — | |
| | | | |
| | | | | | | | |
| Net Assets | | | | | | | | |
Total decrease in net assets | | | (3,725 | ) | | | (624 | ) |
Beginning of period | | | 25,003,862 | | | | 25,004,486 | |
| | | | |
End of period | | $ | 25,000,137 | | | $ | 25,003,862 | |
| | | | |
Undistributed net investment income, end of period | | $ | 21,102 | | | $ | 21,102 | |
| | | | |
| | 1 | | Distributions for annual periods determined in accordance with federal income tax regulations. |
See Notes to Financial Statements.
| | | | | | |
| | | BLACKROCK FUNDS | | JANUARY 31, 2015 | | 23 |
| | | | |
| Financial Highlights | | | BlackRock Short Obligations Fund | |
| | | | | | | | | | | | |
| | | BlackRock | |
| | | Six Months
Ended
January 31,
2015 (Unaudited) | | | Year Ended
July 31,
2014 | | | Period
November 15, 20121 to July 31, 2013 | |
| | | | | | | | | | | | |
| Per Share Operating Performance | | | | | | | | | | | | |
Net asset value, beginning of period | | $ | 10.02 | | | $ | 10.01 | | | $ | 10.00 | |
| | | | |
Net investment income2 | | | 0.03 | | | | 0.05 | | | | 0.03 | |
Net realized and unrealized gain | | | 0.00 | 3 | | | 0.00 | 3 | | | 0.01 | |
| | | | |
Net increase from investment operations | | | 0.03 | | | | 0.05 | | | | 0.04 | |
| | | | |
Distributions from:4 | | | | | | | | | | | | |
Net investment income | | | (0.04 | ) | | | (0.04 | ) | | | (0.03 | ) |
Net realized gain | | | — | | | | (0.00 | )5 | | | (0.00 | )5 |
| | | | |
Total distributions | | | (0.04 | ) | | | (0.04 | ) | | | (0.03 | ) |
| | | | |
Net asset value, end of period | | $ | 10.01 | | | $ | 10.02 | | | $ | 10.01 | |
| | | | |
| | | | | | | | | | | | |
| Total Return6 | | | | | | | | | | | | |
Based on net asset value | | | 0.17 | %7 | | | 0.59 | % | | | 0.43 | %7 |
| | | | |
| | | | | | | | | | | | |
| Ratios to Average Net Assets | | | | | | | | | | | | |
Total expenses | | | 0.95 | %8 | | | 1.15 | % | | | 1.00 | %8,9 |
| | | | |
Total expenses after fees waived and reimbursed | | | 0.10 | %8 | | | 0.10 | % | | | 0.13 | %8 |
| | | | |
Net investment income | | | 0.52 | %8 | | | 0.49 | % | | | 0.46 | %8 |
| | | | |
| | | | | | | | | | | | |
| Supplemental Data | | | | | | | | | | | | |
Net assets, end of period (000) | | $ | 15,019 | | | $ | 15,029 | | | $ | 15,017 | |
| | | | |
Portfolio turnover rate | | | 23 | % | | | 50 | % | | | 35 | % |
| | | | |
| | 1 | | Commencement of operations. |
| | 2 | | Based on average shares outstanding. |
| | 3 | | Amount is less than $0.005 per share. |
| | 4 | | Distributions for annual periods determined in accordance with federal income tax regulations. |
| | 5 | | Amount is greater than $(0.005) per share. |
| | 6 | | Where applicable, assumes the reinvestment of distributions. |
| | 7 | | Aggregate total return. |
| | 9 | | Organization costs were not annualized in the calculation of the expense ratio. If these expenses were annualized, the total expenses for BlackRock Shares would have been 1.00%. |
See Notes to Financial Statements.
| | | | | | |
| 24 | | BLACKROCK FUNDS | | JANUARY 31, 2015 | | |
| | | | |
| Financial Highlights (concluded) | | | BlackRock Short Obligations Fund | |
| | | | | | | | | | | | |
| | | Institutional | |
| | | Six Months
Ended
January 31,
2015
(Unaudited) | | | Year Ended
July 31,
2014 | | | Period
July 9, 20131 to
July 31, 2013 | |
| | | | | | | | | | | | |
| Per Share Operating Performance | | | | | | | | | | | | |
Net asset value, beginning of period | | $ | 10.01 | | | $ | 10.00 | | | $ | 10.00 | |
| | | | |
Net investment income2 | | | 0.03 | | | | 0.05 | | | | 0.00 | 3 |
Net realized and unrealized gain | | | 0.00 | 3 | | | 0.00 | 3 | | | 0.00 | 3 |
| | | | |
Net increase from investment operations | | | 0.03 | | | | 0.05 | | | | 0.00 | |
| | | | |
Distributions from:4 | | | | | | | | | | | | |
Net investment income | | | (0.03 | ) | | | (0.04 | ) | | | (0.00 | )5 |
Net realized gain | | | — | | | | (0.00 | )5 | | | (0.00 | )5 |
| | | | |
Total distributions | | | (0.03 | ) | | | (0.04 | ) | | | 0.00 | |
| | | | |
Net asset value, end of period | | $ | 10.01 | | | $ | 10.01 | | | $ | 10.00 | |
| | | | |
| | | | | | | | | | | | |
| Total Return6 | | | | | | | | | | | | |
Based on net asset value | | | 0.25 | %7 | | | 0.56 | % | | | 0.03 | %7 |
| | | | |
| | | | | | | | | | | | |
| Ratios to Average Net Assets | | | | | | | | | | | | |
Total expenses | | | 0.95 | %8 | | | 1.15 | % | | | 1.53 | %8,9 |
| | | | |
Total expenses after fees waived and reimbursed | | | 0.13 | %8 | | | 0.13 | % | | | 0.13 | %8 |
| | | | |
Net investment income | | | 0.49 | %8 | | | 0.46 | % | | | 0.51 | %8 |
| | | | |
| | | | | | | | | | | | |
| Supplemental Data | | | | | | | | | | | | |
Net assets, end of period (000) | | $ | 10,013 | | | $ | 10,012 | | | $ | 10,004 | |
| | | | |
Portfolio turnover rate | | | 23 | % | | | 50 | % | | | 35 | % |
| | | | |
| | 1 | | Commencement of operations. |
| | 2 | | Based on average shares outstanding. |
| | 3 | | Amount is less than $0.005 per share. |
| | 4 | | Distributions for annual periods determined in accordance with federal income tax regulations. |
| | 5 | | Amount is greater than $(0.005) per share. |
| | 6 | | Where applicable, assumes the reinvestment of distributions. |
| | 7 | | Aggregate total return. |
| | 9 | | Organization costs were not annualized in the calculation of the expense ratio. If these expenses were annualized, the total expenses for Institutional Shares would have been 1.53%. |
See Notes to Financial Statements.
| | | | | | |
| | | BLACKROCK FUNDS | | JANUARY 31, 2015 | | 25 |
| | | | |
| Financial Highlights | | | BlackRock Short-Term Treasury Fund | |
| | | | | | | | | | | | |
| | | Institutional Daily | |
| | | Six Months
Ended
January 31,
2015 (Unaudited) | | | Year Ended
July 31,
2014 | | | Period
November 15, 20121 to July 31, 2013 | |
| | | | | | | | | | | | |
| Per Share Operating Performance | | | | | | | | | | | | |
Net asset value, beginning of period | | $ | 10.00 | | | $ | 10.00 | | | $ | 10.00 | |
| | | | |
Net investment income2 | | | 0.00 | 3 | | | 0.00 | 3 | | | 0.00 | 3 |
Net realized and unrealized gain | | | 0.00 | 3 | | | 0.00 | 3 | | | 0.00 | 3 |
| | | | |
Net increase from investment operations | | | 0.00 | | | | 0.00 | | | | 0.00 | |
| | | | |
Distributions from:4 | | | | | | | | | | | | |
Net investment income | | | (0.00 | )5 | | | (0.00 | )5 | | | (0.00 | )5 |
Net realized gain | | | — | | | | (0.00 | )5 | | | (0.00 | )5 |
| | | | |
Total distributions | | | 0.00 | | | | 0.00 | | | | 0.00 | |
| | | | |
Net asset value, end of period | | $ | 10.00 | | | $ | 10.00 | | | $ | 10.00 | |
| | | | |
| | | | | | | | | | | | |
| Total Return6 | | | | | | | | | | | | |
Based on net asset value | | | 0.01 | %7 | | | 0.05 | % | | | 0.01 | %7 |
| | | | |
| | | | | | | | | | | | |
| Ratios to Average Net Assets | | | | | | | | | | | | |
Total expenses | | | 1.44 | %8 | | | 1.55 | % | | | 1.64 | %8,9 |
| | | | |
Total expenses after fees waived and reimbursed | | | 0.06 | %8 | | | 0.07 | % | | | 0.11 | %8 |
| | | | |
Net investment income | | | 0.01 | %8 | | | 0.01 | % | | | 0.01 | %8 |
| | | | |
| | | | |
| Supplemental Data | | | | | | | | | | | | |
Net assets, end of period (000) | | $ | 14,996 | | | $ | 14,996 | | | $ | 15,002 | |
| | | | |
Portfolio turnover rate | | | 130 | % | | | 33 | % | | | 0 | % |
| | | | |
| | 1 | | Commencement of operations. |
| | 2 | | Based on average shares outstanding. |
| | 3 | | Amount is less than $0.005 per share. |
| | 4 | | Distributions for annual periods determined in accordance with federal income tax regulations. |
| | 5 | | Amount is greater than $(0.005) per share. |
| | 6 | | Where applicable, assumes the reinvestment of distributions. |
| | 7 | | Aggregate total return. |
| | 9 | | Organization costs were not annualized in the calculation of the expense ratio. If these expenses were annualized, the total expenses for Institutional Daily Shares would have been 1.65%. |
See Notes to Financial Statements.
| | | | | | |
| 26 | | BLACKROCK FUNDS | | JANUARY 31, 2015 | | |
| | | | |
| Financial Highlights | | | BlackRock Ultra-Short Obligations Fund | |
| | | | | | | | | | | | |
| | | BlackRock | |
| | | Six Months
Ended
January 31,
2015
(Unaudited) | | | Year Ended
July 31,
2014 | | | Period
November 15, 20121 to July 31, 2013 | |
| | | | | | | | | | | | |
| Per Share Operating Performance | | | | | | | | | | | | |
Net asset value, beginning of period | | $ | 10.00 | | | $ | 10.00 | | | $ | 10.00 | |
| | | | |
Net investment income2 | | | 0.02 | | | | 0.04 | | | | 0.03 | |
Net realized and unrealized gain | | | 0.00 | 3 | | | 0.00 | 3 | | | 0.00 | 3 |
| | | | |
Net increase from investment operations | | | 0.02 | | | | 0.04 | | | | 0.03 | |
| | | | |
Distributions from:4 | | | | | | | | | | | | |
Net investment income | | | (0.02 | ) | | | (0.04 | ) | | | (0.03 | ) |
Net realized gain | | | — | | | | (0.00 | )5 | | | (0.00 | )5 |
| | | | |
Total distributions | | | (0.02 | ) | | | (0.04 | ) | | | (0.03 | ) |
| | | | |
Net asset value, end of period | | $ | 10.00 | | | $ | 10.00 | | | $ | 10.00 | |
| | | | |
| | | | | | | | | | | | |
| Total Return6 | | | | | | | | | | | | |
Based on net asset value | | | 0.19 | %7 | | | 0.36 | % | | | 0.25 | %7 |
| | | | |
| | | | | | | | | | | | |
| Ratios to Average Net Assets8 | | | | | | | | | | | | |
Total expenses | | | 1.06 | %8 | | | 1.17 | % | | | 0.99 | %8,9 |
| | | | |
Total expenses after fees waived and reimbursed | | | 0.10 | %8 | | | 0.10 | % | | | 0.12 | %8 |
| | | | |
Net investment income | | | 0.34 | %8 | | | 0.36 | % | | | 0.36 | %8 |
| | | | |
| | | | | | | | | | | | |
| Supplemental Data | | | | | | | | | | | | |
Net assets, end of period (000) | | $ | 15,001 | | | $ | 15,003 | | | $ | 15,003 | |
| | | | |
Portfolio turnover rate | | | 37 | % | | | 129 | % | | | 91 | % |
| | | | |
| | 1 | | Commencement of operations. |
| | 2 | | Based on average shares outstanding. |
| | 3 | | Amount is less than $0.005 per share. |
| | 4 | | Distributions for annual periods determined in accordance with federal income tax regulations. |
| | 5 | | Amount is greater than $(0.005) per share. |
| | 6 | | Where applicable, assumes the reinvestment of distributions. |
| | 7 | | Aggregate total return. |
| | 9 | | Organization costs were not annualized in the calculation of the expense ratio. If these expenses were annualized, the total expenses for BlackRock Shares would have been 0.99%. |
See Notes to Financial Statements.
| | | | | | |
| | | BLACKROCK FUNDS | | JANUARY 31, 2015 | | 27 |
| | | | |
| Financial Highlights (concluded) | | | BlackRock Ultra-Short Obligations Fund | |
| | | | | | | | | | | | |
| | | Institutional | |
| | | Six Months
Ended
January 31,
2015
(Unaudited) | | | Year Ended
July 31, 2014 | | | Period
July 9, 20131 to
July 31, 2013 | |
| | | | | | | | | | | | |
| Per Share Operating Performance | | | | | | | | | | | | |
Net asset value, beginning of period | | $ | 10.00 | | | $ | 10.00 | | | $ | 10.00 | |
| | | | |
Net investment income2 | | | 0.02 | | | | 0.03 | | | | 0.00 | 3 |
Net realized and unrealized gain | | | 0.00 | 3 | | | 0.00 | 3 | | | 0.00 | 3 |
| | | | |
Net increase from investment operations | | | 0.02 | | | | 0.03 | | | | 0.00 | |
| | | | |
Distributions from:4 | | | | | | | | | | | | |
Net investment income | | | (0.02 | ) | | | (0.03 | ) | | | (0.00 | )5 |
Net realized gain | | | — | | | | (0.00 | )5 | | | (0.00 | )5 |
| | | | |
Total distributions | | | (0.02 | ) | | | (0.03 | ) | | | 0.00 | |
| | | | |
Net asset value, end of period | | $ | 10.00 | | | $ | 10.00 | | | $ | 10.00 | |
| | | | |
| | | | | | | | | | | | |
| Total Return6 | | | | | | | | | | | | |
Based on net asset value | | | 0.18 | %7 | | | 0.34 | % | | | 0.02 | %7 |
| | | | |
| | | | | | | | | | | | |
| Ratios to Average Net Assets | | | | | | | | | | | | |
Total expenses | | | 1.06 | %8 | | | 1.17 | %8 | | | 1.32 | %8,9 |
| | | | |
Total expenses after fees waived and reimbursed | | | 0.13 | %8 | | | 0.13 | %8 | | | 0.13 | %8 |
| | | | |
Net investment income | | | 0.31 | %8 | | | 0.33 | %8 | | | 0.38 | %8 |
| | | | |
| | | | | | | | | | | | |
| Supplemental Data | | | | | | | | | | | | |
Net assets, end of period (000) | | $ | 9,999 | | | $ | 10,001 | | | $ | 10,001 | |
| | | | |
Portfolio turnover rate | | | 37 | % | | | 129 | % | | | 91 | % |
| | | | |
| | 1 | | Commencement of operations. |
| | 2 | | Based on average shares outstanding. |
| | 3 | | Amount is less than $0.005 per share. |
| | 4 | | Distributions for annual periods determined in accordance with federal income tax regulations. |
| | 5 | | Amount is greater than $(0.005) per share. |
| | 6 | | Where applicable, assumes the reinvestment of distributions. |
| | 7 | | Aggregate total return. |
| | 9 | | Organization costs were not annualized in the calculation of the expense ratio. If these expenses were annualized, the total expenses for Institutional Shares would have been 1.32%. |
See Notes to Financial Statements.
| | | | | | |
| 28 | | BLACKROCK FUNDS | | JANUARY 31, 2015 | | |
| | |
| Notes to Financial Statements (Unaudited) | | |
1. Organization:
BlackRock FundsSM (the “Trust”), is registered under the Investment Company Act of 1940, as amended (the “1940 Act”), as an open-end management investment company. The Trust is organized as a Massachusetts business trust. BlackRock Short Obligations Fund (“Short Obligations”), BlackRock Short-Term Treasury Fund (“Short-Term Treasury”) and BlackRock Ultra-Short Obligations Fund (“Ultra-Short Obligations”) (collectively, the “Funds” or individually, a “Fund”) are each a series of the Trust. Each of the Funds is classified as diversified.
Each fund offers multiple classes of shares. BlackRock, Institutional and Institutional Daily Shares are sold without a sales charge and only to certain eligible investors. The BlackRock and Institutional Shares of Short Obligations and Ultra-Short Obligations and the Institutional and Institutional Daily Shares of Short-Term Treasury have equal voting, dividend, liquidation and other rights, except that only shares of the respective classes are entitled to vote on matters concerning only that class.
2. Significant Accounting Policies:
The Funds’ financial statements are prepared in conformity with accounting principles generally accepted in the United States of America (“U.S. GAAP”), which may require management to make estimates and assumptions that affect the reported amounts of assets and liabilities in the financial statements and the reported amounts of increases and decreases in net assets from operations during the reporting period. Actual results could differ from those estimates. Each Fund is considered an investment company under U.S. GAAP and follows the accounting and reporting guidance applicable to investment companies. The following is a summary of significant accounting policies followed by the Funds:
Valuation: U.S. GAAP defines fair value as the price the Funds would receive to sell an asset or pay to transfer a liability in an orderly transaction between market participants at the measurement date. The Funds determine the fair value of their financial instruments at market value using independent dealers or pricing services under policies approved by the Board of Trustees of the Trust (the “Board”). The BlackRock Global Valuation Methodologies Committee (the “Global Valuation Committee”) is the committee formed by management to develop global pricing policies and procedures and to provide oversight of the pricing function for the Funds for all financial instruments.
Bond investments are valued on the basis of last available bid prices or current market quotations provided by dealers or pricing services. In determining the value of a particular investment, pricing services may use certain information with respect to transactions in such investments, quotations from dealers, pricing matrixes, market transactions in comparable investments, various relationships observed in the market between investments and calculated yield measures. Asset-backed and mortgage-backed securities are valued by independent pricing services using models that consider estimated cash flows of each tranche of the security, establish a benchmark yield and develop an estimated tranche-specific spread to the benchmark yield based on the unique attributes of the tranche. Investments in open-end registered investment companies are valued at net asset value (“NAV”) each business day.
In the event that the application of these methods of valuation results in a price for an investment that is deemed not to be representative of the market value of such investment, or if a price is not available, the investment will be valued by the Global Valuation Committee, or its delegate, in accordance with a policy approved by the Board as reflecting fair value (“Fair Value Assets”). When determining the price for Fair Value Assets, the Global Valuation Committee, or its delegate, seeks to determine the price that each Fund might reasonably expect to receive from the current sale of that asset in an arm’s-length transaction. Fair value determinations shall be based upon all available factors that the Global Valuation Committee, or its delegate, deems relevant consistent with the principles of fair value measurement. The pricing of all Fair Value Assets is subsequently reported to the Board or a committee thereof on a quarterly basis.
Investment Transactions and Investment Income: For financial reporting purposes, investment transactions are recorded on the dates the transactions are entered into (the trade dates). Realized gains and losses on investment transactions are determined on the identified cost basis. Interest income, including amortization and accretion of premiums and discounts on debt securities, is recognized on the accrual basis. Income, expenses and realized and unrealized gains and losses are allocated daily to each class based on its relative net assets.
Distributions: Distributions from net investment income are declared daily and paid monthly. Distributions of capital gains are recorded on the ex-dividend dates. The character and timing of distributions are determined in accordance with federal income tax regulations, which may differ from U.S. GAAP.
Recent Accounting Standard: In June 2014, the Financial Accounting Standards Board issued guidance to improve the financial reporting of reverse repurchase agreements and other similar transactions. The guidance will require expanded disclosure requirements for entities that enter into reverse repurchase agreements and similar transactions accounted for as secured borrowings. It is effective for financial statements with fiscal years beginning
| | | | | | |
| | | BLACKROCK FUNDS | | JANUARY 31, 2015 | | 29 |
| | |
| Notes to Financial Statements (continued) | | |
on or after December 15, 2014 and interim periods within those fiscal years. Management is evaluating the impact, if any, of this guidance on the Funds’ financial statement disclosures.
Other: Expenses directly related to a Fund or its classes are charged to that Fund or the applicable class. Other operating expenses shared by several funds are prorated among those funds on the basis of relative net assets or other appropriate methods. Expenses directly related to the Funds and other shared expenses prorated to the Funds are allocated daily to each class based on its relative net assets or other appropriate methods.
The Funds have an arrangement with the custodian whereby fees may be reduced by credits earned on uninvested cash balances, which, if applicable, are shown as fees paid indirectly in the Statements of Operations. The custodian imposes fees on overdrawn cash balances, which can be offset by accumulated credits earned or may result in additional custody charges.
3. Securities and Other Investments:
Asset-Backed and Mortgage-Backed Securities: The Funds may invest in asset-backed securities. Asset-backed securities are generally issued as pass-through certificates, which represent undivided fractional ownership interests in an underlying pool of assets, or as debt instruments, which are also known as collateralized obligations, and are generally issued as the debt of a special purpose entity organized solely for the purpose of owning such assets and issuing such debt. Asset-backed securities are often backed by a pool of assets representing the obligations of a number of different parties. The yield characteristics of certain asset-backed securities may differ from traditional debt securities. One such major difference is that all or a principal part of the obligations may be prepaid at any time because the underlying assets (i.e., loans) may be prepaid at any time. As a result, a decrease in interest rates in the market may result in increases in the level of prepayments as borrowers, particularly mortgagors, refinance and repay their loans. An increased prepayment rate with respect to an asset-backed security subject to such a prepayment feature will have the effect of shortening the maturity of the security. In addition, the Funds may subsequently have to reinvest the proceeds at lower interest rates. If the Funds have purchased such an asset-backed security at a premium, a faster than anticipated prepayment rate could result in a loss of principal to the extent of the premium paid.
The Funds may purchase certain mortgage pass-through securities. There are a number of important differences among the agencies and instrumentalities of the U.S. government that issue mortgage-related securities and among the securities that they issue. For example, mortgage-related securities guaranteed by Ginnie Mae are guaranteed as to the timely payment of principal and interest by Ginnie Mae and such guarantee is backed by the full faith and credit of the United States. However, mortgage-related securities issued by Freddie Mac and Fannie Mae, including Freddie Mac and Fannie Mae guaranteed mortgage pass-through certificates, which are solely the obligations of Freddie Mac and Fannie Mae, are not backed by or entitled to the full faith and credit of the United States, but are supported by the right of the issuer to borrow from the Treasury.
Repurchase Agreements: The Funds may enter into repurchase agreements. In a repurchase agreement, a Fund purchases a security from a counterparty who agrees to repurchase the same security at a mutually agreed upon date and price. On a daily basis, the counterparty is required to maintain collateral subject to the agreement and in value no less than the agreed repurchase amount. The agreements are conditioned upon the collateral being deposited under the Federal Reserve book entry system or held in a segregated account by a Fund’s custodian or designated sub-custodians under tri-party repurchase agreements.
In the event the counterparty defaults and the fair value of the collateral declines, the Funds could experience losses, delays and costs in liquidating the collateral.
Repurchase agreements are entered into by the Fund under Master Repurchase Agreements (each, an “MRA”). The MRA permits the Funds, under certain circumstances including an event of default (such as bankruptcy or insolvency), to offset payables and/or receivables with collateral held by and/or posted to the counterparty. As a result, one single net payment is created. Bankruptcy or insolvency laws of a particular jurisdiction may impose restrictions on or prohibitions against such a right of offset in the event of the MRA counterparty’s bankruptcy or insolvency. Based on the terms of the MRA, the Funds receive securities as collateral with a market value in excess of the repurchase price at maturity. Upon a bankruptcy or insolvency of the MRA counterparty, the Funds would recognize a liability with respect to such excess collateral. The liability reflects the Fund’s obligation under bankruptcy law to return the excess to the counterparty.
| | | | | | |
| 30 | | BLACKROCK FUNDS | | JANUARY 31, 2015 | | |
| | |
Notes to Financial Statements (continued) | | |
4. Investment Advisory Agreement and Other Transactions with Affiliates:
The PNC Financial Services Group, Inc. is the largest stockholder and an affiliate, for 1940 Act purposes, of BlackRock, Inc. (“BlackRock”).
The Trust, on behalf of the Funds, entered into an Investment Advisory Agreement with the Manager, the Funds’ investment advisor, an indirect, wholly owned subsidiary of BlackRock, to provide investment advisory and administration services. The Manager is responsible for the management of each Fund’s portfolio and provides the necessary personnel, facilities, equipment and certain other services necessary to the operations of each Fund. For such services, each Fund pays the Manager a monthly fee based on a percentage of each Fund’s average daily net assets at the following annual rates:
| | | | |
| Average Daily Net Assets | | Investment
Advisory
Fee | |
First $1 billion | | | 0.250 | % |
$1 billion - $3 billion | | | 0.240 | % |
$3 billion - $5 billion | | | 0.230 | % |
$5 billion - $10 billion | | | 0.220 | % |
Greater than $10 billion | | | 0.210 | % |
The Manager voluntarily agreed to waive its investment advisory fees by the amount of investment advisory fees each Fund pays to the Manager indirectly through its investment in affiliated money market funds. However, the Manager does not waive its investment advisory fees by the amount of investment advisory fees paid in connection with each Fund’s investment in other affiliated investment companies, if any. These amounts are included in expenses reimbursed by Manager in the Statements of Operations. For the period ended January 31, 2015, the Manager reimbursed $21 and $74 for Short Obligations and Ultra-Short Obligations, respectively.
Pursuant to written agreements, certain financial intermediaries, some of which may be affiliates, provide the Funds with sub-accounting, recordkeeping, sub-transfer agency and other administrative services with respect to sub-accounts they service. For these services, these entities receive an asset-based fee or an annual fee per shareholder account, which will vary depending on share class and/or net assets.
The Manager maintains a call center, which is responsible for providing certain shareholder services to the Funds, such as responding to shareholder inquiries and processing transactions based upon instructions from shareholders with respect to the subscription and redemption of Fund shares.
Effective January 1, 2015, the Trust, on behalf of the Funds, entered into an Administration Agreement with the Manager, an indirect, wholly owned subsidiary of BlackRock, to provide administrative services. For these services, the Manager receives an administration fee computed daily and payable monthly, based on a percentage of the average daily net assets of the Funds. The administration fee, which is shown as administration in the Statement of Operations, is paid at the below annual rates. In addition, each of the share classes is charged an administration fee, which is shown as administration — class specific in the Statement of Operations, at an annual rate of 0.02% of the average daily net assets of each respective class.
| | | | |
| Average Daily Net Assets | | Administration Fee | |
First $500 Million | | | 0.0425 | % |
$500 Million - $1 Billion | | | 0.0400 | % |
$1 Billion - $2 Billion | | | 0.0375 | % |
$2 Billion - $4 Billion | | | 0.0350 | % |
$4 Billion - $13 Billion | | | 0.0325 | % |
Greater than $13 Billion | | | 0.0300 | % |
Prior to January 1, 2015, BNY Mellon Investment Servicing (U.S.) Inc. (“BNYMIS”) and the Manager acted as co-administrators for the Funds. For these services, the co-administrators received an administration fee computed daily and payable monthly to each administrator pursuant to separate fee arrangements, based on a percentage of the average daily net assets of each Fund. The combined administration fee, which is shown as administration in the Statements of Operations, was paid at the annual rates below. In addition, each of the share classes was charged an administration fee, which is shown as administration — class specific in the Statement of Operations, based on the following percentages of average daily net assets of each respective class:
| | | | | | | | |
| Average Daily Net Assets | | Administration
Fee | | | Administration
Fee —
Class Specific | |
First $500 Million | | | 0.075 | % | | | 0.025 | % |
$500 Million - $1 Billion | | | 0.065 | % | | | 0.015 | % |
Greater than $1 Billion | | | 0.055 | % | | | 0.005 | % |
| | | | | | |
| | | BLACKROCK FUNDS | | JANUARY 31, 2015 | | 31 |
| | |
Notes to Financial Statements (continued) | | |
For the period ended January 31, 2015, the Funds paid the following to the Manager in return for these services, which are included in administration and administration — class specific in the Statements of Operations:
| | | | |
Short Obligations | | $ | 3,049 | |
Short-Term Treasury | | $ | 1,826 | |
Ultra-Short Obligations | | $ | 3,045 | |
BNYMIS and the Manager may have, at their discretion, voluntarily waived all or any portion of their administration fees for a Fund or a share class, which are included in administration fees waived and administration fees waived — class specific in the Statements of Operations.
The Manager contractually or voluntarily agreed to waive and/or reimburse fees or expenses in order to limit expenses, excluding interest expense, dividend expense, tax expense, acquired fund fees and expenses and certain other fund expenses, which constitute extraordinary expenses not incurred in the ordinary course of the Funds’ business. The expense limitations as a percentage of average daily net assets are as follows:
| | | | | | | | | | | | | | | | | | | | |
| | | Short Obligations | | | Short-Term Treasury | | | Ultra-Short Obligations | |
| | | Contractual1 | | | Voluntary2,3 | | | Contractual1 | | | Contractual1 | | | Voluntary2,4 | |
BlackRock | | | 0.30 | % | | | 0.10 | % | | | — | | | | 0.25 | % | | | 0.10 | % |
Institutional | | | 0.35 | % | | | 0.20 | % | | | 0.20 | %5 | | | 0.30 | % | | | 0.20 | % |
Institutional Daily | | | — | | | | — | | | | 0.20 | % | | | — | | | | — | |
| | 1 | | The Manager has agreed not to reduce or discontinue this contractual waiver or reimbursement prior to December 1, 2015 unless approved by the Board, including a majority of the independent trustees, or by a vote of majority of the outstanding voting securities of the Fund. |
| | 2 | | The voluntary waiver or reimbursement may be reduced or discontinued at any time. |
| | 3 | | Prior to December 17, 2012, Short Obligations had a voluntary expense cap of 0.25% and from December 17, 2012 to January 22, 2013 a voluntary expense cap of 0.18% with respect to BlackRock shares. |
| | 4 | | Prior to January 22, 2013, Ultra-Short Obligations had a voluntary expense cap of 0.18% with respect to BlackRock shares. |
| | 5 | | There were no shares outstanding as of January 31, 2015. |
These amounts waived or reimbursed are included in fees waived by Manager and expenses reimbursed by Manager, and shown as administration fees waived — class specific, and transfer agent fees reimbursed — class specific, respectively, in the Statements of Operations. For the period ended Janu-ary 31, 2015, the Manager waived $31,555, 18,899 and $31,512 of investment advisory fees for Short Obligations, Short-Term Treasury and Ultra-Short Obligations, respectively, which are included in fees waived by Manager. The Manager reimbursed expenses of $63,969, $78,385 and $77,181 for Short Obligations, Short-Term Treasury and Ultra-Short Obligations, respectively, which are included in expenses reimbursed by Manager.
If during a Fund’s fiscal year the operating expenses of a share class, that at any time during the prior two fiscal years received a waiver or reimbursement from the Manager, are less than the expense limit for that share class, the Manager is entitled to be reimbursed by such share class up to the lesser of (a) the amount of fees waived or expenses reimbursed during those prior two fiscal years under the agreement and (b) the amount by which the expense limit for that share class exceeds the operating expenses of the share class for the current fiscal year, provided that: (1) the Fund of which the share class is a part has more than $50 million in assets for the fiscal year and (2) the Manager or an affiliate continues to serve as the Fund’s investment advisor or administrator. In the event the expense limit for a share class is changed subsequent to a fiscal year in which the Manager becomes entitled to reimbursement for fees waived or reimbursed, the amount available to reimburse the Manager shall be calculated by reference to the expense limit for that share class in effect at the time the Manager became entitled to receive such reimbursement, rather than the subsequently changed expense limit for that share class.
The Manager voluntarily agreed to waive and/or reimburse fees and/or expenses to enable Short-Term Treasury to maintain minimum levels of daily net investment income. These amounts are reported in the Statements of Operations as fees waived by Manager. The Manager may discontinue the waiver or reimbursement at any time.
| | | | | | |
| 32 | | BLACKROCK FUNDS | | JANUARY 31, 2015 | | |
| | |
Notes to Financial Statements (continued) | | |
On January 31, 2015, the Fund level and class specific waivers and/or reimbursements subject to possible future recoupment under the expense limitation agreement are as follows:
| | | | | | | | | | | | |
| | | | Expiring July 31, | |
| | | 2015 | | | 2016 | | | 2017 | |
Short Obligations | | | | | | | | | | | | |
Fund Level | | $ | 82,787 | | | $ | 205,526 | | | $ | 78,990 | |
BlackRock | | $ | 4,339 | | | $ | 3,829 | | | $ | 1,856 | |
Short-Term Treasury | | | | | | | | | | | | |
Fund Level | | $ | 143,220 | | | $ | 198,471 | | | $ | 91,452 | |
Institutional Daily | | $ | 2,816 | | | $ | 3,936 | | | $ | 1,855 | |
Ultra-Short Obligations | | | | | | | | | | | | |
Fund Level | | $ | 82,082 | | | $ | 222,314 | | | $ | 98,483 | |
BlackRock | | $ | 4,341 | | | $ | 3,863 | | | $ | 1,867 | |
Certain officers and/or trustees of the Trust are officers and/or directors of BlackRock or its affiliates. The Funds reimburse the Manager for a portion of the compensation paid to the Trust’s Chief Compliance Officer, which is included in officer and trustees in the Statements of Operations.
5. Purchases and Sales:
Purchases and sales of investments including paydowns and excluding short-term securities for the period ended January 31, 2015, were as follows:
| | | | | | | | | | | | |
| Purchases | | Short
Obligations | | | Short-Term
Treasury | | | Ultra-Short
Obligations | |
Non-U.S. Government Securities | | $ | 4,496,093 | | | $ | 288,122 | | | $ | 1,000,266 | |
U.S. Government Securities | | | — | | | $ | 664,841 | | | | — | |
| | | | |
Total Purchases | | $ | 4,496,093 | | | $ | 952,963 | | | $ | 1,000,266 | |
| | | | |
| | | | | | | | | | | | |
| Sales | | Short
Obligations | | | Short-Term
Treasury | | | Ultra-Short
Obligations | |
Non-U.S. Government Securities | | $ | 4,118,845 | | | | — | | | $ | 9,562,584 | |
U.S. Government Securities | | | — | | | $ | 2,364,001 | | | | — | |
| | | | |
Total Sales | | $ | 4,118,845 | | | $ | 2,364,001 | | | $ | 9,562,584 | |
| | | | |
6. Income Tax Information:
It is the Funds’ policy to comply with the requirements of the Internal Revenue Code of 1986, as amended, applicable to regulated investment companies, and to distribute substantially all of their taxable income to its shareholders. Therefore, no federal income tax provision is required.
Each Fund files U.S. federal and various state and local tax returns. No income tax returns are currently under examination. The statute of limitationson each Fund’s U.S. federal tax returns remains open for the year ended July 31, 2014 and period ended July 31, 2013. The statutes of limitations on the Fund’s state and local tax returns may remain open for an additional year depending upon the jurisdiction.
Management has analyzed tax laws and regulations and their application to the Funds’ facts and circumstances and does not believe that there are any uncertain tax positions that require recognition of a tax liability.
As of January 31, 2015, gross unrealized appreciation and gross unrealized depreciation based on cost for federal income tax purposes were as follows:
| | | | | | | | | | | | |
| | | Short
Obligations | | | Short-Term
Treasury | | | Ultra-Short
Obligations | |
Tax cost | | $ | 24,943,574 | | | $ | 15,305,386 | | | $ | 25,179,103 | |
| | | | |
Gross unrealized appreciation | | $ | 21,675 | | | $ | 1,685 | | | $ | 4,271 | |
Gross unrealized depreciation | | | (3,901 | ) | | | (1,120 | ) | | | (1,674 | ) |
| | | | |
Net unrealized appreciation | | $ | 17,774 | | | $ | 565 | | | $ | 2,597 | |
| | | | |
| | | | | | |
| | | BLACKROCK FUNDS | | JANUARY 31, 2015 | | 33 |
| | |
| Notes to Financial Statements (concluded) | | |
7. Principal Risks:
In the normal course of business, the Funds invest in securities and enter into transactions where risks exist due to fluctuations in the market (market risk) or failure of the issuer of a security to meet all its obligations (issuer credit risk). The value of securities held by the Funds may decline in response to certain events, including those directly involving the issuers whose securities are owned by the Funds; conditions affecting the general economy; overall market changes; local, regional or global political, social or economic instability; and currency and interest rate and price fluctuations. Similar to issuer credit risk, the Funds may be exposed to counterparty credit risk, or the risk that an entity with which the Funds have unsettled or open transactions may fail to or be unable to perform on its commitments. The Funds manage counterparty risk by entering into transactions only with counterparties that they believe have the financial resources to honor their obligations and by monitoring the financial stability of those counterparties. Financial assets, which potentially expose the Funds to market, issuer and counterparty credit risks, consist principally of financial instruments and receivables due from counterparties. The extent of the Funds’ exposure to market, issuer and counterparty credit risks with respect to these financial assets is generally approximated by their value as recorded in Statements of Assets and Liabilities, less any collateral held by the Funds.
The Funds invest a significant portion of their assets in fixed-income securities. See the Schedules of Investments for these securities. Changes in market interest rates or economic conditions, including the Federal Reserve’s decision in December 2013 to taper its quantitative easing policy, may affect the value and/or liquidity of such investments. Interest rate risk is the risk that prices of bonds and other fixed-income securities will increase as interest rates fall and decrease as interest rates rise. The Funds may be subject to a greater risk of rising interest rates due to the current period of historically low rates.
As of January 31, 2015, Short Obligations and Ultra-Short Obligations invested a significant portion of its assets in securities in the financial services sector. Changes in economic conditions affecting such financial services sectors would have a greater impact on the Fund and could affect the value, income and/or liquidity of positions in such securities.
8. Capital Share Transactions:
Transactions in capital shares for each class were as follows:
| | | | | | | | | | | | | | | | |
| | | Six Months Ended
January 31, 2015 | | | Year Ended
July 31, 2014 | |
| Short Obligations | | Shares | | | Amount | | | Shares | | | Amount | |
Institutional | | | | | | | | | | | | | | | | |
Shares sold | | | 800 | | | $ | 8,000 | | | | — | | | | — | |
Shares issued in reinvestment of dividends | | | 1 | | | | 13 | | | | — | | | | — | |
| | | | | | | | |
Net increase | | | 801 | | | $ | 8,013 | | | | — | | | | — | |
| | | | | | | | |
At January 31, 2015, shares owned by affiliates were as follows:
| | | | | | | | | | | | |
| Shares | | Short
Obligations | | | Short-Term
Treasury | | | Ultra-Short
Obligations | |
Institutional | | | 1,000,000 | | | | 1,500,000 | | | | 1,000,000 | |
BlackRock | | | 1,500,450 | | | | — | | | | 1,500,060 | |
9. Subsequent Events:
Management has evaluated the impact of all subsequent events on the Fund through the date the financial statements were issued and has determined that there were no subsequent events requiring adjustment or additional disclosure in the financial statements.
| | | | | | |
| 34 | | BLACKROCK FUNDS | | JANUARY 31, 2015 | | |
Rodney D. Johnson, Chairman of the Board and Trustee
David O. Beim, Trustee
Collette Chilton, Trustee
Frank J. Fabozzi, Trustee
Dr. Matina S. Horner, Trustee
Herbert I. London, Trustee
Ian A. MacKinnon, Trustee
Cynthia A. Montgomery, Trustee
Barbara G. Novick, Trustee
Joseph P. Platt, Trustee
Robert C. Robb, Jr., Trustee
Toby Rosenblatt, Trustee
Mark Stalnecker, Trustee
Kenneth L. Urish, Trustee
Frederick W. Winter, Trustee
John M. Perlowski, President and Chief Executive Officer
Richard Hoerner, CFA, Vice President
Jennifer McGovern, Vice President
Neal Andrews, Chief Financial Officer
Jay Fife, Treasurer
Charles Park, Chief Compliance Officer and Anti-Money Laundering Compliance Officer
Benjamin Archibald, Secretary
Effective September 19, 2014, Brendan Kyne resigned as a Vice President of the Trust and Jennifer McGovern became a Vice President of the Trust.
Effective December 31, 2014, Paul L. Audet and Henry Gabbay resigned as Trustees of the Trust and Ronald W. Forbes resigned as a Trustee of the Trust and Co-Chair of the Board. Effective January 1, 2015, Collette Chilton, Barbara G. Novick and Mark Stalnecker were appointed to serve as Trustees of the Trust.
Effective March 1, 2015, Charles Park resigned as Anti-Money Laundering Compliance Officer of the Trust and Fernanda Piedra became Anti-Money Laundering Compliance Officer of the Trust.
| | | | | | |
| | | | |
Investment Advisor and Administrator BlackRock Advisors, LLC Wilmington, DE 19809 | | Accounting Agent and Transfer Agent BNY Mellon Investment Servicing (US) Inc. Wilmington, DE 19809 | | Distributor BlackRock Investments, LLC New York, NY 10022 | | Address of the Trust 100 Bellevue Parkway Wilmington, DE 19809 |
| | | | | | |
Custodian The Bank of New York Mellon New York, NY 10286 | | Legal Counsel Sidley Austin LLP New York, NY 10019 | | Independent Registered Public Accounting Firm PricewaterhouseCoopers LLP Philadelphia, PA 19103 | | |
| | | | | | |
| | | BLACKROCK FUNDS | | JANUARY 31, 2015 | | 35 |
Householding
The Funds will mail only one copy of shareholder documents, including prospectuses, annual and semi-annual reports and proxy statements, to shareholders with multiple accounts at the same address. This practice is commonly called “householding” and is intended to reduce expenses and eliminate duplicate mailings of shareholder documents. Mailings of your shareholder documents may be householded indefinitely unless you instruct us otherwise. If you do not want the mailing of these documents to be combined with those for other members of your household, please call the Funds at (800) 441-7762.
Availability of Quarterly Schedule of Investments
The Funds file their complete schedule of portfolio holdings with the SEC for the first and third quarters of each fiscal year on Form N-Q. The Funds’ Forms N-Q are available on the SEC’s website at http://www.sec.gov and may also be reviewed and copied at the SEC’s Public Reference Room in Washington, DC. Information on how to access documents on the SEC’s website without charge may be obtained by calling (800) SEC-0330. The Funds’ Forms N-Q may also be obtained upon request and without charge by calling (800) 441-7762.
Availability of Proxy Voting Policies and Procedures
A description of the policies and procedures that the Funds use to determine how to vote proxies relating to portfolio securities is available upon request and without charge, (1) by calling (800) 441-7762; (2) at http://www.blackrock.com; and (3) on the SEC’s website at http://www.sec.gov.
Availability of Proxy Voting Record
Information about how the Funds voted proxies relating to securities held in the Funds’ portfolios during the most recent 12-month period ended June 30 is available upon request and without charge (1) at http://www.blackrock.com or by calling (800) 441-7762 and (2) on the SEC’s website at http://www.sec.gov.
Account Information
Call us at (800) 441-7762 from 8:00 AM to 6:00 PM EST on any business day to get information about your account balances, recent transactions and share prices. You can also reach us on the Web at http://www.blackrock.com/cash.
Retirement Plans
Shareholders may make investments in conjunction with Traditional, Rollover, Roth, Coverdell, Simple IRAs, SEP IRAs and 403(b) Plans.
| | | | | | |
| 36 | | BLACKROCK FUNDS | | JANUARY 31, 2015 | | |
| | |
| Additional Information (concluded) | | |
|
| BlackRock Privacy Principles |
BlackRock is committed to maintaining the privacy of its current and former fund investors and individual clients (collectively, “Clients”) and to safeguarding their non-public personal information. The following information is provided to help you understand what personal information BlackRock collects, how we protect that information and why in certain cases we share such information with select parties.
If you are located in a jurisdiction where specific laws, rules or regulations require BlackRock to provide you with additional or different privacy-related rights beyond what is set forth below, then BlackRock will comply with those specific laws, rules or regulations.
BlackRock obtains or verifies personal non-public information from and about you from different sources, including the following: (i) information we receive from you or, if applicable, your financial intermediary, on applications, forms or other documents; (ii) information about your transactions with us, our affiliates, or others; (iii) information we receive from a consumer reporting agency; and (iv) from visits to our websites.
BlackRock does not sell or disclose to non-affiliated third parties any non-public personal information about its Clients, except as permitted by law or as is necessary to respond to regulatory requests or to service Client accounts. These non-affiliated third parties are required to protect the confidentiality and security of this information and to use it only for its intended purpose.
We may share information with our affiliates to service your account or to provide you with information about other BlackRock products or services that may be of interest to you. In addition, BlackRock restricts access to non-public personal information about its Clients to those BlackRock employees with a legitimate business need for the information. BlackRock maintains physical, electronic and procedural safeguards that are designed to protect the non-public personal information of its Clients, including procedures relating to the proper storage and disposal of such information.
| | | | | | |
| | | BLACKROCK FUNDS | | JANUARY 31, 2015 | | 37 |
| | |
This report is intended for existing shareholders. It is not authorized for use as an offer of sale or a solicitation of an offer to buy shares of the Funds unless accompanied or preceded by that Fund’s current prospectus. Past performance results shown in this report should not be considered a representation of future performance. Investment returns and principal value of shares will fluctuate so that shares, when redeemed, may be worth more or less than their original cost. Statements and other information herein are as dated and are subject to change. | | 
|
| | |
SHORTS-1/15-SAR | |  |
| | |
| Item 2 – | | Code of Ethics – Not Applicable to this semi-annual report |
| |
| Item 3 – | | Audit Committee Financial Expert – Not Applicable to this semi-annual report |
| |
| Item 4 – | | Principal Accountant Fees and Services – Not Applicable to this semi-annual report |
| |
| Item 5 – | | Audit Committee of Listed Registrants – Not Applicable |
| |
| Item 6 – | | Investments |
| | (a) The registrant’s Schedule of Investments is included as part of the Report to Stockholders filed under Item 1 of this Form. |
| | (b) Not Applicable due to no such divestments during the semi-annual period covered since the previous Form N-CSR filing. |
| |
| Item 7 – | | Disclosure of Proxy Voting Policies and Procedures for Closed-End Management Investment Companies – Not Applicable |
| |
| Item 8 – | | Portfolio Managers of Closed-End Management Investment Companies – Not Applicable |
| |
| Item 9 – | | Purchases of Equity Securities by Closed-End Management Investment Company and Affiliated Purchasers – Not Applicable |
| |
| Item 10 – | | Submission of Matters to a Vote of Security Holders –There have been no material changes to these procedures. |
| |
| Item 11 – | | Controls and Procedures |
| |
| | (a) – The registrant’s principal executive and principal financial officers, or persons performing similar functions, have concluded that the registrant’s disclosure controls and procedures (as defined in Rule 30a-3(c) under the Investment Company Act of 1940, as amended (the “1940 Act”)) are effective as of a date within 90 days of the filing of this report based on the evaluation of these controls and procedures required by Rule 30a-3(b) under the 1940 Act and Rule 15d-15(b) under the Securities Exchange Act of 1934, as amended. |
| |
| | (b) – There were no changes in the registrant’s internal control over financial reporting (as defined in Rule 30a-3(d) under the 1940 Act) that occurred during the second fiscal quarter of the period covered by this report that have materially affected, or are reasonably likely to materially affect, the registrant’s internal control over financial reporting. |
| |
| Item 12 – | | Exhibits attached hereto |
| |
| | (a)(1) – Code of Ethics – Not Applicable to this semi-annual report |
| |
| | (a)(2) – Certifications – Attached hereto |
| |
| | (a)(3) – Not Applicable |
| |
| | (b) – Certifications – Attached hereto |
2
Pursuant to the requirements of the Securities Exchange Act of 1934 and the Investment Company Act of 1940, the registrant has duly caused this report to be signed on its behalf by the undersigned, thereunto duly authorized.
| | | | |
| BlackRock Funds | | |
| | |
| By: | | /s/ John M. Perlowski | | |
| | John M. Perlowski | | |
| | Chief Executive Officer (principal executive officer) of |
| | BlackRock Funds | | |
| |
| Date: April 2, 2015 | | |
Pursuant to the requirements of the Securities Exchange Act of 1934 and the Investment Company Act of 1940, this report has been signed below by the following persons on behalf of the registrant and in the capacities and on the dates indicated.
| | | | |
| By: | | /s/ John M. Perlowski | | |
| | John M. Perlowski | | |
| | Chief Executive Officer (principal executive officer) of |
| | BlackRock Funds | | |
| |
| Date: April 2, 2015 | | |
| | |
| By: | | /s/ Neal J. Andrews | | |
| | Neal J. Andrews | | |
| | Chief Financial Officer (principal financial officer) of |
| | BlackRock Funds | | |
| |
| Date: April 2, 2015 | | |
3