UNITED STATES
SECURITIES AND EXCHANGE COMMISSION
Washington, D.C. 20549
FORM N-CSR
CERTIFIED SHAREHOLDER REPORT OF REGISTERED MANAGEMENT INVESTMENT COMPANIES
Investment Company Act file number: 811-05742
Name of Fund: BlackRock Funds
BlackRock Multi-Manager Alternative Strategies Fund
Fund Address: 100 Bellevue Parkway, Wilmington, DE 19809
Name and address of agent for service: John M. Perlowski, Chief Executive Officer, BlackRock Funds, 55 East 52nd Street, New York, NY 10055
Registrant’s telephone number, including area code: (800) 441-7762
Date of fiscal year end: 08/31/2015
Date of reporting period: 02/28/2015
Item 1 – Report to Stockholders
2
FEBRUARY 28, 2015
| | | | |
SEMI-ANNUAL REPORT (UNAUDITED) | | | | BLACKROCK® |
| | | | |
| | BlackRock Multi-Manager Alternative Strategies Fund | | of BlackRock FundsSM |
| | |
| Not FDIC Insured ¡ May Lose Value ¡ No Bank Guarantee | | |
| | |

| | Shareholders can sign up for e-mail notifications of quarterly statements, annual and semi-annual shareholder reports and prospectuses by enrolling in the electronic delivery program. Electronic copies of shareholder reports and prospectuses are also available on BlackRock’s website. TO ENROLL IN ELECTRONIC DELIVERY: Shareholders Who Hold Accounts with Investment Advisors, Banks or Brokerages: Please contact your financial advisor. Please note that not all investment advisors, banks or brokerages may offer this service. Shareholders Who Hold Accounts Directly with BlackRock: 1. Access the BlackRock website at blackrock.com 2. Select “Access Your Account” 3. Next, select “eDelivery” in the “Related Resources” box and follow the sign-up instructions |
| | | | | | |
| 2 | | BLACKROCK MULTI-MANAGER ALTERNATIVE STRATEGIES FUND | | FEBRUARY 28, 2015 | | |
Dear Shareholder,
Market volatility, while remaining below the long-term average level, increased over the course of 2014 and into 2015, driven largely by higher valuations in risk assets (such as equities and high yield bonds), geopolitical risks, uneven global economic growth and uncertainty around policy moves from the world’s largest central banks. As the U.S. Federal Reserve (the “Fed”) gradually reduced its bond buying program (which ultimately ended in October 2014), U.S. interest rates surprisingly trended lower during the period.
The first half of 2014 was generally a strong period for most asset classes; however, volatility ticked up in the summer as geopolitical tensions intensified in Ukraine and the Middle East and investors feared that better U.S. economic indicators may compel the Fed to increase short-term interest rates sooner than previously anticipated. Global credit markets tightened as the U.S. dollar strengthened versus other currencies, ultimately putting a strain on investor flows, and financial markets broadly weakened in the third quarter.
Several themes dominated the markets in the fourth quarter that resulted in the strong performance of U.S. markets versus other areas of the world. Economic growth strengthened considerably in the United States while the broader global economy showed signs of slowing. The European Central Bank and the Bank of Japan took aggressive measures to stimulate growth while the Fed moved toward tighter policy, causing further strengthening in the U.S. dollar. Fixed income investors piled into U.S. Treasuries where yields remained persistently low, but were comparatively higher than yields on international sovereign debt, while equity investors favored the relative stability of U.S.-based companies amid rising global risks.
Oil prices, which had been gradually declining since mid-summer, plummeted in the fourth quarter due to a global supply-and-demand imbalance. Energy-related assets sold off sharply and emerging markets struggled as many of those economies rely heavily on oil exports. Conversely, the consumer sectors benefited from lower oil prices as savings at the gas pumps freed up discretionary income for other goods and services.
These trends shifted in early 2015. U.S. equities underperformed international markets given high valuations and the anticipation of a rate hike from the Fed. Oil prices showed signs of stabilizing as suppliers became more disciplined in their exploration and production efforts. Markets in Europe and Japan rebounded, driven largely by central bank policy accommodation and improving economic data.
At BlackRock, we believe investors need to think globally, extend their scope across a broad array of asset classes and be prepared to move freely as market conditions change over time. We encourage you to talk with your financial advisor and visit blackrock.com for further insight about investing in today’s markets.
Sincerely,

Rob Kapito
President, BlackRock Advisors, LLC

Rob Kapito
President, BlackRock Advisors, LLC
| | | | | | | | |
| Total Returns as of February 28, 2015 | |
| | | 6-month | | | 12-month | |
U.S. large cap equities
(S&P 500® Index) | | | 6.12 | % | | | 15.51 | % |
U.S. small cap equities
(Russell 2000® Index) | | | 5.70 | | | | 5.63 | |
International equities
(MSCI Europe, Australasia,
Far East Index) | | | (1.26 | ) | | | (0.03 | ) |
Emerging market equities
(MSCI Emerging Markets
Index) | | | (8.30 | ) | | | 5.01 | |
3-month Treasury bill
(BofA Merrill Lynch
3-Month U.S. Treasury
Bill Index) | | | 0.01 | | | | 0.03 | |
U.S. Treasury securities
(BofA Merrill Lynch
10- Year U.S. Treasury
Index) | | | 4.14 | | | | 8.66 | |
U.S. investment grade
bonds (Barclays U.S.
Aggregate Bond Index) | | | 2.25 | | | | 5.05 | |
Tax-exempt municipal
bonds (S&P Municipal
Bond Index) | | | 2.17 | | | | 6.47 | |
U.S. high yield bonds
(Barclays U.S. Corporate
High Yield 2% Issuer
Capped Index) | | | (0.08 | ) | | | 2.81 | |
|
| Past performance is no guarantee of future results. Index performance is shown for illustrative purposes only. You cannot invest directly in an index. | |
| | | | | | |
| | | THIS PAGE NOT PART OF YOUR FUND REPORT | | | | 3 |
| | |
| Fund Summary as of February 28, 2015 | | |
BlackRock Multi-Manager Alternative Strategies Fund’s (the “Fund”) investment objective is to seek total return.
|
| Portfolio Management Commentary |
How did the Fund perform?
| Ÿ | | For the six-month period ended February 28, 2015, the Fund outperformed its benchmark, the BofA Merrill Lynch 3-Month U.S. Treasury Bill Index. |
Underlying Fund Strategies
| Ÿ | | Relative value strategies seek to profit from mispricing of financial instruments relative to each other or historical norms. These strategies utilize quantitative and qualitative analysis to identify securities or spreads between securities that deviate from their theoretical fair value and/or historical norms. |
| Ÿ | | Event driven strategies concentrate on companies that are subject to corporate events such as mergers, acquisitions, restructurings, spin-offs, shareholder activism, or other special situations that alter a company’s financial structure or operating strategy. The intended goal of event driven strategies is to profit when the price of a security changes to reflect more accurately the likelihood and potential impact of the occurrence, or non-occurrence, of the extraordinary event. This can be done by taking a long position in a security or other financial instrument that is believed to be underpriced or a short position in a security or other financial instrument that is believed to be overpriced. |
| Ÿ | | Fundamental long/short strategies involve buying or selling securities believed to be overpriced or underpriced relative to their potential value. Investment strategies within the fundamental long/short discipline include long and short equity- or credit-based strategies that emphasize a fundamental valuation framework and equity active value strategies where an active role is taken to enhance corporate value. |
| Ÿ | | Directional trading strategies seek to profit from changes in macro-level exposures, such as interest rates, currencies, equities and commodities. This strategy may involve analyzing fundamental macroeconomic inputs, as well as technical information such as price, to identify investment opportunities across a broad array of asset classes and geographies. These strategies may also include model driven trading strategies that use technical or fundamental inputs in order to make a trading decision across a portfolio of major global asset classes including fixed income, foreign exchange, equities and commodities. Trading decisions are made systematically using a rules based investment approach. |
What factors influenced performance?
| Ÿ | | The Fund’s directional trading strategies contributed to positive performance during the period, in large part driven by select directional and momentum trades in interest rate futures and foreign exchange derivative |
| | | positions. Relative value trading strategies were another positive contributor during the period, benefiting from trades that take advantage of larger evolving cross-regional themes, such as those focused on the diverging monetary policies of the U.S. versus other developed countries. Fund performance was helped further by relative value trades that sought to isolate potential mispricings across select single-name U.S. equities. |
| Ÿ | | The Fund’s fundamental long/short strategies were a drag on performance for the period, as select positions in structured credit and stressed/distressed securities were negatively impacted by increased risk sensitivity in the broader capital markets. Pricing pressures within the energy sector impacted returns, as well as select positions impacted by technical selling despite positive fundamental developments. The fundamental long/short strategy also detracted from performance, with positions in single-name equities across the energy and consumer sectors underperforming. These losses were offset in part by gains in the health care industry and select short positions. |
| Ÿ | | The Fund, through its underlying sub-advisors, held derivatives during the period. The use of derivatives contributed positively to performance during the period, primarily from global macro and managed futures strategies. The Fund maintained a position in cash and cash equivalents as collateral against the Fund’s exposure to derivatives including, but not limited to, total return swaps, interest rate swaps, credit default swaps, and futures. The Fund’s cash balance did not have a material impact on performance. |
Describe recent portfolio activity.
| Ÿ | | During the six-month period, the Fund added one additional sub-advisor to the portfolio, Achievement Asset Management LLC (“AAM”). AAM is a manager focused on relative value strategies. The Fund removed two sub-advisors during the period, Loeb King Capital Management and PEAK6 Advisors LLC. Loeb King Capital Management was an event driven-focused manager and PEAK6 Advisors LLC was a relative value-focused manager. |
Describe portfolio positioning at period end.
| Ÿ | | At the end of the period, the Fund’s six sub-advisors, two BlackRock mutual funds and direct opportunistic investments had the following approximate exposures to alternative strategies: 41% long/short credit, 22% relative value, 15% fundamental long/short, 15% directional trading, 5% event driven, and 2% other. |
The views expressed reflect the opinions of BlackRock as of the date of this report and are subject to change based on changes in market, economic or other conditions. These views are not intended to be a forecast of future events and are no guarantee of future results.
| | | | | | |
| 4 | | BLACKROCK MULTI-MANAGER ALTERNATIVE STRATEGIES FUND | | FEBRUARY 28, 2015 | | |
| | |
| Ten Largest Holdings | | Percent of Long-Term Investments |
| | | | |
BlackRock Global Long/Short Equity Fund | | | 28 | % |
BlackRock Global Long/Short Credit Fund | | | 12 | |
Octagon Investment Partners XVII Ltd., Series 2013-1A, Class E | | | 3 | |
GreenPoint Mortgage Funding Trust, Series 2007-AR1, Class 3A2 | | | 3 | |
Bear Stearns ALT-A Trust, Series 2005-10, Class 11A1 | | | 3 | |
Bear Stearns ALT-A Trust, Series 2006-4, Class 23A4 | | | 2 | |
CHL Mortgage Pass-Through Trust, Series 2007-4 Class 1A36 | | | 2 | |
Bear Stearns Asset Backed Securities I Trust, Series 2006-HE1 Class 2M3, | | | 2 | |
LightSquared LP, DIP Term Loan A | | | 2 | |
Countrywide Asset-Backed Certificates, Series 2005-8, Class M5 | | | 2 | |
| | |
| Portfolio Composition | | Percent of
Total Net Assets |
| | | | |
Short-Term Securities | | | 34 | % |
Investment Companies | | | 25 | |
Corporate Bonds | | | 13 | |
Non-Agency Mortgage-Backed Securities | | | 9 | |
Asset-Backed Securities | | | 7 | |
Floating Rate Loan Interests | | | 3 | |
Preferred Securities | | | 2 | |
Common Stocks | | | 2 | |
U.S. Treasury Obligations | | | 1 | |
Taxable Municipal Bonds | | | — | 1 |
Investments Sold Short | | | (2 | ) |
Other Assets Less Liabilities | | | 6 | |
| | 1 | | Less than 1% of total net assets. |
| | |
| Ten Largest Investments Sold Short | | Percent of
Investments Sold Short |
| | | | |
Rio Oil Finance Trust | | | 26 | % |
Teck Resources Ltd. | | | 14 | |
Vale Overseas Ltd. | | | 14 | |
Ensco PLC | | | 12 | |
Calfrac Holdings LP | | | 11 | |
Petrobras Global Finance BV | | | 10 | |
Imperial Metals Corp. | | | 9 | |
ACE Cash Express, Inc. | | | 4 | |
Community Choice Financial, Inc. | | | — | 1 |
| | 1 | | Less than 1% of investments sold short. |
| | |
| Sector Allocation | | Percent of
Investments Sold Short |
| | | | |
Materials | | | 37 | % |
Energy. | | | 33 | |
Financials | | | 30 | |
For Fund compliance purposes, the Fund’s sector classifications refer to any one or more of the sector sub-classifications used by one or more widely recognized market indexes or ratings group indexes, and/or as defined by the investment advisor. These definitions may not apply for purposes of this report, which may combine such sector sub-classifications for reporting ease.
| | | | | | |
| | | BLACKROCK MULTI-MANAGER ALTERNATIVE STRATEGIES FUND | | FEBRUARY 28, 2015 | | 5 |
|
| Total Return Based on a $10,000 Investment |
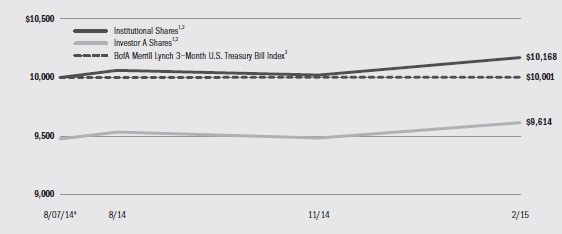
| | 1 | | Assuming maximum sales charges, if any, transaction costs and other operating expenses, including administration fees. Institutional Shares do not have a sales charge. |
| | 2 | | The Fund allocates assets to multiple affiliated and unaffiliated investment managers that employ a variety of alternative investment strategies. |
| | 3 | | An unmanaged index that tracks 3-month U.S. Treasury securities. |
| | 4 | | Commencement of operations. |
|
| Performance Summary for the Period Ended February 28, 2015 |
| | | | | | | | | | | | |
| | | | | | Aggregate Total Returns5 | |
| | | | | | Since Inception6 | |
| | | 6-Month
Total Returns | | | w/o sales
charge | | | w/sales
charge | |
Institutional | | | 1.07 | % | | | 1.68 | % | | | N/A | |
Investor A | | | 0.86 | | | | 1.47 | | | | (3.86 | )% |
Investor C | | | 0.62 | | | | 1.12 | | | | 0.12 | |
BofA Merrill Lynch 3-Month U.S. Treasury Bill Index | | | 0.01 | | | | 0.01 | | | | N/A | |
| | 5 | | Assuming maximum sales charges, if any. Aggregate total returns with and without sales charges reflect reductions for distribution and service fees. See “About Fund Performance” on page 7 for a detailed description of share classes, including any related sales charges and fees. |
| | 6 | | The Fund commenced operations on August 7, 2014. |
N/A—Not applicable as share class and index do not have a sales charge.
Past performance is not indicative of future results.
| | | | | | | | | | | | | | | | | | | | | | | | | | | | | | | | | | | | |
| | | Actual | | | Hypothetical9 | |
| | | | | | | | | Expenses Paid During the Period | | | | | | Including Dividend Expense,
Stock Loan Fees and
Interest Expense | | | Excluding Dividend Expense,
Stock Loan Fees and
Interest Expense | |
| | | Beginning
Account Value
September 1,
2014 | | | Ending
Account Value
February 28,
2015 | | | Including Dividend
Expense, Stock
Loan Fees and
Interest Expense7 | | | Excluding Dividend
Expense, Stock
Loan Fees and
Interest Expense8 | | | Beginning
Account Value
September 1,
2014 | | | Ending
Account Value
February 28,
2015 | | | Expenses
Paid During
the Period7 | | | Ending
Account Value
February 28,
2015 | | | Expenses
Paid During
the Period8 | |
Institutional | | $ | 1,000.00 | | | $ | 1,010.70 | | | $ | 12.41 | | | $ | 11.22 | | | $ | 1,000.00 | | | $ | 1,012.45 | | | $ | 12.42 | | | $ | 1,013.64 | | | $ | 11.23 | |
Investor A | | $ | 1,000.00 | | | $ | 1,008.60 | | | $ | 14.04 | | | $ | 12.85 | | | $ | 1,000.00 | | | $ | 1,010.81 | | | $ | 14.06 | | | $ | 1,012.00 | | | $ | 12.87 | |
Investor C | | $ | 1,000.00 | | | $ | 1,006.20 | | | $ | 17.86 | | | $ | 16.66 | | | $ | 1,000.00 | | | $ | 1,006.99 | | | $ | 17.86 | | | $ | 1,008.18 | | | $ | 16.68 | |
| | 7 | | For each class of the Fund, expenses are equal to the annualized expense ratio for the class (2.50% for Institutional, 2.82% for Investor A, and 3.59% for Investor C), multiplied by the average account value over the period, multiplied by 181/365 (to reflect the one-half year shown). The fees and expenses of the underlying funds in which the Fund invests are not included in the Fund’s annualized expense ratio. |
| | 8 | | For each class of the Fund, expenses are equal to the annualized expense ratio for the class (2.25% for Institutional, 2.58% for Investor A, and 3.35% for Investor C), multiplied by the average account value over the period, multiplied by 181/365 (to reflect the one-half year shown). The fees and expenses of the underlying funds in which the Fund invests are not included in the Fund’s annualized expense ratio. |
| | 9 | | Hypothetical 5% annual return before expenses is calculated by prorating the number of days in the most recent fiscal half year divided by 365. |
| | | | See “Disclosure of Expenses” on page 7 for further information on how expenses were calculated. |
| | | | | | |
| 6 | | BLACKROCK MULTI-MANAGER ALTERNATIVE STRATEGIES FUND | | FEBRUARY 28, 2015 | | |
| Ÿ | | Institutional Shares are not subject to any sales charge. These shares bear no ongoing distribution or service fees and are available only to certain eligible investors. |
| Ÿ | | Investor A Shares are subject to a maximum initial sales charge (front-end load) of 5.25% and a service fee of 0.25% per year (but no distribution fee). Certain redemptions of these shares may be subject to a contingent deferred sales charge (“CDSC”) where no initial sales charge was paid at the time of purchase. The shares are generally available through financial intermediaries. |
| Ÿ | | Investor C Shares are subject to a 1.00% CDSC if redeemed within one year of purchase. In addition, these shares are subject to a distribution fee of 0.75% per year and a service fee of 0.25% per year. The shares are generally available through financial intermediaries. |
Performance information reflects past performance and does not guarantee future results. Current performance may be lower or higher than the performance data quoted. Refer to www.blackrock.com/funds to obtain performance data current to the most recent month end. Performance
results do not reflect the deduction of taxes that a shareholder would pay on Fund distributions or the redemption of Fund shares. Investment return and principal value of shares will fluctuate so that shares, when redeemed, may be worth more or less than their original cost. Dividends paid to each class of shares will vary because of the different levels of service, distribution and transfer agency fees applicable to each class, which are deducted from the income available to be paid to shareholders.
BlackRock Advisors, LLC (the “Manager”), the Fund’s investment advisor, has contractually agreed to waive and/or reimburse a portion of the Fund’s expenses. Without such waiver and/or reimbursement, the Fund’s performance would have been lower. The Manager is under no obligation to continue waiving and/or reimbursing its fees after the applicable termination date of such agreement. See Note 5 of the Notes to Financial Statements for additional information on waivers and/or reimbursements.
Shareholders of the Fund may incur the following charges: (a) transactional expenses, such as sales charges; and (b) operating expenses, including investment advisory fees, administration fees, service and distribution fees, including 12b-1 fees, acquired fund fees and expenses and other Fund expenses. The expense example on the previous page (which is based on a hypothetical investment of $1,000 invested on September 1, 2014 and held through February 28, 2015) is intended to assist shareholders both in calculating expenses based on an investment in the Fund and in comparing these expenses with similar costs of investing in other mutual funds.
The expense example provides information about actual account values and actual expenses. In order to estimate the expenses a shareholder paid during the period covered by this report, shareholders can divide their account value by $1,000 and then multiply the result by the number corresponding to their share class under the heading entitled “Expenses Paid During the Period.”
The expense example also provides information about hypothetical account values and hypothetical expenses based on the Fund’s actual expense ratio and an assumed rate of return of 5% per year before expenses. In order to assist shareholders in comparing the ongoing expenses of investing in the Fund and other funds, compare the 5% hypothetical example with the 5% hypothetical examples that appear in other funds’ shareholder reports.
The expenses shown in the expense example are intended to highlight shareholders’ ongoing costs only and do not reflect any transactional expenses, such as sales charges, if any. Therefore, the hypothetical example is useful in comparing ongoing expenses only, and will not help shareholders determine the relative total expenses of owning different funds. If these transactional expenses were included, shareholder expenses would have been higher.
| | | | | | |
| | | BLACKROCK MULTI-MANAGER ALTERNATIVE STRATEGIES FUND | | FEBRUARY 28, 2015 | | 7 |
| | |
| Derivative Financial Instruments | | |
The Fund may invest in various derivative financial instruments. Derivative financial instruments are used to obtain exposure to a security, index and/or market without owning or taking physical custody of securities or to hedge market, equity, credit, interest rate and/or foreign currency exchange rate risks. Derivative financial instruments may give rise to a form of economic leverage. Derivative financial instruments also involve risks, including the imperfect correlation between the value of a derivative financial instrument and the underlying asset, possible default of the counterparty to the transaction or illiquidity of the derivative financial
instrument. The Fund’s ability to use a derivative financial instrument successfully depends on the investment advisor’s ability to predict pertinent market movements accurately, which cannot be assured. The use of derivative financial instruments may result in losses greater than if they had not been used, may limit the amount of appreciation the Fund can realize on an investment and/or may result in lower distributions paid to shareholders. The Fund’s investments in these instruments are discussed in detail in the Notes to Financial Statements.
| | | | | | |
| 8 | | BLACKROCK MULTI-MANAGER ALTERNATIVE STRATEGIES FUND | | FEBRUARY 28, 2015 | | |
| | | | |
| Schedule of Investments February 28, 2015 (Unaudited) | | | (Percentages shown are based on Net Assets) | |
| | | | |
| | | | | | | | | | | | |
| Asset-Backed Securities | | | | | Par
(000) | | | Value | |
Asset Backed Securities Corp. Home Equity Loan Trust, Series 2006-HE2, Class A1A,
0.42%, 3/25/36 (a) | | | USD | | | | 1,327 | | | $ | 793,113 | |
Bear Stearns Asset Backed Securities I Trust,
Series 2006-HE1, Class 2M3,
0.63%, 2/25/36 (a) | | | | | | | 1,776 | | | | 1,312,029 | |
BlueMountain CLO Ltd., Series 2012-1A, Class E, 5.73%, 7/20/23 (a)(b) | | | | | | | 1,000 | | | | 956,560 | |
Citigroup Mortgage Loan Trust, Series 2006-HE3, Class A2C, 0.33%, 12/25/36 (a) | | | | | | | 1,222 | | | | 742,419 | |
Countrywide Asset-Backed Certificates,
Series 2005-8, Class M5, 0.82%, 12/25/35 (a) | | | | | | | 1,500 | | | | 1,112,286 | |
Morgan Stanley ABS Capital I, Inc. Trust,
Series 2007-HE1, Class A1, 0.30%, 11/25/36 (a) | | | | | | | 587 | | | | 392,021 | |
Octagon Investment Partners XVII Ltd.,
Series 2013-1A, Class E, 4.72%, 10/25/25 (a)(b) | | | | | | | 2,000 | | | | 1,745,827 | |
Total Asset-Backed Securities — 6.9% | | | | | | | | | | | 7,054,255 | |
| | | | | | | | | | | | |
| Common Stocks | | | | | Shares | | | | |
Air Freight & Logistics — 0.1% | | | | | | | | | | | | |
CEVA Holdings LLC (c) | | | | | | | 94 | | | | 86,950 | |
Airlines — 0.5% | | | | | | | | | | | | |
SAS AB — Preference Shares (c) | | | | | | | 8,322 | | | | 490,616 | |
Banks — 0.1% | | | | | | | | | | | | |
Co-Operative Bank PLC (c) | | | | | | | 32,000 | | | | 103,747 | |
HSBC USA, Inc. (c) | | | | | | | 1,122 | | | | 24,863 | |
| | | | | | | | | | | | |
| | | | | | | | | | | | 128,610 | |
Biotechnology — 0.1% | | | | | | | | | | | | |
Acceleron Pharma, Inc. (c) | | | | | | | 719 | | | | 29,213 | |
Amicus Therapeutics, Inc. (c) | | | | | | | 2,971 | | | | 26,026 | |
Celldex Therapeutics, Inc. (c) | | | | | | | 1,327 | | | | 33,891 | |
Intercept Pharmaceuticals, Inc. (c) | | | | | | | 113 | | | | 25,015 | |
| | | | | | | | | | | | |
| | | | | | | | | | | | 114,145 | |
Internet Software & Services — 0.1% | | | | | | | | | | | | |
Google, Inc., Class A (c) | | | | | | | 226 | | | | 127,155 | |
Media — 0.4% | | | | | | | | | | | | |
Cengage Learning Acquisitions, Inc. (Thomson Learning) | | | | | | | 10,844 | | | | 233,829 | |
Tribune Media Co., Class A (c) | | | | | | | 2,430 | | | | 160,307 | |
| | | | | | | | | | | | |
| | | | | | | | | | | | 394,136 | |
Oil, Gas & Consumable Fuels — 0.2% | | | | | | | | | | | | |
MPLX LP | | | | | | | 1,603 | | | | 131,767 | |
| | | | | | | | | | | | |
| Common Stocks | | | | |
Shares | | | Value | |
Real Estate Investment Trusts (REITs) — 0.1% | | | | | | | | | | | | |
American Tower Corp. | | | | | | | 531 | | | $ | 52,643 | |
NorthStar Realty Finance Corp. | | | | | | | 3,942 | | | | 75,765 | |
| | | | | | | | | | | | |
| | | | | | | | | | | | 128,408 | |
Total Common Stocks — 1.6% | | | | | | | | | | | 1,601,787 | |
| | | | | | | | | | | | |
| | | | |
| Corporate Bonds | | | | | Par
(000) | | | | |
Aerospace & Defense — 0.4% | | | | | | | | | | | | |
Meccanica Holdings USA, Inc., 7.38%, 7/15/39 (b) | | | USD | | | | 400 | | | | 454,000 | |
Banks — 0.6% | | | | | | | | | | | | |
Co-Operative Bank PLC, 11.00%, 12/20/23 | | | GBP | | | | 167 | | | | 299,075 | |
HSH Nordbank AG, 0.89%, 2/14/17 (a) | | | EUR | | | | 275 | | | | 265,500 | |
| | | | | | | | | | | | |
| | | | | | | | | | | | 564,575 | |
Chemicals — 0.5% | | | | | | | | | | | | |
Hexion U.S. Finance Corp., 6.63%, 4/15/20 | | | USD | | | | 550 | | | | 525,250 | |
Commercial Services & Supplies — 1.0% | | | | | | | | | | | | |
1st Credit Holdings Ltd., 11.00%, 6/10/20 | | | GBP | | | | 200 | | | | 339,660 | |
Harland Clarke Holdings Corp., 9.75%, 8/01/18 (b) | | | USD | | | | 400 | | | | 428,000 | |
SITEL LLC/Sitel Finance Corp., 11.50%, 4/01/18 | | | | | | | 230 | | | | 205,850 | |
| | | | | | | | | | | | |
| | | | | | | | | | | | 973,510 | |
Consumer Finance — 0.4% | | | | | | | | | | | | |
Ally Financial, Inc., 5.13%, 9/30/24 | | | | | | | 400 | | | | 422,500 | |
Containers & Packaging — 0.4% | | | | | | | | | | | | |
Ardagh Packaging Finance PLC/Ardagh Holdings USA, Inc., 4.25%, 1/15/22 | | | EUR | | | | 400 | | | | 454,332 | |
Diversified Consumer Services — 0.4% | | | | | | | | | | | | |
Monitronics International, Inc., 9.13%, 4/01/20 | | | USD | | | | 400 | | | | 392,500 | |
Diversified Financial Services — 1.2% | | | | | | | | | | | | |
Argos Merger Sub, Inc., 7.13%, 3/15/23 (b) | | | | | | | 197 | | | | 203,895 | |
The Bank of New York Mellon Luxembourg SA, 4.32%, 12/30/99 (h) | | | EUR | | | | 1,400 | | | | 544,415 | |
CNG Holdings, Inc., 9.38%, 5/15/20 (b) | | | USD | | | | 156 | | | | 112,320 | |
Marlin Intermediate Holdings PLC,
10.50%, 8/01/20 (b) | | | GBP | | | | 200 | | | | 340,960 | |
| | | | | | | | | | | | |
| | | | | | | | | | | | 1,201,590 | |
Diversified Telecommunication Services — 0.5% | | | | | | | | | | | | |
Avaya, Inc., 10.50%, 3/01/21 (b) | | | USD | | | | 72 | | | | 62,820 | |
Oi SA, 5.75%, 2/10/22 | | | | | | | 522 | | | | 451,478 | |
| | | | | | | | | | | | |
| | | | | | | | | | | | 514,298 | |
| | | | | | | | | | |
| Portfolio Abbreviations | | | | | | |
| ADR | | American Depositary Receipts | | EURIBOR | | Euro Interbank Offered Rate | | OTC | | Over-the-counter |
| AUD | | Australian Dollar | | GBP | | British Pound | | REIT | | Real Estate Investment Trust |
| CAD | | Canadian Dollar | | JPY | | Japanese Yen | | SEK | | Swedish Krona |
| CLO | | Collateralized Loan Obligation | | LIBOR | | London Interbank Offered Rate | | SPDR | | Standard & Poor’s Depositary |
| ETF | | Exchange-Traded Fund | | NOK | | Norwegian Krone | | | | Receipts |
| EUR | | Euro | | NZD | | New Zealand Dollar | | USD | | U.S. Dollar |
See Notes to Financial Statements.
| | | | | | |
| | | BLACKROCK MULTI-MANAGER ALTERNATIVE STRATEGIES FUND | | FEBRUARY 28, 2015 | | 9 |
| | | | |
| Schedule of Investments (continued) | | | (Percentages shown are based on Net Assets) | |
| | | | |
| | | | | | | | | | | | |
| Corporate Bonds | | | | | Par
(000) | | | Value | |
Electric Utilities — 0.6% | | | | | | | | | | | | |
Energy Future Intermediate Holding Co. LLC/EFIH Finance, Inc.,
12.25%, 3/01/22 (b)(c)(d) | | | USD | | | | 538 | | | $ | 644,255 | |
Electronic Equipment, Instruments & Components — 0.5% | | | | | |
Zebra Technologies Corp., 7.25%, 10/15/22 (b) | | | | | | | 500 | | | | 540,000 | |
Health Care Providers & Services — 1.5% | | | | | | | | | | | | |
Kindred Healthcare, Inc., 8.00%, 1/15/20 (b) | | | | | | | 500 | | | | 542,500 | |
Tenet Healthcare Corp., 5.50%, 3/01/19 (b) | | | | | | | 400 | | | | 407,500 | |
Truven Health Analytics, Inc., 10.63%, 6/01/20 | | | | | | | 543 | | | | 557,933 | |
| | | | | | | | | | | | |
| | | | | | | | | | | | 1,507,933 | |
Hotels, Restaurants & Leisure — 0.4% | | | | | | | | | | | | |
Caesars Entertainment Resort Properties LLC/Caesars Entertainment Resort Properties Finance, Inc.,
8.00%, 10/01/20 (b) | | | | | | | 400 | | | | 403,000 | |
Insurance — 0.2% | | | | | | | | | | | | |
Corolla Trust, 0.00%, 8/28/39 (a)(b) | | | | | | | 275 | | | | 214,500 | |
Internet & Catalog Retail — 0.5% | | | | | | | | | | | | |
Netflix, Inc., 5.75%, 3/01/24 (b) | | | | | | | 448 | | | | 463,680 | |
Internet Software & Services — 0.4% | | | | | | | | | | | | |
Zayo Group LLC/Zayo Capital, Inc.,
6.00%, 4/01/23 (b) | | | | | | | 380 | | | | 388,550 | |
IT Services — 0.5% | | | | | | | | | | | | |
APX Group, Inc., 6.38%, 12/01/19 | | | | | | | 550 | | | | 551,375 | |
Marine — 0.5% | | | | | | | | | | | | |
Stena International SA, 5.75%, 3/01/24 (b) | | | | | | | 529 | | | | 497,260 | |
Media — 0.9% | | | | | | | | | | | | |
iHeartCommunications, Inc.: | | | | | | | | | | | | |
9.00%, 3/01/21 | | | | | | | 85 | | | | 82,025 | |
10.63%, 3/15/23 (b) | | | | | | | 465 | | | | 475,463 | |
Visant Corp., 10.00%, 10/01/17 | | | | | | | 380 | | | | 342,950 | |
| | | | | | | | | | | | |
| | | | | | | | | | | | 900,438 | |
Oil, Gas & Consumable Fuels — 0.5% | | | | | | | | | | | | |
Sabine Pass Liquefaction LLC, 6.25%, 3/15/22 | | | | | | | 500 | | | | 526,250 | |
Personal Products — 0.0% | | | | | | | | | | | | |
Avon Products, Inc., 4.60%, 3/15/20 | | | | | | | 55 | | | | 51,195 | |
Semiconductors & Semiconductor Equipment — 0.3% | | | | | | | | | |
Freescale Semiconductor, Inc.: | | | | | �� | | | | | | | |
5.00%, 5/15/21 (b) | | | | | | | 26 | | | | 27,300 | |
6.00%, 1/15/22 (b) | | | | | | | 282 | | | | 303,855 | |
| | | | | | | | | | | | |
| | | | | | | | | | | | 331,155 | |
Textiles, Apparel & Luxury Goods — 0.4% | | | | | | | | | | | | |
American Achievement Corp., 10.88%, 4/15/16 (b) | | | | | | | 405 | | | | 401,962 | |
Wireless Telecommunication Services — 0.7% | | | | | | | | | | | | |
NII Capital Corp., 7.63%, 4/01/21 (c)(d) | | | | | | | 42 | | | | 14,700 | |
NII International Telecom SCA, 7.88%, 8/15/19 (b)(c)(d) | | | | | | | 692 | | | | 662,590 | |
| | | | | | | | | | | | |
| | | | | | | | | | | | 677,290 | |
Total Corporate Bonds — 13.3% | | | | | | | | | | | 13,601,398 | |
| | | | | | | | | | | | |
| | | | | | | | | | | | | |
| | | | | | | | | | | | |
| Floating Rate Loan Interests (a) | | | | | Par
(000) | | | Value | |
Advertising — 0.4% | | | | | | | | | | | | |
Affinion Group, Inc., Initial Second Lien Term Loan, 8.50%, 10/31/18 | | | USD | | | | 424 | | | $ | 371,530 | |
Commercial Services & Supplies — 0.3% | | | | | | | | | | | | |
Cory Environmental (Viking Consortium Acquisition Ltd.): | | | | | | | | | | | | |
Line of Credit, 2.81% - 2.82%, 9/30/15 | | | GBP | | | | 30 | | | | 34,983 | |
Line of Credit, 2.82%, 9/30/15 | | | | | | | 66 | | | | 79,838 | |
Revolving Loan, 2.82%, 9/30/15 | | | | | | | 30 | | | | 36,061 | |
Term Loan, 2.81% - 2.82%, 9/30/15 | | | | | | | 132 | | | | 154,194 | |
Term Loan, 2.81% - 2.82%, 9/30/15 | | | | | | | 23 | | | | 27,221 | |
| | | | | | | | | | | | |
| | | | | | | | | | | | 332,297 | |
Diversified Telecommunication Services — 1.1% | | | | | | | | | |
LightSquared LP, DIP Term Loan A,
9.00%, 12/31/15 | | | USD | | | | 1,178 | | | | 1,170,016 | |
Electric Utilities — 0.6% | | | | | | | | | | | | |
Texas Competitive Electric Holdings Co. LLC (TXU): | | | | | | | | | | | | |
2014 Term Loan (Non-Extending), 4.66%, 10/10/14 | | | | | | | 361 | | | | 228,332 | |
2017 Term Loan (Extending), 4.66%, 10/10/17 | | | | | | | 550 | | | | 351,081 | |
| | | | | | | | | | | | |
| | | | | | | | | | | | 579,413 | |
Food Products — 0.2% | | | | | | | | | | | | |
Brake Bros Finance PLC, Term Loan D,
6.82%, 3/13/17 | | | GBP | | | | 141 | | | | 210,609 | |
Specialty Retail — 0.4% | | | | | | | | | | | | |
The Sports Authority, Inc., Term B Loan,
7.50%, 11/12/17 | | | USD | | | | 476 | | | | 408,565 | |
Total Floating Rate Loan Interests — 3.0% | | | | | | | | 3,072,430 | |
| | | | | | | | | | | | |
| Investment Companies | | | | | Shares | | | | |
BlackRock Global Long/Short Credit Fund (e) | | | | | | | 728,955 | | | | 7,690,475 | |
BlackRock Global Long/Short Equity Fund (e) | | | | | | | 1,466,266 | | | | 17,477,891 | |
Total Investment Companies — 24.7% | | | | | | | | 25,168,366 | |
| | | | | | | | | | | | |
| | | | |
| Non-Agency Mortgage-Backed Securities | | | | | Par
(000) | | | | |
Collateralized Mortgage Obligations — 7.9% | | | | | | | | | |
Bear Stearns ALT-A Trust: | | | | | | | | | | | | |
Series 2005-10, Class 11A1, 0.67%, 1/25/36 (a) | | | USD | | | | 2,083 | | | | 1,629,116 | |
Series 2006-4, Class 23A4, 2.54%, 8/25/36 (a) | | | | | | | 2,341 | | | | 1,377,702 | |
CHL Mortgage Pass-Through Trust,
Series 2007-4, Class 1A36,
0.47%, 5/25/37 (a) | | | | | | | 1,930 | | | | 1,376,322 | |
See Notes to Financial Statements.
| | | | | | |
| 10 | | BLACKROCK MULTI-MANAGER ALTERNATIVE STRATEGIES FUND | | FEBRUARY 28, 2015 | | |
| | | | |
| Schedule of Investments (continued) | | | (Percentages shown are based on Net Assets) | |
| | | | |
| | | | | | | | | | | | |
| Non-Agency Mortgage-Backed Securities | | | | | Par
(000) | | | Value | |
Collateralized Mortgage Obligations (concluded) | |
Countrywide Alternative Loan Trust: | | | | | | | | | | | | |
Series 2005-J12, Class 2A4, 0.57%, 8/25/35 (a) | | | USD | | | | 986 | | | $ | 650,814 | |
Series 2007-OA6, Class A1B, 0.37%, 6/25/37 (a) | | | | | | | 1,056 | | | | 872,166 | |
GreenPoint Mortgage Funding Trust,
Series 2007-AR1, Class 3A2, 0.33%, 2/25/37 (a) | | | | | | | 2,202 | | | | 1,740,254 | |
WaMu Mortgage Pass-Through Certificates,
Series 2006-AR11, Class 1A,
1.07%, 9/25/46 (a) | | | | | | | 469 | | | | 396,651 | |
Commercial Mortgage-Backed Securities — 0.7% | |
Banc of America Merrill Lynch Commercial Mortgage, Inc.: | | | | | | | | | | | | |
Series 2005-6, Class KCC, 5.64%, 9/10/47 (a)(b) | | | | | | | 26 | | | | 26,458 | |
Series 2005-6, Class KCD, 6.14%, 9/10/47 (a)(b) | | | | | | | 26 | | | | 26,453 | |
Series 2005-6, Class KCE, 6.33%, 9/10/47 (a)(b) | | | | | | | 379 | | | | 382,211 | |
Series 2005-6, Class KCF, 6.92%, 9/10/47 (a)(b) | | | | | | | 261 | | | | 263,380 | |
Total Non-Agency Mortgage-Backed Securities — 8.6% | | | | 8,741,527 | |
| | | | | | | | | | | | |
| Preferred Securities | | | | | | | | | |
| | | |
Capital Trusts | | | | | | | | | | | | |
Banks — 0.7% | | | | | | | | | | | | |
BNP Paribas Fortis SA,2.22% (a)(f)(h) | | | EUR | | | | 250 | | | | 203,526 | |
HSH Nordbank AG, 2.64% (a)(f) | | | | | | | 629 | | | | 193,567 | |
Societe Generale SA, 7.88% (a)(b)(f) | | | USD | | | | 360 | | | | 364,950 | |
| | | | | | | | | | | | |
| | | | | | | | | | | | 762,043 | |
Diversified Financial Services — 0.7% | | | | | | | | | | | | |
The Bank of New York Mellon Luxembourg SA,
4.55%, 12/15/50 (a)(h) | | | EUR | | | | 800 | | | | 568,474 | |
Hypo Real Estate International Trust I,
5.86% (a)(f) | | | | | | | 100 | | | | 101,878 | |
RESPARCS Funding II LP, 7.50% (f) | | | | | | | 85 | | | | 31,575 | |
| | | | | | | | | | | | |
| | | | | | | | | | | | 701,927 | |
Insurance — 0.5% | | | | | | | | | | | | |
Syncora Holdings Ltd., 6.88% (a)(f) | | | USD | | | | 1,023 | | | | 478,398 | |
Total Capital Trusts — 1.9% | | | | | | | | | | | 1,942,368 | |
| | | | | | | | | | | | |
| Preferred Stocks | | | | | Shares | | | | |
Air Freight & Logistics — 0.2% | | | | | | | | | | | | |
CEVA Holdings LLC (c) | | | | | | | 31 | | | | 29,100 | |
CEVA Holdings LLC (c) | | | | | | | 100 | | | | 127,500 | |
Total Preferred Stocks — 0.2% | | | | | | | | | | | 156,600 | |
Total Preferred Securities — 2.1% | | | | | | | | | | | 2,098,968 | |
| | | | | | | | | | | | |
| | | | | | | | | | |
| | | | | | | | | | | | |
| Taxable Municipal Bonds — 0.4% | | | | | Par (000) | | | Value | |
Commonwealth of Puerto Rico GO,
8.00%, 7/01/35 | | | USD | | | | 500 | | | $ | 416,885 | |
| | | | | | | | | | | | |
| U.S. Treasury Obligations | | | | | | | | | |
U.S. Treasury Bonds,3.00%, 11/15/44 | | | | | | | 182 | | | | 197,072 | |
U.S. Treasury Notes: | | | | | | | | | | | | |
2.00%, 11/30/21 | | | | | | | 230 | | | | 230,988 | |
1.63%, 1/31/22 | | | | | | | 332 | | | | 325,179 | |
Total U.S. Treasury Obligations — 0.7% | | | | | | | | 753,239 | |
Total Long-Term Investments (Cost — $63,486,467) — 61.3% | | | | | | | | | | | 62,508,855 | |
| | | | | | | | | | | | |
| Short-Term Securities | | | | | Shares | | | | |
Money Market Funds — 34.4% | | | | | | | | | | | | |
BlackRock Liquidity Funds, TempFund, Institutional Class, 0.05% (e)(g) | | | | | | | 35,122,733 | | | | 35,122,733 | |
Total Short-Term Securities (Cost — $35,122,733) — 34.4% | | | | | | | | | | | 35,122,733 | |
Total Investments Before Investments Sold Short (Cost — $98,609,200) — 95.7% | | | | 97,631,588 | |
| | | | | | | | | | | | |
| Investments Sold Short | | | | | | | | | |
| | | |
| Corporate Bonds | | | | | Par (000) | | | | |
Consumer Finance — (0.1)% | | | | | | | | | | | | |
ACE Cash Express, Inc.,
11.00%, 2/01/19 (b) | | | USD | | | | 94 | | | | (63,450 | ) |
Community Choice Financial, Inc.,
10.75%, 5/01/19 | | | | | | | 8 | | | | (5,120 | ) |
| | | | | | | | | | | | |
| | | | | | | | | | | | (68,570 | ) |
Diversified Financial Services — (0.4)% | |
Rio Oil Finance Trust, 6.75%, 1/06/27 (b) | | | | | | | 500 | | | | (457,500 | ) |
Energy Equipment & Services — (0.2)% | |
Ensco PLC, 5.75%, 10/01/44 | | | | | | | 208 | | | | (216,538 | ) |
Metals & Mining — (0.6)% | | | | | | | | | | | | |
Imperial Metals Corp., 7.00%, 3/15/19 (b) | | | | | | | 170 | | | | (161,500 | ) |
Teck Resources Ltd., 4.75%, 1/15/22 | | | | | | | 250 | | | | (243,536 | ) |
Vale Overseas Ltd., 4.38%, 1/11/22 | | | | | | | 250 | | | | (242,990 | ) |
| | | | | | | | | | | | |
| | | | | | | | | | | | (648,026 | ) |
Oil, Gas & Consumable Fuels — (0.2)% | |
Calfrac Holdings LP, 7.50%, 12/01/20 (b) | | | | | | | 225 | | | | (201,937 | ) |
Total Corporate Bonds — (1.5)% | | | | | | | | | | | (1,592,571 | ) |
| | | | | | | | | | | | |
| Foreign Agency Obligations — (0.2)% | | | | | | | | | |
Petrobras Global Finance BV, 6.25%, 3/17/24 | | | | | | | 184 | | | | (169,648 | ) |
Total Investments Sold Short (Proceeds — $1,772,655) — (1.7)% | | | | | | | | (1,762,219 | ) |
See Notes to Financial Statements.
| | | | | | |
| | | BLACKROCK MULTI-MANAGER ALTERNATIVE STRATEGIES FUND | | FEBRUARY 28, 2015 | | 11 |
| | |
| Schedule of Investments (continued) | | |
| | | | | | | | |
| | | | | | | Value | |
Total Investments Net of Investments Sold Short — 94.0% | | | | | | $ | 95,869,369 | |
Other Assets Less Liabilities — 6.0% | | | | | | | 6,112,469 | |
| | | | | | | | |
Net Assets — 100.0% | | | | | | $ | 101,981,838 | |
| | | | | | | | |
|
| Notes to Schedule of Investments |
| (a) | Variable rate security. Rate shown is as of report date. |
| (b) | Security exempt from registration pursuant to Rule 144A under the Securities Act of 1933, as amended. These securities may be resold in transactions exempt from registration to qualified institutional investors. |
| (c) | Non-income producing security. |
| (d) | Issuer filed for bankruptcy and/or is in default of interest payments. |
| (e) | During the six months ended February 28, 2015, investments in issuers considered to be affiliates of the Fund for purposes of Section 2(a)(3) of the Investment Company Act of 1940, as amended, were as follows: |
| | | | | | | | | | | | | | | | | | | | | | | | | | | | |
| Affiliate | | Shares Held at
August 31, 2014 | | | Shares
Purchased | | | Shares
Sold | | | Shares Held at
February 28, 2015 | | | Value at
February 28, 2015 | | | Income | | | Realized
Gain | |
BlackRock Global Long/Short Credit Fund | | | 686,813 | | | | 42,142 | | | | — | | | | 728,955 | | | $ | 7,690,475 | | | | — | | | $ | 317,870 | |
BlackRock Global Long/Short Equity Fund | | | 1,080,380 | | | | 385,886 | | | | — | | | | 1,466,266 | | | $ | 17,477,891 | | | | — | | | $ | 15,242 | |
BlackRock Liquidity Funds, TempFund, Institutional Class | | | 33,857,047 | | | | 1,265,686 | 1 | | | — | | | | 35,122,733 | | | $ | 35,122,733 | | | $ | 6,516 | | | $ | 2,203 | |
| | 1 | | Represents net shares purchased. |
| (f) | Security is perpetual in nature and has no stated maturity date. |
| (g) | Represents the current yield as of report date. |
| Ÿ | | For Fund compliance purposes, the Fund’s industry classifications refer to any one or more of the industry sub-classifications used by one or more widely recognized market indexes or ratings group indexes, and/or as defined by the investment advisor. These definitions may not apply for purposes of this report, which may combine such industry sub-classifications for reporting ease. |
| Ÿ | | As of February 28, 2015, financial futures contracts outstanding were as follows: |
| | | | | | | | | | | | | | | | | | | | |
Contracts
Long/
(Short) | | | Issue | | Exchange | | Expiration | | | | | Notional
Value | | | Unrealized
Appreciation
(Depreciation) | |
| | (1 | ) | | 30 Day Fed Fund Futures | | Chicago Board of Trade | | March 2015 | | | USD | | | | 416,200 | | | $ | (38 | ) |
| | 5 | | | Amsterdam Exchanges Index Futures | | Amsterdam | | March 2015 | | | USD | | | | 541,393 | | | | 18,076 | |
| | (6 | ) | | ASX SPI 200 Index Futures | | Sydney | | March 2015 | | | USD | | | | 693,183 | | | | (5,564 | ) |
| | (35 | ) | | Australian Government Bonds (10 Year) | | Sydney | | March 2015 | | | USD | | | | 3,605,902 | | | | (9,287 | ) |
| | (73 | ) | | Australian Government Bonds (3 Year) | | Sydney | | March 2015 | | | USD | | | | 6,416,840 | | | | (26,213 | ) |
| | 1 | | | CAC 40 10 Euro Futures | | Paris | | March 2015 | | | USD | | | | 55,409 | | | | 322 | |
| | 5 | | | DAX Stock Index Futures | | Eurex | | March 2015 | | | USD | | | | 1,592,469 | | | | 89,079 | |
| | 10 | | | E-Mini Nasdaq 100 Futures | | Chicago Mercantile | | March 2015 | | | USD | | | | 888,500 | | | | 34,103 | |
| | (6 | ) | | E-Mini Russell 2000 Futures | | Intercontinental Exchange | | March 2015 | | | USD | | | | 738,960 | | | | (13,267 | ) |
| | (10 | ) | | E-Mini S&P 500 Futures | | Chicago Mercantile | | March 2015 | | | USD | | | | 1,051,400 | | | | (9,096 | ) |
| | 7 | | | Euro STOXX 50 Index | | Eurex | | March 2015 | | | USD | | | | 281,216 | | | | 9,627 | |
| | 5 | | | Euro-Bobl | | Eurex | | March 2015 | | | USD | | | | 733,981 | | | | 1,290 | |
| | 86 | | | Euro-Bund | | Eurex | | March 2015 | | | USD | | | | 15,346,075 | | | | 54,691 | |
| | (105 | ) | | Euro-Schatz | | Eurex | | March 2015 | | | USD | | | | 13,079,469 | | | | (38,715 | ) |
| | (34 | ) | | FTSE 100 Index Futures | | NYSE Liffe | | March 2015 | | | USD | | | | 3,632,377 | | | | (82,731 | ) |
| | 1 | | | FTSE/MIB Index Futures | | Borsa Italiana | | March 2015 | | | USD | | | | 125,020 | | | | 11,160 | |
| | 2 | | | Hang Seng Index Futures | | Hong Kong | | March 2015 | | | USD | | | | 319,683 | | | | 996 | |
| | 12 | | | Japanese Government Bonds (10 Year) | | Osaka | | March 2015 | | | USD | | | | 14,836,364 | | | | 1,174 | |
| | 3 | | | Nikkei 225 Index | | Osaka | | March 2015 | | | USD | | | | 471,975 | | | | 11,874 | |
See Notes to Financial Statements.
| | | | | | |
| 12 | | BLACKROCK MULTI-MANAGER ALTERNATIVE STRATEGIES FUND | | FEBRUARY 28, 2015 | | |
| | |
| Schedule of Investments (continued) | | |
| | |
As of February 28, 2015, financial futures contracts outstanding were as follows: (concluded)
| | | | | | | | | | | | | | | | | | | | |
Contracts Long/ (Short) | | | Issue | | Exchange | | Expiration | | Notional Value | | | Unrealized
Appreciation
(Depreciation) | |
| | 53 | | | OMXS30 Index | | Stockholm | | March 2015 | | | USD | | | | 1,070,871 | | | $ | 29,987 | |
| | 9 | | | S&P/Toronto Stock Exchange 60 Index | | Montreal | | March 2015 | | | USD | | | | 1,280,202 | | | | 28,593 | |
| | 4 | | | SGX MSCI Singapore Index | | Singapore | | March 2015 | | | USD | | | | 224,236 | | | | (3,049 | ) |
| | 13 | | | TOPIX Index Futures | | Osaka | | March 2015 | | | USD | | | | 1,657,806 | | | | 46,733 | |
| | | | 3-month Canadian Bankers | | | | | | | | | | | | | | | | |
| | 9 | | | Acceptance | | Montreal | | June 2015 | | | USD | | | | 1,784,377 | | | | 174 | |
| | 6 | | | ASX 90 Day Bank Accepted Bills | | Sydney | | June 2015 | | | USD | | | | 4,672,581 | | | | 1,585 | |
| | (28 | ) | | Canadian Government Bonds (10 Year) | | Montreal | | June 2015 | | | USD | | | | 3,217,279 | | | | (37,849 | ) |
| | (28 | ) | | Gilt British | | NYSE Liffe | | June 2015 | | | USD | | | | 5,125,530 | | | | (1,849 | ) |
| | (4 | ) | | Three Month Euro Swiss Franc
Interest Rate Futures | | NYSE Liffe | | June 2015 | | | USD | | | | 1,058,373 | | | | (3,537 | ) |
| | (1 | ) | | Three Month Euroyen Futures | | Tokyo | | June 2015 | | | USD | | | | 208,673 | | | | (28 | ) |
| | (19 | ) | | U.S. Treasury Bonds (30 Year) | | Chicago Board of Trade | | June 2015 | | | USD | | | | 3,075,031 | | | | (403 | ) |
| | (78 | ) | | U.S. Treasury Notes (2 Year) | | Chicago Board of Trade | | June 2015 | | | USD | | | | 17,049,094 | | | | (13,122 | ) |
| | 41 | | | U.S. Treasury Notes (5 Year) | | Chicago Board of Trade | | June 2015 | | | USD | | | | 4,890,531 | | | | 10,894 | |
| | 67 | | | U.S. Treasury Notes (10 Year) | | Chicago Board of Trade | | June 2015 | | | USD | | | | 8,562,391 | | | | 29,824 | |
| | (11 | ) | | 3-month EURIBOR | | NYSE Liffe | | December 2015 | | | USD | | | | 3,077,371 | | | | (1,479 | ) |
| | (126 | ) | | Euro Dollar Futures | | Chicago Mercantile | | December 2015 | | | USD | | | | 31,257,450 | | | | 5,091 | |
| | 26 | | | Three Month Sterling | | NYSE Liffe | | December 2015 | | | USD | | | | 4,976,880 | | | | 409 | |
| | Total | | | | | | | | | | | | | | | | | $ | 139,455 | |
| | | | | | | | | | | | | | | | | | | | |
| Ÿ | | As of February 28, 2015, forward foreign currency exchange contracts outstanding were as follows: |
| | | | | | | | | | | | | | | | | | | | | | |
Currency
Purchased | | | Currency
Sold | | | Counterparty | | Settlement
Date | | | Unrealized
Appreciation
(Depreciation) | |
| AUD | | | 2,234 | | | | USD | | | | 1,830 | | | JPMorgan Chase Bank N.A. | | | 3/18/15 | | | $ | (86 | ) |
| AUD | | | 8,206 | | | | USD | | | | 6,593 | | | JPMorgan Chase Bank N.A. | | | 3/18/15 | | | | (189 | ) |
| AUD | | | 10,019 | | | | USD | | | | 7,762 | | | JPMorgan Chase Bank N.A. | | | 3/18/15 | | | | 57 | |
| AUD | | | 10,794 | | | | USD | | | | 8,398 | | | JPMorgan Chase Bank N.A. | | | 3/18/15 | | | | 26 | |
| AUD | | | 11,419 | | | | USD | | | | 9,253 | | | JPMorgan Chase Bank N.A. | | | 3/18/15 | | | | (342 | ) |
| AUD | | | 13,716 | | | | USD | | | | 11,002 | | | JPMorgan Chase Bank N.A. | | | 3/18/15 | | | | (298 | ) |
| AUD | | | 14,907 | | | | USD | | | | 12,198 | | | JPMorgan Chase Bank N.A. | | | 3/18/15 | | | | (564 | ) |
| AUD | | | 17,683 | | | | USD | | | | 14,481 | | | JPMorgan Chase Bank N.A. | | | 3/18/15 | | | | (681 | ) |
| AUD | | | 27,579 | | | | USD | | | | 22,317 | | | JPMorgan Chase Bank N.A. | | | 3/18/15 | | | | (794 | ) |
| AUD | | | 58,149 | | | | USD | | | | 46,643 | | | JPMorgan Chase Bank N.A. | | | 3/18/15 | | | | (1,262 | ) |
| AUD | | | 133,548 | | | | USD | | | | 107,825 | | | JPMorgan Chase Bank N.A. | | | 3/18/15 | | | | (3,602 | ) |
| AUD | | | 147,573 | | | | USD | | | | 114,811 | | | JPMorgan Chase Bank N.A. | | | 3/18/15 | | | | 357 | |
| AUD | | | 147,715 | | | | USD | | | | 119,102 | | | JPMorgan Chase Bank N.A. | | | 3/18/15 | | | | (3,823 | ) |
| AUD | | | 158,769 | | | | USD | | | | 123,411 | | | JPMorgan Chase Bank N.A. | | | 3/18/15 | | | | 495 | |
| AUD | | | 164,420 | | | | USD | | | | 127,731 | | | JPMorgan Chase Bank N.A. | | | 3/18/15 | | | | 585 | |
| AUD | | | 251,175 | | | | USD | | | | 194,599 | | | JPMorgan Chase Bank N.A. | | | 3/18/15 | | | | 1,423 | |
| AUD | | | 356,952 | | | | USD | | | | 276,002 | | | JPMorgan Chase Bank N.A. | | | 3/18/15 | | | | 2,569 | |
| AUD | | | 368,152 | | | | USD | | | | 298,330 | | | JPMorgan Chase Bank N.A. | | | 3/18/15 | | | | (11,019 | ) |
| AUD | | | 378,829 | | | | USD | | | | 298,139 | | | JPMorgan Chase Bank N.A. | | | 3/18/15 | | | | (2,495 | ) |
| AUD | | | 440,933 | | | | USD | | | | 345,439 | | | JPMorgan Chase Bank N.A. | | | 3/18/15 | | | | (1,328 | ) |
| AUD | | | 444,446 | | | | USD | | | | 363,667 | | | JPMorgan Chase Bank N.A. | | | 3/18/15 | | | | (16,814 | ) |
See Notes to Financial Statements.
| | | | | | |
| | | BLACKROCK MULTI-MANAGER ALTERNATIVE STRATEGIES FUND | | FEBRUARY 28, 2015 | | 13 |
| | |
| Schedule of Investments (continued) | | |
As of February 28, 2015, forward foreign currency exchange contracts outstanding were as follows: (continued)
| | | | | | | | | | | | | | | | | | | | | | |
Currency Purchased | | | Currency Sold | | | Counterparty | | Settlement
Date | | | Unrealized
Appreciation
(Depreciation) | |
| AUD | | | 481,700 | | | | USD | | | | 387,017 | | | JPMorgan Chase Bank N.A. | | | 3/18/15 | | | $ | (11,090 | ) |
| AUD | | | 544,044 | | | | USD | | | | 439,806 | | | JPMorgan Chase Bank N.A. | | | 3/18/15 | | | | (15,225 | ) |
| AUD | | | 544,045 | | | | USD | | | | 439,839 | | | JPMorgan Chase Bank N.A. | | | 3/18/15 | | | | (15,257 | ) |
| AUD | | | 625,021 | | | | USD | | | | 495,397 | | | JPMorgan Chase Bank N.A. | | | 3/18/15 | | | | (7,620 | ) |
| AUD | | | 802,341 | | | | USD | | | | 650,778 | | | JPMorgan Chase Bank N.A. | | | 3/18/15 | | | | (24,618 | ) |
| AUD | | | 980,000 | | | | USD | | | | 756,481 | | | JPMorgan Chase Bank N.A. | | | 3/18/15 | | | | 8,328 | |
| AUD | | | 980,000 | | | | USD | | | | 756,558 | | | JPMorgan Chase Bank N.A. | | | 3/18/15 | | | | 8,250 | |
| AUD | | | 980,000 | | | | USD | | | | 763,379 | | | JPMorgan Chase Bank N.A. | | | 3/18/15 | | | | 1,429 | |
| AUD | | | 980,000 | | | | USD | | | | 763,477 | | | JPMorgan Chase Bank N.A. | | | 3/18/15 | | | | 1,331 | |
| AUD | | | 1,095,806 | | | | USD | | | | 853,521 | | | JPMorgan Chase Bank N.A. | | | 3/18/15 | | | | 1,664 | |
| AUD | | | 1,333,575 | | | | USD | | | | 1,029,597 | | | JPMorgan Chase Bank N.A. | | | 3/18/15 | | | | 11,147 | |
| CAD | | | 945 | | | | USD | | | | 823 | | | JPMorgan Chase Bank N.A. | | | 3/18/15 | | | | (67 | ) |
| CAD | | | 2,267 | | | | USD | | | | 1,942 | | | JPMorgan Chase Bank N.A. | | | 3/18/15 | | | | (129 | ) |
| CAD | | | 4,782 | | | | USD | | | | 3,863 | | | JPMorgan Chase Bank N.A. | | | 3/18/15 | | | | (39 | ) |
| CAD | | | 11,433 | | | | USD | | | | 9,048 | | | JPMorgan Chase Bank N.A. | | | 3/18/15 | | | | 95 | |
| CAD | | | 21,763 | | | | USD | | | | 18,374 | | | JPMorgan Chase Bank N.A. | | | 3/18/15 | | | | (970 | ) |
| CAD | | | 24,238 | | | | USD | | | | 19,514 | | | JPMorgan Chase Bank N.A. | | | 3/18/15 | | | | (130 | ) |
| CAD | | | 186,669 | | | | USD | | | | 149,056 | | | JPMorgan Chase Bank N.A. | | | 3/18/15 | | | | 224 | |
| CAD | | | 274,040 | | | | USD | | | | 216,883 | | | JPMorgan Chase Bank N.A. | | | 3/18/15 | | | | 2,268 | |
| CAD | | | 277,029 | | | | USD | | | | 238,596 | | | JPMorgan Chase Bank N.A. | | | 3/18/15 | | | | (17,054 | ) |
| CAD | | | 284,922 | | | | USD | | | | 229,252 | | | JPMorgan Chase Bank N.A. | | | 3/18/15 | | | | (1,397 | ) |
| CAD | | | 293,833 | | | | USD | | | | 236,086 | | | JPMorgan Chase Bank N.A. | | | 3/18/15 | | | | (1,105 | ) |
| CAD | | | 453,388 | | | | USD | | | | 393,703 | | | JPMorgan Chase Bank N.A. | | | 3/18/15 | | | | (31,125 | ) |
| CAD | | | 569,363 | | | | USD | | | | 456,176 | | | JPMorgan Chase Bank N.A. | | | 3/18/15 | | | | (1,321 | ) |
| CAD | | | 1,102,225 | | | | USD | | | | 946,807 | | | JPMorgan Chase Bank N.A. | | | 3/18/15 | | | | (65,349 | ) |
| CAD | | | 1,102,387 | | | | USD | | | | 884,199 | | | JPMorgan Chase Bank N.A. | | | 3/18/15 | | | | (2,611 | ) |
| CAD | | | 1,113,993 | | | | USD | | | | 887,212 | | | JPMorgan Chase Bank N.A. | | | 3/18/15 | | | | 3,657 | |
| CAD | | | 1,163,267 | | | | USD | | | | 926,251 | | | JPMorgan Chase Bank N.A. | | | 3/18/15 | | | | 4,022 | |
| CAD | | | 1,221,799 | | | | USD | | | | 980,000 | | | JPMorgan Chase Bank N.A. | | | 3/18/15 | | | | (2,918 | ) |
| CAD | | | 1,223,950 | | | | USD | | | | 980,000 | | | JPMorgan Chase Bank N.A. | | | 3/18/15 | | | | (1,198 | ) |
| CAD | | | 1,237,812 | | | | USD | | | | 980,000 | | | JPMorgan Chase Bank N.A. | | | 3/18/15 | | | | 9,887 | |
| CAD | | | 1,412,348 | | | | USD | | | | 1,197,322 | | | JPMorgan Chase Bank N.A. | | | 3/18/15 | | | | (67,857 | ) |
| CAD | | | 1,564,047 | | | | USD | | | | 1,339,634 | | | JPMorgan Chase Bank N.A. | | | 3/18/15 | | | | (88,854 | ) |
| CAD | | | 1,668,696 | | | | USD | | | | 1,436,208 | | | JPMorgan Chase Bank N.A. | | | 3/18/15 | | | | (101,740 | ) |
| CAD | | | 1,680,289 | | | | USD | | | | 1,345,352 | | | JPMorgan Chase Bank N.A. | | | 3/18/15 | | | | (1,612 | ) |
| CAD | | | 1,978,570 | | | | USD | | | | 1,566,572 | | | JPMorgan Chase Bank N.A. | | | 3/18/15 | | | | 15,705 | |
| EUR | | | 3,128 | | | | USD | | | | 3,707 | | | JPMorgan Chase Bank N.A. | | | 3/18/15 | | | | (206 | ) |
| EUR | | | 5,228 | | | | USD | | | | 6,231 | | | JPMorgan Chase Bank N.A. | | | 3/18/15 | | | | (379 | ) |
| EUR | | | 11,052 | | | | USD | | | | 12,943 | | | JPMorgan Chase Bank N.A. | | | 3/18/15 | | | | (573 | ) |
| EUR | | | 11,410 | | | | USD | | | | 13,473 | | | JPMorgan Chase Bank N.A. | | | 3/18/15 | | | | (701 | ) |
| EUR | | | 12,835 | | | | USD | | | | 15,026 | | | JPMorgan Chase Bank N.A. | | | 3/18/15 | | | | (659 | ) |
| EUR | | | 26,740 | | | | USD | | | | 30,406 | | | JPMorgan Chase Bank N.A. | | | 3/18/15 | | | | (476 | ) |
| EUR | | | 26,967 | | | | USD | | | | 32,899 | | | JPMorgan Chase Bank N.A. | | | 3/18/15 | | | | (2,714 | ) |
| EUR | | | 65,200 | | | | USD | | | | 74,140 | | | JPMorgan Chase Bank N.A. | | | 3/18/15 | | | | (1,160 | ) |
See Notes to Financial Statements.
| | | | | | |
| 14 | | BLACKROCK MULTI-MANAGER ALTERNATIVE STRATEGIES FUND | | FEBRUARY 28, 2015 | | |
| | |
| Schedule of Investments (continued) | | |
As of February 28, 2015, forward foreign currency exchange contracts outstanding were as follows: (continued)
| | | | | | | | | | | | | | | | | | | | | | |
Currency Purchased | | | Currency
Sold | | | Counterparty | | Settlement
Date | | | Unrealized
Appreciation
(Depreciation) | |
| EUR | | | 68,576 | | | | USD | | | | 81,619 | | | JPMorgan Chase Bank N.A. | | | 3/18/15 | | | $ | (4,860 | ) |
| EUR | | | 79,394 | | | | USD | | | | 89,910 | | | JPMorgan Chase Bank N.A. | | | 3/18/15 | | | | (1,042 | ) |
| EUR | | | 95,219 | | | | USD | | | | 107,736 | | | JPMorgan Chase Bank N.A. | | | 3/18/15 | | | | (1,155 | ) |
| EUR | | | 111,537 | | | | USD | | | | 126,629 | | | JPMorgan Chase Bank N.A. | | | 3/18/15 | | | | (1,783 | ) |
| EUR | | | 111,736 | | | | USD | | | | 131,603 | | | JPMorgan Chase Bank N.A. | | | 3/18/15 | | | | (6,534 | ) |
| EUR | | | 114,966 | | | | USD | | | | 137,026 | | | JPMorgan Chase Bank N.A. | | | 3/18/15 | | | | (8,342 | ) |
| EUR | | | 194,458 | | | | USD | | | | 226,352 | | | JPMorgan Chase Bank N.A. | | | 3/18/15 | | | | (8,690 | ) |
| EUR | | | 217,599 | | | | USD | | | | 266,239 | | | JPMorgan Chase Bank N.A. | | | 3/18/15 | | | | (22,675 | ) |
| EUR | | | 424,546 | | | | USD | | | | 503,176 | | | JPMorgan Chase Bank N.A. | | | 3/18/15 | | | | (27,971 | ) |
| EUR | | | 458,946 | | | | USD | | | | 540,189 | | | JPMorgan Chase Bank N.A. | | | 3/18/15 | | | | (26,479 | ) |
| EUR | | | 461,603 | | | | USD | | | | 543,677 | | | JPMorgan Chase Bank N.A. | | | 3/18/15 | | | | (26,993 | ) |
| EUR | | | 539,548 | | | | USD | | | | 611,014 | | | JPMorgan Chase Bank N.A. | | | 3/18/15 | | | | (7,084 | ) |
| EUR | | | 651,567 | | | | USD | | | | 769,948 | | | JPMorgan Chase Bank N.A. | | | 3/18/15 | | | | (40,633 | ) |
| EUR | | | 747,620 | | | | USD | | | | 840,015 | | | JPMorgan Chase Bank N.A. | | | 3/18/15 | | | | (3,186 | ) |
| EUR | | | 858,619 | | | | USD | | | | 974,033 | | | JPMorgan Chase Bank N.A. | | | 3/18/15 | | | | (12,960 | ) |
| EUR | | | 968,208 | | | | USD | | | | 1,086,874 | | | JPMorgan Chase Bank N.A. | | | 3/18/15 | | | | (2,779 | ) |
| EUR | | | 968,948 | | | | USD | | | | 1,134,774 | | | JPMorgan Chase Bank N.A. | | | 3/18/15 | | | | (50,206 | ) |
| EUR | | | 980,000 | | | | USD | | | | 1,135,122 | | | JPMorgan Chase Bank N.A. | | | 3/18/15 | | | | (38,184 | ) |
| EUR | | | 1,103,966 | | | | USD | | | | 1,303,525 | | | JPMorgan Chase Bank N.A. | | | 3/18/15 | | | | (67,828 | ) |
| EUR | | | 1,125,203 | | | | USD | | | | 1,317,274 | | | JPMorgan Chase Bank N.A. | | | 3/18/15 | | | | (57,807 | ) |
| EUR | | | 1,164,205 | | | | USD | | | | 1,317,249 | | | JPMorgan Chase Bank N.A. | | | 3/18/15 | | | | (14,126 | ) |
| EUR | | | 1,189,259 | | | | USD | | | | 1,377,362 | | | JPMorgan Chase Bank N.A. | | | 3/18/15 | | | | (46,195 | ) |
| EUR | | | 1,313,152 | | | | USD | | | | 1,488,216 | | | JPMorgan Chase Bank N.A. | | | 3/18/15 | | | | (18,373 | ) |
| GBP | | | 1,692 | | | | USD | | | | 2,541 | | | JPMorgan Chase Bank N.A. | | | 3/18/15 | | | | 71 | |
| GBP | | | 3,590 | | | | USD | | | | 5,473 | | | JPMorgan Chase Bank N.A. | | | 3/18/15 | | | | 68 | |
| GBP | | | 3,901 | | | | USD | | | | 5,919 | | | JPMorgan Chase Bank N.A. | | | 3/18/15 | | | | 102 | |
| GBP | | | 5,309 | | | | USD | | | | 8,161 | | | JPMorgan Chase Bank N.A. | | | 3/18/15 | | | | 34 | |
| GBP | | | 6,851 | | | | USD | | | | 10,581 | | | JPMorgan Chase Bank N.A. | | | 3/18/15 | | | | (6 | ) |
| GBP | | | 27,912 | | | | USD | | | | 42,354 | | | JPMorgan Chase Bank N.A. | | | 3/18/15 | | | | 731 | |
| GBP | | | 45,052 | | | | USD | | | | 69,583 | | | JPMorgan Chase Bank N.A. | | | 3/18/15 | | | | (40 | ) |
| GBP | | | 58,339 | | | | USD | | | | 88,159 | | | JPMorgan Chase Bank N.A. | | | 3/18/15 | | | | 1,894 | |
| GBP | | | 72,419 | | | | USD | | | | 111,406 | | | JPMorgan Chase Bank N.A. | | | 3/18/15 | | | | 382 | |
| GBP | | | 83,953 | | | | USD | | | | 130,095 | | | JPMorgan Chase Bank N.A. | | | 3/18/15 | | | | (504 | ) |
| GBP | | | 92,985 | | | | USD | | | | 145,931 | | | JPMorgan Chase Bank N.A. | | | 3/18/15 | | | | (2,397 | ) |
| GBP | | | 133,054 | | | | USD | | | | 202,851 | | | JPMorgan Chase Bank N.A. | | | 3/18/15 | | | | 2,533 | |
| GBP | | | 287,371 | | | | USD | | | | 451,650 | | | JPMorgan Chase Bank N.A. | | | 3/18/15 | | | | (8,058 | ) |
| GBP | | | 671,342 | | | | USD | | | | 1,019,559 | | | JPMorgan Chase Bank N.A. | | | 3/18/15 | | | | 16,737 | |
| GBP | | | 794,166 | | | | USD | | | | 1,203,946 | | | JPMorgan Chase Bank N.A. | | | 3/18/15 | | | | 21,944 | |
| GBP | | | 816,802 | | | | USD | | | | 1,246,234 | | | JPMorgan Chase Bank N.A. | | | 3/18/15 | | | | 14,597 | |
| GBP | | | 873,701 | | | | USD | | | | 1,331,765 | | | JPMorgan Chase Bank N.A. | | | 3/18/15 | | | | 16,897 | |
| GBP | | | 957,213 | | | | USD | | | | 1,485,023 | | | JPMorgan Chase Bank N.A. | | | 3/18/15 | | | | (7,451 | ) |
| JPY | | | 196,440 | | | | USD | | | | 1,701 | | | JPMorgan Chase Bank N.A. | | | 3/18/15 | | | | (58 | ) |
| JPY | | | 259,927 | | | | USD | | | | 2,250 | | | JPMorgan Chase Bank N.A. | | | 3/18/15 | | | | (77 | ) |
| JPY | | | 1,166,628 | | | | USD | | | | 9,934 | | | JPMorgan Chase Bank N.A. | | | 3/18/15 | | | | (179 | ) |
See Notes to Financial Statements.
| | | | | | |
| | | BLACKROCK MULTI-MANAGER ALTERNATIVE STRATEGIES FUND | | FEBRUARY 28, 2015 | | 15 |
| | |
| Schedule of Investments (continued) | | |
As of February 28, 2015, forward foreign currency exchange contracts outstanding were as follows: (continued)
| | | | | | | | | | | | | | | | | | | | | | |
Currency
Purchased | | | Currency
Sold | | | Counterparty | | Settlement
Date | | | Unrealized
Appreciation
(Depreciation) | |
| JPY | | | 2,462,099 | | | | USD | | | | 20,456 | | | JPMorgan Chase Bank N.A. | | | 3/18/15 | | | $ | 131 | |
| JPY | | | 3,407,730 | | | | USD | | | | 28,758 | | | JPMorgan Chase Bank N.A. | | | 3/18/15 | | | | (263 | ) |
| JPY | | | 4,977,203 | | | | USD | | | | 42,388 | | | JPMorgan Chase Bank N.A. | | | 3/18/15 | | | | (770 | ) |
| JPY | | | 5,297,732 | | | | USD | | | | 45,500 | | | JPMorgan Chase Bank N.A. | | | 3/18/15 | | | | (1,202 | ) |
| JPY | | | 6,832,163 | | | | USD | | | | 56,746 | | | JPMorgan Chase Bank N.A. | | | 3/18/15 | | | | 384 | |
| JPY | | | 7,893,001 | | | | USD | | | | 66,194 | | | JPMorgan Chase Bank N.A. | | | 3/18/15 | | | | (194 | ) |
| JPY | | | 8,106,494 | | | | USD | | | | 68,336 | | | JPMorgan Chase Bank N.A. | | | 3/18/15 | | | | (551 | ) |
| JPY | | | 8,766,797 | | | | USD | | | | 74,747 | | | JPMorgan Chase Bank N.A. | | | 3/18/15 | | | | (1,440 | ) |
| JPY | | | 14,500,407 | | | | USD | | | | 121,222 | | | JPMorgan Chase Bank N.A. | | | 3/18/15 | | | | 27 | |
| JPY | | | 14,644,393 | | | | USD | | | | 124,880 | | | JPMorgan Chase Bank N.A. | | | 3/18/15 | | | | (2,426 | ) |
| JPY | | | 14,771,331 | | | | USD | | | | 123,812 | | | JPMorgan Chase Bank N.A. | | | 3/18/15 | | | | (313 | ) |
| JPY | | | 19,182,807 | | | | USD | | | | 161,706 | | | JPMorgan Chase Bank N.A. | | | 3/18/15 | | | | (1,303 | ) |
| JPY | | | 21,282,748 | | | | USD | | | | 179,996 | | | JPMorgan Chase Bank N.A. | | | 3/18/15 | | | | (2,033 | ) |
| JPY | | | 42,047,496 | | | | USD | | | | 353,040 | | | JPMorgan Chase Bank N.A. | | | 3/18/15 | | | | (1,447 | ) |
| JPY | | | 44,246,162 | | | | USD | | | | 376,936 | | | JPMorgan Chase Bank N.A. | | | 3/18/15 | | | | (6,957 | ) |
| JPY | | | 46,932,458 | | | | USD | | | | 390,459 | | | JPMorgan Chase Bank N.A. | | | 3/18/15 | | | | 1,982 | |
| JPY | | | 48,121,375 | | | | USD | | | | 401,785 | | | JPMorgan Chase Bank N.A. | | | 3/18/15 | | | | 598 | |
| JPY | | | 48,554,462 | | | | USD | | | | 414,943 | | | JPMorgan Chase Bank N.A. | | | 3/18/15 | | | | (8,939 | ) |
| JPY | | | 62,293,765 | | | | USD | | | | 529,191 | | | JPMorgan Chase Bank N.A. | | | 3/18/15 | | | | (8,301 | ) |
| JPY | | | 71,379,093 | | | | USD | | | | 601,204 | | | JPMorgan Chase Bank N.A. | | | 3/18/15 | | | | (4,345 | ) |
| JPY | | | 71,849,572 | | | | USD | | | | 617,089 | | | JPMorgan Chase Bank N.A. | | | 3/18/15 | | | | (16,295 | ) |
| JPY | | | 82,052,196 | | | | USD | | | | 695,689 | | | JPMorgan Chase Bank N.A. | | | 3/18/15 | | | | (9,583 | ) |
| JPY | | | 82,096,079 | | | | USD | | | | 686,317 | | | JPMorgan Chase Bank N.A. | | | 3/18/15 | | | | 155 | |
| JPY | | | 96,750,788 | | | | USD | | | | 816,195 | | | JPMorgan Chase Bank N.A. | | | 3/18/15 | | | | (7,183 | ) |
| JPY | | | 101,358,678 | | | | USD | | | | 858,005 | | | JPMorgan Chase Bank N.A. | | | 3/18/15 | | | | (10,462 | ) |
| JPY | | | 111,748,402 | | | | USD | | | | 939,781 | | | JPMorgan Chase Bank N.A. | | | 3/18/15 | | | | (5,360 | ) |
| JPY | | | 116,414,217 | | | | USD | | | | 977,941 | | | JPMorgan Chase Bank N.A. | | | 3/18/15 | | | | (4,506 | ) |
| JPY | | | 154,464,592 | | | | USD | | | | 1,303,541 | | | JPMorgan Chase Bank N.A. | | | 3/18/15 | | | | (11,935 | ) |
| JPY | | | 157,620,684 | | | | USD | | | | 1,336,233 | | | JPMorgan Chase Bank N.A. | | | 3/18/15 | | | | (18,236 | ) |
| JPY | | | 164,300,615 | | | | USD | | | | 1,364,625 | | | JPMorgan Chase Bank N.A. | | | 3/18/15 | | | | 9,228 | |
| NOK | | | 316 | | | | USD | | | | 41 | | | JPMorgan Chase Bank N.A. | | | 3/18/15 | | | | — | |
| NOK | | | 1,162 | | | | USD | | | | 149 | | | JPMorgan Chase Bank N.A. | | | 3/18/15 | | | | 2 | |
| NOK | | | 1,310 | | | | USD | | | | 172 | | | JPMorgan Chase Bank N.A. | | | 3/18/15 | | | | (1 | ) |
| NOK | | | 1,528 | | | | USD | | | | 199 | | | JPMorgan Chase Bank N.A. | | | 3/18/15 | | | | 1 | |
| NOK | | | 1,616 | | | | USD | | | | 217 | | | JPMorgan Chase Bank N.A. | | | 3/18/15 | | | | (6 | ) |
| NOK | | | 2,110 | | | | USD | | | | 277 | | | JPMorgan Chase Bank N.A. | | | 3/18/15 | | | | (2 | ) |
| NOK | | | 109,071 | | | | USD | | | | 13,992 | | | JPMorgan Chase Bank N.A. | | | 3/18/15 | | | | 227 | |
| NOK | | | 124,349 | | | | USD | | | | 16,160 | | | JPMorgan Chase Bank N.A. | | | 3/18/15 | | | | 51 | |
| NOK | | | 126,249 | | | | USD | | | | 16,583 | | | JPMorgan Chase Bank N.A. | | | 3/18/15 | | | | (124 | ) |
| NOK | | | 138,355 | | | | USD | | | | 18,442 | | | JPMorgan Chase Bank N.A. | | | 3/18/15 | | | | (405 | ) |
| NOK | | | 143,199 | | | | USD | | | | 19,213 | | | JPMorgan Chase Bank N.A. | | | 3/18/15 | | | | (544 | ) |
| NOK | | | 300,131 | | | | USD | | | | 39,305 | | | JPMorgan Chase Bank N.A. | | | 3/18/15 | | | | (177 | ) |
| NOK | | | 342,860 | | | | USD | | | | 44,940 | | | JPMorgan Chase Bank N.A. | | | 3/18/15 | | | | (242 | ) |
| NOK | | | 382,683 | | | | USD | | | | 50,318 | | | JPMorgan Chase Bank N.A. | | | 3/18/15 | | | | (428 | ) |
See Notes to Financial Statements.
| | | | | | |
| 16 | | BLACKROCK MULTI-MANAGER ALTERNATIVE STRATEGIES FUND | | FEBRUARY 28, 2015 | | |
| | |
| Schedule of Investments (continued) | | |
As of February 28, 2015, forward foreign currency exchange contracts outstanding were as follows: (continued)
| | | | | | | | | | | | | | | | | | | | | | |
Currency Purchased | | | Currency
Sold | | | Counterparty | | Settlement
Date | | | Unrealized
Appreciation
(Depreciation) | |
| NOK | | | 492,494 | | | | USD | | | | 65,489 | | | JPMorgan Chase Bank N.A. | | | 3/18/15 | | | $ | (1,283 | ) |
| NOK | | | 874,792 | | | | USD | | | | 115,848 | | | JPMorgan Chase Bank N.A. | | | 3/18/15 | | | | (1,802 | ) |
| NOK | | | 1,454,599 | | | | USD | | | | 190,591 | | | JPMorgan Chase Bank N.A. | | | 3/18/15 | | | | (956 | ) |
| NOK | | | 2,053,708 | | | | USD | | | | 277,573 | | | JPMorgan Chase Bank N.A. | | | 3/18/15 | | | | (9,833 | ) |
| NOK | | | 3,489,602 | | | | USD | | | | 472,553 | | | JPMorgan Chase Bank N.A. | | | 3/18/15 | | | | (17,616 | ) |
| NOK | | | 3,559,200 | | | | USD | | | | 467,026 | | | JPMorgan Chase Bank N.A. | | | 3/18/15 | | | | (3,015 | ) |
| NOK | | | 4,613,619 | | | | USD | | | | 591,731 | | | JPMorgan Chase Bank N.A. | | | 3/18/15 | | | | 9,743 | |
| NOK | | | 4,924,439 | | | | USD | | | | 632,670 | | | JPMorgan Chase Bank N.A. | | | 3/18/15 | | | | 9,325 | |
| NZD | | | 39,170 | | | | USD | | | | 29,373 | | | JPMorgan Chase Bank N.A. | | | 3/18/15 | | | | 192 | |
| NZD | | | 42,296 | | | | USD | | | | 32,312 | | | JPMorgan Chase Bank N.A. | | | 3/18/15 | | | | (387 | ) |
| NZD | | | 62,756 | | | | USD | | | | 46,248 | | | JPMorgan Chase Bank N.A. | | | 3/18/15 | | | | 1,120 | |
| NZD | | | 77,849 | | | | USD | | | | 57,290 | | | JPMorgan Chase Bank N.A. | | | 3/18/15 | | | | 1,470 | |
| NZD | | | 99,551 | | | | USD | | | | 77,405 | | | JPMorgan Chase Bank N.A. | | | 3/18/15 | | | | (2,264 | ) |
| NZD | | | 108,473 | | | | USD | | | | 84,221 | | | JPMorgan Chase Bank N.A. | | | 3/18/15 | | | | (2,346 | ) |
| NZD | | | 182,624 | | | | USD | | | | 134,555 | | | JPMorgan Chase Bank N.A. | | | 3/18/15 | | | | 3,289 | |
| NZD | | | 224,699 | | | | USD | | | | 172,519 | | | JPMorgan Chase Bank N.A. | | | 3/18/15 | | | | (2,917 | ) |
| NZD | | | 278,447 | | | | USD | | | | 213,604 | | | JPMorgan Chase Bank N.A. | | | 3/18/15 | | | | (3,433 | ) |
| NZD | | | 324,423 | | | | USD | | | | 251,551 | | | JPMorgan Chase Bank N.A. | | | 3/18/15 | | | | (6,677 | ) |
| NZD | | | 1,103,639 | | | | USD | | | | 854,633 | | | JPMorgan Chase Bank N.A. | | | 3/18/15 | | | | (21,608 | ) |
| NZD | | | 1,212,309 | | | | USD | | | | 930,652 | | | JPMorgan Chase Bank N.A. | | | 3/18/15 | | | | (15,603 | ) |
| NZD | | | 4,726,336 | | | | USD | | | | 3,597,214 | | | JPMorgan Chase Bank N.A. | | | 3/18/15 | | | | (29,785 | ) |
| SEK | | | 1,884 | | | | USD | | | | 245 | | | JPMorgan Chase Bank N.A. | | | 3/18/15 | | | | (19 | ) |
| SEK | | | 6,919 | | | | USD | | | | 871 | | | JPMorgan Chase Bank N.A. | | | 3/18/15 | | | | (41 | ) |
| SEK | | | 7,805 | | | | USD | | | | 930 | | | JPMorgan Chase Bank N.A. | | | 3/18/15 | | | | 6 | |
| SEK | | | 9,100 | | | | USD | | | | 1,103 | | | JPMorgan Chase Bank N.A. | | | 3/18/15 | | | | (12 | ) |
| SEK | | | 9,627 | | | | USD | | | | 1,239 | | | JPMorgan Chase Bank N.A. | | | 3/18/15 | | | | (84 | ) |
| SEK | | | 11,565 | | | | USD | | | | 1,452 | | | JPMorgan Chase Bank N.A. | | | 3/18/15 | | | | (65 | ) |
| SEK | | | 12,569 | | | | USD | | | | 1,548 | | | JPMorgan Chase Bank N.A. | | | 3/18/15 | | | | (41 | ) |
| SEK | | | 159,441 | | | | USD | | | | 19,408 | | | JPMorgan Chase Bank N.A. | | | 3/18/15 | | | | (279 | ) |
| SEK | | | 232,316 | | | | USD | | | | 28,186 | | | JPMorgan Chase Bank N.A. | | | 3/18/15 | | | | (315 | ) |
| SEK | | | 257,854 | | | | USD | | | | 34,271 | | | JPMorgan Chase Bank N.A. | | | 3/18/15 | | | | (3,335 | ) |
| SEK | | | 384,299 | | | | USD | | | | 48,398 | | | JPMorgan Chase Bank N.A. | | | 3/18/15 | | | | (2,293 | ) |
| SEK | | | 387,856 | | | | USD | | | | 46,221 | | | JPMorgan Chase Bank N.A. | | | 3/18/15 | | | | 311 | |
| SEK | | | 401,294 | | | | USD | | | | 51,412 | | | JPMorgan Chase Bank N.A. | | | 3/18/15 | | | | (3,268 | ) |
| SEK | | | 443,466 | | | | USD | | | | 55,955 | | | JPMorgan Chase Bank N.A. | | | 3/18/15 | | | | (2,751 | ) |
| SEK | | | 482,581 | | | | USD | | | | 58,507 | | | JPMorgan Chase Bank N.A. | | | 3/18/15 | | | | (610 | ) |
| SEK | | | 560,116 | | | | USD | | | | 69,374 | | | JPMorgan Chase Bank N.A. | | | 3/18/15 | | | | (2,175 | ) |
| SEK | | | 637,471 | | | | USD | | | | 78,535 | | | JPMorgan Chase Bank N.A. | | | 3/18/15 | | | | (2,055 | ) |
| SEK | | | 656,121 | | | | USD | | | | 82,388 | | | JPMorgan Chase Bank N.A. | | | 3/18/15 | | | | (3,671 | ) |
| SEK | | | 745,550 | | | | USD | | | | 88,916 | | | JPMorgan Chase Bank N.A. | | | 3/18/15 | | | | 530 | |
| SEK | | | 1,055,440 | | | | USD | | | | 135,599 | | | JPMorgan Chase Bank N.A. | | | 3/18/15 | | | | (8,974 | ) |
| SEK | | | 1,241,187 | | | | USD | | | | 153,286 | | | JPMorgan Chase Bank N.A. | | | 3/18/15 | | | | (4,377 | ) |
| SEK | | | 1,493,048 | | | | USD | | | | 192,179 | | | JPMorgan Chase Bank N.A. | | | 3/18/15 | | | | (13,053 | ) |
| SEK | | | 2,127,370 | | | | USD | | | | 273,748 | | | JPMorgan Chase Bank N.A. | | | 3/18/15 | | | | (18,521 | ) |
See Notes to Financial Statements.
| | | | | | |
| | | BLACKROCK MULTI-MANAGER ALTERNATIVE STRATEGIES FUND | | FEBRUARY 28, 2015 | | 17 |
| | |
| Schedule of Investments (continued) | | |
As of February 28, 2015, forward foreign currency exchange contracts outstanding were as follows: (continued)
| | | | | | | | | | | | | | | | | | | | | | |
Currency
Purchased | | | Currency
Sold | | | Counterparty | | Settlement
Date | | | Unrealized
Appreciation
(Depreciation) | |
| SEK | | | 2,884,466 | | | | USD | | | | 374,369 | | | JPMorgan Chase Bank N.A. | | | 3/18/15 | | | $ | (28,310 | ) |
| SEK | | | 3,152,326 | | | | USD | | | | 412,541 | | | JPMorgan Chase Bank N.A. | | | 3/18/15 | | | | (34,346 | ) |
| USD | | | 2,488 | | | | AUD | | | | 3,008 | | | JPMorgan Chase Bank N.A. | | | 3/18/15 | | | | 140 | |
| USD | | | 5,781 | | | | AUD | | | | 7,116 | | | JPMorgan Chase Bank N.A. | | | 3/18/15 | | | | 228 | |
| USD | | | 5,965 | | | | AUD | | | | 7,361 | | | JPMorgan Chase Bank N.A. | | | 3/18/15 | | | | 221 | |
| USD | | | 7,478 | | | | AUD | | | | 9,607 | | | JPMorgan Chase Bank N.A. | | | 3/18/15 | | | | (19 | ) |
| USD | | | 7,780 | | | | AUD | | | | 9,583 | | | JPMorgan Chase Bank N.A. | | | 3/18/15 | | | | 301 | |
| USD | | | 7,990 | | | | AUD | | | | 9,861 | | | JPMorgan Chase Bank N.A. | | | 3/18/15 | | | | 295 | |
| USD | | | 9,019 | | | | AUD | | | | 11,759 | | | JPMorgan Chase Bank N.A. | | | 3/18/15 | | | | (158 | ) |
| USD | | | 9,026 | | | | AUD | | | | 11,759 | | | JPMorgan Chase Bank N.A. | | | 3/18/15 | | | | (151 | ) |
| USD | | | 12,103 | | | | AUD | | | | 15,780 | | | JPMorgan Chase Bank N.A. | | | 3/18/15 | | | | (212 | ) |
| USD | | | 19,691 | | | | AUD | | | | 23,807 | | | JPMorgan Chase Bank N.A. | | | 3/18/15 | | | | 1,111 | |
| USD | | | 25,628 | | | | AUD | | | | 31,628 | | | JPMorgan Chase Bank N.A. | | | 3/18/15 | | | | 945 | |
| USD | | | 35,266 | | | | AUD | | | | 43,440 | | | JPMorgan Chase Bank N.A. | | | 3/18/15 | | | | 1,365 | |
| USD | | | 41,345 | | | | AUD | | | | 50,669 | | | JPMorgan Chase Bank N.A. | | | 3/18/15 | | | | 1,802 | |
| USD | | | 86,903 | | | | AUD | | | | 111,644 | | | JPMorgan Chase Bank N.A. | | | 3/18/15 | | | | (226 | ) |
| USD | | | 132,285 | | | | AUD | | | | 167,716 | | | JPMorgan Chase Bank N.A. | | | 3/18/15 | | | | 1,397 | |
| USD | | | 211,026 | | | | AUD | | | | 258,616 | | | JPMorgan Chase Bank N.A. | | | 3/18/15 | | | | 9,198 | |
| USD | | | 219,262 | | | | AUD | | | | 281,414 | | | JPMorgan Chase Bank N.A. | | | 3/18/15 | | | | (358 | ) |
| USD | | | 375,727 | | | | AUD | | | | 456,035 | | | JPMorgan Chase Bank N.A. | | | 3/18/15 | | | | 19,830 | |
| USD | | | 742,649 | | | | AUD | | | | 968,241 | | | JPMorgan Chase Bank N.A. | | | 3/18/15 | | | | (12,982 | ) |
| USD | | | 743,164 | | | | AUD | | | | 968,241 | | | JPMorgan Chase Bank N.A. | | | 3/18/15 | | | | (12,468 | ) |
| USD | | | 772,586 | | | | AUD | | | | 980,000 | | | JPMorgan Chase Bank N.A. | | | 3/18/15 | | | | 7,778 | |
| USD | | | 801,918 | | | | AUD | | | | 980,000 | | | JPMorgan Chase Bank N.A. | | | 3/18/15 | | | | 37,110 | |
| USD | | | 866,269 | | | | AUD | | | | 1,058,332 | | | JPMorgan Chase Bank N.A. | | | 3/18/15 | | | | 40,329 | |
| USD | | | 928,164 | | | | AUD | | | | 1,196,697 | | | JPMorgan Chase Bank N.A. | | | 3/18/15 | | | | (5,758 | ) |
| USD | | | 996,458 | | | | AUD | | | | 1,299,161 | | | JPMorgan Chase Bank N.A. | | | 3/18/15 | | | | (17,429 | ) |
| USD | | | 1,377,471 | | | | AUD | | | | 1,747,497 | | | JPMorgan Chase Bank N.A. | | | 3/18/15 | | | | 13,696 | |
| USD | | | 2,973,978 | | | | AUD | | | | 3,609,635 | | | JPMorgan Chase Bank N.A. | | | 3/18/15 | | | | 156,960 | |
| USD | | | 3,917 | | | | CAD | | | | 4,628 | | | JPMorgan Chase Bank N.A. | | | 3/18/15 | | | | 216 | |
| USD | | | 6,347 | | | | CAD | | | | 7,898 | | | JPMorgan Chase Bank N.A. | | | 3/18/15 | | | | 31 | |
| USD | | | 8,359 | | | | CAD | | | | 9,726 | | | JPMorgan Chase Bank N.A. | | | 3/18/15 | | | | 581 | |
| USD | | | 11,189 | | | | CAD | | | | 13,940 | | | JPMorgan Chase Bank N.A. | | | 3/18/15 | | | | 41 | |
| USD | | | 22,899 | | | | CAD | | | | 26,642 | | | JPMorgan Chase Bank N.A. | | | 3/18/15 | | | | 1,594 | |
| USD | | | 25,196 | | | | CAD | | | | 31,538 | | | JPMorgan Chase Bank N.A. | | | 3/18/15 | | | | (25 | ) |
| USD | | | 42,816 | | | | CAD | | | | 51,423 | | | JPMorgan Chase Bank N.A. | | | 3/18/15 | | | | 1,693 | |
| USD | | | 44,949 | | | | CAD | | | | 53,936 | | | JPMorgan Chase Bank N.A. | | | 3/18/15 | | | | 1,816 | |
| USD | | | 63,390 | | | | CAD | | | | 79,466 | | | JPMorgan Chase Bank N.A. | | | 3/18/15 | | | | (159 | ) |
| USD | | | 99,076 | | | | CAD | | | | 118,992 | | | JPMorgan Chase Bank N.A. | | | 3/18/15 | | | | 3,918 | |
| USD | | | 114,452 | | | | CAD | | | | 135,727 | | | JPMorgan Chase Bank N.A. | | | 3/18/15 | | | | 5,910 | |
| USD | | | 230,547 | | | | CAD | | | | 292,093 | | | JPMorgan Chase Bank N.A. | | | 3/18/15 | | | | (3,042 | ) |
| USD | | | 276,924 | | | | CAD | | | | 344,716 | | | JPMorgan Chase Bank N.A. | | | 3/18/15 | | | | 1,252 | |
| USD | | | 397,227 | | | | CAD | | | | 469,761 | | | JPMorgan Chase Bank N.A. | | | 3/18/15 | | | | 21,556 | |
| USD | | | 421,097 | | | | CAD | | | | 501,005 | | | JPMorgan Chase Bank N.A. | | | 3/18/15 | | | | 20,440 | |
See Notes to Financial Statements.
| | | | | | |
| 18 | | BLACKROCK MULTI-MANAGER ALTERNATIVE STRATEGIES FUND | | FEBRUARY 28, 2015 | | |
| | |
| Schedule of Investments (continued) | | |
As of February 28, 2015, forward foreign currency exchange contracts outstanding were as follows: (continued)
| | | | | | | | | | | | | | | | | | | | | | |
Currency Purchased | | | Currency
Sold | | | Counterparty | | Settlement
Date | | | Unrealized
Appreciation
(Depreciation) | |
| USD | | | 451,249 | | | | CAD | | | | 557,097 | | | JPMorgan Chase Bank N.A. | | | 3/18/15 | | | $ | 5,735 | |
| USD | | | 468,548 | | | | CAD | | | | 594,315 | | | JPMorgan Chase Bank N.A. | | | 3/18/15 | | | | (6,730 | ) |
| USD | | | 486,916 | | | | CAD | | | | 566,556 | | | JPMorgan Chase Bank N.A. | | | 3/18/15 | | | | 33,837 | |
| USD | | | 639,051 | | | | CAD | | | | 772,937 | | | JPMorgan Chase Bank N.A. | | | 3/18/15 | | | | 20,927 | |
| USD | | | 669,573 | | | | CAD | | | | 769,746 | | | JPMorgan Chase Bank N.A. | | | 3/18/15 | | | | 54,001 | |
| USD | | | 690,074 | | | | CAD | | | | 830,004 | | | JPMorgan Chase Bank N.A. | | | 3/18/15 | | | | 26,313 | |
| USD | | | 773,364 | | | | CAD | | | | 965,481 | | | JPMorgan Chase Bank N.A. | | | 3/18/15 | | | | 1,262 | |
| USD | | | 855,431 | | | | CAD | | | | 993,101 | | | JPMorgan Chase Bank N.A. | | | 3/18/15 | | | | 61,241 | |
| USD | | | 907,082 | | | | CAD | | | | 1,088,289 | | | JPMorgan Chase Bank N.A. | | | 3/18/15 | | | | 36,769 | |
| USD | | | 926,468 | | | | CAD | | | | 1,105,092 | | | JPMorgan Chase Bank N.A. | | | 3/18/15 | | | | 42,718 | |
| USD | | | 940,186 | | | | CAD | | | | 1,184,843 | | | JPMorgan Chase Bank N.A. | | | 3/18/15 | | | | (7,342 | ) |
| USD | | | 980,000 | | | | CAD | | | | 1,137,707 | | | JPMorgan Chase Bank N.A. | | | 3/18/15 | | | | 70,167 | |
| USD | | | 980,000 | | | | CAD | | | | 1,170,885 | | | JPMorgan Chase Bank N.A. | | | 3/18/15 | | | | 43,634 | |
| USD | | | 1,208,082 | | | | CAD | | | | 1,411,607 | | | JPMorgan Chase Bank N.A. | | | 3/18/15 | | | | 79,209 | |
| USD | | | 1,218,833 | | | | CAD | | | | 1,516,683 | | | JPMorgan Chase Bank N.A. | | | 3/18/15 | | | | 5,930 | |
| USD | | | 1,770 | | | | EUR | | | | 1,555 | | | JPMorgan Chase Bank N.A. | | | 3/18/15 | | | | 30 | |
| USD | | | 2,887 | | | | EUR | | | | 2,492 | | | JPMorgan Chase Bank N.A. | | | 3/18/15 | | | | 97 | |
| USD | | | 2,973 | | | | EUR | | | | 2,626 | | | JPMorgan Chase Bank N.A. | | | 3/18/15 | | | | 34 | |
| USD | | | 22,626 | | | | EUR | | | | 19,767 | | | JPMorgan Chase Bank N.A. | | | 3/18/15 | | | | 500 | |
| USD | | | 22,933 | | | | EUR | | | | 20,253 | | | JPMorgan Chase Bank N.A. | | | 3/18/15 | | | | 263 | |
| USD | | | 44,798 | | | | EUR | | | | 36,817 | | | JPMorgan Chase Bank N.A. | | | 3/18/15 | | | | 3,588 | |
| USD | | | 62,111 | | | | EUR | | | | 49,834 | | | JPMorgan Chase Bank N.A. | | | 3/18/15 | | | | 6,330 | |
| USD | | | 62,539 | | | | EUR | | | | 50,248 | | | JPMorgan Chase Bank N.A. | | | 3/18/15 | | | | 6,295 | |
| USD | | | 71,198 | | | | EUR | | | | 60,539 | | | JPMorgan Chase Bank N.A. | | | 3/18/15 | | | | 3,435 | |
| USD | | | 79,170 | | | | EUR | | | | 65,066 | | | JPMorgan Chase Bank N.A. | | | 3/18/15 | | | | 6,340 | |
| USD | | | 116,053 | | | | EUR | | | | 95,185 | | | JPMorgan Chase Bank N.A. | | | 3/18/15 | | | | 9,510 | |
| USD | | | 127,516 | | | | EUR | | | | 111,446 | | | JPMorgan Chase Bank N.A. | | | 3/18/15 | | | | 2,772 | |
| USD | | | 174,313 | | | | EUR | | | | 142,089 | | | JPMorgan Chase Bank N.A. | | | 3/18/15 | | | | 15,270 | |
| USD | | | 192,848 | | | | EUR | | | | 170,984 | | | JPMorgan Chase Bank N.A. | | | 3/18/15 | | | | 1,462 | |
| USD | | | 198,693 | | | | EUR | | | | 176,115 | | | JPMorgan Chase Bank N.A. | | | 3/18/15 | | | | 1,564 | |
| USD | | | 199,655 | | | | EUR | | | | 162,014 | | | JPMorgan Chase Bank N.A. | | | 3/18/15 | | | | 18,309 | |
| USD | | | 237,949 | | | | EUR | | | | 197,587 | | | JPMorgan Chase Bank N.A. | | | 3/18/15 | | | | 16,785 | |
| USD | | | 251,545 | | | | EUR | | | | 222,291 | | | JPMorgan Chase Bank N.A. | | | 3/18/15 | | | | 2,730 | |
| USD | | | 294,883 | | | | EUR | | | | 236,930 | | | JPMorgan Chase Bank N.A. | | | 3/18/15 | | | | 29,681 | |
| USD | | | 361,015 | | | | EUR | | | | 317,685 | | | JPMorgan Chase Bank N.A. | | | 3/18/15 | | | | 5,422 | |
| USD | | | 444,140 | | | | EUR | | | | 383,080 | | | JPMorgan Chase Bank N.A. | | | 3/18/15 | | | | 15,349 | |
| USD | | | 580,756 | | | | EUR | | | | 512,009 | | | JPMorgan Chase Bank N.A. | | | 3/18/15 | | | | 7,652 | |
| USD | | | 629,662 | | | | EUR | | | | 551,390 | | | JPMorgan Chase Bank N.A. | | | 3/18/15 | | | | 12,478 | |
| USD | | | 659,724 | | | | EUR | | | | 583,051 | | | JPMorgan Chase Bank N.A. | | | 3/18/15 | | | | 7,101 | |
| USD | | | 721,552 | | | | EUR | | | | 645,024 | | | JPMorgan Chase Bank N.A. | | | 3/18/15 | | | | (439 | ) |
| USD | | | 737,309 | | | | EUR | | | | 647,651 | | | JPMorgan Chase Bank N.A. | | | 3/18/15 | | | | 12,377 | |
| USD | | | 872,357 | | | | EUR | | | | 724,383 | | | JPMorgan Chase Bank N.A. | | | 3/18/15 | | | | 61,537 | |
| USD | | | 904,566 | | | | EUR | | | | 789,385 | | | JPMorgan Chase Bank N.A. | | | 3/18/15 | | | | 20,988 | |
| USD | | | 1,001,564 | | | | EUR | | | | 816,328 | | | JPMorgan Chase Bank N.A. | | | 3/18/15 | | | | 87,828 | |
See Notes to Financial Statements.
| | | | | | |
| | | BLACKROCK MULTI-MANAGER ALTERNATIVE STRATEGIES FUND | | FEBRUARY 28, 2015 | | 19 |
| | |
| Schedule of Investments (continued) | | |
As of February 28, 2015, forward foreign currency exchange contracts outstanding were as follows: (continued)
| | | | | | | | | | | | | | | | | | | | | | |
Currency
Purchased | | | Currency
Sold | | | Counterparty | | Settlement
Date | | | Unrealized
Appreciation
(Depreciation) | |
| USD | | | 1,003,103 | | | | EUR | | | | 799,349 | | | JPMorgan Chase Bank N.A. | | | 3/18/15 | | | $ | 108,372 | |
| USD | | | 1,066,862 | | | | EUR | | | | 855,608 | | | JPMorgan Chase Bank N.A. | | | 3/18/15 | | | | 109,159 | |
| USD | | | 1,096,389 | | | | EUR | | | | 980,000 | | | JPMorgan Chase Bank N.A. | | | 3/18/15 | | | | (549 | ) |
| USD | | | 1,146,038 | | | | EUR | | | | 1,010,220 | | | JPMorgan Chase Bank N.A. | | | 3/18/15 | | | | 15,274 | |
| USD | | | 1,653,475 | | | | EUR | | | | 1,427,377 | | | JPMorgan Chase Bank N.A. | | | 3/18/15 | | | | 55,777 | |
| USD | | | 1,302 | | | | GBP | | | | 858 | | | JPMorgan Chase Bank N.A. | | | 3/18/15 | | | | (22 | ) |
| USD | | | 3,821 | | | | GBP | | | | 2,514 | | | JPMorgan Chase Bank N.A. | | | 3/18/15 | | | | (59 | ) |
| USD | | | 3,894 | | | | GBP | | | | 2,508 | | | JPMorgan Chase Bank N.A. | | | 3/18/15 | | | | 22 | |
| USD | | | 3,903 | | | | GBP | | | | 2,580 | | | JPMorgan Chase Bank N.A. | | | 3/18/15 | | | | (80 | ) |
| USD | | | 4,384 | | | | GBP | | | | 2,884 | | | JPMorgan Chase Bank N.A. | | | 3/18/15 | | | | (68 | ) |
| USD | | | 8,419 | | | | GBP | | | | 5,457 | | | JPMorgan Chase Bank N.A. | | | 3/18/15 | | | | (4 | ) |
| USD | | | 20,128 | | | | GBP | | | | 13,260 | | | JPMorgan Chase Bank N.A. | | | 3/18/15 | | | | (340 | ) |
| USD | | | 61,725 | | | | GBP | | | | 40,172 | | | JPMorgan Chase Bank N.A. | | | 3/18/15 | | | | (286 | ) |
| USD | | | 73,343 | | | | GBP | | | | 47,172 | | | JPMorgan Chase Bank N.A. | | | 3/18/15 | | | | 528 | |
| USD | | | 118,671 | | | | GBP | | | | 76,435 | | | JPMorgan Chase Bank N.A. | | | 3/18/15 | | | | 684 | |
| USD | | | 138,421 | | | | GBP | | | | 89,961 | | | JPMorgan Chase Bank N.A. | | | 3/18/15 | | | | (444 | ) |
| USD | | | 212,351 | | | | GBP | | | | 138,480 | | | JPMorgan Chase Bank N.A. | | | 3/18/15 | | | | (1,409 | ) |
| USD | | | 226,606 | | | | GBP | | | | 144,201 | | | JPMorgan Chase Bank N.A. | | | 3/18/15 | | | | 4,015 | |
| USD | | | 257,751 | | | | GBP | | | | 163,871 | | | JPMorgan Chase Bank N.A. | | | 3/18/15 | | | | 4,797 | |
| USD | | | 285,693 | | | | GBP | | | | 189,593 | | | JPMorgan Chase Bank N.A. | | | 3/18/15 | | | | (6,967 | ) |
| USD | | | 298,589 | | | | GBP | | | | 194,457 | | | JPMorgan Chase Bank N.A. | | | 3/18/15 | | | | (1,578 | ) |
| USD | | | 324,178 | | | | GBP | | | | 211,490 | | | JPMorgan Chase Bank N.A. | | | 3/18/15 | | | | (2,282 | ) |
| USD | | | 341,548 | | | | GBP | | | | 219,626 | | | JPMorgan Chase Bank N.A. | | | 3/18/15 | | | | 2,529 | |
| USD | | | 399,638 | | | | GBP | | | | 265,489 | | | JPMorgan Chase Bank N.A. | | | 3/18/15 | | | | (10,176 | ) |
| USD | | | 509,251 | | | | GBP | | | | 337,135 | | | JPMorgan Chase Bank N.A. | | | 3/18/15 | | | | (11,157 | ) |
| USD | | | 548,450 | | | | GBP | | | | 351,538 | | | JPMorgan Chase Bank N.A. | | | 3/18/15 | | | | 5,809 | |
| USD | | | 573,990 | | | | GBP | | | | 372,037 | | | JPMorgan Chase Bank N.A. | | | 3/18/15 | | | | (294 | ) |
| USD | | | 827,200 | | | | GBP | | | | 543,863 | | | JPMorgan Chase Bank N.A. | | | 3/18/15 | | | | (12,317 | ) |
| USD | | | 832,905 | | | | GBP | | | | 544,791 | | | JPMorgan Chase Bank N.A. | | | 3/18/15 | | | | (8,045 | ) |
| USD | | | 924,372 | | | | GBP | | | | 611,107 | | | JPMorgan Chase Bank N.A. | | | 3/18/15 | | | | (18,945 | ) |
| USD | | | 1,102,658 | | | | GBP | | | | 728,726 | | | JPMorgan Chase Bank N.A. | | | 3/18/15 | | | | (22,218 | ) |
| USD | | | 1,933,752 | | | | GBP | | | | 1,261,053 | | | JPMorgan Chase Bank N.A. | | | 3/18/15 | | | | (12,834 | ) |
| USD | | | 56 | | | | JPY | | | | 6,619 | | | JPMorgan Chase Bank N.A. | | | 3/18/15 | | | | — | |
| USD | | | 9,110 | | | | JPY | | | | 1,085,345 | | | JPMorgan Chase Bank N.A. | | | 3/18/15 | | | | 35 | |
| USD | | | 11,570 | | | | JPY | | | | 1,378,895 | | | JPMorgan Chase Bank N.A. | | | 3/18/15 | | | | 40 | |
| USD | | | 12,082 | | | | JPY | | | | 1,439,573 | | | JPMorgan Chase Bank N.A. | | | 3/18/15 | | | | 44 | |
| USD | | | 16,068 | | | | JPY | | | | 1,924,107 | | | JPMorgan Chase Bank N.A. | | | 3/18/15 | | | | (22 | ) |
| USD | | | 21,523 | | | | JPY | | | | 2,572,241 | | | JPMorgan Chase Bank N.A. | | | 3/18/15 | | | | 14 | |
| USD | | | 22,395 | | | | JPY | | | | 2,682,526 | | | JPMorgan Chase Bank N.A. | | | 3/18/15 | | | | (36 | ) |
| USD | | | 22,478 | | | | JPY | | | | 2,684,423 | | | JPMorgan Chase Bank N.A. | | | 3/18/15 | | | | 32 | |
| USD | | | 37,660 | | | | JPY | | | | 4,439,796 | | | JPMorgan Chase Bank N.A. | | | 3/18/15 | | | | 535 | |
| USD | | | 39,644 | | | | JPY | | | | 4,746,739 | | | JPMorgan Chase Bank N.A. | | | 3/18/15 | | | | (47 | ) |
| USD | | | 43,289 | | | | JPY | | | | 5,169,633 | | | JPMorgan Chase Bank N.A. | | | 3/18/15 | | | | 61 | |
| USD | | | 60,315 | | | | JPY | | | | 7,239,498 | | | JPMorgan Chase Bank N.A. | | | 3/18/15 | | | | (220 | ) |
See Notes to Financial Statements.
| | | | | | |
| 20 | | BLACKROCK MULTI-MANAGER ALTERNATIVE STRATEGIES FUND | | FEBRUARY 28, 2015 | | |
| | |
| Schedule of Investments (continued) | | |
As of February 28, 2015, forward foreign currency exchange contracts outstanding were as follows: (continued)
| | | | | | | | | | | | | | | | | | | | | | |
Currency
Purchased | | | Currency
Sold | | | Counterparty | | Settlement
Date | | | Unrealized
Appreciation
(Depreciation) | |
| USD | | | 74,872 | | | | JPY | | | | 8,869,857 | | | JPMorgan Chase Bank N.A. | | | 3/18/15 | | | $ | 704 | |
| USD | | | 78,032 | | | | JPY | | | | 9,366,017 | | | JPMorgan Chase Bank N.A. | | | 3/18/15 | | | | (285 | ) |
| USD | | | 89,639 | | | | JPY | | | | 10,593,279 | | | JPMorgan Chase Bank N.A. | | | 3/18/15 | | | | 1,060 | |
| USD | | | 95,302 | | | | JPY | | | | 11,304,297 | | | JPMorgan Chase Bank N.A. | | | 3/18/15 | | | | 777 | |
| USD | | | 95,953 | | | | JPY | | | | 11,488,786 | | | JPMorgan Chase Bank N.A. | | | 3/18/15 | | | | (114 | ) |
| USD | | | 98,102 | | | | JPY | | | | 11,540,833 | | | JPMorgan Chase Bank N.A. | | | 3/18/15 | | | | 1,600 | |
| USD | | | 136,455 | | | | JPY | | | | 16,218,758 | | | JPMorgan Chase Bank N.A. | | | 3/18/15 | | | | 836 | |
| USD | | | 163,468 | | | | JPY | | | | 19,410,987 | | | JPMorgan Chase Bank N.A. | | | 3/18/15 | | | | 1,157 | |
| USD | | | 233,777 | | | | JPY | | | | 27,762,920 | | | JPMorgan Chase Bank N.A. | | | 3/18/15 | | | | 1,629 | |
| USD | | | 251,650 | | | | JPY | | | | 30,256,677 | | | JPMorgan Chase Bank N.A. | | | 3/18/15 | | | | (1,351 | ) |
| USD | | | 254,905 | | | | JPY | | | | 30,672,804 | | | JPMorgan Chase Bank N.A. | | | 3/18/15 | | | | (1,575 | ) |
| USD | | | 320,449 | | | | JPY | | | | 37,782,305 | | | JPMorgan Chase Bank N.A. | | | 3/18/15 | | | | 4,521 | |
| USD | | | 323,716 | | | | JPY | | | | 38,061,898 | | | JPMorgan Chase Bank N.A. | | | 3/18/15 | | | | 5,449 | |
| USD | | | 346,213 | | | | JPY | | | | 41,260,825 | | | JPMorgan Chase Bank N.A. | | | 3/18/15 | | | | 1,198 | |
| USD | | | 394,428 | | | | JPY | | | | 46,278,443 | | | JPMorgan Chase Bank N.A. | | | 3/18/15 | | | | 7,456 | |
| USD | | | 556,673 | | | | JPY | | | | 65,476,267 | | | JPMorgan Chase Bank N.A. | | | 3/18/15 | | | | 9,172 | |
| USD | | | 630,792 | | | | JPY | | | | 73,415,471 | | | JPMorgan Chase Bank N.A. | | | 3/18/15 | | | | 16,905 | |
| USD | | | 697,179 | | | | JPY | | | | 83,681,218 | | | JPMorgan Chase Bank N.A. | | | 3/18/15 | | | | (2,548 | ) |
| USD | | | 858,889 | | | | JPY | | | | 102,435,746 | | | JPMorgan Chase Bank N.A. | | | 3/18/15 | | | | 2,339 | |
| USD | | | 901,968 | | | | JPY | | | | 108,261,619 | | | JPMorgan Chase Bank N.A. | | | 3/18/15 | | | | (3,297 | ) |
| USD | | | 963,932 | | | | JPY | | | | 115,432,265 | | | JPMorgan Chase Bank N.A. | | | 3/18/15 | | | | (1,292 | ) |
| USD | | | 1,010,221 | | | | JPY | | | | 119,098,079 | | | JPMorgan Chase Bank N.A. | | | 3/18/15 | | | | 14,344 | |
| USD | | | 1,131,700 | | | | JPY | | | | 134,511,739 | | | JPMorgan Chase Bank N.A. | | | 3/18/15 | | | | 6,936 | |
| USD | | | 1,343,534 | | | | JPY | | | | 160,931,714 | | | JPMorgan Chase Bank N.A. | | | 3/18/15 | | | | (2,149 | ) |
| USD | | | 1,419,181 | | | | JPY | | | | 167,327,189 | | | JPMorgan Chase Bank N.A. | | | 3/18/15 | | | | 20,020 | |
| USD | | | 26 | | | | NOK | | | | 191 | | | JPMorgan Chase Bank N.A. | | | 3/18/15 | | | | 2 | |
| USD | | | 182 | | | | NOK | | | | 1,356 | | | JPMorgan Chase Bank N.A. | | | 3/18/15 | | | | 6 | |
| USD | | | 182 | | | | NOK | | | | 1,396 | | | JPMorgan Chase Bank N.A. | | | 3/18/15 | | | | — | |
| USD | | | 942 | | | | NOK | | | | 7,172 | | | JPMorgan Chase Bank N.A. | | | 3/18/15 | | | | 7 | |
| USD | | | 3,923 | | | | NOK | | | | 28,348 | | | JPMorgan Chase Bank N.A. | | | 3/18/15 | | | | 227 | |
| USD | | | 9,003 | | | | NOK | | | | 64,790 | | | JPMorgan Chase Bank N.A. | | | 3/18/15 | | | | 557 | |
| USD | | | 9,817 | | | | NOK | | | | 73,012 | | | JPMorgan Chase Bank N.A. | | | 3/18/15 | | | | 298 | |
| USD | | | 17,058 | | | | NOK | | | | 131,064 | | | JPMorgan Chase Bank N.A. | | | 3/18/15 | | | | (28 | ) |
| USD | | | 22,163 | | | | NOK | | | | 166,450 | | | JPMorgan Chase Bank N.A. | | | 3/18/15 | | | | 463 | |
| USD | | | 44,697 | | | | NOK | | | | 340,627 | | | JPMorgan Chase Bank N.A. | | | 3/18/15 | | | | 290 | |
| USD | | | 50,926 | | | | NOK | | | | 391,432 | | | JPMorgan Chase Bank N.A. | | | 3/18/15 | | | | (105 | ) |
| USD | | | 136,364 | | | | NOK | | | | 1,054,544 | | | JPMorgan Chase Bank N.A. | | | 3/18/15 | | | | (1,116 | ) |
| USD | | | 161,790 | | | | NOK | | | | 1,229,474 | | | JPMorgan Chase Bank N.A. | | | 3/18/15 | | | | 1,504 | |
| USD | | | 170,788 | | | | NOK | | | | 1,300,739 | | | JPMorgan Chase Bank N.A. | | | 3/18/15 | | | | 1,212 | |
| USD | | | 176,391 | | | | NOK | | | | 1,378,799 | | | JPMorgan Chase Bank N.A. | | | 3/18/15 | | | | (3,363 | ) |
| USD | | | 254,492 | | | | NOK | | | | 1,988,053 | | | JPMorgan Chase Bank N.A. | | | 3/18/15 | | | | (4,690 | ) |
| USD | | | 266,405 | | | | NOK | | | | 2,005,112 | | | JPMorgan Chase Bank N.A. | | | 3/18/15 | | | | 5,000 | |
| USD | | | 342,608 | | | | NOK | | | | 2,610,192 | | | JPMorgan Chase Bank N.A. | | | 3/18/15 | | | | 2,319 | |
See Notes to Financial Statements.
| | | | | | |
| | | BLACKROCK MULTI-MANAGER ALTERNATIVE STRATEGIES FUND | | FEBRUARY 28, 2015 | | 21 |
| | |
| Schedule of Investments (continued) | | |
As of February 28, 2015, forward foreign currency exchange contracts outstanding were as follows: (concluded)
| | | | | | | | | | | | | | | | | | | | | | |
Currency
Purchased | | | Currency
Sold | | | Counterparty | | Settlement
Date | | | Unrealized
Appreciation
(Depreciation) | |
| USD | | | 378,714 | | | | NOK | | | | 2,957,060 | | | JPMorgan Chase Bank N.A. | | | 3/18/15 | | | $ | (6,796 | ) |
| USD | | | 431,908 | | | | NOK | | | | 3,306,567 | | | JPMorgan Chase Bank N.A. | | | 3/18/15 | | | | 1,909 | |
| USD | | | 573,761 | | | | NOK | | | | 4,428,765 | | | JPMorgan Chase Bank N.A. | | | 3/18/15 | | | | (3,614 | ) |
| USD | | | 1,324,669 | | | | NOK | | | | 9,532,718 | | | JPMorgan Chase Bank N.A. | | | 3/18/15 | | | | 81,895 | |
| USD | | | 6,462 | | | | NZD | | | | 8,721 | | | JPMorgan Chase Bank N.A. | | | 3/18/15 | | | | (121 | ) |
| USD | | | 17,899 | | | | NZD | | | | 23,207 | | | JPMorgan Chase Bank N.A. | | | 3/18/15 | | | | 383 | |
| USD | | | 23,835 | | | | NZD | | | | 31,805 | | | JPMorgan Chase Bank N.A. | | | 3/18/15 | | | | (171 | ) |
| USD | | | 45,538 | | | | NZD | | | | 62,820 | | | JPMorgan Chase Bank N.A. | | | 3/18/15 | | | | (1,879 | ) |
| USD | | | 60,535 | | | | NZD | | | | 81,739 | | | JPMorgan Chase Bank N.A. | | | 3/18/15 | | | | (1,161 | ) |
| USD | | | 69,438 | | | | NZD | | | | 90,271 | | | JPMorgan Chase Bank N.A. | | | 3/18/15 | | | | 1,302 | |
| USD | | | 69,566 | | | | NZD | | | | 96,126 | | | JPMorgan Chase Bank N.A. | | | 3/18/15 | | | | (2,990 | ) |
| USD | | | 74,485 | | | | NZD | | | | 99,127 | | | JPMorgan Chase Bank N.A. | | | 3/18/15 | | | | (336 | ) |
| USD | | | 91,245 | | | | NZD | | | | 122,787 | | | JPMorgan Chase Bank N.A. | | | 3/18/15 | | | | (1,435 | ) |
| USD | | | 91,317 | | | | NZD | | | | 118,622 | | | JPMorgan Chase Bank N.A. | | | 3/18/15 | | | | 1,781 | |
| USD | | | 103,707 | | | | NZD | | | | 143,224 | | | JPMorgan Chase Bank N.A. | | | 3/18/15 | | | | (4,398 | ) |
| USD | | | 114,891 | | | | NZD | | | | 150,882 | | | JPMorgan Chase Bank N.A. | | | 3/18/15 | | | | 1,005 | |
| USD | | | 115,578 | | | | NZD | | | | 155,735 | | | JPMorgan Chase Bank N.A. | | | 3/18/15 | | | | (1,971 | ) |
| USD | | | 342,769 | | | | NZD | | | | 454,418 | | | JPMorgan Chase Bank N.A. | | | 3/18/15 | | | | (225 | ) |
| USD | | | 407,498 | | | | NZD | | | | 534,353 | | | JPMorgan Chase Bank N.A. | | | 3/18/15 | | | | 4,169 | |
| USD | | | 804,969 | | | | NZD | | | | 1,061,849 | | | JPMorgan Chase Bank N.A. | | | 3/18/15 | | | | 3,487 | |
| USD | | | 740 | | | | SEK | | | | 6,216 | | | JPMorgan Chase Bank N.A. | | | 3/18/15 | | | | (6 | ) |
| USD | | | 1,033 | | | | SEK | | | | 8,314 | | | JPMorgan Chase Bank N.A. | | | 3/18/15 | | | | 36 | |
| USD | | | 1,036 | | | | SEK | | | | 8,080 | | | JPMorgan Chase Bank N.A. | | | 3/18/15 | | | | 66 | |
| USD | | | 5,248 | | | | SEK | | | | 42,721 | | | JPMorgan Chase Bank N.A. | | | 3/18/15 | | | | 123 | |
| USD | | | 26,544 | | | | SEK | | | | 220,145 | | | JPMorgan Chase Bank N.A. | | | 3/18/15 | | | | 133 | |
| USD | | | 36,779 | | | | SEK | | | | 308,918 | | | JPMorgan Chase Bank N.A. | | | 3/18/15 | | | | (283 | ) |
| USD | | | 51,425 | | | | SEK | | | | 387,037 | | | JPMorgan Chase Bank N.A. | | | 3/18/15 | | | | 4,991 | |
| USD | | | 57,393 | | | | SEK | | | | 461,792 | | | JPMorgan Chase Bank N.A. | | | 3/18/15 | | | | 1,990 | |
| USD | | | 58,768 | | | | SEK | | | | 458,411 | | | JPMorgan Chase Bank N.A. | | | 3/18/15 | | | | 3,771 | |
| USD | | | 176,727 | | | | SEK | | | | 1,477,111 | | | JPMorgan Chase Bank N.A. | | | 3/18/15 | | | | (487 | ) |
| USD | | | 409,349 | | | | SEK | | | | 3,331,994 | | | JPMorgan Chase Bank N.A. | | | 3/18/15 | | | | 9,599 | |
| USD | | | 606,136 | | | | SEK | | | | 5,065,499 | | | JPMorgan Chase Bank N.A. | | | 3/18/15 | | | | (1,516 | ) |
| USD | | | 980,000 | | | | SEK | | | | 8,189,985 | | | JPMorgan Chase Bank N.A. | | | 3/18/15 | | | | (2,462 | ) |
| USD | | | 4,341,719 | | | | SEK | | | | 32,677,081 | | | JPMorgan Chase Bank N.A. | | | 3/18/15 | | | | 421,345 | |
| EUR | | | 45,750 | | | | USD | | | | 51,885 | | | Goldman Sachs International | | | 3/20/15 | | | | (674 | ) |
| EUR | | | 77,419 | | | | USD | | | | 88,307 | | | Goldman Sachs International | | | 3/20/15 | | | | (1,648 | ) |
| USD | | | 153,137 | | | | EUR | | | | 134,375 | | | Goldman Sachs International | | | 3/20/15 | | | | 2,723 | |
| USD | | | 2,297,548 | | | | EUR | | | | 1,984,611 | | | Goldman Sachs International | | | 3/20/15 | | | | 76,065 | |
| USD | | | 40,603 | | | | SEK | | | | 339,121 | | | Goldman Sachs International | | | 3/20/15 | | | | (83 | ) |
| USD | | | 450,825 | | | | SEK | | | | 3,706,596 | | | Goldman Sachs International | | | 3/20/15 | | | | 6,122 | |
| GBP | | | 136,770 | | | | USD | | | | 211,242 | | | Goldman Sachs International | | | 3/23/15 | | | | (129 | ) |
| USD | | | 1,852,855 | | | | GBP | | | | 1,204,760 | | | Goldman Sachs International | | | 3/23/15 | | | | (6,762 | ) |
| USD | | | 829,396 | | | | EUR | | | | 715,675 | | | Bank of America N.A. | | | 4/22/15 | | | | 27,984 | |
| Total | | | | | | | | | | | | | | | | | | | | $ | 806,943 | |
| | | | | | | | | | | | | | | | | | | | | | |
See Notes to Financial Statements.
| | | | | | |
| 22 | | BLACKROCK MULTI-MANAGER ALTERNATIVE STRATEGIES FUND | | FEBRUARY 28, 2015 | | |
| | |
| Schedule of Investments (continued) | | |
| Ÿ | | As of February 28, 2015, centrally cleared credit default swaps — buy protection outstanding were as follows: |
| | | | | | | | | | | | | | | | | | | | |
| Index | | Pay
Fixed Rate | | | Clearinghouse | | Expiration
Date | | Notional
Amount (000) | | | Unrealized
Depreciation | |
CDX.NA.IG Series 22 Version 1 | | | 1.00 | % | | InterContinental Exchange | | 6/20/19 | | | USD | | | | 1,300 | | | $ | (10,798 | ) |
CDX.NA.HY Series 23 Version 2 | | | 5.00 | % | | InterContinental Exchange | | 12/20/19 | | | USD | | | | 565 | | | | (17,932 | ) |
CDX.NA.IG Series 23 Version 1 | | | 1.00 | % | | InterContinental Exchange | | 12/20/19 | | | USD | | | | 10,000 | | | | (44,124 | ) |
Total | | | | | | | | | | | | | | | | | | $ | (72,854 | ) |
| | | | | | | | | | | | | | | | | | | | |
| Ÿ | | As of February 28, 2015, OTC credit default swaps — buy protection outstanding were as follows: |
| | | | | | | | | | | | | | | | | | | | | | | | | | | | |
| Issuer | | Pay
Fixed Rate | | | Counterparty | | Expiration
Date | | Notional
Amount
(000) | | | Market
Value | | | Premiums
Paid
(Received) | | | Unrealized
Appreciation
(Depreciation) | |
MBIA Insurance Corp. | | | 5.00 | % | | Deutsche Bank AG | | 9/20/18 | | | USD | | | | 215 | | | $ | 37,512 | | | $ | 20,963 | | | $ | 16,549 | |
Anglo American Capital PLC | | | 1.00 | % | | Bank of America N.A. | | 9/20/19 | | | EUR | | | | 400 | | | | 5,552 | | | | 8,720 | | | | (3,168 | ) |
Glencore Finance Canada Ltd. | | | 1.00 | % | | Bank of America N.A. | | 9/20/19 | | | EUR | | | | 400 | | | | 3,978 | | | | 11,732 | | | | (7,754 | ) |
Telefonica SA | | | 1.00 | % | | Barclays Bank PLC | | 9/20/19 | | | EUR | | | | 400 | | | | (8,378 | ) | | | 241 | | | | (8,619 | ) |
Portugal Telecom International Finance BV | | | 5.00 | % | | JPMorgan Chase Bank N.A. | | 9/20/19 | | | EUR | | | | 400 | | | | (33,251 | ) | | | (41,705 | ) | | | 8,454 | |
Freescale Semiconductor Ltd. | | | 5.00 | % | | Barclays Bank PLC | | 9/20/19 | | | USD | | | | 200 | | | | (30,822 | ) | | | (16,261 | ) | | | (14,561 | ) |
Clear Channel Communications, Inc. | | | 5.00 | % | | Deutsche Bank AG | | 9/20/19 | | | USD | | | | 275 | | | | 88,748 | | | | 63,287 | | | | 25,461 | |
MGM Mirage, Inc. | | | 5.00 | % | | Morgan Stanley & Co. International PLC | | 9/20/19 | | | USD | | | | 400 | | | | (47,527 | ) | | | (38,613 | ) | | | (8,914 | ) |
Windstream Corp. | | | 5.00 | % | | Morgan Stanley & Co. International PLC | | 9/20/19 | | | USD | | | | 550 | | | | (44,801 | ) | | | (54,265 | ) | | | 9,464 | |
Telefonica SA | | | 1.00 | % | | Barclays Bank PLC | | 12/20/19 | | | EUR | | | | 750 | | | | (14,933 | ) | | | 3,596 | | | | (18,529 | ) |
iTraxx Financials Series 22 Version 1 | | | 1.00 | % | | JPMorgan Chase Bank N.A. | | 12/20/19 | | | EUR | | | | 207 | | | | (5,484 | ) | | | (3,952 | ) | | | (1,532 | ) |
Fiat SpA | | | 5.00 | % | | Bank of America N.A. | | 3/20/20 | | | EUR | | | | 600 | | | | (121,961 | ) | | | (98,629 | ) | | | (23,332 | ) |
Telefonica SA | | | 1.00 | % | | Barclays Bank PLC | | 3/20/20 | | | EUR | | | | 500 | | | | (9,422 | ) | | | (4,575 | ) | | | (4,847 | ) |
Frontier Communications Corp. | | | 5.00 | % | | Bank of America N.A. | | 3/20/20 | | | USD | | | | 500 | | | | (53,325 | ) | | | (42,553 | ) | | | (10,772 | ) |
AK Steel Corp. | | | 5.00 | % | | JPMorgan Chase Bank N.A. | | 3/20/20 | | | USD | | | | 55 | | | | 540 | | | | 3,110 | | | | (2,570 | ) |
Staples, Inc. | | | 1.00 | % | | JPMorgan Chase Bank N.A. | | 3/20/20 | | | USD | | | | 500 | | | | 19,940 | | | | 26,264 | | | | (6,324 | ) |
Total | | | | | | | | | | | | | | | | | | $ | (213,634 | ) | | $ | (162,640 | ) | | $ | (50,994 | ) |
| | | | | | | | | | | | | | | | | | | | |
| Ÿ | | As of February 28, 2015, OTC credit default swaps — sold protection outstanding were as follows: |
| | | | | | | | | | | | | | | | | | | | | | | | | | | | | | | | |
| Issuer | | Receive
Fixed Rate | | | Counterparty | | Expiration
Date | | Credit
Rating1 | | | Notional
Amount
(000)2 | | | Market
Value | | | Premiums
Paid
(Received) | | | Unrealized
Appreciation
(Depreciation) | |
MBIA Insurance Corp. | | | 5.00 | % | | Deutsche Bank AG | | 12/20/16 | | | B | | | | USD | | | | 205 | | | $ | (24,175 | ) | | $ | (13,087 | ) | | $ | (11,088 | ) |
Realogy Group LLC | | | 5.00 | % | | Bank of America N.A. | | 9/20/19 | | | B | | | | USD | | | | 400 | | | | 44,616 | | | | 31,614 | | | | 13,002 | |
Deutsche Telekom International Finance BV | | | 1.00 | % | | Barclays Bank PLC | | 12/20/19 | | | BBB+ | | | | EUR | | | | 750 | | | | 28,594 | | | | 17,081 | | | | 11,513 | |
CNH Capital LLC | | | 5.00 | % | | Bank of America N.A. | | 3/20/20 | | | BB+ | | | | EUR | | | | 600 | | | | 122,013 | | | | 100,249 | | | | 21,764 | |
Volkswagen International Finance NV | | | 1.00 | % | | Barclays Bank PLC | | 3/20/20 | | | A | | | | EUR | | | | 500 | | | | 17,568 | | | | 14,948 | | | | 2,620 | |
UPC Holding BV | | | 5.00 | % | | JPMorgan Chase Bank N.A. | | 9/20/21 | | | B | | | | EUR | | | | 400 | | | | 72,938 | | | | 54,319 | | | | 18,619 | |
Total | | | | | | | | | | | | | | | | | | | | | | $ | 261,554 | | | $ | 205,124 | | | $ | 56,430 | |
| | | | | | | | | | | | | | | | | | | | | | | | |
| | 1 | | Using Standard & Poor’s rating of the issuer. |
| | 2 | | The maximum potential amount the Fund may pay should a negative credit event take place as defined under the terms of the agreement. |
See Notes to Financial Statements.
| | | | | | |
| | | BLACKROCK MULTI-MANAGER ALTERNATIVE STRATEGIES FUND | | FEBRUARY 28, 2015 | | 23 |
| | |
| Schedule of Investments (continued) | | |
| Ÿ | | As of February 28, 2015, OTC total return basket swaps outstanding were as follows1: |
| | | | | | | | | | | | | | | | | | |
| Reference Entity | | Counterparty | | | Expiration
Date | | Net
Notional
Amount | | | Unrealized
Appreciation | | | Net Value of
Reference
Entities | |
Equity Securities Long/Short | | | Morgan Stanley & Co. International PLC | | | 8/08/16 | | $ | 7,150,091 | | | $ | 871,089 | 2 | | $ | 8,028,840 | |
| | 1 | | The Fund receives or pays the total return on a portfolio of long and short positions underlying the total return swap. In addition, the Fund pays or receives a variable rate of interest, based on a specified benchmark, plus or minus a spread in a range of 20-4051 basis points. The benchmark and spread are determined based upon the country and/or currency of the individual underlying positions. The 1-day Federal Funds Rate is the specified benchmark used in determining the variable rate of interest. |
| | 2 | | Amount includes $(7,660) of dividends and financing fees. |
The following table represents the individual long and short positions and related values of equity securities underlying the total return swap with Morgan Stanley & Co. International PLC, as of February 28, 2015, expiration date 8/08/16:
| | | | | | | | |
| | | Shares | | | Value | |
| Reference Entity — Long | | | | | | |
ABIOMED, Inc. | | | 6,399 | | | $ | 388,995 | |
Acceleron Pharma, Inc. | | | 7,975 | | | | 324,024 | |
Agnico-Eagle Mines Ltd. | | | 3,452 | | | | 110,982 | |
American International Group, Inc. | | | 5,309 | | | | 293,747 | |
Amicus Therapeutics, Inc. | | | 4,235 | | | | 37,099 | |
The Bank of New York Mellon Corp. | | | 7,190 | | | | 281,417 | |
Becton Dickinson & Co. | | | 1,480 | | | | 217,146 | |
BioDelivery Sciences International, Inc. | | | 14,442 | | | | 216,558 | |
Carter’s, Inc. | | | 443 | | | | 39,325 | |
Celladon Corp. | | | 2,498 | | | | 45,339 | |
Celldex Therapeutics, Inc. | | | 4,952 | | | | 126,474 | |
Cempra, Inc. | | | 4,039 | | | | 133,772 | |
Cerner Corp. | | | 5,530 | | | | 398,492 | |
Chicago Bridge & Iron Co. NV | | | 7,834 | | | | 361,617 | |
Cigna Corp. | | | 4,681 | | | | 569,350 | |
CommScope Holding Co., Inc. | | | 4,744 | | | | 149,436 | |
Crown Castle International Corp. | | | 5,305 | | | | 457,875 | |
General Motors Co. | | | 9,062 | | | | 338,103 | |
Gilead Sciences, Inc. | | | 2,811 | | | | 291,023 | |
Google, Inc., Class A | | | 502 | | | | 282,440 | |
Halliburton Co. | | | 10,510 | | | | 451,299 | |
Hologic, Inc. | | | 12,455 | | | | 403,293 | |
Intercept Pharmaceuticals, Inc. | | | 1,234 | | | | 273,171 | |
Level 3 Communications, Inc. | | | 8,589 | | | | 462,604 | |
Liberty Broadband Corp. | | | 7,867 | | | | 407,983 | |
Liberty Ventures, Series A | | | 15,729 | | | | 631,991 | |
Life Time Fitness, Inc. | | | 8,743 | | | | 505,345 | |
Lowe’s Cos., Inc. | | | 3,965 | | | | 293,767 | |
The Madison Square Garden Co., Class A | | | 4,915 | | | | 385,090 | |
The Mosaic Co. | | | 5,641 | | | | 300,440 | |
MPLX LP | | | 2,923 | | | | 240,271 | |
Netflix, Inc. | | | 1,132 | | | | 537,598 | |
NorthStar Asset Management Group, Inc. | | | 30,735 | | | | 745,938 | |
NorthStar Realty Finance Corp. | | | 11,231 | | | | 215,860 | |
NXP SemiConductor NV | | | 5,989 | | | | 508,436 | |
Oracle Corp. | | | 7,013 | | | | 307,310 | |
Pfenex, Inc. | | | 3,921 | | | | 57,639 | |
Realogy Holdings Corp. | | | 3,055 | | | | 140,530 | |
Sotheby’s | | | 6,145 | | | | 270,073 | |
Tenet Healthcare Corp. | | | 9,644 | | | | 446,517 | |
Tesoro Corp. | | | 3,236 | | | | 297,194 | |
| | | | | | | | |
| | | Shares | | | Value | |
| Reference Entity — Long | | | | | | |
Teva Pharmaceutical Industries Ltd. — ADR | | | 3,939 | | | $ | 224,602 | |
Time Warner, Inc. | | | 6,081 | | | | 497,791 | |
TripAdvisor, Inc. | | | 4,557 | | | | 406,712 | |
United Continental Holdings, Inc. | | | 5,677 | | | | 370,027 | |
Vail Resorts, Inc. | | | 4,379 | | | | 384,520 | |
Vulcan Materials Co. | | | 5,528 | | | | 458,824 | |
Whole Foods Market, Inc. | | | 46 | | | | 2,599 | |
The Williams Cos., Inc. | | | 11,640 | | | | 570,826 | |
Total Reference Entity — Long | | | | | | | 15,861,464 | |
| Reference Entity — Short | | | | | | |
Air Methods Corp. | | | (1,382 | ) | | | (73,232 | ) |
AMETEK, Inc. | | | (4,799 | ) | | | (255,019 | ) |
Apple Inc. | | | (1,451 | ) | | | (186,395 | ) |
Bristol-Myers Squibb Co. | | | (2,757 | ) | | | (167,956 | ) |
Caterpillar, Inc. | | | (3,654 | ) | | | (302,917 | ) |
Comerica, Inc. | | | (2,467 | ) | | | (112,939 | ) |
ConAgra Foods, Inc. | | | (6,291 | ) | | | (220,059 | ) |
Consumer Discretionary Select Sector SPDR ETF | | | (3,548 | ) | | | (269,542 | ) |
DENTSPLY International, Inc. | | | (705 | ) | | | (37,372 | ) |
DeVry, Inc. | | | (1,866 | ) | | | (68,202 | ) |
Energy Select Sector SPDR ETF | | | (3,203 | ) | | | (253,101 | ) |
Exact Sciences Corp. | | | (4,348 | ) | | | (97,700 | ) |
Foot Locker, Inc. | | | (1,398 | ) | | | (78,526 | ) |
The Fresh Market, Inc. | | | (2,721 | ) | | | (103,561 | ) |
General Electric Co. | | | (8,721 | ) | | | (226,659 | ) |
HCA Holdings, Inc. | | | (4,210 | ) | | | (301,183 | ) |
Health Care Select Sector SPDR ETF | | | (5,858 | ) | | | (423,182 | ) |
Incyte Corp. Ltd. | | | (1,928 | ) | | | (165,519 | ) |
iShares Nasdaq Biotechnology ETF | | | (562 | ) | | | (189,658 | ) |
Isis Pharmaceuticals, Inc. | | | (2,303 | ) | | | (157,894 | ) |
Kellogg Co. | | | (3,472 | ) | | | (223,875 | ) |
Kraft Foods Group, Inc. | | | (3,416 | ) | | | (218,829 | ) |
MannKind Corp. | | | (9,366 | ) | | | (61,066 | ) |
Mattel, Inc. | | | (11,016 | ) | | | (289,941 | ) |
Nielsen NV | | | (3,143 | ) | | | (142,095 | ) |
Panera Bread Co., Class A | | | (1,304 | ) | | | (210,505 | ) |
Post Holdings, Inc. | | | (1,482 | ) | | | (73,329 | ) |
Powershares QQQ Trust, Series 1 | | | (7,877 | ) | | | (853,867 | ) |
ResMed, Inc. | | | (557 | ) | | | (35,849 | ) |
Schlumberger Ltd. | | | (3,222 | ) | | | (271,164 | ) |
Sinclair Broadcast Group, Inc. — Class A | | | (6,137 | ) | | | (1168,522 | ) |
See Notes to Financial Statements.
| | | | | | |
| 24 | | BLACKROCK MULTI-MANAGER ALTERNATIVE STRATEGIES FUND | | FEBRUARY 28, 2015 | | |
| | |
| Schedule of Investments (continued) | | |
| | | | | | | | |
| | | Shares | | | Value | |
| Reference Entity — Short | | | | | | |
SPDR S&P 500 ETF Trust | | | (6,064 | ) | | $ | (1,277,442 | ) |
Thoratec Corp. | | | (909 | ) | | | (37,014 | ) |
Viacom, Inc., Class B | | | (1,908 | ) | | | (133,446 | ) |
Zions Bancorporation | | | (5,426 | ) | | | (145,064 | ) |
Total Reference Entity — Short | | | | | | | (7,832,624 | ) |
Net Value of Reference Entity — Morgan Stanley & Co. International PLC | | | | | | $ | 8,028,840 | |
| Ÿ | | Fair Value Measurements — Various inputs are used in determining the fair value of investments and derivative financial instruments. These inputs to valuation techniques are categorized into a disclosure hierarchy consisting of three broad levels for financial reporting purposes. The hierarchy gives the highest priority to unadjusted quoted prices in active markets for identical assets or liabilities (Level 1 measurements) and the lowest priority to unobservable inputs (Level 3 measurements). Accordingly, the degree of judgment exercised in determining fair value is greatest for instruments categorized in Level 3. The inputs used to measure fair value may fall into different levels of the fair value hierarchy. In such cases, for disclosure purposes, the fair value hierarchy classification is determined based on the lowest level input that is significant to the fair value measurement in its entirety. The categorization of a value determined for investments and derivative financial instruments is based on the pricing transparency of the investment and derivative financial instruments and is not necessarily an indication of the risks associated with investing in those securities. The three levels of the fair value hierarchy are as follows: |
| | Ÿ | | Level 1 – unadjusted quoted prices in active markets/exchanges for identical assets or liabilities that the Fund has the ability to access |
| | Ÿ | | Level 2 – other observable inputs (including, but not limited to, quoted prices for similar assets or liabilities in markets that are active, quoted prices for identical or similar assets or liabilities in markets that are not active, inputs other than quoted prices that are observable for the assets or liabilities (such as interest rates, yield curves, volatilities, prepayment speeds, loss severities, credit risks and default rates) or other market–corroborated inputs) |
| | Ÿ | | Level 3 – unobservable inputs based on the best information available in the circumstances, to the extent observable inputs are not available (including the Fund’s own assumptions used in determining the fair value of investments and derivative financial instruments) |
Changes in valuation techniques may result in transfers into or out of an assigned level within the disclosure hierarchy. In accordance with the Fund’s policy, transfers between different levels of the fair value disclosure hierarchy are deemed to have occurred as of the beginning of the reporting period. For information about the Fund’s policy regarding valuation of investments and derivative financial instruments, refer to the Fund’s most recent financial statements as contained in its annual report.
As of February 28, 2015, the following tables summarize the Fund’s investments and derivative financial instruments categorized in the disclosure hierarchy:
| | | | | | | | | | | | | | | | |
| | | Level 1 | | | Level 2 | | | Level 3 | | | Total | |
Assets: | | | | | | | | | | | | | | | | |
Investments: | | | | | | | | | | | | | | | | |
Long-Term Investments: | | | | | | | | | | | | | | | | |
Asset-Backed Securities | | | — | | | $ | 7,054,255 | | | | — | | | $ | 7,054,255 | |
Common Stocks1 | | $ | 1,177,261 | | | | 233,829 | | | $ | 190,697 | | | | 1,601,787 | |
Corporate Bonds1 | | | — | | | | 13,386,898 | | | | 214,500 | | | | 13,601,398 | |
Floating Rate Loan Interests | | | — | | | | 1,902,414 | | | | 1,170,016 | | | | 3,072,430 | |
Investment Companies | | | 25,168,366 | | | | — | | | | — | | | | 25,168,366 | |
Non-Agency Mortgage-Backed Securities | | | — | | | | 8,741,527 | | | | — | | | | 8,741,527 | |
Preferred Securities | | | — | | | | 1,942,368 | | | | 156,600 | | | | 2,098,968 | |
Taxable Municipal Bonds | | | — | | | | 416,885 | | | | — | | | | 416,885 | |
U.S. Treasury Obligations | | | — | | | | 753,239 | | | | — | | | | 753,239 | |
Short-Term Securities | | | 35,122,733 | | | | — | | | | — | | | | 35,122,733 | |
Liabilities: | | | | | | | | | | | | | | | | |
Investments Sold Short1 | | | — | | | | (1,762,219 | ) | | | — | | | | (1,762,219 | ) |
Unfunded floating rate loan interests2 | | | — | | | | — | | | | (4,454 | ) | | | (4,454 | ) |
| | | | |
Total | | $ | 61,468,360 | | | $ | 32,669,196 | | | $ | 1,727,359 | | | $ | 95,864,915 | |
| | | | |
1 See above Schedule of Investments for values in each industry. | | | | | | | | | | | | | | | | |
2 Unfunded floating rate loan interests are valued at the unrealized appreciation/depreciation on the commitment. | | | | | | | | | | | | | | | | |
See Notes to Financial Statements.
| | | | | | |
| | | BLACKROCK MULTI-MANAGER ALTERNATIVE STRATEGIES FUND | | FEBRUARY 28, 2015 | | 25 |
| | |
| Schedule of Investments (concluded) | | |
| | | | | | | | | | | | | | |
| | | Level 1 | | | Level 2 | | | Level 3 | | Total | |
Derivative Financial Instruments3 | | | | | | | | | | | | | | |
Assets: | | | | | | | | | | | | | | |
Credit contracts | | | — | | | $ | 127,446 | | | — | | $ | 127,446 | |
Equity contracts | | $ | 280,550 | | | | 871,089 | | | — | | | 1,151,639 | |
Foreign currency exchange contracts | | | — | | | | 2,444,099 | | | — | | | 2,444,099 | |
Interest rate contracts | | | 105,132 | | | | — | | | — | | | 105,132 | |
Liabilities: | | | | | | | | | | | | | | |
Credit contracts | | | — | | | | (194,864 | ) | | — | | | (194,864 | ) |
Equity contracts | | | (113,707 | ) | | | — | | | — | | | (113,707 | ) |
Foreign currency exchange contracts | | | — | | | | (1,637,156 | ) | | — | | | (1,637,156 | ) |
Interest rate contracts | | | (132,520 | ) | | | — | | | — | | | (132,520 | ) |
| | | | |
Total | | $ | 139,455 | | | $ | 1,610,614 | | | — | | $ | 1,750,069 | |
| | | | |
| 3 | | Derivative financial instruments are swaps, financial futures contracts and forward foreign currency exchange contracts. Swaps, financial futures contracts and forward foreign currency exchange contracts are valued at the unrealized appreciation/depreciation on the instrument. |
The Fund may hold assets in which the fair value approximates the carrying amount for financial reporting purposes. As of February 28, 2015, such assets are categorized within the disclosure hierarchy as follows:
| | | | | | | | | | | | | | |
| | | | | | | | | | | | | | |
| | | Level 1 | | | Level 2 | | | Level 3 | | Total | |
Assets: | | | | | | | | | | | | | | |
Foreign currency at value | | $ | 57,039 | | | | — | | | — | | $ | 57,039 | |
Cash pledged for financial futures contracts | | | 144,404 | | | | — | | | — | | | 144,404 | |
Cash held for investments sold short | | | 2,255,956 | | | | — | | | — | | | 2,255,956 | |
Cash pledged for centrally cleared swaps | | | 171,230 | | | | — | | | — | | | 171,230 | |
Cash pledged as collateral for OTC derivatives | | | 725,961 | | | | — | | | — | | | 725,961 | |
Liabilities: | | | | | | | | | | | | | | |
Bank overdraft | | | — | | | $ | (10,730 | ) | | — | | | (10,730 | ) |
| | | | |
Total | | $ | 3,354,590 | | | $ | (10,730 | ) | | — | | $ | 3,343,860 | |
| | | | |
During the six months ended February 28, 2015, there were no transfers between Level 1 and Level 2.
A reconciliation of Level 3 investments is presented when the Fund had a significant amount of Level 3 investments at the beginning and/or end of the period in relation to net assets. The following table is a reconciliation of Level 3 investments for which significant unobservable inputs were used in determining fair value:
| | | | | | | | | | | | | | | | | | | | | | | | |
| | | | | | | | | | | | | | | | | | | | | | | | |
| | | Common Stocks | | | Corporate Bonds | | | Floating Rate Loan Interests | | | Preferred Securities | | | Unfunded Floating Rate Loan Interests | | | Total | |
Assets: | | | | | | | | | | | | | | | | | | | | | | | | |
Opening Balance, as of August 31, 2014 | | $ | 151,404 | | | | — | | | | — | | | | — | | | | — | | | $ | 151,404 | |
Transfers into Level 3 | | | 115,150 | | | $ | 116,250 | | | | — | | | $ | 200,475 | | | | — | | | | 431,875 | |
Transfers out of Level 3 | | | — | | | | — | | | | — | | | | — | | | | — | | | | — | |
Accrued discounts/premiums | | | — | | | | 4,556 | | | $ | 604 | | | | — | | | | — | | | | 5,160 | |
Net realized gain (loss) | | | — | | | | — | | | | — | | | | — | | | | — | | | | — | |
Net change in unrealized appreciation/depreciation4,5 | | | (75,857 | ) | | | (5,681 | ) | | | (539 | ) | | | (43,875 | ) | | $ | (4,454 | ) | | | (130,406 | ) |
Purchases | | | — | | | | 99,375 | | | | 1,169,951 | | | | — | | | | — | | | | 1,269,326 | |
Sales | | | — | | | | — | | | | — | | | | — | | | | — | | | | — | |
Closing Balance, as of February 28, 2015 | | $ | 190,697 | | | $ | 214,500 | | | $ | 1,170,016 | | | $ | 156,600 | | | $ | (4,454 | ) | | $ | 1,727,359 | |
| | | | |
Net change in unrealized appreciation/depreciation on investments still held at February 28, 20155 | | $ | (75,857 | ) | | $ | (5,681 | ) | | $ | (539 | ) | | $ | (43,875 | ) | | $ | (4,454 | ) | | $ | (130,406 | ) |
| | | | |
| 4 | | Included in the related Net change in unrealized appreciation/depreciation in the Statement of Operations. |
| 5 | | Any difference between Net change in unrealized appreciation/depreciation and Net change in unrealized appreciation/depreciation on investments still held at February 28, 2015 is generally due to investments no longer held or categorized as Level 3 at period end. |
The Fund’s investments that are categorized as Level 3 were valued utilizing third party pricing information without adjustment. Such valuations are based on unobservable inputs. A significant change in third party information inputs could result in a significantly lower or higher value of such Level 3 investments.
See Notes to Financial Statements.
| | | | | | |
| 26 | | BLACKROCK MULTI-MANAGER ALTERNATIVE STRATEGIES FUND | | FEBRUARY 28, 2015 | | |
| | |
| Statement of Assets and Liabilities | | |
February 28, 2015 (Unaudited)
| | | | |
| Assets | | | | |
Investments at value — unaffiliated (cost — $38,428,355) | | $ | 37,340,489 | |
Investments at value — affiliated (cost — $60,180,845) | | | 60,291,099 | |
Cash pledged for financial futures contracts | | | 144,404 | |
Cash held for investments sold short | | | 2,255,956 | |
Cash pledged for centrally cleared swaps | | | 171,230 | |
Cash pledged as collateral for OTC derivatives | | | 725,961 | |
Foreign currency at value (cost — $57,703) | | | 57,039 | |
Variation margin receivable on financial futures contracts | | | 7,490,240 | |
Variation margin receivable on centrally cleared swaps | | | 77,133 | |
Investments sold receivable | | | 962,793 | |
Swap premiums paid | | | 356,124 | |
Unrealized appreciation on forward foreign currency exchange contracts | | | 2,444,099 | |
Unrealized appreciation on OTC swaps | | | 998,535 | |
Capital shares sold receivable | | | 50,000 | |
Interest receivable | | | 304,327 | |
Dividends receivable — unaffiliated | | | 5,011 | |
Dividends receivable — affiliated | | | 1,856 | |
Receivable from Manager | | | 8 | |
Deferred offering costs | | | 124,252 | |
Prepaid expenses | | | 11,814 | |
| | | | |
Total assets | | | 113,812,370 | |
| | | | |
| | | | |
| Liabilities | | | | |
Bank overdraft | | | 10,730 | |
Investments sold short at value (proceeds — $1,772,655) | | | 1,762,219 | |
Variation margin payable on financial futures contracts | | | 6,172,543 | |
Investments purchased payable | | | 1,631,927 | |
Swap premiums received | | | 313,640 | |
Unrealized depreciation on forward foreign currency exchange contracts | | | 1,637,156 | |
Unrealized depreciation on OTC swaps | | | 122,010 | |
Unrealized depreciation on unfunded floating rate loan interests | | | 4,454 | |
Capital shares redeemed payable | | | 1,915 | |
Investment advisory fees payable | | | 112,659 | |
Service and distribution fees payable | | | 141 | |
Other affiliates payable | | | 3,883 | |
Interest expense payable | | | 29,062 | |
Officer’s and Trustees’ fees payable | | | 1,756 | |
Other accrued expenses payable | | | 26,437 | |
| | | | |
Total liabilities | | | 11,830,532 | |
| | | | |
Net Assets | | $ | 101,981,838 | |
| | | | |
| | | | |
| Net Assets Consist of | | | | |
Paid-in capital | | | 101,344,082 | |
Distributions in excess of net investment income | | | (1,148,262 | ) |
Accumulated net realized gain | | | 993,185 | |
Net unrealized appreciation/depreciation | | | 792,833 | |
| | | | |
Net Assets | | $ | 101,981,838 | |
| | | | |
See Notes to Financial Statements.
| | | | | | |
| | | BLACKROCK MULTI-MANAGER ALTERNATIVE STRATEGIES FUND | | FEBRUARY 28, 2015 | | 27 |
| | |
| Statement of Assets and Liabilities (concluded) | | |
February 28, 2015 (Unaudited)
| | | | |
Net Asset Value | | | | |
Institutional | | | | |
Net assets | | $ | 101,521,975 | |
| | | | |
Shares outstanding1 | | | 10,090,218 | |
| | | | |
Net asset value | | $ | 10.06 | |
| | | | |
Investor A | | | | |
Net assets | | $ | 342,778 | |
| | | | |
Shares outstanding1 | | | 34,131 | |
| | | | |
Net asset value | | $ | 10.04 | |
| | | | |
Investor C | | | | |
Net assets | | $ | 117,085 | |
| | | | |
Shares outstanding1 | | | 11,702 | |
| | | | |
Net asset value | | $ | 10.01 | |
| | | | |
1 Unlimited number of shares authorized, $ 0.001 par value. | | | | |
See Notes to Financial Statements.
| | | | | | |
| 28 | | BLACKROCK MULTI-MANAGER ALTERNATIVE STRATEGIES FUND | | FEBRUARY 28, 2015 | | |
| | | | |
| Six Months Ended February 28, 2015 (Unaudited) | | | |
| | | | |
| Investment Income | | | | |
Interest | | $ | 839,665 | |
Dividends — unaffiliated | | | 172,923 | |
Dividends — affiliated | | | 6,516 | |
Foreign taxes withheld | | | (5,031 | ) |
| | | | |
Total income | | | 1,014,073 | |
| | | | |
| | | | |
| Expenses | | | | |
Offering | | | 139,658 | |
Investment advisory | | | 968,550 | |
Service and distribution — class specific | | | 813 | |
Administration | | | 24,835 | |
Transfer agent — class specific | | | 370 | |
Registration | | | 2,809 | |
Accounting services | | | 128,401 | |
Custodian | | | 7,610 | |
Professional | | | 69,707 | |
Printing | | | 12,438 | |
Officer and Trustees | | | 3,031 | |
Miscellaneous | | | 21,877 | |
| | | | |
Total expenses excluding dividend expense, stock loan fees and interest expense | | | 1,380,099 | |
Dividend expense | | | 64,637 | |
Stock loan fees | | | 31,334 | |
Interest expense | | | 24,849 | |
| | | | |
Total expenses | | | 1,500,919 | |
Less fees waived by Manager | | | (220,614 | ) |
Less accounting services fees waived | | | (39,833 | ) |
Less transfer agent fees waived — class specific | | | (34 | ) |
Less transfer agent fees reimbursed — class specific | | | (41 | ) |
| | | | |
Total expenses after fees waived and reimbursed | | | 1,240,397 | |
| | | | |
Net investment loss | | | (226,324 | ) |
| | | | |
| | | | |
| Realized and Unrealized Gain | | | | |
Net realized gain (loss) from: | | | | |
Investments — unaffiliated | | | (667,368 | ) |
Capital gain distributions received from affiliated investment companies | | | 335,315 | |
Options written | | | (49,829 | ) |
Financial futures contracts | | | 1,222,104 | |
Swaps | | | (961,543 | ) |
Foreign currency transactions | | | 1,108,317 | |
Short sales | | | 128,749 | |
| | | | |
| | | 1,115,745 | |
| | | | |
Net change in unrealized appreciation/depreciation on: | | | | |
Investments — unaffiliated | | | (1,182,205 | ) |
Investments — affiliated | | | (100,883 | ) |
Unfunded floating rate loan interests | | | (4,454 | ) |
Options written | | | 15,154 | |
Financial futures contracts | | | 78,515 | |
Swaps | | | 522,356 | |
Foreign currency translations | | | 702,913 | |
Short sales | | | 190,740 | |
| | | | |
| | | 222,136 | |
| | | | |
Net realized and unrealized gain | | | 1,337,881 | |
| | | | |
Net Increase in Net Assets Resulting from Operations | | $ | 1,111,557 | |
| | | | |
See Notes to Financial Statements.
| | | | | | |
| | | BLACKROCK MULTI-MANAGER ALTERNATIVE STRATEGIES FUND | | FEBRUARY 28, 2015 | | 29 |
| | |
| Statements of Changes in Net Assets | | |
| | | | | | | | |
| Increase in Net Assets: | | Six Months
Ended
February 28, 2015
(Unaudited) | | | Period
August 7, 20141 to
August 31, 2014 | |
Operations | | | | | | | | |
Net investment loss | | $ | (226,324 | ) | | $ | (80,803 | ) |
Net realized gain | | | 1,115,745 | | | | 83,363 | |
Net change in unrealized appreciation/depreciation | | | 222,136 | | | | 570,697 | |
| | | | |
Net increase in net assets resulting from operations | | | 1,111,557 | | | | 573,257 | |
| | | | |
| | | | | | | | |
Distributions to Shareholders From2 | | | | | | | | |
Net investment income: | | | | | | | | |
Institutional | | | (896,809 | ) | | | — | |
Investor A | | | (2,216 | ) | | | — | |
Investor C | | | (982 | ) | | | — | |
Net realized gain: | | | | | | | | |
Institutional | | | (164,728 | ) | | | — | |
Investor A | | | (410 | ) | | | — | |
Investor C | | | (193 | ) | | | — | |
| | | | |
Decrease in net assets resulting from distributions to shareholders | | | (1,065,338 | ) | | | — | |
| | | | |
| | | | | | | | |
Capital Share Transactions | | | | | | | | |
Net increase in net assets derived from capital share transactions | | | 1,183,874 | | | | 100,178,488 | |
| | | | |
| | | | | | | | |
Net Assets | | | | | | | | |
Total increase in net assets | | | 1,230,093 | | | | 100,751,745 | |
Beginning of period | | | 100,751,745 | | | | — | |
| | | | |
End of period | | $ | 101,981,838 | | | $ | 100,751,745 | |
| | | | |
Distributions in excess of net investment income, end of period | | $ | (1,148,262 | ) | | $ | (21,931 | ) |
| | | | |
1 Commencement of operations. | | | | | | | | |
2 Distributions for annual periods determined in accordance with federal income tax regulations. | | | | | | | | |
See Notes to Financial Statements.
| | | | | | |
| 30 | | BLACKROCK MULTI-MANAGER ALTERNATIVE STRATEGIES FUND | | FEBRUARY 28, 2015 | | |
| | | | | | | | | | | | | | | | | | | | | | | | |
| | | Institutional | | | Investor A | | | Investor C | |
| | | Six Months
Ended
February 28,
2015
(Unaudited) | | | Period
August 7,
20141 to
August 31,
2014 | | | Six Months
Ended
February 28,
2015
(Unaudited) | | | Period
August 7,
20141 to
August 31,
2014 | | | Six Months
Ended
February 28,
2015
(Unaudited) | | | Period
August 7,
20141 to
August 31,
2014 | |
| | | | | | | | | | | | | | | | | | | | | | | | |
| Per Share Operating Performance | | | | | | | | | | | | | | | | | | | | | | | | |
Net asset value, beginning of period | | $ | 10.06 | | | $ | 10.00 | | | $ | 10.06 | | | $ | 10.00 | | | $ | 10.05 | | | $ | 10.00 | |
| | | | | | | | | | | | |
Net investment loss2 | | | (0.02 | ) | | | (0.01 | ) | | | (0.04 | ) | | | (0.01 | ) | | | (0.08 | ) | | | (0.02 | ) |
Net realized and unrealized gain | | | 0.13 | | | | 0.07 | | | | 0.13 | | | | 0.07 | | | | 0.14 | | | | 0.07 | |
| | | | | | | | | | | | |
Net increase from investment operations | | | 0.11 | | | | 0.06 | | | | 0.09 | | | | 0.06 | | | | 0.06 | | | | 0.05 | |
| | | | | | | | | | | | |
Distributions from:3 | | | | | | | | | | | | | | | | | | | | | | | | |
Net investment income | | | (0.09 | ) | | | — | | | | (0.09 | ) | | | — | | | | (0.08 | ) | | | — | |
Net realized gain | | | (0.02 | ) | | | — | | | | (0.02 | ) | | | — | | | | (0.02 | ) | | | — | |
| | | | | | | | | | | | |
Total distributions | | | (0.11 | ) | | | — | | | | (0.11 | ) | | | — | | | | (0.10 | ) | | | — | |
| | | | | | | | | | | | |
Net asset value, end of period | | $ | 10.06 | | | $ | 10.06 | | | $ | 10.04 | | | $ | 10.06 | | | $ | 10.01 | | | $ | 10.05 | |
| | | | | | | | | | | | |
| | | | | | | | | | | | | | | | | | | | | | | | |
| Total Return4,5 | | | | | | | | | | | | | | | | | | | | | | | | |
Based on net asset value | | | 1.07 | % | | | 0.60 | % | | | 0.86 | % | | | 0.60 | % | | | 0.62 | % | | | 0.50 | % |
| | | | | | | | | | | | |
| | | | | | | | | | | | | | | | | | | | | | | | |
| Ratios to Average Net Assets6,7 | | | | | | | | | | | | | | | | | | | | | | | | |
Total expenses | | | 3.02 | % | | | 3.97 | %8 | | | 3.38 | % | | | 4.47 | %8 | | | 4.20 | % | | | 5.20 | %8 |
| | | | | | | | | | | | |
Total expenses after fees waived and reimbursed | | | 2.50 | % | | | 2.43 | % | | | 2.82 | % | | | 2.69 | % | | | 3.59 | % | | | 3.44 | % |
| | | | | | | | | | | | |
Total expenses after fees waived and reimbursed and excluding dividend expense, stock loan fees and interest expense | | | 2.25 | % | | | 2.35 | % | | | 2.58 | % | | | 2.60 | % | | | 3.35 | % | | | 3.35 | % |
| | | | | | | | | | | | |
Net investment loss | | | (0.46 | )% | | | (1.22 | )% | | | (0.72 | )% | | | (1.48 | )% | | | (1.55 | )% | | | (2.23 | )% |
| | | | | | | | | | | | |
| | | | | | | | | | | | | | | | | | | | | | | | |
| Supplemental Data | | | | | | | | | | | | | | | | | | | | | | | | |
Net assets, end of period (000) | | $ | 101,522 | | | $ | 100,549 | | | $ | 343 | | | $ | 102 | | | $ | 117 | | | $ | 101 | |
| | | | | | | | | | | | |
Portfolio turnover rate | | | 99 | % | | | 5 | % | | | 99 | % | | | 5 | % | | | 99 | % | | | 5 | % |
| | | | | | | | | | | | |
| | 1 | | Commencement of operations. |
| | 2 | | Based on average shares outstanding. |
| | 3 | | Distributions for annual periods determined in accordance with federal income tax regulations. |
| | 4 | | Where applicable, excludes the effects of any sales charges and assumes the reinvestment of distributions. |
| | 5 | | Aggregate total return. |
| | 6 | | Excludes expenses incurred indirectly as a result of investments in underlying funds as follows: |
| | | | | | | | |
| | | Six Months
Ended
February 28, 2015
(Unaudited) | | | Period
August 7, 20141
to August 31, 2014 | |
Investments in underlying funds7 | | | 0.42 | % | | | 0.41 | % |
| | 8 | | Organization costs and audit expenses were not annualized in the calculation of the expense ratios. If these expenses were annualized, the total expenses for Institutional, Investor A and Investor C Shares would have been 7.04%, 7.51% and 8.27%, respectively. |
See Notes to Financial Statements.
| | | | | | |
| | | BLACKROCK MULTI-MANAGER ALTERNATIVE STRATEGIES FUND | | FEBRUARY 28, 2015 | | 31 |
| | |
| Notes to Financial Statements (Unaudited) | | |
1. Organization:
BlackRock Funds (the “Trust”) is registered under the Investment Company Act of 1940, as amended (the “1940 Act”), as an open-end management investment company. The Trust is organized as a Massachusetts business trust. BlackRock Multi-Manager Alternative Strategies Fund (the “Fund”) is a series of the Trust and is classified as non-diversified.
The investment objective of the Fund is to seek total return. The Fund seeks to achieve its investment objective by allocating assets to multiple affiliated and unaffiliated investment managers that employ a variety of alternative investment strategies. Each of the affiliated and unaffiliated investment managers generally provides day-to-day management for a portion of the Fund’s assets. The Manager may also manage assets directly.
The Fund offers multiple classes of shares. All classes of shares have identical voting, dividend, liquidation and other rights and are subject to the same terms and conditions, except that each bears certain expenses and may have a conversion privilege as outlined below. Institutional Shares are sold only to certain eligible investors. Investor A and Investor C Shares are generally available through financial intermediaries. Each class has exclusive voting rights with respect to matters relating to its shareholder servicing and distribution expenditures.
| | | | | | |
| Share Class | | Initial Sales Charge | | CDSC | | Conversion
Privilege |
Institutional Shares | | No | | No | | None |
Investor A Shares | | Yes | | No1 | | None |
Investor C Shares | | No | | Yes | | None |
| | 1 | | Investor A Shares may be subject to a CDSC for certain redemptions where no initial sales charge was paid at the time of purchase. |
2. Significant Accounting Policies:
The Fund’s financial statements are prepared in conformity with accounting principles generally accepted in the United States of America (“U.S. GAAP”), which may require management to make estimates and assumptions that affect the reported amounts of assets and liabilities in the financial statements and the reported amounts of increases and decreases in net assets from operations during the reporting period. Actual results could differ from those estimates. The Fund is considered an investment company under U.S. GAAP and follows the accounting and reporting guidance applicable to investment companies. The following is a summary of significant accounting policies followed by the Fund:
Valuation: The Fund’s investments are valued at fair value as of the close of trading on the New York Stock Exchange (“NYSE”) (generally 4:00 p.m., Eastern time) (or if the reporting date falls on a day the NYSE is closed, investments are valued at fair value as of the report date). U.S. GAAP defines fair value as the price the Fund would receive to sell an asset or pay to transfer a liability in an orderly transaction between market participants at the measurement date. The Fund determines the fair value of its financial instruments at market value using independent dealers or pricing services under policies approved by the Board of Trustees of the Trust (the “Board”). The BlackRock Global Valuation Methodologies Committee (the “Global Valuation Committee”) is the committee formed by management to develop global pricing policies and procedures and to provide oversight of the pricing function for the Fund for all financial instruments.
Bond investments are valued on the basis of last available bid prices or current market quotations provided by dealers or pricing services. Floating rate loan interests are valued at the mean of the bid prices from one or more brokers or dealers as obtained from a pricing service. In determining the value of a particular investment, pricing services may use certain information with respect to transactions in such investments, quotations from dealers, pricing matrixes, market transactions in comparable investments, various relationships observed in the market between investments and calculated yield measures. Asset-backed and mortgage-backed securities are valued by independent pricing services using models that consider estimated cash flows of each tranche of the security, establish a benchmark yield and develop an estimated tranche-specific spread to the benchmark yield based on the unique attributes of the tranche. Financial futures contracts traded on exchanges are valued at their last sale price. Swap agreements are valued utilizing quotes received daily by the Fund’s pricing service or through brokers, which are derived using daily swap curves and models that incorporate a number of market data factors, such as discounted cash flows, trades and values of the underlying reference instruments. Certain centrally cleared swaps are valued at the price determined by the relevant exchange or clearinghouse. Investments in open-end registered investment companies are valued at NAV each business day.
Municipal investments (including commitments to purchase such investments on a “when-issued” basis) are valued on the basis of prices provided by dealers or pricing services. In determining the value of a particular investment, pricing services may use certain information with respect to transactions in such investments, quotations from dealers, pricing matrixes, market transactions in comparable investments and information with respect to various relationships between investments.
| | | | | | |
| 32 | | BLACKROCK MULTI-MANAGER ALTERNATIVE STRATEGIES FUND | | FEBRUARY 28, 2015 | | |
| | |
| Notes to Financial Statements (continued) | | |
Equity investments traded on a recognized securities exchange are valued at the official close price each day, if available. For equity investments traded on more than one exchange, the official close price on the exchange where the stock is primarily traded is used. Equity investments traded on a recognized exchange for which there were no sales on that day may be valued at the last available bid (long positions) or ask (short positions) price.
Securities and other assets and liabilities denominated in foreign currencies are translated into U.S. dollars using exchange rates determined as of the close of business on the NYSE. Forward foreign currency exchange contracts are valued at the mean between the bid and ask prices and are determined as of the close of business on the NYSE. Interpolated values are derived when the settlement date of the contract is an interim date for which quotations are not available.
Exchange-traded options are valued at the mean between the last bid and ask prices at the close of the options market in which the options trade. An exchange-traded option for which there is no mean price is valued at the last bid (long positions) or ask (short positions) price. If no bid or ask price is available, the prior day’s price will be used, unless it is determined that the prior day’s price no longer reflects the fair value of the option. Over-the-counter (“OTC”) options are valued by an independent pricing service using a mathematical model, which incorporates a number of market data factors, such as the trades and prices of the underlying instruments.
In the event that the application of these methods of valuation results in a price for an investment that is deemed not to be representative of the market value of such investment, or if a price is not available, the investment will be valued by the Global Valuation Committee, or its delegate, in accordance with a policy approved by the Board as reflecting fair value (“Fair Value Investments”). When determining the price for Fair Value Investments, the Global Valuation Committee, or its delegate, seeks to determine the price that the Fund might reasonably expect to receive or pay from the current sale or purchase of that asset or liability in an arm’s-length transaction. Fair value determinations shall be based upon all available factors that the Global Valuation Committee, or its delegate, deems relevant consistent with the principles of fair value measurement, which include the market approach, income approach and/or in the case of recent investments, the cost approach, as appropriate. The market approach generally consists of using comparable market transactions. The income approach generally is used to discount future cash flows to present value and is adjusted for liquidity as appropriate. These factors include but are not limited to: (i) attributes specific to the investment or asset; (ii) the principal market for the investment or asset; (iii) the customary participants in the principal market for the investment or asset; (iv) data assumptions by market participants for the investment or asset, if reasonably available; (v) quoted prices for similar investments or assets in active markets; and (vi) other factors, such as future cash flows, interest rates, yield curves, volatilities, prepayment speeds, loss severities, credit risks, recovery rates, liquidation amounts and/or default rates. Due to the inherent uncertainty of valuations of such investments, the fair values may differ from the values that would have been used had an active market existed. The Global Valuation Committee, or its delegate, employs various methods for calibrating valuation approaches for investments where an active market does not exist, including regular due diligence of the Fund’s pricing vendors, regular reviews of key inputs and assumptions, transactional back-testing or disposition analysis to compare unrealized gains and losses to realized gains and losses, reviews of missing or stale prices and large movements in market values and reviews of any market related activity. The pricing of all Fair Value Investments is subsequently reported to the Board or a committee thereof on a quarterly basis.
Generally, trading in foreign instruments is substantially completed each day at various times prior to the close of business on the NYSE. Occasionally, events affecting the values of such instruments may occur between the foreign market close and the close of business on the NYSE that may not be reflected in the computation of the Fund’s net assets. If events (e.g., a company announcement, market volatility or a natural disaster) occur during such periods that are expected to materially affect the value of such instruments, those instruments may be Fair Value Investments and be valued at their fair value, as determined in good faith by the Global Valuation Committee, or its delegate, using a pricing service and/or policies approved by the Board. Each business day, the Fund uses a pricing service to assist with the valuation of certain foreign exchange-traded equity securities and foreign exchange-traded and OTC options (the “Systematic Fair Value Price”). Using current market factors, the Systematic Fair Value Price is designed to value such foreign securities and foreign options at fair value as of the close of business on the NYSE, which follows the close of the local markets.
Foreign Currency: The Fund’s books and records are maintained in U.S. dollars. Purchases and sales of investment securities are recorded at the rates of exchange prevailing on the respective date of such transactions. Generally, when the U.S. dollar rises in value against a foreign currency, the Fund’s investments denominated in that currency will lose value because that currency is worth fewer U.S. dollars; the opposite effect occurs if the U.S. dollar falls in relative value.
The Fund does not isolate the portion of the results of operations arising as a result of changes in the foreign exchange rates from the changes in the market prices of investments held or sold for financial reporting purposes. Accordingly, the effects of changes in foreign currency exchange rates on investments are not segregated in the Statement of Operations from the effects of changes in market prices of those investments, but are included as a component of net realized and unrealized gain (loss) from investments. The Fund reports realized currency gains (losses) on foreign currency related transactions as components of net realized gain (loss) for financial reporting purposes, whereas such components are generally treated as ordinary
| | | | | | |
| | | BLACKROCK MULTI-MANAGER ALTERNATIVE STRATEGIES FUND | | FEBRUARY 28, 2015 | | 33 |
| | |
| Notes to Financial Statements (continued) | | |
income for federal income tax purposes. The Fund has elected to treat realized gains (losses) from certain foreign currency exchange contracts as capital gain (loss) for federal income tax purposes.
Segregation and Collateralization: In cases where the Fund enters into certain investments (e.g., financial futures contracts, forward foreign currency exchange contracts, options written, swaps and short sales) that would be “senior securities” for 1940 Act purposes, the Fund may segregate or designate on its books and records cash or liquid securities having a market value at least equal to the amount of the Fund’s future obligations under such investments. Doing so allows the investment to be excluded from treatment as a “senior security.” Furthermore, if required by an exchange or counterparty agreement, the Fund may be required to deliver/deposit cash and/or securities to/with an exchange, or broker-dealer or custodian as collateral for certain investments or obligations.
Investment Transactions and Investment Income: For financial reporting purposes, investment transactions are recorded on the dates the transactions are entered into (the trade dates). Realized gains and losses on investment transactions are determined on the identified cost basis. Dividend income is recorded on the ex-dividend date. Dividends from foreign securities where the ex-dividend date may have passed are subsequently recorded when the Fund is informed of the ex-dividend date. Under the applicable foreign tax laws, a withholding tax at various rates may be imposed on capital gains, dividends and interest. Upon notification from issuers, some of the dividend income received from a real estate investment trust may be redesignated as a reduction of cost of the related investment and/or realized gain. Interest income, including amortization and accretion of premiums and discounts on debt securities, is recognized on the accrual basis. Income, expenses and realized and unrealized gains and losses are allocated daily to each class based on its relative net assets.
Distributions: Distributions paid by the Fund are recorded on the ex-dividend date. The character and timing of distributions are determined in accor-dance with federal income tax regulations, which may differ from U.S. GAAP.
Organization and Offering Costs: Upon commencement of operations, organization costs associated with the establishment of the Fund were expensed by the Fund and reimbursed by the Manager. Offering costs are amortized over a 12-month period beginning with the commencement of operations.
Other: Expenses directly related to the Fund or its classes are charged to the Fund or applicable class. Other operating expenses shared by several funds are prorated among those funds on the basis of relative net assets or other appropriate methods. Expenses directly related to the Fund and other shared expenses prorated to the Fund are allocated daily to each class based on its relative net assets or other appropriate methods.
The Fund has an arrangement with the custodian whereby fees may be reduced by credits earned on uninvested cash balances, which, if applicable, are shown as fees paid indirectly in the Statement of Operations. The custodian imposes fees on overdrawn cash balances, which can be offset by accumulated credits earned or may result in additional custody charges.
3. Securities and Other Investments:
Asset-Backed and Mortgage-Backed Securities: The Fund may invest in asset-backed securities. Asset-backed securities are generally issued as pass-through certificates, which represent undivided fractional ownership interests in an underlying pool of assets, or as debt instruments, which are also known as collateralized obligations, and are generally issued as the debt of a special purpose entity organized solely for the purpose of owning such assets and issuing such debt. Asset-backed securities are often backed by a pool of assets representing the obligations of a number of different parties. The yield characteristics of certain asset-backed securities may differ from traditional debt securities. One such major difference is that all or a principal part of the obligations may be prepaid at any time because the underlying assets (i.e., loans) may be prepaid at any time. As a result, a decrease in interest rates in the market may result in increases in the level of prepayments as borrowers, particularly mortgagors, refinance and repay their loans. An increased prepayment rate with respect to an asset-backed security subject to such a prepayment feature will have the effect of shortening the maturity of the security. In addition, the Fund may subsequently have to reinvest the proceeds at lower interest rates. If the Fund has purchased such an asset-backed security at a premium, a faster than anticipated prepayment rate could result in a loss of principal to the extent of the premium paid.
The Fund may purchase certain mortgage pass-through securities. There are a number of important differences among the agencies and instrumentalities of the U.S. Government that issue mortgage-related securities and among the securities that they issue. For example, mortgage-related securities guaranteed by Ginnie Mae are guaranteed as to the timely payment of principal and interest by Ginnie Mae and such guarantee is backed by the full faith and credit of the United States. However, mortgage-related securities issued by Freddie Mac and Fannie Mae, including Freddie Mac and Fannie Mae guaranteed mortgage pass-through certificates, which are solely the obligations of Freddie Mac and Fannie Mae, are not backed by or entitled to the full faith and credit of the United States, but are supported by the right of the issuer to borrow from the Treasury.
| | | | | | |
| 34 | | BLACKROCK MULTI-MANAGER ALTERNATIVE STRATEGIES FUND | | FEBRUARY 28, 2015 | | |
| | |
| Notes to Financial Statements (continued) | | |
Collateralized Debt Obligations: The Fund may invest in collateralized debt obligations (“CDOs”), which include collateralized bond obligations (“CBOs”) and collateralized loan obligations (“CLOs”). CBOs and CLOs are types of asset-backed securities. A CDO is an entity that is backed by a diversified pool of debt securities (CBOs) or syndicated bank loans (CLOs). The cash flows of the CDO can be split into multiple segments, called “tranches,” which will vary in risk profile and yield. The riskiest segment is the subordinated or “equity” tranche. This tranche bears the greatest risk of defaults from the underlying assets in the CDO and serves to protect the other, more senior, tranches from default in all but the most severe circumstances. Since it is shielded from defaults by the more junior tranches, a “senior” tranche will typically have higher credit ratings and lower yields than their underlying securities, and often receive investment grade ratings from one or more of the nationally recognized rating agencies. Despite the protection from the more junior tranches, senior tranches can experience substantial losses due to actual defaults, increased sensitivity to future defaults and the disappearance of one or more protecting tranches as a result of changes in the credit profile of the underlying pool of assets.
Multiple Class Pass-Through Securities: The Fund may invest in multiple class pass-through securities, including collateralized mortgage obligations (“CMOs”) and commercial mortgage-backed securities. These multiple class securities may be issued by Ginnie Mae, U.S. Government agencies or instrumentalities or by trusts formed by private originators of, or investors in, mortgage loans. In general, CMOs are debt obligations of a legal entity that are collateralized by, and multiple class pass-through securities represent direct ownership interests in, a pool of residential or commercial mortgage loans or mortgage pass-through securities (the “Mortgage Assets”), the payments on which are used to make payments on the CMOs or multiple pass-through securities. Classes of CMOs include interest only (“IOs”), principal only (“POs”), planned amortization classes and targeted amortization classes. IOs and POs are stripped mortgage-backed securities representing interests in a pool of mortgages, the cash flow from which has been separated into interest and principal components. IOs receive the interest portion of the cash flow while POs receive the principal portion. IOs and POs can be extremely volatile in response to changes in interest rates. As interest rates rise and fall, the value of IOs tends to move in the same direction as interest rates. POs perform best when prepayments on the underlying mortgages rise since this increases the rate at which the principal is returned and the yield to maturity on the PO. When payments on mortgages underlying a PO are slower than anticipated, the life of the PO is lengthened and the yield to maturity is reduced. If the underlying Mortgage Assets experience greater than anticipated pre-payments of principal, the Fund may not fully recoup its initial investment in IOs.
Capital Trusts and Trust Preferred Securities: The Fund may invest in capital trusts and/or trust preferred securities. These securities are typically issued by corporations, generally in the form of interest-bearing notes with preferred securities characteristics, or by an affiliated business trust of a corporation, generally in the form of beneficial interests in subordinated debentures or similarly structured securities. The securities can be structured as either fixed or adjustable coupon securities that can have either a perpetual or stated maturity date. For trust preferred securities, the issuing bank or corporation will pay interest to the trust, which will then be distributed to holders of the trust preferred securities as a dividend. Dividends can be deferred without creating an event of default or acceleration, although maturity cannot take place unless all cumulative payment obligations have been met. The deferral of payments does not affect the purchase or sale of these securities in the open market. Payments on these securities are treated as interest rather than dividends for federal income tax purposes. These securities generally are rated below that of the issuing company’s senior debt securities and are freely callable at the issuer’s option.
Preferred Stock: The Fund may invest in preferred stock. Preferred stock has a preference over common stock in liquidation (and generally in receiving dividends as well) but is subordinated to the liabilities of the issuer in all respects. As a general rule, the market value of preferred stock with a fixed dividend rate and no conversion element varies inversely with interest rates and perceived credit risk, while the market price of convertible preferred stock generally also reflects some element of conversion value. Because preferred stock is junior to debt securities and other obligations of the issuer, deterioration in the credit quality of the issuer will cause greater changes in the value of a preferred stock than in a more senior debt security with similar stated yield characteristics. Unlike interest payments on debt securities, preferred stock dividends are payable only if declared by the issuer’s board of directors. Preferred stock also may be subject to optional or mandatory redemption provisions.
Floating Rate Loan Interests: The Fund may invest in floating rate loan interests. The floating rate loan interests held by the Fund are typically issued to companies (the “borrower”) by banks, other financial institutions, and privately and publicly offered corporations (the “lender”). Floating rate loan interests are generally non-investment grade, often involve borrowers whose financial condition is troubled or uncertain and companies that are highly leveraged. The Fund may invest in obligations of borrowers who are in bankruptcy proceedings. Floating rate loan interests may include fully funded term loans or revolving lines of credit. Floating rate loan interests are typically senior in the corporate capital structure of the borrower. Floating rate loan interests generally pay interest at rates that are periodically determined by reference to a base lending rate plus a premium. The base lending rates are generally the lending rate offered by one or more European banks, such as the London Interbank Offered Rate (“LIBOR”), the prime rate offered by one or more U.S. banks or the certificate of deposit rate. Floating rate loan interests may involve foreign borrowers, and investments may be denominated in foreign currencies. The Fund considers these investments to be investments in debt securities for purposes of its investment policies.
| | | | | | |
| | | BLACKROCK MULTI-MANAGER ALTERNATIVE STRATEGIES FUND | | FEBRUARY 28, 2015 | | 35 |
| | |
| Notes to Financial Statements (continued) | | |
When the Fund purchases a floating rate loan interest it may receive a facility fee and when it sells a floating rate loan interest it may pay a facility fee. On an ongoing basis, the Fund may receive a commitment fee based on the undrawn portion of the underlying line of credit amount of a floating rate loan interest. Facility and commitment fees are typically amortized to income over the term of the loan or term of the commitment, respectively. Consent and amendment fees are recorded to income as earned. Prepayment penalty fees, which may be received by the Fund upon the prepayment of a floating rate loan interest by a borrower, are recorded as realized gains. The Fund may invest in multiple series or tranches of a loan. A different series or tranche may have varying terms and carry different associated risks.
Floating rate loan interests are usually freely callable at the borrower’s option. The Fund may invest in such loans in the form of participations in loans (“Participations”) or assignments (“Assignments”) of all or a portion of loans from third parties. Participations typically will result in the Fund having a contractual relationship only with the lender, not with the borrower. The Fund will have the right to receive payments of principal, interest and any fees to which it is entitled only from the lender selling the Participation and only upon receipt by the lender of the payments from the borrower. In connection with purchasing Participations, the Fund generally will have no right to enforce compliance by the borrower with the terms of the loan agreement, nor any rights of offset against the borrower, and the Fund may not benefit directly from any collateral supporting the loan in which it has purchased the Participation. As a result, the Fund will assume the credit risk of both the borrower and the lender that is selling the Participation. The Fund’s investment in loan participation interests involves the risk of insolvency of the financial intermediaries who are parties to the transactions. In the event of the insolvency of the lender selling the Participation, the Fund may be treated as a general creditor of the lender and may not benefit from any offset between the lender and the borrower. Assignments typically result in the Fund having a direct contractual relationship with the borrower, and the Fund may enforce compliance by the borrower with the terms of the loan agreement.
In connection with floating rate loan interests, the Fund may also enter into unfunded floating rate loan interests (“commitments”). In connection with these commitments, the Fund earns a commitment fee, typically set as a percentage of the commitment amount. Such fee income, which is included in interest income in the Statement of Operations, is recognized ratably over the commitment period. Unfunded floating rate loan interests are marked-to-market daily, and any unrealized appreciation or depreciation is included in the Statement of Assets and Liabilities and Statement of Operations. As of February 28, 2015, the Fund had the following unfunded floating rate loan interests:
| | | | | | | | | | | | | | | | |
| Borrower | | Par | | | Commitment
Amount | | | Value | | | Unrealized
Depreciation | |
LightSquared LP, Delayed Draw Term Loan B | | $ | 693,760 | | | $ | 693,760 | | | $ | 693,760 | | | | — | |
LightSquared LP, DIP Term Loan A | | $ | 636,289 | | | $ | 636,289 | | | $ | 631,835 | | | $ | (4,454 | ) |
Short Sales: The Fund may enter into short sale transactions in which the Fund sells a security it does not hold in anticipation of a decline in the market price of that security. When the Fund makes a short sale, it will borrow the security sold short and deliver the security to the counterparty to which it sold the security short. An amount equal to the proceeds received by the Fund is reflected as an asset and an equivalent liability. The amount of the liability is subsequently marked-to-market to reflect the market value of the short sale. The Fund is required to repay the counterparty any dividends or interest received on the security sold short, which is shown as dividend expense and interest expense, respectively, in the Statement of Operations. The Fund may pay a fee on the assets borrowed from the counterparty, which is shown as stock loan fees in the Statement of Operations. The Fund maintains a segregated account of securities or deposits cash with the broker-dealer as collateral for the short sales. The Fund may receive interest on the cash collateral deposited with the broker-dealer. The Fund is exposed to market risk based on the amount, if any, that the market value of the security increases beyond the market value at which the position was sold. Thus, a short sale of a security involves the risk that instead of declining, the price of the security sold short will rise. The short sale of securities involves the possibility of a theoretically unlimited loss since there is a theoretically unlimited potential for the market price of the security sold short to increase. A gain, limited to the price at which the Fund sold the security short, or a loss, unlimited as to the dollar amount, will be recognized upon the termination of a short sale if the market price is either less than or greater than the proceeds originally received. There is no assurance the Fund will be able to close out a short position at a particular time or at an acceptable price.
4. Derivative Financial Instruments:
The Fund engages in various portfolio investment strategies using derivative contracts both to increase the returns of the Fund and/or to economically hedge its exposure to certain risks such as credit risk, equity risk, interest rate risk or foreign currency exchange rate risk. These contracts may be transacted on an exchange or OTC.
Financial Futures Contracts: The Fund invests in long and/or short positions in financial futures contracts and options on financial futures contracts to gain exposure to, or economically hedge against, changes in interest rates (interest rate risk), changes in the value of equity securities (equity risk) or foreign currencies (foreign currency exchange rate risk). Financial futures contracts are agreements between the Fund and a counterparty to buy or sell
| | | | | | |
| 36 | | BLACKROCK MULTI-MANAGER ALTERNATIVE STRATEGIES FUND | | FEBRUARY 28, 2015 | | |
| | |
| Notes to Financial Statements (continued) | | |
a specific quantity of an underlying instrument at a specified price and at a specified date. Depending on the terms of the particular contract, financial futures contracts are settled either through physical delivery of the underlying instrument on the settlement date or by payment of a cash settlement amount on the settlement date.
Upon entering into a financial futures contract, the Fund is required to deposit initial margin with the broker in the form of cash or securities in an amount that varies depending on a contract’s size and risk profile. The initial margin deposit must then be maintained at an established level over the life of the contract. Securities deposited as initial margin are designated on the Schedule of Investments and cash deposited, if any, is recorded on the Statement of Assets and Liabilities as cash pledged for financial futures contracts. Pursuant to the contract, the Fund agrees to receive from or pay to the broker an amount of cash equal to the daily fluctuation in value of the contract. Such receipts or payments are known as variation margin. Variation margin is recorded by the Fund as unrealized appreciation or depreciation and, if applicable, as a receivable or payable for variation margin in the Statement of Assets and Liabilities.
When the contract is closed, the Fund records a realized gain or loss equal to the difference between the value of the contract at the time it was opened and the value at the time it was closed. The use of financial futures contracts involves the risk of an imperfect correlation in the movements in the price of financial futures contracts, interest or foreign currency exchange rates and the underlying assets.
Forward Foreign Currency Exchange Contracts: The Fund enters into forward foreign currency exchange contracts as an economic hedge against either specific transactions or portfolio instruments or to obtain exposure to, or hedge exposure away from, foreign currencies (foreign currency exchange rate risk). A forward foreign currency exchange contract is an agreement between two parties to buy and sell a currency at a set exchange rate on a future date. Forward foreign currency exchange contracts, when used by the Fund, help to manage the overall exposure to the currencies in which some of the investments held by the Fund are denominated. The contract is marked-to-market daily and the change in market value is recorded by the Fund as an unrealized gain or loss. When the contract is closed, the Fund records a realized gain or loss equal to the difference between the value at the time it was opened and the value at the time it was closed. The use of forward foreign currency exchange contracts involves the risk that the value of a forward foreign currency exchange contract changes unfavorably due to movements in the value of the referenced foreign currencies.
Options: The Fund purchases and writes call and put options to increase or decrease its exposure to underlying instruments (including equity risk) and/or, in the case of options written, to generate gains from options premiums. A call option gives the purchaser (holder) of the option the right (but not the obligation) to buy, and obligates the seller (writer) to sell (when the option is exercised) the underlying instrument at the exercise or strike price at any time or at a specified time during the option period. A put option gives the holder the right to sell and obligates the writer to buy the underlying instrument at the exercise or strike price at any time or at a specified time during the option period. When the Fund purchases (writes) an option, an amount equal to the premium paid (received) by the Fund is reflected as an asset (liability). The amount of the asset (liability) is subsequently marked-to-market to reflect the current market value of the option purchased (written). When an instrument is purchased or sold through an exercise of an option, the related premium paid (or received) is added to (or deducted from) the basis of the instrument acquired or deducted from (or added to) the proceeds of the instrument sold. When an option expires (or the Fund enters into a closing transaction), the Fund realizes a gain or loss on the option to the extent of the premiums received or paid (or gain or loss to the extent the cost of the closing transaction exceeds the premiums received or paid). When the Fund writes a call option, such option is “covered,” meaning that the Fund holds the underlying instrument subject to being called by the option counterparty. When the Fund writes a put option, such option is covered by cash in an amount sufficient to cover the obligation.
In purchasing and writing options, the Fund bears the risk of an unfavorable change in the value of the underlying instrument or the risk that the Fund may not be able to enter into a closing transaction due to an illiquid market. Exercise of a written option could result in the Fund purchasing or selling a security when it otherwise would not, or at a price different from the current market value.
For the six months ended February 28, 2015, transactions in options written were as follows:
| | | | | | | | | | | | | | | | | | | | |
| | | | | | Calls | | | | | | | | Puts | | | |
| | | Contracts | | | | | Premiums
Received | | | Contracts | | | | | Premiums
Received | |
| | | | | |
Outstanding options, beginning of period | | | 409 | | | | | $ | 55,073 | | | | — | | | | | | — | |
Options written | | | 998 | | | | | | 217,606 | | | | 151 | | | | | $ | 12,112 | |
Options exercised | | | (257 | ) | | | | | (50,401 | ) | | | — | | | | | | — | |
Options expired | | | (57 | ) | | | | | (5,888 | ) | | | (19 | ) | | | | | (1,335 | ) |
Options closed | | | (1,093 | ) | | | | | (216,390 | ) | | | (132 | ) | | | | | (10,777 | ) |
| | | | | | | | |
Outstanding options, end of period | | | — | | | | | | — | | | | — | | | | | | — | |
| | | | | | | | |
| | | | | | |
| | | BLACKROCK MULTI-MANAGER ALTERNATIVE STRATEGIES FUND | | FEBRUARY 28, 2015 | | 37 |
| | |
| Notes to Financial Statements (continued) | | |
Swaps: The Fund enters into swap agreements in which the Fund and a counterparty agree either to make periodic net payments on a specified notional amount or a net payment upon termination. Swap agreements are privately negotiated in the OTC market and may be entered into as a bilateral contract (“OTC swaps”) or centrally cleared (“centrally cleared swaps”). Swaps are marked-to-market daily and changes in value are recorded as unrealized appreciation (depreciation).
For OTC swaps, any upfront premiums paid are recorded as assets and any upfront fees received are recorded as liabilities and are shown as swap premiums paid and swap premiums received, respectively, in the Statement of Assets and Liabilities and amortized over the term of the OTC swap. Payments received or made by the Fund for OTC swaps are recorded in the Statement of Operations as realized gains or losses, respectively. When an OTC swap is terminated, the Fund will record a realized gain or loss equal to the difference between the proceeds from (or cost of) the closing transaction and the Fund’s basis in the contract, if any. Generally, the basis of the contract is the premium received or paid.
In a centrally cleared swap, immediately following execution of the swap agreement, the swap agreement is novated to a central counterparty (the “CCP”) and the Fund’s counterparty on the swap agreement becomes the CCP. The Fund is required to interface with the CCP through a broker. Upon entering into a centrally cleared swap, the Fund is required to deposit initial margin with the broker in the form of cash or securities in an amount that varies depending on the size and risk profile of the particular swap. Securities deposited as initial margin are designated on the Schedule of Investments and cash deposited is recorded on the Statement of Assets and Liabilities as cash pledged for centrally cleared swaps. The daily change in valuation of centrally cleared swaps is recorded as a receivable or payable for variation margin in the Statement of Assets and Liabilities. Payments received from (paid to) the counterparty, including at termination, are recorded as realized gain (loss) in the Statement of Operations.
Swap transactions involve, to varying degrees, elements of interest rate, credit and market risk in excess of the amounts recognized in the Statement of Assets and Liabilities. Such risks involve the possibility that there will be no liquid market for these agreements, that the counterparty to the agreements may default on its obligation to perform or disagree as to the meaning of the contractual terms in the agreements, and that there may be unfavorable changes in interest rates and/or market values associated with these transactions.
| Ÿ | | Credit default swaps – The Fund enters into credit default swaps to manage its exposure to the market or certain sectors of the market, to reduce its risk exposure to defaults of corporate and/or sovereign issuers or to create exposure to corporate and/or sovereign issuers to which it is not otherwise exposed (credit risk). The Fund may either buy or sell (write) credit default swaps on single-name issuers (corporate or sovereign), a combination or basket of single-name issuers or traded indexes. Credit default swaps on single-name issuers are agreements in which the protection buyer pays fixed periodic payments to the seller in consideration for a guarantee from the protection seller to make a specific payment should a negative credit event take place with respect to the referenced entity (e.g., bankruptcy, failure to pay, obligation accelerators, repudiation, moratorium or restructuring). Credit default swaps on traded indexes are agreements in which the buyer pays fixed periodic payments to the seller in consideration for a guarantee from the seller to make a specific payment should a write-down, principal or interest shortfall or default of all or individual underlying securities included in the index occur. As a buyer, if an underlying credit event occurs, the Fund will either (i) receive from the seller an amount equal to the notional amount of the swap and deliver the referenced security or underlying securities comprising the index, or (ii) receive a net settlement of cash equal to the notional amount of the swap less the recovery value of the security or underlying securities comprising the index. As a seller (writer), if an underlying credit event occurs, the Fund will either pay the buyer an amount equal to the notional amount of the swap and take delivery of the referenced security or underlying securities comprising the index or pay a net settlement of cash equal to the notional amount of the swap less the recovery value of the security or underlying securities comprising the index. |
| Ÿ | | Total return swaps – The Fund enters into total return swaps to obtain exposure to securities (both long and short) or markets without owning such securities or investing directly in that market or to transfer the risk/return of one market (e.g., fixed income) to another market (e.g., equity) (equity risk and/or interest rate risk). Total return swaps are agreements in which there is an exchange of cash flows whereby one party commits to make payments based on the total return (dividends or interest plus capital gains/losses) of an underlying instrument in exchange for fixed or floating rate interest payments. |
The Fund will pay an amount equal to any depreciation on a long position and appreciation on a short position including dividends from such positions. Conversely, the Fund will receive any appreciation on a long position and any depreciation on a short position including dividends from such positions. In addition, the Fund will also pay or receive a variable rate of interest based on the underlying benchmark rate plus or minus a spread (“financing fees”). The benchmark and spread are determined based upon the country and/or currency of each individual underlying position. The unrealized appreciation (depreciation) on total return swaps includes dividends on the underlying basket of equity securities and financing fees. The agreement allows the Manager to change the composition of the basket of securities by trading in and out of the underlying equity positions at its discretion. The resulting gains or losses are recorded in the Statements of Operations. Certain swaps have no stated expiration and can be terminated by either party at any time.
| | | | | | |
| 38 | | BLACKROCK MULTI-MANAGER ALTERNATIVE STRATEGIES FUND | | FEBRUARY 28, 2015 | | |
| | |
| Notes to Financial Statements (continued) | | |
The following is a summary of the Fund’s derivative financial instruments categorized by risk exposure:
| | | | | | | | | | |
Fair Values of Derivative Financial Instruments as of February 28, 2015 | |
| | | | | Value | |
| | | Statement of Assets and Liabilities Location | | Derivative
Assets | | | Derivative
Liabilities | |
Interest rate contracts | | Net unrealized appreciation/depreciation1; | | $ | 105,132 | | | $ | 132,520 | |
Foreign currency exchange contracts | | Unrealized appreciation/depreciation on forward foreign currency exchange contracts | | | 2,444,099 | | | | 1,637,156 | |
Credit contracts | | Unrealized appreciation/depreciation on OTC swaps; Swap premiums paid/received | | | 483,570 | | | | 508,504 | |
Equity contracts | | Net unrealized appreciation/depreciation1 Unrealized appreciation/depreciation on OTC swaps | | | 1,151,639 | | | | 113,707 | |
Total | | | | $ | 4,184,440 | | | $ | 2,391,887 | |
| | 1 | | Includes cumulative appreciation/depreciation on financial futures contracts and centrally cleared swaps, if any, as reported within the Schedule of Investments. Only current day’s variation margin is reported in the Statement of Assets and Liabilities. |
| | | | |
The Effect of Derivative Financial Instruments in the Statement of Operations Six Months Ended February 28, 2015 |
| | | Net Realized Gain (Loss) from | | Net Change in
Unrealized Appreciation/Depreciation on |
Interest rate contracts: | | | | |
Financial futures contracts | | $ 606,705 | | $ (58,228) |
Swaps | | 19,020 | | 20,643 |
Options2 | | 7,073 | | — |
Foreign currency exchange contracts: | | | | |
Foreign currency transactions/translations | | 1,192,725 | | 637,441 |
Credit contracts: | | | | |
Swaps | | (78,147) | | 32,785 |
Equity contracts: | | | | |
Financial futures contracts | | 615,399 | | 136,743 |
Swaps | | (902,416) | | 468,928 |
Options2 | | (122,541) | | 63,510 |
| | |
Total | | $ 1,337,818 | | $1,301,822 |
| | |
| | | | | |
| | 2 | | Options purchased are included in the net realized gain (loss) from investments and net change in unrealized appreciation/depreciation on investments. |
For the six months ended February 28, 2015, the average quarterly balances of outstanding derivative financial instruments were as follows:
| | | | |
Financial futures contracts: | | | | |
Average notional value of contracts — long | | $ | 63,383,393 | |
Average notional value of contracts — short | | $ | 75,416,155 | |
Forward foreign currency exchange contracts: | | | | |
Average amounts purchased — in USD | | $ | 73,811,826 | |
Average amounts sold — in USD | | $ | 62,483,982 | |
Options: | | | | |
Average value of option contracts purchased | | $ | 42,242 | |
Average value of option contracts written | | $ | 32,614 | |
Credit default swaps: | | | | |
Average notional value — buy protection | | $ | 13,538,768 | |
Average notional value — sell protection | | $ | 2,678,912 | |
Total return swaps: | | | | |
Average notional value | | $ | 6,981,393 | |
Counterparty Credit Risk: A derivative contract may suffer a mark-to-market loss if the value of the contract decreases due to an unfavorable change in the market rates or values of the underlying instrument. Losses can also occur if the counterparty does not perform under the contract.
The Fund’s risk of loss from counterparty credit risk on OTC derivatives is generally limited to the aggregate unrealized gain less the value of any collateral held by the Fund. For OTC options purchased, the Fund bears the risk of loss of the amount of the premiums paid plus the positive change in market values net of any collateral held by the Fund should the counterparty fail to perform under the contracts. Options written by the Fund do not typically give rise to counterparty credit risk, as options written generally obligate the Fund, and not the counterparty, to perform.
| | | | | | |
| | | BLACKROCK MULTI-MANAGER ALTERNATIVE STRATEGIES FUND | | FEBRUARY 28, 2015 | | 39 |
| | |
Notes to Financial Statements (continued) | | |
With exchange-traded purchased options and futures and centrally cleared swaps, there is less counterparty credit risk to the Fund since the exchange or clearinghouse, as counterparty to such instruments, guarantees against a possible default. The clearinghouse stands between the buyer and the seller of the contract; therefore, credit risk is limited to failure of the clearinghouse. While offset rights may exist under applicable law, the Fund does not have a contractual right of offset against a clearing broker or clearinghouse in the event of a default (including the bankruptcy or insolvency) of the clearing broker or clearinghouse. Additionally, credit risk exists in exchange-traded futures and centrally cleared swaps with respect to initial and variation margin that is held in a clearing broker’s customer accounts. While clearing brokers are required to segregate customer margin from their own assets, in the event that a clearing broker becomes insolvent or goes into bankruptcy and at that time there is a shortfall in the aggregate amount of margin held by the clearing broker for all its clients, typically the shortfall would be allocated on a pro rata basis across all the clearing broker’s customers, potentially resulting in losses to the Fund.
In order to better define its contractual rights and to secure rights that will help the Fund mitigate its counterparty risk, the Fund may enter into an International Swaps and Derivatives Association, Inc. Master Agreement (“ISDA Master Agreement”) or similar agreement with its counterparties. An ISDA Master Agreement is a bilateral agreement between the Fund and a counterparty that governs certain OTC derivatives and typically contains, among other things, collateral posting terms and netting provisions in the event of a default and/or termination event. Under an ISDA Master Agreement, the Fund may, under certain circumstances, offset with the counterparty certain derivative financial instruments’ payables and/or receivables with collateral held and/or posted and create one single net payment. The provisions of the ISDA Master Agreement typically permit a single net payment in the event of default including the bankruptcy or insolvency of the counterparty. Bankruptcy or insolvency laws of a particular jurisdiction may restrict or prohibit the right of offset in bankruptcy, insolvency or other events. In addition, certain ISDA Master Agreements allow counterparties to terminate derivative contracts prior to maturity in the event the Fund’s net assets decline by a stated percentage or the Fund fails to meet the terms of its ISDA Master Agreements. The result would cause the Fund to accelerate payment of any net liability owed to the counterparty.
Collateral Requirements: For derivatives traded under an ISDA Master Agreement, the collateral requirements are typically calculated by netting the mark-to-market amount for each transaction under such agreement and comparing that amount to the value of any collateral currently pledged by the Fund and the counterparty.
Cash collateral that has been pledged to cover obligations of the Fund and cash collateral received from the counterparty, if any, is reported separately on the Statement of Assets and Liabilities as cash pledged as collateral and cash received as collateral, respectively. Non-cash collateral pledged by the Fund, if any, is noted in the Schedule of Investments. Generally, the amount of collateral due from or to a party has to exceed a minimum transfer amount threshold (typically either $250,000 or $500,000) before a transfer is required, which is determined at the close of business of the Fund. Any additional required collateral is delivered to/pledged by the Fund on the next business day. Typically, the Fund and counterparties are not permitted to sell, re-pledge or use the collateral they receive. To the extent amounts due to the Fund from its counterparties are not fully collateralized, the Fund bears the risk of loss from counterparty non-performance. Likewise, to the extent the Fund has delivered collateral to a counterparty and stands ready to perform under the terms of its agreement with such counterparty, the Fund bears the risk of loss from a counterparty in the amount of the value of the collateral in the event the counterparty fails to return such collateral.
For financial reporting purposes, the Fund does not offset derivative assets and derivative liabilities that are subject to netting arrangements, if any, in the Statement of Assets and Liabilities.
As of February 28, 2015, the Fund’s derivative assets and liabilities (by type) are as follows:
| | | | | | | | |
| | | Assets | | | Liabilities | |
Derivative Financial Instruments: | | | | | | | | |
Financial futures contracts | | $ | 7,490,240 | | | $ | 6,172,543 | |
Forward foreign currency exchange contracts | | | 2,444,099 | | | | 1,637,156 | |
Swaps — centrally cleared | | | 77,133 | | | | — | |
Swaps — OTC1 | | | 1,354,659 | | | | 435,650 | |
| | | | |
Total derivative assets and liabilities in the Statement of Assets and Liabilities | | $ | 11,366,131 | | | $ | 8,245,349 | |
Derivatives not subject to a Master Netting Agreement or similar agreement (“MNA”) | | | (7,567,373 | ) | | | (6,172,543 | ) |
| | | | |
Total derivative assets and liabilities subject to an MNA | | $ | 3,798,758 | | | $ | 2,072,806 | |
| | | | |
| | 1 | | Includes unrealized appreciation/depreciation on OTC swaps and swap premiums paid/received in the Statement of Assets and Liabilities. |
| | | | | | |
| 40 | | BLACKROCK MULTI-MANAGER ALTERNATIVE STRATEGIES FUND | | FEBRUARY 28, 2015 | | |
| | |
| Notes to Financial Statements (continued) | | |
As of February 28, 2015, the following tables present the Fund’s derivative assets and liabilities by counterparty net of amounts available for offset under an MNA and net of the related collateral received and pledged by the Fund:
| | | | | | | | | | | | | | | | | | | | |
| Counterparty | | Derivative Assets
Subject to an MNA by
Counterparty | | | Derivatives Available
for Offset2 | | | Non-cash
Collateral
Received | | | Cash
Collateral
Received | | | Net Amount of
Derivative Assets3 | |
Bank of America N.A. | | $ | 215,065 | | | $ | (186,208 | ) | | | — | | | | — | | | $ | 28,857 | |
Barclays Bank PLC | | | 49,999 | | | | (49,999 | ) | | | — | | | | — | | | | — | |
Deutsche Bank AG | | | 126,260 | | | | (24,175 | ) | | | — | | | | — | | | | 102,085 | |
Goldman Sachs International | | | 84,910 | | | | (9,296 | ) | | | — | | | | — | | | | 75,614 | |
JPMorgan Chase Bank N.A. | | | 2,441,971 | | | | (1,683,943 | ) | | | — | | | | — | | | | 758,028 | |
Morgan Stanley & Co. International PLC | | | 880,553 | | | | (101,792 | ) | | | — | | | | — | | | | 778,761 | |
| | | | |
Total | | $ | 3,798,758 | | | $ | (2,055,413 | ) | | | — | | | | — | | | $ | 1,743,345 | |
| | | | |
| | | | | | | | | | | | | | | | | | | | |
| Counterparty | | Derivative Liabilities
Subject to an MNA by
Counterparty | | | Derivatives Available
for Offset2 | | | Non-cash
Collateral
Pledged | | | Cash
Collateral
Pledged | | | Net Amount of
Derivative Liabilities4 | |
Bank of America N.A. | | $ | 186,208 | | | $ | (186,208 | ) | | | — | | | | — | | | | — | |
Barclays Bank PLC | | | 67,392 | | | | (49,999 | ) | | | — | | | | — | | | $ | 17,393 | |
Deutsche Bank AG | | | 24,175 | | | | (24,175 | ) | | | — | | | | — | | | | — | |
Goldman Sachs International | | | 9,296 | | | | (9,296 | ) | | | — | | | | — | | | | — | |
JPMorgan Chase Bank N.A. | | | 1,683,943 | | | | (1,683,943 | ) | | | — | | | | — | | | | — | |
Morgan Stanley & Co. International PLC | | | 101,792 | | | | (101,792 | ) | | | — | | | | — | | | | — | |
| | | | |
Total | | $ | 2,072,806 | | | $ | (2,055,413 | ) | | | — | | | | — | | | $ | 17,393 | |
| | | | |
| | 2 | | The amount of derivatives available for offset is limited to the amount of assets and/or liabilities that are subject to an MNA. |
| | 3 | | Net amount represents the net amount receivable from the counterparty in the event of default. |
| | 4 | | Net amount represents the net amount payable due to the counterparty in the event of default. |
5. Investment Advisory Agreement and Other Transactions with Affiliates:
The PNC Financial Services Group, Inc. is the largest stockholder and an affiliate, for 1940 Act purposes, of BlackRock, Inc. (“BlackRock”).
The Trust, on behalf of the Fund, entered into an Investment Advisory Agreement with the Manager, the Fund’s investment advisor, an indirect, wholly owned subsidiary of BlackRock, to provide investment advisory services. The Manager is responsible for the management of the Fund’s portfolio and provides the necessary personnel, facilities, equipment and certain other services to the operations of the Fund. For such services, the Fund pays the Manager a monthly fee based on a percentage of the Fund’s average daily net assets at the following annual rates:
| | | | |
| Average Daily Net Assets | | Investment
Advisory Fee | |
First $1 Billion | | | 1.95 | % |
$1 Billion - $3 Billion | | | 1.83 | % |
$3 Billion - $5 Billion | | | 1.76 | % |
$5 Billion - $10 Billion | | | 1.70 | % |
Greater than $10 Billion | | | 1.66 | % |
The Manager may, at its discretion, voluntarily waive all or a portion of its investment advisory fees including the amount of investment advisory fees the Fund pays to the Manager indirectly through its investment in affiliated money market funds. This amount is included in fees waived by Manager in the Statement of Operations. For the six months ended February 28, 2015, the amount waived was $432.
In addition, the Manager has contractually agreed to waive the management fee on assets estimated to be attributed to the Fund’s investments in other equity and fixed income mutual funds managed by BlackRock or its affiliates. This amount is included in fees waived by Manager in the Statement of Operations. For the six months ended February 28, 2015, the amount waived was $213,087.
The Manager entered into separate sub-advisory agreements with Benefit Street Partners, LLC (“BSP”), Independence Capital Asset Partners, LLC (“ICA”), LibreMax Capital, LLC (“LMC”), Loeb King Capital Management (“LKC”), MeehanCombs LP (“MCLP”), PEAK6 Advisors LLC (“PEAK”), QMS Capital Management LP (“QMS”), BlackRock International Limited (“BIL”), BlackRock Asset Management North Asia Limited (“BNA”) and BlackRock (Singapore) Limited (“BRS”). BIL, BNA and BRS are each an affiliate of the Manager. The Manager pays BSP, ICA, LMC, LKC, MCLP, PEAK, QMS, BIL, BNA and BRS, for services they provide, a monthly fee that is a percentage of the investment advisory fees paid by the Fund to the Manager.
| | | | | | |
| | | BLACKROCK MULTI-MANAGER ALTERNATIVE STRATEGIES FUND | | FEBRUARY 28, 2015 | | 41 |
| | |
| Notes to Financial Statements (continued) | | |
Effective September 30, 2014, the sub-advisory agreement between the Manager and PEAK was terminated due to a change in PEAK’s ownership structure. Effective January 30, 2015, the sub-advisory agreement between the Manager and LKC was terminated due to LKC’s determination to no longer provide investment advisory services to clients. As a result, the investments made with the portion of assets allocated to PEAK and LKC were sold. The proceeds from the sales were reallocated to the Fund’s remaining sub-advisors and the Manager. Effective February 27, 2015 the Manager entered into a sub-advisory agreement with Achievement Asset Management LLC (formerly known as Peak6 Advisors LLC).
The Trust, on behalf of the Fund, entered into a Distribution Agreement and Distribution and Service Plan with BlackRock Investments, LLC (“BRIL”), an affiliate of the Manager. Pursuant to the Distribution and Service Plan and in accordance with Rule 12b-1 under the 1940 Act, the Fund pays BRIL ongoing service and distribution fees. The fees are accrued daily and paid monthly at annual rates based upon the average daily net assets of the relevant share class of the Fund as follows:
| | | | | | | | |
| | | Investor A | | | Investor C | |
Service Fee | | | 0.25 | % | | | 0.25 | % |
Distribution Fee | | | — | | | | 0.75 | % |
Pursuant to sub-agreements with BRIL, broker-dealers and BRIL provide shareholder servicing and distribution services to the Fund. The ongoing service and/or distribution fee compensates BRIL and each broker-dealer for providing shareholder servicing and/or distribution related services to Investor A and Investor C shareholders.
For the six months ended February 28, 2015, the following table shows the class specific service and distribution fees borne directly by each class of the Fund:
| | | | |
| Investor A | | Investor C | | Total |
$257 | | $556 | | $813 |
The Manager maintains a call center, which is responsible for providing certain shareholder services to the Fund, such as responding to shareholder inquiries and processing transactions based upon instructions from shareholders with respect to the subscription and redemption of Fund shares. For the six months ended February 28, 2015, the Fund reimbursed the Manager the following amounts for costs incurred in running the call center, which are included in transfer agent – class specific in the Statement of Operations:
| | | | | | |
| Institutional | | Investor A | | Investor C | | Total |
$69 | | $26 | | $26 | | $121 |
For the six months ended February 28, 2015, the following table shows the class specific transfer agent fees borne directly by each class of the Fund:
| | | | | | |
| Institutional | | Investor A | | Investor C | | Total |
$152 | | $117 | | $101 | | $370 |
The Manager acts as administrator for the Fund. For these services, the administrator receives an administration fee computed daily and payable monthly based on a percentage of the average daily net assets of the Fund. The administration fee, which is shown as administration in the Statement of Operations, is paid at the following annual rates:
| | | | |
| Average Daily Net Assets | | Administration Fee | |
First $500 Million | | | 0.05 | % |
$500 Million - $1 Billion | | | 0.04 | % |
Greater than $1 Billion | | | 0.03 | % |
The Manager may, at its discretion, voluntarily waive all or any portion of its administration fees for the Fund, which would be included in administration fees waived in the Statement of Operations.
The Manager contractually agreed to waive and/or reimburse fees or expenses in order to limit expenses, excluding interest expense, dividend expense, tax expense, acquired fund fees and expenses and certain other Fund expenses, which constitute extraordinary expenses not incurred in the ordinary course of the Fund’s business. The expense limitations as a percentage of average daily net assets are as follows: 2.35% for Institutional, 2.60% for Investor A and 3.35% for Investor C. The Manager has agreed not to reduce or discontinue this contractual waiver or reimbursement prior to January 1, 2016 unless approved by the Board, including a majority of the Independent Trustees or by a majority of the outstanding voting securities of the Fund.
| | | | | | |
| 42 | | BLACKROCK MULTI-MANAGER ALTERNATIVE STRATEGIES FUND | | FEBRUARY 28, 2015 | | |
| | |
| Notes to Financial Statements (continued) | | |
These amounts waived or reimbursed are included in fees waived by Manager and expenses reimbursed by Manager, and shown as transfer agent fees waived — class specific and transfer agent fees reimbursed — class specific, respectively, in the Statement of Operations. For the six months ended February 28, 2015, the Manager waived $7,095 of investment advisory fees, which is included in fees waived by Manager.
Class specific expense waivers or reimbursements are as follows:
| | | | | | | | | | | | | | | | |
| | | Institutional | | | Investor A | | | Investor C | | | Total | |
Transfer Agent Fees Waived | | $ | 2 | | | $ | 11 | | | $ | 21 | | | $ | 34 | |
Transfer Agent Fees Reimbursed | | $ | 5 | | | $ | 12 | | | $ | 24 | | | $ | 41 | |
If during the Fund’s fiscal year the operating expenses of a share class, that at any time during the prior two fiscal years received a waiver or reimbursement from the Manager, are less than the expense limit for that share class, the Manager is entitled to be reimbursed by such share class up to the lesser of (a) the amount of fees waived or expenses reimbursed during those prior two fiscal years under the agreement and (b) the amount by which the expense limit for that share class exceeds the operating expenses of the share class for the current fiscal year, provided that: (1) the Fund, of which the share class is a part, has more than $50 million in assets for the fiscal year and (2) the Manager or an affiliate continues to serve as the Fund’s investment advisor or administrator. In the event the expense limit for a share class is changed subsequent to a fiscal year in which the Manager becomes entitled to reimbursement for fees waived or reimbursed, the amount available to reimburse the Manager shall be calculated by reference to the expense limit for that share class in effect at the time the Manager became entitled to receive such reimbursement, rather than the subsequently changed expense limit for that share class.
On February 28, 2015, the Fund level and class specific waivers and/or reimbursements subject to possible future recoupment under the expense limitation agreement are as follows:
| | | | | | | | | | | | | | | | | | | | |
| Expires | | Fund Level | | | Institutional | | | Investor A | | | Investor C | | | Total | |
8/31/2016 | | $ | 132,006 | | | $ | 3 | | | $ | 15 | | | $ | 15 | | | $ | 132,039 | |
8/31/2017 | | $ | 7,095 | | | $ | 7 | | | $ | 23 | | | $ | 45 | | | $ | 7,170 | |
For the six months ended February 28, 2015, affiliates earned underwriting discounts, direct commissions and dealer concessions on sales of the Fund’s Investor A Shares of $48.
For the six months ended February 28, 2015, affiliates received CDSCs relating to transactions in Investor C Shares of $10.
Certain officers and/or trustees of the Trust are officers and/or directors of BlackRock or its affiliates. The Fund reimburses the Manager for a portion of the compensation paid to the Trust’s Chief Compliance Officer which is included in officer and trustees in the Statement of Operations.
6. Purchases and Sales:
For the six months ended February 28, 2015, purchases and sales of investments, excluding short-term securities were as follows:
| | | | | | | | |
| | | Purchases | | | Sales | |
Non-U.S. Government Securities | | $ | 61,833,930 | | | $ | 69,630,247 | |
U.S. Government Securities | | $ | 756,291 | | | | — | |
7. Income Tax Information:
It is the Fund’s policy to comply with the requirements of the Internal Revenue Code of 1986, as amended, applicable to regulated investment companies, and to distribute substantially all of its taxable income to its shareholders. Therefore, no federal income tax provision is required.
The Fund files U.S. federal and various state and local tax returns. No income tax returns are currently under examination. The statute of limitations on the Fund’s U.S. federal tax returns remains open for the period ended August 31, 2014.
Management has analyzed tax laws and regulations and their application to the Fund as of February 28, 2015, inclusive of open tax years, and does not believe there are any uncertain tax positions that require recognition of a tax liability in the Fund’s financial statements.
| | | | | | |
| | | BLACKROCK MULTI-MANAGER ALTERNATIVE STRATEGIES FUND | | FEBRUARY 28, 2015 | | 43 |
| | |
| Notes to Financial Statements (continued) | | |
As of February 28, 2015, gross unrealized appreciation and depreciation based on cost for federal income tax purposes were as follows:
| | | | |
Tax cost | | $ | 98,642,783 | |
| | | | |
Gross unrealized appreciation | | $ | 868,860 | |
Gross unrealized depreciation | | | (1,880,055) | |
| | | | |
Net unrealized depreciation | | $ | (1,011,195 | ) |
| | | | |
8. Bank Borrowings:
The Fund, along with certain other funds managed by the Manager and its affiliates (“Participating Funds”), was a party to a 364-day, $1.1 billion credit agreement with a group of lenders, under which the Fund may borrow to fund shareholder redemptions. Excluding commitments designated for a certain individual fund, the Participating Funds, including the Fund, could borrow up to an aggregate commitment amount of $650 million, subject to asset coverage and other limitations as specified in the agreement. Effective November 25, 2014, the credit agreement was amended to an aggregate commitment amount of $2.1 billion, of which, the Participating Funds, including the Fund, can borrow up to $1.6 billion at any time outstanding, subject to asset coverage and other limitations as specified in the agreement. The agreement terminates on April 23, 2015 unless otherwise extended to November 24, 2015 or renewed for a period of 364 days from April 23, 2015. The amended agreement has the following terms: a fee of 0.06% per annum on unused commitment amounts and interest at a rate equal to the higher of (a) the one-month LIBOR (but in any event, not less than 0.00%) on the date the loan is made plus 0.80% per annum or (b) the Fed Funds rate (but in any event, not less than 0.00%) in effect from time to time plus 0.80% per annum on amounts borrowed. Participating Funds paid administration, legal and arrangement fees, which are included in miscellaneous expenses in the Statement of Operations, and along with commitment fees, were allocated among such funds based upon portions of the aggregate commitment available to them and relative net assets of Participating Funds. During the six months ended February 28, 2015, the Fund did not borrow under the credit agreement.
9. Principal Risks:
In the normal course of business, the Fund invests in securities and enters into transactions where risks exist due to fluctuations in the market (market risk) or failure of the issuer of a security to meet all its obligations (issuer credit risk). The value of securities held by the Fund may decline in response to certain events, including those directly involving the issuers whose securities are owned by the Fund; conditions affecting the general economy; overall market changes; local, regional or global political, social or economic instability; and currency and interest rate and price fluctuations. Similar to issuer credit risk, the Fund may be exposed to counterparty credit risk, or the risk that an entity with which the Fund has unsettled or open transactions may fail to or be unable to perform on its commitments. The Fund manages counterparty credit risk by entering into transactions only with counterparties that it believes have the financial resources to honor their obligations and by monitoring the financial stability of those counterparties. Financial assets, which potentially expose the Fund to market, issuer and counterparty credit risks, consist principally of financial instruments and receivables due from counterparties. The extent of the Fund’s exposure to market, issuer and counterparty credit risks with respect to these financial assets is generally approximated by their value recorded in the Statement of Assets and Liabilities, less any collateral held by the Fund.
The Fund invests a significant portion of its assets in fixed income securities and/or uses derivatives tied to the fixed income markets. See the Schedule of Investments for these securities and/or derivatives. Changes in market interest rates or economic conditions, including the Federal Reserve’s decision in December 2013 to taper its quantitative easing policy, may affect the value and/or liquidity of such investments. Interest rate risk is the risk that prices of bonds and other fixed income securities will increase as interest rates fall and decrease as interest rates rise. The Fund may be subject to a greater risk of rising interest rates due to the current period of historically low rates.
| | | | | | |
| 44 | | BLACKROCK MULTI-MANAGER ALTERNATIVE STRATEGIES FUND | | FEBRUARY 28, 2015 | | |
| | |
| Notes to Financial Statements (continued) | | |
10. Capital Share Transactions:
Transactions in capital shares for each class were as follows:
| | | | | | | | | | | | | | | | | | |
| | | Six Months Ended
February 28, 2015 | | | | | Period August 7, 20141 to
August 31, 2014 | |
| Institutional | | Shares | | | Amount | | | | | Shares | | | Amount | |
Shares sold | | | 95,634 | | | $ | 957,650 | | | | | | 9,997,591 | | | $ | 99,976,594 | |
Shares issued in reinvestment of distributions | | | 252 | | | | 2,499 | | | | | | — | | | | — | |
Shares redeemed | | | (3,259 | ) | | | (32,609 | ) | | | | | — | | | | — | |
| | | | | | | | | | |
Net increase | | | 92,627 | | | $ | 927,540 | | | | | | 9,997,591 | | | $ | 99,976,594 | |
| | | | | | | | | | |
| | | | | | | | | | | | | | | | | | |
Investor A | | | | | | | | | | | | | | | | | | |
Shares sold | | | 23,985 | | | $ | 239,729 | | | | | | 10,189 | | | $ | 101,894 | |
Shares issued in reinvestment of distributions | | | 158 | | | | 1,572 | | | | | | — | | | | — | |
Shares redeemed | | | (201 | ) | | | (2,018 | ) | | | | | — | | | | — | |
| | | | |
Net increase | | | 23,942 | | | $ | 239,283 | | | | | | 10,189 | | | $ | 101,894 | |
| | | | | | | | | | |
| | | | | | | | | | | | | | | | | | |
Investor C | | | | | | | | | | | | | | | | | | |
Shares sold | | | 1,798 | | | $ | 18,000 | | | | | | 10,000 | | | $ | 100,000 | |
Shares issued in reinvestment of distributions | | | 17 | | | | 170 | | | | | | — | | | | — | |
Shares redeemed | | | (113 | ) | | | (1,119 | ) | | | | | — | | | | — | |
| | | | | | | | | | |
Net increase | | | 1,702 | | | $ | 17,051 | | | | | | 10,000 | | | $ | 100,000 | |
| | | | | | | | | | |
Total Net Increase | | | 118,271 | | | $ | 1,183,874 | | | | | | 10,017,780 | | | $ | 100,178,488 | |
| | | | | | | | | | |
| | 1 | | Commencement of operations. |
At February 28, 2015, shares owned by affiliates of the Fund were as follows:
| | | | |
| Institutional | | Investor A | | Investor C |
9,980,000 | | 10,000 | | 10,000 |
11. Subsequent Events:
Management has evaluated the impact of all subsequent events on the Fund through the date the financial statements were issued and has determined that there were no subsequent events requiring adjustment or additional disclosure in the financial statements.
| | | | | | |
| | | BLACKROCK MULTI-MANAGER ALTERNATIVE STRATEGIES FUND | | FEBRUARY 28, 2015 | | 45 |
| | |
| Disclosure of Sub-Advisory Agreements | | |
The Board of Trustees (the “Board,” and the members of which are referred to as “Board Members”) of BlackRock FundsSM (the “Trust”) met in person on February 19-20, 2015 (the “Meeting”) to consider the initial approval of (a) the sub-advisory agreement between BlackRock Advisors, LLC (the “Manager” or “BlackRock”), the Trust’s investment advisor, and Achievement Asset Management LLC (“Achievement”) with respect to BlackRock Multi-Manager Alternative Strategies Fund (the “Fund”), a series of the Trust (the “Achievement Sub-Advisory Agreement”) and (b) the sub-advisory agreement between the Manager and Ionic Capital Management LLC (“Ionic,” and together with Achievement, the “Sub-Advisors” or individually, a “Sub-Advisor”) (the “Ionic Sub-Advisory Agreement,” and together with the Achievement Sub-Advisory Agreement, the “Sub-Advisory Agreements”). Each Sub-Advisory Agreement was based on the model sub-advisory agreement between the Manager and potential sub-advisors with respect to the Fund previously approved by the Board, but was substantially negotiated by BlackRock with the pertinent Sub-Advisor.
Activities and Composition of the Board
The Board consists of fifteen individuals, fourteen of whom are not “interested persons” of the Trust as defined in the Investment Company Act of 1940, as amended (the “1940 Act”) (the “Independent Board Members”). The Board Members are responsible for the oversight of the operations of the Fund and perform the various duties imposed on the directors of investment companies by the 1940 Act. The Independent Board Members have retained independent legal counsel to assist them in connection with their duties. The Chair of the Board is an Independent Board Member. The Board has established five standing committees: an Audit Committee, a Governance and Nominating Committee, a Compliance Committee, a Performance Oversight and Contract Committee and an Executive Committee, each of which is chaired by an Independent Board Member and composed of Independent Board Members (except for the Executive Committee, which also has one interested Board Member).
Board Considerations in Approving the Agreements
Pursuant to the 1940 Act, the Board is required to consider the initial approval of the Sub-Advisory Agreements. Prior to the Meeting, the Board received materials relating to its consideration of the Sub-Advisory Agreements. The Board, including the Independent Board Members, reviewed the nature, extent and quality of services to be provided by each Sub-Advisor, including the investment advisory services to be provided to the Fund. The Board received information concerning the investment philosophy and investment process to be used by each Sub-Advisor in managing the Fund, as well as a description of the capabilities, personnel and services of each Sub-Advisor. The Board also received information concerning BlackRock’s process for selecting and overseeing sub-advisors and was informed that BlackRock had performed due diligence on each of the Sub-Advisors, including a review of portfolio compliance systems and capabilities.
In determining to approve the Sub-Advisory Agreements, the Board met with the relevant investment advisory personnel from BlackRock and considered all information it deemed reasonably necessary to evaluate the terms of the Sub-Advisory Agreements. The Board considered all factors it believed relevant with respect to its consideration of the Sub-Advisory Agreements, including, among other factors: (a) the history of each Sub-Advisor; (b) the investment performance of the portfolio management of each Sub-Advisor; (c) possible alternatives to the proposed Sub-Advisory Agreements; (d) the fees to be paid pursuant to the Sub-Advisory Agreements; (e) Blackrock’s compliance and operational oversight of the Fund and the Sub-Advisors; and (f) other factors deemed relevant by the Board Members.
Conclusion
Following discussion, all of the Board Members present at the Meeting, including all of the Independent Board Members present at the Meeting, approved (i) the Achievement Sub-Advisory Agreement between the Manager and Achievement with respect to the Fund and (ii) the Ionic Sub-Advisory Agreement between the Manager and Ionic with respect to the Fund, each for a two-year term beginning on the effective date of the applicable Sub-Advisory Agreement. Based upon its evaluation of all of the aforementioned factors in their totality, the Board, including the Independent Board Members, was satisfied that the terms of the Sub-Advisory Agreements were fair and reasonable and in the best interest of the Fund and its shareholders. In arriving at its decision to approve the Sub-Advisory Agreements, the Board did not identify any single factor or group of factors as all-important or controlling, but considered all factors together, and different Board Members may have attributed different weights to the various factors considered. The Independent Board Members were also assisted by the advice of independent legal counsel in making this determination.
| | | | | | |
| 46 | | BLACKROCK MULTI-MANAGER ALTERNATIVE STRATEGIES FUND | | FEBRUARY 28, 2015 | | |
Rodney D. Johnson, Chair of the Board and Trustee
David O. Beim, Trustee
Collette Chilton, Trustee
Frank J. Fabozzi, Trustee
Dr. Matina S. Horner, Trustee
Herbert I. London, Trustee
Ian A. MacKinnon, Trustee
Cynthia A. Montgomery, Trustee
Barbara G. Novick, Trustee
Joseph P. Platt, Trustee
Robert C. Robb, Jr., Trustee
Toby Rosenblatt, Trustee
Mark Stalnecker, Trustee
Kenneth L. Urish, Trustee
Frederick W. Winter, Trustee
John M. Perlowski, President and Chief Executive Officer
Jennifer McGovern, Vice President
Neal Andrews, Chief Financial Officer
Jay Fife, Treasurer
Charles Park, Chief Compliance Officer and Anti-Money Laundering Compliance Officer
Benjamin Archibald, Secretary
Effective September 19, 2014, Brendan Kyne resigned as a Vice President of the Trust and Jennifer McGovern became a Vice President of the Trust.
Effective December 31, 2014, Paul L. Audet and Henry Gabbay resigned as Trustees of the Trust and Ronald W. Forbes resigned as a Trustee of the Trust and Co-Chair of the Board. Effective January 1, 2015, Collette Chilton, Barbara G. Novick and Mark Stalnecker were appointed to serve as Trustees of the Trust.
Effective March 1, 2015, Charles Park resigned as Anti-Money Laundering Compliance Officer of the Trust and Fernanda Piedra became Anti-Money Laundering Compliance Officer of the Trust.
| | | | | | |
| | | BLACKROCK MULTI-MANAGER ALTERNATIVE STRATEGIES FUND | | FEBRUARY 28, 2015 | | 47 |
| | | | | | |
Investment Advisor and Administrator BlackRock Advisors, LLC Wilmington, DE 19809 | | Sub-Advisors Benefit Street Partners, LLC New York, NY 10019 | | BlackRock International Limited Edinburgh, EH3 8BL United Kingdom | | Custodian The Bank of New York Mellon New York, NY 10286 |
| | | | | | |
Legal Counsel Sidley Austin LLP New York, NY 10019 | | Independence Capital Asset Partners, LLC Denver, CO 80202 | | BlackRock Asset Management North Asia Limited 2 Queen’s Road Central Hong Kong | | Independent Registered Public Accounting Firm Deloitte & Touche LLP Philadelphia, PA 19103 |
| | | | | | |
Accounting Agent, and Transfer Agent BNY Mellon Investment Servicing (US) Inc. Wilmington, DE 19809 | | LibreMax Capital, LLC New York, NY 10022 | | BlackRock (Singapore) Limited 079912 Singapore | | Distributor BlackRock Investments, LLC New York, NY 10022 |
| | | | | | |
| | MeehanCombs LP Stamford, CT 06902 | | Achievement Asset Management LLC Chicago, Illinois 60604 | | Address of the Trust 100 Bellevue Parkway Wilmington, DE 19809 |
| | | | | | |
| | QMS Capital Management LP Durham, NC 27707 | | | | |
| | | | | | |
| 48 | | BLACKROCK MULTI-MANAGER ALTERNATIVE STRATEGIES FUND | | FEBRUARY 28, 2015 | | |
Householding
The Fund will mail only one copy of shareholder documents, including prospectuses, annual and semi-annual reports and proxy statements, to shareholders with multiple accounts at the same address. This practice is commonly called “householding” and is intended to reduce expenses and eliminate duplicate mailings of shareholder documents. Mailings of your shareholder documents may be householded indefinitely unless you instruct us otherwise. If you do not want the mailing of these documents to be combined with those for other members of your household, please contact the Fund at (800) 441-7762.
Availability of Quarterly Portfolio Schedule of Investments
The Fund files its complete schedule of portfolio holdings with the SEC for the first and third quarters of each fiscal year on Form N-Q. The Fund’s Forms N-Q are available on the SEC’s website at http://www.sec.gov and may also be reviewed and copied at the SEC’s Public Reference Room in Washington, D.C. Information on how to access documents on the SEC’s website without charge may be obtained by calling (800) SEC-0330. The Fund’s Forms N-Q may also be obtained upon request and without charge by calling (800) 441-7762.
Availability of Proxy Voting Policies and Procedures
A description of the policies and procedures that the Fund uses to determine how to vote proxies relating to portfolio securities is available upon request and without charge (1) by calling (800) 441-7762; (2) at http://www.blackrock.com; and (3) on the SEC’s website at http://www.sec.gov.
Availability of Proxy Voting Record
Information about how the Fund voted proxies relating to securities held in the Fund’s portfolio during the most recent 12-month period ended June 30 is available upon request and without charge (1) at http://www.blackrock.com or by calling (800) 441-7762 and (2) on the SEC’s website at http:// www.sec.gov.
BlackRock’s Mutual Fund Family
BlackRock offers a diverse lineup of open-end mutual funds crossing all investment styles and managed by experts in equity, fixed income and tax-exempt investing. Visit http://www.blackrock.com for more information.
Account Information
Call us at (800) 441-7762 from 8:00 AM to 6:00 PM EST on any business day to get information about your account balances, recent transactions and share prices. You can also reach us on the Web at http://www.blackrock.com/funds.
Automatic Investment Plans
Investor Class shareholders who want to invest regularly can arrange to have $50 or more automatically deducted from their checking or savings account and invested in any of the BlackRock funds.
Systematic Withdrawal Plans
Investor Class shareholders can establish a systematic withdrawal plan and receive periodic payments of $50 or more from their BlackRock funds, as long as their account balance is at least $10,000.
Retirement Plans
Shareholders may make investments in conjunction with Traditional, Rollover, Roth, Coverdell, Simple IRA’s, SEP IRA’s and 403(b) Plans.
| | | | | | |
| | | BLACKROCK MULTI-MANAGER ALTERNATIVE STRATEGIES FUND | | FEBRUARY 28, 2015 | | 49 |
| | |
| Additional Information (concluded) | | |
|
| BlackRock Privacy Principles |
BlackRock is committed to maintaining the privacy of its current and former fund investors and individual clients (collectively, “Clients”) and to safeguarding their non-public personal information. The following information is provided to help you understand what personal information BlackRock collects, how we protect that information and why in certain cases we share such information with select parties.
If you are located in a jurisdiction where specific laws, rules or regulations require BlackRock to provide you with additional or different privacy-related rights beyond what is set forth below, then BlackRock will comply with those specific laws, rules or regulations.
BlackRock obtains or verifies personal non-public information from and about you from different sources, including the following: (i) information we receive from you or, if applicable, your financial intermediary, on applications, forms or other documents; (ii) information about your transactions with us, our affiliates, or others; (iii) information we receive from a consumer reporting agency; and (iv) from visits to our websites.
BlackRock does not sell or disclose to non-affiliated third parties any non-public personal information about its Clients, except as permitted by law or as is necessary to respond to regulatory requests or to service Client accounts. These non-affiliated third parties are required to protect the confidentiality and security of this information and to use it only for its intended purpose.
We may share information with our affiliates to service your account or to provide you with information about other BlackRock products or services that may be of interest to you. In addition, BlackRock restricts access to non-public personal information about its Clients to those BlackRock employees with a legitimate business need for the information. BlackRock maintains physical, electronic and procedural safeguards that are designed to protect the non-public personal information of its Clients, including procedures relating to the proper storage and disposal of such information.
| | | | | | |
| 50 | | BLACKROCK MULTI-MANAGER ALTERNATIVE STRATEGIES FUND | | FEBRUARY 28, 2015 | | |
| | |
This report is intended for current holders. It is not authorized for use as an offer of sale or a solicitation of an offer to buy shares of the Fund unless preceded or accompanied by the Fund’s current prospectus. Past performance results shown in this report should not be considered a representation of future performance. Investment returns and principal value of shares will fluctuate so that shares, when redeemed, may be worth more or less than their original cost. Statements and other information herein are as dated and are subject to change. | | 
|
| | |
MMAS-2/15-SAR | | 
|
| | | | |
| | |
| Item 2 | | – | | Code of Ethics – Not Applicable to this semi-annual report |
| | |
| Item 3 | | – | | Audit Committee Financial Expert – Not Applicable to this semi-annual report |
| | |
| Item 4 | | – | | Principal Accountant Fees and Services – Not Applicable to this semi-annual report |
| | |
| Item 5 | | – | | Audit Committee of Listed Registrants – Not Applicable |
| | |
| Item 6 | | – | | Investments |
| | | | (a) The registrant’s Schedule of Investments is included as part of the Report to Stockholders filed under Item 1 of this Form. |
| | | | (b) Not Applicable due to no such divestments during the semi-annual period covered since the previous Form N-CSR filing. |
| | |
| Item 7 | | – | | Disclosure of Proxy Voting Policies and Procedures for Closed-End Management Investment Companies – Not Applicable |
| | |
| Item 8 | | – | | Portfolio Managers of Closed-End Management Investment Companies – Not Applicable |
| | |
| Item 9 | | – | | Purchases of Equity Securities by Closed-End Management Investment Company and Affiliated Purchasers – Not Applicable |
| | |
| Item 10 | | – | | Submission of Matters to a Vote of Security Holders –There have been no material changes to these procedures. |
| | |
| Item 11 | | – | | Controls and Procedures |
| | |
| | | | (a) – The registrant’s principal executive and principal financial officers, or persons performing similar functions, have concluded that the registrant’s disclosure controls and procedures (as defined in Rule 30a-3(c) under the Investment Company Act of 1940, as amended (the “1940 Act”)) are effective as of a date within 90 days of the filing of this report based on the evaluation of these controls and procedures required by Rule 30a-3(b) under the 1940 Act and Rule 15d-15(b) under the Securities Exchange Act of 1934, as amended. |
| | |
| | | | (b) – There were no changes in the registrant’s internal control over financial reporting (as defined in Rule 30a-3(d) under the 1940 Act) that occurred during the second fiscal quarter of the period covered by this report that have materially affected, or are reasonably likely to materially affect, the registrant’s internal control over financial reporting. |
| | |
| Item 12 | | – | | Exhibits attached hereto |
| | |
| | | | (a)(1) – Code of Ethics – Not Applicable to this semi-annual report |
| | |
| | | | (a)(2) – Certifications – Attached hereto |
| | |
| | | | (a)(3) – Not Applicable |
| | |
| | | | (b) – Certifications – Attached hereto |
3
Pursuant to the requirements of the Securities Exchange Act of 1934 and the Investment Company Act of 1940, the registrant has duly caused this report to be signed on its behalf by the undersigned, thereunto duly authorized.
BlackRock Funds
| | |
| By: | | /s/ John M. Perlowski |
| | John M. Perlowski |
| | Chief Executive Officer (principal executive officer) of BlackRock Funds |
Date: May 1, 2015
Pursuant to the requirements of the Securities Exchange Act of 1934 and the Investment Company Act of 1940, this report has been signed below by the following persons on behalf of the registrant and in the capacities and on the dates indicated.
| | |
| By: | | /s/ John M. Perlowski |
| | John M. Perlowski |
| | Chief Executive Officer (principal executive officer) of BlackRock Funds |
Date: May 1, 2015
| | |
| By: | | /s/ Neal J. Andrews |
| | Neal J. Andrews |
| | Chief Financial Officer (principal financial officer) of BlackRock Funds |
Date: May 1, 2015
4