UNITED STATES
SECURITIES AND EXCHANGE COMMISSION
Washington, D.C. 20549
FORM N-CSR
CERTIFIED SHAREHOLDER REPORT OF REGISTERED MANAGEMENT INVESTMENT
COMPANIES
Investment Company Act file number: 811-05742
Name of Fund: BlackRock Funds
BlackRock All-Cap Energy & Resources Portfolio
BlackRock Emerging Markets Dividend Fund
BlackRock Energy & Resources Portfolio
BlackRock Flexible Equity Fund
BlackRock Global Opportunities Portfolio
BlackRock Health Sciences Opportunities Portfolio
BlackRock International Opportunities Portfolio
BlackRock Managed Volatility Portfolio
BlackRock Mid-Cap Growth Equity Portfolio
BlackRock Science & Technology Opportunities Portfolio
BlackRock Small Cap Growth Equity Portfolio
BlackRock U.S. Opportunities Portfolio
Fund Address: 100 Bellevue Parkway, Wilmington, DE 19809
Name and address of agent for service: John M. Perlowski, Chief Executive Officer, BlackRock Funds, 55 East 52nd Street, New York, NY 10055
Registrant’s telephone number, including area code: (800) 441-7762
Date of fiscal year end: 09/30/2015
Date of reporting period: 03/31/2015
Item 1 – Report to Stockholders
MARCH 31, 2015
| | | | |
SEMI-ANNUAL REPORT (UNAUDITED) | | | | BLACKROCK® |
BlackRock FundsSM
„ BlackRock All-Cap Energy & Resources Portfolio
„ BlackRock Emerging Markets Dividend Fund
„ BlackRock Energy & Resources Portfolio
| | |
| Not FDIC Insured ¡ May Lose Value ¡ No Bank Guarantee | | |

| | | | | | |
| 2 | | BLACKROCK FUNDS | | MARCH 31, 2015 | | |
Dear Shareholder,
Market volatility has remained low from a long-term perspective, but increased over the course of 2014 amid higher valuations in risk assets (such as equities and high yield bonds), geopolitical risks, uneven global economic growth and uncertainty around policy moves from the world’s largest central banks. As the U.S. Federal Reserve (the “Fed”) gradually reduced its bond buying program (which ultimately ended in October 2014), U.S. interest rates surprisingly trended lower and stock prices forged ahead despite high valuations on the back of a multi-year bull market. Geopolitical tensions intensified in Ukraine and the Middle East and oil prices became highly volatile in the middle of the summer, stoking worries about economic growth outside the United States. As the U.S. economy continued to show steady improvement, the stronger data caused concern among investors that the Fed would raise short-term rates sooner than previously anticipated. The U.S. dollar appreciated and global credit markets tightened, ultimately putting a strain on investor flows, and financial markets broadly weakened in the third quarter.
U.S. economic growth picked up considerably in the fourth quarter while the broader global economy showed signs of slowing. U.S. markets significantly outperformed international markets even as the European Central Bank (“ECB”) and the Bank of Japan eased monetary policy, which drove further strengthening in the U.S. dollar. Oil prices plummeted in the fourth quarter due to a global supply-and-demand imbalance, sparking a selloff in energy-related assets and stress in emerging markets. Fixed income investors piled into U.S. Treasuries as their persistently low yields became relatively attractive as compared to international sovereign debt.
Equity markets reversed in the first quarter of 2015 and U.S. stocks underperformed international markets, notably Europe and Japan, but also emerging markets. Investors had held high expectations for the U.S. economy, but after a harsh winter, first-quarter data disappointed and high valuations took their toll on U.S. stocks. Meanwhile, economic reports in Europe and Asia easily beat investors’ very low expectations for those economies, and accommodative policies from global central banks helped international equities rebound. The ECB’s asset purchase program (announced in January and commenced in March) was the largest in scale and effect on the markets. Overall, market volatility decreased in the first quarter as global risks abated, with a ceasefire in Ukraine and an improving outlook for Greece’s continued membership in the Eurozone.
At BlackRock, we believe investors need to think globally, extend their scope across a broad array of asset classes and be prepared to move freely as market conditions change over time. We encourage you to talk with your financial advisor and visit blackrock.com for further insight about investing in today’s markets.
Sincerely,

Rob Kapito
President, BlackRock Advisors, LLC

Rob Kapito
President, BlackRock Advisors, LLC
| | | | | | | | |
| Total Returns as of March 31, 2015 | |
| | | 6-month | | | 12-month | |
U.S. large cap equities (S&P 500® Index) | | | 5.93 | % | | | 12.73 | % |
U.S. small cap equities (Russell 2000® Index) | | | 14.46 | | | | 8.21 | |
International equities (MSCI Europe, Australasia, Far East Index) | | | 1.13 | | | | (0.92 | ) |
Emerging market equities (MSCI Emerging Markets Index) | | | (2.37 | ) | | | 0.44 | |
3-month Treasury bill (BofA Merrill Lynch 3-Month U.S. Treasury Bill Index) | | | 0.01 | | | | 0.03 | |
U.S. Treasury securities (BofA Merrill Lynch 10- Year U.S. Treasury Index) | | | 6.25 | | | | 9.88 | |
U.S. investment grade bonds (Barclays U.S. Aggregate Bond Index) | | | 3.43 | | | | 5.72 | |
Tax-exempt municipal bonds (S&P Municipal Bond Index) | | | 2.29 | | | | 6.60 | |
U.S. high yield bonds (Barclays U.S. Corporate High Yield 2% Issuer Capped Index) | | | 1.50 | | | | 2.00 | |
|
| Past performance is no guarantee of future results. Index performance is shown for illustrative purposes only. You cannot invest directly in an index. | |
| | | | | | |
| | | THIS PAGE NOT PART OF YOUR FUND REPORT | | | | 3 |
| | | | |
| Fund Summary as of March 31, 2015 | | | BlackRock All-Cap Energy & Resources Portfolio | |
BlackRock All-Cap Energy & Resources Portfolio’s (the “Fund”) investment objective is to provide long-term growth of capital.
|
| Portfolio Management Commentary |
How did the Fund perform?
| Ÿ | | For the six-month period ended March 31, 2015, the Fund underperformed the MSCI World Energy Index. |
What factors influenced performance?
| Ÿ | | The Fund’s overweight positions in the North American exploration and production (E&P) stocks Encana Corp. and Laredo Petroleum, Inc. weighed on relative returns, as the companies’ growth rates appeared to be at risk following the drop in oil prices. Encana Corp. came under further pressure after announcing it was raising funds by issuing new equity. |
| Ÿ | | Toward the end of the period, a divergence in oil prices between Brent (international crude) and West Texas Intermediate (U.S. crude) was beneficial for the Gulf Coast refiners Valero Energy Corp. and Marathon Oil Corp., as these companies took advantage of the spread between the prices of the two types of oil. The Fund’s underweight in these stocks detracted from relative performance. |
| Ÿ | | Well-capitalized E&P companies with stronger-than-average balance sheets and tier one assets generally outperformed during the first quarter. Devon Energy Corp. and Cimarex Energy Co., both of which outpaced the broader sector, were prime examples of this trend. The Fund held overweights in the two stocks, aiding performance. |
| Ÿ | | Eni S.p.A., a European integrated energy company, announced a cut to its dividend near the end of the period. This was the first instance of a dividend cut by one of the major energy companies during this downturn. The stock fell sharply as a result, so the Fund’s underweight was a positive contributor to relative performance. At the close of the period, the Fund remained underweight in Eni S.p.A. in favor of more compelling value opportunities elsewhere in the sector. |
Describe recent portfolio activity.
| Ÿ | | The Fund initiated a position in Marathon Oil Corp., a high-quality, U.S.-focused oil producer, during the period. This purchase was funded through the sales of CONSOL Energy, Inc. and Laredo Petroleum, Inc. and the distribution company TransCanada Corp. The Fund also exited its position in the offshore service company Cameron International Corp. on concerns that the company’s business model will be particularly challenged by lower oil prices. The proceeds of these sales were rotated into a new position in the U.S.-focused land driller Helmerich & Payne, Inc. |
Describe portfolio positioning at period end.
| Ÿ | | The Fund retained a bias toward higher-quality companies, and a number of the major integrated energy companies remained in its top-ten holdings. The Fund’s investment advisor believed these companies’ strong asset bases and financial flexibility gave them the ability to adapt to a weak oil price environment. |
| Ÿ | | The Fund maintained an overweight to the E&P industry, and it also had significant exposure to U.S. onshore unconventional producers and international E&P companies. The Fund retained a strong focus on assessing valuations, asset bases and companies’ financial flexibility. |
| Ÿ | | Believing lower oil prices will lead to falling profit margins for offshore oil services companies, the Fund’s investment advisor remained cautious with respect to this industry group. In addition, these companies tend to be key beneficiaries of the major integrated companies’ capital expenditures (capex). As a result, the capex cuts that have occurred across the energy sector represent a potential headwind for oil services companies. |
The views expressed reflect the opinions of BlackRock as of the date of this report and are subject to change based on changes in market, economic or other conditions. These views are not intended to be a forecast of future events and are no guarantee of future results.
| | |
| Ten Largest Holdings | | Percent of Long-Term Investments |
| | | | |
Exxon Mobil Corp. | | | 11 | % |
Chevron Corp. | | | 8 | |
Royal Dutch Shell PLC, A Shares - ADR | | | 7 | |
ConocoPhillips | | | 6 | |
Anadarko Petroleum Corp. | | | 5 | |
BP PLC | | | 5 | |
TOTAL SA | | | 5 | |
Pioneer Natural Resources Co. | | | 4 | |
Marathon Oil Corp. | | | 4 | |
Enbridge, Inc. | | | 4 | |
| | |
| Industry Allocation | | Percent of Long-Term Investments |
| | | | |
Oil, Gas & Consumable Fuels | | | 93 | % |
Energy Equipment & Services | | | 7 | |
For Fund compliance purposes, the Fund’s industry classifications refer to any one or more of the industry sub-classifications used by one or more widely recognized market indexes or ratings group indexes, and/or as defined by the investment advisor. These definitions may not apply for purposes of this report, which may combine such industry sub-classifications for reporting ease.
| | | | | | |
| 4 | | BLACKROCK FUNDS | | MARCH 31, 2015 | | |
| | | | |
| | | | BlackRock All-Cap Energy & Resources Portfolio | |
|
| Total Return Based on a $10,000 Investment |
| | 1 | Assuming maximum sales charges, if any, transaction costs and other operating expenses, including investment advisory fees and administration fees, if any. Institutional Shares do not have a sales charge. |
| | 2 | Under normal market conditions, the Fund invests at least 80% of its total assets in equity securities of global energy and natural resources companies and companies in associated businesses, as well as utilities (such as gas, water, cable, electrical and telecommunications utilities). |
| | 3 | A free float-adjusted market capitalization index that represents the energy segment in global developed market equity performance. |
| | | | | | | | | | | | | | | | | | | | | | | | | | | | |
| Performance Summary for the Period Ended March 31, 2015 | |
| | | | | | Average Annual Total Returns4 | |
| | | | | | 1 Year | | | 5 Years | | | 10 Years | |
| | | 6-Month Total Returns | | | w/o sales charge | | | w/ sales charge | | | w/o sales charge | | | w/ sales charge | | | w/o sales charge | | | w/ sales charge | |
Institutional | | | (18.91 | )% | | | (17.18 | )% | | | N/A | | | | (0.41 | )% | | | N/A | | | | 5.44 | % | | | N/A | |
Service | | | (19.08 | ) | | | (17.46 | ) | | | N/A | | | | (0.80 | ) | | | N/A | | | | 5.02 | | | | N/A | |
Investor A | | | (19.04 | ) | | | (17.52 | ) | | | (21.85 | )% | | | (0.83 | ) | | | (1.90 | )% | | | 5.00 | | | | 4.43 | % |
Investor B | | | (19.38 | ) | | | (18.12 | ) | | | (21.80 | ) | | | (1.57 | ) | | | (1.97 | ) | | | 4.39 | | | | 4.39 | |
Investor C | | | (19.38 | ) | | | (18.12 | ) | | | (18.94 | ) | | | (1.55 | ) | | | (1.55 | ) | | | 4.24 | | | | 4.24 | |
MSCI World Energy Index | | | (17.67 | ) | | | (16.58 | ) | | | N/A | | | | 2.96 | | | | N/A | | | | 4.59 | | | | N/A | |
| | 4 | | Assuming maximum sales charges, if any. Average annual total returns with and without sales charges reflect reductions for distribution and service fees. See “About Fund Performance” on page 10 for a detailed description of share classes, including any related sales charges and fees. |
| | | | N/A—Not applicable as share class and index do not have a sales charge. |
| | | | Past performance is not indicative of future results. |
| | | | | | | | | | | | | | |
| Expense Example |
| | | Actual | | Hypothetical6 | | |
| | | Beginning
Account Value
October 1, 2014 | | Ending
Account Value
March 31, 2015 | | Expenses Paid
During the Period5 | | Beginning
Account Value
October 1, 2014 | | Ending
Account Value
March 31, 2015 | | Expenses Paid
During the Period5 | | Annualized
Expense Ratio |
Institutional | | $1,000.00 | | $810.90 | | $4.33 | | $1,000.00 | | $1,020.14 | | $4.84 | | 0.96% |
Service | | $1,000.00 | | $809.20 | | $6.22 | | $1,000.00 | | $1,018.05 | | $6.94 | | 1.38% |
Investor A | | $1,000.00 | | $809.60 | | $6.23 | | $1,000.00 | | $1,018.05 | | $6.94 | | 1.38% |
Investor B | | $1,000.00 | | $806.20 | | $9.46 | | $1,000.00 | | $1,014.46 | | $10.55 | | 2.10% |
Investor C | | $1,000.00 | | $806.20 | | $9.46 | | $1,000.00 | | $1,014.46 | | $10.55 | | 2.10% |
| | 5 | | For each class of the Fund, expenses are equal to the annualized expense ratio for the class, multiplied by the average account value over the period, multiplied by 182/365 (to reflect the one-half year period shown). |
| | 6 | | Hypothetical 5% annual return before expenses is calculated by prorating the number of days in the most recent fiscal half year divided by 365. |
| | | | See “Disclosure of Expenses” on page 11 for further information on how expenses were calculated. |
| | | | | | |
| | | BLACKROCK FUNDS | | MARCH 31, 2015 | | 5 |
| | | | |
| Fund Summary as of March 31, 2015 | | | BlackRock Emerging Markets Dividend Fund | |
BlackRock Emerging Markets Dividend Fund’s (the “Fund”) investment objective is primarily to seek investment income and, as a secondary objective, to seek capital appreciation.
|
| Portfolio Management Commentary |
How did the Fund perform?
| Ÿ | | For the six-month period ended March 31, 2015, the Fund underperformed its benchmark, the MSCI Emerging Markets Index. |
What factors influenced performance?
| Ÿ | | Stock selection in China was the largest detractor from performance during the semi-annual period, with the largest negative contribution coming from the Fund’s lack of a position in the internet provider Tencent Holdings Ltd. Stock selection in South Korea also weighed on returns. A lack of exposure to Samsung Co. Ltd., which the Fund does not own due to its low yield, was a notable detractor. The Brazilian industrial stock Marcopolo SA, which suffered as a result of macroeconomic headwinds in Brazil, was the largest detractor among individual stocks. |
| Ÿ | | The most significant contributions to relative performance came from stock selection in Russia, Taiwan and South Africa. The largest individual contributor was the Fund’s lack of exposure to the Brazilian oil & gas stock Petrobras SA, which suffered from an ongoing corruption scandal investigation and the volatility in oil prices. Positions in the Chinese paper products manufacturer Hengan International Group Co. Ltd. and Taiwan Semiconductor Manufacturing Co. Ltd. also contributed positively. |
Describe recent portfolio activity.
| Ÿ | | During the period, the Fund added to its positions in Taiwan, China and Thailand while reducing its weighting in Brazil and deploying cash. At the sector level, the Fund increased its weightings in information technology and financials while reducing its positions in materials and energy. The Fund initiated a position in Industrial & Commercial Bank of China Ltd. and increased its weighting in the Russian food retailer Magnit PJSC. These moves were partially funded by reducing exposure to MMC Norilsk Nickel OJSC, a Russian mining company, and exiting China Petroleum & Chemical Corp. |
Describe portfolio positioning at period end.
| Ÿ | | Divergence in the performance of individual countries continued to be a theme within the emerging markets. However, the moderation of economic growth, policy reforms and interest rate changes became larger drivers of performance across the asset class. The Fund’s investment advisor retained a positive view on the emerging markets, as valuations remained inexpensive relative to both their own history and valuations in the developed markets. |
| Ÿ | | The Fund held overweight positions in Thailand, Mexico and Taiwan at the close of the period, while its largest underweights were in South Korea, China, Malaysia and Brazil. The underweight position in South Korea was a result of the low dividend yields in that market. At the sector level, the Fund was overweight in industrials and financials and underweight in information technology and utilities. |
The views expressed reflect the opinions of BlackRock as of the date of this report and are subject to change based on changes in market, economic or other conditions. These views are not intended to be a forecast of future events and are no guarantee of future results.
| | |
| Ten Largest Holdings | | Percent of
Long-Term Investments |
| | | | |
Taiwan Semiconductor Manufacturing Co. Ltd. - ADR | | | 6 | % |
Industrial & Commercial Bank of China Ltd., H Shares | | | 4 | |
Hengan International Group Co. Ltd. | | | 4 | |
SK Telecom Co. Ltd. | | | 3 | |
Itau Unibanco Holding SA - ADR | | | 3 | |
Powszechny Zaklad Ubezpieczen SA | | | 3 | |
FirstRand Ltd. | | | 3 | |
Grupo Aeroportuario del Pacifico SAB de CV, Class B | | | 3 | |
Sanlam Ltd. | | | 3 | |
China Merchants Holdings International Co. Ltd. | | | 3 | |
| | |
| Geographic Allocation | | Percent of
Long-Term Investments |
| | | | |
Taiwan | | | 19 | % |
China | | | 17 | |
Mexico | | | 12 | |
Thailand | | | 9 | |
South Africa | | | 8 | |
Russia | | | 5 | |
South Korea | | | 5 | |
Brazil | | | 5 | |
Indonesia | | | 3 | |
Poland | | | 3 | |
Other1 | | | 14 | |
| | 1 | | Includes holdings within countries that are 2% or less of long-term investments. Please refer to the Schedule of Investments for such countries. |
| | | | | | |
| 6 | | BLACKROCK FUNDS | | MARCH 31, 2015 | | |
| | | | |
| | | | BlackRock Emerging Markets Dividend Fund | |
|
| Total Return Based on a $10,000 Investment |

| | 1 | Assuming maximum sales charges, if any, transaction costs and other operating expenses, including investment advisory fees and administration fees, if any. Institutional Shares do not have a sales charge. The Fund’s total returns prior to August 16, 2013, are the returns of the Fund when it followed different investment strategies under the name BlackRock China Fund. |
| | 2 | Under normal circumstances, the Fund will invest at least 80% of its net assets (plus any borrowings for investment purposes) in equity securities of, or derivatives having economic characteristics similar to the dividend-paying equity securities of companies domiciled in, or tied economically to, emerging market countries. |
| | 3 | A free float-adjusted market capitalization index that is designed to measure equity market performance of emerging markets. The MSCI Emerging Markets Index consists of the following 23 emerging market country indices: Brazil, Chile, China, Colombia, Czech Republic, Egypt, Greece, Hungary, India, Indonesia, Korea, Malaysia, Mexico, Peru, Philippines, Poland, Qatar, Russia, South Africa, Taiwan, Thailand, Turkey and United Arab Emirates. |
| | 4 | Commencement of operations. |
| | | | | | | | | | | | | | | | | | | | |
| Performance Summary for the Period Ended March 31, 2015 | |
| | | | | | Average Annual Total Returns5 | |
| | | | | | 1 Year | | | Since Inception6 | |
| | | 6-Month Total Returns | | | w/o sales charge | | | w/ sales charge | | | w/o sales charge | | | w/ sales charge | |
Institutional | | | (3.65 | )% | | | (1.99 | )% | | | N/A | | | | (2.76 | )% | | | N/A | |
Investor A | | | (3.80 | ) | | | (2.24 | ) | | | (7.37 | )% | | | (3.01 | ) | | | (4.34 | )% |
Investor C | | | (4.31 | ) | | | (3.04 | ) | | | (3.99 | ) | | | (3.71 | ) | | | (3.71 | ) |
MSCI Emerging Markets Index | | | (2.37 | ) | | | 0.44 | | | | N/A | | | | (2.85 | ) | | | N/A | |
| | 5 | | Assuming maximum sales charges, if any. Average annual total returns with and without sales charges reflect reductions for distribution and service fees. See “About Fund Performance” on page 10 for a detailed description of share classes, including any related sales charges and fees. |
| | 6 | | The Fund commenced operations on April 29, 2011. |
| | | | N/A—Not applicable as share class and index do not have a sales charge. |
| | | | Past performance is not indicative of future results. |
| | | | | | | | | | | | | | |
| Expense Example |
| | | Actual | | Hypothetical8 | | |
| | | Beginning
Account Value
October 1, 2014 | | Ending
Account Value
March 31, 2015 | | Expenses Paid
During the Period7 | | Beginning
Account Value
October 1, 2014 | | Ending
Account Value
March 31, 2015 | | Expenses Paid
During the Period7 | | Annualized
Expense Ratio |
Institutional | | $1,000.00 | | $963.50 | | $7.39 | | $1,000.00 | | $1,017.40 | | $7.59 | | 1.51% |
Investor A | | $1,000.00 | | $962.00 | | $8.61 | | $1,000.00 | | $1,016.16 | | $8.85 | | 1.76% |
Investor C | | $1,000.00 | | $956.90 | | $12.25 | | $1,000.00 | | $1,012.42 | | $12.59 | | 2.51% |
| | 7 | | For each class of the Fund, expenses are equal to the annualized expense ratio for the class, multiplied by the average account value over the period, multiplied by 182/365 (to reflect the one-half year period shown). The fees and expenses of the underlying funds in which the Fund invests are not included in the Fund’s annualized expense ratio. |
| | 8 | | Hypothetical 5% annual return before expenses is calculated by prorating the number of days in the most recent fiscal half year divided by 365. |
| | | | See “Disclosure of Expenses” on page 11 for further information on how expenses were calculated. |
| | | | | | |
| | | BLACKROCK FUNDS | | MARCH 31, 2015 | | 7 |
| | | | |
| Fund Summary as of March 31, 2015 | | | BlackRock Energy & Resources Portfolio | |
BlackRock Energy & Resources Portfolio’s (the “Fund”) investment objective is to provide long-term growth of capital.
|
| Portfolio Management Commentary |
How did the Fund perform?
| Ÿ | | For the six-month period ended March 31, 2015, the Fund’s Institutional, Investor A and Investor C Shares outperformed the MSCI World Small and Mid-Cap Energy Index, while the Investor B Shares performed inline with the benchmark index. |
What factors influenced performance?
| Ÿ | | Well-capitalized exploration and production (E&P) companies with stronger-than-average balance sheets and tier one assets generally outperformed during the period. Carrizo Oil & Gas, Inc. and EOG Resources, Inc., both of which outpaced the broader sector, were prime examples of this trend. The Fund held over-weights in the two stocks, aiding performance. |
| Ÿ | | The Fund’s overweight position in the distribution company Enbridge, Inc. was a notable contributor to relative performance. As a distribution company, its share price was less impacted by the decline in oil prices. The market also reacted favorably to the company’s increase in its quarterly dividend and its announcement of a financial restructuring plan. |
| Ÿ | | The Fund’s overweight position in Canadian Oil Sands Ltd. was the largest detractor during the period. The company has relatively high operational costs, which meant that the stock was especially vulnerable to the drop in oil prices. The market also reacted negatively to the company’s announcement of its 2015 outlook. While Canadian Oil Sands Ltd. indicated that it would generate production growth in 2015, its estimate was below investor expectations. The company also made a substantial cut to its dividend. |
| Ÿ | | An overweight positions in North American E&P companies Encana Corp. and Ithaca Energy, Inc. weighed on relative returns, as the companies’ growth rates |
| | | appeared to be at risk following the drop in oil prices. Encana Corp. came under further pressure after announcing it was raising funds by issuing new equity. |
Describe recent portfolio activity.
| Ÿ | | The Fund initiated a position in Marathon Oil Corp., a high-quality, U.S.-focused oil producer, during the period. This purchase was funded through the sales of two U.S. E&P stocks, Denbury Resources, Inc. and Stone Energy Corp. The Fund also initiated a position in the distribution company Enbridge, Inc. due to its lower sensitivity to oil prices weakness compared to the energy sector as a whole. |
Describe portfolio positioning at period end.
| Ÿ | | The Fund retained a bias toward higher-quality companies, and it maintained an overweight to the E&P industry. The Fund also had significant exposure to U.S. onshore unconventional producers and international E&P companies. The Fund retained a strong focus on assessing valuations, asset bases and companies’ financial flexibility. |
| Ÿ | | Believing lower oil prices will lead to falling profit margins for offshore oil services companies, the Fund’s investment advisor remained cautious with respect to this industry group. In addition, these companies tend to be key beneficiaries of the major integrated companies’ capital expenditures (capex). As a result, the capex cuts that have occurred across the energy sector represent a potential headwind for oil services companies. |
The views expressed reflect the opinions of BlackRock as of the date of this report and are subject to change based on changes in market, economic or other conditions. These views are not intended to be a forecast of future events and are no guarantee of future results.
| | |
| Ten Largest Holdings | | Percent of
Long-Term Investments |
| | | | |
Enbridge, Inc. | | | 7 | % |
Cimarex Energy Co. | | | 6 | |
Cabot Oil & Gas Corp. | | | 5 | |
EQT Corp. | | | 5 | |
AltaGas Ltd. | | | 5 | |
Murphy Oil Corp. | | | 5 | |
Range Resources Corp. | | | 4 | |
Marathon Oil Corp. | | | 4 | |
Carrizo Oil & Gas, Inc. | | | 4 | |
Southwestern Energy Co. | | | 4 | |
| | |
| Industry Allocation | | Percent of
Long-Term Investments |
| | | | |
Oil, Gas & Consumable Fuels | | | 93 | % |
Energy Equipment & Services | | | 7 | |
For Fund compliance purposes, the Fund’s industry classifications refer to any one
or more of the industry sub-classifications used by one or more widely recognized market indexes or ratings group indexes, and/or as defined by the investment advisor. These definitions may not apply for purposes of this report, which may combine such industry sub-classifications for reporting ease.
| | | | | | |
| 8 | | BLACKROCK FUNDS | | MARCH 31, 2015 | | |
| | | | |
| | | | BlackRock Energy & Resources Portfolio | |
|
| Total Return Based on a $10,000 Investment |
| | 1 | Assuming maximum sales charges, if any, transaction costs and other operating expenses, including investment advisory fees and administration fees, if any. Institutional Shares do not have a sales charge. |
| | 2 | Under normal conditions, the Fund invests at least 80% of its total assets in equity securities of global energy and natural resources companies and companies in associated businesses, as well as utilities (such as gas, water, cable, electrical and telecommunications utilities). |
| | 3 | An index comprised of the energy sector constituents of the MSCI World SMID Index, a free float-adjusted market capitalization weighted index designed to measure the equity market performance of the mid and small cap developed market. |
| | | | | | | | | | | | | | | | | | | | | | | | | | | | |
| Performance Summary for the Period Ended March 31, 2015 | |
| | | | | | Average Annual Total Returns4 | |
| | | | | | 1 Year | | | 5 Years | | | 10 Years | |
| | | 6-Month
Total Returns | | | w/o sales
charge | | | w/ sales
charge | | | w/o sales
charge | | | w/ sales
charge | | | w/o sales
charge | | | w/ sales
charge | |
Institutional | | | (28.72 | )% | | | (31.79 | )% | | | N/A | | | | (5.17 | )% | | | N/A | | | | 2.28 | % | | | N/A | |
Investor A | | | (28.82 | ) | | | (31.99 | ) | | | (35.56 | )% | | | (5.48 | ) | | | (6.49 | )% | | | 1.96 | | | | 1.41 | % |
Investor B | | | (29.12 | ) | | | (32.56 | ) | | | (35.59 | ) | | | (6.20 | ) | | | (6.56 | ) | | | 1.35 | | | | 1.35 | |
Investor C | | | (29.07 | ) | | | (32.49 | ) | | | (33.16 | ) | | | (6.18 | ) | | | (6.18 | ) | | | 1.22 | | | | 1.22 | |
MSCI World Small and Mid-Cap Energy Index | | | (29.14 | ) | | | (31.91 | ) | | | N/A | | | | (1.74 | ) | | | N/A | | | | 3.71 | | | | N/A | |
| | 4 | | Assuming maximum sales charges, if any. Average annual total returns with and without sales charges reflect reductions for distribution and service fees. See “About Fund Performance” on page 10 for a detailed description of share classes, including any related sales charges and fees. |
| | | | N/A—Not applicable as share class and index do not have a sales charge. |
| | | | Past performance is not indicative of future results. |
| | | | | | | | | | | | | | |
| Expense Example |
| | | Actual | | Hypothetical6 | | |
| | | Beginning
Account Value
October 1, 2014 | | Ending
Account Value
March 31, 2015 | | Expenses Paid
During the Period5 | | Beginning
Account Value
October 1, 2014 | | Ending
Account Value
March 31, 2015 | | Expenses Paid
During the Period5 | | Annualized
Expense Ratio |
Institutional | | $1,000.00 | | $712.80 | | $4.57 | | $1,000.00 | | $1,019.60 | | $5.39 | | 1.07% |
Investor A | | $1,000.00 | | $711.80 | | $5.89 | | $1,000.00 | | $1,018.05 | | $6.94 | | 1.38% |
Investor B | | $1,000.00 | | $708.80 | | $8.95 | | $1,000.00 | | $1,014.46 | | $10.55 | | 2.10% |
Investor C | | $1,000.00 | | $709.30 | | $8.95 | | $1,000.00 | | $1,014.46 | | $10.55 | | 2.10% |
| | 5 | | For each class of the Fund, expenses are equal to the annualized expense ratio for the class, multiplied by the average account value over the period, multiplied by 182/365 (to reflect the one-half year period shown). The fees and expenses of the underlying funds in which the Fund invests are not included in the Fund’s annualized expense ratio. |
| | 6 | | Hypothetical 5% annual return before expenses is calculated by prorating the number of days in the most recent fiscal half year divided by 365. |
| | | | See “Disclosure of Expenses” on page 11 for further information on how expenses were calculated. |
| | | | | | |
| | | BLACKROCK FUNDS | | MARCH 31, 2015 | | 9 |
| Ÿ | | Institutional Shares are not subject to any sales charge. These shares bear no ongoing distribution or service fees and are available only to certain eligible investors. |
| Ÿ | | Service Shares are not subject to any sales charge. These shares are subject to a service fee of 0.25% per year (but no distribution fee) and are only available to certain eligible investors. |
| Ÿ | | Investor A Shares are subject to a maximum initial sales charge (front-end load) of 5.25% and a service fee of 0.25% per year (but no distribution fee). Certain redemptions of these shares may be subject to a contingent deferred sales charge (“CDSC”) where no initial sales charge was paid at the time of purchase. These shares are generally available through financial intermediaries. |
| Ÿ | | Investor B Shares are subject to a maximum CDSC of 4.50%, declining to 0% after six years. In addition, these shares are subject to a distribution fee of 0.75% per year and a service fee of 0.25% per year. These shares automatically convert to Investor A Shares after approximately eight years. (There is no initial sales charge for automatic share conversions.) All returns for periods greater than eight years reflect this conversion. These shares are only available through exchanges and distribution reinvestments by current holders and for purchase by certain employer-sponsored retirement plans. |
| Ÿ | | Investor C Shares are subject to a 1.00% CDSC if redeemed within one year of purchase. In addition, these shares are subject to a distribution fee of 0.75% per year and a service fee of 0.25% per year. These shares are generally available through financial intermediaries. |
Performance information reflects past performance and does not guarantee future results. Current performance may be lower or higher than the performance data quoted. Refer to www.blackrock.com/funds to obtain performance data current to the most recent month end. Performance results do not reflect the deduction of taxes that a shareholder would pay on Fund distributions or the redemption of Fund shares. Figures shown in the performance tables on the previous pages assume reinvestment of all distributions, if any, at net asset value (“NAV”) on the ex-dividend date. Investment return and principal value of shares will fluctuate so that shares, when redeemed, may be worth more or less than their original cost. Distributions paid to each class of shares will vary because of the different levels of service, distribution and transfer agency fees applicable to each class, which are deducted from the income available to be paid to shareholders.
BlackRock Advisors, LLC (the “Manager”), the Funds’ investment advisor, has contractually agreed to waive and/or reimburse a portion of certain Funds’ expenses. Without such waiver and/or reimbursement, such Funds’ performance would have been lower. The Manager is under no obligation to continue waiving and/or reimbursing its fees after the applicable termination date of such agreement. See Note 5 of the Notes to Financial Statements for additional information on waivers and/or reimbursements.
| | | | | | |
| 10 | | BLACKROCK FUNDS | | MARCH 31, 2015 | | |
Shareholders of the Funds may incur the following charges: (a) transactional expenses, such as sales charges; and (b) operating expenses, including investment advisory fees, administration fees, service and distribution fees, including 12b-1 fees, acquired fund fees and expenses and other Fund expenses. The expense examples on the previous pages (which are based on a hypothetical investment of $1,000 invested on October 1, 2014 and held through March 31, 2015) are intended to assist shareholders both in calculating expenses based on an investment in each Fund and in comparing these expenses with similar costs of investing in other mutual funds.
The expense examples provide information about actual account values and actual expenses. In order to estimate the expenses a shareholder paid during the period covered by this report, shareholders can divide their account value by $1,000 and then multiply the result by the number corresponding to their Fund and share class under the headings entitled “Expenses Paid During the Period.”
The expense examples also provide information about hypothetical account values and hypothetical expenses based on a Fund’s actual expense ratio and an assumed rate of return of 5% per year before expenses. In order to assist shareholders in comparing the ongoing expenses of investing in these Funds and other funds, compare the 5% hypothetical examples with the 5% hypothetical examples that appear in shareholder reports of other funds.
The expenses shown in the expense examples are intended to highlight shareholders’ ongoing costs only and do not reflect any transactional expenses, such as sales charges, if any. Therefore, the hypothetical examples are useful in comparing ongoing expenses only, and will not help shareholders determine the relative total expenses of owning different funds. If these transactional expenses were included, shareholder expenses would have been higher.
| | |
| Derivative Financial Instruments | | |
The Funds may invest in various derivative financial instruments. Derivative financial instruments are used to obtain exposure to a security, index and/or market without owning or taking physical custody of securities or to manage equity, credit, interest rate, foreign currency exchange rate, commodity and/or other risks. Derivative financial instruments may give rise to a form of economic leverage. Derivative financial instruments also involve risks, including the imperfect correlation between the value of a derivative financial instrument and the underlying asset, possible default of the counterparty to the transaction or illiquidity of the derivative financial
instrument. The Funds’ ability to use a derivative financial instrument successfully depends on the investment advisor’s ability to predict pertinent market movements accurately, which cannot be assured. The use of derivative financial instruments may result in losses greater than if they had not been used, may limit the amount of appreciation a Fund can realize on an investment and/or may result in lower distributions paid to shareholders. The Funds’ investments in these instruments are discussed in detail in the Notes to Financial Statements.
| | | | | | |
| | | BLACKROCK FUNDS | | MARCH 31, 2015 | | 11 |
| | | | |
| Schedule of Investments March 31, 2015 (Unaudited) | | | BlackRock All-Cap Energy & Resources Portfolio | |
| | | (Percentages shown are based on Net Assets) | |
| | | | | | | | |
| Common Stocks | | Shares | | | Value | |
Energy Equipment & Services — 7.0% | | | | | | | | |
Halliburton Co. | | | 38,300 | | | $ | 1,680,604 | |
Helmerich & Payne, Inc. | | | 49,000 | | | | 3,335,430 | |
Schlumberger Ltd. | | | 65,641 | | | | 5,477,085 | |
| | | | | | | | |
| | | | | | | | 10,493,119 | |
Oil, Gas & Consumable Fuels — 92.4% | | | | | | | | |
Anadarko Petroleum Corp. | | | 96,100 | | | | 7,958,041 | |
BG Group PLC | | | 116,825 | | | | 1,433,873 | |
BP PLC | | | 1,125,600 | | | | 7,296,290 | |
Cabot Oil & Gas Corp. | | | 130,900 | | | | 3,865,477 | |
Cairn Energy PLC (a) | | | 512,600 | | | | 1,187,670 | |
Canadian Natural Resources Ltd. | | | 50,300 | | | | 1,541,705 | |
Chevron Corp. | | | 109,098 | | | | 11,453,108 | |
Cimarex Energy Co. | | | 29,200 | | | | 3,360,628 | |
ConocoPhillips | | | 156,600 | | | | 9,749,916 | |
Devon Energy Corp. | | | 92,100 | | | | 5,554,551 | |
Enbridge, Inc. | | | 116,900 | | | | 5,634,791 | |
Encana Corp. | | | 404,400 | | | | 4,514,797 | |
EOG Resources, Inc. | | | 59,140 | | | | 5,422,546 | |
Exxon Mobil Corp. | | | 190,900 | | | | 16,226,500 | |
Kosmos Energy Ltd. (a) | | | 173,414 | | | | 1,371,705 | |
Marathon Oil Corp. | | | 222,200 | | | | 5,801,642 | |
Murphy Oil Corp. | | | 45,900 | | | | 2,138,940 | |
Noble Energy, Inc. | | | 81,500 | | | | 3,985,350 | |
| | | | | | | | |
| Common Stocks | | Shares | | | Value | |
Oil, Gas & Consumable Fuels (concluded) | | | | | | | | |
Oil Search Ltd. | | | 520,787 | | | $ | 2,841,519 | |
Phillips 66 | | | 55,500 | | | | 4,362,300 | |
Pioneer Natural Resources Co. | | | 37,600 | | | | 6,147,976 | |
Range Resources Corp. | | | 60,000 | | | | 3,122,400 | |
Royal Dutch Shell PLC, A Shares — ADR | | | 184,542 | | | | 11,007,930 | |
Southwestern Energy Co. (a) | | | 138,700 | | | | 3,216,453 | |
Statoil ASA | | | 151,612 | | | | 2,680,714 | |
TOTAL SA | | | 141,700 | | | | 7,043,456 | |
| | | | | | | | |
| | | | | | | | 138,920,278 | |
Total Long-Term Investments (Cost — $154,561,727) — 99.4% | | | | | | | 149,413,397 | |
| | | | | | | | |
| Short-Term Securities | | | | | | |
BlackRock Liquidity Funds, TempFund, Institutional Class, 0.06% (b)(c) | | | 1,312,983 | | | | 1,312,983 | |
Total Short-Term Securities (Cost — $1,312,983) — 0.9% | | | | | | | 1,312,983 | |
Total Investments (Cost — $155,874,710) — 100.3% | | | | | | | 150,726,380 | |
Liabilities in Excess of Other Assets — (0.3)% | | | | | | | (515,247 | ) |
| | | | | | | | |
Net Assets — 100.0% | | | | | | $ | 150,211,133 | |
| | | | | | | | |
|
| Notes to Schedule of Investments |
| (a) | Non-income producing security. |
| (b) | During the six months ended March 31, 2015, investments in issuers considered to be an affiliate of the Fund for purposes of Section 2(a)(3) of the Investment Company Act of 1940, as amended, were as follows: |
| | | | | | | | | | | | | | | | |
| Affiliate | | Shares/
Beneficial
Interest
Held at
September 30,
2014 | | | Net Activity | | | Shares/
Beneficial
Interest
Held at
March 31,
2015 | | | Income | |
BlackRock Liquidity Funds, TempFund, Institutional Class | | | 3,666,592 | | | | (2,353,609 | ) | | | 1,312,983 | | | $ | 1,483 | |
BlackRock Liquidity Series, LLC, Money Market Series | | | — | | | | — | | | | — | | | $ | 41 | |
| (c) | Represents the current yield as of report date. |
| | | | | | | | | | |
| Portfolio Abbreviations |
| ADR | | American Depositary Receipts | | NVDR | | Non-Voting Depository Receipts | | ZAR | | South African Rand |
| GDR | | Global Depositary Receipts | | USD | | U.S. Dollar | | | | |
See Notes to Financial Statements.
| | | | | | |
| 12 | | BLACKROCK FUNDS | | MARCH 31, 2015 | | |
| | | | |
| Schedule of Investments (concluded) | | | BlackRock All-Cap Energy & Resources Portfolio | |
| Ÿ | | For Fund compliance purposes, the Fund’s industry classifications refer to any one or more of the industry sub-classifications used by one or more widely recognized market indexes or ratings group indexes, and/or as defined by the investment advisor. These definitions may not apply for purposes of this report, which may combine such industry sub-classifications for reporting ease. |
| Ÿ | | Fair Value Measurements — Various inputs are used in determining the fair value of investments. These inputs to valuation techniques are categorized into a disclosure hierarchy consisting of three broad levels for financial statement purposes. The hierarchy gives the highest priority to unadjusted quoted prices in active markets for identical assets or liabilities (Level 1 measurements) and the lowest priority to unobservable inputs (Level 3 measurements). Accordingly, the degree of judgment exercised in determining fair value is greatest for instruments categorized in Level 3. The inputs used to measure fair value may fall into different levels of the fair value hierarchy. In such cases, for disclosure purposes, the fair value hierarchy classification is determined based on the lowest level input that is significant to the fair value measurement in its entirety. The categorization of a value determined for investments is based on the pricing transparency of the investment and is not necessarily an indication of the risks associated with investing in those securities. The three levels of the fair value hierarchy are as follows: |
| | Ÿ | | Level 1 — unadjusted quoted prices in active markets/exchanges for identical assets or liabilities that the Fund has the ability to access |
| | Ÿ | | Level 2 — other observable inputs (including, but not limited to, quoted prices for similar assets or liabilities in markets that are active, quoted prices for identical or similar assets or liabilities in markets that are not active, inputs other than quoted prices that are observable for the assets or liabilities (such as interest rates, yield curves, volatilities, prepayment speeds, loss severities, credit risks and default rates) or other market–corroborated inputs) |
| | Ÿ | | Level 3 — unobservable inputs based on the best information available in the circumstances, to the extent observable inputs are not available (including the Fund’s own assumptions used in determining the fair value of investments) |
Changes in valuation techniques may result in transfers into or out of an assigned level within the disclosure hierarchy. In accordance with the Fund’s policy, transfers between different levels of the fair value disclosure hierarchy are deemed to have occurred as of the beginning of the reporting period. For information about the Fund’s policy regarding valuation of investments, refer to Note 2 of the Notes to Financial Statements.
As of March 31, 2015, the following table summarizes the Fund’s investments categorized in the disclosure hierarchy:
| | | | | | | | | | | | | | |
| | | Level 1 | | | Level 2 | | | Level 3 | | Total | |
Assets: | | | | | | | | | | | | | | |
Investments: | | | | | | | | | | | | | | |
Long-Term Investments: | | | | | | | | | | | | | | |
Common Stocks: | | | | | | | | | | | | | | |
Energy Equipment & Services | | $ | 10,493,119 | | | | — | | | — | | $ | 10,493,119 | |
Oil, Gas & Consumable Fuels | | | 116,436,756 | | | $ | 22,483,522 | | | — | | | 138,920,278 | |
Short-Term Securities | | | 1,312,983 | | | | — | | | — | | | 1,312,983 | |
| | | | |
Total | | $ | 128,242,858 | | | $ | 22,483,522 | | | — | | $ | 150,726,380 | |
| | | | |
The Fund may hold assets and/or liabilities in which the fair value approximates the carrying amount for financial statement purposes. As of March 31, 2015, foreign currency at value of $24,324 is categorized as Level 1 within the disclosure hierarchy.
During the six months ended March 31, 2015, there were no transfers between levels.
See Notes to Financial Statements.
| | | | | | |
| | | BLACKROCK FUNDS | | MARCH 31, 2015 | | 13 |
| | | | |
| Schedule of Investments March 31, 2015 (Unaudited) | | | BlackRock Emerging Markets Dividend Fund | |
| | | (Percentages shown are based on Net Assets) | |
| | | | | | | | |
| Common Stocks | | Shares | | | Value | |
Brazil — 4.7% | | | | | | | | |
BB Seguridade Participacoes SA | | | 5,020 | | | $ | 51,450 | |
Itau Unibanco Holding SA — ADR | | | 11,983 | | | | 132,532 | |
Marcopolo SA, Preference | | | 29,175 | | | | 21,116 | |
| | | | | | | | |
| | | | | | | | 205,098 | |
Cambodia — 0.7% | | | | | | | | |
NagaCorp Ltd. | | | 48,000 | | | | 31,870 | |
Chile — 2.0% | | | | | | | | |
Banco de Chile — ADR | | | 1,301 | | | | 87,245 | |
China — 16.5% | | | | | | | | |
Beijing Capital International Airport Co. Ltd., H Shares | | | 66,000 | | | | 64,452 | |
China Hongqiao Group Ltd. | | | 40,500 | | | | 24,261 | |
China Merchants Holdings International Co. Ltd. | | | 28,432 | | | | 111,419 | |
China Mobile Ltd. | | | 3,500 | | | | 45,613 | |
Hengan International Group Co. Ltd. | | | 13,000 | | | | 156,479 | |
Industrial & Commercial Bank of China Ltd., H Shares | | | 218,000 | | | | 161,251 | |
Jiangsu Expressway Co. Ltd., H Shares | | | 56,000 | | | | 75,198 | |
Want Want China Holdings Ltd. | | | 78,000 | | | | 83,005 | |
| | | | | | | | |
| | | | | | | | 721,678 | |
Czech Republic — 1.1% | | | | | | | | |
Komercni Banka AS | | | 224 | | | | 48,316 | |
Greece — 0.5% | | | | | | | | |
OPAP SA | | | 2,589 | | | | 24,165 | |
Hong Kong — 0.9% | | | | | | | | |
Chow Tai Fook Jewellery Group Ltd. | | | 17,600 | | | | 18,977 | |
Sands China Ltd. | | | 5,200 | | | | 21,503 | |
| | | | | | | | |
| | | | | | | | 40,480 | |
India — 2.3% | | | | | | | | |
Infosys Ltd. — ADR | | | 2,932 | | | | 102,855 | |
Indonesia — 3.5% | | | | | | | | |
Bank Central Asia Tbk PT | | | 63,301 | | | | 71,742 | |
Bank Mandiri Persero Tbk PT | | | 40,666 | | | | 38,782 | |
Media Nusantara Citra Tbk PT | | | 186,524 | | | | 40,832 | |
| | | | | | | | |
| | | | | | | | 151,356 | |
Kazakhstan — 0.3% | | | | | | | | |
KCell JSC — GDR | | | 1,523 | | | | 14,240 | |
Mexico — 11.4% | | | | | | | | |
Bolsa Mexicana de Valores SAB de CV | | | 34,189 | | | | 58,276 | |
Fibra Uno Administracion SA de CV | | | 16,418 | | | | 43,484 | |
Fomento Economico Mexicano SAB de CV — ADR (a) | | | 666 | | | | 62,271 | |
Grupo Aeroportuario del Pacifico SAB de CV, Class B | | | 18,101 | | | | 118,941 | |
Grupo Aeroportuario del Sureste SAB de CV — ADR (a) | | | 699 | | | | 93,960 | |
Kimberly-Clark de Mexico SAB de CV, Class A | | | 27,619 | | | | 57,706 | |
Mexico Real Estate Management SA de CV | | | 41,142 | | | | 64,814 | |
| | | | | | | | |
| | | | | | | | 499,452 | |
Peru — 1.6% | | | | | | | | |
Credicorp Ltd. | | | 497 | | | | 69,893 | |
| | | | | | | | |
| Common Stocks | | Shares | | | Value | |
Philippines — 1.5% | | | | | | | | |
Alliance Global Group, Inc. | | | 113,000 | | | $ | 66,845 | |
Poland — 3.4% | | | | | | | | |
Powszechna Kasa Oszczednosci Bank Polski SA | | | 2,944 | | | | 26,350 | |
Powszechny Zaklad Ubezpieczen SA | | | 964 | | | | 124,382 | |
| | | | | | | | |
| | | | | | | | 150,732 | |
Russia — 5.4% | | | | | | | | |
Lukoil OAO — ADR | | | 2,396 | | | | 110,983 | |
Magnit PJSC — GDR | | | 1,566 | | | | 79,944 | |
MMC Norilsk Nickel OJSC — ADR | | | 2,574 | | | | 45,727 | |
| | | | | | | | |
| | | | | | | | 236,654 | |
South Africa — 8.3% | | | | | | | | |
FirstRand Ltd. | | | 26,670 | | | | 122,603 | |
Mr. Price Group Ltd. | | | 2,517 | | | | 53,834 | |
Sanlam Ltd. | | | 18,110 | | | | 116,715 | |
Truworths International Ltd. | | | 9,508 | | | | 69,015 | |
| | | | | | | | |
| | | | | | | | 362,167 | |
South Korea — 3.8% | | | | | | | | |
SK Telecom Co. Ltd. | | | 568 | | | | 139,766 | |
SK Telecom Co. Ltd. — ADR | | | 929 | | | | 25,278 | |
| | | | | | | | |
| | | | | | | | 165,044 | |
Taiwan — 19.1% | | | | | | | | |
Chipbond Technology Corp. | | | 37,000 | | | | 77,995 | |
Delta Electronics, Inc. | | | 8,000 | | | | 50,412 | |
Eclat Textile Co. Ltd. | | | 2,000 | | | | 26,208 | |
Far EasTone Telecommunications Co. Ltd. | | | 39,000 | | | | 94,085 | |
Himax Technologies, Inc. — ADR | | | 2,853 | | | | 18,059 | |
Lite-On Technology Corp. | | | 28,000 | | | | 36,221 | |
Makalot Industrial Co. Ltd. | | | 4,000 | | | | 28,713 | |
MediaTek, Inc. | | | 3,000 | | | | 40,517 | |
Quanta Computer, Inc. | | | 21,000 | | | | 50,687 | |
Taiwan Semiconductor Manufacturing Co. Ltd. | | | 9,000 | | | | 41,828 | |
Taiwan Semiconductor Manufacturing Co. Ltd. — ADR | | | 10,311 | | | | 242,102 | |
Tripod Technology Corp. | | | 20,000 | | | | 40,226 | |
Yageo Corp. | | | 42,902 | | | | 88,400 | |
| | | | | | | | |
| | | | | | | | 835,453 | |
Thailand — 8.8% | | | | | | | | |
Advanced Info Service PCL — NVDR | | | 7,900 | | | | 57,412 | |
Bangkok Expressway PCL — NVDR | | | 14,500 | | | | 17,362 | |
BEC World PCL — NVDR | | | 33,200 | | | | 41,819 | |
Kasikornbank PCL — NVDR | | | 15,700 | | | | 110,394 | |
PTT PCL — NVDR | | | 4,500 | | | | 44,639 | |
Siam City Cement PCL — NVDR | | | 2,284 | | | | 26,796 | |
The Siam Commercial Bank PCL — NVDR | | | 11,700 | | | | 63,989 | |
Thai Oil PCL — NVDR | | | 13,800 | | | | 22,026 | |
| | | | | | | | |
| | | | | | | | 384,437 | |
Turkey — 0.6% | | | | | | | | |
Tupras Turkiye Petrol Rafinerileri AS | | | 1,198 | | | | 28,383 | |
See Notes to Financial Statements.
| | | | | | |
| 14 | | BLACKROCK FUNDS | | MARCH 31, 2015 | | |
| | | | |
| Schedule of Investments (continued) | | | BlackRock Emerging Markets Dividend Fund | |
| | | (Percentages shown are based on Net Assets) | |
| | | | | | | | |
| Common Stocks | | Shares | | | Value | |
United Arab Emirates — 1.3% | | | | | | | | |
Dragon Oil PLC | | | 6,228 | | | $ | 54,941 | |
Total Common Stocks — 97.7% | | | | | | | 4,281,304 | |
| | | | | | | | |
| Participation Notes (a) | | | | | | |
South Korea — 1.3% | | | | | | | | |
Deutsche Bank AG (Hyundai Motor & Finance Co.), due 8/12/23 | | | 2,530 | | | | 56,554 | |
Total Long-Term Investments (Cost — $4,215,044) — 99.0% | | | | | | | 4,337,858 | |
| | | | | | | | |
| Short-Term Securities | | Shares | | | Value | |
BlackRock Liquidity Funds, TempFund,
Institutional Class, 0.06% (b)(c) | | | 52,359 | | | $ | 52,359 | |
Total Short-Term Securities (Cost — $52,359) — 1.2% | | | | | | | 52,359 | |
Total Investments (Cost — $4,267,403) — 100.2% | | | | | | | 4,390,217 | |
Liabilities in Excess of Other Assets — (0.2)% | | | | | | | (6,788 | ) |
| | | | | | | | |
Net Assets — 100.0% | | | | | | $ | 4,383,429 | |
| | | | | | | | |
|
| Notes to Schedule of Investments |
| (a) | Non-income producing security. |
| (b) | During the six months ended March 31, 2015, investments in issuers considered to be an affiliate of the Fund for purposes of Section 2(a)(3) of the Investment Company Act of 1940, as amended, were as follows: |
| | | | | | | | | | | | | | | | |
| Affiliate | | Shares/ Beneficial
Interest Held at
September 30, 2014 | | | Net
Activity | | | Shares/ Beneficial
Interest Held at
March 31, 2015 | | | Income | |
BlackRock Liquidity Funds, TempFund, Institutional Class | | | 147,277 | | | | (94,918 | ) | | | 52,359 | | | $ | 24 | |
BlackRock Liquidity Series, LLC, Money Market Series | | | — | | | | — | | | | — | | | $ | 90 | |
| (c) | Represents the current yield as of report date. |
| Ÿ | | As of March 31, 2015, forward foreign currency exchange contracts outstanding were as follows: |
| | | | | | | | | | | | | | | | | | | | | | |
Currency
Purchased | | | Currency
Sold | | | Counterparty | | Settlement
Date | | | Unrealized
Appreciation
(Depreciation) | |
| USD | | | 69,139 | | | | ZAR | | | | 802,351 | | | Deutsche Bank AG | | | 4/22/15 | | | $ | 3,241 | |
| ZAR | | | 802,351 | | | | USD | | | | 69,065 | | | BNP Paribas S.A. | | | 4/22/15 | | | | (3,167 | ) |
| Total | | | | | | | | | | | | | | | | | | | | $ | 74 | |
| | | | | | | | | | | | | | | | | | | | | | |
| Ÿ | | Fair Value Measurements — Various inputs are used in determining the fair value of investments and derivative financial instruments. These inputs to valuation techniques are categorized into a disclosure hierarchy consisting of three broad levels for financial statement purposes. The hierarchy gives the highest priority to unadjusted quoted prices in active markets for identical assets or liabilities (Level 1 measurements) and the lowest priority to unobservable inputs (Level 3 measurements). Accordingly, the degree of judgment exercised in determining fair value is greatest for instruments categorized in Level 3. The inputs used to measure fair value may fall into different levels of the fair value hierarchy. In such cases, for disclosure purposes, the fair value hierarchy classification is determined based on the lowest level input that is significant to the fair value measurement in its entirety. The categorization of a value determined for investments and derivative financial instruments is based on the pricing transparency of the investment and derivative financial instruments and is not necessarily an indication of the risks associated with investing in those securities. The three levels of the fair value hierarchy are as follows: |
| | Ÿ | | Level 1 — unadjusted quoted prices in active markets/exchanges for identical assets or liabilities that the Fund has the ability to access |
| | Ÿ | | Level 2 — other observable inputs (including, but not limited to, quoted prices for similar assets or liabilities in markets that are active, quoted prices for identical or similar assets or liabilities in markets that are not active, inputs other than quoted prices that are observable for the assets or liabilities (such as interest rates, yield curves, volatilities, prepayment speeds, loss severities, credit risks and default rates) or other market–corroborated inputs) |
| | Ÿ | | Level 3 — unobservable inputs based on the best information available in the circumstances, to the extent observable inputs are not available (including the Fund’s own assumptions used in determining the fair value of investments and derivative financial instruments) |
Changes in valuation techniques may result in transfers into or out of an assigned level within the disclosure hierarchy. In accordance with the Fund’s policy, transfers between different levels of the fair value disclosure hierarchy are deemed to have occurred as of the beginning of the reporting period. For information about the Fund’s policy regarding valuation of investments and derivative financial instruments, refer to Note 2 of the Notes to Financial Statements.
See Notes to Financial Statements.
| | | | | | |
| | | BLACKROCK FUNDS | | MARCH 31, 2015 | | 15 |
| | | | |
| Schedule of Investments (continued) | | | BlackRock Emerging Markets Dividend Fund | |
As of March 31, 2015, the following tables summarize the Fund’s investments and derivative financial instruments categorized in the disclosure hierarchy:
| | | | | | | | | | | | | | | | | | | | |
| | | Level 1 | | Level 2 | | Level 3 | | Total |
Assets: | | | | | | | | | | | | | | | | | | | | |
Investments: | | | | | | | | | | | | | | | | | | | | |
Long-Term Investments: | | | | | | | | | | | | | | | | | | | | |
Common Stocks: | | | | | | | | | | | | | | | | | | | | |
Brazil | | | $ | 205,098 | | | | | — | | | | | — | | | | $ | 205,098 | |
Cambodia | | | | — | | | | $ | 31,870 | | | | | — | | | | | 31,870 | |
Chile | | | | 87,245 | | | | | — | | | | | — | | | | | 87,245 | |
China | | | | — | | | | | 721,678 | | | | | — | | | | | 721,678 | |
Czech Republic | | | | — | | | | | 48,316 | | | | | — | | | | | 48,316 | |
Greece | | | | — | | | | | 24,165 | | | | | — | | | | | 24,165 | |
Hong Kong | | | | — | | | | | 40,480 | | | | | — | | | | | 40,480 | |
India | | | | 102,855 | | | | | — | | | | | — | | | | | 102,855 | |
Indonesia | | | | — | | | | | 151,356 | | | | | — | | | | | 151,356 | |
Kazakhstan | | | | 14,240 | | | | | — | | | | | — | | | | | 14,240 | |
Mexico | | | | 499,452 | | | | | — | | | | | — | | | | | 499,452 | |
Peru | | | | 69,893 | | | | | — | | | | | — | | | | | 69,893 | |
Philippines | | | | — | | | | | 66,845 | | | | | — | | | | | 66,845 | |
Poland | | | | — | | | | | 150,732 | | | | | — | | | | | 150,732 | |
Russia | | | | 236,654 | | | | | — | | | | | — | | | | | 236,654 | |
South Africa | | | | — | | | | | 362,167 | | | | | — | | | | | 362,167 | |
South Korea | | | | 25,278 | | | | | 139,766 | | | | | — | | | | | 165,044 | |
Taiwan | | | | 260,161 | | | | | 575,292 | | | | | — | | | | | 835,453 | |
Thailand | | | | — | | | | | 384,437 | | | | | — | | | | | 384,437 | |
Turkey | | | | — | | | | | 28,383 | | | | | — | | | | | 28,383 | |
United Arab Emirates | | | | — | | | | | 54,941 | | | | | — | | | | | 54,941 | |
Participation Notes: | | | | | | | | | | | | | | | | | | | | |
South Korea | | | | — | | | | | 56,554 | | | | | — | | | | | 56,554 | |
Short-Term Securities | | | | 52,359 | | | | | — | | | | | — | | | | | 52,359 | |
| | | | | |
Total | | | $ | 1,553,235 | | | | $ | 2,836,982 | | | | | — | | | | $ | 4,390,217 | |
| | | | | |
| | | | | | | | | | | | | | | | | | | | |
| | | Level 1 | | Level 2 | | Level 3 | | Total |
Derivative Financial Instruments1 | | | | | | | | | | | | | | | | | | | | |
Assets: | | | | | | | | | | | | | | | | | | | | |
Forward foreign currency exchange contracts | | | | — | | | | | $3,241 | | | | | — | | | | $ | 3,241 | |
Liabilities: | | | | | | | | | | | | | | | | | | | | |
Forward foreign currency exchange contracts | | | | — | | | | | (3,167) | | | | | — | | | | | (3,167 | ) |
| | | | | |
Total | | | | — | | | | | $74 | | | | | — | | | | $ | 74 | |
| | | | | |
1 Derivative financial instruments are forward foreign currency exchange contracts, which are valued at the unrealized appreciation/depreciation on the instrument. | |
|
| The Fund may hold assets and/or liabilities in which the fair value approximates the carrying amount for financial statement purposes. As of March 31, 2015, such assets are categorized within the disclosure hierarchy as follows: | |
| | | | | | | | | | | | | | | | | | | | |
| | | Level 1 | | Level 2 | | Level 3 | | Total |
Assets: | | | | | | | | | | | | | | | | | | | | |
Cash | | | $ | 12,988 | | | | | — | | | | | — | | | | $ | 12,988 | |
Foreign currency at value | | | | 6,045 | | | | | — | | | | | — | | | | | 6,045 | |
| | | | | |
Total | | | $ | 19,033 | | | | | — | | | | | — | | | | $ | 19,033 | |
| | | | | |
See Notes to Financial Statements.
| | | | | | |
| 16 | | BLACKROCK FUNDS | | MARCH 31, 2015 | | |
| | | | |
| Schedule of Investments (concluded) | | | BlackRock Emerging Markets Dividend Fund | |
Transfers between Level 1 and Level 2 were as follows:
| | | | | | | | | | | | | | | | |
| | | Transfers into
Level 1 | | | Transfers out
of Level 11 | | | Transfers into
Level 21 | | | Transfers out
of Level 2 | |
Assets: | | | | | | | | | | | | | | | | |
Long-Term Investments: | | | | | | | | | | | | | | | | |
Thailand | | | — | | | $ | (50,794 | ) | | $ | 50,794 | | | | — | |
1 External pricing service used to reflect any significant market movements between the time the Fund valued such foreign securities and the earlier closing of foreign markets. | |
See Notes to Financial Statements.
| | | | | | |
| | | BLACKROCK FUNDS | | MARCH 31, 2015 | | 17 |
| | | | |
| Schedule of Investments March 31, 2015 (Unaudited) | | | BlackRock Energy & Resources Portfolio | |
| | | (Percentages shown are based on Net Assets) | |
| | | | | | | | |
| Common Stocks | | Shares | | | Value | |
Commercial Services & Supplies — 0.0% | | | | | | | | |
Republic Resources, Inc. (Acquired 7/18/97 to 2/24/99, cost $779,869) (a)(b) | | | 28,750 | | | | — | |
Energy Equipment & Services — 6.8% | | | | | | | | |
Cameron International Corp. (b) | | | 181,200 | | | $ | 8,175,744 | |
Helmerich & Payne, Inc. | | | 180,500 | | | | 12,286,635 | |
Poseidon Concepts Corp. (b) | | | 35,081 | | | | 14 | |
Superior Energy Services, Inc. | | | 330,357 | | | | 7,380,175 | |
| | | | | | | | |
| | | | | | | | 27,842,568 | |
Oil, Gas & Consumable Fuels — 93.4% | | | | | | | | |
AltaGas Ltd. | | | 618,100 | | | | 20,623,668 | |
Cabot Oil & Gas Corp. | | | 763,700 | | | | 22,552,061 | |
Cairn Energy PLC (b) | | | 4,115,600 | | | | 9,535,652 | |
Canadian Oil Sands Ltd. | | | 758,000 | | | | 5,894,990 | |
Carrizo Oil & Gas, Inc. (b) | | | 349,800 | | | | 17,367,570 | |
Cimarex Energy Co. | | | 197,510 | | | | 22,731,426 | |
Concho Resources, Inc. (b) | | | 38,100 | | | | 4,416,552 | |
CONSOL Energy, Inc. | | | 443,600 | | | | 12,372,004 | |
Enbridge, Inc. | | | 561,000 | | | | 27,041,214 | |
Encana Corp. | | | 1,341,000 | | | | 14,971,174 | |
EOG Resources, Inc. | | | 174,800 | | | | 16,027,412 | |
EQT Corp. | | | 265,744 | | | | 22,022,205 | |
Genel Energy PLC (b) | | | 366,200 | | | | 2,550,245 | |
Gulfport Energy Corp. (b) | | | 220,835 | | | | 10,138,535 | |
Ithaca Energy, Inc. (b) | | | 4,702,200 | | | | 2,376,067 | |
Kosmos Energy Ltd. (b) | | | 1,398,788 | | | | 11,064,413 | |
Laredo Petroleum, Inc. (b) | | | 682,200 | | | | 8,895,888 | |
Longview Energy Co. (Acquired 8/13/04, cost $1,281,000) (a)(b) | | | 85,400 | | | | 150,304 | |
Marathon Oil Corp. | | | 674,500 | | | | 17,611,195 | |
Murphy Oil Corp. | | | 419,900 | | | | 19,567,340 | |
Noble Energy, Inc. | | | 218,600 | | | | 10,689,540 | |
Oil Search Ltd. | | | 3,041,800 | | | | 16,596,678 | |
Painted Pony Petroleum Ltd. (b) | | | 635,900 | | | | 2,972,270 | |
| | | | | | | | |
| Common Stocks | | Shares | | | Value | |
Oil, Gas & Consumable Fuels (concluded) | | | | | | | | |
Pioneer Natural Resources Co. | | | 99,937 | | | $ | 16,340,699 | |
Range Resources Corp. | | | 346,940 | | | | 18,054,758 | |
Rosetta Resources, Inc. (b) | | | 452,600 | | | | 7,703,252 | |
RSP Permian, Inc. (b) | | | 303,342 | | | | 7,641,185 | |
SM Energy Co. | | | 248,900 | | | | 12,863,152 | |
Southwestern Energy Co. (b) | | | 744,600 | | | | 17,267,274 | |
TransGlobe Energy Corp. | | | 817,600 | | | | 2,911,355 | |
| | | | | | | | |
| | | | | | | | 380,950,078 | |
Total Common Stocks — 100.2% | | | | | | | 408,792,646 | |
| | | | | | | | |
| Warrants (c) | | | | | | |
Oil, Gas & Consumable Fuels — 0.0% | | | | | | | | |
Magnum Hunter Resources Corp. (Issued/Exercisable 10/15/13, 1 Share for 1 Warrant, Expires 4/15/16, Strike Price $8.50) | | | 235,700 | | | | 2 | |
Total Warrants — 0.0% | | | | | | | 2 | |
Total Long-Term Investments (Cost — $448,055,319) — 100.2% | | | | 408,792,648 | |
| | | | | | | | |
| Short-Term Securities | | | | | | |
BlackRock Liquidity Funds, TempFund, Institutional Class, 0.06% (d)(e) | | | 577,947 | | | | 577,947 | |
Total Short-Term Securities (Cost — $577,947) — 0.2% | | | | 577,947 | |
Total Investments (Cost — $448,633,266) — 100.4% | | | | 409,370,595 | |
Liabilities in Excess of Other Assets — (0.4)% | | | | (1,447,517 | ) |
| | | | | | | | |
Net Assets — 100.0% | | | | | | $ | 407,923,078 | |
| | | | | | | | |
|
| Notes to Schedule of Investments |
| (a) | Restricted security as to resale. As of report date, the Fund held restricted securities with a current value of $150,304 and an original cost of $2,060,869, which was less than 0.01% of its net assets. |
| (b) | Non-income producing security. |
| (c) | Warrants entitle the Fund to purchase a predetermined number of shares of common stock and are non-income producing. The purchase price and number of shares are subject to adjustment under certain conditions until the expiration date of the warrants, if any. |
| (d) | During the six months ended March 31, 2015, investments in issuers considered to be an affiliate of the Fund for purposes of Section 2(a)(3) of the Investment Company Act of 1940, as amended, were as follows: |
| | | | | | | | | | | | | | | | | | | | |
| Affiliate | | Shares Held at
September 30, 2014 | | | Net Activity | | | Shares Held at
March 31, 2015 | | | Income | | | Realized
Gain | |
BlackRock Liquidity Funds, TempFund, Institutional Class | | | 9,547,958 | | | | (8,970,011 | ) | | | 577,947 | | | $ | 3,011 | | | $ | 1,503 | |
| (e) | Represents the current yield as of report date. |
See Notes to Financial Statements.
| | | | | | |
| 18 | | BLACKROCK FUNDS | | MARCH 31, 2015 | | |
| | | | |
| Schedule of Investments (concluded) | | | BlackRock Energy & Resources Portfolio | |
| Ÿ | | For Fund compliance purposes, the Fund’s industry classifications refer to any one or more of the industry sub-classifications used by one or more widely recognized market indexes or ratings group indexes, and/or as defined by the investment advisor. These definitions may not apply for purposes of this report, which may combine such industry sub-classifications for reporting ease. |
| Ÿ | | Fair Value Measurements — Various inputs are used in determining the fair value of investments. These inputs to valuation techniques are categorized into a disclosure hierarchy consisting of three broad levels for financial statement purposes. The hierarchy gives the highest priority to unadjusted quoted prices in active markets for identical assets or liabilities (Level 1 measurements) and the lowest priority to unobservable inputs (Level 3 measurements). Accordingly, the degree of judgment exercised in determining fair value is greatest for instruments categorized in Level 3. The inputs used to measure fair value may fall into different levels of the fair value hierarchy. In such cases, for disclosure purposes, the fair value hierarchy classification is determined based on the lowest level input that is significant to the fair value measurement in its entirety. The categorization of a value determined for investments is based on the pricing transparency of the investment and is not necessarily an indication of the risks associated with investing in those securities. The three levels of the fair value hierarchy are as follows: |
| | Ÿ | | Level 1 — unadjusted quoted prices in active markets/exchanges for identical assets or liabilities that the Fund has the ability to access |
| | Ÿ | | Level 2 — other observable inputs (including, but not limited to, quoted prices for similar assets or liabilities in markets that are active, quoted prices for identical or similar assets or liabilities in markets that are not active, inputs other than quoted prices that are observable for the assets or liabilities (such as interest rates, yield curves, volatilities, prepayment speeds, loss severities, credit risks and default rates) or other market–corroborated inputs) |
| | Ÿ | | Level 3 — unobservable inputs based on the best information available in the circumstances, to the extent observable inputs are not available (including the Fund’s own assumptions used in determining the fair value of investments) |
Changes in valuation techniques may result in transfers into or out of an assigned level within the disclosure hierarchy. In accordance with the Fund’s policy, transfers between different levels of the fair value disclosure hierarchy are deemed to have occurred as of the beginning of the reporting period. For information about the Fund’s policy regarding valuation of investments, refer to Note 2 of the Notes to Financial Statements.
As of March 31, 2015, the following table summarizes the Fund’s investments categorized in the disclosure hierarchy:
| | | | | | | | | | | | | | | | |
| | | Level 1 | | | Level 2 | | | Level 3 | | | Total | |
Assets: | | | | | | | | | | | | | | | | |
Investments: | | | | | | | | | | | | | | | | |
Long-Term Investments: | | | | | | | | | | | | | | | | |
Common Stocks: | | | | | | | | | | | | | | | | |
Energy Equipment & Services | | $ | 27,842,554 | | | $ | 14 | | | | — | | | $ | 27,842,568 | |
Oil, Gas & Consumable Fuels | | | 352,117,199 | | | | 28,682,575 | | | $ | 150,304 | | | | 380,950,078 | |
Warrants | | | — | | | | 2 | | | | — | | | | 2 | |
Short-Term Securities | | | 577,947 | | | | — | | | | — | | | | 577,947 | |
| | | | |
Total | | $ | 380,537,700 | | | $ | 28,682,591 | | | $ | 150,304 | | | $ | 409,370,595 | |
| | | | |
The Fund may hold assets and/or liabilities in which the fair value approximates the carrying amount for financial statement purposes. As of March 31, 2015, foreign currency at value of $80,671 is categorized as Level 1 within the disclosure hierarchy.
During the six months ended March 31, 2015, there were no transfers between levels.
See Notes to Financial Statements.
| | | | | | |
| | | BLACKROCK FUNDS | | MARCH 31, 2015 | | 19 |
| | |
| Statements of Assets and Liabilities | | |
| | | | | | | | | | | | |
| March 31, 2015 (Unaudited) | | BlackRock
All-Cap Energy &
Resources
Portfolio | | | BlackRock
Emerging
Markets
Dividend
Fund | | | BlackRock
Energy &
Resources
Portfolio | |
| | | | | | | | | | | | |
| Assets | | | | | | | | | | | | |
Investments at value — unaffiliated1 | | $ | 149,413,397 | | | $ | 4,337,858 | | | $ | 408,792,648 | |
Investments at value — affiliated2 | | | 1,312,983 | | | | 52,359 | | | | 577,947 | |
Cash | | | — | | | | 12,988 | | | | — | |
Foreign currency at value3 | | | 24,324 | | | | 6,045 | | | | 80,671 | |
Investments sold receivable | | | — | | | | 35,521 | | | | — | |
Unrealized appreciation on forward foreign currency exchange contracts | | | — | | | | 3,241 | | | | — | |
Capital shares sold receivable | | | 273,353 | | | | 11,968 | | | | 513,972 | |
Dividends receivable — unaffiliated | | | 98,951 | | | | 13,197 | | | | 366,796 | |
Receivable from Manager | | | 17,841 | | | | 13,989 | | | | 14,306 | |
Dividends receivable — affiliated | | | 123 | | | | 1 | | | | 245 | |
Securities lending income receivable — affiliated | | | 41 | | | | 79 | | | | — | |
Prepaid expenses | | | 52,588 | | | | 34,408 | | | | 43,060 | |
| | | | |
Total assets | | | 151,193,601 | | | | 4,521,654 | | | | 410,389,645 | |
| | | | |
| | | | | | | | | | | | |
| Liabilities | | | | | | | | | | | | |
Investments purchased payable | | | — | | | | 7,121 | | | | — | |
Unrealized depreciation on forward foreign currency exchange contracts | | | — | | | | 3,167 | | | | — | |
Capital shares redeemed payable | | | 604,990 | | | | 24,296 | | | | 1,625,373 | |
Transfer agent fees payable | | | 137,478 | | | | 1,509 | | | | 339,081 | |
Investment advisory fees payable | | | 96,103 | | | | — | | | | 262,107 | |
Service and distribution fees payable | | | 57,445 | | | | 639 | | | | 100,267 | |
Professional fees payable | | | 40,318 | | | | 64,779 | | | | 40,006 | |
Other affiliates payable | | | 6,445 | | | | 10 | | | | 34,089 | |
Pricing fees payable | | | 5,802 | | | | 22,438 | | | | 6,920 | |
Officer’s and Trustees’ fees payable | | | 2,611 | | | | 767 | | | | 5,885 | |
Other accrued expenses payable | | | 31,276 | | | | 13,499 | | | | 52,839 | |
| | | | |
Total liabilities | | | 982,468 | | | | 138,225 | | | | 2,466,567 | |
| | | | |
Net Assets | | $ | 150,211,133 | | | $ | 4,383,429 | | | $ | 407,923,078 | |
| | | | |
| | | | | | | | | | | | |
| Net Assets Consist of | | | | | | | | | | | | |
Paid-in capital | | $ | 207,169,550 | | | $ | 5,126,786 | | | $ | 560,534,804 | |
Undistributed (distributions in excess of) net investment income (loss) | | | 849,177 | | | | (19,557 | ) | | | (2,390,690 | ) |
Accumulated net realized loss | | | (52,656,018 | ) | | | (846,323 | ) | | | (110,953,068 | ) |
Net unrealized appreciation/depreciation | | | (5,151,576 | ) | | | 122,523 | | | | (39,267,968 | ) |
| | | | |
Net Assets | | $ | 150,211,133 | | | $ | 4,383,429 | | | $ | 407,923,078 | |
| | | | |
1 Investments at cost — unaffiliated | | $ | 154,561,727 | | | $ | 4,215,044 | | | $ | 448,055,319 | |
2 Investments at cost — affiliated | | $ | 1,312,983 | | | $ | 52,359 | | | $ | 577,947 | |
3 Foreign currency at cost | | $ | 24,321 | | | $ | 6,050 | | | $ | 80,664 | |
See Notes to Financial Statements.
| | | | | | |
| 20 | | BLACKROCK FUNDS | | MARCH 31, 2015 | | |
| | |
| Statements of Assets and Liabilities (concluded) | | |
| | | | | | | | | | | | |
| March 31, 2015 (Unaudited) | | BlackRock
All-Cap Energy
& Resources
Portfolio | | | BlackRock
Emerging
Markets
Dividend
Fund | | | BlackRock
Energy &
Resources
Portfolio | |
| | | | | | | | | | | | |
| Net Asset Value | | | | | | | | | | | | |
Institutional | | | | | | | | | | | | |
Net assets | | $ | 30,878,629 | | | $ | 2,702,577 | | | $ | 119,420,591 | |
| | | | |
Shares outstanding1 | | | 2,384,903 | | | | 326,164 | | | | 4,421,314 | |
| | | | |
Net asset value | | $ | 12.95 | | | $ | 8.29 | | | $ | 27.01 | |
| | | | |
Service | | | | | | | | | | | | |
Net assets | | $ | 1,369,112 | | | | — | | | | — | |
| | | | |
Shares outstanding1 | | | 108,367 | | | | — | | | | — | |
| | | | |
Net asset value | | $ | 12.63 | | | | — | | | | — | |
| | | | |
Investor A | | | | | | | | | | | | |
Net assets | | $ | 69,389,743 | | | $ | 1,290,234 | | | $ | 230,249,697 | |
| | | | |
Shares outstanding1 | | | 5,502,499 | | | | 156,394 | | | | 9,866,359 | |
| | | | |
Net asset value | | $ | 12.61 | | | $ | 8.25 | | | $ | 23.34 | |
| | | | |
Investor B | | | | | | | | | | | | |
Net assets | | $ | 2,439,670 | | | | — | | | $ | 1,792,617 | |
| | | | |
Shares outstanding1 | | | 202,915 | | | | — | | | | 106,424 | |
| | | | |
Net asset value | | $ | 12.02 | | | | — | | | $ | 16.84 | |
| | | | |
Investor C | | | | | | | | | | | | |
Net assets | | $ | 46,133,979 | | | $ | 390,618 | | | $ | 56,460,173 | |
| | | | |
Shares outstanding1 | | | 3,843,504 | | | | 47,728 | | | | 3,379,768 | |
| | | | |
Net asset value | | $ | 12.00 | | | $ | 8.18 | | | $ | 16.71 | |
| | | | |
| | 1 | | Unlimited number of shares authorized, $ 0.001 par value. |
See Notes to Financial Statements.
| | | | | | |
| | | BLACKROCK FUNDS | | MARCH 31, 2015 | | 21 |
| | | | | | | | | | | | |
| Six Months Ended March 31, 2015 (Unaudited) | | BlackRock All-Cap Energy
& Resources
Portfolio | | | BlackRock
Emerging
Markets
Dividend
Fund | | | BlackRock
Energy &
Resources
Portfolio | |
| | | | | | | | | | | | |
| Investment Income | | | | | | | | | | | | |
Dividends — unaffiliated | | $ | 2,256,833 | | | $ | 51,945 | | | $ | 2,904,105 | |
Dividends — affiliated | | | 1,483 | | | | 24 | | | | 3,011 | |
Other income — affiliated | | | — | | | | 42 | | | | — | |
Securities lending — affiliated — net | | | 41 | | | | 90 | | | | — | |
Foreign taxes withheld | | | (152,513 | ) | | | (5,458 | ) | | | (238,617 | ) |
| | | | |
Total income | | | 2,105,844 | | | | 46,643 | | | | 2,668,499 | |
| | | | |
| | | | | | | | | | | | |
| Expenses | | | | | | | | | | | | |
Investment advisory | | | 613,814 | | | | 24,559 | | | | 1,632,497 | |
Service and distribution — class specific | | | 366,872 | | | | 4,500 | | | | 644,826 | |
Transfer agent — class specific | | | 181,778 | | | | 2,530 | | | | 537,731 | |
Administration | | | 49,035 | | | | 1,466 | | | | 129,984 | |
Professional | | | 34,611 | | | | 54,638 | | | | 39,376 | |
Registration | | | 29,908 | | | | 18,116 | | | | 30,076 | |
Administration — class specific | | | 18,573 | | | | 557 | | | | 49,334 | |
Accounting services | | | 12,826 | | | | 3,556 | | | | 28,877 | |
Printing | | | 9,516 | | | | 5,711 | | | | 18,191 | |
Custodian | | | 7,759 | | | | 8,255 | | | | 15,587 | |
Officer and Trustees | | | 4,743 | | | | 2,109 | | | | 9,530 | |
Pricing | | | 2,678 | | | | 10,356 | | | | 3,194 | |
Miscellaneous | | | 6,985 | | | | 3,475 | | | | 8,945 | |
Recoupment of past waived and/or reimbursed fees — class specific | | | — | | | | — | | | | 2,465 | |
| | | | |
Total expenses | | | 1,339,098 | | | | 139,828 | | | | 3,150,613 | |
Less fees waived by the Manager | | | (1,551 | ) | | | (24,594 | ) | | | (4,680 | ) |
Less administration fees waived | | | — | | | | (1,466 | ) | | | — | |
Less administration fees waived — class specific | | | (18,537 | ) | | | (550 | ) | | | (37,055 | ) |
Less transfer agent fees waived — class specific | | | (11,490 | ) | | | (151 | ) | | | (14,666 | ) |
Less transfer agent fees reimbursed — class specific | | | (51,466 | ) | | | (2,295 | ) | | | (33,754 | ) |
Less expenses reimbursed by the Manager | | | — | | | | (69,114 | ) | | | — | |
| | | | |
Total expenses after fees waived and/or reimbursed | | | 1,256,054 | | | | 41,658 | | | | 3,060,458 | |
| | | | |
Net investment income (loss) | | | 849,790 | | | | 4,985 | | | | (391,959 | ) |
| | | | |
| | | | | | | | | | | | |
| Realized and Unrealized Gain (Loss) | | | | | | | | | | | | |
Net realized gain (loss) from: | | | | | | | | | | | | |
Investments | | | (1,500,310 | ) | | | (185,452 | ) | | | (22,944,267 | ) |
Capital gain distributions received from affiliated investment companies | | | — | | | | — | | | | 1,503 | |
Foreign currency transactions | | | (48,882 | ) | | | 5,861 | | | | (99,770 | ) |
| | | | |
| | | (1,549,192 | ) | | | (179,591 | ) | | | (23,042,534 | ) |
| | | | |
Net change in unrealized appreciation/depreciation on: | | | | | | | | | | | | |
Investments | | | (36,453,414 | ) | | | (10,088 | ) | | | (139,468,681 | ) |
Foreign currency translations | | | (892 | ) | | | (13,217 | ) | | | (2,233 | ) |
| | | | |
| | | (36,454,306 | ) | | | (23,305 | ) | | | (139,470,914 | ) |
| | | | |
Net realized and unrealized loss | | | (38,003,498 | ) | | | (202,896 | ) | | | (162,513,448 | ) |
| | | | |
Net Decrease in Net Assets Resulting from Operations | | $ | (37,153,708 | ) | | $ | (197,911 | ) | | $ | (162,905,407 | ) |
| | | | |
See Notes to Financial Statements.
| | | | | | |
| 22 | | BLACKROCK FUNDS | | MARCH 31, 2015 | | |
| | |
| Statements of Changes in Net Assets | | |
| | | | | | | | | | | | | | | | | | | | | | | | |
| | | BlackRock
All-Cap Energy &
Resources
Portfolio | | | BlackRock
Emerging
Markets
Dividend
Fund | | | BlackRock
Energy &
Resources
Portfolio | |
| Increase (Decrease) in Net Assets: | | Six Months Ended March 31, 2015 (Unaudited) | | | Year Ended
September 30,
2014 | | | Six Months
Ended
March 31, 2015
(Unaudited) | | | Year Ended
September 30,
2014 | | | Six Months Ended March 31, 2015 (Unaudited) | | | Year Ended
September 30,
2014 | |
| | | | | | | | | | | | | | | | | | | | | | | | |
| Operations | | | | | | | | | | | | | | | | | | | | | | | | |
Net investment income (loss) | | $ | 849,790 | | | $ | 1,182,643 | | | $ | 4,985 | | | $ | 111,342 | | | $ | (391,959 | ) | | $ | (4,840,727 | ) |
Net realized gain (loss) | | | (1,549,192 | ) | | | 49,403,376 | | | | (179,591 | ) | | | (126,900 | ) | | | (23,042,534 | ) | | | 114,806,534 | |
Net change in unrealized appreciation/depreciation | | | (36,454,306 | ) | | | (36,681,534 | ) | | | (23,305 | ) | | | 34,469 | | | | (139,470,914 | ) | | | (101,325,236 | ) |
| | | | | | | | | | | | |
Net increase (decrease) in net assets resulting from operations | | | (37,153,708 | ) | | | 13,904,485 | | | | (197,911 | ) | | | 18,911 | | | | (162,905,407 | ) | | | 8,640,571 | |
| | | | | | | | | | | | |
| | | | | | | | | | | | | | | | | | | | | | | | |
| Distributions to Shareholders From1 | | | | | | | | | | | | | | | | | | | | | | | | |
Net investment income: | | | | | | | | | | | | | | | | | | | | | | | | |
Institutional | | | (552,322 | ) | | | (243,720 | ) | | | (44,898 | ) | | | (84,952 | ) | | | — | | | | — | |
Service | | | (18,439 | ) | | | (7,889 | ) | | | — | | | | — | | | | — | | | | — | |
Investor A | | | (877,257 | ) | | | (428,293 | ) | | | (28,189 | ) | | | (44,272 | ) | | | — | | | | — | |
Investor C | | | (179,698 | ) | | | — | | | | (5,914 | ) | | | (7,777 | ) | | | — | | | | — | |
| | | | | | | | | | | | |
Decrease in net assets resulting from distributions to shareholders | | | (1,627,716 | ) | | | (679,902 | ) | | | (79,001 | ) | | | (137,001 | ) | | | — | | | | — | |
| | | | | | | | | | | | |
| | | | | | | | | | | | | | | | | | | | | | | | |
| Capital Share Transactions | | | | | | | | | | | | | | | | | | | | | | | | |
Net increase (decrease) in net assets derived from capital share transactions | | | (8,610,591 | ) | | | (36,929,775 | ) | | | (500,506 | ) | | | 1,020,647 | | | | 37,097,918 | | | | (113,778,135 | ) |
| | | | | | | | | | | | |
| | | | | | | | | | | | | | | | | | | | | | | | |
| Net Assets | | | | | | | | | | | | | | | | | | | | | | | | |
Total increase (decrease) in net assets | | | (47,392,015 | ) | | | (23,705,192 | ) | | | (777,418 | ) | | | 902,557 | | | | (125,807,489 | ) | | | (105,137,564 | ) |
Beginning of period | | | 197,603,148 | | | | 221,308,340 | | | | 5,160,847 | | | | 4,258,290 | | | | 533,730,567 | | | | 638,868,131 | |
| | | | | | | | | | | | |
End of period | | $ | 150,211,133 | | | $ | 197,603,148 | | | $ | 4,383,429 | | | $ | 5,160,847 | | | $ | 407,923,078 | | | $ | 533,730,567 | |
| | | | | | | | | | | | |
Undistributed (distributions in excess of) net investment income (loss), end of period | | $ | 849,177 | | | $ | 1,627,103 | | | $ | (19,557 | ) | | $ | 54,459 | | | $ | (2,390,690 | ) | | $ | (1,998,731 | ) |
| | | | | | | | | | | | |
| | 1 | | Distributions for annual periods determined in accordance with federal income tax regulations. |
See Notes to Financial Statements.
| | | | | | |
| | | BLACKROCK FUNDS | | MARCH 31, 2015 | | 23 |
| | | | |
| Financial Highlights | | | BlackRock All-Cap Energy & Resources Portfolio | |
| | | | | | | | | | | | | | | | | | | | | | | | |
| | | Institutional | |
| | | Six Months
Ended
March 31,
2015
(Unaudited) | | | Year Ended September 30, | |
| | | | 2014 | | | 2013 | | | 2012 | | | 2011 | | | 2010 | |
| Per Share Operating Performance | | | | | | | | | | | | | | | | | | | | | | | | |
Net asset value, beginning of period | | $ | 16.26 | | | $ | 15.28 | | | $ | 13.51 | | | $ | 12.14 | | | $ | 13.76 | | | $ | 12.46 | |
| | | | |
Net investment income1 | | | 0.11 | | | | 0.19 | | | | 0.06 | | | | 0.05 | | | | 0.01 | | | | 0.02 | |
Net realized and unrealized gain (loss) | | | (3.18 | ) | | | 0.90 | | | | 1.71 | | | | 1.32 | | | | (1.51 | )2 | | | 1.382 | |
| | | | |
Net increase (decrease) from investment operations | | | (3.07 | ) | | | 1.09 | | | | 1.77 | | | | 1.37 | | | | (1.50 | ) | | | 1.40 | |
| | | | |
Distributions from net investment income3 | | | (0.24 | ) | | | (0.11 | ) | | | (0.00 | )4 | | | — | | | | (0.12 | ) | | | (0.10 | ) |
| | | | |
Net asset value, end of period | | $ | 12.95 | | | $ | 16.26 | | | $ | 15.28 | | | $ | 13.51 | | | $ | 12.14 | | | $ | 13.76 | |
| | | | |
| | | | | | | | | | | | | | | | | | | | | | | | |
| Total Return5 | | | | | | | | | | | | | | | | | | | | | | | | |
Based on net asset value | | | (18.91 | )%6 | | | 7.16 | % | | | 13.13 | % | | | 11.29 | % | | | (11.10 | )%7 | | | 11.32 | %7 |
| | | | |
| | | | | | | | | | | | | | | | | | | | | | | | |
| Ratios to Average Net Assets | | | | | | | | | | | | | | | | | | | | | | | | |
Total expenses | | | 1.10 | %8 | | | 1.00 | %9 | | | 0.98 | %9 | | | 0.95 | % | | | 0.93 | %9 | | | 0.94 | %9 |
| | | | |
Total expenses after fees waived and/or reimbursed and paid indirectly | | | 0.96 | %8 | | | 0.96 | % | | | 0.96 | % | | | 0.94 | % | | | 0.93 | % | | | 0.93 | % |
| | | | |
Net investment income | | | 1.64 | %8 | | | 1.15 | % | | | 0.49 | % | | | 0.34 | % | | | 0.03 | % | | | 0.16 | % |
| | | | |
| | | | | | | | | | | | | | | | | | | | | | | | |
| Supplemental Data | | | | | | | | | | | | | | | | | | | | | | | | |
Net assets, end of period (000) | | $ | 30,879 | | | $ | 36,865 | | | $ | 35,726 | | | $ | 272,779 | | | $ | 400,269 | | | $ | 420,071 | |
| | | | |
Portfolio turnover rate | | | 23 | % | | | 71 | % | | | 28 | % | | | 19 | % | | | 22 | % | | | 38 | % |
| | | | |
| | 1 | | Based on average shares outstanding. |
| | 2 | | Includes redemption fees, which are less than $0.005 per share. |
| | 3 | | Distributions for annual periods determined in accordance with federal income tax regulations. |
| | 4 | | Amount is greater than $(0.005) per share. |
| | 5 | | Where applicable, assumes the reinvestment of distributions. |
| | 6 | | Aggregate total return. |
| | 7 | | Redemption fee of 2.00% is reflected in total return calculations. There was no impact to the return. |
| | 9 | | Includes recoupment of past waived and/or reimbursed fees. Excluding the recoupment of past waived and/or reimbursed fees for the years ended September 30, 2011 and September 30, 2010, the ratio would have been 0.91% and 0.93%, respectively. There was no financial impact to the expense ratios for the years ended September 30, 2014 and September 30, 2013. |
See Notes to Financial Statements.
| | | | | | |
| 24 | | BLACKROCK FUNDS | | MARCH 31, 2015 | | |
| | | | |
| Financial Highlights (continued) | | | BlackRock All-Cap Energy & Resources Portfolio | |
| | | | | | | | | | | | | | | | | | | | | | | | |
| | | Service | |
| | | Six Months
Ended
March 31,
2015
(Unaudited) | | | Year Ended September 30, | |
| | | | 2014 | | | 2013 | | | 2012 | | | 2011 | | | 2010 | |
| Per Share Operating Performance | | | | | | | | | | | | | | | | | | | | | | | | |
Net asset value, beginning of period | | $ | 15.81 | | | $ | 14.87 | | | $ | 13.20 | | | $ | 11.90 | | | $ | 13.49 | | | $ | 12.24 | |
| | | | |
Net investment income (loss)1 | | | 0.08 | | | | 0.12 | | | | 0.02 | | | | 0.00 | 2 | | | (0.05 | ) | | | (0.03 | ) |
Net realized and unrealized gain (loss) | | | (3.09 | ) | | | 0.88 | | | | 1.65 | | | | 1.30 | | | | (1.47 | )3 | | | 1.35 | 3 |
| | | | |
Net increase (decrease) from investment operations | | | (3.01 | ) | | | 1.00 | | | | 1.67 | | | | 1.30 | | | | (1.52 | ) | | | 1.32 | |
| | | | |
Distributions from net investment income4 | | | (0.17 | ) | | | (0.06 | ) | | | — | | | | — | | | | (0.07 | ) | | | (0.07 | ) |
| | | | |
Net asset value, end of period | | $ | 12.63 | | | $ | 15.81 | | | $ | 14.87 | | | $ | 13.20 | | | $ | 11.90 | | | $ | 13.49 | |
| | | | |
| | | | | | | | | | | | | | | | | | | | | | | | |
| Total Return5 | | | | | | | | | | | | | | | | | | | | | | | | |
Based on net asset value | | | (19.08 | )%6 | | | 6.72 | % | | | 12.65 | % | | | 10.93 | % | | | (11.36 | )%7 | | | 10.79 | %7 |
| | | | |
| | | | | | | | | | | | | | | | | | | | | | | | |
| Ratios to Average Net Assets | | | | | | | | | | | | | | | | | | | | | | | | |
Total expenses | | | 1.42 | %8 | | | 1.35 | %9 | | | 1.34 | %9 | | | 1.29 | %9 | | | 1.27 | %9 | | | 1.34 | %9 |
| | | | |
Total expenses after fees waived and/or reimbursed and paid indirectly | | | 1.38 | %8 | | | 1.34 | % | | | 1.33 | % | | | 1.29 | % | | | 1.26 | % | | | 1.34 | % |
| | | | |
Net investment income (loss) | | | 1.18 | %8 | | | 0.77 | % | | | 0.17 | % | | | 0.00 | % | | | (0.30 | )% | | | (0.25 | )% |
| | | | |
| | | | | | | | | | | | | | | | | | | | | | | | |
| Supplemental Data | | | | | | | | | | | | | | | | | | | | | | | | |
Net assets, end of period (000) | | $ | 1,369 | | | $ | 2,046 | | | $ | 2,298 | | | $ | 3,828 | | | $ | 4,816 | | | $ | 4,231 | |
| | | | |
Portfolio turnover rate | | | 23 | % | | | 71 | % | | | 28 | % | | | 19 | % | | | 22 | % | | | 38 | % |
| | | | |
| | 1 | | Based on average shares outstanding. |
| | 2 | | Amount is less than $0.005 per share. |
| | 3 | | Includes redemption fees, which are less than $0.005 per share. |
| | 4 | | Distributions for annual periods determined in accordance with federal income tax regulations. |
| | 5 | | Where applicable, assumes the reinvestment of distributions. |
| | 6 | | Aggregate total return. |
| | 7 | | Redemption fee of 2.00% is reflected in total return calculations. There was no impact to the return. |
| | 9 | | Includes recoupment of past waived and/or reimbursed fees. Excluding the recoupment of past waived and/or reimbursed fees for the years ended September 30, 2011 and September 30, 2010, the ratio would have been 1.24% and 1.27%, respectively. There was no financial impact to the expense ratios for the years ended September 30, 2014, September 30, 2013 and September 30, 2012. |
See Notes to Financial Statements.
| | | | | | |
| | | BLACKROCK FUNDS | | MARCH 31, 2015 | | 25 |
| | | | |
| Financial Highlights (continued) | | | BlackRock All-Cap Energy & Resources Portfolio | |
| | | | | | | | | | | | | | | | | | | | | | | | |
| | | Investor A | |
| | | Six Months
Ended
March 31,
2015
(Unaudited) | | | Year Ended September 30, | |
| | | | 2014 | | | 2013 | | | 2012 | | | 2011 | | | 2010 | |
| Per Share Operating Performance | | | | | | | | | | | | | | | | | | | | | | | | |
Net asset value, beginning of period | | $ | 15.77 | | | $ | 14.85 | | | $ | 13.19 | | | $ | 11.90 | | | $ | 13.50 | | | $ | 12.24 | |
| | | | |
Net investment income (loss)1 | | | 0.08 | | | | 0.12 | | | | 0.02 | | | | (0.01 | ) | | | (0.06 | ) | | | (0.03 | ) |
Net realized and unrealized gain (loss) | | | (3.08 | ) | | | 0.86 | | | | 1.64 | | | | 1.30 | | | | (1.47 | )2 | | | 1.35 | 2 |
| | | | |
Net increase (decrease) from investment operations | | | (3.00 | ) | | | 0.98 | | | | 1.66 | | | | 1.29 | | | | (1.53 | ) | | | 1.32 | |
| | | | |
Distributions from net investment income3 | | | (0.16 | ) | | | (0.06 | ) | | | — | | | | — | | | | (0.07 | ) | | | (0.06 | ) |
| | | | |
Net asset value, end of period | | $ | 12.61 | | | $ | 15.77 | | | $ | 14.85 | | | $ | 13.19 | | | $ | 11.90 | | | $ | 13.50 | |
| | | | |
| | | | | | | | | | | | | | | | | | | | | | | | |
| Total Return4 | | | | | | | | | | | | | | | | | | | | | | | | |
Based on net asset value | | | (19.04 | )%5 | | | 6.65 | % | | | 12.59 | % | | | 10.84 | % | | | (11.46 | )%6 | | | 10.84 | %6 |
| | | | |
| | | | | | | | | | | | | | | | | | | | | | | | |
| Ratios to Average Net Assets | | | | | | | | | | | | | | | | | | | | | | | | |
Total expenses | | | 1.48 | %7 | | | 1.40 | %8 | | | 1.39 | %8 | | | 1.35 | %8 | | | 1.35 | %8 | | | 1.34 | %8 |
| | | | |
Total expenses after fees waived and/or reimbursed and paid indirectly | | | 1.38 | %7 | | | 1.38 | % | | | 1.37 | % | | | 1.34 | % | | | 1.34 | % | | | 1.34 | % |
| | | | |
Net investment income (loss) | | | 1.18 | %7 | | | 0.73 | % | | | 0.12 | % | | | (0.09 | )% | | | (0.38 | )% | | | (0.25 | )% |
| | | | |
| | | | | | | | | | | | | | | | | | | | | | | | |
| Supplemental Data | | | | | | | | | | | | | | | | | | | | | | | | |
Net assets, end of period (000) | | $ | 69,390 | | | $ | 91,625 | | | $ | 103,388 | | | $ | 137,765 | | | $ | 187,017 | | | $ | 207,523 | |
| | | | |
Portfolio turnover rate | | | 23 | % | | | 71 | % | | | 28 | % | | | 19 | % | | | 22 | % | | | 38 | % |
| | | | |
| | 1 | | Based on average shares outstanding. |
| | 2 | | Includes redemption fees, which are less than $0.005 per share. |
| | 3 | | Distributions for annual periods determined in accordance with federal income tax regulations. |
| | 4 | | Where applicable, excludes the effects of any sales charges and assumes the reinvestment of distributions. |
| | 5 | | Aggregate total return. |
| | 6 | | Redemption fee of 2.00% is reflected in total return calculations. There was no impact to the return. |
| | 8 | | Includes recoupment of past waived and/or reimbursed fees. Excluding the recoupment of past waived and/or reimbursed fees for the years ended September 30, 2014, September 30, 2013, September 30, 2011 and September 30, 2010, the ratio would have been 1.38%, 1.37%, 1.28%, and 1.32%, respectively. There was no financial impact to the expense ratios for the year ended September 30, 2012. |
See Notes to Financial Statements.
| | | | | | |
| 26 | | BLACKROCK FUNDS | | MARCH 31, 2015 | | |
| | | | |
| Financial Highlights (continued) | | | BlackRock All-Cap Energy & Resources Portfolio | |
| | | | | | | | | | | | | | | | | | | | | | | | |
| | | Investor B | |
| | | Six Months
Ended
March 31,
2015
(Unaudited) | | | Year Ended September 30, | |
| | | | 2014 | | | 2013 | | | 2012 | | | 2011 | | | 2010 | |
| Per Share Operating Performance | | | | | | | | | | | | | | | | | | | | | | | | |
Net asset value, beginning of period | | $ | 14.91 | | | $ | 14.08 | | | $ | 12.59 | | | $ | 11.45 | | | $ | 13.03 | | | $ | 11.84 | |
| | | | |
Net investment income (loss)1 | | | 0.03 | | | | (0.00 | )2 | | | (0.08 | ) | | | (0.11 | ) | | | (0.18 | ) | | | (0.13 | ) |
Net realized and unrealized gain (loss) | | | (2.92 | ) | | | 0.83 | | | | 1.57 | | | | 1.25 | | | | (1.40 | )3 | | | 1.32 | 3 |
| | | | |
Net increase (decrease) from investment operations | | | (2.89 | ) | | | 0.83 | | | | 1.49 | | | | 1.14 | | | | (1.58 | ) | | | 1.19 | |
| | | | |
Net asset value, end of period | | $ | 12.02 | | | $ | 14.91 | | | $ | 14.08 | | | $ | 12.59 | | | $ | 11.45 | | | $ | 13.03 | |
| | | | |
| | | | | | | | | | | | | | | | | | | | | | | | |
| Total Return4 | | | | | | | | | | | | | | | | | | | | | | | | |
Based on net asset value | | | (19.38 | )%5 | | | 5.90 | % | | | 11.84 | % | | | 9.96 | % | | | (12.13 | )%6 | | | 10.05 | %6 |
| | | | |
| | | | | | | | | | | | | | | | | | | | | | | | |
| Ratios to Average Net Assets | | | | | | | | | | | | | | | | | | | | | | | | |
Total expenses | | | 2.56 | %7 | | | 2.34 | %8 | | | 2.28 | %8 | | | 2.20 | %8 | | | 2.11 | %8 | | | 2.17 | %8 |
| | | | |
Total expenses after fees waived and/or reimbursed and paid indirectly | | | 2.10 | %7 | | | 2.10 | % | | | 2.10 | % | | | 2.10 | % | | | 2.10 | % | | | 2.10 | % |
| | | | |
Net investment income (loss) | | | 0.47 | %7 | | | (0.02 | )% | | | (0.60 | )% | | | (0.83 | )% | | | (1.15 | )% | | | (1.03 | )% |
| | | | |
| | | | | | | | | | | | | | | | | | | | | | | | |
| Supplemental Data | | | | | | | | | | | | | | | | | | | | | | | | |
Net assets, end of period (000) | | $ | 2,440 | | | $ | 3,935 | | | $ | 9,802 | | | $ | 15,162 | | | $ | 18,872 | | | $ | 27,113 | |
| | | | |
Portfolio turnover rate | | | 23 | % | | | 71 | % | | | 28 | % | | | 19 | % | | | 22 | % | | | 38 | % |
| | | | |
| | 1 | | Based on average shares outstanding. |
| | 2 | | Amount is greater than $(0.005) per share. |
| | 3 | | Includes redemption fees, which are less than $0.005 per share. |
| | 4 | | Where applicable, excludes the effects of any sales charges and assumes the reinvestment of distributions. |
| | 5 | | Aggregate total return. |
| | 6 | | Redemption fee of 2.00% is reflected in total return calculations. There was no impact to the return. |
| | 8 | | Includes recoupment of past waived and/or reimbursed fees. Excluding the recoupment of past waived and/or reimbursed fees for the years ended September 30, 2014, September 30, 2012, September 30, 2011 and September 30, 2010, the ratio would have been 2.33%, 2.19%, 2.09%, and 2.16%, respectively. There was no financial impact to the expense ratios for the year ended September 30, 2013. |
See Notes to Financial Statements.
| | | | | | |
| | | BLACKROCK FUNDS | | MARCH 31, 2015 | | 27 |
| | | | |
| Financial Highlights (concluded) | | | BlackRock All-Cap Energy & Resources Portfolio | |
| | | | | | | | | | | | | | | | | | | | | | | | |
| | | Investor C | |
| | | Six Months
Ended
March 31,
2015
(Unaudited) | | | Year Ended September 30, | |
| | | | 2014 | | | 2013 | | | 2012 | | | 2011 | | | 2010 | |
| Per Share Operating Performance | | | | | | | | | | | | | | | | | | | | | | | | |
Net asset value, beginning of period | | $ | 14.94 | | | $ | 14.10 | | | $ | 12.62 | | | $ | 11.47 | | | $ | 13.04 | | | $ | 11.85 | |
| | | | |
Net investment income (loss)1 | | | 0.03 | | | | 0.00 | 2 | | | (0.07 | ) | | | (0.10 | ) | | | (0.17 | ) | | | (0.13 | ) |
Net realized and unrealized gain (loss) | | | (2.92 | ) | | | 0.84 | | | | 1.55 | | | | 1.25 | | | | (1.40 | )3 | | | 1.323 | |
| | | | |
Net increase (decrease) from investment operations | | | (2.89 | ) | | | 0.84 | | | | 1.48 | | | | 1.15 | | | | (1.57 | ) | | | 1.19 | |
| | | | |
Distributions from net investment income4 | | | (0.05 | ) | | | — | | | | — | | | | — | | | | — | | | | — | |
| | | | |
Net asset value, end of period | | $ | 12.00 | | | $ | 14.94 | | | $ | 14.10 | | | $ | 12.62 | | | $ | 11.47 | | | $ | 13.04 | |
| | | | |
| | | | | | | | | | | | | | | | | | | | | | | | |
| Total Return5 | | | | | | | | | | | | | | | | | | | | | | | | |
Based on net asset value | | | (19.38 | )%6 | | | 5.96 | % | | | 11.73 | % | | | 10.03 | % | | | (12.04 | )%7 | | | 10.04 | %7 |
| | | | |
| | | | | | | | | | | | | | | | | | | | | | | | |
| Ratios to Average Net Assets | | | | | | | | | | | | | | | | | | | | | | | | |
Total expenses | | | 2.17 | %8 | | | 2.12 | %9 | | | 2.12 | %9 | | | 2.08 | % | | | 2.05 | %9 | | | 2.08 | % |
| | | | |
Total expenses after fees waived and/or reimbursed and paid indirectly | | | 2.10 | %8 | | | 2.10 | % | | | 2.09 | % | | | 2.07 | % | | | 2.04 | % | | | 2.08 | % |
| | | | |
Net investment income (loss) | | | 0.47 | %8 | | | 0.00 | % | | | (0.59 | )% | | | (0.79 | )% | | | (1.08 | )% | | | (1.00 | )% |
| | | | |
| | | | | | | | | | | | | | | | | | | | | | | | |
| Supplemental Data | | | | | | | | | | | | | | | | | | | | | | | | |
Net assets, end of period (000) | | $ | 46,134 | | | $ | 63,133 | | | $ | 70,094 | | | $ | 85,649 | | | $ | 99,433 | | | $ | 116,401 | |
| | | | |
Portfolio turnover rate | | | 23 | % | | | 71 | % | | | 28 | % | | | 19 | % | | | 22 | % | | | 38 | % |
| | | | |
| | 1 | | Based on average shares outstanding. |
| | 2 | | Amount is less than $0.005 per share. |
| | 3 | | Includes redemption fees, which are less than $0.005 per share. |
| | 4 | | Distributions for annual periods determined in accordance with federal income tax regulations. |
| | 5 | | Where applicable, excludes the effects of any sales charges and assumes the reinvestment of distributions. |
| | 6 | | Aggregate total return. |
| | 7 | | Redemption fee of 2.00% is reflected in total return calculations. There was no impact to the return. |
| | 9 | | Includes recoupment of past waived and/or reimbursed fees. Excluding the recoupment of past waived and/or reimbursed fees for the years ended September 30, 2014 and September 30, 2011, the ratio would have been 2.10% and 2.03%, respectively. There was no financial impact to the expense ratios for the year ended September 30, 2013. |
See Notes to Financial Statements.
| | | | | | |
| 28 | | BLACKROCK FUNDS | | MARCH 31, 2015 | | |
| | | | |
| Financial Highlights | | | BlackRock Emerging Markets Dividend Fund | |
| | | | | | | | | | | | | | | | | | | | |
| | | Institutional | |
| | | Six Months
Ended
March 31,
2015
(Unaudited) | | | Year Ended September 30, | | | Period
April 29,
20111 to
September 30,
2011 | |
| | | | 2014 | | | 2013 | | | 2012 | | |
| Per Share Operating Performance | | | | | | | | | | | | | | | | | | | | |
Net asset value, beginning of period | | $ | 8.75 | | | $ | 8.93 | | | $ | 7.79 | | | $ | 6.90 | | | $ | 10.00 | |
| | | | |
Net investment income2 | | | 0.02 | | | | 0.22 | | | | 0.15 | | | | 0.12 | | | | 0.13 | |
Net realized and unrealized gain (loss) | | | (0.34 | ) | | | (0.12 | ) | | | 1.11 | | | | 0.89 | | | | (3.23 | ) |
| | | | |
Net increase (decrease) from investment operations | | | (0.32 | ) | | | 0.10 | | | | 1.26 | | | | 1.01 | | | | (3.10 | ) |
| | | | |
Distributions from net investment income3 | | | (0.14 | ) | | | (0.28 | ) | | | (0.12 | ) | | | (0.12 | ) | | | — | |
| | | | |
Net asset value, end of period | | $ | 8.29 | | | $ | 8.75 | | | $ | 8.93 | | | $ | 7.79 | | | $ | 6.90 | |
| | | | |
| | | | | | | | | | | | | | | | | | | | |
| Total Return4 | | | | | | | | | | | | | | | | | | | | |
Based on net asset value | | | (3.65 | )%5 | | | 1.06 | % | | | 16.15 | %6 | | | 14.82 | % | | | (31.00 | )%5 |
| | | | |
| | | | | | | | | | | | | | | | | | | | |
| Ratios to Average Net Assets | | | | | | | | | | | | | | | | | | | | |
Total expenses7 | | | 5.44 | %8 | | | 6.72 | % | | | 7.54 | % | | | 13.05 | % | | | 9.67 | %8,9 |
| | | | |
Total expenses after fees waived and/or reimbursed7 | | | 1.51 | %8 | | | 1.51 | % | | | 1.63 | % | | | 1.65 | % | | | 1.65 | %8 |
| | | | |
Net investment income7 | | | 0.41 | %8 | | | 2.41 | % | | | 1.71 | % | | | 1.55 | % | | | 3.39 | %8 |
| | | | |
| | | | | | | | | | | | | | | | | | | | |
| Supplemental Data | | | | | | | | | | | | | | | | | | | | |
Net assets, end of period (000) | | $ | 2,703 | | | $ | 2,774 | | | $ | 2,736 | | | $ | 2,355 | | | $ | 2,049 | |
| | | | |
Portfolio turnover rate | | | 29 | % | | | 71 | % | | | 150 | % | | | 40 | % | | | 14 | % |
| | | | |
| | 1 | | Commencement of operations. |
| | 2 | | Based on average shares outstanding. |
| | 3 | | Distributions for annual periods determined in accordance with federal income tax regulations. |
| | 4 | | Where applicable, assumes the reinvestment of distributions. |
| | 5 | | Aggregate total return. |
| | 6 | | Includes a payment from an affiliate related to securities lending which impacted the Fund’s total return. Not including this payment the Fund’s total return would have been 15.76%. |
| | 7 | | Excludes expenses incurred indirectly as a result of investments in underlying funds as follows: |
| | | | | | | | | | | | | | | | | | | | |
| | | Six Months
Ended
March 31,
2015
(Unaudited) | | | Year Ended September 30, | | | Period
April 29, 20111
to
September 30,
2011 | |
| | | | 2014 | | | 2013 | | | 2012 | | |
Investments in underlying funds | | | — | | | | 0.01 | % | | | — | | | | — | | | | — | |
| | 9 | | Organization costs were not annualized in the calculation of the expense ratios. If these expenses were annualized, the total expenses would have been 13.81%. |
See Notes to Financial Statements.
| | | | | | |
| | | BLACKROCK FUNDS | | MARCH 31, 2015 | | 29 |
| | | | |
| Financial Highlights (continued) | | | BlackRock Emerging Markets Dividend Fund | |
| | | | | | | | | | | | | | | | | | | | |
| | | Investor A | |
| | | Six Months
Ended
March 31,
2015
(Unaudited) | | | Year Ended
September 30, | | | Period
April 29, 20111 to
September 30,
2011 | |
| | | | 2014 | | | 2013 | | | 2012 | | |
| Per Share Operating Performance | | | | | | | | | | | | | | | | | | | | |
Net asset value, beginning of period | | $ | 8.71 | | | $ | 8.89 | | | $ | 7.77 | | | $ | 6.89 | | | $ | 10.00 | |
| | | | |
Net investment income2 | | | 0.00 | 3 | | | 0.20 | | | | 0.21 | | | | 0.18 | | | | 0.09 | |
Net realized and unrealized gain (loss) | | | (0.33 | ) | | | (0.13 | ) | | | 1.02 | | | | 0.82 | | | | (3.20 | ) |
| | | | |
Net increase (decrease) from investment operations | | | (0.33 | ) | | | 0.07 | | | | 1.23 | | | | 1.00 | | | | (3.11 | ) |
| | | | |
Distributions from net investment income4 | | | (0.13 | ) | | | (0.25 | ) | | | (0.11 | ) | | | (0.12 | ) | | | — | |
| | | | |
Net asset value, end of period | | $ | 8.25 | | | $ | 8.71 | | | $ | 8.89 | | | $ | 7.77 | | | $ | 6.89 | |
| | | | |
| | | | | | | | | | | | | | | | | | | | |
| Total Return5 | | | | | | | | | | | | | | | | | | | | |
Based on net asset value | | | (3.80 | )%6 | | | 0.77 | % | | | 15.82 | %7 | | | 14.64 | % | | | (31.10 | )%6 |
| | | | |
| | | | | | | | | | | | | | | | | | | | |
| Ratios to Average Net Assets | | | | | | | | | | | | | | | | | | | | |
Total expenses8 | | | 5.83 | %9 | | | 7.17 | % | | | 8.33 | % | | | 14.41 | % | | | 12.18 | %9,10 |
| | | | |
Total expenses after fees waived and/or reimbursed8 | | | 1.76 | %9 | | | 1.76 | % | | | 1.87 | % | | | 1.90 | % | | | 1.90 | %9 |
| | | | |
Net investment income8 | | | 0.09 | %9 | | | 2.30 | % | | | 2.44 | % | | | 2.24 | % | | | 2.47 | %9 |
| | | | |
| | | | | | | | | | | | | | | | | | | | |
| Supplemental Data | | | | | | | | | | | | | | | | | | | | |
Net assets, end of period (000) | | $ | 1,290 | | | $ | 1,887 | | | $ | 1,308 | | | $ | 360 | | | $ | 51 | |
| | | | |
Portfolio turnover rate | | | 29 | % | | | 71 | % | | | 150 | % | | | 40 | % | | | 14 | % |
| | | | |
| | 1 | | Commencement of operations. |
| | 2 | | Based on average shares outstanding. |
| | 3 | | Amount is less than $0.005 per share. |
| | 4 | | Distributions for annual periods determined in accordance with federal income tax regulations. |
| | 5 | | Where applicable, excludes the effects of any sales charges and assumes the reinvestment of distributions. |
| | 6 | | Aggregate total return. |
| | 7 | | Includes a payment from an affiliate related to securities lending which impacted the Fund’s total return. Not including this payment the Fund’s total return would have been 15.43%. |
| | 8 | | Excludes expenses incurred indirectly as a result of investments in underlying funds as follows: |
| | | | | | | | | | | | | | | | | | | | |
| | | Six Months
Ended
March 31, 2015
(Unaudited) | | | Year Ended September 30, | | | Period
April 29, 20111 to
September 30,
2011 | |
| | | | 2014 | | | 2013 | | | 2012 | | |
Investments in underlying funds | | | — | | | | 0.01 | % | | | — | | | | — | | | | — | |
| | 10 | | Organization costs were not annualized in the calculation of the expense ratios. If these expenses were annualized, the total expenses would have been 18.86%. |
See Notes to Financial Statements.
| | | | | | |
| 30 | | BLACKROCK FUNDS | | MARCH 31, 2015 | | |
| | | | |
| Financial Highlights (concluded) | | | BlackRock Emerging Markets Dividend Fund | |
| | | | | | | | | | | | | | | | | | | | |
| | | Investor C | |
| | | Six Months
Ended
March 31,
2015
(Unaudited) | | | Year Ended September 30, | | | Period
April 29, 20111 to
September 30,
2011 | |
| | | | 2014 | | | 2013 | | | 2012 | | |
| Per Share Operating Performance | | | | | | | | | | | | | | | | | | | | |
Net asset value, beginning of period | | $ | 8.65 | | | $ | 8.84 | | | $ | 7.72 | | | $ | 6.87 | | | $ | 10.00 | |
| | | | |
Net investment income (loss)2 | | | (0.03 | ) | | | 0.16 | | | | 0.20 | | | | 0.05 | | | | 0.09 | |
Net realized and unrealized gain (loss) | | | (0.34 | ) | | | (0.15 | ) | | | 0.95 | | | | 0.90 | | | | (3.22 | ) |
| | | | |
Net increase (decrease) from investment operations | | | (0.37 | ) | | | 0.01 | | | | 1.15 | | | | 0.95 | | | | (3.13 | ) |
| | | | |
Distributions from net investment income3 | | | (0.10 | ) | | | (0.20 | ) | | | (0.03 | ) | | | (0.10 | ) | | | — | |
| | | | |
Net asset value, end of period. | | $ | 8.18 | | | $ | 8.65 | | | $ | 8.84 | | | $ | 7.72 | | | $ | 6.87 | |
| | | | |
| | | | | | | | | | | | | | | | | | | | |
| Total Return4 | | | | | | | | | | | | | | | | | | | | |
Based on net asset value | | | (4.31 | )%5 | | | 0.10 | % | | | 14.95 | %6 | | | 13.95 | % | | | (31.30 | )%5 |
| | | | |
| | | | | | | | | | | | | | | | | | | | |
| Ratios to Average Net Assets | | | | | | | | | | | | | | | | | | | | |
Total expenses7 | | | 6.66 | %8 | | | 8.11 | % | | | 9.53 | % | | | 14.94 | % | | | 11.73 | %8,9 |
| | | | |
Total expenses after fees waived and/or reimbursed7 | | | 2.51 | %8 | | | 2.51 | % | | | 2.61 | % | | | 2.65 | % | | | 2.65 | %8 |
| | | | |
Net investment income (loss)7 | | | (0.60 | )%8 | | | 1.76 | % | | | 2.33 | % | | | 0.60 | % | | | 2.30 | %8 |
| | | | |
| | | | | | | | | | | | | | | | | | | | |
| Supplemental Data | | | | | | | | | | | | | | | | | | | | |
Net assets, end of period (000) | | $ | 391 | | | $ | 500 | | | $ | 214 | | | $ | 28 | | | $ | 19 | |
| | | | |
Portfolio turnover rate | | | 29 | % | | | 71 | % | | | 150 | % | | | 40 | % | | | 14 | % |
| | | | |
| | 1 | | Commencement of operations. |
| | 2 | | Based on average shares outstanding. |
| | 3 | | Distributions for annual periods determined in accordance with federal income tax regulations. |
| | 4 | | Where applicable, excludes the effects of any sales charges and assumes the reinvestment of distributions. |
| | 5 | | Aggregate total return. |
| | 6 | | Includes a payment from an affiliate related to securities lending which impacted the Fund’s total return. Not including this payment the Fund’s total return would have been 14.56%. |
| | 7 | | Excludes expenses incurred indirectly as a result of investments in underlying funds as follows: |
| | | | | | | | | | | | | | | | | | | | |
| | | Six Months
Ended
March 31,
2015
(Unaudited) | | | Year Ended September 30, | | | Period
April 29, 20111 to
September 30,
2011 | |
| | | | 2014 | | | 2013 | | | 2012 | | |
Investments in underlying funds | | | — | | | | 0.01 | % | | | — | | | | — | | | | — | |
| | 9 | | Organization costs were not annualized in the calculation of the expense ratios. If these expenses were annualized, the total expenses would have been 16.54%. |
See Notes to Financial Statements.
| | | | | | |
| | | BLACKROCK FUNDS | | MARCH 31, 2015 | | 31 |
| | | | |
| Financial Highlights | | | BlackRock Energy & Resources Portfolio | |
| | | | | | | | | | | | | | | | | | | | | | | | |
| | | Institutional | |
| | | Six Months
Ended
March 31,
2015
(Unaudited) | | | Year Ended September 30, | |
| | | | 2014 | | | 2013 | | | 2012 | | | 2011 | | | 2010 | |
| Per Share Operating Performance | | | | | | | | | | | | | | | | | | | | | | | | |
Net asset value, beginning of period | | $ | 37.89 | | | $ | 37.36 | | | $ | 32.87 | | | $ | 31.70 | | | $ | 34.98 | | | $ | 32.61 | |
| | | | |
Net investment income (loss)1 | | | 0.02 | | | | (0.17 | ) | | | (0.04 | ) | | | (0.16 | ) | | | (0.08 | ) | | | 0.05 | |
Net realized and unrealized gain (loss) | | | (10.90 | ) | | | 0.70 | | | | 4.56 | | | | 2.79 | | | | (2.68 | ) | | | 2.31 | |
| | | | |
Net increase (decrease) from investment operations | | | (10.88 | ) | | | 0.53 | | | | 4.52 | | | | 2.63 | | | | (2.76 | ) | | | 2.36 | |
| | | | |
Distributions from:2 | | | | | | | | | | | | | | | | | | | | | | | | |
Net investment income | | | — | | | | — | | | | — | | | | (0.25 | ) | | | (0.52 | ) | | | — | |
Return of capital | | | — | | | | — | | | | (0.03 | ) | | | (0.47 | ) | | | — | | | | — | |
Net realized gain | | | — | | | | — | | | | — | | | | (0.74 | ) | | | — | | | | — | |
| | | | |
Total distributions | | | — | | | | — | | | | (0.03 | ) | | | (1.46 | ) | | | (0.52 | ) | | | — | |
| | | | |
Redemption fees added to paid-in capital | | | — | | | | — | | | | — | | | | — | | | | 0.00 | 3 | | | 0.01 | |
| | | | |
Net asset value, end of period | | $ | 27.01 | | | $ | 37.89 | | | $ | 37.36 | | | $ | 32.87 | | | $ | 31.70 | | | $ | 34.98 | |
| | | | |
| | | | | | | | | | | | | | | | | | | | | | | | |
| Total Return4 | | | | | | | | | | | | | | | | | | | | | | | | |
Based on net asset value | | | (28.72 | )%5 | | | 1.42 | % | | | 13.78 | % | | | 7.76 | % | | | (8.28 | )% | | | 7.27 | %6,7 |
| | | | |
| | | | | | | | | | | | | | | | | | | | | | | | |
| Ratios to Average Net Assets | | | | | | | | | | | | | | | | | | | | | | | | |
Total expenses8 | | | 1.08 | %9,10 | | | 1.03 | %9 | | | 1.04 | %9 | | | 0.99 | %9 | | | 0.93 | %9 | | | 0.97 | %9 |
| | | | |
Total expenses after fees waived and/or reimbursed and paid indirectly8 | | | 1.07 | %10 | | | 1.02 | % | | | 1.03 | % | | | 0.99 | % | | | 0.92 | % | | | 0.97 | % |
| | | | |
Net investment income (loss)8 | | | 0.15 | %10 | | | (0.43 | )% | | | (0.11 | )% | | | (0.44 | )% | | | (0.18 | )% | | | 0.13 | % |
| | | | |
| | | | | | | | | | | | | | | | | | | | | | | | |
| Supplemental Data | | | | | | | | | | | | | | | | | | | | | | | | |
Net assets, end of period (000) | | $ | 119,421 | | | $ | 92,994 | | | $ | 105,317 | | | $ | 222,034 | | | $ | 306,403 | | | $ | 274,009 | |
| | | | |
Portfolio turnover rate | | | 28 | % | | | 56 | % | | | 33 | % | | | 15 | % | | | 40 | % | | | 16 | % |
| | | | |
| | 1 | | Based on average shares outstanding. |
| | 2 | | Distributions for annual periods determined in accordance with federal income tax regulations. |
| | 3 | | Amount is less than $0.005 per share. |
| | 4 | | Where applicable, assumes the reinvestment of distributions. |
| | 5 | | Aggregate total return. |
| | 6 | | Includes proceeds received from a settlement of litigation, which impacted the Fund’s total return. Excluding these proceeds, the Fund’s total return would have been 7.20%. |
| | 7 | | Redemption fee of 2.00% is reflected in total return calculations. The impact to the return from redemption fees received during the period was an increase of 0.03%. |
| | 8 | | Excludes expenses incurred indirectly as a result of investments in underlying funds as follows: |
| | | | | | | | | | | | | | | | | | | | | | | | |
| | | Six Months
Ended
March 31,
2015
(Unaudited) | | | Year Ended September 30, | |
| | | | 2014 | | | 2013 | | | 2012 | | | 2011 | | | 2010 | |
Investments in underlying funds | | | 0.01 | % | | | 0.01 | % | | | — | | | | — | | | | — | | | | — | |
| | 9 | | Includes recoupment of past waived and/or reimbursed fees. Excluding the recoupment of past waived and/or reimbursed fees for the year ended September 30, 2013, the ratio would have been 1.03%. There was no financial impact to the expense ratios for the six months ended March 31, 2015, and the years ended September 30, 2014, September 30, 2012, September 30, 2011 and September 30, 2010. |
See Notes to Financial Statements.
| | | | | | |
| 32 | | BLACKROCK FUNDS | | MARCH 31, 2015 | | |
| | | | |
| Financial Highlights (continued) | | | BlackRock Energy & Resources Portfolio | |
| | | | | | | | | | | | | | | | | | | | | | | | |
| | | Investor A | |
| | | Six Months
Ended
March 31,
2015
(Unaudited) | | | Year Ended September 30, | |
| | | | 2014 | | | 2013 | | | 2012 | | | 2011 | | | 2010 | |
| Per Share Operating Performance | | | | | | | | | | | | | | | | | | | | | | | | |
Net asset value, beginning of period | | $ | 32.79 | | | $ | 32.42 | | | $ | 28.62 | | | $ | 27.73 | | | $ | 30.63 | | | $ | 28.67 | |
| | | | |
Net investment loss1 | | | (0.02 | ) | | | (0.25 | ) | | | (0.11 | ) | | | (0.24 | ) | | | (0.20 | ) | | | (0.12 | ) |
Net realized and unrealized gain (loss) | | | (9.43 | ) | | | 0.62 | | | | 3.94 | | | | 2.46 | | | | (2.34 | ) | | | 2.08 | |
| | | | |
Net increase (decrease) from investment operations | | | (9.45 | ) | | | 0.37 | | | | 3.83 | | | | 2.22 | | | | (2.54 | ) | | | 1.96 | |
| | | | |
Distributions from:2 | | | | | | | | | | | | | | | | | | | | | | | | |
Net investment income | | | — | | | | — | | | | — | | | | (0.17 | ) | | | (0.36 | ) | | | — | |
Return of capital | | | — | | | | — | | | | (0.03 | ) | | | (0.42 | ) | | | — | | | | — | |
Net realized gain | | | — | | | | — | | | | — | | | | (0.74 | ) | | | — | | | | — | |
| | | | |
Total distributions | | | — | | | | — | | | | (0.03 | ) | | | (1.33 | ) | | | (0.36 | ) | | | — | |
| | | | |
Redemption fees added to paid-in capital | | | — | | | | — | | | | — | | | | — | | | | 0.00 | 3 | | | 0.00 | 3 |
| | | | |
Net asset value, end of period | | $ | 23.34 | | | $ | 32.79 | | | $ | 32.42 | | | $ | 28.62 | | | $ | 27.73 | | | $ | 30.63 | |
| | | | |
| | | | | | | | | | | | | | | | | | | | | | | | |
| Total Return4 | | | | | | | | | | | | | | | | | | | | | | | | |
Based on net asset value | | | (28.82 | )%5 | | | 1.14 | % | | | 13.42 | % | | | 7.41 | % | | | (8.61 | )% | | | 6.84 | %6,7 |
| | | | |
| | | | | | | | | | | | | | | | | | | | | | | | |
| Ratios to Average Net Assets | | | | | | | | | | | | | | | | | | | | | | | | |
Total expenses8 | | | 1.43 | %9 | | | 1.31 | %10 | | | 1.34 | %10 | | | 1.34 | %10 | | | 1.28 | %10 | | | 1.35 | %10 |
| | | | |
Total expenses after fees waived and/or reimbursed and paid indirectly8 | | | 1.38 | %9 | | | 1.31 | % | | | 1.34 | % | | | 1.34 | % | | | 1.27 | % | | | 1.35 | % |
| | | | |
Net investment loss8 | | | (0.15 | )%9 | | | (0.72 | )% | | | (0.38 | )% | | | (0.77 | )% | | | (0.52 | )% | | | (0.39 | )% |
| | | | |
| | | | | | | | | | | | | | | | | | | | | | | | |
| Supplemental Data | | | | | | | | | | | | | | | | | | | | | | | | |
Net assets, end of period (000) | | $ | 230,250 | | | $ | 353,706 | | | $ | 425,568 | | | $ | 539,085 | | | $ | 632,030 | | | $ | 644,786 | |
| | | | |
Portfolio turnover rate | | | 28 | % | | | 56 | % | | | 33 | % | | | 15 | % | | | 40 | % | | | 16 | % |
| | | | |
| | 1 | | Based on average shares outstanding. |
| | 2 | | Distributions for annual periods determined in accordance with federal income tax regulations. |
| | 3 | | Amount is less than $0.005 per share. |
| | 4 | | Where applicable, excludes the effects of any sales charges and assumes the reinvestment of distributions. |
| | 5 | | Aggregate total return. |
| | 6 | | Includes proceeds received from a settlement of litigation, which impacted the Fund’s total return. Excluding these proceeds, the Fund’s total return would have been 6.77%. |
| | 7 | | Redemption fee of 2.00% is reflected in total return calculations. There was no impact to the return. |
| | 8 | | Excludes expenses incurred indirectly as a result of investments in underlying funds as follows: |
| | | | | | | | | | | | | | | | | | | | | | | | |
| | | Six Months
Ended
March 31,
2015
(Unaudited) | | | Year Ended September 30, | |
| | | | 2014 | | | 2013 | | | 2012 | | | 2011 | | | 2010 | |
Investments in underlying funds | | | 0.01 | % | | | 0.01 | % | | | — | | | | — | | | | — | | | | — | |
| | 10 | | Includes recoupment of past waived and/or reimbursed fees. Excluding the recoupment of past waived and/or reimbursed fees for the years ended September 30, 2013, September 30, 2012, September 30, 2011 and September 30, 2010, the ratio would have been 1.33%, 1.33%, 1.26% and 1.31%, respectively. There was no financial impact to the expense ratios for the year ended September 30, 2014. |
See Notes to Financial Statements.
| | | | | | |
| | | BLACKROCK FUNDS | | MARCH 31, 2015 | | 33 |
| | | | |
| Financial Highlights (continued) | | | BlackRock Energy & Resources Portfolio | |
| | | | | | | | | | | | | | | | | | | | | | | | |
| | | Investor B | |
| | | Six Months
Ended
March 31,
2015
(Unaudited) | | | Year Ended September 30, | |
| | | | 2014 | | | 2013 | | | 2012 | | | 2011 | | | 2010 | |
| Per Share Operating Performance | | | | | | | | | | | | | | | | | | | | | | | | |
Net asset value, beginning of period | | $ | 23.76 | | | $ | 23.68 | | | $ | 21.07 | | | $ | 20.65 | | | $ | 22.86 | | | $ | 21.56 | |
| | | | |
Net investment loss1 | | | (0.08 | ) | | | (0.38 | ) | | | (0.25 | ) | | | (0.36 | ) | | | (0.38 | ) | | | (0.27 | ) |
Net realized and unrealized gain (loss) | | | (6.84 | ) | | | 0.46 | | | | 2.89 | | | | 1.87 | | | | (1.73 | )2 | | | 1.57 | 2 |
| | | | |
Net increase (decrease) from investment operations | | | (6.92 | ) | | | 0.08 | | | | 2.64 | | | | 1.51 | | | | (2.11 | ) | | | 1.30 | |
| | | | |
Distributions from:3 | | | | | | | | | | | | | | | | | | | | | | | | |
Net investment income | | | — | | | | — | | | | — | | | | (0.06 | ) | | | (0.10 | ) | | | — | |
Return of capital | | | — | | | | — | | | | (0.03 | ) | | | (0.29 | ) | | | — | | | | — | |
Net realized gain | | | — | | | | — | | | | — | | | | (0.74 | ) | | | — | | | | — | |
| | | | |
Total distributions | | | — | | | | — | | | | (0.03 | ) | | | (1.09 | ) | | | (0.10 | ) | | | — | |
| | | | |
Net asset value, end of period | | $ | 16.84 | | | $ | 23.76 | | | $ | 23.68 | | | $ | 21.07 | | | $ | 20.65 | | | $ | 22.86 | |
| | | | |
| | | | | | | | | | | | | | | | | | | | | | | | |
| Total Return4 | | | | | | | | | | | | | | | | | | | | | | | | |
Based on net asset value | | | (29.12 | )%5 | | | 0.34 | % | | | 12.57 | % | | | 6.63 | % | | | (9.33 | )% | | | 6.03 | %6,7 |
| | | | |
| | | | | | | | | | | | | | | | | | | | | | | | |
| Ratios to Average Net Assets | | | | | | | | | | | | | | | | | | | | | | | | |
Total expenses8 | | | 2.58 | %9 | | | 2.32 | %10 | | | 2.31 | %10 | | | 2.16 | %10 | | | 2.07 | %10 | | | 2.10 | %10 |
| | | | |
Total expenses after fees waived and/or reimbursed and paid indirectly8 | | | 2.10 | %9 | | | 2.10 | % | | | 2.10 | % | | | 2.10 | % | | | 2.07 | % | | | 2.09 | % |
| | | | |
Net investment loss8 | | | (0.88 | )%9 | | | (1.53 | )% | | | (1.15 | )% | | | (1.56 | )% | | | (1.31 | )% | | | (1.17 | )% |
| | | | |
| | | | | | | | | | | | | | | | | | | | | | | | |
| Supplemental Data | | | | | | | | | | | | | | | | | | | | | | | | |
Net assets, end of period (000) | | $ | 1,793 | | | $ | 3,082 | | | $ | 4,576 | | | $ | 7,687 | | | $ | 16,450 | | | $ | 25,633 | |
| | | | |
Portfolio turnover rate | | | 28 | % | | | 56 | % | | | 33 | % | | | 15 | % | | | 40 | % | | | 16 | % |
| | | | |
| | 1 | | Based on average shares outstanding. |
| | 2 | | Includes redemption fees, which are less than $0.005 per share. |
| | 3 | | Distributions for annual periods determined in accordance with federal income tax regulations. |
| | 4 | | Where applicable, excludes the effects of any sales charges and assumes the reinvestment of distributions. |
| | 5 | | Aggregate total return. |
| | 6 | | Includes proceeds received from a settlement of litigation, which impacted the Fund’s total return. Excluding these proceeds, the Fund’s total return would have been 5.94%. |
| | 7 | | Redemption fee of 2.00% is reflected in total return calculations. There was no impact to the return. |
| | 8 | | Excludes expenses incurred indirectly as a result of investments in underlying funds as follows: |
| | | | | | | | | | | | | | | | | | | | | | | | |
| | | Six Months
Ended
March 31,
2015
(Unaudited) | | | Year Ended September 30, | |
| | | | 2014 | | | 2013 | | | 2012 | | | 2011 | | | 2010 | |
Investments in underlying funds | | | 0.01 | % | | | 0.01 | % | | | — | | | | — | | | | — | | | | — | |
| | 10 | | Includes recoupment of past waived and/or reimbursed fees. Excluding the recoupment of past waived and/or reimbursed fees for the years ended September 30, 2014, September 30, 2013 and September 30, 2011, the ratio would have been 2.31%, 2.30% and 2.03%, respectively. There was no financial impact to the expense ratios for the years ended September 30, 2012 and September 30, 2010. |
See Notes to Financial Statements.
| | | | | | |
| 34 | | BLACKROCK FUNDS | | MARCH 31, 2015 | | |
| | | | |
| Financial Highlights (concluded) | | | BlackRock Energy & Resources Portfolio | |
| | | | | | | | | | | | | | | | | | | | | | | | |
| | | Investor C | |
| | | Six Months
Ended
March 31,
2015
(Unaudited) | | | Year Ended September 30, | |
| | | | 2014 | | | 2013 | | | 2012 | | | 2011 | | | 2010 | |
| Per Share Operating Performance | | | | | | | | | | | | | | | | | | | | | | | | |
Net asset value, beginning of period | | $ | 23.56 | | | $ | 23.47 | | | $ | 20.88 | | | $ | 20.55 | | | $ | 22.81 | | | $ | 21.51 | |
| | | | |
Net investment loss1 | | | (0.08 | ) | | | (0.36 | ) | | | (0.24 | ) | | | (0.34 | ) | | | (0.37 | ) | | | (0.24 | ) |
Net realized and unrealized gain (loss) | | | (6.77 | ) | | | 0.45 | | | | 2.86 | | | | 1.84 | | | | (1.69 | )2 | | | 1.54 | 2 |
| | | | |
Net increase (decrease) from investment operations | | | (6.85 | ) | | | 0.09 | | | | 2.62 | | | | 1.50 | | | | (2.06 | ) | | | 1.30 | |
| | | | |
Distributions from:3 | | | | | | | | | | | | | | | | | | | | | | | | |
Net investment income | | | — | | | | — | | | | — | | | | (0.09 | ) | | | (0.20 | ) | | | — | |
Return of capital | | | — | | | | — | | | | (0.03 | ) | | | (0.34 | ) | | | — | | | | — | |
Net realized gain | | | — | | | | — | | | | — | | | | (0.74 | ) | | | — | | | | — | |
| | | | |
Total distributions | | | — | | | | — | | | | (0.03 | ) | | | (1.17 | ) | | | (0.20 | ) | | | — | |
| | | | |
Net asset value, end of period | | $ | 16.71 | | | $ | 23.56 | | | $ | 23.47 | | | $ | 20.88 | | | $ | 20.55 | | | $ | 22.81 | |
| | | | |
| | | | | | | | | | | | | | | | | | | | | | | | |
| Total Return4 | | | | | | | | | | | | | | | | | | | | | | | | |
Based on net asset value | | | (29.07 | )%5 | | | 0.38 | % | | | 12.59 | % | | | 6.57 | % | | | (9.25 | )% | | | 6.04 | %6,7 |
| | | | |
| | | | | | | | | | | | | | | | | | | | | | | | |
| Ratios to Average Net Assets | | | | | | | | | | | | | | | | | | | | | | | | |
Total expenses8 | | | 2.16 | %9 | | | 2.06 | %10 | | | 2.10 | %10 | | | 2.07 | %10 | | | 2.04 | %10 | | | 2.06 | %10 |
| | | | |
Total expenses after fees waived and/or reimbursed and paid indirectly8 | | | 2.10 | %9 | | | 2.05 | % | | | 2.09 | % | | | 2.07 | % | | | 2.03 | % | | | 2.05 | % |
| | | | |
Net investment loss8 | | | (0.87 | )%9 | | | (1.47 | )% | | | (1.12 | )% | | | (1.50 | )% | | | (1.29 | )% | | | (1.07 | )% |
| | | | |
| | | | | | | | | | | | | | | | | | | | | | | | |
| Supplemental Data | | | | | | | | | | | | | | | | | | | | | | | | |
Net assets, end of period (000) | | $ | 56,460 | | | $ | 83,948 | | | $ | 103,407 | | | $ | 132,808 | | | $ | 146,186 | | | $ | 142,490 | |
| | | | |
Portfolio turnover rate | | | 28 | % | | | 56 | % | | | 33 | % | | | 15 | % | | | 40 | % | | | 16 | % |
| | | | |
| | 1 | | Based on average shares outstanding. |
| | 2 | | Includes redemption fees, which are less than $0.005 per share. |
| | 3 | | Distributions for annual periods determined in accordance with federal income tax regulations. |
| | 4 | | Where applicable, excludes the effects of any sales charges and assumes the reinvestment of distributions. |
| | 5 | | Aggregate total return. |
| | 6 | | Includes proceeds received from a settlement of litigation, which impacted the Fund’s total return. Excluding these proceeds, the Fund’s total return would have been 5.95%. |
| | 7 | | Redemption fee of 2.00% is reflected in total return calculations. There was no impact to the return. |
| | 8 | | Excludes expenses incurred indirectly as a result of investments in underlying funds as follows: |
| | | | | | | | | | | | | | | | | | | | | | | | |
| | | Six Months
Ended
March 31,
2015
(Unaudited) | | | Year Ended September 30, | |
| | | | 2014 | | | 2013 | | | 2012 | | | 2011 | | | 2010 | |
Investments in underlying funds | | | 0.01 | % | | | 0.01 | % | | | — | | | | — | | | | — | | | | — | |
| | 10 | | Includes recoupment of past waived and/or reimbursed fees. Excluding the recoupment of past waived and/or reimbursed fees for the years ended September 30, 2014, September 30, 2011 and September 30, 2010, the ratio would have been 2.05%, 1.99% ,and 2.05%, respectively. There was no financial impact to the expense ratios for the years ended September 30, 2013 and September 30, 2012. |
See Notes to Financial Statements.
| | | | | | |
| | | BLACKROCK FUNDS | | MARCH 31, 2015 | | 35 |
| | |
| Notes to Financial Statements (Unaudited) | | |
1. Organization:
BlackRock FundsSM (the “Trust”) is registered under the Investment Company Act of 1940, as amended (the “1940 Act”), as an open-end management investment company. The Trust is organized as a Massachusetts business trust. The following are referred to herein collectively as the “Funds” or individually, a “Fund”:
| | | | |
| Fund Name | | Herein Referred To As | | Diversification Classification |
BlackRock All-Cap Energy & Resources Portfolio | | All-Cap Energy & Resources | | Non-diversified |
BlackRock Emerging Markets Dividend Fund | | Emerging Markets Dividend | | Diversified |
BlackRock Energy & Resources Portfolio | | Energy & Resources | | Non-diversified |
Each Fund offers multiple classes of shares. All classes of shares have identical voting, dividend, liquidation and other rights and are subject to the same terms and conditions, except that certain classes bear expenses related to the shareholder servicing and distribution of such shares. Institutional and Service Shares are sold only to certain eligible investors. Investor B Shares are only available through exchanges and distribution reinvestments by current holders and for purchase by certain employer-sponsored retirement plans. Investor A and Investor C Shares are generally available through financial intermediaries. Each class has exclusive voting rights with respect to matters relating to its shareholder servicing and distribution expenditures (except that Investor B shareholders may vote on material changes to the Investor A distribution and service plan).
| | | | | | |
| Share Class | | Initial Sales Charge | | CDSC | | Conversion Privilege |
Institutional and Service Shares | | No | | No | | None |
Investor A Shares | | Yes | | No1 | | None |
Investor B Shares | | No | | Yes | | To Investor A Shares after approximately 8 years |
Investor C Shares | | No | | Yes | | None |
| | 1 | | Investor A Shares may be subject to a CDSC where no initial sales charge was paid at the time of purchase. |
The Funds, together with certain other registered investment companies advised by the Manager or its affiliates, are included in a complex of open-end funds referred to as the Equity-Liquidity Complex.
2. Significant Accounting Policies:
The Funds’ financial statements are prepared in conformity with accounting principles generally accepted in the United States of America (“U.S. GAAP”), which may require management to make estimates and assumptions that affect the reported amounts of assets and liabilities in the financial statements and the reported amounts of increases and decreases in net assets from operations during the reporting period. Actual results could differ from those estimates. Each Fund is considered an investment company under U.S. GAAP and follows the accounting and reporting guidance applicable to investment companies The following is a summary of significant accounting policies followed by the Funds:
Valuation: The Funds’ investments are valued at fair value as of the close of trading on the New York Stock Exchange (“NYSE”) (generally 4:00 p.m., Eastern time). U.S. GAAP defines fair value as the price the Funds would receive to sell an asset or pay to transfer a liability in an orderly transaction between market participants at the measurement date. The Funds determine the fair values of their financial instruments at market value using independent dealers or pricing services under policies approved by the Board of Trustees of the Trust (the “Board”). The BlackRock Global Valuation Methodologies Committee (the “Global Valuation Committee”) is the committee formed by management to develop global pricing policies and procedures and to provide oversight of the pricing function for the Funds for all financial instruments.
Equity investments traded on a recognized securities exchange are valued at the official close each day, if available. For equity investments traded on more than one exchange, the official close price on the exchange where the stock is primarily traded is used. Equity investments traded on a recognized exchange for which there were no sales on that day may be valued at the last available bid (long positions) or ask (short positions) price. Investments in open-end registered investment companies are valued at NAV each business day.
Securities and other assets and liabilities denominated in foreign currencies are translated into U.S. dollars using exchange rates determined as of the close of business on the NYSE. Forward foreign currency exchange contracts are valued at the mean between the bid and ask prices and are determined as of the close of business on the NYSE. Interpolated values are derived when the settlement date of the contract is an interim date for which quotations are not available.
The Funds value their investment in BlackRock Liquidity Series, LLC, Money Market Series (the “Money Market Series”) at fair value, which is ordinarily based upon their pro rata ownership in the underlying fund’s net assets. The Money Market Series seeks current income consistent with maintaining liquidity and preserving capital. Although the Money Market Series is not registered under the 1940 Act, its investments will follow the parameters of
| | | | | | |
| 36 | | BLACKROCK FUNDS | | MARCH 31, 2015 | | |
| | |
| Notes to Financial Statements (continued) | | |
investments by a money market fund that is subject to Rule 2a-7 under the 1940 Act. Each Fund may withdraw up to 25% of its investment daily, although the manager of the Money Market Series, in its sole discretion, may permit an investor to withdraw more than 25% on any one day.
In the event that the application of these methods of valuation results in a price for an investment that is deemed not to be representative of the market value of such investment, or if a price is not available, the investment will be valued by the Global Valuation Committee, or its delegate, in accordance with a policy approved by the Board as reflecting fair value (“Fair Value Investments”). When determining the price for Fair Value Investments, the Global Valuation Committee, or its delegate, seeks to determine the price that each Fund might reasonably expect to receive or pay from the current sale or purchase of that asset or liability in an arm’s-length transaction. Fair value determinations shall be based upon all available factors that the Global Valuation Committee, or its delegate, deems relevant consistent with the principles of fair value measurement, which include the market approach, income approach and/or in the case of recent investments, the cost approach, as appropriate. The market approach generally consists of using comparable market transactions. The income approach generally is used to discount future cash flows to present value and is adjusted for liquidity as appropriate. These factors include but are not limited to: (i) attributes specific to the investment or asset; (ii) the principal market for the investment or asset; (iii) the customary participants in the principal market for the investment or asset; (iv) data assumptions by market participants for the investment or asset, if reasonably available; (v) quoted prices for similar investments or assets in active markets; and (vi) other factors, such as future cash flows, interest rates, yield curves, volatilities, prepayment speeds, loss severities, credit risks, recovery rates, liquidation amounts and/or default rates. Due to the inherent uncertainty of valuations of such investments, the fair values may differ from the values that would have been used had an active market existed. The Global Valuation Committee, or its delegate, employs various methods for calibrating valuation approaches for investments where an active market does not exist, including regular due diligence of the Funds’ pricing vendors, regular reviews of key inputs and assumptions, transactional back-testing or disposition analysis to compare unrealized gains and losses to realized gains and losses, reviews of missing or stale prices and large movements in market values and reviews of any market related activity. The pricing of all Fair Value Investments is subsequently reported to the Board or a committee thereof on a quarterly basis.
Generally, trading in foreign instruments is substantially completed each day at various times prior to the close of business on the NYSE. Occasionally, events affecting the values of such instruments may occur between the foreign market close and the close of business on the NYSE that may not be reflected in the computation of each Fund’s net assets. If events (e.g., a company announcement, market volatility or a natural disaster) occur during such periods that are expected to materially affect the value of such instruments, those instruments may be Fair Value Investments and be valued at their fair value, as determined in good faith by the Global Valuation Committee, or its delegate, using a pricing service and/or policies approved by the Board. Each business day, the Funds use a pricing service to assist with the valuation of certain foreign exchange-traded equity securities and foreign exchange-traded and over-the-counter (“OTC”) options (the “Systematic Fair Value Price”). Using current market factors, the Systematic Fair Value Price is designed to value such foreign securities and foreign options at fair value as of the close of business on the NYSE, which follows the close of the local markets.
Foreign Currency: Each Fund’s books and records are maintained in U.S. dollars. Purchases and sales of investment securities are recorded at the rates of exchange prevailing on the respective dates of such transactions. Generally, when the U.S. dollar rises in value against a foreign currency, each Fund’s investments denominated in that currency will lose value because that currency is worth fewer U.S. dollars; the opposite effect occurs if the U.S. dollar falls in relative value.
Each Fund does not isolate the portion of the results of operations arising as a result of changes in the foreign exchange rates from the changes in the market prices of investments held or sold for financial reporting purposes. Accordingly, the effects of changes in foreign currency exchange rates on investments are not segregated in the Statements of Operations from the effects of changes in market prices of those investments, but are included as a component of net realized and unrealized gain (loss) from investments. Each Fund reports realized currency gains (losses) on foreign currency related transactions as components of net realized gain (loss) for financial reporting purposes, whereas such components are generally treated as ordinary income for federal income tax purposes.
Segregation and Collateralization: In cases where a Fund enters into certain investments (e.g., forward foreign currency exchange contracts) that would be “senior securities” for 1940 Act purposes, a Fund may segregate or designate on its books and records cash or liquid securities having a market value at least equal to the amount of a Fund’s future obligations under such investments. Doing so allows the investment to be excluded from treatment as a “senior security.” Furthermore, if required by an exchange or counterparty agreement, the Funds may be required to deliver/deposit cash and/or securities to/with an exchange, or broker-dealer or custodian as collateral for certain investments or obligations.
Investment Transactions and Investment Income: For financial reporting purposes, investment transactions are recorded on the dates the transactions are entered into (the trade dates). Realized gains and losses on investment transactions are determined on the identified cost basis. Dividend income is recorded on the ex-dividend date. Dividends from foreign securities where the ex-dividend date may have passed are subsequently recorded when
| | | | | | |
| | | BLACKROCK FUNDS | | MARCH 31, 2015 | | 37 |
| | |
| Notes to Financial Statements (continued) | | |
the Funds are informed of the ex-dividend date. Under the applicable foreign tax laws, a withholding tax at various rates may be imposed on capital gains, dividends and interest. Income, expenses and realized and unrealized gains and losses are allocated daily to each class based on its relative net assets.
Distributions: Distributions paid by the Funds are recorded on the ex-dividend dates. The character and timing of distributions are determined in accordance with federal income tax regulations, which may differ from U.S. GAAP.
Recent Accounting Standard: In June 2014, the Financial Accounting Standards Board issued guidance to improve the financial reporting of reverse repurchase agreements and other similar transactions. The guidance will require expanded disclosure for entities that enter into reverse repurchase agreements and similar transactions accounted for as secured borrowings. It is effective for financial statements with fiscal years beginning on or after December 15, 2014 and for interim periods beginning after March 15, 2015. Management is evaluating the impact, if any, of this guidance on the Funds’ financial statement disclosures.
Other: Expenses directly related to a Fund or its classes are charged to that Fund or the applicable class. Other operating expenses shared by several funds are prorated among those funds on the basis of relative net assets or other appropriate methods. Expenses directly related to the Funds and other shared expenses prorated to the Funds are allocated daily to each class based on its relative net assets or other appropriate methods.
The Funds have an arrangement with their custodian whereby fees may be reduced by credits earned on uninvested cash balances, which, if applicable, are shown as fees paid indirectly in the Statements of Operations. The custodian imposes fees on overdrawn cash balances, which can be offset by accumulated credits earned or may result in additional custody charges.
3. Securities and Other Investments:
Participation Notes: Emerging Markets Dividend may invest in participation notes (“P-Notes”). P-Notes are promissory notes issued by banks or broker-dealers that are designed to offer Emerging Markets Dividend a return measured by the change in the value of the underlying security or basket of securities (the “underlying security”) while not holding the actual shares of the underlying security. P-Notes are typically used to allow Emerging Markets Dividend to gain exposure to securities traded in foreign markets that may be restricted due to country-specific regulations. When the P-Note matures, the issuer will pay to, or receive from, Emerging Markets Dividend the difference between the value of the underlying security at the time of the purchase and the underlying security’s value at maturity of the P-Notes. Income received on P-Notes is recorded by Emerging Markets Dividend as dividend income in the Statements of Operations. An investment in a P-Note involves additional risks beyond the risks normally associated with a direct investment in the underlying security. While the holder of a P-Note is entitled to receive from the bank or broker-dealer any dividends paid by the underlying security, the holder is not entitled to the same rights (e.g., voting rights) as a direct owner of the underlying security. P-Notes are considered general unsecured contractual obligations of the bank or broker-dealer. Emerging Markets Dividend must rely on the creditworthiness of the issuer for its investment returns on the P-Notes and has no rights against the issuer of the underlying security. A P-Note may be more volatile and less liquid than other investments held by Emerging Markets Dividend since the P-Note generally is dependent on the liquidity in the local trading market for the underlying security.
Securities Lending: Each Fund may lend its securities to approved borrowers, such as brokers, dealers and other financial institutions. The borrower pledges and maintains with the Funds collateral consisting of cash, an irrevocable letter of credit issued by a bank, or securities issued or guaranteed by the U.S. Government. The initial collateral received by each Fund is required to have a value of at least 102% of the current value of the loaned securities for securities traded on U.S. exchanges and a value of at least 105% for all other securities. The collateral is maintained thereafter, at a value equal to at least 100% of the current market value of the securities on loan. The market value of the loaned securities is determined at the close of each business day of the Fund and any additional required collateral is delivered to the Fund on the next business day. During the term of the loan, each Fund is entitled to all distributions made on or in respect of the loaned securities. Loans of securities are terminable at any time and the borrower, after notice, is required to return borrowed securities within the standard time period for settlement of securities transactions.
The market value of securities on loan and the value of the related collateral are shown separately in the Statements of Assets and Liabilities as a component of investments at value — unaffiliated, and collateral on securities loaned at value, respectively. As of March 31, 2015, any securities on loan were collateralized by cash. The cash collateral invested by the securities lending agent, BlackRock Investment Management, LLC (“BIM”), if any, is disclosed in the Schedules of Investments.
Securities lending transactions are entered into by the Funds under Master Securities Lending Agreements (each, an “MSLA”) which provide the right, in the event of default (including bankruptcy or insolvency), for the non-defaulting party to liquidate the collateral and calculate a net exposure to the
| | | | | | |
| 38 | | BLACKROCK FUNDS | | MARCH 31, 2015 | | |
| | |
| Notes to Financial Statements (continued) | | |
defaulting party or request additional collateral. In the event that a borrower defaults, each Fund, as lender, would offset the market value of the collateral received against the market value of the securities loaned. When the value of the collateral is greater than that of the market value of the securities loaned, the lender is left with a net amount payable to the defaulting party. However, bankruptcy or insolvency laws of a particular jurisdiction may impose restrictions on or prohibitions against such a right of offset in the event of an MSLA counterparty’s bankruptcy or insolvency. Under the MSLA, the borrower can resell or re-pledge the loaned securities, and the Funds can reinvest cash collateral, or, upon an event of default, resell or re-pledge the collateral.
The risks of securities lending include the risk that the borrower may not provide additional collateral when required or may not return the securities when due. To mitigate these risks, the Funds benefit from a borrower default indemnity provided by BIM. BIM’s indemnity allows for full replacement of the securities loaned if the collateral received does not cover the value on the securities loaned in the event of borrower default. Each Fund could suffer a loss if the value of an investment purchased with cash collateral falls below the market value of loaned securities or if the value of an investment purchased with cash collateral falls below the value of the original cash collateral received.
4. Derivative Financial Instruments:
Emerging Markets Dividend engages in various portfolio investment strategies using derivative contracts both to increase the returns of Emerging Markets Dividend and/or to economically manage its exposure to certain risks such as foreign currency exchange rate risk. These contracts may be transacted on an exchange or OTC.
Forward Foreign Currency Exchange Contracts: Emerging Markets Dividend enters into forward foreign currency exchange contracts as an economic hedge against either specific transactions or portfolio instruments or to obtain exposure to, or hedge exposure away from, foreign currencies (foreign currency exchange rate risk). A forward foreign currency exchange contract is an agreement between two parties to buy and sell a currency at a set exchange rate on a future date. Forward foreign currency exchange contracts, when used by Emerging Markets Dividend, help to manage the overall exposure to the currencies in which some of the investments held by Emerging Markets Dividend are denominated. The contract is marked-to-market daily and the change in market value is recorded by Emerging Markets Dividend as an unrealized gain or loss. When the contract is closed, Emerging Markets Dividend records a realized gain or loss equal to the difference between the value at the time it was opened and the value at the time it was closed. The use of forward foreign currency exchange contracts involves the risk that the value of a forward foreign currency exchange contract changes unfavorably due to movements in the value of the referenced foreign currencies.
The following is a summary of Emerging Markets Dividend’s derivative financial instruments categorized by risk exposure:
| | | | | | | | | | |
| Fair Values of Derivative Financial Instruments as of March 31, 2015 | |
| | | | | Value | |
| | | Statements of Assets and Liabilities Location | | Derivative
Assets | | | Derivative
Liabilities | |
Foreign currency exchange contracts | | Unrealized appreciation/depreciation on forward foreign currency exchange contracts | | $ | 3,241 | | | $ | 3,167 | |
| | | | |
The Effect of Derivative Financial Instruments in the Statements of Operations
Six Months Ended March 31, 2015 |
| | | Net Realized Gain (Loss) from | | Net Change in Unrealized
Appreciation/Depreciation on |
Foreign currency exchange contracts: | | | | |
Foreign currency transactions/ translations | | $12,395 | | $(13,350) |
For the six months ended March 31, 2015, the average quarterly balances of outstanding derivative financial instruments were as follows:
| | | | |
Forward foreign currency exchange contracts: | | | | |
Average amounts purchased - in USD | | $ | 147,514 | |
Average amounts sold - in USD | | $ | 84,966 | |
Counterparty Credit Risk: A derivative contract may suffer a mark-to-market loss if the value of the contract decreases due to an unfavorable change in the market rates or values of the underlying instrument. Losses can also occur if the counterparty does not perform under the contract.
A Fund’s risk of loss from counterparty credit risk on OTC derivatives is generally limited to the aggregate unrealized gain less the value of any collateral held by such Fund.
| | | | | | |
| | | BLACKROCK FUNDS | | MARCH 31, 2015 | | 39 |
| | |
| Notes to Financial Statements (continued) | | |
In order to better define its contractual rights and to secure rights that will help the Fund mitigate their counterparty risk, a Fund may enter into an International Swaps and Derivatives Association, Inc. Master Agreement (“ISDA Master Agreement”) or similar agreement with its counterparties. An ISDA Master Agreement is a bilateral agreement between Emerging Markets Dividend and a counterparty that governs certain OTC derivatives and typically contains, among other things, collateral posting terms and netting provisions in the event of a default and/or termination event. Under an ISDA Master Agreement, Emerging Markets Dividend may, under certain circumstances, offset with the counterparty certain derivative financial instruments’ payables and/or receivables with collateral held and/or posted and create one single net payment. The provisions of the ISDA Master Agreement typically permit a single net payment in the event of default including the bankruptcy or insolvency of the counterparty. Bankruptcy or insolvency laws of a particular jurisdiction may restrict or prohibit the right of offset in bankruptcy, insolvency or other events. In addition, certain ISDA Master Agreements allow counterparties to terminate derivative contracts prior to maturity in the event Emerging Markets Dividend’s net assets decline by a stated percentage or Emerging Markets Dividend fails to meet the terms of its ISDA Master Agreements, which the result would cause Emerging Markets Dividend to accelerate payment of any net liability owed to the counterparty.
As of March 31, 2015, Emerging Markets Dividend’s derivative assets and liabilities (by type) are as follows:
| | | | | | | | |
| | | Assets | | | Liabilities | |
Derivative Financial Instruments: | | | | | | | | |
Forward foreign currency exchange contracts | | $ | 3,241 | | | $ | 3,167 | |
| | | | |
Total derivative assets and liabilities subject to an Master Netting Agreement (“MNA”) | | $ | 3,241 | | | $ | 3,167 | |
| | | | |
As of March 31, 2015, the following table presents Emerging Markets Dividend’s derivative assets and/or liabilities by counterparty net of amounts available for offset under an MNA and net of the related collateral received and pledged by Emerging Markets Dividend:
| | | | | | | | | | |
| Counterparty | | Derivative Assets
Subject to an MNA by
Counterparty | | Derivatives Available
for Offset | | Non-cash
Collateral
Received | | Cash
Collateral
Received | | Net Amount of
Derivative Assets1 |
Deutsche Bank AG | | $3,241 | | — | | — | | — | | $3,241 |
| | | | | | | | | | |
| Counterparty | | Derivative Liabilities
Subject to an MNA by
Counterparty | | Derivatives Available
for Offset | | Non-cash
Collateral
Pledged | | Cash
Collateral
Pledged | | Net Amount of
Derivative Liabilities2 |
BNP Paribas S.A | | $3,167 | | — | | — | | — | | $3,167 |
| | 1 | | Net amount represents the net amount receivable from the counterparty in the event of default. |
| | 2 | | Net amount represents the net amount payable due to the counterparty in the event of default. |
5. Investment Advisory Agreement and Other Transactions with Affiliates:
The PNC Financial Services Group, Inc. is the largest stockholder and an affiliate of BlackRock, Inc. (“BlackRock”) for 1940 Act purposes.
The Trust, on behalf of the Funds, entered into an Investment Advisory Agreement with the Manager, the Funds’ investment advisor, an indirect, wholly owned subsidiary of BlackRock, to provide investment advisory services. The Manager is responsible for the management of each Fund’s portfolio and provides the necessary personnel, facilities, equipment and certain other services to the operations of each Fund. For such services, each Fund, except Emerging Markets Dividend, pays the Manager a monthly fee based on a percentage of each Fund’s average daily net assets at the following annual rates:
| | | | |
| Average Daily Net Assets | | Investment Advisory Fee | |
First $1 Billion | | | 0.750 | % |
$1 Billion - $2 Billion | | | 0.700 | % |
$2 Billion - $3 Billion | | | 0.675 | % |
Greater than $3 Billion | | | 0.650 | % |
| | | | | | |
| 40 | | BLACKROCK FUNDS | | MARCH 31, 2015 | | |
| | |
| Notes to Financial Statements (continued) | | |
Emerging Markets Dividend pays the Manager a monthly fee based on a percentage of its average daily net assets at the following annual rates:
| | | | |
| Average Daily Net Assets | | Investment Advisory Fee | |
First $1 Billion | | | 1.00 | % |
$1 Billion - $3 Billion | | | 0.94 | % |
$3 Billion - $5 Billion | | | 0.90 | % |
$5 Billion - $10 Billion | | | 0.87 | % |
Greater than $10 Billion | | | 0.85 | % |
The Manager voluntarily agreed to waive its investment advisory fees by the amount of investment advisory fees each Fund pays to the Manager indirectly through its investment in affiliated money market funds. However, the Manager does not waive its investment advisory fees by the amount of investment advisory fees paid in connection with each Fund’s investment in other affiliated investment companies, if any. These amounts are included in fees waived by the Manager in the Statements of Operations. For the six months ended March 31, 2015, the amounts waived were as follows:
| | | | |
All-Cap Energy & Resources | | $ | 1,536 | |
Emerging Markets Dividend | | $ | 35 | |
Energy & Resources | | $ | 4,680 | |
The Manager, on behalf of each Fund, entered into sub-advisory agreements with BlackRock International Limited (“BIL”), an affiliate of the Manager. The Manager pays BIL, for services it provides, a monthly fee that is a percentage of the investment advisory fees paid by each Fund to the Manager.
The Trust, on behalf of the Funds, entered into a Distribution Agreement and a Distribution and Service Plan with BlackRock Investments, LLC (“BRIL”), an affiliate of the Manager. Pursuant to the Distribution and Service Plan and in accordance with Rule 12b-1 under the 1940 Act, each Fund pays BRIL ongoing service and distribution fees. The fees are accrued daily and paid monthly at annual rates based upon the average daily net assets of the relevant share class of each Fund as follows:
| | | | | | | | | | | | | | | | |
| | | Service | | | Investor A | | | Investor B | | | Investor C | |
Service Fee | | | 0.25 | % | | | 0.25 | % | | | 0.25 | % | | | 0.25 | % |
Distribution Fee | | | — | | | | — | | | | 0.75 | % | | | 0.75 | % |
Pursuant to sub-agreements with BRIL, broker-dealers and BRIL provide shareholder servicing and distribution services to each Fund. The ongoing service and/or distribution fee compensates BRIL and each broker-dealer for providing shareholder servicing and/or distribution related services to Service, Investor A, Investor B and Investor C shareholders.
For the six months ended March 31, 2015, the following table shows the class specific service and distribution fees borne directly by each class of each Fund:
| | | | | | | | | | | | | | | | | | | | |
| | | Service | | | Investor A | | | Investor B | | | Investor C | | | Total | |
All-Cap Energy & Resources | | $ | 1,964 | | | $ | 94,009 | | | $ | 14,848 | | | $ | 256,051 | | | $ | 366,872 | |
Emerging Markets Dividend | | | — | | | $ | 2,108 | | | | — | | | $ | 2,392 | | | $ | 4,500 | |
Energy & Resources | | | — | | | $ | 324,239 | | | $ | 10,735 | | | $ | 309,852 | | | $ | 644,826 | |
Pursuant to written agreements, certain financial intermediaries, some of which may be affiliates, provide the Funds with sub-accounting, recordkeeping, sub-transfer agency and other administrative services with respect to sub-accounts they service. For these services, these entities receive an asset-based fee or an annual fee per shareholder account, which will vary depending on share class and/or net assets. For the six months ended March 31, 2015, Energy & Resources paid the following amounts to affiliates of BlackRock in return for these services, which are included in transfer agent — class specific in the Statements of Operations:
| | | | | | | | | | | | |
| | | Institutional | | | Investor A | | | Total | |
Energy & Resources | | $ | 19,575 | | | $ | 72 | | | $ | 19,647 | |
The Manager maintains a call center, which is responsible for providing certain shareholder services to the Funds, such as responding to shareholder inquiries and processing transactions based upon instructions from shareholders with respect to the subscription and redemption of Fund shares. For the six months ended March 31, 2015, each Fund reimbursed the Manager the following amounts for costs incurred in running the call center, which are included in transfer agent — class specific in the Statements of Operations:
| | | | | | |
| | | BLACKROCK FUNDS | | MARCH 31, 2015 | | 41 |
| | |
| Notes to Financial Statements (continued) | | |
| | | | | | | | | | | | | | | | | | | | | | | | |
| | | Institutional | | | Service | | | Investor A | | | Investor B | | | Investor C | | | Total | |
All-Cap Energy & Resources | | $ | 513 | | | $ | 22 | | | $ | 7,973 | | | $ | 952 | | | $ | 2,046 | | | $ | 11,506 | |
Emerging Markets Dividend | | $ | 57 | | | | — | | | $ | 51 | | | | — | | | $ | 45 | | | $ | 153 | |
Energy & Resources | | $ | 893 | | | | — | | | $ | 19,452 | | | $ | 833 | | | $ | 2,549 | | | $ | 23,727 | |
For the six months ended March 31, 2015, the following table shows the class specific transfer agent fees borne directly by each class of each Fund: | |
| | | Institutional | | | Service | | | Investor A | | | Investor B | | | Investor C | | | Total | |
All-Cap Energy & Resources | | $ | 21,652 | | | $ | 1,577 | | | $ | 98,027 | | | $ | 8,884 | | | $ | 51,638 | | | $ | 181,778 | |
Emerging Markets Dividend | | $ | 344 | | | | — | | | $ | 1,583 | | | | — | | | $ | 603 | | | $ | 2,530 | |
Energy & Resources | | $ | 98,972 | | | | — | | | $ | 352,492 | | | $ | 7,295 | | | $ | 78,972 | | | $ | 537,731 | |
Effective January 1, 2015, the Trust, on behalf of the Funds, entered into an Administration Agreement with the Manager, an indirect, wholly owned subsidiary of BlackRock, to provide administrative services. For these services, the Manager receives an administration fee computed daily and payable monthly, based on a percentage of the average daily net assets of the Funds. The administration fee, which is shown as administration in the Statements of Operations, is paid at the annual rates below.
| | | | |
| Average Daily Net Assets | | Administration Fee | |
First $500 Million | | | 0.0425 | % |
$500 Million - $1 Billion | | | 0.0400 | % |
$1 Billion - $2 Billion | | | 0.0375 | % |
$2 Billion - $4 Billion | | | 0.0350 | % |
$4 Billion - $13 Billion | | | 0.0325 | % |
Greater than $13 Billion | | | 0.0300 | % |
In addition, the Manager charges each of the share classes an administration fee, which is shown as administration — class specific in the Statements of Operations, at an annual rate of 0.02% of the average daily net assets of each respective class.
Prior to January 1, 2015, BNY Mellon Investment Servicing (US) Inc. (“BNYMIS”) and the Manager act as co-administrators for the Funds. For these services, the co-administrators receive an administration fee computed daily and payable monthly to each administrator pursuant to separate fee arrangements, based on a percentage of the average daily net assets of each Fund. The combined administration fee, which is shown as administration in the Statements of Operations, was paid at the annual rates below. In addition, each of the share classes was charged an administration fee, which is shown as administration — class specific in the Statements of Operations, based on the following percentages of average daily net assets of each respective class:
| | | | | | | | |
| Average Daily Net Assets | | Administration Fee | | | Administration Fee —
Class Specific | |
First $500 Million | | | 0.075 | % | | | 0.025 | % |
$500 Million - $1 Billion | | | 0.065 | % | | | 0.015 | % |
Greater than $1 Billion | | | 0.055 | % | | | 0.005 | % |
For the six months ended March 31, 2015, the Funds paid the following to the Manager in return for these services, which are included in administration and administration — class specific in the Statements of Operations:
| | | | |
All-Cap Energy & Resources | | $ | 53,242 | |
Emerging Markets Dividend | | $ | 557 | |
Energy & Resources | | $ | 147,047 | |
For the six months ended March 31, 2015, the following table shows the class specific administration fees borne directly by each class of each Fund:
| | | | | | | | | | | | | | | | | | | | | | | | |
| | | Institutional | | | Service | | | Investor A | | | Investor B | | | Investor C | | | Total | |
All-Cap Energy & Resources | | $ | 3,713 | | | $ | 179 | | | $ | 8,530 | | | $ | 340 | | | $ | 5,811 | | | $ | 18,573 | |
Emerging Markets Dividend | | $ | 311 | | | | — | | | $ | 192 | | | | — | | | $ | 54 | | | $ | 557 | |
Energy & Resources | | $ | 12,478 | | | | — | | | $ | 29,561 | | | $ | 246 | | | $ | 7,049 | | | $ | 49,334 | |
BNYMIS and the Manager may have, at their discretion, voluntarily waived all or any portion of their administration fees for a Fund or a share class, which are included in administration fees waived and administration fees waived — class specific in the Statements of Operations.
| | | | | | |
| 42 | | BLACKROCK FUNDS | | MARCH 31, 2015 | | |
| | |
| Notes to Financial Statements (continued) | | |
The Manager contractually agreed to waive and/or reimburse fees or expenses in order to limit expenses, excluding interest expense, dividend expense, tax expense, acquired fund fees and expenses and certain other fund expenses, which constitute extraordinary expenses not incurred in the ordinary course of the Funds’ business. The expense limitations as a percentage of average daily net assets are as follows:
| | | | | | | | | | | | | | | | | | | | | | | | | | | | |
| | | BlackRock | | | Institutional | | | Service | | | Investor A | | | Investor B | | | Investor C | | | Class R | |
All-Cap Energy & Resources | | | 0.92 | %1 | | | 0.96 | % | | | 1.38 | % | | | 1.38 | % | | | 2.10 | % | | | 2.10 | % | | | 1.83 | %1 |
Emerging Markets Dividend | | | N/A | | | | 1.50 | % | | | N/A | | | | 1.75 | % | | | N/A | | | | 2.50 | % | | | N/A | |
Energy & Resources | | | N/A | | | | 1.07 | % | | | 1.38 | %1 | | | 1.38 | % | | | 2.10 | % | | | 2.10 | % | | | 1.94 | %1 |
| | 1 | | There were no shares outstanding as of March 31, 2015. |
The Manager has agreed not to reduce or discontinue this contractual waiver or reimbursement prior to February 1, 2016, unless approved by the Board, including a majority of the independent Trustees.
These amounts waived or reimbursed are included in fees waived by the Manager, and shown as administration fees waived, administration fees waived — class specific, transfer agent fees waived — class specific, transfer agent fees reimbursed — class specific and expenses reimbursed by the Manager, respectively, in the Statements of Operations. For the six months ended March 31, 2015, the Manager waived $15 and $24,559 of investment advisory fees for All-Cap Energy & Resources and Emerging Markets Dividend, respectively, which is included in fees waived by the Manager.
Class specific expense waivers or reimbursements are as follows:
| | | | | | | | | | | | | | | | | | | | | | | | |
| Administration Fees Waived | | Institutional | | | Service | | | Investor A | | | Investor B | | | Investor C | | | Total | |
All-Cap Energy & Resources | | $ | 3,713 | | | $ | 143 | | | $ | 8,530 | | | $ | 340 | | | $ | 5,811 | | | $ | 18,537 | |
Emerging Markets Dividend | | $ | 304 | | | | — | | | $ | 192 | | | | — | | | $ | 54 | | | $ | 550 | |
Energy & Resources | | $ | 5,220 | | | | — | | | $ | 24,903 | | | $ | 246 | | | $ | 6,686 | | | $ | 37,055 | |
| | | | | | | | | | | | | | | | | | | | | | | | |
| Transfer Agent Fees Waived | | Institutional | | | Service | | | Investor A | | | Investor B | | | Investor C | | | Total | |
All-Cap Energy & Resources | | $ | 514 | | | $ | 9 | | | $ | 7,972 | | | $ | 952 | | | $ | 2,043 | | | $ | 11,490 | |
Emerging Markets Dividend | | $ | 55 | | | | — | | | $ | 51 | | | | — | | | $ | 45 | | | $ | 151 | |
Energy & Resources | | $ | 164 | | | | — | | | $ | 11,320 | | | $ | 833 | | | $ | 2,349 | | | $ | 14,666 | |
| | | | | | | | | | | | | | | | | | | | | | | | |
| Transfer Agent Fees Reimbursed | | Institutional | | | Service | | | Investor A | | | Investor B | | | Investor C | | | Total | |
All-Cap Energy & Resources | | $ | 18,001 | | | $ | 121 | | | $ | 19,023 | | | $ | 5,491 | | | $ | 8,830 | | | $ | 51,466 | |
Emerging Markets Dividend | | $ | 240 | | | | — | | | $ | 1,504 | | | | — | | | $ | 551 | | | $ | 2,295 | |
Energy & Resources | | $ | 923 | | | | — | | | $ | 20,440 | | | $ | 4,078 | | | $ | 8,313 | | | $ | 33,754 | |
If during a Fund’s fiscal year the operating expenses of a share class, that at any time during the prior two fiscal years received a waiver or reimbursement from the Manager, are less than the expense limit for that share class, the Manager is entitled to be reimbursed by such share class up to the lesser of (a) the amount of fees waived or expenses reimbursed during those prior two fiscal years under the agreement and (b) the amount by which the expense limit for that share class exceeds the operating expenses of the share class for the current fiscal year, provided that: (1) the Fund, of which the share class is a part, has more than $50 million in assets for the fiscal year and (2) the Manager or an affiliate continues to serve as the Fund’s investment advisor or administrator. In the event the expense limit for a share class is changed subsequent to a fiscal year in which the Manager becomes entitled to reimbursement for fees waived or reimbursed, the amount available to reimburse the Manager shall be calculated by reference to the expense limit for that share class in effect at the time the Manager became entitled to receive such reimbursement, rather than the subsequently changed expense limit for that share class.
For the six months ended March 31, 2015, the Manager recouped waivers and/or reimbursements previously recorded of $2,465 for Energy & Resources Institutional Shares.
| | | | | | |
| | | BLACKROCK FUNDS | | MARCH 31, 2015 | | 43 |
| | |
| Notes to Financial Statements (continued) | | |
On March 31, 2015, the Fund level and class specific waivers and/or reimbursements subject to possible future recoupment under the expense limitation agreement are as follows:
| | | | | | | | | | | | |
| | | Expires September 30, | |
| | | 2015 | | | 2016 | | | 2017 | |
All-Cap Energy & Resources | | | | | | | | | | | | |
Fund Level | | $ | 406 | | | $ | 9,430 | | | $ | 15 | |
Institutional | | $ | 25,585 | | | $ | 14,085 | | | $ | 22,228 | |
Service | | | — | | | $ | 65 | | | $ | 273 | |
Investor A | | $ | 540 | | | $ | 11,605 | | | $ | 35,525 | |
Investor B | | $ | 22,079 | | | $ | 15,786 | | | $ | 6,783 | |
Investor C | | $ | 7,867 | | | $ | 11,239 | | | $ | 16,684 | |
Emerging Markets Dividend | | | | | | | | | | | | |
Fund Level | | $ | 221,737 | | | $ | 248,998 | | | $ | 95,139 | |
Institutional | | $ | 1,750 | | | $ | 1,503 | | | $ | 599 | |
Investor A | | $ | 1,610 | | | $ | 3,247 | | | $ | 1,747 | |
Investor C | | $ | 461 | | | $ | 1,046 | | | $ | 650 | |
Energy & Resources | | | | | | | | | | | | |
Institutional | | | — | | | $ | 6,343 | | | $ | 6,307 | |
Investor A | | | — | | | | — | | | $ | 56,663 | |
Investor B | | $ | 11,644 | | | $ | 8,537 | | | $ | 5,157 | |
Investor C | | | — | | | $ | 1,415 | | | $ | 17,348 | |
For the six months ended March 31, 2015, affiliates earned underwriting discounts, direct commissions and dealer concessions on sales of each Fund’s Investor A Shares as follows:
| | | | |
All-Cap Energy & Resources | | $ | 9,743 | |
Emerging Markets Dividend | | $ | 439 | |
Energy & Resources | | $ | 14,515 | |
For the six months ended March 31, 2015, affiliates received CDSCs as follows:
| | | | | | | | | | | | |
| | | Investor A | | | Investor B | | | Investor C | |
All-Cap Energy & Resources | | $ | 9,184 | | | $ | 134 | | | $ | 1,984 | |
Emerging Markets Dividend | | | — | | | | — | | | $ | 37 | |
Energy & Resources | | $ | 1 | | | $ | 300 | | | $ | 3,866 | |
The U.S. Securities and Exchange Commission has issued an exemptive order which permits BIM, an affiliate of the Manager, to serve as securities lending agent for the Funds, subject to applicable conditions. As securities lending agent, BIM bears all operational costs directly related to securities lending. The Funds are responsible for expenses in connection with the investment of cash collateral received for securities on loan (the “collateral investment expenses”). The cash collateral is invested in a private investment company managed by the Manager or its affiliates. However, BIM has agreed to cap the collateral investment expenses of the private investment company to an annual rate of 0.04%. The investment advisor to the private investment company will not charge any advisory fees with respect to shares purchased by the Funds.
Securities lending income is equal to the total of income earned from the reinvestment of cash collateral, net of fees and other payments to and from borrowers of securities, and less the collateral investment expenses. Each Fund retains a portion of securities lending income and remits a remaining portion to BIM as compensation for its services as securities lending agent. BIM may lend securities only when the difference between the borrower rebate rate and the risk free rate exceeds a certain level (such securities, the “specials only securities”).
Pursuant to such agreement, each Fund retains 80% of securities lending income. In addition, commencing the business day following the date that the aggregate securities lending income earned across certain funds in the Equity-Liquidity Complex in a calendar year exceeds a specific threshold, each Fund, pursuant to the securities lending agreement, will retain for the remainder of the calendar year securities lending income in an amount equal to 85% of securities lending income. The share of securities lending income earned by each Fund is shown as securities lending — affiliated —net in the Statements of Operations. For the six months ended March 31, 2015, All-Cap Energy & Resources and Emerging Markets Dividend paid BIM $10 and $23, respectively, for securities lending agent services.
Emerging Markets Dividend recorded payments from an affiliate to compensate for foregone securities lending revenue, which is shown as other income — affiliated in the Statements of Operations.
| | | | | | |
| 44 | | BLACKROCK FUNDS | | MARCH 31, 2015 | | |
| | |
| Notes to Financial Statements (continued) | | |
Certain officers and/or trustees of the Trust are officers and/or directors of BlackRock or its affiliates. The Funds reimburse the Manager for a portion of the compensation paid to the Trust’s Chief Compliance Officer, which is included in officer and trustees in the Statements of Operations.
6. Purchases and Sales:
Purchases and sales of investments, excluding short-term securities, for the six months ended March 31, 2015, were as follows:
| | | | | | | | |
| | | Purchases | | | Sales | |
All-Cap Energy & Resources | | $ | 37,760,081 | | | $ | 44,522,544 | |
Emerging Markets Dividend | | $ | 1,409,432 | | | $ | 1,746,606 | |
Energy & Resources | | $ | 169,751,900 | | | $ | 124,179,500 | |
7. Income Tax Information:
It is the Funds’ policy to comply with the requirements of the Internal Revenue Code of 1986, as amended, applicable to regulated investment companies, and to distribute substantially all of their taxable income to their shareholders. Therefore, no federal income tax provision is required.
The Funds file U.S. federal and various state and local tax returns. No income tax returns are currently under examination. The statute of limitations on All-Cap Energy & Resources’ and Energy & Resources’ U.S. federal tax returns remains open for each of the four years ended September 30, 2014. The statute of limitations on Emerging Markets Dividend’s U.S. federal tax returns remains open for the period ended September 30, 2011 and the three years ended September 30, 2014. The statutes of limitations on each Fund’s state and local tax returns may remain open for an additional year depending upon the jurisdiction.
Management has analyzed tax laws and regulations and their application to the Funds as of March 31, 2015, inclusive of the open tax return years, and does not believe there are any uncertain tax positions that require recognition of a tax liability in the Funds’ financial statements.
As of September 30, 2014, the Funds had capital loss carryforwards available to offset future realized capital gains through the indicated expiration dates as follows:
| | | | | | | | | | | | |
| Expires September 30, | | All-Cap
Energy &
Resources | | | Emerging
Markets
Dividend | | | Energy &
Resources | |
2018 | | $ | 51,018,124 | | | | — | | | | — | |
2019 | | | — | | | $ | 18,788 | | | | — | |
No expiration date1 | | | — | | | | 622,302 | | | $ | 87,909,363 | |
Total | | $ | 51,018,124 | | | $ | 641,090 | | | $ | 87,909,363 | |
| | | | |
| | 1 | | Must be utilized prior to losses subject to expiration. |
As of March 31, 2015, gross unrealized appreciation and depreciation based on cost for federal income tax purposes were as follows:
| | | | | | | | | | | | |
| | | All-Cap Energy &
Resources | | | Emerging
Markets
Dividend | | | Energy &
Resources | |
Tax cost | | $ | 155,963,411 | | | $ | 4,293,263 | | | $ | 448,634,437 | |
| | | | |
Gross unrealized appreciation | | $ | 12,496,798 | | | $ | 382,884 | | | $ | 42,689,168 | |
Gross unrealized depreciation | | | (17,733,829 | ) | | | (285,930 | ) | | | (81,953,010 | ) |
| | | | |
Net unrealized appreciation (depreciation) | | $ | (5,237,031 | ) | | $ | 96,954 | | | $ | (39,263,842 | ) |
| | | | |
8. Bank Borrowings:
The Trust, on behalf of the Funds, along with certain other funds managed by the Manager and its affiliates (“Participating Funds”), was a party to a 364-day, $1.1 billion credit agreement with a group of lenders, under which the Funds may borrow to fund shareholder redemptions. Excluding commitments designated for a certain individual fund, the Participating Funds, including the Funds, could borrow up to an aggregate commitment amount of $650 million, subject to asset coverage and other limitations as specified in the agreement. Effective November 25, 2014, the credit agreement was amended to an aggregate commitment amount of $2.1 billion, of which the Participating Funds, including the Funds, can borrow up to $1.6 billion at any time outstanding, subject to asset coverage and other limitations as specified in the agreement. The agreement terminates on April 23, 2015, unless otherwise extended to November 24, 2015 or renewed for a period of 364 days from April 23, 2015. The amended agreement has the following
| | | | | | |
| | | BLACKROCK FUNDS | | MARCH 31, 2015 | | 45 |
| | |
| Notes to Financial Statements (continued) | | |
terms: a fee of 0.06% per annum on unused commitment amounts and interest at a rate equal to the higher of (a) one-month LIBOR (but, in any event, not less than 0.00%) on the date the loan is made plus 0.80% per annum or (b) the Fed Funds rate (but, in any event, not less than 0.00%) in effect from time to time plus 0.80% per annum on amounts borrowed. Participating Funds paid administration, legal and arrangement fees, which are included in miscellaneous expenses in the Statements of Operations, and along with commitment fees, were allocated among such funds based upon portions of the aggregate commitment available to them and relative net assets of Participating Funds. During the six months ended March 31, 2015, the Funds did not borrow under the credit agreement.
9. Principal Risks:
In the normal course of business, the Funds invest in securities and enter into transactions where risks exist due to fluctuations in the market (market risk) or failure of the issuer of a security to meet all its obligations (issuer credit risk). The value of securities held by the Funds may decline in response to certain events, including those directly involving the issuers whose securities are owned by the Funds; conditions affecting the general economy; overall market changes; local, regional or global political, social or economic instability; and currency, interest rate and price fluctuations. Similar to issuer credit risk, the Funds may be exposed to counterparty credit risk, or the risk that an entity with which the Funds have unsettled or open transactions may fail to or be unable to perform on its commitments. The Funds manage counterparty credit risk by entering into transactions only with counterparties that they believe have the financial resources to honor their obligations and by monitoring the financial stability of those counterparties. Financial assets, which potentially expose the Funds to market, issuer and counterparty credit risks, consist principally of financial instruments and receivables due from counterparties. The extent of the Funds’ exposure to market, issuer and counterparty credit risks with respect to these financial assets is generally approximated by their value recorded in the Statements of Assets and Liabilities, less any collateral held by the Funds.
As of March 31, 2015, All-Cap Energy & Resources and Energy & Resources invested a significant portion of their assets in securities in the energy sector. Changes in economic conditions affecting such sector would have a greater impact on All-Cap Energy & Resources and Energy & Resources and could affect the value, income and/or liquidity of positions in such securities.
As of March 31, 2015, Emerging Markets Dividend had the following industry classifications:
| | | | |
| Industry | | Percent of Long-Term Investments | |
Banks | | | 19 | % |
Transportation Infrastructure | | | 11 | |
Semiconductors & Semiconductor Equipment | | | 10 | |
Wireless Telecommunication Services | | | 9 | |
Insurance | | | 7 | |
Oil, Gas & Consumable Fuels | | | 6 | |
Other1 | | | 38 | |
| | 1 | | All other industries held were each less than 5% of long-term investments. |
10. Capital Share Transactions:
Transactions in capital shares for each class were as follows:
| | | | | | | | | | | | | | | | | | |
| | | Six Months Ended
March 31, 2015 | | | | | Year Ended
September 30, 2014 | |
| All-Cap Energy & Resources | | Shares | | | Amount | | | | | Shares | | | Amount | |
Institutional | | | | | | | | | | | | | | | | | | |
Shares sold | | | 898,879 | | | $ | 12,400,701 | | | | | | 646,900 | | | $ | 10,752,489 | |
Shares issued in reinvestment of distributions | | | 39,582 | | | | 525,654 | | | | | | 15,019 | | | | 206,142 | |
Shares redeemed | | | (821,405 | ) | | | (11,162,721 | ) | | | | | (732,240 | ) | | | (11,884,287 | ) |
| | | | | | | | | | |
Net increase (decrease) | | | 117,056 | | | $ | 1,763,634 | | | | | | (70,321 | ) | | $ | (925,656 | ) |
| | | | | | | | | | |
| | | | | | | | | | | | | | | | | | |
Service | | | | | | | | | | | | | | | | | | |
Shares sold | | | 5,833 | | | $ | 77,369 | | | | | | 23,463 | | | $ | 375,705 | |
Shares issued in reinvestment of distributions | | | 1,395 | | | | 18,098 | | | | | | 521 | | | | 7,757 | |
Shares redeemed | | | (28,269 | ) | | | (387,328 | ) | | | | | (49,100 | ) | | | (757,516 | ) |
| | | | | | | | | | |
Net decrease | | | (21,041 | ) | | $ | (291,861 | ) | | | | | (25,116 | ) | | $ | (374,054 | ) |
| | | | | | | | | | |
| | | | | | |
| 46 | | BLACKROCK FUNDS | | MARCH 31, 2015 | | |
| | |
| Notes to Financial Statements (continued) | | |
| | | | | | | | | | | | | | | | | | |
| | | Six Months Ended
March 31, 2015 | | | | | Year Ended
September 30, 2014 | |
| All-Cap Energy & Resources (concluded) | | Shares | | | Amount | | | | | Shares | | | Amount | |
Investor A | | | | | | | | | | | | | | | | | | |
Shares sold and automatic conversion of shares | | | 784,151 | | | $ | 10,478,685 | | | | | | 958,490 | | | $ | 15,089,057 | |
Shares issued in reinvestment of distributions | | | 66,408 | | | | 859,979 | | | | | | 28,029 | | | | 439,558 | |
Shares redeemed | | | (1,156,396 | ) | | | (15,581,719 | ) | | | | | (2,140,226 | ) | | | (33,842,288 | ) |
| | | | | | | | | | |
Net decrease | | | (305,837 | ) | | $ | (4,243,055 | ) | | | | | (1,153,707 | ) | | $ | (18,313,673 | ) |
| | | | | | | | | | |
| | | | | | | | | | | | | | | | | | |
Investor B | | | | | | | | | | | | | | | | | | |
Shares sold | | | 2,575 | | | $ | 33,706 | | | | | | 4,098 | | | $ | 60,909 | |
Shares redeemed and automatic conversion of shares | | | (63,565 | ) | | | (809,317 | ) | | | | | (436,554 | ) | | | (6,458,408 | ) |
| | | | | | | | | | |
Net decrease | | | (60,990 | ) | | $ | (775,611 | ) | | | | | (432,456 | ) | | $ | (6,397,499 | ) |
| | | | | | | | | | |
| | | | | | | | | | | | | | | | | | |
Investor C | | | | | | | | | | | | | | | | | | |
Shares sold | | | 608,535 | | | $ | 7,559,112 | | | | | | 271,508 | | | $ | 4,146,097 | |
Shares issued in reinvestment of distributions | | | 13,701 | | | | 169,204 | | | | | | — | | | | — | |
Shares redeemed | | | (1,004,653 | ) | | | (12,792,014 | ) | | | | | (1,015,038 | ) | | | (15,064,990 | ) |
| | | | | | | | | | |
Net decrease | | | (382,417 | ) | | $ | (5,063,698 | ) | | | | | (743,530 | ) | | $ | (10,918,893 | ) |
| | | | | | | | | | |
Total Net Decrease | | | (653,229 | ) | | $ | (8,610,591 | ) | | | | | (2,425,130 | ) | | $ | (36,929,775 | ) |
| | | | | | | | | | |
| | | | | | | | | | | | | | | | | | |
| Emerging Markets Dividend | | | | | | | | | | | | | | |
Institutional | | | | | | | | | | | | | | | | | | |
Shares sold | | | 23,810 | | | $ | 201,559 | | | | | | 14,124 | | | $ | 128,245 | |
Shares issued in reinvestment of distributions | | | 409 | | | | 3,382 | | | | | | 391 | | | | 3,458 | |
Shares redeemed | | | (15,025 | ) | | | (124,865 | ) | | | | | (3,794 | ) | | | (34,150 | ) |
| | | | | | | | | | |
Net increase | | | 9,194 | | | $ | 80,076 | | | | | | 10,721 | | | $ | 97,553 | |
| | | | | | | | | | |
| | | | | | | | | | | | | | | | | | |
Investor A | | | | | | | | | | | | | | | | | | |
Shares sold | | | 40,644 | | | $ | 342,661 | | | | | | 106,687 | | | $ | 958,337 | |
Shares issued in reinvestment of distributions | | | 3,014 | | | | 24,954 | | | | | | 4,316 | | | | 38,037 | |
Shares redeemed | | | (103,785 | ) | | | (867,233 | ) | | | | | (41,532 | ) | | | (366,879 | ) |
| | | | | | | | | | |
Net increase (decrease) | | | (60,127 | ) | | $ | (499,618 | ) | | | | | 69,471 | | | $ | 629,495 | |
| | | | | | | | | | |
| | | | | | | | | | | | | | | | | | |
Investor C | | | | | | | | | | | | | | | | | | |
Shares sold | | | 6,199 | | | $ | 52,319 | | | | | | 34,522 | | | $ | 301,649 | |
Shares issued in reinvestment of distributions | | | 693 | | | | 5,717 | | | | | | 840 | | | | 7,376 | |
Shares redeemed | | | (17,001 | ) | | | (139,000 | ) | | | | | (1,751 | ) | | | (15,426 | ) |
| | | | | | | | | | |
Net increase (decrease) | | | (10,109 | ) | | $ | (80,964 | ) | | | | | 33,611 | | | $ | 293,599 | |
| | | | | | | | | | |
Total Net Increase (Decrease) | | | (61,042 | ) | | $ | (500,506 | ) | | | | | 113,803 | | | $ | 1,020,647 | |
| | | | | | | | | | |
| | | | | | | | | | | | | | | | | | |
| Energy & Resources | | | | | | | | | | | | | | |
Institutional | | | | | | | | | | | | | | | | | | |
Shares sold | | | 2,796,180 | | | $ | 90,068,297 | | | | | | 725,115 | | | $ | 29,170,844 | |
Shares redeemed | | | (829,077 | ) | | | (24,367,807 | ) | | | | | (1,089,938 | ) | | | (42,500,141 | ) |
| | | | | | | | | | |
Net increase (decrease) | | | 1,967,103 | | | $ | 65,700,490 | | | | | | (364,823 | ) | | $ | (13,329,297 | ) |
| | | | | | | | | | |
| | | | | | |
| | | BLACKROCK FUNDS | | MARCH 31, 2015 | | 47 |
| | |
| Notes to Financial Statements (concluded) | | |
| | | | | | | | | | | | | | | | | | |
| | | Six Months Ended
March 31, 2015 | | | | | Year Ended
September 30, 2014 | |
| Energy & Resources (concluded) | | Shares | | | Amount | | | | | Shares | | | Amount | |
Investor A | | | | | | | | | | | | | | | | | | |
Shares sold and automatic conversion of shares | | | 1,467,250 | | | $ | 36,217,985 | | | | | | 1,705,523 | | | $ | 59,839,840 | |
Shares redeemed | | | (2,387,301 | ) | | | (60,407,512 | ) | | | | | (4,044,870 | ) | | | (138,244,319 | ) |
| | | | | | | | | | |
Net decrease | | | (920,051 | ) | | $ | (24,189,527 | ) | | | | | (2,339,347 | ) | | $ | (78,404,479 | ) |
| | | | | | | | | | |
| | | | | | | | | | | | | | | | | | |
Investor B | | | | | | | | | | | | | | | | | | |
Shares sold | | | 1,960 | | | $ | 34,104 | | | | | | 2,941 | | | $ | 75,125 | |
Shares redeemed and automatic conversion of shares | | | (25,275 | ) | | | (476,157 | ) | | | | | (66,483 | ) | | | (1,647,628 | ) |
| | | | | | | | | | |
Net decrease | | | (23,315 | ) | | $ | (442,053 | ) | | | | | (63,542 | ) | | $ | (1,572,503 | ) |
| | | | | | | | | | |
| | | | | | | | | | | | | | | | | | |
Investor C | | | | | | | | | | | | | | | | | | |
Shares sold | | | 544,893 | | | $ | 9,581,215 | | | | | | 279,728 | | | $ | 7,033,404 | |
Shares redeemed | | | (728,280 | ) | | | (13,552,207 | ) | | | | | (1,122,560 | ) | | | (27,505,260 | ) |
| | | | | | | | | | |
Net decrease | | | (183,387 | ) | | $ | (3,970,992 | ) | | | | | (842,832 | ) | | $ | (20,471,856 | ) |
| | | | | | | | | | |
Total Net Increase (Decrease) | | | 840,350 | | | $ | 37,097,918 | | | | | | (3,610,544 | ) | | $ | (113,778,135 | ) |
| | | | | | | | | | |
At March 31, 2015, shares owned by affiliates of Emerging Markets Dividend were as follows:
| | | | |
| Institutional | | Investor A | | Investor C |
296,000 | | 2,000 | | 2,000 |
11. Subsequent Events:
Management’s evaluation of the impact of all subsequent events on the Funds’ financial statements was completed through the date the financial statements were issued and the following item was noted:
Effective April 23, 2015, the 364-day, $2.1 billion credit agreement to which the Funds are a party, was further amended to expire on April 21, 2016, unless otherwise extended or renewed.
| | | | | | |
| 48 | | BLACKROCK FUNDS | | MARCH 31, 2015 | | |
Rodney D. Johnson, Chair of the Board and Trustee
David O. Beim, Trustee
Collette Chilton, Trustee
Frank J. Fabozzi, Trustee
Dr. Matina S. Horner, Trustee
Herbert I. London, Trustee
Ian A. MacKinnon, Trustee
Cynthia A. Montgomery, Trustee
Barbara G. Novick, Trustee
Joseph P. Platt, Trustee
Robert C. Robb, Jr., Trustee
Toby Rosenblatt, Trustee
Mark Stalnecker, Trustee
Kenneth L. Urish, Trustee
Frederick W. Winter, Trustee
John M. Perlowski, President and Chief Executive Officer
Jennifer McGovern, Vice President
Neal Andrews, Chief Financial Officer
Jay Fife, Treasurer
Charles Park, Chief Compliance Officer
Fernanda Piedra, Anti-Money Laundering Compliance Officer
Benjamin Archibald, Secretary
Effective December 31, 2014, Paul L. Audet and Henry Gabbay resigned as Trustees of the Trust and Ronald W. Forbes resigned as a Trustee of the Trust and Co-Chair of the Board. Effective January 1, 2015, Collette Chilton, Barbara G. Novick and Mark Stalnecker were appointed to serve as Trustees of the Trust.
Effective March 1, 2015, Charles Park resigned as Anti-Money Laundering Compliance Officer of the Trust and Fernanda Piedra became Anti- Money Laundering Compliance Officer of the Trust.
| | | | | | |
| | | | |
Investment Advisor and Administrator BlackRock Advisors, LLC Wilmington, DE 19809 | | Accounting Agent and Transfer Agent BNY Mellon Investment Servicing (US) Inc. Wilmington, DE 19809 | | Independent Registered Public Accounting Firm Deloitte & Touche LLP Philadelphia, PA 19103 | | Address of the Trust 100 Bellevue Parkway Wilmington, DE 19809 |
| | | | | | |
Sub-Advisor BlackRock International Limited Edinburgh, EH3 8BL United Kingdom | | Custodian The Bank of New York Mellon New York, NY 10286 | | Distributor BlackRock Investments, LLC New York, NY 10022 | | Legal Counsel Sidley Austin LLP New York, NY 10019 |
| | | | | | |
| | | BLACKROCK FUNDS | | MARCH 31, 2015 | | 49 |
Householding
The Funds will mail only one copy of shareholder documents, including prospectuses, annual and semi-annual reports and proxy statements, to shareholders with multiple accounts at the same address. This practice is commonly called “householding” and is intended to reduce expenses and eliminate duplicate mailings of shareholder documents. Mailings of your shareholder documents may be householded indefinitely unless you instruct us otherwise. If you do not want the mailing of these documents to be combined with those for other members of your household, please call the Funds at (800) 441-7762.
Availability of Quarterly Schedule of Investments
The Funds file their complete schedule of portfolio holdings with the SEC for the first and third quarters of each fiscal year on Form N-Q. The Funds’ Forms N-Q are available on the SEC’s website at http://www.sec.gov and may also be reviewed and copied at the SEC’s Public Reference Room in Washington, D.C. Information on how to access documents on the SEC’s website without charge may be obtained by calling (800) SEC-0330. The Funds’ Forms N-Q may also be obtained upon request and without charge by calling (800) 441-7762.
Availability of Proxy Voting Policies and Procedures
A description of the policies and procedures that the Funds use to determine how to vote proxies relating to portfolio securities is available upon request and without charge (1) by calling (800) 441-7762; (2) at http://www.blackrock.com; and (3) on the SEC’s website at http://www.sec.gov.
Availability of Proxy Voting Record
Information about how the Funds voted proxies relating to securities held in the Funds’ portfolios during the most recent 12-month period ended June 30 is available upon request and without charge (1) at http://www.blackrock.com or by calling (800) 441-7762 and (2) on the SEC’s website at http://www.sec.gov.
BlackRock’s Mutual Fund Family
BlackRock offers a diverse lineup of open-end mutual funds crossing all investment styles and managed by experts in equity, fixed income and taxexempt investing. Visit http://www.blackrock.com for more information.
Account Information
Call us at (800) 441-7762 from 8:00 AM to 6:00 PM EST on any business day to get information about your account balances, recent transactions and share prices. You can also reach us on the Web at http://www.blackrock.com/funds.
Automatic Investment Plans
Investor Class shareholders who want to invest regularly can arrange to have $50 or more automatically deducted from their checking or savings account and invested in any of the BlackRock funds.
Systematic Withdrawal Plans
Investor Class shareholders can establish a systematic withdrawal plan and receive periodic payments of $50 or more from their BlackRock funds, as long as their account balance is at least $10,000.
Retirement Plans
Shareholders may make investments in conjunction with Traditional, Rollover, Roth, Coverdell, Simple IRAs, SEP IRAs and 403(b) Plans.
| | | | | | |
| 50 | | BLACKROCK FUNDS | | MARCH 31, 2015 | | |
| | |
| Additional Information (concluded) | | |
|
| BlackRock Privacy Principles |
BlackRock is committed to maintaining the privacy of its current and former fund investors and individual clients (collectively, “Clients”) and to safeguarding their non-public personal information. The following information is provided to help you understand what personal information BlackRock collects, how we protect that information and why in certain cases we share such information with select parties.
If you are located in a jurisdiction where specific laws, rules or regulations require BlackRock to provide you with additional or different privacy-related rights beyond what is set forth below, then BlackRock will comply with those specific laws, rules or regulations.
BlackRock obtains or verifies personal non-public information from and about you from different sources, including the following: (i) information we receive from you or, if applicable, your financial intermediary, on applications, forms or other documents; (ii) information about your transactions with us, our affiliates, or others; (iii) information we receive from a consumer reporting agency; and (iv) from visits to our websites.
BlackRock does not sell or disclose to non-affiliated third parties any non-public personal information about its Clients, except as permitted by law or as is necessary to respond to regulatory requests or to service Client accounts. These non-affiliated third parties are required to protect the confidentiality and security of this information and to use it only for its intended purpose.
We may share information with our affiliates to service your account or to provide you with information about other BlackRock products or services that may be of interest to you. In addition, BlackRock restricts access to non-public personal information about its Clients to those BlackRock employees with a legitimate business need for the information. BlackRock maintains physical, electronic and procedural safeguards that are designed to protect the non-public personal information of its Clients, including procedures relating to the proper storage and disposal of such information.
| | | | | | |
| | | BLACKROCK FUNDS | | MARCH 31, 2015 | | 51 |
| | |
This report is intended for current holders. It is not authorized for use as an offer of sale or a solicitation of an offer to buy shares of the Funds unless preceded or accompanied by the Funds’ current prospectus. Past performance results shown in this report should not be considered a representation of future performance. Investment returns and principal value of shares will fluctuate so that shares, when redeemed, may be worth more or less than their original cost. Statements and other information herein are as dated and are subject to change. | |  |
| | |
Eq-Allcap-3/15-SAR | |  |
MARCH 31, 2015
| | | | |
SEMI-ANNUAL REPORT (UNAUDITED) | | | | BLACKROCK® |
BlackRock FundsSM
▶ BlackRock Flexible Equity Fund
▶ BlackRock Mid-Cap Growth Equity Portfolio
▶ BlackRock Small Cap Growth Equity Portfolio
| | |
| Not FDIC Insured ¡ May Lose Value ¡ No Bank Guarantee | | |
| | |
 | | |
| | Shareholders can sign up for e-mail notifications of quarterly statements, annual and semi-annual shareholder reports and prospectuses by enrolling in the electronic delivery program. Electronic copies of shareholder reports and prospectuses are also available on Blackrock’s website. |
| | TO ENROLL IN ELECTRONIC DELIVERY: |
| | Shareholders who hold Accounts with Investment Advisors, Banks or Brokerages: Please contact your financial advisor. Please note that not all investment advisors, banks or brokerages may offer this service. |
| | Shareholders Who Hold Accounts Directly with Blackrock: |
| | 1. Access the Blackrock website at blackrock.com |
| | 2. Select “Access Your Account” |
| | 3. Next, select “eDelivery” in the “Related Resources” box and follow the sign-up instructions |
| | | | | | |
| 2 | | BLACKROCK FUNDS | | MARCH 31, 2015 | | |
Dear Shareholder,
Market volatility has remained low from a long-term perspective, but increased over the course of 2014 amid higher valuations in risk assets (such as equities and high yield bonds), geopolitical risks, uneven global economic growth and uncertainty around policy moves from the world’s largest central banks. As the U.S. Federal Reserve (the “Fed”) gradually reduced its bond buying program (which ultimately ended in October 2014), U.S. interest rates surprisingly trended lower and stock prices forged ahead despite high valuations on the back of a multi-year bull market. Geopolitical tensions intensified in Ukraine and the Middle East and oil prices became highly volatile in the middle of the summer, stoking worries about economic growth outside the United States. As the U.S. economy continued to show steady improvement, the stronger data caused concern among investors that the Fed would raise short-term rates sooner than previously anticipated. The U.S. dollar appreciated and global credit markets tightened, ultimately putting a strain on investor flows, and financial markets broadly weakened in the third quarter.
U.S. economic growth picked up considerably in the fourth quarter while the broader global economy showed signs of slowing. U.S. markets significantly outperformed international markets even as the European Central Bank (“ECB”) and the Bank of Japan eased monetary policy, which drove further strengthening in the U.S. dollar. Oil prices plummeted in the fourth quarter due to a global supply-and-demand imbalance, sparking a selloff in energy-related assets and stress in emerging markets. Fixed income investors piled into U.S. Treasuries as their persistently low yields became relatively attractive as compared to international sovereign debt.
Equity markets reversed in the first quarter of 2015 and U.S. stocks underperformed international markets, notably Europe and Japan, but also emerging markets. Investors had held high expectations for the U.S. economy, but after a harsh winter, first-quarter data disappointed and high valuations took their toll on U.S. stocks. Meanwhile, economic reports in Europe and Asia easily beat investors’ very low expectations for those economies, and accommodative policies from global central banks helped international equities rebound. The ECB’s asset purchase program (announced in January and commenced in March) was the largest in scale and effect on the markets. Overall, market volatility decreased in the first quarter as global risks abated, with a ceasefire in Ukraine and an improving outlook for Greece’s continued membership in the Eurozone.
At BlackRock, we believe investors need to think globally, extend their scope across a broad array of asset classes and be prepared to move freely as market conditions change over time. We encourage you to talk with your financial advisor and visit blackrock.com for further insight about investing in today’s markets.
Sincerely,

Rob Kapito
President, BlackRock Advisors, LLC

Rob Kapito
President, BlackRock Advisors, LLC
| | | | | | | | |
| Total Returns as of March 31, 2015 | |
| | | 6-month | | | 12-month | |
U.S. large cap equities
(S&P 500® Index) | | | 5.93 | % | | | 12.73 | % |
U.S. small cap equities
(Russell 2000® Index) | | | 14.46 | | | | 8.21 | |
International equities
(MSCI Europe, Australasia, Far East Index) | | | 1.13 | | | | (0.92 | ) |
Emerging market equities
(MSCI Emerging Markets Index) | | | (2.37 | ) | | | 0.44 | |
3-month Treasury bill
(BofA Merrill Lynch
3-Month U.S. Treasury
Bill Index) | | | 0.01 | | | | 0.03 | |
U.S. Treasury securities
(BofA Merrill Lynch
10- Year U.S. Treasury
Index) | | | 6.25 | | | | 9.88 | |
U.S. investment grade
bonds (Barclays U.S.
Aggregate Bond Index) | | | 3.43 | | | | 5.72 | |
Tax-exempt municipal
bonds (S&P Municipal Bond Index) | | | 2.29 | | | | 6.60 | |
U.S. high yield bonds
(Barclays U.S. Corporate
High Yield 2% Issuer
Capped Index) | | | 1.50 | | | | 2.00 | |
|
| Past performance is no guarantee of future results. Index performance is shown for illustrative purposes only. You cannot invest directly in an index. | |
| | | | | | |
| | | THIS PAGE NOT PART OF YOUR FUND REPORT | | | | 3 |
| | | | |
| Fund Summary as of March 31, 2015 | | | BlackRock Flexible Equity Fund | |
BlackRock Flexible Equity Fund’s (the “Fund”) investment objective is to seek to achieve long-term total return.
|
| Portfolio Management Commentary |
How did the Fund perform?
| • | | For the six-month period ended March 31, 2015, the Fund underperformed its benchmark, the S&P 500® Index. |
What factors influenced performance?
| • | | In a positive market environment, portfolio protection in the form of cash and short index futures were the largest detractors from performance. Due to concerns regarding stock market valuations, the Fund’s investment advisor sought to insulate the Fund from absolute losses and reduce beta by maintaining an elevated cash position and a series of short index futures positions. (Beta measures a portfolio’s volatility relative to the market as a whole.) The elevated cash position detracted from relative performance given that equity markets rallied during the fourth quarter of 2014. Short index positions on the Nikkei 225® Index, Russell 2000® Index, Nasdaq 100® Index and S&P 500® Index all detracted from performance at a time in which these indices gained ground. |
| • | | The Fund’s positions in North American oil & gas producers detracted from performance as the rapid decline in global oil prices pressured both groups during the period. While the Fund strived to emphasize producers with the ability to remain profitable in a low-price environment, even these types of companies were punished amid the broader sell-off in the energy sector. Against this backdrop, holdings Suncor Energy, Inc., Painted Pony Petroleum, Ltd. and EQT Corp. detracted from overall results. |
| • | | The Fund’s positioning in the information technology (“IT”) sector also hindered relative performance, with an overweight in poor-performing Micron Technology, Inc. and an underweight in Apple, Inc. having the largest negative impact. |
| • | | Conversely, the Fund experienced positive stock selection across multiple sectors. Within consumer discretionary, Orbitz Worldwide, Inc. made the largest contribution to return after industry leader Expedia, Inc. announced it would acquire the company at a premium. Since Orbitz Worldwide, Inc. was a top ten position in the Fund, the resulting rally in the stock helped buoy overall portfolio results. The |
| | | Fund had initiated the investment on the belief that the company was well positioned to either engage in a share buyback or be acquired by a competitor or private equity firm. |
| • | | When combined with the positive impact from currency management, the Fund’s position in Japan Airlines Co., Ltd. also made an important contribution to results. Falling oil prices provided a lift to the airline industry globally, boosting the share price of the Japanese carrier. Additionally, in a period of increased currency volatility and U.S. dollar strength, the decision to manage yen exposure in the stock proved to be a key driver of returns. |
| • | | Lastly, the Fund benefited from its position in managed-care firm UnitedHealth Group Inc., which rallied due to continued operating success and widespread strength in the broader health care sector. |
Describe recent portfolio activity.
| • | | Due to a combination of portfolio trading activity and market movement, the Fund’s weighting in the health care sector increased substantially during the period, specifically within the health care providers & services industry. In addition, the Fund increased its allocations to financials (mainly banks), IT (largely within the internet software & services and communications equipment industries) and consumer staples (primarily beverages). |
| • | | The Fund’s weighting in the consumer discretionary sector decreased significantly, with the largest reduction occurring in the media industry. The Fund also reduced its position in the energy sector, especially within the oil, gas & consumable fuels segment, and in materials, namely in the metals & mining industry. |
Describe portfolio positioning at period end.
| • | | Relative to the S&P 500® Index, the Fund ended the period with its largest sector overweight in health care, followed by financials and IT. Utilities, consumer staples and telecommunication services were the most significant underweights. |
The views expressed reflect the opinions of BlackRock as of the date of this report and are subject to change based on changes in market, economic or other conditions. These views are not intended to be a forecast of future events and are no guarantee of future results.
| | |
| Ten Largest Holdings | | Percent of Long-Term Investments |
| | | | |
UnitedHealth Group, Inc. | | | 5 | % |
CVS Health Corp. | | | 3 | |
JPMorgan Chase & Co. | | | 3 | |
Comcast Corp., Class A | | | 3 | |
Lowe’s Companies, Inc. | | | 3 | |
Google, Inc., Class A | | | 3 | |
3M Co. | | | 3 | |
U.S. Bancorp | | | 3 | |
Bank of America Corp. | | | 3 | |
American International Group, Inc. | | | 2 | |
| | |
| Sector Allocation | | Percent of Long-Term Investments |
| | | | |
Information Technology | | | 23 | % |
Health Care | | | 21 | |
Financials | | | 19 | |
Consumer Discretionary | | | 13 | |
Industrials | | | 8 | |
Consumer Staples | | | 7 | |
Energy | | | 7 | |
Materials | | | 2 | |
For Fund compliance purposes, the Fund’s sector classifications refer to any one or more of the sector sub-classifications used by one or more widely recognized market indexes or ratings group indexes, and/or as defined by the investment advisor. These definitions may not apply for purposes of this report, which may combine sector sub-classifications for reporting ease.
| | | | | | |
| 4 | | BLACKROCK FUNDS | | MARCH 31, 2015 | | |
| | | | |
| | | | BlackRock Flexible Equity Fund | |
|
| Total Return Based on a $10,000 Investment |

| | 1 | Assuming maximum sales charges, if any, transaction costs and other operating expenses, including investment advisory fees and administration fees, if any. Institutional Shares do not have a sales charge. |
| | 2 | Under normal circumstances, the Fund will invest at least 80% of its net assets (plus any borrowings for investment purposes) in equity securities and equity-like securities and instruments with similar economic characteristics. The Fund seeks to invest in securities issued by North American companies. The Fund may invest in companies of any market capitalization size, style, or sector. The Fund’s total return prior to July 31, 2012 are the returns of the Fund when it followed a different investment strategy. |
| | 3 | This unmanaged index covers 500 leading companies and captures approximately 80% coverage of available market capitalization. |
| | | | | | | | | | | | | | | | | | | | | | | | | | | | |
| Performance Summary for the Period Ended March 31, 2015 | | | | | | | | | |
| | | | | | Average Annual Total Returns4 | |
| | | | | | 1 Year | | | 5 Years | | | 10 Years | |
| | | 6-Month
Total Returns | | | w/o sales
charge | | | w/ sales
charge | | | w/o sales
charge | | | w/ sales
charge | | | w/o sales
charge | | | w/ sales
charge | |
Institutional | | | 4.42 | % | | | 4.06 | % | | | N/A | | | | 8.44 | % | | | N/A | | | | 6.43 | % | | | N/A | |
Service | | | 4.17 | | | | 3.73 | | | | N/A | | | | 8.09 | | | | N/A | | | | 6.12 | | | | N/A | |
Investor A | | | 4.27 | | | | 3.75 | | | | (1.70 | )% | | | 8.10 | | | | 6.94 | % | | | 6.11 | | | | 5.54 | % |
Investor B | | | 3.82 | | | | 2.93 | | | | (0.92 | ) | | | 7.26 | | | | 6.96 | | | | 5.47 | | | | 5.47 | |
Investor C | | | 3.79 | | | | 2.89 | | | | 2.04 | | | | 7.25 | | | | 7.25 | | | | 5.30 | | | | 5.30 | |
Class R | | | 4.05 | | | | 3.41 | | | | N/A | | | | 7.72 | | | | N/A | | | | 6.02 | | | | N/A | |
S&P 500® Index | | | 5.93 | | | | 12.73 | | | | N/A | | | | 14.47 | | | | N/A | | | | 8.01 | | | | N/A | |
| | 4 | | Assuming maximum sales charges, if any. Average annual total returns with and without sales charges reflect reductions for distribution and service fees. See “About Fund Performance” on page 10 for a detailed description of share classes, including any related sales charges and fees. |
| | | | N/A—Not applicable as share class and index do not have a sales charge. |
| | | | Past performance is not indicative of future results. |
| | | | | | | | | | | | | | |
| Expense Example |
| | | Actual | | Hypothetical6 | | |
| | | Beginning
Account Value
October 1, 2014 | | Ending
Account Value
March 31, 2015 | | Expenses Paid
During the Period5 | | Beginning
Account Value
October 1, 2014 | | Ending
Account Value
March 31, 2015 | | Expenses Paid
During the Period5 | | Annualized
Expense Ratio |
Institutional | | $1,000.00 | | $1,044.20 | | $4.69 | | $1,000.00 | | $1,020.34 | | $4.63 | | 0.92% |
Service | | $1,000.00 | | $1,041.70 | | $6.26 | | $1,000.00 | | $1,018.80 | | $6.19 | | 1.23% |
Investor A | | $1,000.00 | | $1,042.70 | | $6.32 | | $1,000.00 | | $1,018.75 | | $6.24 | | 1.24% |
Investor B | | $1,000.00 | | $1,038.20 | | $10.21 | | $1,000.00 | | $1,014.91 | | $10.10 | | 2.01% |
Investor C | | $1,000.00 | | $1,037.90 | | $10.21 | | $1,000.00 | | $1,014.91 | | $10.10 | | 2.01% |
Class R | | $1,000.00 | | $1,040.50 | | $8.14 | | $1,000.00 | | $1,016.95 | | $8.05 | | 1.60% |
| | 5 | | For each class of the Fund, expenses are equal to the annualized expense ratio for the class, multiplied by the average account value over the period, multiplied by 182/365 (to reflect the one-half year period shown). |
| | 6 | | Hypothetical 5% annual return before expenses is calculated by prorating the number of days in the most recent fiscal half year divided by 365. |
| | | | See “Disclosure of Expenses” on page 11 for further information on how expenses were calculated. |
| | | | | | |
| | | BLACKROCK FUNDS | | MARCH 31, 2015 | | 5 |
| | | | |
| Fund Summary as of March 31, 2015 | | | BlackRock Mid-Cap Growth Equity Portfolio | |
BlackRock Mid-Cap Growth Equity Portfolio’s (the “Fund”) investment objective is long-term capital appreciation.
|
| Portfolio Management Commentary |
How did the Fund perform?
| • | | For the six-month period ended March 31, 2015, the Fund outperformed its benchmark, the Russell Midcap® Growth Index. |
What factors influenced performance?
| • | | In sector terms, relative performance was supported by the Fund’s limited exposure to the energy sector, which posted significant declines in the reporting period. Additional contributions came from favorable stock selection within information technology (“IT”), particularly software & services, as well as from positioning in health care, namely biotechnology and pharmaceuticals. |
| • | | On an individual stock basis, BioMarin Pharmaceuticals Inc., Vipshop Holdings Ltd. and United Therapeutics Corp. were the Fund’s top contributors. BioMarin gained on improved financial results and investor excitement around the company’s drug pipeline that focuses on rare diseases/disorders. The announced acquisition of Dutch biotech firm Prosensa Holding NV was also a driver in the period, as was market speculation that BioMarin itself could be the next big takeover target in the industry. Vipshop Holdings outperformed after adding a record number of customers in the fourth quarter of 2014 and beating top- and bottom-line expectations. Shares of United Therapeutics climbed after the company received a favorable ruling in its patent infringement lawsuit against competitor Sandoz. Greater appreciation for the potential of the company’s oral version of Remodulin may also have lent support to the stock price. |
| • | | Positions in lululemon athletica inc., Madison Square Garden Co. and Acuity Brands Inc. also added to relative returns. |
| • | | Conversely, at the sector level, industrials was the main source of weakness in the six-month period, with marine industry holding Kirby Corp. as the Fund’s leading individual detractor. The company experienced a rapid and sharp decline in its on-land |
| | diesel engine services business as uncertainty for land-based oil drilling led to order cancellations for new engines. Positioning within airlines and commercial services & supplies further hindered performance in the industrials sector. |
| • | | Elsewhere in the Fund, positions in Netflix Inc. and Liberty TripAdvisor Holdings Inc. detracted from relative returns. Netflix shares sank early in the reporting period after third-quarter subscriber growth missed the company’s prior guidance. Notably, the stock rebounded in the second half as its fourth-quarter earnings report showed subscriber growth back on trend. Liberty TripAdvisor Holdings lagged as subsidiary TripAdvisor Inc. underperformed due to disappointing earnings and a perceived lack of progress on its direct booking initiative. Additionally, investors worried about negative foreign exchange impact, as well as what a stronger dollar might mean for cross-border travel and the company’s future guidance. |
Describe recent portfolio activity.
| • | | Due to a combination of portfolio trading activity and market movement during the six-month period, the Fund’s weighting in the consumer discretionary sector increased, most notably within textiles, apparel & luxury goods, multiline retail and specialty retail. The allocation to IT increased as well, mainly within the software industry. The Fund’s weighting in the industrials sector decreased substantially, with reductions in several industries, including road & rail, machinery, electrical equipment and commercial services & supplies. |
Describe portfolio positioning at period end.
| • | | As of period end, the Fund’s largest sector overweight relative to the Russell Midcap® Growth Index was in consumer discretionary, wherein internet & catalog retail exposure was balanced by idiosyncratic opportunities across segments, including media, textiles, apparel & luxury goods, and specialty retail. Industrials was the most significant underweight. |
The views expressed reflect the opinions of BlackRock as of the date of this report and are subject to change based on changes in market, economic or other conditions. These views are not intended to be a forecast of future events and are no guarantee of future results.
| | |
| Ten Largest Holdings | | Percent of Long-Term Investments |
| | | | |
United Therapeutics Corp. | | | 4 | % |
Liberty Ventures, Series A | | | 4 | |
Netflix, Inc. | | | 3 | |
Liberty TripAdvisor Holdings, Inc., Class A | | | 3 | |
The Madison Square Garden Co., Class A | | | 3 | |
Dollar General Corp. | | | 3 | |
FleetCor Technologies, Inc. | | | 3 | |
Vipshop Holdings Ltd. - ADR | | | 3 | |
Vertex Pharmaceuticals, Inc. | | | 3 | |
Uber Technologies, Inc., Series D | | | 2 | |
| | |
| Sector Allocation | | Percent of Long-Term Investments |
| | | | |
Consumer Discretionary | | | 38 | % |
Information Technology | | | 20 | |
Health Care | | | 18 | |
Industrials | | | 8 | |
Financials | | | 6 | |
Consumer Staples | | | 5 | |
Telecommunication Services | | | 2 | |
Materials | | | 2 | |
Energy | | | 1 | |
For Fund compliance purposes, the Fund’s sector classifications refer to any one or more of the sector sub-classifications used by one or more widely recognized market indexes or ratings group indexes, and/or as defined by the investment advisor. These definitions may not apply for purposes of this report, which may combine sector sub-classifications for reporting ease.
| | | | | | |
| 6 | | BLACKROCK FUNDS | | MARCH 31, 2015 | | |
| | | | |
| | | | BlackRock Mid-Cap Growth Equity Portfolio | |
|
| Total Return Based on a $10,000 Investment |
| | 1 | Assuming maximum sales charges, if any, transaction costs and other operating expenses, including investment advisory fees and administration fees, if any. Institutional Shares do not have a sales charge. |
| | 2 | The Fund normally invests at least 80% of its net assets in equity securities issued by U.S. mid-capitalization companies, which Fund management believes have above-average earnings growth potential. |
| | 3 | An unmanaged index that consists of the bottom 800 securities of the Russell 1000® Index with greater-than-average growth orientation as ranked by total market capitalization. They generally have higher price-to-book and price-to-earnings ratios, lower dividend yields and higher forecasted growth values. |
| | | | | | | | | | | | | | | | | | | | | | | | | | | | |
| Performance Summary for the Period Ended March 31, 2015 | | | | | | | | | |
| | | | | | Average Annual Total Returns4 | |
| | | | | | 1 Year | | | 5 Years | | | 10 Years | |
| | | 6-Month
Total Returns | | | w/o sales
charge | | | w/ sales
charge | | | w/o sales
charge | | | w/ sales
charge | | | w/o sales
charge | | | w/ sales
charge | |
Institutional | | | 14.16 | % | | | 16.53 | % | | | N/A | | | | 15.28 | % | | | N/A | | | | 9.69 | % | | | N/A | |
Service | | | 13.92 | | | | 15.98 | | | | N/A | | | | 14.75 | | | | N/A | | | | 9.26 | | | | N/A | |
Investor A | | | 13.96 | | | | 16.17 | | | | 10.07 | % | | | 14.90 | | | | 13.66 | % | | | 9.26 | | | | 8.67 | % |
Investor B | | | 13.58 | | | | 15.32 | | | | 10.85 | | | | 14.03 | | | | 13.79 | | | | 8.60 | | | | 8.60 | |
Investor C | | | 13.57 | | | | 15.32 | | | | 14.33 | | | | 14.01 | | | | 14.01 | | | | 8.44 | | | | 8.44 | |
Class R | | | 13.83 | | | | 15.90 | | | | N/A | | | | 14.65 | | | | N/A | | | | 9.11 | | | | N/A | |
Russell Midcap® Growth Index | | | 11.53 | | | | 15.56 | | | | N/A | | | | 16.43 | | | | N/A | | | | 10.19 | | | | N/A | |
| | 4 | | Assuming maximum sales charges, if any. Average annual total returns with and without sales charges reflect reductions for distribution and service fees. See “About Fund Performance” on page 10 for a detailed description of share classes, including any related sales charges and fees. |
| | | | N/A—Not applicable as share class and index do not have a sales charge. |
| | | | Past performance is not indicative of future results. |
| | | | | | | | | | | | | | |
| Expense Example |
| | | Actual | | Hypothetical6 | | |
| | | Beginning Account Value
October 1, 2014 | | Ending Account Value
March 31, 2015 | | Expenses Paid
During the Period5 | | Beginning
Account Value
October 1, 2014 | | Ending Account Value
March 31, 2015 | | Expenses Paid
During the Period5 | | Annualized
Expense Ratio |
Institutional | | $1,000.00 | | $1,141.60 | | $5.77 | | $1,000.00 | | $1,019.55 | | $5.44 | | 1.08% |
Service | | $1,000.00 | | $1,139.20 | | $7.95 | | $1,000.00 | | $1,017.50 | | $7.49 | | 1.49% |
Investor A | | $1,000.00 | | $1,139.60 | | $7.41 | | $1,000.00 | | $1,018.00 | | $6.99 | | 1.39% |
Investor B | | $1,000.00 | | $1,135.80 | | $11.50 | | $1,000.00 | | $1,014.16 | | $10.85 | | 2.16% |
Investor C | | $1,000.00 | | $1,135.70 | | $11.50 | | $1,000.00 | | $1,014.16 | | $10.85 | | 2.16% |
Class R | | $1,000.00 | | $1,138.30 | | $8.80 | | $1,000.00 | | $1,016.70 | | $8.30 | | 1.65% |
| | 5 | | For each class of the Fund, expenses are equal to the annualized expense ratio for the class, multiplied by the average account value over the period, multiplied by 182/365 (to reflect the one-half year period shown). |
| | 6 | | Hypothetical 5% annual return before expenses is calculated by prorating the number of days in the most recent fiscal half year divided by 365. |
| | | | See “Disclosure of Expenses” on page 11 for further information on how expenses were calculated. |
| | | | | | |
| | | BLACKROCK FUNDS | | MARCH 31, 2015 | | 7 |
| | | | |
| Fund Summary as of March 31, 2015 | | | BlackRock Small Cap Growth Equity Portfolio | |
BlackRock Small Cap Growth Equity Portfolio’s (the “Fund”) investment objective is to seek long-term capital growth.
|
| Portfolio Management Commentary |
How did the Fund perform?
| • | | For the six-month period ended March 31, 2015, the Fund underperformed its benchmark, the Russell 2000® Growth Index. |
What factors influenced performance?
| • | | The Fund’s underperformance was attributable primarily to stock selection within the energy and industrials sectors. Within energy, positions in domestic oil & gas producer Bonanza Creek Energy, Inc. and oil & gas equipment & services company Basic Energy Services, Inc. detracted most from performance. Shares of Bonanza Creek Energy fell sharply along with crude oil and natural gas prices, as investors expected increasing supply along with decreasing global demand for these commodities to hurt the company’s margins and revenues. Even with lower investor expectations, the company missed earnings and revenue estimates for the last two quarters of 2014. Basic Energy Services was also hurt by lower oil prices and industry weakness, along with misses on earnings and revenues. Within industrials, weaker expectations for domestic crude oil production negatively impacted railcar manufacturer The Greenbrier Cos, Inc., which has benefited extensively from demand for railcars driven by shale oil production. A position in metal and gas cylinder manufacturer Luxfer Holdings PLC lagged, as the company’s results were also hurt by the energy sector weakness. |
| • | | Stock selection within the information technology (“IT”) sector made the most significant positive contribution to performance. The Fund’s position |
| | | in Ambarella, Inc., a producer of high-definition chips for video cameras, appreciated considerably after the company released earnings and revenues that were above expectations. The company’s processing chips are used for high-definition wearable cameras, wireless security cameras and dashboard and rear-view cameras for automobiles. Ambarella is the exclusive chip supplier to wearable sports camera leader GoPro, which accounts for about one-third of the company’s revenues. A position in supply chain technology provider Manhattan Associates, Inc. contributed to performance, as the company’s shares appreciated on better-than-expected earnings, revenues and forward guidance. A position in flash memory producer Spansion, Inc. rose significantly over the period on strong earnings, as well as the announcement of an accretive merger with integrated circuits company Cypress Semiconductor, which is expected to achieve considerable cost synergies. |
Describe recent portfolio activity.
| • | | During the six-month period, the Fund’s weightings in the health care and consumer discretionary sectors increased while the weightings in energy and IT decreased. |
Describe portfolio positioning at period end.
| • | | Relative to the Russell 2000 Growth® Index, the Fund’s most significant sector overweight position as of period end was consumer discretionary while the most significant underweight position was in IT. |
The views expressed reflect the opinions of BlackRock as of the date of this report and are subject to change based on changes in market, economic or other conditions. These views are not intended to be a forecast of future events and are no guarantee of future results.
| | |
| Ten Largest Holdings | | Percent of Long-Term Investments |
| | | | |
Manhattan Associates, Inc. | | | 2 | % |
STERIS Corp. | | | 2 | |
LogMeIn, Inc. | | | 2 | |
Burlington Stores, Inc. | | | 2 | |
Tenneco, Inc. | | | 2 | |
Jack in the Box, Inc. | | | 2 | |
JetBlue Airways Corp. | | | 2 | |
DuPont Fabros Technology, Inc. | | | 2 | |
Syntel, Inc. | | | 2 | |
Boise Cascade Co. | | | 2 | |
| | |
| Sector Allocation | | Percent of Long-Term Investments |
| | | | |
Health Care | | | 25 | % |
Information Technology | | | 25 | |
Consumer Discretionary | | | 18 | |
Industrials | | | 14 | |
Financials | | | 8 | |
Materials | | | 4 | |
Consumer Staples | | | 3 | |
Energy | | | 2 | |
Telecommunication Services | | | 1 | |
For Fund compliance purposes, the Fund’s sector classifications refer to any one or more of the sector sub-classifications used by one or more widely recognized market indexes or ratings group indexes, and/or as defined by the investment advisor. These definitions may not apply for purposes of this report, which may combine sector sub-classifications for reporting ease.
| | | | | | |
| 8 | | BLACKROCK FUNDS | | MARCH 31, 2015 | | |
| | | | |
| | | | BlackRock Small Cap Growth Equity Portfolio | |
|
| Total Return Based on a $10,000 Investment |
| | 1 | Assuming maximum sales charges, if any, transaction costs and other operating expenses, including investment advisory fees and administration fees, if any. Institutional Shares do not have a sales charge. |
| | 2 | Under normal circumstances, the Fund will invest at least 80% of its net assets (plus any borrowings for investment purposes) in equity securities of small cap companies and at least 80% of its net assets (plus any borrowings for investment purposes) in securities or instruments of issuers located in the United States. |
| | 3 | An unmanaged index that measures performance of the small-cap growth segment of the US equity universe. It includes those Russell 2000® Index companies with higher price-to-value ratios and higher forecasted growth values. |
| | | | | | | | | | | | | | | | | | | | | | | | | | | | |
| Performance Summary for the Period Ended March 31, 2015 | | | | | | | | | |
| | | | | | Average Annual Total Returns4 | |
| | | | | | 1 Year | | | 5 Years | | | 10 Years | |
| | | 6-Month
Total Returns | | | w/o sales
charge | | | w/ sales
charge | | | w/o sales
charge | | | w/ sales
charge | | | w/o sales
charge | | | w/ sales
charge | |
Institutional | | | 11.82 | % | | | 7.99 | % | | | N/A | | | | 14.07 | % | | | N/A | | | | 10.13 | % | | | N/A | |
Service | | | 11.64 | | | | 7.67 | | | | N/A | | | | 13.74 | | | | N/A | | | | 9.83 | | | | N/A | |
Investor A | | | 11.65 | | | | 7.67 | | | | 2.01 | % | | | 13.69 | | | | 12.47 | % | | | 9.75 | | | | 9.16 | % |
Investor B | | | 11.12 | | | | 6.75 | | | | 3.54 | | | | 12.72 | | | | 12.57 | | | | 8.99 | | | | 8.99 | |
Investor C | | | 11.23 | | | | 6.80 | | | | 6.09 | | | | 12.76 | | | | 12.76 | | | | 8.81 | | | | 8.81 | |
Russell 2000® Growth Index | | | 17.36 | | | | 12.06 | | | | N/A | | | | 16.58 | | | | N/A | | | | 10.02 | | | | N/A | |
| | 4 | | Assuming maximum sales charges, if any. Average annual total returns with and without sales charges reflect reductions for distribution and service fees. See “About Fund Performance” on page 10 for a detailed description of share classes, including any related sales charges and fees. |
| | | | N/A—Not applicable as share class and index do not have a sales charge. |
| | | | Past performance is not indicative of future results. |
| | | | | | | | | | | | | | |
| Expense Example |
| | | Actual | | Hypothetical6 | | |
| | | Beginning
Account Value
October 1, 2014 | | Ending
Account Value
March 31, 2015 | | Expenses Paid
During the Period5 | | Beginning
Account Value
October 1, 2014 | | Ending
Account Value
March 31, 2015 | | Expenses Paid
During the Period5 | | Annualized
Expense Ratio |
Institutional | | $1,000.00 | | $1,118.20 | | $4.38 | | $1,000.00 | | $1,020.79 | | $4.18 | | 0.83% |
Service | | $1,000.00 | | $1,116.40 | | $6.07 | | $1,000.00 | | $1,019.20 | | $5.79 | | 1.15% |
Investor A | | $1,000.00 | | $1,116.50 | | $6.07 | | $1,000.00 | | $1,019.20 | | $5.79 | | 1.15% |
Investor B | | $1,000.00 | | $1,111.20 | | $10.95 | | $1,000.00 | | $1,014.56 | | $10.45 | | 2.08% |
Investor C | | $1,000.00 | | $1,112.30 | | $10.22 | | $1,000.00 | | $1,015.26 | | $9.75 | | 1.94% |
| | 5 | | For each class of the Fund, expenses are equal to the annualized expense ratio for the class, multiplied by the average account value over the period, multiplied by 182/365 (to reflect the one-half year period shown). |
| | 6 | | Hypothetical 5% annual return before expenses is calculated by prorating the number of days in the most recent fiscal half year divided by 365. |
| | | | See “Disclosure of Expenses” on page 11 for further information on how expenses were calculated. |
| | | | | | |
| | | BLACKROCK FUNDS | | MARCH 31, 2015 | | 9 |
| • | | Institutional Shares are not subject to any sales charge. These shares bear no ongoing distribution or service fees and are available only to certain eligible investors. |
| • | | Service Shares are not subject to any sales charge. These shares are subject to a service fee of 0.25% per year (but no distribution fee) and are only available to certain eligible investors. |
| • | | Investor A Shares are subject to a maximum initial sales charge (front-end load) of 5.25% and a service fee of 0.25% per year (but no distribution fee). Certain redemptions of these shares may be subject to a contingent deferred sales charge (“CDSC”) where no initial sales charge was paid at the time of purchase. These shares are generally available through financial intermediaries. |
| • | | Investor B Shares are subject to a maximum CDSC of 4.50% declining to 0% after six years. In addition, these shares are subject to a distribution fee of 0.75% per year and a service fee of 0.25% per year. These shares automatically convert to Investor A Shares after approximately eight years. (There is no initial sales charge for automatic share conversions.) All returns for periods greater than eight years reflect this conversion. These shares are only available through exchanges and distribution reinvestments by current holders and for purchase by certain employer-sponsored retirement plans. |
| • | | Investor C Shares are subject to a 1.00% CDSC if redeemed within one year of purchase. In addition, these shares are subject to a distribution fee of 0.75% per year and a service fee of 0.25% per year. These shares are generally available through financial intermediaries. |
| • | | Class R Shares are not subject to any sales charge. These shares are subject to a distribution fee of 0.25% per year and a service fee of |
0.25% per year. These shares are available only to certain employer-sponsored retirement plans. Prior to October 2, 2006, Class R performance results of BlackRock Mid-Cap Growth Equity Portfolio are those of Institutional Shares (which have no distribution or service fees) restated to reflect Class R Share fees. Prior to July 30, 2010, Class R performance results of BlackRock Flexible Equity Fund are those of Institutional Shares (which have no distribution or service fees) restated to reflect Class R Share fees.
Performance information reflects past performance and does not guarantee future results. Current performance may be lower or higher than the performance data quoted. Refer to www.blackrock.com/funds to obtain performance data current to the most recent month end. Performance results do not reflect the deduction of taxes that a shareholder would pay on fund distributions or the redemption of fund shares. Figures shown in each of the performance tables on the previous pages assume reinvestment of all distributions, if any, at net asset value (“NAV”) on the ex-dividend date. Investment return and principal value of shares will fluctuate so that shares, when redeemed, may be worth more or less than their original cost. Distributions paid to each class of shares will vary because of the different levels of service, distribution and transfer agency fees applicable to each class, which are deducted from the income available to be paid to shareholders.
BlackRock Advisors, LLC (the “Manager”), the Funds’ investment advisor, waived and/or reimbursed a portion of each Fund’s expenses. Without such waiver and/or reimbursement, each Fund’s performance would have been lower. The Manager is under no obligation to waive and/or reimburse or to continue waiving and/or reimbursing its fees after the applicable termination date. See Note 5 of the Notes to Financial Statements for additional information on waivers and reimbursements.
| | | | | | |
| 10 | | BLACKROCK FUNDS | | MARCH 31, 2015 | | |
Shareholders of the Funds may incur the following charges: (a) transactional expenses, such as sales charges; and (b) operating expenses, including investment advisory fees, administration fees, service and distribution fees, including 12b-1 fees, acquired fund fees and expenses and other Fund expenses. The expense examples on the previous pages (which are based on a hypothetical investment of $1,000 invested on October 1, 2014 and held through March 31, 2015) are intended to assist shareholders both in calculating expenses based on an investment in each Fund and in comparing these expenses with similar costs of investing in other mutual funds.
The expense examples provide information about actual account values and actual expenses. In order to estimate the expenses a shareholder paid during the period covered by this report, shareholders can divide their account value by $1,000 and then multiply the result by the number corresponding to their Fund and share class under the headings entitled “Expenses Paid During the Period.”
The expense examples also provide information about hypothetical account values and hypothetical expenses based on a Fund’s actual expense ratio and an assumed rate of return of 5% per year before expenses. In order to assist shareholders in comparing the ongoing expenses of investing in these Funds and other funds, compare the 5% hypothetical examples with the 5% hypothetical examples that appear in shareholder reports of other funds.
The expenses shown in the expense examples are intended to highlight shareholders’ ongoing costs only and do not reflect any transactional expenses, such as sales charges, if any. Therefore, the hypothetical examples are useful in comparing ongoing expenses only, and will not help shareholders determine the relative total expenses of owning different funds. If these transactional expenses were included, shareholder expenses would have been higher.
|
Derivative Financial Instruments |
The Funds may invest in various derivative financial instruments. Derivative financial instruments are used to obtain exposure to a security, index and/or market without owning or taking physical custody of securities or to manage market, equity, credit, interest rate, foreign currency exchange rate, commodity and/or other risks. Derivative financial instruments may give rise to a form of economic leverage. Derivative financial instruments also involve risks, including the imperfect correlation between the value of a derivative financial instrument and the underlying asset, possible default of the counterparty to the transaction or illiquidity of the derivative
financial instrument. The Funds’ ability to use a derivative financial instrument successfully depends on the investment advisor’s ability to predict pertinent market movements accurately, which cannot be assured. The use of derivative financial instruments may result in losses greater than if they had not been used, may limit the amount of appreciation a Fund can realize on an investment and/or may result in lower distributions paid to shareholders. The Funds’ investments in these instruments are discussed in detail in the Notes to Financial Statements.
| | | | | | |
| | | BLACKROCK FUNDS | | MARCH 31, 2015 | | 11 |
| | | | |
| Consolidated Schedule of Investments March 31, 2015 (Unaudited) | | | BlackRock Flexible Equity Fund | |
| | | (Percentages shown are based on Net Assets) | |
| | | | | | | | |
| Common Stocks | | Shares | | | Value | |
Aerospace & Defense — 1.2% | | | | | | | | |
Honeywell International, Inc. | | | 8,100 | | | $ | 844,911 | |
Raytheon Co. | | | 53,176 | | | | 5,809,478 | |
| | | | | | | | |
| | | | | | | | 6,654,389 | |
Air Freight & Logistics — 1.1% | | | | | | | | |
FedEx Corp. | | | 38,037 | | | | 6,293,222 | |
Airlines — 1.8% | | | | | | | | |
Southwest Airlines Co. | | | 87,650 | | | | 3,882,895 | |
United Continental Holdings, Inc. (a) | | | 87,475 | | | | 5,882,694 | |
| | | | | | | | |
| | | | | | | | 9,765,589 | |
Auto Components — 0.6% | | | | | | | | |
Lear Corp. | | | 27,700 | | | | 3,069,714 | |
Banks — 11.8% | | | | | | | | |
Bank of America Corp. | | | 882,604 | | | | 13,583,276 | |
Citigroup, Inc. | | | 238,971 | | | | 12,311,786 | |
JPMorgan Chase & Co. | | | 262,554 | | | | 15,905,521 | |
SunTrust Banks, Inc. | | | 180,039 | | | | 7,397,803 | |
U.S. Bancorp | | | 316,757 | | | | 13,832,778 | |
Wells Fargo & Co. | | | 49,409 | | | | 2,687,850 | |
| | | | | | | | |
| | | | | | | | 65,719,014 | |
Beverages — 2.7% | | | | | | | | |
Dr Pepper Snapple Group, Inc. | | | 115,590 | | | | 9,071,503 | |
Molson Coors Brewing Co., Class B | | | 80,911 | | | | 6,023,824 | |
| | | | | | | | |
| | | | | | | | 15,095,327 | |
Biotechnology — 1.9% | | | | | | | | |
Amgen, Inc. | | | 65,942 | | | | 10,540,829 | |
Capital Markets — 1.2% | | | | | | | | |
Atlas Mara Co-Nvest Ltd. (a) | | | 93,690 | | | | 655,830 | |
Freedom Pay, Inc. (a) | | | 43,051 | | | | — | |
The Goldman Sachs Group, Inc. | | | 32,111 | | | | 6,035,905 | |
| | | | | | | | |
| | | | | | | | 6,691,735 | |
Chemicals — 0.3% | | | | | | | | |
The Dow Chemical Co. | | | 39,097 | | | | 1,875,874 | |
Communications Equipment — 3.2% | | | | | | | | |
Brocade Communications Systems, Inc. | | | 397,945 | | | | 4,721,617 | |
Cisco Systems, Inc. | | | 331,545 | | | | 9,125,776 | |
QUALCOMM, Inc. | | | 56,040 | | | | 3,885,814 | |
| | | | | | | | |
| | | | | | | | 17,733,207 | |
Consumer Finance — 2.5% | | | | | | | | |
Discover Financial Services | | | 161,822 | | | | 9,118,670 | |
SLM Corp. (a) | | | 493,733 | | | | 4,581,842 | |
| | | | | | | | |
| | | | | | | | 13,700,512 | |
Containers & Packaging — 0.7% | | | | | | | | |
Packaging Corp. of America | | | 51,403 | | | | 4,019,201 | |
Electronic Equipment, Instruments & Components — 0.5% | | | | | |
Zebra Technologies Corp., Class A (a) | | | 31,261 | | | | 2,835,842 | |
Energy Equipment & Services — 2.4% | | | | | | | | |
Atwood Oceanics, Inc. | | | 58,395 | | | | 1,641,483 | |
Halliburton Co. | | | 24,076 | | | | 1,056,455 | |
Schlumberger Ltd. | | | 104,580 | | | | 8,726,155 | |
| | | | | | | | |
| Common Stocks | | Shares | | | Value | |
Energy Equipment & Services (concluded) | | | | | | | | |
Weatherford International PLC (a) | | | 139,743 | | | $ | 1,718,839 | |
| | | | | | | | |
| | | | | | | | 13,142,932 | |
Food & Staples Retailing — 4.1% | | | | | | | | |
CVS Health Corp. | | | 175,080 | | | | 18,070,007 | |
The Kroger Co. | | | 8,200 | | | | 628,612 | |
Wal-Mart Stores, Inc. | | | 51,465 | | | | 4,232,996 | |
| | | | | | | | |
| | | | | | | | 22,931,615 | |
Food Products — 0.4% | | | | | | | | |
Pilgrim’s Pride Corp. (b) | | | 37,405 | | | | 844,979 | |
Tyson Foods, Inc., Class A | | | 40,009 | | | | 1,532,345 | |
| | | | | | | | |
| | | | | | | | 2,377,324 | |
Health Care Equipment & Supplies — 0.1% | | | | | | | | |
Medtronic PLC | | | 7,560 | | | | 589,604 | |
Health Care Providers & Services — 14.2% | | | | | | | | |
Aetna, Inc. | | | 117,700 | | | | 12,538,581 | |
Centene Corp. (a) | | | 98,564 | | | | 6,967,489 | |
Cigna Corp. | | | 66,840 | | | | 8,651,770 | |
Express Scripts Holding Co. (a) | | | 22,834 | | | | 1,981,306 | |
Humana, Inc. | | | 4,200 | | | | 747,684 | |
Laboratory Corp. of America Holdings (a) | | | 52,646 | | | | 6,638,134 | |
McKesson Corp. | | | 33,537 | | | | 7,586,069 | |
UnitedHealth Group, Inc. | | | 227,683 | | | | 26,932,622 | |
Universal Health Services, Inc., Class B | | | 58,239 | | | | 6,855,313 | |
| | | | | | | | |
| | | | | | | | 78,898,968 | |
Hotels, Restaurants & Leisure — 1.7% | | | | | | | | |
Carnival Corp. | | | 135,649 | | | | 6,489,448 | |
Las Vegas Sands Corp. | | | 50,222 | | | | 2,764,219 | |
| | | | | | | | |
| | | | | | | | 9,253,667 | |
Industrial Conglomerates — 2.5% | | | | | | | | |
3M Co. | | | 84,054 | | | | 13,864,707 | |
Insurance — 3.5% | | | | | | | | |
American International Group, Inc. | | | 231,635 | | | | 12,691,282 | |
The Travelers Cos., Inc. | | | 65,113 | | | | 7,040,669 | |
| | | | | | | | |
| | | | | | | | 19,731,951 | |
Internet & Catalog Retail — 0.5% | | | | | | | | |
The Priceline Group, Inc. (a) | | | 2,221 | | | | 2,585,577 | |
Internet Software & Services — 3.9% | | | | | | | | |
Facebook, Inc., Class A (a) | | | 94,639 | | | | 7,780,745 | |
Google, Inc., Class A (a) | | | 25,550 | | | | 14,172,585 | |
| | | | | | | | |
| | | | | | | | 21,953,330 | |
IT Services — 3.0% | | | | | | | | |
Alliance Data Systems Corp. (a) | | | 3,725 | | | | 1,103,531 | |
Amdocs Ltd. | | | 72,853 | | | | 3,963,203 | |
Cognizant Technology Solutions Corp., Class A (a) | | | 43,501 | | | | 2,714,027 | |
DST Systems, Inc. | | | 10,830 | | | | 1,198,989 | |
MasterCard, Inc., Class A | | | 32,326 | | | | 2,792,643 | |
ServiceSource International, Inc. (a) | | | 557,644 | | | | 1,728,696 | |
Total System Services, Inc. | | | 82,088 | | | | 3,131,657 | |
| | | | | | | | |
| | | | | | | | 16,632,746 | |
| | | | | | | | | | |
| Portfolio Abbreviations |
| ADR | | American Depositary Receipts | | EUR | | Euro | | USD | | U.S. Dollar |
| CAD | | Canadian Dollar | | JPY | | Japanese Yen | | | | |
| CVR | | Contingent Value Rights | | KRW | | Korean Won | | | | |
See Notes to Financial Statements.
| | | | | | |
| 12 | | BLACKROCK FUNDS | | MARCH 31, 2015 | | |
| | | | |
| Consolidated Schedule of Investments (continued) | | | BlackRock Flexible Equity Fund | |
| | | (Percentages shown are based on Net Assets) | |
| | | | | | | | |
| Common Stocks | | Shares | | | Value | |
Machinery — 0.7% | | | | | | | | |
Parker Hannifin Corp. | | | 34,655 | | | $ | 4,116,321 | |
Media — 3.1% | | | | | | | | |
Comcast Corp., Class A | | | 267,716 | | | | 15,117,923 | |
Omnicom Group, Inc. | | | 30,701 | | | | 2,394,064 | |
| | | | | | | | |
| | | | | | | | 17,511,987 | |
Multiline Retail — 0.7% | | | | | | | | |
Macy’s, Inc. | | | 60,810 | | | | 3,947,177 | |
Multi-Utilities — 0.4% | | | | | | | | |
Public Service Enterprise Group, Inc. | | | 48,129 | | | | 2,017,568 | |
Oil, Gas & Consumable Fuels — 4.4% | | | | | | | | |
BP PLC — ADR | | | 159,683 | | | | 6,245,202 | |
Exxon Mobil Corp. | | | 21,359 | | | | 1,815,515 | |
Hess Corp. | | | 54,612 | | | | 3,706,516 | |
Marathon Petroleum Corp. | | | 26,003 | | | | 2,662,447 | |
PBF Energy, Inc., Class A | | | 42,158 | | | | 1,429,999 | |
Suncor Energy, Inc. | | | 242,587 | | | | 7,095,670 | |
Tesoro Corp. | | | 16,922 | | | | 1,544,809 | |
| | | | | | | | |
| | | | | | | | 24,500,158 | |
Paper & Forest Products — 0.7% | | | | | | | | |
Domtar Corp. | | | 78,475 | | | | 3,627,115 | |
Pharmaceuticals — 4.5% | | | | | | | | |
AstraZeneca PLC — ADR | | | 81,969 | | | | 5,609,139 | |
Johnson & Johnson | | | 19,164 | | | | 1,927,898 | |
Pfizer, Inc. | | | 17,382 | | | | 604,720 | |
Shire PLC — ADR | | | 22,449 | | | | 5,371,821 | |
Teva Pharmaceutical Industries Ltd. — ADR | | | 180,486 | | | | 11,244,278 | |
| | | | | | | | |
| | | | | | | | 24,757,856 | |
Road & Rail — 0.9% | | | | | | | | |
Norfolk Southern Corp. | | | 34,624 | | | | 3,563,502 | |
Union Pacific Corp. | | | 14,282 | | | | 1,546,883 | |
| | | | | | | | |
| | | | | | | | 5,110,385 | |
Semiconductors & Semiconductor Equipment — 4.1% | | | | | | | | |
Intel Corp. | | | 345,522 | | | | 10,804,473 | |
Micron Technology, Inc. (a) | | | 362,995 | | | | 9,848,054 | |
NVIDIA Corp. | | | 112,900 | | | | 2,362,434 | |
| | | | | | | | |
| | | | | | | | 23,014,961 | |
Software — 2.1% | | | | | | | | |
Microsoft Corp. | | | 177,697 | | | | 7,224,272 | |
Oracle Corp. | | | 108,274 | | | | 4,672,023 | |
| | | | | | | | |
| | | | | | | | 11,896,295 | |
| | | | | | | | |
| Common Stocks | | Shares | | | Value | |
Specialty Retail — 5.1% | | | | | | | | |
The Home Depot, Inc. | | | 78,160 | | | $ | 8,879,758 | |
Lowe’s Companies, Inc. | | | 198,647 | | | | 14,777,350 | |
Ross Stores, Inc. | | | 44,046 | | | | 4,640,687 | |
| | | | | | | | |
| | | | | | | | 28,297,795 | |
Technology Hardware, Storage & Peripherals — 5.5% | | | | | |
Apple Inc. | | | 63,988 | | | | 7,962,027 | |
EMC Corp. | | | 286,176 | | | | 7,314,659 | |
Hewlett-Packard Co. | | | 177,663 | | | | 5,535,979 | |
Western Digital Corp. | | | 106,112 | | | | 9,657,253 | |
| | | | | | | | |
| | | | | | | | 30,469,918 | |
Textiles, Apparel & Luxury Goods — 0.6% | | | | | | | | |
Deckers Outdoor Corp. (a) | | | 18,552 | | | | 1,351,884 | |
Fossil Group, Inc. (a) | | | 24,771 | | | | 2,042,369 | |
| | | | | | | | |
| | | | | | | | 3,394,253 | |
Total Common Stocks — 98.6% | | | | | | | 548,618,665 | |
| | | | | | | | |
| Investment Companies — 0.1% | | | | | | |
Utilities Select Sector SPDR Fund | | | 19,180 | | | | 852,167 | |
Total Long-Term Investments (Cost — $534,656,902) — 98.7% | | | | 549,470,832 | |
| | | | | | | | |
| Short-Term Securities | | | | | | |
BlackRock Liquidity Funds, TempFund, Institutional Class, 0.06% (c)(d) | | | 1,637,791 | | | | 1,637,791 | |
| | | Beneficial
Interest
(000) | | | | |
BlackRock Liquidity Series, LLC, Money Market Series, 0.22% (c)(d)(e) | | $ | 576 | | | | 576,157 | |
Total Short-Term Securities (Cost — $2,213,948) — 0.4% | | | | | | | 2,213,948 | |
Total Investments (Cost — $536,870,850) — 99.1% | | | | 551,684,780 | |
Other Assets in Excess of Liabilities — 0.9% | | | | | | | 4,881,233 | |
| | | | | | | | |
Net Assets — 100.0% | | | | | | $ | 556,566,013 | |
| | | | | | | | |
|
| Notes to Consolidated Schedule of Investments |
| (a) | Non-income producing security. |
| (b) | Security, or a portion of security, is on loan. |
| (c) | During the six months ended March 31, 2015, investments in issuers considered to be an affiliate of the Fund for purposes of Section 2(a)(3) of the Investment Company Act of 1940, as amended, were as follows: |
| | | | | | | | | | | | | | | | | | | | | | | | | | | | |
| Affiliate | | Shares/Beneficial
Interest Held at
September 30,
2014 | | | Shares
Purchased | | | Shares
Sold | | | Shares/Beneficial
Interest Held at
March 31, 2015 | | | Value at
March 31,
2015 | | | Income | | | Realized
Gain (Loss) | |
BlackRock Liquidity Funds, TempFund, Institutional Class | | | 49,141,411 | | | | — | | | | 47,503,620 | 1 | | | 1,637,791 | | | $ | 1,637,791 | | | $ | 7,375 | | | $ | 3,191 | |
BlackRock Liquidity Series, LLC, Money Market Series | | | — | | | | 576,157 | 2 | | | — | | | $ | 576,157 | | | $ | 576,157 | | | $ | 76,249 | | | | — | |
iShares Gold Trust | | | 946,100 | | | | 1,314,000 | | | | 2,260,100 | | | | — | | | | — | | | | — | | | $ | (602,119 | ) |
| | 1 | | Represents net shares sold. |
| | 2 | | Represents net shares purchased. |
See Notes to Financial Statements.
| | | | | | |
| | | BLACKROCK FUNDS | | MARCH 31, 2015 | | 13 |
| | | | |
| Consolidated Schedule of Investments (continued) | | | BlackRock Flexible Equity Fund | |
| (d) | Represents the current yield as of report date. |
| (e) | Security was purchased with the cash collateral from loaned securities. The Fund may withdraw up to 25% of its investment daily, although the manager of the BlackRock Liquidity Series, LLC, Money Market Series, in its sole discretion, may permit an investor to withdraw more than 25% on any one day. |
| • | | For Fund compliance purposes, the Fund’s industry classifications refer to any one or more of the industry sub-classifications used by one or more widely recognized market indexes or ratings group indexes, and/or as defined by the investment advisor. These definitions may not apply for purposes of this report, which may combine such industry sub-classifications for reporting ease. |
| • | | As of March 31, 2015, forward foreign currency exchange contracts outstanding were as follows: |
| | | | | | | | | | | | | | | | | | | | | | |
Currency Purchased | | | Currency
Sold | | | Counterparty | | Settlement
Date | | | Unrealized
Appreciation
(Depreciation) | |
| CAD | | | 5,341,000 | | | | USD | | | | 4,297,671 | | | Citibank N.A. | | | 4/22/15 | | | $ | (81,839 | ) |
| CAD | | | 4,213,000 | | | | USD | | | | 3,368,420 | | | Goldman Sachs Bank USA | | | 4/22/15 | | | | (42,957 | ) |
| CAD | | | 1,521,683 | | | | USD | | | | 1,217,605 | | | State Street Bank and Trust Co. | | | 4/22/15 | | | | (16,489 | ) |
| EUR | | | 1,028,728 | | | | USD | | | | 1,181,138 | | | Citibank N.A. | | | 4/22/15 | | | | (74,663 | ) |
| EUR | | | 1,069,857 | | | | USD | | | | 1,208,328 | | | Deutsche Bank AG | | | 4/22/15 | | | | (57,616 | ) |
| EUR | | | 920,457 | | | | USD | | | | 1,042,708 | | | TD Securities, Inc. | | | 4/22/15 | | | | (52,687 | ) |
| JPY | | | 1,090,227,000 | | | | USD | | | | 9,077,010 | | | BNP Paribas S.A. | | | 4/22/15 | | | | 16,336 | |
| JPY | | | 721,004,000 | | | | USD | | | | 6,027,000 | | | Citibank N.A. | | | 4/22/15 | | | | (13,263 | ) |
| JPY | | | 2,239,247,000 | | | | USD | | | | 18,647,898 | | | Citibank N.A. | | | 4/22/15 | | | | 29,174 | |
| JPY | | | 637,901,000 | | | | USD | | | | 5,333,710 | | | Standard Chartered Bank | | | 4/22/15 | | | | (13,116 | ) |
| JPY | | | 319,425,085 | | | | USD | | | | 2,687,999 | | | The Bank of New York Mellon | | | 4/22/15 | | | | (23,744 | ) |
| KRW | | | 9,000,000,000 | | | | USD | | | | 8,186,283 | | | Standard Chartered Bank | | | 4/22/15 | | | | (80,317 | ) |
| KRW | | | 2,419,143,024 | | | | USD | | | | 2,194,632 | | | Standard Chartered Bank | | | 4/22/15 | | | | (15,800 | ) |
| KRW | | | 5,843,460,082 | | | | USD | | | | 5,369,759 | | | UBS AG | | | 4/22/15 | | | | (106,771 | ) |
| USD | | | 9,223,664 | | | | CAD | | | | 11,075,683 | | | TD Securities, Inc. | | | 4/22/15 | | | | 481,252 | |
| USD | | | 144,610 | | | | EUR | | | | 131,425 | | | Citibank N.A. | | | 4/22/15 | �� | | | 3,252 | |
| USD | | | 3,334,688 | | | | EUR | | | | 2,887,616 | | | HSBC Bank PLC | | | 4/22/15 | | | | 228,836 | |
| USD | | | 42,167,238 | | | | JPY | | | | 4,949,033,730 | | | HSBC Bank PLC | | | 4/22/15 | | | | 888,426 | |
| USD | | | 484,642 | | | | JPY | | | | 58,770,355 | | | The Bank of New York Mellon | | | 4/22/15 | | | | (5,549 | ) |
| USD | | | 15,955,084 | | | | KRW | | | | 17,262,603,106 | | | Standard Chartered Bank | | | 4/22/15 | | | | 407,298 | |
| Total | | | | | | | | | | | | | | | | | | | | $ | 1,469,763 | |
| | | | | | | | | | | | | | | | | | | | | | |
| • | | Fair Value Measurements — Various inputs are used in determining the fair value of investments and derivative financial instruments. These inputs to valuation techniques are categorized into a disclosure hierarchy consisting of three broad levels for financial statement purposes. The hierarchy gives the highest priority to unadjusted quoted prices in active markets for identical assets or liabilities (Level 1 measurements) and the lowest priority to unobservable inputs (Level 3 measurements). Accordingly, the degree of judgment exercised in determining fair value is greatest for instruments categorized in Level 3. The inputs used to measure fair value may fall into different levels of the fair value hierarchy. In such cases, for disclosure purposes, the fair value hierarchy classification is determined based on the lowest level input that is significant to the fair value measurement in its entirety. The categorization of a value determined for investments and derivative financial instruments is based on the pricing transparency of the investment and derivative financial instruments and is not necessarily an indication of the risks associated with investing in those securities. The three levels of the fair value hierarchy are as follows: |
| | • | | Level 1 — unadjusted quoted prices in active markets/exchanges for identical assets or liabilities that the Fund has the ability to access |
| | • | | Level 2 — other observable inputs (including, but not limited to, quoted prices for similar assets or liabilities in markets that are active, quoted prices for identical or similar assets or liabilities in markets that are not active, inputs other than quoted prices that are observable for the assets or liabilities (such as interest rates, yield curves, volatilities, prepayment speeds, loss severities, credit risks and default rates) or other market–corroborated inputs) |
| | • | | Level 3 — unobservable inputs based on the best information available in the circumstances, to the extent observable inputs are not available (including the Fund’s own assumptions used in determining the fair value of investments and derivative financial instruments) |
Changes in valuation techniques may result in transfers into or out of an assigned level within the disclosure hierarchy. In accordance with the Fund’s policy, transfers between different levels of the fair value disclosure hierarchy are deemed to have occurred as of the beginning of the reporting period. For information about the Fund’s policy regarding valuation of investments and derivative financial instruments, refer to Note 2 of the Notes to Financial Statements.
See Notes to Financial Statements.
| | | | | | |
| 14 | | BLACKROCK FUNDS | | MARCH 31, 2015 | | |
| | | | |
| Consolidated Schedule of Investments (concluded) | | | BlackRock Flexible Equity Fund | |
As of March 31, 2015, the following tables summarize the Fund’s investments and derivative financial instruments categorized in the disclosure hierarchy:
| | | | | | | | | | | | | | |
| | | Level 1 | | | Level 2 | | | Level 3 | | Total | |
Assets: | | | | | | | | | | | | | | |
Investments: | | | | | | | | | | | | | | |
Long-Term Investments: | | | | | | | | | | | | | | |
Common Stocks1 | | $ | 548,618,665 | | | | — | | | — | | $ | 548,618,665 | |
Investment Companies | | | 852,167 | | | | — | | | — | | | 852,167 | |
Short-Term Securities | | | 1,637,791 | | | $ | 576,157 | | | — | | | 2,213,948 | |
| | | | |
Total | | $ | 551,108,623 | | | $ | 576,157 | | | — | | $ | 551,684,780 | |
| | | | |
1 See above Schedule of Investments for values in each industry. | | | | | | | | | | | | | | |
| | | | | | | | | | | | | | |
| | | Level 1 | | | Level 2 | | | Level 3 | | Total | |
Derivative Financial Instruments2 | | | | | | | | | | | | | | |
Assets: | | | | | | | | | | | | | | |
Foreign currency exchange contracts | | | — | | | $ | 2,054,574 | | | — | | $ | 2,054,574 | |
Liabilities: | | | | | | | | | | | | | | |
Foreign currency exchange contracts | | | — | | | | (584,811 | ) | | — | | | (584,811 | ) |
| | | | |
Total | | | — | | | $ | 1,469,763 | | | — | | $ | 1,469,763 | |
| | | | |
2 Derivative financial instruments are forward foreign currency exchange contracts. Forward foreign currency exchange contracts are valued at the unrealized appreciation/ depreciation on the instrument. | | | | |
The Fund may hold assets and/or liabilities in which the fair value approximates the carrying amount for financial statement purposes. As of March 31, 2015, collateral on securities loaned at value of $576,157 are categorized as Level 2 within the disclosure hierarchy.
During the six months ended March 31, 2015, there were no transfers between levels.
See Notes to Financial Statements.
| | | | | | |
| | | BLACKROCK FUNDS | | MARCH 31, 2015 | | 15 |
| | | | |
| Schedule of Investments March 31, 2015 (Unaudited) | | | BlackRock Mid-Cap Growth Equity Portfolio | |
| | | (Percentages shown are based on Net Assets) | |
| | | | | | | | |
| Common Stocks | | Shares | | | Value | |
Air Freight & Logistics — 1.5% | | | | | | | | |
XPO Logistics, Inc. (a) | | | 145,174 | | | $ | 6,601,062 | |
Airlines — 2.2% | | | | | | | | |
Spirit Airlines, Inc. (a) | | | 121,874 | | | | 9,428,173 | |
Banks — 2.5% | | | | | | | | |
First Republic Bank | | | 113,411 | | | | 6,474,634 | |
SVB Financial Group (a) | | | 35,304 | | | | 4,485,020 | |
| | | | | | | | |
| | | | | | | | 10,959,654 | |
Beverages — 1.8% | | | | | | | | |
Constellation Brands, Inc., Class A (a) | | | 67,675 | | | | 7,864,512 | |
Biotechnology — 9.3% | | | | | | | | |
BioMarin Pharmaceutical, Inc. (a) | | | 56,825 | | | | 7,081,532 | |
Cellectis SA — ADR (a) | | | 1,300 | | | | 44,967 | |
Intercept Pharmaceuticals, Inc. (a) | | | 15,032 | | | | 4,239,325 | |
United Therapeutics Corp. (a) | | | 103,808 | | | | 17,900,132 | |
Vertex Pharmaceuticals, Inc. (a) | | | 94,887 | | | | 11,193,819 | |
| | | | | | | | |
| | | | | | | | 40,459,775 | |
Capital Markets — 1.5% | | | | | | | | |
Affiliated Managers Group, Inc. (a) | | | 31,076 | | | | 6,674,503 | |
Chemicals — 1.7% | | | | | | | | |
Platform Specialty Products Corp. (a) | | | 291,302 | | | | 7,474,809 | |
Commercial Services & Supplies — 1.6% | | | | | | | | |
KAR Auction Services, Inc. | | | 189,419 | | | | 7,184,663 | |
Diversified Consumer Services — 1.8% | | | | | | | | |
H&R Block, Inc. | | | 248,977 | | | | 7,984,692 | |
Diversified Financial Services — 2.2% | | | | | | | | |
Moody’s Corp. | | | 92,437 | | | | 9,594,961 | |
Electrical Equipment — 1.5% | | | | | | | | |
Acuity Brands, Inc. | | | 37,672 | | | | 6,334,924 | |
Food & Staples Retailing — 2.2% | | | | | | | | |
Sprouts Farmers Market, Inc. (a) | | | 278,387 | | | | 9,807,574 | |
Food Products — 0.6% | | | | | | | | |
Mead Johnson Nutrition Co. | | | 24,464 | | | | 2,459,366 | |
Health Care Equipment & Supplies — 1.2% | | | | | | | | |
The Cooper Cos., Inc. | | | 27,112 | | | | 5,081,331 | |
Health Care Technology — 1.7% | | | | | | | | |
athenahealth, Inc. (a)(b) | | | 31,534 | | | | 3,764,844 | |
IMS Health Holdings, Inc. (a) | | | 127,374 | | | | 3,448,014 | |
| | | | | | | | |
| | | | | | | | 7,212,858 | |
Hotels, Restaurants & Leisure — 2.8% | | | | | | | | |
Domino’s Pizza, Inc. | | | 51,699 | | | | 5,198,334 | |
Restaurant Brands International, Inc. | | | 184,961 | | | | 7,104,352 | |
| | | | | | | | |
| | | | | | | | 12,302,686 | |
Household Durables — 1.9% | | | | | | | | |
Jarden Corp. (a) | | | 158,130 | | | | 8,365,077 | |
Internet & Catalog Retail — 13.9% | | | | | | | | |
HSN, Inc. | | | 84,291 | | | | 5,751,175 | |
Liberty TripAdvisor Holdings, Inc., Class A (a) | | | 415,835 | | | | 13,219,395 | |
Liberty Ventures, Series A (a) | | | 378,636 | | | | 15,906,498 | |
Netflix, Inc. (a) | | | 34,786 | | | | 14,494,978 | |
Vipshop Holdings Ltd. — ADR (a) | | | 382,997 | | | | 11,275,432 | |
| | | | | | | | |
| | | | | | | | 60,647,478 | |
Internet Software & Services — 5.0% | | | | | | | | |
58.com, Inc. — ADR (a) | | | 47,332 | | | | 2,502,916 | |
CoStar Group, Inc. (a) | | | 36,967 | | | | 7,313,182 | |
Hortonworks, Inc. (a)(b) | | | 104,720 | | | | 2,496,525 | |
LinkedIn Corp., Class A (a) | | | 37,359 | | | | 9,334,520 | |
| | | | | | | | |
| | | | | | | | 21,647,143 | |
| | | | | | | | |
| Common Stocks | | Shares | | | Value | |
IT Services — 6.5% | | | | | | | | |
Alliance Data Systems Corp. (a) | | | 33,716 | | | $ | 9,988,365 | |
FleetCor Technologies, Inc. (a) | | | 76,303 | | | | 11,515,649 | |
Vantiv, Inc., Class A (a) | | | 185,907 | | | | 7,008,694 | |
| | | | | | | | |
| | | | | | | | 28,512,708 | |
Media — 5.2% | | | | | | | | |
Charter Communications, Inc., Class A (a) | | | 37,516 | | | | 7,244,715 | |
The Madison Square Garden Co., Class A (a) | | | 150,962 | | | | 12,778,933 | |
Schibsted ASA | | | 46,887 | | | | 2,711,242 | |
| | | | | | | | |
| | | | | | | | 22,734,890 | |
Multiline Retail — 2.7% | | | | | | | | |
Dollar General Corp. | | | 154,383 | | | | 11,637,391 | |
Oil, Gas & Consumable Fuels — 1.3% | | | | | | | | |
Concho Resources, Inc. (a) | | | 49,901 | | | | 5,784,524 | |
Pharmaceuticals — 5.5% | | | | | | | | |
Catalent, Inc. (a) | | | 262,842 | | | | 8,187,528 | |
Mallinckrodt PLC (a) | | | 59,760 | | | | 7,568,604 | |
Perrigo Co. PLC | | | 50,310 | | | | 8,328,821 | |
| | | | | | | | |
| | | | | | | | 24,084,953 | |
Professional Services — 0.5% | | | | | | | | |
TriNet Group, Inc. (a) | | | 58,009 | | | | 2,043,657 | |
Software — 3.8% | | | | | | | | |
Check Point Software Technologies Ltd. (a) | | | 85,014 | | | | 6,968,598 | |
PTC, Inc. (a) | | | 209,835 | | | | 7,589,732 | |
Splunk, Inc. (a) | | | 36,246 | | | | 2,145,763 | |
| | | | | | | | |
| | | | | | | | 16,704,093 | |
Specialty Retail — 3.9% | | | | | | | | |
The Men’s Wearhouse, Inc. | | | 142,133 | | | | 7,419,343 | |
Restoration Hardware Holdings, Inc. (a) | | | 98,839 | | | | 9,803,840 | |
| | | | | | | | |
| | | | | | | | 17,223,183 | |
Technology Hardware, Storage & Peripherals — 1.1% | | | | | | | | |
SanDisk Corp. | | | 78,959 | | | | 5,023,372 | |
Textiles, Apparel & Luxury Goods — 5.2% | | | | | | | | |
Kate Spade & Co. (a) | | | 261,036 | | | | 8,715,992 | |
lululemon athletica, inc. (a) | | | 120,467 | | | | 7,712,297 | |
Under Armour, Inc., Class A (a) | | | 76,467 | | | | 6,174,710 | |
| | | | | | | | |
| | | | | | | | 22,602,999 | |
Trading Companies & Distributors — 0.8% | | | | | | | | |
HD Supply Holdings, Inc. (a) | | | 113,170 | | | | 3,525,811 | |
Wireless Telecommunication Services — 2.4% | | | | | | | | |
SBA Communications Corp., Class A (a) | | | 91,070 | | | | 10,664,297 | |
Total Common Stocks — 95.8% | | | | | | | 418,627,119 | |
| | | | | | | | |
| Preferred Stocks | | | | | | |
Internet Software & Services — 2.5% | | | | | | | | |
Uber Technologies, Inc., Series D (Acquired 6/06/14, cost $5,000,911) (a)(c) | | | 322,368 | | | | 10,950,905 | |
Software — 0.9% | | | | | | | | |
Palantir Technologies, Inc., Series I (Acquired 2/07/14, cost $2,811,905) (a)(c) | | | 458,712 | | | | 4,077,950 | |
Total Preferred Stocks — 3.4% | | | | | | | 15,028,855 | |
See Notes to Financial Statements.
| | | | | | |
| 16 | | BLACKROCK FUNDS | | MARCH 31, 2015 | | |
| | | | |
| Schedule of Investments (continued) | | | BlackRock Mid-Cap Growth Equity Portfolio | |
| | | (Percentages shown are based on Net Assets) | |
| | | | | | | | |
| Warrants (d) | | Shares | | | Value | |
Pharmaceuticals — 0.0% | | | | | | | | |
Alexza Pharmaceuticals, Inc.
(Issued/Exercisable 5/06/11, 1 Share for 1
Warrant, Expires 5/06/16, Strike Price USD 17.70) | | | 81,252 | | | | — | |
Total Long-Term Investments (Cost — $321,175,040) — 99.2% | | | | | | $ | 433,655,974 | |
| | | | | | | | |
| Short-Term Securities | | | | | | |
BlackRock Liquidity Funds, TempFund, Institutional Class, 0.06% (e)(f) | | | 2,200,167 | | | | 2,200,167 | |
| | | | | | | | |
| Short-Term Securities | | Beneficial
Interest
(000) | | | Value | |
BlackRock Liquidity Series, LLC, Money Market Series, 0.22% (e)(f)(g) | | $ | 2,144 | | | $ | 2,144,391 | |
Total Short-Term Securities (Cost — $4,344,558) — 1.0% | | | | | | | 4,344,558 | |
Total Investments (Cost — $325,519,598) — 100.2% | | | | 438,000,532 | |
Liabilities in Excess of Other Assets — (0.2)% | | | | | | | (939,243 | ) |
| | | | | | | | |
Net Assets — 100.0% | | | | | | $ | 437,061,289 | |
| | | | | | | | |
|
| Notes to Schedule of Investments |
| (a) | Non-income producing security. |
| (b) | Security, or a portion of security, is on loan. |
| (c) | Restricted security as to resale. As of report date, the Fund held restricted securities with a current value of $15,028,855 and an original cost of $7,812,816 which was 3.4% of its net assets. |
| (d) | Warrants entitle the Fund to purchase a predetermined number of shares of common stock and are non-income producing. The purchase price and number of shares are subject to adjustment under certain conditions until the expiration date of the warrants, if any. |
| (e) | During the six months ended March 31, 2015, investments in issuers considered to be an affiliate of the Fund for purposes of Section 2(a)(3) of the Investment Company Act of 1940, as amended, were as follows: |
| | | | | | | | | | | | | | | | |
| Affiliate | | Shares/ Beneficial
Interest Held at
September 30, 2014 | | | Net Activity | | | Shares/
Beneficial
Interest Held at
March 31, 2015 | | | Income | |
BlackRock Liquidity Funds, TempFund, Institutional Class | | | 1,739,599 | | | | 460,568 | | | | 2,200,167 | | | $ | 841 | |
BlackRock Liquidity Series, LLC, Money Market Series | | $ | 15,352,860 | | | $ | (13,208,469 | ) | | $ | 2,144,391 | | | $ | 33,275 | |
| (f) | Represents the current yield as of report date. |
| (g) | Security was purchased with the cash collateral from loaned securities. The Fund may withdraw up to 25% of its investment daily, although the manager of the BlackRock Liquidity Series, LLC, Money Market Series, in its sole discretion, may permit an investor to withdraw more than 25% on any one day. |
| • | | For Fund compliance purposes, the Fund’s industry classifications refer to any one or more of the industry sub-classifications used by one or more widely recognized market indexes or ratings group indexes, and/or as defined by the investment advisor. These definitions may not apply for purposes of this report, which may combine such industry sub-classifications for reporting ease. |
| • | | Fair Value Measurements — Various inputs are used in determining the fair value of investments. These inputs to valuation techniques are categorized into a disclosure hierarchy consisting of three broad levels for financial statement purposes. The hierarchy gives the highest priority to unadjusted quoted prices in active markets for identical assets or liabilities (Level 1 measurements) and the lowest priority to unobservable inputs (Level 3 measurements). Accordingly, the degree of judgment exercised in determining fair value is greatest for instruments categorized in Level 3. The inputs used to measure fair value may fall into different levels of the fair value hierarchy. In such cases, for disclosure purposes, the fair value hierarchy classification is determined based on the lowest level input that is significant to the fair value measurement in its entirety. The categorization of a value determined for investments is based on the pricing transparency of the investment and is not necessarily an indication of the risks associated with investing in those securities. The three levels of the fair value hierarchy are as follows: |
| | • | | Level 1 — unadjusted quoted prices in active markets/exchanges for identical assets or liabilities that the Fund has the ability to access |
| | • | | Level 2 — other observable inputs (including, but not limited to, quoted prices for similar assets or liabilities in markets that are active, quoted prices for identical or similar assets or liabilities in markets that are not active, inputs other than quoted prices that are observable for the assets or liabilities (such as interest rates, yield curves, volatilities, prepayment speeds, loss severities, credit risks and default rates) or other market–corroborated inputs) |
| | • | | Level 3 — unobservable inputs based on the best information available in the circumstances, to the extent observable inputs are not available (including the Fund’s own assumptions used in determining the fair value of investments) |
Changes in valuation techniques may result in transfers into or out of an assigned level within the disclosure hierarchy. In accordance with the Fund’s policy, transfers between different levels of the fair value disclosure hierarchy are deemed to have occurred as of the beginning of the reporting period. For information about the Fund’s policy regarding valuation of investments, refer to Note 2 of the Notes to Financial Statements.
See Notes to Financial Statements.
| | | | | | |
| | | BLACKROCK FUNDS | | MARCH 31, 2015 | | 17 |
| | | | |
| Schedule of Investments (continued) | | | BlackRock Mid-Cap Growth Equity Portfolio | |
As of March 31, 2015, the following table summarizes the Fund’s investments categorized in the disclosure hierarchy:
| | | | | | | | | | | | | | | | |
| | | Level 1 | | | Level 2 | | | Level 3 | | | Total | |
Assets: | | | | | | | | | | | | | | | | |
Investments: | | | | | | | | | | | | | | | | |
Long-Term Investments: | | | | | | | | | | | | | | | | |
Common Stocks: | | | | | | | | | | | | | | | | |
Air Freight & Logistics | | $ | 6,601,062 | | | | — | | | | — | | | $ | 6,601,062 | |
Airlines | | | 9,428,173 | | | | — | | | | — | | | | 9,428,173 | |
Banks | | | 10,959,654 | | | | — | | | | — | | | | 10,959,654 | |
Beverages | | | 7,864,512 | | | | — | | | | — | | | | 7,864,512 | |
Biotechnology | | | 40,459,775 | | | | — | | | | — | | | | 40,459,775 | |
Capital Markets | | | 6,674,503 | | | | — | | | | — | | | | 6,674,503 | |
Chemicals | | | 7,474,809 | | | | — | | | | — | | | | 7,474,809 | |
Commercial Services & Supplies | | | 7,184,663 | | | | — | | | | — | | | | 7,184,663 | |
Diversified Consumer Services | | | 7,984,692 | | | | — | | | | — | | | | 7,984,692 | |
Diversified Financial Services | | | 9,594,961 | | | | — | | | | — | | | | 9,594,961 | |
Electrical Equipment | | | 6,334,924 | | | | — | | | | — | | | | 6,334,924 | |
Food & Staples Retailing | | | 9,807,574 | | | | — | | | | — | | | | 9,807,574 | |
Food Products | | | 2,459,366 | | | | — | | | | — | | | | 2,459,366 | |
Health Care Equipment & Supplies | | | 5,081,331 | | | | — | | | | — | | | | 5,081,331 | |
Health Care Technology | | | 7,212,858 | | | | — | | | | — | | | | 7,212,858 | |
Hotels, Restaurants & Leisure | | | 12,302,686 | | | | — | | | | — | | | | 12,302,686 | |
Household Durables | | | 8,365,077 | | | | — | | | | — | | | | 8,365,077 | |
Internet & Catalog Retail | | | 60,647,478 | | | | — | | | | — | | | | 60,647,478 | |
Internet Software & Services | | | 21,647,143 | | | | — | | | | — | | | | 21,647,143 | |
IT Services | | | 28,512,708 | | | | — | | | | — | | | | 28,512,708 | |
Media | | | 20,023,648 | | | $ | 2,711,242 | | | | — | | | | 22,734,890 | |
Multiline Retail | | | 11,637,391 | | | | — | | | | — | | | | 11,637,391 | |
Oil, Gas & Consumable Fuels | | | 5,784,524 | | | | — | | | | — | | | | 5,784,524 | |
Pharmaceuticals | | | 24,084,953 | | | | — | | | | — | | | | 24,084,953 | |
Professional Services | | | 2,043,657 | | | | — | | | | — | | | | 2,043,657 | |
Software | | | 16,704,093 | | | | — | | | | — | | | | 16,704,093 | |
Specialty Retail | | | 17,223,183 | | | | — | | | | — | | | | 17,223,183 | |
Technology Hardware, Storage & Peripherals | | | 5,023,372 | | | | — | | | | — | | | | 5,023,372 | |
Textiles, Apparel & Luxury Goods | | | 22,602,999 | | | | — | | | | — | | | | 22,602,999 | |
Trading Companies & Distributors | | | 3,525,811 | | | | — | | | | — | | | | 3,525,811 | |
Wireless Telecommunication Services | | | 10,664,297 | | | | — | | | | — | | | | 10,664,297 | |
Preferred Stocks: | | | | | | | | | | | | | | | | |
Internet Software & Services | | | — | | | | — | | | $ | 10,950,905 | | | | 10,950,905 | |
Software | | | — | | | | — | | | | 4,077,950 | | | | 4,077,950 | |
Warrants | | | — | | | | — | | | | — | | | | — | |
Short-Term Securities | | | 2,200,167 | | | | 2,144,391 | | | | — | | | | 4,344,558 | |
| | | | |
Total | | $ | 418,116,044 | | | $ | 4,855,633 | | | $ | 15,028,855 | | | $ | 438,000,532 | |
| | | | |
The Fund may hold assets and/or liabilities in which the fair value approximates the carrying amount for financial statement purposes. As of March 31, 2015, such assets and/or liabilities are categorized within the disclosure hierarchy as follows: | |
| | | | | | | | | | | | | | | | |
| | | Level 1 | | | Level 2 | | | Level 3 | | | Total | |
Assets: | | | | | | | | | | | | | | | | |
Foreign currency at value | | $ | 1,355 | | | | — | | | | — | | | $ | 1,355 | |
Liabilities: | | | | | | | | | | | | | | | | |
Collateral on securities loaned at value | | | — | | | $ | (2,144,391 | ) | | | — | | | | (2,144,391 | ) |
| | | | |
Total | | $ | 1,355 | | | $ | (2,144,391 | ) | | | — | | | $ | (2,143,036 | ) |
| | | | |
During the six months ended March 31, 2015, there were no transfers between Level 1 and Level 2.
See Notes to Financial Statements.
| | | | | | |
| 18 | | BLACKROCK FUNDS | | MARCH 31, 2015 | | |
| | | | |
| Schedule of Investments (concluded) | | | BlackRock Mid-Cap Growth Equity Portfolio | |
A reconciliation of Level 3 investments is presented when the Fund had a significant amount of Level 3 investments at the beginning and/or end of the period in relation to net assets. The following table is a reconciliation of Level 3 investments for which significant unobservable inputs were used in determining fair value:
| | | | |
| | | Preferred
Securities | |
Assets: | | | | |
Opening balance, as of September 30, 2014 | | $ | 7,812,816 | |
Transfers into Level 3 | | | — | |
Transfers out of Level 3 | | | — | |
Accrued discounts/premiums | | | — | |
Net realized gain (loss) | | | — | |
Net change in unrealized appreciation/depreciation1,2 | | | 7,216,039 | |
Purchases | | | — | |
Sales | | | — | |
Closing balance, as of March 31, 2015 | | $ | 15,028,855 | |
| | | | |
Net change in unrealized appreciation/depreciation on investments still held at March 31, 20152 | | $ | 7,216,039 | |
| | | | |
| | 1 | | Included in the related net change in unrealized appreciation/depreciation in the Statements of Operations. |
| | 2 | | Any difference between Net change in unrealized appreciation/depreciation and Net change in unrealized appreciation/depreciation on investments still held at March 31, 2015 is generally due to investments no longer held or categorized as level 3 at period end. |
The following table summarizes the valuation techniques used and unobservable inputs utilized by the BlackRock Global Valuation Methodologies Committee (the “Global Valuation Committee”) to determine the value of certain of the Fund’s Level 3 investments as of March 31, 2015.
| | | | | | | | | | | | |
| | | Value | | | Valuation Techniques | | Unobservable
Inputs | | Range of
Unobservable Inputs
Utilized | |
Assets: | | | | | | | | | | | | |
Preferred Stocks3 | | $ | 15,028,855 | | | Probability-Weighted Expected Return Model | | Years to IPO4 | | | 0.75-2.9 | |
| | | | | | | | IPO Exit Probability5 | | | 90.00% - 95.00% | |
| | | | | | | | Discount Rate4 | | | 21.30% - 22.31% | |
| | | | | | | | Margin5 | | | 20.00% | |
| | | | | | | | | Revenue Multiple5 | | | 10.0x-16.0x | |
| | 3 | | For the period ended March 31, 2015, the valuation technique for certain investments classified as preferred stocks changed to a Probability-Weighted Expected Return Model. The investments were previously valued utilizing a market comparable company and option pricing model approach. A Probability-Weighted Expected Return Model was considered to be a more relevant measure of fair value for these investments which leverages the most recent equity raise pre-money valuation. |
| | 4 | | Decrease in unobservable input may result in a significant increase to value, while an increase in the unobservable input may result in a significant decrease to value. |
| | 5 | | Increase in unobservable input may result in a significant increase to value, while a decrease in the unobservable input may result in a significant decrease to value. |
See Notes to Financial Statements.
| | | | | | |
| | | BLACKROCK FUNDS | | MARCH 31, 2015 | | 19 |
| | | | |
| Schedule of Investments March 31, 2015 (Unaudited) | | | BlackRock Small Cap Growth Equity Portfolio | |
| | | (Percentages shown are based on Net Assets) | |
| | | | | | | | |
| Common Stocks | | Shares | | | Value | |
Aerospace & Defense — 0.7% | | | | | | | | |
Ducommun, Inc. (a) | | | 100,832 | | | $ | 2,611,549 | |
Moog, Inc., Class A (a) | | | 6,073 | | | | 455,779 | |
Vectrus, Inc. (a) | | | 99,653 | | | | 2,540,155 | |
| | | | | | | | |
| | | | | | | | 5,607,483 | |
Airlines — 1.9% | | | | | | | | |
American Airlines Group, Inc. | | | 12,816 | | | | 676,428 | |
JetBlue Airways Corp. (a) | | | 702,238 | | | | 13,518,081 | |
Virgin America, Inc. (a) | | | 72,033 | | | | 2,189,803 | |
| | | | | | | | |
| | | | | | | | 16,384,312 | |
Auto Components — 3.1% | | | | | | | | |
Lear Corp. | | | 2,217 | | | | 245,688 | |
Tenneco, Inc. (a) | | | 241,345 | | | | 13,858,030 | |
Tower International, Inc. (a) | | | 463,986 | | | | 12,342,028 | |
| | | | | | | | |
| | | | | | | | 26,445,746 | |
Banks — 1.0% | | | | | | | | |
CommunityOne Bancorp (a) | | | 29,762 | | | | 292,858 | |
First Midwest Bancorp, Inc. | | | 29,540 | | | | 513,110 | |
Glacier Bancorp, Inc. | | | 29,657 | | | | 745,874 | |
Texas Capital Bancshares, Inc. (a) | | | 110,708 | | | | 5,385,944 | |
Umpqua Holdings Corp. | | | 75,351 | | | | 1,294,530 | |
| | | | | | | | |
| | | | | | | | 8,232,316 | |
Biotechnology — 10.4% | | | | | | | | |
ACADIA Pharmaceuticals, Inc. (a) | | | 26,049 | | | | 848,937 | |
Acorda Therapeutics, Inc. (a) | | | 86,189 | | | | 2,868,370 | |
Adamas Pharmaceuticals, Inc. (a) | | | 33,856 | | | | 592,141 | |
Alder Biopharmaceuticals, Inc. (a) | | | 65,719 | | | | 1,896,650 | |
Amicus Therapeutics, Inc. (a) | | | 120,335 | | | | 1,309,245 | |
Anacor Pharmaceuticals, Inc. (a) | | | 4,972 | | | | 287,630 | |
Ardelyx, Inc. (a) | | | 40,556 | | | | 530,878 | |
Ariad Pharmaceuticals, Inc. (a) | | | 104,827 | | | | 863,774 | |
Auspex Pharmaceuticals, Inc. (a) | | | 9,376 | | | | 940,132 | |
BIND Therapeutics, Inc. (a)(b) | | | 82,364 | | | | 452,178 | |
BioSpecifics Technologies Corp. (a) | | | 46,664 | | | | 1,826,896 | |
Bluebird Bio, Inc. (a) | | | 11,141 | | | | 1,345,499 | |
Celladon Corp. (a) | | | 37,598 | | | | 712,106 | |
Celldex Therapeutics, Inc. (a) | | | 33,552 | | | | 935,094 | |
Cepheid, Inc. (a) | | | 40,654 | | | | 2,313,213 | |
China Biologic Products, Inc. (a) | | | 18,188 | | | | 1,737,136 | |
Clovis Oncology, Inc. (a) | | | 5,183 | | | | 384,734 | |
Coherus Biosciences, Inc. (a) | | | 26,191 | | | | 800,921 | |
Concert Pharmaceuticals, Inc. (a) | | | 104,828 | | | | 1,587,620 | |
Cytokinetics, Inc. (a) | | | 173,037 | | | | 1,173,191 | |
Dyax Corp. (a) | | | 222,551 | | | | 3,728,842 | |
Eleven Biotherapeutics, Inc. (a) | | | 3,424 | | | | 30,542 | |
Emergent Biosolutions, Inc. (a) | | | 60,436 | | | | 1,738,139 | |
Enanta Pharmaceuticals, Inc. (a) | | | 62,276 | | | | 1,906,891 | |
Enzon Pharmaceuticals, Inc. | | | 631,173 | | | | 669,043 | |
EPIRUS Biopharmaceuticals, Inc. (a) | | | 63,827 | | | | 571,252 | |
Epizyme, Inc. (a) | | | 33,386 | | | | 626,989 | |
Exact Sciences Corp. (a) | | | 25,367 | | | | 558,581 | |
FibroGen, Inc. (a) | | | 11,824 | | | | 371,037 | |
Five Prime Therapeutics, Inc. (a) | | | 84,073 | | | | 1,921,068 | |
Halozyme Therapeutics, Inc. (a) | | | 21,628 | | | | 308,848 | |
Harvard Apparatus Regenerative Technology, Inc. (a) | | | 84,747 | | | | 275,428 | |
Hyperion Therapeutics, Inc. (a) | | | 9,767 | | | | 448,305 | |
Immune Design Corp. (a) | | | 49,806 | | | | 1,051,405 | |
Infinity Pharmaceuticals, Inc. (a) | | | 147,161 | | | | 2,057,311 | |
Intrexon Corp. (a) | | | 6,507 | | | | 295,223 | |
Ironwood Pharmaceuticals, Inc. (a) | | | 28,876 | | | | 462,016 | |
| | | | | | | | |
| Common Stocks | | Shares | | | Value | |
Biotechnology (concluded) | | | | | | | | |
Isis Pharmaceuticals, Inc. (a) | | | 132,353 | | | $ | 8,426,915 | |
Kindred Biosciences, Inc. (a) | | | 61,634 | | | | 440,067 | |
Ligand Pharmaceuticals, Inc., Class B (a) | | | 39,739 | | | | 3,064,274 | |
Lion Biotechnologies, Inc. (a) | | | 65,049 | | | | 787,743 | |
Loxo Oncology, Inc. (a) | | | 17,257 | | | | 214,850 | |
Merrimack Pharmaceuticals, Inc. (a) | | | 217,995 | | | | 2,589,781 | |
MiMedx Group, Inc. (a) | | | 47,200 | | | | 490,880 | |
Momenta Pharmaceuticals, Inc. (a) | | | 32,937 | | | | 500,642 | |
Neurocrine Biosciences, Inc. (a) | | | 46,878 | | | | 1,861,525 | |
Novavax, Inc. (a) | | | 64,410 | | | | 532,671 | |
OncoGenex Pharmaceuticals, Inc. (a) | | | 154,513 | | | �� | 332,203 | |
Oncothyreon, Inc. (a) | | | 136,379 | | | | 222,298 | |
Ophthotech Corp. (a) | | | 4,645 | | | | 216,132 | |
OPKO Health, Inc. (a) | | | 91,298 | | | | 1,293,693 | |
Orexigen Therapeutics, Inc. (a) | | | 64,920 | | | | 508,324 | |
Osiris Therapeutics, Inc. (a) | | | 6,594 | | | | 115,922 | |
PDL BioPharma, Inc. | | | 376,335 | | | | 2,647,517 | |
Peregrine Pharmaceuticals, Inc. (a)(b) | | | 282,657 | | | | 381,587 | |
Portola Pharmaceuticals, Inc. (a) | | | 9,885 | | | | 375,235 | |
Prothena Corp. PLC (a) | | | 49,524 | | | | 1,888,845 | |
PTC Therapeutics, Inc. (a) | | | 2,890 | | | | 175,857 | |
Puma Biotechnology, Inc. (a) | | | 15,692 | | | | 3,705,038 | |
Raptor Pharmaceutical Corp. (a) | | | 28,820 | | | | 313,273 | |
Receptos, Inc. (a) | | | 20,056 | | | | 3,307,034 | |
Retrophin, Inc. (a) | | | 4,354 | | | | 104,322 | |
Rigel Pharmaceuticals, Inc. (a) | | | 380,863 | | | | 1,359,681 | |
Sangamo Biosciences, Inc. (a) | | | 113,676 | | | | 1,782,440 | |
Sorrento Therapeutics, Inc. (a) | | | 40,323 | | | | 466,134 | |
Spark Therapeutics, Inc. (a) | | | 3,369 | | | | 261,097 | |
Spectrum Pharmaceuticals, Inc. (a) | | | 231,100 | | | | 1,402,777 | |
Synageva BioPharma Corp. (a) | | | 8,402 | | | | 819,447 | |
Threshold Pharmaceuticals, Inc. (a) | | | 47,898 | | | | 194,466 | |
Trevena, Inc. (a) | | | 252,950 | | | | 1,649,234 | |
United Therapeutics Corp. (a) | | | 3,360 | | | | 579,382 | |
Verastem, Inc. (a) | | | 143,686 | | | | 1,461,287 | |
Versartis, Inc. (a) | | | 22,975 | | | | 422,051 | |
Vitae Pharmaceuticals, Inc. (a) | | | 73,909 | | | | 865,474 | |
Xencor, Inc. (a) | | | 119,740 | | | | 1,834,417 | |
| | | | | | | | |
| | | | | | | | 88,021,780 | |
Building Products — 0.3% | | | | | | | | |
Continental Building Products, Inc. (a) | | | 114,140 | | | | 2,578,423 | |
Capital Markets — 0.2% | | | | | | | | |
Westwood Holdings Group, Inc. | | | 25,521 | | | | 1,538,916 | |
Chemicals — 0.6% | | | | | | | | |
OM Group, Inc. | | | 18,146 | | | | 544,924 | |
PolyOne Corp. | | | 69,193 | | | | 2,584,359 | |
Trinseo SA (a) | | | 88,389 | | | | 1,750,102 | |
| | | | | | | | |
| | | | | | | | 4,879,385 | |
Commercial Services & Supplies — 0.7% | | | | | | | | |
ARC Document Solutions, Inc. (a) | | | 146,509 | | | | 1,352,278 | |
Atento SA (a) | | | 160,334 | | | | 1,906,371 | |
Deluxe Corp. | | | 6,795 | | | | 470,758 | |
Quad Graphics, Inc. | | | 14,177 | | | | 325,787 | |
SP Plus Corp. (a) | | | 89,830 | | | | 1,962,785 | |
| | | | | | | | |
| | | | | | | | 6,017,979 | |
Communications Equipment — 1.5% | | | | | | | | |
Aruba Networks, Inc. (a) | | | 96,608 | | | | 2,365,930 | |
Aviat Networks, Inc. (a) | | | 201,039 | | | | 239,236 | |
Calix, Inc. (a) | | | 295,492 | | | | 2,479,178 | |
See Notes to Financial Statements.
| | | | | | |
| 20 | | BLACKROCK FUNDS | | MARCH 31, 2015 | | |
| | | | |
| Schedule of Investments (continued) | | | BlackRock Small Cap Growth Equity Portfolio | |
| | | (Percentages shown are based on Net Assets) | |
| | | | | | | | |
| Common Stocks | | Shares | | | Value | |
Communications Equipment (concluded) | | | | | | | | |
Plantronics, Inc. | | | 19,708 | | | $ | 1,043,539 | |
Polycom, Inc. (a) | | | 61,424 | | | | 823,082 | |
ShoreTel, Inc. (a) | | | 457,298 | | | | 3,118,772 | |
Sonus Networks, Inc. (a) | | | 286,620 | | | | 2,258,566 | |
| | | | | | | | |
| | | | | | | | 12,328,303 | |
Consumer Finance — 0.0% | | | | | | | | |
Consumer Portfolio Services, Inc. (a) | | | 40,668 | | | | 284,269 | |
Containers & Packaging — 1.8% | | | | | | | | |
Berry Plastics Group, Inc. (a) | | | 146,393 | | | | 5,297,963 | |
Graphic Packaging Holding Co. | | | 701,773 | | | | 10,203,779 | |
| | | | | | | | |
| | | | | | | | 15,501,742 | |
Distributors — 1.3% | | | | | | | | |
Core-Mark Holding Co., Inc. | | | 171,474 | | | | 11,029,208 | |
Diversified Consumer Services — 1.3% | | | | | | | | |
Collectors Universe, Inc. | | | 72,917 | | | | 1,645,007 | |
K12, Inc. (a) | | | 22,302 | | | | 350,587 | |
LifeLock, Inc. (a) | | | 424,013 | | | | 5,982,823 | |
ServiceMaster Global Holdings, Inc. (a) | | | 82,116 | | | | 2,771,415 | |
Steiner Leisure Ltd. (a) | | | 10,791 | | | | 511,493 | |
| | | | | | | | |
| | | | | | | | 11,261,325 | |
Diversified Financial Services — 0.2% | | | | | | | | |
JG Wentworth Co. (a) | | | 159,147 | | | | 1,653,537 | |
Diversified Telecommunication Services — 1.3% | |
IDT Corp, Class B | | | 33,266 | | | | 590,471 | |
Inteliquent, Inc. | | | 449,455 | | | | 7,074,422 | |
Intelsat SA (a) | | | 46,960 | | | | 563,520 | |
Leap Wireless International, Inc. (a) | | | 11,529 | | | | 29,053 | |
Premiere Global Services, Inc. (a) | | | 207,480 | | | | 1,983,509 | |
Vonage Holdings Corp. (a) | | | 145,171 | | | | 712,790 | |
| | | | | | | | |
| | | | | | | | 10,953,765 | |
Electrical Equipment — 1.2% | | | | | | | | |
EnerSys, Inc. | | | 121,686 | | | | 7,817,109 | |
Polypore International, Inc. (a) | | | 40,788 | | | | 2,402,413 | |
| | | | | | | | |
| | | | | | | | 10,219,522 | |
Electronic Equipment, Instruments & Components — 2.4% | |
DTS, Inc. (a) | | | 15,591 | | | | 531,185 | |
Electro Rent Corp. | | | 28,044 | | | | 318,019 | |
Kimball Electronics, Inc. (a) | | | 22,408 | | | | 316,849 | |
Methode Electronics, Inc. | | | 34,603 | | | | 1,627,725 | |
Newport Corp. (a) | | | 411,538 | | | | 7,843,914 | |
OSI Systems, Inc. (a) | | | 61,075 | | | | 4,535,429 | |
RealD, Inc. (a) | | | 375,674 | | | | 4,804,870 | |
| | | | | | | | |
| | | | | | | | 19,977,991 | |
Energy Equipment & Services — 0.5% | | | | | |
C&J Energy Services Ltd. (a) | | | 92,677 | | | | 1,031,495 | |
CHC Group Ltd. (a) | | | 287,539 | | | | 382,427 | |
Matrix Service Co. (a) | | | 66,059 | | | | 1,159,996 | |
Pacific Drilling SA (a) | | | 311,100 | | | | 1,210,179 | |
| | | | | | | | |
| | | | | | | | 3,784,097 | |
Food & Staples Retailing — 0.6% | | | | | | | | |
SUPERVALU, Inc. (a) | | | 440,658 | | | | 5,124,853 | |
Food Products — 1.5% | | | | | | | | |
Cal-Maine Foods, Inc. | | | 12,894 | | | | 503,640 | |
Landec Corp. (a) | | | 13,484 | | | | 188,102 | |
Omega Protein Corp. (a) | | | 111,816 | | | | 1,530,761 | |
Pilgrim’s Pride Corp. (b) | | | 110,530 | | | | 2,496,873 | |
Sanderson Farms, Inc. (b) | | | 98,906 | | | | 7,877,863 | |
| | | | | | | | |
| Common Stocks | | Shares | | | Value | |
Food Products (concluded) | | | | | | | | |
Seaboard Corp. (a) | | | 104 | | | $ | 429,728 | |
| | | | | | | | |
| | | | | | | | 13,026,967 | |
Health Care Equipment & Supplies — 6.0% | | | | | | | | |
Align Technology, Inc. (a) | | | 84,427 | | | | 4,540,906 | |
Anika Therapeutics, Inc. (a) | | | 127,363 | | | | 5,243,535 | |
Cyberonics, Inc. (a) | | | 24,362 | | | | 1,581,581 | |
Dexcom, Inc. (a) | | | 106,276 | | | | 6,625,246 | |
Greatbatch, Inc. (a) | | | 6,723 | | | | 388,926 | |
ICU Medical, Inc. (a) | | | 46,840 | | | | 4,362,678 | |
Natus Medical, Inc. (a) | | | 21,248 | | | | 838,659 | |
Nevro Corp. (a) | | | 25,255 | | | | 1,210,472 | |
Orthofix International NV (a) | | | 17,581 | | | | 630,982 | |
RTI Surgical, Inc. (a) | | | 38,703 | | | | 191,193 | |
STERIS Corp. | | | 243,791 | | | | 17,131,194 | |
SurModics, Inc. (a) | | | 67,577 | | | | 1,759,029 | |
Symmetry Surgical, Inc. (a) | | | 176,135 | | | | 1,291,070 | |
Thoratec Corp. (a) | | | 28,960 | | | | 1,213,134 | |
Zeltiq Aesthetics, Inc. (a) | | | 115,661 | | | | 3,565,829 | |
| | | | | | | | |
| | | | | | | | 50,574,434 | |
Health Care Providers & Services — 4.9% | | | | | | | | |
Alliance HealthCare Services, Inc. (a) | | | 26,038 | | | | 577,523 | |
AMN Healthcare Services, Inc. (a) | | | 85,570 | | | | 1,974,100 | |
Centene Corp. (a) | | | 81,490 | | | | 5,760,528 | |
Corvel Corp. (a) | | | 71,464 | | | | 2,459,076 | |
Five Star Quality Care, Inc. (a) | | | 153,062 | | | | 679,595 | |
Health Net, Inc. (a) | | | 181,311 | | | | 10,967,502 | |
HealthSouth Corp. | | | 166,384 | | | | 7,380,794 | |
Team Health Holdings, Inc. (a) | | | 200,254 | | | | 11,716,862 | |
| | | | | | | | |
| | | | | | | | 41,515,980 | |
Health Care Technology — 0.8% | | | | | | | | |
Omnicell, Inc. (a) | | | 181,289 | | | | 6,363,244 | |
Hotels, Restaurants & Leisure — 2.6% | | | | | | | | |
Brinker International, Inc. | | | 114,488 | | | | 7,047,881 | |
Isle of Capri Casinos, Inc. (a) | | | 87,164 | | | | 1,224,654 | |
Jack in the Box, Inc. | | | 142,534 | | | | 13,671,861 | |
| | | | | | | | |
| | | | | | | | 21,944,396 | |
Household Durables — 0.2% | | | | | | | | |
Zagg, Inc. (a) | | | 194,396 | | | | 1,685,413 | |
Insurance — 0.1% | | | | | | | | |
Maiden Holdings Ltd. | | | 31,214 | | | | 462,904 | |
Internet & Catalog Retail — 0.3% | | | | | | | | |
1-800-Flowers.com, Inc., Class A (a) | | | 161,720 | | | | 1,913,148 | |
U.S. Auto Parts Network, Inc. (a) | | | 78,258 | | | | 169,820 | |
| | | | | | | | |
| | | | | | | | 2,082,968 | |
Internet Software & Services — 4.4% | | | | | | | | |
Blucora, Inc. (a) | | | 98,802 | | | | 1,349,635 | |
Carbonite, Inc. (a) | | | 16,210 | | | | 231,803 | |
Constant Contact, Inc. (a) | | | 185,427 | | | | 7,085,166 | |
LendingClub Corp. (Acquired 4/15/14,
cost $1,161,150) (a)(c) | | | 114,160 | | | | 2,131,082 | |
Limelight Networks, Inc. (a) | | | 226,206 | | | | 821,128 | |
LivePerson, Inc. (a) | | | 100,815 | | | | 1,031,842 | |
LogMeIn, Inc. (a) | | | 289,826 | | | | 16,227,358 | |
Monster Worldwide, Inc. (a) | | | 50,878 | | | | 322,566 | |
New Relic, Inc. (a) | | | 1,305 | | | | 45,283 | |
NIC, Inc. | | | 350,262 | | | | 6,189,130 | |
Spark Networks, Inc. (a)(b) | | | 94,798 | | | | 382,984 | |
support.com, Inc. (a) | | | 313,902 | | | | 489,687 | |
Travelzoo, Inc. (a) | | | 103,506 | | | | 997,798 | |
See Notes to Financial Statements.
| | | | | | |
| | | BLACKROCK FUNDS | | MARCH 31, 2015 | | 21 |
| | | | |
| Schedule of Investments (continued) | | | BlackRock Small Cap Growth Equity Portfolio | |
| | | (Percentages shown are based on Net Assets) | |
| | | | | | | | |
| Common Stocks | | Shares | | | Value | |
Internet Software & Services (concluded) | | | | | | | | |
Zix Corp. (a) | | | 56,611 | | | $ | 222,481 | |
| | | | | | | | |
| | | | | | | | 37,527,943 | |
IT Services — 2.4% | | | | | | | | |
CSG Systems International, Inc. | | | 64,416 | | | | 1,957,602 | |
The Dolan Co. (a) | | | 14,888 | | | | 298 | |
Forrester Research, Inc. | | | 8,536 | | | | 313,954 | |
Global Cash Access Holdings, Inc. (a) | | | 410,065 | | | | 3,124,695 | |
Lionbridge Technologies, Inc. (a) | | | 178,551 | | | | 1,021,312 | |
Science Applications International Corp. | | | 18,988 | | | | 975,034 | |
Syntel, Inc. (a) | | | 247,604 | | | | 12,808,555 | |
| | | | | | | | |
| | | | | | | | 20,201,450 | |
Leisure Products — 1.3% | | | | | | | | |
Brunswick Corp. | | | 173,529 | | | | 8,928,067 | |
Nautilus, Inc. (a) | | | 120,976 | | | | 1,847,303 | |
| | | | | | | | |
| | | | | | | | 10,775,370 | |
Life Sciences Tools & Services — 0.4% | | | | | | | | |
Harvard Bioscience, Inc. (a) | | | 218,693 | | | | 1,272,793 | |
PRA Health Sciences, Inc. (a) | | | 85,505 | | | | 2,465,964 | |
| | | | | | | | |
| | | | | | | | 3,738,757 | |
Machinery — 3.7% | | | | | | | | |
Blount International, Inc. (a) | | | 476,707 | | | | 6,139,986 | |
Briggs & Stratton Corp. | | | 27,207 | | | | 558,832 | |
Global Brass & Copper Holdings, Inc. | | | 185,730 | | | | 2,869,529 | |
The Greenbrier Cos., Inc. (b) | | | 102,848 | | | | 5,965,184 | |
Hyster-Yale Materials Handling, Inc. | | | 44,296 | | | | 3,246,454 | |
John Bean Technologies Corp. | | | 10,943 | | | | 390,884 | |
Luxfer Holdings PLC — ADR | | | 518,214 | | | | 6,928,521 | |
Wabash National Corp. (a) | | | 364,814 | | | | 5,143,877 | |
| | | | | | | | |
| | | | | | | | 31,243,267 | |
Media — 0.5% | | | | | | | | |
Ascent Capital Group, Inc., Class A (a) | | | 26,443 | | | | 1,052,696 | |
Crown Media Holdings, Inc., Class A (a) | | | 185,694 | | | | 742,776 | |
Tribune Publishing Co. | | | 144,833 | | | | 2,809,760 | |
| | | | | | | | |
| | | | | | | | 4,605,232 | |
Metals & Mining — 0.0% | | | | | | | | |
Ryerson Holding Corp. (a) | | | 3,705 | | | | 23,601 | |
Multiline Retail — 1.9% | | | | | | | | |
Burlington Stores, Inc. (a) | | | 271,723 | | | | 16,145,781 | |
Oil, Gas & Consumable Fuels — 1.0% | | | | | | | | |
Bill Barrett Corp. (a) | | | 85,648 | | | | 710,878 | |
Delek US Holdings, Inc. | | | 4,256 | | | | 169,176 | |
Energy XXI Ltd. (b) | | | 44,523 | | | | 162,064 | |
Evolution Petroleum Corp. | | | 41,618 | | | | 247,627 | |
Jones Energy, Inc., Class A (a) | | | 73,683 | | | | 661,673 | |
Northern Oil and Gas, Inc. (a) | | | 68,976 | | | | 531,805 | |
Par Petroleum Corp. (a) | | | 17,556 | | | | 407,475 | |
REX American Resources Corp. (a) | | | 1,597 | | | | 97,114 | |
Rosetta Resources, Inc. (a) | | | 225,028 | | | | 3,829,977 | |
Swift Energy Co. (a)(b) | | | 87,545 | | | | 189,097 | |
W&T Offshore, Inc. | | | 42,047 | | | | 214,860 | |
Whiting Petroleum Corp. (a) | | | 43,306 | | | | 1,338,155 | |
| | | | | | | | |
| | | | | | | | 8,559,901 | |
Paper & Forest Products — 1.5% | | | | | | | | |
Boise Cascade Co. (a) | | | 337,252 | | | | 12,633,460 | |
Pharmaceuticals — 2.4% | | | | | | | | |
Actavis PLC (a) | | | 7,330 | | | | 1,173 | |
Catalent, Inc. (a) | | | 29,230 | | | | 910,515 | |
Furiex Pharmaceuticals, Inc. — CVR (a) | | | 6,467 | | | | 64,670 | |
| | | | | | | | |
| Common Stocks | | Shares | | | Value | |
Pharmaceuticals (concluded) | | | | | | | | |
Lannett Co., Inc. (a) | | | 127,383 | | | $ | 8,625,103 | |
Phibro Animal Health Corp., Class A | | | 24,563 | | | | 869,776 | |
Pozen, Inc. (a) | | | 25,176 | | | | 194,359 | |
Prestige Brands Holdings, Inc. (a) | | | 31,133 | | | | 1,335,294 | |
Sagent Pharmaceuticals, Inc. (a) | | | 55,315 | | | | 1,286,074 | |
Sciclone Pharmaceuticals, Inc. (a) | | | 175,294 | | | | 1,553,105 | |
Sucampo Pharmaceuticals, Inc., Class A (a) | | | 365,546 | | | | 5,687,896 | |
| | | | | | | | |
| | | | | | | | 20,527,965 | |
Professional Services — 3.2% | | | | | | | | |
Insperity, Inc. | | | 25,368 | | | | 1,326,493 | |
Kforce, Inc. | | | 392,020 | | | | 8,745,966 | |
Korn/Ferry International | | | 48,861 | | | | 1,606,061 | |
On Assignment, Inc. (a) | | | 68,348 | | | | 2,622,513 | |
RPX Corp. (a) | | | 657,800 | | | | 9,465,742 | |
TrueBlue, Inc. (a) | | | 121,404 | | | | 2,956,187 | |
| | | | | | | | |
| | | | | | | | 26,722,962 | |
Real Estate Investment Trusts (REITs) — 4.5% | | | | | | | | |
Chatham Lodging Trust | | | 37,726 | | | | 1,109,522 | |
Consolidated-Tomoka Land Co. | | | 2,913 | | | | 173,790 | |
CoreSite Realty Corp. | | | 7,609 | | | | 370,406 | |
DuPont Fabros Technology, Inc. | | | 395,739 | | | | 12,932,750 | |
The Geo Group, Inc. | | | 11,279 | | | | 493,343 | |
LaSalle Hotel Properties | | | 135,256 | | | | 5,256,048 | |
Lexington Realty Trust | | | 182,384 | | | | 1,792,835 | |
Pebblebrook Hotel Trust | | | 23,401 | | | | 1,089,785 | |
PS Business Parks, Inc. | | | 39,660 | | | | 3,293,366 | |
Re/Max Holdings, Inc., Class A | | | 13,659 | | | | 453,615 | |
RLJ Lodging Trust | | | 324,034 | | | | 10,145,505 | |
Strategic Hotels & Resorts, Inc. (a) | | | 39,009 | | | | 484,882 | |
| | | | | | | | |
| | | | | | | | 37,595,847 | |
Real Estate Management & Development — 0.9% | | | | | | | | |
Forestar Group, Inc. (a) | | | 186,993 | | | | 2,948,880 | |
Marcus & Millichap, Inc. (a) | | | 130,831 | | | | 4,903,546 | |
| | | | | | | | |
| | | | | | | | 7,852,426 | |
Road & Rail — 1.2% | | | | | | | | |
Quality Distribution, Inc. (a) | | | 19,046 | | | | 196,745 | |
Swift Transportation Co. (a) | | | 390,935 | | | | 10,172,129 | |
| | | | | | | | |
| | | | | | | | 10,368,874 | |
Semiconductors & Semiconductor Equipment — 6.2% | |
Alpha & Omega Semiconductor Ltd. (a) | | | 24,742 | | | | 220,451 | |
Ambarella, Inc. (a)(b) | | | 107,595 | | | | 8,146,017 | |
Amkor Technology, Inc. (a) | | | 214,533 | | | | 1,895,399 | |
Cabot Microelectronics Corp. (a) | | | 84,963 | | | | 4,245,601 | |
Cirrus Logic, Inc. (a) | | | 101,943 | | | | 3,390,624 | |
Integrated Device Technology, Inc. (a) | | | 416,215 | | | | 8,332,624 | |
Intermolecular, Inc. (a) | | | 280,962 | | | | 460,778 | |
Lattice Semiconductor Corp. (a) | | | 47,513 | | | | 301,232 | |
MaxLinear, Inc., Class A (a) | | | 86,235 | | | | 701,091 | |
Monolithic Power Systems, Inc. | | | 84,806 | | | | 4,465,036 | |
Pericom Semiconductor Corp. | | | 44,136 | | | | 682,784 | |
Qorvo, Inc. (a) | | | 122,382 | | | | 9,753,845 | |
Semtech Corp. (a) | | | 12,917 | | | | 344,173 | |
Tessera Technologies, Inc. | | | 236,222 | | | | 9,515,022 | |
| | | | | | | | |
| | | | | | | | 52,454,677 | |
Software — 6.6% | | | | | | | | |
Advent Software, Inc. | | | 46,638 | | | | 2,057,202 | |
Aspen Technology, Inc. (a) | | | 248,438 | | | | 9,562,379 | |
AVG Technologies NV (a) | | | 500,389 | | | | 10,833,422 | |
See Notes to Financial Statements.
| | | | | | |
| 22 | | BLACKROCK FUNDS | | MARCH 31, 2015 | | |
| | | | |
| Schedule of Investments (continued) | | | BlackRock Small Cap Growth Equity Portfolio | |
| | | (Percentages shown are based on Net Assets) | |
| | | | | | | | |
| Common Stocks | | Shares | | | Value | |
Software (concluded) | | | | | | | | |
ePlus, Inc. (a) | | | 33,862 | | | $ | 2,943,624 | |
Infoblox, Inc. (a) | | | 28,735 | | | | 685,904 | |
Manhattan Associates, Inc. (a) | | | 338,991 | | | | 17,156,334 | |
Monotype Imaging Holdings, Inc. | | | 11,861 | | | | 387,143 | |
Net1 UEPS Technologies, Inc. (a) | | | 156,605 | | | | 2,142,356 | |
Progress Software Corp. (a) | | | 25,507 | | | | 693,025 | |
QAD, Inc., Class A | | | 21,862 | | | | 529,060 | |
Qlik Technologies, Inc. (a) | | | 6,852 | | | | 213,303 | |
Qualys, Inc. (a) | | | 10,596 | | | | 492,502 | |
SolarWinds, Inc. (a) | | | 4,322 | | | | 221,459 | |
Vasco Data Security International, Inc. (a)(b) | | | 129,450 | | | | 2,788,353 | |
Verint Systems, Inc. (a) | | | 77,131 | | | | 4,776,723 | |
Viggle, Inc. (a) | | | 16,470 | | | | 11,776 | |
| | | | | | | | |
| | | | | | | | 55,494,565 | |
Specialty Retail — 2.0% | | | | | | | | |
Aaron’s, Inc. | | | 160,057 | | | | 4,531,214 | |
ANN, Inc. (a) | | | 82,985 | | | | 3,404,875 | |
Build-A-Bear-Workshop, Inc. (a) | | | 20,044 | | | | 393,865 | |
Haverty Furniture Cos., Inc. | | | 53,247 | | | | 1,324,785 | |
Kirkland’s, Inc. (a) | | | 93,888 | | | | 2,229,840 | |
Outerwall, Inc. (b) | | | 66,852 | | | | 4,420,254 | |
Stage Stores, Inc. | | | 40,796 | | | | 935,044 | |
| | | | | | | | |
| | | | | | | | 17,239,877 | |
Technology Hardware, Storage & Peripherals — 0.7% | |
Avid Technology, Inc. (a) | | | 187,810 | | | | 2,798,369 | |
Quantum Corp. (a) | | | 1,946,591 | | | | 3,114,546 | |
| | | | | | | | |
| | | | | | | | 5,912,915 | |
Textiles, Apparel & Luxury Goods — 2.9% | | | | | | | | |
Deckers Outdoor Corp. (a) | | | 93,120 | | | | 6,785,654 | |
Iconix Brand Group, Inc. (a) | | | 179,379 | | | | 6,039,691 | |
Skechers U.S.A., Inc., Class A (a) | | | 164,243 | | | | 11,810,714 | |
| | | | | | | | |
| | | | | | | | 24,636,059 | |
Thrifts & Mortgage Finance — 1.2% | | | | | | | | |
Anchor BanCorp Wisconsin, Inc. (a) | | | 14,643 | | | | 508,551 | |
EverBank Financial Corp. | | | 134,524 | | | | 2,425,468 | |
HomeStreet, Inc. (a) | | | 189,528 | | | | 3,472,153 | |
Meta Financial Group, Inc. | | | 66,804 | | | | 2,654,123 | |
MGIC Investment Corp. (a) | | | 37,979 | | | | 365,738 | |
Walker & Dunlop, Inc. (a) | | | 14,698 | | | | 260,596 | |
| | | | | | | | |
| | | | | | | | 9,686,629 | |
Tobacco — 0.8% | | | | | | | | |
Vector Group Ltd. | | | 294,954 | | | | 6,480,139 | |
Trading Companies & Distributors — 0.8% | | | | | | | | |
H&E Equipment Services, Inc. | | | 38,964 | | | | 973,710 | |
Neff Corp., Class A (a) | | | 21,888 | | | | 230,700 | |
Watsco, Inc. | | | 44,345 | | | | 5,574,167 | |
Willis Lease Finance Corp. (a) | | | 9,853 | | | | 183,069 | |
| | | | | | | | |
| | | | | | | | 6,961,646 | |
Water Utilities — 0.1% | | | | | | | | |
American States Water Co. | | | 9,680 | | | | 386,135 | |
Total Common Stocks — 98.0% | | | | | | | 827,256,736 | |
| | | | | | | | |
| | | | | | | |
| | | | | | | | |
| Preferred Stocks | | Shares | | | Value | |
Household Durables — 0.1% | | | | | | | | |
AliphCom (Acquired 6/03/14, cost $749,991) (a)(c) | | | 66,562 | | | $ | 736,648 | |
Software — 0.7% | | | | | | | | |
Apigee Corp., Series H (Acquired 4/15/14, cost $303,400) (a)(c) | | | 104,261 | | | | 328,422 | |
Illumio Inc., Series C (Acquired 3/10/15, cost $750,000) (a)(c) | | | 46,673 | | | | 750,000 | |
MongoDB Series C (Acquired 12/19/13, cost $1,517,990) (a)(c) | | | 60,511 | | | | 1,372,995 | |
MongoDB Series D (Acquired 12/19/13, cost $472,222) (a)(c) | | | 18,824 | | | | 420,716 | |
MongoDB Series E (Acquired 12/19/13, cost $16,682) (a)(c) | | | 665 | | | | 14,477 | |
Palantir Technologies, Inc., Series I (Acquired 2/06/14, cost $1,999,998) (a)(c) | | | 326,264 | | | | 2,900,487 | |
| | | | | | | | |
| | | | | | | | 5,787,097 | |
Total Preferred Stocks — 0.8% | | | | | | | 6,523,745 | |
| | | | | | | | |
| Warrants (d) | | | | | | |
Pharmaceuticals — 0.0% | | | | | | | | |
Alexza Pharmaceuticals, Inc.
(Issued/Exercisable 5/06/11, 1 Share for 1 Warrant, Expires 5/06/16, Strike Price USD 17.70) | | | 1,000,249 | | | | — | |
Total Long-Term Investments (Cost — $723,089,641) — 98.8% | | | | | | | 833,780,481 | |
| | | | | | | | |
| Short-Term Securities | | | | | | |
BlackRock Liquidity Funds, TempFund, Institutional Class, 0.06% (e)(f) | | | 9,428,446 | | | | 9,428,446 | |
| | | Beneficial
Interest
(000) | | | | |
BlackRock Liquidity Series, LLC, Money Market Series, 0.22% (e)(f)(g) | | $ | 20,955 | | | | 20,954,953 | |
Total Short-Term Securities (Cost — $30,383,399) — 3.6% | | | | | | | 30,383,399 | |
Total Investments (Cost — $753,473,040) — 102.4% | | | | 864,163,880 | |
Liabilities in Excess of Other Assets — (2.4)% | | | | (19,960,050 | ) |
| | | | | | | | |
Net Assets — 100.0% | | | | | | $ | 844,203,830 | |
| | | | | | | | |
|
| Notes to Schedule of Investments |
| (a) | Non-income producing security. |
| (b) | Security, or a portion of security, is on loan. |
See Notes to Financial Statements.
| | | | | | |
| | | BLACKROCK FUNDS | | MARCH 31, 2015 | | 23 |
| | | | |
| Schedule of Investments (continued) | | | BlackRock Small Cap Growth Equity Portfolio | |
| (c) | Restricted security as to resale. As of report date, the Fund held restricted securities with a current value of $8,654,827 and an original cost of $6,971,433 which was 1.0% of its net assets. |
| (d) | Warrants entitle the Fund to purchase a predetermined number of shares of common stock and are non-income producing. The purchase price and number of shares are subject to adjustment under certain conditions until the expiration date of the warrants, if any. |
| (e) | During the six months ended March 31, 2015, investments in issuers considered to be an affiliate of the Fund for purposes of Section 2(a)(3) of the Investment Company Act of 1940, as amended, were as follows: |
| | | | | | | | | | | | | | | | |
| Affiliate | | Shares/Beneficial Interest Held at September 30,
2014 | | | Net Activity | | | Shares/Beneficial Interest Held at March 31, 2015 | | | Income | |
BlackRock Liquidity Funds, TempFund, Institutional Class | | | 13,997,672 | | | | (4,569,226 | ) | | | 9,428,446 | | | $ | 2,508 | |
BlackRock Liquidity Series, LLC, Money Market Series | | $ | 10,214,730 | | | $ | 10,740,223 | | | $ | 20,954,953 | | | $ | 1,192,992 | |
| (f) | Represents the current yield as of report date. |
| (g) | Security was purchased with the cash collateral from loaned securities. The Fund may withdraw up to 25% of its investment daily, although the manager of the BlackRock Liquidity Series, LLC, Money Market Series, in its sole discretion, may permit an investor to withdraw more than 25% on any one day. |
| • | | For Fund compliance purposes, the Fund’s industry classifications refer to any one or more of the industry sub-classifications used by one or more widely recognized market indexes or ratings group indexes, and/or as defined by the investment advisor. These definitions may not apply for purposes of this report, which may combine such industry sub-classifications for reporting ease. |
| • | | As of March 31, 2015, financial futures contracts outstanding were as follows: |
| | | | | | | | | | | | | | | | | | | | |
Contracts
Purchased | | | Issue | | Exchange | | Expiration | | | | | Notional Value | | | Unrealized
Appreciation | |
| | 98 | | | E-Mini Russell 2000 Futures | | Intercontinental Exchange | | June 2015 | | | USD | | | | 12,239,220 | | | $ | 149,175 | |
| • | | Fair Value Measurements — Various inputs are used in determining the fair value of investments and derivative financial instruments. These inputs to valuation techniques are categorized into a disclosure hierarchy consisting of three broad levels for financial statement purposes. The hierarchy gives the highest priority to unadjusted quoted prices in active markets for identical assets or liabilities (Level 1 measurements) and the lowest priority to unobservable inputs (Level 3 measurements). Accordingly, the degree of judgment exercised in determining fair value is greatest for instruments categorized in Level 3. The inputs used to measure fair value may fall into different levels of the fair value hierarchy. In such cases, for disclosure purposes, the fair value hierarchy classification is determined based on the lowest level input that is significant to the fair value measurement in its entirety. The categorization of a value determined for investments and derivative financial instruments is based on the pricing transparency of the investment and derivative financial instrument and is not necessarily an indication of the risks associated with investing in those securities. The three levels of the fair value hierarchy are as follows: |
| | • | | Level 1 — unadjusted quoted prices in active markets/exchanges for identical assets or liabilities that the Fund has the ability to access |
| | • | | Level 2 — other observable inputs (including, but not limited to, quoted prices for similar assets or liabilities in markets that are active, quoted prices for identical or similar assets or liabilities in markets that are not active, inputs other than quoted prices that are observable for the assets or liabilities (such as interest rates, yield curves, volatilities, prepayment speeds, loss severities, credit risks and default rates) or other market–corroborated inputs) |
| | • | | Level 3 — unobservable inputs based on the best information available in the circumstances, to the extent observable inputs are not available (including the Fund’s own assumptions used in determining the fair value of investments and derivative financial instruments) |
Changes in valuation techniques may result in transfers into or out of an assigned level within the disclosure hierarchy. In accordance with the Fund’s policy, transfers between different levels of the fair value disclosure hierarchy are deemed to have occurred as of the beginning of the reporting period. For information about the Fund’s policy regarding valuation of investments and derivative financial instruments, refer to Note 2 of the Notes to Financial Statements.
As of March 31, 2015, the following tables summarize the Fund’s investments and derivative financial instruments categorized in the disclosure hierarchy:
| | | | | | | | | | | | | | | | |
| | | Level 1 | | | Level 2 | | | Level 3 | | | Total | |
Assets: | | | | | | | | | | | | | | | | |
Investments: | | | | | | | | | | | | | | | | |
Long-Term Investments: | | | | | | | | | | | | | | | | |
Common Stocks: | | | | | | | | | | | | | | | | |
Aerospace & Defense | | $ | 5,607,483 | | | | — | | | | — | | | $ | 5,607,483 | |
Airlines | | | 16,384,312 | | | | — | | | | — | | | | 16,384,312 | |
Auto Components | | | 26,445,746 | | | | — | | | | — | | | | 26,445,746 | |
Banks | | | 8,232,316 | | | | — | | | | — | | | | 8,232,316 | |
Biotechnology | | | 88,021,780 | | | | — | | | | — | | | | 88,021,780 | |
Building Products | | | 2,578,423 | | | | — | | | | — | | | | 2,578,423 | |
Capital Markets | | | 1,538,916 | | | | — | | | | — | | | | 1,538,916 | |
Chemicals | | | 4,879,385 | | | | — | | | | — | | | | 4,879,385 | |
Commercial Services & Supplies | | | 6,017,979 | | | | — | | | | — | | | | 6,017,979 | |
Communications Equipment | | | 12,328,303 | | | | — | | | | — | | | | 12,328,303 | |
Consumer Finance | | | 284,269 | | | | — | | | | — | | | | 284,269 | |
Containers & Packaging | | | 15,501,742 | | | | — | | | | — | | | | 15,501,742 | |
Distributors | | | 11,029,208 | | | | — | | | | — | | | | 11,029,208 | |
Diversified Consumer Services | | | 11,261,325 | | | | — | | | | — | | | | 11,261,325 | |
Diversified Financial Services | | | 1,653,537 | | | | — | | | | — | | | | 1,653,537 | |
Diversified Telecommunication Services | | | 10,924,712 | | | | — | | | $ | 29,053 | | | | 10,953,765 | |
Electrical Equipment | | | 10,219,522 | | | | — | | | | — | | | | 10,219,522 | |
See Notes to Financial Statements.
| | | | | | |
| 24 | | BLACKROCK FUNDS | | MARCH 31, 2015 | | |
| | | | |
| Schedule of Investments (concluded) | | | BlackRock Small Cap Growth Equity Portfolio | |
| | | | | | | | | | | | | | | | | | | | |
| | | Level 1 | | Level 2 | | Level 3 | | Total |
Electronic Equipment, Instruments & Components | | | $ | 19,977,991 | | | | | — | | | | | — | | | | $ | 19,977,991 | |
Energy Equipment & Services | | | | 3,784,097 | | | | | — | | | | | — | | | | | 3,784,097 | |
Food & Staples Retailing | | | | 5,124,853 | | | | | — | | | | | — | | | | | 5,124,853 | |
Food Products | | | | 13,026,967 | | | | | — | | | | | — | | | | | 13,026,967 | |
Health Care Equipment & Supplies | | | | 50,574,434 | | | | | — | | | | | — | | | | | 50,574,434 | |
Health Care Providers & Services | | | | 41,515,980 | | | | | — | | | | | — | | | | | 41,515,980 | |
Health Care Technology | | | | 6,363,244 | | | | | — | | | | | — | | | | | 6,363,244 | |
Hotels, Restaurants & Leisure | | | | 21,944,396 | | | | | — | | | | | — | | | | | 21,944,396 | |
Household Durables | | | | 1,685,413 | | | | | — | | | | | — | | | | | 1,685,413 | |
Insurance | | | | 462,904 | | | | | — | | | | | — | | | | | 462,904 | |
Internet & Catalog Retail | | | | 2,082,968 | | | | | — | | | | | — | | | | | 2,082,968 | |
Internet Software & Services | | | | 35,396,861 | | | | | $2,131,082 | | | | | — | | | | | 37,527,943 | |
IT Services | | | | 20,201,152 | | | | | — | | | | $ | 298 | | | | | 20,201,450 | |
Leisure Products | | | | 10,775,370 | | | | | — | | | | | — | | | | | 10,775,370 | |
Life Sciences Tools & Services | | | | 3,738,757 | | | | | — | | | | | — | | | | | 3,738,757 | |
Machinery | | | | 31,243,267 | | | | | — | | | | | — | | | | | 31,243,267 | |
Media | | | | 4,605,232 | | | | | — | | | | | — | | | | | 4,605,232 | |
Metals & Mining | | | | 23,601 | | | | | — | | | | | — | | | | | 23,601 | |
Multiline Retail | | | | 16,145,781 | | | | | — | | | | | — | | | | | 16,145,781 | |
Oil, Gas & Consumable Fuels | | | | 8,559,901 | | | | | — | | | | | — | | | | | 8,559,901 | |
Paper & Forest Products | | | | 12,633,460 | | | | | — | | | | | — | | | | | 12,633,460 | |
Pharmaceuticals | | | | 20,462,122 | | | | | — | | | | | 65,843 | | | | | 20,527,965 | |
Professional Services | | | | 26,722,962 | | | | | — | | | | | — | | | | | 26,722,962 | |
Real Estate Investment Trusts (REITs) | | | | 37,595,847 | | | | | — | | | | | — | | | | | 37,595,847 | |
Real Estate Management & Development | | | | 7,852,426 | | | | | — | | | | | — | | | | | 7,852,426 | |
Road & Rail | | | | 10,368,874 | | | | | — | | | | | — | | | | | 10,368,874 | |
Semiconductors & Semiconductor Equipment | | | | 52,454,677 | | | | | — | | | | | — | | | | | 52,454,677 | |
Software | | | | 55,482,789 | | | | | — | | | | | 11,776 | | | | | 55,494,565 | |
Specialty Retail | | | | 17,239,877 | | | | | — | | | | | — | | | | | 17,239,877 | |
Technology Hardware, Storage & Peripherals | | | | 5,912,915 | | | | | — | | | | | — | | | | | 5,912,915 | |
Textiles, Apparel & Luxury Goods | | | | 24,636,059 | | | | | — | | | | | — | | | | | 24,636,059 | |
Thrifts & Mortgage Finance | | | | 9,686,629 | | | | | — | | | | | — | | | | | 9,686,629 | |
Tobacco | | | | 6,480,139 | | | | | — | | | | | — | | | | | 6,480,139 | |
Trading Companies & Distributors | | | | 6,961,646 | | | | | — | | | | | — | | | | | 6,961,646 | |
Water Utilities | | | | 386,135 | | | | | — | | | | | — | | | | | 386,135 | |
Preferred Stocks: | | | | | | | | | | | | | | | | | | | | |
Household Durables | | | | — | | | | | — | | | | | 736,648 | | | | | 736,648 | |
Software | | | | — | | | | | — | | | | | 5,787,097 | | | | | 5,787,097 | |
Warrants | | | | — | | | | | — | | | | | — | | | | | — | |
Short-Term Securities | | | | 9,428,446 | | | | $ | 20,954,953 | | | | | — | | | | | 30,383,399 | |
| | | | | |
Total | | | $ | 834,447,130 | | | | $ | 23,086,035 | | | | $ | 6,630,715 | | | | $ | 864,163,880 | |
| | | | | |
| | | | | | | | | | | | | | | | | | | | |
| | | Level 1 | | Level 2 | | Level 3 | | Total |
Derivative Financial Instruments1 | | | | | | | | | | | | | | | | | | | | |
Assets: | | | | | | | | | | | | | | | | | | | | |
Equity contracts | | | $ | 149,175 | | | | | — | | | | | — | | | | $ | 149,175 | |
1 Derivative financial instruments are financial futures contracts which are valued at the unrealized appreciation/depreciation on the instrument. | |
The Fund may hold assets and/or liabilities in which the fair value approximates the carrying amount for financial statement purposes. As of March 31, 2015, such assets and/or liabilities are categorized within the disclosure hierarchy as follows: | |
| | | | | | | | | | | | | | | | | | | | |
| | | Level 1 | | Level 2 | | Level 3 | | Total |
Assets: | | | | | | | | | | | | | | | | | | | | |
Cash pledged for financial futures contracts | | | $ | 537,000 | | | | | — | | | | | — | | | | $ | 537,000 | |
Liabilities: | | | | | | | | | | | | | | | | | | | | |
Collateral on securities loaned at value | | | | — | | | | $ | (20,954,953 | ) | | | | — | | | | | (20,954,953 | ) |
| | | | | |
Total | | | $ | 537,000 | | | | $ | (20,954,953 | ) | | | | — | | | | $ | (20,417,953 | ) |
| | | | | |
During the six months ended March 31, 2015, there were no transfers between levels.
See Notes to Financial Statements.
| | | | | | |
| | | BLACKROCK FUNDS | | MARCH 31, 2015 | | 25 |
| | |
| Statements of Assets and Liabilities | | |
| | | | | | | | | | | | |
| March 31, 2015 (Unaudited) | | BlackRock
Flexible Equity Fund1 | | | BlackRock Mid-Cap
Growth Equity
Portfolio | | | BlackRock
Small Cap
Growth Equity
Portfolio | |
| | | | | | | | | | | | |
| Assets | | | | | | | | | | | | |
Investments at value — unaffiliated2,3 | | $ | 549,470,832 | | | $ | 433,655,974 | | | $ | 833,780,481 | |
Investments at value — affiliated4 | | | 2,213,948 | | | | 4,344,558 | | | | 30,383,399 | |
Cash pledged for financial futures contracts | | | — | | | | — | | | | 537,000 | |
Foreign currency at value5 | | | — | | | | 1,355 | | | | — | |
Investments sold receivable | | | 5,065,336 | | | | — | | | | 12,209,545 | |
Unrealized appreciation on forward foreign currency exchange contracts | | | 2,054,574 | | | | — | | | | — | |
Capital shares sold receivable | | | 156,989 | | | | 2,272,783 | | | | 707,633 | |
Dividends receivable — unaffiliated | | | 911,148 | | | | 125,179 | | | | 565,775 | |
Dividends receivable — affiliated | | | 1,016 | | | | 204 | | | | 499 | |
Receivable from Manager | | | 120,511 | | | | 3,303 | | | | — | |
Securities lending income receivable — affiliated | | | 1,240 | | | | 3,155 | | | | 262,151 | |
Prepaid expenses | | | 53,495 | | | | 54,359 | | | | 47,944 | |
| | | | |
Total assets | | | 560,049,089 | | | | 440,460,870 | | | | 878,494,427 | |
| | | | |
| | | | | | | | |
| Liabilities | | | | | | | | | | | | |
Collateral on securities loaned at value | | | 576,157 | | | | 2,144,391 | | | | 20,954,953 | |
Variation margin payable on financial futures contracts | | | — | | | | — | | | | 24,690 | |
Investments purchased payable | | | — | | | | — | | | | 10,412,252 | |
Unrealized depreciation on forward foreign currency exchange contracts | | | 584,811 | | | | — | | | | — | |
Capital shares redeemed payable | | | 1,217,826 | | | | 451,222 | | | | 1,726,588 | |
Investment advisory fees payable | | | 378,412 | | | | 300,000 | | | | 393,561 | |
Transfer agent fees payable | | | 429,556 | | | | 273,351 | | | | 429,823 | |
Service and distribution fees payable | | | 169,194 | | | | 110,246 | | | | 97,377 | |
Officer’s and Trustees’ fees payable | | | 5,424 | | | | 3,339 | | | | 6,310 | |
Other affiliates payable | | | 22,742 | | | | 44,523 | | | | 93,636 | |
Other accrued expenses payable | | | 98,954 | | | | 72,509 | | | | 151,407 | |
| | | | |
Total liabilities | | | 3,483,076 | | | | 3,399,581 | | | | 34,290,597 | |
| | | | |
Net Assets | | $ | 556,566,013 | | | $ | 437,061,289 | | | $ | 844,203,830 | |
| | | | |
| | | | | | | | | | | | |
| Net Assets Consist of | | | | | | | | | | | | |
Paid-in capital | | $ | 533,624,716 | | | $ | 319,610,341 | | | $ | 714,510,720 | |
Undistributed (accumulated) net investment income (loss) | | | (5,373,907 | ) | | | (1,529,943 | ) | | | 707,583 | |
Accumulated net realized gain | | | 12,054,694 | | | | 6,500,131 | | | | 18,145,512 | |
Net unrealized appreciation/depreciation | | | 16,260,510 | | | | 112,480,760 | | | | 110,840,015 | |
| | | | |
Net Assets | | $ | 556,566,013 | | | $ | 437,061,289 | | | $ | 844,203,830 | |
| | | | |
1 Consolidated Statement of Assets and Liabilities. | | | | | | | | | | | | |
2 Investments at cost — unaffiliated | | $ | 534,656,902 | | | $ | 321,175,040 | | | $ | 723,089,641 | |
3 Securities loaned at value | | $ | 544,577 | | | $ | 2,090,828 | | | $ | 20,485,531 | |
4 Investments at cost — affiliated | | $ | 2,213,948 | | | $ | 4,344,558 | | | $ | 30,383,399 | |
5 Foreign currency at cost | | $ | — | | | $ | 1,529 | | | | — | |
See Notes to Financial Statements.
| | | | | | |
| 26 | | BLACKROCK FUNDS | | MARCH 31, 2015 | | |
| | |
| Statements of Assets and Liabilities (concluded) | | |
| | | | | | | | | | | | |
| March 31, 2015 (Unaudited) | | BlackRock
Flexible Equity Fund1 | | | BlackRock Mid-Cap
Growth Equity
Portfolio | | | BlackRock
Small Cap
Growth Equity
Portfolio | |
| | | | | | | | | | | | |
| Net Asset Value | | | | | | | | | | | | |
Institutional | | | | | | | | | | | | |
Net assets | | $ | 49,474,897 | | | $ | 32,844,437 | | | $ | 487,378,006 | |
| | | | |
Shares outstanding2 | | | 3,842,164 | | | | 1,828,485 | | | | 25,027,989 | |
| | | | |
Net asset value | | $ | 12.88 | | | $ | 17.96 | | | $ | 19.47 | |
| | | | |
Service | | | | | | | | | | | | |
Net assets | | $ | 175,797 | | | $ | 2,002,404 | | | $ | 21,356,229 | |
| | | | |
Shares outstanding2 | | | 13,871 | | | | 121,816 | | | | 1,254,521 | |
| | | | |
Net asset value | | $ | 12.67 | | | $ | 16.44 | | | $ | 17.02 | |
| | | | |
Investor A | | | | | | | | | | | | |
Net assets | | $ | 415,058,185 | | | $ | 355,612,923 | | | $ | 302,109,498 | |
| | | | |
Shares outstanding2 | | | 33,457,210 | | | | 22,488,818 | | | | 19,191,233 | |
| | | | |
Net asset value | | $ | 12.41 | | | $ | 15.81 | | | $ | 15.74 | |
| | | | |
Investor B | | | | | | | | | | | | |
Net assets | | $ | 5,546,755 | | | $ | 2,982,528 | | | $ | 729,955 | |
| | | | |
Shares outstanding2 | | | 502,905 | | | | 230,397 | | | | 69,451 | |
| | | | |
Net asset value | | $ | 11.03 | | | $ | 12.95 | | | $ | 10.51 | |
| | | | |
Investor C | | | | | | | | | | | | |
Net assets | | $ | 84,986,365 | | | $ | 35,447,037 | | | $ | 32,630,142 | |
| | | | |
Shares outstanding2 | | | 7,796,051 | | | | 2,758,394 | | | | 3,167,370 | |
| | | | |
Net asset value | | $ | 10.90 | | | $ | 12.85 | | | $ | 10.30 | |
| | | | |
Class R | | | | | | | | | | | | |
Net assets | | $ | 1,324,014 | | | $ | 8,171,960 | | | | — | |
| | | | |
Shares outstanding2 | | | 103,541 | | | | 522,048 | | | | — | |
| | | | |
Net asset value | | $ | 12.79 | | | $ | 15.65 | | | | — | |
| | | | |
| | 1 | | Consolidated Statement of Assets and Liabilities. |
| | 2 | | Unlimited number of shares authorized, $0.001 par value. |
See Notes to Financial Statements.
| | | | | | |
| | | BLACKROCK FUNDS | | MARCH 31, 2015 | | 27 |
| | | | | | | | | | | | |
| Six Months Ended March 31, 2015 (Unaudited) | | BlackRock
Flexible Equity Fund1 | | | BlackRock
Mid-Cap
Growth Equity
Portfolio | | | BlackRock
Small Cap
Growth Equity
Portfolio | |
| | | | | | | | | | | | |
| Investment Income | | | | | | | | | | | | |
Dividends — unaffiliated | | $ | 3,322,297 | | | $ | 1,295,810 | | | $ | 3,516,253 | |
Dividends — affiliated | | | 7,375 | | | | 841 | | | | 2,508 | |
Securities lending — affiliated — net | | | 76,249 | | | | 33,275 | | | | 1,192,992 | |
Foreign taxes withheld | | | (75,923 | ) | | | (2,497 | ) | | | (211 | ) |
| | | | |
Total income | | | 3,329,998 | | | | 1,327,429 | | | | 4,711,542 | |
| | | | |
| | | | | | | | | | | | |
| Expenses | | | | | | | | | | | | |
Investment advisory | | | 2,299,435 | | | | 1,586,884 | | | | 2,209,187 | |
Service and distribution — class specific | | | 1,010,390 | | | | 599,707 | | | | 548,079 | |
Transfer agent — class specific | | | 642,675 | | | | 479,585 | | | | 697,890 | |
Administration | | | 167,503 | | | | 116,019 | | | | 226,069 | |
Administration — class specific | | | 64,919 | | | | 44,571 | | | | 90,305 | |
Professional | | | 43,205 | | | | 31,972 | | | | 40,767 | |
Registration | | | 39,361 | | | | 38,527 | | | | 36,961 | |
Custodian | | | 33,112 | | | | 15,112 | | | | 59,585 | |
Accounting services | | | 31,900 | | | | 23,484 | | | | 41,942 | |
Printing | | | 19,927 | | | | 14,072 | | | | 22,954 | |
Officer and Trustees | | | 10,642 | | | | 7,547 | | | | 13,436 | |
Miscellaneous | | | 15,728 | | | | 11,933 | | | | 19,536 | |
Recoupment of past waived and/or reimbursed fees — class specific | | | 15 | | | | 7,362 | | | | — | |
| | | | |
Total expenses | | | 4,378,812 | | | | 2,976,775 | | | | 4,006,711 | |
Less fees waived by the Manager | | | (18,262 | ) | | | (831 | ) | | | (2,661 | ) |
Less administration fees waived — class specific | | | (64,911 | ) | | | (37,107 | ) | | | (91 | ) |
Less transfer agent fees waived — class specific | | | (52,742 | ) | | | (51,253 | ) | | | — | |
Less transfer agent fees reimbursed — class specific | | | (395,484 | ) | | | (30,212 | ) | | | — | |
| | | | |
Total expenses after fees waived and reimbursed | | | 3,847,413 | | | | 2,857,372 | | | | 4,003,959 | |
| | | | |
Net investment income (loss) | | | (517,415 | ) | | | (1,529,943 | ) | | | 707,583 | |
| | | | |
| | | | | | | | | | | | |
| Realized and Unrealized Gain (Loss) | | | | | | | | | | | | |
Net realized gain (loss) from: | | | | | | | | | | | | |
Investments — unaffiliated | | | 66,640,198 | | | | 12,961,847 | | | | 24,026,937 | |
Investments — affiliated | | | (602,119 | ) | | | — | | | | — | |
Capital gain distributions received from affiliated investment companies | | | 3,191 | | | | — | | | | — | |
Options written | | | (1,895,215 | ) | | | — | | | | — | |
Financial futures contracts | | | (8,345,746 | ) | | | — | | | | 397,857 | |
Swaps | | | (1,811,587 | ) | | | — | | | | — | |
Foreign currency transactions | | | 9,192,082 | | | | (54,943 | ) | | | — | |
| | | | |
| | | 63,180,804 | | | | 12,906,904 | | | | 24,424,794 | |
| | | | |
Net change in unrealized appreciation/depreciation on: | | | | | | | | | | | | |
Investments — unaffiliated | | | (34,156,299 | ) | | | 40,647,464 | | | | 64,476,033 | |
Investments — affiliated | | | 452,280 | | | | — | | | | — | |
Options written | | | (138,156 | ) | | | — | | | | — | |
Financial futures contracts | | | (1,856,152 | ) | | | — | | | | 498,850 | |
Swaps | | | 505,315 | | | | — | | | | — | |
Foreign currency translations | | | (3,910,738 | ) | | | (97 | ) | | | — | |
| | | | |
| | | (39,103,750 | ) | | | 40,647,367 | | | | 64,974,883 | |
| | | | |
Net realized and unrealized gain | | | 24,077,054 | | | | 53,554,271 | | | | 89,399,677 | |
| | | | |
Net Increase in Net Assets Resulting from Operations | | $ | 23,559,639 | | | $ | 52,024,328 | | | $ | 90,107,260 | |
| | | | |
| | 1 | | Consolidated Statement of Operations. |
See Notes to Financial Statements.
| | | | | | |
| 28 | | BLACKROCK FUNDS | | MARCH 31, 2015 | | |
| | |
| Statements of Changes in Net Assets | | |
| | | | | | | | | | | | | | | | | | | | | | | | |
| | | BlackRock
Flexible
Equity
Fund1 | | | BlackRock
Mid-Cap
Growth Equity
Portfolio | | | BlackRock
Small Cap
Growth Equity
Portfolio | |
| Increase (Decrease) in Net Assets: | | Six Months
Ended
March 31, 2015
(Unaudited) | | | Year Ended
September 30,
2014 | | | Six Months Ended March 31, 2015
(Unaudited) | | | Year Ended September 30,
2014 | | | Six Months Ended
March 31, 2015
(Unaudited) | | | Year Ended September 30,
2014 | |
| | | | | | | | | | | | | | | | | | | | | | | | |
| Operations | | | | | | | | | | | | | | | | | | | | | | | | |
Net investment income (loss) | | $ | (517,415 | ) | | $ | 9,751,658 | | | $ | (1,529,943 | ) | | $ | (4,058,090 | ) | | $ | 707,583 | | | $ | (3,740,286 | ) |
Net realized gain | | | 63,180,804 | | | | 84,047,958 | | | | 12,906,904 | | | | 48,420,488 | | | | 24,424,794 | | | | 234,248,636 | |
Net change in unrealized appreciation/depreciation | | | (39,103,750 | ) | | | (54,848,721 | ) | | | 40,647,367 | | | | 3,873,240 | | | | 64,974,883 | | | | (120,565,561 | ) |
| | | | | | | | | | | | |
Net increase in net assets resulting from operations | | | 23,559,639 | | | | 38,950,895 | | | | 52,024,328 | | | | 48,235,638 | | | | 90,107,260 | | | | 109,942,789 | |
| | | | | | | | | | | | |
| | | | | | | | | | | | | | | | | | | | | | | | |
| Distributions to Shareholders From2 | | | | | | | | | | | | | | | | | | | | | | | | |
Net investment income: | | | | | | | | | | | | | | | | | | | | | | | | |
Institutional | | | (1,469,061 | ) | | | (973,756 | ) | | | — | | | | — | | | | — | | | | — | |
Service | | | (4,373 | ) | | | (2,950 | ) | | | — | | | | — | | | | — | | | | — | |
Investor A | | | (11,203,633 | ) | | | (5,945,499 | ) | | | — | | | | — | | | | — | | | | — | |
Investor B | | | (130,864 | ) | | | (39,265 | ) | | | — | | | | — | | | | — | | | | — | |
Investor C | | | (2,049,761 | ) | | | (580,645 | ) | | | — | | | | — | | | | — | | | | — | |
Class R | | | (36,334 | ) | | | (7,904 | ) | | | — | | | | — | | | | — | | | | — | |
Net realized gain: | | | | | | | | | | | | | | | | | | | | | | | | |
Institutional | | | (6,558,090 | ) | | | (477,055 | ) | | | (3,190,419 | ) | | | (3,566,206 | ) | | | (99,594,343 | ) | | | (224,335,020 | ) |
Service | | | (22,326 | ) | | | (2,055 | ) | | | (475,796 | ) | | | (359,600 | ) | | | (4,990,887 | ) | | | (8,970,316 | ) |
Investor A | | | (55,240,666 | ) | | | (4,533,517 | ) | | | (36,956,433 | ) | | | (48,709,954 | ) | | | (71,147,923 | ) | | | (114,556,801 | ) |
Investor B | | | (915,431 | ) | | | (84,318 | ) | | | (424,056 | ) | | | (773,466 | ) | | | (252,945 | ) | | | (545,137 | ) |
Investor C | | | (12,781,606 | ) | | | (1,036,560 | ) | | | (4,319,606 | ) | | | (4,928,001 | ) | | | (10,799,606 | ) | | | (14,869,102 | ) |
Class R | | | (190,598 | ) | | | (11,753 | ) | | | (935,237 | ) | | | (1,635,424 | ) | | | — | | | | — | |
| | | | | | | | | | | | |
Decrease in net assets resulting from distributions to shareholders | | | (90,602,743 | ) | | | (13,695,277 | ) | | | (46,301,547 | ) | | | (59,972,651 | ) | | | (186,785,704 | ) | | | (363,276,376 | ) |
| | | | | | | | | | | | |
| | | | | | | | | | | | | | | | | | | | | | | | |
| Capital Share Transactions | | | | | | | | | | | | | | | | | | | | | | | | |
Net increase (decrease) in net assets derived from capital share transactions | | | 27,021,449 | | | | (121,269,351 | ) | | | 36,016,376 | | | | 63,142,862 | | | | 146,257,756 | | | | (206,530,437 | ) |
| | | | | | | | | | | | |
| | | | | | | | | | | | | | | | | | | | | | | | |
| Net Assets | | | | | | | | | | | | | | | | | | | | | | | | |
Total increase (decrease) in net assets | | | (40,021,655 | ) | | | (96,013,733 | ) | | | 41,739,157 | | | | 51,405,849 | | | | 49,579,312 | | | | (459,864,024 | ) |
Beginning of period | | | 596,587,668 | | | | 692,601,401 | | | | 395,322,132 | | | | 343,916,283 | | | | 794,624,518 | | | | 1,254,488,542 | |
| | | | | | | | | | | | |
End of period | | $ | 556,566,013 | | | $ | 596,587,668 | | | $ | 437,061,289 | | | $ | 395,322,132 | | | $ | 844,203,830 | | | $ | 794,624,518 | |
| | | | | | | | | | | | |
Undistributed (accumulated) net investment income (loss) | | $ | (5,373,907 | ) | | $ | 10,037,534 | | | $ | (1,529,943 | ) | | | — | | | $ | 707,583 | | | | — | |
| | | | | | | | | | | | |
| | 1 | | Consolidated Statements of Changes in Net Assets. |
| | 2 | | Distributions for annual periods determined in accordance with federal income tax regulations. |
See Notes to Financial Statements.
| | | | | | |
| | | BLACKROCK FUNDS | | MARCH 31, 2015 | | 29 |
| | | | |
| Financial Highlights | | | BlackRock Flexible Equity Fund | |
| | | | | | | | | | | | | | | | | | | | | | | | |
| | | Institutional | |
| | | Six Months
Ended
March 31, 2015
(Unaudited)1 | | | Year Ended September 30, | |
| | | 20141 | | | 20131 | | | 20121 | | | 2011 | | | 2010 | |
| Per Share Operating Performance | | | | | | | | | | | | | | | | | | | | | | | | |
Net asset value, beginning of period | | $ | 14.51 | | | $ | 14.04 | | | $ | 12.53 | | | $ | 9.81 | | | $ | 10.53 | | | $ | 9.34 | |
| | | | |
Net investment income2 | | | 0.02 | | | | 0.29 | | | | 0.19 | | | | 0.10 | | | | 0.12 | | | | 0.10 | |
Net realized and unrealized gain (loss) | | | 0.60 | | | | 0.53 | | | | 1.46 | | | | 2.72 | | | | (0.74 | ) | | | 1.16 | |
| | | | |
Net increase (decrease) from investment operations | | | 0.62 | | | | 0.82 | | | | 1.65 | | | | 2.82 | | | | (0.62 | ) | | | 1.26 | |
| | | | |
Distributions from:3 | | | | | | | | | | | | | | | | | | | | | | | | |
Net investment income | | | (0.41 | ) | | | (0.21 | ) | | | (0.14 | ) | | | (0.10 | ) | | | (0.10 | ) | | | (0.07 | ) |
Net realized gain | | | (1.84 | ) | | | (0.14 | ) | | | — | | | | — | | | | — | | | | — | |
| | | | |
Total distributions | | | (2.25 | ) | | | (0.35 | ) | | | (0.14 | ) | | | (0.10 | ) | | | (0.10 | ) | | | (0.07 | ) |
| | | | |
Net asset value, end of period | | $ | 12.88 | | | $ | 14.51 | | | $ | 14.04 | | | $ | 12.53 | | | $ | 9.81 | | | $ | 10.53 | |
| | | | |
| | | | | | | | | | | | | | | | | | | | | | | | |
| Total Return4 | | | | | | | | | | | | | | | | | | | | | | | | |
Based on net asset value | | | 4.42 | %5 | | | 5.76 | % | | | 13.36 | % | | | 28.90 | % | | | (6.03 | )%6 | | | 13.56 | % |
| | | | |
| | | | | | | | | | | | | | | | | | | | | | | | |
| Ratios to Average Net Assets | | | | |
Total expenses | | | 1.11 | %7,8 | | | 1.09 | %7 | | | 1.15 | %7 | | | 1.13 | % | | | 1.08 | % | | | 1.13 | % |
| | | | |
Total expenses excluding recoupment of past waived fees | | | 1.11 | %7,8 | | | 1.09 | %7 | | | 1.15 | %7 | | | 1.13 | % | | | 1.08 | % | | | 1.13 | % |
| | | | |
Total expenses after fees waived, reimbursed and paid indirectly | | | 0.92 | %7,8 | | | 0.96 | %7 | | | 0.97 | %7 | | | 0.97 | % | | | 0.97 | % | | | 0.97 | % |
| | | | |
Net investment income | | | 0.24 | %7,8 | | | 1.99 | %7 | | | 1.48 | %7 | | | 0.89 | % | | | 0.98 | % | | | 0.99 | % |
| | | | |
| | | | | | | | | | | | | | | | | | | | | | | | |
| Supplemental Data | | | | | | | | | | | | | | | | | | | | | | | | |
Net assets, end of period (000) | | $ | 49,475 | | | $ | 53,274 | | | $ | 64,078 | | | $ | 142,963 | | | $ | 195,753 | | | $ | 204,286 | |
| | | | |
Portfolio turnover | | | 131 | % | | | 102 | % | | | 119 | % | | | 156 | % | | | 137 | % | | | 123 | % |
| | | | |
| | 1 | | Consolidated Financial Highlights. |
| | 2 | | Based on average shares outstanding. |
| | 3 | | Distributions for annual periods determined in accordance with federal income tax regulations. |
| | 4 | | Where applicable, assumes the reinvestment of distributions. |
| | 5 | | Aggregate total return. |
| | 6 | | Includes proceeds received from a settlement of litigation, which had no impact on the Fund’s total return. |
| | 7 | | Excludes expenses incurred indirectly as a result of investments in underlying funds as follows: |
| | | | | | | | | | | | | | | | | | | | | | | | |
| | | | |
| | | Six Months
Ended
March 31,
2015
(Unaudited) | | | Year Ended September 30, | |
| | | 2014 | | | 2013 | | | 2012 | | | 2011 | | | 2010 | |
Investments in underlying funds | | | 0.01 | % | | | 0.01 | % | | | 0.03 | % | | | — | | | | — | | | | — | |
See Notes to Financial Statements.
| | | | | | |
| 30 | | BLACKROCK FUNDS | | MARCH 31, 2015 | | |
| | | | |
| Financial Highlights (continued) | | | BlackRock Flexible Equity Fund | |
| | | | | | | | | | | | | | | | | | | | | | | | |
| | | Service | |
| | | Six Months
Ended March 31,
2015 (Unaudited)1 | | | Year Ended September 30, | |
| | | | 20141 | | | 20131 | | | 20121 | | | 2011 | | | 2010 | |
| Per Share Operating Performance | | | | | | | | | | | | | | | | | | | | | | | | |
Net asset value, beginning of period | | $ | 14.29 | | | $ | 13.81 | | | $ | 12.30 | | | $ | 9.63 | | | $ | 10.33 | | | $ | 9.17 | |
| | | | |
Net investment income (loss)2 | | | (0.01 | ) | | | 0.23 | | | | 0.14 | | | | 0.06 | | | | 0.08 | | | | 0.04 | |
Net realized and unrealized gain (loss) | | | 0.59 | | | | 0.54 | | | | 1.44 | | | | 2.68 | | | | (0.73 | ) | | | 1.17 | |
| | | | |
Net increase (decrease) from investment operations | | | 0.58 | | | | 0.77 | | | | 1.58 | | | | 2.74 | | | | (0.65 | ) | | | 1.21 | |
| | | | |
Distributions from:3 | | | | |
Net investment income | | | (0.36 | ) | | | (0.15 | ) | | | (0.07 | ) | | | (0.07 | ) | | | (0.05 | ) | | | (0.05 | ) |
Net realized gain | | | (1.84 | ) | | | (0.14 | ) | | | — | | | | — | | | | — | | | | — | |
| | | | |
Total distributions | | | (2.20 | ) | | | (0.29 | ) | | | (0.07 | ) | | | (0.07 | ) | | | (0.05 | ) | | | (0.05 | ) |
| | | | |
Net asset value, end of period | | $ | 12.67 | | | $ | 14.29 | | | $ | 13.81 | | | $ | 12.30 | | | $ | 9.63 | | | $ | 10.33 | |
| | | | |
| | | | | | | | | | | | | | | | | | | | | | | | |
| Total Return4 | | | | | | | | | | | | | | | | | | | | | | | | |
Based on net asset value | | | 4.17 | %5 | | | 5.45 | % | | | 13.00 | % | | | 28.58 | % | | | (6.38 | )%6 | | | 13.20 | % |
| | | | |
| | | | | | | | | | | | | | | | | | | | | | | | |
| Ratios to Average Net Assets | | | | | | | | | | | | | | | | | | | | | | | | |
Total expenses | | | 1.39 | %7,8,9 | | | 1.30 | %7 | | | 1.75 | %7 | | | 1.95 | % | | | 1.49 | % | | | 1.31 | % |
| | | | |
Total expenses excluding recoupment of past waived fees | | | 1.38 | %7,9 | | | 1.30 | %7 | | | 1.73 | %7 | | | 1.95 | % | | | 1.49 | % | | | 1.31 | % |
| | | | |
Total expenses after fees waived, reimbursed and paid indirectly | | | 1.23 | %7,9 | | | 1.27 | %7 | | | 1.29 | %7 | | | 1.29 | % | | | 1.29 | % | | | 1.27 | % |
| | | | |
Net investment income (loss) | | | (0.08 | )%7,9 | | | 1.60 | %7 | | | 1.15 | %7 | | | 0.56 | % | | | 0.65 | % | | | 0.37 | % |
| | | | |
| | | | | | | | | | | | | | | | | | | | | | | | |
| Supplemental Data | | | | | | | | | | | | | | | | | | | | | | | | |
Net assets, end of period (000) | | $ | 176 | | | $ | 211 | | | $ | 421 | | | $ | 674 | | | $ | 1,025 | | | $ | 737 | |
| | | | |
Portfolio turnover | | | 131 | % | | | 102 | % | | | 119 | % | | | 156 | % | | | 137 | % | | | 123 | % |
| | | | |
| | 1 | | Consolidated Financial Highlights. |
| | 2 | | Based on average shares outstanding. |
| | 3 | | Distributions for annual periods determined in accordance with federal income tax regulations. |
| | 4 | | Where applicable, assumes the reinvestment of distributions. |
| | 5 | | Aggregate total return. |
| | 6 | | Includes proceeds received from a settlement of litigation, which had no impact on the Fund’s total return. |
| | 7 | | Excludes expenses incurred indirectly as a result of investments in underlying funds as follows: |
| | | | | | | | | | | | | | | | | | | | | | | | |
| | | | |
| | | Six Months
Ended
March 31,
2015 (Unaudited) | | | Year Ended September 30, | |
| | | | 2014 | | | 2013 | | | 2012 | | | 2011 | | | 2010 | |
Investments in underlying funds | | | 0.01 | % | | | 0.01 | % | | | 0.03 | % | | | — | | | | — | | | | — | |
| | 8 | | Includes recoupment of past waived and/or reimbursed fees. There was no financial impact to the expense ratio. |
See Notes to Financial Statements.
| | | | | | |
| | | BLACKROCK FUNDS | | MARCH 31, 2015 | | 31 |
| | | | |
| Financial Highlights (continued) | | | BlackRock Flexible Equity Fund | |
| | | | | | | | | | | | | | | | | | | | | | | | |
| | | Investor A | |
| | | Six Months
Ended
March 31,
2015 (Unaudited)1 | | | Year Ended September 30, | |
| | | | 20141 | | | 20131 | | | 20121 | | | 2011 | | | 2010 | |
| Per Share Operating Performance | | | | | | | | | | | | | | | | | | | | | | | | |
Net asset value, beginning of period | | $ | 14.04 | | | $ | 13.59 | | | $ | 12.14 | | | $ | 9.50 | | | $ | 10.21 | | | $ | 9.06 | |
| | | | |
Net investment income (loss)2 | | | (0.01 | ) | | | 0.22 | | | | 0.14 | | | | 0.07 | | | | 0.08 | | | | 0.06 | |
Net realized and unrealized gain (loss) | | | 0.59 | | | | 0.54 | | | | 1.41 | | | | 2.63 | | | | (0.72 | ) | | | 1.13 | |
| | | | |
Net increase (decrease) from investment operations | | | 0.58 | | | | 0.76 | | | | 1.55 | | | | 2.70 | | | | (0.64 | ) | | | 1.19 | |
| | | | |
Distributions from:3 | | | | | | | | | | | | | | | | | | | | | | | | |
Net investment income | | | (0.37 | ) | | | (0.17 | ) | | | (0.10 | ) | | | (0.06 | ) | | | (0.07 | ) | | | (0.04 | ) |
Net realized gain | | | (1.84 | ) | | | (0.14 | ) | | | — | | | | — | | | | — | | | | — | |
| | | | |
Total distributions | | | (2.21 | ) | | | (0.31 | ) | | | (0.10 | ) | | | (0.06 | ) | | | (0.07 | ) | | | (0.04 | ) |
| | | | |
Net asset value, end of period | | $ | 12.41 | | | $ | 14.04 | | | $ | 13.59 | | | $ | 12.14 | | | $ | 9.50 | | | $ | 10.21 | |
| | | | |
| | | | | | | | | | | | | | | | | | | | | | | | |
| Total Return4 | | | | | | | | | | | | | | | | | | | | | | | | |
Based on net asset value | | | 4.27 | %5 | | | 5.46 | % | | | 12.92 | % | | | 28.54 | % | | | (6.33 | )%6 | | | 13.21 | % |
| | | | |
| | | | | | | | | | | | | | | | | | | | | | | | |
| Ratios to Average Net Assets | | | | | | | | | | | | | | | | | | | | | | | | |
Total expenses | | | 1.43 | %7,8 | | | 1.40 | %7 | | | 1.43 | %7 | | | 1.40 | % | | | 1.37 | % | | | 1.40 | % |
| | | | |
Total expenses excluding recoupment of past waived fees | | | 1.43 | %7,8 | | | 1.40 | %7 | | | 1.43 | %7 | | | 1.40 | % | | | 1.37 | % | | | 1.40 | % |
| | | | |
Total expenses after fees waived, reimbursed and paid indirectly | | | 1.24 | %7,8 | | | 1.27 | %7 | | | 1.29 | %7 | | | 1.29 | % | | | 1.29 | % | | | 1.29 | % |
| | | | |
Net investment income (loss) | | | (0.08 | )%7,8 | | | 1.55 | %7 | | | 1.11 | %7 | | | 0.60 | % | | | 0.66 | % | | | 0.61 | % |
| | | | |
| | | | | | | | | | | | | | | | | | | | | | | | |
| Supplemental Data | | | | | | | | | | | | | | | | | | | | | | | | |
Net assets, end of period (000) | | $ | 415,058 | | | $ | 443,630 | | | $ | 512,059 | | | $ | 615,464 | | | $ | 587,989 | | | $ | 726,666 | |
| | | | |
Portfolio turnover | | | 131 | % | | | 102 | % | | | 119 | % | | | 156 | % | | | 137 | % | | | 123 | % |
| | | | |
| | 1 | | Consolidated Financial Highlights. |
| | 2 | | Based on average shares outstanding. |
| | 3 | | Distributions for annual periods determined in accordance with federal income tax regulations. |
| | 4 | | Where applicable, excludes the effects of any sales charges and assumes the reinvestment of distributions. |
| | 5 | | Aggregate total return. |
| | 6 | | Includes proceeds received from a settlement of litigation, which had no impact on the Fund’s total return. |
| | 7 | | Excludes expenses incurred indirectly as a result of investments in underlying funds as follows: |
| | | | | | | | | | | | | | | | | | | | | | | | |
| | | | |
| | | Six Months
Ended
March 31,
2015 (Unaudited) | | | Year Ended September 30, | |
| | | | 2014 | | | 2013 | | | 2012 | | | 2011 | | | 2010 | |
Investments in underlying funds | | | 0.01 | % | | | 0.01 | % | | | 0.03 | % | | | — | | | | — | | | | — | |
See Notes to Financial Statements.
| | | | | | |
| 32 | | BLACKROCK FUNDS | | MARCH 31, 2015 | | |
| | | | |
| Financial Highlights (continued) | | | BlackRock Flexible Equity Fund | |
| | | | | | | | | | | | | | | | | | | | | | | | |
| | | Investor B | |
| | | Six Months
Ended
March 31,
2015 (Unaudited)1 | | | Year Ended September 30, | |
| | | | 20141 | | | 20131 | | | 20121 | | | 2011 | | | 2010 | |
| Per Share Operating Performance | | | | | | | | | | | | | | | | | | | | | | | | |
Net asset value, beginning of period | | $ | 12.66 | | | $ | 12.26 | | | $ | 10.95 | | | $ | 8.58 | | | $ | 9.25 | | | $ | 8.23 | |
| | | | |
Net investment income (loss)2 | | | (0.05 | ) | | | 0.11 | | | | 0.04 | | | | (0.02 | ) | | | (0.01 | ) | | | (0.02 | ) |
Net realized and unrealized gain (loss) | | | 0.52 | | | | 0.48 | | | | 1.28 | | | | 2.39 | | | | (0.65 | ) | | | 1.04 | |
| | | | |
Net increase (decrease) from investment operations | | | 0.47 | | | | 0.59 | | | | 1.32 | | | | 2.37 | | | | (0.66 | ) | | | 1.02 | |
| | | | |
Distributions from:3 | | | | | | | | | | | | | | | | | | | | | | | | |
Net investment income | | | (0.26 | ) | | | (0.05 | ) | | | (0.01 | ) | | | — | | | | (0.01 | ) | | | — | |
Net realized gain | | | (1.84 | ) | | | (0.14 | ) | | | — | | | | — | | | | — | | | | — | |
| | | | |
Total distributions | | | (2.10 | ) | | | (0.19 | ) | | | (0.01 | ) | | | — | | | | (0.01 | ) | | | — | |
| | | | |
Net asset value, end of period | | $ | 11.03 | | | $ | 12.66 | | | $ | 12.26 | | | $ | 10.95 | | | $ | 8.58 | | | $ | 9.25 | |
| | | | |
| | | | | | | | | | | | | | | | | | | | | | | | |
| Total Return4 | | | | | | | | | | | | | | | | | | | | | | | | |
Based on net asset value | | | 3.82 | %5 | | | 4.68 | % | | | 12.04 | % | | | 27.62 | % | | | (7.17 | )%6 | | | 12.39 | % |
| | | | |
| | | | | | | | | | | | | | | | | | | | | | | | |
| Ratios to Average Net Assets | | | | | | | | | | | | | | | | | | | | | | | | |
Total expenses | | | 2.56 | %7,8 | | | 2.41 | %7 | | | 2.42 | %7 | | | 2.31 | % | | | 2.13 | % | | | 2.22 | % |
| | | | |
Total expenses excluding recoupment of past waived fees | | | 2.56 | %7,8 | | | 2.41 | %7 | | | 2.41 | %7 | | | 2.30 | % | | | 2.12 | % | | | 2.20 | % |
| | | | |
Total expenses after fees waived, reimbursed and paid indirectly | | | 2.01 | %7,8 | | | 2.05 | %7 | | | 2.06 | %7 | | | 2.06 | % | | | 2.06 | % | | | 2.04 | % |
| | | | |
Net investment income (loss) | | | (0.87 | )%7,8 | | | 0.82 | %7 | | | 0.36 | %7 | | | (0.19 | )% | | | (0.10 | )% | | | (0.24 | )% |
| | | | |
| | | | | | | | | | | | | | | | | | | | | | | | |
| Supplemental Data | | | | | | | | | | | | | | | | | | | | | | | | |
Net assets, end of period (000) | | $ | 5,547 | | | $ | 7,122 | | | $ | 11,918 | | | $ | 17,465 | | | $ | 26,233 | | | $ | 42,239 | |
| | | | |
Portfolio turnover | | | 131 | % | | | 102 | % | | | 119 | % | | | 156 | % | | | 137 | % | | | 123 | % |
| | | | |
| | 1 | | Consolidated Financial Highlights. |
| | 2 | | Based on average shares outstanding. |
| | 3 | | Distributions for annual periods determined in accordance with federal income tax regulations. |
| | 4 | | Where applicable, excludes the effects of any sales charges and assumes the reinvestment of distributions. |
| | 5 | | Aggregate total return. |
| | 6 | | Includes proceeds received from a settlement of litigation, which had no impact on the Fund’s total return. |
| | 7 | | Excludes expenses incurred indirectly as a result of investments in underlying funds as follows: |
| | | | | | | | | | | | | | | | | | | | | | | | |
| | | | |
| | | Six Months
Ended
March 31,
2015 (Unaudited) | | | Year Ended September 30, | |
| | | | 2014 | | | 2013 | | | 2012 | | | 2011 | | | 2010 | |
Investments in underlying funds | | | 0.01 | % | | | 0.01 | % | | | 0.03 | % | | | — | | | | — | | | | — | |
See Notes to Financial Statements.
| | | | | | |
| | | BLACKROCK FUNDS | | MARCH 31, 2015 | | 33 |
| | | | |
| Financial Highlights (continued) | | | BlackRock Flexible Equity Fund | |
| | | | | | | | | | | | | | | | | | | | | | | | |
| | | Investor C | |
| | | Six Months
Ended
March 31,
2015 (Unaudited)1 | | | Year Ended September 30, | |
| | | | 20141 | | | 20131 | | | 20121 | | | 2011 | | | 2010 | |
| Per Share Operating Performance | | | | | | | | | | | | | | | | | | | | | | | | |
Net asset value, beginning of period | | $ | 12.57 | | | $ | 12.20 | | | $ | 10.91 | | | $ | 8.55 | | | $ | 9.22 | | | $ | 8.20 | |
| | | | |
Net investment income (loss)2 | | | (0.05 | ) | | | 0.10 | | | | 0.04 | | | | (0.02 | ) | | | (0.01 | ) | | | (0.01 | ) |
Net realized and unrealized gain (loss) | | | 0.52 | | | | 0.48 | | | | 1.27 | | | | 2.38 | | | | (0.64 | ) | | | 1.03 | |
| | | | |
Net increase (decrease) from investment operations | | | 0.47 | | | | 0.58 | | | | 1.31 | | | | 2.36 | | | | (0.65 | ) | | | 1.02 | |
| | | | |
Distributions from:3 | | | | | | | | | | | | | | | | | | | | | | | | |
Net investment income | | | (0.30 | ) | | | (0.07 | ) | | | (0.02 | ) | | | — | | | | (0.02 | ) | | | — | |
Net realized gain | | | (1.84 | ) | | | (0.14 | ) | | | — | | | | — | | | | — | | | | — | |
| | | | |
Total distributions | | | (2.14 | ) | | | (0.21 | ) | | | (0.02 | ) | | | — | | | | (0.02 | ) | | | — | |
| | | | |
Net asset value, end of period | | $ | 10.90 | | | $ | 12.57 | | | $ | 12.20 | | | $ | 10.91 | | | $ | 8.55 | | | $ | 9.22 | |
| | | | |
| | | | | | | | | | | | | | | | | | | | | | | | |
| Total Return4 | | | | | | | | | | | | | | | | | | | | | | | | |
Based on net asset value | | | 3.79 | %5 | | | 4.67 | % | | | 12.01 | % | | | 27.60 | % | | | (7.11 | )%6 | | | 12.44 | % |
| | | | |
| | | | | | | | | | | | | | | | | | | | | | | | |
| Ratios to Average Net Assets | | | | | | | | | | | | | | | | | | | | | | | | |
Total expenses | | | 2.16 | %7,8 | | | 2.14 | %7 | | | 2.20 | %7 | | | 2.18 | % | | | 2.16 | % | | | 2.22 | % |
| | | | |
Total expenses excluding recoupment of past waived fees | | | 2.16 | %7,8 | | | 2.14 | %7 | | | 2.20 | %7 | | | 2.18 | % | | | 2.16 | % | | | 2.22 | % |
| | | | |
Total expenses after fees waived, reimbursed and paid indirectly | | | 2.01 | %7,8 | | | 2.04 | %7 | | | 2.06 | %7 | | | 2.06 | % | | | 2.06 | % | | | 2.06 | % |
| | | | |
Net investment income (loss) | | | (0.85 | )%7,8 | | | 0.78 | %7 | | | 0.34 | %7 | | | (0.18 | )% | | | (0.11 | )% | | | (0.17 | )% |
| | | | |
| | | | | | | | | | | | | | | | | | | | | | | | |
| Supplemental Data | | | | | | | | | | | | | | | | | | | | | | | | |
Net assets, end of period (000) | | $ | 84,986 | | | $ | 90,904 | | | $ | 103,097 | | | $ | 115,242 | | | $ | 112,520 | | | $ | 148,923 | |
| | | | |
Portfolio turnover | | | 131 | % | | | 102 | % | | | 119 | % | | | 156 | % | | | 137 | % | | | 123 | % |
| | | | |
| | 1 | | Consolidated Financial Highlights. |
| | 2 | | Based on average shares outstanding. |
| | 3 | | Distributions for annual periods determined in accordance with federal income tax regulations. |
| | 4 | | Where applicable, excludes the effects of any sales charges and assumes the reinvestment of distributions. |
| | 5 | | Aggregate total return. |
| | 6 | | Includes proceeds received from a settlement of litigation, which had no impact on the Fund’s total return. |
| | 7 | | Excludes expenses incurred indirectly as a result of investments in underlying funds as follows: |
| | | | | | | | | | | | | | | | | | | | | | | | |
| | | | |
| | | Six Months
Ended
March 31,
2015 (Unaudited) | | | Year Ended September 30, | |
| | | | 2014 | | | 2013 | | | 2012 | | | 2011 | | | 2010 | |
Investments in underlying funds | | | 0.01 | % | | | 0.01 | % | | | 0.03 | % | | | — | | | | — | | | | — | |
See Notes to Financial Statements.
| | | | | | |
| 34 | | BLACKROCK FUNDS | | MARCH 31, 2015 | | |
| | | | |
| Financial Highlights (concluded) | | | BlackRock Flexible Equity Fund | |
| | | | | | | | | | | | | | | | | | | | | | | | |
| | | Class R | |
| | | Six Months
Ended
March 31,
2015 (Unaudited)1 | | | Year Ended September 30, | | | Period July 30, 20102 to
September 30, 2010 | |
| | | | 20141 | | | 20131 | | | 20121 | | | 2011 | | |
| Per Share Operating Performance | | | | | | | | | | | | | | | | | | | | | | | | |
Net asset value, beginning of period | | $ | 14.41 | | | $ | 13.94 | | | $ | 12.46 | | | $ | 9.75 | | | $ | 10.51 | | | $ | 10.24 | |
| | | | |
Net investment income (loss)3 | | | (0.03 | ) | | | 0.19 | | | | 0.10 | | | | 0.03 | | | | 0.04 | | | | 0.00 | 4 |
Net realized and unrealized gain (loss) | | | 0.60 | | | | 0.53 | | | | 1.45 | | | | 2.71 | | | | (0.73 | ) | | | 0.27 | |
| | | | |
Net increase (decrease) from investment operations | | | 0.57 | | | | 0.72 | | | | 1.55 | | | | 2.74 | | | | (0.69 | ) | | | 0.27 | |
| | | | |
Distributions from:5 | | | | | | | | | | | | | | | | | | | | | | | | |
Net investment income | | | (0.35 | ) | | | (0.11 | ) | | | (0.07 | ) | | | (0.03 | ) | | | (0.07 | ) | | | — | |
Net realized gain | | | (1.84 | ) | | | (0.14 | ) | | | — | | | | — | | | | — | | | | — | |
| | | | |
Total distributions | | | (2.19 | ) | | | (0.25 | ) | | | (0.07 | ) | | | (0.03 | ) | | �� | (0.07 | ) | | | — | |
| | | | |
Net asset value, end of period | | $ | 12.79 | | | $ | 14.41 | | | $ | 13.94 | | | $ | 12.46 | | | $ | 9.75 | | | $ | 10.51 | |
| | | | |
| | | | | | | | | | | | | | | | | | | | | | | | |
| Total Return6 | | | | | | | | | | | | | | | | | | | | | | | | |
Based on net asset value | | | 4.05 | %7 | | | 5.05 | % | | | 12.51 | % | | | 28.13 | % | | | (6.66 | )%8 | | | 13.17 | %7 |
| | | | |
| | | | | | | | | | | | | | | | | | | | | | | | |
| Ratios to Average Net Assets | | | | | | | | | | | | | | | | | | | | | | | | |
Total expenses | | | 1.66 | %9,10 | | | 1.68 | %9 | | | 1.78 | %9 | | | 1.78 | % | | | 1.72 | % | | | 2.21 | %10 |
| | | | |
Total expenses excluding recoupment of past waived fees | | | 1.66 | %9,10 | | | 1.67 | %9 | | | 1.78 | %9 | | | 1.78 | % | | | 1.70 | % | | | 2.21 | %10 |
| | | | |
Total expenses after fees waived, reimbursed and paid indirectly | | | 1.60 | %9,10 | | | 1.63 | %9 | | | 1.65 | %9 | | | 1.65 | % | | | 1.65 | % | | | 1.65 | %10 |
| | | | |
Net investment income (loss) | | | (0.44 | )%9,10 | | | 1.30 | %9 | | | 0.78 | %9 | | | 0.25 | % | | | 0.31 | % | | | 0.08 | %10 |
| | | | |
| | | | | | | | | | | | | | | | | | | | | | | | |
| Supplemental Data | | | | | | | | | | | | | | | | | | | | | | | | |
Net assets, end of period (000) | | $ | 1,324 | | | $ | 1,446 | | | $ | 1,028 | | | $ | 1,312 | | | $ | 920 | | | $ | 838 | |
| | | | |
Portfolio turnover | | | 131 | % | | | 102 | % | | | 119 | % | | | 156 | % | | | 137 | % | | | 123 | % |
| | | | |
| | 1 | | Consolidated Financial Highlights. |
| | 2 | | Commencement of operations. |
| | 3 | | Based on average shares outstanding. |
| | 4 | | Amount is less than $0.005 per share. |
| | 5 | | Distributions for annual periods determined in accordance with federal income tax regulations. |
| | 6 | | Where applicable, assumes the reinvestment of distributions. |
| | 7 | | Aggregate total return. |
| | 8 | | Includes proceeds received from a settlement of litigation, which had no impact on the Fund’s total return. |
| | 9 | | Excludes expenses incurred indirectly as a result of investments in underlying funds as follows: |
| | | | | | | | | | | | | | | | | | | | | | | | |
| | | | |
| | | Six Months
Ended
March 31,
2015 (Unaudited) | | | Year Ended September 30, | |
| | | | 2014 | | | 2013 | | | 2012 | | | 2011 | | | 2010 | |
Investments in underlying funds | | | 0.01 | % | | | 0.01 | % | | | 0.03 | % | | | — | | | | — | | | | — | |
See Notes to Financial Statements.
| | | | | | |
| | | BLACKROCK FUNDS | | MARCH 31, 2015 | | 35 |
| | | | |
| Financial Highlights | | | BlackRock Mid-Cap Growth Equity Portfolio | |
| | | | | | | | | | | | | | | | | | | | | | | | | | | | | | | | | | | | | | | | | | | | | | | | |
| | | Institutional | | | Service | |
| | | Six Months
Ended
March 31,
2015 (Unaudited) | | | Year Ended September 30, | | | Six Months
Ended
March 31,
2015 (Unaudited) | | | Year Ended September 30, | |
| | | | 2014 | | | 2013 | | | 2012 | | | 2011 | | | 2010 | | | | 2014 | | | 2013 | | | 2012 | | | 2011 | | | 2010 | |
| Per Share Operating Performance | | | | | | | | | | | | | | | | | | | | | | | | | | | | | | | | | | | | | | | | | | | | | | | | |
Net asset value, beginning of period | | $ | 17.67 | | | $ | 18.22 | | | $ | 13.58 | | | $ | 11.10 | | | $ | 11.18 | | | $ | 10.27 | | | $ | 16.34 | | | $ | 17.05 | | | $ | 12.77 | | | $ | 10.49 | | | $ | 10.60 | | | $ | 9.78 | |
| | | | | | | | |
Net investment income (loss)1 | | | (0.04 | ) | | | (0.12 | ) | | | 0.05 | | | | 0.04 | | | | (0.05 | ) | | | (0.01 | ) | | | (0.07 | ) | | | (0.19 | ) | | | (0.02 | ) | | | (0.01 | ) | | | (0.10 | ) | | | (0.05 | ) |
Net realized and unrealized gain (loss) | | | 2.24 | | | | 2.49 | | | | 4.59 | | | | 2.44 | | | | (0.03 | ) | | | 0.92 | | | | 2.06 | | | | 2.31 | | | | 4.30 | | | | 2.29 | | | | (0.01 | ) | | | 0.87 | |
| | | | | | | | |
Net increase (decrease) from investment operations | | | 2.20 | | | | 2.37 | | | | 4.64 | | | | 2.48 | | | | (0.08 | ) | | | 0.91 | | | | 1.99 | | | | 2.12 | | | | 4.28 | | | | 2.28 | | | | (0.11 | ) | | | 0.82 | |
| | | | | | | | |
Distributions from net realized gain2 | | | (1.91 | ) | | | (2.92 | ) | | | — | | | | — | | | | — | | | | — | | | | (1.89 | ) | | | (2.83 | ) | | | — | | | | — | | | | — | | | | — | |
| | | | | | | | |
Net asset value, end of period | | $ | 17.96 | | | $ | 17.67 | | | $ | 18.22 | | | $ | 13.58 | | | $ | 11.10 | | | $ | 11.18 | | | $ | 16.44 | | | $ | 16.34 | | | $ | 17.05 | | | $ | 12.77 | | | $ | 10.49 | | | $ | 10.60 | |
| | | | | | | | |
| | | | | | | | | | | | | | | | | | | | | | | | | | | | | | | | | | | | | | | | | | | | | | | | |
| Total Return3 | | | | | | | | | | | | | | | | | | | | | | | | | | | | | | | | | | | | | | | | | | | | | | | | |
Based on net asset value | | | 14.16 | %4 | | | 14.70 | % | | | 34.17 | % | | | 22.34 | % | | | (0.72 | )%5 | | | 8.86 | %5 | | | 13.92 | %4 | | | 14.11 | % | | | 33.52 | % | | | 21.74 | % | | | (1.04 | )%5 | | | 8.38 | %5 |
| | | | | | | | |
| | | | | | | | | | | | | | | | | | | | | | | | | | | | | | | | | | | | | | | | | | | | | | | | |
| Ratios to Average Net Assets | | | | | | | | | | | | | | | | | | | | | | | | | | | | | | | | | | | | | | | | | | | | | | | | |
Total expenses | | | 1.08 | %6,7 | | | 1.11 | % | | | 1.13 | % | | | 1.11 | % | | | 1.17 | % | | | 1.15 | % | | | 1.49 | %6,7 | | | 1.58 | % | | | 1.67 | % | | | 2.29 | % | | | 1.87 | % | | | 1.63 | % |
| | | | | | | | |
Total expenses excluding recoupment of past waived fees | | | 1.06 | %7 | | | 1.08 | % | | | 1.11 | % | | | 1.11 | % | | | 1.17 | % | | | 1.14 | % | | | 1.37 | %7 | | | 1.33 | % | | | 1.51 | % | | | 2.29 | % | | | 1.87 | % | | | 1.62 | % |
| | | | | | | | |
Total expenses after fees waived, reimbursed and paid indirectly | | | 1.08 | %7 | | | 1.10 | % | | | 1.11 | % | | | 1.07 | % | | | 1.17 | % | | | 1.15 | % | | | 1.49 | %7 | | | 1.58 | % | | | 1.58 | % | | | 1.58 | % | | | 1.58 | % | | | 1.58 | % |
| | | | | | | | |
Net investment income (loss) | | | (0.45 | )%7 | | | (0.68 | )% | | | 0.30 | % | | | 0.27 | % | | | (0.38 | )% | | | (0.09 | )% | | | (0.92 | )%7 | | | (1.17 | )% | | | (0.15 | )% | | | (0.06 | )% | | | (0.83 | )% | | | (0.52 | )% |
| | | | | | | | |
| | | | | | | | | | | | | | | | | | | | | | | | | | | | | | | | | | | | | | | | | | | | | | | | |
| Supplemental Data | | | | | | | | | | | | | | | | | | | | | | | | | | | | | | | | | | | | | | | | | | | | | | | | |
Net assets, end of period (000) | | $ | 32,844 | | | $ | 33,448 | | | $ | 21,485 | | | $ | 18,526 | | | $ | 19,348 | | | $ | 24,421 | | | $ | 2,002 | | | $ | 3,838 | | | $ | 2,065 | | | $ | 1,865 | | | $ | 714 | | | $ | 330 | |
| | | | | | | | |
Portfolio turnover | | | 50 | % | | | 123 | % | | | 160 | % | | | 88 | % | | | 131 | % | | | 76 | % | | | 50 | % | | | 123 | % | | | 160 | % | | | 88 | % | | | 131 | % | | | 76 | % |
| | | | | | | | |
| | 1 | | Based on average shares outstanding. |
| | 2 | | Distributions for annual periods determined in accordance with federal income tax regulations. |
| | 3 | | Where applicable, assumes the reinvestment of distributions. |
| | 4 | | Aggregate total return. |
| | 5 | | Includes a payment received from a settlement of litigation, which impacted the Fund’s total return. Excluding the payment from a settlement of litigation, the Fund’s total return is as follows: |
| | | | | | | | | | | | | | | | | | | | | | | | |
| | | | |
| | | Six Months
Ended
March 31,
2015 (Unaudited) | | | Year Ended September 30, | |
| | | | 2014 | | | 2013 | | | 2012 | | | 2011 | | | 2010 | |
| | | | |
Institutional | | | — | | | | — | | | | — | | | | — | | | | (0.90 | )% | | | 8.47% | |
| | | | |
Service | | | — | | | | — | | | | — | | | | — | | | | (1.23 | )% | | | 7.98% | |
| | 6 | | Includes recoupment of past waived and/or reimbursed fees. There was no financial impact to the expense ratio. |
See Notes to Financial Statements.
| | | | | | |
| 36 | | BLACKROCK FUNDS | | MARCH 31, 2015 | | |
| | | | |
| Financial Highlights (continued) | | | BlackRock Mid-Cap Growth Equity Portfolio | |
| | | | | | | | | | | | | | | | | | | | | | | | | | | | | | | | | | | | | | | | | | | | | | | | |
| | | Investor A | | | Investor B | |
| |
| Six Months
Ended March 31, 2015 (Unaudited) |
| | | Year Ended September 30, | | |
| Six Months
Ended March 31, 2015 (Unaudited) |
| | | Year Ended September 30, | |
| | | | 2014 | | | 2013 | | | 2012 | | | 2011 | | | 2010 | | | | 2014 | | | 2013 | | | 2012 | | | 2011 | | | 2010 | |
| Per Share Operating Performance | | | | | | | | | | | | | | | | | | | | | | | | | | | | | | | | | | | | | | | | | | | | | | | | |
Net asset value, beginning of period | | $ | 15.78 | | | $ | 16.56 | | | $ | 12.38 | | | $ | 10.15 | | | $ | 10.27 | | | $ | 9.47 | | | $ | 13.22 | | | $ | 14.27 | | | $ | 10.75 | | | $ | 8.88 | | | $ | 9.05 | | | $ | 8.42 | |
| | | | | | | | |
Net investment income (loss)1 | | | (0.05 | ) | | | (0.16 | ) | | | 0.00 | 2 | | | (0.01 | ) | | | (0.09 | ) | | | (0.05 | ) | | | (0.09 | ) | | | (0.24 | ) | | | (0.08 | ) | | | (0.09 | ) | | | (0.16 | ) | | | (0.12 | ) |
Net realized and unrealized gain (loss) | | | 1.96 | | | | 2.24 | | | | 4.18 | | | | 2.24 | | | | (0.03 | ) | | | 0.85 | | | | 1.61 | | | | 1.90 | | | | 3.60 | | | | 1.96 | | | | (0.01 | ) | | | 0.75 | |
| | | | | | | | |
Net increase (decrease) from investment operations | | | 1.91 | | | | 2.08 | | | | 4.18 | | | | 2.23 | | | | (0.12 | ) | | | 0.80 | | | | 1.52 | | | | 1.66 | | | | 3.52 | | | | 1.87 | | | | (0.17 | ) | | | 0.63 | |
| | | | | | | | |
Distributions from net realized gain3 | | | (1.88 | ) | | | (2.86 | ) | | | — | | | | — | | | | — | | | | — | | | | (1.79 | ) | | | (2.71 | ) | | | — | | | | — | | | | — | | | | — | |
| | | | | | | | |
Net asset value, end of period | | $ | 15.81 | | | $ | 15.78 | | | $ | 16.56 | | | $ | 12.38 | | | $ | 10.15 | | | $ | 10.27 | | | $ | 12.95 | | | $ | 13.22 | | | $ | 14.27 | | | $ | 10.75 | | | $ | 8.88 | | | $ | 9.05 | |
| | | | | | | | |
| | | | | | | | | | | | | | | | | | | | | | | | | | | | | | | | | | | | | | | | | | | | | | | | |
| Total Return4 | | | | | | | | | | | | | | | | | | | | | | | | | | | | | | | | | | | | | | | | | | | | | | | | |
Based on net asset value | | | 13.96 | %5 | | | 14.38 | % | | | 33.76 | % | | | 21.97 | % | | | (1.17 | )%6 | | | 8.45 | %6 | | | 13.58 | %5 | | | 13.47 | % | | | 32.74 | % | | | 21.06 | % | | | (1.88 | )%6 | | | 7.48 | %6 |
| | | | | | | | |
| | | | | | | | | | | | | | | | | | | | | | | | | | | | | | | | | | | | | | | | | | | | | | | | |
| Ratios to Average Net Assets | | | | | | | | | | | | | | | | | | | | | | | | | | | | | | | | | | | | | | | | | | | | | | | | |
Total expenses | | | 1.46 | %7 | | | 1.48 | % | | | 1.55 | % | | | 1.55 | % | | | 1.59 | % | | | 1.58 | % | | | 2.79 | %7 | | | 2.66 | % | | | 2.70 | % | | | 2.59 | % | | | 2.43 | % | | | 2.48 | % |
| | | | | | | | |
Total expenses excluding recoupment of past waived fees | | | 1.46 | %7 | | | 1.48 | % | | | 1.55 | % | | | 1.55 | % | | | 1.56 | % | | | 1.55 | % | | | 2.79 | %7 | | | 2.66 | % | | | 2.70 | % | | | 2.59 | % | | | 2.42 | % | | | 2.47 | % |
| | | | | | | | |
Total expenses after fees waived, reimbursed and paid indirectly | | | 1.39 | %7 | | | 1.39 | % | | | 1.39 | % | | | 1.39 | % | | | 1.58 | % | | | 1.58 | % | | | 2.16 | %7 | | | 2.16 | % | | | 2.16 | % | | | 2.16 | % | | | 2.39 | % | | | 2.38 | % |
| | | | | | | | |
Net investment income (loss) | | | (0.72 | )%7 | | | (1.01 | )% | | | 0.03 | % | | | (0.06 | )% | | | (0.79 | )% | | | (0.51 | )% | | | (1.50 | )%7 | | | (1.79 | )% | | | (0.66 | )% | | | (0.88 | )% | | | (1.58 | )% | | | (1.36 | )% |
| | | | | | | | |
| | | | | | | | | | | | | | | | | | | | | | | | | | | | | | | | | | | | | | | | | | | | | | | | |
| Supplemental Data | | | | | | | | | | | | | | | | | | | | | | | | | | | | | | | | | | | | | | | | | | | | | | | | |
Net assets, end of period (000) | | $ | 355,613 | | | $ | 315,762 | | | $ | 282,726 | | | $ | 237,748 | | | $ | 232,924 | | | $ | 180,501 | | | $ | 2,983 | | | $ | 3,313 | | | $ | 4,330 | | | $ | 5,123 | | | $ | 7,596 | | | $ | 8,209 | |
| | | | | | | | |
Portfolio turnover | | | 50 | % | | | 123 | % | | | 160 | % | | | 88 | % | | | 131 | % | | | 76 | % | | | 50 | % | | | 123 | % | | | 160 | % | | | 88 | % | | | 131 | % | | | 76 | % |
| | | | | | | | |
| | 1 | | Based on average shares outstanding. |
| | 2 | | Amount is less than $0.005 per share. |
| | 3 | | Distributions for annual periods determined in accordance with federal income tax regulations. |
| | 4 | | Where applicable, excludes the effects of any sales charges and assumes the reinvestment of distributions. |
| | 5 | | Aggregate total return. |
| | 6 | | Includes a payment received from a settlement of litigation, which impacted the Fund’s total return. Excluding the payment from a settlement of litigation, the Fund’s total return is as follows: |
| | | | | | | | | | | | | | | | | | | | | | | | |
| | | | |
| | | Six Months
Ended
March 31,
2015 (Unaudited) | | | Year Ended September 30, | |
| | | | 2014 | | | 2013 | | | 2012 | | | 2011 | | | 2010 | |
| | | | |
Investor A | | | — | | | | — | | | | — | | | | — | | | | (1.36 | )% | | | 8.03% | |
| | | | |
Investor B | | | — | | | | — | | | | — | | | | — | | | | (2.10 | )% | | | 7.01% | |
See Notes to Financial Statements.
| | | | | | |
| | | BLACKROCK FUNDS | | MARCH 31, 2015 | | 37 |
| | | | |
| Financial Highlights (concluded) | | | BlackRock Mid-Cap Growth Equity Portfolio | |
| | | | | | | | | | | | | | | | | | | | | | | | | | | | | | | | | | | | | | | | | | | | | | | | |
| | | Investor C | | | Class R | |
| | | Six Months
Ended
March 31,
2015 (Unaudited) | | | Year Ended September 30, | | | Six Months
Ended
March 31,
2015 (Unaudited) | | | Year Ended September 30, | |
| | | | 2014 | | | 2013 | | | 2012 | | | 2011 | | | 2010 | | | | 2014 | | | 2013 | | | 2012 | | | 2011 | | | 2010 | |
| Per Share Operating Performance | | | | | | | | | | | | | | | | | | | | | | | | | | | | | | | | | | | | | | | | | | | | | | | | |
Net asset value, beginning of period | | $ | 13.16 | | | $ | 14.28 | | | $ | 10.75 | | | $ | 8.89 | | | $ | 9.05 | | | $ | 8.41 | | | $ | 15.63 | | | $ | 16.44 | | | $ | 12.32 | | | $ | 10.13 | | | $ | 10.25 | | | $ | 9.46 | |
| | | | | | | | |
Net investment loss1 | | | (0.09 | ) | | | (0.23 | ) | | | (0.09 | ) | | | (0.08 | ) | | | (0.16 | ) | | | (0.11 | ) | | | (0.07 | ) | | | (0.20 | ) | | | (0.04 | ) | | | (0.03 | ) | | | (0.10 | ) | | | (0.04 | ) |
Net realized and unrealized gain (loss) | | | 1.60 | | | | 1.88 | | | | 3.62 | | | | 1.94 | | | | (0.00 | )2 | | | 0.75 | | | | 1.95 | | | | 2.22 | | | | 4.16 | | | | 2.22 | | | | (0.02 | ) | | | 0.83 | |
| | | | | | | | |
Net increase (decrease) from investment operations | | | 1.51 | | | | 1.65 | | | | 3.53 | | | | 1.86 | | | | (0.16 | ) | | | 0.64 | | | | 1.88 | | | | 2.02 | | | | 4.12 | | | | 2.19 | | | | (0.12 | ) | | | 0.79 | |
| | | | | | | | |
Distributions from net realized gain3 | | | (1.82 | ) | | | (2.77 | ) | | | — | | | | — | | | | — | | | | — | | | | (1.86 | ) | | | (2.83 | ) | | | — | | | | — | | | | — | | | | — | |
| | | | | | | | |
Net asset value, end of period | | $ | 12.85 | | | $ | 13.16 | | | $ | 14.28 | | | $ | 10.75 | | | $ | 8.89 | | | $ | 9.05 | | | $ | 15.65 | | | $ | 15.63 | | | $ | 16.44 | | | $ | 12.32 | | | $ | 10.13 | | | $ | 10.25 | |
| | | | | | | | |
| | | | | | | | | | | | | | | | | | | | | | | | | | | | | | | | | | | | | | | | | | | | | | | | |
| Total Return4 | | | | | | | | | | | | | | | | | | | | | | | | | | | | | | | | | | | | | | | | | | | | | | | | |
Based on net asset value | | | 13.57 | %5 | | | 13.42 | % | | | 32.84 | % | | | 20.92 | % | | | (1.77 | )%6 | | | 7.61 | %6 | | | 13.83 | %5 | | | 14.03 | % | | | 33.44 | % | | | 21.62 | % | | | (1.17 | )%6 | | | 8.35 | %6 |
| | | | | | | | |
| | | | | | | | | | | | | | | | | | | | | | | | | | | | | | | | | | | | | | | | | | | | | | | | |
| Ratios to Average Net Assets | | | | | | | | | | | | | | | | | | | | | | | | | | | | | | | | | | | | | | | | | | | | | | | | |
Total expenses | | | 2.16 | %7,8 | | | 2.17 | % | | | 2.23 | % | | | 2.31 | % | | | 2.34 | % | | | 2.33 | % | | | 1.74 | %8 | | | 1.74 | % | | | 1.74 | % | | | 1.84 | % | | | 1.91 | % | | | 1.97 | % |
| | | | | | | | |
Total expenses excluding recoupment of past waived fees | | | 2.14 | %8 | | | 2.16 | % | | | 2.23 | % | | | 2.31 | % | | | 2.31 | % | | | 2.30 | % | | | 1.74 | %8 | | | 1.74 | % | | | 1.74 | % | | | 1.84 | % | | | 1.91 | % | | | 1.97 | % |
| | | | | | | | |
Total expenses after fees waived, reimbursed and paid indirectly | | | 2.16 | %8 | | | 2.16 | % | | | 2.16 | % | | | 2.16 | % | | | 2.33 | % | | | 2.33 | % | | | 1.65 | %8 | | | 1.65 | % | | | 1.65 | % | | | 1.65 | % | | | 1.65 | % | | | 1.65 | % |
| | | | | | | | |
Net investment income (loss) | | | (1.49 | )%8 | | | (1.77 | )% | | | (0.75 | )% | | | (0.81 | )% | | | (1.54 | )% | | | (1.26 | )% | | | (0.98 | )%8 | | | (1.26 | )% | | | (0.26 | )% | | | (0.28 | )% | | | (0.84 | )% | | | (0.44 | )% |
| | | | | | | | |
| | | | | | | | | | | | | | | | | | | | | | | | | | | | | | | | | | | | | | | | | | | | | | | | |
| Supplemental Data | | | | | | | | | | | | | | | | | | | | | | | | | | | | | | | | | | | | | | | | | | | | | | | | |
Net assets, end of period (000) | | $ | 35,447 | | | $ | 31,257 | | | $ | 23,959 | | | $ | 18,774 | | | $ | 16,615 | | | $ | 12,578 | | | $ | 8,172 | | | $ | 7,704 | | | $ | 9,352 | | | $ | 6,663 | | | $ | 5,227 | | | $ | 4,138 | |
| | | | | | | | |
Portfolio turnover | | | 50 | % | | | 123 | % | | | 160 | % | | | 88 | % | | | 131 | % | | | 76 | % | | | 50 | % | | | 123 | % | | | 160 | % | | | 88 | % | | | 131 | % | | | 76 | % |
| | | | | | | | |
| | 1 | | Based on average shares outstanding. |
| | 2 | | Amount is greater than $(0.005) per share. |
| | 3 | | Distributions for annual periods determined in accordance with federal income tax regulations. |
| | 4 | | Where applicable, excludes the effects of any sales charges and assumes the reinvestment of distributions. |
| | 5 | | Aggregate total return. |
| | 6 | | Includes a payment received from a settlement of litigation, which impacted the Fund’s total return. Excluding the payment from a settlement of litigation, the Fund’s total return is as follows: |
| | | | | | | | | | | | | | | | | | | | | | | | |
| | | | |
| | | Six Months
Ended
March 31,
2015 (Unaudited) | | | Year Ended September 30, | |
| | | | 2014 | | | 2013 | | | 2012 | | | 2011 | | | 2010 | |
| | | | |
Investor C | | | — | | | | — | | | | — | | | | — | | | | (1.99 | )% | | | 7.13% | |
| | | | |
Class R | | | — | | | | — | | | | — | | | | — | | | | (1.37 | )% | | | 7.93% | |
| | 7 | | Includes recoupment of past waived and/or reimbursed fees. There was no financial impact to the expense ratio. |
See Notes to Financial Statements.
| | | | | | |
| 38 | | BLACKROCK FUNDS | | MARCH 31, 2015 | | |
| | | | |
| Financial Highlights | | | BlackRock Small Cap Growth Equity Portfolio | |
| | | | | | | | | | | | | | | | | | | | | | | | | | | | | | | | | | | | | | | | | | | | | | | | |
| | | Institutional | | | Service | |
| |
| Six Months
Ended
March 31,
2015
(Unaudited) |
| | | Year Ended September 30, | | |
| Six Months
Ended
March 31,
2015
(Unaudited) |
| | | Year Ended September 30, | |
| | | | 2014 | | | 2013 | | | 2012 | | | 2011 | | | 2010 | | | | 2014 | | | 2013 | | | 2012 | | | 2011 | | | 2010 | |
| Per Share Operating Performance | | | | | | | | | | | | | | | | | | | | | | | | | | | | | | | | | | | | | | | | | | | | | | | | |
Net asset value, beginning of period | | $ | 22.28 | | | $ | 29.86 | | | $ | 26.67 | | | $ | 20.09 | | | $ | 20.42 | | | $ | 18.66 | | | $ | 20.05 | | | $ | 27.81 | | | $ | 25.01 | | | $ | 18.93 | | | $ | 19.29 | | | $ | 17.67 | |
| | | | | | | | |
Net investment income (loss)1 | | | 0.03 | | | | (0.06 | ) | | | 0.01 | | | | 0.04 | | | | (0.13 | ) | | | (0.12 | ) | | | 0.00 | 2 | | | (0.12 | ) | | | (0.06 | ) | | | (0.04 | ) | | | (0.18 | ) | | | (0.16 | ) |
Net realized and unrealized gain (loss) | | | 2.13 | | | | 2.58 | | | | 5.90 | | | | 7.14 | | | | (0.20 | )3 | | | 1.88 | 3 | | | 1.87 | | | | 2.40 | | | | 5.49 | | | | 6.72 | | | | (0.18 | )3 | | | 1.78 | 3 |
| | | | | | | | |
Net increase (decrease) from investment operations | | | 2.16 | | | | 2.52 | | | | 5.91 | | | | 7.18 | | | | (0.33 | ) | | | 1.76 | | | | 1.87 | | | | 2.28 | | | | 5.43 | | | | 6.68 | | | | (0.36 | ) | | | 1.62 | |
| | | | | | | | |
Distributions from:4 | | | | | | | | | | | | | | | | | | | | | | | | | | | | | | | | | | | | | | | | | | | | | | | | |
Net investment income | | | — | | | | — | | | | (0.07 | ) | | | — | | | | — | | | | — | | | | — | | | | — | | | | — | | | | — | | | | — | | | | — | |
Net realized gain | | | (4.97 | ) | | | (10.10 | ) | | | (2.65 | ) | | | (0.60 | ) | | | — | | | | — | | | | (4.90 | ) | | | (10.04 | ) | | | (2.63 | ) | | | (0.60 | ) | | | — | | | | — | |
| | | | | | | | |
Total distributions | | | (4.97 | ) | | | (10.10 | ) | | | (2.72 | ) | | | (0.60 | ) | | | — | | | | — | | | | (4.90 | ) | | | (10.04 | ) | | | (2.63 | ) | | | (0.60 | ) | | | — | | | | — | |
| | | | | | | | |
Net asset value, end of period | | $ | 19.47 | | | $ | 22.28 | | | $ | 29.86 | | | $ | 26.67 | | | $ | 20.09 | | | $ | 20.42 | | | $ | 17.02 | | | $ | 20.05 | | | $ | 27.81 | | | $ | 25.01 | | | $ | 18.93 | | | $ | 19.29 | |
| | | | | | | | |
| | | | | | | | | | | | | | | | | | | | | | | | | | | | | | | | | | | | | | | | | | | | | | | | |
| Total Return5 | | | | | | | | | | | | | | | | | | | | | | | | | | | | | | | | | | | | | | | | | | | | | | | | |
Based on net asset value | | | 11.82 | %6 | | | 8.90 | % | | | 25.36 | % | | | 36.16 | % | | | (1.62 | )%7,8 | | | 9.43 | %8 | | | 11.64 | %6 | | | 8.62 | % | | | 24.96 | % | | | 35.72 | % | | | (1.87 | )%7,8 | | | 9.17 | %8 |
| | | | | | | | |
| | | | | | | | | | | | | | | | | | | | | | | | | | | | | | | | | | | | | | | | | | | | | | | | |
| Ratios to Average Net Assets | | | | | | | | | | | | | | | | | | | | | | | | | | | | | | | | | | | | | | | | | | | | | | | | |
Total expenses | | | 0.83 | %9 | | | 0.87 | % | | | 0.82 | % | | | 0.82 | % | | | 0.80 | % | | | 0.83 | % | | | 1.15 | %9 | | | 1.12 | % | | | 1.12 | % | | | 1.20 | % | | | 1.07 | % | | | 1.10 | % |
| | | | | | | | |
Total expenses excluding recoupment of past waived fees | | | 0.83 | %9 | | | 0.87 | % | | | 0.82 | % | | | 0.82 | % | | | 0.80 | % | | | 0.83 | % | | | 1.15 | %9 | | | 1.12 | % | | | 1.12 | % | | | 1.20 | % | | | 1.07 | % | | | 1.10 | % |
| | | | | | | | |
Total expenses after fees waived, reimbursed and paid indirectly | | | 0.83 | %9 | | | 0.87 | % | | | 0.82 | % | | | 0.82 | % | | | 0.80 | % | | | 0.83 | % | | | 1.15 | %9 | | | 1.12 | % | | | 1.12 | % | | | 1.17 | % | | | 1.07 | % | | | 1.10 | % |
| | | | | | | | |
Net investment income (loss) | | | 0.34 | %9 | | | (0.24 | )% | | | 0.06 | % | | | 0.15 | % | | | (0.55 | )% | | | (0.59 | )% | | | 0.02 | %9 | | | (0.53 | )% | | | (0.25 | )% | | | (0.15 | )% | | | (0.81 | )% | | | (0.86 | )% |
| | | | | | | | |
| | | | | | | | | | | | | | | | | | | | | | | | | | | | | | | | | | | | | | | | | | | | | | | | |
| Supplemental Data | | | | | | | | | | | | | | | | | | | | | | | | | | | | | | | | | | | | | | | | | | | | | | | | |
Net assets, end of period (000) | | $ | 487,378 | | | $ | 454,928 | | | $ | 862,261 | | | $ | 979,582 | | | $ | 931,857 | | | $ | 806,461 | | | $ | 21,356 | | | $ | 23,621 | | | $ | 24,792 | | | $ | 29,281 | | | $ | 23,683 | | | $ | 47,917 | |
| | | | | | | | |
Portfolio turnover | | | 66 | % | | | 132 | % | | | 175 | % | | | 147 | % | | | 141 | % | | | 128 | % | | | 66 | % | | | 132 | % | | | 175 | % | | | 147 | % | | | 141 | % | | | 128 | % |
| | | | | | | | |
| | 1 | | Based on average shares outstanding. |
| | 2 | | Amount is less than $0.005 per share. |
| | 3 | | Includes redemption fees, which are less than $0.005 per share. |
| | 4 | | Distributions for annual periods determined in accordance with federal income tax regulations. |
| | 5 | | Where applicable, assumes the reinvestment of distributions. |
| | 6 | | Aggregate total return. |
| | 7 | | Includes proceeds received from a settlement of litigation, which had no impact on the Fund’s total return. |
| | 8 | | Redemption fee of 2.00% is reflected in total return calculations. There was no impact to the return. |
See Notes to Financial Statements.
| | | | | | |
| | | BLACKROCK FUNDS | | MARCH 31, 2015 | | 39 |
| | | | |
| Financial Highlights (continued) | | | BlackRock Small Cap Growth Equity Portfolio | |
| | | | | | | | | | | | | | | | | | | | | | | | | | | | | | | | | | | | | | | | | | | | | | | | |
| | | Investor A | | | Investor B | |
| | | Six Months
Ended
March 31,
2015 (Unaudited) | | | Year Ended September 30, | | | Six Months
Ended
March 31,
2015 (Unaudited) | | | Year Ended September 30, | |
| | | | 2014 | | | 2013 | | | 2012 | | | 2011 | | | 2010 | | | | 2014 | | | 2013 | | | 2012 | | | 2011 | | | 2010 | |
| Per Share Operating Performance | | | | | | | | | | | | | | | | | | | | | | | | | | | | | | | | | | | | | | | | | | | | | | | | |
Net asset value, beginning of period | | $ | 18.91 | | | $ | 26.75 | | | $ | 24.17 | | | $ | 18.31 | | | $ | 18.69 | | | $ | 17.14 | | | $ | 14.15 | | | $ | 22.34 | | | $ | 20.50 | | | $ | 15.75 | | | $ | 16.20 | | | $ | 15.00 | |
| | | | | | | | |
Net investment income (loss)1 | | | 0.00 | 2 | | | (0.12 | ) | | | (0.06 | ) | | | (0.04 | ) | | | (0.21 | ) | | | (0.18 | ) | | | (0.05 | ) | | | (0.22 | ) | | | (0.21 | ) | | | (0.21 | ) | | | (0.32 | ) | | | (0.30 | ) |
Net realized and unrealized gain (loss) | | | 1.74 | | | | 2.31 | | | | 5.27 | | | | 6.50 | | | | (0.17 | )3 | | | 1.73 | 3 | | | 1.19 | | | | 1.90 | | | | 4.41 | | | | 5.56 | | | | (0.13 | )3 | | | 1.50 | 3 |
| | | | | | | | |
Net increase (decrease) from investment operations | | | 1.74 | | | | 2.19 | | | | 5.21 | | | | 6.46 | | | | (0.38 | ) | | | 1.55 | | | | 1.14 | | | | 1.68 | | | | 4.20 | | | | 5.35 | | | | (0.45 | ) | | | 1.20 | |
| | | | | | | | |
Distributions from net realized gain4 | | | (4.91 | ) | | | (10.03 | ) | | | (2.63 | ) | | | (0.60 | ) | | | — | | | | — | | | | (4.78 | ) | | | (9.87 | ) | | | (2.36 | ) | | | (0.60 | ) | | | — | | | | — | |
| | | | | | | | |
Net asset value, end of period | | $ | 15.74 | | | $ | 18.91 | | | $ | 26.75 | | | $ | 24.17 | | | $ | 18.31 | | | $ | 18.69 | | | $ | 10.51 | | | $ | 14.15 | | | $ | 22.34 | | | $ | 20.50 | | | $ | 15.75 | | | $ | 16.20 | |
| | | | | | | | |
| | | | | | | | | | | | | | | | | | | | | | | | | | | | | | | | | | | | | | | | | | | | | | | | |
| Total Return5 | | | | | | | | | | | | | | | | | | | | | | | | | | | | | | | | | | | | | | | | | | | | | | | | |
Based on net asset value | | | 11.65 | %6 | | | 8.60 | % | | | 24.91 | % | | | 35.73 | % | | | (2.03 | )%7,8 | | | 9.04 | %8 | | | 11.12 | %6 | | | 7.73 | % | | | 23.92 | % | | | 34.46 | % | | | (2.78 | )%7,8 | | | 8.00 | %8 |
| | | | | | | | |
| | | | | | | | | | | | | | | | | | | | | | | | | | | | | | | | | | | | | | | | | | | | | | | | |
| Ratios to Average Net Assets | | | | | | | | | | | | | | | | | | | | | | | | | | | | | | | | | | | | | | | | | | | | | | | | |
Total expenses | | | 1.15 | %9 | | | 1.15 | % | | | 1.14 | % | | | 1.17 | % | | | 1.18 | % | | | 1.22 | % | | | 2.08 | %9 | | | 1.99 | % | | | 1.98 | % | | | 2.07 | % | | | 1.96 | % | | | 2.19 | % |
| | | | | | | | |
Total expenses excluding recoupment of past waived fees | | | 1.15 | %9 | | | 1.15 | % | | | 1.14 | % | | | 1.17 | % | | | 1.18 | % | | | 1.22 | % | | | 2.08 | %9 | | | 1.99 | % | | | 1.98 | % | | | 2.07 | % | | | 1.96 | % | | | 2.07 | % |
| | | | | | | | |
Total expenses after fees waived, reimbursed and paid indirectly | | | 1.15 | %9 | | | 1.15 | % | | | 1.14 | % | | | 1.17 | % | | | 1.18 | % | | | 1.22 | % | | | 2.08 | %9 | | | 1.99 | % | | | 1.98 | % | | | 2.07 | % | | | 1.96 | % | | | 2.19 | % |
| | | | | | | | |
Net investment income (loss) | | | 0.03 | %9 | | | (0.56 | )% | | | (0.25 | )% | | | (0.18 | )% | | | (0.94 | )% | | | (0.98 | )% | | | (0.92 | )%9 | | | (1.39 | )% | | | (1.08 | )% | | | (1.12 | )% | | | (1.72 | )% | | | (1.94 | )% |
| | | | | | | | |
| | | | | | | | | | | | | | | | | | | | | | | | | | | | | | | | | | | | | | | | | | | | | | | | |
| Supplemental Data | | | | | | | | | | | | | | | | | | | | | | | | | | | | | | | | | | | | | | | | | | | | | | | | |
Net assets, end of period (000) | | $ | 302,109 | | | $ | 282,684 | | | $ | 332,978 | | | $ | 352,073 | | | $ | 235,400 | | | $ | 269,080 | | | $ | 730 | | | $ | 794 | | | $ | 1,265 | | | $ | 1,506 | | | $ | 1,687 | | | $ | 2,369 | |
| | | | | | | | |
Portfolio turnover | | | 66 | % | | | 132 | % | | | 175 | % | | | 147 | % | | | 141 | % | | | 128 | % | | | 66 | % | | | 132 | % | | | 175 | % | | | 147 | % | | | 141 | % | | | 128 | % |
| | | | | | | | |
| | 1 | | Based on average shares outstanding. |
| | 2 | | Amount is less than $0.005 per share. |
| | 3 | | Includes redemption fees, which are less than $0.005 per share. |
| | 4 | | Distributions for annual periods determined in accordance with federal income tax regulations. |
| | 5 | | Where applicable, excludes the effects of any sales charges and assumes the reinvestment of distributions. |
| | 6 | | Aggregate total return. |
| | 7 | | Includes proceeds received from a settlement of litigation, which had no impact on the Fund’s total return. |
| | 8 | | Redemption fee of 2.00% is reflected in total return calculations. There was no impact to the return. |
See Notes to Financial Statements.
| | | | | | |
| 40 | | BLACKROCK FUNDS | | MARCH 31, 2015 | | |
| | | | |
| Financial Highlights (concluded) | | | BlackRock Small Cap Growth Equity Portfolio | |
| | | | | | | | | | | | | | | | | | | | | | | | |
| | | Investor C | |
| | | Six Months
Ended
March 31,
2015 (Unaudited) | | | Year Ended September 30, | |
| | | | 2014 | | | 2013 | | | 2012 | | | 2011 | | | 2010 | |
| Per Share Operating Performance | | | | | | | | | | | | | | | | | | | | | | | | |
Net asset value, beginning of period | | $ | 13.99 | | | $ | 22.23 | | | $ | 20.50 | | | $ | 15.73 | | | $ | 16.19 | | | $ | 14.99 | |
| | | | |
Net investment loss1 | | | (0.04 | ) | | | (0.21 | ) | | | (0.21 | ) | | | (0.19 | ) | | | (0.35 | ) | | | (0.30 | ) |
Net realized and unrealized gain (loss) | | | 1.17 | | | | 1.89 | | | | 4.38 | | | | 5.56 | | | | (0.11 | )2 | | | 1.50 | 2 |
| | | | |
Net increase (decrease) from investment operations | | | 1.13 | | | | 1.68 | | | | 4.17 | | | | 5.37 | | | | (0.46 | ) | | | 1.20 | |
| | | | |
Distributions from net realized gain3 | | | (4.82 | ) | | | (9.92 | ) | | | (2.44 | ) | | | (0.60 | ) | | | — | | | | — | |
| | | | |
Net asset value, end of period | | $ | 10.30 | | | $ | 13.99 | | | $ | 22.23 | | | $ | 20.50 | | | $ | 15.73 | | | $ | 16.19 | |
| | | | |
| | | | | | | | | | | | | | | | | | | | | | | | |
| Total Return4 | | | | | | | | | | | | | | | | | | | | | | | | |
Based on net asset value | | | 11.23 | %5 | | | 7.73 | % | | | 23.91 | % | | | 34.63 | % | | | (2.84 | )%6,7 | | | 8.01 | %7 |
| | | | |
| | | | | | | | | | | | | | | | | | | | | | | | |
| Ratios to Average Net Assets | | | | | | | | | | | | | | | | | | | | | | | | |
Total expenses | | | 1.94 | %8 | | | 1.93 | % | | | 1.95 | % | | | 1.99 | % | | | 2.08 | % | | | 2.19 | % |
| | | | |
Total expenses excluding recoupment of past waived fees | | | 1.94 | %8 | | | 1.93 | % | | | 1.95 | % | | | 1.99 | % | | | 2.05 | % | | | 2.13 | % |
| | | | |
Total expenses after fees waived, reimbursed and paid indirectly | | | 1.94 | %8 | | | 1.93 | % | | | 1.95 | % | | | 1.99 | % | | | 2.07 | % | | | 2.16 | % |
| | | | |
Net investment loss | | | (0.77 | )%8 | | | (1.33 | )% | | | (1.06 | )% | | | (0.99 | )% | | | (1.83 | )% | | | (1.92 | )% |
| | | | |
| | | | | | | | | | | | | | | | | | | | | | | | |
| Supplemental Data | | | | | | | | | | | | | | | | | | | | | | | | |
Net assets, end of period (000) | | $ | 32,630 | | | $ | 32,598 | | | $ | 33,193 | | | $ | 28,787 | | | $ | 23,947 | | | $ | 33,219 | |
| | | | |
Portfolio turnover | | | 66 | % | | | 132 | % | | | 175 | % | | | 147 | % | | | 141 | % | | | 128 | % |
| | | | |
| | 1 | | Based on average shares outstanding. |
| | 2 | | Includes redemption fees, which are less than $0.005 per share. |
| | 3 | | Distributions for annual periods determined in accordance with federal income tax regulations. |
| | 4 | | Where applicable, excludes the effects of any sales charges and assumes the reinvestment of distributions. |
| | 5 | | Aggregate total return. |
| | 6 | | Includes proceeds received from a settlement of litigation, which had no impact on the Fund’s total return. |
| | 7 | | Redemption fee of 2.00% is reflected in total return calculations. There was no impact to the return. |
See Notes to Financial Statements.
| | | | | | |
| | | BLACKROCK FUNDS | | MARCH 31, 2015 | | 41 |
| | |
| Notes to Financial Statements (Unaudited) | | |
1. Organization:
BlackRock FundsSM (the “Trust”) is registered under the Investment Company Act of 1940, as amended (the “1940 Act”), as an open-end management investment company. The Trust is organized as a Massachusetts business trust. The following are referred to herein collectively as the “Funds” or individually, a “Fund”:
| | | | |
| Fund Name | | Herein Referred To As | | Diversification Classification |
BlackRock Flexible Equity Fund | | Flexible Equity | | Diversified |
BlackRock Mid-Cap Growth Equity Portfolio | | Mid-Cap Growth Equity | | Diversified |
BlackRock Small Cap Growth Equity Portfolio | | Small Cap Growth Equity | | Diversified |
Each Fund offers multiple classes of shares. All classes of shares have identical voting, dividend, liquidation and other rights and are subject to the same terms and conditions, except that certain classes bear expenses related to the shareholder servicing and distribution of such shares. Institutional Shares are sold only to certain eligible investors. Investor B Shares are only available through exchanges and distribution reinvestments by current holders and for purchase by certain employer-sponsored retirement plans. Class R Shares are available only to certain employer-sponsored retirement plans. Investor A and Investor C Shares are generally available through financial intermediaries. Each class has exclusive voting rights with respect to matters relating to its shareholder servicing and distribution expenditures (except that Investor B shareholders may vote on material changes to the Investor A distribution and service plan).
| | | | | | |
| Share Class | | Initial Sales Charge | | CDSC | | Conversion Privilege |
Institutional, Service and Class R Shares | | No | | No | | None |
Investor A Shares | | Yes | | No1 | | None |
Investor B Shares | | No | | Yes | | To Investor A Shares after approximately 8 years |
Investor C Shares | | No | | Yes | | None |
| | 1 | | Investor A Shares may be subject to a CDSC for certain redemptions where no initial sales charge was paid at the time of purchase. |
The Funds, together with certain other registered investment companies advised by the Manager or its affiliates, are included in a complex of open-end funds referred to as the Equity-Liquidity Complex.
Basis of Consolidation: The accompanying consolidated financial statements of Flexible Equity include the account of BlackRock Flexible Equity Fund Subsidiary, Ltd. (the “Subsidiary”), which is a wholly owned subsidiary of Flexible Equity and primarily invests in commodity-related instruments. The Subsidiary enables Flexible Equity to hold these commodity-related instruments and satisfy regulated investment company tax requirements. Flexible Equity may invest up to 25% of its total assets in the Subsidiary. As of March 31, 2015, there were no net assets in the Subsidiary. Intercompany accounts and transactions, if any, have been eliminated. The Subsidiary is subject to the same investment policies and restrictions that apply to Flexible Equity, except that the Subsidiary may invest without limitation in commodity-related instruments.
2. Significant Accounting Policies:
The Funds’ financial statements are prepared in conformity with accounting principles generally accepted in the United States of America (“U.S. GAAP”), which may require management to make estimates and assumptions that affect the reported amounts of assets and liabilities in the financial statements and the reported amounts of increases and decreases in net assets from operations during the reporting period. Actual results could differ from those estimates. Each Fund is considered an investment company under U.S. GAAP and follows the accounting and reporting guidance applicable to investment companies. The following is a summary of significant accounting policies followed by the Funds:
Valuation: The Funds’ investments are valued at fair value as of the close of trading on the New York Stock Exchange (“NYSE”) (generally 4:00 p.m., Eastern time). U.S. GAAP defines fair value as the price the Funds would receive to sell an asset or pay to transfer a liability in an orderly transaction between market participants at the measurement date. The Funds determine the fair values of their financial instruments at market value using independent dealers or pricing services under policies approved by the Board of Trustees of the Trust (the “Board”). The BlackRock Global Valuation Methodologies Committee (the “Global Valuation Committee”) is the committee formed by management to develop global pricing policies and procedures and to provide oversight of the pricing function for the Funds for all financial instruments.
Equity investments traded on a recognized securities exchange are valued at the official close price each day, if available. For equity investments traded on more than one exchange, the official close price on the exchange where the stock is primarily traded is used. Equity investments traded on a recognized exchange for which there were no sales on that day may be valued at the last available bid (long positions) or ask (short positions) price. Participation notes are valued on the basis of last available bid prices or current market quotations provided by dealers or pricing services. Financial futures contracts traded on exchanges are valued at their last sale price. Swap agreements are valued utilizing quotes received daily by the Fund’s pricing service or through brokers, which are derived using daily swap curves and models that incorporate a number of market data factors, such as discounted cash flows, trades and values of the underlying reference instruments. Investments in open-end registered investment companies are valued at NAV each business day.
| | | | | | |
| 42 | | BLACKROCK FUNDS | | MARCH 31, 2015 | | |
| | |
| Notes to Financial Statements (continued) | | |
Securities and other assets and liabilities denominated in foreign currencies are translated into U.S. dollars using exchange rates determined as of the close of business on the NYSE. Forward foreign currency exchange contracts are valued at the mean between the bid and ask prices and are determined as of the close of business on the NYSE. Interpolated values are derived when the settlement date of the contract is an interim date for which quotations are not available.
Exchange-traded options are valued at the mean between the last bid and ask prices at the close of the options market in which the options trade. An exchange-traded option for which there is no mean price is valued at the last bid (long positions) or ask (short positions) price. If no bid or ask price is available, the prior day’s price will be used, unless it is determined that the prior day’s price no longer reflects the fair value of the option. Over-the-counter (“OTC”) options are valued by an independent pricing service using a mathematical model, which incorporates a number of market data factors, such as the trades and prices of the underlying instruments.
The Funds value their investments in BlackRock Liquidity Series, LLC, Money Market Series (the “Money Market Series”) at fair value, which is ordinarily based upon their pro rata ownership in the underlying fund’s net assets. The Money Market Series seeks current income consistent with maintaining liquidity and preserving capital. Although the Money Market Series is not registered under the 1940 Act, its investments will follow the parameters of investments by a money market fund that is subject to Rule 2a-7 under the 1940 Act. Each Fund may withdraw up to 25% of its investment daily, although the Manager of the Money Market Series, in its sole discretion, may permit an investor to withdraw more than 25% on any one day.
In the event that the application of these methods of valuation results in a price for an investment that is deemed not to be representative of the market value of such investment, or if a price is not available, the investment will be valued by the Global Valuation Committee, or its delegate, in accordance with a policy approved by the Board as reflecting fair value (“Fair Value Investments”). When determining the price for Fair Value Investments, the Global Valuation Committee, or its delegate, seeks to determine the price that each Fund might reasonably expect to receive or pay from the current sale or purchase of that asset or liability in an arm’s-length transaction. Fair value determinations shall be based upon all available factors that the Global Valuation Committee, or its delegate, deems relevant consistent with the principles of fair value measurement, which include the market approach, income approach and/or in the case of recent investments, the cost approach, as appropriate. The market approach generally consists of using comparable market transactions. The income approach generally is used to discount future cash flows to present value and is adjusted for liquidity as appropriate. These factors include but are not limited to: (i) attributes specific to the investment or asset; (ii) the principal market for the investment or asset; (iii) the customary participants in the principal market for the investment or asset; (iv) data assumptions by market participants for the investment or asset, if reasonably available; (v) quoted prices for similar investments or assets in active markets; and (vi) other factors, such as future cash flows, interest rates, yield curves, volatilities, prepayment speeds, loss severities, credit risks, recovery rates, liquidation amounts and/or default rates. Due to the inherent uncertainty of valuations of such investments, the fair values may differ from the values that would have been used had an active market existed. The Global Valuation Committee, or its delegate, employs various methods for calibrating valuation approaches for investments where an active market does not exist, including regular due diligence of the Funds’ pricing vendors, regular reviews of key inputs and assumptions, transactional back-testing or disposition analysis to compare unrealized gains and losses to realized gains and losses, reviews of missing or stale prices and large movements in market values and reviews of any market related activity. The pricing of all Fair Value Investments is subsequently reported to the Board or a committee thereof on a quarterly basis.
Generally, trading in foreign instruments is substantially completed each day at various times prior to the close of business on the NYSE. Occasionally, events affecting the values of such instruments may occur between the foreign market close and the close of business on the NYSE that may not be reflected in the computation of each Fund’s net assets. If events (e.g., a company announcement, market volatility or a natural disaster) occur during such periods that are expected to materially affect the value of such instruments, those instruments may be Fair Value Assets and be valued at their fair value, as determined in good faith by the Global Valuation Committee, or its delegate, using a pricing service and/or policies approved by the Board. Each business day, the Funds use a pricing service to assist with the valuation of certain foreign exchange-traded equity securities and foreign exchange-traded and OTC options (the “Systematic Fair Value Price”). Using current market factors, the Systematic Fair Value Price is designed to value such foreign securities and foreign options at fair value as of the close of business on the NYSE, which follows the close of the local markets.
Foreign Currency: Each Funds’ books and records are maintained in U.S. dollars. Purchases and sales of investment securities are recorded at the rates of exchange prevailing on the respective dates of such transactions. Generally, when the U.S. dollar rises in value against a foreign currency, each Funds’ investments denominated in that currency will lose value because that currency is worth fewer U.S. dollars; the opposite effect occurs if the U.S. dollar falls in relative value.
Each Fund does not isolate the portion of the results of operations arising as a result of changes in the foreign exchange rates from the changes in the market prices of investments held or sold for financial reporting purposes. Accordingly, the effects of changes in foreign currency exchange rates on investments are not segregated in the Statements of Operations from the effects of changes in market prices of those investments but are included as a component of net realized and unrealized gain (loss) from investments. Each Fund reports realized currency gains (losses) on foreign currency related transactions as components of net realized gain (loss) for financial reporting purposes, whereas such components are generally treated as ordinary income for federal income tax purposes.
| | | | | | |
| | | BLACKROCK FUNDS | | MARCH 31, 2015 | | 43 |
| | |
| Notes to Financial Statements (continued) | | |
Segregation and Collateralization: In cases where a Fund enters into certain investments (e.g., financial futures contracts, forward foreign currency exchange contracts, options written, and swaps), that would be “senior securities” for 1940 Act purposes, the Fund may segregate or designate on its books and records cash or liquid securities having a market value at least equal to the amount of a Fund’s future obligations under such investments. Doing so allows the investment to be excluded from treatment as a “senior security.” Furthermore, if required by an exchange or counterparty agreement, the Fund may be required to deliver/deposit cash and/or securities to/with an exchange, or broker-dealer or custodian as collateral for certain investments or obligations.
Investment Transactions and Investment Income: For financial reporting purposes, investment transactions are recorded on the dates the transactions are entered into (the trade dates). Realized gains and losses on investment transactions are determined on the identified cost basis. Dividend income is recorded on the ex-dividend date. Dividends from foreign securities where the ex-dividend date may have passed are subsequently recorded when the Funds are informed of the ex-dividend date. Under the applicable foreign tax laws, a withholding tax at various rates may be imposed on capital gains, dividends and interest. Upon notification from issuers, some of the dividend income received from a real estate investment trust may be redesignated as a reduction of cost of the related investment and/or realized gain. Income, expenses and realized and unrealized gains and losses are allocated daily to each class based on its relative net assets.
Distributions: Distributions paid by the Funds are recorded on the ex-dividend date. The character and timing of distributions are determined in accordance with federal income tax regulations, which may differ from U.S. GAAP.
Net income and realized gains from investments held by the Subsidiary are treated as ordinary income for tax purposes. Accordingly, the net investment income (loss) and realized gains (losses) reported in the Flexible Equity Fund’s financial statements presented under U.S. GAAP for such investments held by the Subsidiary may differ significantly from distributions. As such, any net gain will pass through to the Flexible Equity Fund as ordinary income for federal income tax purposes. If a net loss is realized by the Subsidiary in any taxable year, the loss will generally not be available to offset the Flexible Equity Fund’s ordinary income and/or capital gains for that year.
Recent Accounting Standard: In June 2014, the Financial Accounting Standards Board issued guidance to improve the financial reporting of reverse repurchase agreements and other similar transactions. The guidance will require expanded disclosure for entities that enter into reverse repurchase agreements and similar transactions accounted for as secured borrowings. It is effective for financial statements with fiscal years beginning on or after December 15, 2014 and for interim periods beginning after March 15, 2015. Management is evaluating the impact, if any, of this guidance on the Fund’s financial statement disclosures.
Other: Expenses directly related to a Fund or its classes are charged to that Fund or the applicable class. Other operating expenses shared by several funds are prorated among those funds on the basis of relative net assets or other appropriate methods. Expenses directly related to the Funds and other shared expenses prorated to the Funds are allocated daily to each class based on its relative net assets or other appropriate methods.
The Funds have an arrangement with their custodian whereby fees may be reduced by credits earned on uninvested cash balances, which, if applicable, are shown as fees paid indirectly in the Statements of Operations. The custodian imposes fees on overdrawn cash balances, which can be offset by accumulated credits earned or may result in additional custody charges.
3. Securities and Other Investments:
Participation Notes: Flexible Equity may invest in participation notes (“P-Notes”). P-Notes are promissory notes issued by banks or broker-dealers that are designed to offer Flexible Equity a return measured by the change in the value of the underlying security or basket of securities (the “underlying security”) while not holding the actual shares of the underlying security. P-Notes are typically used to allow Flexible Equity to gain exposure to securities traded in foreign markets that may be restricted due to country-specific regulations. When the P-Note matures, the issuer will pay to, or receive from, Flexible Equity the difference between the value of the underlying security at the time of the purchase and the underlying security’s value at maturity of the P-Notes. Income received on P-Notes is recorded by Flexible Equity as dividend income in the Statements of Operations. An investment in a P-Note involves additional risks beyond the risks normally associated with a direct investment in the underlying security. While the holder of a P-Note is entitled to receive from the bank or broker-dealer any dividends paid by the underlying security, the holder is not entitled to the same rights (e.g., voting rights) as a direct owner of the underlying security. P-Notes are considered general unsecured contractual obligations of the bank or broker-dealer. Flexible Equity must rely on the creditworthiness of the issuer for its investment returns on the P-Notes and has no rights against the issuer of the underlying security. A P-Note may be more volatile and less liquid than other investments held by Flexible Equity since the P-Note generally is dependent on the liquidity in the local trading market for the underlying security.
Preferred Stock: The Funds may invest in preferred stock. Preferred stock has a preference over common stock in liquidation (and generally in receiving dividends as well) but is subordinated to the liabilities of the issuer in all respects. As a general rule, the market value of preferred stock with a fixed dividend rate and no conversion element varies inversely with interest rates and perceived credit risk, while the market price of convertible preferred stock generally also reflects some element of conversion value. Because preferred stock is junior to debt securities and other obligations of the issuer, deterioration in the credit quality of the issuer will cause greater changes in the value of a preferred stock than in a more senior debt security with
| | | | | | |
| 44 | | BLACKROCK FUNDS | | MARCH 31, 2015 | | |
| | |
| Notes to Financial Statements (continued) | | |
similar stated yield characteristics. Unlike interest payments on debt securities, preferred stock dividends are payable only if declared by the issuer’s board of directors. Preferred stock also may be subject to optional or mandatory redemption provisions.
Securities Lending: Each Fund may lend its securities to approved borrowers, such as brokers, dealers and other financial institutions. The borrower pledges and maintains with the Funds collateral consisting of cash, an irrevocable letter of credit issued by a bank, or securities issued or guaranteed by the U.S. Government. The initial collateral received by each Fund is required to have a value of at least 102% of the current value of the loaned securities for securities traded on U.S. exchanges and a value of at least 105% for all other securities. The collateral is maintained thereafter, at a value equal to at least 100% of the current market value of the securities on loan. The market value of the loaned securities is determined at the close of each business day of the Fund and any additional required collateral is delivered to the Fund on the next business day. During the term of the loan, each Fund is entitled to all distributions made on or in respect of the loaned securities. Loans of securities are terminable at any time and the borrower, after notice, is required to return borrowed securities within the standard time period for settlement of securities transactions.
The market value of securities on loan and the value of the related collateral are shown separately in the Statements of Assets and Liabilities as a component of investments at value — unaffiliated, and collateral on securities loaned at value, respectively. As of March 31, 2015, any securities on loan were collateralized by cash. The cash collateral invested by the securities lending agent, BlackRock Investment Management, LLC (“BIM”), if any, is disclosed in the Schedules of Investments.
Securities lending transactions are entered into by the Funds under Master Securities Lending Agreements (each, an “MSLA”) which provide the right, in the event of default (including bankruptcy or insolvency), for the non-defaulting party to liquidate the collateral and calculate a net exposure to the defaulting party or request additional collateral. In the event that a borrower defaults, each Fund, as lender, would offset the market value of the collateral received against the market value of the securities loaned. When the value of the collateral is greater than that of the market value of the securities loaned, the lender is left with a net amount payable to the defaulting party. However, bankruptcy or insolvency laws of a particular jurisdiction may impose restrictions on or prohibitions against such a right of offset in the event of an MSLA counterparty’s bankruptcy or insolvency. Under the MSLA, the borrower can resell or re-pledge the loaned securities, and the Funds can reinvest cash collateral, or, upon an event of default, resell or re-pledge the collateral.
As of March 31, 2015, the following table is a summary of the Funds’ securities lending agreements by counterparty, which are subject to offset under an MSLA:
| | | | | | | | | | | | |
| Flexible Equity | |
| Counterparty | | Securities
Loaned
at Value | | | Cash
Collateral
Received1 | | | Net
Amount | |
Goldman Sachs & Co. | | $ | 544,577 | | | $ | (544,577 | ) | | | — | |
| | 1 | | Collateral with a value of $576,157 has been received in connection with securities lending agreements. Collateral received in excess of the value of securities loaned from the individual counterparty is not shown for financial reporting purposes. |
| | | | | | | | | | | | |
| Mid-Cap Growth Equity | |
| Counterparty | | Securities
Loaned
at Value | | | Cash
Collateral
Received1 | | | Net
Amount | |
Goldman Sachs & Co. | | $ | 741,889 | | | $ | (741,889 | ) | | | — | |
JP Morgan Securities LLC | | | 1,348,939 | | | | (1,348,939 | ) | | | — | |
Total | | $ | 2,090,828 | | | $ | (2,090,828 | ) | | | — | |
| | | | |
| | 1 | | Collateral with a value of $2,144,391 has been received in connection with securities lending agreements. Collateral received in excess of the value of securities loaned from the individual counterparty is not shown for financial reporting purposes. |
| | | | | | |
| | | BLACKROCK FUNDS | | MARCH 31, 2015 | | 45 |
| | |
| Notes to Financial Statements (continued) | | |
| | | | | | | | | | | | |
| Small Cap Growth Equity | |
| Counterparty | | Securities
Loaned
at Value | | | Cash
Collateral
Received1 | | | Net
Amount | |
Barclays Capital Inc. | | $ | 989,984 | | | $ | (989,984 | ) | | | — | |
BNP Paribas S.A. | | | 522,000 | | | | (522,000 | ) | | | — | |
Citigroup Global Markets, Inc. | | | 160,160 | | | | (160,160 | ) | | | — | |
Credit Suisse Securities (USA) LLC | | | 3,779,973 | | | | (3,779,973 | ) | | | — | |
Deutsche Bank Securities, Inc. | | | 2,188,179 | | | | (2,188,179 | ) | | | — | |
Goldman Sachs & Co. | | | 1,918,046 | | | | (1,918,046 | ) | | | — | |
JP Morgan Securities LLC | | | 1,620,893 | | | | (1,620,893 | ) | | | — | |
Merrill Lynch, Pierce, Fenner & Smith, Inc. | | | 2,909,644 | | | | (2,909,644 | ) | | | — | |
Morgan Stanley | | | 5,215,440 | | | | (5,215,440 | ) | | | — | |
UBS Securities LLC | | | 1,181,212 | | | | (1,181,212 | ) | | | — | |
Total | | $ | 20,485,531 | | | $ | (20,485,531 | ) | | | — | |
| | | | |
| | 1 | | Collateral with a value of $20,954,953 has been received in connection with securities lending agreements. Collateral received in excess of the value of securities loaned from the individual counterparty is not shown for financial reporting purposes. |
The risks of securities lending include the risk that the borrower may not provide additional collateral when required or may not return the securities when due. To mitigate these risks, the Funds benefit from a borrower default indemnity provided by BIM. BIM’s indemnity allows for full replacement of the securities loaned if the collateral received does not cover the value on securities loaned in the event of borrower default. The Funds could suffer a loss if the value of an investment purchased with cash collateral falls below the market value of loaned securities or if the value of an investment purchased with cash collateral falls below the value of the original cash collateral received.
4. Derivative Financial Instruments:
The Funds engage in various portfolio investment strategies using derivative contracts both to increase the returns of the Funds and/or to economically manage their exposure to certain risks such as equity risk or foreign currency exchange rate risk. These contracts may be transacted on an exchange or OTC.
Financial Futures Contracts: Flexible Equity and Small Cap Growth Equity purchase and/or sell financial futures contracts and options on financial future contracts to gain exposure to, or economically hedge against, changes in the value of equity securities (equity risk). Financial futures contracts are agreements between the Funds and a counterparty to buy or sell a specific quantity of an underlying instrument at a specified price and at a specified date. Depending on the terms of the particular contract, financial futures contracts are settled either through physical delivery of the underlying instrument on the settlement date or by payment of a cash settlement amount on the settlement date.
Upon entering into a financial futures contract, Flexible Equity and Small Cap Growth Equity are required to deposit initial margin with the broker in the form of cash or securities in an amount that varies depending on a contract’s size and risk profile. The initial margin deposit must then be maintained at an established level over the life of the contract. Securities deposited as initial margin are designated on the Schedules of Investments and cash deposited, if any, is recorded on the Statements of Assets and Liabilities as cash pledged for financial futures contracts. Pursuant to the contract, Flexible Equity and Small Cap Growth Equity agree to receive from or pay to the broker an amount of cash equal to the daily fluctuation in value of the contract. Such receipts or payments are known as variation margin. Variation margin is recorded by Flexible Equity and Small Cap Growth Equity as unrealized appreciation or depreciation and, if applicable, as a receivable or payable for variation margin in the Statements of Assets and Liabilities.
When the contract is closed, Flexible Equity and Small Cap Growth Equity record a realized gain or loss equal to the difference between the value of the contract at the time it was opened and the value at the time it was closed. The use of financial futures contracts involves the risk of an imperfect correlation in the movements in the price of financial futures contracts, interest or foreign currency exchange rates and the underlying assets.
Forward Foreign Currency Exchange Contracts: Flexible Equity enters into forward foreign currency exchange contracts as an economic hedge against either specific transactions or portfolio instruments or to obtain exposure to, or hedge exposure away from, foreign currencies (foreign currency exchange rate risk). A forward foreign currency exchange contract is an agreement between two parties to buy and sell a currency at a set exchange rate on a future date. Forward foreign currency exchange contracts, when used by Flexible Equity, help to manage the overall exposure to the currencies in which some of the investments held by Flexible Equity are denominated. The contract is marked-to-market daily and the change in market value is recorded by Flexible Equity as an unrealized gain or loss. When the contract is closed, Flexible Equity records a realized gain or loss equal to the difference between the value at the time it was opened and the value at the time it was closed. The use of forward foreign currency exchange contracts involves the risk that the value of a forward foreign currency exchange contract changes unfavorably due to movements in the value of the referenced foreign currencies.
Options: Flexible Equity purchases and writes call and put options to increase or decrease its exposure to underlying instruments (including equity risk) and/or, in the case of options written, to generate gains from options premiums. A call option gives the purchaser (holder) of the option the right (but
| | | | | | |
| 46 | | BLACKROCK FUNDS | | MARCH 31, 2015 | | |
| | |
| Notes to Financial Statements (continued) | | |
not the obligation) to buy, and obligates the seller (writer) to sell (when the option is exercised) the underlying instrument at the exercise or strike price at any time or at a specified time during the option period. A put option gives the holder the right to sell and obligates the writer to buy the underlying instrument at the exercise or strike price at any time or at a specified time during the option period. When the Fund purchases (writes) an option, an amount equal to the premium paid (received) by the Fund is reflected as an asset (liability). The amount of the asset (liability) is subsequently marked-to-market to reflect the current market value of the option purchased (written). When an instrument is purchased or sold through an exercise of an option, the related premium paid (or received) is added to (or deducted from) the basis of the instrument acquired or deducted from (or added to) the proceeds of the instrument sold. When an option expires (or the Fund enters into a closing transaction), the Fund realizes a gain or loss on the option to the extent of the premiums received or paid (or gain or loss to the extent the cost of the closing transaction exceeds the premiums received or paid). When the Fund writes a call option, such option is “covered,” meaning that the Fund holds the underlying instrument subject to being called by the option counterparty. When the Fund writes a put option, such option is covered by cash in an amount sufficient to cover the obligation.
In purchasing and writing options, Flexible Equity bears the risk of an unfavorable change in the value of the underlying instrument or the risk that Flexible Equity may not be able to enter into a closing transaction due to an illiquid market. Exercise of a written option could result in Flexible Equity purchasing or selling a security when it otherwise would not, or at a price different from the current market value.
For the six months ended March 31, 2015, transactions in options written for Flexible Equity were as follows:
| | | | | | | | | | | | | | | | | | | | |
| | | Calls | | | | | | | Puts | |
| | | Contracts | | | Premiums
Received | | | | | | | Contracts | | | Premiums
Received | |
Outstanding options, beginning of period | | | 1,382 | | | $ | 215,100 | | | | | | | | 1,500 | | | $ | 58,441 | |
Options written | | | 25,378 | | | | 3,366,634 | | | | | | | | — | | | | — | |
Options exercised | | | (6,187 | ) | | | (743,090 | ) | | | | | | | — | | | | — | |
Options expired | | | (2,364 | ) | | | (267,904 | ) | | | | | | | — | | | | — | |
Options closed | | | (18,209 | ) | | | (2,570,740 | ) | | | | | | | (1,500 | ) | | | (58,441 | ) |
| | | | | | | | | | | | |
Outstanding options, end of period | | | — | | | | — | | | | | | | | — | | | | — | |
| | | | | | | | | | | | |
Swaps: Flexible Equity enters into swap agreements in which the Fund and a counterparty agree either to make periodic net payments on a specified notional amount or a net payment upon termination. Swap agreements are privately negotiated in the OTC market and may be entered into as a bilateral contract (“OTC swaps”) or centrally cleared (“centrally cleared swaps”). Swaps are marked-to-market daily and changes in value are recorded as unrealized appreciation (depreciation).
For OTC swaps, any upfront premiums paid are recorded as assets and any upfront fees received are recorded as liabilities and are shown as swap premiums paid and swap premiums received, respectively, in the Statements of Assets and Liabilities and amortized over the term of the OTC swap. Payments received or made by the Fund for OTC swaps are recorded in the Statements of Operations as realized gains or losses, respectively. When an OTC swap is terminated, the Fund will record a realized gain or loss equal to the difference between the proceeds from (or cost of) the closing transaction and the Fund’s basis in the contract, if any. Generally, the basis of the contract is the premium received or paid.
Swap transactions involve, to varying degrees, elements of interest rate, credit and market risk in excess of the amounts recognized in the Statements of Assets and Liabilities. Such risks involve the possibility that there will be no liquid market for these agreements, that the counterparty to the agreements may default on its obligation to perform or disagree as to the meaning of the contractual terms in the agreements, and that there may be unfavorable changes in interest rates and/or market values associated with these transactions.
| • | | Total return swaps — Flexible Equity enters into total return swaps to obtain exposure to a security or market without owning such security or investing directly in that market or to transfer the risk/return of one market (e.g., fixed income) to another market (e.g., equity) (equity risk). Total return swaps are agreements in which there is an exchange of cash flows whereby one party commits to make payments based on the total return (dividends or interest plus capital gains/losses) of an underlying instrument in exchange for fixed or floating rate interest payments. To the extent the total return of the instrument or index underlying the transaction exceeds or falls short of the offsetting interest rate obligation, the Funds will receive a payment from or make a payment to the counterparty. |
| | | | | | |
| | | BLACKROCK FUNDS | | MARCH 31, 2015 | | 47 |
| | |
| Notes to Financial Statements (continued) | | |
The following is a summary of the Funds’ derivative financial instruments categorized by risk exposure:
| | | | | | | | | | | | | | | | | | |
| Fair Values of Derivative Financial Instruments as of March 31, 2015 | |
| | | | | Value | |
| | | | | Flexible Equity | | | Small Cap
Growth Equity | |
| | | |
| | | Statements of Assets and Liabilities Location | | Derivative
Assets | | | Derivative
Liabilities | | | Derivative
Assets | | | Derivative
Liabilities | |
| | | |
Foreign currency exchange contracts | | Unrealized appreciation/depreciation on forward foreign currency exchange contracts | | $ | 2,054,574 | | | $ | 584,811 | | | | — | | | | — | |
Equity contracts | | Net unrealized appreciation/depreciation1 | | | — | | | | — | | | $ | 149,175 | | | | — | |
| | | |
Total | | | | $ | 2,054,574 | | | $ | 584,811 | | | $ | 149,175 | | | | — | |
| | | |
| | 1 | | Includes cumulative appreciation/depreciation on financial futures contracts and centrally cleared swaps, if any, as reported in the Schedules of Investments. Only current day’s variation margin is reported within the Statements of Assets and Liabilities. |
| | | | | | | | | | | | | | | | | | |
The Effect of Derivative Financial Instruments in the Statements of Operations Six Months Ended March 31, 2015 | |
| | | Flexible
Equity | | | Small Cap
Growth Equity | | | | | Flexible
Equity | | | Small Cap
Growth Equity | |
| | | | | | | | | | |
| | | Net Realized Gain (Loss) From | | | | | Net Change in Unrealized Appreciation/Depreciation on | |
| | | | | | | | | | |
Foreign currency exchange contracts: | | | | | | | | | | | | | | | | | | |
Foreign currency transactions/translations | | $ | 9,078,454 | | | | — | | | | | $ | (3,892,285 | ) | | | — | |
Equity contracts: | | | | | | | | | | | | | | | | | | |
Financial futures contracts | | | (8,345,746 | ) | | $ | 397,857 | | | | | | (1,856,152 | ) | | $ | 498,850 | |
Swaps | | | (1,811,587 | ) | | | — | | | | | | 505,315 | | | | — | |
Options2 | | | (5,466,451 | ) | | | — | | | | | | 431,968 | | | | — | |
| | | | | | | | | | |
Total | | $ | (6,545,330 | ) | | $ | 397,857 | | | | | $ | (4,811,154 | ) | | $ | 498,850 | |
| | | | |
| | 2 | | Options purchased are included in the net realized gain (loss) from investments — unaffiliated and net change in unrealized appreciation/depreciation on investments — unaffiliated. |
For the six months ended March 31, 2015, the average quarterly balances of outstanding derivative financial instruments were as follows:
| | | | | | | | |
| | | Flexible
Equity | | | Small Cap
Growth Equity | |
Financial futures contracts: | | | | | | | | |
Average notional value of contracts - long | | | — | | | $ | 10,262,025 | |
Average notional value of contracts - short | | $ | 28,141,334 | | | | — | |
Forward foreign currency exchange contracts: | | | | | | | | |
Average amounts purchased - in USD | | $ | 81,310,574 | | | | — | |
Average amounts sold - in USD | | $ | 42,439,084 | | | | — | |
Options: | | | | | | | | |
Average value of option contracts purchased | | $ | 99,611 | | | | — | |
Average value of option contracts written | | $ | 745,142 | | | | — | |
Total return swaps: | | | | | | | | |
Average notional value | | $ | 9,656,553 | | | | — | |
Counterparty Credit Risk: A derivative contract may suffer a mark-to-market loss if the value of the contract decreases due to an unfavorable change in the market rates or values of the underlying instrument. Losses can also occur if the counterparty does not perform under the contract.
A Fund’s risk of loss from counterparty credit risk on OTC derivatives is generally limited to the aggregate unrealized gain less the value of any collateral held by such Fund.
For OTC options purchased, each Fund bears the risk of loss of the amount of the premiums paid plus the positive change in market values net of any collateral held by such Fund should the counterparty fail to perform under the contracts. Options written by the Funds do not typically give rise to counterparty credit risk, as options written generally obligate the Funds, and not the counterparty, to perform.
With exchange-traded purchased options and futures, there is less counterparty credit risk to the Funds since the exchange or clearinghouse, as counterparty to such instruments, guarantees against a possible default. The clearinghouse stands between the buyer and the seller of the contract; therefore, the credit risk is limited to failure of the clearinghouse. While offset rights may exist under applicable law, a Fund does not have a contractual right of offset against a clearing broker or clearinghouse in the event of a default (including the bankruptcy or insolvency) of the clearing broker or clearinghouse. Additionally, credit risk exists in exchange-traded futures with respect to initial and variation margin that is held in a clearing broker’s customer accounts. While clearing brokers are required to segregate customer margin from their own assets, in the event that a clearing broker
| | | | | | |
| 48 | | BLACKROCK FUNDS | | MARCH 31, 2015 | | |
| | |
| Notes to Financial Statements (continued) | | |
becomes insolvent or goes into bankruptcy and at that time there is a shortfall in the aggregate amount of margin held by the clearing broker for all its clients, typically the shortfall would be allocated on a pro rata basis across all the clearing broker’s customers, potentially resulting in losses to the Funds.
In order to better define its contractual rights and to secure rights that will help the Fund mitigate its counterparty risk, the Fund may enter into an International Swaps and Derivatives Association, Inc. Master Agreement (“ISDA Master Agreement”) or similar agreement with its counterparties. An ISDA Master Agreement is a bilateral agreement between each Fund and a counterparty that governs certain OTC derivatives and typically contains, among other things, collateral posting terms and netting provisions in the event of a default and/or termination event. Under an ISDA Master Agreement, each Fund may, under certain circumstances, offset with the counterparty certain derivative financial instruments’ payables and/or receivables with collateral held and/or posted and create one single net payment. The provisions of the ISDA Master Agreement typically permit a single net payment in the event of default including the bankruptcy or insolvency of the counterparty. Bankruptcy or insolvency laws of a particular jurisdiction may restrict or prohibit the right of offset in bankruptcy, insolvency or other events. In addition, certain ISDA Master Agreements allow counterparties to terminate derivative contracts prior to maturity in the event the Fund’s net assets decline by a stated percentage or the Fund fails to meet the terms of its ISDA Master Agreements, which would cause the Fund to accelerate payment of any net liability owed to the counterparty.
Collateral Requirements: For derivatives traded under an ISDA Master Agreement, the collateral requirements are typically calculated by netting the mark-to-market amount for each transaction under such agreement and comparing that amount to the value of any collateral currently pledged by the Fund and the counterparty.
Cash collateral that has been pledged to cover obligations of the Funds and cash collateral received from the counterparty, if any, is reported separately on the Statements of Assets and Liabilities as cash pledged as collateral and cash received as collateral, respectively. Non-cash collateral pledged by the Funds, if any, is noted in the Schedule of Investments. Generally, the amount of collateral due from or to a party has to exceed a minimum transfer amount threshold (typically either $250,000 or $500,000) before a transfer is required, which is determined at the close of business of the Funds. Any additional required collateral is delivered to/pledged by the Funds on the next business day. Typically, the Funds and counterparties are not permitted to sell, re-pledge or use the collateral they receive. To the extent amounts due to the Funds from its counterparties are not fully collateralized, the Funds bear the risk of loss from counterparty non-performance. Likewise, to the extent the Funds have delivered collateral to a counterparty and stand ready to perform under the terms of its agreement with such counterparty, the Funds bear the risk of loss from a counterparty in the amount of the value of the collateral in the event the counterparty fails to return such collateral.
For financial reporting purposes, the Funds do not offset derivative assets and derivative liabilities that are subject to netting arrangements, if any, in the Statements of Assets and Liabilities.
As of March 31, 2015, the Funds’ derivative assets and liabilities (by type) were as follows:
| | | | | | | | | | | | | | | | | | |
| | | Flexible Equity | | | | | Small Cap Growth
Equity | |
| | | Assets | | | Liabilities | | | | | Assets | | | Liabilities | |
Derivative Financial Instruments: | | | | | | | | | | | | | | | | | | |
Financial futures contracts | | | — | | | | — | | | | | $ | 149,175 | | | | — | |
Forward foreign currency exchange contracts | | $ | 2,054,574 | | | $ | 584,811 | | | | | | — | | | | — | |
| | | | |
Total derivative assets and liabilities in the Statements of Assets and Liabilities | | $ | 2,054,574 | | | $ | 584,811 | | | | | $ | 149,175 | | | | — | |
| | | | |
Derivatives not subject to a Master Netting Agreement or similar agreement (“MNA”) | | | — | | | | — | | | | | | (149,175 | ) | | | — | |
| | | | |
Total derivative assets and liabilities subject to an MNA | | $ | 2,054,574 | | | $ | 584,811 | | | | | | — | | | | — | |
| | | | |
As of March 31, 2015, the following table presents the Funds’ derivative assets and liabilities by counterparty net of amounts available for offset under an MNA and net of the related collateral received and pledged by the Fund:
| | | | | | | | | | | | | | | | | | | | |
| Flexible Equity | |
| Counterparty | | Derivative Assets
Subject to an MNA
by Counterparty | | | Derivatives
Available
for Offset1 | | | Non-cash
Collateral
Received | | | Cash
Collateral
Received | | | Net Amount of
Derivative
Assets2 | |
BNP Paribas S.A. | | $ | 16,336 | | | | — | | | | — | | | | — | | | $ | 16,336 | |
Citibank N.A. | | | 32,426 | | | $ | (32,426 | ) | | | — | | | | — | | | | — | |
HSBC Bank PLC | | | 1,117,262 | | | | — | | | | — | | | | — | | | | 1,117,262 | |
Standard Chartered Bank | | | 407,298 | | | | (109,233 | ) | | | — | | | | — | | | | 298,065 | |
TD Securities, Inc. | | | 481,252 | | | | (52,687 | ) | | | — | | | | — | | | | 428,565 | |
| | | | |
Total | | $ | 2,054,574 | | | $ | (194,346 | ) | | | — | | | | — | | | $ | 1,860,228 | |
| | | | |
| | | | | | |
| | | BLACKROCK FUNDS | | MARCH 31, 2015 | | 49 |
| | |
| Notes to Financial Statements (continued) | | |
| | | | | | | | | | | | | | | | | | | | |
| Counterparty | | Derivative Liabilities
Subject to an MNA
by Counterparty | | | Derivatives
Available
for Offset1 | | | Non-cash
Collateral
Pledged | | | Cash
Collateral
Pledged | | | Net Amount of
Derivative
Liabilities3 | |
The Bank of New York Mellon | | $ | 29,293 | | | | — | | | | — | | | | — | | | $ | 29,293 | |
Citibank N.A. | | | 169,765 | | | $ | (32,426 | ) | | | — | | | | — | | | | 137,339 | |
Deutsche Bank AG | | | 57,616 | | | | — | | | | — | | | | — | | | | 57,616 | |
Goldman Sachs Bank USA | | | 42,957 | | | | — | | | | — | | | | — | | | | 42,957 | |
Standard Chartered Bank | | | 109,233 | | | | (109,233 | ) | | | — | | | | — | | | | — | |
State Street Bank and Trust Co. | | | 16,489 | | | | — | | | | — | | | | — | | | | 16,489 | |
TD Securities, Inc. | | | 52,687 | | | | (52,687 | ) | | | — | | | | — | | | | — | |
UBS AG | | | 106,771 | | | | — | | | | — | | | | — | | | | 106,771 | |
| | | | |
Total | | $ | 584,811 | | | $ | (194,346 | ) | | | — | | | | — | | | $ | 390,465 | |
| | | | |
| | 1 | | The amount of derivatives available for offset is limited to the amount of derivative assets and/or liabilities that are subject to an MNA. |
| | 2 | | Net amount represents the net amount receivable from the counterparty in the event of default. |
| | 3 | | Net amount represents the net amount payable due to the counterparty in the event of default. Net amount may be offset further by the options written receivable/payable on the Statement of Assets and Liabilities. |
5. Investment Advisory Agreement and Other Transactions with Affiliates:
The PNC Financial Services Group, Inc. is the largest stockholder and an affiliate of BlackRock, Inc. (“BlackRock”) for 1940 Act purposes.
The Trust, on behalf of the Funds, entered into an Investment Advisory Agreement with the Manager, the Funds’ investment advisor, an indirect, wholly owned subsidiary of BlackRock, to provide investment advisory services. The Manager is responsible for the management of each Fund’s portfolio and provides the necessary personnel, facilities, equipment and certain other services to the operations of each Fund. For such services, each Fund pays the Manager a monthly fee based on a percentage of each Fund’s average daily net assets at the following annual rates:
| | | | | | | | |
| | | Flexible Equity and
Mid-Cap Growth Equity | | | Small Cap
Growth Equity | |
| Average Daily Net Assets | | Investment Advisory Fee | |
First $1 Billion | | | 0.800 | % | | | 0.550 | % |
$1 Billion - $2 Billion | | | 0.700 | % | | | 0.500 | % |
$2 Billion - $3 Billion | | | 0.650 | % | | | 0.475 | % |
Greater than $3 Billion | | | 0.625 | % | | | 0.450 | % |
The Manager voluntarily agreed to waive its investment advisory fees by the amount of investment advisory fees each Fund pays to the Manager indirectly through its investment in affiliated money market funds. However, the Manager does not waive its investment advisory fees by the amount of investment advisory fees paid in connection with each Fund’s investment in other affiliated investment companies, if any. These amounts are included in fees waived by the Manager in the Statements of Operations. For the six months ended March 31, 2015, the amounts waived were as follows:
| | | | |
Flexible Equity | | $ | 12,504 | |
Mid-Cap Growth Equity | | $ | 831 | |
Small Cap Growth Equity | | $ | 2,661 | |
The Manager provides investment management and other services to the Subsidiary. The Manager does not receive separate compensation from the Subsidiary for providing investment management or administrative services. However, Flexible Equity pays the Manager based on Flexible Equity’s net assets, which include the assets of the Subsidiary.
The Trust, on behalf of the Funds, entered into a Distribution Agreement and a Distribution and Service Plan with BlackRock Investments, LLC (“BRIL”), an affiliate of the Manager. Pursuant to the Distribution and Service Plan and in accordance with Rule 12b-1 under the 1940 Act, each Fund pays BRIL ongoing service and distribution fees. The fees are accrued daily and paid monthly at annual rates based upon the average daily net assets of the relevant share class of each Fund as follows:
| | | | | | | | |
| | | Service
Fee | | | Distribution
Fee | |
Service | | | 0.25 | % | | | — | |
Investor A | | | 0.25 | % | | | — | |
Investor B | | | 0.25 | % | | | 0.75 | % |
Investor C | | | 0.25 | % | | | 0.75 | % |
Class R | | | 0.25 | % | | | 0.25 | % |
Pursuant to sub-agreements with BRIL, broker-dealers and BRIL provide shareholder servicing and distribution services to each Fund. The ongoing service and/or distribution fee compensates BRIL and each broker-dealer for providing shareholder servicing and/or distribution related services to Service, Investor A, Investor B, Investor C and Class R shareholders.
| | | | | | |
| 50 | | BLACKROCK FUNDS | | MARCH 31, 2015 | | |
| | |
| Notes to Financial Statements (continued) | | |
For the six months ended March 31, 2015, the following table shows the class specific service and distribution fees borne directly by each class of each Fund:
| | | | | | | | | | | | | | | | | | | | | | | | |
| | | Service | | | Investor A | | | Investor B | | | Investor C | | | Class R | | | Total | |
Flexible Equity | | $ | 236 | | | $ | 534,810 | | | $ | 31,745 | | | $ | 439,855 | | | $ | 3,744 | | | $ | 1,010,390 | |
Mid-Cap Growth Equity | | $ | 3,498 | | | $ | 401,174 | | | $ | 15,448 | | | $ | 160,235 | | | $ | 19,352 | | | $ | 599,707 | |
Small Cap Growth Equity | | $ | 26,423 | | | $ | 358,000 | | | $ | 3,756 | | | $ | 159,900 | | | | — | | | $ | 548,079 | |
Pursuant to written agreements, certain financial intermediaries, some of which may be affiliates, provide the Funds with sub-accounting, recordkeeping, sub-transfer agency and other administrative services with respect to sub-accounts they service. For these services, these entities receive an asset-based fee or an annual fee per shareholder account, which will vary depending on share class and/or net assets. For the six months ended March 31, 2015, the Funds paid the following amounts to the affiliates of BlackRock in return for these services, which are included in transfer agent — class specific in the Statements of Operations:
| | | | |
Flexible Equity | | $ | 491 | |
Mid-Cap Growth Equity | | $ | 1,515 | |
Small Cap Growth Equity | | $ | 117,234 | |
The Manager maintains a call center, which is responsible for providing certain shareholder services to the Funds, such as responding to shareholder inquiries and processing transactions based upon instructions from shareholders with respect to the subscription and redemption of Fund shares. For the six months ended March 31, 2015, each Fund reimbursed the Manager the following amounts for costs incurred in running the call center, which are included in transfer agent — class specific in the Statements of Operations:
| | | | | | | | | | | | | | | | | | | | | | | | | | | | |
| | | Institutional | | | Service | | | Investor A | | | Investor B | | | Investor C | | | Class R | | | Total | |
Flexible Equity | | $ | 1,187 | | | $ | 8 | | | $ | 46,235 | | | $ | 3,163 | | | $ | 2,146 | | | $ | 3 | | | $ | 52,742 | |
Mid-Cap Growth Equity | | $ | 990 | | | $ | 18 | | | $ | 69,572 | | | $ | 2,460 | | | $ | 1,599 | | | $ | 39 | | | $ | 74,678 | |
Small Cap Growth Equity | | $ | 1,002 | | | $ | 154 | | | $ | 4,690 | | | $ | 69 | | | $ | 1,028 | | | | — | | | $ | 6,943 | |
For the six months ended March 31, 2015, the following table shows the class specific transfer agent fees borne directly by each class of each Fund:
| | | | | | | | | | | | | | | | | | | | | | | | | | | | |
| | | Institutional | | | Service | | | Investor A | | | Investor B | | | Investor C | | | Class R | | | Total | |
Flexible Equity | | $ | 41,524 | | | $ | 167 | | | $ | 485,421 | | | $ | 19,552 | | | $ | 94,390 | | | $ | 1,621 | | | $ | 642,675 | |
Mid-Cap Growth Equity | | $ | 16,426 | | | $ | 2,246 | | | $ | 406,676 | | | $ | 12,863 | | | $ | 30,358 | | | $ | 11,016 | | | $ | 479,585 | |
Small Cap Growth Equity | | $ | 334,292 | | | $ | 22,858 | | | $ | 299,813 | | | $ | 1,481 | | | $ | 39,446 | | | | — | | | $ | 697,890 | |
Effective January 1, 2015, The Trust, on behalf of the Funds, entered into an Administration Agreement with the Manager, an indirect, wholly owned subsidiary of BlackRock, to provide administrative services. For these services, the Manager receives an administration fee computed daily and payable monthly, based on a percentage of the average daily net assets of the Funds. The administration fee, which is shown as administration in the Statement of Operations, is paid at the annual rates below:
| | | | |
| Average Daily Net Assets | | Administration Fee | |
First $500 Million | | | 0.0425 | % |
$500 Million - $1 Billion | | | 0.0400 | % |
$1 Billion - $2 Billion | | | 0.0375 | % |
$2 Billion - $4 Billion | | | 0.0350 | % |
$4 Billion - $13 Billion | | | 0.0325 | % |
Greater than $13 Billion | | | 0.0300 | % |
In addition, the Manager charges each of the share classes an administration fee, which is shown as administration — class specific in the Statement of Operations, at an annual rate of 0.02% of the average daily net assets of each respective class.
Prior to January 1, 2015, BNY Mellon Investment Servicing (US) Inc. (“BNYMIS”) and the Manager acted as co-administrators for the Funds. For these services, the co-administrators received an administration fee computed daily and payable monthly to each administrator pursuant to separate fee arrangements, based on a percentage of the average daily net assets of each Fund. The combined administration fee, which is shown as administration in the Statements of Operations, was paid at the following annual rates. In addition, each of the share classes is charged an administration fee, which is shown as administration — class specific in the Statements of Operations, based on the following percentages of average daily net assets of each respective class:
| | | | | | | | |
| Average Daily Net Assets | | Administration Fee | | | Administration Fee —
Class Specific | |
First $500 Million | | | 0.075 | % | | | 0.025 | % |
$500 Million - $1 Billion | | | 0.065 | % | | | 0.015 | % |
Greater than $1 Billion | | | 0.055 | % | | | 0.005 | % |
| | | | | | |
| | | BLACKROCK FUNDS | | MARCH 31, 2015 | | 51 |
| | |
| Notes to Financial Statements (continued) | | |
For the six months ended March 31, 2015, the Funds paid the following to the Manager in return for these services, which are included in administration and administration — class specific in the Statements of Operations:
| | | | |
Flexible Equity | | $ | 199,136 | |
Mid-Cap Growth Equity | | $ | 137,669 | |
Small Cap Growth Equity | | $ | 274,852 | |
For the six months ended March 31, 2015, the following table shows the class specific administration fees borne directly by each class of each Fund:
| | | | | | | | | | | | | | | | | | | | | | | | | | | | |
| | | Institutional | | | Service | | | Investor A | | | Investor B | | | Investor C | | | Class R | | | Total | |
Flexible Equity | | $ | 5,817 | | | $ | 21 | | | $ | 48,271 | | | $ | 720 | | | $ | 9,922 | | | $ | 168 | | | $ | 64,919 | |
Mid-Cap Growth Equity | | $ | 3,416 | | | $ | 326 | | | $ | 36,014 | | | $ | 349 | | | $ | 3,596 | | | $ | 870 | | | $ | 44,571 | |
Small Cap Growth Equity | | $ | 52,067 | | | $ | 2,383 | | | $ | 32,168 | | | $ | 85 | | | $ | 3,602 | | | | — | | | $ | 90,305 | |
BNYMIS and the Manager may have, at their discretion, voluntarily waived all or any portion of their administration fees for a Fund or a share class, which are included in administration fees waived — class specific in the Statements of Operations.
The Manager contractually and/or voluntarily agreed to waive and/or reimburse fees or expenses in order to limit expenses, excluding interest expense, dividend expense, tax expense, acquired fund fees and expenses and certain other fund expenses, which constitute extraordinary expenses not incurred in the ordinary course of the Funds’ business. The expense limitations as a percentage of average daily net assets are as follows:
| | | | | | | | | | | | | | | | | | | | | | |
| | | Flexible Equity | | | | | | | Mid-Cap
Growth Equity | | | | | Small Cap
Growth Equity | |
| | | Contractual1 | | | Voluntary2 | | | | | | | Contractual3 | | | | | Contractual3 | |
| | | | | | | | | | | | | | | | | | | | | | |
Institutional | | | 0.97 | % | | | 0.92 | % | | | | | | | 1.11 | % | | | | | 1.02 | % |
Service | | | 1.29 | % | | | 1.24 | % | | | | | | | 1.58 | % | | | | | 1.18 | %4 |
Investor A | | | 1.29 | % | | | 1.24 | % | | | | | | | 1.39 | % | | | | | 1.50 | % |
Investor B | | | 2.06 | % | | | 2.01 | % | | | | | | | 2.16 | % | | | | | 2.28 | % |
Investor C | | | 2.06 | % | | | 2.01 | % | | | | | | | 2.16 | % | | | | | 2.28 | % |
Class R | | | 1.65 | %5 | | | 1.60 | % | | | | | | | 1.65 | % | | | | | 1.72 | %6 |
| | 1 | | The Manager has agreed not to reduce or discontinue this contractual waiver or reimbursement prior to February 1, 2016, except for Class R Shares which is prior to February 1, 2025, unless approved by the Board, including a majority of the independent Trustees. |
| | 2 | | The voluntary waiver or reimbursement, which became effective June 1, 2014, may be reduced or discontinued at any time. |
| | 3 | | The Manager has agreed not to reduce or discontinue this contractual waiver or reimbursement prior to February 1, 2016 unless approved by the Board, including a majority of the independent Trustees. |
| | 4 | | Prior to February 1, 2015, the contractual cap was 1.29%. |
| | 5 | | On February 1 of each year, the waiver agreement will renew automatically for an additional one year so that the agreement will have a perpetual ten year term. |
| | 6 | | There were no shares outstanding as of March 31, 2015. |
These amounts waived or reimbursed are included in fees waived by the Manager, and shown as administration fees waived — class specific, transfer agent fees waived — class specific and transfer agent fees reimbursed — class specific, respectively, in the Statements of Operations. For the six months ended March 31, 2015, the Manager waived $5,758 of investment advisory fees for Flexible Equity, which is included in fees waived by the Manager. Class specific expense waivers or reimbursements are as follows:
| | | | | | | | | | | | | | | | | | | | | | | | | | | | |
| Administration Fees Waived | | Institutional | | | Service | | | Investor A | | | Investor B | | | Investor C | | | Class R | | | Total | |
Flexible Equity | | $ | 5,817 | | | $ | 13 | | | $ | 48,271 | | | $ | 720 | | | $ | 9,922 | | | $ | 168 | | | $ | 64,911 | |
Mid-Cap Growth Equity | | | — | | | $ | 3 | | | $ | 35,610 | | | $ | 349 | | | $ | 275 | | | $ | 870 | | | $ | 37,107 | |
Small Cap Growth Equity | | | — | | | $ | 91 | | | | — | | | | — | | | | — | | | | — | | | $ | 91 | |
| | | | | | | | | | | | | | | | | | | | | | | | | | | | |
Transfer Agent Fees Waived | | | Institutional | | | | Service | | | | Investor A | | | | Investor B | | | | Investor C | | | | Class R | | | | Total | |
Flexible Equity | | $ | 1,187 | | | $ | 8 | | | $ | 46,235 | | | $ | 3,163 | | | $ | 2,146 | | | $ | 3 | | | $ | 52,742 | |
Mid-Cap Growth Equity | | | — | | | | — | | | $ | 48,754 | | | $ | 2,460 | | | | — | | | $ | 39 | | | $ | 51,253 | |
| | | | | | | | | | | | | | | | | | | | | | | | | | | | |
Transfer Agent Fees Reimbursed | | | Institutional | | | | Service | | | | Investor A | | | | Investor B | | | | Investor C | | | | Class R | | | | Total | |
Flexible Equity | | $ | 40,150 | | | $ | 121 | | | $ | 288,410 | | | $ | 13,506 | | | $ | 53,033 | | | $ | 264 | | | $ | 395,484 | |
Mid-Cap Growth Equity | | | — | | | $ | 5 | | | $ | 20,895 | | | $ | 6,856 | | | | — | | | $ | 2,456 | | | $ | 30,212 | |
If during a Fund’s fiscal year the operating expenses of a share class, that at any time during the prior two fiscal years received a waiver or reimbursement from the Manager, are less than the expense limit for that share class, the Manager is entitled to be reimbursed by such share class up to the lesser of (a) the amount of fees waived or expenses reimbursed during those prior two fiscal years under the agreement and (b) the amount by which the expense limit for that share class exceeds the operating expenses of the share class for the current fiscal year, provided that: (1) the Fund, of which the share class is a part, has more than $50 million in assets for the fiscal year and (2) the Manager or an affiliate continues to serve as the Fund’s investment advisor or administrator. In the event the expense limit for a share class is changed subsequent to a fiscal year in which the Manager
| | | | | | |
| 52 | | BLACKROCK FUNDS | | MARCH 31, 2015 | | |
| | |
| Notes to Financial Statements (continued) | | |
becomes entitled to reimbursement for fees waived or reimbursed, the amount available to reimburse the Manager shall be calculated by reference to the expense limit for that share class in effect at the time the Manager became entitled to receive such reimbursement, rather than the subsequently changed expense limit for that share class.
For the six months ended March 31, 2015, the Manager recouped the following Fund level and class specific waivers and/or reimbursements previously recorded by the Funds:
| | | | | | | | | | | | | | | | |
| | | Institutional | | | Service | | | Investor C | | | Total | |
Flexible Equity | | | — | | | $ | 15 | | | | — | | | $ | 15 | |
Mid-Cap Growth Equity | | $ | 2,523 | | | $ | 1,701 | | | $ | 3,138 | | | $ | 7,362 | |
On March 31, 2015, the Fund level and class specific waivers and/or reimbursements subject to possible future recoupment under the expense limitation agreement are as follows:
| | | | | | | | | | | | |
| | | Expiring September 30, | |
| | | 2015 | | | 2016 | | | 2017 | |
Flexible Equity | | | | | | | | | | | | |
Fund Level | | $ | 4,185 | | | | — | | | | — | |
Institutional | | $ | 161,208 | | | $ | 68,244 | | | $ | 34,796 | |
Service | | $ | 2,162 | | | $ | 51 | | | $ | 110 | |
Investor A | | $ | 726,434 | | | $ | 534,736 | | | $ | 280,289 | |
Investor B | | $ | 50,744 | | | $ | 33,683 | | | $ | 15,862 | |
Investor C | | $ | 141,245 | | | $ | 74,719 | | | $ | 44,014 | |
R Shares | | $ | 1,533 | | | $ | 563 | | | $ | 275 | |
Mid-Cap Growth Equity | | | | | | | | | | | | |
Service | | | — | | | | — | | | $ | 8 | |
Investor A | | $ | 387,828 | | | $ | 282,293 | | | $ | 105,259 | |
Investor B | | $ | 24,471 | | | $ | 19,359 | | | $ | 9,664 | |
Investor C | | $ | 10,988 | | | $ | 4,164 | | | $ | 276 | |
R Shares | | $ | 6,418 | | | $ | 7,596 | | | $ | 3,365 | |
For the six months ended March 31, 2015, affiliates earned underwriting discounts, direct commissions and dealer concessions on sales of each Fund’s Investor A Shares as follows:
| | | | |
Flexible Equity | | $ | 3,751 | |
Mid-Cap Growth Equity | | $ | 7,673 | |
Small Cap Growth Equity | | $ | 5,826 | |
For the six months ended March 31, 2015, affiliates received CDSCs as follows:
| | | | | | | | | | | | |
| | | Investor A | | | Investor B | | | Investor C | |
Flexible Equity | | $ | 12 | | | $ | 148 | | | $ | 1,463 | |
Mid-Cap Growth Equity | | $ | 195 | | | $ | 79 | | | $ | 1,499 | |
Small Cap Growth Equity | | $ | 484 | | | | — | | | $ | 1,628 | |
The U.S. Securities and Exchange Commission has issued an exemptive order which permits BIM, an affiliate of the Manager, to serve as securities lending agent for the Funds, subject to applicable conditions. As securities lending agent, BIM bears all operational costs directly related to securities lending. The Funds are responsible for expenses in connection with the investment of cash collateral received for securities on loan (the “collateral investment expenses”). The cash collateral is invested in a private investment company managed by the Manager or its affiliates. However, BIM has agreed to cap the collateral investment expenses of the private investment company to an annual rate of 0.04%. The investment advisor to the private investment company will not charge any advisory fees with respect to shares purchased by the Funds.
Securities lending income is equal to the total of income earned from the reinvestment of cash collateral, net of fees and other payments to and from borrowers of securities, and less the collateral investment expenses. Each Fund retains a portion of securities lending income and remits a remaining portion to BIM as compensation for its services as securities lending agent. Pursuant to a securities lending agreement, BIM may lend securities only when the difference between the borrower rebate rate and the risk free rate exceeds a certain level (such securities, the “specials only securities”).
Pursuant to such agreement, each Fund retains 80% of securities lending income. In addition, commencing the business day following the date that the aggregate securities lending income earned across certain funds in the Equity-Liquidity Complex in a calendar year exceeds a specified threshold, each Fund, pursuant to the securities lending agreement, will retain for the remainder of the calendar year securities lending income in an amount equal to 85% of securities lending income.
| | | | | | |
| | | BLACKROCK FUNDS | | MARCH 31, 2015 | | 53 |
| | |
| Notes to Financial Statements (continued) | | |
The share of securities lending income earned by each Fund, if any, is shown as securities lending — affiliated — net in the Statements of Operations. For the six months ended March 31, 2015, each Fund paid BIM the following amounts for securities lending agent services:
| | | | |
Flexible Equity | | $ | 14,153 | |
Mid-Cap Growth Equity | | $ | 6,286 | |
Small Cap Growth Equity | | $ | 264,570 | |
Certain officers and/or trustees of the Trust are officers and/or directors of BlackRock or its affiliates. The Funds reimburse the Manager for a portion of the compensation paid to the Trust’s Chief Compliance Officer, which is included in officer and trustees in the Statements of Operations.
The Funds may purchase securities from, or sell securities to, an affiliated fund provided the affiliation is due solely to having a common investment advisor, common officers, or common trustees. For the six months ended March 31, 2015, Flexible Equity’s purchase and sale transactions with an affiliated fund in compliance with Rule 17a-7 under the 1940 Act were $17,172,283 and $5,877,528, respectively.
6. Purchases and Sales:
Purchases and sales of investments, excluding short-term securities, for the six months ended March 31, 2015, were as follows:
| | | | | | | | | | | | |
| | | Flexible Equity | | | Mid-Cap
Growth Equity | | | Small Cap
Growth Equity | |
Purchases | | $ | 730,085,154 | | | $ | 201,149,810 | | | $ | 531,990,041 | |
Sales | | $ | 702,498,813 | | | $ | 216,217,237 | | | $ | 557,813,030 | |
7. Income Tax Information:
It is the Funds’ policy to comply with the requirements of the Internal Revenue Code of 1986, as amended, applicable to regulated investment companies, and to distribute substantially all of their taxable income to their shareholders. Therefore, no federal income tax provision is required.
The Funds file U.S. federal and various state and local tax returns. No income tax returns are currently under examination. The statute of limitations on the Funds’ U.S. federal tax returns remains open for each of the four years ended September 30, 2014. The statutes of limitations on each Fund’s state and local tax returns may remain open for an additional year depending upon the jurisdiction.
Management has analyzed tax laws and regulations and their application to the Funds as of March 31, 2015, inclusive of the open tax return years, and does not believe that there are any uncertain tax positions that require recognition of a tax liability in the Funds’ financial statements.
As of September 30, 2014, the Flexible Equity Fund had a capital loss carryforward available to offset future realized capital gains of $47,020,050, all of which is due to expire September 30, 2017.
As of March 31, 2015, gross unrealized appreciation and depreciation based on cost for federal income tax purposes were as follows:
| | | | | | | | | | | | |
| | | Flexible Equity | | | Mid-Cap
Growth Equity | | | Small Cap
Growth Equity | |
Tax cost | | $ | 538,543,784 | | | $ | 326,034,390 | | | $ | 760,102,039 | |
| | | | |
Gross unrealized appreciation | | $ | 26,571,964 | | | $ | 114,886,919 | | | $ | 140,844,001 | |
Gross unrealized depreciation | | | (13,430,968 | ) | | | (2,920,777 | ) | | | (36,782,160 | ) |
| | | | |
Net unrealized appreciation | | $ | 13,140,996 | | | $ | 111,966,142 | | | $ | 104,061,841 | |
| | | | |
8. Bank Borrowings:
The Trust, on behalf of the Funds, along with certain other funds managed by the Manager and its affiliates (“Participating Funds”), was a party to a 364-day, $1.1 billion credit agreement with a group of lenders, under which the Funds may borrow to fund shareholder redemptions. Excluding commitments designated for a certain individual fund, the Participating Funds, including the Fund, could borrow up to an aggregate commitment amount of $650 million, subject to asset coverage and other limitations as specified in the agreement. Effective November 25, 2014, the credit agreement was amended to an aggregate commitment amount of $2.1 billion, of which the Participating Funds, including the Fund, can borrow up to $1.6 billion at any time outstanding, subject to asset coverage and other limitations as specified in the agreement. The agreement terminates on April 23, 2015, unless otherwise extended to November 24, 2015 or renewed for a period of 364 days from April 23, 2015. The amended agreement has the following terms: a fee of 0.06% per annum on unused commitment amounts and interest at a rate equal to the higher of (a) one-month LIBOR (but, in any event, not less than 0.00%) on the date the loan is made plus 0.80% per annum or (b) the Fed Funds rate (but, in any event, not less than 0.00%) in effect from time to time plus 0.80% per annum on amounts borrowed. Participating Funds paid administration, legal and arrangement fees, which are included in miscellaneous expenses in the Statement of Operations, and along with commitment fees, were allocated among such funds based upon
| | | | | | |
| 54 | | BLACKROCK FUNDS | | MARCH 31, 2015 | | |
| | |
| Notes to Financial Statements (continued) | | |
portions of the aggregate commitment available to them and relative net assets of Participating Funds. During the six months ended March 31, 2015, the Funds did not borrow under the credit agreement.
9. Principal Risks:
In the normal course of business, the Funds invest in securities and enter into transactions where risks exist due to fluctuations in the market (market risk) or failure of the issuer of a security to meet all its obligations (issuer credit risk). The value of securities held by the Funds may decline in response to certain events, including those directly involving the issuers whose securities are owned by the Funds; conditions affecting the general economy; overall market changes; local, regional or global political, social or economic instability; and currency and interest rate and price fluctuations. Similar to issuer credit risk, the Funds may be exposed to counterparty credit risk, or the risk that an entity with which the Funds have unsettled or open transactions may fail to or be unable to perform on its commitments. The Funds manage counterparty credit risk by entering into transactions only with counterparties that they believe have the financial resources to honor their obligations and by monitoring the financial stability of those counterparties. Financial assets, which potentially expose the Funds to market, issuer and counterparty credit risks, consist principally of financial instruments and receivables due from counterparties. The extent of the Funds’ exposure to market, issuer and counterparty credit risks with respect to these financial assets is generally approximated by their value recorded in the Statements of Assets and Liabilities, less any collateral held by the Funds.
As of March 31, 2015, Flexible Equity and Small Cap Growth Equity invested a significant portion of their assets in securities in the information technology and health care sectors. Mid-Cap Growth Equity invested a significant portion of its assets in securities in the consumer discretionary and information technology sectors. Changes in economic conditions affecting such sectors would have a greater impact on the respective Funds and could affect the value, income and/or liquidity of positions in such securities.
10. Capital Share Transactions:
Transactions in capital shares for each class were as follows:
| | | | | | | | | | | | | | | | | | |
| | | Six Months Ended
March 31, 2015 | | | | | Year Ended
September 30, 2014 | |
| Flexible Equity | | Shares | | | Amount | | | | | Shares | | | Amount | |
Institutional | | | | | | | | | | | | | | | | | | |
Shares sold | | | 195,452 | | | $ | 2,645,063 | | | | | | 1,242,439 | | | $ | 18,462,322 | |
Shares issued in reinvestment of distributions | | | 571,422 | | | | 7,302,784 | | | | | | 88,986 | | | | 1,337,911 | |
Shares redeemed | | | (595,914 | ) | | | (7,942,014 | ) | | | | | (2,225,666 | ) | | | (32,833,176 | ) |
| | | | | | | | | | |
Net increase (decrease) | | | 170,960 | | | $ | 2,005,833 | | | | | | (894,241 | ) | | $ | (13,032,943 | ) |
| | | | | | | | | | |
| | | | | | | | | | | | | | | | | | |
Service | | | | | | | | | | | | | | | | | | |
Shares sold | | | — | | | | — | | | | | | 1,364 | | | $ | 19,360 | |
Shares issued in reinvestment of distributions | | | 2,121 | | | $ | 26,699 | | | | | | 336 | | | | 5,005 | |
Shares redeemed | | | (3,004 | ) | | | (43,352 | ) | | | | | (17,425 | ) | | | (252,400 | ) |
| | | | | | | | | | |
Net decrease | | | (883 | ) | | $ | (16,653 | ) | | | | | (15,725 | ) | | $ | (228,035 | ) |
| | | | | | | | | | |
| | | | | | | | | | | | | | | | | | |
Investor A | | | | | | | | | | | | | | | | | | |
Shares sold and automatic conversion of shares | | | 777,828 | | | $ | 10,197,631 | | | | | | 1,663,646 | | | $ | 23,801,164 | |
Shares issued in reinvestment of distributions | | | 5,268,169 | | | | 64,956,765 | | | | | | 698,720 | | | | 10,236,797 | |
Shares redeemed | | | (4,183,626 | ) | | | (55,001,580 | ) | | | | | (8,445,720 | ) | | | (121,467,554 | ) |
| | | | | | | | | | |
Net increase (decrease) | | | 1,862,371 | | | $ | 20,152,816 | | | | | | (6,083,354 | ) | | $ | (87,429,593 | ) |
| | | | | | | | | | |
| | | | | | | | | | | | | | | | | | |
Investor B | | | | | | | | | | | | | | | | | | |
Shares sold | | | 887 | | | $ | 10,536 | | | | | | 3,381 | | | $ | 43,442 | |
Shares issued in reinvestment of distributions | | | 94,405 | | | | 1,036,570 | | | | | | 9,091 | | | | 121,879 | |
Shares redeemed and automatic conversion of shares | | | (154,965 | ) | | | (1,805,988 | ) | | | | | (421,887 | ) | | | (5,456,644 | ) |
| | | | | | | | | | |
Net decrease | | | (59,673 | ) | | $ | (758,882 | ) | | | | | (409,415 | ) | | $ | (5,291,323 | ) |
| | | | | | | | | | |
| | | | | | |
| | | BLACKROCK FUNDS | | MARCH 31, 2015 | | 55 |
| | |
| Notes to Financial Statements (continued) | | |
| | | | | | | | | | | | | | | | | | |
| | | Six Months Ended
March 31, 2015 | | | | | Year Ended
September 30, 2014 | |
| Flexible Equity (concluded) | | Shares | | | Amount | | | | | Shares | | | Amount | |
Investor C | | | | | | | | | | | | | | | | | | |
Shares sold | | | 145,741 | | | $ | 1,724,831 | | | | | | 265,044 | | | $ | 3,408,878 | |
Shares issued in reinvestment of distributions | | | 1,323,125 | | | | 14,355,983 | | | | | | 117,219 | | | | 1,558,290 | |
Shares redeemed | | | (906,062 | ) | | | (10,486,190 | ) | | | | | (1,600,571 | ) | | | (20,645,886 | ) |
| | | | | | | | | | |
Net increase (decrease) | | | 562,804 | | | $ | 5,594,624 | | | | | | (1,218,308 | ) | | $ | (15,678,718 | ) |
| | | | | | | | | | |
| | | | | | | | | | | | | | | | | | |
Class R | | | | | | | | | | | | | | | | | | |
Shares sold | | | 10,954 | | | $ | 148,085 | | | | | | 53,477 | | | $ | 784,618 | |
Shares issued in reinvestment of distributions | | | 17,840 | | | | 226,931 | | | | | | 1,295 | | | | 19,657 | |
Shares redeemed | | | (25,613 | ) | | | (331,305 | ) | | | | | (28,177 | ) | | | (413,014 | ) |
| | | | | | | | | | |
Net increase | | | 3,181 | | | $ | 43,711 | | | | | | 26,595 | | | $ | 391,261 | |
| | | | | | | | | | |
Total Net Increase (Decrease) | | | 2,538,760 | | | $ | 27,021,449 | | | | | | (8,594,448 | ) | | $ | (121,269,351 | ) |
| | | | | | | | | | |
| Mid-Cap Growth Equity | | | | | | | | | | | | | | |
Institutional | | | | | | | | | | | | | | | | | | |
Shares sold | | | 478,585 | | | $ | 8,371,788 | | | | | | 1,196,508 | | | $ | 21,091,745 | |
Shares issued in reinvestment of distributions | | | 185,953 | | | | 2,891,571 | | | | | | 194,583 | | | | 3,105,529 | |
Shares redeemed | | | (729,013 | ) | | | (12,334,031 | ) | | | | | (677,079 | ) | | | (11,709,016 | ) |
| | | | | | | | | | |
Net increase (decrease) | | | (64,475 | ) | | $ | (1,070,672 | ) | | | | | 714,012 | | | $ | 12,488,258 | |
| | | | | | | | | | |
| | | | | | | | | | | | | | | | | | |
Service | | | | | | | | | | | | | | | | | | |
Shares sold | | | 36,763 | | | $ | 588,978 | | | | | | 158,478 | | | $ | 2,550,496 | |
Shares issued in reinvestment of distributions | | | 33,345 | | | | 475,497 | | | | | | 24,218 | | | | 359,153 | |
Shares redeemed | | | (183,110 | ) | | | (2,613,334 | ) | | | | | (68,930 | ) | | | (1,110,985 | ) |
| | | | | | | | | | |
Net increase (decrease) | | | (113,002 | ) | | $ | (1,548,859 | ) | | | | | 113,766 | | | $ | 1,798,664 | |
| | | | | | | | | | |
| | | | | | | | | | | | | | | | | | |
Investor A | | | | | | | | | | | | | | | | | | |
Shares sold and automatic conversion of shares | | | 1,629,216 | | | $ | 24,897,260 | | | | | | 2,620,664 | | | $ | 41,081,622 | |
Shares issued in reinvestment of distributions | | | 2,641,817 | | | | 36,192,894 | | | | | | 3,329,313 | | | | 47,575,801 | |
Shares redeemed | | | (1,797,456 | ) | | | (26,948,741 | ) | | | | | (3,002,634 | ) | | | (46,763,780 | ) |
| | | | | | | | | | |
Net increase | | | 2,473,577 | | | $ | 34,141,413 | | | | | | 2,947,343 | | | $ | 41,893,643 | |
| | | | | | | | | | |
| | | | | | | | | | | | | | | | | | |
Investor B | | | | | | | | | | | | | | | | | | |
Shares sold | | | 1,598 | | | $ | 20,297 | | | | | | 14,015 | | | $ | 189,102 | |
Shares issued in reinvestment of distributions | | | 37,360 | | | | 419,930 | | | | | | 63,066 | | | | 759,319 | |
Shares redeemed and automatic conversion of shares | | | (59,282 | ) | | | (719,407 | ) | | | | | (129,834 | ) | | | (1,701,598 | ) |
| | | | | | | | | | |
Net decrease | | | (20,324 | ) | | $ | (279,180 | ) | | | | | (52,753 | ) | | $ | (753,177 | ) |
| | | | | | | | | | |
| | | | | | | | | | | | | | | | | | |
Investor C | | | | | | | | | | | | | | | | | | |
Shares sold | | | 316,586 | | | $ | 3,963,175 | | | | | | 737,262 | | | $ | 9,789,456 | |
Shares issued in reinvestment of distributions | | | 377,524 | | | | 4,213,180 | | | | | | 396,072 | | | | 4,748,893 | |
Shares redeemed | | | (310,731 | ) | | | (3,815,107 | ) | | | | | (436,380 | ) | | | (5,629,287 | ) |
| | | | | | | | | | |
Net increase | | | 383,379 | | | $ | 4,361,248 | | | | | | 696,954 | | | $ | 8,909,062 | |
| | | | | | | | | | |
| | | | | | |
| 56 | | BLACKROCK FUNDS | | MARCH 31, 2015 | | |
| | |
| Notes to Financial Statements (concluded) | | |
| | | | | | | | | | | | | | | | | | |
| | | Six Months Ended
March 31, 2015 | | | | | Year Ended
September 30, 2014 | |
| Mid-Cap Growth Equity (concluded) | | Shares | | | Amount | | | | | Shares | | | Amount | |
Class R | | | | | | | | | | | | | | | | | | |
Shares sold | | | 105,588 | | | $ | 1,577,263 | | | | | | 213,560 | | | $ | 3,338,369 | |
Shares issued in reinvestment of distributions | | | 68,920 | | | | 935,238 | | | | | | 115,333 | | | | 1,635,424 | |
Shares redeemed | | | (145,406 | ) | | | (2,100,075 | ) | | | | | (404,806 | ) | | | (6,167,381 | ) |
| | | | | | | | | | |
Net increase (decrease) | | | 29,102 | | | $ | 412,426 | | | | | | (75,913 | ) | | $ | (1,193,588 | ) |
| | | | | | | | | | |
Total Net Increase | | | 2,688,257 | | | $ | 36,016,376 | | | | | | 4,343,409 | | | $ | 63,142,862 | |
| | | | | | | | | | |
| Small Cap Growth Equity | | | | | | | | | | | | | | |
Institutional | | | | | | | | | | | | | | | | | | |
Shares sold | | | 1,822,865 | | | $ | 35,926,624 | | | | | | 8,656,098 | | | $ | 211,371,164 | |
Shares issued in reinvestment of distributions | | | 5,535,087 | | | | 98,413,836 | | | | | | 9,997,391 | | | | 219,842,574 | |
Shares redeemed | | | (2,750,662 | ) | | | (54,556,283 | ) | | | | | (27,109,533 | ) | | | (690,162,339 | ) |
| | | | | | | | | | |
Net increase (decrease) | | | 4,607,290 | | | $ | 79,784,177 | | | | | | (8,456,044 | ) | | $ | (258,948,601 | ) |
| | | | | | | | | | |
| | | | | | | | | | | | | | | | | | |
Service | | | | | | | | | | | | | | | | | | |
Shares sold | | | 128,462 | | | $ | 2,281,081 | | | | | | 326,946 | | | $ | 7,360,406 | |
Shares issued in reinvestment of distributions | | | 320,597 | | | | 4,988,487 | | | | | | 452,078 | | | | 8,964,705 | |
Shares redeemed | | | (372,662 | ) | | | (6,880,388 | ) | | | | | (492,363 | ) | | | (10,724,740 | ) |
| | | | | | | | | | |
Net increase | | | 76,397 | | | $ | 389,180 | | | | | | 286,661 | | | $ | 5,600,371 | |
| | | | | | | | | | |
| | | | | | | | | | | | | | | | | | |
Investor A | | | | | | | | | | | | | | | | | | |
Shares sold and automatic conversion of shares | | | 2,017,404 | | | $ | 31,831,481 | | | | | | 4,602,327 | | | $ | 93,881,945 | |
Shares issued in reinvestment of distributions | | | 4,903,069 | | | | 70,555,130 | | | | | | 6,048,552 | | | | 113,168,255 | |
Shares redeemed | | | (2,678,458 | ) | | | (43,856,254 | ) | | | | | (8,147,736 | ) | | | (171,817,273 | ) |
| | | | | | | | | | |
Net increase | | | 4,242,015 | | | $ | 58,530,357 | | | | | | 2,503,143 | | | $ | 35,232,927 | |
| | | | | | | | | | |
| | | | | | | | | | | | | | | | | | |
Investor B | | | | | | | | | | | | | | | | | | |
Shares sold | | | 935 | | | $ | 11,161 | | | | | | 2,277 | | | $ | 38,240 | |
Shares issued in reinvestment of distributions | | | 25,616 | | | | 246,684 | | | | | | 34,769 | | | | 489,888 | |
Shares redeemed and automatic conversion of shares | | | (13,241 | ) | | | (144,097 | ) | | | | | (37,519 | ) | | | (555,636 | ) |
| | | | | | | | | | |
Net increase (decrease) | | | 13,310 | | | $ | 113,748 | | | | | | (473 | ) | | $ | (27,508 | ) |
| | | | | | | | | | |
| | | | | | | | | | | | | | | | | | |
Investor C | | | | | | | | | | | | | | | | | | |
Shares sold | | | 224,841 | | | $ | 2,456,563 | | | | | | 411,912 | | | $ | 6,591,150 | |
Shares issued in reinvestment of distributions | | | 1,120,241 | | | | 10,575,042 | | | | | | 1,031,671 | | | | 14,371,093 | |
Shares redeemed | | | (507,505 | ) | | | (5,591,311 | ) | | | | | (606,945 | ) | | | (9,349,869 | ) |
| | | | | | | | | | |
Net increase | | | 837,577 | | | $ | 7,440,294 | | | | | | 836,638 | | | $ | 11,612,374 | |
| | | | | | | | | | |
Total Net Increase (Decrease) | | | 9,776,589 | | | $ | 146,257,756 | | | | | | (4,830,075 | ) | | $ | (206,530,437 | ) |
| | | | | | | | | | |
11. Subsequent Events:
Management’s evaluation of the impact of all subsequent events on the Funds’ financial statements was completed through the date the financial statements were issued and the following item was noted:
Effective April 23, 2015, the 364-day, $2.1 billion credit agreement to which the Funds are a party, was further amended to expire on April 21, 2016, unless otherwise extended or renewed.
| | | | | | |
| | | BLACKROCK FUNDS | | MARCH 31, 2015 | | 57 |
Rodney D. Johnson, Chair of the Board and Trustee
David O. Beim, Trustee
Collette Chilton, Trustee
Frank J. Fabozzi, Trustee
Dr. Matina S. Horner, Trustee
Herbert I. London, Trustee
Ian A. MacKinnon, Trustee
Cynthia A. Montgomery, Trustee
Barbara G. Novick, Trustee
Joseph P. Platt, Trustee
Robert C. Robb, Jr., Trustee
Toby Rosenblatt, Trustee
Mark Stalnecker, Trustee
Kenneth L. Urish, Trustee
Frederick W. Winter, Trustee
John M. Perlowski, President and Chief Executive Officer
Jennifer McGovern, Vice President
Neal Andrews, Chief Financial Officer
Jay Fife, Treasurer
Charles Park, Chief Compliance Officer
Fernanda Piedra, Anti-Money Laundering Compliance Officer
Benjamin Archibald, Secretary
Effective December 31, 2014, Paul L. Audet and Henry Gabbay resigned as Trustees of the Trust and Ronald W. Forbes resigned as a Trustee of the Trust and Co-Chair of the Board. Effective January 1, 2015, Collette Chilton, Barbara G. Novick and Mark Stalnecker were appointed to serve as Trustees of the Trust.
Effective March 1, 2015, Charles Park resigned as Anti-Money Laundering Compliance Officer of the Trust and Fernanda Piedra became Anti-Money Laundering Compliance Officer of the Trust.
| | | | | | |
| | | | |
Investment Advisor and Administrator BlackRock Advisors, LLC Wilmington, DE 19809 | | Accounting Agent and Transfer Agent BNY Mellon Investment Servicing (US) Inc. Wilmington, DE 19809 | | Independent Registered Public Accounting Firm Deloitte & Touche LLP Philadelphia, PA 19103 | | Address of the Trust 100 Bellevue Parkway Wilmington, DE 19809 |
| | | | | | |
Custodian The Bank of New York Mellon New York, NY 10286 | | Distributor BlackRock Investments, LLC New York, NY 10022 | | Legal Counsel Sidley Austin LLP New York, NY 10019 | | |
| | | | | | |
| 58 | | BLACKROCK FUNDS | | MARCH 31, 2015 | | |
Householding
The Funds will mail only one copy of shareholder documents, including prospectuses, annual and semi-annual reports and proxy statements, to shareholders with multiple accounts at the same address. This practice is commonly called “householding” and is intended to reduce expenses and eliminate duplicate mailings of shareholder documents. Mailings of your shareholder documents may be householded indefinitely unless you instruct us otherwise. If you do not want the mailing of these documents to be combined with those for other members of your household, please call the Funds at (800) 441-7762.
Availability of Quarterly Schedule of Investments
The Funds file their complete schedule of portfolio holdings with the SEC for the first and third quarters of each fiscal year on Form N-Q. The Funds’ Forms N-Q are available on the SEC’s website at http://www.sec.gov and may also be reviewed and copied at the SEC’s Public Reference Room in Washington, D.C. Information on how to access documents on the SEC’s website without charge may be obtained by calling (800) SEC-0330. The Funds’ Forms N-Q may also be obtained upon request and without charge by calling (800) 441-7762.
Availability of Proxy Voting Policies and Procedures
A description of the policies and procedures that the Funds use to determine how to vote proxies relating to portfolio securities is available upon request and without charge (1) by calling (800) 441-7762; (2) at http://www.blackrock.com; and (3) on the SEC’s website at http://www.sec.gov.
Availability of Proxy Voting Record
Information about how the Funds voted proxies relating to securities held in the Funds’ portfolios during the most recent 12-month period ended June 30 is available upon request and without charge (1) at http://www.blackrock.com or by calling (800) 441-7762 and (2) on the SEC’s website at http://www.sec.gov.
BlackRock’s Mutual Fund Family
BlackRock offers a diverse lineup of open-end mutual funds crossing all investment styles and managed by experts in equity, fixed income and tax-exempt investing. Visit http://www.blackrock.com for more information.
Account Information
Call us at (800) 441-7762 from 8:00 AM to 6:00 PM EST on any business day to get information about your account balances, recent transactions and share prices. You can also reach us on the Web at http://www.blackrock.com/funds.
Automatic Investment Plans
Investor Class shareholders who want to invest regularly can arrange to have $50 or more automatically deducted from their checking or savings account and invested in any of the BlackRock funds.
Systematic Withdrawal Plans
Investor Class shareholders can establish a systematic withdrawal plan and receive periodic payments of $50 or more from their BlackRock funds, as long as their account balance is at least $10,000.
Retirement Plans
Shareholders may make investments in conjunction with Traditional, Rollover, Roth, Coverdell, Simple IRAs, SEP IRAs and 403(b) Plans.
| | | | | | |
| | | BLACKROCK FUNDS | | MARCH 31, 2015 | | 59 |
| | |
| Additional Information (concluded) | | |
|
| BlackRock Privacy Principles |
BlackRock is committed to maintaining the privacy of its current and former fund investors and individual clients (collectively, “Clients”) and to safeguarding their non-public personal information. The following information is provided to help you understand what personal information BlackRock collects, how we protect that information and why in certain cases we share such information with select parties.
If you are located in a jurisdiction where specific laws, rules or regulations require BlackRock to provide you with additional or different privacy-related rights beyond what is set forth below, then BlackRock will comply with those specific laws, rules or regulations.
BlackRock obtains or verifies personal non-public information from and about you from different sources, including the following: (i) information we receive from you or, if applicable, your financial intermediary, on applications, forms or other documents; (ii) information about your transactions with us, our affiliates, or others; (iii) information we receive from a consumer reporting agency; and (iv) from visits to our websites.
BlackRock does not sell or disclose to non-affiliated third parties any non-public personal information about its Clients, except as permitted by law or as is necessary to respond to regulatory requests or to service Client accounts. These non-affiliated third parties are required to protect the confidentiality and security of this information and to use it only for its intended purpose.
We may share information with our affiliates to service your account or to provide you with information about other BlackRock products or services that may be of interest to you. In addition, BlackRock restricts access to non-public personal information about its Clients to those BlackRock employees with a legitimate business need for the information. BlackRock maintains physical, electronic and procedural safeguards that are designed to protect the non-public personal information of its Clients, including procedures relating to the proper storage and disposal of such information.
| | | | | | |
| 60 | | BLACKROCK FUNDS | | MARCH 31, 2015 | | |
This report is intended for current holders. It is not authorized for use as an offer of sale or a solicitation of an offer to buy shares of the Funds unless preceded or accompanied by the Funds’ current prospectus. Past performance results shown in this report should not be considered a representation of future performance. Investment returns and principal value of shares will fluctuate so that shares, when redeemed, may be worth more or less than their original cost. Statements and other information herein are as dated and are subject to change.

| | |
| |
Eq-Midcap-3/15-SAR | | 
|
MARCH 31, 2015
| | | | |
SEMI-ANNUAL REPORT (UNAUDITED) | | | | BLACKROCK® |
BlackRock FundsSM
„ BlackRock Global Opportunities Portfolio
„ BlackRock Health Sciences Opportunities Portfolio
„ BlackRock International Opportunities Portfolio
„ BlackRock Science & Technology Opportunities Portfolio
„ BlackRock U.S. Opportunities Portfolio
| | |
| Not FDIC Insured ¡ May Lose Value ¡ No Bank Guarantee | | |

| | | | | | |
| 2 | | BLACKROCK FUNDS | | MARCH 31, 2015 | | |
Dear Shareholder,
Market volatility has remained low from a long-term perspective, but increased over the course of 2014 amid higher valuations in risk assets (such as equities and high yield bonds), geopolitical risks, uneven global economic growth and uncertainty around policy moves from the world’s largest central banks. As the U.S. Federal Reserve (the “Fed”) gradually reduced its bond buying program (which ultimately ended in October 2014), U.S. interest rates surprisingly trended lower and stock prices forged ahead despite high valuations on the back of a multi-year bull market. Geopolitical tensions intensified in Ukraine and the Middle East and oil prices became highly volatile in the middle of the summer, stoking worries about economic growth outside the United States. As the U.S. economy continued to show steady improvement, the stronger data caused concern among investors that the Fed would raise short-term rates sooner than previously anticipated. The U.S. dollar appreciated and global credit markets tightened, ultimately putting a strain on investor flows, and financial markets broadly weakened in the third quarter.
U.S. economic growth picked up considerably in the fourth quarter while the broader global economy showed signs of slowing. U.S. markets significantly outperformed international markets even as the European Central Bank (“ECB”) and the Bank of Japan eased monetary policy, which drove further strengthening in the U.S. dollar. Oil prices plummeted in the fourth quarter due to a global supply-and-demand imbalance, sparking a selloff in energy-related assets and stress in emerging markets. Fixed income investors piled into U.S. Treasuries as their persistently low yields became relatively attractive as compared to international sovereign debt.
Equity markets reversed in the first quarter of 2015 and U.S. stocks underperformed international markets, notably Europe and Japan, but also emerging markets. Investors had held high expectations for the U.S. economy, but after a harsh winter, first-quarter data disappointed and high valuations took their toll on U.S. stocks. Meanwhile, economic reports in Europe and Asia easily beat investors’ very low expectations for those economies, and accommodative policies from global central banks helped international equities rebound. The ECB’s asset purchase program (announced in January and commenced in March) was the largest in scale and effect on the markets. Overall, market volatility decreased in the first quarter as global risks abated, with a ceasefire in Ukraine and an improving outlook for Greece’s continued membership in the Eurozone.
At BlackRock, we believe investors need to think globally, extend their scope across a broad array of asset classes and be prepared to move freely as market conditions change over time. We encourage you to talk with your financial advisor and visit blackrock.com for further insight about investing in today’s markets.
Sincerely,

Rob Kapito
President, BlackRock Advisors, LLC

Rob Kapito
President, BlackRock Advisors, LLC
| | | | |
| Total Returns as of March 31, 2015 |
| | | 6-month | | 12-month |
U.S. large cap equities
(S&P 500® Index) | | 5.93% | | 12.73% |
U.S. small cap equities
(Russell 2000® Index) | | 14.46 | | 8.21 |
International equities
(MSCI Europe, Australasia,
Far East Index) | | 1.13 | | (0.92) |
Emerging market equities
(MSCI Emerging Markets
Index) | | (2.37) | | 0.44 |
3-month Treasury bill
(BofA Merrill Lynch
3-Month U.S. Treasury
Bill Index) | | 0.01 | | 0.03 |
U.S. Treasury securities
(BofA Merrill Lynch
10-Year U.S. Treasury
Index) | | 6.25 | | 9.88 |
U.S. investment grade
bonds (Barclays U.S.
Aggregate Bond Index) | | 3.43 | | 5.72 |
Tax-exempt municipal
bonds (S&P Municipal
Bond Index) | | 2.29 | | 6.60 |
U.S. high yield bonds
(Barclays U.S. Corporate
High Yield 2% Issuer
Capped Index) | | 1.50 | | 2.00 |
|
| Past performance is no guarantee of future results. Index performance is shown for illustrative purposes only. You cannot invest directly in an index. |
| | | | | | |
| | | THIS PAGE NOT PART OF YOUR FUND REPORT | | | | 3 |
| | | | |
Fund Summary as of March 31, 2015 | | | BlackRock Global Opportunities Portfolio | |
BlackRock Global Opportunities Portfolio’s (the “Fund”) investment objective is to provide long-term capital appreciation.
|
| Portfolio Management Commentary |
How did the Fund perform?
| Ÿ | | For the six-month period ended March 31, 2015, the Fund outperformed the benchmark, the MSCI All Country World Index (“ACWI”). |
What factors influenced performance?
| Ÿ | | Stock selection in the financials and industrials sectors were the primary positive contributors to relative performance. Within the financials sector, selection in the asset management & custody banks sub-industry was a notable contributor as shares of WisdomTree Investments, Inc. traded higher following a report that the firm’s assets under management had surpassed the $50 billion mark. Within industrials, shares of American Airlines Group, Inc. rallied after the stock was added to the S&P 500 Index. The company has also benefited along with other airlines from lower input costs caused by declining energy prices. |
| Ÿ | | Stock selection decisions in the energy sector pared back some of the relative gains. Within the oil & gas exploration & production sub-industry, shares of Lekoil Ltd. fell as the price of oil continued its downward trend. Also detracting from relative performance was selection in the information technology (“IT”) sector, as shares of LendingClub Corp. gradually fell over the period after posting strong short-term gains following its initial public offering. |
Describe recent portfolio activity.
| Ÿ | | During the six-month period, the Fund increased its exposure to the IT, telecommunication services and consumer staples sectors, while reducing exposure to the energy, financials and industrials sectors. In regional terms, these shifts resulted in increased overweight exposures to emerging Asia and developed Europe, while reducing exposure to emerging Americas and Japan. |
Describe portfolio positioning at period end.
| Ÿ | | Relative to the MSCI ACWI, the Fund ended the period overweight developed Europe and underweight both developed Americas and Asia. From a sector perspective, the Fund was most notably overweight in the IT and health care sectors, while its biggest underweights were to the materials and the consumer staples sectors. |
The views expressed reflect the opinions of BlackRock as of the date of this report and are subject to change based on changes in market, economic or other conditions. These views are not intended to be a forecast of future events and are no guarantee of future results.
| | | | |
| Ten Largest Holdings | | Percent of
Long-Term Investments | |
Apple Inc. | | | 2% | |
Citigroup, Inc. | | | 2 | |
Royal Dutch Shell PLC, A Shares - ADR | | | 2 | |
The Hartford Financial Services Group, Inc. | | | 1 | |
AIA Group Ltd. | | | 1 | |
Roper Industries, Inc. | | | 1 | |
The Hain Celestial Group, Inc. | | | 1 | |
Actavis PLC | | | 1 | |
Kennedy-Wilson Holdings, Inc. | | | 1 | |
BankUnited, Inc. | | | 1 | |
| | | | |
| Geographic Allocation | | Percent of
Long-Term Investments | |
United States | | | 53% | |
United Kingdom | | | 10 | |
Japan | | | 5 | |
France | | | 4 | |
Germany | | | 3 | |
Switzerland | | | 3 | |
China | | | 3 | |
India | | | 2 | |
Netherlands | | | 2 | |
Ireland | | | 2 | |
South Korea | | | 2 | |
Other1 | | | 11 | |
| | 1 | | Includes holdings within countries that are 1% or less of long-term investments. |
| | | | Please refer to the Schedule of Investments for such countries. |
| | | | | | |
| 4 | | BLACKROCK FUNDS | | MARCH 31, 2015 | | |
| | | | |
| | | | BlackRock Global Opportunities Portfolio | |
|
| Total Return Based on a $10,000 Investment |
| | 1 | Assuming maximum sales charges, if any, transaction costs and other operating expenses, including investment advisory fees and administration fees, if any. Institutional Shares do not have a sales charge. |
| | 2 | Under normal market conditions, the Fund will invest at least 75% of its total assets in global equity securities of any market capitalization, selected for their above-average return potential. The Fund may invest up to 25% of its total assets in stocks of issuers in emerging market countries. The Fund may also invest up to 25% of its total assets in global fixed-income securities, including corporate bonds, U.S. government debt securities, non-U.S. government and supranational debt securities, asset-backed securities, mortgage-backed securities, emerging market debt securities and non-investment grade debt securities (high yield or junk bonds). |
| | 3 | A free float-adjusted market capitalization weighted index that is designed to measure the equity market performance of developed and emerging markets. The MSCI ACWI consists of 46 country indexes comprising 23 developed and 23 emerging market country indexes. |
| | 4 | Commencement of operations. |
| | | | | | | | | | | | | | |
| Performance Summary for the Period Ended March 31, 2015 |
| | | | | Average Annual Total Returns5 |
| | | | | 1 Year | | 5 Years | | Since Inception6 |
| | | 6-Month
Total Returns | | w/o sales
charge | | w/sales
charge | | w/o sales
charge | | w/sales
charge | | w/o sales
charge | | w/sales
charge |
Institutional | | 4.77% | | 1.76% | | N/A | | 7.59% | | N/A | | 5.53% | | N/A |
Investor A | | 4.63 | | 1.53 | | (3.81)% | | 7.29 | | 6.14% | | 5.24 | | 4.62% |
Investor B | | 4.12 | | 0.64 | | (3.86) | | 6.37 | | 6.06 | | 4.55 | | 4.55 |
Investor C | | 4.19 | | 0.77 | | (0.24) | | 6.39 | | 6.39 | | 4.44 | | 4.44 |
Class R | | 4.47 | | 1.21 | | N/A | | 6.91 | | N/A | | 4.85 | | N/A |
MSCI ACWI | | 2.73 | | 5.42 | | N/A | | 8.99 | | N/A | | 5.18 | | N/A |
| | 5 | | Assuming maximum sales charges, if any. Average annual total returns with and without sales charges reflect reductions for distribution and service fees. See “About Fund Performance” on page 14 for a detailed description of share classes, including any related sales charges and fees. |
| | 6 | | The Fund commenced operations on January 31, 2006. |
| | | | N/A - Not applicable as share class and index do not have a sales charge. |
| | | | Past performance is not indicative of future results. |
| | | | | | | | | | | | | | |
| Expense Example |
| | | |
| | | Actual | | Hypothetical8 | | |
| | | Beginning Account Value
October 1, 2014 | | Ending Account Value
March 31, 2015 | | Expenses Paid
During the Period7 | | Beginning Account Value
October 1, 2014 | | Ending Account Value
March 31, 2015 | | Expenses Paid
During the Period7 | | Annualized Expense Ratio |
Institutional | | $1,000.00 | | $1,047.70 | | $ 5.41 | | $1,000.00 | | $1,019.65 | | $ 5.34 | | 1.06% |
Investor A | | $1,000.00 | | $1,046.30 | | $ 6.79 | | $1,000.00 | | $1,018.30 | | $ 6.69 | | 1.33% |
Investor B | | $1,000.00 | | $1,041.20 | | $11.09 | | $1,000.00 | | $1,014.06 | | $10.95 | | 2.18% |
Investor C | | $1,000.00 | | $1,041.90 | | $10.89 | | $1,000.00 | | $1,014.26 | | $10.75 | | 2.14% |
Class R | | $1,000.00 | | $1,044.70 | | $ 8.77 | | $1,000.00 | | $1,016.36 | | $ 8.65 | | 1.72% |
| | 7 | | For each class of the Fund, expenses are equal to the annualized expense ratio for the class, multiplied by the average account value over the period, multiplied by 182/ 365 (to reflect the one-half year period shown). |
| | 8 | | Hypothetical 5% annual return before expenses is calculated by prorating the number of days in the most recent fiscal half year divided by 365. |
| | | | See “Disclosure of Expenses” on page 15 for further information on how expenses were calculated. |
| | | | | | |
| | | BLACKROCK FUNDS | | MARCH 31, 2015 | | 5 |
| | | | |
Fund Summary as of March 31, 2015 | | | BlackRock Health Sciences Opportunities Portfolio | |
BlackRock Health Sciences Opportunities Portfolio’s (the “Fund”) investment objective is to provide long-term growth of capital.
|
| Portfolio Management Commentary |
How did the Fund perform?
| Ÿ | | For the six-month period ended March 31, 2015, the Fund outperformed its benchmark, the Russell 3000® Health Care Index, as well as the broad-market S&P 500® Index. The following discussion of relative performance pertains to the Russell 3000® Health Care Index. |
What factors influenced performance?
| Ÿ | | Stock selection in the biotechnology and pharmaceutical industries made the strongest contribution to performance during the semi-annual period. Positioning in the medical equipment and supplies industry also marginally aided relative performance. |
| Ÿ | | In biotechnology, the Fund’s underweight position in Gilead Sciences, Inc., combined with overweight allocations in several holdings that appreciated following positive clinical developments added significant value. Notable holdings that benefited performance included Receptos, Inc., BioMarin Pharmaceutical, Inc., Alkermes PLC, Neurocrine Biosciences, Inc., Incyte Corp., Kite Pharma, Inc. and Spark Therapeutics, Inc. |
| Ÿ | | Within the pharmaceutical sub-sector, Eisai Co. Ltd. and Intra-Cellular Therapies, Inc. also rallied due to positive clinical developments. In addition, the Fund was underweight in several large benchmark components that lagged, such as Johnson & Johnson and Merck & Co., Inc. The Fund’s positions in several specialty pharmaceutical companies also aided relative performance. |
| Ÿ | | Given the Fund’s strong outperformance, there were only a handful of detractors during the period. An underweight allocation in the managed health care and health care services industries detracted from relative performance. Out-of-benchmark positions in several lagging non-U.S. pharmaceutical stocks such as Shire PLC, Roche Holding AG, AstraZeneca PLC, Bayer AG and Novartis AG were notable detractors. |
Describe recent portfolio activity.
| Ÿ | | During the fourth quarter of 2014, the Fund increased its weighting in biotechnology and made a corresponding reduction in the pharmaceutical industry. Other industry weightings remained unchanged in aggregate. The weighting in biotechnology and pharmaceuticals remained consistent during the first quarter of 2015, and the Fund slightly increased its position in health care providers and services. |
Describe portfolio positioning at period end.
| Ÿ | | The Fund continues to focus on innovative companies. The Fund’s largest industry allocations remain in biotechnology and pharmaceuticals, both of which are benefiting from the acceleration in new drug discovery and development, and in medical devices and supplies, where many companies are developing innovative products. Amid these broad trends, the Fund remained focused on the individual merits of each company’s respective pipeline or product opportunity, in keeping with its bottom-up, fundamental investment process. |
The views expressed reflect the opinions of BlackRock as of the date of this report and are subject to change based on changes in market, economic or other conditions. These views are not intended to be a forecast of future events and are no guarantee of future results.
| | |
| Ten Largest Holdings | | Percent of
Long-Term Investments |
Biogen Idec, Inc. | | 4% |
Celgene Corp. | | 3 |
Actavis PLC | | 3 |
UnitedHealth Group, Inc. | | 3 |
Medtronic PLC | | 3 |
Amgen, Inc. | | 3 |
Bristol-Myers Squibb Co. | | 3 |
McKesson Corp. | | 3 |
Eli Lilly & Co. | | 3 |
Alexion Pharmaceuticals, Inc. | | 2 |
| | |
| Industry Allocation | | Percent of Long-Term Investments |
Biotechnology | | 30% |
Pharmaceuticals | | 30 |
Health Care Equipment & Supplies | | 18 |
Health Care Providers & Services | | 17 |
Life Sciences Tools & Services | | 4 |
Health Care Technology | | 1 |
For Fund compliance purposes, the Fund’s industry classifications refer to any one or more of the industry sub-classifications used by one or more widely recognized market indexes or ratings group indexes, and/or as defined by the investment advisor. These definitions may not apply for purposes of this report, which may combine such industry sub-classifications for reporting ease.
| | | | | | |
| 6 | | BLACKROCK FUNDS | | MARCH 31, 2015 | | |
| | | | |
| | | | BlackRock Health Sciences Opportunities Portfolio | |
|
| Total Return Based on a $10,000 Investment |
| | 1 | Assuming maximum sales charges, if any, transaction costs and other operating expenses, including investment advisory fees and administration fees, if any. Institutional Shares do not have a sales charge. |
| | 2 | Under normal market conditions, the Fund invests at least 80% of its total assets in equity securities, primarily common stock, of companies in health sciences and related industries. |
| | 3 | An unmanaged index that covers 500 leading companies and captures approximately 80% coverage of available market capitalization. |
| | 4 | An unmanaged index that features companies involved in medical services or health care in the Russell 3000® Index, which includes the largest 3,000 U.S. companies as determined by total market capitalization. |
| | | | | | | | | | | | | | |
| Performance Summary for the Period Ended March 31, 2015 |
| | | | | Average Annual Total Returns5 |
| | | | | 1 Year | | 5 Years | | 10 Years |
| | | 6-Month
Total Returns | | w/o sales
charge | | w/sales
charge | | w/o sales
charge | | w/sales
charge | | w/o sales
charge | | w/sales charge |
Institutional | | 20.58% | | 34.88% | | N/A | | 21.37% | | N/A | | 16.74% | | N/A |
Service | | 20.42 | | 34.51 | | N/A | | 21.01 | | N/A | | 16.40 | | N/A |
Investor A | | 20.44 | | 34.53 | | 27.47% | | 21.02 | | 19.72% | | 16.39 | | 15.76% |
Investor B | | 19.93 | | 33.47 | | 28.97 | | 20.07 | | 19.88 | | 15.65 | | 15.65 |
Investor C | | 20.00 | | 33.58 | | 32.58 | | 20.15 | | 20.15 | | 15.54 | | 15.54 |
Class R | | 20.25 | | 34.13 | | N/A | | 20.56 | | N/A | | 15.89 | | N/A |
S&P 500® Index | | 5.93 | | 12.73 | | N/A | | 14.47 | | N/A | | 8.01 | | N/A |
Russell 3000® Health Care Index | | 17.05 | | 27.77 | | N/A | | 20.91 | | N/A | | 11.97 | | N/A |
| | 5 | | Assuming maximum sales charges, if any. Average annual total returns with and without sales charges reflect reductions for distribution and service fees. See “About Fund Performance” on page 14 for a detailed description of share classes, including any related sales charges and fees. |
| | | | N/A - Not applicable as share class and index do not have a sales charge. |
| | | | Past performance is not indicative of future results. |
| | | | | | | | | | | | | | |
| Expense Example |
| | | Actual | | Hypothetical7 | | |
| | | Beginning Account Value
October 1, 2014 | | Ending Account Value
March 31, 2015 | | Expenses Paid
During the Period6 | | Beginning Account Value
October 1, 2014 | | Ending Account Value
March 31 2015 | | Expenses Paid
During the Period6 | | Annualized Expense Ratio |
Institutional | | $1,000.00 | | $1,205.80 | | $ 4.73 | | $1,000.00 | | $1,020.64 | | $4.33 | | 0.86% |
Service | | $1,000.00 | | $1,204.20 | | $ 6.32 | | $1,000.00 | | $1,019.20 | | $5.79 | | 1.15% |
Investor A | | $1,000.00 | | $1,204.40 | | $ 6.27 | | $1,000.00 | | $1,019.25 | | $5.74 | | 1.14% |
Investor B | | $1,000.00 | | $1,199.30 | | $10.86 | | $1,000.00 | | $1,015.06 | | $9.95 | | 1.98% |
Investor C | | $1,000.00 | | $1,200.00 | | $10.20 | | $1,000.00 | | $1,015.66 | | $9.35 | | 1.86% |
Class R | | $1,000.00 | | $1,202.50 | | $ 7.85 | | $1,000.00 | | $1,017.80 | | $7.19 | | 1.43% |
| | 6 | | For each class of the Fund, expenses are equal to the annualized expense ratio for the class, multiplied by the average account value over the period, multiplied by 182/ 365 (to reflect the one-half year period shown). |
| | 7 | | Hypothetical 5% annual return before expenses is calculated by prorating the number of days in the most recent fiscal half year divided by 365. |
| | | | See “Disclosure of Expenses” on page 15 for further information on how expenses were calculated. |
| | | | | | |
| | | BLACKROCK FUNDS | | MARCH 31, 2015 | | 7 |
| | |
| Fund Summary as of March 31, 2015 | | BlackRock International Opportunities Portfolio |
BlackRock International Opportunities Portfolio’s (the “Fund”) investment objective is to seek long-term capital appreciation.
|
| Portfolio Management Commentary |
How did the Fund perform?
| Ÿ | | For the six-month period ended March 31, 2015, the Fund outperformed its benchmark, the MSCI All Country World Index (“ACWI”) Ex-U.S. |
What factors influenced performance?
| Ÿ | | A positive contributor to relative performance was stock selection within the industrial machinery industry of the industrials sector, led by a position in FANUC Corp. Shares of the company traded higher after its announcement that it was initiating an investor relations department, a milestone for a Japanese company. Also, contributing to performance was selection within the airlines industry in industrials, after shares of Ryanair Holdings PLC rallied following a positive earnings reversion, an analyst upgrade and a decline in fuel prices. |
| Ÿ | | Detracting from performance was stock selection within the oil & gas exploration & production industry in the energy sector, led by shares of Lekoil Ltd., which fell as the price of oil continued its downward trend. |
Describe recent portfolio activity.
| Ÿ | | During the six-month period, the Fund increased its exposure to the information technology, consumer discretionary and financials sectors, while reducing exposure to the energy, industrials and materials sectors. Regionally, these trades resulted in increased exposures to developed Europe and emerging Asia, while reducing exposure to Japan. |
| Ÿ | | During the time period, derivatives were used in the form of forward currency transactions to hedge currency exposure of holdings back to the exposure of the benchmark, with minimal impact on performance. |
Describe portfolio positioning at period end.
| Ÿ | | Relative to the MSCI ACWI Ex-U.S., the Fund ended the period with overweight positions in developed Europe and the emerging Americas and an underweight position in Asia. On a sector basis, the Fund was most notably overweight in health care and consumer discretionary, while the most significant underweights were in materials and financials. |
The views expressed reflect the opinions of BlackRock as of the date of this report and are subject to change based on changes in market, economic or other conditions. These views are not intended to be a forecast of future events and are no guarantee of future results.
| | |
| Ten Largest Holdings | | Percent of Long-Term Investments |
| | |
Novartis AG, Registered Shares | | 3% |
Roche Holding AG | | 3 |
AstraZeneca PLC | | 3 |
Teva Pharmaceutical Industries Ltd. - ADR | | 2 |
Liberty Global PLC, Series A | | 2 |
Royal Dutch Shell PLC, A Shares | | 2 |
Shire PLC - ADR | | 2 |
Imperial Tobacco Group PLC | | 2 |
AXA SA | | 2 |
Element Financial Corp. | | 2 |
| | |
| Geographic Allocation | | Percent of Long-Term Investments |
| | |
United Kingdom | | 21% |
Switzerland | | 9 |
Japan | | 9 |
France | | 6 |
China | | 6 |
Ireland | | 6 |
Germany | | 6 |
Netherlands | | 5 |
India | | 4 |
Canada | | 4 |
South Korea | | 3 |
Italy | | 3 |
Israel | | 2 |
United States | | 2 |
Hong Kong | | 2 |
Belgium | | 2 |
Spain | | 2 |
Other1 | | 8 |
| | 1 | | Includes holdings within countries that are 1% or less of long-term investments. |
| | | | Please refer to the Schedule of Investments for such countries. |
| | | | | | |
| 8 | | BLACKROCK FUNDS | | MARCH 31, 2015 | | |
| | | | |
| | | | BlackRock International Opportunities Portfolio | |
|
| Total Return Based on a $10,000 Investment |
| | 1 | Assuming maximum sales charges, if any, transaction costs and other operating expenses, including investment advisory fees and administration fees, if any. Institutional Shares do not have a sales charge. |
| | 2 | Under normal market conditions, the Fund invests at least 80% of its net assets in equity securities issued by foreign companies of any market capitalization. The Fund may invest up to 40% of its net assets in stocks of issuers in emerging market countries. |
| | 3 | A free float-adjusted market capitalization weighted index designed to measure the combined equity market performance of developed and emerging market countries, excluding the United States. |
| | | | | | | | | | | | | | |
| Performance Summary for the Period Ended March 31, 2015 |
| | |
| | | | | Average Annual Total Returns4 |
| | | | | 1 Year | | 5 Years | | 10 Years |
| | | 6-Month
Total Returns | | w/o sales
charge | | w/sales
charge | | w/o sales
charge | | w/sales
charge | | w/o sales
charge | | w/sales
charge |
Institutional | | 1.50% | | (5.34)% | | N/A | | 5.22% | | N/A | | 7.40% | | N/A |
Service | | 1.38 | | (5.59) | | N/A | | 4.81 | | N/A | | 7.02 | | N/A |
Investor A | | 1.35 | | (5.64) | | (10.59)% | | 4.92 | | 3.79% | | 7.08 | | 6.50% |
Investor B | | 0.91 | | (6.38) | | (10.04) | | 4.06 | | 3.72 | | 6.40 | | 6.40 |
Investor C | | 0.99 | | (6.33) | | (7.13) | | 4.13 | | 4.13 | | 6.27 | | 6.27 |
MSCI ACWI Ex-U.S. | | (0.51) | | (1.01) | | N/A | | 4.82 | | N/A | | 5.46 | | N/A |
| | 4 | | Assuming maximum sales charges, if any. Average annual total returns with and without sales charges reflect reductions for distribution and service fees. See “About Fund Performance” on page 14 for a detailed description of share classes, including any related sales charges and fees. |
| | | | N/A - Not applicable as share class and index do not have a sales charge. |
| | | | Past performance is not indicative of future results. |
| | | | | | | | | | | | | | |
| Expense Example |
| | | |
| | | Actual | | Hypothetical6 | | |
| | | Beginning Account Value
October 1, 2014 | | Ending Account Value
March 31, 2015 | | Expenses Paid
During the Period5 | | Beginning Account Value
October 1, 2014 | | Ending Account Value
March 31, 2015 | | Expenses Paid
During the Period5 | | Annualized Expense Ratio |
Institutional | | $1,000.00 | | $1,015.00 | | $ 5.98 | | $1,000.00 | | $1,019.00 | | $ 5.99 | | 1.19% |
Service | | $1,000.00 | | $1,013.80 | | $ 7.33 | | $1,000.00 | | $1,017.65 | | $ 7.34 | | 1.46% |
Investor A | | $1,000.00 | | $1,013.50 | | $ 7.58 | | $1,000.00 | | $1,017.40 | | $ 7.59 | | 1.51% |
Investor B | | $1,000.00 | | $1,009.10 | | $11.82 | | $1,000.00 | | $1,013.16 | | $11.85 | | 2.36% |
Investor C | | $1,000.00 | | $1,009.90 | | $11.22 | | $1,000.00 | | $1,013.76 | | $11.25 | | 2.24% |
| | 5 | | For each class of the Fund, expenses are equal to the annualized expense ratio for the class, multiplied by the average account value over the period, multiplied by 182/ 365 (to reflect the one-half year period shown). |
| | 6 | | Hypothetical 5% annual return before expenses is calculated by prorating the number of days in the most recent fiscal half year divided by 365. |
| | | | See “Disclosure of Expenses” on page 15 for further information on how expenses were calculated. |
| | | | | | |
| | | BLACKROCK FUNDS | | MARCH 31, 2015 | | 9 |
| | | | |
Fund Summary as of March 31, 2015 | | | BlackRock Science & Technology Opportunities Portfolio | |
BlackRock Science & Technology Opportunities Portfolio’s (the “Fund”) investment objective is to provide long-term capital appreciation.
|
| Portfolio Management Commentary |
How did the Fund perform?
| Ÿ | | For the six-month period ended March 31, 2015, the Fund outperformed its benchmark, the MSCI World Information Technology Index. |
What factors influenced performance?
| Ÿ | | Stock selection in the systems software industry was the most significant positive contributor to relative return. In particular, the Fund’s underweight position in large benchmark constituent Microsoft Corp. led contributors for the period after the company reported weaker-than-expected PC sales. In addition, selection in the IT consulting & other services industry contributed to gains, led by a position in Luxoft Holding, Inc., which saw its shares appreciate over the period based on financial results that outperformed which shares appreciated after reporting strong financial results. |
| Ÿ | | The most significant detractor from the Fund’s performance relative to the benchmark was selection in the internet software & services industry, led by a position in LendingClub Corp., as investors became concerned that the company’s growth rate was already priced into its valuation |
| | | following the initial public offering. Selection in the consumer finance industry also detracted from performance, after shares of TrustBuddy International AB traded lower following slower-than-expected revenue growth for the quarter. |
Describe recent portfolio activity.
| Ÿ | | During the six-month period, the Fund reduced its overweight exposure to software & services stocks. These proceeds were used in large part to help fund purchases within the semiconductors & semiconductor equipment and technology hardware & equipment groups. |
Describe portfolio positioning at period end.
| Ÿ | | Relative to the MSCI World Information Technology Index, the Fund ended the period with its largest overweight in the internet software & services industry. This positioning reflects a focus on areas of secular growth and emerging technology including the shift to mobile payments, e-commerce acceleration, mobile monetization, social media and cloud computing. |
The views expressed reflect the opinions of BlackRock as of the date of this report and are subject to change based on changes in market, economic or other conditions. These views are not intended to be a forecast of future events and are no guarantee of future results.
| | |
| Ten Largest Holdings | | Percent of Long-Term Investments |
| | |
Apple Inc. | | 11% |
Facebook, Inc., Class A | | 3 |
Tencent Holdings Ltd. | | 3 |
Visa, Inc., Class A | | 2 |
Google, Inc., Class A | | 2 |
Google, Inc., Class C | | 2 |
MasterCard, Inc., Class A | | 2 |
Uber Technologies, Inc., Series D | | 2 |
Samsung Electronics Co. Ltd. | | 2 |
Vipshop Holdings Ltd. - ADR | | 2 |
| | |
| Industry Allocation | | Percent of Long-Term Investments |
| | |
Internet Software & Services | | 27% |
Software | | 15 |
Technology Hardware, Storage & Peripherals | | 14 |
IT Services | | 12 |
Semiconductors & Semiconductor Equipment | | 12 |
Internet & Catalog Retail | | 6 |
Electronic Equipment, Instruments & Components | | 3 |
Media | | 2 |
Communications Equipment | | 2 |
Real Estate Investment Trusts (REITs) | | 2 |
Household Durables | | 2 |
Other1 | | 3 |
| | 1 | | Includes holdings within industries that are 1% or less of long-term investments. Please refer to the Schedule of Investments for such industries. |
| | | For Fund compliance purposes, the Fund’s industry classifications refer to any one or more of the industry sub-classifications used by one or more widely recognized market indexes or ratings group indexes, and/or as defined by the investment advisor. These definitions may not apply for purposes of this report, which may combine such industry sub-classifications for reporting ease. |
| | | | | | |
| 10 | | BLACKROCK FUNDS | | MARCH 31, 2015 | | |
| | |
| | | BlackRock Science & Technology Opportunities Portfolio |
|
| Total Return Based on a $10,000 Investment |
| | 1 | Assuming maximum sales charges, if any, transaction costs and other operating expenses, including investment advisory fees and administration fees, if any. Institutional Shares do not have a sales charge. |
| | 2 | Under normal market conditions, the Fund invests at least 80% of its net assets in equity securities issued by U.S. and non-U.S. science and technology companies in all market capitalization ranges, selected for their rapid and sustainable growth potential from the development, advancement and use of science and/or use of technology. The Fund may invest up to 25% of its net assets in emerging market countries. |
| | 3 | An index that measures the performance of the technology sector in developed equity markets. |
| | | | | | | | | | | | | | |
| Performance Summary for the Period Ended March 31, 2015 |
| | | | | Average Annual Total Returns4 |
| | | | | 1 Year | | 5 Years | | 10 Years |
| | | 6-Month
Total Returns | | w/o sales
charge | | w/sales
charge | | w/o sales
charge | | w/sales
charge | | w/o sales
charge | | w/sales
charge |
Institutional | | 12.25% | | 12.88% | | N/A | | 13.01% | | N/A | | 11.06% | | N/A |
Service | | 12.10 | | 12.67 | | N/A | | 12.78 | | N/A | | 10.74 | | N/A |
Investor A | | 12.10 | | 12.52 | | 6.61% | | 12.61 | | 11.40% | | 10.63 | | 10.04% |
Investor B | | 11.61 | | 11.61 | | 7.11 | | 11.67 | | 11.41 | | 9.89 | | 9.89 |
Investor C | | 11.55 | | 11.56 | | 10.56 | | 11.64 | | 11.64 | | 9.67 | | 9.67 |
Class R | | 11.88 | | 12.20 | | N/A | | 12.30 | | N/A | | 10.29 | | N/A |
MSCI World Information Technology Index | | 6.26 | | 16.13 | | N/A | | 12.36 | | N/A | | 8.45 | | N/A |
| | 4 | | Assuming maximum sales charges, if any. Average annual total returns with and without sales charges reflect reductions for distribution and service fees. See “About Fund Performance” on page 14 for a detailed description of share classes, including any related sales charges and fees. |
| | | | N/A - Not applicable as share class and index do not have a sales charge. |
| | | | Past performance is not indicative of future results. |
| | | | | | | | | | | | | | |
| Expense Example |
| | | Actual | | Hypothetical6 | | |
| | | Beginning Account Value
October 1, 2014 | | Ending Account Value March 31, 2015 | | Expenses Paid
During the Period5 | | Beginning Account Value
October 1, 2014 | | Ending Account Value March 31, 2015 | | Expenses Paid During the Period5 | | Annualized Expense Ratio |
Institutional | | $1,000.00 | | $1,122.50 | | $ 6.83 | | $1,000.00 | | $1,018.50 | | $ 6.49 | | 1.29% |
Service | | $1,000.00 | | $1,121.00 | | $ 8.14 | | $1,000.00 | | $1,017.25 | | $ 7.75 | | 1.54% |
Investor A | | $1,000.00 | | $1,121.00 | | $ 8.51 | | $1,000.00 | | $1,016.90 | | $ 8.10 | | 1.61% |
Investor B | | $1,000.00 | | $1,116.10 | | $12.77 | | $1,000.00 | | $1,012.86 | | $12.14 | | 2.42% |
Investor C | | $1,000.00 | | $1,115.60 | | $12.92 | | $1,000.00 | | $1,012.72 | | $12.29 | | 2.45% |
Class R | | $1,000.00 | | $1,118.80 | | $ 9.98 | | $1,000.00 | | $1,015.51 | | $ 9.50 | | 1.89% |
| | 5 | | For each class of the Fund, expenses are equal to the annualized expense ratio for the class, multiplied by the average account value over the period, multiplied by 182/ 365 (to reflect the one-half year period shown). |
| | 6 | | Hypothetical 5% annual return before expenses is calculated by prorating the number of days in the most recent fiscal half year divided by 365. |
| | | | See “Disclosure of Expenses” on page 15 for further information on how expenses were calculated. |
| | | | | | |
| | | BLACKROCK FUNDS | | MARCH 31, 2015 | | 11 |
| | | | |
Fund Summary as of March 31, 2015 | | | BlackRock U.S. Opportunities Portfolio | |
BlackRock U.S. Opportunities Portfolio’s (the “Fund”) investment objective is to provide long-term capital appreciation.
|
| Portfolio Management Commentary |
How did the Fund perform?
| Ÿ | | For the six-month period ended March 31, 2015, the Fund outperformed the benchmark, the Russell Midcap® Index. |
What factors influenced performance?
| Ÿ | | Stock selection within the industrials and health care sectors were the largest contributors to relative performance for the period. In industrials, performance was led by positioning in the airlines industry. In particular, shares of JetBlue Airways Corp. benefited as the company announced new cost cutting plans. Within health care, stock selection in the biotechnology segment had a positive impact on performance, led by a position in BioMarin Pharmaceutical, Inc., whose shares were bolstered by the continued positive expectations for favorable clinical data related to its drug pipeline. |
| Ÿ | | Conversely, stock selection within the oil & gas equipment & services industry of the energy sector detracted from relative performance. In particular, a position in U.S. Silica Holdings, Inc. was negatively impacted |
| | by OPEC’s decision to maintain its current production levels, sending oil prices substantially lower over the period. Within the consumer discretionary sector, holdings in the apparel, accessories & luxury goods industry also detracted, after shares of Sequential Brands Group, Inc. traded lower as investors took profits following the stock’s significant outperformance in 2014. |
Describe recent portfolio activity.
| Ÿ | | During the six-month period, the Fund increased its exposures to the information technology (“IT”), financials, and materials sectors, while reducing exposures to energy, consumer discretionary, and consumer staples. |
Describe portfolio positioning at period end.
| Ÿ | | Relative to the Russell Midcap® Index, the Fund ended the period with overweight positions in the IT, health care and materials sectors, while maintaining underweight allocations to the utilities, industrials and consumer staples sectors. |
The views expressed reflect the opinions of BlackRock as of the date of this report and are subject to change based on changes in market, economic or other conditions. These views are not intended to be a forecast of future events and are no guarantee of future results.
| | |
| Ten Largest Holdings | | Percent of
Long-Term Investments |
| | |
Jarden Corp. | | 2% |
Sequential Brands Group, Inc. | | 2 |
BankUnited, Inc. | | 1 |
The Hartford Financial Services Group, Inc. | | 1 |
Crown Holdings, Inc. | | 1 |
Snap-on, Inc. | | 1 |
Regions Financial Corp. | | 1 |
Mallinckrodt PLC | | 1 |
Roper Industries, Inc. | | 1 |
Kennedy-Wilson Holdings, Inc. | | 1 |
| | |
| Sector Allocation | | Percent of
Long-Term Investments |
| | |
Financials | | 20% |
Information Technology | | 18 |
Consumer Discretionary | | 17 |
Health Care | | 15 |
Industrials | | 11 |
Materials | | 7 |
Consumer Staples | | 5 |
Energy | | 4 |
Utilities | | 2 |
Telecommunication Services | | 1 |
For Fund compliance purposes, the Fund’s sector classifications refer to any one or more of the sector sub-classifications used by one or more widely recognized market indexes or ratings group indexes, and/or as defined by the investment advisor. These definitions may not apply for purposes of this report, which may combine such sector sub-classifications for reporting ease.
| | | | | | |
| 12 | | BLACKROCK FUNDS | | MARCH 31, 2015 | | |
| | | | |
| | | | BlackRock U.S. Opportunities Portfolio | |
|
| Total Return Based on a $10,000 Investment |

| | 1 | Assuming maximum sales charges, if any, transaction costs and other operating expenses, including investment advisory fees and administration fees, if any. Institutional Shares do not have a sales charge. |
| | 2 | Under normal market conditions, the Fund invests at least 80% of its net assets in equity securities issued by U.S. emerging capitalization companies with relatively attractive earnings growth potential and valuation. |
| | 3 | A market index measures the performance of the mid-cap segment of the U.S. equities universe. It is a subset of the Russell 1000® Index including approximately 800 of the smallest securities based on a combination of their market cap and current index membership. The Russell Midcap® Index represents approximately 31% of the total market capitalization of the Russell 1000® companies. |
| | | | | | | | | | |
| Performance Summary for the Period Ended March 31, 2015 |
| | | | | | | | | | | | | | |
| | | | | Average Annual Total Returns4 |
| | | | | 1 Year | | 5 Years | | 10 Years |
| | | 6-Month
Total Returns | | w/o sales
charge | | w/sales
charge | | w/o sales
charge | | w/sales
charge | | w/o sales
charge | | w/sales
charge |
Institutional | | 12.16% | | 15.58% | | N/A | | 14.40% | | N/A | | 12.11% | | N/A |
Service | | 11.93 | | 15.11 | | N/A | | 13.90 | | N/A | | 11.63 | | N/A |
Investor A | | 11.93 | | 15.10 | | 9.06% | | 13.88 | | 12.66% | | 11.59 | | 10.99% |
Investor B | | 11.50 | | 14.22 | | 9.91 | | 12.99 | | 12.74 | | 10.92 | | 10.92 |
Investor C | | 11.51 | | 14.27 | | 13.31 | | 13.04 | | 13.04 | | 10.77 | | 10.77 |
Russell Midcap® Index | | 10.13 | | 13.68 | | N/A | | 16.16 | | N/A | | 10.02 | | N/A |
| | 4 | | Assuming maximum sales charges, if any. Average annual total returns with and without sales charges reflect reductions for distribution and service fees. See “About Fund Performance” on page 14 for a detailed description of share classes, including any related sales charges and fees. |
| | | | N/A - Not applicable as share class and index do not have a sales charge. |
| | | | Past performance is not indicative of future results. |
| | | | | | | | | | | | | | |
| Expense Example |
| | | |
| | | Actual | | Hypothetical6 | | |
| | | Beginning
Account Value
October 1, 2014 | | Ending
Account Value
March 31, 2015 | | Expenses Paid
During the Period5 | | Beginning
Account Value
October 1, 2014 | | Ending
Account Value
March 31, 2015 | | Expenses Paid
During the Period5 | | Annualized Expense
Ratio |
Institutional | | $1,000.00 | | $1,121.60 | | $ 4.81 | | $1,000.00 | | $1,020.39 | | $ 4.58 | | 0.91% |
Service | | $1,000.00 | | $1,119.30 | | $ 6.92 | | $1,000.00 | | $1,018.40 | | $ 6.59 | | 1.31% |
Investor A | | $1,000.00 | | $1,119.30 | | $ 6.92 | | $1,000.00 | | $1,018.40 | | $ 6.59 | | 1.31% |
Investor B | | $1,000.00 | | $1,115.00 | | $11.07 | | $1,000.00 | | $1,014.46 | | $10.55 | | 2.10% |
Investor C | | $1,000.00 | | $1,115.10 | | $10.92 | | $1,000.00 | | $1,014.61 | | $10.40 | | 2.07% |
| | 5 | | For each class of the Fund, expenses are equal to the annualized expense ratio for the class, multiplied by the average account value over the period, multiplied by 182/ 365 (to reflect the one-half year period shown). |
| | 6 | | Hypothetical 5% annual return before expenses is calculated by prorating the number of days in the most recent fiscal half year divided by 365. |
| | | | See “Disclosure of Expenses” on page 15 for further information on how expenses were calculated. |
| | | | | | |
| | | BLACKROCK FUNDS | | MARCH 31, 2015 | | 13 |
| Ÿ | | Institutional Shares are not subject to any sales charge. These shares bear no ongoing distribution or service fees and are available only to certain eligible investors. |
| Ÿ | | Service Shares are not subject to any sales charge. These shares are subject to a service fee of 0.25% per year (but no distribution fee) and are only available to certain eligible investors. |
| Ÿ | | Investor A Shares are subject to a maximum initial sales charge (front-end load) of 5.25% and a service fee of 0.25% per year (but no distribution fee). Certain redemptions of these shares may be subject to a contingent deferred sales charge (“CDSC”) where no initial sales charge was paid at the time of purchase. These shares are generally available through financial intermediaries. |
| Ÿ | | Investor B Shares are subject to a maximum CDSC of 4.50%, declining to 0% after six years. In addition, these shares are subject to a distribution fee of 0.75% per year and a service fee of 0.25% per year. These shares automatically convert to Investor A Shares after approximately eight years. (There is no initial sales charge for automatic share conversions.) On February 11, 2015, the Board of Trustees of the Trust (the “Board”) approved the conversion of all of the issued and outstanding Investor B Shares of BlackRock Global Opportunities Portfolio and BlackRock Science & Technology Opportunities Portfolio into Investor A Shares of each respective Fund, which will be effective on or about the close of business on June 23, 2015. All returns for periods greater than eight years reflect this conversion. These shares are only available through exchanges and distribution reinvestments by current holders and for purchase by certain employer-sponsored retirement plans. |
| Ÿ | | Investor C Shares are subject to a 1.00% CDSC if redeemed within one year of purchase. In addition, these shares are subject to a distribution fee of 0.75% per year and a service fee of 0.25% per year. These shares are generally available through financial intermediaries |
| Ÿ | | Class R Shares are not subject to any sales charge. These shares are subject to a distribution fee of 0.25% per year and a service fee of |
0.25% per year. These shares are available only to certain employer-sponsored retirement plans. Prior to September 8, 2008, the performance results of Class R Shares of BlackRock Science & Technology Opportunities Portfolio are those of Institutional Shares (which have no distribution or service fees) restated to reflect Class R Share fees. Prior to September 12, 2011, the performance results of Class R Shares of BlackRock Global Opportunities Portfolio and Health Sciences Opportunities are those of the applicable Fund’s Institutional Shares (which have no distribution or service fees) restated to reflect Class R Share fees.
Performance information reflects past performance and does not guarantee future results. Current performance may be lower or higher than the performance data quoted. Refer to www.blackrock.com/funds to obtain performance data current to the most recent month-end. Performance results do not reflect the deduction of taxes that a shareholder would pay on fund distributions or the redemption of fund shares. Figures shown in the performance tables on the previous pages assume reinvestment of all distributions, if any, at net asset value (“NAV”) on the ex-dividend date. Investment return and principal value of shares will fluctuate so that shares, when redeemed, may be worth more or less than their original cost. Distributions paid to each class of shares will vary because of the different levels of service, distribution and transfer agency fees applicable to each class, which are deducted from the income available to be paid to shareholders.
BlackRock Advisors, LLC (the “Manager”), the Funds’ investment advisor, has contractually agreed to waive and/or reimburse a portion of certain Funds’ expenses. Without such waiver and/or reimbursement, such Funds’ performance would have been lower. The Manager is under no obligation to continue waiving and/or reimbursing its fees after the applicable termination date of such agreement. See Note 5 of the Notes to Financial Statements for additional information on waivers and/or reimbursements.
| | | | | | |
| 14 | | BLACKROCK FUNDS | | MARCH 31, 2015 | | |
Shareholders of the Funds may incur the following charges: (a) transactional expenses, such as sales charges; and (b) operating expenses, including investment advisory fees, administration fees, service and distribution fees, including 12b-1 fees, acquired fund fees and expenses and other Fund expenses. The expense examples on the previous pages (which are based on a hypothetical investment of $1,000 invested on October 1, 2014 and held through March 31, 2015) are intended to assist shareholders both in calculating expenses based on an investment in each Fund and in comparing these expenses with similar costs of investing in other mutual funds.
The expense examples provide information about actual account values and actual expenses. In order to estimate the expenses a shareholder paid during the period covered by this report, shareholders can divide their account value by $1,000 and then multiply the result by the number corresponding to their Fund and share class under the headings entitled “Expenses Paid During the Period.”
The expense examples also provide information about hypothetical account values and hypothetical expenses based on a Fund’s actual expense ratio and an assumed rate of return of 5% per year before expenses. In order to assist shareholders in comparing the ongoing expenses of investing in these Funds and other funds, compare the 5% hypothetical examples with the 5% hypothetical examples that appear in shareholder reports of other funds.
The expenses shown in the expense examples are intended to highlight shareholders’ ongoing costs only and do not reflect any transactional expenses, such as sales charges, if any. Therefore, the hypothetical examples are useful in comparing ongoing expenses only, and will not help shareholders determine the relative total expenses of owning different funds. If these transactional expenses were included, shareholder expenses would have been higher.
|
Derivative Financial Instruments |
The Funds may invest in various derivative financial instruments. Derivative financial instruments are used to obtain exposure to a security, index and/or market without owning or taking physical custody of securities or to manage equity, credit, interest rate, foreign currency exchange rate, commodity and/or other risks. Derivative financial instruments may give rise to a form of economic leverage. Derivative financial instruments also involve risks, including the imperfect correlation between the value of a derivative financial instrument and the underlying asset, possible default of the counterparty to the transaction or illiquidity of the derivative financial
instrument. The Funds’ ability to use a derivative financial instrument successfully depends on the investment advisor’s ability to predict pertinent market movements accurately, which cannot be assured. The use of derivative financial instruments may result in losses greater than if they had not been used, may limit the amount of appreciation a Fund can realize on an investment, and/or may result in lower distributions paid to shareholders. The Funds’ investments in these instruments are discussed in detail in the Notes to Financial Statements.
| | | | | | |
| | | BLACKROCK FUNDS | | MARCH 31, 2015 | | 15 |
| | | | |
Schedule of Investments March 31, 2015 (Unaudited) | | | BlackRock Global Opportunities Portfolio | |
| | | (Percentages shown are based on Net Assets) | |
| | | | | | | | |
| Common Stocks | | Shares | | | Value | |
Belgium — 1.0% | | | | | | | | |
Anheuser-Busch InBev NV | | | 26,518 | | | $ | 3,239,569 | |
Canada — 0.9% | | | | | | | | |
Enbridge, Inc. | | | 34,900 | | | | 1,682,243 | |
MEG Energy Corp. (a) | | | 75,500 | | | | 1,219,636 | |
| | | | | | | | |
| | | | | | | | 2,901,879 | |
China — 2.6% | | | | | | | | |
Alibaba Group Holding Ltd. - ADR (a) | | | 27,500 | | | | 2,289,100 | |
Baidu, Inc. - ADR (a) | | | 12,600 | | | | 2,625,840 | |
Beijing Enterprises Water Group Ltd. | | | 2,696,000 | | | | 1,833,293 | |
China Construction Bank Corp., H Shares | | | 1,830,000 | | | | 1,518,876 | |
| | | | | | | | |
| | | | | | | | 8,267,109 | |
France — 4.2% | | | | | | | | |
AXA SA | | | 83,700 | | | | 2,106,652 | |
Schneider Electric SE | | | 36,612 | | | | 2,849,090 | |
Société Générale SA | | | 43,200 | | | | 2,085,775 | |
Unibail-Rodamco SE | | | 12,200 | | | | 3,294,428 | |
Vivendi SA | | | 112,520 | | | | 2,793,612 | |
| | | | | | | | |
| | | | | | | | 13,129,557 | |
Germany — 3.2% | | | | | | | | |
Daimler AG, Registered Shares | | | 35,400 | | | | 3,399,616 | |
Henkel AG & Co. KGaA | | | 22,228 | | | | 2,610,920 | |
Infineon Technologies AG | | | 181,133 | | | | 2,154,918 | |
Telefonica Deutschland Holding AG | | | 335,500 | | | | 1,929,261 | |
| | | | | | | | |
| | | | | | | | 10,094,715 | |
Hong Kong — 1.4% | | | | | | | | |
AIA Group Ltd. | | | 669,900 | | | | 4,205,957 | |
India — 1.9% | | | | | | | | |
Bharti Infratel Ltd. | | | 170,247 | | | | 1,047,360 | |
HDFC Bank Ltd. | | | 146,997 | | | | 2,826,747 | |
ITC Ltd. | | | 388,400 | | | | 2,019,127 | |
| | | | | | | | |
| | | | | | | | 5,893,234 | |
Indonesia — 1.0% | | | | | | | | |
Global Mediacom Tbk PT | | | 9,238,700 | | | | 1,234,710 | |
Matahari Department Store Tbk PT | | | 1,233,560 | | | | 1,855,046 | |
| | | | | | | | |
| | | | | | | | 3,089,756 | |
Ireland — 1.7% | | | | | | | | |
Green REIT PLC | | | 1,460,039 | | | | 2,568,357 | |
Shire PLC - ADR | | | 11,800 | | | | 2,823,622 | |
| | | | | | | | |
| | | | | | | | 5,391,979 | |
Italy — 1.1% | | | | | | | | |
Banca Generali SpA | | | 74,372 | | | | 2,331,965 | |
Moncler SpA | | | 58,600 | | | | 982,389 | |
| | | | | | | | |
| | | | | | | | 3,314,354 | |
| | | | | | | | |
| Common Stocks | | Shares | | | Value | |
Japan — 5.0% | | | | | | | | |
FANUC Corp. | | | 10,800 | | | $ | 2,357,789 | |
Mitsubishi Estate Co. Ltd. | | | 117,000 | | | | 2,713,460 | |
Nabtesco Corp. | | | 92,000 | | | | 2,657,809 | |
Nintendo Co. Ltd. | | | 7,400 | | | | 1,085,764 | |
Shinsei Bank Ltd. | | | 1,367,000 | | | | 2,718,059 | |
SMC Corp. | | | 6,000 | | | | 1,786,583 | |
SoftBank Corp. | | | 41,500 | | | | 2,416,937 | |
| | | | | | | | |
| | | | | | | | 15,736,401 | |
Mexico — 0.4% | | | | | | | | |
Cemex SAB de CV - ADR (a) | | | 117,360 | | | | 1,111,399 | |
Netherlands — 2.0% | | | | | | | | |
Koninklijke Philips NV | | | 49,700 | | | | 1,409,982 | |
Royal Dutch Shell PLC, A Shares - ADR | | | 83,200 | | | | 4,962,880 | |
| | | | | | | | |
| | | | | | | | 6,372,862 | |
New Zealand — 0.6% | | | | | | | | |
Xero Ltd. (Acquired 10/15/13, cost $1,616,409) (a)(b) | | | 106,300 | | | | 1,915,229 | |
Nigeria — 0.3% | | | | | | | | |
Lekoil Ltd. (a) | | | 2,787,800 | | | | 971,820 | |
Norway — 0.5% | | | | | | | | |
Statoil ASA | | | 94,600 | | | | 1,672,661 | |
Peru — 0.5% | | | | | | | | |
Credicorp Ltd. | | | 10,700 | | | | 1,504,741 | |
South Africa — 0.8% | | | | | | | | |
Naspers Ltd., N Shares | | | 16,600 | | | | 2,546,291 | |
South Korea — 1.7% | | | | | | | | |
Samsung Electronics Co. Ltd. | | | 2,400 | | | | 3,112,208 | |
SK Hynix, Inc. | | | 54,600 | | | | 2,230,226 | |
| | | | | | | | |
| | | | | | | | 5,342,434 | |
Spain — 1.3% | | | | | | | | |
NH Hotel Group SA (a) | | | 439,887 | | | | 2,401,962 | |
Sacyr SA (a) | | | 414,100 | | | | 1,737,657 | |
| | | | | | | | |
| | | | | | | | 4,139,619 | |
Sweden — 0.8% | | | | | | | | |
Nordea Bank AB | | | 207,719 | | | | 2,530,117 | |
Switzerland — 2.7% | | | | | | | | |
Novartis AG, Registered Shares | | | 36,600 | | | | 3,612,438 | |
Roche Holding AG | | | 9,140 | | | | 2,511,600 | |
UBS Group AG (a) | | | 121,272 | | | | 2,273,985 | |
| | | | | | | | |
| | | | | | | | 8,398,023 | |
Taiwan — 1.0% | | | | | | | | |
Hermes Microvision, Inc. | | | 22,117 | | | | 1,272,436 | |
| | | | | | | | | | | | |
| Portfolio Abbreviations | | |
| | | | | | |
| ADR | | American Depositary Receipts | | HKD | | Hong Kong Dollar | | REIT | | Real Estate Investment Trust | | |
| AUD | | Australian Dollar | | JPY | | Japanese Yen | | SEK | | Swedish Krona | | |
| CAD | | Canadian Dollar | | MLP | | Master Limited Partnership | | SGD | | Singapore Dollar | | |
| CHF | | Swiss Franc | | MXN | | Mexican Peso | | TRY | | Turkish Lira | | |
| DKK | | Danish Krone | | NOK | | Norwegian Krone | | USD | | U.S. Dollar | | |
| EUR | | Euro | | NZD | | New Zealand Dollar | | ZAR | | South African Rand | | |
| GBP | | British Pound | | | | | | | | | | |
See Notes to Financial Statements.
| | | | | | |
| 16 | | BLACKROCK FUNDS | | MARCH 31, 2015 | | |
| | | | |
Schedule of Investments (continued) | | | BlackRock Global Opportunities Portfolio | |
| | | (Percentages shown are based on Net Assets) | |
| | | | | | | | |
| Common Stocks | | Shares | | | Value | |
Taiwan (concluded) | | | | | | | | |
Largan Precision Co. Ltd. | | | 20,000 | | | $ | 1,719,360 | |
| | | | | | | | |
| | | | | | | | 2,991,796 | |
United Kingdom — 9.4% | | | | | | | | |
AstraZeneca PLC | | | 54,500 | | | | 3,739,689 | |
BAE Systems PLC | | | 205,500 | | | | 1,592,528 | |
BP PLC | | | 334,800 | | | | 2,170,218 | |
Crest Nicholson Holdings PLC | | | 347,510 | | | | 2,188,356 | |
Delphi Automotive PLC | | | 37,700 | | | | 3,006,198 | |
Diageo PLC | | | 87,600 | | | | 2,420,756 | |
Kennedy Wilson Europe Real Estate PLC | | | 85,758 | | | | 1,398,069 | |
Lloyds Banking Group PLC | | | 1,474,100 | | | | 1,708,677 | |
Metro Bank PLC (Acquired 1/15/14, cost
$1,748,929) (a)(b) | | | 82,275 | | | | 1,619,553 | |
Nomad Holdings Ltd. (a) | | | 167,843 | | | | 1,888,234 | |
Prudential PLC | | | 96,800 | | | | 2,402,124 | |
SABMiller PLC | | | 46,300 | | | | 2,425,265 | |
Vodafone Group PLC - ADR | | | 86,935 | | | | 2,841,036 | |
| | | | | | | | |
| | | | | | | | 29,400,703 | |
United States — 50.2% | | | | | | | | |
Abbott Laboratories | | | 71,900 | | | | 3,331,127 | |
Actavis PLC (a) | | | 13,600 | | | | 4,047,632 | |
Adobe Systems, Inc. (a) | | | 25,950 | | | | 1,918,743 | |
Altria Group, Inc. | | | 63,400 | | | | 3,171,268 | |
Amazon.com, Inc. (a) | | | 4,200 | | | | 1,562,820 | |
American Airlines Group, Inc. | | | 55,200 | | | | 2,913,456 | |
Apple Inc. | | | 58,895 | | | | 7,328,305 | |
Applied Materials, Inc. | | | 72,200 | | | | 1,628,832 | |
Aramark | | | 79,200 | | | | 2,505,096 | |
Autodesk, Inc. (a) | | | 37,300 | | | | 2,187,272 | |
BankUnited, Inc. | | | 115,488 | | | | 3,781,077 | |
Becton Dickinson & Co. | | | 12,800 | | | | 1,837,952 | |
Best Buy Co., Inc. | | | 49,917 | | | | 1,886,363 | |
Boston Scientific Corp. (a) | | | 116,200 | | | | 2,062,550 | |
Bristol-Myers Squibb Co. | | | 48,200 | | | | 3,108,900 | |
Charles River Laboratories International, Inc. (a) | | | 39,300 | | | | 3,116,097 | |
Citigroup, Inc. | | | 117,768 | | | | 6,067,407 | |
Comcast Corp., Class A | | | 64,100 | | | | 3,619,727 | |
Concho Resources, Inc. (a) | | | 18,600 | | | | 2,156,112 | |
Crown Holdings, Inc. (a) | | | 52,300 | | | | 2,825,246 | |
Discover Financial Services | | | 53,100 | | | | 2,992,185 | |
Eastman Chemical Co. | | | 29,810 | | | | 2,064,641 | |
Eli Lilly & Co. | | | 27,400 | | | | 1,990,610 | |
EOG Resources, Inc. | | | 23,900 | | | | 2,191,391 | |
Facebook, Inc., Class A (a) | | | 39,160 | | | | 3,219,539 | |
Finisar Corp. (a) | | | 73,300 | | | | 1,564,222 | |
Google, Inc., Class A (a) | | | 5,979 | | | | 3,316,551 | |
Google, Inc., Class C (a) | | | 5,979 | | | | 3,276,492 | |
The Hain Celestial Group, Inc. (a) | | | 63,612 | | | | 4,074,349 | |
The Hartford Financial Services Group, Inc. | | | 106,300 | | | | 4,445,466 | |
Hortonworks, Inc. (a)(c) | | | 23,654 | | | | 563,911 | |
Hortonworks, Inc. (Acquired 3/21/14, cost
$3,133,876) (a)(b) | | | 128,573 | | | | 2,911,921 | |
Inovalon Holdings, Inc., Class A (a) | | | 47,700 | | | | 1,441,017 | |
JDS Uniphase Corp. (a) | | | 117,100 | | | | 1,536,352 | |
Kennedy-Wilson Holdings, Inc. | | | 154,800 | | | | 4,046,472 | |
Kinder Morgan, Inc. | | | 77,100 | | | | 3,242,826 | |
Las Vegas Sands Corp. | | | 19,890 | | | | 1,094,746 | |
LendingClub Corp. (a) | | | 34,500 | | | | 677,925 | |
LendingClub Corp. (Acquired 12/12/14, cost
$1,044,221) (a)(b) | | | 102,664 | | | | 1,916,480 | |
Lowe’s Companies, Inc. | | | 36,820 | | | | 2,739,040 | |
Macquarie Infrastructure Co. LLC | | | 24,600 | | | | 2,024,334 | |
MasterCard, Inc., Class A | | | 34,300 | | | | 2,963,177 | |
Medtronic PLC | | | 24,429 | | | | 1,905,218 | |
Merck & Co., Inc. | | | 48,200 | | | | 2,770,536 | |
| | | | | | | | |
| Common Stocks | | Shares | | | Value | |
United States (concluded) | | | | | | | | |
Mondelez International, Inc., Class A | | | 96,600 | | | $ | 3,486,294 | |
New Relic, Inc. (a) | | | 13,600 | | | | 471,920 | |
New Relic, Inc. (Acquired 12/15/14, cost $2,154,165) (a)(b) | | | 76,011 | | | | 2,505,703 | |
Platform Specialty Products Corp. (a) | | | 122,100 | | | | 3,133,086 | |
Public Service Enterprise Group, Inc. | | | 59,000 | | | | 2,473,280 | |
Ralph Lauren Corp. | | | 9,900 | | | | 1,301,850 | |
Roper Industries, Inc. | | | 24,340 | | | | 4,186,480 | |
Samsonite International SA | | | 628,500 | | | | 2,184,811 | |
Sensata Technologies Holding NV (a) | | | 22,700 | | | | 1,304,115 | |
St. Jude Medical, Inc. | | | 23,200 | | | | 1,517,280 | |
Strategic Growth Bancorp (Acquired 3/10/14,cost $1,691,208) (a)(b) | | | 135,840 | | | | 1,437,187 | |
U.S. Silica Holdings, Inc. (c) | | | 39,400 | | | | 1,403,034 | |
United Parcel Service, Inc., Class B | | | 29,200 | | | | 2,830,648 | |
United Rentals, Inc. (a) | | | 12,347 | | | | 1,125,552 | |
UnitedHealth Group, Inc. | | | 16,700 | | | | 1,975,443 | |
Valeant Pharmaceuticals International, Inc. (a) | | | 15,200 | | | | 3,019,024 | |
WisdomTree Investments, Inc. | | | 128,549 | | | | 2,758,662 | |
| | | | | | | | |
| | | | | | | | 157,139,752 | |
Total Common Stocks — 96.2% | | | | | | | 301,301,957 | |
| | | | | | | | |
| Preferred Stocks | | | | | | |
India — 0.4% | | | | | | | | |
Snapdeal.com, Series F (Acquired 5/07/14, cost
$574,789) (a)(b) | | | 81 | | | | 968,000 | |
Snapdeal.com, Series G (Acquired 10/29/14, cost $227,633) (a)(b) | | | 27 | | | | 322,667 | |
| | | | | | | | |
| | | | | | | | 1,290,667 | |
United States — 1.3% | | | | | | | | |
Palantir Technologies, Inc., Series I (Acquired 2/07/14, cost $942,242) (a)(b) | | | 153,710 | | �� | | 1,366,482 | |
Uber Technologies, Inc., Series D (Acquired 6/06/14, cost $1,176,386) (a)(b) | | | 75,832 | | | | 2,576,028 | |
| | | | | | | | |
| | | | | | | | 3,942,510 | |
Total Preferred Stocks — 1.7% | | | | | | | 5,233,177 | |
| | | | | | | | |
| Warrants (d) | | | | | | |
United Kingdom — 0.0% | | | | | | | | |
Nomad Holdings Ltd. (issued 4/10/14, expiring 4/10/17, strike price $11.50) | | | 167,843 | | | | 67,976 | |
| | |
Total Warrants — 0.0% | | | | | | | 67,976 | |
Total Long-Term Investments (Cost — $258,798,269) — 97.9% | | | | | | | 306,603,110 | |
See Notes to Financial Statements.
| | | | | | |
| | | BLACKROCK FUNDS | | MARCH 31, 2015 | | 17 |
| | | | |
Schedule of Investments (continued) | | | BlackRock Global Opportunities Portfolio | |
| | | (Percentages shown are based on Net Assets) | |
| | | | | | | | |
| Short-Term Securities | | Shares | | | Value | |
BlackRock Liquidity Funds, TempFund, Institutional Class, 0.06% (e)(f) | | | 2,305,045 | | | $ | 2,305,045 | |
| | | Beneficial
Interest
(000) | | | | |
BlackRock Liquidity Series, LLC, Money Market Series, 0.22% (e)(f)(g) | | | $ 1,974 | | | | 1,974,042 | |
Total Short-Term Securities (Cost — $4,279,087) — 1.4% | | | | | | | 4,279,087 | |
| | | | |
| | | Value | |
| |
Total Investments (Cost $263,077,356) — 99.3% | | $ | 310,882,197 | |
Other Assets Less Liabilities — 0.7% | | | 2,170,407 | |
| | | | |
Net Assets — 100.0% | | $ | 313,052,604 | |
| | | | |
|
| Notes to Schedule of Investments |
| (a) | Non-income producing security. |
| (b) | Restricted security as to resale. As of report date, the Fund held restricted securities with a current value of $17,539,250 and an original cost of $14,309,858, which was 5.6% of its net assets. |
| (c) | Security, or a portion of security, is on loan. |
| (d) | Warrants entitle the Fund to purchase a predetermined number of shares of common stock and are non-income producing. The purchase price and number of shares are subject to adjustment under certain conditions until the expiration date of the warrants, if any. |
| (e) | Represents the current yield as of report date. |
| (f) | During the six months ended March 31, 2015, investments in issuers considered to be affiliates of the Fund for purposes of Section 2(a)(3) of the Investment Company Act of 1940, as amended, were as follows: |
| | | | | | | | | | | | | | | | |
| Affiliate | | Shares/
Beneficial
Interest
Held at
September 30,
2014 | | | Net
Activity | | | Shares/
Beneficial
Interest
Held at
March 31,
2015 | | | Income | |
BlackRock Liquidity Funds, TempFund, Institutional Class | | | 1,732,302 | | | | 572,743 | | | | 2,305,045 | | | $ | 1,028 | |
BlackRock Liquidity Series, LLC, Money Market Series | | | $1,198,277 | | | $ | 775,765 | | | $ | 1,974,042 | | | $ | 41,286 | |
| (g) | Security was purchased with the cash collateral from loaned securities. The Fund may withdraw up to 25% of its investment daily, although the manager of the BlackRock Liquidity Series, LLC, Money Market Series, in its sole discretion, may permit an investor to withdraw more than 25% on any one day. |
| Ÿ | | As of March 31, 2015, forward foreign currency exchange contracts outstanding were as follows: |
| | | | | | | | | | | | | | | | | | | | | | |
Currency
Purchased | | | Currency Sold | | | Counterparty | | Settlement
Date | | | Unrealized
Appreciation
(Depreciation) | |
| AUD | | | 3,696,000 | | | | USD | | | | 3,015,646 | | | Morgan Stanley Capital Services LLC | | | 4/22/15 | | | | $(204,371 | ) |
| CAD | | | 92,000 | | | | USD | | | | 74,644 | | | Bank of America N.A. | | | 4/22/15 | | | | (2,026 | ) |
| CAD | | | 270,000 | | | | USD | | | | 215,722 | | | Goldman Sachs International | | | 4/22/15 | | | | (2,602 | ) |
| CAD | | | 470,000 | | | | USD | | | | 391,959 | | | Morgan Stanley Capital Services LLC | | | 4/22/15 | | | | (20,972 | ) |
| CHF | | | 331,079 | | | | USD | | | | 358,599 | | | BNP Paribas S.A. | | | 4/22/15 | | | | (17,598 | ) |
| CHF | | | 160,409 | | | | USD | | | | 188,750 | | | Citibank N.A. | | | 4/22/15 | | | | (23,533 | ) |
| CHF | | | 1,386,370 | | | | USD | | | | 1,607,598 | | | Royal Bank of Canada | | | 4/22/15 | | | | (179,679 | ) |
| CHF | | | 47,528 | | | | USD | | | | 47,297 | | | The Bank of New York Mellon | | | 4/22/15 | | | | 1,655 | |
| CHF | | | 61,854 | | | | USD | | | | 63,075 | | | UBS AG | | | 4/22/15 | | | | 632 | |
| DKK | | | 9,870,061 | | | | USD | | | | 1,542,865 | | | Goldman Sachs International | | | 4/22/15 | | | | (121,306 | ) |
| EUR | | | 29,297 | | | | USD | | | | 33,978 | | | BNP Paribas S.A. | | | 4/22/15 | | | | (2,466 | ) |
| EUR | | | 80,327 | | | | USD | | | | 85,202 | | | BNP Paribas S.A. | | | 4/22/15 | | | | 1,196 | |
| EUR | | | 158,789 | | | | USD | | | | 179,809 | | | BNP Paribas S.A. | | | 4/22/15 | | | | (9,019 | ) |
| EUR | | | 467,054 | | | | USD | | | | 494,090 | | | BNP Paribas S.A. | | | 4/22/15 | | | | 8,262 | |
| EUR | | | 1,342,995 | | | | USD | | | | 1,520,774 | | | BNP Paribas S.A. | | | 4/22/15 | | | | (76,280 | ) |
| EUR | | | 110,130 | | | | USD | | | | 120,800 | | | Citibank N.A. | | | 4/22/15 | | | | (2,347 | ) |
| EUR | | | 124,650 | | | | USD | | | | 132,883 | | | Citibank N.A. | | | 4/22/15 | | | | 1,188 | |
| EUR | | | 411,130 | | | | USD | | | | 469,479 | | | Citibank N.A. | | | 4/22/15 | | | | (27,277 | ) |
| EUR | | | 494,365 | | | | USD | | | | 570,464 | | | Citibank N.A. | | | 4/22/15 | | | | (38,736 | ) |
See Notes to Financial Statements.
| | | | | | |
| 18 | | BLACKROCK FUNDS | | MARCH 31, 2015 | | |
| | | | |
Schedule of Investments (continued) | | | BlackRock Global Opportunities Portfolio | |
As of March 31, 2015, forward foreign currency exchange contracts outstanding were as follows: (concluded)
| | | | | | | | | | | | | | | | | | | | | | |
Currency Purchased | | | Currency
Sold | | | Counterparty | | Settlement
Date | | | Unrealized
Appreciation
(Depreciation) | |
| EUR | | | 49,776 | | | | USD | | | | 54,153 | | | Deutsche Bank AG | | | 4/22/15 | | | | $ (615) | |
| EUR | | | 1,432,247 | | | | USD | | | | 1,558,180 | | | Deutsche Bank AG | | | 4/22/15 | | | | (17,689) | |
| EUR | | | 68,120 | | | | USD | | | | 73,725 | | | State Street Bank and Trust Co. | | | 4/22/15 | | | | (456) | |
| EUR | | | 237,503 | | | | USD | | | | 258,872 | | | State Street Bank and Trust Co. | | | 4/22/15 | | | | (3,419) | |
| EUR | | | 785,267 | | | | USD | | | | 884,294 | | | TD Securities, Inc. | | | 4/22/15 | | | | (39,679) | |
| EUR | | | 19,150 | | | | USD | | | | 20,870 | | | The Bank of New York Mellon | | | 4/22/15 | | | | (272) | |
| EUR | | | 32,604 | | | | USD | | | | 37,259 | | | The Bank of New York Mellon | | | 4/22/15 | | | | (2,191) | |
| EUR | | | 86,320 | | | | USD | | | | 92,602 | | | The Bank of New York Mellon | | | 4/22/15 | | | | 363 | |
| EUR | | | 457,585 | | | | USD | | | | 482,721 | | | UBS AG | | | 4/22/15 | | | | 9,446 | |
| GBP | | | 964,000 | | | | USD | | | | 1,444,602 | | | Goldman Sachs International | | | 4/22/15 | | | | (14,829) | |
| GBP | | | 728,000 | | | | USD | | | | 1,093,487 | | | JPMorgan Chase Bank N.A. | | | 4/22/15 | | | | (13,741) | |
| GBP | | | 135,000 | | | | USD | | | | 204,451 | | | The Bank of New York Mellon | | | 4/22/15 | | | | (4,224) | |
| HKD | | | 1,284,000 | | | | USD | | | | 165,651 | | | Citibank N.A. | | | 4/22/15 | | | | (41) | |
| HKD | | | 7,669,000 | | | | USD | | | | 989,042 | | | HSBC Bank PLC | | | 4/22/15 | | | | 104 | |
| SEK | | | 599,000 | | | | USD | | | | 73,346 | | | The Bank of New York Mellon | | | 4/22/15 | | | | (3,770) | |
| SEK | | | 11,988,044 | | | | USD | | | | 1,433,961 | | | UBS AG | | | 4/22/15 | | | | (41,499) | |
| SGD | | | 2,518,000 | | | | USD | | | | 1,893,031 | | | TD Securities, Inc. | | | 4/22/15 | | | | (59,212) | |
| USD | | | 512,042 | | | | CHF | | | | 472,694 | | | TD Securities, Inc. | | | 4/22/15 | | | | 25,181 | |
| USD | | | 1,659,756 | | | | EUR | | | | 1,457,000 | | | Goldman Sachs International | | | 4/22/15 | | | | 92,641 | |
| USD | | | 7,289,707 | | | | EUR | | | | 6,270,554 | | | Goldman Sachs International | | | 4/22/15 | | | | 545,247 | |
| USD | | | 1,484,377 | | | | EUR | | | | 1,300,360 | | | Royal Bank of Canada | | | 4/22/15 | | | | 85,740 | |
| USD | | | 1,561,282 | | | | EUR | | | | 1,384,605 | | | State Street Bank and Trust Co. | | | 4/22/15 | | | | 72,033 | |
| USD | | | 6,308,551 | | | | GBP | | | | 4,155,975 | | | Morgan Stanley Capital Services LLC | | | 4/22/15 | | | | 144,544 | |
| USD | | | 352,847 | | | | GBP | | | | 239,000 | | | State Street Bank and Trust Co. | | | 4/22/15 | | | | (1,630) | |
| USD | | | 485,974 | | | | GBP | | | | 328,000 | | | State Street Bank and Trust Co. | | | 4/22/15 | | | | (505) | |
| USD | | | 2,787,061 | | | | GBP | | | | 1,885,000 | | | The Bank of New York Mellon | | | 4/22/15 | | | | (8,710) | |
| USD | | | 4,818,851 | | | | GBP | | | | 3,233,000 | | | UBS AG | | | 4/22/15 | | | | 23,771 | |
| USD | | | 1,045,119 | | | | HKD | | | | 8,103,000 | | | State Street Bank and Trust Co. | | | 4/22/15 | | | | (4) | |
| USD | | | 761,504 | | | | NOK | | | | 5,856,000 | | | Goldman Sachs International | | | 4/22/15 | | | | 35,052 | |
| USD | | | 579,832 | | | | NOK | | | | 4,409,000 | | | Morgan Stanley Capital Services LLC | | | 4/22/15 | | | | 32,885 | |
| USD | | | 1,357,088 | | | | NZD | | | | 1,753,000 | | | Morgan Stanley Capital Services LLC | | | 4/22/15 | | | | 49,522 | |
| USD | | | 892,065 | | | | SEK | | | | 7,262,000 | | | HSBC Bank PLC | | | 4/22/15 | | | | 48,553 | |
| | | | | | |
| Total | | | | | | | | | | | | | | | | | | | | | $237,317 | |
| Ÿ | | Fair Value Measurements — Various inputs are used in determining the fair value of investments and derivative financial instruments. These inputs to valuation techniques are categorized into a disclosure hierarchy consisting of three broad levels for financial statement purposes. The hierarchy gives the highest priority to unadjusted quoted prices in active markets for identical assets or liabilities (Level 1 measurements) and the lowest priority to unobservable inputs (Level 3 measurements). Accordingly, the degree of judgment exercised in determining fair value is greatest for instruments categorized in Level 3. The inputs used to measure fair value may fall into different levels of the fair value hierarchy. In such cases, for disclosure purposes, the fair value hierarchy classification is determined based on the lowest level input that is significant to the fair value measurement in its entirety. The categorization of a value determined for investments and derivative financial instruments is based on the pricing transparency of the investment and derivative financial instruments and is not necessarily an indication of the risks associated with investing in those securities. The three levels of the fair value hierarchy are as follows: |
| | Ÿ | | Level 1 – unadjusted quoted prices in active markets/exchanges for identical assets or liabilities that the Fund has the ability to access |
| | Ÿ | | Level 2 – other observable inputs (including, but not limited to, quoted prices for similar assets or liabilities in markets that are active, quoted prices for identical or similar assets or liabilities in markets that are not active, inputs other than quoted prices that are observable for the assets or liabilities (such as interest rates, yield curves, volatilities, prepayment speeds, loss severities, credit risks and default rates) or other market–corroborated inputs) |
| | Ÿ | | Level 3 – unobservable inputs based on the best information available in the circumstances, to the extent observable inputs are not available (including the Fund’s own assumptions used in determining the fair value of investments and derivative financial instruments) |
Changes in valuation techniques may result in transfers into or out of an assigned level within the disclosure hierarchy. In accordance with the Fund’s policy, transfers between different levels of the fair value disclosure hierarchy are deemed to have occurred as of the beginning of the reporting period. For information about the Fund’s policy regarding
See Notes to Financial Statements.
| | | | | | |
| | | BLACKROCK FUNDS | | MARCH 31, 2015 | | 19 |
| | | | |
Schedule of Investments (continued) | | | BlackRock Global Opportunities Portfolio | |
valuation of investments and derivative financial instruments, refer to Note 2 of the Notes to Financial Statements.
As of March 31, 2015, the following tables summarize the Fund’s investments and derivative financial instruments categorized in the disclosure hierarchy:
| | | | | | | | | | | | | | | | |
| | | Level 1 | | | Level 2 | | | Level 3 | | | Total | |
Assets: | | | | | | | | | | | | | | | | |
Investments: | | | | | | | | | | | | | | | | |
Long-Term Investments: | | | | | | | | | | | | | | | | |
Common Stocks: | | | | | | | | | | | | | | | | |
Belgium | | | – | | | $ | 3,239,569 | | | | – | | | $ | 3,239,569 | |
Canada | | $ | 2,901,879 | | | | – | | | | – | | | | 2,901,879 | |
China | | | 4,914,940 | | | | 3,352,169 | | | | – | | | | 8,267,109 | |
France | | | – | | | | 13,129,557 | | | | – | | | | 13,129,557 | |
Germany | | | – | | | | 10,094,715 | | | | – | | | | 10,094,715 | |
Hong Kong | | | – | | | | 4,205,957 | | | | – | | | | 4,205,957 | |
India | | | 1,047,360 | | | | 4,845,874 | | | | – | | | | 5,893,234 | |
Indonesia | | | – | | | | 3,089,756 | | | | – | | | | 3,089,756 | |
Ireland | | | 5,391,979 | | | | – | | | | – | | | | 5,391,979 | |
Italy | | | – | | | | 3,314,354 | | | | – | | | | 3,314,354 | |
Japan | | | – | | | | 15,736,401 | | | | – | | | | 15,736,401 | |
Mexico | | | 1,111,399 | | | | – | | | | – | | | | 1,111,399 | |
Netherlands | | | 4,962,880 | | | | 1,409,982 | | | | – | | | | 6,372,862 | |
New Zealand | | | 1,915,229 | | | | – | | | | – | | | | 1,915,229 | |
Nigeria | | | 971,820 | | | | – | | | | – | | | | 971,820 | |
Norway | | | – | | | | 1,672,661 | | | | – | | | | 1,672,661 | |
Peru | | | 1,504,741 | | | | – | | | | – | | | | 1,504,741 | |
South Africa | | | – | | | | 2,546,291 | | | | – | | | | 2,546,291 | |
South Korea | | | – | | | | 5,342,434 | | | | – | | | | 5,342,434 | |
Spain | | | – | | | | 4,139,619 | | | | – | | | | 4,139,619 | |
Sweden | | | – | | | | 2,530,117 | | | | – | | | | 2,530,117 | |
Switzerland | | | – | | | | 8,398,023 | | | | – | | | | 8,398,023 | |
Taiwan | | | – | | | | 2,991,796 | | | | – | | | | 2,991,796 | |
United Kingdom | | | 7,245,303 | | | | 20,535,847 | | | $ | 1,619,553 | | | | 29,400,703 | |
United States | | | 146,183,650 | | | | 9,518,915 | | | | 1,437,187 | | | | 157,139,752 | |
Preferred Stocks: | | | | | | | | | | | | | | | | |
India | | | – | | | | – | | | | 1,290,667 | | | | 1,290,667 | |
United States | | | – | | | | – | | | | 3,942,510 | | | | 3,942,510 | |
Warrants | | | – | | | | 67,976 | | | | – | | | | 67,976 | |
Short-Term Securities | | | 2,305,045 | | | | 1,974,042 | | | | – | | | | 4,279,087 | |
| | | | |
Total | | $ | 180,456,225 | | | $ | 122,136,055 | | | $ | 8,289,917 | | | $ | 310,882,197 | |
| | | | |
| | | | | | | | | | | | | | | | |
| |
| | | Level 1 | | | Level 2 | | | Level 3 | | | Total | |
| |
Derivative Financial Instruments1 | | | | | | | | | | | | | | | | |
Assets: | | | | | | | | | | | | | | | | |
| Forward foreign currency exchange contracts | | | – | | | $ | 1,178,015 | | | | – | | | $ | 1,178,015 | |
Liabilities: | | | | | | | | | | | | | | | | |
| Forward foreign currency exchange contracts | | | – | | | | (940,698 | ) | | | – | | | | (940,698 | ) |
| | | | |
Total | | | – | | | $ | 237,317 | | | | – | | | $ | 237,317 | |
| | | | |
1 Derivative financial instruments are forward foreign currency exchange contracts, which are valued at the unrealized appreciation/depreciation on the instrument.
See Notes to Financial Statements.
| | | | | | |
| 20 | | BLACKROCK FUNDS | | MARCH 31, 2015 | | |
| | | | |
| Schedule of Investments (continued) | | | BlackRock Global Opportunities Portfolio | |
The Fund may hold assets and/or liabilities in which the fair value approximates the carrying amount for financial statement purposes. As of March 31, 2015, such assets and/or liabilities are categorized within the disclosure hierarchy as follows:
| | | | | | | | | | | | | | | | | | | | |
| | | Level 1 | | Level 2 | | Level 3 | | Total |
Assets: | | | | | | | | | | | | | | | | | | | | |
Foreign currency at value | | | $ | 2,795,824 | | | | | — | | | | | — | | | | $ | 2,795,824 | |
Liabilities: | | | | | | | | | | | | | | | | | | | | |
Collateral on securities loaned at value | | | | — | | | | $ | (1,974,042 | ) | | | | — | | | | | (1,974,042 | ) |
| | | | | |
Total | | | $ | 2,795,824 | | | | $ | (1,974,042 | ) | | | | — | | | | $ | 821,782 | |
| | | | | |
| | | | |
| Transfers between Level 1 and Level 2 were as follows: | | | | | | | | | | | | | | | | | | | | |
| | | | | | | | | | | | | | | | | | | | |
| | | Transfers into
Level 1 | | Transfers out
of Level 11 | | Transfers into
Level 21 | | Transfers out
of Level 2 |
Assets: | | | | | | | | | | | | | | | | | | | | |
Long-Term Investments: | | | | | | | | | | | | | | | | | | | | |
United Kingdom | | | | — | | | | $ | (1,999,010 | ) | | | $ | 1,999,010 | | | | | — | |
United States | | | | — | | | | | (2,286,265 | ) | | | | 2,286,265 | | | | | — | |
| | | | | |
Total | | | | — | | | | $ | (4,285,275 | ) | | | $ | 4,285,275 | | | | | — | |
| | | | | |
1 External pricing service used to reflect any significant market movements between the time the Fund valued such foreign securities and the earlier closing of foreign markets. | |
|
| A reconciliation of Level 3 investments is presented when the Fund had a significant amount of Level 3 investments at the beginning and/or end of the period in relation to net assets. The following table is a reconciliation of Level 3 investments for which significant unobservable inputs were used in determining fair value: | |
| | | | | | | | | | | | | | | | | | | | |
| | | | | Common Stocks | | Preferred Stocks | | Total |
Assets: | | | | | | | | | | | | | | | | | | | | |
Opening Balance, as of September 30, 2014 | | | | | | | | $ | 3,494,697 | | | | $ | 8,839,486 | | | | $ | 12,334,183 | |
Transfers into Level 3 | | | | | | | | | — | | | | | — | | | | | — | |
Transfers out of Level 31 | | | | | | | | | (6,359,757 | ) | | | | — | | | | | (6,359,757 | ) |
Other2 | | | | | | | | | 6,166,560 | | | | | (6,166,560 | ) | | | | — | |
Accrued discounts/premiums | | | | | | | | | — | | | | | — | | | | | — | |
Net realized gain (loss) | | | | | | | | | — | | | | | — | | | | | — | |
Net change in unrealized appreciation/depreciation3,4 | | | | | | | | | (244,760 | ) | | | | 2,332,619 | | | | | 2,087,859 | |
Purchases | | | | | | | | | — | | | | | 227,632 | | | | | 227,632 | |
Sales | | | | | | | | | — | | | | | — | | | | | — | |
Closing Balance, as of March 31, 2015 | | | | | | | | $ | 3,056,740 | | | | $ | 5,233,177 | | | | $ | 8,289,917 | |
| | | | | | | | | | |
Net change in unrealized appreciation/depreciation on investments still held at March 31, 20154 | | | | | | | | $ | (244,760 | ) | | | $ | 2,332,619 | | | | $ | 2,087,859 | |
| | | | | | | | | | |
| | 1 | | As of September 30, 2014, the Fund used significant unobservable inputs in determining the value of certain investments. As of March 31, 2015, the Fund used observable inputs in determining the value of the same investments. As a result, investments with a beginning period value of $6,359,757 transferred from Level 3 to Level 2 in the disclosure hierarchy. |
| | 2 | | Certain Level 3 investments were re-classified between Common Stocks and Preferred Stocks. |
| | 3 | | Included in the related net change in unrealized appreciation/depreciation in the Statements of Operations. |
| | 4 | | Any difference between Net change in unrealized appreciation/depreciation and Net change in unrealized appreciation/depreciation on investments still held at March 31, 2015, is generally due to investments no longer held or categorized as Level 3 at period end. |
See Notes to Financial Statements.
| | | | | | |
| | | BLACKROCK FUNDS | | MARCH 31, 2015 | | 21 |
| | | | |
| Schedule of Investments (concluded) | | | BlackRock Global Opportunities Portfolio | |
The following table summarizes the valuation techniques used and unobservable inputs utilized by the BlackRock Global Valuation Methodologies Committee (the “Global Valuation Committee”) to determine the value of certain of the Fund’s Level 3 investments as of March 31, 2015. The table does not include Level 3 investments with values based upon unadjusted third party pricing information in the amount of $1,437,187.
| | | | | | | | | | | | |
| | | Value | | | Valuation Techniques | | Unobservable Inputs Utilized | | Range of
Unobservable Inputs
Utilized | |
Assets: | | | | | | | | | | | | |
Common Stocks | | $ | 1,619,553 | | | Market Comparable Companies | | Price to Tangible Book Value Multiple1 | | | 1.8x | |
Preferred Stocks2 | | | 1,290,667 | | | Probability-Weighted Expected Return Model | | Years to IPO3 | | | 1.2-3.2 | |
| | | | | | | | IPO Exit Probability1 | | | 75.00% | |
| | | | | | | | Discount Rate3 | | | 25.00% | |
| | | | | | | | Revenue Multiple1 | | | 0.84x-1.87x | |
| | | 3,942,510 | | | Probability-Weighted Expected Return Model | | Years to IPO3 | | | 0.75-2.9 | |
| | | | | | | | IPO Exit Probability1 | | | 90.00% - 95.00% | |
| | | | | | | | Discount Rate3 | | | 21.30% - 22.31% | |
| | | | | | | | Margin1 | | | 20.00% | |
| | | | | | | | Revenue Multiple1 | | | 10.0x-16.0x | |
Total | | $ | 6,852,730 | | | | | | | | | |
| | 1 | | Increase in unobservable input may result in a significant increase to value, while a decrease in the unobservable input may result in a significant decrease to value. |
| | 2 | | For the period ended March 31, 2015, the valuation technique for certain investments classified as preferred stocks changed to a Probability-Weighted Expected Return Model. The investments were previously valued utilizing a market comparable company and option pricing model approach. A Probability-Weighted Expected Return Model was considered to be a more relevant measure of fair value for these investments which leverages the most recent equity raise pre-money valuation and/or secondary market transactions. |
| | 3 | | Decrease in unobservable input may result in a significant increase to value, while an increase in the unobservable input may result in a significant decrease to value. |
See Notes to Financial Statements.
| | | | | | |
| 22 | | BLACKROCK FUNDS | | MARCH 31, 2015 | | |
| | | | |
| Schedule of Investments March 31, 2015 (Unaudited) | | | BlackRock Health Sciences Opportunities Portfolio | |
| | | (Percentages shown are based on Net Assets) | |
| | | | | | | | |
| Common Stocks | | Shares | | | Value | |
Biotechnology — 29.4% | | | | | | | | |
Acceleron Pharma, Inc. (a) | | | 393,200 | | | $ | 14,965,192 | |
Actelion Ltd., Registered Shares | | | 195,700 | | | | 22,570,777 | |
Agios Pharmaceuticals, Inc. (a) | | | 332,546 | | | | 31,359,088 | |
Alder Biopharmaceuticals, Inc. (a) | | | 495,700 | | | | 14,305,902 | |
Alexion Pharmaceuticals, Inc. (a) | | | 751,517 | | | | 130,237,896 | |
Alkermes PLC (a) | | | 872,700 | | | | 53,208,519 | |
Alnylam Pharmaceuticals, Inc. (a) | | | 127,852 | | | | 13,350,306 | |
Amgen, Inc. | | | 997,510 | | | | 159,451,973 | |
Anacor Pharmaceuticals, Inc. (a) | | | 157,400 | | | | 9,105,590 | |
Aquinox Pharmaceuticals, Inc. (a) | | | 92,500 | | | | 793,650 | |
Ascendis Pharma A/S — ADR (a) | | | 123,600 | | | | 2,144,460 | |
BioCryst Pharmaceuticals, Inc. (a) | | | 227,900 | | | | 2,057,937 | |
Biogen Idec, Inc. (a) | | | 479,612 | | | | 202,511,371 | |
BioMarin Pharmaceutical, Inc. (a) | | | 642,300 | | | | 80,043,426 | |
Bluebird Bio, Inc. (a) | | | 42,600 | | | | 5,144,802 | |
Celgene Corp. (a) | | | 1,569,538 | | | | 180,936,341 | |
Celldex Therapeutics, Inc. (a) | | | 296,500 | | | | 8,263,455 | |
Cellectis SA — ADR (a) | | | 148,900 | | | | 5,150,451 | |
Clovis Oncology, Inc. (a) | | | 182,100 | | | | 13,517,283 | |
Conatus Pharmaceuticals, Inc. (a) | | | 110,200 | | | | 784,624 | |
Dyax Corp. (a) | | | 679,737 | | | | 11,388,993 | |
Genomic Health, Inc. (a) | | | 406,800 | | | | 12,427,740 | |
Gilead Sciences, Inc. (a) | | | 815,456 | | | | 80,020,697 | |
Incyte Corp. (a) | | | 570,700 | | | | 52,310,362 | |
Infinity Pharmaceuticals, Inc. (a) | | | 339,500 | | | | 4,746,210 | |
Intercept Pharmaceuticals, Inc. (a) | | | 98,400 | | | | 27,750,768 | |
Isis Pharmaceuticals, Inc. (a) | | | 974,067 | | | | 62,018,846 | |
Karyopharm Therapeutics, Inc. (a) | | | 254,039 | | | | 7,776,134 | |
Medivation, Inc. (a) | | | 414,600 | | | | 53,512,422 | |
Neurocrine Biosciences, Inc. (a) | | | 611,738 | | | | 24,292,116 | |
Protalix BioTherapeutics, Inc. (a)(b) | | | 1,155,326 | | | | 2,056,480 | |
PTC Therapeutics, Inc. (a) | | | 334,100 | | | | 20,329,985 | |
Puma Biotechnology, Inc. (a) | | | 126,300 | | | | 29,820,693 | |
Receptos, Inc. (a) | | | 409,600 | | | | 67,538,944 | |
Regeneron Pharmaceuticals, Inc. (a) | | | 166,722 | | | | 75,271,649 | |
SAGE Therapeutics, Inc. (a) | | | 269,387 | | | | 13,531,309 | |
Sarepta Therapeutics, Inc. (a)(b) | | | 545,100 | | | | 7,238,928 | |
Seattle Genetics, Inc. (a)(b) | | | 202,818 | | | | 7,169,616 | |
Spark Therapeutics, Inc. (a) | | | 144,000 | | | | 11,160,000 | |
Spark Therapeutics, Inc. (Acquired 2/04/15, cost $404,066, unrestricted issue on 2/04/15 was valued at $43.21 pershare) (a)(c) | | | 250,972 | | | | 18,477,813 | |
Synageva BioPharma Corp. (a) | | | 149,300 | | | | 14,561,229 | |
Ultragenyx Pharmaceutical, Inc. (a) | | | 397,005 | | | | 24,650,040 | |
Vertex Pharmaceuticals, Inc. (a) | | | 588,670 | | | | 69,445,400 | |
Zafgen, Inc. (a) | | | 180,700 | | | | 7,157,527 | |
| | | | | | | | |
| | | | | | | | 1,654,556,944 | |
Health Care Equipment & Supplies — 17.7% | | | | | | | | |
Abbott Laboratories | | | 2,785,300 | | | | 129,042,949 | |
Align Technology, Inc. (a) | | | 164,800 | | | | 8,863,768 | |
AtriCure, Inc. (a) | | | 335,881 | | | | 6,882,202 | |
Baxter International, Inc. | | | 278,200 | | | | 19,056,700 | |
Becton Dickinson & Co. | | | 588,792 | | | | 84,544,643 | |
Boston Scientific Corp. (a) | | | 6,662,900 | | | | 118,266,475 | |
The Cooper Cos., Inc. | | | 256,900 | | | | 48,148,198 | |
CR Bard, Inc. | | | 153,600 | | | | 25,704,960 | |
DexCom, Inc. (a) | | | 363,600 | | | | 22,666,824 | |
Edwards Lifesciences Corp. (a) | | | 618,182 | | | | 88,066,208 | |
Endologix, Inc. (a) | | | 317,738 | | | | 5,423,788 | |
| | | | | | | | |
| Common Stocks | | Shares | | | Value | |
Health Care Equipment & Supplies (concluded) | | | | | | | | |
Insulet Corp. (a) | | | 223,500 | | | $ | 7,453,725 | |
Intuitive Surgical, Inc. (a) | | | 97,800 | | | | 49,391,934 | |
Masimo Corp. (a) | | | 560,400 | | | | 18,481,992 | |
Medtronic PLC | | | 2,184,723 | | | | 170,386,547 | |
PW Medtech Group Ltd. (a) | | | 2,621,900 | | | | 989,854 | |
St. Jude Medical, Inc. | | | 1,044,600 | | | | 68,316,840 | |
Stryker Corp. | | | 1,051,000 | | | | 96,954,750 | |
Thoratec Corp. (a) | | | 194,100 | | | | 8,130,849 | |
Zimmer Holdings, Inc. | | | 142,600 | | | | 16,758,352 | |
| | | | | | | | |
| | | | | | | | 993,531,558 | |
Health Care Providers & Services — 16.5% | | | | | | | | |
Aetna, Inc. | | | 386,723 | | | | 41,197,601 | |
AmerisourceBergen Corp. | | | 322,200 | | | | 36,624,474 | |
Anthem, Inc. | | | 681,400 | | | | 105,214,974 | |
Cardinal Health, Inc. | | | 1,165,880 | | | | 105,243,988 | |
Cigna Corp. | | | 824,900 | | | | 106,775,056 | |
Express Scripts Holding Co. (a) | | | 441,547 | | | | 38,313,033 | |
HCA Holdings, Inc. (a) | | | 800,448 | | | | 60,217,703 | |
HealthEquity, Inc. (a) | | | 83,300 | | | | 2,081,667 | |
Humana, Inc. | | | 230,000 | | | | 40,944,600 | |
McKesson Corp. | | | 645,200 | | | | 145,944,240 | |
Premier, Inc., Class A (a) | | | 141,700 | | | | 5,325,086 | |
UnitedHealth Group, Inc. | | | 1,501,194 | | | | 177,576,238 | |
Universal Health Services, Inc., Class B | | | 509,200 | | | | 59,937,932 | |
| | | | | | | | |
| | | | | | | | 925,396,592 | |
Health Care Technology — 0.4% | | | | | | | | |
Cerner Corp. (a) | | | 277,900 | | | | 20,358,954 | |
Life Sciences Tools & Services — 3.8% | | | | | | | | |
Agilent Technologies, Inc. | | | 882,100 | | | | 36,651,255 | |
Charles River Laboratories International, Inc. (a) | | | 817,900 | | | | 64,851,291 | |
Illumina, Inc. (a) | | | 207,900 | | | | 38,594,556 | |
Thermo Fisher Scientific, Inc. | | | 567,000 | | | | 76,170,780 | |
| | | | | | | | |
| | | | | | | | 216,267,882 | |
Machinery — 0.2% | | | | | | | | |
Pall Corp. | | | 108,500 | | | | 10,892,315 | |
Pharmaceuticals — 29.3% | | | | | | | | |
AbbVie, Inc. | | | 1,453,200 | | | | 85,070,328 | |
Achaogen, Inc. (a) | | | 183,711 | | | | 1,793,019 | |
Actavis PLC (a) | | | 602,052 | | | | 179,182,716 | |
AstraZeneca PLC | | | 1,069,500 | | | | 73,387,103 | |
Bayer AG, Registered Shares | | | 297,600 | | | | 44,525,512 | |
Bristol-Myers Squibb Co. | | | 2,377,800 | | | | 153,368,100 | |
Chugai Pharmaceutical Co. Ltd. | | | 905,700 | | | | 28,584,731 | |
Dermira, Inc. (a) | | | 146,100 | | | | 2,242,635 | |
Eli Lilly & Co. | | | 1,918,300 | | | | 139,364,495 | |
Intra-Cellular Therapies, Inc. (a) | | | 983,154 | | | | 23,477,717 | |
Jazz Pharmaceuticals PLC (a) | | | 109,600 | | | | 18,937,784 | |
Johnson & Johnson | | | 764,800 | | | | 76,938,880 | |
Mallinckrodt PLC (a) | | | 616,100 | | | | 78,029,065 | |
Merck & Co., Inc. | | | 1,883,800 | | | | 108,280,824 | |
Mylan NV (a) | | | 1,020,000 | | | | 60,537,000 | |
Novartis AG, Registered Shares | | | 862,300 | | | | 85,109,431 | |
Perrigo Co. PLC | | | 440,700 | | | | 72,957,885 | |
Pfizer, Inc. | | | 1,623,740 | | | | 56,489,915 | |
Phibro Animal Health Corp., Class A | | | 325,700 | | | | 11,533,037 | |
Roche Holding AG | | | 217,000 | | | | 59,629,886 | |
Shire PLC — ADR | | | 261,300 | | | | 62,526,477 | |
See Notes to Financial Statements.
| | | | | | |
| | | BLACKROCK FUNDS | | MARCH 31, 2015 | | 23 |
| | | | |
| Schedule of Investments (continued) | |
| BlackRock Health Sciences Opportunities Portfolio
(Percentages shown are based on Net Assets) |
|
| | | | | | | | |
| Common Stocks | | Shares | | | Value | |
Pharmaceuticals (concluded) | | | | | | | | |
Tetraphase Pharmaceuticals, Inc. (a) | | | 230,600 | | | $ | 8,449,184 | |
Teva Pharmaceutical Industries Ltd. — ADR | | | 1,416,100 | | | | 88,223,030 | |
Valeant Pharmaceuticals International, Inc. (a) | | | 537,100 | | | | 106,678,802 | |
Zoetis, Inc. | | | 484,200 | | | | 22,413,618 | |
| | | | | | | | |
| | | | | | | | 1,647,731,174 | |
Total Common Stocks — 97.3% | | | | | | | 5,468,735,419 | |
| | | | | | | | |
| Preferred Stocks | | | | | | |
Biotechnology — 0.2% | | | | | | | | |
ProNAi Therapeutics, Inc., Series D (Acquired 4/15/14, cost $3,632,975) (a)(c) | | | 5,189,964 | | | | 3,632,975 | |
Seres Health, Inc. (Acquired 11/24/14, cost $3,672,922) (a)(c) | | | 301,970 | | | | 5,435,460 | |
Total Preferred Stocks — 0.2% | | | | | | | 9,068,435 | |
Total Long-Term Investments (Cost — $3,692,087,079) — 97.5% | | | | 5,477,803,854 | |
| | | | | | | | |
| | | | | | | |
| | | | | | | | |
| Short-Term Securities | | Shares | | | Value | |
BlackRock Liquidity Funds, TempFund, Institutional Class, 0.06% (d)(e) | | | 122,708,089 | | | $ | 122,708,089 | |
| | | Beneficial
Interest
(000) | | | | |
BlackRock Liquidity Series, LLC, Money Market Series, 0.22% (d)(e)(f) | | $ | 7,494 | | | | 7,494,299 | |
Total Short-Term Securities
(Cost — $130,202,388) — 2.3% | | | | 130,202,388 | |
Total Investments Before Options Written (Cost — $3,822,289,467) — 99.8% | | | | 5,608,006,242 | |
| | | | | | | | |
| Options Written | | | | | | |
(Premiums Received — $339,405) — (0.0)% | | | | | | | (144,838 | ) |
Total Investments Net of Options Written
(Cost — $3,821,950,062) — 99.8% | | | | 5,607,861,404 | |
Other Assets Less Liabilities — 0.2% | | | | 10,065,405 | |
| | | | | | | | |
Net Assets — 100.0% | | | | | | $ | 5,617,926,809 | |
| | | | | | | | |
|
| Notes to Schedule of Investments |
| (a) | Non-income producing security. |
| (b) | Security, or a portion of security, is on loan. |
| (c) | Restricted security as to resale. As of report date, the Fund held restricted securities with a current value of $27,546,248 and an original cost of $7,709,963, which was 0.5% of its net assets. |
| (d) | Represents the current yield as of report date. |
| (e) | During the six months ended March 31, 2015, investments in issuers considered to be affiliates of the Fund for purposes of Section 2(a)(3) of the Investment Company Act of 1940, as amended, were as follows: |
| | | | | | | | | | | | | | | | | | | | |
| Affiliate | | Shares/
Beneficial
Interest Held at
September 30,
2014 | | | Net Activity | | | Shares/
Beneficial
Interest Held at
March 31, 2015 | | | Income | | | Realized
Gain | |
BlackRock Liquidity Funds, TempFund, Institutional Class | | | 115,300,758 | | | | 7,407,331 | | | | 122,708,089 | | | $ | 29,999 | | | $ | 7,875 | |
BlackRock Liquidity Series, LLC, Money Market Series | | $ | 4,824,791 | | | $ | 2,669,508 | | | $ | 7,494,299 | | | $ | 51,703 | | | | — | |
| (f) | Security was purchased with the cash collateral from loaned securities. The Fund may withdraw up to 25% of its investment daily, although the manager of the BlackRock Liquidity Series, LLC, Money Market Series, in its sole discretion, may permit an investor to withdraw more than 25% on any one day. |
| Ÿ | | For Fund compliance purposes, the Fund’s industry classifications refer to any one or more of the industry sub-classifications used by one or more widely recognized market indexes or ratings group indexes, and/or as defined by the investment advisor. These definitions may not apply for purposes of this report, which may combine such industry sub-classifications for reporting ease. |
See Notes to Financial Statements.
| | | | | | |
| 24 | | BLACKROCK FUNDS | | MARCH 31, 2015 | | |
| | | | |
| Schedule of Investments (continued) | | | BlackRock Health Sciences Opportunities Portfolio | |
| Ÿ | | As of March 31, 2015, forward foreign currency exchange contracts outstanding were as follows: |
| | | | | | | | | | | | | | | | | | | | | | |
Currency
Purchased | | | Currency
Sold | | | Counterparty | | Settlement
Date | | | Unrealized
Appreciation
(Depreciation) | |
| CHF | | | 51,430,772 | | | | USD | | | | 60,216,335 | | | Deutsche Bank AG | | | 4/22/15 | | | $ | (7,244,201 | ) |
| CHF | | | 4,197,481 | | | | USD | | | | 4,390,900 | | | JPMorgan Chase Bank N.A. | | | 4/22/15 | | | | (67,622 | ) |
| EUR | | | 12,537,126 | | | | USD | | | | 14,254,599 | | | UBS AG | | | 4/22/15 | | | | (769,962 | ) |
| USD | | | 8,328,090 | | | | CHF | | | | 8,139,267 | | | Deutsche Bank AG | | | 4/22/15 | | | | (55,108 | ) |
| USD | | | 4,468,423 | | | | CHF | | | | 4,222,557 | | | Goldman Sachs Bank USA | | | 4/22/15 | | | | 119,318 | |
| USD | | | 111,123,024 | | | | CHF | | | | 95,066,647 | | | Morgan Stanley Capital Services LLC | | | 4/22/15 | | | | 13,207,263 | |
| USD | | | 1,264,854 | | | | CHF | | | | 1,167,732 | | | Royal Bank of Canada | | | 4/22/15 | | | | 62,125 | |
| USD | | | 2,094,096 | | | | CHF | | | | 1,942,410 | | | UBS AG | | | 4/22/15 | | | | 93,473 | |
| USD | | | 918,095 | | | | EUR | | | | 812,300 | | | Bank of America N.A. | | | 4/22/15 | | | | 44,405 | |
| USD | | | 28,374,381 | | | | EUR | | | | 25,226,000 | | | Deutsche Bank AG | | | 4/22/15 | | | | 1,241,890 | |
| USD | | | 1,049,970 | | | | EUR | | | | 919,806 | | | Royal Bank of Canada | | | 4/22/15 | | | | 60,648 | |
| USD | | | 1,118,542 | | | | EUR | | | | 987,457 | | | Royal Bank of Canada | | | 4/22/15 | | | | 56,456 | |
| USD | | | 21,855,583 | | | | EUR | | | | 18,882,708 | | | Royal Bank of Canada | | | 4/22/15 | | | | 1,545,787 | |
| USD | | | 1,036,727 | | | | EUR | | | | 960,643 | | | Royal Bank of Scotland PLC | | | 4/22/15 | | | | 3,481 | |
| USD | | | 682,795 | | | | EUR | | | | 596,450 | | | UBS AG | | | 4/22/15 | | | | 41,267 | |
| USD | | | 1,372,856 | | | | GBP | | | | 892,000 | | | Bank of America N.A. | | | 4/22/15 | | | | 49,870 | |
| USD | | | 1,985,218 | | | | GBP | | | | 1,289,000 | | | Morgan Stanley Capital Services LLC | | | 4/22/15 | | | | 73,415 | |
| USD | | | 66,691,048 | | | | GBP | | | | 44,032,000 | | | Morgan Stanley Capital Services LLC | | | 4/22/15 | | | | 1,384,216 | |
| Total | | | | | | | | | | | | | | | | | | | | $ | 9,846,721 | |
| | | | | | | | | | | | | | | | | | | | | | |
| Ÿ | | As of March 31, 2015, exchange-traded options written were as follows: |
| | | | | | | | | | | | | | | | | | | | | | |
| Description | | Put/
Call | | | Strike Price | | | Expiration
Date | | | Contracts | | Value | |
Alnylam Pharmaceuticals, Inc. | | | Put | | | | USD | | | | 90.00 | | | | 4/17/15 | | | 293 | | $ | (17,580 | ) |
Alnylam Pharmaceuticals, Inc. | | | Put | | | | USD | | | | 95.00 | | | | 4/17/15 | | | 293 | | | (37,358 | ) |
Synageva Biopharma Corp. | | | Put | | | | USD | | | | 85.00 | | | | 4/17/15 | | | 310 | | | (31,000 | ) |
Synageva Biopharma Corp. | | | Put | | | | USD | | | | 90.00 | | | | 4/17/15 | | | 310 | | | (58,900 | ) |
Total | | | | | | | | | | | | | | | | | | | | $ | (144,838 | ) |
| | | | | | | | | | | | | | | | | | | | | | |
| Ÿ | | Fair Value Measurements — Various inputs are used in determining the fair value of investments and derivative financial instruments. These inputs to valuation techniques are categorized into a disclosure hierarchy consisting of three broad levels for financial statement purposes. The hierarchy gives the highest priority to unadjusted quoted prices in active markets for identical assets or liabilities (Level 1 measurements) and the lowest priority to unobservable inputs (Level 3 measurements). Accordingly, the degree of judgment exercised in determining fair value is greatest for instruments categorized in Level 3. The inputs used to measure fair value may fall into different levels of the fair value hierarchy. In such cases, for disclosure purposes, the fair value hierarchy classification is determined based on the lowest level input that is significant to the fair value measurement in its entirety. The categorization of a value determined for investments and derivative financial instruments is based on the pricing transparency of the investment and derivative financial instruments and is not necessarily an indication of the risks associated with investing in those securities. The three levels of the fair value hierarchy are as follows: |
| | Ÿ | | Level 1 — unadjusted quoted prices in active markets/exchanges for identical assets or liabilities that the Fund has the ability to access |
| | Ÿ | | Level 2 — other observable inputs (including, but not limited to, quoted prices for similar assets or liabilities in markets that are active, quoted prices for identical or similar assets or liabilities in markets that are not active, inputs other than quoted prices that are observable for the assets or liabilities (such as interest rates, yield curves, volatilities, prepayment speeds, loss severities, credit risks and default rates) or other market–corroborated inputs) |
| | Ÿ | | Level 3 — unobservable inputs based on the best information available in the circumstances, to the extent observable inputs are not available (including the Fund’s own assumptions used in determining the fair value of investments and derivative financial instruments) |
Changes in valuation techniques may result in transfers into or out of an assigned level within the disclosure hierarchy. In accordance with the Fund’s policy, transfers between different levels of the fair value disclosure hierarchy are deemed to have occurred as of the beginning of the reporting period. For information about the Fund’s policy regarding valuation of investments and derivative financial instruments, refer to Note 2 of the Notes to Financial Statements.
See Notes to Financial Statements.
| | | | | | |
| | | BLACKROCK FUNDS | | MARCH 31, 2015 | | 25 |
| | | | |
| Schedule of Investments (concluded) | | | BlackRock Health Sciences Opportunities Portfolio | |
As of March 31, 2015, the following tables summarize the Fund’s investments and derivative financial instruments categorized in the disclosure hierarchy:
| | | | | | | | | | | | | | | | | | | | |
| | | Level 1 | | Level 2 | | Level 3 | | Total |
Assets: | | | | | | | | | | | | | | | | | | | | |
Investments: | | | | | | | | | | | | | | | | | | | | |
Long-Term Investments: | | | | | | | | | | | | | | | | | | | | |
Common Stocks: | | | | | | | | | | | | | | | | | | | | |
Biotechnology | | | $ | 1,613,508,354 | | | | $ | 41,048,590 | | | | | — | | | | $ | 1,654,556,944 | |
Health Care Equipment & Supplies | | | | 992,541,704 | | | | | 989,854 | | | | | — | | | | | 993,531,558 | |
Health Care Providers & Services | | | | 925,396,592 | | | | | — | | | | | — | | | | | 925,396,592 | |
Health Care Technology | | | | 20,358,954 | | | | | — | | | | | — | | | | | 20,358,954 | |
Life Sciences Tools & Services | | | | 216,267,882 | | | | | — | | | | | — | | | | | 216,267,882 | |
Machinery | | | | 10,892,315 | | | | | — | | | | | — | | | | | 10,892,315 | |
Pharmaceuticals | | | | 1,356,494,511 | | | | | 291,236,663 | | | | | — | | | | | 1,647,731,174 | |
Preferred Stocks: | | | | | | | | | | | | | | | | | | | | |
Biotechnology | | | | — | | | | | — | | | | $ | 9,068,435 | | | | | 9,068,435 | |
Short-Term Securities | | | | 122,708,089 | | | | | 7,494,299 | | | | | — | | | | | 130,202,388 | |
| | | | | |
Total | | | $ | 5,258,168,401 | | | | $ | 340,769,406 | | | | $ | 9,068,435 | | | | $ | 5,608,006,242 | |
| | | | | |
| | | | | | | | | | | | | | | | | | | | |
| | | Level 1 | | Level 2 | | Level 3 | | Total |
Derivative Financial Instruments1 | | | | | | | | | | | | | | | | | | | | |
Assets: | | | | | | | | | | | | | | | | | | | | |
Forward foreign currency exchange contracts | | | | — | | | | $ | 17,983,614 | | | | | — | | | | $ | 17,983,614 | |
Liabilities: | | | | | | | | | | | | | | | | | | | | |
Equity contracts | | | $ | (144,838 | ) | | | | — | | | | | — | | | | | (144,838 | ) |
Forward foreign currency exchange contracts | | | | — | | | | | (8,136,893 | ) | | | | — | | | | | (8,136,893 | ) |
| | | | | |
Total | | | $ | (144,838 | ) | | | $ | 9,846,721 | | | | | — | | | | $ | 9,701,883 | |
| | | | | |
1 Derivative financial instruments are forward foreign currency exchange contracts and options written. Forward foreign currency exchange contracts are valued at the unrealized appreciation/depreciation on the instrument and options written are shown at value. | |
|
The Fund may hold assets and/or liabilities in which the fair value approximates the carrying amount for financial statement purposes. As of March 31, 2015, such assets and/or liabilities are categorized within the disclosure hierarchy as follows: | |
| |
| | | Level 1 | | Level 2 | | Level 3 | | Total |
Assets: | | | | | | | | | | | | | | | | | | | | |
Cash pledged as collateral for options written | | | $ | 11,387,775 | | | | | — | | | | | — | | | | $ | 11,387,775 | |
Foreign currency at value | | | | 67,343,198 | | | | | — | | | | | — | | | | | 67,343,198 | |
Liabilities: | | | | | | | | | | | | | | | | | | | | |
Collateral on securities loaned at value | | | | — | | | | $ | (7,494,299 | ) | | | | — | | | | | (7,494,299 | ) |
| | | | | |
Total | | | $ | 78,730,973 | | | | $ | (7,494,299 | ) | | | | — | | | | $ | 71,236,674 | |
| | | | | |
During the six months ended March 31, 2015, there were no transfers between levels.
See Notes to Financial Statements.
| | | | | | |
| 26 | | BLACKROCK FUNDS | | MARCH 31, 2015 | | |
| | | | |
| Schedule of Investments March 31, 2015 (Unaudited) | | | BlackRock International Opportunities Portfolio | |
| | | (Percentages shown are based on Net Assets) | |
| | | | | | | | |
| Common Stocks | | Shares | | | Value | |
Belgium — 1.7% | | | | | | | | |
Anheuser-Busch InBev NV | | | 153,379 | | | $ | 18,737,531 | |
Canada — 3.9% | | | | | | | | |
Element Financial Corp. (a) | | | 1,424,100 | | | | 19,249,609 | |
Enbridge, Inc. | | | 199,600 | | | | 9,621,081 | |
Gildan Activewear, Inc. | | | 321,900 | | | | 9,490,147 | |
MEG Energy Corp. (a) | | | 327,200 | | | | 5,285,628 | |
| | | | | | | | |
| | | | | | | | 43,646,465 | |
China — 5.7% | | | | | | | | |
Alibaba Group Holding Ltd. — ADR (a) | | | 97,558 | | | | 8,120,728 | |
Baidu, Inc. — ADR (a) | | | 64,650 | | | | 13,473,060 | |
Beijing Enterprises Water Group Ltd. | | | 12,430,000 | | | | 8,452,459 | |
China Construction Bank Corp., H Shares | | | 9,157,000 | | | | 7,600,192 | |
CSR Corp. Ltd., H Shares | | | 7,350,000 | | | | 9,708,164 | |
Qunar Cayman Islands Ltd. — ADR (a) | | | 157,900 | | | | 6,513,375 | |
Tencent Holdings Ltd. | | | 589,400 | | | | 11,192,657 | |
| | | | | | | | |
| | | | | | | | 65,060,635 | |
France — 6.1% | | | | | | | | |
AXA SA | | | 821,700 | | | | 20,681,435 | |
BNP Paribas SA | | | 223,923 | | | | 13,624,771 | |
Dassault Aviation SA | | | 1,338 | | | | 1,619,434 | |
Orange SA | | | 821,800 | | | | 13,197,696 | |
Schneider Electric SE | | | 117,234 | | | | 9,122,971 | |
Unibail-Rodamco SE | | | 42,000 | | | | 11,341,473 | |
| | | | | | | | |
| | | | | | | | 69,587,780 | |
Germany — 5.6% | | | | | | | | |
Bayer AG, Registered Shares | | | 89,300 | | | | 13,360,646 | |
Continental AG | | | 40,700 | | | | 9,584,669 | |
Henkel AG & Co. KGaA, Preference | | | 98,686 | | | | 11,591,744 | |
Infineon Technologies AG | | | 806,244 | | | | 9,591,792 | |
SAP SE | | | 169,400 | | | | 12,243,739 | |
Wacker Chemie AG | | | 63,700 | | | | 7,352,784 | |
| | | | | | | | |
| | | | | | | | 63,725,374 | |
Hong Kong — 2.2% | | | | | | | | |
AIA Group Ltd. | | | 2,733,700 | | | | 17,163,496 | |
Melco Crown Entertainment Ltd. — ADR | | | 341,100 | | | | 7,320,006 | |
| | | | | | | | |
| | | | | | | | 24,483,502 | |
India — 3.0% | | | | | | | | |
Bharti Infratel Ltd. | | | 618,886 | | | | 3,807,388 | |
HDFC Bank Ltd. | | | 684,855 | | | | 13,169,739 | |
ITC Ltd. | | | 1,288,500 | | | | 6,698,365 | |
Tata Motors Ltd. — ADR | | | 224,300 | | | | 10,106,958 | |
| | | | | | | | |
| | | | | | | | 33,782,450 | |
Indonesia — 1.1% | | | | | | | | |
Global Mediacom Tbk PT | | | 34,090,288 | | | | 4,556,009 | |
Matahari Department Store Tbk PT | | | 5,623,171 | | | | 8,456,209 | |
| | | | | | | | |
| | | | | | | | 13,012,218 | |
Ireland — 5.7% | | | | | | | | |
Dalata Hotel Group PLC (a) | | | 2,063,626 | | | | 8,099,003 | |
Green REIT PLC | | | 5,393,585 | | | | 9,487,866 | |
Kingspan Group PLC | | | 568,679 | | | | 10,835,228 | |
Ryanair Holdings PLC — ADR | | | 206,784 | | | | 13,806,968 | |
Shire PLC — ADR | | | 92,200 | | | | 22,062,538 | |
| | | | | | | | |
| | | | | | | | 64,291,603 | |
Israel — 2.4% | | | | | | | | |
Teva Pharmaceutical Industries Ltd. — ADR | | | 437,700 | | | | 27,268,710 | |
| | | | | | | | |
| Common Stocks | | Shares | | | Value | |
Italy — 2.4% | | | | | | | | |
Banca Generali SpA | | | 482,800 | | | $ | 15,138,393 | |
UniCredit SpA | | | 1,814,846 | | | | 12,306,952 | |
| | | | | | | | |
| | | | | | | | 27,445,345 | |
Japan — 8.5% | | | | | | | | |
Chugai Pharmaceutical Co. Ltd. | | | 238,600 | | | | 7,530,437 | |
FANUC Corp. | | | 42,800 | | | | 9,343,831 | |
Mitsubishi Estate Co. Ltd. | | | 688,000 | | | | 15,956,073 | |
Nabtesco Corp. | | | 462,100 | | | | 13,349,713 | |
ORIX Corp. | | | 654,000 | | | | 9,189,438 | |
Shinsei Bank Ltd. | | | 5,974,000 | | | | 11,878,337 | |
SMC Corp. | | | 36,600 | | | | 10,898,155 | |
Toyota Motor Corp. | | | 266,800 | | | | 18,623,635 | |
| | | | | | | | |
| | | | | | | | 96,769,619 | |
Mexico — 0.6% | | | | | | | | |
Cemex SAB de CV — ADR (a) | | | 744,756 | | | | 7,052,839 | |
Netherlands — 4.5% | | | | | | | | |
Aalberts Industries NV | | | 339,505 | | | | 10,685,010 | |
ASML Holding NV | | | 109,900 | | | | 11,141,562 | |
Koninklijke Philips NV | | | 191,600 | | | | 5,435,665 | |
Royal Dutch Shell PLC, A Shares | | | 782,500 | | | | 23,348,670 | |
| | | | | | | | |
| | | | | | | | 50,610,907 | |
New Zealand — 1.3% | | | | | | | | |
Xero Ltd. (a) | | | 272,500 | | | | 4,889,527 | |
Xero Ltd. (Acquired 10/15/13, cost $8,211,297) (a)(b) | | | 540,000 | | | | 9,729,292 | |
| | | | | | | | |
| | | | | | | | 14,618,819 | |
Nigeria — 0.4% | | | | | | | | |
Lekoil Ltd. (a) | | | 13,810,100 | | | | 4,814,164 | |
Norway — 1.3% | | | | | | | | |
Statoil ASA | | | 828,700 | | | | 14,652,584 | |
Peru — 0.6% | | | | | | | | |
Credicorp Ltd. | | | 46,800 | | | | 6,581,484 | |
South Africa — 0.9% | | | | | | | | |
Naspers Ltd., N Shares | | | 67,300 | | | | 10,323,215 | |
South Korea — 2.8% | | | | | | | | |
Coway Co. Ltd. | | | 86,300 | | | | 7,102,913 | |
Samsung Electronics Co. Ltd. | | | 12,737 | | | | 16,516,748 | |
SK Hynix, Inc. | | | 184,100 | | | | 7,519,865 | |
| | | | | | | | |
| | | | | | | | 31,139,526 | |
Spain — 1.6% | | | | | | | | |
NH Hotel Group SA (a) | | | 1,737,747 | | | | 9,488,805 | |
Sacyr SA (a)(c) | | | 2,099,937 | | | | 8,811,810 | |
| | | | | | | | |
| | | | | | | | 18,300,615 | |
Sweden — 1.3% | | | | | | | | |
Nordea Bank AB | | | 1,195,600 | | | | 14,562,979 | |
Switzerland — 8.6% | | | | | | | | |
Actelion Ltd., Registered Shares | | | 61,855 | | | | 7,133,957 | |
Adecco SA, Registered Shares | | | 77,700 | | | | 6,458,696 | |
Novartis AG, Registered Shares | | | 387,400 | | | | 38,236,569 | |
Roche Holding AG | | | 108,814 | | | | 29,901,228 | |
UBS Group AG (a) | | | 831,000 | | | | 15,582,174 | |
| | | | | | | | |
| | | | | | | | 97,312,624 | |
Taiwan — 1.4% | | | | | | | | |
Hermes Microvision, Inc. | | | 167,510 | | | | 9,637,189 | |
See Notes to Financial Statements.
| | | | | | |
| | | BLACKROCK FUNDS | | MARCH 31, 2015 | | 27 |
| | | | |
| Schedule of Investments (continued) | |
| BlackRock International Opportunities Portfolio
(Percentages shown are based on Net Assets) |
|
| | | | | | | | |
| Common Stocks | | Shares | | | Value | |
Taiwan (concluded) | | | | | | | | |
Largan Precision Co. Ltd. | | | 70,000 | | | $ | 6,017,759 | |
| | | | | | | | |
| | | | | | | | 15,654,948 | |
United Kingdom — 20.4% | | | | | | | | |
ARM Holdings PLC | | | 612,900 | | | | 9,954,232 | |
AstraZeneca PLC | | | 415,800 | | | | 28,531,424 | |
BAE Systems PLC | | | 1,510,300 | | | | 11,704,110 | |
BP PLC | | | 1,699,000 | | | | 11,013,145 | |
Crest Nicholson Holdings PLC | | | 1,570,922 | | | | 9,892,481 | |
Diageo PLC | | | 319,500 | | | | 8,829,129 | |
Hargreaves Lansdown PLC | | | 305,245 | | | | 5,206,609 | |
Imperial Tobacco Group PLC | | | 500,100 | | | | 21,937,419 | |
Kennedy Wilson Europe Real Estate PLC | | | 763,998 | | | | 12,455,069 | |
Liberty Global PLC, Series A (a) | | | 454,300 | | | | 23,382,821 | |
Lloyds Banking Group PLC | | | 11,858,300 | | | | 13,745,337 | |
Metro Bank PLC, (Acquired 1/15/14, cost $9,137,436) (a)(b) | | | 429,853 | | | | 8,461,495 | |
Nomad Holdings Ltd. (a) | | | 894,145 | | | | 10,059,131 | |
Prudential PLC | | | 442,000 | | | | 10,968,375 | |
SABMiller PLC | | | 346,500 | | | | 18,150,202 | |
Vodafone Group PLC | | | 3,504,500 | | | | 11,467,811 | |
Whitbread PLC | | | 189,800 | | | | 14,737,888 | |
| | | | | | | | |
| | | | | | | | 230,496,678 | |
United States — 2.3% | | | | | | | | |
Las Vegas Sands Corp. | | | 102,500 | | | | 5,641,600 | |
Samsonite International SA | | | 4,483,500 | | | | 15,585,680 | |
Sensata Technologies Holding NV (a) | | | 80,800 | | | | 4,641,960 | |
| | | | | | | | |
| | | | | | | | 25,869,240 | |
Total Common Stocks — 96.3% | | | | | | | 1,089,801,854 | |
| | | | | | | | |
| | | | | | | |
| | | | | | | | |
| Preferred Stocks | | Shares | | | Value | |
India — 1.1% | | | | | | | | |
Snapdeal.com, Series F (Acquired 5/07/14,
cost $5,268,843) (a)(b) | | | 749 | | | $ | 8,951,012 | |
Snapdeal.com, Series G (Acquired 10/29/14,
cost $2,090,847) (a)(b) | | | 248 | | | | 2,963,753 | |
Total Preferred Stocks — 1.1% | | | | | | | 11,914,765 | |
| | | | | | | | |
| | | | | | | |
Warrants (d) | | | | | | | | |
United Kingdom — 0.0% | | | | | | | | |
Nomad Holdings Ltd. (issued 4/10/14, expiring 4/10/17, strike price $11.50) | | | 894,145 | | | | 362,129 | |
Total Warrants — 0.0% | | | | | | | 362,129 | |
Total Long-Term Investments (Cost — $962,132,301) — 97.4% | | | | 1,102,078,748 | |
| | | | | | | | |
| | | | | | | |
Short-Term Securities | | | | | | | | |
BlackRock Liquidity Funds, TempFund, Institutional Class, 0.06% (e)(f) | | | 5,797,795 | | | | 5,797,795 | |
| Short-Term Securities | | Beneficial
Interest
(000) | | | | |
BlackRock Liquidity Series, LLC, Money Market Series, 0.22% (e)(f)(g) | | $ | 1,431 | | | | 1,430,717 | |
Total Short-Term Securities
(Cost — $7,228,512) — 0.6% | | | | | | | 7,228,512 | |
Total Investments (Cost — $969,360,813) — 98.0% | | | | 1,109,307,260 | |
Other Assets Less Liabilities — 2.0% | | | | 22,650,670 | |
| | | | | | | | |
Net Assets — 100.0% | | | | | | $ | 1,131,957,930 | |
| | | | | | | | |
|
| Notes to Schedule of Investments |
| (a) | Non-income producing security. |
| (b) | Restricted security as to resale. As of report date, the Fund held restricted securities with a current value of $30,105,552 and an original cost of $24,708,423, which was 2.7% of its net assets. |
| (c) | Security, or a portion of security, is on loan. |
| (d) | Warrants entitle the Fund to purchase a predetermined number of shares of common stock and are non-income producing. The purchase price and number of shares are subject to adjustment under certain conditions until the expiration date of the warrants, if any. |
| (e) | During the six months ended March 31, 2015, investments in issuers considered to be affiliates of the Fund for purposes of Section 2(a)(3) of the Investment Company Act of 1940, as amended, were as follows: |
| | | | | | | | | | | | | | | | |
| Affiliate | | Shares/
Beneficial
Interest Held at
September 30,
2014 | | | Net Activity | | | Shares/
Beneficial
Interest
Held at
March 31,
2015 | | | Income | |
BlackRock Liquidity Funds, TempFund, Institutional Class | | | 14,744,969 | | | | (8,947,174 | ) | | | 5,797,795 | | | $ | 2,254 | |
BlackRock Liquidity Series, LLC, Money Market Series | | $ | 18,399,705 | | | $ | (16,968,988 | ) | | $ | 1,430,717 | | | $ | 97,820 | |
| (f) | Represents the current yield as of report date. |
| (g) | Security was purchased with the cash collateral from loaned securities. The Fund may withdraw up to 25% of its investment daily, although the manager of the BlackRock Liquidity Series, LLC, Money Market Series, in its sole discretion, may permit an investor to withdraw more than 25% on any one day. |
See Notes to Financial Statements.
| | | | | | |
| 28 | | BLACKROCK FUNDS | | MARCH 31, 2015 | | |
| | | | |
| Schedule of Investments (continued) | | | BlackRock International Opportunities Portfolio | |
| Ÿ | | As of March 31, 2015, forward foreign currency exchange contracts outstanding were as follows: |
| | | | | | | | | | | | | | | | | | | | |
Currency Purchased | | | | | Currency Sold | | | | | Counterparty | | Settlement
Date | | | Unrealized
Appreciation
(Depreciation) | |
| AUD | | | 40,880,000 | | | USD | | | 33,354,871 | | | Morgan Stanley Capital Services LLC | | | 4/22/15 | | | $ | (2,260,464 | ) |
| CAD | | | 11,401,000 | | | USD | | | 9,250,229 | | | Bank of America N.A. | | | 4/22/15 | | | | (251,034 | ) |
| CAD | | | 1,999,000 | | | USD | | | 1,574,420 | | | Goldman Sachs International | | | 4/22/15 | | | | 3,458 | |
| CAD | | | 10,533,000 | | | USD | | | 8,464,407 | | | Goldman Sachs International | | | 4/22/15 | | | | (150,353 | ) |
| CHF | | | 23,673,753 | | | USD | | | 27,717,777 | | | Deutsche Bank AG | | | 4/22/15 | | | | (3,334,530 | ) |
| DKK | | | 82,084,250 | | | USD | | | 12,831,218 | | | Goldman Sachs International | | | 4/22/15 | | | | (1,008,838 | ) |
| EUR | | | 406,623 | | | USD | | | 431,299 | | | BNP Paribas S.A. | | | 4/22/15 | | | | 6,055 | |
| EUR | | | 2,140,434 | | | USD | | | 2,264,337 | | | BNP Paribas S.A. | | | 4/22/15 | | | | 37,864 | |
| EUR | | | 417,459 | | | USD | | | 481,719 | | | Citibank N.A. | | | 4/22/15 | | | | (32,710 | ) |
| EUR | | | 825,105 | | | USD | | | 879,602 | | | Citibank N.A. | | | 4/22/15 | | | | 7,862 | |
| EUR | | | 1,879,365 | | | USD | | | 2,146,092 | | | Citibank N.A. | | | 4/22/15 | | | | (124,691 | ) |
| EUR | | | 11,036,132 | | | USD | | | 12,006,506 | | | Deutsche Bank AG | | | 4/22/15 | | | | (136,302 | ) |
| EUR | | | 1,379,605 | | | USD | | | 1,555,547 | | | Goldman Sachs International | | | 4/22/15 | | | | (71,675 | ) |
| EUR | | | 6,126,056 | | | USD | | | 6,966,464 | | | Goldman Sachs International | | | 4/22/15 | | | | (377,423 | ) |
| EUR | | | 1,523,622 | | | USD | | | 1,614,384 | | | Royal Bank of Scotland PLC | | | 4/22/15 | | | | 24,388 | |
| EUR | | | 7,303,530 | | | USD | | | 7,909,679 | | | Royal Bank of Scotland PLC | | | 4/22/15 | | | | (54,174 | ) |
| EUR | | | 1,459,206 | | | USD | | | 1,550,319 | | | State Street Bank and Trust Co. | | | 4/22/15 | | | | 19,169 | |
| EUR | | | 1,572,119 | | | USD | | | 1,713,569 | | | State Street Bank and Trust Co. | | | 4/22/15 | | | | (22,634 | ) |
| EUR | | | 3,933,608 | | | USD | | | 4,435,539 | | | State Street Bank and Trust Co. | | | 4/22/15 | | | | (204,643 | ) |
| EUR | | | 5,514,866 | | | USD | | | 5,968,606 | | | State Street Bank and Trust Co. | | | 4/22/15 | | | | (36,946 | ) |
| EUR | | | 64,992 | | | USD | | | 74,394 | | | TD Securities, Inc. | | | 4/22/15 | | | | (4,490 | ) |
| EUR | | | 457,205 | | | USD | | | 498,257 | | | The Bank of New York Mellon | | | 4/22/15 | | | | (6,498 | ) |
| EUR | | | 302,217 | | | USD | | | 318,819 | | | UBS AG | | | 4/22/15 | | | | 6,239 | |
| EUR | | | 1,761,878 | | | USD | | | 1,858,663 | | | UBS AG | | | 4/22/15 | | | | 36,371 | |
| GBP | | | 7,799,000 | | | USD | | | 11,742,011 | | | Goldman Sachs International | | | 4/22/15 | | | | (174,788 | ) |
| GBP | | | 380,000 | | | USD | | | 573,934 | | | Royal Bank of Scotland PLC | | | 4/22/15 | | | | (10,330 | ) |
| GBP | | | 2,416,000 | | | USD | | | 3,579,611 | | | State Street Bank and Trust Co. | | | 4/22/15 | | | | 3,722 | |
| GBP | | | 6,107,000 | | | USD | | | 9,194,101 | | | State Street Bank and Trust Co. | | | 4/22/15 | | | | (136,397 | ) |
| GBP | | | 8,597,000 | | | USD | | | 13,229,506 | | | State Street Bank and Trust Co. | | | 4/22/15 | | | | (478,715 | ) |
| GBP | | | 1,938,000 | | | USD | | | 2,948,936 | | | TD Securities, Inc. | | | 4/22/15 | | | | (74,558 | ) |
| GBP | | | 3,568,000 | | | USD | | | 5,434,642 | | | TD Securities, Inc. | | | 4/22/15 | | | | (142,700 | ) |
| HKD | | | 85,315,000 | | | USD | | | 10,999,942 | | | The Bank of New York Mellon | | | 4/22/15 | | | | 3,964 | |
| JPY | | | 1,229,424,000 | | | USD | | | 10,418,091 | | | Goldman Sachs International | | | 4/22/15 | | | | (163,733 | ) |
| JPY | | | 5,001,944,880 | | | USD | | | 42,954,322 | | | Goldman Sachs International | | | 4/22/15 | | | | (1,234,190 | ) |
| JPY | | | 305,858,000 | | | USD | | | 2,546,745 | | | TD Securities, Inc. | | | 4/22/15 | | | | 4,350 | |
| JPY | | | 315,081,000 | | | USD | | | 2,681,607 | | | TD Securities, Inc. | | | 4/22/15 | | | | (53,585 | ) |
| JPY | | | 921,499,000 | | | USD | | | 7,738,669 | | | The Bank of New York Mellon | | | 4/22/15 | | | | (52,646 | ) |
| MXN | | | 97,156,000 | | | USD | | | 6,594,681 | | | BNP Paribas S.A. | | | 4/22/15 | | | | (234,797 | ) |
| NOK | | | 27,050,000 | | | USD | | | 3,367,621 | | | Goldman Sachs International | | | 4/22/15 | | | | (11,998 | ) |
| NOK | | | 1,587,000 | | | USD | | | 206,820 | | | The Bank of New York Mellon | | | 4/22/15 | | | | (9,948 | ) |
| SEK | | | 105,186,000 | | | USD | | | 12,921,065 | | | HSBC Bank PLC | | | 4/22/15 | | | | (703,266 | ) |
| SGD | | | 21,429,000 | | | USD | | | 16,110,310 | | | TD Securities, Inc. | | | 4/22/15 | | | | (503,912 | ) |
| TRY | | | 21,267,000 | | | USD | | | 9,015,826 | | | Citibank N.A. | | | 4/22/15 | | | | (885,256 | ) |
| USD | | | 6,212,053 | | | AUD | | | 7,605,000 | | | Bank of America N.A. | | | 4/22/15 | | | | 427,489 | |
| USD | | | 319,453 | | | CAD | | | 383,058 | | | Morgan Stanley Capital Services LLC | | | 4/22/15 | | | | 17,093 | |
| USD | | | 2,233,113 | | | CAD | | | 2,800,000 | | | TD Securities, Inc. | | | 4/22/15 | | | | 22,978 | |
| USD | | | 6,274,390 | | | CAD | | | 7,774,000 | | | UBS AG | | | 4/22/15 | | | | 138,108 | |
| USD | | | 27,018,664 | | | CHF | | | 23,673,753 | | | Goldman Sachs International | | | 4/22/15 | | | | 2,635,417 | |
| USD | | | 3,656,579 | | | EUR | | | 3,223,468 | | | Bank of America N.A. | | | 4/22/15 | | | | 189,493 | |
See Notes to Financial Statements.
| | | | | | |
| | | BLACKROCK FUNDS | | MARCH 31, 2015 | | 29 |
| | | | |
| Schedule of Investments (continued) | | | BlackRock International Opportunities Portfolio | |
As of March 31, 2015, forward foreign currency exchange contracts outstanding were as follows: (concluded)
| | | | | | | | | | | | | | | | | | | | |
Currency Purchased | | | | | Currency Sold | | | | | Counterparty | | Settlement
Date | | | Unrealized
Appreciation
(Depreciation) | |
| USD | | | 10,922,013 | | | EUR | | | 9,458,000 | | | Bank of America N.A. | | | 4/22/15 | | | $ | 749,211 | |
| USD | | | 394,653 | | | EUR | | | 345,399 | | | BNP Paribas S.A. | | | 4/22/15 | | | | 23,151 | |
| USD | | | 1,982,346 | | | EUR | | | 1,741,645 | | | Citibank N.A. | | | 4/22/15 | | | | 109,073 | |
| USD | | | 43,346,959 | | | EUR | | | 37,286,744 | | | Goldman Sachs International | | | 4/22/15 | | | | 3,242,215 | |
| USD | | | 6,420,701 | | | EUR | | | 5,643,000 | | | JPMorgan Chase Bank N.A. | | | 4/22/15 | | | | 351,223 | |
| USD | | | 16,300,908 | | | EUR | | | 14,280,102 | | | Royal Bank of Canada | | | 4/22/15 | | | | 941,566 | |
| USD | | | 7,661,344 | | | EUR | | | 7,057,000 | | | State Street Bank and Trust Co. | | | 4/22/15 | | | | 71,001 | |
| USD | | | 749,417 | | | EUR | | | 658,689 | | | TD Securities, Inc. | | | 4/22/15 | | | | 40,946 | |
| USD | | | 2,875,009 | | | EUR | | | 2,515,811 | | | The Bank of New York Mellon | | | 4/22/15 | | | | 169,061 | |
| USD | | | 1,361,273 | | | EUR | | | 1,197,260 | | | UBS AG | | | 4/22/15 | | | | 73,529 | |
| USD | | | 6,595,067 | | | GBP | | | 4,461,000 | | | BNP Paribas S.A. | | | 4/22/15 | | | | (21,344 | ) |
| USD | | | 425,240 | | | GBP | | | 290,000 | | | Citibank N.A. | | | 4/22/15 | | | | (4,879 | ) |
| USD | | | 6,428,401 | | | GBP | | | 4,281,000 | | | Deutsche Bank AG | | | 4/22/15 | | | | 78,961 | |
| USD | | | 3,691,199 | | | GBP | | | 2,505,000 | | | Morgan Stanley Capital Services LLC | | | 4/22/15 | | | | (24,136 | ) |
| USD | | | 56,580,463 | | | GBP | | | 37,274,324 | | | Morgan Stanley Capital Services LLC | | | 4/22/15 | | | | 1,296,397 | |
| USD | | | 6,687,292 | | | GBP | | | 4,459,000 | | | State Street Bank and Trust Co. | | | 4/22/15 | | | | 73,848 | |
| USD | | | 8,586,435 | | | GBP | | | 5,816,000 | | | State Street Bank and Trust Co. | | | 4/22/15 | | | | (39,668 | ) |
| USD | | | 9,888,557 | | | GBP | | | 6,643,000 | | | State Street Bank and Trust Co. | | | 4/22/15 | | | | 35,876 | |
| USD | | | 3,243,979 | | | GBP | | | 2,157,000 | | | TD Securities, Inc. | | | 4/22/15 | | | | 44,787 | |
| USD | | | 7,640,406 | | | GBP | | | 5,126,000 | | | UBS AG | | | 4/22/15 | | | | 37,689 | |
| USD | | | 6,437,740 | | | HKD | | | 49,913,000 | | | State Street Bank and Trust Co. | | | 4/22/15 | | | | (25 | ) |
| USD | | | 6,498,917 | | | JPY | | | 764,632,000 | | | Barclays Bank PLC | | | 4/22/15 | | | | 121,288 | |
| USD | | | 6,092,278 | | | JPY | | | 723,920,000 | | | Deutsche Bank AG | | | 4/22/15 | | | | 54,219 | |
| USD | | | 1,237,722 | | | JPY | | | 147,831,000 | | | Goldman Sachs International | | | 4/22/15 | | | | 4,696 | |
| USD | | | 3,714,250 | | | NOK | | | 29,036,000 | | | Goldman Sachs International | | | 4/22/15 | | | | 112,259 | |
| USD | | | 7,010,757 | | | NOK | | | 53,913,000 | | | Goldman Sachs International | | | 4/22/15 | | | | 322,709 | |
| USD | | | 2,723,726 | | | NOK | | | 20,711,000 | | | Morgan Stanley Capital Services LLC | | | 4/22/15 | | | | 154,473 | |
| USD | | | 12,008,646 | | | NZD | | | 15,512,000 | | | Morgan Stanley Capital Services LLC | | | 4/22/15 | | | | 438,212 | |
| ZAR | | | 23,596,000 | | | USD | | | 2,013,018 | | | State Street Bank and Trust Co. | | | 4/22/15 | | | | (75,050 | ) |
| ZAR | | | 59,267,000 | | | USD | | | 5,056,177 | | | State Street Bank and Trust Co. | | | 4/22/15 | | | | (188,507 | ) |
| Total | | | | | | | | | | | | | | | | | | $ | (1,171,423 | ) |
| | | | | | | | | | | | | | | | | | | | |
| Ÿ | | Fair Value Measurements — Various inputs are used in determining the fair value of investments and derivative financial instruments. These inputs to valuation techniques are categorized into a disclosure hierarchy consisting of three broad levels for financial statement purposes. The hierarchy gives the highest priority to unadjusted quoted prices in active markets for identical assets or liabilities (Level 1 measurements) and the lowest priority to unobservable inputs (Level 3 measurements). Accordingly, the degree of judgment exercised in determining fair value is greatest for instruments categorized in Level 3. The inputs used to measure fair value may fall into different levels of the fair value hierarchy. In such cases, for disclosure purposes, the fair value hierarchy classification is determined based on the lowest level input that is significant to the fair value measurement in its entirety. The categorization of a value determined for investments and derivative financial instruments is based on the pricing transparency of the investment and derivative financial instruments and is not necessarily an indication of the risks associated with investing in those securities. The three levels of the fair value hierarchy are as follows: |
| | Ÿ | | Level 1 – unadjusted quoted prices in active markets/exchanges for identical assets or liabilities that the Fund has the ability to access |
| | Ÿ | | Level 2 – other observable inputs (including, but not limited to, quoted prices for similar assets or liabilities in markets that are active, quoted prices for identical or similar assets or liabilities in markets that are not active, inputs other than quoted prices that are observable for the assets or liabilities (such as interest rates, yield curves,volatilities, prepayment speeds, loss severities, credit risks and default rates) or other market–corroborated inputs) |
| | Ÿ | | Level 3 – unobservable inputs based on the best information available in the circumstances, to the extent observable inputs are not available (including the Fund’s own assumptions used in determining the fair value of investments and derivative financial instruments) |
Changes in valuation techniques may result in transfers into or out of an assigned level within the disclosure hierarchy. In accordance with the Fund’s policy, transfers between different levels of the fair value disclosure hierarchy are deemed to have occurred as of the beginning of the reporting period. For information about the Fund’s policy regarding valuation of investments and derivative financial instruments, refer to Note 2 of the Notes to Financial Statements.
See Notes to Financial Statements.
| | | | | | |
| 30 | | BLACKROCK FUNDS | | MARCH 31, 2015 | | |
| | | | |
| Schedule of Investments (continued) | | | BlackRock International Opportunities Portfolio | |
As of March 31, 2015, the following tables summarize the Fund’s investments and derivative financial instruments categorized in the disclosure hierarchy:
| | | | | | | | | | | | | | | | | | | | |
| | | Level 1 | | Level 2 | | Level 3 | | Total |
Assets: | | | | | | | | | | | | | | | | | | | | |
Investments: | | | | | | | | | | | | | | | | | | | | |
Long-Term Investments: | | | | | | | | | | | | | | | | | | | | |
Common Stocks: | | | | | | | | | | | | | | | | | | | | |
Belgium | | | | — | | | | $ | 18,737,531 | | | | | — | | | | $ | 18,737,531 | |
Canada | | | $ | 43,646,465 | | | | | — | | | | | — | | | | | 43,646,465 | |
China | | | | 28,107,163 | | | | | 36,953,472 | | | | | — | | | | | 65,060,635 | |
France | | | | — | | | | | 69,587,780 | | | | | — | | | | | 69,587,780 | |
Germany | | | | — | | | | | 63,725,374 | | | | | — | | | | | 63,725,374 | |
Hong Kong | | | | 7,320,006 | | | | | 17,163,496 | | | | | — | | | | | 24,483,502 | |
India | | | | 13,914,346 | | | | | 19,868,104 | | | | | — | | | | | 33,782,450 | |
Indonesia | | | | — | | | | | 13,012,218 | | | | | — | | | | | 13,012,218 | |
Ireland | | | | 53,456,375 | | | | | 10,835,228 | | | | | — | | | | | 64,291,603 | |
Israel | | | | 27,268,710 | | | | | — | | | | | — | | | | | 27,268,710 | |
Italy | | | | — | | | | | 27,445,345 | | | | | — | | | | | 27,445,345 | |
Japan | | | | — | | | | | 96,769,619 | | | | | — | | | | | 96,769,619 | |
Mexico | | | | 7,052,839 | | | | | — | | | | | — | | | | | 7,052,839 | |
Netherlands | | | | — | | | | | 50,610,907 | | | | | — | | | | | 50,610,907 | |
New Zealand | | | | 9,729,292 | | | | | 4,889,527 | | | | | — | | | | | 14,618,819 | |
Nigeria | | | | 4,814,164 | | | | | — | | | | | — | | | | | 4,814,164 | |
Norway | | | | — | | | | | 14,652,584 | | | | | — | | | | | 14,652,584 | |
Peru | | | | 6,581,484 | | | | | — | | | | | — | | | | | 6,581,484 | |
South Africa | | | | — | | | | | 10,323,215 | | | | | — | | | | | 10,323,215 | |
South Korea | | | | — | | | | | 31,139,526 | | | | | — | | | | | 31,139,526 | |
Spain | | | | — | | | | | 18,300,615 | | | | | — | | | | | 18,300,615 | |
Sweden | | | | — | | | | | 14,562,979 | | | | | — | | | | | 14,562,979 | |
Switzerland | | | | — | | | | | 97,312,624 | | | | | — | | | | | 97,312,624 | |
Taiwan | | | | — | | | | | 15,654,948 | | | | | — | | | | | 15,654,948 | |
United Kingdom | | | | 35,837,890 | | | | | 186,197,293 | | | | $ | 8,461,495 | | | | | 230,496,678 | |
United States | | | | 10,283,560 | | | | | 15,585,680 | | | | | — | | | | | 25,869,240 | |
Preferred Stocks: | | | | | | | | | | | | | | | | | | | | |
India | | | | — | | | | | — | | | | | 11,914,765 | | | | | 11,914,765 | |
Warrants | | | | — | | | | | 362,129 | | | | | — | | | | | 362,129 | |
Short-Term Securities | | | | 5,797,795 | | | | | 1,430,717 | | | | | — | | | | | 7,228,512 | |
| | | | | |
Total | | | $ | 253,810,089 | | | | $ | 835,120,911 | | | | $ | 20,376,260 | | | | $ | 1,109,307,260 | |
| | | | | |
| | | | | | | | | | | | | | | | | | | | |
| | | Level 1 | | Level 2 | | Level 3 | | Total |
Derivative Financial Instruments1 | | | | | | | | | | | | | | | | | | | | |
Assets: | | | | | | | | | | | | | | | | | | | | |
Forward foreign currency exchange contracts | | | | — | | | | $ | 12,130,410 | | | | | — | | | | $ | 12,130,410 | |
Liabilities: | | | | | | | | | | | | | | | | | | | | |
Forward foreign currency exchange contracts | | | | — | | | | | (13,301,833 | ) | | | | — | | | | | (13,301,833 | ) |
| | | | | |
Total | | | | — | | | | $ | (1,171,423 | ) | | | | — | | | | $ | (1,171,423 | ) |
| | | | | |
1 Derivative financial instruments are forward foreign currency exchange contracts, which are valued at the unrealized appreciation/depreciation on the instrument. | |
See Notes to Financial Statements.
| | | | | | |
| | | BLACKROCK FUNDS | | MARCH 31, 2015 | | 31 |
| | | | |
| Schedule of Investments (concluded) | | | BlackRock International Opportunities Portfolio | |
The Fund may hold assets and/or liabilities in which the fair value approximates the carrying amount for financial statement purposes. As of March 31, 2015, such assets and/or liabilities are categorized within the disclosure hierarchy as follows:
| | | | | | | | | | | | | | | | | | | | |
| | | Level 1 | | Level 2 | | Level 3 | | Total |
Assets: | | | | | | | | | | | | | | | | | | | | |
Foreign currency at value | | | $ | 111,499 | | | | | — | | | | | — | | | | $ | 111,499 | |
Liabilities: | | | | | | | | | | | | | | | | | | | | |
Collateral on securities loaned at value | | | | — | | | | $ | (1,430,717 | ) | | | | — | | | | | (1,430,717 | ) |
| | | | | |
Total | | | $ | 111,499 | | | | $ | (1,430,717 | ) | | | | — | | | | $ | (1,319,218 | ) |
| | | | | |
| | | | |
Transfers between Level 1 and Level 2 were as follows: | | | | | | | | | | | | | | | | | | | | |
| | | Transfers into Level 1 | | Transfers out
of Level 11 | | Transfers into
Level 21 | | Transfers out
of Level 2 |
Assets: | | | | | | | | | | | | | | | | | | | | |
Long-Term Investments: | | | | | | | | | | | | | | | | | | | | |
Ireland | | | | — | | | | $ | (9,107,713 | ) | | | $ | 9,107,713 | | | | | — | |
United Kingdom | | | | — | | | | | (10,649,267 | ) | | | | 10,649,267 | | | | | — | |
United States | | | | — | | | | | (16,389,885 | ) | | | | 16,389,885 | | | | | — | |
| | | | | |
Total | | | | — | | | | $ | (36,146,865 | ) | | | $ | 36,146,865 | | | | | — | |
| | | | | |
1 External pricing service used to reflect any significant market movements between the time the Fund valued such foreign securities and the earlier closing of foreign markets. | |
|
| A reconciliation of Level 3 investments is presented when the Fund had a significant amount of Level 3 investments at the beginning and/or end of the period in relation to net assets. The following table is a reconciliation of Level 3 investments for which significant unobservable inputs were used in determining fair value: | |
|
| |
| | | | | | | | | | | | | | | |
| | | Common Stocks | | Preferred Stocks | | Total |
Assets: | | | | | | | | | | | | | | | |
Opening Balance, as of September 30, 2014 | | | $ | 9,066,043 | | | | $ | 5,125,544 | | | | $ | 14,191,587 | |
Transfers into Level 3 | | | | — | | | | | — | | | | | — | |
Transfers out of Level 3 | | | | — | | | | | — | | | | | — | |
Accrued discounts/premiums | | | | — | | | | | — | | | | | — | |
Net realized gain (loss) | | | | — | | | | | — | | | | | — | |
Net change in unrealized appreciation/depreciation2,3 | | | | (604,548 | ) | | | | 4,698,375 | | | | | 4,093,827 | |
Purchases | | | | — | | | | | 2,090,846 | | | | | 2,090,846 | |
Sales | | | | — | | | | | — | | | | | — | |
Closing Balance, as of March 31, 2015 | | | $ | 8,461,495 | | | | $ | 11,914,765 | | | | $ | 20,376,260 | |
| | | | | |
Net change in unrealized appreciation/depreciation on investments still held at March 31, 20153 | | | $ | (604,548 | ) | | | $ | 4,698,375 | | | | $ | 4,093,827 | |
| | | | | |
2 Included in the related net change in unrealized appreciation/depreciation in the Statements of Operations. | |
3 Any difference between Net change in unrealized appreciation/depreciation and Net change in unrealized appreciation/depreciation on investments still held at March 31, 2015, is generally due to investments no longer held or categorized as Level 3 at period end. | |
The following table summarizes the valuation techniques used and unobservable inputs utilized by the BlackRock Global Valuation Methodologies Committee (the “Global Valuation Committee”) to determine the value of certain of the Fund’s Level 3 investments as of March 31, 2015.
| | | | | | | | | | | | |
| | | Value | | | Valuation Techniques | | Unobservable Inputs | | Range of
Unobservable Inputs
Utilized | |
Assets: | | | | | | | | | | | | |
Common Stocks. | | $ | 8,461,495 | | | Market Comparable Companies | | Price to Tangible Book Value Multiple4 | | | 1.8x | |
Preferred Stocks5 | | | 11,914,765 | | | Probability-Weighted Expected Return Model | | Years to IPO6 | | | 1.2-3.2 | |
| | | | | | | | IPO Exit Probability4 | | | 75.00% | |
| | | | | | | | Discount Rate6 | | | 25.00% | |
| | | | | | | | Revenue Multiple4 | | | 0.84x-1.87x | |
| | | | |
Total | | $ | 20,376,260 | | | | | | | | | |
| | | | |
| | 4 | | Increase in unobservable input may result in a significant increase to value, while a decrease in the unobservable input may result in a significant decrease to value. |
| | 5 | | For the period ended March 31, 2015, the valuation technique for certain investments classified as preferred stocks changed to a Probability-Weighted Expected Return Model. The investments were previously valued utilizing a market comparable company and option pricing model approach. A Probability-Weighted Expected Return Model was considered to be a more relevant measure of fair value for these investments which leverages secondary market transactions. |
| | 6 | | Decrease in unobservable input may result in a significant increase to value, while an increase in the unobservable input may result in a significant decrease to value. |
See Notes to Financial Statements.
| | | | | | |
| 32 | | BLACKROCK FUNDS | | MARCH 31, 2015 | | |
| | | | |
| Schedule of Investments March 31, 2015 (Unaudited) | | | BlackRock Science & Technology Opportunities Portfolio | |
| | | (Percentages shown are based on Net Assets) | |
| | | | | | | | |
| Common Stocks | | Shares | | | Value | |
Commercial Services & Supplies — 0.4% | | | | | | | | |
Atento SA (a) | | | 83,800 | | | $ | 996,382 | |
Communications Equipment — 2.2% | | | | | | | | |
Finisar Corp. (a) | | | 122,300 | | | | 2,609,882 | |
JDS Uniphase Corp. (a) | | | 198,400 | | | | 2,603,008 | |
| | | | | | | | |
| | | | | | | | 5,212,890 | |
Consumer Finance — 0.2% | | | | | | | | |
Trustbuddy AB (a) | | | 6,696,207 | | | | 474,293 | |
Diversified Telecommunication Services — 0.6% | | | | | | | | |
Link Net Tbk PT (a) | | | 3,230,500 | | | | 1,476,271 | |
Electronic Equipment, Instruments & Components — 2.5% | | | | | |
Alps Electric Co. Ltd. | | | 53,700 | | | | 1,293,060 | |
CDW Corp. | | | 38,300 | | | | 1,426,292 | |
Largan Precision Co. Ltd. | | | 22,000 | | | | 1,891,296 | |
PAX Global Technology Ltd. (a) | | | 1,373,000 | | | | 1,435,972 | |
| | | | | | | | |
| | | | | | | | 6,046,620 | |
Health Care Technology — 0.7% | | | | | | | | |
Inovalon Holdings, Inc., Class A (a)(b) | | | 52,600 | | | | 1,589,046 | |
Household Durables — 1.6% | | | | | | | | |
Sony Corp. (a) | | | 140,600 | | | | 3,760,153 | |
Internet & Catalog Retail — 5.2% | | | | | | | | |
Amazon.com, Inc. (a) | | | 8,700 | | | | 3,237,270 | |
Makemytrip Ltd. (a) | | | 54,000 | | | | 1,185,840 | |
Netflix, Inc. (a) | | | 3,800 | | | | 1,583,422 | |
Qunar Cayman Islands Ltd. — ADR (a)(b) | | | 54,000 | | | | 2,227,500 | |
Vipshop Holdings Ltd. — ADR (a)(b) | | | 139,900 | | | | 4,118,656 | |
| | | | | | | | |
| | | | | | | | 12,352,688 | |
Internet Software & Services — 23.9% | | | | | | | | |
58.com, Inc. — ADR (a) | | | 57,000 | | | | 3,014,160 | |
Alibaba Group Holding Ltd. — ADR (a)(b) | | | 30,600 | | | | 2,547,144 | |
Baidu, Inc. — ADR (a) | | | 11,400 | | | | 2,375,760 | |
comScore, Inc. (a)(b) | | | 37,100 | | | | 1,899,520 | |
Cvent, Inc. (a) | | | 34,900 | | | | 978,596 | |
Facebook, Inc., Class A (a) | | | 99,700 | | | | 8,196,835 | |
Google, Inc., Class A (a) | | | 9,783 | | | | 5,426,630 | |
Google, Inc., Class C (a)(b) | | | 9,783 | | | | 5,361,084 | |
Hortonworks, Inc. (a) | | | 48,686 | | | | 1,160,674 | |
Hortonworks, Inc. (Acquired 3/21/14,
cost $3,100,447) (a)(c) | | | 127,202 | | | | 2,880,871 | |
LendingClub Corp. (a)(b) | | | 61,600 | | | | 1,210,440 | |
LendingClub Corp. (Acquired 12/12/14,
cost $1,804,420) (a)(c) | | | 177,404 | | | | 3,311,689 | |
LinkedIn Corp., Class A (a) | | | 9,300 | | | | 2,323,698 | |
New Relic, Inc. (a) | | | 20,000 | | | | 694,000 | |
New Relic, Inc. (Acquired 12/15/14,
cost $2,114,612) (a)(c) | | | 74,616 | | | | 2,459,716 | |
Pandora Media, Inc. (a) | | | 64,200 | | | | 1,040,682 | |
Tencent Holdings Ltd. | | | 337,300 | | | | 6,405,299 | |
Twitter, Inc. (a) | | | 39,300 | | | | 1,968,144 | |
Yelp, Inc. (a) | | | 25,600 | | | | 1,212,160 | |
YY, Inc. — ADR (a) | | | 21,500 | | | | 1,172,933 | |
Zillow Group, Inc., Class A (a) | | | 15,400 | | | | 1,544,620 | |
| | | | | | | | |
| | | | | | | | 57,184,655 | |
IT Services — 12.0% | | | | | | | | |
Alliance Data Systems Corp. (a) | | | 13,800 | | | | 4,088,250 | |
Cognizant Technology Solutions Corp.,
Class A (a) | | | 37,800 | | | | 2,358,342 | |
Euronet Worldwide, Inc. (a) | | | 66,175 | | | | 3,887,781 | |
Fidelity National Information Services, Inc. | | | 40,838 | | | | 2,779,434 | |
| | | | | | | | |
| Common Stocks | | Shares | | | Value | |
IT Services (concluded) | | | | | | | | |
Global Payments, Inc. | | | 15,900 | | | $ | 1,457,712 | |
Jack Henry & Associates, Inc. | | | 28,231 | | | | 1,973,065 | |
Luxoft Holding, Inc. (a) | | | 31,800 | | | | 1,645,332 | |
MasterCard, Inc., Class A | | | 60,100 | | | | 5,192,039 | |
Visa, Inc., Class A | | | 83,500 | | | | 5,461,735 | |
| | | | | | | | |
| | | | | | | | 28,843,690 | |
Media — 2.4% | | | | | | | | |
Eros International PLC (a) | | | 89,600 | | | | 1,565,312 | |
Naspers Ltd., N Shares | | | 17,300 | | | | 2,653,665 | |
Rentrak Corp. (a) | | | 28,400 | | | | 1,577,904 | |
| | | | | | | | |
| | | | | | | | 5,796,881 | |
Professional Services — 0.2% | | | | | | | | |
TechnoPro Holdings, Inc. (a) | | | 24,400 | | | | 579,814 | |
Real Estate Investment Trusts (REITs) — 2.1% | | | | | | | | |
Crown Castle International Corp. (b) | | | 29,500 | | | | 2,434,930 | |
Digital Realty Trust, Inc. (b) | | | 39,000 | | | | 2,572,440 | |
| | | | | | | | |
| | | | | | | | 5,007,370 | |
Semiconductors & Semiconductor Equipment — 11.8% | | | | | | | | |
ARM Holdings PLC | | | 80,300 | | | | 1,304,168 | |
ASML Holding NV | | | 18,000 | | | | 1,824,824 | |
Avago Technologies Ltd. | | | 19,199 | | | | 2,437,889 | |
Broadcom Corp., Class A | | | 34,500 | | | | 1,493,677 | |
Cavium, Inc. (a)(b) | | | 28,400 | | | | 2,011,288 | |
Hermes Microvision, Inc. | | | 43,206 | | | | 2,485,729 | |
Hua Hong Semiconductor Ltd. (a)(d) | | | 702,000 | | | | 871,088 | |
Intersil Corp. | | | 85,400 | | | | 1,222,928 | |
Lam Research Corp. | | | 23,100 | | | | 1,622,429 | |
Maxim Integrated Products, Inc. | | | 55,400 | | | | 1,928,474 | |
Microsemi Corp. (a) | | | 46,800 | | | | 1,656,720 | |
Novatek Microelectronics Corp. | | | 217,000 | | | | 1,119,922 | |
NXP Semiconductor NV (a) | | | 28,965 | | | | 2,906,927 | |
Siliconware Precision Industries Co. Ltd. | | | 897,000 | | | | 1,486,213 | |
SK Hynix, Inc. | | | 39,500 | | | | 1,613,442 | |
SunEdison Semiconductor Ltd. (a) | | | 39,800 | | | | 1,027,636 | |
Synaptics, Inc. (a) | | | 14,300 | | | | 1,162,661 | |
| | | | | | | | |
| | | | | | | | 28,176,015 | |
Software — 12.8% | | | | | | | | |
Activision Blizzard, Inc. | | | 65,700 | | | | 1,493,033 | |
Adobe Systems, Inc. (a)(b) | | | 35,700 | | | | 2,639,658 | |
Autodesk, Inc. (a) | | | 59,500 | | | | 3,489,080 | |
Globant SA (a) | | | 81,076 | | | | 1,707,460 | |
Imperva, Inc. (a) | | | 28,300 | | | | 1,208,410 | |
Nintendo Co. Ltd. | | | 11,800 | | | | 1,731,354 | |
Oracle Corp. | | | 89,300 | | | | 3,853,295 | |
Proofpoint, Inc. (a)(b) | | | 56,610 | | | | 3,352,444 | |
salesforce.com, Inc. (a) | | | 51,600 | | | | 3,447,396 | |
ServiceNow, Inc. (a) | | | 40,880 | | | | 3,220,526 | |
Tableau Software, Inc., Class A (a) | | | 17,650 | | | | 1,632,978 | |
Xero Ltd. (Acquired 10/15/13,
cost $2,411,080) (a)(c) | | | 158,560 | | | | 2,856,809 | |
| | | | | | | | |
| | | | | | | | 30,632,443 | |
Technology Hardware, Storage & Peripherals — 13.6% | | | | | | | | |
Apple Inc. (b) | | | 212,359 | | | | 26,423,830 | |
Pegatron Corp. | | | 659,000 | | | | 1,778,012 | |
Samsung Electronics Co. Ltd. | | | 3,325 | | | | 4,311,705 | |
| | | | | | | | |
| | | | | | | | 32,513,547 | |
See Notes to Financial Statements.
| | | | | | |
| | | BLACKROCK FUNDS | | MARCH 31, 2015 | | 33 |
| | | | |
| Schedule of Investments (continued) | | | BlackRock Science & Technology Opportunities Portfolio | |
| | | (Percentages shown are based on Net Assets) | |
| | | | | | | | |
| Common Stocks | | Shares | | | Value | |
Wireless Telecommunication Services — 1.2% | | | | | | | | |
Bharti Infratel Ltd. | | | 250,145 | | | $ | 1,538,893 | |
RingCentral, Inc., Class A (a)(b) | | | 84,800 | | | | 1,299,984 | |
| | | | | | | | |
| | | | | | | | 2,838,877 | |
Total Common Stocks — 93.4% | | | | | | | 223,481,635 | |
| | | | | | | | |
| Preferred Stocks | | | | | | |
Internet & Catalog Retail — 0.9% | | | | | | | | |
Snapdeal.com, Series F (Acquired 5/07/14,
cost $1,014,752) (a)(c) | | | 143 | | | | 1,708,938 | |
Snapdeal.com, Series G (Acquired 10/29/14,
cost $396,249) (a)(c) | | | 47 | | | | 561,679 | |
| | | | | | | | |
| | | | | | | | 2,270,617 | |
Internet Software & Services — 2.3% | | | | | | | | |
Uber Technologies, Inc., Series D (Acquired 6/06/14,
cost $2,000,004) (a)(c) | | | 128,924 | | | | 4,379,574 | |
Zuora, Inc. (Acquired 1/16/15, cost $1,006,814) (a)(c) | | | 265,000 | | | | 1,029,578 | |
| | | | | | | | |
| | | | | | | | 5,409,152 | |
Software — 1.9% | | | | | | | | |
Illumio, Inc., Series C (Acquired 3/11/15,
cost $499,995) (a)(c) | | | 31,115 | | | | 499,995 | |
MongoDB, Series C (Acquired 12/19/13,
cost $1,512,773) (a)(c) | | | 60,303 | | | | 1,368,275 | |
MongoDB, Series D (Acquired 12/19/13,
cost $470,592) (a)(c) | | | 18,759 | | | | 419,264 | |
MongoDB, Series E (Acquired 12/19/13,
cost $16,632) (a)(c) | | | 663 | | | | 14,433 | |
Palantir Technologies, Inc., Series I (Acquired 2/07/14, cost $1,500,011) (a)(c) | | | 244,700 | | | | 2,175,383 | |
| | | | | | | | |
| | | | | | | | 4,477,350 | |
Total Preferred Stocks — 5.1% | | | | | | | 12,157,119 | |
Total Long-Term Investments (Cost — $166,240,668) — 98.5% | | | | | | | 235,638,754 | |
| | | | | | | | |
| Short-Term Securities | | Shares | | | Value | |
BlackRock Liquidity Funds, TempFund, Institutional Class, 0.06% (e)(f) | | | 3,855,025 | | | $ | 3,855,025 | |
| | | Beneficial Interest (000) | | | | |
BlackRock Liquidity Series, LLC, Money Market
Series, 0.22% (e)(f)(g) | | $ | 26 | | | | 26,200 | |
Total Short-Term Securities (Cost — $3,881,225) — 1.6% | | | | 3,881,225 | |
Total Investments Before Options Written (Cost — $170,121,893) — 100.1% | | | | | | | 239,519,979 | |
| | | | | | | | |
| Options Written | | | | | | |
(Premiums Received — $256,144) — (0.1)% | | | | | | | (183,462 | ) |
Total Investments Net of Options Written
(Cost — $169,865,749) | | | | | | | 239,336,517 | |
Other Assets Less Liabilities — 0.0% | | | | | | | 28,827 | |
| | | | | | | | |
Net Assets — 100.0% | | | | | | $ | 239,365,344 | |
| | | | | | | | |
|
| Notes to Schedule of Investments |
| (a) | Non-income producing security. |
| (b) | All or a portion of security has been pledged and/or segregated as collateral in connection with outstanding options written. |
| (c) | Restricted security as to resale. As of report date, the Fund held restricted securities with a current value of $23,666,204 and an original cost of $17,848,381, which was 9.9% of its net assets. |
| (d) | Security, or a portion of security, is on loan. |
| (e) | During the six months ended March 31, 2015, investments in issuers considered to be affiliates of the Fund for purposes of Section 2(a)(3) of the Investment Company Act of 1940, as amended, were as follows: |
| | | | | | | | | | | | | | | | |
| Affiliate | | Shares/
Beneficial
Interest
Held at
September 30,
2014 | | | Net Activity | | | Shares/
Beneficial
Interest
Held at
March 31,
2015 | | | Income | |
BlackRock Liquidity Funds, TempFund, Institutional Class | | | 6,567,506 | | | | (2,712,481 | ) | | | 3,855,025 | | | $ | 993 | |
BlackRock Liquidity Series, LLC, Money Market Series | | $ | 1,494,487 | | | $ | (1,468,287 | ) | | $ | 26,200 | | | $ | 15,577 | |
| (f) | Represents the current yield as of report date. |
| (g) | Security was purchased with the cash collateral from loaned securities. The Fund may withdraw up to 25% of its investment daily, although the manager of the BlackRock Liquidity Series, LLC, Money Market Series, in its sole discretion, may permit an investor to withdraw more than 25% on any one day. |
See Notes to Financial Statements.
| | | | | | |
| 34 | | BLACKROCK FUNDS | | MARCH 31, 2015 | | |
| | | | |
| Schedule of Investments (continued) | | | BlackRock Science & Technology Opportunities Portfolio | |
| Ÿ | | For Fund compliance purposes, the Fund’s industry classifications refer to any one or more of the industry sub-classifications used by one or more widely recognized market indexes or ratings group indexes, and/or as defined by the investment advisor. These definitions may not apply for purposes of this report, which may combine such industry sub-classifications for reporting ease. |
| Ÿ | | As of March 31, 2015, forward foreign currency exchange contracts outstanding were as follows: |
| | | | | | | | | | | | | | | | | | | | |
Currency
Purchased | | | | | Currency Sold | | | | | Counterparty | | Settlement
Date | | | Unrealized
Appreciation
(Depreciation) | |
| HKD | | | 878,000 | | | USD | | | 113,213 | | | Citibank N.A. | | | 4/22/15 | | | $ | 32 | |
| SEK | | | 8,553,000 | | | USD | | | 1,050,652 | | | HSBC Bank PLC | | | 4/22/15 | | | | (57,185 | ) |
| USD | | | 8,036,530 | | | HKD | | | 62,315,000 | | | HSBC Bank PLC | | | 4/22/15 | | | | (842 | ) |
| USD | | | 2,314,714 | | | NZD | | | 2,990,000 | | | Morgan Stanley Capital Services LLC | | | 4/22/15 | | | | 84,467 | |
| USD | | | 231,301 | | | ZAR | | | 2,815,000 | | | Goldman Sachs Bank USA | | | 4/22/15 | | | | 101 | |
| USD | | | 1,548,043 | | | ZAR | | | 18,150,000 | | | Goldman Sachs International | | | 4/22/15 | | | | 57,362 | |
| USD | | | 320,592 | | | ZAR | | | 3,753,000 | | | TD Securities, Inc. | | | 4/22/15 | | | | 12,354 | |
| Total | | | | | | | | | | | | | | | | | | $ | 96,289 | |
| | | | | | | | | | | | | | | | | | | | |
| Ÿ | | As of March 31, 2015, exchange-traded options written were as follows: |
| | | | | | | | | | | | | | | | | | | | | | | | |
| Description | | Put/
Call | | | Strike Price | | | Expiration
Date | | | Contracts | | | Value | |
Apple Inc. | | | Call | | | | USD | | | | 132.00 | | | | 4/02/15 | | | | 430 | | | $ | (1,290 | ) |
Adobe Systems, Inc. | | | Call | | | | USD | | | | 75.00 | | | | 4/17/15 | | | | 71 | | | | (5,538 | ) |
Alibaba Group Holding Ltd. — ADR | | | Call | | | | USD | | | | 90.00 | | | | 4/17/15 | | | | 156 | | | | (2,496 | ) |
Cavium, Inc. | | | Call | | | | USD | | | | 75.00 | | | | 4/17/15 | | | | 56 | | | | (4,900 | ) |
Crown Castle International Corp. | | | Call | | | | USD | | | | 87.50 | | | | 4/17/15 | | | | 56 | | | | (560 | ) |
Inovalon Holdings, Inc., Class A | | | Call | | | | USD | | | | 30.00 | | | | 4/17/15 | | | | 173 | | | | (25,085 | ) |
LendingClub Corp. | | | Call | | | | USD | | | | 23.00 | | | | 4/17/15 | | | | 305 | | | | (4,575 | ) |
Qunar Cayman Islands Ltd. — ADR | | | Call | | | | USD | | | | 40.00 | | | | 4/17/15 | | | | 108 | | | | (25,650 | ) |
Vipshop Holdings Ltd. — ADR | | | Call | | | | USD | | | | 30.00 | | | | 4/17/15 | | | | 284 | | | | (21,300 | ) |
Apple Inc. | | | Call | | | | USD | | | | 130.00 | | | | 4/24/15 | | | | 270 | | | | (30,240 | ) |
comScore, Inc. | | | Call | | | | USD | | | | 52.50 | | | | 4/24/15 | | | | 74 | | | | (6,290 | ) |
Google, Inc., Class C | | | Call | | | | USD | | | | 580.00 | | | | 4/24/15 | | | | 19 | | | | (10,735 | ) |
Digital Realty Trust, Inc. | | | Call | | | | USD | | | | 70.00 | | | | 5/15/15 | | | | 74 | | | | (3,885 | ) |
Proofpoint, Inc. | | | Call | | | | USD | | | | 65.00 | | | | 5/15/15 | | | | 186 | | | | (36,270 | ) |
RingCentral, Inc., Class A | | | Call | | | | USD | | | | 17.50 | | | | 5/15/15 | | | | 169 | | | | (4,648 | ) |
Total | | | | | | | | | | | | | | | | | | | | | | $ | (183,462 | ) |
| | | | | | | | | | | | | | | | | | | | | | | | |
| Ÿ | | Fair Value Measurements — Various inputs are used in determining the fair value of investments and derivative financial instruments. These inputs to valuation techniques are categorized into a disclosure hierarchy consisting of three broad levels for financial statement purposes. The hierarchy gives the highest priority to unadjusted quoted prices in active markets for identical assets or liabilities (Level 1 measurements) and the lowest priority to unobservable inputs (Level 3 measurements). Accordingly, the degree of judgment exercised in determining fair value is greatest for instruments categorized in Level 3. The inputs used to measure fair value may fall into different levels of the fair value hierarchy. In such cases, for disclosure purposes, the fair value hierarchy classification is determined based on the lowest level input that is significant to the fair value measurement in its entirety. The categorization of a value determined for investments and derivative financial instruments is based on the pricing transparency of the investment and derivative financial instruments and is not necessarily an indication of the risks associated with investing in those securities. The three levels of the fair value hierarchy are as follows: |
| | Ÿ | | Level 1 – unadjusted quoted prices in active markets/exchanges for identical assets or liabilities that the Fund has the ability to access |
| | Ÿ | | Level 2 – other observable inputs (including, but not limited to, quoted prices for similar assets or liabilities in markets that are active, quoted prices for identical or similar assets or liabilities in markets that are not active, inputs other than quoted prices that are observable for the assets or liabilities (such as interest rates, yield curves, volatilities, prepayment speeds, loss severities, credit risks and default rates) or other market–corroborated inputs) |
| | Ÿ | | Level 3 – unobservable inputs based on the best information available in the circumstances, to the extent observable inputs are not available (including the Fund’s own assumptions used in determining the fair value of investments and derivative financial instruments) |
See Notes to Financial Statements.
| | | | | | |
| | | BLACKROCK FUNDS | | MARCH 31, 2015 | | 35 |
| | | | |
| Schedule of Investments (continued) | | | BlackRock Science & Technology Opportunities Portfolio | |
Changes in valuation techniques may result in transfers into or out of an assigned level within the disclosure hierarchy. In accordance with the Fund’s policy, transfers between different levels of the fair value disclosure hierarchy are deemed to have occurred as of the beginning of the reporting period. For information about the Fund’s policy regarding valuation of investments and derivative financial instruments, refer to Note 2 of the Notes to Financial Statements.
As of March 31, 2015, the following tables summarize the Fund’s investments and derivative financial instruments categorized in the disclosure hierarchy:
| | | | | | | | | | | | | | | | |
| | | Level 1 | | | Level 2 | | | Level 3 | | | Total | |
Assets: | | | | | | | | | | | | | | | | |
Investments: | | | | | | | | | | | | | | | | |
Long-Term Investments: | | | | | | | | | | | | | | | | |
Common Stocks: | | | | | | | | | | | | | | | | |
Commercial Services & Supplies | | $ | 996,382 | | | | — | | | | — | | | $ | 996,382 | |
Communications Equipment | | | 5,212,890 | | | | — | | | | — | | | | 5,212,890 | |
Consumer Finance | | | 474,293 | | | | — | | | | — | | | | 474,293 | |
Diversified Telecommunication Services | | | 1,476,271 | | | | — | | | | — | | | | 1,476,271 | |
Electronic Equipment, Instruments & Components | | | 1,426,292 | | | $ | 4,620,328 | | | | — | | | | 6,046,620 | |
Health Care Technology | | | 1,589,046 | | | | — | | | | — | | | | 1,589,046 | |
Household Durables | | | — | | | | 3,760,153 | | | | — | | | | 3,760,153 | |
Internet & Catalog Retail | | | 12,352,688 | | | | — | | | | — | | | | 12,352,688 | |
Internet Software & Services | | | 42,127,080 | | | | 15,057,575 | | | | — | | | | 57,184,655 | |
IT Services | | | 28,843,690 | | | | — | | | | — | | | | 28,843,690 | |
Media | | | 3,143,216 | | | | 2,653,665 | | | | — | | | | 5,796,881 | |
Professional Services | | | 579,814 | | | | — | | | | — | | | | 579,814 | |
Real Estate Investment Trusts (REITs) | | | 5,007,370 | | | | — | | | | — | | | | 5,007,370 | |
Semiconductors & Semiconductor Equipment | | | 18,341,717 | | | | 9,834,298 | | | | — | | | | 28,176,015 | |
Software | | | 28,901,089 | | | | 1,731,354 | | | | — | | | | 30,632,443 | |
Technology Hardware, Storage & Peripherals | | | 26,423,830 | | | | 6,089,717 | | | | — | | | | 32,513,547 | |
Wireless Telecommunication Services | | | 2,838,877 | | | | — | | | | — | | | | 2,838,877 | |
Preferred Stocks: | | | | | | | | | | | | | | | | |
Internet & Catalog Retail | | | — | | | | — | | | $ | 2,270,617 | | | | 2,270,617 | |
Internet Software & Services | | | — | | | | — | | | | 5,409,152 | | | | 5,409,152 | |
Software | | | — | | | | — | | | | 4,477,350 | | | | 4,477,350 | |
Short-Term Securities | | | 3,855,025 | | | | 26,200 | | | | — | | | | 3,881,225 | |
| | | | |
Total | | $ | 183,589,570 | | | $ | 43,773,290 | | | $ | 12,157,119 | | | $ | 239,519,979 | |
| | | | |
| | | | | | | | | | | | | | | | |
| | | Level 1 | | | Level 2 | | | Level 3 | | | Total | |
Derivative Financial Instruments1 | | | | | | | | | | | | | | | | |
Assets: | | | | | | | | | | | | | | | | |
Forward foreign currency exchange contracts | | | — | | | $ | 154,316 | | | | — | | | $ | 154,316 | |
Liabilities: | | | | | | | | | | | | | | | | |
Equity contracts | | $ | (177,172 | ) | | | (6,290 | ) | | | — | | | | (183,462 | ) |
Forward foreign currency exchange contracts | | | — | | | | (58,027 | ) | | | — | | | | (58,027 | ) |
| | | | |
Total | | $ | (177,172 | ) | | $ | 89,999 | | | | — | | | $ | (87,173 | ) |
| | | | |
| | 1 | | Derivative financial instruments are forward foreign currency exchange contracts and options written. Forward foreign currency exchange contracts are valued at the unrealized appreciation/depreciation on the instrument and options written are shown at value. |
See Notes to Financial Statements.
| | | | | | |
| 36 | | BLACKROCK FUNDS | | MARCH 31, 2015 | | |
| | | | |
| Schedule of Investments (continued) | | | BlackRock Science & Technology Opportunities Portfolio | |
The Fund may hold assets and/or liabilities in which the fair value approximates the carrying amount for financial statement purposes. As of March 31, 2015, such assets and/or liabilities are categorized within the disclosure hierarchy as follows:
| | | | | | | | | | | | | | | | |
| | | Level 1 | | | Level 2 | | | Level 3 | | | Total | |
Assets: | | | | | | | | | | | | | | | | |
Cash pledged as collateral for options written | | $ | 718,200 | | | | — | | | | — | | | $ | 718,200 | |
Foreign currency at value | | | 546,693 | | | | — | | | | — | | | | 546,693 | |
Liabilities: | | | | | | | | | | | | | | | | |
Collateral on securities loaned at value | | | — | | | $ | (26,200 | ) | | | — | | | | (26,200 | ) |
| | | | |
Total | | $ | 1,264,893 | | | $ | (26,200 | ) | | | — | | | $ | 1,238,693 | |
| | | | |
Transfers between Level 1 and Level 2 were as follows:
| | | | | | | | | | | | | | | | |
| | | Transfers into
Level 11 | | | Transfers out
of Level 1 | | | Transfers into
Level 2 | | | Transfers out
of Level 21 | |
Assets: | | | | | | | | | | | | | | | | |
Long-Term Investments: | | | | | | | | | | | | | | | | |
Software | | $ | 2,539,969 | | | | — | | | | — | | | $ | (2,539,969 | ) |
| | 1 | | Systematic Fair Value Prices were not utilized at period end for these investments. |
A reconciliation of Level 3 investments is presented when the Fund had a significant amount of Level 3 investments at the beginning and/or end of the period in relation to net assets. The following table is a reconciliation of Level 3 investments for which significant unobservable inputs were used in determining fair value:
| | | | | | | | | | | | |
| | | Common
Stocks | | | Preferred
Stocks | | | Total | |
Assets: | | | | | | | | | | | | |
Opening Balance, as of September 30, 2014 | | $ | 153,848 | | | $ | 13,297,420 | | | $ | 13,451,268 | |
Transfers into Level 3 | | | — | | | | — | | | | — | |
Transfers out of Level 31 | | | (7,066,453 | ) | | | — | | | | (7,066,453 | ) |
Other2 | | | 6,912,605 | | | | (6,912,605 | ) | | | — | |
Accrued discounts/premiums | | | — | | | | — | | | | — | |
Net realized gain (loss) | | | — | | | | — | | | | — | |
Net change in unrealized appreciation/depreciation3,4 | | | — | | | | 3,869,246 | | | | 3,869,246 | |
Purchases | | | — | | | | 1,903,058 | | | | 1,903,058 | |
Sales | | | — | | | | — | | | | — | |
Closing Balance, as of March 31, 2015 | | | — | | | $ | 12,157,119 | | | $ | 12,157,119 | |
| | | | |
Net change in unrealized appreciation/depreciation on investments still held at March 31, 20154 | | | — | | | $ | 3,869,246 | | | $ | 3,869,246 | |
| | | | |
| | 1 | | As of September 30, 2014, the Fund used significant unobservable inputs in determining the value of certain investments. As of March 31, 2015, the Fund used observable inputs in determining the value of the same investments. As a result, investments with a beginning period value of $7,066,453 transferred from Level 3 to Level 2 in the disclosure hierarchy. |
| | 2 | | Certain Level 3 investments were re-classified between Common Stocks and Preferred Stocks. |
| | 3 | | Included in the related net change in unrealized appreciation/depreciation in the Statements of Operations. |
| | 4 | | Any difference between Net change in unrealized appreciation/depreciation and Net change in unrealized appreciation/depreciation on investments still held at March 31, 2015, is generally due to investments no longer held or categorized as Level 3 at period end. |
See Notes to Financial Statements.
| | | | | | |
| | | BLACKROCK FUNDS | | MARCH 31, 2015 | | 37 |
| | | | |
| Schedule of Investments (concluded) | | | BlackRock Science & Technology Opportunities Portfolio | |
The following table summarizes the valuation techniques used and unobservable inputs utilized by the BlackRock Global Valuation Methodologies Committee (the “Global Valuation Committee”) to determine the value of certain of the Fund’s Level 3 investments as of March 31, 2015. The table does not include Level 3 investments with values based upon unadjusted third party pricing information in the amount of $499,995.
| | | | | | | | | | | | |
| | | Value | | | Valuation Techniques | | Unobservable Inputs | | Range of
Unobservable Inputs
Utilized | |
Assets: | | | | | | | | | | | | |
Preferred Stocks1 | | $ | 2,270,617 | | | Probability-Weighted Expected Return Model | | Years to IPO2 | | | 1.2-3.2 | |
| | | | | | | | IPO Exit Probability3 | | | 75.00% | |
| | | | | | | | Discount Rate2 | | | 25.00% | |
| | | | | | | | Revenue Multiple3 | | | 0.84x-1.87x | |
| | | 6,554,957 | | | Probability-Weighted Expected Return Model | | Years to IPO2 | | | 0.75-2.9 | |
| | | | | | | | IPO Exit Probability3 | | | 90.00% - 95.00% | |
| | | | | | | | Discount Rate2 | | | 21.30% - 22.31% | |
| | | | | | | | Margin3 | | | 20.00% | |
| | | | | | | | Revenue Multiple3 | | | 10.0x-16.0x | |
| | | 1,029,578 | | | Probability-Weighted Expected Return Model | | Years to IPO2 | | | 1-2 | |
| | | | | | | | IPO Exit Probability3 | | | 75.00% | |
| | | | | | | | Discount Rate2 | | | 20.00% | |
| | | | | | | | Revenue Multiple3 | | | 8.0x | |
| | | | | | | | Merger and/or Acquisition Probability3 | | | 25.00% | |
| | | 1,801,972 | | | Market Comparable Companies | | 2016 Revenue Multiple3 | | | 11.0x | |
| | | | | | Options Pricing Model | | Years to IPO2 | | | 1-2 | |
| | | | | | | | Risk Free Rate2 | | | 0.31% | |
| | | | | | | | Volatility3 | | | 30.00% | |
Total | | $ | 11,657,124 | | | | | | | | | |
| | 1 | | For the period ended March 31, 2015, the valuation technique for certain investments classified as preferred stocks changed to a Probability-Weighted Expected Return Model. The investments were previously valued utilizing a market comparable company and option pricing model approach. A Probability-Weighted Expected Return Model was considered to be a more relevant measure of fair value for these investments which leverages the most recent equity raise pre-money valuation and/or secondary market transactions. |
| | 2 | | Decrease in unobservable input may result in a significant increase to value, while an increase in the unobservable input may result in a significant decrease to value. |
| | 3 | | Increase in unobservable input may result in a significant increase to value, while a decrease in the unobservable input may result in a significant decrease to value. |
See Notes to Financial Statements.
| | | | | | |
| 38 | | BLACKROCK FUNDS | | MARCH 31, 2015 | | |
| | | | |
| Schedule of Investments March 31, 2015 (Unaudited) | | | BlackRock U.S. Opportunities Portfolio | |
| | | (Percentages shown are based on Net Assets) | |
| | | | | | | | |
| Common Stocks | | Shares | | | Value | |
Aerospace & Defense — 1.1% | | | | | | | | |
B/E Aerospace, Inc. | | | 143,624 | | | $ | 9,137,359 | |
Triumph Group, Inc. | | | 154,024 | | | | 9,198,313 | |
| | | | | | | | |
| | | | | | | | 18,335,672 | |
Airlines — 1.7% | | | | | | | | |
American Airlines Group, Inc. | | | 280,668 | | | | 14,813,657 | |
JetBlue Airways Corp. (a) | | | 640,500 | | | | 12,329,625 | |
| | | | | | | | |
| | | | | | | | 27,143,282 | |
Auto Components — 3.1% | | | | | | | | |
Delphi Automotive PLC | | | 242,300 | | | | 19,321,002 | |
Lear Corp. | | | 146,960 | | | | 16,286,107 | |
Visteon Corp. (a) | | | 150,300 | | | | 14,488,920 | |
| | | | | | | | |
| | | | | | | | 50,096,029 | |
Automobiles — 0.3% | | | | | | | | |
Tesla Motors, Inc. (a) | | | 25,960 | | | | 4,900,469 | |
Banks — 4.5% | | | | | | | | |
BankUnited, Inc. | | | 710,780 | | | | 23,270,937 | |
Regions Financial Corp. | | | 2,288,343 | | | | 21,624,841 | |
SunTrust Banks, Inc. | | | 343,530 | | | | 14,115,648 | |
Western Alliance Bancorp (a) | | | 444,286 | | | | 13,168,637 | |
| | | | | | | | |
| | | | | | | | 72,180,063 | |
Beverages — 0.5% | | | | | | | | |
Molson Coors Brewing Co., Class B | | | 118,300 | | | | 8,807,435 | |
Biotechnology — 2.1% | | | | | | | | |
BioMarin Pharmaceutical, Inc. (a) | | | 44,615 | | | | 5,559,921 | |
Incyte Corp. (a) | | | 132,000 | | | | 12,099,120 | |
Isis Pharmaceuticals, Inc. (a) | | | 66,500 | | | | 4,234,055 | |
Receptos, Inc. (a) | | | 35,800 | | | | 5,903,062 | |
Vertex Pharmaceuticals, Inc. (a) | | | 46,600 | | | | 5,497,402 | |
| | | | | | | | |
| | | | | | | | 33,293,560 | |
Capital Markets — 1.8% | | | | | | | | |
Evercore Partners, Inc., Class A | | | 189,200 | | | | 9,774,072 | |
WisdomTree Investments, Inc. | | | 903,127 | | | | 19,381,105 | |
| | | | | | | | |
| | | | | | | | 29,155,177 | |
Chemicals — 5.0% | | | | | | | | |
Ashland, Inc. | | | 110,500 | | | | 14,067,755 | |
Axalta Coating Systems Ltd. (a) | | | 447,500 | | | | 12,359,950 | |
Cytec Industries, Inc. | | | 212,780 | | | | 11,498,631 | |
Eastman Chemical Co. | | | 174,900 | | | | 12,113,574 | |
Platform Specialty Products Corp. (a) | | | 607,339 | | | | 15,584,319 | |
The Valspar Corp. | | | 175,540 | | | | 14,750,626 | |
| | | | | | | | |
| | | | | | | | 80,374,855 | |
Communications Equipment — 1.0% | | | | | | | | |
Finisar Corp. (a) | | | 365,000 | | | | 7,789,100 | |
JDS Uniphase Corp. (a) | | | 583,200 | | | | 7,651,584 | |
| | | | | | | | |
| | | | | | | | 15,440,684 | |
Consumer Finance — 0.9% | | | | | | | | |
Discover Financial Services | | | 262,900 | | | | 14,814,415 | |
Containers & Packaging — 1.4% | | | | | | | | |
Crown Holdings, Inc. (a) | | | 406,750 | | | | 21,972,635 | |
Electric Utilities — 1.6% | | | | | | | | |
PPL Corp. | | | 216,400 | | | | 7,284,024 | |
Xcel Energy, Inc. | | | 559,400 | | | | 19,472,714 | |
| | | | | | | | |
| | | | | | | | 26,756,738 | |
Electrical Equipment — 1.1% | | | | | | | | |
Acuity Brands, Inc. | | | 58,430 | | | | 9,825,589 | |
Sensata Technologies Holding NV (a) | | | 145,400 | | | | 8,353,230 | |
| | | | | | | | |
| | | | | | | | 18,178,819 | |
| | | | | | | | |
Common Stocks | | | Shares | | | | Value | |
Electronic Equipment, Instruments & Components — 1.4% | | | | | | | | |
Amphenol Corp., Class A | | | 174,660 | | | $ | 10,292,714 | |
CDW Corp. | | | 325,900 | | | | 12,136,516 | |
| | | | | | | | |
| | | | | | | | 22,429,230 | |
Energy Equipment & Services — 0.4% | | | | | | | | |
U.S. Silica Holdings, Inc. (b) | | | 164,900 | | | | 5,872,089 | |
Food Products — 2.9% | | | | | | | | |
The Hain Celestial Group, Inc. (a) | | | 302,402 | | | | 19,368,848 | |
Hormel Foods Corp. | | | 218,200 | | | | 12,404,670 | |
Pinnacle Foods, Inc. | | | 374,200 | | | | 15,271,102 | |
| | | | | | | | |
| | | | | | | | 47,044,620 | |
Health Care Equipment & Supplies — 2.8% | | | | | | | | |
Boston Scientific Corp. (a) | | | 549,700 | | | | 9,757,175 | |
The Cooper Cos., Inc. | | | 61,170 | | | | 11,464,481 | |
Edwards Lifesciences Corp. (a) | | | 118,300 | | | | 16,853,018 | |
Intuitive Surgical, Inc. (a) | | | 15,000 | | | | 7,575,450 | |
| | | | | | | | |
| | | | | | | | 45,650,124 | |
Health Care Providers & Services — 3.7% | | | | | | | | |
AmerisourceBergen Corp. | | | 74,200 | | | | 8,434,314 | |
Cardinal Health, Inc. | | | 110,100 | | | | 9,938,727 | |
Cigna Corp. | | | 89,647 | | | | 11,603,908 | |
HCA Holdings, Inc. (a) | | | 127,560 | | | | 9,596,339 | |
Humana, Inc. | | | 33,100 | | | | 5,892,462 | |
Universal Health Services, Inc., Class B | | | 121,090 | | | | 14,253,504 | |
| | | | | | | | |
| | | | | | | | 59,719,254 | |
Health Care Technology — 0.4% | | | | | | | | |
Inovalon Holdings, Inc., Class A (a) | | | 237,100 | | | | 7,162,791 | |
Hotels, Restaurants & Leisure — 1.8% | | | | | | | | |
Aramark | | | 327,500 | | | | 10,358,825 | |
Belmond Ltd., Class A (a) | | | 823,405 | | | | 10,111,413 | |
ClubCorp Holdings, Inc. | | | 418,100 | | | | 8,094,416 | |
| | | | | | | | |
| | | | | | | | 28,564,654 | |
Household Durables — 2.4% | | | | | | | | |
Jarden Corp. (a) | | | 530,620 | | | | 28,069,798 | |
Toll Brothers, Inc. (a) | | | 273,355 | | | | 10,753,786 | |
| | | | | | | | |
| | | | | | | | 38,823,584 | |
Household Products — 0.9% | | | | | | | | |
Energizer Holdings, Inc. | | | 100,800 | | | | 13,915,440 | |
Independent Power and Renewable Electricity
Producers — 0.5% | | | | | | | | |
Pattern Energy Group, Inc. | | | 310,899 | | | | 8,804,660 | |
Industrial Conglomerates — 1.3% | | | | | | | | |
Roper Industries, Inc. | | | 124,320 | | | | 21,383,040 | |
Insurance — 3.0% | | | | | | | | |
Assured Guaranty Ltd. | | | 491,900 | | | | 12,981,241 | |
The Hartford Financial Services Group, Inc. | | | 541,000 | | | | 22,624,620 | |
Reinsurance Group of America, Inc. | | | 147,320 | | | | 13,728,751 | |
| | | | | | | | |
| | | | | | | | 49,334,612 | |
Internet & Catalog Retail — 0.7% | | | | | | | | |
Liberty Interactive Corp., Class A (a) | | | 383,000 | | | | 11,179,770 | |
Internet Software & Services — 4.4% | | | | | | | | |
comScore, Inc. (a) | | | 208,305 | | | | 10,665,216 | |
Hortonworks, Inc. (a)(b) | | | 121,416 | | | | 2,894,557 | |
Hortonworks, Inc. (Acquired 3/21/14, cost $14,233,594) (a)(c) | | | 583,961 | | | | 13,225,549 | |
LendingClub Corp. (a) | | | 177,500 | | | | 3,487,875 | |
LendingClub Corp. (Acquired 12/12/14, cost $4,571,285) (a)(c) | | | 449,432 | | | | 8,389,772 | |
LinkedIn Corp., Class A (a) | | | 28,700 | | | | 7,170,982 | |
New Relic, Inc. (a) | | | 70,000 | | | | 2,429,000 | |
See Notes to Financial Statements.
| | | | | | |
| | | BLACKROCK FUNDS | | MARCH 31, 2015 | | 39 |
| | | | |
| Schedule of Investments (continued) | | | BlackRock U.S. Opportunities Portfolio | |
| | | (Percentages shown are based on Net Assets) | |
| | | | | | | | |
| Common Stocks | | Shares | | | Value | |
Internet Software & Services (concluded) | | | | | | | | |
New Relic, Inc. (Acquired 12/15/14, cost $9,551,576) (a)(c) | | | 337,036 | | | $ | 11,110,392 | |
Pandora Media, Inc. (a) | | | 440,800 | | | | 7,145,368 | |
Zillow Group, Inc., Class A (a) | | | 51,400 | | | | 5,155,420 | |
| | | | | | | | |
| | | | | | | | 71,674,131 | |
IT Services — 3.1% | | | | | | | | |
Alliance Data Systems Corp. (a) | | | 55,660 | | | | 16,489,275 | |
Euronet Worldwide, Inc. (a) | | | 252,873 | | | | 14,856,289 | |
Fidelity National Information Services, Inc. | | | 274,120 | | | | 18,656,607 | |
| | | | | | | | |
| | | | | | | | 50,002,171 | |
Leisure Products — 0.4% | | | | | | | | |
Performance Sports Group Ltd. (a) | | | 325,200 | | | | 6,341,400 | |
Life Sciences Tools & Services — 2.7% | | | | | | | | |
Agilent Technologies, Inc. | | | 197,400 | | | | 8,201,970 | |
Charles River Laboratories International, Inc. (a) | | | 209,400 | | | | 16,603,326 | |
Illumina, Inc. (a) | | | 38,330 | | | | 7,115,581 | |
Thermo Fisher Scientific, Inc. | | | 92,340 | | | | 12,404,956 | |
| | | | | | | | |
| | | | | | | | 44,325,833 | |
Machinery — 2.9% | | | | | | | | |
Crane Co. | | | 126,500 | | | | 7,894,865 | |
Snap-on, Inc. | | | 148,470 | | | | 21,833,998 | |
Stanley Black & Decker, Inc. | | | 176,500 | | | | 16,831,040 | |
| | | | | | | | |
| | | | | | | | 46,559,903 | |
Media — 2.8% | | | | | | | | |
The E.W. Scripps Co., Class A (a) | | | 250,400 | | | | 7,121,376 | |
Markit Ltd. (a) | | | 326,500 | | | | 8,782,850 | |
Media General, Inc. (a) | | | 112,663 | | | | 1,857,813 | |
Nexstar Broadcasting Group, Inc., Class A | | | 146,900 | | | | 8,405,618 | |
Sirius XM Holdings, Inc. (a) | | | 4,040,180 | | | | 15,433,488 | |
Tribune Media Co., Class A | | | 74,000 | | | | 4,499,940 | |
| | | | | | | | |
| | | | | | | | 46,101,085 | |
Metals & Mining — 0.6% | | | | | | | | |
Constellium NV, Class A (a) | | | 447,472 | | | | 9,092,631 | |
Oil, Gas & Consumable Fuels — 3.6% | | | | | | | | |
Concho Resources, Inc. (a) | | | 141,080 | | | | 16,353,994 | |
Diamondback Energy, Inc. (a) | | | 86,500 | | | | 6,646,660 | |
GasLog Ltd. | | | 334,900 | | | | 6,503,758 | |
GasLog Partners LP | | | 285,000 | | | | 7,011,000 | |
MarkWest Energy Partners LP — MLP | | | 103,000 | | | | 6,808,300 | |
Oasis Petroleum, Inc. (a) | | | 363,300 | | | | 5,166,126 | |
Penn Virginia Corp. (a) | | | 535,600 | | | | 3,470,688 | |
Targa Resources Partners LP — MLP | | | 169,800 | | | | 7,022,928 | |
| | | | | | | | |
| | | | | | | | 58,983,454 | |
Pharmaceuticals — 3.1% | | | | | | | | |
Mallinckrodt PLC (a) | | | 170,700 | | | | 21,619,155 | |
Mylan NV (a) | | | 184,600 | | | | 10,956,010 | |
Perrigo Co. PLC | | | 107,900 | | | | 17,862,845 | |
| | | | | | | | |
| | | | | | | | 50,438,010 | |
Professional Services — 1.3% | | | | | | | | |
Equifax, Inc. | | | 220,460 | | | | 20,502,780 | |
Real Estate Investment Trusts (REITs) — 6.3% | | | | | | | | |
Brixmor Property Group, Inc. | | | 276,300 | | | | 7,335,765 | |
Hospitality Properties Trust | | | 442,940 | | | | 14,612,590 | |
Host Hotels & Resorts, Inc. | | | 647,300 | | | | 13,062,514 | |
InfraREIT, Inc. | | | 481,100 | | | | 13,754,649 | |
Liberty Property Trust | | | 298,800 | | | | 10,667,160 | |
RLJ Lodging Trust | | | 459,850 | | | | 14,397,903 | |
| | | | | | | | |
| Common Stocks | | Shares | | | Value | |
Real Estate Investment Trusts (REITs) (concluded) | | | | | | | | |
STAG Industrial, Inc. | | | 576,000 | | | $ | 13,547,520 | |
Weyerhaeuser Co. | | | 433,313 | | | | 14,364,326 | |
| | | | | | | | |
| | | | | | | | 101,742,427 | |
Real Estate Management & Development — 1.3% | | | | | | | | |
Kennedy-Wilson Holdings, Inc. | | | 788,900 | | | | 20,621,846 | |
Semiconductors & Semiconductor
Equipment — 4.4% | | | | | | | | |
Applied Materials, Inc. | | | 489,500 | | | | 11,043,120 | |
Avago Technologies Ltd. | | | 134,818 | | | | 17,119,190 | |
Canadian Solar, Inc. (a) | | | 180,400 | | | | 6,023,556 | |
Maxim Integrated Products, Inc. | | | 338,706 | | | | 11,790,356 | |
NXP Semiconductor NV (a) | | | 163,090 | | | | 16,367,712 | |
Synaptics, Inc. (a) | | | 111,800 | | | | 9,089,899 | |
| | | | | | | | |
| | | | | | | | 71,433,833 | |
Software — 2.2% | | | | | | | | |
Autodesk, Inc. (a) | | | 196,000 | | | | 11,493,440 | |
ServiceNow, Inc. (a) | | | 152,300 | | | | 11,998,194 | |
Tableau Software, Inc., Class A (a) | | | 138,900 | | | | 12,851,028 | |
| | | | | | | | |
| | | | | | | | 36,342,662 | |
Specialty Retail — 2.6% | | | | | | | | |
Best Buy Co., Inc. | | | 250,200 | | | | 9,455,058 | |
Cabela’s, Inc. (a) | | | 213,000 | | | | 11,923,740 | |
Genesco, Inc. (a) | | | 109,990 | | | | 7,834,588 | |
L Brands, Inc. | | | 132,600 | | | | 12,502,854 | |
| | | | | | | | |
| | | | | | | | 41,716,240 | |
Textiles, Apparel & Luxury Goods — 2.9% | | | | | | | | |
Kate Spade & Co. (a) | | | 271,600 | | | | 9,068,724 | |
PVH Corp. | | | 71,230 | | | | 7,590,269 | |
Ralph Lauren Corp. | | | 43,400 | | | | 5,707,100 | |
Sequential Brands Group, Inc. (a)(d) | | | 2,327,900 | | | | 24,908,530 | |
| | | | | | | | |
| | | | | | | | 47,274,623 | |
Thrifts & Mortgage Finance — 1.0% | | | | | | | | |
Essent Group Ltd. (a) | | | 393,100 | | | | 9,399,021 | |
Strategic Growth Bancorp (Acquired 3/10/14,cost $7,599,729) (a)(c) | | | 610,420 | | | | 6,458,244 | |
| | | | | | | | |
| | | | | | | | 15,857,265 | |
Trading Companies & Distributors — 0.6% | | | | | | | | |
United Rentals, Inc. (a) | | | 114,075 | | | | 10,399,077 | |
Transportation Infrastructure — 1.0% | | | | | | | | |
Macquarie Infrastructure Co. LLC | | | 204,900 | | | | 16,861,221 | |
Wireless Telecommunication Services — 1.3% | | | | | | | | |
SBA Communications Corp., Class A (a) | | | 130,330 | | | | 15,261,643 | |
T-Mobile U.S., Inc. (a) | | | 162,300 | | | | 5,143,287 | |
| | | | | | | | |
| | | | | | | | 20,404,930 | |
Total Common Stocks — 96.8% | | | | | | | 1,568,009,223 | |
| | | | | | | | |
| | | | | | | |
Investment Companies | | | | | | | | |
Equity Funds — 0.7% | | | | | | | | |
Vanguard REIT ETF | | | 135,500 | | | | 11,391,485 | |
| | | | | | | | |
| | | | | | | |
See Notes to Financial Statements.
| | | | | | |
| 40 | | BLACKROCK FUNDS | | MARCH 31, 2015 | | |
| | | | |
| Schedule of Investments (continued) | | | BlackRock U.S. Opportunities Portfolio | |
| | | (Percentages shown are based on Net Assets) | |
| | | | | | | | |
| Preferred Stocks | | Shares | | | Value | |
Internet Software & Services — 0.9% | | | | | | | | |
Uber Technologies, Inc., Series D (Acquired 6/06/14, cost
$5,217,970) (a)(c) | | | 336,360 | | | $ | 11,426,216 | |
Zuora, Inc. (Acquired 1/16/15, cost
$3,742,311) (a)(c) | | | 985,000 | | | | 3,826,922 | |
| | | | | | | | |
| | | | | | | | 15,253,138 | |
Software — 1.0% | | | | | | | | |
MongoDB, Series C (Acquired 12/19/13, cost
$7,974,602) (a)(c) | | | 317,888 | | | | 7,212,879 | |
MongoDB, Series D (Acquired 12/19/13, cost
$2,480,799) (a)(c) | | | 98,891 | | | | 2,210,214 | |
MongoDB, Series E (Acquired 12/19/13, cost
$87,676) (a)(c) | | | 3,495 | | | | 76,086 | |
Palantir Technologies, Inc., Series I (Acquired
2/07/14, cost $4,300,011) (a)(c) | | | 701,470 | | | | 6,236,068 | |
| | | | | | | | |
| | | | | | | | 15,735,247 | |
Total Preferred Stocks — 1.9% | | | | | | | 30,988,385 | |
Total Long-Term Investments (Cost — $1,162,956,354) — 99.4% | | | | 1,610,389,093 | |
| | | | | | | | |
Short-Term Securities | | Shares | | | Value | |
BlackRock Liquidity Funds, TempFund,
Institutional Class, 0.06% (e) | | | 2,372,653 | | | $ | 2,372,653 | |
| | | Beneficial
Interest
(000) | | | | |
BlackRock Liquidity Series, LLC, Money Market Series, 0.22% (e)(f)(g) | | $ | 4,470 | | | | 4,470,214 | |
Total Short-Term Securities (Cost — $6,842,867) — 0.4% | | | | 6,842,867 | |
Total Investments (Cost — $1,169,799,221) — 99.8% | | | | 1,617,231,960 | |
Other Assets Less Liabilities — 0.2% | | | | 3,991,771 | |
| | | | | | | | |
Net Assets — 100.0% | | | | | | $ | 1,621,223,731 | |
| | | | | | | | |
|
| Notes to Schedule of Investments |
| (a) | Non-income producing security. |
| (b) | Security, or a portion of security, is on loan. |
| (c) | Restricted security as to resale. As of report date, the Fund held restricted securities with a current value of $70,172,342 and an original cost of $59,759,553, which was 4.3% of its net assets. |
| (d) | During the six months ended March 31, 2015, investments in issuers (whereby the Fund held 5% or more of the companies’ outstanding securities) that were considered to be an affiliate for purposes of Section 2(a)(3) of the Investment Company Act of 1940, as amended, were as follows: |
| | | | | | | | | | | | | | | | | | |
| Affiliate | | Shares Held at
September 30,
2014 | | | Shares
Purchased | | Shares
Sold | | | Shares Held at
March 31 2015 | | | Value at
March 31,
2015 | |
Sequential Brands Group, Inc. | | | 2,327,900 | | | — | | | — | | | | 2,327,900 | | | $ | 24,908,530 | |
| (e) | Represents the current yield as of report date. |
| (f) | During the six months ended March 31, 2015, investments in issuers considered to be affiliates of the Fund for purposes of Section 2(a)(3) of the Investment Company Act of 1940, as amended, were as follows: |
| | | | | | | | | | | | | | | | | | | | |
| Affiliate | | Shares/
Beneficial
Interest
Held at
September 30,
2014 | | | Net Activity | | | Shares/
Beneficial
Interest
Held at
March 31,
2015 | | | Income | | | Realized
Gain | |
BlackRock Liquidity Funds, TempFund, Institutional Class | | | 73,708,080 | | | | (71,335,427 | ) | | | 2,372,653 | | | $ | 9,016 | | | $ | 3,550 | |
BlackRock Liquidity Series, LLC, Money Market Series | | $ | 8,060,661 | | | $ | (3,590,447 | ) | | $ | 4,470,214 | | | $ | 85,508 | | | | — | |
| (g) | Security was purchased with the cash collateral from loaned securities. The Fund may withdraw up to 25% of its investment daily, although the manager of the BlackRock Liquidity Series, LLC, Money Market Series, in its sole discretion, may permit an investor to withdraw more than 25% on any one day. |
See Notes to Financial Statements.
| | | | | | |
| | | BLACKROCK FUNDS | | MARCH 31, 2015 | | 41 |
| | | | |
| Schedule of Investments (continued) | | | BlackRock U.S. Opportunities Portfolio | |
| Ÿ | | For Fund compliance purposes, the Fund’s industry classifications refer to any one or more of the industry sub-classifications used by one or more widely recognized market indexes or ratings group indexes, and/or as defined by the investment advisor. These definitions may not apply for purposes of this report, which may combine such industry sub-classifications for reporting ease. |
| Ÿ | | Fair Value Measurements — Various inputs are used in determining the fair value of investments. These inputs to valuation techniques are categorized into a disclosure hierarchy consisting of three broad levels for financial statement purposes. The hierarchy gives the highest priority to unadjusted quoted prices in active markets for identical assets or liabilities (Level 1 measurements) and the lowest priority to unobservable inputs (Level 3 measurements). Accordingly, the degree of judgment exercised in determining fair value is greatest for instruments categorized in Level 3. The inputs used to measure fair value may fall into different levels of the fair value hierarchy. In such cases, for disclosure purposes, the fair value hierarchy classification is determined based on the lowest level input that is significant to the fair value measurement in its entirety. The categorization of a value determined for investments is based on the pricing transparency of the investment and is not necessarily an indication of the risks associated with investing in those securities. The three levels of the fair value hierarchy are as follows: |
| | Ÿ | | Level 1 – unadjusted quoted prices in active markets/exchanges for identical assets or liabilities that the Fund has the ability to access |
| | Ÿ | | Level 2 – other observable inputs (including, but not limited to, quoted prices for similar assets or liabilities in markets that are active, quoted prices for identical or similar assets or liabilities in markets that are not active, inputs other than quoted prices that are observable for the assets or liabilities (such as interest rates, yield curves, volatilities, prepayment speeds, loss severities, credit risks and default rates) or other market–corroborated inputs) |
| | Ÿ | | Level 3 – unobservable inputs based on the best information available in the circumstances, to the extent observable inputs are not available (including the Fund’s own assumptions used in determining the fair value of investments) |
Changes in valuation techniques may result in transfers into or out of an assigned level within the disclosure hierarchy. In accordance with the Fund’s policy, transfers between different levels of the fair value disclosure hierarchy are deemed to have occurred as of the beginning of the reporting period. For information about the Fund’s policy regarding valuation of investments, refer to Note 2 of the Notes to Financial Statements.
As of March 31, 2015, the following table summarizes the Fund’s investments categorized in the disclosure hierarchy:
| | | | | | | | | | | | | | | | |
| | | Level 1 | | | Level 2 | | | Level 3 | | | Total | |
Assets: | | | | | | | | | | | | | | | | |
Investments: | | | | | | | | | | | | | | | | |
Long-Term Investments: | | | | | | | | | | | | | | | | |
Common Stocks: | | | | | | | | | | | | | | | | |
Aerospace & Defense | | $ | 18,335,672 | | | | — | | | | — | | | $ | 18,335,672 | |
Airlines | | | 27,143,282 | | | | — | | | | — | | | | 27,143,282 | |
Auto Components | | | 50,096,029 | | | | — | | | | — | | | | 50,096,029 | |
Automobiles | | | 4,900,469 | | | | — | | | | — | | | | 4,900,469 | |
Banks | | | 72,180,063 | | | | — | | | | — | | | | 72,180,063 | |
Beverages | | | 8,807,435 | | | | — | | | | — | | | | 8,807,435 | |
Biotechnology | | | 33,293,560 | | | | — | | | | — | | | | 33,293,560 | |
Capital Markets | | | 29,155,177 | | | | — | | | | — | | | | 29,155,177 | |
Chemicals | | | 80,374,855 | | | | — | | | | — | | | | 80,374,855 | |
Communications Equipment | | | 15,440,684 | | | | — | | | | — | | | | 15,440,684 | |
Consumer Finance | | | 14,814,415 | | | | — | | | | — | | | | 14,814,415 | |
Containers & Packaging | | | 21,972,635 | | | | — | | | | — | | | | 21,972,635 | |
Electric Utilities | | | 26,756,738 | | | | — | | | | — | | | | 26,756,738 | |
Electrical Equipment | | | 18,178,819 | | | | — | | | | — | | | | 18,178,819 | |
Electronic Equipment, Instruments & Components | | | 22,429,230 | | | | — | | | | — | | | | 22,429,230 | |
Energy Equipment & Services | | | 5,872,089 | | | | — | | | | — | | | | 5,872,089 | |
Food Products | | | 47,044,620 | | | | — | | | | — | | | | 47,044,620 | |
Health Care Equipment & Supplies | | | 45,650,124 | | | | — | | | | — | | | | 45,650,124 | |
Health Care Providers & Services | | | 59,719,254 | | | | — | | | | — | | | | 59,719,254 | |
Health Care Technology | | | 7,162,791 | | | | — | | | | — | | | | 7,162,791 | |
Hotels, Restaurants & Leisure | | | 28,564,654 | | | | — | | | | — | | | | 28,564,654 | |
Household Durables | | | 38,823,584 | | | | — | | | | — | | | | 38,823,584 | |
Household Products | | | 13,915,440 | | | | — | | | | — | | | | 13,915,440 | |
Independent Power and Renewable Electricity Producers | | | 8,804,660 | | | | — | | | | — | | | | 8,804,660 | |
Industrial Conglomerates | | | 21,383,040 | | | | — | | | | — | | | | 21,383,040 | |
Insurance | | | 49,334,612 | | | | — | | | | — | | | | 49,334,612 | |
Internet & Catalog Retail | | | 11,179,770 | | | | — | | | | — | | | | 11,179,770 | |
Internet Software & Services | | | 38,948,418 | | | $ | 32,725,713 | | | | — | | | | 71,674,131 | |
IT Services | | | 50,002,171 | | | | — | | | | — | | | | 50,002,171 | |
Leisure Products | | | 6,341,400 | | | | — | | | | — | | | | 6,341,400 | |
Life Sciences Tools & Services | | | 44,325,833 | | | | — | | | | — | | | | 44,325,833 | |
Machinery | | | 46,559,903 | | | | — | | | | — | | | | 46,559,903 | |
Media. | | | 46,101,085 | | | | — | | | | — | | | | 46,101,085 | |
Metals & Mining | | | 9,092,631 | | | | — | | | | — | | | | 9,092,631 | |
Oil, Gas & Consumable Fuels | | | 58,983,454 | | | | — | | | | — | | | | 58,983,454 | |
See Notes to Financial Statements.
| | | | | | |
| 42 | | BLACKROCK FUNDS | | MARCH 31, 2015 | | |
| | | | |
| Schedule of Investments (continued) | | | BlackRock U.S. Opportunities Portfolio | |
| | | | | | | | | | | | | | | | |
| | | Level 1 | | | Level 2 | | | Level 3 | | | Total | |
Pharmaceuticals | | $ | 50,438,010 | | | | — | | | | — | | | $ | 50,438,010 | |
Professional Services | | | 20,502,780 | | | | — | | | | — | | | | 20,502,780 | |
Real Estate Investment Trusts (REITs) | | | 101,742,427 | | | | — | | | | — | | | | 101,742,427 | |
Real Estate Management & Development | | | 20,621,846 | | | | — | | | | — | | | | 20,621,846 | |
Semiconductors & Semiconductor Equipment | | | 71,433,833 | | | | — | | | | — | | | | 71,433,833 | |
Software | | | 36,342,662 | | | | — | | | | — | | | | 36,342,662 | |
Specialty Retail | | | 41,716,240 | | | | — | | | | — | | | | 41,716,240 | |
Textiles, Apparel & Luxury Goods | | | 47,274,623 | | | | — | | | | — | | | | 47,274,623 | |
Thrifts & Mortgage Finance | | | 9,399,021 | | | | — | | | $ | 6,458,244 | | | | 15,857,265 | |
Trading Companies & Distributors | | | 10,399,077 | | | | — | | | | — | | | | 10,399,077 | |
Transportation Infrastructure | | | 16,861,221 | | | | — | | | | — | | | | 16,861,221 | |
Wireless Telecommunication Services | | | 20,404,930 | | | | — | | | | — | | | | 20,404,930 | |
Investment Companies | | | 11,391,485 | | | | — | | | | — | | | | 11,391,485 | |
Preferred Stocks: | | | | | | | | | | | | | | | | |
Internet Software & Services | | | — | | | | — | | | | 15,253,138 | | | | 15,253,138 | |
Software | | | — | | | | — | | | | 15,735,247 | | | | 15,735,247 | |
Short-Term Securities | | | 2,372,653 | | | $ | 4,470,214 | | | | — | | | | 6,842,867 | |
| | | | |
Total | | $ | 1,542,589,404 | | | $ | 37,195,927 | | | $ | 37,446,629 | | | $ | 1,617,231,960 | |
| | | | |
The Fund may hold assets and/or liabilities in which the fair value approximates the carrying amount for financial statement purposes. As of March 31, 2015, collateral on securities loaned at value of $4,470,214 is categorized as Level 2 within the disclosure hierarchy.
During the period ended March 31, 2015, there were no transfers between Level 1 and Level 2.
A reconciliation of Level 3 investments is presented when the Fund had a significant amount of Level 3 investments at the beginning and/or end of the period in relation to net assets. The following table is a reconciliation of Level 3 investments for which significant unobservable inputs were used in determining fair value:
| | | | | | | | | | | | |
| | | Common
Stocks | | | Preferred
Stocks | | | Total | |
Assets: | | | | | | | | | | | | |
Opening Balance, as of September 30, 2014 | | $ | 7,756,059 | | | $ | 47,325,756 | | | $ | 55,081,815 | |
Transfers into Level 3 | | | — | | | | — | | | | — | |
Transfers out of Level 31 | | | (28,476,941 | ) | | | | | | | (28,476,941 | ) |
Other2 | | | 27,759,025 | | | | (27,759,025 | ) | | | — | |
Accrued discounts/premiums | | | — | | | | — | | | | — | |
Net realized gain (loss) | | | — | | | | — | | | | — | |
Net change in unrealized appreciation/depreciation3,4 | | | (579,899 | ) | | | 7,679,343 | | | | 7,099,444 | |
Purchases | | | — | | | | 3,742,311 | | | | 3,742,311 | |
Sales | | | — | | | | — | | | | — | |
| | | | |
Closing Balance, as of March 31, 2015 | | $ | 6,458,244 | | | $ | 30,988,385 | | | $ | 37,446,629 | |
| | | | |
Net change in unrealized appreciation/depreciation on investments still held at March 31, 20154 | | $ | (579,899 | ) | | $ | 7,679,343 | | | $ | 7,099,444 | |
| | | | |
| | 1 | | As of September 30, 2014, the Fund used significant unobservable inputs in determining the value of certain investments. As of March 31, 2015, the Fund used observable inputs in determining the value of the same investments. As a result, investments with a beginning period value of $28,476,941 transferred from Level 3 to Level 2 in the disclosure hierarchy. |
| | 2 | | Certain Level 3 investments were re-classified between Common Stocks and Preferred Stocks. |
| | 3 | | Included in the related net change in unrealized appreciation/depreciation in the Statements of Operations. |
| | 4 | | Any difference between Net change in unrealized appreciation/depreciation and Net change in unrealized appreciation/depreciation on investments still held at March 31, 2015, is generally due to investments no longer held or categorized as Level 3 at period end. |
See Notes to Financial Statements.
| | | | | | |
| | | BLACKROCK FUNDS | | MARCH 31, 2015 | | 43 |
| | |
| Schedule of Investments (concluded) | | BlackRock U.S. Opportunities Portfolio |
The following table summarizes the valuation techniques used and unobservable inputs utilized by the BlackRock Global Valuation Methodologies Committee (the “Global Valuation Committee”) to determine the value of certain of the Fund’s Level 3 investments as of March 31, 2015. The table does not include Level 3 investments with values based upon unadjusted third party pricing information in the amount of $6,458,244.
| | | | | | | | | | | | |
| | | Value | | | Valuation Techniques | | Unobservable Inputs | | Range of
Unobservable Inputs
Utilized | |
Assets: | | | | | | | | | | | | |
Preferred Stocks1 | | $ | 17,662,284 | | | Probability-Weighted Expected Return Model | | Years to IPO2 | | | 0.75-2.9 | |
| | | | | | | | IPO Exit Probability3 | | | 90.00% - 95.00% | |
| | | | | | | | Discount Rate2 | | | 21.30% - 22.31% | |
| | | | | | | | Margin3 | | | 20.00% | |
| | | | | | | | Revenue Multiple3 | | | 10.0x-16.0x | |
| | | 3,826,922 | | | Probability-Weighted Expected Return Model | | Years to IPO2 | | | 1-2 | |
| | | | | | | | IPO Exit Probability3 | | | 75.00% | |
| | | | | | | | Discount Rate2 | | | 20.00% | |
| | | | | | | | Revenue Multiple3 | | | 8.0x | |
| | | | | | | | Merger and/or Acquisition Probability3 | | | 25.00% | |
| | | 9,499,179 | | | Market Comparable Companies | | 2016 Revenue Multiple3 | | | 11.0x | |
| | | | | | Options Pricing Model | | Years to IPO2 | | | 1-2 | |
| | | | | | | | Risk Free Rate2 | | | 0.31% | |
| | | | | | | | Volatility3 | | | 30.00% | |
Total | | $ | 30,988,385 | | | | | | | | | |
| | 1 | | For the period ended March 31, 2015, the valuation technique for certain investments classified as preferred stocks changed to a Probability-Weighted Expected Return Model. The investments were previously valued utilizing a market comparable company and option pricing model approach. A Probability-Weighted Expected Return Model was considered to be a more relevant measure of fair value for these investments which leverages the most recent equity raise pre-money valuation and secondary market transactions. |
| | 2 | | Decrease in unobservable input may result in a significant increase to value, while an increase in the unobservable input may result in a significant decrease to value. |
| | 3 | | Increase in unobservable input may result in a significant increase to value, while a decrease in the unobservable input may result in a significant decrease to value. |
See Notes to Financial Statements.
| | | | | | |
| 44 | | BLACKROCK FUNDS | | MARCH 31, 2015 | | |
| | |
| Statements of Assets and Liabilities | | |
| | | | | | | | | | | | | | | | | | | | |
| March 31, 2015 (Unaudited) | | BlackRock
Global
Opportunities
Portfolio | | | BlackRock Health Sciences
Opportunities
Portfolio | | | BlackRock
International
Opportunities
Portfolio | | | BlackRock
Science & Technology
Opportunities
Portfolio | | | BlackRock U.S.
Opportunities
Portfolio | |
| Assets | | | | | | | | | | | | | | | | | | | | |
Investments at value — unaffiliated1,2 | | $ | 306,603,110 | | | $ | 5,477,803,854 | | | $ | 1,102,078,748 | | | $ | 235,638,754 | | | $ | 1,610,389,093 | |
Investments at value — affiliated3 | | | 4,279,087 | | | | 130,202,388 | | | | 7,228,512 | | | | 3,881,225 | | | | 6,842,867 | |
Cash pledged as collateral for options written | | | — | | | | 11,387,775 | | | | — | | | | 718,200 | | | | — | |
Foreign currency at value4 | | | 2,795,824 | | | | 67,343,198 | | | | 111,499 | | | | 546,693 | | | | — | |
Investments sold receivable | | | 1,871,582 | | | | 45,261,516 | | | | 30,913,361 | | | | 6,505,904 | | | | 17,010,618 | |
Options written receivable | | | — | | | | — | | | | — | | | | 85,989 | | | | — | |
Unrealized appreciation on forward foreign currency exchange contracts | | | 1,178,015 | | | | 17,983,614 | | | | 12,130,410 | | | | 154,316 | | | | — | |
Capital shares sold receivable | | | 57,269 | | | | 16,033,141 | | | | 3,347,231 | | | | 229,509 | | | | 1,987,337 | |
Dividends receivable — unaffiliated | | | 592,997 | | | | 5,172,478 | | | | 3,417,712 | | | | 73,961 | | | | 2,201,637 | |
Dividends receivable — affiliated | | | 128 | | | | 9,258 | | | | 598 | | | | 350 | | | | 704 | |
Receivable from Manager | | | 60,815 | | | | — | | | | 113 | | | | 116 | | | | 220,716 | |
Securities lending income receivable — affiliated | | | 6,619 | | | | 8,184 | | | | 7,938 | | | | 929 | | | | 34,917 | |
Prepaid expenses | | | 44,812 | | | | 151,210 | | | | 56,902 | | | | 57,834 | | | | 65,397 | |
| | | | |
Total assets | | | 317,490,258 | | | | 5,771,356,616 | | | | 1,159,293,024 | | | | 247,893,780 | | | | 1,638,753,286 | |
| | | | |
| | | | | | | | | | | | | | | | | | | | |
| Liabilities | | | | | | | | | | | | | | | | | | | | |
Options written at value5 | | | — | | | | 144,838 | | | | — | | | | 183,462 | | | | — | |
Collateral on securities loaned at value | | | 1,974,042 | | | | 7,494,299 | | | | 1,430,717 | | | | 26,200 | | | | 4,470,214 | |
Deferred foreign capital gain tax payable | | | 190,246 | | | | — | | | | 693,325 | | | | 205,810 | | | | — | |
Investments purchased payable | | | 486,602 | | | | 119,910,833 | | | | 2,561,716 | | | | 7,135,916 | | | | 7,430,348 | |
Unrealized depreciation on forward foreign currency exchange contracts | | | 940,698 | | | | 8,136,893 | | | | 13,301,833 | | | | 58,027 | | | | — | |
Capital shares redeemed payable | | | 251,405 | | | | 11,058,648 | | | | 7,077,835 | | | | 383,133 | | | | 2,772,699 | |
Investment advisory fees payable | | | 236,983 | | | | 3,206,355 | | | | 885,892 | | | | 205,966 | | | | 1,133,670 | |
Service and distribution fees payable | | | 87,666 | | | | 1,584,579 | | | | 214,368 | | | | 62,771 | | | | 297,901 | |
Other affiliates payable | | | 12,255 | | | | 318,334 | | | | 118,253 | | | | 23,392 | | | | 155,797 | |
Officer’s and Trustees’ fees payable | | | 3,104 | | | | 20,345 | | | | 14,842 | | | | 2,054 | | | | 11,821 | |
Other accrued expenses payable | | | 254,653 | | | | 1,554,683 | | | | 1,036,313 | | | | 241,705 | | | | 1,257,105 | |
| | | | |
Total liabilities | | | 4,437,654 | | | | 153,429,807 | | | | 27,335,094 | | | | 8,528,436 | | | | 17,529,555 | |
| | | | |
Net Assets | | $ | 313,052,604 | | | $ | 5,617,926,809 | | | $ | 1,131,957,930 | | | $ | 239,365,344 | | | $ | 1,621,223,731 | |
| | | | |
| | | | | | | | | | | | | | | | | | | | |
| Net Assets Consist of | | | | | | | | | | | | | | | | | | | | |
Paid-in capital | | $ | 356,546,565 | | | $ | 3,466,076,635 | | | $ | 1,016,853,690 | | | $ | 183,518,665 | | | $ | 1,102,422,320 | |
Accumulated (distributions in excess of) net investment income (loss) | | | (3,170,662 | ) | | | (14,305,702 | ) | | | (19,429,189 | ) | | | (3,392,221 | ) | | | (893,647 | ) |
Accumulated net realized gain (loss) | | | (88,153,156 | ) | | | 370,899,893 | | | | (3,313,297 | ) | | | (10,128,102 | ) | | | 72,262,319 | |
Net unrealized appreciation/depreciation | | | 47,829,857 | | | | 1,795,255,983 | | | | 137,846,726 | | | | 69,367,002 | | | | 447,432,739 | |
| | | | |
Net Assets | | $ | 313,052,604 | | | $ | 5,617,926,809 | | | $ | 1,131,957,930 | | | $ | 239,365,344 | | | $ | 1,621,223,731 | |
| | | | |
1 Investments at cost — unaffiliated | | $ | 258,798,269 | | | $ | 3,692,087,079 | | | $ | 962,132,301 | | | $ | 166,240,668 | | | $ | 1,162,956,354 | |
2 Securities loaned at value | | $ | 1,947,265 | | | $ | 7,043,505 | | | $ | 1,334,135 | | | $ | 24,817 | | | $ | 4,430,030 | |
3 Investments at cost — affiliated | | $ | 4,279,087 | | | $ | 130,202,388 | | | $ | 7,228,512 | | | $ | 3,881,225 | | | $ | 6,842,867 | |
4 Foreign currency at cost | | $ | 2,796,205 | | | $ | 67,701,240 | | | $ | 112,945 | | | $ | 546,581 | | | | — | |
5 Premiums received | | | — | | | $ | 339,405 | | | | — | | | $ | 256,144 | | | | — | |
See Notes to Financial Statements.
| | | | | | |
| | | BLACKROCK FUNDS | | MARCH 31, 2015 | | 45 |
| | |
| Statements of Assets and Liabilities (concluded) | | |
| | | | | | | | | | | | | | | | | | | | |
| March 31, 2015 (Unaudited) | | BlackRock
Global
Opportunities
Portfolio | | | BlackRock
Health Sciences
Opportunities
Portfolio | | | BlackRock
International
Opportunities
Portfolio | | | BlackRock
Science
& Technology
Opportunities
Portfolio | | | BlackRock
U.S.
Opportunities
Portfolio | |
| | | | | | | | | | | | | | | | | | | | |
| Net Asset Value | | | | | | | | | | | | | | | | | | | | |
Institutional | | | | | | | | | | | | | | | | | | | | |
Net assets | | $ | 65,734,276 | | | $ | 1,518,558,187 | | | $ | 507,227,238 | | | $ | 60,260,829 | | | $ | 918,604,856 | |
| | | | |
Shares outstanding1 | | | 4,501,621 | | | | 26,918,256 | | | | 14,847,158 | | | | 3,736,812 | | | | 22,198,818 | |
| | | | |
Net asset value | | $ | 14.60 | | | $ | 56.41 | | | $ | 34.16 | | | $ | 16.13 | | | $ | 41.38 | |
| | | | |
| | | | | | | | | | | | | | | | | | | | |
Service | | | | | | | | | | | | | | | | | | | | |
Net assets | | | — | | | $ | 35,983,372 | | | $ | 25,367,726 | | | $ | 1,393,929 | | | $ | 32,154,117 | |
| | | | |
Shares outstanding1 | | | — | | | | 658,926 | | | | 775,863 | | | | 90,104 | | | | 817,021 | |
| | | | |
Net asset value | | | — | | | $ | 54.61 | | | $ | 32.70 | | | $ | 15.47 | | | $ | 39.36 | |
| | | | |
| | | | | | | | | | | | | | | | | | | | |
Investor A | | | | | | | | | | | | | | | | | | | | |
Net assets | | $ | 186,952,886 | | | $ | 2,799,471,211 | | | $ | 482,335,528 | | | $ | 135,403,639 | | | $ | 434,899,852 | |
| | | | |
Shares outstanding1 | | | 12,921,126 | | | | 51,415,274 | | | | 14,923,428 | | | | 8,916,047 | | | | 11,386,805 | |
| | | | |
Net asset value | | $ | 14.47 | | | $ | 54.45 | | | $ | 32.32 | | | $ | 15.19 | | | $ | 38.19 | |
| | | | |
| | | | | | | | | | | | | | | | | | | | |
Investor B | | | | | | | | | | | | | | | | | | | | |
Net assets | | $ | 1,440,974 | | | $ | 19,826,452 | | | $ | 2,416,864 | | | $ | 989,721 | | | $ | 10,182,222 | |
| | | | |
Shares outstanding1 | | | 101,809 | | | | 392,138 | | | | 81,419 | | | | 73,523 | | | | 317,008 | |
| | | | |
Net asset value | | $ | 14.15 | | | $ | 50.56 | | | $ | 29.68 | | | $ | 13.46 | | | $ | 32.12 | |
| | | | |
| | | | | | | | | | | | | | | | | | | | |
Investor C | | | | | | | | | | | | | | | | | | | | |
Net assets | | $ | 48,674,958 | | | $ | 1,124,315,609 | | | $ | 114,610,574 | | | $ | 36,533,972 | | | $ | 225,382,684 | |
| | | | |
Shares outstanding1 | | | 3,472,663 | | | | 22,614,806 | | | | 3,912,870 | | | | 2,722,473 | | | | 7,016,993 | |
| | | | |
Net asset value | | $ | 14.02 | | | $ | 49.72 | | | $ | 29.29 | | | $ | 13.42 | | | $ | 32.12 | |
| | | | |
| | | | | | | | | | | | | | | | | | | | |
Class R | | | | | | | | | | | | | | | | | | | | |
Net assets | | $ | 10,249,510 | | | $ | 119,771,978 | | | | — | | | $ | 4,783,254 | | | | — | |
| | | | |
Shares outstanding1 | | | 710,976 | | | | 2,221,411 | | | | — | | | | 309,565 | | | | — | |
| | | | |
Net asset value | | $ | 14.42 | | | $ | 53.92 | | | | — | | | $ | 15.45 | | | | — | |
| | | | |
| | 1 | | Unlimited number of shares authorized, $0.001 par value. |
See Notes to Financial Statements.
| | | | | | |
| 46 | | BLACKROCK FUNDS | | MARCH 31, 2015 | | |
| | | | | | | | | | | | | | | | | | | | |
| Six Months Ended March 31, 2015 (Unaudited) | | BlackRock
Global
Opportunities
Portfolio | | | BlackRock
Health
Sciences
Opportunities
Portfolio | | | BlackRock
International
Opportunities
Portfolio | | | BlackRock
Science &
Technology
Opportunities
Portfolio | | | BlackRock
U.S.
Opportunities
Portfolio | |
| | | | | | | | | | | | | | | | | | | | |
| Investment Income | | | | | | | | | | | | | | | | | | | | |
Dividends — unaffiliated | | $ | 2,206,405 | | | $ | 26,276,127 | | | $ | 11,500,033 | | | $ | 732,386 | | | $ | 8,358,961 | |
Dividends — affiliated | | | 1,028 | | | | 29,999 | | | | 2,254 | | | | 993 | | | | 9,016 | |
Securities lending — affiliated — net | | | 41,286 | | | | 51,703 | | | | 97,820 | | | | 15,577 | | | | 85,508 | |
Foreign taxes withheld | | | (154,514 | ) | | | (861,274 | ) | | | (1,252,364 | ) | | | (7,170 | ) | | | — | |
| | | | |
Total income | | | 2,094,205 | | | | 25,496,555 | | | | 10,347,743 | | | | 741,786 | | | | 8,453,485 | |
| | | | |
| | | | | | | | | | | | | | | | | | | | |
| Expenses | | | | | | | | | | | | | | | | | | | | |
Investment advisory | | | 1,407,102 | | | | 16,624,030 | | | | 6,466,851 | | | | 1,008,795 | | | | 8,406,976 | |
Service and distribution — class specific | | | 515,878 | | | | 8,196,423 | | | | 1,355,907 | | | | 345,910 | | | | 1,752,807 | |
Transfer agent — class specific | | | 244,129 | | | | 2,489,053 | | | | 1,266,077 | | | | 273,897 | | | | 1,192,085 | |
Administration | | | 92,243 | | | | 1,127,235 | | | | 355,523 | | | | 65,476 | | | | 406,289 | |
Professional | | | 47,948 | | | | 42,022 | | | | 50,741 | | | | 35,256 | | | | 46,833 | |
Custodian | | | 38,399 | | | | 97,560 | | | | 156,177 | | | | 17,599 | | | | 40,038 | |
Administration — class specific | | | 35,269 | | | | 431,468 | | | | 142,383 | | | | 25,165 | | | | 167,838 | |
Registration | | | 30,914 | | | | 95,520 | | | | 53,277 | | | | 38,414 | | | | 47,574 | |
Accounting services | | | 22,571 | | | | 271,917 | | | | 75,124 | | | | 17,629 | | | | 69,923 | |
Printing | | | 10,871 | | | | 65,987 | | | | 46,630 | | | | 8,648 | | | | 32,955 | |
Officer and Trustees | | | 6,626 | | | | 60,968 | | | | 24,017 | | | | 5,076 | | | | 23,844 | |
Miscellaneous | | | 15,051 | | | | 39,624 | | | | 28,303 | | | | 11,938 | | | | 18,241 | |
Recoupment of past waived and/or reimbursed fees — class specific | | | — | | | | — | | | | 1,675 | | | | 23,422 | | | | 9,265 | |
| | | | |
Total expenses | | | 2,467,001 | | | | 29,541,807 | | | | 10,022,685 | | | | 1,877,225 | | | | 12,214,668 | |
Less fees waived by Manager | | | (15,202 | ) | | | (39,085 | ) | | | (656,842 | ) | | | (1,088 | ) | | | (2,022,413 | ) |
Less administration fees waived — class specific | | | (35,269 | ) | | | — | | | | (15,237 | ) | | | (6,821 | ) | | | (141,510 | ) |
Less transfer agent fees waived — class specific | | | (7,408 | ) | | | — | | | | (1,602 | ) | | | (1,645 | ) | | | (9,569 | ) |
Less transfer agent fees reimbursed — class specific | | | (187,933 | ) | | | — | | | | (1,676 | ) | | | (1,402 | ) | | | (662,870 | ) |
| | | | |
Total expenses after fees waived and/or reimbursed | | | 2,221,189 | | | | 29,502,722 | | | | 9,347,328 | | | | 1,866,269 | | | | 9,378,306 | |
| | | | |
Net investment income (loss) | | | (126,984 | ) | | | (4,006,167 | ) | | | 1,000,415 | | | | (1,124,483 | ) | | | (924,821 | ) |
| | | | |
| | | | | | | | | | | | | | | | | | | | |
| Realized and Unrealized Gain (Loss) | | | | | | | | | | | | | | | | | | | | |
Net realized gain (loss) from: | | | | | | | | | | | | | | | | | | | | |
Investments | | | 4,581,648 | | | | 379,358,269 | | | | (6,735,398 | ) | | | 7,849,149 | | | | 83,301,733 | |
Capital gain distributions received from affiliated investment companies | | | — | | | | 7,875 | | | | — | | | | — | | | | 3,550 | |
Options written | | | — | | | | 285,157 | | | | — | | | | 41,146 | | | | — | |
Foreign currency transactions | | | 1,575,609 | | | | 4,853,357 | | | | 6,911,650 | | | | 404,523 | | | | — | |
| | | | |
| | | 6,157,257 | | | | 384,504,658 | | | | 176,252 | | | | 8,294,818 | | | | 83,305,283 | |
| | | | |
Net change in unrealized appreciation/depreciation on: | | | | | | | | | | | | | | | | | | | | |
Investments | | | 8,443,528 | 1 | | | 510,198,146 | | | | 13,598,949 | 1 | | | 18,445,291 | 1 | | | 94,439,285 | |
Options written | | | — | | | | 194,567 | | | | — | | | | 72,682 | | | | — | |
Foreign currency translations | | | (781,514 | ) | | | (875,342 | ) | | | (9,895,874 | ) | | | (293,778 | ) | | | — | |
| | | | |
| | | 7,662,014 | | | | 509,517,371 | | | | 3,703,075 | | | | 18,224,195 | | | | 94,439,285 | |
| | | | |
Net realized and unrealized gain | | | 13,819,271 | | | | 894,022,029 | | | | 3,879,327 | | | | 26,519,013 | | | | 177,744,568 | |
| | | | |
Net Increase in Net Assets Resulting from Operations | | $ | 13,692,287 | | | $ | 890,015,862 | | | $ | 4,879,742 | | | $ | 25,394,530 | | | $ | 176,819,747 | |
| | | | |
| | 1 | | Net of ($190,246, $693,325 and $205,810) foreign capital gain tax for Global Opportunities, International Opportunities and Science & Technology Opportunities, respectively. |
See Notes to Financial Statements.
| | | | | | |
| | | BLACKROCK FUNDS | | MARCH 31, 2015 | | 47 |
| | |
| Statements of Changes in Net Assets | | |
| | | | | | | | | | | | | | | | |
| | | BlackRock
Global Opportunities
Portfolio | | | BlackRock
Health Sciences
Opportunities
Portfolio | |
| Increase (Decrease) in Net Assets: | | Six Months
Ended
March 31, 2015
(Unaudited) | | | Year Ended
September 30,
2014 | | | Six Months
Ended March 31, 2015 (Unaudited) | | | Year Ended
September 30,
2014 | |
| | | | | | | | | | | | | | | | |
| Operations | | | | | | | | | | | | | | | | |
Net investment income (loss) | | $ | (126,984 | ) | | $ | 1,572,501 | | | $ | (4,006,167 | ) | | $ | (5,669,420 | ) |
Net realized gain | | | 6,157,257 | | | | 31,453,698 | | | | 384,504,658 | | | | 356,507,986 | |
Net change in unrealized appreciation/depreciation | | | 7,662,014 | | | | (14,244,616 | ) | | | 509,517,371 | | | | 504,697,663 | |
| | | | | | | | |
Net increase in net assets resulting from operations | | | 13,692,287 | | | | 18,781,583 | | | | 890,015,862 | | | | 855,536,229 | |
| | | | | | | | |
| | | | | | | | | | | | | | | | |
| Distributions to Shareholders From1 | | | | | | | | | | | | | | | | |
Net investment income: | | | | | | | | | | | | | | | | |
Institutional | | | (1,182,326 | ) | | | — | | | | (3,636,341 | ) | | | (2,684,586 | ) |
Service | | | — | | | | — | | | | (7,864 | ) | | | (15,999 | ) |
Investor A | | | (2,755,653 | ) | | | — | | | | (969,029 | ) | | | (1,334,162 | ) |
Investor C | | | (299,620 | ) | | | — | | | | — | | | | — | |
Class R | | | (109,637 | ) | | | — | | | | — | | | | — | |
Net realized gain: | | | | | | | | | | | | | | | | |
Institutional | | | — | | | | — | | | | (81,656,297 | ) | | | (73,784,321 | ) |
Service | | | — | | | | — | | | | (2,189,953 | ) | | | (2,296,130 | ) |
Investor A | | | — | | | | — | | | | (152,909,044 | ) | | | (159,449,440 | ) |
Investor B | | | — | | | | — | | | | (1,328,584 | ) | | | (3,350,382 | ) |
Investor C | | | — | | | | — | | | | (61,611,824 | ) | | | (60,490,412 | ) |
Class R | | | — | | | | — | | | | (5,828,156 | ) | | | (3,720,373 | ) |
| | | | | | | | |
Decrease in net assets resulting from distributions to shareholders | | | (4,347,236 | ) | | | — | | | | (310,137,092 | ) | | | (307,125,805 | ) |
| | | | | | | | |
| | | | | | | | | | | | | | | | |
| Capital Share Transactions | | | | | | | | | | | | | | | | |
Net increase (decrease) in net assets derived from capital share transactions | | | (15,773,200 | ) | | | (38,945,315 | ) | | | 893,295,462 | | | | 517,643,012 | |
| | | | | | | | |
| | | | | | | | | | | | | | | | |
| Net Assets | | | | | | | | | | | | | | | | |
Total increase (decrease) in net assets | | | (6,428,149 | ) | | | (20,163,732 | ) | | | 1,473,174,232 | | | | 1,066,053,436 | |
Beginning of period | | | 319,480,753 | | | | 339,644,485 | | | | 4,144,752,577 | | | | 3,078,699,141 | |
| | | | | | | | |
End of period | | $ | 313,052,604 | | | $ | 319,480,753 | | | $ | 5,617,926,809 | | | $ | 4,144,752,577 | |
| | | | | | | | |
Undistributed (accumulated) net investment income (loss), end of period | | $ | (3,170,662 | ) | | $ | 1,303,558 | | | $ | (14,305,702 | ) | | $ | (5,686,301 | ) |
| | | | | | | | |
| | 1 | | Distributions for annual periods determined in accordance with federal income tax regulations. |
See Notes to Financial Statements.
| | | | | | |
| 48 | | BLACKROCK FUNDS | | MARCH 31, 2015 | | |
| | |
| Statements of Changes in Net Assets (concluded) | | |
| | | | | | | | | | | | | | | | | | | | | | | | |
| | | BlackRock
International
Opportunities
Portfolio | | | BlackRock
Science &
Technology
Opportunities
Portfolio | | | BlackRock
U.S. Opportunities
Portfolio | |
| Increase (Decrease) in Net Assets: | | Six Months
Ended March 31,
2015 (Unaudited) | | | Year Ended
September 30,
2014 | | | Six Months
Ended
March 31, 2015
(Unaudited) | | | Year Ended
September 30,
2014 | | | Six Months
Ended March 31,
2015 (Unaudited) | | | Year Ended
September 30,
2014 | |
| | | | | | | | | | | | | | | | | | | | | | | | |
| Operations | | | | | | | | | | | | | | | | | | | | | | | | |
Net investment income (loss) | | $ | 1,000,415 | | | $ | 17,062,650 | | | $ | (1,124,483 | ) | | $ | (2,371,646 | ) | | $ | (924,821 | ) | | $ | (8,010,488 | ) |
Net realized gain | | | 176,252 | | | | 116,647,309 | | | | 8,294,818 | | | | 24,040,750 | | | | 83,305,283 | | | | 294,616,993 | |
Net change in unrealized appreciation/depreciation | | | 3,703,075 | | | | (125,627,644 | ) | | | 18,224,195 | | | | 5,667,184 | | | | 94,439,285 | | | | (50,830,763 | ) |
| | | | | | | | | | | | |
Net increase in net assets resulting from operations | | | 4,879,742 | | | | 8,082,315 | | | | 25,394,530 | | | | 27,336,288 | | | | 176,819,747 | | | | 235,775,742 | |
| | | | | | | | | | | | |
| | | | | | | | | | | | | | | | | | | | | | | | |
| Distributions to Shareholders From1 | | | | | | | | | | | | | | | | | | | | | | | | |
Net investment income: | | | | | | | | | | | | | | | | | | | | | | | | |
Institutional | | | (14,511,734 | ) | | | (1,532,662 | ) | | | — | | | | — | | | | — | | | | — | |
Service | | | (656,317 | ) | | | (48,294 | ) | | | — | | | | — | | | | — | | | | — | |
Investor A | | | (13,763,636 | ) | | | (919,073 | ) | | | — | | | | — | | | | — | | | | — | |
Investor B | | | (46,718 | ) | | | — | | | | — | | | | — | | | | — | | | | — | |
Investor C | | | (2,388,654 | ) | | | — | | | | — | | | | — | | | | — | | | | — | |
Net realized gain: | | | | | | | | | | | | | | | | | | | | | | | | |
Institutional | | | (58,313,799 | ) | | | (2,005,514 | ) | | | — | | | | — | | | | (119,058,466 | ) | | | (134,711,811 | ) |
Service | | | (2,959,800 | ) | | | (101,390 | ) | | | — | | | | — | | | | (4,386,546 | ) | | | (31,011,668 | ) |
Investor A | | | (62,289,732 | ) | | | (1,953,372 | ) | | | — | | | | — | | | | (63,008,538 | ) | | | (103,656,072 | ) |
Investor B | | | (313,352 | ) | | | (14,262 | ) | | | — | | | | — | | | | (1,680,434 | ) | | | (2,930,164 | ) |
Investor C | | | (14,061,426 | ) | | | (410,265 | ) | | | — | | | | — | | | | (34,791,331 | ) | | | (47,392,290 | ) |
| | | | | | | | | | | | |
Decrease in net assets resulting from distributions to shareholders | | | (169,305,168 | ) | | | (6,984,832 | ) | | | — | | | | — | | | | (222,925,315 | ) | | | (319,702,005 | ) |
| | | | | | | | | | | | |
| | | | | | | | | | | | | | | | | | | | | | | | |
| Capital Share Transactions | | | | | | | | | | | | | | | | | | | | | | | | |
Net increase (decrease) in net assets derived from capital share transactions | | | (264,289,686 | ) | | | (164,685,699 | ) | | | 1,964,199 | | | | 15,083,112 | | | | 148,325,942 | | | | 33,482,653 | |
| | | | | | | | | | | | |
| | | | | | | | | | | | | | | | | | | | | | | | |
| Net Assets | | | | | | | | | | | | | | | | | | | | | | | | |
Total increase (decrease) in net assets | | | (428,715,112 | ) | | | (163,588,216 | ) | | | 27,358,729 | | | | 42,419,400 | | | | 102,220,374 | | | | (50,443,610 | ) |
Beginning of period | | | 1,560,673,042 | | | | 1,724,261,258 | | | | 212,006,615 | | | | 169,587,215 | | | | 1,519,003,357 | | | | 1,569,446,967 | |
| | | | | | | | | | | | |
End of period | | $ | 1,131,957,930 | | | $ | 1,560,673,042 | | | $ | 239,365,344 | | | $ | 212,006,615 | | | $ | 1,621,223,731 | | | $ | 1,519,003,357 | |
| | | | | | | | | | | | |
Undistributed (distributions in excess of) net investment income (loss), end of period | | $ | (19,429,189 | ) | | $ | 10,937,455 | | | $ | (3,392,221 | ) | | $ | (2,267,738 | ) | | $ | (893,647 | ) | | $ | 31,174 | |
| | | | | | | | | | | | |
| | 1 | | Distributions for annual periods determined in accordance with federal income tax regulations. |
See Notes to Financial Statements.
| | | | | | |
| | | BLACKROCK FUNDS | | MARCH 31, 2015 | | 49 |
| | | | |
| Financial Highlights | | | BlackRock Global Opportunities Portfolio | |
| | | | | | | | | | | | | | | | | | | | | | | | |
| | | Institutional | |
| | | Six Months
Ended
March 31,
2015
(Unaudited) | | | Year Ended September 30, | |
| | | | 2014 | | | 2013 | | | 2012 | | | 2011 | | | 2010 | |
| Per Share Operating Performance | | | | | | | | | | | | | | | | | | | | | | | | |
Net asset value, beginning of period | | $ | 14.19 | | | $ | 13.42 | | | $ | 11.11 | | | $ | 9.32 | | | $ | 10.52 | | | $ | 10.13 | |
| | | | |
Net investment income1 | | | 0.02 | | | | 0.12 | | | | 0.10 | | | | 0.14 | | | | 0.08 | | | | 0.06 | |
Net realized and unrealized gain (loss) | | | 0.64 | | | | 0.65 | | | | 2.36 | | | | 1.67 | | | | (1.20 | )2 | | | 0.48 | 2 |
| | | | |
Net increase (decrease) from investment operations | | | 0.66 | | | | 0.77 | | | | 2.46 | | | | 1.81 | | | | (1.12 | ) | | | 0.54 | |
| | | | |
Distributions from net investment income3 | | | (0.25 | ) | | | — | | | | (0.15 | ) | | | (0.02 | ) | | | (0.08 | ) | | | (0.15 | ) |
| | | | |
Net asset value, end of period | | $ | 14.60 | | | $ | 14.19 | | | $ | 13.42 | | | $ | 11.11 | | | $ | 9.32 | | | $ | 10.52 | |
| | | | |
| | | | | | | | | | | | | | | | | | | | | | | | |
| Total Return4 | | | | | | | | | | | | | | | | | | | | | | | | |
Based on net asset value | | | 4.77 | %5 | | | 5.74 | % | | | 22.40 | % | | | 19.45 | % | | | (10.81 | )%6 | | | 5.32 | %6 |
| | | | |
| | | | | | | | | | | | | | | | | | | | | | | | |
| Ratios to Average Net Assets | | | | | | | | | | | | | | | | | | | | | | | | |
Total expenses | | | 1.21 | %7 | | | 1.20 | % | | | 1.22 | % | | | 1.25 | % | | | 1.53 | %8 | | | 1.43 | %8 |
| | | | |
Total expenses after fees waived and/or reimbursed and paid indirectly | | | 1.06 | %7 | | | 1.06 | % | | | 1.06 | % | | | 1.06 | % | | | 1.34 | % | | | 1.37 | % |
| | | | |
Net investment income | | | 0.29 | %7 | | | 0.82 | % | | | 0.83 | % | | | 1.35 | % | | | 0.68 | % | | | 0.64 | % |
| | | | |
| | | | | | | | | | | | | | | | | | | | | | | | |
| Supplemental Data | | | | | | | | | | | | | | | | | | | | | | | | |
Net assets, end of period (000) | | $ | 65,734 | | | $ | 61,601 | | | $ | 63,182 | | | $ | 54,448 | | | $ | 58,793 | | | $ | 21,699 | |
| | | | |
Portfolio turnover rate | | | 31 | % | | | 99 | % | | | 149 | % | | | 122 | % | | | 137 | % | | | 146 | % |
| | | | |
| | 1 | | Based on average shares outstanding. |
| | 2 | | Includes redemption fees, which are less than $0.005 per share. |
| | 3 | | Distributions for annual periods determined in accordance with federal income tax regulations. |
| | 4 | | Where applicable, assumes the reinvestment of distributions. |
| | 5 | | Aggregate total return. |
| | 6 | | Redemption fee of 2.00% is reflected in total return calculations. There was no impact to the return. |
| | 8 | | Includes recoupment of past waived and/or reimbursed fees. Excluding the recoupment of past waived and/or reimbursed fees for the years ended September 30, 2011 and September 30, 2010 the ratio would have been 1.52% and 1.42%, respectively. |
See Notes to Financial Statements.
| | | | | | |
| 50 | | BLACKROCK FUNDS | | MARCH 31, 2015 | | |
| | | | |
| Financial Highlights (continued) | | | BlackRock Global Opportunities Portfolio | |
| | | | | | | | | | | | | | | | | | | | | | | | |
| | | Investor A | |
| | | Six Months
Ended
March 31,
2015
(Unaudited) | | | Year Ended September 30, | |
| | | | 2014 | | | 2013 | | | 2012 | | | 2011 | | | 2010 | |
| Per Share Operating Performance | | | | | | | | | | | | | | | | | | | | | | | | |
Net asset value, beginning of period | | $ | 14.04 | | | $ | 13.32 | | | $ | 11.02 | | | $ | 9.26 | | | $ | 10.45 | | | $ | 10.08 | |
| | | | |
Net investment income1 | | | 0.00 | 2 | | | 0.08 | | | | 0.07 | | | | 0.11 | | | | 0.05 | | | | 0.03 | |
Net realized and unrealized gain (loss) | | | 0.64 | | | | 0.64 | | | | 2.35 | | | | 1.66 | | | | (1.20 | )3 | | | 0.46 | 3 |
| | | | |
Net increase (decrease) from investment operations | | | 0.64 | | | | 0.72 | | | | 2.42 | | | | 1.77 | | | | (1.15 | ) | | | 0.49 | |
| | | | |
Distributions from net investment income4 | | | (0.21 | ) | | | — | | | | (0.12 | ) | | | (0.01 | ) | | | (0.04 | ) | | | (0.12 | ) |
| | | | |
Net asset value, end of period | | $ | 14.47 | | | $ | 14.04 | | | $ | 13.32 | | | $ | 11.02 | | | $ | 9.26 | | | $ | 10.45 | |
| | | | |
| | | | | | | | | | | | | | | | | | | | | | | | |
| Total Return5 | | | | | | | | | | | | | | | | | | | | | | | | |
Based on net asset value | | | 4.63 | %6 | | | 5.41 | % | | | 22.14 | % | | | 19.16 | % | | | (11.11 | )%7 | | | 4.92 | %7 |
| | | | |
| | | | | | | | | | | | | | | | | | | | | | | | |
| Ratios to Average Net Assets | | | | | | | | | | | | | | | | | | | | | | | | |
Total expenses | | | 1.49 | %8 | | | 1.46 | % | | | 1.48 | % | | | 1.52 | % | | | 1.76 | %9 | | | 1.72 | %9 |
| | | | |
Total expenses after fees waived and/or reimbursed and paid indirectly | | | 1.33 | %8 | | | 1.33 | % | | | 1.33 | % | | | 1.33 | % | | | 1.61 | % | | | 1.67 | % |
| | | | |
Net investment income | | | 0.01 | %8 | | | 0.56 | % | | | 0.56 | % | | | 1.06 | % | | | 0.42 | % | | | 0.32 | % |
| | | | |
| | | | | | | | | | | | | | | | | | | | | | | | |
| Supplemental Data | | | | | | | | | | | | | | | | | | | | | | | | |
Net assets, end of period (000) | | $ | 186,953 | | | $ | 191,653 | | | $ | 202,343 | | | $ | 195,961 | | | $ | 210,299 | | | $ | 39,280 | |
| | | | |
Portfolio turnover rate | | | 31 | % | | | 99 | % | | | 149 | % | | | 122 | % | | | 137 | % | | | 146 | % |
| | | | |
| | 1 | | Based on average shares outstanding. |
| | 2 | | Amount is less than $0.005 per share. |
| | 3 | | Includes redemption fees, which are less than $0.005 per share. |
| | 4 | | Distributions for annual periods determined in accordance with federal income tax regulations. |
| | 5 | | Where applicable, excludes the effects of any sales charges and assumes the reinvestment of distributions. |
| | 6 | | Aggregate total return. |
| | 7 | | Redemption fee of 2.00% is reflected in total return calculations. There was no impact to the return. |
| | 9 | | Includes recoupment of past waived and/or reimbursed fees. Excluding the recoupment of past waived and/or reimbursed fees for the years ended September 30, 2011 and September 30, 2010 the ratio would have been 1.74% and 1.70%, respectively. |
See Notes to Financial Statements.
| | | | | | |
| | | BLACKROCK FUNDS | | MARCH 31, 2015 | | 51 |
| | | | |
| Financial Highlights (continued) | | | BlackRock Global Opportunities Portfolio | |
| | | | | | | | | | | | | | | | | | | | | | | | |
| | | Investor B | |
| | | Six Months
Ended
March 31,
2015
(Unaudited) | | | Year Ended September 30, | |
| | | | 2014 | | | 2013 | | | 2012 | | | 2011 | | | 2010 | |
| Per Share Operating Performance | | | | | | | | | | | | | | | | | | | | | | | | |
Net asset value, beginning of period | | $ | 13.59 | | | $ | 12.99 | | | $ | 10.75 | | | $ | 9.10 | | | $ | 10.31 | | | $ | 9.93 | |
| | | | |
Net investment income (loss)1 | | | (0.06 | ) | | | (0.03 | ) | | | (0.03 | ) | | | 0.02 | | | | (0.04 | ) | | | (0.04 | ) |
Net realized and unrealized gain (loss) | | | 0.62 | | | | 0.63 | | | | 2.28 | | | | 1.63 | | | | (1.17 | )2 | | | 0.45 | 2 |
| | | | |
Net increase (decrease) from investment operations | | | 0.56 | | | | 0.60 | | | | 2.25 | | | | 1.65 | | | | (1.21 | ) | | | 0.41 | |
| | | | |
Distributions from net investment income3 | | | — | | | | — | | | | (0.01 | ) | | | — | | | | — | | | | (0.03 | ) |
| | | | |
Net asset value, end of period | | $ | 14.15 | | | $ | 13.59 | | | $ | 12.99 | | | $ | 10.75 | | | $ | 9.10 | | | $ | 10.31 | |
| | | | |
| | | | | | | | | | | | | | | | | | | | | | | | |
| Total Return4 | | | | | | | | | | | | | | | | | | | | | | | | |
Based on net asset value | | | 4.12 | %5 | | | 4.62 | % | | | 20.95 | % | | | 18.13 | % | | | (11.74 | )%6 | | | 4.09 | %6 |
| | | | |
| | | | | | | | | | | | | | | | | | | | | | | | |
| Ratios to Average Net Assets | | | | | | | | | | | | | | | | | | | | | | | | |
Total expenses | | | 2.60 | %7 | | | 2.21 | %8 | | | 2.19 | %8 | | | 2.21 | %8 | | | 2.56 | %8 | | | 2.45 | %8 |
| | | | |
Total expenses after fees waived and/or reimbursed and paid indirectly | | | 2.18 | %7 | | | 2.18 | % | | | 2.18 | % | | | 2.18 | % | | | 2.42 | % | | | 2.43 | % |
| | | | |
Net investment income (loss) | | | (0.87 | )%7 | | | (0.24 | )% | | | (0.29 | )% | | | 0.21 | % | | | (0.39 | )% | | | (0.44 | )% |
| | | | |
| | | | | | | | | | | | | | | | | | | | | | | | |
| Supplemental Data | | | | | | | | | | | | | | | | | | | | | | | | |
Net assets, end of period (000) | | $ | 1,441 | | | $ | 1,900 | | | $ | 4,254 | | | $ | 5,412 | | | $ | 6,750 | | | $ | 3,617 | |
| | | | |
Portfolio turnover rate | | | 31 | % | | | 99 | % | | | 149 | % | | | 122 | % | | | 137 | % | | | 146 | % |
| | | | |
| | 1 | | Based on average shares outstanding. |
| | 2 | | Includes redemption fees, which are less than $0.005 per share. |
| | 3 | | Distributions for annual periods determined in accordance with federal income tax regulations. |
| | 4 | | Where applicable, excludes the effects of any sales charges and assumes the reinvestment of distributions. |
| | 5 | | Aggregate total return. |
| | 6 | | Redemption fee of 2.00% is reflected in total return calculations. There was no impact to the return. |
| | 8 | | Includes recoupment of past waived and/or reimbursed fees. Excluding the recoupment of past waived and/or reimbursed fees for the years ended September 30, 2012 and September 30, 2011, the ratio would have been 2.20% and 2.53%, respectively. There was no financial impact to the expense ratios for the years ended September 30, 2014, September 30, 2013 and September 30, 2010. |
See Notes to Financial Statements.
| | | | | | |
| 52 | | BLACKROCK FUNDS | | MARCH 31, 2015 | | |
| | | | |
| Financial Highlights (continued) | | | BlackRock Global Opportunities Portfolio | |
| | | | | | | | | | | | | | | | | | | | | | | | |
| | | Investor C | |
| | | Six Months
Ended
March 31,
2015
(Unaudited) | | | Year Ended September 30, | |
| | | | 2014 | | | 2013 | | | 2012 | | | 2011 | | | 2010 | |
| Per Share Operating Performance | | | | | | | | | | | | | | | | | | | | | | | | |
Net asset value, beginning of period | | $ | 13.54 | | | $ | 12.94 | | | $ | 10.71 | | | $ | 9.06 | | | $ | 10.27 | | | $ | 9.91 | |
| | | | |
Net investment income (loss)1 | | | (0.05 | ) | | | (0.03 | ) | | | (0.03 | ) | | | 0.03 | | | | (0.04 | ) | | | (0.04 | ) |
Net realized and unrealized gain (loss) | | | 0.61 | | | | 0.63 | | | | 2.28 | | | | 1.62 | | | | (1.17 | )2 | | | 0.45 | 2 |
| | | | |
Net increase (decrease) from investment operations | | | 0.56 | | | | 0.60 | | | | 2.25 | | | | 1.65 | | | | (1.21 | ) | | | 0.41 | |
| | | | |
Distributions from net investment income3 | | | (0.08 | ) | | | — | | | | (0.02 | ) | | | — | | | | — | | | | (0.05 | ) |
| | | | |
Net asset value, end of period | | $ | 14.02 | | | $ | 13.54 | | | $ | 12.94 | | | $ | 10.71 | | | $ | 9.06 | | | $ | 10.27 | |
| | | | |
| | | | | | | | | | | | | | | | | | | | | | | | |
| Total Return4 | | | | | | | | | | | | | | | | | | | | | | | | |
Based on net asset value | | | 4.19 | %5 | | | 4.64 | % | | | 21.07 | % | | | 18.21 | % | | | (11.78 | )%6 | | | 4.13 | %6 |
| | | | |
| | | | | | | | | | | | | | | | | | | | | | | | |
| Ratios to Average Net Assets | | | | | | | | | | | | | | | | | | | | | | | | |
Total expenses | | | 2.28 | %7 | | | 2.24 | % | | | 2.28 | % | | | 2.32 | % | | | 2.59 | %8 | | | 2.49 | %8 |
| | | | |
Total expenses after fees waived and/or reimbursed and paid indirectly | | | 2.14 | %7 | | | 2.14 | % | | | 2.14 | % | | | 2.14 | % | | | 2.42 | % | | | 2.44 | % |
| | | | |
Net investment income (loss) | | | (0.81 | )%7 | | | (0.25 | )% | | | (0.25 | )% | | | 0.26 | % | | | (0.38 | )% | | | (0.40 | )% |
| | | | |
| | | | | | | | | | | | | | | | | | | | | | | | |
| Supplemental Data | | | | | | | | | | | | | | | | | | | | | | | | |
Net assets, end of period (000) | | $ | 48,675 | | | $ | 58,036 | | | $ | 55,494 | | | $ | 54,332 | | | $ | 58,687 | | | $ | 19,554 | |
| | | | |
Portfolio turnover rate | | | 31 | % | | | 99 | % | | | 149 | % | | | 122 | % | | | 137 | % | | | 146 | % |
| | | | |
| | 1 | | Based on average shares outstanding. |
| | 2 | | Includes redemption fees, which are less than $0.005 per share. |
| | 3 | | Distributions for annual periods determined in accordance with federal income tax regulations. |
| | 4 | | Where applicable, excludes the effects of any sales charges and assumes the reinvestment of distributions. |
| | 5 | | Aggregate total return. |
| | 6 | | Redemption fee of 2.00% is reflected in total return calculations. There was no impact to the return. |
| | 8 | | Includes recoupment of past waived and/or reimbursed fees. Excluding the recoupment of past waived and/or reimbursed fees for the year ended September 30, 2011 the ratio would have been 2.57% . There was no financial impact to the expense ratios for the year ended September 30, 2010. |
See Notes to Financial Statements.
| | | | | | |
| | | BLACKROCK FUNDS | | MARCH 31, 2015 | | 53 |
| | | | |
| Financial Highlights (concluded) | | | BlackRock Global Opportunities Portfolio | |
| | | | | | | | | | | | | | | | | | | | |
| | | Class R | |
| | | Six Months
Ended
March 31,
2015 (Unaudited) | | | Year Ended September 30, | | | Period
September 12,
20111 to
September 30,
2011 | |
| | | | 2014 | | | 2013 | | | 2012 | | |
| Per Share Operating Performance | | | | | | | | | | | | | | | | | | | | |
Net asset value, beginning of period | | $ | 13.94 | | | $ | 13.28 | | | $ | 10.99 | | | $ | 9.26 | | | $ | 9.76 | |
| | | | |
Net investment income (loss)2 | | | (0.03 | ) | | | 0.02 | | | | 0.02 | | | | 0.08 | | | | 0.00 | 3 |
Net realized and unrealized gain (loss) | | | 0.64 | | | | 0.64 | | | | 2.35 | | | | 1.65 | | | | (0.50 | )4 |
| | | | |
Net increase (decrease) from investment operations | | | 0.61 | | | | 0.66 | | | | 2.37 | | | | 1.73 | | | | (0.50 | ) |
| | | | |
Distributions from net investment income5 | | | (0.13 | ) | | | — | | | | (0.08 | ) | | | (0.00 | )6 | | | — | |
| | | | |
Net asset value, end of period | | $ | 14.42 | | | $ | 13.94 | | | $ | 13.28 | | | $ | 10.99 | | | $ | 9.26 | |
| | | | |
| | | | | | | | | | | | | | | | | | | | |
| Total Return7 | | | | | | | | | | | | | | | | | | | | |
Based on net asset value | | | 4.47 | %8 | | | 4.97 | % | | | 21.71 | % | | | 18.72 | % | | | (4.83 | )%8,9 |
| | | | |
| | | | | | | | | | | | | | | | | | | | |
| Ratios to Average Net Assets | | | | | | | | | | | | | | | | | | | | |
Total expenses | | | 1.83 | %10 | | | 1.81 | %11 | | | 1.81 | %11 | | | 1.80 | %11 | | | 1.98 | %10,11 |
| | | | |
Total expenses after fees waived and/or reimbursed and paid indirectly | | | 1.72 | %10 | | | 1.72 | % | | | 1.72 | % | | | 1.65 | % | | | 1.72 | %10 |
| | | | |
Net investment income (loss) | | | (0.41 | )%10 | | | 0.17 | % | | | 0.18 | % | | | 0.74 | % | | | 0.23 | %10 |
| | | | |
| | | | | | | | | | | | | | | | | | | | |
| Supplemental Data | | | | | | | | | | | | | | | | | | | | |
Net assets, end of period (000) | | $ | 10,250 | | | $ | 12,483 | | | $ | 14,371 | | | $ | 14,704 | | | $ | 14,891 | |
| | | | |
Portfolio turnover rate | | | 31 | % | | | 99 | % | | | 149 | % | | | 122 | % | | | 137 | % |
| | | | |
| | 1 | | Commencement of operations. |
| | 2 | | Based on average shares outstanding. |
| | 3 | | Amount is less than $0.005 per share. |
| | 4 | | Includes redemption fees, which are less than $0.005 per share. |
| | 5 | | Distributions for annual periods determined in accordance with federal income tax regulations. |
| | 6 | | Amount is greater than $(0.005) per share. |
| | 7 | | Where applicable, assumes the reinvestment of distributions. |
| | 8 | | Aggregate total return. |
| | 9 | | Redemption fee of 2.00% is reflected in total return calculations. There was no impact to the return. |
| | 11 | | Includes recoupment of past waived and/or reimbursed fees. Excluding the recoupment of past waived and/or reimbursed fees for the years ended September 30, 2013 and September 30, 2012, the ratio would have been 1.80% and 1.79%, respectively. There was no financial impact to the expense ratios for the year ended September 30, 2014 and the period ended September 30, 2011. |
See Notes to Financial Statements.
| | | | | | |
| 54 | | BLACKROCK FUNDS | | MARCH 31, 2015 | | |
| | | | |
| Financial Highlights | | | BlackRock Health Sciences Opportunities Portfolio | |
| | | | | | | | | | | | | | | | | | | | | | | | |
| | | Institutional | |
| | | Six Months
Ended
March 31,
2015
(Unaudited) | | | Year Ended September 30, | |
| | | | 2014 | | | 2013 | | | 2012 | | | 2011 | | | 2010 | |
| Per Share Operating Performance | | | | | | | | | | | | | | | | | | | | | | | | |
Net asset value, beginning of period | | $ | 50.07 | | | $ | 43.24 | | | $ | 34.62 | | | $ | 28.77 | | | $ | 28.92 | | | $ | 26.29 | |
| | | | |
Net investment income1 | | | 0.05 | | | | 0.09 | | | | 0.20 | | | | 0.15 | | | | 0.02 | | | | 0.06 | |
Net realized and unrealized gain | | | 9.86 | | | | 10.94 | | | | 10.82 | | | | 7.26 | | | | 1.23 | 2 | | | 2.57 | 2 |
| | | | |
Net increase from investment operations | | | 9.91 | | | | 11.03 | | | | 11.02 | | | | 7.41 | | | | 1.25 | | | | 2.63 | |
| | | | |
Distributions from:3 | | | | | | | | | | | | | | | | | | | | | | | | |
Net investment income | | | (0.15 | ) | | | (0.15 | ) | | | (0.18 | ) | | | — | | | | (0.05 | ) | | | — | |
Net realized gain | | | (3.42 | ) | | | (4.05 | ) | | | (2.22 | ) | | | (1.56 | ) | | | (1.35 | ) | | | — | |
| | | | |
Total distributions | | | (3.57 | ) | | | (4.20 | ) | | | (2.40 | ) | | | (1.56 | ) | | | (1.40 | ) | | | — | |
| | | | |
Net asset value, end of period | | $ | 56.41 | | | $ | 50.07 | | | $ | 43.24 | | | $ | 34.62 | | | $ | 28.77 | | | $ | 28.92 | |
| | | | |
| | | | | | | | | | | | | | | | | | | | | | | | |
| Total Return4 | | | | | | | | | | | | | | | | | | | | | | | | |
Based on net asset value | | | 20.58 | %5 | | | 27.74 | % | | | 34.07 | % | | | 27.06 | % | | | 4.41 | %6 | | | 10.00 | %6,7 |
| | | | |
| | | | | | | | | | | | | | | | | | | | | | | | |
| Ratios to Average Net Assets | | | | | | | | | | | | | | | | | | | | | | | | |
Total expenses | | | 0.86 | %8 | | | 0.91 | % | | | 0.94 | % | | | 0.98 | % | | | 1.00 | % | | | 1.00 | % |
| | | | |
Total expenses after fees waived and/or reimbursed and paid indirectly | | | 0.86 | %8 | | | 0.91 | % | | | 0.94 | % | | | 0.98 | % | | | 1.00 | % | | | 1.00 | % |
| | | | |
Net investment income | | | 0.19 | %8 | | | 0.20 | % | | | 0.54 | % | | | 0.47 | % | | | 0.07 | % | | | 0.21 | % |
| | | | |
| | | | | | | | | | | | | | | | | | | | | | | | |
| Supplemental Data | | | | | | | | | | | | | | | | | | | | | | | | |
Net assets, end of period (000) | | $ | 1,518,558 | | | $ | 1,141,938 | | | $ | 748,148 | | | $ | 473,193 | | | $ | 362,292 | | | $ | 232,697 | |
| | | | |
Portfolio turnover rate | | | 28 | % | | | 57 | % | | | 94 | % | | | 135 | % | | | 135 | % | | | 184 | % |
| | | | |
| | 1 | | Based on average shares outstanding. |
| | 2 | | Includes redemption fees, which are less than $0.005 per share. |
| | 3 | | Distributions for annual periods determined in accordance with federal income tax regulations. |
| | 4 | | Where applicable, assumes the reinvestment of distributions. |
| | 5 | | Aggregate total return. |
| | 6 | | Redemption fee of 2.00% is reflected in total return calculations. There was no impact to the return. |
| | 7 | | Includes proceeds received from a settlement of litigation, which had no impact on the Fund’s total return. |
See Notes to Financial Statements.
| | | | | | |
| | | BLACKROCK FUNDS | | MARCH 31, 2015 | | 55 |
| | | | |
| Financial Highlights (continued) | | | BlackRock Health Sciences Opportunities Portfolio | |
| | | | | | | | | | | | | | | | | | | | | | | | |
| | | Service | |
| | | Six Months Ended March 31,
2015 (Unaudited) | | | Year Ended September 30, | |
| | | | 2014 | | | 2013 | | | 2012 | | | 2011 | | | 2010 | |
| Per Share Operating Performance | | | | | | | | | | | | | | | | | | | | | | | | |
Net asset value, beginning of period | | $ | 48.51 | | | $ | 42.02 | | | $ | 33.72 | | | $ | 28.05 | | | $ | 28.22 | | | $ | 25.74 | |
| | | | |
Net investment income (loss)1 | | | (0.03 | ) | | | (0.04 | ) | | | 0.09 | | | | 0.05 | | | | (0.07 | ) | | | (0.03 | ) |
Net realized and unrealized gain | | | 9.56 | | | | 10.61 | | | | 10.53 | | | | 7.10 | | | | 1.19 | 2 | | | 2.51 | 2 |
| | | | |
Net increase from investment operations | | | 9.53 | | | | 10.57 | | | | 10.62 | | | | 7.15 | | | | 1.12 | | | | 2.48 | |
| | | | |
Distributions from:3 | | | | | | | | | | | | | | | | | | | | | | | | |
Net investment income | | | (0.01 | ) | | | (0.03 | ) | | | (0.10 | ) | | | — | | | | — | | | | — | |
Net realized gain | | | (3.42 | ) | | | (4.05 | ) | | | (2.22 | ) | | | (1.48 | ) | | | (1.29 | ) | | | — | |
| | | | |
Total distributions | | | (3.43 | ) | | | (4.08 | ) | | | (2.32 | ) | | | (1.48 | ) | | | (1.29 | ) | | | — | |
| | | | |
Net asset value, end of period | | $ | 54.61 | | | $ | 48.51 | | | $ | 42.02 | | | $ | 33.72 | | | $ | 28.05 | | | $ | 28.22 | |
| | | | |
| | | | | | | | | | | | | | | | | | | | | | | | |
| Total Return4 | | | | | | | | | | | | | | | | | | | | | | | | |
Based on net asset value | | | 20.42 | %5 | | | 27.36 | % | | | 33.68 | % | | | 26.73 | % | | | 4.04 | %6 | | | 9.64 | %6,7 |
| | | | |
| | | | | | | | | | | | | | | | | | | | | | | | |
| Ratios to Average Net Assets | | | | | | | | | | | | | | | | | | | | | | | | |
Total expenses | | | 1.15 | %8 | | | 1.21 | % | | | 1.23 | % | | | 1.28 | % | | | 1.32 | %9 | | | 1.33 | % |
| | | | |
Total expenses after fees waived and/or reimbursed and paid indirectly | | | 1.15 | %8 | | | 1.20 | % | | | 1.23 | % | | | 1.28 | % | | | 1.31 | % | | | 1.32 | % |
| | | | |
Net investment income (loss) | | | (0.10 | )%8 | | | (0.08 | )% | | | 0.25 | % | | | 0.18 | % | | | (0.24 | )% | | | (0.12 | )% |
| | | | |
| | | | | | | | | | | | | | | | | | | | | | | | |
| Supplemental Data | | | | | | | | | | | | | | | | | | | | | | | | |
Net assets, end of period (000) | | $ | 35,983 | | | $ | 30,139 | | | $ | 23,035 | | | $ | 14,921 | | | $ | 13,478 | | | $ | 11,704 | |
| | | | |
Portfolio turnover rate | | | 28 | % | | | 57 | % | | | 94 | % | | | 135 | % | | | 135 | % | | | 184 | % |
| | | | |
| | 1 | | Based on average shares outstanding. |
| | 2 | | Includes redemption fees, which are less than $0.005 per share. |
| | 3 | | Distributions for annual periods determined in accordance with federal income tax regulations. |
| | 4 | | Where applicable, assumes the reinvestment of distributions. |
| | 5 | | Aggregate total return. |
| | 6 | | Redemption fee of 2.00% is reflected in total return calculations. There was no impact to the return. |
| | 7 | | Includes proceeds received from a settlement of litigation, which had no impact on the Fund’s total return. |
| | 9 | | Includes recoupment of past waived and/or reimbursed fees. Excluding the recoupment of past waived and/or reimbursed fees for the year ended September 30, 2011 the ratio would have been 1.31%. |
See Notes to Financial Statements.
| | | | | | |
| 56 | | BLACKROCK FUNDS | | MARCH 31, 2015 | | |
| | | | |
| Financial Highlights (continued) | | | BlackRock Health Sciences Opportunities Portfolio | |
| | | | | | | | | | | | | | | | | | | | | | | | |
| | | Investor A | |
| | | Six Months
Ended
March 31,
2015 (Unaudited) | | | Year Ended September 30, | |
| | | | 2014 | | | 2013 | | | 2012 | | | 2011 | | | 2010 | |
| Per Share Operating Performance | | | | | | | | | | | | | | | | | | | | | | | | |
Net asset value, beginning of period | | $ | 48.38 | | | $ | 41.92 | | | $ | 33.64 | | | $ | 28.00 | | | $ | 28.18 | | | $ | 25.69 | |
| | | | |
Net investment income (loss)1 | | | (0.02 | ) | | | (0.03 | ) | | | 0.09 | | | | 0.05 | | | | (0.07 | ) | | | (0.03 | ) |
Net realized and unrealized gain | | | 9.53 | | | | 10.57 | | | | 10.51 | | | | 7.07 | | | | 1.19 | 2 | | | 2.52 | 2 |
| | | | |
Net increase from investment operations | | | 9.51 | | | | 10.54 | | | | 10.60 | | | | 7.12 | | | | 1.12 | | | | 2.49 | |
| | | | |
Distributions from:3 | | | | | | | | | | | | | | | | | | | | | | | | |
Net investment income | | | (0.02 | ) | | | (0.03 | ) | | | (0.10 | ) | | | — | | | | — | | | | — | |
Net realized gain | | | (3.42 | ) | | | (4.05 | ) | | | (2.22 | ) | | | (1.48 | ) | | | (1.30 | ) | | | — | |
| | | | |
Total distributions | | | (3.44 | ) | | | (4.08 | ) | | | (2.32 | ) | | | (1.48 | ) | | | (1.30 | ) | | | — | |
| | | | |
Net asset value, end of period | | $ | 54.45 | | | $ | 48.38 | | | $ | 41.92 | | | $ | 33.64 | | | $ | 28.00 | | | $ | 28.18 | |
| | | | |
| | | | | | | | | | | | | | | | | | | | | | | | |
| Total Return4 | | | | | | | | | | | | | | | | | | | | | | | | |
Based on net asset value | | | 20.44 | %5 | | | 27.37 | % | | | 33.73 | % | | | 26.68 | % | | | 4.03 | %6 | | | 9.69 | %6,7 |
| | | | |
| | | | | | | | | | | | | | | | | | | | | | | | |
| Ratios to Average Net Assets | | | | | | | | | | | | | | | | | | | | | | | | |
Total expenses | | | 1.14 | %8 | | | 1.19 | % | | | 1.22 | % | | | 1.29 | % | | | 1.31 | % | | | 1.31 | % |
| | | | |
Total expenses after fees waived and/or reimbursed and paid indirectly | | | 1.14 | %8 | | | 1.19 | % | | | 1.21 | % | | | 1.28 | % | | | 1.31 | % | | | 1.31 | % |
| | | | |
Net investment income (loss) | | | (0.09 | )%8 | | | (0.07 | )% | | | 0.26 | % | | | 0.17 | % | | | (0.24 | )% | | | (0.11 | )% |
| | | | |
| | | | | | | | | | | | | | | | | | | | | | | | |
| Supplemental Data | | | | | | | | | | | | | | | | | | | | | | | | |
Net assets, end of period (000) | | $ | 2,799,471 | | | $ | 2,051,816 | | | $ | 1,641,026 | | | $ | 1,018,429 | | | $ | 825,046 | | | $ | 682,857 | |
| | | | |
Portfolio turnover rate | | | 28 | % | | | 57 | % | | | 94 | % | | | 135 | % | | | 135 | % | | | 184 | % |
| | | | |
| | 1 | | Based on average shares outstanding. |
| | 2 | | Includes redemption fees, which are less than $0.005 per share. |
| | 3 | | Distributions for annual periods determined in accordance with federal income tax regulations. |
| | 4 | | Where applicable, excludes the effects of any sales charges and assumes the reinvestment of distributions. |
| | 5 | | Aggregate total return. |
| | 6 | | Redemption fee of 2.00% is reflected in total return calculations. There was no impact to the return. |
| | 7 | | Includes proceeds received from a settlement of litigation, which had no impact on the Fund’s total return. |
See Notes to Financial Statements.
| | | | | | |
| | | BLACKROCK FUNDS | | MARCH 31, 2015 | | 57 |
| | | | |
| Financial Highlights (continued) | | | BlackRock Health Sciences Opportunities Portfolio | |
| | | | | | | | | | | | | | | | | | | | | | | | |
| | | Investor B | |
| | | Six Months
Ended
March 31,
2015 (Unaudited) | | | Year Ended September 30, | |
| | | | 2014 | | | 2013 | | | 2012 | | | 2011 | | | 2010 | |
| Per Share Operating Performance | | | | | | | | | | | | | | | | | | | | | | | | |
Net asset value, beginning of period | | $ | 44.84 | | | $ | 38.99 | | | $ | 31.46 | | | $ | 26.26 | | | $ | 26.39 | | | $ | 24.25 | |
| | | | |
Net investment loss1 | | | (0.23 | ) | | | (0.34 | ) | | | (0.17 | ) | | | (0.17 | ) | | | (0.28 | ) | | | (0.23 | ) |
Net realized and unrealized gain | | | 8.86 | | | | 9.83 | | | | 9.79 | | | | 6.63 | | | | 1.14 | 2 | | | 2.37 | 2 |
| | | | |
Net increase from investment operations | | | 8.63 | | | | 9.49 | | | | 9.62 | | | | 6.46 | | | | 0.86 | | | | 2.14 | |
| | | | |
Distributions from:3 | | | | | | | | | | | | | | | | | | | | | | | | |
Net investment income | | | — | | | | — | | | | — | | | | — | | | | — | | | | — | |
Net realized gain | | | (2.91 | ) | | | (3.64 | ) | | | (2.09 | ) | | | (1.26 | ) | | | (0.99 | ) | | | — | |
| | | | |
Total distributions | | | (2.91 | ) | | | (3.64 | ) | | | (2.09 | ) | | | (1.26 | ) | | | (0.99 | ) | | | — | |
| | | | |
Net asset value, end of period | | $ | 50.56 | | | $ | 44.84 | | | $ | 38.99 | | | $ | 31.46 | | | $ | 26.26 | | | $ | 26.39 | |
| | | | |
| | | | | | | | | | | | | | | | | | | | | | | | |
| Total Return4 | | | | | | | | | | | | | | | | | | | | | | | | |
Based on net asset value | | | 19.93 | %5 | | | 26.40 | % | | | 32.63 | % | | | 25.70 | % | | | 3.27 | %6 | | | 8.82 | %6,7 |
| | | | |
| | | | | | | | | | | | | | | | | | | | | | | | |
| Ratios to Average Net Assets | | | | | | | | | | | | | | | | | | | | | | | | |
Total expenses | | | 1.98 | %8 | | | 1.98 | % | | | 2.02 | % | | | 2.07 | % | | | 2.06 | % | | | 2.10 | % |
| | | | |
Total expenses after fees waived and/or reimbursed and paid indirectly | | | 1.98 | %8 | | | 1.98 | % | | | 2.02 | % | | | 2.07 | % | | | 2.06 | % | | | 2.09 | % |
| | | | |
Net investment loss | | | (0.95 | )%8 | | | (0.85 | )% | | | (0.51 | )% | | | (0.59 | )% | | | (0.99 | )% | | | (0.88 | )% |
| | | | |
| | | | | | | | | | | | | | | | | | | | | | | | |
| Supplemental Data | | | | | | | | | | | | | | | | | | | | | | | | |
Net assets, end of period (000) | | $ | 19,826 | | | $ | 23,321 | | | $ | 39,048 | | | $ | 40,452 | | | $ | 46,180 | | | $ | 47,855 | |
| | | | |
Portfolio turnover rate | | | 28 | % | | | 57 | % | | | 94 | % | | | 135 | % | | | 135 | % | | | 184 | % |
| | | | |
| | 1 | | Based on average shares outstanding. |
| | 2 | | Includes redemption fees, which are less than $0.005 per share. |
| | 3 | | Distributions for annual periods determined in accordance with federal income tax regulations. |
| | 4 | | Where applicable, excludes the effects of any sales charges and assumes the reinvestment of distributions. |
| | 5 | | Aggregate total return. |
| | 6 | | Redemption fee of 2.00% is reflected in total return calculations. There was no impact to the return. |
| | 7 | | Includes proceeds received from a settlement of litigation, which had no impact on the Fund’s total return. |
See Notes to Financial Statements.
| | | | | | |
| 58 | | BLACKROCK FUNDS | | MARCH 31, 2015 | | |
| | | | |
| Financial Highlights (continued) | | | BlackRock Health Sciences Opportunities Portfolio | |
| | | | | | | | | | | | | | | | | | | | | | | | |
| | | Investor C | |
| | | Six Months
Ended
March 31,
2015 (Unaudited) | | | Year Ended September 30, | |
| | | | 2014 | | | 2013 | | | 2012 | | | 2011 | | | 2010 | |
| Per Share Operating Performance | | | | | | | | | | | | | | | | | | | | | | | | |
Net asset value, beginning of period | | $ | 44.36 | | | $ | 38.77 | | | $ | 31.34 | | | $ | 26.18 | | | $ | 26.37 | | | $ | 24.22 | |
| | | | |
Net investment loss1 | | | (0.19 | ) | | | (0.32 | ) | | | (0.16 | ) | | | (0.16 | ) | | | (0.27 | ) | | | (0.21 | ) |
Net realized and unrealized gain | | | 8.72 | | | | 9.74 | | | | 9.74 | | | | 6.62 | | | | 1.14 | 2 | | | 2.36 | 2 |
| | | | |
Net increase from investment operations | | | 8.53 | | | | 9.42 | | | | 9.58 | | | | 6.46 | | | | 0.87 | | | | 2.15 | |
| | | | |
Distributions from:3 | | | | | | | | | | | | | | | | | | | | | | | | |
Net investment income | | | — | | | | — | | | | (0.00 | )4 | | | — | | | | — | | | | — | |
Net realized gain | | | (3.17 | ) | | | (3.83 | ) | | | (2.15 | ) | | | (1.30 | ) | | | (1.06 | ) | | | — | |
| | | | |
Total distributions | | | (3.17 | ) | | | (3.83 | ) | | | (2.15 | ) | | | (1.30 | ) | | | (1.06 | ) | | | — | |
| | | | |
Net asset value, end of period | | $ | 49.72 | | | $ | 44.36 | | | $ | 38.77 | | | $ | 31.34 | | | $ | 26.18 | | | $ | 26.37 | |
| | | | |
| | | | | | | | | | | | | | | | | | | | | | | | |
| Total Return5 | | | | | | | | | | | | | | | | | | | | | | | | |
Based on net asset value | | | 20.00 | %6 | | | 26.46 | % | | | 32.71 | % | | | 25.80 | % | | | 3.32 | %7 | | | 8.88 | %7,8 |
| | | | |
| | | | | | | | | | | | | | | | | | | | | | | | |
| Ratios to Average Net Assets | | | | | | | | | | | | | | | | | | | | | | | | |
Total expenses | | | 1.87 | %9 | | | 1.91 | % | | | 1.95 | % | | | 2.01 | % | | | 2.02 | % | | | 2.04 | % |
| | | | |
Total expenses after fees waived and/or reimbursed and paid indirectly | | | 1.86 | %9 | | | 1.91 | % | | | 1.95 | % | | | 2.01 | % | | | 2.02 | % | | | 2.04 | % |
| | | | |
Net investment loss | | | (0.81 | )%9 | | | (0.80 | )% | | | (0.48 | )% | | | (0.55 | )% | | | (0.95 | )% | | | (0.83 | )% |
| | | | |
| | | | | | | | | | | | | | | | | | | | | | | | |
| Supplemental Data | | | | | | | | | | | | | | | | | | | | | | | | |
Net assets, end of period (000) | | $ | 1,124,316 | | | $ | 822,928 | | | $ | 596,123 | | | $ | 384,910 | | | $ | 327,855 | | | $ | 285,428 | |
| | | | |
Portfolio turnover rate | | | 28 | % | | | 57 | % | | | 94 | % | | | 135 | % | | | 135 | % | | | 184 | % |
| | | | |
| | 1 | | Based on average shares outstanding. |
| | 2 | | Includes redemption fees, which are less than $0.005 per share. |
| | 3 | | Distributions for annual periods determined in accordance with federal income tax regulations. |
| | 4 | | Amount is greater than $(0.005) per share. |
| | 5 | | Where applicable, excludes the effects of any sales charges and assumes the reinvestment of distributions. |
| | 6 | | Aggregate total return. |
| | 7 | | Redemption fee of 2.00% is reflected in total return calculations. There was no impact to the return. |
| | 8 | | Includes proceeds received from a settlement of litigation, which had no impact on the Fund’s total return. |
See Notes to Financial Statements.
| | | | | | |
| | | BLACKROCK FUNDS | | MARCH 31, 2015 | | 59 |
| | | | |
| Financial Highlights (concluded) | | | BlackRock Health Sciences Opportunities Portfolio | |
| | | | | | | | | | | | | | | | | | | | |
| | | Class R | |
| | | Six Months
Ended
March 31,
2015 (Unaudited) | | | Year Ended September 30, | | | Period
September 12,
20111 to
September 30,
2011 | |
| | | | 2014 | | | 2013 | | | 2012 | | |
| Per Share Operating Performance | | | | | | | | | | | | | | | | | | | | |
Net asset value, beginning of period | | $ | 47.94 | | | $ | 41.62 | | | $ | 33.46 | | | $ | 28.00 | | | $ | 28.19 | |
| | | | |
Net investment loss2 | | | (0.09 | ) | | | (0.17 | ) | | | (0.03 | ) | | | (0.07 | ) | | | (0.01 | ) |
Net realized and unrealized gain (loss) | | | 9.43 | | | | 10.52 | | | | 10.43 | | | | 7.05 | | | | (0.18 | )3 |
| | | | |
Net increase (decrease) from investment operations | | | 9.34 | | | | 10.35 | | | | 10.40 | | | | 6.98 | | | | (0.19 | ) |
| | | | |
Distributions from:4 | | | | | | | | | | | | | | | | | | | | |
Net investment income | | | — | | | | — | | | | (0.02 | ) | | | — | | | | — | |
Net realized gain | | | (3.36 | ) | | | (4.03 | ) | | | (2.22 | ) | | | (1.52 | ) | | | — | |
| | | | |
Total distributions | | | (3.36 | ) | | | (4.03 | ) | | | (2.24 | ) | | | (1.52 | ) | | | — | |
| | | | |
Net asset value, end of period | | $ | 53.92 | | | $ | 47.94 | | | $ | 41.62 | | | $ | 33.46 | | | $ | 28.00 | |
| | | | |
| | | | | | | | | | | | | | | | | | | | |
| Total Return5 | | | | | | | | | | | | | | | | | | | | |
Based on net asset value | | | 20.25 | %6 | | | 27.05 | % | | | 33.21 | % | | | 26.17 | % | | | (0.64 | )%6,7 |
| | | | |
| | | | | | | | | | | | | | | | | | | | |
| Ratios to Average Net Assets | | | | | | | | | | | | | | | | | | | | |
Total expenses | | | 1.43 | %8 | | | 1.49 | % | | | 1.55 | %9 | | | 1.70 | % | | | 1.75 | %8 |
| | | | |
Total expenses after fees waived and/or reimbursed and paid indirectly | | | 1.43 | %8 | | | 1.49 | % | | | 1.55 | % | | | 1.68 | % | | | 1.75 | %8 |
| | | | |
Net investment loss | | | (0.36 | )%8 | | | (0.38 | )% | | | (0.09 | )% | | | (0.24 | )% | | | (0.82 | )%8 |
| | | | |
| | | | | | | | | | | | | | | | | | | | |
| Supplemental Data | | | | | | | | | | | | | | | | | | | | |
Net assets, end of period (000) | | $ | 119,772 | | | $ | 74,611 | | | $ | 31,319 | | | $ | 14,613 | | | $ | 9,580 | |
| | | | |
Portfolio turnover rate | | | 28 | % | | | 57 | % | | | 94 | % | | | 135 | % | | | 135 | % |
| | | | |
| | 1 | | Commencement of operations. |
| | 2 | | Based on average shares outstanding. |
| | 3 | | Includes redemption fees, which are less than $0.005 per share. |
| | 4 | | Distributions for annual periods determined in accordance with federal income tax regulations. |
| | 5 | | Where applicable, assumes the reinvestment of distributions. |
| | 6 | | Aggregate total return. |
| | 7 | | Redemption fee of 2.00% is reflected in total return calculations. There was no impact to the return. |
| | 9 | | Includes recoupment of past waived and/or reimbursed fees. Excluding the recoupment of past waived and/or reimbursed fees for the year ended September 30, 2013 the ratio would have been 1.54%. |
See Notes to Financial Statements.
| | | | | | |
| 60 | | BLACKROCK FUNDS | | MARCH 31, 2015 | | |
| | | | |
| Financial Highlights | | | BlackRock International Opportunities Portfolio | |
| | | | | | | | | | | | | | | | | | | | | | | | |
| | | Institutional | |
| | | Six Months
Ended
March 31,
2015
(Unaudited) | | | Year Ended September 30, | |
| | | | 2014 | | | 2013 | | | 2012 | | | 2011 | | | 2010 | |
| Per Share Operating Performance | | | | | | | | | | | | | | | | | | | | | | | | |
Net asset value, beginning of period | | $ | 38.51 | | | $ | 38.58 | | | $ | 32.82 | | | $ | 28.37 | | | $ | 32.76 | | | $ | 31.36 | |
| | | | |
Net investment income1 | | | 0.07 | | | | 0.48 | | | | 0.48 | | | | 0.56 | | | | 0.49 | | | | 0.28 | |
Net realized and unrealized gain (loss) | | | 0.21 | | | | (0.38 | ) | | | 5.84 | | | | 4.49 | | | | (4.52 | )2 | | | 1.58 | 2 |
| | | | |
Net increase (decrease) from investment operations | | | 0.28 | | | | 0.10 | | | | 6.32 | | | | 5.05 | | | | (4.03 | ) | | | 1.86 | |
| | | | |
Distributions from:3 | | | | | | | | | | | | | | | | | | | | | | | | |
Net investment income | | | (0.92 | ) | | | (0.07 | ) | | | (0.56 | ) | | | (0.60 | ) | | | (0.36 | ) | | | (0.46 | ) |
Net realized gain | | | (3.71 | ) | | | (0.10 | ) | | | — | | | | — | | | | — | | | | — | |
| | | | |
Total distributions | | | (4.63 | ) | | | (0.17 | ) | | | (0.56 | ) | | | (0.60 | ) | | | (0.36 | ) | | | (0.46 | ) |
| | | | |
Net asset value, end of period | | $ | 34.16 | | | $ | 38.51 | | | $ | 38.58 | | | $ | 32.82 | | | $ | 28.37 | | | $ | 32.76 | |
| | | | |
| | | | | | | | | | | | | | | | | | | | | | | | |
| Total Return4 | | | | | | | | | | | | | | | | | | | | | | | | |
Based on net asset value | | | 1.50 | %5 | | | 0.25 | % | | | 19.50 | % | | | 18.08 | % | | | (12.50 | )%6 | | | 5.99 | %6 |
| | | | |
| | | | | | | | | | | | | | | | | | | | | | | | |
| Ratios to Average Net Assets | | | | | | | | | | | | | | | | | | | | | | | | |
Total expenses | | | 1.29 | %7 | | | 1.22 | % | | | 1.23 | % | | | 1.29 | % | | | 1.26 | % | | | 1.35 | %8 |
| | | | |
Total expenses after fees waived and/or reimbursed and paid indirectly | | | 1.19 | %7 | | | 1.19 | % | | | 1.23 | % | | | 1.29 | % | | | 1.26 | % | | | 1.35 | % |
| | | | |
Net investment income | | | 0.39 | %7 | | | 1.19 | % | | | 1.34 | % | | | 1.83 | % | | | 1.41 | % | | | 0.91 | % |
| | | | |
| | | | | | | | | | | | | | | | | | | | | | | | |
| Supplemental Data | | | | | | | | | | | | | | | | | | | | | | | | |
Net assets, end of period (000) | | $ | 507,227 | | | $ | 730,062 | | | $ | 775,659 | | | $ | 798,205 | | | $ | 792,695 | | | $ | 802,167 | |
| | | | |
Portfolio turnover rate | | | 33 | % | | | 138 | % | | | 157 | % | | | 99 | % | | | 116 | % | | | 116 | % |
| | | | |
| | 1 | | Based on average shares outstanding. |
| | 2 | | Includes redemption fees, which are less than $0.005 per share. |
| | 3 | | Distributions for annual periods determined in accordance with federal income tax regulations. |
| | 4 | | Where applicable, assumes the reinvestment of distributions. |
| | 5 | | Aggregate total return. |
| | 6 | | Redemption fee of 2.00% is reflected in total return calculations. There was no impact to the return. |
| | 8 | | Includes recoupment of past waived and/or reimbursed fees. Excluding the recoupment of past waived and/or reimbursed fees for the year ended September 30, 2010 the ratio would have been 1.34% |
See Notes to Financial Statements.
| | | | | | |
| | | BLACKROCK FUNDS | | MARCH 31, 2015 | | 61 |
| | | | |
| Financial Highlights (continued) | | | BlackRock International Opportunities Portfolio | |
| | | | | | | | | | | | | | | | | | | | | | | | |
| | | Service | |
| | | Six Months Ended March 31, 2015 (Unaudited) | | | Year Ended September 30, | |
| | | | 2014 | | | 2013 | | | 2012 | | | 2011 | | | 2010 | |
| Per Share Operating Performance | | | | | | | | | | | | | | | | | | | | | | | | |
Net asset value, beginning of period | | $ | 37.01 | | | $ | 37.16 | | | $ | 31.62 | | | $ | 27.34 | | | $ | 31.58 | | | $ | 30.26 | |
| | | | |
Net investment income1 | | | 0.03 | | | | 0.34 | | | | 0.26 | | | | 0.39 | | | | 0.34 | | | | 0.16 | |
Net realized and unrealized gain (loss) | | | 0.19 | | | | (0.34 | ) | | | 5.67 | | | | 4.33 | | | | (4.37 | )2 | | | 1.53 | 2 |
| | | | |
Net increase (decrease) from investment operations | | | 0.22 | | | | 0.00 | | | | 5.93 | | | | 4.72 | | | | (4.03 | ) | | | 1.69 | |
| | | | |
Distributions from:3 | | | | | | | | | | | | | | | | | | | | | | | | |
Net investment income | | | (0.82 | ) | | | (0.05 | ) | | | (0.39 | ) | | | (0.44 | ) | | | (0.21 | ) | | | (0.37 | ) |
Net realized gain | | | (3.71 | ) | | | (0.10 | ) | | | — | | | | — | | | | — | | | | — | |
| | | | |
Total distributions | | | (4.53 | ) | | | (0.15 | ) | | | (0.39 | ) | | | (0.44 | ) | | | (0.21 | ) | | | (0.37 | ) |
| | | | |
Net asset value, end of period | | $ | 32.70 | | | $ | 37.01 | | | $ | 37.16 | | | $ | 31.62 | | | $ | 27.34 | | | $ | 31.58 | |
| | | | |
| | | | | | | | | | | | | | | | | | | | | | | | |
| Total Return4 | | | | | | | | | | | | | | | | | | | | | | | | |
Based on net asset value | | | 1.38 | %5 | | | (0.03 | )% | | | 18.93 | % | | | 17.48 | % | | | (12.88 | )%6 | | | 5.63 | %6 |
| | | | |
| | | | | | | | | | | | | | | | | | | | | | | | |
| Ratios to Average Net Assets | | | | | | | | | | | | | | | | | | | | | | | | |
Total expenses | | | 1.56 | %7,8 | | | 1.51 | %7 | | | 1.71 | %7 | | | 1.90 | %7 | | | 1.66 | %7 | | | 1.72 | %7 |
| | | | |
Total expenses after fees waived and/or reimbursed and paid indirectly | | | 1.46 | %8 | | | 1.48 | % | | | 1.71 | % | | | 1.80 | % | | | 1.65 | % | | | 1.72 | % |
| | | | |
Net investment income | | | 0.17 | %8 | | | 0.87 | % | | | 0.76 | % | | | 1.31 | % | | | 1.02 | % | | | 0.53 | % |
| | | | |
| | | | | | | | | | | | | | | | | | | | | | | | |
| Supplemental Data | | | | | | | | | | | | | | | | | | | | | | | | |
Net assets, end of period (000) | | $ | 25,368 | | | $ | 30,049 | | | $ | 40,885 | | | $ | 47,598 | | | $ | 47,846 | | | $ | 70,365 | |
| | | | |
Portfolio turnover rate | | | 33 | % | | | 138 | % | | | 157 | % | | | 99 | % | | | 116 | % | | | 116 | % |
| | | | |
| | 1 | | Based on average shares outstanding. |
| | 2 | | Includes redemption fees, which are less than $0.005 per share. |
| | 3 | | Distributions for annual periods determined in accordance with federal income tax regulations. |
| | 4 | | Where applicable, assumes the reinvestment of distributions. |
| | 5 | | Aggregate total return. |
| | 6 | | Redemption fee of 2.00% is reflected in total return calculations. There was no impact to the return. |
| | 7 | | Includes recoupment of past waived and/or reimbursed fees. Excluding the recoupment of past waived and/or reimbursed fees for the years ended September 30, 2013 and September 30, 2010, the ratio would have been 1.60% and 1.69%, respectively. There was no financial impact to the expense ratios for the six months ended March 31, 2015, and the years ended September 30, 2014, September 30, 2012 and September 30, 2011. |
See Notes to Financial Statements.
| | | | | | |
| 62 | | BLACKROCK FUNDS | | MARCH 31, 2015 | | |
| | | | |
| Financial Highlights (continued) | | | BlackRock International Opportunities Portfolio | |
| | | | | | | | | | | | | | | | | | | | | | | | |
| | | Investor A | |
| | | Six Months
Ended
March 31,
2015 (Unaudited) | | | Year Ended September 30, | |
| | | | 2014 | | | 2013 | | | 2012 | | | 2011 | | | 2010 | |
| Per Share Operating Performance | | | | | | | | | | | | | | | | | | | | | | | | |
Net asset value, beginning of period | | $ | 36.64 | | | $ | 36.80 | | | $ | 31.33 | | | $ | 27.10 | | | $ | 31.33 | | | $ | 30.02 | |
| | | | |
Net investment income1 | | | 0.01 | | | | 0.33 | | | | 0.35 | | | | 0.45 | | | | 0.39 | | | | 0.21 | |
Net realized and unrealized gain (loss) | | | 0.20 | | | | (0.34 | ) | | | 5.59 | | | | 4.30 | | | | (4.34 | )2 | | | 1.50 | 2 |
| | | | |
Net increase (decrease) from investment operations | | | 0.21 | | | | (0.01 | ) | | | 5.94 | | | | 4.75 | | | | (3.95 | ) | | | 1.71 | |
| | | | |
Distributions from:3 | | | | | | | | | | | | | | | | | | | | | | | | |
Net investment income | | | (0.82 | ) | | | (0.05 | ) | | | (0.47 | ) | | | (0.52 | ) | | | (0.28 | ) | | | (0.40 | ) |
Net realized gain | | | (3.71 | ) | | | (0.10 | ) | | | — | | | | — | | | | — | | | | — | |
| | | | |
Total distributions | | | (4.53 | ) | | | (0.15 | ) | | | (0.47 | ) | | | (0.52 | ) | | | (0.28 | ) | | | (0.40 | ) |
| | | | |
Net asset value, end of period | | $ | 32.32 | | | $ | 36.64 | | | $ | 36.80 | | | $ | 31.33 | | | $ | 27.10 | | | $ | 31.33 | |
| | | | |
| | | | | | | | | | | | | | | | | | | | | | | | |
| Total Return4 | | | | | | | | | | | | | | | | | | | | | | | | |
Based on net asset value | | | 1.35 | %5 | | | (0.06 | )% | | | 19.16 | % | | | 17.74 | % | | | (12.77 | )%6 | | | 5.73 | %6 |
| | | | |
| | | | | | | | | | | | | | | | | | | | | | | | |
| Ratios to Average Net Assets | | | | | | | | | | | | | | | | | | | | | | | | |
Total expenses | | | 1.61 | %7,8 | | | 1.53 | % | | | 1.52 | % | | | 1.57 | % | | | 1.54 | % | | | 1.59 | % |
| | | | |
Total expenses after fees waived and/or reimbursed and paid indirectly | | | 1.51 | %8 | | | 1.50 | % | | | 1.52 | % | | | 1.57 | % | | | 1.53 | % | | | 1.59 | % |
| | | | |
Net investment income | | | 0.06 | %8 | | | 0.86 | % | | | 1.02 | % | | | 1.52 | % | | | 1.16 | % | | | 0.72 | % |
| | | | |
| | | | | | | | | | | | | | | | | | | | | | | | |
| Supplemental Data | | | | | | | | | | | | | | | | | | | | | | | | |
Net assets, end of period (000) | | $ | 482,336 | | | $ | 662,683 | | | $ | 753,074 | | | $ | 692,445 | | | $ | 703,201 | | | $ | 794,034 | |
| | | | |
Portfolio turnover rate | | | 33 | % | | | 138 | % | | | 157 | % | | | 99 | % | | | 116 | % | | | 116 | % |
| | | | |
| | 1 | | Based on average shares outstanding. |
| | 2 | | Includes redemption fees, which are less than $0.005 per share. |
| | 3 | | Distributions for annual periods determined in accordance with federal income tax regulations. |
| | 4 | | Where applicable, excludes the effects of any sales charges and assumes the reinvestment of distributions. |
| | 5 | | Aggregate total return. |
| | 6 | | Redemption fee of 2.00% is reflected in total return calculations. There was no impact to the return. |
| | 7 | | Includes recoupment of past waived and/or reimbursed fees. There was no financial impact to the expense ratio for the six months ended March 31, 2015. |
See Notes to Financial Statements.
| | | | | | |
| | | BLACKROCK FUNDS | | MARCH 31, 2015 | | 63 |
| | | | |
| Financial Highlights (continued) | | | BlackRock International Opportunities Portfolio | |
| | | | | | | | | | | | | | | | | | | | | | | | |
| | | Investor B | |
| | | Six Months
Ended
March 31,
2015 (Unaudited) | | | Year Ended September 30, | |
| | | | 2014 | | | 2013 | | | 2012 | | | 2011 | | | 2010 | |
| Per Share Operating Performance | | | | | | | | | | | | | | | | | | | | | | | | |
Net asset value, beginning of period | | $ | 33.89 | | | $ | 34.27 | | | $ | 29.15 | | | $ | 25.18 | | | $ | 29.10 | | | $ | 27.83 | |
| | | | |
Net investment income (loss)1 | | | (0.11 | ) | | | (0.04 | ) | | | 0.02 | | | | 0.16 | | | | 0.10 | | | | (0.05 | ) |
Net realized and unrealized gain (loss) | | | 0.16 | | | | (0.24 | ) | | | 5.25 | | | | 4.03 | | | | (4.01 | )2 | | | 1.42 | 2 |
| | | | |
Net increase (decrease) from investment operations | | | 0.05 | | | | (0.28 | ) | | | 5.27 | | | | 4.19 | | | | (3.91 | ) | | | 1.37 | |
| | | | |
Distributions from:3 | | | | | | | | | | | | | | | | | | | | | | | | |
Net investment income | | | (0.55 | ) | | | — | | | | (0.15 | ) | | | (0.22 | ) | | | (0.01 | ) | | | (0.10 | ) |
Net realized gain | | | (3.71 | ) | | | (0.10 | ) | | | — | | | | — | | | | — | | | | — | |
| | | | |
Total distributions | | | (4.26 | ) | | | (0.10 | ) | | | (0.15 | ) | | | (0.22 | ) | | | (0.01 | ) | | | (0.10 | ) |
| | | | |
Net asset value, end of period | | $ | 29.68 | | | $ | 33.89 | | | $ | 34.27 | | | $ | 29.15 | | | $ | 25.18 | | | $ | 29.10 | |
| | | | |
| | | | | | | | | | | | | | | | | | | | | | | | |
| Total Return4 | | | | | | | | | | | | | | | | | | | | | | | | |
Based on net asset value | | | 0.91 | %5 | | | (0.84 | )% | | | 18.15 | % | | | 16.72 | % | | | (13.45 | )%6 | | | 4.92 | %6 |
| | | | |
| | | | | | | | | | | | | | | | | | | | | | | | |
| Ratios to Average Net Assets | | | | | | | | | | | | | | | | | | | | | | | | |
Total expenses | | | 2.57 | %7 | | | 2.39 | % | | | 2.40 | % | | | 2.41 | % | | | 2.32 | % | | | 2.38 | % |
| | | | |
Total expenses after fees waived and/or reimbursed and paid indirectly | | | 2.36 | %7 | | | 2.29 | % | | | 2.40 | % | | | 2.41 | % | | | 2.32 | % | | | 2.38 | % |
| | | | |
Net investment income (loss) | | | (0.75 | )%7 | | | (0.12 | )% | | | 0.06 | % | | | 0.60 | % | | | 0.34 | % | | | (0.18 | )% |
| | | | |
| | | | | | | | | | | | | | | | | | | | | | | | |
| Supplemental Data | | | | | | | | | | | | | | | | | | | | | | | | |
Net assets, end of period (000) | | $ | 2,416 | | | $ | 3,058 | | | $ | 6,507 | | | $ | 10,813 | | | $ | 15,568 | | | $ | 25,080 | |
| | | | |
Portfolio turnover rate | | | 33 | % | | | 138 | % | | | 157 | % | | | 99 | % | | | 116 | % | | | 116 | % |
| | | | |
| | 1 | | Based on average shares outstanding. |
| | 2 | | Includes redemption fees, which are less than $0.005 per share. |
| | 3 | | Distributions for annual periods determined in accordance with federal income tax regulations. |
| | 4 | | Where applicable, excludes the effects of any sales charges and assumes the reinvestment of distributions. |
| | 5 | | Aggregate total return. |
| | 6 | | Redemption fee of 2.00% is reflected in total return calculations. There was no impact to the return. |
See Notes to Financial Statements.
| | | | | | |
| 64 | | BLACKROCK FUNDS | | MARCH 31, 2015 | | |
| | | | |
| Financial Highlights (concluded) | | | BlackRock International Opportunities Portfolio | |
| | | | | | | | | | | | | | | | | | | | | | | | |
| | | Investor C | |
| | | Six Months
Ended
March 31,
2015 (Unaudited) | | | Year Ended September 30, | |
| | | | 2014 | | | 2013 | | | 2012 | | | 2011 | | | 2010 | |
| Per Share Operating Performance | | | | | | | | | | | | | | | | | | | | | | | | |
Net asset value, beginning of period | | $ | 33.56 | | | $ | 33.93 | | | $ | 28.91 | | | $ | 24.98 | | | $ | 28.92 | | | $ | 27.74 | |
| | | | |
Net investment income (loss)1 | | | (0.09 | ) | | | 0.04 | | | | 0.07 | | | | 0.20 | | | | 0.11 | | | | (0.02 | ) |
Net realized and unrealized gain (loss) | | | 0.16 | | | | (0.31 | ) | | | 5.17 | | | | 3.98 | | | | (3.98 | )2 | | | 1.39 | 2 |
| | | | |
Net increase (decrease) from investment operations | | | 0.07 | | | | (0.27 | ) | | | 5.24 | | | | 4.18 | | | | (3.87 | ) | | | 1.37 | |
| | | | |
Distributions from:3 | | | | | | | | | | | | | | | | | | | | | | | | |
Net investment income | | | (0.63 | ) | | | — | | | | (0.22 | ) | | | (0.25 | ) | | | (0.07 | ) | | | (0.19 | ) |
Net realized gain | | | (3.71 | ) | | | (0.10 | ) | | | — | | | | — | | | | — | | | | — | |
| | | | |
Total distributions | | | (4.34 | ) | | | (0.10 | ) | | | (0.22 | ) | | | (0.25 | ) | | | (0.07 | ) | | | (0.19 | ) |
| | | | |
Net asset value, end of period | | $ | 29.29 | | | $ | 33.56 | | | $ | 33.93 | | | $ | 28.91 | | | $ | 24.98 | | | $ | 28.92 | |
| | | | |
| | | | | | | | | | | | | | | | | | | | | | | | |
| Total Return4 | | | | | | | | | | | | | | | | | | | | | | | | |
Based on net asset value | | | 0.99 | %5 | | | (0.82 | )% | | | 18.25 | % | | | 16.83 | % | | | (13.44 | )%6 | | | 4.95 | %6 |
| | | | |
| | | | | | | | | | | | | | | | | | | | | | | | |
| Ratios to Average Net Assets | | | | | | | | | | | | | | | | | | | | | | | | |
Total expenses | | | 2.34 | %7 | | | 2.27 | % | | | 2.30 | % | | | 2.34 | % | | | 2.31 | % | | | 2.36 | % |
| | | | |
Total expenses after fees waived and/or reimbursed and paid indirectly | | | 2.24 | %7 | | | 2.23 | % | | | 2.30 | % | | | 2.34 | % | | | 2.31 | % | | | 2.36 | % |
| | | | |
Net investment income (loss) | | | (0.60 | )%7 | | | 0.11 | % | | | 0.24 | % | | | 0.73 | % | | | 0.37 | % | | | (0.06 | )% |
| | | | |
| | | | | | | | | | | | | | | | | | | | | | | | |
| Supplemental Data | | | | | | | | | | | | | | | | | | | | | | | | |
Net assets, end of period (000) | | $ | 114,611 | | | $ | 134,821 | | | $ | 148,136 | | | $ | 148,910 | | | $ | 169,481 | | | $ | 224,958 | |
| | | | |
Portfolio turnover rate | | | 33 | % | | | 138 | % | | | 157 | % | | | 99 | % | | | 116 | % | | | 116 | % |
| | | | |
| | 1 | | Based on average shares outstanding. |
| | 2 | | Includes redemption fees, which are less than $0.005 per share. |
| | 3 | | Distributions for annual periods determined in accordance with federal income tax regulations. |
| | 4 | | Where applicable, excludes the effects of any sales charges and assumes the reinvestment of distributions. |
| | 5 | | Aggregate total return. |
| | 6 | | Redemption fee of 2.00% is reflected in total return calculations. There was no impact to the return. |
See Notes to Financial Statements.
| | | | | | |
| | | BLACKROCK FUNDS | | MARCH 31, 2015 | | 65 |
| | | | |
| Financial Highlights | | | BlackRock Science & Technology Opportunities Portfolio | |
| | | | | | | | | | | | | | | | | | | | | | | | |
| | | Institutional | |
| | | Six Months
Ended
March 31,
2015 (Unaudited) | | | Year Ended September 30, | |
| | | | 2014 | | | 2013 | | | 2012 | | | 2011 | | | 2010 | |
| Per Share Operating Performance | | | | | | | | | | | | | | | | | | | | | | | | |
Net asset value, beginning of period | | $ | 14.37 | | | $ | 12.27 | | | $ | 10.01 | | | $ | 8.61 | | | $ | 9.02 | | | $ | 7.79 | |
| | | | |
Net investment loss1 | | | (0.05 | ) | | | (0.10 | ) | | | (0.03 | ) | | | (0.06 | ) | | | (0.06 | ) | | | (0.05 | ) |
Net realized and unrealized gain (loss) | | | 1.81 | | | | 2.20 | | | | 2.29 | | | | 1.46 | | | | (0.35 | )2 | | | 1.28 | 2 |
| | | | |
Net increase (decrease) from investment operations | | | 1.76 | | | | 2.10 | | | | 2.26 | | | | 1.40 | | | | (0.41 | ) | | | 1.23 | |
| | | | |
Net asset value, end of period | | $ | 16.13 | | | $ | 14.37 | | | $ | 12.27 | | | $ | 10.01 | | | $ | 8.61 | | | $ | 9.02 | |
| | | | |
| | | | | | | | | | | | | | | | | | | | | | | | |
| Total Return3 | | | | | | | | | | | | | | | | | | | | | | | | |
Based on net asset value | | | 12.25 | %4 | | | 17.11 | % | | | 22.58 | % | | | 16.26 | % | | | (4.55 | )%5 | | | 15.79 | %5,6 |
| | | | |
| | | | | | | | | | | | | | | | | | | | | | | | |
| Ratios to Average Net Assets | | | | | | | | | | | | | | | | | | | | | | | | |
Total expenses | | | 1.31 | %7,8 | | | 1.36 | % | | | 1.50 | %7 | | | 1.45 | %7 | | | 1.46 | %7 | | | 1.55 | %7 |
| | | | |
Total expenses after fees waived and/or reimbursed and paid indirectly | | | 1.29 | %8 | | | 1.29 | % | | | 1.36 | % | | | 1.39 | % | | | 1.39 | % | | | 1.39 | % |
| | | | |
Net investment loss | | | (0.63 | )%8 | | | (0.74 | )% | | | (0.34 | )% | | | (0.63 | )% | | | (0.60 | )% | | | (0.59 | )% |
| | | | |
| | | | | | | | | | | | | | | | | | | | | | | | |
| Supplemental Data | | | | | | | | | | | | | | | | | | | | | | | | |
Net assets, end of period (000) | | $ | 60,261 | | | $ | 53,922 | | | $ | 36,218 | | | $ | 34,022 | | | $ | 33,982 | | | $ | 33,135 | |
| | | | |
Portfolio turnover rate | | | 38 | % | | | 99 | % | | | 86 | % | | | 320 | % | | | 103 | % | | | 97 | % |
| | | | |
| | 1 | | Based on average shares outstanding. |
| | 2 | | Includes redemption fees, which are less than $0.005 per share. |
| | 3 | | Where applicable, assumes the reinvestment of distributions. |
| | 4 | | Aggregate total return. |
| | 5 | | Redemption fee of 2.00% is reflected in total return calculations. There was no impact to the return. |
| | 6 | | Includes proceeds received from a settlement of litigation, which impacted the Fund’s total return. Excluding these proceeds, the Fund’s total return would have been 15.53%. |
| | 7 | | Includes recoupment of past waived and/or reimbursed fees. Excluding the recoupment of past waived and/or reimbursed fees for the years ended September 30, 2013 and September 30, 2012, the ratio would have been 1.49% and 1.44%, respectively. There was no financial impact to the expense ratios for the six months ended March 31, 2015, and the years ended September 30, 2011 and September 30, 2010. |
See Notes to Financial Statements.
| | | | | | |
| 66 | | BLACKROCK FUNDS | | MARCH 31, 2015 | | |
| | | | |
| Financial Highlights (continued) | | | BlackRock Science & Technology Opportunities Portfolio | |
| | | | | | | | | | | | | | | | | | | | | | | | |
| | | Service | |
| | | Six Months
Ended
March 31,
2015 (Unaudited) | | | Year Ended September 30, | |
| | | | 2014 | | | 2013 | | | 2012 | | | 2011 | | | 2010 | |
| Per Share Operating Performance | | | | | | | | | | | | | | | | | | | | | | | | |
Net asset value, beginning of period | | $ | 13.80 | | | $ | 11.81 | | | $ | 9.66 | | | $ | 8.32 | | | $ | 8.72 | | | $ | 7.56 | |
| | | | |
Net investment loss1 | | | (0.06 | ) | | | (0.13 | ) | | | (0.05 | ) | | | (0.08 | ) | | | (0.07 | ) | | | (0.08 | ) |
Net realized and unrealized gain (loss) | | | 1.73 | | | | 2.12 | | | | 2.20 | | | | 1.42 | | | | (0.33 | )2 | | | 1.24 | 2 |
| | | | |
Net increase (decrease) from investment operations | | | 1.67 | | | | 1.99 | | | | 2.15 | | | | 1.34 | | | | (0.40 | ) | | | 1.16 | |
| | | | |
Net asset value, end of period | | $ | 15.47 | | | $ | 13.80 | | | $ | 11.81 | | | $ | 9.66 | | | $ | 8.32 | | | $ | 8.72 | |
| | | | |
| | | | | | | | | | | | | | | | | | | | | | | | |
| Total Return3 | | | | | | | | | | | | | | | | | | | | | | | | |
Based on net asset value | | | 12.10 | %4 | | | 16.85 | % | | | 22.26 | % | | | 16.11 | % | | | (4.59 | )%5 | | | 15.34 | %5,6 |
| | | | |
| | | | | | | | | | | | | | | | | | | | | | | | |
| Ratios to Average Net Assets | | | | | | | | | | | | | | | | | | | | | | | | |
Total expenses | | | 1.54 | %7,8 | | | 1.50 | % | | | 1.56 | %7 | | | 1.57 | %7 | | | 1.55 | %7 | | | 1.76 | %7 |
| | | | |
Total expenses after fees waived and/or reimbursed and paid indirectly | | | 1.54 | %8 | | | 1.46 | % | | | 1.56 | % | | | 1.57 | % | | | 1.53 | % | | | 1.74 | % |
| | | | |
Net investment loss | | | (0.88 | )%8 | | | (0.93 | )% | | | (0.54 | )% | | | (0.81 | )% | | | (0.74 | )% | | | (0.94 | )% |
| | | | |
| | | | | | | | | | | | | | | | | | | | | | | | |
| Supplemental Data | | | | | | | | | | | | | | | | | | | | | | | | |
Net assets, end of period (000) | | $ | 1,394 | | | $ | 1,297 | | | $ | 869 | | | $ | 944 | | | $ | 851 | | | $ | 659 | |
| | | | |
Portfolio turnover rate | | | 38 | % | | | 99 | % | | | 86 | % | | | 320 | % | | | 103 | % | | | 97 | % |
| | | | |
| | 1 | | Based on average shares outstanding. |
| | 2 | | Includes redemption fees, which are less than $0.005 per share. |
| | 3 | | Where applicable, assumes the reinvestment of distributions. |
| | 4 | | Aggregate total return. |
| | 5 | | Redemption fee of 2.00% is reflected in total return calculations. There was no impact to the return. |
| | 6 | | Includes proceeds received from a settlement of litigation, which impacted the Fund’s total return. Excluding these proceeds, the Fund’s total return would have been 15.08%. |
| | 7 | | Includes recoupment of past waived and/or reimbursed fees. Excluding the recoupment of past waived and/or reimbursed fees for the six months ended March 31, 2015, and the years ended September 30, 2012, September 30, 2011 and September 30, 2010, the ratio would have been 1.47%, 1.56%, 1.54% and 1.67%, respectively. There was no financial impact to the expense ratios for the year ended September 30, 2013. |
See Notes to Financial Statements.
| | | | | | |
| | | BLACKROCK FUNDS | | MARCH 31, 2015 | | 67 |
| | | | |
| Financial Highlights (continued) | | | BlackRock Science & Technology Opportunities Portfolio | |
| | | | | | | | | | | | | | | | | | | | | | | | |
| | | Investor A | |
| | | Six Months
Ended
March 31,
2015 (Unaudited) | | | Year Ended September 30, | |
| | | | 2014 | | | 2013 | | | 2012 | | | 2011 | | | 2010 | |
| Per Share Operating Performance | | | | | | | | | | | | | | | | | | | | | | | | |
Net asset value, beginning of period | | $ | 13.55 | | | $ | 11.61 | | | $ | 9.51 | | | $ | 8.21 | | | $ | 8.62 | | | $ | 7.48 | |
| | | | |
Net investment loss1 | | | (0.07 | ) | | | (0.14 | ) | | | (0.06 | ) | | | (0.09 | ) | | | (0.09 | ) | | | (0.08 | ) |
Net realized and unrealized gain (loss) | | | 1.71 | | | | 2.08 | | | | 2.16 | | | | 1.39 | | | | (0.32 | )2 | | | 1.22 | 2 |
| | | | |
Net increase (decrease) from investment operations | | | 1.64 | | | | 1.94 | | | | 2.10 | | | | 1.30 | | | | (0.41 | ) | | | 1.14 | |
| | | | |
Net asset value, end of period | | $ | 15.19 | | | $ | 13.55 | | | $ | 11.61 | | | $ | 9.51 | | | $ | 8.21 | | | $ | 8.62 | |
| | | | |
| | | | | | | | | | | | | | | | | | | | | | | | |
| Total Return3 | | | | | | | | | | | | | | | | | | | | | | | | |
Based on net asset value | | | 12.10 | %4 | | | 16.71 | % | | | 22.08 | % | | | 15.84 | % | | | (4.76 | )%5 | | | 15.24 | %5,6 |
| | | | |
| | | | | | | | | | | | | | | | | | | | | | | | |
| Ratios to Average Net Assets | | | | | | | | | | | | | | | | | | | | | | | | |
Total expenses | | | 1.62 | %7,8 | | | 1.64 | %7 | | | 1.72 | %7 | | | 1.72 | %7 | | | 1.79 | %7 | | | 1.82 | %7 |
| | | | |
Total expenses after fees waived and/or reimbursed and paid indirectly | | | 1.61 | %8 | | | 1.61 | % | | | 1.70 | % | | | 1.71 | % | | | 1.78 | % | | | 1.79 | % |
| | | | |
Net investment loss | | | (0.95 | )%8 | | | (1.07 | )% | | | (0.67 | )% | | | (0.95 | )% | | | (0.98 | )% | | | (0.99 | )% |
| | | | |
| | | | | | | | | | | | | | | | | | | | | | | | |
| Supplemental Data | | | | | | | | | | | | | | | | | | | | | | | | |
Net assets, end of period (000) | | $ | 135,404 | | | $ | 118,814 | | | $ | 97,437 | | | $ | 106,466 | | | $ | 106,632 | | | $ | 105,577 | |
| | | | |
Portfolio turnover rate | | | 38 | % | | | 99 | % | | | 86 | % | | | 320 | % | | | 103 | % | | | 97 | % |
| | | | |
| | 1 | | Based on average shares outstanding. |
| | 2 | | Includes redemption fees, which are less than $0.005 per share. |
| | 3 | | Where applicable, excludes the effects of any sales charges and assumes the reinvestment of distributions. |
| | 4 | | Aggregate total return. |
| | 5 | | Redemption fee of 2.00% is reflected in total return calculations. There was no impact to the return. |
| | 6 | | Includes proceeds received from a settlement of litigation, which impacted the Fund’s total return. Excluding these proceeds, the Fund’s total return would have been 14.97%. |
| | 7 | | Includes recoupment of past waived and/or reimbursed fees. Excluding the recoupment of past waived and/or reimbursed fees for the six months ended March 31, 2015, and the years ended September 30, 2014, September 30, 2012, September 30, 2011 and September 30, 2010, the ratio would have been 1.59%, 1.63%, 1.70%, 1.71% and 1.81%, respectively. There was no financial impact to the expense ratios for the year ended September 30, 2013. |
See Notes to Financial Statements.
| | | | | | |
| 68 | | BLACKROCK FUNDS | | MARCH 31, 2015 | | |
| | | | |
| Financial Highlights (continued) | | | BlackRock Science & Technology Opportunities Portfolio | |
| | | | | | | | | | | | | | | | | | | | | | | | |
| | | Investor B | |
| | | Six Months
Ended
March 31,
2015 (Unaudited) | | | Year Ended September 30, | |
| | | | 2014 | | | 2013 | | | 2012 | | | 2011 | | | 2010 | |
| Per Share Operating Performance | | | | | | | | | | | | | | | | | | | | | | | | |
Net asset value, beginning of period | | $ | 12.06 | | | $ | 10.42 | | | $ | 8.60 | | | $ | 7.48 | | | $ | 7.93 | | | $ | 6.94 | |
| | | | |
Net investment loss1 | | | (0.11 | ) | | | (0.22 | ) | | | (0.13 | ) | | | (0.15 | ) | | | (0.16 | ) | | | (0.14 | ) |
Net realized and unrealized gain (loss) | | | 1.51 | | | | 1.86 | | | | 1.95 | | | | 1.27 | | | | (0.29 | )2 | | | 1.13 | 2 |
| | | | |
Net increase (decrease) from investment operations | | | 1.40 | | | | 1.64 | | | | 1.82 | | | | 1.12 | | | | (0.45 | ) | | | 0.99 | |
| | | | |
Net asset value, end of period | | $ | 13.46 | | | $ | 12.06 | | | $ | 10.42 | | | $ | 8.60 | | | $ | 7.48 | | | $ | 7.93 | |
| | | | |
| | | | | | | | | | | | | | | | | | | | | | | | |
| Total Return3 | | | | | | | | | | | | | | | | | | | | | | | | |
Based on net asset value | | | 11.61 | %4 | | | 15.74 | % | | | 21.16 | % | | | 14.97 | % | | | (5.68 | )%5 | | | 14.27 | %5,6 |
| | | | |
| | | | | | | | | | | | | | | | | | | | | | | | |
| Ratios to Average Net Assets | | | | | | | | | | | | | | | | | | | | | | | | |
Total expenses | | | 2.61 | %7,8 | | | 2.42 | %7 | | | 2.50 | %7 | | | 2.52 | %7 | | | 2.67 | %7 | | | 2.70 | %7 |
| | | | |
Total expenses after fees waived and/or reimbursed and paid indirectly | | | 2.42 | %8 | | | 2.41 | % | | | 2.49 | % | | | 2.52 | % | | | 2.66 | % | | | 2.69 | % |
| | | | |
Net investment loss | | | (1.76 | )%8 | | | (1.90 | )% | | | (1.47 | )% | | | (1.76 | )% | | | (1.87 | )% | | | (1.90 | )% |
| | | | |
| | | | | | | | | | | | | | | | | | | | | | | | |
| Supplemental Data | | | | | | | | | | | | | | | | | | | | | | | | |
Net assets, end of period (000) | | $ | 990 | | | $ | 1,585 | | | $ | 2,275 | | | $ | 2,645 | | | $ | 3,130 | | | $ | 4,390 | |
| | | | |
Portfolio turnover rate | | | 38 | % | | | 99 | % | | | 86 | % | | | 320 | % | | | 103 | % | | | 97 | % |
| | | | |
| | 1 | | Based on average shares outstanding. |
| | 2 | | Includes redemption fees, which are less than $0.005 per share. |
| | 3 | | Where applicable, excludes the effects of any sales charges and assumes the reinvestment of distributions. |
| | 4 | | Aggregate total return. |
| | 5 | | Redemption fee of 2.00% is reflected in total return calculations. There was no impact to the return. |
| | 6 | | Includes proceeds received from a settlement of litigation, which impacted the Fund’s total return. Excluding these proceeds, the Fund’s total return would have been 13.98%. |
| | 7 | | Includes recoupment of past waived and/or reimbursed fees. Excluding the recoupment of past waived and/or reimbursed fees for the years ended September 30, 2011 and September 30, 2010, the ratio would have been 2.44% and 2.65%, respectively. There was no financial impact to the expense ratios for the six months ended March 31, 2015, and the years ended September 30, 2014, September 30, 2013 and September 30, 2012. |
See Notes to Financial Statements.
| | | | | | |
| | | BLACKROCK FUNDS | | MARCH 31, 2015 | | 69 |
| | | | |
| Financial Highlights (continued) | | | BlackRock Science & Technology Opportunities Portfolio | |
| | | | | | | | | | | | | | | | | | | | | | | | |
| | | Investor C | |
| | | Six Months Ended March 31, 2015
(Unaudited) | | | Year Ended September 30, | |
| | | | 2014 | | | 2013 | | | 2012 | | | 2011 | | | 2010 | |
| Per Share Operating Performance | | | | | | | | | | | | | | | | | | | | | | | | |
Net asset value, beginning of period | | $ | 12.03 | | | $ | 10.39 | | | $ | 8.58 | | | $ | 7.47 | | | $ | 7.92 | | | $ | 6.94 | |
| | | | |
Net investment loss1 | | | (0.11 | ) | | | (0.22 | ) | | | (0.14 | ) | | | (0.15 | ) | | | (0.16 | ) | | | (0.14 | ) |
Net realized and unrealized gain (loss) | | | 1.50 | | | | 1.86 | | | | 1.95 | | | | 1.26 | | | | (0.29 | )2 | | | 1.12 | 2 |
| | | | |
Net increase (decrease) from investment operations | | | 1.39 | | | | 1.64 | | | | 1.81 | | | | 1.11 | | | | (0.45 | ) | | | 0.98 | |
| | | | |
Net asset value, end of period | | $ | 13.42 | | | $ | 12.03 | | | $ | 10.39 | | | $ | 8.58 | | | $ | 7.47 | | | $ | 7.92 | |
| | | | |
| | | | | | | | | | | | | | | | | | | | | | | | |
| Total Return3 | | | | | | | | | | | | | | | | | | | | | | | | |
Based on net asset value | | | 11.55 | %4 | | | 15.78 | % | | | 21.10 | % | | | 14.86 | % | | | (5.68 | )%5 | | | 14.12 | %5,6 |
| | | | |
| | | | | | | | | | | | | | | | | | | | | | | | |
| Ratios to Average Net Assets | | | | | | | | | | | | | | | | | | | | | | | | |
Total expenses | | | 2.45 | %7,8 | | | 2.46 | %7 | | | 2.58 | %7 | | | 2.60 | %7 | | | 2.68 | %7 | | | 2.73 | %7 |
| | | | |
Total expenses after fees waived and/or reimbursed and paid indirectly | | | 2.45 | %8 | | | 2.44 | % | | | 2.57 | % | | | 2.60 | % | | | 2.67 | % | | | 2.71 | % |
| | | | |
Net investment loss | | | (1.79 | )%8 | | | (1.90 | )% | | | (1.56 | )% | | | (1.84 | )% | | | (1.88 | )% | | | (1.92 | )% |
| | | | |
| | | | | | | | | | | | | | | | | | | | | | | | |
| Supplemental Data | | | | | | | | | | | | | | | | | | | | | | | | |
Net assets, end of period (000) | | $ | 36,534 | | | $ | 32,194 | | | $ | 28,234 | | | $ | 26,543 | | | $ | 27,651 | | | $ | 27,053 | |
| | | | |
Portfolio turnover rate | | | 38 | % | | | 99 | % | | | 86 | % | | | 320 | % | | | 103 | % | | | 97 | % |
| | | | |
| | 1 | | Based on average shares outstanding. |
| | 2 | | Includes redemption fees, which are less than $0.005 per share. |
| | 3 | | Where applicable, excludes the effects of any sales charges and assumes the reinvestment of distributions. |
| | 4 | | Aggregate total return. |
| | 5 | | Redemption fee of 2.00% is reflected in total return calculations. There was no impact to the return. |
| | 6 | | Includes proceeds received from a settlement of litigation, which impacted the Fund’s total return. Excluding these proceeds, the Fund’s total return would have been 13.83%. |
| | 7 | | Includes recoupment of past waived and/or reimbursed fees. Excluding the recoupment of past waived and/or reimbursed fees for the six months ended March 31, 2015, and the years ended September 30, 2014, September 30, 2012 and September 30, 2011, the ratio would have been 2.42%, 2.45%, 2.59%, and 2.59%, respectively. There was no financial impact to the expense ratios for the years ended September 30, 2013 and September 30, 2010. |
See Notes to Financial Statements.
| | | | | | |
| 70 | | BLACKROCK FUNDS | | MARCH 31, 2015 | | |
| | | | |
| Financial Highlights (concluded) | | | BlackRock Science & Technology Opportunities Portfolio | |
| | | | | | | | | | | | | | | | | | | | | | | | |
| | | Class R | |
| | | Six Months Ended
March 31,
2015
(Unaudited) | | | Year Ended September 30, | |
| | | 2014 | | | 2013 | | | 2012 | | | 2011 | | | 2010 | |
| Per Share Operating Performance | | | | | | | | | | | | | | | | | | | | | | | | |
Net asset value, beginning of period | | $ | 13.81 | | | $ | 11.86 | | | $ | 9.74 | | | $ | 8.43 | | | $ | 8.88 | | | $ | 7.72 | |
| | | | |
Net investment loss1 | | | (0.09 | ) | | | (0.18 | ) | | | (0.09 | ) | | | (0.12 | ) | | | (0.12 | ) | | | (0.11 | ) |
Net realized and unrealized gain (loss) | | | 1.73 | | | | 2.13 | | | | 2.21 | | | | 1.43 | | | | (0.33 | )2 | | | 1.27 | 2 |
| | | | |
Net increase (decrease) from investment operations | | | 1.64 | | | | 1.95 | | | | 2.12 | | | | 1.31 | | | | (0.45 | ) | | | 1.16 | |
| | | | |
Net asset value, end of period | | $ | 15.45 | | | $ | 13.81 | | | $ | 11.86 | | | $ | 9.74 | | | $ | 8.43 | | | $ | 8.88 | |
| | | | |
| | | | | | | | | | | | | | | | | | | | | | | | |
| Total Return3 | | | | | | | | | | | | | | | | | | | | | | | | |
Based on net asset value | | | 11.88 | %4 | | | 16.44 | % | | | 21.77 | % | | | 15.54 | % | | | (5.07 | )%5 | | | 15.03 | %5,6 |
| | | | |
| | | | | | | | | | | | | | | | | | | | | | | | |
| Ratios to Average Net Assets | | | | | | | | | | | | | | | | | | | | | | | | |
Total expenses | | | 1.90 | %7,8 | | | 1.91 | %7 | | | 1.97 | %7 | | | 2.00 | %7 | | | 2.00 | %7 | | | 2.10 | %7 |
| | | | |
Total expenses after fees waived and/or reimbursed and paid indirectly | | | 1.89 | %8 | | | 1.89 | % | | | 1.93 | % | | | 1.99 | % | | | 2.00 | % | | | 2.09 | % |
| | | | |
Net investment loss | | | (1.23 | )%8 | | | (1.35 | )% | | | (0.92 | )% | | | (1.23 | )% | | | (1.21 | )% | | | (1.29 | )% |
| | | | |
| | | | | | | | | | | | | | | | | | | | | | | | |
| Supplemental Data | | | | | | | | | | | | | | | | | | | | | | | | |
Net assets, end of period (000) | | $ | 4,783 | | | $ | 4,195 | | | $ | 4,555 | | | $ | 4,329 | | | $ | 3,518 | | | $ | 2,961 | |
| | | | |
Portfolio turnover rate | | | 38 | % | | | 99 | % | | | 86 | % | | | 320 | % | | | 103 | % | | | 97 | % |
| | | | |
| | 1 | | Based on average shares outstanding. |
| | 2 | | Includes redemption fees, which are less than $0.005 per share. |
| | 3 | | Where applicable, assumes the reinvestment of distributions. |
| | 4 | | Aggregate total return. |
| | 5 | | Redemption fee of 2.00% is reflected in total return calculations. There was no impact to the return. |
| | 6 | | Includes proceeds received from a settlement of litigation, which impacted the Fund’s total return. Excluding these proceeds, the Fund’s total return would have been 14.77%. |
| | 7 | | Includes recoupment of past waived and/or reimbursed fees. Excluding the recoupment of past waived and/or reimbursed fees for the six months ended March 31, 2015, and the years ended September 30, 2014 and September 30, 2012, the ratio would have been 1.85%, 1.89% and 1.99%, respectively. There was no financial impact to the expense ratios for the years ended September 30, 2013, September 30, 2011 and September 30, 2010. |
See Notes to Financial Statements.
| | | | | | |
| | | BLACKROCK FUNDS | | MARCH 31, 2015 | | 71 |
| | | | |
| Financial Highlights | | | BlackRock U.S. Opportunities Portfolio | |
| | | | | | | | | | | | | | | | | | | | | | | | |
| | | Institutional | |
| | | Six Months Ended March 31, 2015
(Unaudited) | | | Year Ended September 30, | |
| | | | 2014 | | | 2013 | | | 2012 | | | 2011 | | | 2010 | |
| Per Share Operating Performance | | | | | | | | | | | | | | | | | | | | | | | | |
Net asset value, beginning of period | | $ | 42.91 | | | $ | 45.82 | | | $ | 36.42 | | | $ | 33.86 | | | $ | 36.94 | | | $ | 32.20 | |
| | | | |
Net investment income (loss)1 | | | 0.04 | | | | (0.07 | ) | | | 0.11 | | | | 0.19 | | | | 0.05 | | | | 0.04 | |
Net realized and unrealized gain (loss) | | | 4.61 | | | | 6.49 | | | | 10.41 | | | | 6.31 | | | | (2.44 | )2 | | | 4.77 | 2 |
| | | | |
Net increase (decrease) from investment operations | | | 4.65 | | | | 6.42 | | | | 10.52 | | | | 6.50 | | | | (2.39 | ) | | | 4.81 | |
| | | | |
Distributions from:3 | | | | | | | | | | | | | | | | | | | | | | | | |
Net investment income | | | — | | | | — | | | | (0.33 | ) | | | — | | | | — | | | | (0.07 | ) |
Net realized gains | | | (6.18 | ) | | | (9.33 | ) | | | (0.79 | ) | | | (3.94 | ) | | | (0.69 | ) | | | — | |
| | | | |
Total distributions | | | (6.18 | ) | | | (9.33 | ) | | | (1.12 | ) | | | (3.94 | ) | | | (0.69 | ) | | | (0.07 | ) |
| | | | |
Net asset value, end of period | | $ | 41.38 | | | $ | 42.91 | | | $ | 45.82 | | | $ | 36.42 | | | $ | 33.86 | | | $ | 36.94 | |
| | | | |
| | | | | | | | | | | | | | | | | | | | | | | | |
| Total Return4 | | | | | | | | | | | | | | | | | | | | | | | | |
Based on net asset value | | | 12.16 | %5 | | | 16.28 | % | | | 29.79 | % | | | 20.40 | % | | | (6.75 | )%6 | | | 14.96 | %6,7 |
| | | | |
| | | | | | | | | | | | | | | | | | | | | | | | |
| Ratios to Average Net Assets | | | | | | | | | | | | | | | | | | | | | | | | |
Total expenses | | | 1.33 | %8 | | | 1.34 | %9 | | | 1.37 | % | | | 1.30 | % | | | 1.36 | % | | | 1.30 | % |
| | | | |
Total expenses after fees waived and/or reimbursed and paid indirectly | | | 0.91 | %8 | | | 0.94 | % | | | 1.01 | % | | | 1.03 | % | | | 1.03 | % | | | 1.03 | % |
| | | | |
Net investment income (loss) | | | 0.19 | %8 | | | (0.17 | )% | | | 0.28 | % | | | 0.52 | % | | | 0.12 | % | | | 0.13 | % |
| | | | |
| | | | | | | | | | | | | | | | | | | | | | | | |
| Supplemental Data | | | | | | | | | | | | | | | | | | | | | | | | |
Net assets, end of period (000) | | $ | 918,605 | | | $ | 732,297 | | | $ | 676,540 | | | $ | 1,294,928 | | | $ | 1,905,254 | | | $ | 1,588,509 | |
| | | | |
Portfolio turnover rate | | | 27 | % | | | 66 | % | | | 82 | % | | | 106 | % | | | 120 | % | | | 123 | % |
| | | | |
| | 1 | | Based on average shares outstanding. |
| | 2 | | Includes redemption fees, which are less than $0.005 per share. |
| | 3 | | Distributions for annual periods determined in accordance with federal income tax regulations. |
| | 4 | | Where applicable, assumes the reinvestment of distributions. |
| | 5 | | Aggregate total return. |
| | 6 | | Redemption fee of 2.00% is reflected in total return calculations. There was no impact to the return. |
| | 7 | | Includes proceeds received from a settlement of litigation, which had no impact on the Fund’s total return. |
| | 9 | | Includes recoupment of past waived and/or reimbursed fees. There was no financial impact to the expense ratio. |
See Notes to Financial Statements.
| | | | | | |
| 72 | | BLACKROCK FUNDS | | MARCH 31, 2015 | | |
| | | | |
| Financial Highlights (continued) | | | BlackRock U.S. Opportunities Portfolio | |
| | | | | | | | | | | | | | | | | | | | | | | | |
| | | Service | |
| | | Six Months Ended March 31, 2015
(Unaudited) | | | Year Ended September 30, | |
| | | | 2014 | | | 2013 | | | 2012 | | | 2011 | | | 2010 | |
| Per Share Operating Performance | | | | | | | | | | | | | | | | | | | | | | | | |
Net asset value, beginning of period | | $ | 40.51 | | | $ | 43.72 | | | $ | 34.71 | | | $ | 32.44 | | | $ | 35.40 | | | $ | 30.93 | |
| | | | |
Net investment income (loss)1 | | | (0.07 | ) | | | (0.23 | ) | | | (0.09 | ) | | | 0.02 | | | | (0.12 | ) | | | (0.11 | ) |
Net realized and unrealized gain (loss) | | | 4.41 | | | | 6.16 | | | | 9.98 | | | | 6.03 | | | | (2.34 | )2 | | | 4.58 | 2 |
| | | | |
Net increase (decrease) from investment operations | | | 4.34 | | | | 5.93 | | | | 9.89 | | | | 6.05 | | | | (2.46 | ) | | | 4.47 | |
| | | | |
Distributions from:3 | | | | | | | | | | | | | | | | | | | | | | | | |
Net investment income | | | — | | | | — | | | | (0.09 | ) | | | — | | | | — | | | | — | |
Net realized gains | | | (5.49 | ) | | | (9.14 | ) | | | (0.79 | ) | | | (3.78 | ) | | | (0.50 | ) | | | — | |
| | | | |
Total distributions | | | (5.49 | ) | | | (9.14 | ) | | | (0.88 | ) | | | (3.78 | ) | | | (0.50 | ) | | | — | |
| | | | |
Net asset value, end of period | | $ | 39.36 | | | $ | 40.51 | | | $ | 43.72 | | | $ | 34.71 | | | $ | 32.44 | | | $ | 35.40 | |
| | | | |
| | | | | | | | | | | | | | | | | | | | | | | | |
| Total Return4 | | | | | | | | | | | | | | | | | | | | | | | | |
Based on net asset value | | | 11.93 | %5 | | | 15.82 | % | | | 29.26 | % | | | 19.80 | % | | | (7.16 | )%6 | | | 14.45 | %6,7 |
| | | | |
| | | | | | | | | | | | | | | | | | | | | | | | |
| Ratios to Average Net Assets | | | | | | | | | | | | | | | | | | | | | | | | |
Total expenses | | | 1.69 | %8 | | | 1.59 | %9 | | | 1.61 | % | | | 1.62 | % | | | 1.57 | %9 | | | 1.60 | %9 |
| | | | |
Total expenses after fees waived and/or reimbursed and paid indirectly | | | 1.31 | %8 | | | 1.34 | % | | | 1.45 | % | | | 1.51 | % | | | 1.46 | % | | | 1.48 | % |
| | | | |
Net investment income (loss) | | | (0.34 | )%8 | | | (0.57 | )% | | | (0.22 | )% | | | 0.05 | % | | | (0.30 | )% | | | (0.34 | )% |
| | | | |
| | | | | | | | | | | | | | | | | | | | | | | | |
| Supplemental Data | | | | | | | | | | | | | | | | | | | | | | | | |
Net assets, end of period (000) | | $ | 32,154 | | | $ | 140,498 | | | $ | 155,414 | | | $ | 159,939 | | | $ | 183,604 | | | $ | 235,926 | |
| | | | |
Portfolio turnover rate | | | 27 | % | | | 66 | % | | | 82 | % | | | 106 | % | | | 120 | % | | | 123 | % |
| | | | |
| | 1 | | Based on average shares outstanding. |
| | 2 | | Includes redemption fees, which are less than $0.005 per share. |
| | 3 | | Distributions for annual periods determined in accordance with federal income tax regulations. |
| | 4 | | Where applicable, assumes the reinvestment of distributions. |
| | 5 | | Aggregate total return. |
| | 6 | | Redemption fee of 2.00% is reflected in total return calculations. There was no impact to the return. |
| | 7 | | Includes proceeds received from a settlement of litigation, which had no impact on the Fund’s total return. |
| | 9 | | Includes recoupment of past waived and/or reimbursed fees. There was no financial impact to the expense ratio. |
See Notes to Financial Statements.
| | | | | | |
| | | BLACKROCK FUNDS | | MARCH 31, 2015 | | 73 |
| | |
| Financial Highlights (continued) | | BlackRock U.S. Opportunities Portfolio |
| | | | | | | | | | | | | | | | | | | | | | | | |
| | | Investor A | |
| | | Six Months Ended March 31, 2015
(Unaudited) | | | Year Ended September 30, | |
| | | | 2014 | | | 2013 | | | 2012 | | | 2011 | | | 2010 | |
| Per Share Operating Performance | | | | | | | | | | | | | | | | | | | | | | | | |
Net asset value, beginning of period | | $ | 39.96 | | | $ | 43.23 | | | $ | 34.30 | | | $ | 32.08 | | | $ | 35.02 | | | $ | 30.61 | |
| | | | |
Net investment income (loss)1 | | | (0.04 | ) | | | (0.23 | ) | | | (0.09 | ) | | | 0.01 | | | | (0.13 | ) | | | (0.12 | ) |
Net realized and unrealized gain (loss) | | | 4.27 | | | | 6.09 | | | | 9.86 | | | | 5.97 | | | | (2.31 | )2 | | | 4.53 | 2 |
| | | | |
Net increase (decrease) from investment operations | | | 4.23 | | | | 5.86 | | | | 9.77 | | | | 5.98 | | | | (2.44 | ) | | | 4.41 | |
| | | | |
Distributions from:3 | | | | | | | | | | | | | | | | | | | | | | | | |
Net investment income | | | — | | | | — | | | | (0.05 | ) | | | — | | | | — | | | | — | |
Net realized gains | | | (6.00 | ) | | | (9.13 | ) | | | (0.79 | ) | | | (3.76 | ) | | | (0.50 | ) | | | — | |
| | | | |
Total distributions | �� | | (6.00 | ) | | | (9.13 | ) | | | (0.84 | ) | | | (3.76 | ) | | | (0.50 | ) | | | — | |
| | | | |
Net asset value, end of period | | $ | 38.19 | | | $ | 39.96 | | | $ | 43.23 | | | $ | 34.30 | | | $ | 32.08 | | | $ | 35.02 | |
| | | | |
| | | | | | | | | | | | | | | | | | | | | | | | |
| Total Return4 | | | | | | | | | | | | | | | | | | | | | | | | |
Based on net asset value | | | 11.93 | %5 | | | 15.83 | % | | | 29.19 | % | | | 19.82 | % | | | (7.19 | )%6 | | | 14.41 | %6,7 |
| | | | |
| | | | | | | | | | | | | | | | | | | | | | | | |
| Ratios to Average Net Assets | | | | | | | | | | | | | | | | | | | | | | | | |
Total expenses | | | 1.63 | %8,9 | | | 1.61 | %8 | | | 1.63 | %8 | | | 1.62 | %8 | | | 1.59 | % | | | 1.64 | %8 |
| | | | |
Total expenses after fees waived and/or reimbursed and paid indirectly | | | 1.31 | %9 | | | 1.34 | % | | | 1.47 | % | | | 1.51 | % | | | 1.49 | % | | | 1.51 | % |
| | | | |
Net investment income (loss) | | | (0.23 | )%9 | | | (0.58 | )% | | | (0.23 | )% | | | 0.03 | % | | | (0.34 | )% | | | (0.37 | )% |
| | | | |
| | | | | | | | | | | | | | | | | | | | | | | | |
| Supplemental Data | | | | | | | | | | | | | | | | | | | | | | | | |
Net assets, end of period (000) | | $ | 434,900 | | | $ | 423,779 | | | $ | 512,224 | | | $ | 610,343 | | | $ | 888,293 | | | $ | 1,158,626 | |
| | | | |
Portfolio turnover rate | | | 27 | % | | | 66 | % | | | 82 | % | | | 106 | % | | | 120 | % | | | 123 | % |
| | | | |
| | 1 | | Based on average shares outstanding. |
| | 2 | | Includes redemption fees, which are less than $0.005 per share. |
| | 3 | | Distributions for annual periods determined in accordance with federal income tax regulations. |
| | 4 | | Where applicable, excludes the effects of any sales charges and assumes the reinvestment of distributions. |
| | 5 | | Aggregate total return. |
| | 6 | | Redemption fee of 2.00% is reflected in total return calculations. There was no impact to the return. |
| | 7 | | Includes proceeds received from a settlement of litigation, which had no impact on the Fund’s total return. |
| | 8 | | Includes recoupment of past waived and/or reimbursed fees. Excluding the recoupment of past waived and/or reimbursed fees for the six months ended March 31, 2015, and the year ended September 30, 2014, the ratio would have been 1.62% and 1.60%, respectively. There was no financial impact to the expense ratios for the years ended, September 30, 2013, September 30, 2012 and September 30, 2010. |
See Notes to Financial Statements.
| | | | | | |
| 74 | | BLACKROCK FUNDS | | MARCH 31, 2015 | | |
| | | | |
| Financial Highlights (continued) | | | BlackRock U.S. Opportunities Portfolio | |
| | | | | | | | | | | | | | | | | | | | | | | | |
| | | Investor B | |
| | | Six Months
Ended
March 31,
2015
(Unaudited) | | | Year Ended September 30, | |
| | | | 2014 | | | 2013 | | | 2012 | | | 2011 | | | 2010 | |
| Per Share Operating Performance | | | | | | | | | | | | | | | | | | | | | | | | |
Net asset value, beginning of period | | $ | 34.37 | | | $ | 38.39 | | | $ | 30.72 | | | $ | 29.11 | | | $ | 31.96 | | | $ | 28.16 | |
| | | | |
Net investment loss1 | | | (0.17 | ) | | | (0.48 | ) | | | (0.35 | ) | | | (0.23 | ) | | | (0.40 | ) | | | (0.35 | ) |
Net realized and unrealized gain (loss) | | | 3.62 | | | | 5.31 | | | | 8.79 | | | | 5.39 | | | | (2.06 | )2 | | | 4.15 | 2 |
| | | | |
Net increase (decrease) from investment operations | | | 3.45 | | | | 4.83 | | | | 8.44 | | | | 5.16 | | | | (2.46 | ) | | | 3.80 | |
| | | | |
Distributions from net realized gains3 | | | (5.70 | ) | | | (8.85 | ) | | | (0.77 | ) | | | (3.55 | ) | | | (0.39 | ) | | | — | |
| | | | |
Net asset value, end of period | | $ | 32.12 | | | $ | 34.37 | | | $ | 38.39 | | | $ | 30.72 | | | $ | 29.11 | | | $ | 31.96 | |
| | | | |
| | | | | | | | | | | | | | | | | | | | | | | | |
| Total Return4 | | | | | | | | | | | | | | | | | | | | | | | | |
Based on net asset value | | | 11.50 | %5 | | | 14.90 | % | | | 28.19 | % | | | 18.87 | % | | | (7.90 | )%6 | | | 13.49 | %6,7 |
| | | | |
| | | | | | | | | | | | | | | | | | | | | | | | |
| Ratios to Average Net Assets | | | | | | | | | | | | | | | | | | | | | | | | |
Total expenses | | | 2.40 | %8 | | | 2.39 | %9 | | | 2.43 | %9 | | | 2.42 | %9 | | | 2.39 | %9 | | | 2.44 | %9 |
| | | | |
Total expenses after fees waived and/or reimbursed and paid indirectly | | | 2.10 | %8 | | | 2.14 | % | | | 2.26 | % | | | 2.30 | % | | | 2.28 | % | | | 2.30 | % |
| | | | |
Net investment loss | | | (1.03 | )%8 | | | (1.37 | )% | | | (1.04 | )% | | | (0.74 | )% | | | (1.12 | )% | | | (1.18 | )% |
| | | | |
| | | | | | | | | | | | | | | | | | | | | | | | |
| Supplemental Data | | | | | | | | | | | | | | | | | | | | | | | | |
Net assets, end of period (000) | | $ | 10,182 | | | $ | 10,935 | | | $ | 13,107 | | | $ | 12,833 | | | $ | 15,047 | | | $ | 20,255 | |
| | | | |
Portfolio turnover rate | | | 27 | % | | | 66 | % | | | 82 | % | | | 106 | % | | | 120 | % | | | 123 | % |
| | | | |
| | 1 | | Based on average shares outstanding. |
| | 2 | | Includes redemption fees, which are less than $0.005 per share. |
| | 3 | | Distributions for annual periods determined in accordance with federal income tax regulations. |
| | 4 | | Where applicable, excludes the effects of any sales charges and assumes the reinvestment of distributions. |
| | 5 | | Aggregate total return. |
| | 6 | | Redemption fee of 2.00% is reflected in total return calculations. There was no impact to the return. |
| | 7 | | Includes proceeds received from a settlement of litigation, which had no impact on the Fund’s total return. |
| | 9 | | Includes recoupment of past waived and/or reimbursed fees. Excluding the recoupment of past waived and/or reimbursed fees for the years ended September 30, 2014, September 30, 2013 and September 30, 2011, the ratio would have been 2.37%, 2.42% and 2.37%, respectively. There was no financial impact to the expense ratios for the six months ended March 31, 2015, and the years ended September 30, 2012 and September 30, 2010. |
See Notes to Financial Statements.
| | | | | | |
| | | BLACKROCK FUNDS | | MARCH 31, 2015 | | 75 |
| | | | |
| Financial Highlights (concluded) | | | BlackRock U.S. Opportunities Portfolio | |
| | | | | | | | | | | | | | | | | | | | | | | | |
| | | Investor C | |
| | | Six Months
Ended
March 31,
2015
(Unaudited) | | | Year Ended September 30, | |
| | | | 2014 | | | 2013 | | | 2012 | | | 2011 | | | 2010 | |
| Per Share Operating Performance | | | | | | | | | | | | | | | | | | | | | | | | |
Net asset value, beginning of period | | $ | 34.43 | | | $ | 38.44 | | | $ | 30.75 | | | $ | 29.11 | | | $ | 31.95 | | | $ | 28.14 | |
| | | | |
Net investment loss1 | | | (0.16 | ) | | | (0.46 | ) | | | (0.33 | ) | | | (0.21 | ) | | | (0.38 | ) | | | (0.33 | ) |
Net realized and unrealized gain (loss) | | | 3.62 | | | | 5.32 | | | | 8.79 | | | | 5.39 | | | | (2.07 | )2 | | | 4.14 | 2 |
| | | | |
Net increase (decrease) from investment operations | | | 3.46 | | | | 4.86 | | | | 8.46 | | | | 5.18 | | | | (2.45 | ) | | | 3.81 | |
| | | | |
Distributions from net realized gains3 | | | (5.77 | ) | | | (8.87 | ) | | | (0.77 | ) | | | (3.54 | ) | | | (0.39 | ) | | | — | |
| | | | |
Net asset value, end of period | | $ | 32.12 | | | $ | 34.43 | | | $ | 38.44 | | | $ | 30.75 | | | $ | 29.11 | | | $ | 31.95 | |
| | | | |
| | | | | | | | | | | | | | | | | | | | | | | | |
| Total Return4 | | | | | | | | | | | | | | | | | | | | | | | | |
Based on net asset value | | | 11.51 | %5 | | | 14.97 | % | | | 28.22 | % | | | 18.94 | % | | | (7.87 | )%6 | | | 13.54 | %6,7 |
| | | | |
| | | | | | | | | | | | | | | | | | | | | | | | |
| Ratios to Average Net Assets | | | | | | | | | | | | | | | | | | | | | | | | |
Total expenses | | | 2.33 | %8 | | | 2.33 | %9 | | | 2.38 | % | | | 2.35 | % | | | 2.34 | %9 | | | 2.39 | %9 |
| | | | |
Total expenses after fees waived and/or reimbursed and paid indirectly | | | 2.07 | %8 | | | 2.09 | % | | | 2.22 | % | | | 2.25 | % | | | 2.24 | % | | | 2.27 | % |
| | | | |
Net investment loss | | | (0.98 | )%8 | | | (1.32 | )% | | | (0.98 | )% | | | (0.69 | )% | | | (1.08 | )% | | | (1.12 | )% |
| | | | |
| | | | | | | | | | | | | | | | | | | | | | | | |
| Supplemental Data | | | | | | | | | | | | | | | | | | | | | | | | |
Net assets, end of period (000) | | $ | 225,383 | | | $ | 211,493 | | | $ | 212,162 | | | $ | 226,350 | | | $ | 282,586 | | | $ | 334,958 | |
| | | | |
Portfolio turnover rate | | | 27 | % | | | 66 | % | | | 82 | % | | | 106 | % | | | 120 | % | | | 123 | % |
| | | | |
| | 1 | | Based on average shares outstanding. |
| | 2 | | Includes redemption fees, which are less than $0.005 per share. |
| | 3 | | Distributions for annual periods determined in accordance with federal income tax regulations. |
| | 4 | | Where applicable, excludes the effects of any sales charges and assumes the reinvestment of distributions. |
| | 5 | | Aggregate total return. |
| | 6 | | Redemption fee of 2.00% is reflected in total return calculations. There was no impact to the return. |
| | 7 | | Includes proceeds received from a settlement of litigation, which had no impact on the Fund’s total return. |
| | 9 | | Includes recoupment of past waived and/or reimbursed fees. Excluding the recoupment of past waived and/or reimbursed fees for the years ended September 30, 2014, September 30, 2011 and September 30, 2010, the ratio would have been 2.32%, 2.33% and 2.38%, respectively. |
See Notes to Financial Statements.
| | | | | | |
| 76 | | BLACKROCK FUNDS | | MARCH 31, 2015 | | |
| | |
| Notes to Financial Statements (Unaudited) | | |
1. Organization:
BlackRock FundsSM (the “Trust”) is registered under the Investment Company Act of 1940, as amended (the “1940 Act”), as an open-end management investment company. The Trust is organized as a Massachusetts business trust. The following are referred to herein collectively as the “Funds” or individually, a “Fund”:
| | | | |
| Fund Name | | Herein Referred To As | | Diversification Classification |
BlackRock Global Opportunities Portfolio | | (“Global Opportunities”) | | Diversified |
BlackRock Health Sciences Opportunities Portfolio | | (“Health Sciences Opportunities”) | | Non-diversified |
BlackRock International Opportunities Portfolio | | (“International Opportunities”) | | Diversified |
BlackRock Science & Technology Opportunities Portfolio | | (“Science & Technology Opportunities”) | | Diversified |
BlackRock U.S. Opportunities Portfolio | | (“U.S. Opportunities”) | | Diversified |
Each Fund offers multiple classes of shares. All classes of shares have identical voting, dividend, liquidation and other rights and are subject to the same terms and conditions, except that certain classes bear expenses related to the shareholder servicing and distribution of such shares. Institutional and Service Shares are sold only to certain eligible investors. Investor B Shares are only available through exchanges and distribution reinvestments by current holders and for purchase by certain employer-sponsored retirement plans. Class R Shares are available only to certain employer-sponsored retirement plans. Investor A and Investor C Shares are generally available through financial intermediaries. Each class has exclusive voting rights with respect to matters relating to its shareholder servicing and distribution expenditures (except that Investor B shareholders may vote on material changes to the Investor A distribution and service plan).
| | | | | | |
| Share Class | | Initial Sales Charge | | CDSC | | Conversion Privilege |
Institutional, Service and Class R Shares | | No | | No | | None |
Investor A Shares | | Yes | | No1 | | None |
Investor B Shares | | No | | Yes | | To Investor A Shares after approximately 8 years |
Investor C Shares | | No | | Yes | | None |
| | 1 | | Investor A Shares may be subject to a CDSC where no initial sales charge was paid at the time of purchase. |
The Funds, together with certain other registered investment companies advised by the Manager or its affiliates, are included in a complex of open-end funds referred to as the Equity-Liquidity Complex.
2. Significant Accounting Policies:
The Funds’ financial statements are prepared in conformity with accounting principles generally accepted in the United States of America (“U.S. GAAP”), which may require management to make estimates and assumptions that affect the reported amounts of assets and liabilities in the financial statements and the reported amounts of increases and decreases in net assets from operations during the reporting period. Actual results could differ from those estimates. Each Fund is considered an investment company under U.S. GAAP and follows the accounting and reporting guidance applicable to investment companies. The following is a summary of significant accounting policies followed by the Funds:
Valuation: The Funds’ investments are valued at fair value as of the close of trading on the New York Stock Exchange (“NYSE”)(generally 4:00 p.m., Eastern time). U.S. GAAP defines fair value as the price the Funds would receive to sell an asset or pay to transfer a liability in an orderly transaction between market participants at the measurement date. The Funds determine the fair values of their financial instruments at market value using independent dealers or pricing services under policies approved by the Board. The BlackRock Global Valuation Methodologies Committee (the “Global Valuation Committee”) is the committee formed by management to develop global pricing policies and procedures and to provide oversight of the pricing function for the Funds for all financial instruments.
Equity investments traded on a recognized securities exchange are valued at the official close price each day, if available. For equity investments traded on more than one exchange, the official close price on the exchange where the stock is primarily traded is used. Equity investments traded on a recognized exchange for which there were no sales on that day may be valued at the last available bid (long positions) or ask (short positions) price. Investments in open-end registered investment companies are valued at NAV each business day.
Securities and other assets and liabilities denominated in foreign currencies are translated into U.S. dollars using exchange rates determined as of the close of business on the NYSE. Forward foreign currency exchange contracts are valued at the mean between the bid and ask prices and are determined as of the close of business on the NYSE. Interpolated values are derived when the settlement date of the contract is an interim date for which quotations are not available.
Exchange-traded options are valued at the mean between the last bid and ask prices at the close of the options market in which the options trade. An exchange-traded option for which there is no mean price is valued at the last bid (long positions) or ask (short positions) price. If no bid or ask price is available, the prior day’s price will be used, unless it is determined that the prior day’s price no longer reflects the fair value of the option. Over-the-counter (“OTC”) options are valued by an independent pricing service using a mathematical model, which incorporates a number of market data factors, such as the trades and prices of the underlying instruments.
| | | | | | |
| | | BLACKROCK FUNDS | | MARCH 31, 2015 | | 77 |
| | |
| Notes to Financial Statements (continued) | | |
The Funds value their investments in BlackRock Liquidity Series, LLC, Money Market Series (the “Money Market Series”) at fair value, which is ordinarily based upon their pro rata ownership in the underlying fund’s net assets. The Money Market Series seeks current income consistent with maintaining liquidity and preserving capital. Although the Money Market Series is not registered under the 1940 Act, its investments will follow the parameters of investments by a money market fund that is subject to Rule 2a-7 under the 1940 Act. Each Fund may withdraw up to 25% of its investment daily, although the manager of the Money Market Series, in its sole discretion, may permit an investor to withdraw more than 25% on any one day.
In the event that the application of these methods of valuation results in a price for an investment that is deemed not to be representative of the market value of such investment, or if a price is not available, the investment will be valued by the Global Valuation Committee, or its delegate, in accordance with a policy approved by the Board as reflecting fair value (“Fair Value Investments”). When determining the price for Fair Value Investments, the Global Valuation Committee, or its delegate, seeks to determine the price that each Fund might reasonably expect to receive or pay from the current sale or purchase of that asset or liability in an arm’s-length transaction. Fair value determinations shall be based upon all available factors that the Global Valuation Committee, or its delegate, deems relevant consistent with the principles of fair value measurement, which include the market approach, income approach and/or in the case of recent investments, the cost approach, as appropriate. The market approach generally consists of using comparable market transactions. The income approach generally is used to discount future cash flows to present value and is adjusted for liquidity as appropriate. These factors include but are not limited to: (i) attributes specific to the investment or asset; (ii) the principal market for the investment or asset; (iii) the customary participants in the principal market for the investment or asset; (iv) data assumptions by market participants for the investment or asset, if reasonably available; (v) quoted prices for similar investments or assets in active markets; and (vi) other factors, such as future cash flows, interest rates, yield curves, volatilities, prepayment speeds, loss severities, credit risks, recovery rates, liquidation amounts and/or default rates. Due to the inherent uncertainty of valuations of such investments, the fair values may differ from the values that would have been used had an active market existed. The Global Valuation Committee, or its delegate, employs various methods for calibrating valuation approaches for investments where an active market does not exist, including regular due diligence of the Funds’ pricing vendors, regular reviews of key inputs and assumptions, transactional back-testing or disposition analysis to compare unrealized gains and losses to realized gains and losses, reviews of missing or stale prices and large movements in market values and reviews of any market related activity. The pricing of all Fair Value Investments is subsequently reported to the Board or a committee thereof on a quarterly basis.
Generally, trading in foreign instruments is substantially completed each day at various times prior to the close of business on the NYSE. Occasionally, events affecting the values of such instruments may occur between the foreign market close and the close of business on the NYSE that may not be reflected in the computation of each Fund’s net assets. If events (e.g., a company announcement, market volatility or a natural disaster) occur during such periods that are expected to materially affect the value of such instruments, those instruments may be Fair Value Investments and be valued at their fair value, as determined in good faith by the Global Valuation Committee, or its delegate, using a pricing service and/or policies approved by the Board. Each business day, the Funds use a pricing service to assist with the valuation of certain foreign exchange-traded equity securities and foreign exchange-traded and OTC options (the “Systematic Fair Value Price”). Using current market factors, the Systematic Fair Value Price is designed to value such foreign securities and foreign options at fair value as of the close of business on the NYSE, which follows the close of the local markets.
Foreign Currency: Each Fund’s books and records are maintained in U.S. dollars. Purchases and sales of investment securities are recorded at the rates of exchange prevailing on the respective dates of such transactions. Generally, when the U.S. dollar rises in value against a foreign currency, each Fund’s investments denominated in that currency will lose value because that currency is worth fewer U.S. dollars; the opposite effect occurs if the U.S. dollar falls in relative value.
Each Fund does not isolate the portion of the results of operations arising as a result of changes in the foreign exchange rates from the changes in the market prices of investments held or sold for financial reporting purposes. Accordingly, the effects of changes in foreign currency exchange rates on investments are not segregated in the Statements of Operations from the effects of changes in market prices of those investments, but are included as a component of net realized and unrealized gain (loss) from investments. Each Fund reports realized currency gains (losses) on foreign currency related transactions as components of net realized gain (loss) for financial reporting purposes, whereas such components are generally treated as ordinary income for federal income tax purposes.
Segregation and Collateralization: In cases where a Fund enters into certain investments (e.g., forward foreign currency exchange contracts and options written) that would be “senior securities” for 1940 Act purposes, a Fund may segregate or designate on its books and records cash or liquid securities having a market value at least equal to the amount of a Fund’s future obligations under such investments. Doing so allows the investment to be excluded from treatment as a “senior security.” Furthermore, if required by an exchange or counterparty agreement, the Funds may be required to deliver/deposit cash and/or securities to/with an exchange, or broker-dealer or custodian as collateral for certain investments or obligations.
Investment Transactions and Investment Income: For financial reporting purposes, investment transactions are recorded on the dates the transactions are entered into (the trade dates). Realized gains and losses on investment transactions are determined on the identified cost basis. Dividend income is recorded on the ex-dividend date. Dividends from foreign securities where the ex-dividend date may have passed are subsequently recorded when the Funds are informed of the ex-dividend date. Under the applicable foreign tax laws, a withholding tax at various rates may be imposed on capital
| | | | | | |
| 78 | | BLACKROCK FUNDS | | MARCH 31, 2015 | | |
| | |
| Notes to Financial Statements (continued) | | |
gains, dividends and interest. Upon notification from issuers, some of the dividend income received from a real estate investment trust may be redesignated as a reduction of cost of the related investment and/or realized gain. Income, expenses and realized and unrealized gains and losses are allocated daily to each class based on its relative net assets.
Distributions: Distributions paid by the Funds are recorded on the ex-dividend dates. The character and timing of distributions are determined in accordance with federal income tax regulations, which may differ from U.S. GAAP.
Recent Accounting Standard: In June 2014, the Financial Accounting Standards Board issued guidance to improve the financial reporting of reverse repurchase agreements and other similar transactions. The guidance will require expanded disclosure for entities that enter into reverse repurchase agreements and similar transactions accounted for as secured borrowings. It is effective for financial statements with fiscal years beginning on or after December 15, 2014 and for interim periods beginning after March 15, 2015. Management is evaluating the impact, if any, of this guidance on the Funds’ financial statement disclosures.
Other: Expenses directly related to a Fund or its classes are charged to that Fund or the applicable class. Other operating expenses shared by several funds are prorated among those funds on the basis of relative net assets or other appropriate methods. Expenses directly related to the Funds and other shared expenses prorated to the Funds are allocated daily to each class based on its relative net assets or other appropriate methods.
The Funds have an arrangement with their custodian whereby fees may be reduced by credits earned on uninvested cash balances, which, if applicable, are shown as fees paid indirectly in the Statements of Operations. The custodian imposes fees on overdrawn cash balances, which can be offset by accumulated credits earned or may result in additional custody charges.
3. Securities and Other Investments:
Preferred Stock: Each Fund may invest in preferred stock. Preferred stock has a preference over common stock in liquidation (and generally in receiving dividends as well) but is subordinated to the liabilities of the issuer in all respects. As a general rule, the market value of preferred stock with a fixed dividend rate and no conversion element varies inversely with interest rates and perceived credit risk, while the market price of convertible preferred stock generally also reflects some element of conversion value. Because preferred stock is junior to debt securities and other obligations of the issuer, deterioration in the credit quality of the issuer will cause greater changes in the value of a preferred stock than in a more senior debt security with similar stated yield characteristics. Unlike interest payments on debt securities, preferred stock dividends are payable only if declared by the issuer’s board of directors. Preferred stock also may be subject to optional or mandatory redemption provisions.
Securities Lending: Each Fund may lend its securities to approved borrowers, such as brokers, dealers and other financial institutions. The borrower pledges and maintains with the Funds collateral consisting of cash, an irrevocable letter of credit issued by a bank, or securities issued or guaranteed by the U.S. Government. The initial collateral received by each Fund is required to have a value of at least 102% of the current value of the loaned securities for securities traded on U.S. exchanges and a value of at least 105% for all other securities. The collateral is maintained thereafter, at a value equal to at least 100% of the current market value of the securities on loan. The market value of the loaned securities is determined at the close of each business day of the Fund and any additional required collateral is delivered to the Fund on the next business day. During the term of the loan, each Fund is entitled to all distributions made on or in respect of the loaned securities. Loans of securities are terminable at any time and the borrower, after notice, is required to return borrowed securities within the standard time period for settlement of securities transactions.
The market value of securities on loan and the value of the related collateral are shown separately in the Statements of Assets and Liabilities as a component of investments at value — unaffiliated, and collateral on securities loaned at value, respectively. As of March 31, 2015, any securities on loan were collateralized by cash. The cash collateral invested by the securities lending agent, BlackRock Investment Management, LLC (“BIM”), if any, is disclosed in the Schedules of Investments.
Securities lending transactions are entered into by the Funds under Master Securities Lending Agreements (each, an “MSLA”) which provide the right, in the event of default (including bankruptcy or insolvency), for the non-defaulting party to liquidate the collateral and calculate a net exposure to the defaulting party or request additional collateral. In the event that a borrower defaults, each Fund, as lender, would offset the market value of the collateral received against the market value of the securities loaned. When the value of the collateral is greater than that of the market value of the securities loaned, the lender is left with a net amount payable to the defaulting party. However, bankruptcy or insolvency laws of a particular jurisdiction may impose restrictions on or prohibitions against such a right of offset in the event of an MSLA counterparty’s bankruptcy or insolvency. Under the MSLA, the borrower can resell or re-pledge the loaned securities, and the Funds can reinvest cash collateral, or, upon an event of default, resell or re-pledge the collateral.
| | | | | | |
| | | BLACKROCK FUNDS | | MARCH 31, 2015 | | 79 |
| | |
| Notes to Financial Statements (continued) | | |
As of March 31, 2015 the following tables are a summary of the Funds’ securities lending agreements by counterparty which are subject to offset under an MSLA:
| | | | | | | | | | | | |
| Global Opportunities | | | | | | | | | |
| Counterparty | | Securities Loaned
at Value | | | Cash Collateral
Received1 | | | Net
Amount | |
Goldman Sachs & Co | | $ | 1,385,514 | | | $ | (1,385,514 | ) | | | — | |
JP Morgan Securities LLC | | | 558,261 | | | | (558,261 | ) | | | — | |
Morgan Stanley | | | 3,490 | | | | (3,490 | ) | | | — | |
| | | | |
Total | | $ | 1,947,265 | | | $ | (1,947,265 | ) | | | — | |
| | | | |
| | | | | | | | | | | | |
| Health Sciences Opportunities | | | | | | | | | |
| Counterparty | | Securities Loaned
at Value | | | Cash Collateral
Received1 | | | Net
Amount | |
Credit Suisse Securities (USA) LLC | | $ | 379,245 | | | $ | (379,245 | ) | | | — | |
Goldman Sachs & Co | | | 3,878,744 | | | | (3,878,744 | ) | | | — | |
Merrill Lynch, Pierce, Fenner & Smith, Inc | | | 1,324,016 | | | | (1,324,016 | ) | | | — | |
Morgan Stanley | | | 1,461,500 | | | | (1,461,500 | ) | | | — | |
| | | | |
Total | | $ | 7,043,505 | | | $ | (7,043,505 | ) | | | — | |
| | | | |
| | | | | | | | | | | | |
| International Opportunities | | | | | | | | | |
| Counterparty | | Securities Loaned
at Value | | | Cash Collateral
Received1 | | | Net
Amount | |
Goldman Sachs & Co | | $ | 1,334,135 | | | $ | (1,334,135 | ) | | | — | |
| | | | |
| | | | | | | | | | | | |
| Science & Technology Opportunities | | | | | | | | | |
| Counterparty | | Securities Loaned
at Value | | | Cash Collateral
Received1 | | | Net
Amount | |
Merrill Lynch, Pierce, Fenner & Smith, Inc | | $ | 24,817 | | | $ | (24,817 | ) | | | — | |
| | | | |
| | | | | | | | | | | | |
| U.S. Opportunities | | | | | | | | | |
| Counterparty | | Securities Loaned
at Value | | | Cash Collateral
Received1 | | | Net
Amount | |
Goldman Sachs & Co | | $ | 4,219,857 | | | $ | (4,219,857 | ) | | | — | |
Morgan Stanley | | | 210,173 | | | | (210,173 | ) | | | — | |
| | | | |
Total | | $ | 4,430,030 | | | $ | (4,430,030 | ) | | | — | |
| | | | |
| | 1 | | Collateral with a value of $1,974,042, $7,494,299, $1,430,717, $26,200 and $4,470,214 has been received in connection with securities lending agreements for Global Opportunities, Health Sciences Opportunities, International Opportunities, Science & Technology Opportunities and U.S. Opportunities, respectively. Collateral received in excess of the value of securities loaned from the individual counterparty is not shown for financial reporting purposes. |
The risks of securities lending include the risk that the borrower may not provide additional collateral when required or may not return the securities when due. To mitigate these risks, the Funds benefit from a borrower default indemnity provided by BIM. BIM’s indemnity allows for full replacement of the securities loaned if the collateral received does not cover the value on the securities loaned in the event of borrower default. Each Fund could suffer a loss if the value of an investment purchased with cash collateral falls below the market value of loaned securities or if the value of an investment purchased with cash collateral falls below the value of the original cash collateral received.
4. Derivative Financial Instruments:
The Funds engage in various portfolio investment strategies using derivative contracts both to increase the returns of the Funds and/or to economically manage their exposure to certain risks such as equity risk or foreign currency exchange rate risk. These contracts may be transacted on an exchange or OTC.
| | | | | | |
| 80 | | BLACKROCK FUNDS | | MARCH 31, 2015 | | |
| | |
| Notes to Financial Statements (continued) | | |
Forward Foreign Currency Exchange Contracts: Certain Funds enter into forward foreign currency exchange contracts as an economic hedge against either specific transactions or portfolio instruments or to obtain exposure to, or hedge exposure away from, foreign currencies (foreign currency exchange rate risk). A forward foreign currency exchange contract is an agreement between two parties to buy and sell a currency at a set exchange rate on a future date. Forward foreign currency exchange contracts, when used by the Funds, help to manage the overall exposure to the currencies in which some of the investments held by the Funds are denominated. The contract is marked-to-market daily and the change in market value is recorded by the Funds as an unrealized gain or loss. When the contract is closed, the Funds record a realized gain or loss equal to the difference between the value at the time it was opened and the value at the time it was closed. The use of forward foreign currency exchange contracts involves the risk that the value of a forward foreign currency exchange contract changes unfavorably due to movements in the value of the referenced foreign currencies.
Options: Certain Funds purchase and write call and put options to increase or decrease their exposure to underlying instruments (including equity risk) and/or in the case of options written, to generate gains from options premiums. A call option gives the purchaser (holder) of the option the right (but not the obligation) to buy, and obligates the seller (writer) to sell (when the option is exercised) the underlying instrument at the exercise or strike price at any time or at a specified time during the option period. A put option gives the holder the right to sell and obligates the writer to buy the underlying instrument at the exercise or strike price at any time or at a specified time during the option period. When a Fund purchases (writes) an option, an amount equal to the premium paid (received) by a Fund is reflected as an asset (liability). The amount of the asset (liability) is subsequently marked-to-market to reflect the current market value of the option purchased (written). When an instrument is purchased or sold through an exercise of an option, the related premium paid (or received) is added to (or deducted from) the basis of the instrument acquired or deducted from (or added to) the proceeds of the instrument sold. When an option expires (or a Fund enters into a closing transaction), a Fund realizes a gain or loss on the option to the extent of the premiums received or paid (or gain or loss to the extent the cost of the closing transaction exceeds the premiums received or paid). When a Fund writes a call option, such option is “covered,” meaning that a Fund holds the underlying instrument subject to being called by the option counterparty. When a Fund writes a put option, such option is covered by cash in an amount sufficient to cover the obligation.
In purchasing and writing options, a Fund bears the risk of an unfavorable change in the value of the underlying instrument or the risk that a Fund may not be able to enter into a closing transaction due to an illiquid market. Exercise of a written option could result in a Fund purchasing or selling a security when it otherwise would not, or at a price different from the current market value.
For the six months ended March 31, 2015, transactions in options written were as follows:
| | | | | | | | |
| | | Health Sciences Opportunities | |
| | | Puts | |
| | | Contracts | | | Premiums
Received | |
| | | | |
Outstanding options, beginning of period | | | — | | | | — | |
Options written | | | 2,736 | | | $ | 624,562 | |
Options expired | | | (1,530 | ) | | | (285,157 | ) |
| | | | |
Outstanding options, end of period | | | 1,206 | | | $ | 339,405 | |
| | | | |
| | | | | | | | |
| | | Science & Technology Opportunities | |
| | | Calls | |
| | | Contracts | | | Premiums
Received | |
| | | | |
Outstanding options, beginning of period | | | — | | | | — | |
Options written | | | 2,967 | | | $ | 314,897 | |
Options closed | | | (536 | ) | | | (58,753 | ) |
| | | | |
Outstanding options, end of period | | | 2,431 | | | $ | 256,144 | |
| | | | |
As of March 31, 2015, the value of Science & Technology Opportunities securities subject to covered call options written was $17,064,741.
| | | | | | |
| | | BLACKROCK FUNDS | | MARCH 31, 2015 | | 81 |
| | |
| Notes to Financial Statements (continued) | | |
The following is a summary of the Funds’ derivative financial instruments categorized by risk exposure:
| | | | | | | | | | | | | | | | | | | | |
| Fair Values of Derivative Financial Instruments as of March 31, 2015 | |
| | | | | Global
Opportunities | | Health Sciences Opportunities | |
| | | | | Value | |
| | | Statements of Assets and Liabilities Location | | Derivative
Assets | | | Derivative
Liabilities | | | | | Derivative
Assets | | | Derivative
Liabilities | |
Foreign currency exchange contracts | | Unrealized appreciation/depreciation on forward foreign currency exchange contracts | | $ | 1,178,015 | | | $ | 940,698 | | | | | $ | 17,983,614 | | | $ | 8,136,893 | |
| | | |
Equity contracts | | Options written at value | | | — | | | | — | | | | | | — | | | | 144,838 | |
| | | |
Total | | | | $ | 1,178,015 | | | $ | 940,698 | | | | | $ | 17,983,614 | | | $ | 8,281,731 | |
| | | |
| | | | | | | | | | | | | | | | | | | | |
| Fair Values of Derivative Financial Instruments as of March 31, 2015 | |
| | | | | International
Opportunities | | Science &
Technology
Opportunities | |
| | | | | Value | |
| | | Statements of Assets and Liabilities Location | | Derivative
Assets | | | Derivative
Liabilities | | | | | Derivative
Assets | | | Derivative
Liabilities | |
Foreign currency exchange contracts | | Unrealized appreciation/depreciation on forward foreign currency exchange contracts | | $ | 12,130,410 | | | $ | 13,301,833 | | | | | $ | 154,316 | | | $ | 58,027 | |
| | | |
Equity contracts | | Options written at value | | | — | | | | — | | | | | | — | | | | 183,462 | |
| | | |
Total | | | | $ | 12,130,410 | | | $ | 13,301,833 | | | | | $ | 154,316 | | | $ | 241,489 | |
| | | |
| | | | | | | | | | | | | | | | | | |
The Effect of Derivative Financial Instruments in the Statements of Operations Six Months Ended March 31, 2015 | |
| | | Net Realized Gain (Loss) from | | | | | Net Change in Unrealized Appreciation/Depreciation on | |
| | | Global
Opportunities | | | Health Sciences
Opportunities | | | | | Global Opportunities | | | Health Sciences
Opportunities | |
Foreign currency exchange contracts: | | | | | | | | | | | | | | | | | | |
Foreign currency transactions/translations | | $ | 1,760,137 | | | $ | 5,081,351 | | | | | $ | (772,843 | ) | | $ | (460,506 | ) |
Equity contracts: | | | | | | | | | | | | | | | | | | |
Options | | | — | | | | 285,157 | | | | | | — | | | | 194,567 | |
Total | | $ | 1,760,137 | | | $ | 5,366,508 | | | | | $ | (772,843 | ) | | $ | (265,939 | ) |
| | | | | | | | | | | | | | | | | | |
| | | | | | | | | | | | | | | | | | |
The Effect of Derivative Financial Instruments in the Statements of Operations Six Months Ended March 31, 2015 | |
| | | Net Realized Gain (Loss) from | | | | | Net Change in Unrealized Appreciation/Depreciation on | |
| | | International
Opportunities | | | Science &
Technology
Opportunities | | | | | International
Opportunities | | | Science &
Technology
Opportunities | |
Foreign currency exchange contracts: | | | | | | | | | | | | | | | | | | |
Foreign currency transactions/translations | | $ | 7,508,920 | | | $ | 361,748 | | | | | $ | (9,828,980 | ) | | $ | (357,053 | ) |
Equity contracts: | | | | | | | | | | | | | | | | | | |
Options | | | — | | | | 41,146 | | | | | | — | | | | 72,682 | |
Total | | $ | 7,508,920 | | | $ | 402,894 | | | | | $ | (9,828,980 | ) | | $ | (284,371 | ) |
| | | | | | | | | | | | | | | | | | |
| | | | | | | | | | | | | | | | | | | | | | | | | | | | | | |
For the six months ended March 31, 2015, the average quarterly balances of outstanding derivative financial instruments were as follows: | |
| | | Global
Opportunities | | | | | | Health Sciences
Opportunities | | | | | | | | International
Opportunities | | | | | | Science & Technology Opportunities | |
Forward foreign currency exchange contracts: | | | | | | | | | | | | | | | | | | | | | | | | | | | | | | |
Average amounts purchased - in USD | | $ | 31,217,559 | | | | | | | $ | 241,284,843 | | | | | | | | | $ | 351,255,505 | | | | | | | $ | 13,016,287 | |
Average amounts sold - in USD | | $ | 23,594,510 | | | | | | | $ | 53,111,463 | | | | | | | | | $ | 360,518,316 | | | | | | | $ | 2,119,038 | |
Options: | | | | | | | | | | | | | | | | | | | | | | | | | | | | | | |
Average notional value of option contracts written | | | — | | | | | | | $ | 72,419 | | | | | | | | | | — | | | | | | | $ | 91,731 | |
Counterparty Credit Risk: A derivative contract may suffer a mark-to-market loss if the value of the contract decreases due to an unfavorable change in the market rates or values of the underlying instrument. Losses can also occur if the counterparty does not perform under the contract.
| | | | | | |
| 82 | | BLACKROCK FUNDS | | MARCH 31, 2015 | | |
| | |
| Notes to Financial Statements (continued) | | |
A Fund’s risk of loss from counterparty credit risk on OTC derivatives is generally limited to the aggregate unrealized gain less the value of any collateral held by such Fund. For OTC options purchased, each Fund bears the risk of loss of the amount of the premiums paid plus the positive change in market values net of any collateral held by such Fund should the counterparty fail to perform under the contracts. Options written by the Funds do not typically give rise to counterparty credit risk, as options written generally obligate the Funds, and not the counterparty, to perform.
With exchange-traded purchased options, there is less counterparty credit risk to the Funds since the exchange or clearinghouse, as counterparty to such instruments, guarantees against a possible default. The clearinghouse stands between the buyer and the seller of the contract; therefore, credit risk is limited to failure of the clearinghouse. While offset rights may exist under applicable law, the Funds do not have a contractual right of offset against a clearing broker or clearinghouse in the event of a default (including the bankruptcy or insolvency) of the clearing broker or clearinghouse.
In order to better define its contractual rights and to secure rights that will help the Funds mitigate their counterparty risk, a Fund may enter into an International Swaps and Derivatives Association, Inc. Master Agreement (“ISDA Master Agreement”) or similar agreement with its counterparties. An ISDA Master Agreement is a bilateral agreement between each Fund and a counterparty that governs certain OTC derivatives and typically contains, among other things, collateral posting terms and netting provisions in the event of a default and/or termination event. Under an ISDA Master Agreement, each Fund may, under certain circumstances, offset with the counterparty certain derivative financial instruments’ payables and/or receivables with collateral held and/or posted and create one single net payment. The provisions of the ISDA Master Agreement typically permit a single net payment in the event of default including the bankruptcy or insolvency of the counterparty. Bankruptcy or insolvency laws of a particular jurisdiction may restrict or prohibit the right of offset in bankruptcy, insolvency or other events. In addition, certain ISDA Master Agreements allow counterparties to terminate derivative contracts prior to maturity in the event a Fund’s net assets decline by a stated percentage or a Fund fails to meet the terms of its ISDA Master Agreements, which would cause a Fund to accelerate payment of any net liability owed to the counterparty.
Collateral Requirements: For derivatives traded under an ISDA Master Agreement, the collateral requirements are typically calculated by netting the mark-to-market amount for each transaction under such agreement and comparing that amount to the value of any collateral currently pledged by a Fund and the counterparty.
Cash collateral that has been pledged to cover obligations of the Funds and cash collateral received from the counterparty, if any, is reported separately on the Statements of Assets and Liabilities as cash pledged as collateral and cash received as collateral, respectively. Non-cash collateral pledged by the Fund, if any, is noted in the Schedules of Investments. Generally, the amount of collateral due from or to a party has to exceed a minimum transfer amount threshold (typically either $250,000 or $500,000) before a transfer is required, which is determined at the close of business of the Funds. Any additional required collateral is delivered to/pledged by the Funds on the next business day. Typically, the Funds and counterparties are not permitted to sell, re-pledge or use the collateral they receive. To the extent amounts due to the Funds from its counterparties are not fully collateralized, the Funds bear the risk of loss from counterparty non-performance. Likewise, to the extent the Funds have delivered collateral to a counterparty and stand ready to perform under the terms of its agreement with such counterparty, the Funds bear the risk of loss from a counterparty in the amount of the value of the collateral in the event the counterparty fails to return such collateral.
For financial reporting purposes, the Funds do not offset derivative assets and derivative liabilities that are subject to netting arrangements, if any, in the Statements of Assets and Liabilities.
As of March 31, 2015, the Funds’ derivative assets and liabilities (by type) are as follows:
| | | | | | | | | | | | | | | | | | |
| | | | | | | | | | | | | | | | | | | |
| | | Global Opportunities | | | | | Health Sciences Opportunities | |
| | | Assets | | | Liabilities | | | | | Assets | | | Liabilities | |
Derivative Financial Instruments: | | | | | | | | | | | | | | | | | | |
Forward foreign currency exchange contracts. | | | $1,178,015 | | | | $940,698 | | | | | | $17,983,614 | | | | $8,136,893 | |
Options | | | — | | | | — | | | | | | — | | | | 144,838 | |
Total derivative assets and liabilities in the Statements of Assets and Liabilities. | | | $1,178,015 | | | | $940,698 | | | | | | $17,983,614 | | | | $8,281,731 | |
Derivatives not subject to a Master Netting Agreement or similar agreement (“MNA”) | | | — | | | | — | | | | | | — | | | | (144,838 | ) |
Total derivative assets and liabilities subject to an MNA | | | $1,178,015 | | | | $940,698 | | | | | | $17,983,614 | | | | $8,136,893 | |
| | | | | | |
| | | BLACKROCK FUNDS | | MARCH 31, 2015 | | 83 |
| | |
| Notes to Financial Statements (continued) | | |
| | | | | | | | | | | | | | | | |
| | | International | | | Science & Technology | |
| | | Opportunities | | | Opportunities | |
| | | Assets | | | Liabilities | | | Assets | | | Liabilities | |
Derivative Financial Instruments: | | | | | | | | | | | | | | | | |
Forward foreign currency exchange contracts. | | $ | 12,130,410 | | | $ | 13,301,833 | | | $ | 154,316 | | | $ | 58,027 | |
Options | | | — | | | | — | | | | — | | | | 183,462 | |
Total derivative assets and liabilities in the Statements of Assets and Liabilities | | $ | 12,130,410 | | | $ | 13,301,833 | | | $ | 154,316 | | | $ | 241,489 | |
Derivatives not subject to an MNA | | | — | | | | — | | | | — | | | | (183,462 | ) |
Total derivative assets and liabilities subject to an MNA | | $ | 12,130,410 | | | $ | 13,301,833 | | | $ | 154,316 | | | $ | 58,027 | |
As of March 31, 2015, the following tables present the Funds’ derivative assets and liabilities by counterparty net of amounts available for offset under an MNA and net of the related collateral received and pledged by the Funds:
| | | | | | | | | | | | | | | | | | | | |
| Global Opportunities | | | | | | | | | | | | | | | |
| Counterparty | | Derivative Assets
Subject to an MNA by
Counterparty | | | Derivatives Available
for Offset1 | | | Non-cash
Collateral
Received | | | Cash
Collateral
Received | | | Net Amount of
Derivative Assets2 | |
The Bank of New York Mellon | | $ | 2,018 | | | $ | (2,018 | ) | | | — | | | | — | | | | — | |
BNP Paribas S.A | | | 9,458 | | | | (9,458 | ) | | | — | | | | — | | | | — | |
Citibank N.A | | | 1,188 | | | | (1,188 | ) | | | — | | | | — | | | | — | |
Goldman Sachs International | | | 672,940 | | | | (138,737 | ) | | | — | | | | — | | | $ | 534,203 | |
HSBC Bank PLC | | | 48,657 | | | | — | | | | — | | | | — | | | | 48,657 | |
Morgan Stanley Capital Services LLC | | | 226,951 | | | | (225,343 | ) | | | — | | | | — | | | | 1,608 | |
Royal Bank of Canada | | | 85,740 | | | | (85,740 | ) | | | — | | | | — | | | | — | |
State Street Bank and Trust Co | | | 72,033 | | | | (6,014 | ) | | | — | | | | — | | | | 66,019 | |
TD Securities, Inc | | | 25,181 | | | | (25,181 | ) | | | — | | | | — | | | | — | |
UBS AG | | | 33,849 | | | | (33,849 | ) | | | — | | | | — | | | | — | |
| | | | |
Total | | $ | 1,178,015 | | | $ | (527,528 | ) | | | — | | | | — | | | $ | 650,487 | |
| | | | |
| | | | | | | | | | | | | | | | | | | | |
| Counterparty | | Derivative Liabilities
Subject to an MNA by
Counterparty | | | Derivatives Available
for Offset1 | | | Non-cash
Collateral
Pledged | | | Cash
Collateral
Pledged | | | Net Amount of
Derivative Liabilities3 | |
Bank of America N.A | | $ | 2,026 | | | | — | | | | — | | | | — | | | $ | 2,026 | |
The Bank of New York Mellon | | | 19,167 | | | $ | (2,018 | ) | | | — | | | | — | | | | 17,149 | |
BNP Paribas S.A | | | 105,363 | | | | (9,458 | ) | | | — | | | | — | | | | 95,905 | |
Citibank N.A | | | 91,934 | | | | (1,188 | ) | | | — | | | | — | | | | 90,746 | |
Deutsche Bank AG | | | 18,304 | | | | — | | | | — | | | | — | | | | 18,304 | |
Goldman Sachs International | | | 138,737 | | | | (138,737 | ) | | | — | | | | — | | | | — | |
JPMorgan Chase Bank N.A | | | 13,741 | | | | — | | | | — | | | | — | | | | 13,741 | |
Morgan Stanley Capital Services LLC | | | 225,343 | | | | (225,343 | ) | | | — | | | | — | | | | — | |
Royal Bank of Canada | | | 179,679 | | | | (85,740 | ) | | | — | | | | — | | | | 93,939 | |
State Street Bank and Trust Co | | | 6,014 | | | | (6,014 | ) | | | — | | | | — | | | | — | |
TD Securities, Inc | | | 98,891 | | | | (25,181 | ) | | | — | | | | — | | | | 73,710 | |
UBS AG | | | 41,499 | | | | (33,849 | ) | | | — | | | | — | | | | 7,650 | |
| | | | |
Total | | $ | 940,698 | | | $ | (527,528 | ) | | | — | | | | — | | | $ | 413,170 | |
| | | | |
| | | | | | | | | | | | | | | | | | | | |
| Health Sciences Opportunities | | | | | | | | | | | | | | | |
| Counterparty | | Derivative Assets
Subject to an MNA by
Counterparty | | | Derivative Available
for Offset1 | | | Non-cash
Collateral
Received | | | Cash
Collateral
Received | | | Net Amount of
Derivative Assets2 | |
Bank of America N.A | | $ | 94,275 | | | | — | | | | — | | | | — | | | $ | 94,275 | |
Deutsche Bank AG | | | 1,241,890 | | | $ | (1,241,890 | ) | | | — | | | | — | | | | — | |
Goldman Sachs Bank USA | | | 119,318 | | | | — | | | | — | | | | — | | | | 119,318 | |
Morgan Stanley Capital Services LLC | | | 14,664,894 | | | | — | | | | — | | | | — | | | | 14,664,894 | |
Royal Bank of Canada | | | 1,725,016 | | | | — | | | | — | | | | — | | | | 1,725,016 | |
Royal Bank of Scotland PLC | | | 3,481 | | | | — | | | | — | | | | — | | | | 3,481 | |
UBS AG | | | 134,740 | | | | (134,740 | ) | | | — | | | | — | | | | — | |
| | | | |
Total | | $ | 17,983,614 | | | $ | (1,376,630 | ) | | | — | | | | — | | | $ | 16,606,984 | |
| | | | |
| | | | | | |
| 84 | | BLACKROCK FUNDS | | MARCH 31, 2015 | | |
| | |
| Notes to Financial Statements (continued) | | |
| | | | | | | | | | | | | | | | | | | | |
| Counterparty | | Derivative Liabilities
Subject to an MNA by
Counterparty | | | Derivative Available for
Offset1 | | | Non-cash
Collateral
Pledged | | | Cash
Collateral
Pledged | | | Net Amount of
Derivative Liabilities3 | |
Deutsche Bank AG | | $ | 7,299,309 | | | $ | (1,241,890 | ) | | | — | | | | — | | | $ | 6,057,419 | |
JPMorgan Chase Bank N.A | | | 67,622 | | | | — | | | | — | | | | — | | | | 67,622 | |
UBS AG | | | 769,962 | | | | (134,740 | ) | | | — | | | | — | | | | 635,222 | |
| | | | |
Total | | $ | 8,136,893 | | | $ | (1,376,630 | ) | | | — | | | | — | | | $ | 6,760,263 | |
| | | | |
| | | | | | | | | | | | | | | | | | | | |
| International Opportunities | | | | | | | | | | | | | | | |
| Counterparty | | Derivative Assets
Subject to an MNA by
Counterparty | | | Derivative Available for Offset1 | | | Non-cash
Collateral
Received | | | Cash
Collateral
Received | | | Net Amount of
Derivative Assets2 | |
Bank of America N.A | | $ | 1,366,193 | | | $ | (251,034 | ) | | | — | | | | — | | | $ | 1,115,159 | |
The Bank of New York Mellon | | | 173,025 | | | | (69,092 | ) | | | — | | | | — | | | | 103,933 | |
Barclays Bank PLC | | | 121,288 | | | | — | | | | — | | | | — | | | | 121,288 | |
BNP Paribas S.A | | | 67,070 | | | | (67,070 | ) | | | — | | | | — | | | | — | |
Citibank N.A | | | 116,935 | | | | (116,935 | ) | | | — | | | | — | | | | — | |
Deutsche Bank AG | | | 133,180 | | | | (133,180 | ) | | | — | | | | — | | | | — | |
Goldman Sachs International | | | 6,320,754 | | | | (3,192,998 | ) | | | — | | | | — | | | | 3,127,756 | |
JPMorgan Chase Bank N.A | | | 351,223 | | | | — | | | | — | | | | — | | | | 351,223 | |
Morgan Stanley Capital Services LLC | | | 1,906,175 | | | | (1,906,175 | ) | | | — | | | | — | | | | — | |
Royal Bank of Canada | | | 941,566 | | | | — | | | | — | | | | — | | | | 941,566 | |
Royal Bank of Scotland PLC | | | 24,388 | | | | (24,388 | ) | | | — | | | | — | | | | — | |
State Street Bank and Trust Co | | | 203,616 | | | | (203,616 | ) | | | — | | | | — | | | | — | |
TD Securities, Inc | | | 113,061 | | | | (113,061 | ) | | | — | | | | — | | | | — | |
UBS AG | | | 291,936 | | | | — | | | | — | | | | — | | | | 291,936 | |
| | | | |
Total | | $ | 12,130,410 | | | $ | (6,077,549 | ) | | | — | | | | — | | | $ | 6,052,861 | |
| | | | |
| | | | | | | | | | | | | | | | | | | | |
| Counterparty | | Derivative Liabilities
Subject to an MNA by
Counterparty | | | Derivative Available for Offset1 | | | Non-cash
Collateral
Pledged | | | Cash
Collateral
Pledged | | | Net Amount of
Derivative Liabilities3 | |
Bank of America N.A | | $ | 251,034 | | | $ | (251,034 | ) | | | — | | | | — | | | | — | |
The Bank of New York Mellon | | | 69,092 | | | | (69,092 | ) | | | — | | | | — | | | | — | |
BNP Paribas S.A | | | 256,141 | | | | (67,070 | ) | | | — | | | | — | | | $ | 189,071 | |
Citibank N.A | | | 1,047,536 | | | | (116,935 | ) | | | — | | | | — | | | | 930,601 | |
Deutsche Bank AG | | | 3,470,832 | | | | (133,180 | ) | | | — | | | | — | | | | 3,337,652 | |
Goldman Sachs International | | | 3,192,998 | | | | (3,192,998 | ) | | | — | | | | — | | | | — | |
HSBC Bank PLC | | | 703,266 | | | | — | | | | — | | | | — | | | | 703,266 | |
Morgan Stanley Capital Services LLC | | | 2,284,600 | | | | (1,906,175 | ) | | | — | | | | — | | | | 378,425 | |
Royal Bank of Scotland PLC | | | 64,504 | | | | (24,388 | ) | | | — | | | | — | | | | 40,116 | |
State Street Bank and Trust Co | | | 1,182,585 | | | | (203,616 | ) | | | — | | | | — | | | | 978,969 | |
TD Securities, Inc | | | 779,245 | | | | (113,061 | ) | | | — | | | | — | | | | 666,184 | |
| | | | |
Total | | $ | 13,301,833 | | | $ | (6,077,549 | ) | | | — | | | | — | | | $ | 7,224,284 | |
| | | | |
| | | | | | | | | | | | | | | | | | | | |
| Science & Technology Opportunities | | | | | | | | | | | | | | | |
| Counterparty | | Derivative Assets
Subject to an MNA by
Counterparty | | | Derivative Available for Offset1 | | | Non-cash
Collateral
Received | | | Cash
Collateral
Received | | | Net Amount of
Derivative Assets2 | |
Citibank N.A | | $ | 32 | | | | — | | | | — | | | | — | | | $ | 32 | |
Goldman Sachs Bank USA | | | 101 | | | | — | | | | — | | | | — | | | | 101 | |
Goldman Sachs International | | | 57,362 | | | | — | | | | — | | | | — | | | | 57,362 | |
Morgan Stanley Capital Services LLC | | | 84,467 | | | | — | | | | — | | | | — | | | | 84,467 | |
TD Securities, Inc | | | 12,354 | | | | — | | | | — | | | | — | | | | 12,354 | |
| | | | |
Total | | $ | 154,316 | | | | — | | | | — | | | | — | | | $ | 154,316 | |
| | | | |
| | | | | | | | | | | | | | | | | | | | |
| Counterparty | | Derivative Liabilities
Subject to an MNA by
Counterparty | | | Derivative Available for Offset1 | | | Non-cash
Collateral
Pledged | | | Cash
Collateral
Pledged | | | Net Amount of
Derivative Liabilities3 | |
HSBC Bank PLC | | $ | 58,027 | | | | — | | | | — | | | | — | | | $ | 58,027 | |
| | 1 | | The amount of derivatives available for offset is limited to the amount of derivative assets and/or liabilities that are subject to an MNA. |
| | 2 | | Net amount represents the net amount receivable from the counterparty in the event of default. |
| | 3 | | Net amount represents the net amount payable due to the counterparty in the event of default. |
5. Investment Advisory Agreement and Other Transactions with Affiliates:
The PNC Financial Services Group, Inc. is the largest stockholder and an affiliate of BlackRock, Inc. (“BlackRock”) for 1940 Act purposes.
| | | | | | |
| | | BLACKROCK FUNDS | | MARCH 31, 2015 | | 85 |
| | |
| Notes to Financial Statements (continued) | | |
The Trust, on behalf of the Funds, entered into an Investment Advisory Agreement with the Manager, the Funds’ investment advisor, an indirect, wholly owned subsidiary of BlackRock, to provide investment advisory services. The Manager is responsible for the management of each Fund’s portfolio and provides the necessary personnel, facilities, equipment and certain other services to the operations of each Fund. For such services, each Fund pays the Manager a monthly fee based on a percentage of each Fund’s average daily net assets at the following annual rates:
| | | | | | | | | | | | | | | | |
| | | First $1 Billion | | | $1 Billion - $2 Billion | | | $2 Billion - $3 Billion | | | Greater than $3 Billion | |
Global Opportunities and Science & Technology Opportunities | | | 0.900 | % | | | 0.850 | % | | | 0.800 | % | | | 0.750 | % |
Health Sciences Opportunities | | | 0.750 | % | | | 0.700 | % | | | 0.675 | % | | | 0.650 | % |
International Opportunities | | | 1.000 | % | | | 0.950 | % | | | 0.900 | % | | | 0.850 | % |
U.S. Opportunities | | | 1.100 | % | | | 1.050 | % | | | 1.025 | % | | | 1.000 | % |
Effective June 1, 2014, the Manager has contractually agreed to waive 0.10% of International Opportunities investment advisory fee until February 1, 2016. For the six months ended March 31, 2015, the amount waived was $654,478.
The Manager voluntarily agreed to waive its investment advisory fees by the amount of investment advisory fees each Fund pays to the Manager indirectly through its investment in affiliated money market funds. However, the Manager does not waive its investment advisory fees by the amount of investment advisory fees paid in connection with each Fund’s investment in other affiliated investment companies, if any. These amounts are included in fees waived by the Manager in the Statements of Operations. For the six months ended March 31, 2015, the amounts waived were as follows:
| | | | |
Global Opportunities | | $ | 1,078 | |
Health Sciences Opportunities | | $ | 39,085 | |
International Opportunities | | $ | 2,364 | |
Science & Technology Opportunities | | $ | 1,088 | |
U.S. Opportunities | | $ | 13,754 | |
The Trust, on behalf of the Funds, entered into a Distribution Agreement and a Distribution and Service Plan with BlackRock Investments, LLC (“BRIL”), an affiliate of the Manager. Pursuant to the Distribution and Service Plan and in accordance with Rule 12b-1 under the 1940 Act, each Fund pays BRIL ongoing service and distribution fees. The fees are accrued daily and paid monthly at annual rates based upon the average daily net assets of the relevant share class of each Fund as follows:
| | | | | | | | | | | | | | | | | | | | |
| | | Service | | | Investor A | | | Investor B | | | Investor C | | | Class R | |
Service Fee | | | 0.25 | % | | | 0.25 | % | | | 0.25 | % | | | 0.25 | % | | | 0.25 | % |
Distribution Fee | | | — | | | | — | | | | 0.75 | % | | | 0.75 | % | | | 0.25 | % |
Pursuant to sub-agreements with BRIL, broker-dealers and BRIL provide shareholder servicing and distribution services to each Fund. The ongoing service and/or distribution fee compensates BRIL and each broker-dealer for providing shareholder servicing and/or distribution related servicesto Service, Investor A, Investor B, Investor C and Class R shareholders.
For the six months ended March 31, 2015, the following table shows the class specific service and distribution fees borne directly by each class of each Fund:
| | | | | | | | | | | | | | | | | | | | | | | | |
| | | Service | | | Investor A | | | Investor B | | | Investor C | | | Class R | | | Total | |
Global Opportunities | | | — | | | $ | 232,809 | | | $ | 8,150 | | | $ | 247,315 | | | $ | 27,604 | | | $ | 515,878 | |
Health Sciences Opportunities | | $ | 41,811 | | | $ | 3,011,302 | | | $ | 107,617 | | | $ | 4,798,903 | | | $ | 236,790 | | | $ | 8,196,423 | |
International Opportunities | | $ | 34,978 | | | $ | 703,954 | | | $ | 13,292 | | | $ | 603,683 | | | | — | | | $ | 1,355,907 | |
Science & Technology Opportunities | | $ | 1,672 | | | $ | 157,912 | | | $ | 5,385 | | | $ | 170,067 | | | $ | 10,874 | | | $ | 345,910 | |
U.S. Opportunities | | $ | 86,194 | | | $ | 537,749 | | | $ | 51,993 | | | $ | 1,076,871 | | | | — | | | $ | 1,752,807 | |
Pursuant to written agreements, certain financial intermediaries, some of which may be affiliates, provide the Funds with sub-accounting, recordkeeping, sub-transfer agency and other administrative services with respect to sub-accounts they service. For these services, these entities receive an asset-based fee or an annual fee per shareholder account, which will vary depending on share class and/or net assets. For the six months ended March 31, 2015, the Funds paid the following amounts to affiliates of BlackRock in return for these services, which are included in transfer agent — class specific in the Statements of Operations:
| | | | | | | | | | | | | | | | | | | | |
| | | Institutional | | | Service | | | Investor A | | | Investor C | | | Total | |
Health Sciences Opportunities | | $ | 247 | | | $ | 87 | | | $ | 290 | | | $ | 48 | | | $ | 672 | |
International Opportunities | | $ | 101,964 | | | $ | 1,115 | | | $ | 6,369 | | | | — | | | $ | 109,448 | |
Science & Technology Opportunities | | $ | 6 | | | | — | | | $ | 2,101 | | | | — | | | $ | 2,107 | |
U.S. Opportunities | | $ | 43,217 | | | $ | 53 | | | $ | 4,834 | | | | — | | | $ | 48,104 | |
The Manager maintains a call center, which is responsible for providing certain shareholder services to the Funds, such as responding to shareholder inquiries and processing transactions based upon instructions from shareholders with respect to the subscription and redemption of Fund shares. For
| | | | | | |
| 86 | | BLACKROCK FUNDS | | MARCH 31, 2015 | | |
| | |
| Notes to Financial Statements (continued) | | |
the six months ended March 31, 2015, each Fund reimbursed the Manager the following amounts for costs incurred in running the call center, which are included in transfer agent — class specific in the Statements of Operations:
| | | | | | | | | | | | | | | | | | | | | | | | | | | | |
| | | Institutional | | | Service | | | Investor A | | | Investor B | | | Investor C | | | Class R | | | Total | |
Global Opportunities | | $ | 1,849 | | | | — | | | $ | 4,501 | | | $ | 280 | | | $ | 747 | | | $ | 31 | | | $ | 7,408 | |
Health Sciences Opportunities | | $ | 7,888 | | | $ | 92 | | | $ | 35,001 | | | $ | 1,622 | | | $ | 9,000 | | | $ | 446 | | | $ | 54,049 | |
International Opportunities | | $ | 2,262 | | | $ | 69 | | | $ | 10,273 | | | $ | 314 | | | $ | 2,363 | | | | — | | | $ | 15,281 | |
Science & Technology Opportunities | | $ | 4,293 | | | $ | 11 | | | $ | 5,138 | | | $ | 144 | | | $ | 1,543 | | | $ | 24 | | | $ | 11,153 | |
U.S. Opportunities | | $ | 828 | | | $ | 235 | | | $ | 9,628 | | | $ | 423 | | | $ | 1,508 | | | | — | | | $ | 12,622 | |
For the six months ended March 31, 2015, the following table shows the class specific transfer agent fees borne directly by each class of each Fund:
| | | | | | | | | | | | | | | | | | | | | | | | | | | | |
| | | Institutional | | | Service | | | Investor A | | | Investor B | | | Investor C | | | Class R | | | Total | |
Global Opportunities | | $ | 38,790 | | | | — | | | $ | 141,416 | | | $ | 4,172 | | | $ | 46,191 | | | $ | 13,560 | | | $ | 244,129 | |
Health Sciences Opportunities | | $ | 548,125 | | | $ | 19,620 | | | $ | 1,409,678 | | | $ | 21,080 | | | $ | 422,175 | | | $ | 68,375 | | | $ | 2,489,053 | |
International Opportunities | | $ | 462,990 | | | $ | 24,680 | | | $ | 650,704 | | | $ | 5,825 | | | $ | 121,878 | | | | — | | | $ | 1,266,077 | |
Science & Technology Opportunities | | $ | 59,199 | | | $ | 797 | | | $ | 150,991 | | | $ | 2,721 | | | $ | 54,788 | | | $ | 5,401 | | | $ | 273,897 | |
U.S. Opportunities | | $ | 558,792 | | | $ | 84,583 | | | $ | 390,590 | | | $ | 10,582 | | | $ | 147,538 | | | | — | | | $ | 1,192,085 | |
Effective January 1, 2015, the Trust, on behalf of the Funds, entered into an Administration Agreement with the Manager, an indirect, wholly-owned subsidiary of BlackRock, to provide administrative services. For these services, the Manager receives an administration fee computed daily and payable monthly, based on a percentage of the average daily net assets of the Funds. The administration fee, which is shown as administration in the Statements of Operations, is paid at the annual rates below.
| | | | |
| Average Daily Net Assets | | Administration Fee | |
First $500 Million. | | | 0.0425 | % |
$500 Million - $1 Billion | | | 0.0400 | % |
$1 Billion - $2 Billion | | | 0.0375 | % |
$2 Billion - $4 Billion | | | 0.0350 | % |
$4 Billion - $13 Billion | | | 0.0325 | % |
Greater than $13 Billion | | | 0.0300 | % |
In addition, the Manager charges each of the share classes an administration fee, which is shown as administration — class specific in the Statements of Operations, at an annual rate of 0.02% of the average daily net assets of each respective class.
Prior to January 1, 2015, BNY Mellon Investment Servicing (US) Inc. (“BNYMIS”) and the Manager acted as co-administrators for the Funds. For these services, the co-administrators received an administration fee computed daily and payable monthly to each administrator pursuant to separate fee arrangements, based on a percentage of the average daily net assets of each Fund. The combined administration fee, which is shown as administration in the Statements of Operations, was paid at the annual rates shown below. In addition, each of the share classes was charged an administration fee, which is shown as administration — class specific in the Statements of Operations, based on the following percentages of average daily net assets of each respective class:
| | | | | | | | |
| Average Daily Net Assets | | Administration Fee | | | Administration Fee —
Class Specific | |
First $500 Million. | | | 0.075 | % | | | 0.025 | % |
$500 Million - $1 Billion | | | 0.065 | % | | | 0.015 | % |
Greater than $1 Billion | | | 0.055 | % | | | 0.005 | % |
For the six months ended March 31, 2015, the Funds paid the following to the Manager in return for these services, which are included in administration and administration — class specific in the Statements of Operations:
| | | | |
Global Opportunities | | $ | 104,265 | |
Health Sciences Opportunities | | $ | 1,314,847 | |
International Opportunities | | $ | 409,226 | |
Science & Technology Opportunities | | $ | 73,516 | |
U.S. Opportunities | | $ | 503,909 | |
| | | | | | |
| | | BLACKROCK FUNDS | | MARCH 31, 2015 | | 87 |
| | |
| Notes to Financial Statements (continued) | | |
For the six months ended March 31, 2015, the following table shows the class specific administration fees borne directly by each class of each Fund:
| | | | | | | | | | | | | | | | | | | | | | | | | | | | |
| | | Institutional | | | Service | | | Investor A | | | Investor B | | | Investor C | | | Class R | | | Total | |
Global Opportunities | | $ | 7,260 | | | | — | | | $ | 20,988 | | | $ | 186 | | | $ | 5,578 | | | $ | 1,257 | | | $ | 35,269 | |
Health Sciences Opportunities | | $ | 123,189 | | | $ | 3,749 | | | $ | 194,197 | | | $ | 2,437 | | | $ | 97,362 | | | $ | 10,534 | | | $ | 431,468 | |
International Opportunities | | $ | 64,066 | | | $ | 3,171 | | | $ | 61,173 | | | $ | 303 | | | $ | 13,670 | | | | — | | | $ | 142,383 | |
Science & Technology Opportunities | | $ | 6,409 | | | $ | 151 | | | $ | 14,177 | | | $ | 122 | | | $ | 3,817 | | | $ | 489 | | | $ | 25,165 | |
U.S. Opportunities | | $ | 85,741 | | | $ | 8,229 | | | $ | 48,464 | | | $ | 1,175 | | | $ | 24,229 | | | | — | | | $ | 167,838 | |
BNYMIS and the Manager may have, at their discretion, voluntarily waived all or any portion of their administration fees for a Fund or a share class, which are included in administration fees waived – class specific in the Statements of Operations.
The Manager contractually agreed to waive and/or reimburse fees or expenses in order to limit expenses, excluding interest expense, dividend expense, tax expense, acquired fund fees and expenses and certain other fund expenses, which constitute extraordinary expenses not incurred in the ordinary course of the Funds’ business. The expense limitations as a percentage of average daily net assets are as follows:
| | | | | | | | | | | | | | | | | | | | |
| | | Global
Opportunities | | | Health Sciences
Opportunities | | | International
Opportunities | | | Science & Technology
Opportunities | | | U.S.
Opportunities | |
Institutional | | | 1.06 | % | | | N/A | | | | 1.24 | % | | | 1.29 | % | | | 0.91 | % |
Service | | | 1.70 | %2 | | | N/A | | | | 1.52 | % | | | 1.61 | % | | | 1.31 | % |
Investor A | | | 1.33 | % | | | N/A | | | | 1.52 | % | | | 1.61 | % | | | 1.31 | % |
Investor B | | | 2.18 | % | | | N/A | | | | 2.36 | % | | | 2.42 | % | | | 2.10 | % |
Investor C | | | 2.14 | % | | | N/A | | | | 2.29 | % | | | 2.49 | % | | | 2.07 | % |
Class R | | | 1.72 | % | | | 1.81 | %1 | | | 2.13 | %2 | | | 1.89 | % | | | 2.19 | %2 |
| | 1 | | The contractual expense limitation expired on January 31, 2015. |
| | 2 | | There were no shares outstanding as of March 31, 2015. |
The Manager has agreed not to reduce or discontinue this contractual waiver or reimbursement prior to February 1, 2016, unless approved by the Board, including a majority of the independent Trustees.
These amounts waived or reimbursed, are included in fees waived by the Manager, and shown as administration fees waived — class specific, transfer agent fees waived — class specific and transfer agent fees reimbursed — class specific, respectively, in the Statements of Operations. For the six months ended March 31, 2015, the amounts included in fees waived by the Manager were as follows:
| | | | |
Global Opportunities | | $ | 14,124 | |
U.S. Opportunities | | $ | 2,008,659 | |
Class specific expense waivers and reimbursements are as follows:
| | | | | | | | | | | | | | | | | | | | | | | | | | | | |
| Administration Fees Waived | | Institutional | | | Service | | | Investor A | | | Investor B | | | Investor C | | | Class R | | | Total | |
Global Opportunities | | $ | 7,260 | | | | — | | | $ | 20,988 | | | $ | 186 | | | $ | 5,578 | | | $ | 1,257 | | | $ | 35,269 | |
International Opportunities | | | — | | | | — | | | $ | 14,934 | | | $ | 303 | | | | — | | | | — | | | $ | 15,237 | |
Science & Technology Opportunities | | $ | 3,785 | | | | — | | | $ | 2,835 | | | $ | 106 | | | $ | 16 | | | $ | 79 | | | $ | 6,821 | |
U.S. Opportunities | | $ | 85,741 | | | $ | 8,229 | | | $ | 41,608 | | | $ | 1,098 | | | $ | 4,834 | | | | — | | | $ | 141,510 | |
| Transfer Agent Fees Waived | | Institutional | | | Service | | | Investor A | | | Investor B | | | Investor C | | | Class R | | | Total | |
Global Opportunities | | $ | 1,849 | | | | — | | | $ | 4,501 | | | $ | 280 | | | $ | 747 | | | $ | 31 | | | $ | 7,408 | |
International Opportunities | | | — | | | | — | | | $ | 1,308 | | | $ | 294 | | | | — | | | | — | | | $ | 1,602 | |
Science & Technology Opportunities | | $ | 1,157 | | | | — | | | $ | 362 | | | $ | 123 | | | | — | | | $ | 3 | | | $ | 1,645 | |
U.S. Opportunities | | $ | 828 | | | $ | 235 | | | $ | 8,172 | | | $ | 334 | | | | — | | | | — | | | $ | 9,569 | |
| Transfer Agent Fees Reimbursed | | Institutional | | | Service | | | Investor A | | | Investor B | | | Investor C | | | Class R | | | Total | |
Global Opportunities | | $ | 36,717 | | | | — | | | $ | 117,852 | | | $ | 2,897 | | | $ | 25,971 | | | $ | 4,496 | | | $ | 187,933 | |
International Opportunities | | | — | | | | — | | | $ | 845 | | | $ | 831 | | | | — | | | | — | | | $ | 1,676 | |
Science & Technology Opportunities | | $ | 426 | | | | — | | | $ | 169 | | | $ | 790 | | | | — | | | $ | 17 | | | $ | 1,402 | |
U.S. Opportunities | | $ | 557,944 | | | $ | 33,011 | | | $ | 71,379 | | | $ | 536 | | | | — | | | | — | | | $ | 662,870 | |
| | | | | | |
| 88 | | BLACKROCK FUNDS | | MARCH 31, 2015 | | |
| | |
| Notes to Financial Statements (continued) | | |
If during a Fund’s fiscal year the operating expenses of a share class, that at any time during the prior two fiscal years received a waiver or reimbursement from the Manager, are less than the expense limit for that share class, the Manager is entitled to be reimbursed by such share class up to the lesser of (a) the amount of fees waived or expenses reimbursed during those prior two fiscal years under the agreement and (b) the amount by which the expense limit for that share class exceeds the operating expenses of the share class for the current fiscal year, provided that: (1) the Fund, of which the share class is a part, has more than $50 million in assets for the fiscal year and (2) the Manager or an affiliate continues to serve as the Fund’s investment advisor or administrator. In the event the expense limit for a share class is changed subsequent to a fiscal year in which the Manager becomes entitled to reimbursement for fees waived or reimbursed, the amount available to reimburse the Manager shall be calculated by reference to the expense limit for that share class in effect at the time the Manager became entitled to receive such reimbursement, rather than the subsequently changed expense limit for that share class.
For the six months ended March 31, 2015, the Manager recouped the following Fund level and class specific waivers and/or reimbursements previously recorded by the Funds:
| | | | | | | | | | | | | | | | | | | | | | | | | | | | |
| | | Share Classes | |
| | | Institutional | | | Service | | | Investor A | | | Investor B | | | Investor C | | | Class R | | | Total | |
International Opportunities | | | — | | | $ | 213 | | | $ | 1,462 | | | | — | | | | — | | | | — | | | $ | 1,675 | |
Science & Technology Opportunities | | $ | 472 | | | $ | 449 | | | $ | 16,815 | | | $ | 10 | | | $ | 4,669 | | | $ | 1,007 | | | $ | 23,422 | |
U.S. Opportunities | | | — | | | | — | | | $ | 4,586 | | | | — | | | $ | 4,679 | | | | — | | | $ | 9,265 | |
On March 31, 2015, the Fund level and class specific waivers and/or reimbursements subject to possible future recoupment under the expense limitation agreement are as follows:
| | | | | | | | | | | | |
| | | Expiring September 30, | |
| | | 2015 | | | 2016 | | | 2017 | |
Global Opportunities | | | | | | | | | | | | |
Fund Level | | $ | 14,155 | | | $ | 6,998 | | | $ | 14,124 | |
Institutional | | $ | 91,262 | | | $ | 86,621 | | | $ | 45,826 | |
Investor A | | $ | 293,364 | | | $ | 267,938 | | | $ | 143,341 | |
Investor B | | $ | 359 | | | $ | 858 | | | $ | 3,363 | |
Investor C | | $ | 73,264 | | | $ | 53,906 | | | $ | 32,296 | |
Class R | | $ | 12,010 | | | $ | 12,490 | | | $ | 5,784 | |
International Opportunities | | | | | | | | | | | | |
Fund Level | | | — | | | | — | | | $ | 654,478 | |
Investor A | | | — | | | | — | | | $ | 17,087 | |
Investor B | | | — | | | | — | | | $ | 1,428 | |
Science & Technology Opportunities | | | | | | | | | | | | |
Institutional | | $ | 42,884 | | | $ | 32,859 | | | $ | 5,368 | |
Investor A | | | — | | | $ | 21,780 | | | $ | 3,366 | |
Investor B | | | — | | | $ | 314 | | | $ | 1,019 | |
Investor C | | | — | | | | — | | | $ | 16 | |
Class R | | | — | | | $ | 420 | | | $ | 99 | |
U.S. Opportunities | | | | | | | | | | | | |
Fund Level | | $ | 2,794,164 | | | $ | 3,593,356 | | | $ | 2,008,659 | |
Institutional | | $ | 1,866,300 | | | $ | 1,207,231 | | | $ | 644,513 | |
Service | | $ | 414 | | | $ | 38,565 | | | $ | 41,475 | |
Investor A | | $ | 866 | | | $ | 171,493 | | | $ | 121,159 | |
Investor B | | $ | 180 | | | $ | 2,743 | | | $ | 1,968 | |
Investor C | | | — | | | $ | 11,666 | | | $ | 4,834 | |
For the six months ended March 31, 2015, affiliates earned underwriting discounts, direct commissions and dealer concessions on sales of each Fund’s Investor A Shares as follows:
| | | | |
Global Opportunities | | $ | 1,509 | |
Health Sciences Opportunities | | $ | 312,918 | |
International Opportunities | | $ | 13,200 | |
Science & Technology Opportunities | | $ | 8,428 | |
U.S. Opportunities | | $ | 21,689 | |
| | | | | | |
| | | BLACKROCK FUNDS | | MARCH 31, 2015 | | 89 |
| | |
| Notes to Financial Statements (continued) | | |
For the six months ended March 31, 2015, affiliates received CDSCs as follows:
| | | | | | | | | | | | |
| | | Investor A | | | Investor B | | | Investor C | |
Global Opportunities | | $ | 122 | | | $ | 5 | | | $ | 2,949 | |
Health Sciences Opportunities | | $ | 2,326 | | | $ | 210 | | | $ | 54,250 | |
International Opportunities | | $ | 2,922 | | | $ | 74 | | | $ | 8,273 | |
Science & Technology Opportunities | | $ | 112 | | | $ | 7 | | | $ | 1,974 | |
U.S. Opportunities | | $ | 2,572 | | | $ | 473 | | | $ | 2,749 | |
The U.S. Securities and Exchange Commission has issued an exemptive order which permits BIM, an affiliate of the Manager, to serve as securities lending agent for the Funds, subject to applicable conditions. As securities lending agent, BIM bears all operational costs directly related to securities lending. The Funds are responsible for expenses in connection with the investment of cash collateral received for securities on loan (the “collateral investment expenses”). The cash collateral is invested in a private investment company managed by the Manager or its affiliates. However, BIM has agreed to cap the collateral investment expenses of the private investment company to an annual rate of 0.04%. The investment advisor to the private investment company will not charge any advisory fees with respect to shares purchased by the Funds.
Securities lending income is equal to the total of income earned from the reinvestment of cash collateral, net of fees and other payments to and from borrowers of securities, and less the collateral investment expenses. Each Fund retains a portion of securities lending income and remits a remaining portion to BIM as compensation for its services as securities lending agent. BIM may lend securities only when the difference between the borrower rebate rate and the risk free rate exceeds a certain level (such securities, the “specials only securities”).
Pursuant to such agreement, each Fund retains 80% of securities lending income. In addition, commencing the business day following the date that the aggregate securities lending income earned across certain funds in the Equity-Liquidity Complex in a calendar year exceeds a specified threshold, each Fund, pursuant to the securities lending agreement, will retain for the remainder of the calendar year securities lending income in an amount equal to 85% of securities lending income. The share of securities lending income earned by each Fund is shown as securities lending — affiliated — net in the Statements of Operations. For the six months ended March 31, 2015, each Fund paid BIM the following amounts for securities lending agent services:
| | | | |
Global Opportunities | | $ | 7,899 | |
Health Sciences Opportunities | | $ | 11,167 | |
International Opportunities | | $ | 19,135 | |
Science & Technology Opportunities | | $ | 3,147 | |
U.S. Opportunities | | $ | 20,479 | |
Certain officers and/or trustees of the Trust are officers and/or directors of BlackRock or its affiliates. The Funds reimburse the Manager for a portion of the compensation paid to the Trust’s Chief Compliance Officer, which is included in officer and trustees in the Statements of Operations.
The Funds may purchase securities from, or sell securities to, an affiliated fund provided the affiliation is due solely to having a common investment advisor, common officers, or common trustees. For the six months ended March 31, 2015, the purchase and sale transactions with an affiliated fund in compliance with Rule 17a-7 under the 1940 Act were as follows:
| | | | | | | | | | |
| | | Global
Opportunities | | | | | Health
Sciences
Opportunities | |
Purchases | | | — | | | | | $ | 28,085,450 | |
Sales | | $ | 2,155,830 | | | | | $ | 8,112,260 | |
6. Purchases and Sales:
Purchases and sales of investments, excluding short-term securities, for the six months ended March 31, 2015, were as follows:
| | | | | | | | | | | | | | | | | | | | |
| | | Global Opportunities | | | Health Sciences Opportunities | | | International Opportunities | | | Science & Technology Opportunities | | | U.S. Opportunities | |
Purchases | | $ | 96,492,632 | | | $ | 1,864,828,161 | | | $ | 427,327,513 | | | $ | 91,884,122 | | | $ | 421,843,093 | |
Sales | | $ | 118,791,160 | | | $ | 1,346,630,777 | | | $ | 853,013,535 | | | $ | 85,629,706 | | | $ | 470,975,443 | |
| | | | | | |
| 90 | | BLACKROCK FUNDS | | MARCH 31, 2015 | | |
| | |
| Notes to Financial Statements (continued) | | |
7. Income Tax Information:
It is the Funds’ policy to comply with the requirements of the Internal Revenue Code of 1986, as amended, applicable to regulated investment companies, and to distribute substantially all of their taxable income to their shareholders. Therefore, no federal income tax provision is required.
The Funds file U.S. federal and various state and local tax returns. No income tax returns are currently under examination. The statute of limitations on the Funds’ U.S. federal tax returns remains open for each of the four years ended September 30, 2014. The statutes of limitations on each Fund’s state and local tax returns may remain open for an additional year depending upon the jurisdiction.
Management has analyzed tax laws and regulations and their application to the Funds as of March 31, 2015, inclusive of the open tax return years, and does not believe there are any uncertain tax positions that require recognition of a tax liability in the Funds’ financial statements.
As of September 30, 2014, the Funds had capital loss carryforwards available to offset future realized capital gains through the indicated expiration dates as follows:
| | | | | | | | |
| Expires September 30, | | Global
Opportunities | | | Science &
Technology
Opportunities | |
2015 | | | — | | | $ | 12,880,909 | |
2017 | | $ | 83,723,600 | | | | 4,448,928 | |
2018 | | | 9,946,168 | | | | — | |
2019 | | | — | | | | 783,208 | |
Total | | $ | 93,669,768 | | | $ | 18,113,045 | |
| | | | |
As of March 31, 2015, gross unrealized appreciation and depreciation based on cost for federal income tax purposes were as follows:
| | | | | | | | | | | | | | | | | | | | |
| | | Global
Opportunities | | | Health
Sciences
Opportunities | | | International
Opportunities | | | Science &
Technology
Opportunities | | | U.S.
Opportunities | |
Tax cost | | $ | 265,807,836 | | | $ | 3,829,519,668 | | | $ | 984,340,149 | | | $ | 170,431,768 | | | $ | 1,170,549,140 | |
| | | | |
Gross unrealized appreciation | | $ | 54,504,028 | | | $ | 1,792,821,009 | | | $ | 159,752,130 | | | $ | 72,693,909 | | | $ | 470,945,897 | |
Gross unrealized depreciation | | | (9,429,667 | ) | | | (14,334,435 | ) | | | (34,785,019 | ) | | | (3,605,698 | ) | | | (24,263,077 | ) |
| | | | |
Net unrealized appreciation | | $ | 45,074,361 | | | $ | 1,778,486,574 | | | $ | 124,967,111 | | | $ | 69,088,211 | | | $ | 446,682,820 | |
| | | | |
8. Bank Borrowings:
The Trust, on behalf of the Funds, along with certain other funds managed by the Manager and its affiliates (“Participating Funds”), was a party to a 364-day, $1.1 billion credit agreement with a group of lenders, under which the Funds may borrow to fund shareholder redemptions. Excluding commitments designated for a certain individual fund, the Participating Funds, including the Funds, could borrow up to an aggregate commitment amount of $650 million, subject to asset coverage and other limitations as specified in the agreement. Effective November 25, 2014, the credit agreement was amended to an aggregate commitment amount of $2.1 billion, of which the Participating Funds, including the Funds, can borrow up to $1.6 billion at any time outstanding, subject to asset coverage and other limitations as specified in the agreement. The agreement terminates on April 23, 2015, unless otherwise extended to November 24, 2015 or renewed for a period of 364 days from April 23, 2015. The amended agreement has the following terms: a fee of 0.06% per annum on unused commitment amounts and interest at a rate equal to the higher of (a) one-month LIBOR (but, in any event, not less than 0.00%) on the date the loan is made plus 0.80% per annum or (b) the Fed Funds rate (but, in any event, not less than 0.00%) in effect from time to time plus 0.80% per annum on amounts borrowed. Participating Funds paid administration, legal and arrangement fees, which are included in miscellaneous expenses in the Statements of Operations, and along with commitment fees, were allocated among such funds based upon portions of the aggregate commitment available to them and relative net assets of Participating Funds. During the six months ended March 31, 2015, the Funds did not borrow under the credit agreement.
| | | | | | |
| | | BLACKROCK FUNDS | | MARCH 31, 2015 | | 91 |
| | |
| Notes to Financial Statements (continued) | | |
9. Principal Risks:
In the normal course of business, the Funds invest in securities and enter into transactions where risks exist due to fluctuations in the market (market risk) or failure of the issuer of a security to meet all its obligations (issuer credit risk). The value of securities held by the Funds may decline in response to certain events, including those directly involving the issuers whose securities are owned by the Funds; conditions affecting the general economy; overall market changes; local, regional or global political, social or economic instability; and currency, interest rate and price fluctuations. Similar to issuer credit risk, the Funds may be exposed to counterparty credit risk, or the risk that an entity with which the Funds have unsettled or open transactions may fail to or be unable to perform on its commitments. The Funds manage counterparty credit risk by entering into transactions only with counterparties that they believe have the financial resources to honor their obligations and by monitoring the financial stability of those counterparties. Financial assets, which potentially expose the Funds to market, issuer and counterparty credit risks, consist principally of financial instruments and receivables due from counterparties. The extent of the Funds’ exposure to market, issuer and counterparty credit risks with respect to these financial assets is generally approximated by their value recorded in the Statements of Assets and Liabilities, less any collateral held by the Funds.
Global Opportunities and International Opportunities invest a significant portion of their assets in securities of issuers located in Europe or with significant exposure to European issuers or countries. The European financial markets have recently experienced volatility and adverse trends due to concerns about economic downturns in, or rising government debt levels of, several European countries. These events may spread to other countries in Europe and may affect the value and liquidity of certain of Global Opportunities’ and International Opportunities’ investments.
As of March 31, 2015, Health Sciences Opportunities invested a significant portion of its assets in securities in the health care sector. Changes in economic conditions affecting such sector would have a greater impact on Health Sciences Opportunities and could affect the value, income and/or liquidity of positions in such securities.
As of March 31, 2015, Science & Technology Opportunities invested a significant portion of its assets in securities in the information technology sector. Changes in economic conditions affecting such sector would have a greater impact on Science & Technology Opportunities and could affect the value, income and/or liquidity of positions in such securities.
Global Opportunities and International Opportunities invest a substantial amount of their assets in issuers located in a single country or a limited number of countries. When a Fund concentrates its investments in this manner, it assumes the risk that economic, political and social conditions in those countries may have a significant impact on its investment performance. Foreign issuers may not be subject to the same uniform accounting, auditing and financial reporting standards and practices as used in the United States. Foreign securities markets may also be less liquid, more volatile, and less subject to governmental supervision not typically associated with investing in U.S. securities. Investment percentages in specific countries are presented in the Schedule of Investments.
As of March 31, 2015, the Funds listed below had the following industry classifications:
| | | | | | | | |
| Industry | | Global
Opportunities | | | International
Opportunities | |
Pharmaceuticals | | | 9 | % | | | 15 | % |
Banks | | | 9 | | | | 9 | |
Internet Software & Services | | | 8 | | | | — | |
Oil, Gas & Consumable Fuels | | | 7 | | | | 6 | |
Machinery | | | — | | | | 5 | |
Other1 | | | 67 | | | | 65 | |
| | 1 | | All other industries held were each less than 5% of long-term investments. |
| | | | | | |
| 92 | | BLACKROCK FUNDS | | MARCH 31, 2015 | | |
| | |
| Notes to Financial Statements (continued) | | |
10. Capital Share Transactions:
Transactions in capital shares for each class were as follows:
| | | | | | | | | | | | | | | | | | | | |
| | | Six Months Ended
March 31, 2015 | | | | | | Year Ended
September 30, 2014 | |
| Global Opportunities | | Shares | | | Amount | | | | | | Shares | | | Amount | |
Institutional | | | | | | | | | | | | | | | | | | | | |
Shares sold | | | 659,151 | | | $ | 9,378,539 | | | | | | | | 559,973 | | | $ | 8,067,694 | |
Shares issued in reinvestment of distributions | | | 73,078 | | | | 999,712 | | | | | | | | — | | | | — | |
Shares redeemed | | | (570,316 | ) | | | (8,008,409 | ) | | | | | | | (927,126 | ) | | | (13,279,874 | ) |
| | | | | | | | | | | | |
Net increase (decrease) | | | 161,913 | | | $ | 2,369,842 | | | | | | | | (367,153 | ) | | $ | (5,212,180 | ) |
| | | | | | | | | | | | |
| | | | | | | | | | | | | | | | | | | | |
Investor A | | | | | | | | | | | | | | | | | | | | |
Shares sold and automatic conversion of shares | | | 375,276 | | | $ | 5,247,459 | | | | | | | | 1,174,324 | | | $ | 16,846,920 | |
Shares issued in reinvestment of distributions | | | 173,048 | | | | 2,348,269 | | | | | | | | — | | | | — | |
Shares redeemed | | | (1,275,444 | ) | | | (17,864,810 | ) | | | | | | | (2,722,327 | ) | | | (38,978,663 | ) |
| | | | | | | | | | | | |
Net decrease | | | (727,120 | ) | | $ | (10,269,082 | ) | | | | | | | (1,548,003 | ) | | $ | (22,131,743 | ) |
| | | | | | | | | | | | |
| | | | | | | | | | | | | | | | | | | | |
Investor B | | | | | | | | | | | | | | | | | | | | |
Shares sold | | | 328 | | | $ | 4,709 | | | | | | | | 4,031 | | | $ | 54,489 | |
Shares redeemed and automatic conversion of shares | | | (38,360 | ) | | | (518,180 | ) | | | | | | | (191,601 | ) | | | (2,656,037 | ) |
| | | | | | | | | | | | |
Net decrease | | | (38,032 | ) | | $ | (513,471 | ) | | | | | | | (187,570 | ) | | $ | (2,601,548 | ) |
| | | | | | | | | | | | |
| | | | | | | | | | | | | | | | | | | | |
Investor C | | | | | | | | | | | | | | | | | | | | |
Shares sold | | | 80,095 | | | $ | 1,078,910 | | | | | | | | 253,192 | | | $ | 3,506,834 | |
Shares issued in reinvestment of distributions | | | 19,855 | | | | 261,485 | | | | | | | | — | | | | — | |
Shares redeemed | | | (457,087 | ) | | | (6,181,066 | ) | | | | | | | (711,580 | ) | | | (9,849,263 | ) |
| | | | | | | | | | | | |
Net decrease | | | (357,137 | ) | | $ | (4,840,671 | ) | | | | | | | (458,388 | ) | | $ | (6,342,429 | ) |
| | | | | | | | | | | | |
| | | | | | | | | | | | | | | | | | | | |
Class R | | | | | | | | | | | | | | | | | | | | |
Shares sold | | | 87,564 | | | $ | 1,224,702 | | | | | | | | 255,598 | | | $ | 3,633,694 | |
Shares issued in reinvestment of distributions | | | 8,103 | | | | 109,637 | | | | | | | | — | | | | — | |
Shares redeemed | | | (279,912 | ) | | | (3,854,157 | ) | | | | | | | (442,796 | ) | | | (6,291,109 | ) |
| | | | | | | | | | | | |
Net decrease | | | (184,245 | ) | | $ | (2,519,818 | ) | | | | | | | (187,198 | ) | | $ | (2,657,415 | ) |
| | | | | | | | | | | | |
Total Net Decrease | | | (1,144,621 | ) | | $ | (15,773,200 | ) | | | | | | | (2,748,312 | ) | | $ | (38,945,315 | ) |
| | | | | | | | | | | | |
| | | | | | |
| | | BLACKROCK FUNDS | | MARCH 31, 2015 | | 93 |
| | |
| Notes to Financial Statements (continued) | | |
| | | | | | | | | | | | | | | | | | |
| | | Six Months Ended
March 31, 2015 | | | | | Year Ended
September 30, 2014 | |
| Health Sciences Opportunities | | Shares | | | Amount | | | | | Shares | | | Amount | |
Institutional | | | | | | | | | | | | | | | | | | |
Shares sold | | | 5,257,640 | | | $ | 280,344,724 | | | | | | 7,644,570 | | | $ | 351,072,043 | |
Shares issued in reinvestment of distributions | | | 1,580,160 | | | | 80,367,006 | | | | | | 1,752,835 | | | | 71,375,071 | |
Shares redeemed | | | (2,726,866 | ) | | | (144,116,925 | ) | | | | | (3,893,043 | ) | | | (175,249,757 | ) |
| | | | | | | | | | |
Net increase | | | 4,110,934 | | | $ | 216,594,805 | | | | | | 5,504,362 | | | $ | 247,197,357 | |
| | | | | | | | | | |
| | | | | | | | | | | | | | | | | | |
Service | | | | | | | | | | | | | | | | | | |
Shares sold | | | 126,228 | | | $ | 6,526,606 | | | | | | 256,116 | | | $ | 11,207,546 | |
Shares issued in reinvestment of distributions | | | 44,544 | | | | 2,194,689 | | | | | | 58,067 | | | | 2,296,543 | |
Shares redeemed | | | (133,093 | ) | | | (6,841,007 | ) | | | | | (241,136 | ) | | | (10,553,404 | ) |
| | | | | | | | | | |
Net increase | | | 37,679 | | | $ | 1,880,288 | | | | | | 73,047 | | | $ | 2,950,685 | |
| | | | | | | | | | |
| | | | | | | | | | | | | | | | | | |
Investor A | | | | | | | | | | | | | | | | | | |
Shares sold and automatic conversion of shares | | | 11,361,475 | | | $ | 584,377,973 | | | | | | 14,209,197 | | | $ | 623,988,278 | |
Shares issued in reinvestment of distributions | | | 3,077,194 | | | | 151,182,544 | | | | | | 4,007,405 | | | | 158,051,325 | |
Shares redeemed | | | (5,430,620 | ) | | | (277,846,986 | ) | | | | | (14,958,299 | ) | | | (651,906,905 | ) |
| | | | | | | | | | |
Net increase | | | 9,008,049 | | | $ | 457,713,531 | | | | | | 3,258,303 | | | $ | 130,132,698 | |
| | | | | | | | | | |
| | | | | | | | | | | | | | | | | | |
Investor B | | | | | | | | | | | | | | | | | | |
Shares sold | | | 8,785 | | | $ | 422,735 | | | | | | 23,020 | | | $ | 924,810 | |
Shares issued in reinvestment of distributions | | | 27,405 | | | | 1,253,222 | | | | | | 87,259 | | | | 3,209,380 | |
Shares redeemed and automatic conversion of shares | | | (164,086 | ) | | | (7,670,219 | ) | | | | | (591,665 | ) | | | (23,846,033 | ) |
| | | | | | | | | | |
Net decrease | | | (127,896 | ) | | $ | (5,994,262 | ) | | | | | (481,386 | ) | | $ | (19,711,843 | ) |
| | | | | | | | | | |
| | | | | | | | | | | | | | | | | | |
Investor C | | | | | | | | | | | | | | | | | | |
Shares sold | | | 4,132,563 | | | $ | 195,112,794 | | | | | | 4,155,253 | | | $ | 168,011,937 | |
Shares issued in reinvestment of distributions | | | 1,315,606 | | | | 59,149,656 | | | | | | 1,589,322 | | | | 57,803,090 | |
Shares redeemed | | | (1,384,730 | ) | | | (64,933,720 | ) | | | | | (2,570,701 | ) | | | (103,456,988 | ) |
| | | | | | | | | | |
Net increase | | | 4,063,439 | | | $ | 189,328,730 | | | | | | 3,173,874 | | | $ | 122,358,039 | |
| | | | | | | | | | |
| | | | | | | | | | | | | | | | | | |
Class R | | | | | | | | | | | | | | | | | | |
Shares sold | | | 798,011 | | | $ | 40,598,680 | | | | | | 1,080,547 | | | $ | 47,107,098 | |
Shares issued in reinvestment of distributions | | | 119,635 | | | | 5,825,014 | | | | | | 94,950 | | | | 3,718,232 | |
Shares redeemed | | | (252,722 | ) | | | (12,651,324 | ) | | | | | (371,441 | ) | | | (16,109,254 | ) |
| | | | | | | | | | |
Net increase | | | 664,924 | | | $ | 33,772,370 | | | | | | 804,056 | | | $ | 34,716,076 | |
| | | | | | | | | | |
Total Net Increase | | | 17,757,129 | | | $ | 893,295,462 | | | | | | 12,332,256 | | | $ | 517,643,012 | |
| | | | | | | | | | |
| | | | | | |
| 94 | | BLACKROCK FUNDS | | MARCH 31, 2015 | | |
| | |
| Notes to Financial Statements (continued) | | |
| | | | | | | | | | | | | | | | |
| |
| Six Months Ended
March 31, 2015 |
| |
| Year Ended
September 30, 2014 |
|
| International Opportunities | | Shares | | | Amount | | | Shares | | | Amount | |
Institutional | | | | | | | | | | | | | | | | |
Shares sold | | | 1,697,612 | | | $ | 57,277,743 | | | | 6,167,293 | | | $ | 249,506,958 | |
Shares issued in reinvestment of distributions | | | 2,003,498 | | | | 64,292,313 | | | | 77,908 | | | | 3,096,054 | |
Shares redeemed | | | (7,811,584 | ) | | | (274,681,544 | ) | | | (7,391,101 | ) | | | (300,896,765 | ) |
| | | | | | | | |
Net decrease | | | (4,110,474 | ) | | $ | (153,111,488 | ) | | | (1,145,900 | ) | | $ | (48,293,753 | ) |
| | | | | | | | |
| | | | | | | | | | | | | | | | |
Service | | | | | | | | | | | | | | | | |
Shares sold | | | 160,431 | | | $ | 5,372,384 | | | | 198,084 | | | $ | 7,714,316 | |
Shares issued in reinvestment of distributions | | | 116,696 | | | | 3,586,080 | | | | 3,882 | | | | 148,540 | |
Shares redeemed | | | (313,269 | ) | | | (10,246,966 | ) | | | (490,070 | ) | | | (19,061,712 | ) |
| | | | | | | | |
Net decrease | | | (36,142 | ) | | $ | (1,288,502 | ) | | | (288,104 | ) | | $ | (11,198,856 | ) |
| | | | | | | | |
| | | | | | | | | | | | | | | | |
Investor A | | | | | | | | | | | | | | | | |
Shares sold and automatic conversion of shares | | | 1,574,163 | | | $ | 51,278,104 | | | | 5,068,943 | | | $ | 197,126,704 | |
Shares issued in reinvestment of distributions | | | 2,461,235 | | | | 74,796,935 | | | | 74,728 | | | | 2,832,191 | |
Shares redeemed | | | (7,198,520 | ) | | | (231,452,565 | ) | | | (7,519,102 | ) | | | (289,257,711 | ) |
| | | | | | | | |
Net decrease | | | (3,163,122 | ) | | $ | (105,377,526 | ) | | | (2,375,431 | ) | | $ | (89,298,816 | ) |
| | | | | | | | |
| | | | | | | | | | | | | | | | |
Investor B | | | | | | | | | | | | | | | | |
Shares sold | | | 1,218 | | | $ | 40,075 | | | | 3,750 | | | $ | 135,739 | |
Shares issued in reinvestment of distributions | | | 12,504 | | | | 349,877 | | | | 389 | | | | 13,713 | |
Shares redeemed and automatic conversion of shares | | | (22,521 | ) | | | (670,111 | ) | | | (103,778 | ) | | | (3,745,813 | ) |
| | | | | | | | |
Net decrease | | | (8,799 | ) | | $ | (280,159 | ) | | | (99,639 | ) | | $ | (3,596,361 | ) |
| | | | | | | | |
| | | | | | | | | | | | | | | | |
Investor C | | | | | | | | | | | | | | | | |
Shares sold | | | 160,889 | | | $ | 4,792,194 | | | | 573,025 | | | $ | 20,482,057 | |
Shares issued in reinvestment of distributions | | | 565,596 | | | | 15,610,427 | | | | 11,153 | | | | 389,466 | |
Shares redeemed | | | (830,492 | ) | | | (24,634,632 | ) | | | (933,331 | ) | | | (33,169,436 | ) |
| | | | | | | | |
Net decrease | | | (104,007 | ) | | $ | (4,232,011 | ) | | | (349,153 | ) | | $ | (12,297,913 | ) |
| | | | | | | | |
Total Net Decrease | | | (7,422,544 | ) | | $ | (264,289,686 | ) | | | (4,258,227 | ) | | $ | (164,685,699 | ) |
| | | | | | | | |
| | | | | | |
| | | BLACKROCK FUNDS | | MARCH 31, 2015 | | 95 |
| | |
| Notes to Financial Statements (continued) | | |
| | | | | | | | | | | | | | | | |
| |
| Six Months Ended
March 31, 2015 |
| |
| Year Ended
September 30, 2014 |
|
| Science & Technology Opportunities | | Shares | | | Amount | | | Shares | | | Amount | |
Institutional | | | | | | | | | | | | | | | | |
Shares sold | | | 433,391 | | | $ | 6,625,000 | | | | 1,532,531 | | | $ | 21,948,213 | |
Shares redeemed | | | (449,425 | ) | | | (6,885,238 | ) | | | (730,845 | ) | | | (10,315,532 | ) |
| | | | | | | | |
Net increase (decrease) | | | (16,034 | ) | | $ | (260,238 | ) | | | 801,686 | | | $ | 11,632,681 | |
| | | | | | | | |
| | | | | | | | | | | | | | | | |
Service | | | | | | | | | | | | | | | | |
Shares sold | | | 7,137 | | | $ | 105,162 | | | | 94,776 | | | $ | 1,339,215 | |
Shares redeemed | | | (11,022 | ) | | | (156,132 | ) | | | (74,410 | ) | | | (992,076 | ) |
| | | | | | | | |
Net increase (decrease) | | | (3,885 | ) | | $ | (50,970 | ) | | | 20,366 | | | $ | 347,139 | |
| | | | | | | | |
| | | | | | | | | | | | | | | | |
Investor A | | | | | | | | | | | | | | | | |
Shares sold and automatic conversion of shares | | | 963,539 | | | $ | 13,964,345 | | | | 3,095,255 | | | $ | 41,547,658 | |
Shares redeemed | | | (815,094 | ) | | | (11,717,917 | ) | | | (2,718,632 | ) | | | (35,844,015 | ) |
| | | | | | | | |
Net increase | | | 148,445 | | | $ | 2,246,428 | | | | 376,623 | | | $ | 5,703,643 | |
| | | | | | | | |
| | | | | | | | | | | | | | | | |
Investor B | | | | | | | | | | | | | | | | |
Shares sold | | | 1,394 | | | $ | 17,364 | | | | 44,407 | | | $ | 502,217 | |
Shares redeemed and automatic conversion of shares | | | (59,301 | ) | | | (723,593 | ) | | | (131,358 | ) | | | (1,547,200 | ) |
| | | | | | | | |
Net decrease | | | (57,907 | ) | | $ | (706,229 | ) | | | (86,951 | ) | | $ | (1,044,983 | ) |
| | | | | | | | |
| | | | | | | | | | | | | | | | |
Investor C | | | | | | | | | | | | | | | | |
Shares sold | | | 282,807 | | | $ | 3,605,563 | | | | 651,585 | | | $ | 7,783,124 | |
Shares redeemed | | | (237,384 | ) | | | (2,977,194 | ) | | | (691,770 | ) | | | (8,220,073 | ) |
| | | | | | | | |
Net increase (decrease) | | | 45,423 | | | $ | 628,369 | | | | (40,185 | ) | | $ | (436,949 | ) |
| | | | | | | | |
| | | | | | | | | | | | | | | | |
Class R | | | | | | | | | | | | | | | | |
Shares sold | | | 70,087 | | | $ | 1,038,007 | | | | 185,320 | | | $ | 2,514,750 | |
Shares redeemed | | | (64,319 | ) | | | (931,168 | ) | | | (265,410 | ) | | | (3,633,169 | ) |
| | | | | | | | |
Net increase (decrease) | | | 5,768 | | | $ | 106,839 | | | | (80,090 | ) | | $ | (1,118,419 | ) |
| | | | | | | | |
Total Net Increase | | | 121,810 | | | $ | 1,964,199 | | | | 991,449 | | | $ | 15,083,112 | |
| | | | | | | | |
| | | | | | |
| 96 | | BLACKROCK FUNDS | | MARCH 31, 2015 | | |
| | |
| Notes to Financial Statements (concluded) | | |
| | | | | | | | | | | | | | | | | | |
| | | Six Months Ended
March 31, 2015 | | | | | Year Ended
September 30, 2014 | |
| U.S. Opportunities | | Shares | | | Amount | | | | | Shares | | | Amount | |
Institutional | | | | | | | | | | | | | | | | | | |
Shares sold | | | 4,861,724 | | | $ | 206,238,647 | | | | | | 4,156,486 | | | $ | 181,387,913 | |
Shares issued in reinvestment of distributions | | | 2,949,945 | | | | 111,832,341 | | | | | | 3,132,585 | | | | 120,980,318 | |
Shares redeemed | | | (2,678,678 | ) | | | (109,574,482 | ) | | | | | (4,989,778 | ) | | | (215,505,257 | ) |
| | | | | | | | | | |
Net increase | | | 5,132,991 | | | $ | 208,496,506 | | | | | | 2,299,293 | | | $ | 86,862,974 | |
| | | | | | | | | | |
| | | | | | | | | | | | | | | | | | |
Service | | | | | | | | | | | | | | | | | | |
Shares sold | | | 38,608 | | | $ | 1,488,434 | | | | | | 51,647 | | | $ | 2,099,262 | |
Shares issued in reinvestment of distributions | | | 120,784 | | | | 4,360,312 | | | | | | 846,209 | | | | 30,945,870 | |
Shares redeemed | | | (2,810,663 | ) | | | (117,319,557 | ) | | | | | (984,665 | ) | | | (39,784,451 | ) |
| | | | | | | | | | |
Net decrease | | | (2,651,271 | ) | | $ | (111,470,811 | ) | | | | | (86,809 | ) | | $ | (6,739,319 | ) |
| | | | | | | | | | |
| | | | | | | | | | | | | | | | | | |
Investor A | | | | | | | | | | | | | | | | | | |
Shares sold and automatic conversion of shares | | | 1,883,794 | | | $ | 71,333,587 | | | | | | 1,624,273 | | | $ | 64,380,292 | |
Shares issued in reinvestment of distributions | | | 1,775,552 | | | | 62,197,586 | | | | | | 2,833,685 | | | | 102,239,143 | |
Shares redeemed | | | (2,876,969 | ) | | | (107,123,431 | ) | | | | | (5,701,512 | ) | | | (228,766,152 | ) |
| | | | | | | | | | |
Net increase (decrease) | | | 782,377 | | | $ | 26,407,742 | | | | | | (1,243,554 | ) | | $ | (62,146,717 | ) |
| | | | | | | | | | |
| | | | | | | | | | | | | | | | | | |
Investor B | | | | | | | | | | | | | | | | | | |
Shares sold | | | 2,553 | | | $ | 83,240 | | | | | | 7,754 | | | $ | 256,750 | |
Shares issued in reinvestment of distributions | | | 55,908 | | | | 1,650,948 | | | | | | 91,556 | | | | 2,859,297 | |
Shares redeemed and automatic conversion of shares | | | (59,628 | ) | | | (1,926,742 | ) | | | | | (122,587 | ) | | | (4,173,014 | ) |
| | | | | | | | | | |
Net decrease | | | (1,167 | ) | | $ | (192,554 | ) | | | | | (23,277 | ) | | $ | (1,056,967 | ) |
| | | | | | | | | | |
| | | | | | | | | | | | | | | | | | |
Investor C | | | | | | | | | | | | | | | | | | |
Shares sold | | | 368,453 | | | $ | 11,739,092 | | | | | | 348,094 | | | $ | 12,036,883 | |
Shares issued in reinvestment of distributions | | | 1,144,808 | | | | 33,806,149 | | | | | | 1,461,947 | | | | 45,714,858 | |
Shares redeemed | | | (639,147 | ) | | | (20,460,182 | ) | | | | | (1,186,064 | ) | | | (41,189,059 | ) |
| | | | | | | | | | |
Net increase | | | 874,114 | | | $ | 25,085,059 | | | | | | 623,977 | | | $ | 16,562,682 | |
| | | | | | | | | | |
Total Net Increase | | | 4,137,044 | | | $ | 148,325,942 | | | | | | 1,569,630 | | | $ | 33,482,653 | |
| | | | | | | | | | |
11. Subsequent Events:
Management’s evaluation of the impact of all subsequent events on the Funds’ financial statements was completed through the date the financial statements were issued and the following item was noted:
Effective April 23, 2015, the 364-day, $2.1 billion credit agreement to which the Funds are a party, was further amended to expire on April 21, 2016, unless otherwise extended or renewed.
| | | | | | |
| | | BLACKROCK FUNDS | | MARCH 31, 2015 | | 97 |
Rodney D. Johnson, Chair of the Board and Trustee
David O. Beim, Trustee
Collette Chilton, Trustee
Frank J. Fabozzi, Trustee
Dr. Matina S. Horner, Trustee
Herbert I. London, Trustee
Ian A. MacKinnon, Trustee
Cynthia A. Montgomery, Trustee
Barbara G. Novick, Trustee
Joseph P. Platt, Trustee
Robert C. Robb, Jr., Trustee
Toby Rosenblatt, Trustee
Mark Stalnecker, Trustee
Kenneth L. Urish, Trustee
Frederick W. Winter, Trustee
John M. Perlowski, President and Chief Executive Officer
Jennifer McGovern, Vice President
Neal Andrews, Chief Financial Officer
Jay Fife, Treasurer
Charles Park, Chief Compliance Officer
Fernanda Piedra, Anti-Money Laundering Compliance Officer
Benjamin Archibald, Secretary
Effective December 31, 2014, Paul L. Audet and Henry Gabbay resigned as Trustees of the Trust and Ronald W. Forbes resigned as a Trustee of the Trust and Co-Chair of the Board. Effective January 1, 2015, Collette Chilton, Barbara G. Novick and Mark Stalnecker were appointed to serve as Trustees of the Trust.
Effective March 1, 2015, Charles Park resigned as Anti-Money Laundering Compliance Officer of the Trust and Fernanda Piedra became Anti-Money Laundering Compliance Officer of the Trust.
| | | | | | |
| | | | |
Investment Advisor and Administrator BlackRock Advisors, LLC Wilmington, DE 19809 | | Accounting Agent and Transfer Agent BNY Mellon Investment Servicing (US) Inc. Wilmington, DE 19809 | | Independent Registered Public Accounting Firm Deloitte & Touche LLP Philadelphia, PA 19103 | | Address of the Trust 100 Bellevue Parkway Wilmington, DE 19809 |
| | | | | | |
Custodian The Bank of New York Mellon New York, NY 10286 | | Distributor BlackRock Investments, LLC New York, NY 10022 | | Legal Counsel Sidley Austin LLP New York, NY 10019 | | |
| | | | | | |
| 98 | | BLACKROCK FUNDS | | MARCH 31, 2015 | | |
Householding
The Funds will mail only one copy of shareholder documents, including prospectuses, annual and semi-annual reports and proxy statements, to shareholders with multiple accounts at the same address. This practice is commonly called “householding” and is intended to reduce expenses and eliminate duplicate mailings of shareholder documents. Mailings of your shareholder documents may be householded indefinitely unless you instruct us otherwise. If you do not want the mailing of these documents to be combined with those for other members of your household, please call the Funds at (800) 441-7762.
Availability of Quarterly Schedule of Investments
The Funds file their complete schedule of portfolio holdings with the SEC for the first and third quarters of each fiscal year on Form N-Q. The Funds’ Forms N-Q are available on the SEC’s website at http://www.sec.gov and may also be reviewed and copied at the SEC’s Public Reference Room in Washington, D.C. Information on how to access documents on the SEC’s website without charge may be obtained by calling (800) SEC-0330. The Funds’ Forms N-Q may also be obtained upon request and without charge by calling (800) 441-7762.
Availability of Proxy Voting Policies and Procedures
A description of the policies and procedures that the Funds use to determine how to vote proxies relating to portfolio securities is available upon request and without charge (1) by calling (800) 441-7762; (2) at http://www.blackrock.com; and (3) on the SEC’s website at http://www.sec.gov.
Availability of Proxy Voting Record
Information about how the Funds voted proxies relating to securities held in the Funds’ portfolios during the most recent 12-month period ended June 30 is available upon request and without charge (1) at http://www.blackrock.com or by calling (800) 441-7762 and (2) on the SEC’s website at http://www.sec.gov.
BlackRock’s Mutual Fund Family
BlackRock offers a diverse lineup of open-end mutual funds crossing all investment styles and managed by experts in equity, fixed income and tax-exempt investing. Visit http://www.blackrock.com for more information.
Account Information
Call us at (800) 441-7762 from 8:00 AM to 6:00 PM EST on any business day to get information about your account balances, recent transactions and share prices. You can also reach us on the Web at http://www.blackrock.com/funds.
Automatic Investment Plans
Investor Class shareholders who want to invest regularly can arrange to have $50 or more automatically deducted from their checking or savings account and invested in any of the BlackRock funds.
Systematic Withdrawal Plans
Investor Class shareholders can establish a systematic withdrawal plan and receive periodic payments of $50 or more from their BlackRock funds, as long as their account balance is at least $10,000.
Retirement Plans
Shareholders may make investments in conjunction with Traditional, Rollover, Roth, Coverdell, Simple IRAs, SEP IRAs and 403(b) Plans.
| | | | | | |
| | | BLACKROCK FUNDS | | MARCH 31, 2015 | | 99 |
| | |
| Additional Information (concluded) | | |
|
| BlackRock Privacy Principles |
BlackRock is committed to maintaining the privacy of its current and former fund investors and individual clients (collectively, “Clients”) and to safeguarding their non-public personal information. The following information is provided to help you understand what personal information BlackRock collects, how we protect that information and why in certain cases we share such information with select parties.
If you are located in a jurisdiction where specific laws, rules or regulations require BlackRock to provide you with additional or different privacy-related rights beyond what is set forth below, then BlackRock will comply with those specific laws, rules or regulations.
BlackRock obtains or verifies personal non-public information from and about you from different sources, including the following: (i) information we receive from you or, if applicable, your financial intermediary, on applications, forms or other documents; (ii) information about your transactions with us, our affiliates, or others; (iii) information we receive from a consumer reporting agency; and (iv) from visits to our websites.
BlackRock does not sell or disclose to non-affiliated third parties any non-public personal information about its Clients, except as permitted by law or as is necessary to respond to regulatory requests or to service Client accounts. These non-affiliated third parties are required to protect the confidentiality and security of this information and to use it only for its intended purpose.
We may share information with our affiliates to service your account or to provide you with information about other BlackRock products or services that may be of interest to you. In addition, BlackRock restricts access to non-public personal information about its Clients to those BlackRock employees with a legitimate business need for the information. BlackRock maintains physical, electronic and procedural safeguards that are designed to protect the non-public personal information of its Clients, including procedures relating to the proper storage and disposal of such information.
| | | | | | |
| 100 | | BLACKROCK FUNDS | | MARCH 31, 2015 | | |
This report is intended for current holders. It is not authorized for use as an offer of sale or a solicitation of an offer to buy shares of the Funds unless preceded or accompanied by the Funds’ current prospectus. Past performance results shown in this report should not be considered a representation of future performance. Investment returns and principal value of shares will fluctuate so that shares, when redeemed, may be worth more or less than their original cost. Statements and other information herein are as dated and are subject to change.

| | |
Eq-Opps-3/15-SAR | |  |
MARCH 31, 2015
| | | | |
SEMI-ANNUAL REPORT (UNAUDITED) | | | | BLACKROCK® |
| | | | |
| | BlackRock Managed Volatility Portfolio | | of BlackRock FundsSM |
| | |
| Not FDIC Insured ¡ May Lose Value ¡ No Bank Guarantee | | |

| | | | | | |
| 2 | | BLACKROCK MANAGED VOLATILITY PORTFOLIO | | MARCH 31, 2015 | | |
Dear Shareholder,
Market volatility has remained low from a long-term perspective, but increased over the course of 2014 amid higher valuations in risk assets (such as equities and high yield bonds), geopolitical risks, uneven global economic growth and uncertainty around policy moves from the world’s largest central banks. As the U.S. Federal Reserve (the “Fed”) gradually reduced its bond buying program (which ultimately ended in October 2014), U.S. interest rates surprisingly trended lower and stock prices forged ahead despite high valuations on the back of a multi-year bull market. Geopolitical tensions intensified in Ukraine and the Middle East and oil prices became highly volatile in the middle of the summer, stoking worries about economic growth outside the United States. As the U.S. economy continued to show steady improvement, the stronger data caused concern among investors that the Fed would raise short-term rates sooner than previously anticipated. The U.S. dollar appreciated and global credit markets tightened, ultimately putting a strain on investor flows, and financial markets broadly weakened in the third quarter.
U.S. economic growth picked up considerably in the fourth quarter while the broader global economy showed signs of slowing. U.S. markets significantly outperformed international markets even as the European Central Bank (“ECB”) and the Bank of Japan eased monetary policy, which drove further strengthening in the U.S. dollar. Oil prices plummeted in the fourth quarter due to a global supply-and-demand imbalance, sparking a selloff in energy-related assets and stress in emerging markets. Fixed income investors piled into U.S. Treasuries as their persistently low yields became relatively attractive as compared to international sovereign debt.
Equity markets reversed in the first quarter of 2015 and U.S. stocks underperformed international markets, notably Europe and Japan, but also emerging markets. Investors had held high expectations for the U.S. economy, but after a harsh winter, first-quarter data disappointed and high valuations took their toll on U.S. stocks. Meanwhile, economic reports in Europe and Asia easily beat investors’ very low expectations for those economies, and accommodative policies from global central banks helped international equities rebound. The ECB’s asset purchase program (announced in January and commenced in March) was the largest in scale and effect on the markets. Overall, market volatility decreased in the first quarter as global risks abated, with a ceasefire in Ukraine and an improving outlook for Greece’s continued membership in the Eurozone.
At BlackRock, we believe investors need to think globally, extend their scope across a broad array of asset classes and be prepared to move freely as market conditions change over time. We encourage you to talk with your financial advisor and visit blackrock.com for further insight about investing in today’s markets.
Sincerely,

Rob Kapito
President, BlackRock Advisors, LLC

Rob Kapito
President, BlackRock Advisors, LLC
| | | | | | | | |
| Total Returns as of March 31, 2015 | |
| | | 6-month | | | 12-month | |
U.S. large cap equities
(S&P 500® Index) | | | 5.93 | % | | | 12.73 | % |
U.S. small cap equities
(Russell 2000® Index) | | | 14.46 | | | | 8.21 | |
International equities
(MSCI Europe, Australasia, Far East Index) | | | 1.13 | | | | (0.92 | ) |
Emerging market equities
(MSCI Emerging Markets Index) | | | (2.37 | ) | | | 0.44 | |
3-month Treasury bill
(BofA Merrill Lynch 3-Month U.S. Treasury Bill Index) | | | 0.01 | | | | 0.03 | |
U.S. Treasury securities
(BofA Merrill Lynch 10-Year U.S. Treasury Index) | | | 6.25 | | | | 9.88 | |
U.S. investment grade bonds
(Barclays U.S. Aggregate Bond Index) | | | 3.43 | | | | 5.72 | |
Tax-exempt municipal bonds
(S&P Municipal Bond Index) | | | 2.29 | | | | 6.60 | |
U.S. high yield bonds
(Barclays U.S. Corporate High Yield 2% Issuer Capped Index) | | | 1.50 | | | | 2.00 | |
|
| Past performance is no guarantee of future results. Index performance is shown for illustrative purposes only. You cannot invest directly in an index. | |
| | | | | | |
| | | THIS PAGE NOT PART OF YOUR FUND REPORT | | | | 3 |
| | |
| Fund Summary as of March 31, 2015 | | |
BlackRock Managed Volatility Portfolio’s (the “Fund”) investment objective is to seek total return.
|
| Portfolio Management Commentary |
How did the Fund perform?
| Ÿ | | For the six-month period ended March 31, 2015, the Fund outperformed its reference benchmark (50% MSCI All Country World Index (“MSCI ACWI”)/50% Citigroup World Government Bond Index (hedged into USD) (“Citigroup WGBI (hedged into USD)”). The Fund is entirely unconstrained relative to the 50/50 benchmark and can deviate substantially in regards to risk and overall asset allocation. The Fund also outperformed its performance benchmark, the BofA Merrill Lynch 3-Month U.S. Treasury Bill Index, for the same six-month period. |
What factors influenced performance?
| Ÿ | | An overweight to equities relative to the reference benchmark contributed positively to the Fund’s performance, as equities broadly outperformed fixed income over the six-month period, supported by continued monetary easing outside the U.S. and stabilizing oil prices. The most significant contributors to performance included exposure to European and Japanese equities, both of which benefited from supportive policy measures and stronger economic data. Additionally, an underweight to the yen was a primary contributor to performance, as additional stimulus measures from the Bank of Japan weakened the yen and boosted equity markets. The Fund also benefited from sector overweights in information technology, consumer discretionary and health care. |
| Ÿ | | On a broad asset allocation level, a relatively high allocation to cash negatively impacted performance as markets rallied during the period. A Eurozone recovery theme, reflected in a European equity overweight position, detracted from performance in the fourth quarter of 2014 due to weak economic data, but rebounded in early 2015, supported by improving growth dynamics and positive sentiment with respect to European Central Bank (“ECB”) plans to purchase sovereign bonds. Within U.S. equities, exposure to energy detracted from performance given a sharp decline in oil prices over the period. Additionally, interest rate hedges detracted relative to the cash benchmark. |
Describe recent portfolio activity.
| Ÿ | | From a broad asset allocation perspective, the Fund remained overweight in equities relative to fixed income, consistent with the view that improving economic growth and easy global monetary policy could create a favorable backdrop for equities, particularly in the developed markets. The Fund shifted exposure toward international developed equities, most notably in Europe and Japan, where valuations were relatively attractive and accommodative monetary policies should support risk assets. In addition, data out of the Eurozone suggests stronger conditions for growth. Conversely, the Fund reduced its overweight in U.S. equities as leading economic indicators showed signs of softening growth, a stronger dollar provided a headwind to corporate earnings and the volatility in oil prices continues to negatively impact energy companies. |
| Ÿ | | Within fixed income, the Fund continued to hold a significant underweight in duration (lower sensitivity to interest rate movements) relative to the reference benchmark index given a more cautious view on the direction of interest rates. |
| Ÿ | | During the period, the Fund used derivatives in executing its investment strategy. The use of derivatives did not have a material impact on performance. |
Describe portfolio positioning at period end.
| Ÿ | | Compared to the reference benchmark, the Fund ended the period overweight in equities relative to fixed income, while continuing to hold an allocation to cash. While the Fund held an underweight to U.S. equities, the Fund favored developed market equities overall, and in particular leaned toward Europe and Japan. Additionally, the Fund had currency hedges and a reduced duration profile in anticipation of a gradual rise in U.S. interest rates, especially at the front-end of the curve. |
The views expressed reflect the opinions of BlackRock as of the date of this report and are subject to change based on changes in market, economic or other conditions. These views are not intended to be a forecast of future events and are no guarantee of future results.
| | |
| Ten Largest Holdings | | Percent of Long-Term Investments |
| | | | |
Government of Japan | | | 6 | % |
iShares 1-3 Year Credit Bond ETF | | | 4 | |
Fannie Mae Mortgage-Backed Securities | | | 2 | |
United Kingdom Gilt | | | 2 | |
LVMH Moet Hennessy Louis Vuitton SA | | | 1 | |
U.S. Treasury Notes | | | 1 | |
Freddie Mac Mortgage-Backed Securities | | | 1 | |
Ginnie Mae Mortgage-Backed Securities | | | 1 | |
Daimler AG, Registered Shares | | | 1 | |
Inditex SA | | | 1 | |
| | |
| Portfolio Composition | | Percent of Long-Term Investments |
| | | | |
Common Stocks | | | 57 | % |
Foreign Government Obligations | | | 15 | |
Corporate Bonds | | | 12 | |
U.S. Government Sponsored Agency Securities | | | 5 | |
Investment Companies | | | 4 | |
U.S. Treasury Obligations | | | 3 | |
Foreign Agency Obligations | | | 2 | |
Asset-Backed Securities | | | 1 | |
Non-Agency Mortgage-Backed Securities | | | 1 | |
| | | | | | |
| 4 | | BLACKROCK MANAGED VOLATILITY PORTFOLIO | | MARCH 31, 2015 | | |
|
| Total Return Based on a $10,000 Investment |
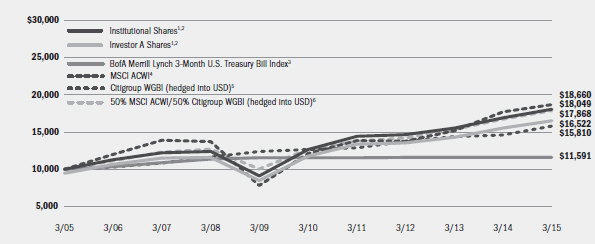
| | 1 | Assuming maximum sales charges, if any, transaction costs and other operating expenses, including investment advisory fees and administration fees, if any. Institutional Shares do not have a sales charge. |
| | 2 | The Fund uses an asset allocation strategy, investing varying percentages of its portfolio in three major categories: stocks, bonds and money market instruments. |
| | 3 | An unmanaged index that tracks 3-month U.S. Treasury securities. |
| | 4 | A free float-adjusted market capitalization weighted index that is designed to measure the equity market performance of developed and emerging markets. The MSCI ACWI consists of 46 country indexes comprising of 23 developed and 23 emerging market country indexes. |
| | 5 | A market capitalization weighted bond index consisting of government bond markets of 23 countries, including the United States. |
| | 6 | A customized weighted index is comprised of the returns of the 50% MSCI ACWI/50% Citigroup WGBI (hedged into USD). |
| | | | | | | | | | | | | | | | | | | | | | | | | | | | |
| Performance Summary for the Period Ended March 31, 2015 | |
| | | | | | Average Annual Total Returns7 | |
| | | | | | 1 Year | | | 5 Years | | | 10 Years | |
| | | 6-Month
Total Returns | | | w/o sales
charge | | | w/ sales
charge | | | w/o sales
charge | | | w/ sales
charge | | | w/o sales
charge | | | w/ sales
charge | |
Institutional | | | 4.92 | % | | | 6.66 | % | | | N/A | | | | 7.36 | % | | | N/A | | | | 6.08 | % | | | N/A | |
Service | | | 4.77 | | | | 6.28 | | | | N/A | | | | 7.04 | | | | N/A | | | | 5.77 | | | | N/A | |
Investor A | | | 4.80 | | | | 6.32 | | | | 0.74 | % | | | 7.03 | | | | 5.88 | % | | | 5.72 | | | | 5.15 | % |
Investor B | | | 4.24 | | | | 5.28 | | | | 0.84 | | | | 6.09 | | | | 5.77 | | | | 5.04 | | | | 5.04 | |
Investor C | | | 4.42 | | | | 5.62 | | | | 4.63 | | | | 6.29 | | | | 6.29 | | | | 4.97 | | | | 4.97 | |
BofA Merrill Lynch 3-Month U.S. Treasury Bill Index | | | 0.01 | | | | 0.03 | | | | N/A | | | | 0.09 | | | | N/A | | | | 1.49 | | | | N/A | |
50% MSCI ACWI/50% Citigroup WGBI (hedged into USD) | | | 3.83 | | | | 6.96 | | | | N/A | | | | 7.07 | | | | N/A | | | | 5.98 | | | | N/A | |
MSCI ACWI | | | 2.73 | | | | 5.42 | | | | N/A | | | | 8.99 | | | | N/A | | | | 6.44 | | | | N/A | |
Citigroup WGBI (hedged into USD) | | | 4.77 | | | | 8.31 | | | | N/A | | | | 4.54 | | | | N/A | | | | 4.69 | | | | N/A | |
| | 7 | | Assuming maximum sales charges, if any. Average annual total returns with and without sales charges reflect reductions for distribution and service fees. See “About Fund Performance” on page 6 for a detailed description of share classes, including any related sales charges and fees. |
| | | | N/A—Not applicable as share class and index do not have a sales charge. |
| | | | Past performance is not indicative of future results. |
| | | | | | | | | | | | | | |
| Expense Example |
| | | Actual | | Hypothetical9 | | |
| | | Beginning Account Value
October 1, 2014 | | Ending Account Value
March 31, 2015 | | Expenses Paid
During the Period8 | | Beginning Account Value
October 1, 2014 | | Ending Account Value
March 31, 2015 | | Expenses Paid
During the Period8 | | Annualized Expense Ratio |
Institutional | | $1,000.00 | | $1,049.20 | | $4.04 | | $1,000.00 | | $1,020.99 | | $3.98 | | 0.79% |
Service | | $1,000.00 | | $1,047.70 | | $5.97 | | $1,000.00 | | $1,019.10 | | $5.89 | | 1.17% |
Investor A | | $1,000.00 | | $1,048.00 | | $5.67 | | $1,000.00 | | $1,019.40 | | $5.59 | | 1.11% |
Investor B | | $1,000.00 | | $1,042.40 | | $10.90 | | $1,000.00 | | $1,014.26 | | $10.75 | | 2.14% |
Investor C | | $1,000.00 | | $1,044.20 | | $9.17 | | $1,000.00 | | $1,015.96 | | $9.05 | | 1.80% |
| | 8 | | For each class of the Fund, expenses are equal to the annualized expense ratio for the class, multiplied by the average account value over the period, multiplied by 182/365 (to reflect the one-half year period shown). The fees and expenses of the underlying funds in which the Fund invests are not included in the Fund’s annualized expense ratio. |
| | 9 | | Hypothetical 5% annual return before expenses is calculated by prorating the number of days in the most recent fiscal half year divided by 365. |
| | | | See “Disclosure of Expenses” on page 6 for further information on how expenses were calculated. |
| | | | | | |
| | | BLACKROCK MANAGED VOLATILITY PORTFOLIO | | MARCH 31, 2015 | | 5 |
| Ÿ | | Institutional Shares are not subject to any sales charge. These shares bear no ongoing distribution or service fees and are available only to certain eligible investors. |
| Ÿ | | Service Shares are not subject to any sales charge. These shares are subject to a service fee of 0.25% per year (but no distribution fee) and are only available to certain eligible investors. |
| Ÿ | | Investor A Shares are subject to a maximum initial sales charge (front-end load) of 5.25% and a service fee of 0.25% per year (but no distribution fee). Certain redemptions of these shares may be subject to a contingent deferred sales charge (“CDSC”) where no initial sales charge was paid at the time of purchase. These shares are generally available through financial intermediaries. |
| Ÿ | | Investor B Shares are subject to a maximum CDSC of 4.50%, declining to 0% after six years. In addition, these shares are subject to a distribution fee of 0.75% per year and a service fee of 0.25% per year. These shares automatically convert to Investor A Shares after approximately eight years. (There is no initial sales charge for automatic share conversions.) All returns for periods greater than eight years reflect this conversion. These shares are only available through exchanges and distribution reinvestments by current holders and for purchase by certain employer-sponsored retirement plans. |
| Ÿ | | Investor C Shares are subject to a 1.00% CDSC if redeemed within one year of purchase. In addition, these shares are subject to a distribution |
fee of 0.75% per year and a service fee of 0.25% per year. These shares are generally available through financial intermediaries.
Performance information reflects past performance and does not guarantee future results. Current performance may be lower or higher than the performance data quoted. Refer to www.blackrock.com/funds to obtain performance data current to the most recent month end. Performance results do not reflect the deduction of taxes that a shareholder would pay on fund distributions or the redemption of fund shares. Figures shown in the performance table on the previous page assume reinvestment of all distributions, if any, at net asset value (“NAV”) on the ex-dividend date. Investment return and principal value of shares will fluctuate so that shares, when redeemed, may be worth more or less than their original cost. Distributions paid to each class of shares will vary because of the different levels of service, distribution and transfer agency fees applicable to each class, which are deducted from the income available to be paid to shareholders.
BlackRock Advisors, LLC (the “Manager”), the Fund’s investment advisor, has contractually agreed to waive and/or reimburse a portion of the Fund’s expenses. Without such waiver and/or reimbursement, the Fund’s performance would have been lower. The Manager is under no obligation to continue waiving and/or reimbursing its fees after the applicable termination date of such agreement. See Note 5 of the Notes to Financial Statements for additional information on waivers and/or reimbursements.
Shareholders of the Fund may incur the following charges: (a) transactional expenses, such as sales charges; and (b) operating expenses, including investment advisory fees, administration fees, service and distribution fees, including 12b-1 fees, acquired fund fees and expenses and other Fund expenses. The expense example on the previous page (which is based on a hypothetical investment of $1,000 invested on October 1, 2014 and held through March 31, 2015) is intended to assist shareholders both in calculating expenses based on an investment in the Fund and in comparing these expenses with similar costs of investing in other mutual funds.
The expense example provides information about actual account values and actual expenses. In order to estimate the expenses a shareholder paid during the period covered by this report, shareholders can divide their account value by $1,000 and then multiply the result by the number corresponding to their share class under the heading entitled “Expenses Paid During the Period.”
The expense example also provides information about hypothetical account values and hypothetical expenses based on the Fund’s actual expense ratio and an assumed rate of return of 5% per year before expenses. In order to assist shareholders in comparing the ongoing expenses of investing in the Fund and other funds, compare the 5% hypothetical example with the 5% hypothetical examples that appear in shareholder reports of other funds.
The expenses shown in the expense example are intended to highlight shareholders’ ongoing costs only and do not reflect any transactional expenses, such as sales charges, if any. Therefore, the hypothetical example is useful in comparing ongoing expenses only, and will not help shareholders determine the relative total expenses of owning different funds. If these transactional expenses were included, shareholder expenses would have been higher.
| | | | | | |
| 6 | | BLACKROCK MANAGED VOLATILITY PORTFOLIO | | MARCH 31, 2015 | | |
| | |
| Derivative Financial Instruments | | |
| | |
The Fund may invest in various derivative financial instruments. Derivative financial instruments are used to obtain exposure to a security, index and/or market without owning or taking physical custody of securities or to manage equity, credit, interest rate, foreign currency exchange rate, commodity and/or other risks. Derivative financial instruments may give rise to a form of economic leverage. Derivative financial instruments also involve risks, including the imperfect correlation between the value of a derivative financial instrument and the underlying asset, possible default of the counterparty to the transaction or illiquidity of the derivative
financial instrument. The Fund’s ability to use a derivative financial instrument successfully depends on the investment advisor’s ability to predict pertinent market movements accurately, which cannot be assured. The use of derivative financial instruments may result in losses greater than if they had not been used, may limit the amount of appreciation the Fund can realize on an investment and/or may result in lower distributions paid to shareholders. The Fund’s investments in these instruments are discussed in detail in the Notes to Financial Statements.
| | | | | | |
| | | BLACKROCK MANAGED VOLATILITY PORTFOLIO | | MARCH 31, 2015 | | 7 |
| | | | |
| Schedule of Investments March 31, 2015 (Unaudited) | | | | |
| | | (Percentages shown are based on Net Assets) | |
| | | | | | | | | | | | |
| Asset-Backed Securities (a) | | | | | Par (000) | | | Value | |
Amortizing Residential Collateral Trust, Series 2002-BC5, Class M2, 1.96%, 7/25/32 | | | USD | | | | 9 | | | $ | 7,814 | |
Asset-Backed European Securitisation Transaction S.r.l., Series 9, Class A, 0.74%, 12/10/28 | | | EUR | | | | 215 | | | | 232,019 | |
Auto ABS, Series 2012-3, Class A, 3.25%, 9/27/24 | | | | | | | 382 | | | | 411,229 | |
Bumper Mortgage, Series 2014-6, Class A, 0.44%, 3/19/29 | | | | | | | 400 | | | | 430,937 | |
Driver GmbH, Series 12, Class A, 0.35%, 5/22/20 | | | | | | | 389 | | | | 418,718 | |
E-Carat PLC, Series 5, Class A, 0.91%, 4/18/23 | | | GBP | | | | 500 | | | | 741,760 | |
Knollwood CDO Ltd., Series 2004-1A, Class C, 3.50% (3.50% Cash or PIK), 1/10/39 (b)(c) | | | USD | | | | 138 | | | | 1 | |
MOTOR PLC, Series 2015-1X, Class A2, 1.00%, 6/25/22 | | | GBP | | | | 345 | | | | 511,778 | |
SMART Trust, Series 2014-2E, Class AE, 0.42%, 6/14/21 | | | EUR | | | | 369 | | | | 396,153 | |
Sunrise S.r.l., Series 2014-1, Class A, 1.15%, 5/27/31 | | | | | | | 117 | | | | 126,026 | |
Turbo Finance PLC, Series 5, Class A, 0.98%, 8/20/21 | | | GBP | | | | 420 | | | | 623,779 | |
Total Asset-Backed Securities — 0.5% | | | | | | | | | | | 3,900,214 | |
| | | | | | | | | | | | |
| Common Stocks | | | | | Shares | | | | |
Aerospace & Defense — 1.1% | | | | | | | | | | | | |
Airbus Group NV | | | | | | | 58,934 | | | | 3,831,337 | |
Finmeccanica SpA (d) | | | | | | | 36,412 | | | | 432,505 | |
MTU Aero Engines AG | | | | | | | 3,317 | | | | 324,963 | |
Safran SA | | | | | | | 27,747 | | | | 1,938,718 | |
Thales SA | | | | | | | 12,552 | | | | 696,412 | |
Zodiac Aerospace | | | | | | | 17,843 | | | | 590,361 | |
| | | | | | | | | | | | |
| | | | | | | | | | | | 7,814,296 | |
Air Freight & Logistics — 1.2% | | | | | | | | | | | | |
Bollore SA | | | | | | | 173,964 | | | | 926,915 | |
bpost SA | | | | | | | 13,228 | | | | 371,252 | |
Deutsche Post AG, Registered Shares | | | | | | | 142,175 | | | | 4,429,429 | |
Kintetsu World Express, Inc. | | | | | | | 2,200 | | | | 98,885 | |
Oesterreichische Post AG | | | | | | | 4,290 | | | | 211,266 | |
PostNL NV (d) | | | | | | | 28,998 | | | | 123,192 | |
| | | | | | | | |
| Common Stocks | | Shares | | | Value | |
Air Freight & Logistics (concluded) | | | | | | | | |
Royal Mail PLC | | | 378,650 | | | $ | 2,455,987 | |
TNT Express NV | | | 35,236 | | | | 223,811 | |
Yamato Holdings Co. Ltd. | | | 9,100 | | | | 209,743 | |
| | | | | | | | |
| | | | | | | | 9,050,480 | |
Airlines — 0.2% | | | | | | | | |
ANA Holdings, Inc. | | | 78,000 | | | | 208,819 | |
Deutsche Lufthansa AG, Registered Shares | | | 31,366 | | | | 439,206 | |
International Consolidated Airlines Group SA (d) | | | 125,213 | | | | 1,121,891 | |
| | | | | | | | |
| | | | | | | | 1,769,916 | |
Auto Components — 1.6% | | | | | | | | |
Aisin Seiki Co. Ltd. | | | 5,400 | | | | 195,779 | |
Autoliv, Inc. | | | 1,090 | | | | 128,369 | |
BorgWarner, Inc. | | | 1,803 | | | | 109,045 | |
Brembo SpA | | | 4,373 | | | | 178,696 | |
Bridgestone Corp. | | | 8,700 | | | | 348,347 | |
Calsonic Kansei Corp. | | | 11,000 | | | | 72,796 | |
Cie Generale des Etablissements Michelin | | | 11,850 | | | | 1,178,418 | |
Continental AG | | | 12,458 | | | | 2,933,803 | |
Cooper Tire & Rubber Co. | | | 3,067 | | | | 131,390 | |
Dana Holding Corp. | | | 4,484 | | | | 94,881 | |
Delphi Automotive PLC | | | 2,348 | | | | 187,230 | |
Denso Corp. | | | 8,500 | | | | 387,475 | |
Eagle Industry Co. Ltd. | | | 3,200 | | | | 64,640 | |
ElringKlinger AG | | | 4,002 | | | | 119,982 | |
Exedy Corp. | | | 3,300 | | | | 78,600 | |
Faurecia | | | 7,841 | | | | 341,914 | |
FCC Co. Ltd. | | | 4,300 | | | | 67,015 | |
Gentex Corp. | | | 5,289 | | | | 96,789 | |
The Goodyear Tire & Rubber Co. | | | 4,945 | | | | 133,911 | |
Johnson Controls, Inc. | | | 5,018 | | | | 253,108 | |
Koito Manufacturing Co. Ltd. | | | 4,600 | | | | 138,316 | |
Leoni AG | | | 2,067 | | | | 130,567 | |
Mitsuba Corp. | | | 2,700 | | | | 59,619 | |
NGK Spark Plug Co. Ltd. | | | 6,000 | | | | 161,064 | |
NHK Spring Co. Ltd. | | | 8,900 | | | | 92,588 | |
Nifco, Inc. | | | 2,900 | | | | 99,967 | |
Nippon Seiki Co. Ltd. | | | 5,000 | | | | 98,536 | |
Nissin Kogyo Co. Ltd. | | | 4,900 | | | | 77,823 | |
NOK Corp. | | | 4,500 | | | | 135,304 | |
Nokian Renkaat OYJ | | | 9,331 | | | | 278,080 | |
Pirelli & C. SpA | | | 31,566 | | | | 522,501 | |
Plastic Omnium SA | | | 9,451 | | | | 249,075 | |
Showa Corp. | | | 6,300 | | | | 63,592 | |
Stanley Electric Co. Ltd. | | | 5,200 | | | | 117,376 | |
Sumitomo Electric Industries Ltd. | | | 14,600 | | | | 191,383 | |
| | | | | | | | | | |
| Portfolio Abbreviations |
| ADR | | American Depositary Receipts | | GBP | | British Pound | | PIK | | Payment-in-kind |
| AUD | | Australian Dollar | | ILS | | Israeli Shekel | | PLN | | Polish Zloty |
| BRL | | Brazilian Real | | INR | | Indian Rupee | | REIT | | Real Estate Investment Trust |
| CAD | | Canadian Dollar | | JPY | | Japanese Yen | | S&P | | Standard & Poor’s |
| CDO | | Collateralized Debt Obligation | | KRW | | Korean Won | | SEK | | Swedish Krona |
| CHF | | Swiss Franc | | LIBOR | | London Interbank Offered Rate | | SGD | | Singapore Dollar |
| CZK | | Czech Koruna | | LP | | Limited Partnership | | TBA | | To-be-announced |
| DKK | | Danish Krone | | MXN | | Mexican Peso | | THB | | Thai Baht |
| ETF | | Exchange Traded Fund | | MYR | | Malaysian Ringgit | | TRY | | Turkish Lira |
| EUR | | Euro | | NOK | | Norwegian Krone | | TWD | | Taiwan New Dollar |
| EURIBOR | | Euro Interbank Offer Rate | | NZD | | New Zealand Dollar | | USD | | U.S. Dollar |
| FTSE | | Financial Times Stock Exchange | | OTC | | Over-the-counter | | ZAR | | South African Rand |
See Notes to Financial Statements.
| | | | | | |
| 8 | | BLACKROCK MANAGED VOLATILITY PORTFOLIO | | MARCH 31, 2015 | | |
| | | | |
| Schedule of Investments (continued) | | | | |
| | | (Percentages shown are based on Net Assets) | |
| | | | | | | | |
| Common Stocks | | Shares | | | Value | |
Auto Components (concluded) | | | | | | | | |
Sumitomo Rubber Industries Ltd. | | | 6,500 | | | $ | 119,817 | |
Tenneco, Inc. (d) | | | 1,900 | | | | 109,098 | |
Tokai Rika Co. Ltd. | | | 4,500 | | | | 104,291 | |
Topre Corp. | | | 4,600 | | | | 71,813 | |
Toyo Tire & Rubber Co. Ltd. | | | 4,900 | | | | 88,030 | |
Toyoda Gosei Co. Ltd. | | | 4,700 | | | | 104,919 | |
Toyota Industries Corp. | | | 4,500 | | | | 257,386 | |
TPR Co. Ltd. | | | 2,300 | | | | 61,568 | |
TRW Automotive Holdings Corp. (d) | | | 1,071 | | | | 112,294 | |
TS Tech Co. Ltd. | | | 3,200 | | | | 86,289 | |
Unipres Corp. | | | 3,300 | | | | 67,297 | |
Valeo SA | | | 4,915 | | | | 733,095 | |
The Yokohama Rubber Co. Ltd. | | | 10,000 | | | | 103,081 | |
| | | | | | | | |
| | | | | | | | 11,536,957 | |
Automobiles — 3.9% | | | | | | | | |
Bayerische Motoren Werke AG | | | 39,332 | | | | 4,898,196 | |
Daihatsu Motor Co. Ltd. | | | 10,400 | | | | 159,074 | |
Daimler AG, Registered Shares | | | 67,143 | | | | 6,448,034 | |
Fiat Chrysler Automobiles NV (d) | | | 83,756 | | | | 1,359,695 | |
Ford Motor Co. | | | 30,690 | | | | 495,337 | |
Fuji Heavy Industries Ltd. | | | 10,400 | | | | 345,241 | |
General Motors Co. | | | 13,126 | | | | 492,225 | |
Harley-Davidson, Inc. | | | 4,879 | | | | 296,350 | |
Honda Motor Co. Ltd. | | | 13,000 | | | | 424,358 | |
Isuzu Motors Ltd. | | | 14,900 | | | | 197,685 | |
Mazda Motor Corp. | | | 134,900 | | | | 2,733,321 | |
Mitsubishi Motors Corp. | | | 21,200 | | | | 191,155 | |
Nissan Motor Co. Ltd. | | | 33,700 | | | | 342,748 | |
Peugeot SA | | | 49,901 | | | | 834,122 | |
Porsche Automobil Holding SE, Preference Shares | | | 10,095 | | | | 988,583 | |
Renault SA | | | 20,101 | | | | 1,825,767 | |
Suzuki Motor Corp. | | | 9,600 | | | | 288,328 | |
Tesla Motors, Inc. (d) | | | 2,443 | | | | 461,165 | |
Thor Industries, Inc. | | | 3,341 | | | | 211,185 | |
Toyota Motor Corp. | | | 12,900 | | | | 900,468 | |
Volkswagen AG | | | 18,790 | | | | 4,831,308 | |
Yamaha Motor Co. Ltd. | | | 6,800 | | | | 163,816 | |
| | | | | | | | |
| | | | | | | | 28,888,161 | |
Banks — 1.2% | | | | | | | | |
Aozora Bank Ltd. | | | 40,000 | | | | 141,782 | |
The Bank of Yokohama Ltd. | | | 25,000 | | | | 146,416 | |
The Chiba Bank Ltd. | | | 19,000 | | | | 139,252 | |
The Chugoku Bank Ltd. | | | 8,000 | | | | 119,456 | |
Fukuoka Financial Group, Inc. | | | 26,000 | | | | 133,705 | |
The Gunma Bank Ltd. | | | 16,000 | | | | 108,088 | |
The Hachijuni Bank Ltd. | | | 17,000 | | | | 119,869 | |
The Hiroshima Bank Ltd. | | | 20,000 | | | | 107,787 | |
Hokuhoku Financial Group, Inc. | | | 52,000 | | | | 115,912 | |
ING Groep NV — CVA (d) | | | 125,473 | | | | 1,837,918 | |
The Iyo Bank Ltd. | | | 10,800 | | | | 128,080 | |
The Joyo Bank Ltd. | | | 25,000 | | | | 128,479 | |
KBC Groep NV | | | 25,839 | | | | 1,596,904 | |
The Keiyo Bank Ltd. | | | 15,000 | | | | 86,833 | |
Mitsubishi UFJ Financial Group, Inc. | | | 81,700 | | | | 506,002 | |
Mizuho Financial Group, Inc. | | | 213,400 | | | | 375,046 | |
The Nishi-Nippon City Bank Ltd. | | | 36,000 | | | | 104,348 | |
North Pacific Bank Ltd. | | | 18,800 | | | | 70,954 | |
Resona Holdings, Inc. | | | 41,700 | | | | 206,947 | |
Senshu Ikeda Holdings, Inc. | | | 15,700 | | | | 74,551 | |
Seven Bank Ltd. | | | 32,200 | | | | 158,770 | |
Shinsei Bank Ltd. | | | 70,000 | | | | 139,184 | |
The Shizuoka Bank Ltd. | | | 14,000 | | | | 139,631 | |
Société Générale SA | | | 28,190 | | | | 1,361,065 | |
| | | | | | | | |
| Common Stocks | | Shares | | | Value | |
Banks (concluded) | | | | | | | | |
Sumitomo Mitsui Financial Group, Inc. | | | 10,900 | | | $ | 417,520 | |
Sumitomo Mitsui Trust Holdings, Inc. | | | 57,000 | | | | 236,782 | |
Suruga Bank Ltd. | | | 6,700 | | | | 139,137 | |
Yamaguchi Financial Group, Inc. | | | 9,000 | | | | 103,440 | |
| | | | | | | | |
| | | | | | | | 8,943,858 | |
Beverages — 0.4% | | | | | | | | |
Asahi Group Holdings Ltd. | | | 7,400 | | | | 234,643 | |
Brown-Forman Corp., Class B | | | 1,742 | | | | 157,390 | |
The Coca-Cola Co. | | | 13,304 | | | | 539,477 | |
Constellation Brands, Inc., Class A (d) | | | 3,311 | | | | 384,771 | |
Dr Pepper Snapple Group, Inc. | | | 4,790 | | | | 375,919 | |
Ito En Ltd. | | | 4,500 | | | | 97,073 | |
Kirin Holdings Co. Ltd. | | | 15,100 | | | | 198,056 | |
Monster Beverage Corp. (d) | | | 4,101 | | | | 567,558 | |
PepsiCo, Inc. | | | 6,908 | | | | 660,543 | |
| | | | | | | | |
| | | | | | | | 3,215,430 | |
Biotechnology — 0.2% | | | | | | | | |
Genmab A/S (d) | | | 23,623 | | | | 1,772,931 | |
Building Products — 0.6% | | | | | | | | |
Aica Kogyo Co. Ltd. | | | 4,300 | | | | 100,127 | |
Asahi Glass Co. Ltd. | | | 27,000 | | | | 176,850 | |
Bunka Shutter Co. Ltd. | | | 7,000 | | | | 57,891 | |
Cie de Saint-Gobain | | | 78,108 | | | | 3,429,498 | |
Daikin Industries Ltd. | | | 4,200 | | | | 280,787 | |
LIXIL Group Corp. | | | 7,100 | | | | 168,027 | |
Nichias Corp. | | | 10,000 | | | | 57,677 | |
Sankyo Tateyama, Inc. | | | 2,700 | | | | 52,148 | |
Sanwa Holdings Corp. | | | 11,900 | | | | 88,278 | |
TOTO Ltd. | | | 8,000 | | | | 118,792 | |
Wienerberger AG | | | 7,642 | | | | 121,945 | |
| | | | | | | | |
| | | | | | | | 4,652,020 | |
Capital Markets — 0.2% | | | | | | | | |
Daiwa Securities Group, Inc. | | | 30,000 | | | | 236,157 | |
Ichiyoshi Securities Co. Ltd. | | | 4,900 | | | | 53,021 | |
Jafco Co. Ltd. | | | 2,400 | | | | 89,139 | |
kabu.com Securities Co. Ltd. | | | 12,700 | | | | 83,305 | |
Kyokuto Securities Co. Ltd. | | | 3,400 | | | | 50,070 | |
Matsui Securities Co. Ltd. | | | 9,300 | | | | 84,369 | |
Nomura Holdings, Inc. | | | 43,500 | | | | 255,503 | |
Okasan Securities Group, Inc. | | | 10,000 | | | | 79,347 | |
SBI Holdings, Inc. | | | 9,200 | | | | 111,369 | |
Tokai Tokyo Financial Holdings, Inc. | | | 12,200 | | | | 93,981 | |
| | | | | | | | |
| | | | | | | | 1,136,261 | |
Chemicals — 1.1% | | | | | | | | |
Air Water, Inc. | | | 5,000 | | | | 89,289 | |
Akzo Nobel NV | | | 25,805 | | | | 1,951,099 | |
Asahi Kasei Corp. | | | 21,000 | | | | 200,542 | |
Daicel Corp. | | | 10,300 | | | | 122,771 | |
Denki Kagaku Kogyo KK | | | 22,000 | | | | 86,673 | |
DIC Corp. | | | 29,000 | | | | 84,316 | |
Hitachi Chemical Co. Ltd. | | | 6,200 | | | | 132,392 | |
JSR Corp. | | | 8,000 | | | | 138,537 | |
Kansai Paint Co. Ltd. | | | 7,000 | | | | 127,398 | |
Kuraray Co. Ltd. | | | 11,000 | | | | 148,937 | |
Mitsubishi Chemical Holdings Corp. | | | 31,100 | | | | 180,538 | |
Nihon Parkerizing Co. Ltd. | | | 7,400 | | | | 89,514 | |
Nippon Kayaku Co. Ltd. | | | 8,000 | | | | 100,165 | |
Nippon Paint Holdings Co. Ltd. | | | 4,900 | | | | 179,128 | |
The Nippon Synthetic Chemical Industry Co. Ltd. | | | 8,000 | | | | 53,093 | |
Nissan Chemical Industries Ltd. | | | 5,200 | | | | 107,457 | |
Nitto Denko Corp. | | | 3,300 | | | | 220,354 | |
See Notes to Financial Statements.
| | | | | | |
| | | BLACKROCK MANAGED VOLATILITY PORTFOLIO | | MARCH 31, 2015 | | 9 |
| | | | |
| Schedule of Investments (continued) | | | | |
| | | (Percentages shown are based on Net Assets) | |
| | | | | | | | |
| Common Stocks | | Shares | | | Value | |
Chemicals (concluded) | | | | | | | | |
NOF Corp. | | | 11,000 | | | $ | 81,599 | |
OCI NV (d) | | | 13,739 | | | | 425,183 | |
Shin-Etsu Chemical Co. Ltd. | | | 5,400 | | | | 352,556 | |
Sumitomo Chemical Co. Ltd. | | | 40,000 | | | | 205,298 | |
Syngenta AG, Registered Shares | | | 6,585 | | | | 2,237,113 | |
Taiyo Holdings Co. Ltd. | | | 2,400 | | | | 84,324 | |
Taiyo Nippon Sanso Corp. | | | 10,000 | | | | 136,078 | |
Toray Industries, Inc. | | | 26,000 | | | | 217,620 | |
Tosoh Corp. | | | 21,000 | | | | 105,777 | |
Zeon Corp. | | | 10,000 | | | | 92,260 | |
| | | | | | | | |
| | | | | | | | 7,950,011 | |
Commercial Services & Supplies — 0.2% | | | | | | | | |
Aeon Delight Co. Ltd. | | | 3,000 | | | | 71,724 | |
Bilfinger SE | | | 3,106 | | | | 179,528 | |
Dai Nippon Printing Co. Ltd. | | | 19,000 | | | | 184,550 | |
Edenred | | | 14,919 | | | | 372,226 | |
Park24 Co. Ltd. | | | 4,900 | | | | 100,253 | |
Pilot Corp. | | | 1,400 | | | | 78,727 | |
Secom Co. Ltd. | | | 3,700 | | | | 246,791 | |
Societe BIC SA | | | 3,052 | | | | 434,819 | |
Sohgo Security Services Co. Ltd. | | | 4,000 | | | | 136,115 | |
| | | | | | | | |
| | | | | | | | 1,804,733 | |
Communications Equipment — 0.0% | | | | | | | | |
Hitachi Kokusai Electric, Inc. | | | 6,000 | | | | 80,380 | |
Construction & Engineering — 1.1% | | | | | | | | |
Abengoa SA, B Shares | | | 50,524 | | | | 183,090 | |
ACS Actividades de Construccion y Servicios SA | | | 20,245 | | | | 716,555 | |
Arcadis NV | | | 5,529 | | | | 177,563 | |
Boskalis Westminster NV | | | 7,897 | | | | 389,231 | |
Bouygues SA | | | 21,746 | | | | 853,653 | |
Chiyoda Corp. | | | 12,000 | | | | 102,511 | |
COMSYS Holdings Corp. | | | 7,700 | | | | 94,993 | |
Eiffage SA | | | 5,707 | | | | 339,653 | |
Ferrovial SA | | | 48,235 | | | | 1,025,571 | |
Fomento de Construcciones y Contratas SA (d) | | | 10,718 | | | | 130,525 | |
Hazama Ando Corp. | | | 13,700 | | | | 78,270 | |
HOCHTIEF AG | | | 4,679 | | | | 354,046 | |
JGC Corp. | | | 7,000 | | | | 139,003 | |
Kajima Corp. | | | 34,000 | | | | 157,631 | |
Kyowa Exeo Corp. | | | 7,100 | | | | 76,141 | |
Maeda Road Construction Co. Ltd. | | | 6,000 | | | | 97,265 | |
Nippo Corp. | | | 5,000 | | | | 82,419 | |
Obayashi Corp. | | | 24,000 | | | | 155,569 | |
Obrascon Huarte Lain SA | | | 7,324 | | | | 155,868 | |
Orascom Construction Ltd. (d) | | | 6,870 | | | | 91,364 | |
Outotec OYJ (e) | | | 8,305 | | | | 50,834 | |
Sacyr SA (d) | | | 32,259 | | | | 135,366 | |
Shimizu Corp. | | | 25,000 | | | | 169,020 | |
Sumitomo Mitsui Construction Co. Ltd. | | | 54,800 | | | | 75,599 | |
Taisei Corp. | | | 28,000 | | | | 158,040 | |
Toshiba Plant Systems & Services Corp. | | | 6,600 | | | | 90,933 | |
Vinci SA | | | 36,099 | | | | 2,062,462 | |
| | | | | | | | |
| | | | | | | | 8,143,175 | |
Construction Materials — 0.0% | | | | | | | | |
Sumitomo Osaka Cement Co. Ltd. | | | 27,000 | | | | 82,941 | |
Taiheiyo Cement Corp. | | | 34,000 | | | | 103,812 | |
| | | | | | | | |
| | | | | | | | 186,753 | |
Consumer Finance — 0.1% | | | | | | | | |
Acom Co. Ltd. (d) | | | 43,200 | | | | 149,805 | |
AEON Financial Service Co. Ltd. | | | 4,900 | | | | 123,608 | |
Aiful Corp. (d) | | | 25,000 | | | | 88,668 | |
Credit Saison Co. Ltd. | | | 5,700 | | | | 102,251 | |
| | | | | | | | |
| Common Stocks | | Shares | | | Value | |
Consumer Finance (concluded) | | | | | | | | |
Hitachi Capital Corp. | | | 4,400 | | | $ | 92,872 | |
J Trust Co. Ltd. | | | 9,700 | | | | 83,564 | |
Orient Corp. (d) | | | 47,200 | | | | 76,629 | |
| | | | | | | | |
| | | | | | | | 717,397 | |
Containers & Packaging — 0.0% | | | | | | | | |
FP Corp. | | | 2,400 | | | | 87,036 | |
Distributors — 0.1% | | | | | | | | |
D’ieteren SA/NV | | | 3,839 | | | | 134,651 | |
Genuine Parts Co. | | | 4,155 | | | | 387,204 | |
LKQ Corp. (d) | | | 10,234 | | | | 261,581 | |
Pool Corp. | | | 2,662 | | | | 185,701 | |
| | | | | | | | |
| | | | | | | | 969,137 | |
Diversified Consumer Services — 0.1% | | | | | | | | |
Apollo Education Group, Inc. (d) | | | 8,070 | | | | 152,684 | |
Benesse Holdings, Inc. | | | 4,400 | | | | 138,415 | |
Bright Horizons Family Solutions, Inc. (d) | | | 3,434 | | | | 176,061 | |
Graham Holdings Co., Class B | | | 243 | | | | 255,060 | |
Service Corp. International | | | 9,266 | | | | 241,379 | |
| | | | | | | | |
| | | | | | | | 963,599 | |
Diversified Financial Services — 0.1% | | | | | | | | |
Century Tokyo Leasing Corp. | | | 3,200 | | | | 97,479 | |
Fuyo General Lease Co. Ltd. | | | 1,800 | | | | 72,318 | |
IBJ Leasing Co. Ltd. | | | 2,800 | | | | 57,907 | |
Japan Exchange Group, Inc. | | | 4,900 | | | | 141,869 | |
Mitsubishi UFJ Lease & Finance Co. Ltd. | | | 22,400 | | | | 110,696 | |
ORIX Corp. | | | 18,000 | | | | 252,920 | |
Ricoh Leasing Co. Ltd. | | | 2,000 | | | | 59,350 | |
| | | | | | | | |
| | | | | | | | 792,539 | |
Diversified Telecommunication Services — 0.1% | | | | | | | | |
Nippon Telegraph & Telephone Corp. | | | 7,700 | | | | 475,329 | |
Electric Utilities — 0.1% | | | | | | | | |
Tohoku Electric Power Co., Inc. | | | 15,500 | | | | 176,056 | |
Tokyo Electric Power Co., Inc. (d) | | | 42,900 | | | | 162,374 | |
| | | | | | | | |
| | | | | | | | 338,430 | |
Electrical Equipment — 1.1% | | | | | | | | |
Alstom SA (d) | | | 20,873 | | | | 642,284 | |
AMETEK, Inc. | | | 29,794 | | | | 1,565,377 | |
Fuji Electric Co. Ltd. | | | 21,000 | | | | 99,078 | |
Gamesa Corp Tecnologica SA (d) | | | 18,517 | | | | 233,194 | |
GS Yuasa Corp. | | | 20,000 | | | | 90,004 | |
Legrand SA | | | 16,685 | | | | 903,786 | |
Mitsubishi Electric Corp. | | | 25,000 | | | | 296,787 | |
Nexans SA (d) | | | 2,803 | | | | 94,783 | |
Nidec Corp. | | | 4,400 | | | | 292,080 | |
OSRAM Licht AG | | | 6,733 | | | | 333,302 | |
Prysmian SpA | | | 13,572 | | | | 279,716 | |
Schneider Electric SE | | | 40,785 | | | | 3,173,827 | |
SGL Carbon SE (d)(e) | | | 6,296 | | | | 102,242 | |
| | | | | | | | |
| | | | | | | | 8,106,460 | |
Electronic Equipment, Instruments & Components — 0.5% | | | | | |
Alps Electric Co. Ltd. | | | 5,400 | | | | 130,028 | |
Anritsu Corp. | | | 9,900 | | | | 69,131 | |
Enplas Corp. | | | 1,600 | | | | 63,994 | |
Hamamatsu Photonics KK | | | 4,800 | | | | 144,682 | |
Hirose Electric Co. Ltd. | | | 1,155 | | | | 148,707 | |
Hitachi High-Technologies Corp. | | | 4,000 | | | | 121,729 | |
Hitachi Ltd. | | | 50,000 | | | | 341,493 | |
Horiba Ltd. | | | 2,400 | | | | 91,689 | |
Hoya Corp. | | | 6,500 | | | | 260,223 | |
Japan Aviation Electronics Industry Ltd. | | | 4,000 | | | | 96,591 | |
See Notes to Financial Statements.
| | | | | | |
| 10 | | BLACKROCK MANAGED VOLATILITY PORTFOLIO | | MARCH 31, 2015 | | |
| | | | |
| Schedule of Investments (continued) | | | | |
| | | (Percentages shown are based on Net Assets) | |
| | | | | | | | |
| Common Stocks | | Shares | | | Value | |
Electronic Equipment, Instruments & Components (concluded) | |
Keyence Corp. | | | 600 | | | $ | 327,418 | |
Kyocera Corp. | | | 5,400 | | | | 295,125 | |
Murata Manufacturing Co. Ltd. | | | 2,300 | | | | 315,880 | |
Oki Electric Industry Co. Ltd. | | | 39,000 | | | | 80,731 | |
Omron Corp. | | | 4,000 | | | | 180,197 | |
Shimadzu Corp. | | | 11,000 | | | | 122,506 | |
Tabuchi Electric Co. Ltd. | | | 4,300 | | | | 49,134 | |
TDK Corp. | | | 3,100 | | | | 219,503 | |
Topcon Corp. | | | 4,700 | | | | 115,134 | |
Yaskawa Electric Corp. | | | 7,300 | | | | 106,684 | |
Yokogawa Electric Corp. | | | 11,700 | | | | 126,050 | |
| | | | | | | | |
| | | | | | | | 3,406,629 | |
Food & Staples Retailing — 1.2% | | | | | | | | |
Aeon Co. Ltd. | | | 18,800 | | | | 206,225 | |
Ain Pharmaciez, Inc. | | | 1,900 | | | | 75,257 | |
Casey’s General Stores, Inc. | | | 2,390 | | | | 215,339 | |
Cosmos Pharmaceutical Corp. | | | 700 | | | | 109,385 | |
Costco Wholesale Corp. | | | 4,442 | | | | 672,941 | |
CVS Health Corp. | | | 11,727 | | | | 1,210,344 | |
FamilyMart Co. Ltd. | | | 3,300 | | | | 138,265 | |
The Fresh Market, Inc. (d) | | | 4,420 | | | | 179,629 | |
The Kroger Co. | | | 8,968 | | | | 687,487 | |
Kusuri No Aoki Co. Ltd. | | | 1,000 | | | | 75,110 | |
Lawson, Inc. | | | 2,300 | | | | 159,436 | |
Matsumotokiyoshi Holdings Co. Ltd. | | | 2,400 | | | | 85,401 | |
Mitsubishi Shokuhin Co. Ltd. | | | 3,700 | | | | 77,395 | |
Rite Aid Corp. (d) | | | 38,496 | | | | 334,530 | |
Seven & i Holdings Co. Ltd. | | | 8,900 | | | | 374,007 | |
Sugi Holdings Co. Ltd. | | | 2,400 | | | | 118,695 | |
Sundrug Co. Ltd. | | | 2,200 | | | | 114,196 | |
Sysco Corp. | | | 12,474 | | | | 470,644 | |
Tsuruha Holdings, Inc. | | | 1,700 | | | | 130,137 | |
United Natural Foods, Inc. (d) | | | 2,846 | | | | 219,256 | |
Valor Co. Ltd. | | | 3,200 | | | | 69,096 | |
Walgreens Boots Alliance, Inc. | | | 12,221 | | | | 1,034,874 | |
Wal-Mart Stores, Inc. | | | 15,652 | | | | 1,287,377 | |
Welcia Holdings Co. Ltd. | | | 2,200 | | | | 82,142 | |
Whole Foods Market, Inc. | | | 8,824 | | | | 459,554 | |
| | | | | | | | |
| | | | | | | | 8,586,722 | |
Food Products — 1.1% | | | | | | | | |
Ajinomoto Co., Inc. | | | 9,000 | | | | 197,446 | |
Archer-Daniels-Midland Co. | | | 7,388 | | | | 350,191 | |
Bunge Ltd. | | | 1,137 | | | | 93,643 | |
Calbee, Inc. | | | 3,600 | | | | 156,284 | |
Campbell Soup Co. | | | 6,838 | | | | 318,309 | |
ConAgra Foods, Inc. | | | 10,917 | | | | 398,798 | |
Darling Ingredients, Inc. (d) | | | 10,008 | | | | 140,212 | |
Dean Foods Co. | | | 9,478 | | | | 156,671 | |
Ezaki Glico Co. Ltd. | | | 3,300 | | | | 133,409 | |
Flowers Foods, Inc. | | | 11,743 | | | | 267,036 | |
General Mills, Inc. | | | 8,645 | | | | 489,307 | |
The Hain Celestial Group, Inc. (d) | | | 3,043 | | | | 194,904 | |
The Hershey Co. | | | 3,692 | | | | 372,560 | |
Hormel Foods Corp. | | | 7,399 | | | | 420,633 | |
Ingredion, Inc. | | | 1,969 | | | | 153,228 | |
Kellogg Co. | | | 5,204 | | | | 343,204 | |
Keurig Green Mountain, Inc. | | | 3,737 | | | | 417,535 | |
Kewpie Corp. | | | 5,800 | | | | 141,128 | |
Kikkoman Corp. | | | 5,000 | | | | 158,546 | |
Kraft Foods Group, Inc. | | | 9,329 | | | | 812,696 | |
Lancaster Colony Corp. | | | 2,019 | | | | 192,148 | |
Maruha Nichiro Corp. | | | 4,000 | | | | 56,428 | |
McCormick & Co, Inc., Non-Voting Shares | | | 2,675 | | | | 206,269 | |
MEIJI Holdings Co. Ltd. | | | 1,400 | | | | 170,534 | |
| | | | | | | | |
| Common Stocks | | Shares | | | Value | |
Food Products (concluded) | | | | | | | | |
Mondelez International, Inc., Class A | | | 4,153 | | | $ | 149,882 | |
NH Foods Ltd. | | | 6,000 | | | | 138,262 | |
Nichirei Corp. | | | 16,000 | | | | 89,636 | |
Nissin Foods Holdings Co. Ltd. | | | 3,600 | | | | 176,926 | |
Snyder’s-Lance, Inc. | | | 5,369 | | | | 171,593 | |
Toyo Suisan Kaisha Ltd. | | | 3,600 | | | | 126,656 | |
TreeHouse Foods, Inc. (d) | | | 1,937 | | | | 164,684 | |
Tyson Foods, Inc., Class A | | | 9,457 | | | | 362,203 | |
The WhiteWave Foods Co. (d) | | | 6,678 | | | | 296,103 | |
Yakult Honsha Co. Ltd. | | | 3,400 | | | | 236,853 | |
| | | | | | | | |
| | | | | | | | 8,253,917 | |
Gas Utilities — 0.1% | | | | | | | | |
Osaka Gas Co. Ltd. | | | 41,000 | | | | 171,453 | |
Tokyo Gas Co. Ltd. | | | 35,000 | | | | 220,036 | |
| | | | | | | | |
| | | | | | | | 391,489 | |
Health Care Equipment & Supplies — 0.1% | | | | | | | | |
Asahi Intecc Co. Ltd. | | | 1,600 | | | | 111,665 | |
Nakanishi, Inc. | | | 2,300 | | | | 89,755 | |
Nihon Kohden Corp. | | | 4,000 | | | | 108,797 | |
Olympus Corp. | | | 6,000 | | | | 222,454 | |
Sysmex Corp. | | | 3,600 | | | | 199,609 | |
Terumo Corp. | | | 7,400 | | | | 194,938 | |
| | | | | | | | |
| | | | | | | | 927,218 | |
Health Care Providers & Services — 0.2% | | | | | | | | |
Alfresa Holdings Corp. | | | 8,000 | | | | 112,731 | |
Healthscope Ltd. | | | 388,383 | | | | 902,928 | |
Medipal Holdings Corp. | | | 9,100 | | | | 118,611 | |
Miraca Holdings, Inc. | | | 2,100 | | | | 96,543 | |
Ship Healthcare Holdings, Inc. | | | 3,200 | | | | 73,051 | |
| | | | | | | | |
| | | | | | | | 1,303,864 | |
Health Care Technology — 0.0% | | | | | | | | |
M3, Inc. | | | 7,900 | | | | 167,597 | |
Hotels, Restaurants & Leisure — 1.7% | | | | | | | | |
Accor SA | | | 15,259 | | | | 795,694 | |
Autogrill SpA (d) | | | 16,670 | | | | 161,476 | |
Brinker International, Inc. | | | 3,702 | | | | 227,895 | |
Caesars Entertainment Corp. (d) | | | 16,364 | | | | 172,313 | |
Carnival Corp. | | | 6,961 | | | | 333,014 | |
The Cheesecake Factory, Inc. | | | 3,406 | | | | 168,018 | |
Chipotle Mexican Grill, Inc. (d) | | | 788 | | | | 512,626 | |
Cracker Barrel Old Country Store, Inc. | | | 1,608 | | | | 244,641 | |
Darden Restaurants, Inc. | | | 5,078 | | | | 352,109 | |
Domino’s Pizza, Inc. | | | 2,258 | | | | 227,042 | |
GTECH SpA (e) | | | 11,736 | | | | 232,483 | |
HIS Co. Ltd. | | | 3,400 | | | | 119,397 | |
Jack in the Box, Inc. | | | 2,328 | | | | 223,302 | |
Las Vegas Sands Corp. | | | 28,450 | | | | 1,565,888 | |
Life Time Fitness, Inc. (d) | | | 3,106 | | | | 220,402 | |
Marriott International, Inc., Class A | | | 6,203 | | | | 498,225 | |
McDonald’s Corp. | | | 3,665 | | | | 357,118 | |
Melia Hotels International SA | | | 10,705 | | | | 132,083 | |
MGM Resorts International (d) | | | 11,579 | | | | 243,506 | |
Oriental Land Co. Ltd. | | | 4,000 | | | | 302,873 | |
Panera Bread Co., Class A (d) | | | 1,372 | | | | 219,513 | |
Resorttrust, Inc. | | | 4,400 | | | | 114,657 | |
Royal Caribbean Cruises Ltd. | | | 3,276 | | | | 268,141 | |
Sands China Ltd. | | | 444,000 | | | | 1,836,044 | |
Six Flags Entertainment Corp. | | | 4,569 | | | | 221,185 | |
Sodexo SA | | | 10,161 | | | | 991,032 | |
Starbucks Corp. | | | 7,562 | | | | 716,121 | |
Starwood Hotels & Resorts Worldwide, Inc. | | | 1,470 | | | | 122,745 | |
TUI AG | | | 18,071 | | | | 316,509 | |
See Notes to Financial Statements.
| | | | | | |
| | | BLACKROCK MANAGED VOLATILITY PORTFOLIO | | MARCH 31, 2015 | | 11 |
| | | | |
| Schedule of Investments (continued) | | | | |
| | | (Percentages shown are based on Net Assets) | |
| | | | | | | | |
| Common Stocks | | Shares | | | Value | |
Hotels, Restaurants & Leisure (concluded) | | | | | | | | |
Vail Resorts, Inc. | | | 2,415 | | | $ | 249,759 | |
The Wendy’s Co. | | | 16,991 | | | | 185,202 | |
Wyndham Worldwide Corp. | | | 3,082 | | | | 278,829 | |
Wynn Resorts Ltd. | | | 848 | | | | 106,746 | |
Yum! Brands, Inc. | | | 2,148 | | | | 169,091 | |
| | | | | | | | |
| | | | | | | | 12,885,679 | |
Household Durables — 0.7% | | | | | | | | |
Casio Computer Co. Ltd. | | | 7,400 | | | | 140,168 | |
De’ Longhi | | | 10,264 | | | | 222,162 | |
DR Horton, Inc. | | | 12,966 | | | | 369,272 | |
Fujitsu General Ltd. | | | 5,000 | | | | 65,494 | |
Garmin Ltd. | | | 3,710 | | | | 176,299 | |
Haseko Corp. | | | 10,800 | | | | 105,202 | |
Iida Group Holdings Co. Ltd. | | | 10,200 | | | | 126,893 | |
Jarden Corp. (d) | | | 4,312 | | | | 228,105 | |
Leggett & Platt, Inc. | | | 4,601 | | | | 212,060 | |
Lennar Corp., Class A | | | 6,501 | | | | 336,817 | |
MDC Holdings, Inc. | | | 4,842 | | | | 137,997 | |
Misawa Homes Co. Ltd. | | | 4,900 | | | | 42,717 | |
Mohawk Industries, Inc. (d) | | | 1,898 | | | | 352,554 | |
Newell Rubbermaid, Inc. | | | 6,453 | | | | 252,119 | |
Nikon Corp. | | | 11,100 | | | | 148,835 | |
NVR, Inc. (d) | | | 198 | | | | 263,075 | |
Panasonic Corp. | | | 30,900 | | | | 405,780 | |
Pressance Corp. | | | 1,600 | | | | 50,808 | |
PulteGroup, Inc. | | | 14,412 | | | | 320,379 | |
Rinnai Corp. | | | 1,700 | | | | 125,989 | |
SEB SA | | | 3,448 | | | | 248,681 | |
Sekisui Chemical Co. Ltd. | | | 11,000 | | | | 142,725 | |
Sekisui House Ltd. | | | 12,300 | | | | 178,596 | |
Starts Corp., Inc. | | | 4,100 | | | | 62,314 | |
Sumitomo Forestry Co. Ltd. | | | 7,800 | | | | 85,168 | |
Toll Brothers, Inc. (d) | | | 7,533 | | | | 296,348 | |
Whirlpool Corp. | | | 1,126 | | | | 227,520 | |
| | | | | | | | |
| | | | | | | | 5,324,077 | |
Household Products — 0.3% | | | | | | | | |
The Clorox Co. | | | 3,081 | | | | 340,112 | |
Colgate-Palmolive Co. | | | 3,178 | | | | 220,363 | |
Energizer Holdings, Inc. | | | 1,247 | | | | 172,148 | |
Kimberly-Clark Corp. | | | 3,430 | | | | 367,387 | |
Pigeon Corp. | | | 1,400 | | | | 117,647 | |
The Procter & Gamble Co. | | | 7,548 | | | | 618,483 | |
Spectrum Brands Holdings, Inc. | | | 1,519 | | | | 136,042 | |
Unicharm Corp. | | | 9,800 | | | | 256,564 | |
| | | | | | | | |
| | | | | | | | 2,228,746 | |
Independent Power and Renewable Electricity Producers — 0.0% | |
Electric Power Development Co. Ltd. | | | 4,700 | | | | 158,329 | |
Industrial Conglomerates — 1.1% | | | | | | | | |
Keihan Electric Railway Co. Ltd. | | | 18,000 | | | | 109,545 | |
Koninklijke Philips NV | | | 61,168 | | | | 1,735,327 | |
Rheinmetall AG | | | 2,422 | | | | 116,496 | |
Siemens AG, Registered Shares (d) | | | 57,760 | | | | 6,246,959 | |
Toshiba Corp. | | | 58,000 | | | | 243,024 | |
| | | | | | | | |
| | | | | | | | 8,451,351 | |
Insurance — 0.2% | | | | | | | | |
The Dai-ichi Life Insurance Co. Ltd. | | | 16,500 | | | | 239,334 | |
MS&AD Insurance Group Holdings, Inc. | | | 8,300 | | | | 232,367 | |
Sompo Japan Nipponkoa Holdings, Inc. | | | 6,900 | | | | 214,510 | |
Sony Financial Holdings, Inc. | | | 8,300 | | | | 133,514 | |
T&D Holdings, Inc. | | | 11,800 | | | | 162,086 | |
Tokio Marine Holdings, Inc. | | | 7,800 | | | | 294,425 | |
| | | | | | | | |
| | | | | | | | 1,276,236 | |
| | | | | | | | |
| Common Stocks | | Shares | | | Value | |
Internet & Catalog Retail — 0.6% | | | | | | | | |
Amazon.com, Inc. (d) | | | 2,085 | | | $ | 775,829 | |
Expedia, Inc. | | | 2,520 | | | | 237,208 | |
Groupon, Inc. (d) | | | 17,730 | | | | 127,833 | |
HSN, Inc. | | | 3,501 | | | | 238,873 | |
Liberty Interactive Corp., Class A (d) | | | 10,027 | | | | 292,688 | |
Liberty Ventures, Series A (d) | | | 7,002 | | | | 294,154 | |
Netflix, Inc. (d) | | | 1,142 | | | | 475,860 | |
The Priceline Group, Inc. (d) | | | 264 | | | | 307,336 | |
Rakuten, Inc. | | | 16,200 | | | | 285,252 | |
Start Today Co. Ltd. | | | 4,200 | | | | 110,565 | |
TripAdvisor, Inc. (d) | | | 15,067 | | | | 1,253,122 | |
Yoox SpA (d) | | | 4,008 | | | | 110,519 | |
| | | | | | | | |
| | | | | | | | 4,509,239 | |
Internet Software & Services — 0.1% | | | | | | | | |
COOKPAD, Inc. | | | 2,400 | | | | 109,616 | |
Dena Co. Ltd. | | | 100 | | | | 1,957 | |
F@N Communications, Inc. | | | 10,200 | | | | 86,607 | |
GMO internet, Inc. | | | 5,600 | | | | 68,798 | |
Gree, Inc. | | | 14,400 | | | | 100,196 | |
Kakaku.com, Inc. | | | 7,600 | | | | 126,112 | |
Mixi, Inc. | | | 3,200 | | | | 129,357 | |
Yahoo Japan Corp. | | | 79,100 | | | | 326,263 | |
| | | | | | | | |
| | | | | | | | 948,906 | |
IT Services — 0.2% | | | | | | | | |
Fujitsu Ltd. | | | 32,000 | | | | 218,228 | |
Itochu Techno-Solutions Corp. | | | 5,000 | | | | 103,721 | |
NEC Networks & System Integration Corp. | | | 4,100 | | | | 82,492 | |
Nomura Research Institute Ltd. | | | 4,900 | | | | 184,094 | |
NS Solutions Corp. | | | 3,200 | | | | 98,578 | |
NTT Data Corp. | | | 4,900 | | | | 212,819 | |
Obic Co. Ltd. | | | 3,300 | | | | 139,938 | |
Otsuka Corp. | | | 2,800 | | | | 119,322 | |
SCSK Corp. | | | 4,100 | | | | 114,747 | |
Transcosmos, Inc. | | | 3,800 | | | | 80,007 | |
| | | | | | | | |
| | | | | | | | 1,353,946 | |
Leisure Products — 0.2% | | | | | | | | |
Bandai Namco Holdings, Inc. | | | 7,600 | | | | 147,927 | |
Brunswick Corp. | | | 2,896 | | | | 148,999 | |
Hasbro, Inc. | | | 2,459 | | | | 155,507 | |
Heiwa Corp. | | | 4,600 | | | | 90,359 | |
Mattel, Inc. | | | 7,206 | | | | 164,657 | |
Polaris Industries, Inc. | | | 1,719 | | | | 242,551 | |
Sega Sammy Holdings, Inc. | | | 10,400 | | | | 151,533 | |
Shimano, Inc. | | | 1,500 | | | | 222,903 | |
Universal Entertainment Corp. | | | 4,500 | | | | 73,525 | |
Yamaha Corp. | | | 7,100 | | | | 123,983 | |
| | | | | | | | |
| | | | | | | | 1,521,944 | |
Machinery — 1.5% | | | | | | | | |
Aalberts Industries NV | | | 6,496 | | | | 204,444 | |
ANDRITZ AG | | | 6,455 | | | | 385,408 | |
Cargotec OYJ, B Shares | | | 3,597 | | | | 124,375 | |
CNH Industrial NV (d) | | | 82,482 | | | | 675,961 | |
Construcciones y Auxiliar de Ferrocarriles SA | | | 204 | | | | 67,826 | |
DMG MORI SEIKI AG | | | 4,731 | | | | 155,602 | |
Duerr AG | | | 2,113 | | | | 232,047 | |
Ebara Corp. | | | 20,000 | | | | 84,198 | |
FANUC Corp. | | | 1,900 | | | | 414,796 | |
GEA Group AG | | | 12,950 | | | | 622,522 | |
Hino Motors Ltd. | | | 10,500 | | | | 149,400 | |
Hitachi Construction Machinery Co. Ltd. | | | 6,700 | | | | 116,956 | |
Hoshizaki Electric Co. Ltd. | | | 2,300 | | | | 149,359 | |
IHI Corp. | | | 35,000 | | | | 163,651 | |
See Notes to Financial Statements.
| | | | | | |
| 12 | | BLACKROCK MANAGED VOLATILITY PORTFOLIO | | MARCH 31, 2015 | | |
| | | | |
| Schedule of Investments (continued) | | | | |
| | | (Percentages shown are based on Net Assets) | |
| | | | | | | | |
| Common Stocks | | Shares | | | Value | |
Machinery (concluded) | | | | | | | | |
JTEKT Corp. | | | 9,400 | | | $ | 146,560 | |
Kawasaki Heavy Industries Ltd. | | | 31,000 | | | | 156,396 | |
KION Group AG | | | 5,959 | | | | 243,628 | |
Komatsu Ltd. | | | 12,100 | | | | 237,192 | |
Kone OYJ, B Shares | | | 28,113 | | | | 1,246,534 | |
Konecranes OYJ | | | 4,020 | | | | 126,674 | |
Krones AG | | | 1,976 | | | | 205,137 | |
Kubota Corp. | | | 15,000 | | | | 236,984 | |
Makita Corp. | | | 3,300 | | | | 171,007 | |
MAN SE | | | 8,950 | | | | 942,155 | |
Metso OYJ | | | 9,722 | | | | 284,044 | |
Minebea Co. Ltd. | | | 9,000 | | | | 141,556 | |
Mitsubishi Heavy Industries Ltd. | | | 44,000 | | | | 242,100 | |
Mitsui Engineering & Shipbuilding Co. Ltd. | | | 50,000 | | | | 85,249 | |
Nabtesco Corp. | | | 4,000 | | | | 115,557 | |
Nachi-Fujikoshi Corp. | | | 15,000 | | | | 82,130 | |
Namura Shipbuilding Co. Ltd. | | | 6,000 | | | | 56,569 | |
NGK Insulators Ltd. | | | 7,000 | | | | 149,146 | |
NSK Ltd. | | | 11,000 | | | | 160,551 | |
Obara Group, Inc. | | | 1,500 | | | | 84,700 | |
OKUMA Corp. | | | 9,000 | | | | 83,461 | |
OSG Corp. | | | 4,600 | | | | 89,458 | |
Rational AG | | | 721 | | | | 241,002 | |
SMC Corp. | | | 900 | | | | 267,987 | |
Sumitomo Heavy Industries Ltd. | | | 22,000 | | | | 143,975 | |
Tadano Ltd. | | | 6,000 | | | | 80,566 | |
Takuma Co. Ltd. | | | 8,000 | | | | 62,662 | |
THK Co. Ltd. | | | 5,600 | | | | 142,300 | |
Tsubakimoto Chain Co. | | | 10,000 | | | | 83,285 | |
Vallourec SA | | | 9,759 | | | | 238,192 | |
Wartsila OYJ Abp | | | 12,352 | | | | 546,332 | |
Zardoya Otis SA | | | 26,499 | | | | 342,001 | |
| | | | | | | | |
| | | | | | | | 10,981,635 | |
Marine — 0.0% | | | | | | | | |
Kawasaki Kisen Kaisha Ltd. | | | 44,000 | | | | 118,151 | |
Nippon Yusen KK | | | 55,000 | | | | 158,220 | |
| | | | | | | | |
| | | | | | | | 276,371 | |
Media — 3.9% | | | | | | | | |
Altice SA (d) | | | 14,517 | | | | 1,574,202 | |
AMC Networks, Inc., Class A (d) | | | 3,335 | | | | 255,594 | |
Atresmedia Corp de Medios de Comunicacion SA | | | 13,874 | | | | 209,876 | |
Avex Group Holdings, Inc. | | | 3,900 | | | | 62,208 | |
Axel Springer SE | | | 6,065 | | | | 357,966 | |
Cablevision Systems Corp., Class A | | | 12,234 | | | | 223,882 | |
CBS Corp., Class B, Non-Voting Shares | | | 9,125 | | | | 553,249 | |
Charter Communications, Inc., Class A (d) | | | 2,787 | | | | 538,198 | |
Cinemark Holdings, Inc. | | | 4,141 | | | | 186,635 | |
Comcast Corp., Class A | | | 22,132 | | | | 1,249,794 | |
CTS Eventim AG & Co. KGaA | | | 6,434 | | | | 202,701 | |
CyberAgent, Inc. | | | 2,000 | | | | 114,555 | |
Daiichikosho Co. Ltd. | | | 2,900 | | | | 90,083 | |
Dentsu, Inc. | | | 4,500 | | | | 192,504 | |
DIRECTV (d) | | | 6,887 | | | | 586,084 | |
Discovery Communications, Inc., Class A (d) | | | 72,041 | | | | 2,215,981 | |
DISH Network Corp. (d) | | | 6,054 | | | | 424,143 | |
DreamWorks Animation SKG, Inc., Class A (d) | | | 7,495 | | | | 181,379 | |
Eutelsat Communications SA | | | 14,149 | | | | 469,338 | |
Fuji Media Holdings, Inc. | | | 9,100 | | | | 128,987 | |
Gannett Co., Inc. | | | 8,135 | | | | 301,646 | |
Grupo Televisa SAB — ADR (d) | | | 47,594 | | | | 1,571,078 | |
Hakuhodo DY Holdings, Inc. | | | 12,400 | | | | 131,828 | |
Havas SA | | | 26,002 | | | | 197,387 | |
The Interpublic Group of Cos., Inc. | | | 8,871 | | | | 196,227 | |
| | | | | | | | |
| Common Stocks | | Shares | | | Value | |
Media (concluded) | | | | | | | | |
JCDecaux SA | | | 13,375 | | | $ | 450,387 | |
John Wiley & Sons, Inc., Class A | | | 1,655 | | | | 101,187 | |
Kabel Deutschland Holding AG (d) | | | 5,685 | | | | 737,955 | |
Kadokawa Dwango (d) | | | 4,700 | | | | 73,678 | |
Lagardere SCA | | | 8,749 | | | | 262,954 | |
Liberty Global PLC, Series A (d) | | | 49,608 | | | | 2,553,324 | |
Lions Gate Entertainment Corp. | | | 5,575 | | | | 189,104 | |
Live Nation Entertainment, Inc. (d) | | | 6,552 | | | | 165,307 | |
The Madison Square Garden Co., Class A (d) | | | 3,248 | | | | 274,943 | |
Mediaset Espana Comunicacion SA (d) | | | 25,021 | | | | 313,230 | |
Mediaset SpA (d) | | | 71,282 | | | | 324,454 | |
Meredith Corp. | | | 3,031 | | | | 169,039 | |
Metropole Television SA | | | 7,876 | | | | 157,948 | |
Morningstar, Inc. | | | 1,992 | | | | 149,221 | |
The New York Times Co., Class A | | | 11,497 | | | | 158,199 | |
Nippon Television Holdings, Inc. | | | 8,900 | | | | 148,144 | |
NOS SGPS | | | 31,268 | | | | 226,608 | |
Numericable-SFR SAS (d) | | | 23,212 | | | | 1,266,400 | |
Publicis Groupe SA | | | 14,080 | | | | 1,086,361 | |
Reed Elsevier NV | | | 48,272 | | | | 1,202,817 | |
Regal Entertainment Group, Class A | | | 8,814 | | | | 201,312 | |
RTL Group SA | | | 9,914 | | | | 953,329 | |
Scripps Networks Interactive, Inc., Class A | | | 4,324 | | | | 296,453 | |
SES SA, Receipt | | | 21,421 | | | | 759,376 | |
Sinclair Broadcast Group, Inc., Class A | | | 6,272 | | | | 197,004 | |
Sirius XM Holdings, Inc. (d) | | | 131,782 | | | | 503,407 | |
Sky Deutschland AG (d) | | | 58,806 | | | | 427,502 | |
Societe Television Francaise 1 | | | 13,835 | | | | 244,277 | |
Telenet Group Holding NV (d) | | | 7,534 | | | | 414,560 | |
Time Warner Cable, Inc. | | | 5,114 | | | | 766,486 | |
Time Warner, Inc. | | | 8,630 | | | | 728,717 | |
Toho Co. Ltd. | | | 5,200 | | | | 127,144 | |
Usen Corp. (d) | | | 17,000 | | | | 50,836 | |
Viacom, Inc., Class B | | | 6,261 | | | | 427,626 | |
Wolters Kluwer NV | | | 18,288 | | | | 597,186 | |
| | | | | | | | |
| | | | | | | | 28,922,000 | |
Metals & Mining — 0.2% | | | | | | | | |
Asahi Holdings, Inc. | | | 3,100 | | | | 53,064 | |
Dowa Holdings Co. Ltd. | | | 10,000 | | | | 85,408 | |
Hitachi Metals Ltd. | | | 10,000 | | | | 153,266 | |
JFE Holdings, Inc. | | | 9,300 | | | | 205,280 | |
Kobe Steel Ltd. | | | 80,000 | | | | 147,553 | |
Mitsubishi Materials Corp. | | | 34,000 | | | | 114,249 | |
Mitsui Mining & Smelting Co. Ltd. | | | 35,000 | | | | 79,598 | |
Nippon Steel & Sumitomo Metal Corp. | | | 108,000 | | | | 271,556 | |
Sumitomo Metal Mining Co. Ltd. | | | 11,000 | | | | 160,773 | |
| | | | | | | | |
| | | | | | | | 1,270,747 | |
Multiline Retail — 0.8% | | | | | | | | |
Big Lots, Inc. | | | 3,404 | | | | 163,494 | |
Dillard’s, Inc., Class A | | | 2,057 | | | | 280,801 | |
Dollar General Corp. | | | 7,832 | | | | 590,376 | |
Dollar Tree, Inc. (d) | | | 5,682 | | | | 461,066 | |
Don Quijote Holdings Co. Ltd. | | | 1,700 | | | | 138,190 | |
Family Dollar Stores, Inc. | | | 4,432 | | | | 351,192 | |
Isetan Mitsukoshi Holdings Ltd. | | | 10,800 | | | | 178,446 | |
Izumi Co. Ltd. | | | 2,600 | | | | 95,149 | |
J Front Retailing Co. Ltd. | | | 8,300 | | | | 130,299 | |
J.C. Penney Co., Inc. (d) | | | 20,422 | | | | 171,749 | |
Kohl’s Corp. | | | 5,787 | | | | 452,833 | |
Macy’s, Inc. | | | 8,424 | | | | 546,802 | |
Marui Group Co. Ltd. | | | 11,300 | | | | 128,049 | |
Nordstrom, Inc. | | | 5,630 | | | | 452,202 | |
Ryohin Keikaku Co. Ltd. | | | 700 | | | | 101,648 | |
See Notes to Financial Statements.
| | | | | | |
| | | BLACKROCK MANAGED VOLATILITY PORTFOLIO | | MARCH 31, 2015 | | 13 |
| | | | |
| Schedule of Investments (continued) | | | | |
| | | (Percentages shown are based on Net Assets) | |
| | | | | | | | |
| Common Stocks | | Shares | | | Value | |
Multiline Retail (concluded) | | | | | | | | |
Sears Holdings Corp. (d) | | | 5,671 | | | $ | 234,666 | |
Seria Co. Ltd. | | | 2,100 | | | | 75,967 | |
Takashimaya Co. Ltd. | | | 13,000 | | | | 127,707 | |
Target Corp. | | | 10,418 | | | | 855,005 | |
| | | | | | | | |
| | | | | | | | 5,535,641 | |
Oil, Gas & Consumable Fuels — 0.1% | | | | | | | | |
Inpex Corp. | | | 23,900 | | | | 263,349 | |
JX Holdings, Inc. | | | 54,100 | | | | 208,158 | |
Longview Energy Co. (Acquired 8/13/04,
cost $48,000) (d)(f) | | | 3,200 | | | | 5,632 | |
Matador Resources Co. (Acquired 4/13/06,
cost $8,451) (d)(f) | | | 939 | | | | 20,583 | |
Nippon Gas Co. Ltd. | | | 3,100 | | | | 76,536 | |
Showa Shell Sekiyu KK | | | 14,400 | | | | 131,523 | |
| | | | | | | | |
| | | | | | | | 705,781 | |
Paper & Forest Products — 0.0% | | | | | | | | |
Ainsworth Lumber Co. Ltd. (d) | | | 26,991 | | | | 74,495 | |
Ainsworth Lumber Co. Ltd. (b)(d) | | | 19,432 | | | | 53,545 | |
Daio Paper Corp. | | | 8,000 | | | | 68,539 | |
Oji Holdings Corp. | | | 32,000 | | | | 130,930 | |
| | | | | | | | |
| | | | | | | | 327,509 | |
Personal Products — 0.3% | | | | | | | | |
Dr Ci:Labo Co. Ltd. | | | 1,900 | | | | 66,334 | |
The Estee Lauder Cos., Inc., Class A | | | 18,938 | | | | 1,574,884 | |
Kao Corp. | | | 5,900 | | | | 294,611 | |
Kobayashi Pharmaceutical Co. Ltd. | | | 1,700 | | | | 121,652 | |
Kose Corp. | | | 2,500 | | | | 137,879 | |
Shiseido Co. Ltd. | | | 10,100 | | | | 179,175 | |
| | | | | | | | |
| | | | | | | | 2,374,535 | |
Pharmaceuticals — 1.8% | | | | | | | | |
Astellas Pharma, Inc. | | | 23,600 | | | | 386,684 | |
AstraZeneca PLC | | | 52,568 | | | | 3,607,119 | |
Chugai Pharmaceutical Co. Ltd. | | | 8,900 | | | | 280,892 | |
Daiichi Sankyo Co. Ltd. | | | 12,700 | | | | 201,814 | |
Eisai Co. Ltd. | | | 4,200 | | | | 298,737 | |
Hisamitsu Pharmaceutical Co., Inc. | | | 3,100 | | | | 127,321 | |
Kaken Pharmaceutical Co. Ltd. | | | 3,000 | | | | 86,729 | |
KYORIN Holdings, Inc. | | | 4,000 | | | | 95,626 | |
Kyowa Hakko Kirin Co. Ltd. | | | 103,000 | | | | 1,342,586 | |
Mitsubishi Tanabe Pharma Corp. | | | 11,800 | | | | 202,434 | |
Mochida Pharmaceutical Co. Ltd. | | | 1,300 | | | | 85,347 | |
Novo Nordisk A/S, Class B | | | 32,146 | | | | 1,716,075 | |
Ono Pharmaceutical Co. Ltd. | | | 2,500 | | | | 282,110 | |
Otsuka Holdings Co. Ltd. | | | 8,900 | | | | 278,425 | |
Rohto Pharmaceutical Co. Ltd. | | | 6,900 | | | | 98,074 | |
Santen Pharmaceutical Co. Ltd. | | | 11,000 | | | | 160,444 | |
Sawai Pharmaceutical Co. Ltd. | | | 1,500 | | | | 88,827 | |
Shionogi & Co. Ltd. | | | 6,200 | | | | 206,401 | |
Shire PLC | | | 19,075 | | | | 1,520,711 | |
Sumitomo Dainippon Pharma Co. Ltd. | | | 13,200 | | | | 156,344 | |
Taisho Pharmaceutical Holdings Co. Ltd. | | | 2,600 | | | | 193,186 | |
Takeda Pharmaceutical Co. Ltd. | | | 8,300 | | | | 414,319 | |
Teva Pharmaceutical Industries Ltd. — ADR | | | 26,980 | | | | 1,680,854 | |
Towa Pharmaceutical Co. Ltd. | | | 1,100 | | | | 62,885 | |
Tsumura & Co. | | | 3,100 | | | | 76,558 | |
| | | | | | | | |
| | | | | | | | 13,650,502 | |
Professional Services — 0.6% | | | | | | | | |
Bureau Veritas SA | | | 30,060 | | | | 644,927 | |
Meitec Corp. | | | 2,500 | | | | 83,603 | |
Nihon M&A Center, Inc. | | | 3,000 | | | | 103,382 | |
Randstad Holding NV | | | 11,715 | | | | 710,160 | |
Recruit Holdings Co. Ltd. | | | 73,500 | | | | 2,293,307 | |
| | | | | | | | |
| Common Stocks | | Shares | | | Value | |
Professional Services (concluded) | | | | | | | | |
Teleperformance | | | 3,637 | | | $ | 249,249 | |
Temp Holdings Co. Ltd. | | | 3,200 | | | | 110,412 | |
| | | | | | | | |
| | | | | | | | 4,195,040 | |
Real Estate Management & Development — 0.3% | | | | | | | | |
Aeon Mall Co. Ltd. | | | 6,000 | | | | 118,819 | |
Daikyo, Inc. | | | 52,000 | | | | 78,369 | |
Daito Trust Construction Co. Ltd. | | | 1,700 | | | | 189,832 | |
Daiwa House Industry Co. Ltd. | | | 10,200 | | | | 201,045 | |
Hulic Co. Ltd. | | | 12,600 | | | | 141,574 | |
Leopalace21 Corp. (d) | | | 16,900 | | | | 88,466 | |
Mitsubishi Estate Co. Ltd. | | | 14,000 | | | | 324,688 | |
Mitsui Fudosan Co. Ltd. | | | 10,000 | | | | 293,680 | |
Nomura Real Estate Holdings, Inc. | | | 6,000 | | | | 108,055 | |
NTT Urban Development Corp. | | | 11,900 | | | | 118,867 | |
Relo Holdings, Inc. | | | 900 | | | | 79,625 | |
Sumitomo Real Estate Sales Co. Ltd. | | | 3,100 | | | | 84,211 | |
Sumitomo Realty & Development Co. Ltd. | | | 6,000 | | | | 216,008 | |
Takara Leben Co. Ltd. | | | 11,800 | | | | 63,195 | |
Tokyo Tatemono Co. Ltd. | | | 13,000 | | | | 95,242 | |
Tokyu Fudosan Holdings Corp. | | | 17,500 | | | | 119,360 | |
| | | | | | | | |
| | | | | | | | 2,321,036 | |
Road & Rail — 0.3% | | | | | | | | |
Central Japan Railway Co. | | | 1,700 | | | | 307,223 | |
East Japan Railway Co. | | | 3,600 | | | | 288,482 | |
Hankyu Hanshin Holdings, Inc. | | | 23,000 | | | | 142,080 | |
Keio Corp. | | | 19,000 | | | | 148,809 | |
Keisei Electric Railway Co. Ltd. | | | 8,000 | | | | 99,292 | |
Kintetsu Corp. | | | 37,000 | | | | 135,749 | |
Nagoya Railroad Co. Ltd. | | | 28,000 | | | | 111,806 | |
Nankai Electric Railway Co. Ltd. | | | 23,000 | | | | 95,019 | |
Nippon Express Co. Ltd. | | | 33,000 | | | | 184,381 | |
Nishi-Nippon Railroad Co. Ltd. | | | 19,000 | | | | 87,045 | |
Odakyu Electric Railway Co. Ltd. | | | 14,000 | | | | 142,589 | |
Sankyu, Inc. | | | 18,000 | | | | 78,294 | |
Senko Co. Ltd. | | | 10,000 | | | | 64,788 | |
Sotetsu Holdings, Inc. | | | 17,000 | | | | 78,744 | |
Tobu Railway Co. Ltd. | | | 26,000 | | | | 123,181 | |
Tokyu Corp. | | | 24,000 | | | | 148,483 | |
West Japan Railway Co. | | | 3,200 | | | | 167,777 | |
| | | | | | | | |
| | | | | | | | 2,403,742 | |
Semiconductors & Semiconductor Equipment — 0.3% | | | | | |
Disco Corp. | | | 1,100 | | | | 112,234 | |
MediaTek, Inc. | | | 114,000 | | | | 1,539,657 | |
Nuflare Technology, Inc. | | | 900 | | | | 39,990 | |
Sanken Electric Co. Ltd. | | | 10,000 | | | | 69,089 | |
Shindengen Electric Manufacturing Co. Ltd. | | | 11,000 | | | | 54,849 | |
Tokyo Electron Ltd. | | | 3,900 | | | | 270,519 | |
| | | | | | | | |
| | | | | | | | 2,086,338 | |
Software — 0.3% | | | | | | | | |
GungHo Online Entertainment, Inc. | | | 40,700 | | | | 158,994 | |
Nexon Co. Ltd. | | | 14,600 | | | | 155,477 | |
Oracle Corp. | | | 3,500 | | | | 150,618 | |
Trend Micro, Inc. | | | 48,700 | | | | 1,604,690 | |
| | | | | | | | |
| | | | | | | | 2,069,779 | |
Specialty Retail — 3.3% | | | | | | | | |
Aaron’s, Inc. (d) | | | 5,500 | | | | 155,705 | |
ABC-Mart, Inc. | | | 2,200 | | | | 128,668 | |
Abercrombie & Fitch Co., Class A | | | 4,505 | | | | 99,290 | |
Advance Auto Parts, Inc. | | | 2,404 | | | | 359,855 | |
American Eagle Outfitters, Inc. | | | 11,506 | | | | 196,522 | |
ANN, Inc. (d) | | | 4,104 | | | | 168,387 | |
See Notes to Financial Statements.
| | | | | | |
| 14 | | BLACKROCK MANAGED VOLATILITY PORTFOLIO | | MARCH 31, 2015 | | |
| | | | |
| Schedule of Investments (continued) | | | | |
| | | (Percentages shown are based on Net Assets) | |
| | | | | | | | |
| Common Stocks | | Shares | | | Value | |
Specialty Retail (concluded) | | | | | | | | |
AOKI Holdings, Inc. | | | 5,900 | | | $ | 83,391 | |
Ascena Retail Group, Inc. (d) | | | 12,945 | | | | 187,832 | |
AutoNation, Inc. (d) | | | 4,685 | | | | 301,386 | |
AutoZone, Inc. (d) | | | 820 | | | | 559,371 | |
Bed Bath & Beyond, Inc. (d) | | | 5,496 | | | | 421,955 | |
Best Buy Co., Inc. | | | 8,186 | | | | 309,349 | |
The Buckle, Inc. | | | 3,670 | | | | 187,500 | |
Cabela’s, Inc. (d) | | | 4,035 | | | | 225,879 | |
CarMax, Inc. (d) | | | 6,572 | | | | 453,534 | |
Chico’s FAS, Inc. | | | 9,883 | | | | 174,830 | |
CST Brands, Inc. | | | 2,910 | | | | 127,545 | |
Dick’s Sporting Goods, Inc. | | | 4,700 | | | | 267,853 | |
DSW, Inc., Class A | | | 5,485 | | | | 202,287 | |
Fast Retailing Co. Ltd. | | | 1,100 | | | | 425,324 | |
Foot Locker, Inc. | | | 4,406 | | | | 277,578 | |
GameStop Corp., Class A | | | 4,072 | | | | 154,573 | |
The Gap, Inc. | | | 7,821 | | | | 338,884 | |
Genesco, Inc. (d) | | | 2,159 | | | | 153,786 | |
GNC Holdings, Inc., Class A | | | 5,133 | | | | 251,876 | |
Gulliver International Co. Ltd. | | | 8,800 | | | | 72,370 | |
Hikari Tsushin, Inc. | | | 1,500 | | | | 97,148 | |
The Home Depot, Inc. | | | 12,208 | | | | 1,386,951 | |
Inditex SA | | | 197,285 | | | | 6,333,945 | |
Kingfisher PLC | | | 554,284 | | | | 3,127,296 | |
Komeri Co. Ltd. | | | 3,000 | | | | 70,647 | |
K’s Holdings Corp. | | | 2,700 | | | | 87,311 | |
L Brands, Inc. | | | 5,537 | | | | 522,084 | |
Lowe’s Companies, Inc. | | | 13,114 | | | | 975,550 | |
Lumber Liquidators Holdings, Inc. (d) | | | 2,389 | | | | 73,533 | |
The Men’s Wearhouse, Inc. | | | 2,747 | | | | 143,393 | |
Nitori Holdings Co. Ltd. | | | 2,100 | | | | 142,156 | |
O’Reilly Automotive, Inc. (d) | | | 2,440 | | | | 527,626 | |
Penske Automotive Group, Inc. | | | 3,174 | | | | 163,429 | |
Pier 1 Imports, Inc. | | | 9,025 | | | | 126,169 | |
Ross Stores, Inc. | | | 5,353 | | | | 563,992 | |
Sally Beauty Holdings, Inc. (d) | | | 6,355 | | | | 218,421 | |
Sanrio Co. Ltd. | | | 3,700 | | | | 98,837 | |
Shimamura Co. Ltd. | | | 1,200 | | | | 111,145 | |
Signet Jewelers Ltd. | | | 2,558 | | | | 355,025 | |
Staples, Inc. | | | 15,667 | | | | 255,137 | |
T-Gaia Corp. | | | 4,300 | | | | 56,879 | |
Tiffany & Co. | | | 2,406 | | | | 211,752 | |
The TJX Cos., Inc. | | | 8,775 | | | | 614,689 | |
Tractor Supply Co. | | | 4,546 | | | | 386,683 | |
Ulta Salon Cosmetics & Fragrance, Inc. (d) | | | 2,417 | | | | 364,604 | |
United Arrows Ltd. | | | 2,100 | | | | 62,332 | |
Urban Outfitters, Inc. (d) | | | 5,735 | | | | 261,803 | |
USS Co. Ltd. | | | 8,300 | | | | 143,420 | |
VT Holdings Co. Ltd. | | | 11,400 | | | | 49,926 | |
Williams-Sonoma, Inc. | | | 2,281 | | | | 181,819 | |
World Duty Free SpA (d) | | | 16,520 | | | | 177,645 | |
Yamada Denki Co. Ltd. | | | 32,600 | | | | 134,245 | |
| | | | | | | | |
| | | | | | | | 24,311,122 | |
Technology Hardware, Storage & Peripherals — 0.2% | | | | | | | | |
Brother Industries Ltd. | | | 8,900 | | | | 141,402 | |
Canon, Inc. | | | 12,400 | | | | 438,728 | |
Elecom Co. Ltd. | | | 2,800 | | | | 58,164 | |
FUJIFILM Holdings Corp. | | | 8,600 | | | | 305,958 | |
Konica Minolta, Inc. | | | 16,200 | | | | 164,176 | |
NEC Corp. | | | 58,000 | | | | 170,371 | |
Ricoh Co. Ltd. | | | 15,100 | | | | 164,189 | |
Seiko Epson Corp. | | | 9,200 | | | | 162,944 | |
Wacom Co. Ltd. | | | 15,200 | | | | 73,221 | |
| | | | | | | | |
| | | | | | | | 1,679,153 | |
| | | | | | | | |
| Common Stocks | | Shares | | | Value | |
Textiles, Apparel & Luxury Goods — 2.8% | | | | | | | | |
adidas AG | | | 15,236 | | | $ | 1,203,080 | |
Asics Corp. | | | 5,500 | | | | 149,668 | |
Brunello Cucinelli SpA | | | 4,380 | | | | 77,096 | |
Carter’s, Inc. | | | 2,614 | | | | 241,717 | |
Christian Dior SE | | | 12,554 | | | | 2,362,876 | |
Cie Financiere Richemont SA, Registered Shares | | | 21,887 | | | | 1,758,640 | |
Coach, Inc. | | | 6,484 | | | | 268,632 | |
Columbia Sportswear Co. | | | 2,727 | | | | 166,074 | |
Deckers Outdoor Corp. (d) | | | 1,867 | | | | 136,048 | |
Fossil Group, Inc. (d) | | | 1,321 | | | | 108,916 | |
Gerry Weber International AG | | | 2,961 | | | | 102,171 | |
Hanesbrands, Inc. | | | 11,600 | | | | 388,716 | |
HUGO BOSS AG | | | 4,678 | | | | 568,336 | |
Iconix Brand Group, Inc. (d) | | | 3,149 | | | | 106,027 | |
Kering | | | 8,609 | | | | 1,680,633 | |
lululemon athletica, inc. (d) | | | 2,905 | | | | 185,978 | |
Luxottica Group SpA | | | 29,964 | | | | 1,897,784 | |
LVMH Moet Hennessy Louis Vuitton SA | | | 36,077 | | | | 6,348,916 | |
Moncler SpA | | | 17,680 | | | | 296,393 | |
NIKE, Inc., Class B | | | 4,173 | | | | 418,677 | |
PVH Corp. | | | 2,161 | | | | 230,276 | |
Ralph Lauren Corp. | | | 1,886 | | | | 248,009 | |
Salvatore Ferragamo SpA | | | 11,814 | | | | 377,998 | |
Seiko Holdings Corp. | | | 13,000 | | | | 65,534 | |
Steven Madden Ltd. (d) | | | 4,396 | | | | 167,048 | |
Tod’s SpA | | | 2,085 | | | | 188,870 | |
Under Armour, Inc., Class A (d) | | | 5,049 | | | | 407,707 | |
VF Corp. | | | 5,897 | | | | 444,103 | |
Wolverine World Wide, Inc. | | | 4,656 | | | | 155,743 | |
| | | | | | | | |
| | | | | | | | 20,751,666 | |
Tobacco — 0.3% | | | | | | | | |
Imperial Tobacco Group PLC | | | 37,203 | | | | 1,631,949 | |
Japan Tobacco, Inc. | | | 13,700 | | | | 433,124 | |
| | | | | | | | |
| | | | | | | | 2,065,073 | |
Trading Companies & Distributors — 0.4% | | | | | | | | |
BayWa AG | | | 2,320 | | | | 90,763 | |
Brenntag AG | | | 9,507 | | | | 567,990 | |
ITOCHU Corp. | | | 22,500 | | | | 243,492 | |
Iwatani Corp. | | | 13,000 | | | | 85,163 | |
Kanamoto Co. Ltd. | | | 2,400 | | | | 69,079 | |
Kanematsu Corp. | | | 34,000 | | | | 49,433 | |
Kloeckner & Co. SE (d) | | | 6,927 | | | | 65,977 | |
Marubeni Corp. | | | 30,000 | | | | 173,445 | |
MISUMI Group, Inc. | | | 3,200 | | | | 128,964 | |
Mitsubishi Corp. | | | 15,700 | | | | 315,473 | |
Mitsui & Co. Ltd. | | | 21,700 | | | | 290,610 | |
MonotaRO Co. Ltd. | | | 2,900 | | | | 105,033 | |
Nippon Steel & Sumikin Bussan Corp. | | | 17,000 | | | | 58,709 | |
Nishio Rent All Co. Ltd. | | | 2,400 | | | | 69,036 | |
Rexel SA | | | 18,850 | | | | 355,430 | |
Sojitz Corp. | | | 64,000 | | | | 106,992 | |
Sumitomo Corp. | | | 19,700 | | | | 210,218 | |
Toyota Tsusho Corp. | | | 6,700 | | | | 177,266 | |
Yuasa Trading Co. Ltd. | | | 2,500 | | | | 52,280 | |
| | | | | | | | |
| | | | | | | | 3,215,353 | |
Transportation Infrastructure — 0.6% | | | | | | | | |
Abertis Infraestructuras SA | | | 60,429 | | | | 1,092,224 | |
Aeroports de Paris | | | 6,490 | | | | 775,709 | |
Ansaldo STS SpA | | | 12,911 | | | | 130,815 | |
Atlantia SpA | | | 55,254 | | | | 1,450,984 | |
Fraport AG Frankfurt Airport Services Worldwide | | | 6,003 | | | | 358,569 | |
See Notes to Financial Statements.
| | | | | | |
| | | BLACKROCK MANAGED VOLATILITY PORTFOLIO | | MARCH 31, 2015 | | 15 |
| | | | |
| Schedule of Investments (continued) | | | | |
| | | (Percentages shown are based on Net Assets) | |
| | | | | | | | | | | | |
| Common Stocks | | | | | Shares | | | Value | |
Transportation Infrastructure (concluded) | | | | | | | | | |
Groupe Eurotunnel SA, Registered Shares | | | | | | | 34,682 | | | $ | 497,200 | |
Hamburger Hafen und Logistik AG | | | | | | | 4,801 | | | | 100,750 | |
Societa Iniziative Autostradali e Servizi SpA | | | | | | | 15,108 | | | | 175,843 | |
| | | | | | | | | | | | |
| | | | | | | | | | | | 4,582,094 | |
Wireless Telecommunication Services — 0.6% | | | | | | | | | |
KDDI Corp. | | | | | | | 18,900 | | | | 426,999 | |
NTT DOCOMO, Inc. | | | | | | | 29,200 | | | | 510,300 | |
SoftBank Corp. | | | | | | | 8,900 | | | | 518,331 | |
Vodafone Group PLC | | | | | | | 940,770 | | | | 3,078,491 | |
| | | | | | | | | | | | |
| | | | | | | | | | | | 4,534,121 | |
Total Common Stocks — 41.6% | | | | | | | | | | | 309,350,416 | |
| | | | | | | | | | | | |
| | | | |
| Corporate Bonds | | | | | Par
(000) | | | | |
Aerospace & Defense — 0.1% | | | | | | | | | | | | |
Airbus Group Finance BV, 2.70%, 4/17/23 (b) | | | USD | | | | 500 | | | | 502,184 | |
Airlines — 0.0% | | | | | | | | | | | | |
Ryanair Ltd., 1.88%, 6/17/21 | | | EUR | | | | 200 | | | | 226,144 | |
Auto Components — 0.2% | | | | | | | | | | | | |
AA Bond Co. Ltd., 5.50%, 7/31/22 | | | GBP | | | | 200 | | | | 299,645 | |
Delphi Automotive PLC, 1.50%, 3/10/25 | | | EUR | | | | 325 | | | | 347,694 | |
Faurecia, 3.13%, 6/15/22 | | | | | | | 375 | | | | 404,528 | |
Schaeffler Finance BV, 3.25%, 5/15/25 | | | | | | | 225 | | | | 241,381 | |
| | | | | | | | | | | | |
| | | | | | | | | | | | 1,293,248 | |
Automobiles — 0.1% | | | | | | | | | | | | |
Volkswagen International Finance NV,
2.00%, 1/14/20 | | | | | | | 400 | | | | 459,982 | |
Banks — 3.0% | | | | | | | | | | | | |
Abbey National Treasury Services PLC: | | | | | | | | | | | | |
4.25%, 4/12/21 | | | | | | | 500 | | | | 664,108 | |
5.25%, 2/16/29 | | | GBP | | | | 200 | | | | 399,181 | |
Akbank TAS, 5.00%, 10/24/22 | | | USD | | | | 200 | | | | 200,900 | |
Asian Development Bank, 2.35%, 6/21/27 | | | JPY | | | | 20,000 | | | | 204,289 | |
Banca Monte dei Paschi di Siena SpA,
2.88%, 4/16/22 | | | EUR | | | | 300 | | | | 361,974 | |
Banco Popular Espanol SA, 2.13%, 10/08/19 | | | | | | | 100 | | | | 115,759 | |
Bank of America Corp., 5.70%, 1/24/22 | | | USD | | | | 600 | | | | 701,543 | |
Bank of Ireland: | | | | | | | | | | | | |
1.25%, 4/09/20 | | | EUR | | | | 150 | | | | 160,432 | |
10.00%, 12/19/22 | | | | | | | 100 | | | | 147,345 | |
Bankia SA, 4.00%, 5/22/24 (a) | | | | | | | 400 | | | | 437,023 | |
Barclays Bank PLC, 6.00%, 1/14/21 | | | | | | | 100 | | | | 132,521 | |
CaixaBank SA, 2.63%, 3/21/24 | | | | | | | 200 | | | | 252,734 | |
Canadian Imperial Bank of Commerce,
2.60%, 7/02/15 (b) | | | USD | | | | 290 | | | | 291,499 | |
Carrefour Banque SA, 2.88%, 9/25/15 | | | EUR | | | | 94 | | | | 102,365 | |
Cooperatieve Centrale Raiffeisen- Boerenleenbank BA, 2.50%, 5/26/26 (a) | | | | | | | 225 | | | | 250,652 | |
Credit Agricole SA: | | | | | | | | | | | | |
2.38%, 5/20/24 | | | | | | | 200 | | | | 238,945 | |
2.63%, 3/17/27 | | | | | | | 125 | | | | 137,939 | |
Danske Bank A/S: | | | | | | | | | | | | |
3.88%, 5/18/16 | | | | | | | 500 | | | | 559,984 | |
3.88%, 10/04/23 (a) | | | | | | | 300 | | | | 350,102 | |
2.75%, 5/19/26 (a) | | | | | | | 100 | | | | 113,873 | |
Dexia Credit Local SA, 0.63%, 1/21/22 | | | | | | | 1,600 | | | | 1,741,726 | |
Heta Asset Resolution AG, 2.38%, 12/13/22 | | | | | | | 1,300 | | | | 1,525,155 | |
HSBC Bank Brasil SA — Banco Multiplo,
4.00%, 5/11/16 (b) | | | USD | | | | 680 | | | | 690,200 | |
ING Bank NV, 3.38%, 1/11/18 | | | EUR | | | | 250 | | | | 294,112 | |
| | | | | | | | | | | | |
| Corporate Bonds | | | | | Par
(000) | | | Value | |
Banks (concluded) | | | | | | | | | | | | |
Intesa Sanpaolo SpA: | | | | | | | | | | | | |
1.13%, 1/14/20 | | | EUR | | | | 350 | | | $ | 379,464 | |
6.63%, 9/13/23 | | | | | | | 200 | | | | 276,202 | |
3.38%, 1/24/25 | | | | | | | 200 | | | | 271,211 | |
3.25%, 2/10/26 | | | | | | | 100 | | | | 136,544 | |
Intesa Sanpaolo Vita SpA, 5.35%, 9/18/18 | | | | | | | 100 | | | | 121,902 | |
JPMorgan Chase & Co., 1.38%, 9/16/21 | | | | | | | 525 | | | | 581,836 | |
KBC Groep NV, 2.38%, 11/25/24 (a) | | | | | | | 600 | | | | 665,902 | |
KFW: | | | | | | | | | | | | |
1.13%, 12/23/19 | | | GBP | | | | 200 | | | | 296,539 | |
1.50%, 4/20/20 | | | USD | | | | 5,200 | | | | 5,197,228 | |
Lloyds Bank PLC: | | | | | | | | | | | | |
6.50%, 3/24/20 | | | EUR | | | | 300 | | | | 401,560 | |
4.00%, 9/29/20 | | | | | | | 250 | | | | 323,732 | |
1.00%, 11/19/21 | | | | | | | 225 | | | | 244,874 | |
Macquarie Bank Ltd.: | | | | | | | | | | | | |
2.50%, 9/18/18 | | | | | | | 200 | | | | 229,254 | |
2.60%, 6/24/19 (b) | | | USD | | | | 800 | | | | 811,326 | |
Nordea Bank AB, 4.88%, 5/13/21 (b) | | | | | | | 800 | | | | 877,201 | |
The Royal Bank of Scotland PLC, 7.50%, 4/29/24 | | | GBP | | | | 100 | | | | 206,043 | |
Société Générale SFH, 2.88%, 3/14/19 | | | EUR | | | | 500 | | | | 597,497 | |
Swedbank AB, 3.00%, 12/05/22 (a) | | | | | | | 384 | | | | 436,376 | |
UniCredit SpA, 3.00%, 1/31/24 | | | | | | | 180 | | | | 233,210 | |
Wells Fargo & Co., 5.38%, 11/02/43 | | | USD | | | | 100 | | | | 117,798 | |
| | | | | | | | | | | | |
| | | | | | | | | | | | 22,480,060 | |
Beverages — 0.1% | | | | | | | | | | | | |
PepsiCo, Inc., 3.60%, 8/13/42 | | | | | | | 400 | | | | 387,888 | |
Biotechnology — 0.0% | | | | | | | | | | | | |
Gilead Sciences, Inc., 4.50%, 2/01/45 | | | | | | | 300 | | | | 331,325 | |
Capital Markets — 0.4% | | | | | | | | | | | | |
Credit Suisse AG, 1.00%, 3/12/19 | | | EUR | | | | 525 | | | | 581,877 | |
Deutsche Bank AG: | | | | | | | | | | | | |
2.75%, 2/17/25 | | | | | | | 300 | | | | 331,060 | |
4.50%, 4/01/25 | | | USD | | | | 300 | | | | 299,674 | |
The Goldman Sachs Group, Inc., 5.75%, 1/24/22 | | | | | | | 700 | | | | 817,151 | |
Morgan Stanley, 3.75%, 2/25/23 | | | | | | | 650 | | | | 680,770 | |
UBS AG, 4.75%, 2/12/26 (a) | | | EUR | | | | 175 | | | | 209,311 | |
| | | | | | | | | | | | |
| | | | | | | | | | | | 2,919,843 | |
Chemicals — 0.2% | | | | | | | | | | | | |
Brenntag Finance BV, 5.50%, 7/19/18 | | | | | | | 400 | | | | 493,310 | |
LYB International Finance BV, 4.88%, 3/15/44 | | | USD | | | | 100 | | | | 107,415 | |
Monsanto Co., 4.20%, 7/15/34 | | | | | | | 500 | | | | 535,822 | |
| | | | | | | | | | | | |
| | | | | | | | | | | | 1,136,547 | |
Commercial Services & Supplies — 0.0% | | | | | | | | | | | | |
Paprec Holding, 5.25%, 4/01/22 | | | EUR | | | | 100 | | | | 110,213 | |
Pitney Bowes, Inc., 4.63%, 3/15/24 | | | USD | | | | 200 | | | | 209,790 | |
| | | | | | | | | | | | |
| | | | | | | | | | | | 320,003 | |
Construction & Engineering — 0.1% | | | | | | | | | | | | |
ACS Actividades de Construccion y Servicios SA,
2.88%, 4/01/20 | | | EUR | | | | 400 | | | | 435,367 | |
Consumer Finance — 0.0% | | | | | | | | | | | | |
Ally Financial, Inc., 3.50%, 1/27/19 | | | USD | | | | 139 | | | | 137,263 | |
Containers & Packaging — 0.0% | | | | | | | | | | | | |
Smurfit Kappa Acquisitions, 2.75%, 2/01/25 | | | EUR | | | | 150 | | | | 164,532 | |
Diversified Financial Services — 0.7% | | | | | | | | | | | | |
American Honda Finance Corp., 1.88%, 9/04/19 | | | | | | | 500 | | | | 571,556 | |
See Notes to Financial Statements.
| | | | | | |
| 16 | | BLACKROCK MANAGED VOLATILITY PORTFOLIO | | MARCH 31, 2015 | | |
| | | | |
| Schedule of Investments (continued) | | | | |
| | | (Percentages shown are based on Net Assets) | |
| | | | | | | | | | | | |
| Corporate Bonds | | | | | Par
(000) | | | Value | |
Diversified Financial Services (concluded) | | | | | | | | | | | | |
APT Pipelines Ltd.: | | | | | | | | | | | | |
1.38%, 3/22/22 | | | EUR | | | | 200 | | | $ | 215,544 | |
2.00%, 3/22/27 | | | | | | | 375 | | | | 405,215 | |
AyT Cedulas Cajas X Fondo de Titulizacion,
3.75%, 6/30/25 | | | | | | | 200 | | | | 267,637 | |
Caisse Centrale du Credit Immobilier de France SA, 0.50%, 5/19/17 | | | | | | | 1,000 | | | | 1,087,181 | |
Cedulas TDA 6 Fondo de Titulizacion de Activos, 4.25%, 4/10/31 | | | | | | | 100 | | | | 148,016 | |
Fundacion Bancaria Caixa d’Estalvis i Pensions de Barcelona, 2.38%, 5/09/19 | | | | | | | 200 | | | | 226,725 | |
Imperial Tobacco Finance PLC, 3.38%, 2/26/26 | | | | | | | 170 | | | | 212,365 | |
JPMorgan Chase Bank, NA, 6.00%, 10/01/17 | | | USD | | | | 445 | | | | 492,546 | |
LCR Finance PLC, 4.50%, 12/07/38 | | | GBP | | | | 30 | | | | 60,916 | |
The NASDAQ OMX Group, Inc., 3.88%, 6/07/21 | | | EUR | | | | 200 | | | | 248,213 | |
Nationwide Building Society: | | | | | | | | | | | | |
3.13%, 4/03/17 | | | | | | | 100 | | | | 113,643 | |
4.13%, 3/20/23 (a) | | | | | | | 150 | | | | 173,957 | |
1.25%, 3/03/25 | | | | | | | 700 | | | | 761,313 | |
Old Mutual PLC, 7.13%, 10/19/16 | | | GBP | | | | 200 | | | | 320,671 | |
| | | | | | | | | | | | |
| | | | | | | | | | | | 5,305,498 | |
Diversified Telecommunication Services — 0.2% | | | | | | | | | | | | |
AT&T Inc., 4.80%, 6/15/44 | | | USD | | | | 500 | | | | 512,015 | |
Sunrise Communications Holdings SA, 2.13%, 3/31/22 | | | CHF | | | | 425 | | | | 431,166 | |
Verizon Communications, Inc.: | | | | | | | | | | | | |
3.50%, 11/01/21 | | | USD | | | | 240 | | | | 250,869 | |
6.40%, 2/15/38 | | | | | | | 200 | | | | 249,315 | |
6.55%, 9/15/43 | | | | | | | 150 | | | | 195,324 | |
| | | | | | | | | | | | |
| | | | | | | | | | | | 1,638,689 | |
Electric Utilities — 0.2% | | | | | | | | | | | | |
Alabama Power Co., 3.95%, 6/01/21 | | | | | | | 220 | | | | 243,177 | |
Berkshire Hathaway Energy Co., 6.50%, 9/15/37 | | | | | | | 150 | | | | 203,069 | |
Enel Finance International NV, 5.63%, 8/14/24 | | | GBP | | | | 100 | | | | 180,905 | |
ESB Finance Ltd., 6.25%, 9/11/17 | | | EUR | | | | 200 | | | | 245,631 | |
Georgia Power Co., 3.00%, 4/15/16 | | | USD | | | | 390 | | | | 399,682 | |
PacifiCorp, 6.25%, 10/15/37 | | | | | | | 100 | | | | 137,450 | |
| | | | | | | | | | | | |
| | | | | | | | | | | | 1,409,914 | |
Electrical Equipment — 0.0% | | | | | | | | | | | | |
Vestas Wind Systems A/S, 2.75%, 3/11/22 | | | EUR | | | | 275 | | | | 293,105 | |
Food & Staples Retailing — 0.1% | | | | | | | | | | | | |
Wal-Mart Stores, Inc., 4.00%, 4/11/43 | | | USD | | | | 500 | | | | 530,369 | |
WM Morrison Supermarkets PLC, 4.63%, 12/08/23 | | | GBP | | | | 300 | | | | 478,291 | |
| | | | | | | | | | | | |
| | | | | | | | | | | | 1,008,660 | |
Gas Utilities — 0.1% | | | | | | | | | | | | |
Gas Natural Finance BV, 3.88%, 1/17/23 | | | EUR | | | | 100 | | | | 130,336 | |
KeySpan Gas East Corp., 5.82%, 4/01/41 (b) | | | USD | | | | 185 | | | | 245,287 | |
Southern Gas Networks PLC, 2.50%, 2/03/25 | | | GBP | | | | 150 | | | | 220,206 | |
| | | | | | | | | | | | |
| | | | | | | | | | | | 595,829 | |
Health Care Equipment & Supplies — 0.2% | | | | | | | | | | | | |
CareFusion Corp., 4.88%, 5/15/44 | | | USD | | | | 150 | | | | 166,270 | |
Covidien International Finance SA, 3.20%, 6/15/22 | | | | | | | 500 | | | | 519,243 | |
Medtronic, Inc., 4.38%, 3/15/35 (b) | | | | | | | 625 | | | | 679,652 | |
Mölnlycke Holding AB, 1.50%, 2/28/22 | | | EUR | | | | 100 | | | | 111,562 | |
Stryker Corp., 4.38%, 5/15/44 | | | USD | | | | 200 | | | | 210,305 | |
| | | | | | | | | | | | |
| | | | | | | | | | | | 1,687,032 | |
| | | | | | | | | | | | |
| Corporate Bonds | | | | | Par
(000) | | | Value | |
Health Care Providers & Services — 0.1% | | | | | | | | | | | | |
Laboratory Corp. of America Holdings: | | | | | | | | | | | | |
3.60%, 2/01/25 | | | USD | | | | 300 | | | $ | 301,224 | |
4.70%, 2/01/45 | | | | | | | 100 | | | | 102,930 | |
McKesson Corp., 4.88%, 3/15/44 | | | | | | | 100 | | | | 114,761 | |
| | | | | | | | | | | | |
| | | | | | | | | | | | 518,915 | |
Hotels, Restaurants & Leisure — 0.2% | | | | | | | | | | | | |
Accor SA, 2.63%, 2/05/21 | | | EUR | | | | 600 | | | | 697,115 | |
Merlin Entertainments PLC, 2.75%, 3/15/22 | | | | | | | 125 | | | | 135,414 | |
Wyndham Worldwide Corp.: | | | | | | | | | | | | |
4.25%, 3/01/22 | | | USD | | | | 330 | | | | 344,395 | |
3.90%, 3/01/23 | | | | | | | 200 | | | | 203,860 | |
| | | | | | | | | | | | |
| | | | | | | | | | | | 1,380,784 | |
Household Durables — 0.0% | | | | | | | | | | | | |
Indesit Co. SpA, 4.50%, 4/26/18 | | | EUR | | | | 300 | | | | 357,430 | |
Independent Power and Renewable Electricity Producers — 0.1% | | | | | |
Comision Federal de Electricidad, 4.88%, 1/15/24 | | | USD | | | | 200 | | | | 213,000 | |
Southern Electric Power Distribution PLC,
4.63%, 2/20/37 | | | GBP | | | | 100 | | | | 178,193 | |
| | | | | | | | | | | | |
| | | | | | | | | | | | 391,193 | |
Industrial Conglomerates — 0.1% | | | | | | | | | | | | |
Smiths Group PLC, 4.13%, 5/05/17 | | | EUR | | | | 500 | | | | 575,638 | |
Insurance — 0.3% | | | | | | | | | | | | |
AIA Group Ltd., 3.13%, 3/13/23 | | | USD | | | | 600 | | | | 606,690 | |
Allianz SE, 2.40%, 7/07/45 (a) | | | EUR | | | | 300 | | | | 322,100 | |
Aon PLC, 2.88%, 5/14/26 | | | | | | | 200 | | | | 246,461 | |
Aviva PLC, 6.13%, 11/14/36 (a) | | | GBP | | | | 100 | | | | 173,820 | |
NN Group NV: | | | | | | | | | | | | |
1.00%, 3/18/22 | | | EUR | | | | 275 | | | | 294,187 | |
4.63%, 4/08/44 (a) | | | | | | | 200 | | | | 241,902 | |
Talanx AG, 3.13%, 2/13/23 | | | | | | | 100 | | | | 124,772 | |
| | | | | | | | | | | | |
| | | | | | | | | | | | 2,009,932 | |
Internet & Catalog Retail — 0.1% | | | | | | | | | | | | |
Expedia, Inc., 4.50%, 8/15/24 | | | USD | | | | 300 | | | | 303,203 | |
The Priceline Group, Inc., 1.80%, 3/03/27 | | | EUR | | | | 350 | | | | 374,944 | |
| | | | | | | | | | | | |
| | | | | | | | | | | | 678,147 | |
Internet Software & Services — 0.1% | | | | | | | | | | | | |
Alibaba Group Holding Ltd., 3.13%, 11/28/21 (b) | | | USD | | | | 450 | | | | 453,173 | |
Baidu, Inc.: | | | | | | | | | | | | |
2.75%, 6/09/19 | | | | | | | 200 | | | | 202,070 | |
3.50%, 11/28/22 | | | | | | | 200 | | | | 203,047 | |
| | | | | | | | | | | | |
| | | | | | | | | | | | 858,290 | |
IT Services — 0.1% | | | | | | | | | | | | |
MasterCard Inc., 3.38%, 4/01/24 | | | | | | | 425 | | | | 447,433 | |
Life Sciences Tools & Services — 0.0% | | | | | | | | | | | | |
Life Technologies Corp., 6.00%, 3/01/20 | | | | | | | 230 | | | | 265,625 | |
Media — 0.2% | | | | | | | | | | | | |
Altice SA, 6.25%, 2/15/25 | | | EUR | | | | 150 | | | | 161,247 | |
Sky PLC, 3.75%, 9/16/24 (b) | | | USD | | | | 425 | | | | 439,384 | |
Time Warner Cable, Inc.: | | | | | | | | | | | | |
5.00%, 2/01/20 | | | | | | | 150 | | | | 167,394 | |
4.50%, 9/15/42 | | | | | | | 6 | | | | 6,155 | |
Unitymedia Hessen GmbH & Co. KG/Unitymedia NRW GmbH, 3.50%, 1/15/27 | | | EUR | | | | 200 | | | | 216,049 | |
Virgin Media Finance PLC, 4.50%, 1/15/25 | | | | | | | 125 | | | | 140,750 | |
| | | | | | | | | | | | |
| | | | | | | | | | | | 1,130,979 | |
See Notes to Financial Statements.
| | | | | | |
| | | BLACKROCK MANAGED VOLATILITY PORTFOLIO | | MARCH 31, 2015 | | 17 |
| | | | |
| Schedule of Investments (continued) | | | | |
| | | (Percentages shown are based on Net Assets) | |
| | | | | | | | | | | | |
| Corporate Bonds | | | | | Par
(000) | | | Value | |
Multi-Utilities — 0.1% | | | | | | | | | | | | |
Centrica PLC, 6.38%, 3/10/22 | | | GBP | | | | 100 | | | $ | 185,069 | |
Dominion Resources, Inc., 1.95%, 8/15/16 | | | USD | | | | 305 | | | | 308,622 | |
| | | | | | | | | | | | |
| | | | | | | | | | | | 493,691 | |
Oil, Gas & Consumable Fuels — 0.3% | | | | | | | | | | | | |
Enterprise Products Operating LLC, Series L,
6.30%, 9/15/17 | | | | | | | 250 | | | | 279,088 | |
Kinder Morgan, Inc., 5.30%, 12/01/34 | | | | | | | 300 | | | | 309,924 | |
Orlen Capital AB, 2.50%, 6/30/21 | | | EUR | | | | 100 | | | | 111,281 | |
Petroleos Mexicanos: | | | | | | | | | | | | |
4.88%, 1/18/24 | | | USD | | | | 400 | | | | 423,400 | |
5.63%, 1/23/46 | | | | | | | 229 | | | | 232,435 | |
Petronas Capital Ltd., 4.50%, 3/18/45 | | | | | | | 300 | | | | 301,306 | |
Vier Gas Transport GmbH, 3.13%, 7/10/23 | | | EUR | | | | 150 | | | | 189,640 | |
| | | | | | | | | | | | |
| | | | | | | | | | | | 1,847,074 | |
Paper & Forest Products — 0.0% | | | | | | | | | | | | |
Metsa Board OYJ, 4.00%, 3/13/19 | | | | | | | 100 | | | | 116,530 | |
Pharmaceuticals — 0.2% | | | | | | | | | | | | |
Actavis Funding SCS: | | | | | | | | | | | | |
3.80%, 3/15/25 | | | USD | | | | 150 | | | | 154,805 | |
4.55%, 3/15/35 | | | | | | | 150 | | | | 156,348 | |
4.75%, 3/15/45 | | | | | | | 75 | | | | 79,714 | |
Bayer U.S. Finance LLC, 3.00%, 10/08/21 (b) | | | | | | | 275 | | | | 284,518 | |
Novartis Capital Corp., 4.40%, 5/06/44 | | | | | | | 300 | | | | 345,512 | |
VRX Escrow Corp., 4.50%, 5/15/23 | | | EUR | | | | 350 | | | | 378,688 | |
| | | | | | | | | | | | |
| | | | | | | | | | | | 1,399,585 | |
Professional Services — 0.1% | | | | | | | | | | | | |
Experian Finance PLC, 4.75%, 11/23/18 | | | GBP | | | | 400 | | | | 659,730 | |
Real Estate Investment Trusts (REITs) — 0.2% | | | | | | | | | | | | |
American Tower Corp., 3.50%, 1/31/23 | | | USD | | | | 500 | | | | 495,619 | |
Gecina SA, 1.75%, 7/30/21 | | | EUR | | | | 200 | | | | 225,243 | |
Goodman Funding Pty. Ltd., 6.38%, 4/15/21 (b) | | | USD | | | | 400 | | | | 469,213 | |
Ventas Realty LP/Ventas Capital Corp.,
4.75%, 6/01/21 | | | | | | | 135 | | | | 149,037 | |
WEA Finance LLC/Westfield UK & Europe Finance PLC: | | | | | | | | | | | | |
2.70%, 9/17/19 (b) | | | | | | | 200 | | | | 202,458 | |
4.75%, 9/17/44 (b) | | | | | | | 200 | | | | 217,674 | |
| | | | | | | | | | | | |
| | | | | | | | | | | | 1,759,244 | |
Real Estate Management & Development — 0.2% | | | | | |
Citycon OYJ, 3.75%, 6/24/20 | | | EUR | | | | 547 | | | | 661,472 | |
Grand City Properties SA, 2.00%, 10/29/21 | | | | | | | 100 | | | | 111,019 | |
Tesco Property Finance 1 PLC, 7.62%, 7/13/39 | | | GBP | | | | 330 | | | | 598,092 | |
| | | | | | | | | | | | |
| | | | | | | | | | | | 1,370,583 | |
Road & Rail — 0.1% | | | | | | | | | | | | |
National Express Group PLC, 6.63%, 6/17/20 | | | | | | | 400 | | | | 707,521 | |
Network Rail Infrastructure Finance PLC,
3.00%, 9/07/23 | | | | | | | 100 | | | | 164,120 | |
| | | | | | | | | | | | |
| | | | | | | | | | | | 871,641 | |
Semiconductors & Semiconductor Equipment — 0.1% | | | | | |
ASML Holding NV, 3.38%, 9/19/23 | | | EUR | | | | 200 | | | | 255,485 | |
Intel Corp., 4.25%, 12/15/42 | | | USD | | | | 200 | | | | 208,373 | |
TSMC Global Ltd., 1.63%, 4/03/18 (b) | | | | | | | 300 | | | | 297,406 | |
| | | | | | | | | | | | |
| | | | | | | | | | | | 761,264 | |
| | | | | | | | | | | | |
| Corporate Bonds | | | | | Par
(000) | | | Value | |
Software — 0.1% | | | | | | | | | | | | |
Adobe Systems, Inc., 3.25%, 2/01/25 | | | USD | | | | 400 | | | $ | 404,295 | |
Specialty Retail — 0.1% | | | | | | | | | | | | |
Marks & Spencer PLC, 4.75%, 6/12/25 | | | GBP | | | | 200 | | | | 334,639 | |
O’Reilly Automotive, Inc., 3.80%, 9/01/22 | | | USD | | | | 500 | | | | 522,329 | |
| | | | | | | | | | | | |
| | | | | | | | | | | | 856,968 | |
Technology Hardware, Storage & Peripherals — 0.0% | | | | | |
Seagate HDD Cayman, 4.75%, 1/01/25 (b) | | | | | | | 250 | | | | 258,873 | |
Textiles, Apparel & Luxury Goods — 0.1% | | | | | | | | | | | | |
LVMH Moet Hennessy Louis Vuitton SA,
1.63%, 6/29/17 (b) | | | | | | | 800 | | | | 808,002 | |
Thrifts & Mortgage Finance — 0.0% | | | | | | | | | | | | |
Achmea Bank NV, 2.75%, 2/18/21 | | | EUR | | | | 150 | | | | 177,196 | |
Tobacco — 0.2% | | | | | | | | | | | | |
Altria Group, Inc., 2.85%, 8/09/22 | | | USD | | | | 800 | | | | 795,299 | |
BAT International Finance PLC, 2.00%, 3/13/45 | | | EUR | | | | 150 | | | | 161,111 | |
Imperial Tobacco Finance PLC, 4.88%, 6/07/32 | | | GBP | | | | 100 | | | | 171,933 | |
Philip Morris International, Inc., 3.88%, 8/21/42 | | | USD | | | | 300 | | | | 295,340 | |
Reynolds American, Inc., 4.75%, 11/01/42 | | | | | | | 200 | | | | 206,295 | |
| | | | | | | | | | | | |
| | | | | | | | | | | | 1,629,978 | |
Trading Companies & Distributors — 0.0% | | | | | | | | | | | | |
Travis Perkins PLC, 4.38%, 9/15/21 | | | GBP | | | | 200 | | | | 311,497 | |
Transportation Infrastructure — 0.1% | | | | | | | | | | | | |
Brisa Concessao Rodoviaria SA, 3.88%, 4/01/21 | | | EUR | | | | 100 | | | | 122,034 | |
Manchester Airport Group Funding PLC,
4.75%, 3/31/34 | | | GBP | | | | 100 | | | | 173,857 | |
Silk Bidco AS, 7.50%, 2/01/22 | | | EUR | | | | 200 | | | | 222,576 | |
Transurban Finance Co. Pty. Ltd, 1.88%, 9/16/24 | | | | | | | 475 | | | | 540,594 | |
| | | | | | | | | | | | |
| | | | | | | | | | | | 1,059,061 | |
Wireless Telecommunication Services — 0.3% | | | | | | | | | |
Crown Castle Towers LLC, 6.11%, 1/15/40 (b) | | | USD | | | | 500 | | | | 570,390 | |
EE Finance PLC, 4.38%, 3/28/19 | | | GBP | | | | 200 | | | | 323,183 | |
SK Telecom Co. Ltd., 2.13%, 5/01/18 (b) | | | USD | | | | 950 | | | | 956,965 | |
Telefonica Emisiones SAU, 4.71%, 1/20/20 | | | EUR | | | | 100 | | | | 127,241 | |
| | | | | | | | | | | | |
| | | | | | | | | | | | 1,977,779 | |
Total Corporate Bonds — 9.2% | | | | | | | | | | | 68,110,470 | |
| | | | | | | | | | | | |
| Foreign Agency Obligations | | | | | | | | | |
Banco Nacional de Desenvolvimento Economico e Social, 5.75%, 9/26/23 (b) | | | USD | | | | 200 | | | | 206,040 | |
Caisse d’Amortissement de la Dette Sociale: | | | | | | | | | | | | |
1.88%, 2/12/22 (b) | | | | | | | 1,200 | | | | 1,199,340 | |
1.38%, 11/25/24 | | | EUR | | | | 220 | | | | 256,693 | |
Canada Housing Trust No. 1: | | | | | | | | | | | | |
2.75%, 6/15/16 | | | CAD | | | | 400 | | | | 323,761 | |
3.35%, 12/15/20 | | | | | | | 250 | | | | 220,668 | |
2.55%, 3/15/25 | | | | | | | 140 | | | | 118,164 | |
CDP Financial, Inc., 3.15%, 7/24/24 (b) | | | USD | | | | 300 | | | | 311,300 | |
CNOOC Curtis Funding No. 1 Pty Ltd.,
4.50%, 10/03/23 (b) | | | | | | | 200 | | | | 217,196 | |
See Notes to Financial Statements.
| | | | | | |
| 18 | | BLACKROCK MANAGED VOLATILITY PORTFOLIO | | MARCH 31, 2015 | | |
| | | | |
| Schedule of Investments (continued) | | | | |
| | | (Percentages shown are based on Net Assets) | |
| | | | | | | | | | |
Foreign Agency Obligations | | | | Par (000) | | | Value | |
Development Bank of Japan (20 Year),
1.05%, 6/20/23 | | JPY | | | 50,000 | | | $ | 440,636 | |
European Financial Stability Facility: | | | | | | | | | | |
1.50%, 1/22/20 | | EUR | | | 250 | | | | 288,623 | |
2.35%, 7/29/44 | | | | | 410 | | | | 625,267 | |
European Investment Bank: | | | | | | | | | | |
1.25%, 5/15/18 | | USD | | | 600 | | | | 603,996 | |
1.50%, 4/15/21 | | EUR | | | 1,150 | | | | 1,349,799 | |
1.88%, 2/10/25 | | USD | | | 1,568 | | | | 1,545,488 | |
2.15%, 1/18/27 | | JPY | | | 20,000 | | | | 199,840 | |
3.88%, 6/08/37 | | GBP | | | 100 | | | | 188,398 | |
FMS Wertmanagement AoeR, 0.63%, 1/30/17 | | USD | | | 1,446 | | | | 1,444,824 | |
Hydro-Quebec: | | | | | | | | | | |
8.40%, 1/15/22 | | | | | 405 | | | | 549,795 | |
5.00%, 2/15/50 | | CAD | | | 100 | | | | 115,922 | |
Instituto de Credito Oficial, 4.75%, 4/30/20 | | EUR | | | 200 | | | | 259,036 | |
Japan Bank for International Cooperation,
3.00%, 5/29/24 | | USD | | | 200 | | | | 212,718 | |
Propertize BV, 0.50%, 2/27/17 | | EUR | | | 500 | | | | 543,241 | |
SNCF Reseau, 5.25%, 12/07/28 | | GBP | | | 60 | | | | 118,802 | |
Total Foreign Agency Obligations — 1.5% | | | | | | | | | 11,339,547 | |
| | | | | | | | | | |
| Foreign Government Obligations | | | | | | | | |
Australia — 0.4% | | | | | | | | | | |
Commonwealth of Australia: | | | | | | | | | | |
4.75%, 6/15/16 | | AUD | | | 900 | | | | 709,551 | |
5.50%, 4/21/23 | | | | | 500 | | | | 473,037 | |
3.25%, 4/21/25 | | | | | 280 | | | | 230,856 | |
4.75%, 4/21/27 | | | | | 150 | | | | 141,468 | |
New South Wales Treasury Corp.: | | | | | | | | | | |
6.00%, 2/01/18 | | | | | 400 | | | | 338,658 | |
6.00%, 5/01/30 | | | | | 50 | | | | 52,002 | |
Queensland Treasury Corp.: | | | | | | | | | | |
6.25%, 2/21/20 | | | | | 400 | | | | 360,476 | |
4.75%, 7/21/25 | | | | | 100 | | | | 88,865 | |
Treasury Corp. of Victoria, 6.00%, 6/15/20 | | | | | 250 | | | | 226,058 | |
Western Australian Treasury Corp., 5.00%, 7/23/25 | | | | | 140 | | | | 127,272 | |
| | | | | | | | | | |
| | | | | | | | | | 2,748,243 | |
Austria — 0.1% | | | | | | | | | | |
Republic of Austria, 1.65%, 10/21/24 | | EUR | | | 570 | | | | 689,521 | |
Belgium — 0.4% | | | | | | | | | | |
Kingdom of Belgium: | | | | | | | | | | |
3.50%, 6/28/17 | | | | | 550 | | | | 640,053 | |
2.60%, 6/22/24 | | | | | 920 | | | | 1,189,811 | |
0.80%, 6/22/25 | | | | | 400 | | | | 445,316 | |
3.75%, 6/22/45 | | | | | 200 | | | | 365,832 | |
| | | | | | | | | | |
| | | | | | | | | | 2,641,012 | |
Brazil — 0.1% | | | | | | | | | | |
Federative Republic of Brazil, 8.88%, 4/15/24 | | USD | | | 300 | | | | 396,000 | |
Canada — 0.7% | | | | | | | | | | |
Government of Canada: | | | | | | | | | | |
1.75%, 3/01/19 | | CAD | | | 900 | | | | 742,142 | |
8.00%, 6/01/27 | | | | | 370 | | | | 504,451 | |
4.00%, 6/01/41 | | | | | 490 | | | | 544,666 | |
Province of Alberta, 3.10%, 6/01/24 | | | | | 200 | | | | 173,823 | |
Province of British Columbia, 4.80%, 6/15/21 | | | | | 350 | | | | 332,593 | |
Province of Manitoba: | | | | | | | | | | |
4.30%, 3/01/16 | | | | | 200 | | | | 163,051 | |
1.75%, 5/30/19 | | USD | | | 490 | | | | 495,673 | |
3.30%, 6/02/24 | | CAD | | | 140 | | | | 122,806 | |
Province of New Brunswick, 3.80%, 8/14/45 | | | | | 60 | | | | 55,381 | |
| | | | | | | | | | |
| Foreign Government Obligations | | | | Par (000) | | | Value | |
Canada (concluded) | | | | | | | | | | |
Province of Ontario: | | | | | | | | | | |
4.30%, 3/08/17 | | CAD | | | 600 | | | $ | 505,411 | |
6.20%, 6/02/31 | | | | | 400 | | | | 467,222 | |
3.50%, 6/02/43 | | | | | 200 | | | | 178,046 | |
Province of Quebec: | | | | | | | | | | |
4.50%, 12/01/19 | | | | | 500 | | | | 453,515 | |
2.75%, 9/01/25 | | | | | 140 | | | | 116,487 | |
5.00%, 12/01/41 | | | | | 150 | | | | 165,037 | |
| | | | | | | | | | |
| | | | | | | | | | 5,020,304 | |
Czech Republic — 0.0% | | | | | | | | | | |
Czech Republic, 3.85%, 9/29/21 | | CZK | | | 4,300 | | | | 207,622 | |
Denmark — 0.1% | | | | | | | | | | |
Kingdom of Denmark: | | | | | | | | | | |
4.00%, 11/15/19 | | DKK | | | 3,200 | | | | 550,304 | |
4.50%, 11/15/39 | | | | | 540 | | | | 146,905 | |
| | | | | | | | | | |
| | | | | | | | | | 697,209 | |
Finland — 0.1% | | | | | | | | | | |
Republic of Finland: | | | | | | | | | | |
1.13%, 9/15/18 | | EUR | | | 20 | | | | 22,440 | |
0.63%, 9/15/20 | | | | | 400 | | | | 438,739 | |
| | | | | | | | | | |
| | | | | | | | | | 461,179 | |
France — 0.6% | | | | | | | | | | |
France Government Bond OAT: | | | | | | | | | | |
1.75%, 11/25/24 | | | | | 1,700 | | | | 2,055,329 | |
2.50%, 5/25/30 | | | | | 550 | | | | 737,126 | |
3.25%, 5/25/45 | | | | | 1,160 | | | | 1,932,743 | |
| | | | | | | | | | |
| | | | | | | | | | 4,725,198 | |
Germany — 0.2% | | | | | | | | | | |
Federal Republic of Germany: | | | | | | | | | | |
5.50%, 1/04/31 | | | | | 350 | | | | 667,733 | |
2.50%, 7/04/44 | | | | | 640 | | | | 1,042,489 | |
| | | | | | | | | | |
| | | | | | | | | | 1,710,222 | |
Indonesia — 0.0% | | | | | | | | | | |
Republic of Indonesia, 4.13%, 1/15/25 | | USD | | | 308 | | | | 316,085 | |
Ireland — 0.3% | | | | | | | | | | |
Republic of Ireland: | | | | | | | | | | |
3.40%, 3/18/24 | | EUR | | | 1,670 | | | | 2,222,291 | |
2.00%, 2/18/45 | | | | | 220 | | | | 270,507 | |
| | | | | | | | | | |
| | | | | | | | | | 2,492,798 | |
Israel — 0.1% | | | | | | | | | | |
State of Israel: | | | | | | | | | | |
4.25%, 8/31/16 | | ILS | | | 1,000 | | | | 265,994 | |
3.75%, 3/31/24 | | | | | 400 | | | | 119,106 | |
| | | | | | | | | | |
| | | | | | | | | | 385,100 | |
Italy — 0.7% | | | | | | | | | | |
Buoni Poliennali Del Tesoro: | | | | | | | | | | |
1.15%, 5/15/17 | | EUR | | | 1,250 | | | | 1,371,122 | |
2.15%, 12/15/21 | | | | | 2,350 | | | | 2,732,648 | |
3.25%, 9/01/46 | | | | | 700 | | | | 952,743 | |
| | | | | | | | | | |
| | | | | | | | | | 5,056,513 | |
Ivory Coast — 0.0% | | | | | | | | | | |
African Development Bank, 1.63%, 10/02/18 | | USD | | | 100 | | | | 101,521 | |
Japan — 4.4% | | | | | | | | | | |
Government of Japan (5 Year): | | | | | | | | | | |
Series 102, 0.30%, 12/20/16 | | JPY | | | 430,000 | | | | 3,601,305 | |
Series 105, 0.20%, 6/20/17 | | | | | 195,000 | | | | 1,631,303 | |
Series 113, 0.30%, 6/20/18 | | | | | 280,000 | | | | 2,354,092 | |
See Notes to Financial Statements.
| | | | | | |
| | | BLACKROCK MANAGED VOLATILITY PORTFOLIO | | MARCH 31, 2015 | | 19 |
| | | | |
| Schedule of Investments (continued) | | | | |
| | | (Percentages shown are based on Net Assets) | |
| | | | | | | | | | |
| Foreign Government Obligations | | | | Par (000) | | | Value | |
Japan (concluded) | | | | | | | | | | |
Government of Japan (10 Year): | | | | | | | | | | |
Series 300, 1.50%, 3/20/19 | | JPY | | | 485,000 | | | $ | 4,268,522 | |
Series 309, 1.10%, 6/20/20 | | | | | 155,000 | | | | 1,357,631 | |
Series 313, 1.30%, 3/20/21 | | | | | 210,000 | | | | 1,870,060 | |
Series 323, 0.90%, 6/20/22 | | | | | 290,000 | | | | 2,539,405 | |
Series 325, 0.80%, 9/20/22 | | | | | 85,000 | | | | 739,208 | |
Government of Japan (20 Year): | | | | | | | | | | |
Series 76, 1.90%, 3/20/25 | | | | | 75,000 | | | | 718,202 | |
Series 94, 2.10%, 3/20/27 | | | | | 370,000 | | | | 3,645,559 | |
Series 127, 1.90%, 3/20/31 | | | | | 82,000 | | | | 794,771 | |
Series 137, 1.70%, 6/20/32 | | | | | 237,000 | | | | 2,216,033 | |
Series 146, 1.70%, 9/20/33 | | | | | 140,000 | | | | 1,299,351 | |
Government of Japan (30 Year): | | | | | | | | | | |
Series 26, 2.40%, 3/20/37 | | | | | 100,000 | | | | 1,020,383 | |
Series 36, 2.00%, 3/20/42 | | | | | 137,000 | | | | 1,317,905 | |
Series 42, 1.70%, 3/20/44 | | | | | 65,000 | | | | 586,780 | |
Government of Japan (40 Year),
Series 5, 2.00%, 3/20/52 | | | | | 42,000 | | | | 406,073 | |
Japan Finance Organization for Municipalities: | | | | | | | | | | |
2.00%, 5/09/16 | | | | | 100,000 | | | | 851,068 | |
2.38%, 2/13/25 (b) | | USD | | | 1,100 | | | | 1,086,754 | |
| | | | | | | | | | |
| | | | | | | | | | 32,304,405 | |
Malaysia — 0.1% | | | | | | | | | | |
Federation of Malaysia, 3.58%, 9/28/18 | | MYR | | | 1,200 | | | | 325,422 | |
Mexico — 0.1% | | | | | | | | | | |
United Mexican States: | | | | | | | | | | |
6.50%, 6/09/22 | | MXN | | | 7,500 | | | | 513,965 | |
7.75%, 5/29/31 | | | | | 1,000 | | | | 74,875 | |
8.30%, 8/15/31 | | USD | | | 194 | | | | 297,790 | |
| | | | | | | | | | |
| | | | | | | | | | 886,630 | |
Netherlands — 0.2% | | | | | | | | | | |
Kingdom of the Netherlands: | | | | | | | | | | |
0.50%, 4/15/17 | | EUR | | | 400 | | | | 436,209 | |
1.25%, 1/15/19 | | | | | 450 | | | | 508,765 | |
1.75%, 7/15/23 | | | | | 220 | | | | 266,437 | |
5.50%, 1/15/28 | | | | | 100 | | | | 175,475 | |
| | | | | | | | | | |
| | | | | | | | | | 1,386,886 | |
New Zealand — 0.0% | | | | | | | | | | |
Government of New Zealand, 5.00%, 3/15/19 | | NZD | | | 300 | | | | 239,814 | |
Norway — 0.0% | | | | | | | | | | |
Kingdom of Norway, 2.00%, 5/24/23 | | NOK | | | 800 | | | | 104,087 | |
Panama — 0.0% | | | | | | | | | | |
Republic of Panama, 4.00%, 9/22/24 | | USD | | | 200 | | | | 209,500 | |
Poland — 0.1% | | | | | | | | | | |
Republic of Poland: | | | | | | | | | | |
1.63%, 1/15/19 | | EUR | | | 400 | | | | 452,291 | |
5.13%, 4/21/21 | | USD | | | 200 | | | | 229,760 | |
5.00%, 3/23/22 | | | | | 250 | | | | 287,188 | |
| | | | | | | | | | |
| | | | | | | | | | 969,239 | |
Singapore — 0.0% | | | | | | | | | | |
Republic of Singapore, 2.25%, 6/01/21 | | SGD | | | 350 | | | | 257,371 | |
South Africa — 0.1% | | | | | | | | | | |
Republic of South Africa: | | | | | | | | | | |
5.50%, 3/09/20 | | USD | | | 100 | | | | 109,687 | |
7.00%, 2/28/31 | | ZAR | | | 3,000 | | | | 220,801 | |
8.75%, 2/28/48 | | | | | 700 | | | | 59,918 | |
| | | | | | | | | | |
| | | | | | | | | | 390,406 | |
| | | | | | | | | | |
| Foreign Government Obligations | | | | Par (000) | | | Value | |
Spain — 0.6% | | | | | | | | | | |
Kingdom of Spain: | | | | | | | | | | |
2.10%, 4/30/17 | | EUR | | | 600 | | | $ | 671,529 | |
3.80%, 4/30/24 | | | | | 1,000 | | | | 1,320,150 | |
1.60%, 4/30/25 | | | | | 930 | | | | 1,035,826 | |
5.15%, 10/31/28 | | | | | 1,020 | | | | 1,581,010 | |
| | | | | | | | | | |
| | | | | | | | | | 4,608,515 | |
Sweden — 0.1% | | | | | | | | | | |
Kingdom of Sweden: | | | | | | | | | | |
3.75%, 8/12/17 | | SEK | | | 6,000 | | | | 763,837 | |
3.50%, 6/01/22 | | | | | 1,000 | | | | 143,286 | |
2.50%, 5/12/25 | | | | | 540 | | | | 75,412 | |
| | | | | | | | | | |
| | | | | | | | | | 982,535 | |
Thailand — 0.1% | | | | | | | | | | |
Kingdom of Thailand: | | | | | | | | | | |
3.45%, 3/08/19 | | THB | | | 13,500 | | | | 434,306 | |
4.85%, 6/17/61 | | | | | 3,000 | | | | 108,063 | |
| | | | | | | | | | |
| | | | | | | | | | 542,369 | |
Turkey — 0.0% | | | | | | | | | | |
Republic of Turkey, 8.80%, 11/14/18 | | TRY | | | 600 | | | | 234,104 | |
United Kingdom — 1.2% | | | | | | | | | | |
United Kingdom Gilt: | | | | | | | | | | |
1.75%, 1/22/17 | | GBP | | | 1,500 | | | | 2,278,269 | |
3.75%, 9/07/19 | | | | | 200 | | | | 332,028 | |
3.75%, 9/07/21 | | | | | 250 | | | | 427,291 | |
5.00%, 3/07/25 | | | | | 800 | | | | 1,557,961 | |
4.25%, 6/07/32 | | | | | 650 | | | | 1,268,326 | |
4.50%, 12/07/42 | | | | | 990 | | | | 2,134,053 | |
4.25%, 12/07/55 | | | | | 320 | | | | 725,766 | |
3.50%, 7/22/68 | | | | | 100 | | | | 203,892 | |
| | | | | | | | | | |
| | | | | | | | | | 8,927,586 | |
Total Foreign Government Obligations — 10.8% | | | | 80,017,396 | |
| | | | | |
| Investment Companies — 3.2% | | | | Shares | | | | |
iShares 1-3 Year Credit Bond ETF (g) | | | | | 221,827 | | | | 23,409,403 | |
| | | | | | | | | | |
| Non-Agency Mortgage-Backed Securities | | | | Par (000) | | | | |
Collateralized Mortgage Obligations — 0.4% | | | | | | | | | | |
Fosse Master Issuer PLC, Series 2015-1X, Class A3, 0.82%, 10/18/54 (a)(h) | | GBP | | | 290 | | | | 430,184 | |
Granite Master Issuer PLC: | | | | | | | | | | |
Series 2006-2, Class A4,
0.26%, 12/20/54 (a) | | USD | | | 410 | | | | 408,299 | |
Series 2007-1, Class 5A1,
0.73%, 12/20/54 (a) | | GBP | | | 124 | | | | 183,606 | |
Lanark Master Issuer PLC, Series 2014-2X,
Class 1A, 0.45%, 12/22/54 (a)(h) | | EUR | | | 800 | | | | 862,214 | |
Silverstone Master Issuer PLC, Series 2015-1X,
Class 1A, 0.91%, 1/21/70 | | GBP | | | 445 | | | | 661,478 | |
Storm BV, Series 2014-2, Class A1,
0.32%, 3/22/51 (a)(h) | | EUR | | | 80 | | | | 86,619 | |
| | | | | | | | | | |
| | | | | | | | | | 2,632,400 | |
Commercial Mortgage-Backed Securities — 0.1% | | | | | |
Banc of America Commercial Mortgage Trust,
Series 2007-1, Class AMFX,
5.48%, 1/15/49 (a) | | USD | | | 30 | | | | 31,263 | |
COBALT CMBS Commercial Mortgage Trust,
Series 2006-C1, Class A4,
5.22%, 8/15/48 | | | | | 286 | | | | 300,390 | |
See Notes to Financial Statements.
| | | | | | |
| 20 | | BLACKROCK MANAGED VOLATILITY PORTFOLIO | | MARCH 31, 2015 | | |
| | | | |
| Schedule of Investments (continued) | | | | |
| | | (Percentages shown are based on Net Assets) | |
| | | | | | | | | | |
| Non-Agency Mortgage-Backed Securities | | | | Par (000) | | | Value | |
Commercial Mortgage-Backed Securities (concluded) | | | | | |
Greenwich Capital Commercial Funding Corp.,
Series 2006-GG7, Class AJ,
5.79%, 7/10/38 (a) | | USD | | | 170 | | | $ | 173,991 | |
JPMorgan Chase Commercial Mortgage Securities Trust, Series 2006-CB14, Class AM,
5.43%, 12/12/44 (a) | | | | | 180 | | | | 184,595 | |
LB-UBS Commercial Mortgage Trust, Series 2007-C1,
Class AM, 5.46%, 2/15/40 | | | | | 165 | | | | 176,256 | |
| | | | | | | | | | |
| | | | | | | | | | 866,495 | |
Total Non-Agency Mortgage-Backed Securities — 0.5% | | | | 3,498,895 | |
| | | | | |
| U.S. Government Sponsored Agency Securities | | | | | | | | |
Agency Obligations — 0.2% | | | | | | | | | | |
Fannie Mae, 6.63%, 11/15/30 | | | | | 200 | | | | 301,019 | |
Federal Home Loan Bank, 5.63%, 6/13/16 | | | | | 890 | | | | 944,610 | |
Small Business Administration Participation Certificates, Series 1997-20F, Class 1,
7.20%, 6/01/17 | | | | | 40 | | | | 41,996 | |
Tennessee Valley Authority, 5.25%, 9/15/39 | | | | | 145 | | | | 189,863 | |
| | | | | | | | | | |
| | | | | | | | | | 1,477,488 | |
Collateralized Mortgage Obligations — 0.0% | | | | | | | | | | |
Freddie Mac: | | | | | | | | | | |
Series K712, Class A2, 1.87%, 11/25/19 | | | | | 180 | | | | 181,944 | |
Series K029, Class A2, 3.32%, 2/25/23 | | | | | 130 | | | | 139,770 | |
| | | | | | | | | | |
| | | | | | | | | | 321,714 | |
Mortgage-Backed Securities — 3.3% | | | | | | | | | | |
Fannie Mae Mortgage-Backed Securities: | | | | | | | | | | |
2.50%, 4/01/30 (i) | | | | | 640 | | | | 657,300 | |
3.00%, 4/01/30-4/01/45 (i) | | | | | 2,380 | | | | 2,446,665 | |
3.50%, 4/01/30-4/01/45 (i) | | | | | 2,850 | | | | 3,003,272 | |
4.00%, 4/01/30-4/01/45 (i) | | | | | 2,240 | | | | 2,390,236 | |
4.50%, 4/01/45 (i) | | | | | 950 | | | | 1,036,391 | |
5.00%, 4/01/45 (i) | | | | | 540 | | | | 600,455 | |
5.50%, 4/01/45 (i) | | | | | 390 | | | | 439,420 | |
6.00%, 4/01/45 (i) | | | | | 340 | | | | 387,866 | |
Freddie Mac Mortgage-Backed Securities: | | | | | | | | | | |
2.50%, 4/01/30 (i) | | | | | 430 | | | | 440,884 | |
3.00%, 4/01/30-4/01/45 (i) | | | | | 1,320 | | | | 1,361,119 | |
3.50%, 4/01/30-4/01/45 (i) | | | | | 1,340 | | | | 1,406,821 | |
4.00%, 4/01/30-4/01/45 (i) | | | | | 1,340 | | | | 1,428,373 | |
4.50%, 4/01/45 (i) | | | | | 900 | | | | 980,086 | |
5.00%, 4/01/45 (i) | | | | | 380 | | | | 421,384 | |
5.50%, 4/01/45 (i) | | | | | 300 | | | | 336,609 | |
6.00%, 4/01/45 (i) | | | | | 200 | | | | 227,539 | |
Ginnie Mae Mortgage-Backed Securities: | | | | | | | | | | |
3.00%, 4/15/45 (i) | | | | | 1,130 | | | | 1,163,426 | |
3.50%, 4/15/45 (i) | | | | | 1,700 | | | | 1,788,947 | |
4.00%, 4/15/45 (i) | | | | | 1,320 | | | | 1,416,525 | |
4.50%, 4/15/45 (i) | | | | | 830 | | | | 915,101 | |
5.00%, 4/15/45 (i) | | | | | 870 | | | | 969,540 | |
5.50%, 4/15/45 (i) | | | | | 170 | | | | 191,755 | |
6.00%, 4/15/44 (i) | | | | | 120 | | | | 136,592 | |
| | | | | | | | | | |
| | | | | | | | | | 24,146,306 | |
Total U.S. Government Sponsored Agency Securities — 3.5% | | | | 25,945,508 | |
| | | | | | | | |
| U.S. Treasury Obligations | | Par (000) | | | Value | |
U.S. Treasury Bonds: | | | | | | | | |
5.25%, 11/15/28 | | USD | 500 | | | $ | 682,539 | |
5.38%, 2/15/31 | | | 1,000 | | | | 1,420,938 | |
5.00%, 5/15/37 | | | 570 | | | | 828,460 | |
4.38%, 5/15/41 | | | 950 | | | | 1,294,821 | |
3.00%, 5/15/42 | | | 1,068 | | | | 1,165,122 | |
3.38%, 5/15/44 | | | 500 | | | | 585,742 | |
U.S. Treasury Inflation Indexed Notes, 0.25%, 1/15/25 | | | 2,220 | | | | 2,235,700 | |
U.S. Treasury Notes: | | | | | | | | |
0.88%, 7/15/17 | | | 4,000 | | | | 4,020,000 | |
1.00%, 6/30/19 | | | 2,380 | | | | 2,355,829 | |
2.50%, 5/15/24 | | | 500 | | | | 525,234 | |
Total U.S. Treasury Obligations — 2.0% | | | | 15,114,385 | |
Total Long-Term Investments (Cost — $544,764,132) — 72.8% | | | | | | | 540,686,234 | |
| | | | | | | | |
| Short-Term Securities | | Shares | | | | |
BlackRock Liquidity Funds, TempFund, Institutional Class, 0.06% (g)(j) | | | 211,570,778 | | | | 211,570,778 | |
| | |
| | | Beneficial
Interest (000) | | | | |
BlackRock Liquidity Series, LLC, Money Market Series, 0.22% (g)(j)(k) | | $ | 345 | | | | 344,954 | |
Total Short-Term Securities (Cost — $211,915,732) — 28.5% | | | | 211,915,732 | |
| | | | | | | | |
| Options Purchased | | | | | | |
(Cost — $24,441) — 0.0% | | | | | | | 55,087 | |
Total Investments Before Options Written (Cost — $756,704,305) — 101.3% | | | | 752,657,053 | |
| | | | | |
| Options Written | | | | | | |
(Premiums Received — $ 266,989) — (0.0)% | | | | (291,931 | ) |
Total Investments Net of Options Written — 101.3% | | | | 752,365,122 | |
Liabilities in Excess of Other Assets — (1.3)% | | | | (9,654,668 | ) |
| | | | | | | | |
Net Assets — 100.0% | | | | | | $ | 742,710,454 | |
| | | | | | | | |
See Notes to Financial Statements.
| | | | | | |
| | | BLACKROCK MANAGED VOLATILITY PORTFOLIO | | MARCH 31, 2015 | | 21 |
| | |
| Schedule of Investments (continued) | | |
|
| Notes to Schedule of Investments |
| (a) | Variable rate security. Rate shown is as of report date. |
| (b) | Security exempt from registration pursuant to Rule 144A under the Securities Act of 1933, as amended. These securities may be resold in transactions exempt from registration to qualified institutional investors. |
| (c) | Represents a payment-in-kind security which may pay interest/dividends in additional par/shares and/or in cash. Rates shown are the current rate and possible payment rates. |
| (d) | Non-income producing security. |
| (e) | Security, or a portion of security, is on loan. |
| (f) | Restricted security as to resale. As of report date, the Fund held less than 0.01% of its net assets, with a current value of $26,215 and an original cost of $56,451 of its net assets. |
| (g) | During the six months ended March 31, 2015, investments in issuers considered to be affiliates of the Fund for purposes of Section 2(a)(3) of the Investment Company Act of 1940, as amended, were as follows: |
| | | | | | | | | | | | | | | | | | | | | | | | | | | | |
| Affiliate | | Shares/ Beneficial Interest Held at
September 30, 2014 | | | Shares/
Beneficial Interest
Purchased | | | Shares/
Beneficial Interest
Sold | | | Shares/
Beneficial
Interest Held at
March 31, 2015 | | | Value at March 31, 2015 | | | Income | | | Realized
Gain | |
BlackRock Liquidity Funds, TempFund, Institutional Class | | | 420,264,224 | | | | — | | | | 208,693,446 | 1 | | | 211,570,778 | | | $ | 211,570,778 | | | $ | 79,525 | | | $ | 28,007 | |
BlackRock Liquidity Series, LLC, Money Market Series | | | — | | | $ | 344,954 | 2 | | | — | | | $ | 344,954 | | | $ | 344,954 | | | $ | 4,913 | | | | — | |
iShares 1-3 Year Credit Bond ETF | | | 221,827 | | | | — | | | | — | | | | 221,827 | | | $ | 23,409,403 | | | $ | 115,184 | | | | — | |
| | 1 | | Represents net shares sold. |
| | 2 | | Represents net beneficial interest purchased. |
| (h) | Represents a step-up bond that pays an initial coupon rate for the first period and then a higher coupon rate for the following periods. Rate shown is as of report date. |
| (i) | Represents or includes a TBA transaction. As of March 31, 2015, unsettled TBA transactions were as follows: |
| | | | | | | | |
| Counterparty | | Value | | | Unrealized
Appreciation | |
Barclays Capital, Inc. | | $ | 4,874,515 | | | $ | 31,196 | |
Citigroup Global Markets, Inc. | | $ | 4,933,685 | | | $ | 30,382 | |
Deutsche Bank Securities, Inc. | | $ | 2,418,939 | | | $ | 13,107 | |
Goldman Sachs & Co. | | $ | 6,704,561 | | | $ | 47,359 | |
Merrill Lynch, Pierce, Fenner & Smith, Inc. | | $ | 795,722 | | | $ | 8,166 | |
Morgan Stanley & Co. LLC | | $ | 4,418,884 | | | $ | 39,602 | |
| (j) | Represents the current yield as of report date. |
| (k) | Security was purchased with the cash collateral from loaned securities. The Fund may withdraw up to 25% of its investment daily, although the manager of the BlackRock Liquidity Series, LLC, Money Market Series, in its sole discretion, may permit an investor to withdraw more than 25% on any one day. |
| Ÿ | | For Fund compliance purposes, the Fund’s industry classifications refer to any one or more of the industry sub-classifications used by one or more widely recognized market indexes or ratings group indexes, and/or as defined by the investment advisor. These definitions may not apply for purposes of this report, which may combine such industry sub-classifications for reporting ease. |
| Ÿ | | As of March 31, 2015, financial futures contracts outstanding were as follows: |
| | | | | | | | | | | | | | | | | | | | | | |
Contracts
Long/
(Short) | | | Issue | | Exchange | | Expiration | | | Notional Value | | | Unrealized
Appreciation
(Depreciation) | |
| | 70 | | | IBEX 35 Index | | Madrid | | | April 2015 | | | | USD | | | | 8,648,427 | | | $ | 390,306 | |
| | 2,882 | | | SGX CNX Nifty Index | | Singapore | | | April 2015 | | | | USD | | | | 49,218,796 | | | | (754,366 | ) |
| | 445 | | | Australian Government Bonds (3 Year) | | Sydney | | | June 2015 | | | | USD | | | | 38,180,889 | | | | 174,776 | |
| | 111 | | | Australian Government Bonds (10 Year) | | Sydney | | | June 2015 | | | | USD | | | | 11,216,745 | | | | 193,559 | |
| | 10 | | | Canadian Government Bonds (10 Year) | | Montreal | | | June 2015 | | | | USD | | | | 1,126,998 | | | | (688 | ) |
| | 19 | | | Euro-Bobl | | Eurex | | | June 2015 | | | | USD | | | | 2,644,212 | | | | (77 | ) |
| | 29 | | | Euro-Schatz | | Eurex | | | June 2015 | | | | USD | | | | 3,468,232 | | | | 1,899 | |
| | 80 | | | FTSE/MIB Index | | Milan | | | June 2015 | | | | USD | | | | 9,813,982 | | | | 188,544 | |
| | 9 | | | Nikkei 225 Index | | Osaka | | | June 2015 | | | | USD | | | | 1,441,531 | | | | 42,918 | |
| | 37 | | | U.S. Treasury Notes (2 Year) | | Chicago Board of Trade | | | June 2015 | | | | USD | | | | 8,108,781 | | | | (17,223 | ) |
| | 137 | | | U.S. Treasury Notes (5 Year) | | Chicago Board of Trade | | | June 2015 | | | | USD | | | | 16,468,899 | | | | (109,789 | ) |
| | 79 | | | U.S. Treasury Notes (10 Year) | | Chicago Board of Trade | | | June 2015 | | | | USD | | | | 10,183,594 | | | | (72,984 | ) |
| | (85 | ) | | AUD Currency Futures | | Chicago Mercantile | | | June 2015 | | | | USD | | | | 6,443,850 | | | | 50,705 | |
| | (33 | ) | | CHF Currency Futures | | Chicago Mercantile | | | June 2015 | | | | USD | | | | 4,254,938 | | | | (143,869 | ) |
| | (91 | ) | | EUR Currency Futures | | Chicago Mercantile | | | June 2015 | | | | USD | | | | 12,232,675 | | | | (163,092 | ) |
| | (734 | ) | | E-Mini S&P 500 Futures | | Chicago Mercantile | | | June 2015 | | | | USD | | | | 75,631,360 | | | | 275,165 | |
| | (22 | ) | | Euro-Bund | | Eurex | | | June 2015 | | | | USD | | | | 3,755,532 | | | | (7,528 | ) |
See Notes to Financial Statements.
| | | | | | |
| 22 | | BLACKROCK MANAGED VOLATILITY PORTFOLIO | | MARCH 31, 2015 | | |
| | |
| Schedule of Investments (continued) | | |
| Ÿ | | As of March 31, 2015, financial futures contracts outstanding were as follows: (concluded) |
| | | | | | | | | | | | | | | | | | | | | | | | |
Contracts
Long/
(Short) | | | Issue | | Exchange | | | Expiration | | | | | | Notional
Value | | | Unrealized
Appreciation
(Depreciation) | |
| | (2 | ) | | Euro-Buxl | | | Eurex | | | | June 2015 | | | | USD | | | | 378,831 | | | $ | (24,471 | ) |
| | (156 | ) | | FTSE 100 Index | | | London | | | | June 2015 | | | | USD | | | | 15,566,904 | | | | 103,281 | |
| | (168 | ) | | GBP Currency Futures | | | Chicago Mercantile | | | | June 2015 | | | | USD | | | | 15,578,850 | | | | 64,697 | |
| | (19 | ) | | Long Gilt British | | | NYSE Liffe | | | | June 2015 | | | | USD | | | | 3,403,274 | | | | (6,175 | ) |
| | (94 | ) | | JPY Currency Futures | | | Chicago Mercantile | | | | June 2015 | | | | USD | | | | 9,806,550 | | | | (112,069 | ) |
| | (10 | ) | | SEK Currency Futures | | | Chicago Mercantile | | | | June 2015 | | | | USD | | | | 23,228 | | | | 23 | |
| | (9 | ) | | U.S. Treasury Bonds (30 Year) | | | Chicago Board of Trade | | | | June 2015 | | | | USD | | | | 1,474,875 | | | | 4,342 | |
| | (1,070 | ) | | U.S. Treasury Notes (2 Year) | | | Chicago Board of Trade | | | | June 2015 | | | | USD | | | | 234,497,187 | | | | (498,056 | ) |
| | (820 | ) | | U.S. Treasury Notes (5 Year) | | | Chicago Board of Trade | | | | June 2015 | | | | USD | | | | 98,572,970 | | | | (657,133 | ) |
| | (397 | ) | | U.S. Treasury Notes (10 Year) | | | Chicago Board of Trade | | | | June 2015 | | | | USD | | | | 51,175,781 | | | | (366,768 | ) |
| | (6 | ) | | U.S. Ultra Treasury Bonds | | | Chicago Board of Trade | | | | June 2015 | | | | USD | | | | 1,019,250 | | | | 7,226 | |
| | Total | | | | | | | | | | | | | | | | | | | | | $ | (1,436,847 | ) |
| | | | | | | | | | | | | | | | | | | | | | | | |
| Ÿ | | As of March 31, 2015, forward foreign currency exchange contracts outstanding were as follows: |
| | | | | | | | | | | | | | | | | | | | | | |
Currency
Purchased | | | Currency
Sold | | | Counterparty | | Settlement
Date | | | Unrealized
Appreciation
(Depreciation) | |
| BRL | | | 690,000 | | | | USD | | | | 215,423 | | | Deutsche Bank AG | | | 4/02/15 | | | $ | 658 | |
| BRL | | | 840,000 | | | | USD | | | | 269,058 | | | Deutsche Bank AG | | | 4/02/15 | | | | (6,003 | ) |
| BRL | | | 990,000 | | | | USD | | | | 303,216 | | | Deutsche Bank AG | | | 4/02/15 | | | | 6,814 | |
| BRL | | | 600,000 | | | | USD | | | | 190,900 | | | Goldman Sachs International | | | 4/02/15 | | | | (3,004 | ) |
| BRL | | | 798,098 | | | | USD | | | | 277,103 | | | JPMorgan Chase Bank N.A. | | | 4/02/15 | | | | (27,170 | ) |
| BRL | | | 501,902 | | | | USD | | | | 174,120 | | | Morgan Stanley & Co. International PLC | | | 4/02/15 | | | | (16,944 | ) |
| USD | | | 35,971 | | | | BRL | | | | 114,128 | | | Barclays Bank PLC | | | 4/02/15 | | | | 231 | |
| USD | | | 430,179 | | | | BRL | | | | 1,300,000 | | | Deutsche Bank AG | | | 4/02/15 | | | | 23,069 | |
| USD | | | 71,942 | | | | BRL | | | | 227,799 | | | Goldman Sachs International | | | 4/02/15 | | | | 605 | |
| USD | | | 185,128 | | | | BRL | | | | 600,000 | | | JPMorgan Chase Bank N.A. | | | 4/02/15 | | | | (2,769 | ) |
| USD | | | 600,939 | | | | BRL | | | | 1,920,000 | | | JPMorgan Chase Bank N.A. | | | 4/02/15 | | | | (331 | ) |
| USD | | | 81,349 | | | | BRL | | | | 258,074 | | | Morgan Stanley & Co. International PLC | | | 4/02/15 | | | | 530 | |
| AUD | | | 3,640,000 | | | | USD | | | | 2,779,944 | | | Westpac Banking Corp. | | | 4/07/15 | | | | (8,725 | ) |
| CAD | | | 6,893,436 | | | | USD | | | | 5,442,692 | | | HSBC Bank PLC | | | 4/07/15 | | | | (471 | ) |
| CHF | | | 430,000 | | | | USD | | | | 442,790 | | | HSBC Bank PLC | | | 4/07/15 | | | | (182 | ) |
| CZK | | | 4,700,000 | | | | USD | | | | 183,194 | | | HSBC Bank PLC | | | 4/07/15 | | | | 161 | |
| DKK | | | 4,400,000 | | | | USD | | | | 632,547 | | | HSBC Bank PLC | | | 4/07/15 | | | | 829 | |
| EUR | | | 13,265,000 | | | | USD | | | | 14,247,407 | | | Deutsche Bank AG | | | 4/07/15 | | | | 17,123 | |
| EUR | | | 13,265,000 | | | | USD | | | | 14,247,407 | | | Goldman Sachs International | | | 4/07/15 | | | | 17,123 | |
| EUR | | | 13,265,000 | | | | USD | | | | 14,247,468 | | | Morgan Stanley & Co. International PLC | | | 4/07/15 | | | | 17,061 | |
| EUR | | | 13,265,000 | | | | USD | | | | 14,247,459 | | | UBS AG | | | 4/07/15 | | | | 17,071 | |
| GBP | | | 2,995,000 | | | | USD | | | | 4,445,883 | | | Deutsche Bank AG | | | 4/07/15 | | | | (3,333 | ) |
| GBP | | | 2,995,000 | | | | USD | | | | 4,445,898 | | | Goldman Sachs International | | | 4/07/15 | | | | (3,348 | ) |
| GBP | | | 300,000 | | | | USD | | | | 463,514 | | | JPMorgan Chase Bank N.A. | | | 4/07/15 | | | | (18,518 | ) |
| GBP | | | 2,990,000 | | | | USD | | | | 4,438,655 | | | Morgan Stanley & Co. International PLC | | | 4/07/15 | | | | (3,522 | ) |
| GBP | | | 2,995,000 | | | | USD | | | | 4,445,868 | | | UBS AG | | | 4/07/15 | | | | (3,318 | ) |
| ILS | | | 2,000,000 | | | | USD | | | | 502,940 | | | HSBC Bank PLC | | | 4/07/15 | | | | (342 | ) |
| JPY | | | 965,900,000 | | | | USD | | | | 8,054,201 | | | Deutsche Bank AG | | | 4/07/15 | | | | 229 | |
| JPY | | | 965,900,000 | | | | USD | | | | 8,054,872 | | | Goldman Sachs International | | | 4/07/15 | | | | (442 | ) |
| JPY | | | 965,900,000 | | | | USD | | | | 8,054,201 | | | Morgan Stanley & Co. International PLC | | | 4/07/15 | | | | 229 | |
| JPY | | | 965,900,000 | | | | USD | | | | 8,054,818 | | | UBS AG | | | 4/07/15 | | | | (388 | ) |
| MXN | | | 10,150,000 | | | | USD | | | | 666,222 | | | HSBC Bank PLC | | | 4/07/15 | | | | (1,119 | ) |
| NOK | | | 5,350,000 | | | | USD | | | | 663,846 | | | HSBC Bank PLC | | | 4/07/15 | | | | 139 | |
| NZD | | | 350,000 | | | | USD | | | | 262,342 | | | Westpac Banking Corp. | | | 4/07/15 | | | | (871 | ) |
See Notes to Financial Statements.
| | | | | | |
| | | BLACKROCK MANAGED VOLATILITY PORTFOLIO | | MARCH 31, 2015 | | 23 |
| | |
| Schedule of Investments (continued) | | |
As of March 31, 2015, forward foreign currency exchange contracts outstanding were as follows: (continued)
| | | | | | | | | | | | | | | | | | | | | | |
Currency
Purchased | | | Currency
Sold | | | Counterparty | | Settlement
Date | | | Unrealized
Appreciation
(Depreciation) | |
| SEK | | | 11,400,000 | | | | USD | | | | 1,321,971 | | | HSBC Bank PLC | | | 4/07/15 | | | $ | 1,882 | |
| SGD | | | 400,000 | | | | USD | | | | 291,585 | | | HSBC Bank PLC | | | 4/07/15 | | | | (164 | ) |
| THB | | | 19,200,000 | | | | USD | | | | 589,929 | | | HSBC Bank PLC | | | 4/07/15 | | | | (87 | ) |
| TRY | | | 600,000 | | | | USD | | | | 231,080 | | | HSBC Bank PLC | | | 4/07/15 | | | | (684 | ) |
| USD | | | 2,843,572 | | | | AUD | | | | 3,640,000 | | | UBS AG | | | 4/07/15 | | | | 72,353 | |
| USD | | | 373,203 | | | | CAD | | | | 470,000 | | | Citibank N.A. | | | 4/07/15 | | | | 2,148 | |
| USD | | | 5,141,443 | | | | CAD | | | | 6,423,436 | | | UBS AG | | | 4/07/15 | | | | 70,277 | |
| USD | | | 454,173 | | | | CHF | | | | 430,000 | | | Deutsche Bank AG | | | 4/07/15 | | | | 11,565 | |
| USD | | | 191,859 | | | | CZK | | | | 4,700,000 | | | Deutsche Bank AG | | | 4/07/15 | | | | 8,504 | |
| USD | | | 662,122 | | | | DKK | | | | 4,400,000 | | | UBS AG | | | 4/07/15 | | | | 28,745 | |
| USD | | | 271,559 | | | | EUR | | | | 250,000 | | | Citibank N.A. | | | 4/07/15 | | | | 2,722 | |
| USD | | | 14,452,197 | | | | EUR | | | | 12,880,000 | | | Deutsche Bank AG | | | 4/07/15 | | | | 601,677 | |
| USD | | | 850,252 | | | | EUR | | | | 800,000 | | | Goldman Sachs International | | | 4/07/15 | | | | (10,029 | ) |
| USD | | | 561,041 | | | | EUR | | | | 500,000 | | | JPMorgan Chase Bank N.A. | | | 4/07/15 | | | | 23,366 | |
| USD | | | 14,441,182 | | | | EUR | | | | 12,870,000 | | | JPMorgan Chase Bank N.A. | | | 4/07/15 | | | | 601,416 | |
| USD | | | 14,452,326 | | | | EUR | | | | 12,880,000 | | | Morgan Stanley & Co. International PLC | | | 4/07/15 | | | | 601,806 | |
| USD | | | 14,452,339 | | | | EUR | | | | 12,880,000 | | | UBS AG | | | 4/07/15 | | | | 601,819 | |
| USD | | | 1,828,108 | | | | GBP | | | | 1,210,000 | | | Citibank N.A. | | | 4/07/15 | | | | 33,288 | |
| USD | | | 3,962,976 | | | | GBP | | | | 2,565,000 | | | Deutsche Bank AG | | | 4/07/15 | | | | 158,255 | |
| USD | | | 440,374 | | | | GBP | | | | 300,000 | | | Goldman Sachs International | | | 4/07/15 | | | | (4,623 | ) |
| USD | | | 3,970,591 | | | | GBP | | | | 2,570,000 | | | JPMorgan Chase Bank N.A. | | | 4/07/15 | | | | 158,453 | |
| USD | | | 3,963,035 | | | | GBP | | | | 2,565,000 | | | Morgan Stanley & Co. International PLC | | | 4/07/15 | | | | 158,314 | |
| USD | | | 736,678 | | | | GBP | | | | 500,000 | | | UBS AG | | | 4/07/15 | | | | (4,983 | ) |
| USD | | | 3,963,043 | | | | GBP | | | | 2,565,000 | | | UBS AG | | | 4/07/15 | | | | 158,322 | |
| USD | | | 501,637 | | | | ILS | | | | 2,000,000 | | | Deutsche Bank AG | | | 4/07/15 | | | | (961 | ) |
| USD | | | 7,930,789 | | | | JPY | | | | 947,650,000 | | | Deutsche Bank AG | | | 4/07/15 | | | | 28,542 | |
| USD | | | 610,933 | | | | JPY | | | | 73,000,000 | | | JPMorgan Chase Bank N.A. | | | 4/07/15 | | | | 2,202 | |
| USD | | | 7,930,789 | | | | JPY | | | | 947,650,000 | | | JPMorgan Chase Bank N.A. | | | 4/07/15 | | | | 28,542 | |
| USD | | | 7,931,061 | | | | JPY | | | | 947,650,000 | | | Morgan Stanley & Co. International PLC | | | 4/07/15 | | | | 28,814 | |
| USD | | | 7,930,789 | | | | JPY | | | | 947,650,000 | | | UBS AG | | | 4/07/15 | | | | 28,542 | |
| USD | | | 106,396 | | | | MXN | | | | 1,650,000 | | | Citibank N.A. | | | 4/07/15 | | | | (1,724 | ) |
| USD | | | 567,120 | | | | MXN | | | | 8,500,000 | | | Deutsche Bank AG | | | 4/07/15 | | | | 10,137 | |
| USD | | | 700,496 | | | | NOK | | | | 5,350,000 | | | Deutsche Bank AG | | | 4/07/15 | | | | 36,511 | |
| USD | | | 263,988 | | | | NZD | | | | 350,000 | | | Deutsche Bank AG | | | 4/07/15 | | | | 2,516 | |
| USD | | | 1,367,210 | | | | SEK | | | | 11,400,000 | | | Deutsche Bank AG | | | 4/07/15 | | | | 43,356 | |
| USD | | | 293,794 | | | | SGD | | | | 400,000 | | | Deutsche Bank AG | | | 4/07/15 | | | | 2,373 | |
| USD | | | 592,410 | | | | THB | | | | 19,200,000 | | | Deutsche Bank AG | | | 4/07/15 | | | | 2,568 | |
| USD | | | 228,753 | | | | TRY | | | | 600,000 | | | Citibank N.A. | | | 4/07/15 | | | | (1,644 | ) |
| USD | | | 255,982 | | | | ZAR | | | | 3,000,000 | | | UBS AG | | | 4/07/15 | | | | 8,944 | |
| ZAR | | | 3,000,000 | | | | USD | | | | 247,399 | | | HSBC Bank PLC | | | 4/07/15 | | | | (361 | ) |
| AUD | | | 2,220,000 | | | | USD | | | | 1,798,489 | | | Deutsche Bank AG | | | 4/16/15 | | | | (109,279 | ) |
| CAD | | | 2,882,000 | | | | USD | | | | 2,410,755 | | | Credit Suisse International | | | 4/16/15 | | | | (135,728 | ) |
| BRL | | | 1,920,000 | | | | USD | | | | 596,033 | | | JPMorgan Chase Bank N.A. | | | 5/05/15 | | | | (145 | ) |
| USD | | | 456,355 | | | | BRL | | | | 1,490,000 | | | JPMorgan Chase Bank N.A. | | | 5/05/15 | | | | (6,078 | ) |
| EUR | | | 420,000 | | | | USD | | | | 451,271 | | | Citibank N.A. | | | 5/06/15 | | | | 557 | |
| SEK | | | 3,200,000 | | | | USD | | | | 371,227 | | | HSBC Bank PLC | | | 5/06/15 | | | | 547 | |
| USD | | | 2,775,333 | | | | AUD | | | | 3,640,000 | | | Westpac Banking Corp. | | | 5/06/15 | | | | 8,902 | |
| USD | | | 5,440,497 | | | | CAD | | | | 6,893,436 | | | HSBC Bank PLC | | | 5/06/15 | | | | 301 | |
| USD | | | 443,276 | | | | CHF | | | | 430,000 | | | HSBC Bank PLC | | | 5/06/15 | | | | 135 | |
See Notes to Financial Statements.
| | | | | | |
| 24 | | BLACKROCK MANAGED VOLATILITY PORTFOLIO | | MARCH 31, 2015 | | |
| | |
| Schedule of Investments (continued) | | |
As of March 31, 2015, forward foreign currency exchange contracts outstanding were as follows: (continued)
| | | | | | | | | | | | | | | | | | | | | | |
Currency
Purchased | | | Currency
Sold | | | Counterparty | | Settlement
Date | | | Unrealized
Appreciation
(Depreciation) | |
| USD | | | 183,251 | | | | CZK | | | | 4,700,000 | | | HSBC Bank PLC | | | 5/06/15 | | | $ | (179 | ) |
| USD | | | 633,149 | | | | DKK | | | | 4,400,000 | | | HSBC Bank PLC | | | 5/06/15 | | | | (894 | ) |
| USD | | | 14,252,779 | | | | EUR | | | | 13,265,000 | | | Deutsche Bank AG | | | 5/06/15 | | | | (17,463 | ) |
| USD | | | 14,253,044 | | | | EUR | | | | 13,265,000 | | | Goldman Sachs International | | | 5/06/15 | | | | (17,198 | ) |
| USD | | | 14,252,794 | | | | EUR | | | | 13,265,000 | | | Morgan Stanley & Co. International PLC | | | 5/06/15 | | | | (17,447 | ) |
| USD | | | 14,252,528 | | | | EUR | | | | 13,265,000 | | | UBS AG | | | 5/06/15 | | | | (17,714 | ) |
| USD | | | 4,445,149 | | | | GBP | | | | 2,995,000 | | | Deutsche Bank AG | | | 5/06/15 | | | | 3,486 | |
| USD | | | 4,445,104 | | | | GBP | | | | 2,995,000 | | | Goldman Sachs International | | | 5/06/15 | | | | 3,441 | |
| USD | | | 4,437,809 | | | | GBP | | | | 2,990,000 | | | Morgan Stanley & Co. International PLC | | | 5/06/15 | | | | 3,561 | |
| USD | | | 4,445,083 | | | | GBP | | | | 2,995,000 | | | UBS AG | | | 5/06/15 | | | | 3,420 | |
| USD | | | 502,883 | | | | ILS | | | | 2,000,000 | | | HSBC Bank PLC | | | 5/06/15 | | | | 290 | |
| USD | | | 664,909 | | | | MXN | | | | 10,150,000 | | | HSBC Bank PLC | | | 5/06/15 | | | | 1,135 | |
| USD | | | 663,236 | | | | NOK | | | | 5,350,000 | | | HSBC Bank PLC | | | 5/06/15 | | | | (177 | ) |
| USD | | | 261,601 | | | | NZD | | | | 350,000 | | | Westpac Banking Corp. | | | 5/06/15 | | | | 901 | |
| USD | | | 1,322,496 | | | | SEK | | | | 11,400,000 | | | HSBC Bank PLC | | | 5/06/15 | | | | (1,950 | ) |
| USD | | | 291,345 | | | | SGD | | | | 400,000 | | | HSBC Bank PLC | | | 5/06/15 | | | | 136 | |
| USD | | | 588,392 | | | | THB | | | | 19,200,000 | | | HSBC Bank PLC | | | 5/06/15 | | | | (661 | ) |
| USD | | | 229,279 | | | | TRY | | | | 600,000 | | | HSBC Bank PLC | | | 5/06/15 | | | | 757 | |
| USD | | | 246,221 | | | | ZAR | | | | 3,000,000 | | | HSBC Bank PLC | | | 5/06/15 | | | | 403 | |
| GBP | | | 2,548,000 | | | | USD | | | | 3,746,363 | | | Goldman Sachs International | | | 5/07/15 | | | | 32,362 | |
| JPY | | | 25,000,000 | | | | USD | | | | 208,559 | | | Barclays Bank PLC | | | 5/07/15 | | | | 3 | |
| USD | | | 3,832,332 | | | | GBP | | | | 2,548,000 | | | Citibank N.A. | | | 5/07/15 | | | | 53,607 | |
| USD | | | 8,057,224 | | | | JPY | | | | 965,900,000 | | | Deutsche Bank AG | | | 5/07/15 | | | | (794 | ) |
| USD | | | 8,057,862 | | | | JPY | | | | 965,900,000 | | | Goldman Sachs International | | | 5/07/15 | | | | (155 | ) |
| USD | | | 8,057,392 | | | | JPY | | | | 965,900,000 | | | Morgan Stanley & Co. International PLC | | | 5/07/15 | | | | (626 | ) |
| USD | | | 208,556 | | | | JPY | | | | 25,000,000 | | | UBS AG | | | 5/07/15 | | | | (6 | ) |
| USD | | | 8,057,775 | | | | JPY | | | | 965,900,000 | | | UBS AG | | | 5/07/15 | | | | (243 | ) |
| AUD | | | 270,000 | | | | USD | | | | 209,712 | | | Bank of America N.A. | | | 6/10/15 | | | | (4,895 | ) |
| AUD | | | 550,000 | | | | USD | | | | 422,494 | | | Bank of America N.A. | | | 6/10/15 | | | | (5,273 | ) |
| AUD | | | 134,000 | | | | USD | | | | 104,543 | | | Barclays Bank PLC | | | 6/10/15 | | | | (2,893 | ) |
| AUD | | | 291,555 | | | | USD | | | | 222,267 | | | Barclays Bank PLC | | | 6/10/15 | | | | (1,099 | ) |
| AUD | | | 269,000 | | | | USD | | | | 208,978 | | | Citibank N.A. | | | 6/10/15 | | | | (4,920 | ) |
| AUD | | | 979,000 | | | | USD | | | | 748,246 | | | Credit Suisse International | | | 6/10/15 | | | | (5,594 | ) |
| AUD | | | 124,505 | | | | USD | | | | 94,452 | | | Goldman Sachs International | | | 6/10/15 | | | | (5 | ) |
| AUD | | | 44,000 | | | | USD | | | | 33,792 | | | HSBC Bank PLC | | | 6/10/15 | | | | (414 | ) |
| AUD | | | 306,000 | | | | USD | | | | 240,749 | | | JPMorgan Chase Bank N.A. | | | 6/10/15 | | | | (8,623 | ) |
| AUD | | | 404,000 | | | | USD | | | | 317,852 | | | JPMorgan Chase Bank N.A. | | | 6/10/15 | | | | (11,385 | ) |
| AUD | | | 713,000 | | | | USD | | | | 542,600 | | | JPMorgan Chase Bank N.A. | | | 6/10/15 | | | | (1,731 | ) |
| AUD | | | 81,495 | | | | USD | | | | 61,730 | | | UBS AG | | | 6/10/15 | | | | 91 | |
| AUD | | | 256,446 | | | | USD | | | | 195,501 | | | UBS AG | | | 6/10/15 | | | | (966 | ) |
| AUD | | | 1,600,000 | | | | USD | | | | 1,230,336 | | | UBS AG | | | 6/10/15 | | | | (16,605 | ) |
| AUD | | | 2,730,999 | | | | USD | | | | 2,100,029 | | | UBS AG | | | 6/10/15 | | | | (28,342 | ) |
| CAD | | | 738,000 | | | | USD | | | | 582,187 | | | Citibank N.A. | | | 6/10/15 | | | | (62 | ) |
| CAD | | | 94,000 | | | | USD | | | | 73,801 | | | Royal Bank of Canada | | | 6/10/15 | | | | 345 | |
| EUR | | | 65,690 | | | | PLN | | | | 270,000 | | | Barclays Bank PLC | | | 6/10/15 | | | | (377 | ) |
| EUR | | | 176,234 | | | | PLN | | | | 730,000 | | | Barclays Bank PLC | | | 6/10/15 | | | | (2,497 | ) |
| EUR | | | 175,595 | | | | PLN | | | | 730,000 | | | Credit Suisse International | | | 6/10/15 | | | | (3,184 | ) |
| EUR | | | 246,662 | | | | PLN | | | | 1,020,000 | | | Credit Suisse International | | | 6/10/15 | | | | (3,039 | ) |
| EUR | | | 243,000 | | | | USD | | | | 257,414 | | | Barclays Bank PLC | | | 6/10/15 | | | | 4,127 | |
See Notes to Financial Statements.
| | | | | | |
| | | BLACKROCK MANAGED VOLATILITY PORTFOLIO | | MARCH 31, 2015 | | 25 |
| | |
| Schedule of Investments (continued) | | |
As of March 31, 2015, forward foreign currency exchange contracts outstanding were as follows: (continued)
| | | | | | | | | | | | | | | | | | | | | | |
Currency
Purchased | | | Currency
Sold | | | Counterparty | | Settlement
Date | | | Unrealized
Appreciation
(Depreciation) | |
| EUR | | | 315,000 | | | | USD | | | | 346,261 | | | Barclays Bank PLC | | | 6/10/15 | | | $ | (7,226 | ) |
| EUR | | | 190,000 | | | | USD | | | | 200,373 | | | BNP Paribas S.A. | | | 6/10/15 | | | | 4,124 | |
| EUR | | | 417,000 | | | | USD | | | | 454,578 | | | Citibank N.A. | | | 6/10/15 | | | | (5,761 | ) |
| EUR | | | 760,000 | | | | USD | | | | 830,616 | | | Citibank N.A. | | | 6/10/15 | | | | (12,628 | ) |
| EUR | | | 283,000 | | �� | | USD | | | | 307,921 | | | Credit Suisse International | | | 6/10/15 | | | | (3,328 | ) |
| EUR | | | 343,000 | | | | USD | | | | 372,666 | | | Credit Suisse International | | | 6/10/15 | | | | (3,495 | ) |
| EUR | | | 565,000 | | | | USD | | | | 598,618 | | | Credit Suisse International | | | 6/10/15 | | | | 9,492 | |
| EUR | | | 93,000 | | | | USD | | | | 98,593 | | | Deutsche Bank AG | | | 6/10/15 | | | | 1,503 | |
| EUR | | | 1,073,000 | | | | USD | | | | 1,166,957 | | | Goldman Sachs International | | | 6/10/15 | | | | (12,087 | ) |
| EUR | | | 190,000 | | | | USD | | | | 200,068 | | | HSBC Bank PLC | | | 6/10/15 | | | | 4,429 | |
| EUR | | | 786,000 | | | | USD | | | | 854,852 | | | HSBC Bank PLC | | | 6/10/15 | | | | (8,880 | ) |
| EUR | | | 190,000 | | | | USD | | | | 200,526 | | | JPMorgan Chase Bank N.A. | | | 6/10/15 | | | | 3,971 | |
| EUR | | | 423,000 | | | | USD | | | | 448,633 | | | JPMorgan Chase Bank N.A. | | | 6/10/15 | | | | 6,642 | |
| EUR | | | 1,070,000 | | | | USD | | | | 1,171,051 | | | JPMorgan Chase Bank N.A. | | | 6/10/15 | | | | (19,410 | ) |
| EUR | | | 512,000 | | | | USD | | | | 563,064 | | | Morgan Stanley & Co. International PLC | | | 6/10/15 | | | | (11,998 | ) |
| EUR | | | 900,000 | | | | USD | | | | 961,817 | | | Morgan Stanley & Co. International PLC | | | 6/10/15 | | | | 6,853 | |
| EUR | | | 925,000 | | | | USD | | | | 1,015,747 | | | State Street Bank and Trust Co. | | | 6/10/15 | | | | (20,169 | ) |
| EUR | | | 216,000 | | | | USD | | | | 227,727 | | | UBS AG | | | 6/10/15 | | | | 4,754 | |
| EUR | | | 260,000 | | | | USD | | | | 280,584 | | | UBS AG | | | 6/10/15 | | | | (746 | ) |
| EUR | | | 260,000 | | | | USD | | | | 282,632 | | | UBS AG | | | 6/10/15 | | | | (2,794 | ) |
| EUR | | | 262,000 | | | | USD | | | | 278,498 | | | UBS AG | | | 6/10/15 | | | | 3,493 | |
| GBP | | | 61,000 | | | | USD | | | | 91,978 | | | Barclays Bank PLC | | | 6/10/15 | | | | (1,535 | ) |
| GBP | | | 85,000 | | | | USD | | | | 128,293 | | | Barclays Bank PLC | | | 6/10/15 | | | | (2,266 | ) |
| GBP | | | 170,000 | | | | USD | | | | 252,131 | | | Barclays Bank PLC | | | 6/10/15 | | | | (76 | ) |
| GBP | | | 240,000 | | | | USD | | | | 354,708 | | | Barclays Bank PLC | | | 6/10/15 | | | | 1,134 | |
| GBP | | | 291,204 | | | | USD | | | | 431,417 | | | Barclays Bank PLC | | | 6/10/15 | | | | 344 | |
| GBP | | | 296,000 | | | | USD | | | | 441,885 | | | Barclays Bank PLC | | | 6/10/15 | | | | (3,013 | ) |
| GBP | | | 563,193 | | | | USD | | | | 847,048 | | | Barclays Bank PLC | | | 6/10/15 | | | | (12,016 | ) |
| GBP | | | 170,442 | | | | USD | | | | 252,418 | | | Citibank N.A. | | | 6/10/15 | | | | 293 | |
| GBP | | | 1,031,000 | | | | USD | | | | 1,529,824 | | | Citibank N.A. | | | 6/10/15 | | | | (1,185 | ) |
| GBP | | | 170,000 | | | | USD | | | | 252,060 | | | Credit Suisse International | | | 6/10/15 | | | | (5 | ) |
| GBP | | | 458,000 | | | | USD | | | | 680,037 | | | Credit Suisse International | | | 6/10/15 | | | | (972 | ) |
| GBP | | | 511,000 | | | | USD | | | | 771,745 | | | Credit Suisse International | | | 6/10/15 | | | | (14,098 | ) |
| GBP | | | 50,000 | | | | USD | | | | 74,465 | | | Goldman Sachs International | | | 6/10/15 | | | | (331 | ) |
| GBP | | | 55,807 | | | | USD | | | | 83,944 | | | Goldman Sachs International | | | 6/10/15 | | | | (1,200 | ) |
| GBP | | | 136,354 | | | | USD | | | | 201,905 | | | Goldman Sachs International | | | 6/10/15 | | | | 263 | |
| GBP | | | 192,000 | | | | USD | | | | 287,011 | | | Goldman Sachs International | | | 6/10/15 | | | | (2,337 | ) |
| GBP | | | 163,000 | | | | USD | | | | 241,443 | | | HSBC Bank PLC | | | 6/10/15 | | | | 233 | |
| GBP | | | 282,000 | | | | USD | | | | 422,143 | | | HSBC Bank PLC | | | 6/10/15 | | | | (4,028 | ) |
| GBP | | | 420,000 | | | | USD | | | | 634,570 | | | HSBC Bank PLC | | | 6/10/15 | | | | (11,847 | ) |
| GBP | | | 455,000 | | | | USD | | | | 676,234 | | | HSBC Bank PLC | | | 6/10/15 | | | | (1,617 | ) |
| GBP | | | 60,000 | | | | USD | | | | 88,778 | | | JPMorgan Chase Bank N.A. | | | 6/10/15 | | | | 183 | |
| GBP | | | 172,000 | | | | USD | | | | 255,639 | | | UBS AG | | | 6/10/15 | | | | (619 | ) |
| INR | | | 17,100,000 | | | | USD | | | | 271,127 | | | Credit Suisse International | | | 6/10/15 | | | | (2,103 | ) |
| INR | | | 12,100,000 | | | | USD | | | | 190,611 | | | HSBC Bank PLC | | | 6/10/15 | | | | (249 | ) |
| INR | | | 13,500,000 | | | | USD | | | | 214,082 | | | Morgan Stanley & Co. International PLC | | | 6/10/15 | | | | (1,694 | ) |
| INR | | | 16,900,000 | | | | USD | | | | 265,713 | | | UBS AG | | | 6/10/15 | | | | 165 | |
| INR | | | 19,300,000 | | | | USD | | | | 303,889 | | | UBS AG | | | 6/10/15 | | | | (254 | ) |
| JPY | | | 24,915,000 | | | | USD | | | | 208,637 | | | Bank of America N.A. | | | 6/10/15 | | | | (693 | ) |
See Notes to Financial Statements.
| | | | | | |
| 26 | | BLACKROCK MANAGED VOLATILITY PORTFOLIO | | MARCH 31, 2015 | | |
| | |
| Schedule of Investments (continued) | | |
As of March 31, 2015, forward foreign currency exchange contracts outstanding were as follows: (continued)
| | | | | | | | | | | | | | | | | | | | | | |
Currency
Purchased | | | Currency
Sold | | | Counterparty | | Settlement
Date | | | Unrealized
Appreciation
(Depreciation) | |
| JPY | | | 24,915,000 | | | | USD | | | | 208,672 | | | Bank of America N.A. | | | 6/10/15 | | | $ | (728 | ) |
| JPY | | | 27,250,000 | | | | USD | | | | 225,322 | | | Bank of America N.A. | | | 6/10/15 | | | | 2,110 | |
| JPY | | | 27,250,000 | | | | USD | | | | 225,565 | | | Bank of America N.A. | | | 6/10/15 | | | | 1,867 | |
| JPY | | | 39,500,000 | | | | USD | | | | 332,028 | | | Bank of America N.A. | | | 6/10/15 | | | | (2,355 | ) |
| JPY | | | 42,400,000 | | | | USD | | | | 354,148 | | | Bank of America N.A. | | | 6/10/15 | | | | (271 | ) |
| JPY | | | 9,200,000 | | | | USD | | | | 75,991 | | | Barclays Bank PLC | | | 6/10/15 | | | | 794 | |
| JPY | | | 13,800,000 | | | | USD | | | | 115,927 | | | Barclays Bank PLC | | | 6/10/15 | | | | (751 | ) |
| JPY | | | 15,500,000 | | | | USD | | | | 129,355 | | | Barclays Bank PLC | | | 6/10/15 | | | | 11 | |
| JPY | | | 16,600,000 | | | | USD | | | | 137,434 | | | Barclays Bank PLC | | | 6/10/15 | | | | 1,112 | |
| JPY | | | 16,968,652 | | | | USD | | | | 140,190 | | | Barclays Bank PLC | | | 6/10/15 | | | | 1,433 | |
| JPY | | | 37,400,000 | | | | USD | | | | 314,518 | | | Barclays Bank PLC | | | 6/10/15 | | | | (2,372 | ) |
| JPY | | | 25,670,000 | | | | USD | | | | 215,122 | | | BNP Paribas S.A. | | | 6/10/15 | | | | (877 | ) |
| JPY | | | 40,200,000 | | | | USD | | | | 336,495 | | | Citibank N.A. | | | 6/10/15 | | | | (980 | ) |
| JPY | | | 111,400,000 | | | | USD | | | | 935,817 | | | Citibank N.A. | | | 6/10/15 | | | | (6,056 | ) |
| JPY | | | 41,481,392 | | | | USD | | | | 342,678 | | | Credit Suisse International | | | 6/10/15 | | | | 3,532 | |
| JPY | | | 7,500,000 | | | | USD | | | | 61,871 | | | Goldman Sachs International | | | 6/10/15 | | | | 726 | |
| JPY | | | 16,886,562 | | | | USD | | | | 139,579 | | | Goldman Sachs International | | | 6/10/15 | | | | 1,359 | |
| JPY | | | 27,149,956 | | | | USD | | | | 224,304 | | | Goldman Sachs International | | | 6/10/15 | | | | 2,294 | |
| JPY | | | 37,500,000 | | | | USD | | | | 309,353 | | | Goldman Sachs International | | | 6/10/15 | | | | 3,628 | |
| JPY | | | 6,500,000 | | | | USD | | | | 53,809 | | | HSBC Bank PLC | | | 6/10/15 | | | | 441 | |
| JPY | | | 6,513,438 | | | | USD | | | | 53,846 | | | Morgan Stanley & Co. International PLC | | | 6/10/15 | | | | 516 | |
| JPY | | | 15,900,000 | | | | USD | | | | 131,389 | | | UBS AG | | | 6/10/15 | | | | 1,315 | |
| JPY | | | 11,700,000 | | | | USD | | | | 98,148 | | | Westpac Banking Corp. | | | 6/10/15 | | | | (498 | ) |
| KRW | | | 237,600,000 | | | | USD | | | | 214,247 | | | Barclays Bank PLC | | | 6/10/15 | | | | (578 | ) |
| KRW | | | 299,300,000 | | | | USD | | | | 268,647 | | | HSBC Bank PLC | | | 6/10/15 | | | | 508 | |
| KRW | | | 299,500,000 | | | | USD | | | | 270,796 | | | JPMorgan Chase Bank N.A. | | | 6/10/15 | | | | (1,461 | ) |
| KRW | | | 343,800,000 | | | | USD | | | | 305,654 | | | JPMorgan Chase Bank N.A. | | | 6/10/15 | | | | 3,519 | |
| KRW | | | 213,700,000 | | | | USD | | | | 189,703 | | | Morgan Stanley & Co. International PLC | | | 6/10/15 | | | | 2,474 | |
| MXN | | | 3,190,000 | | | | USD | | | | 212,064 | | | Credit Suisse International | | | 6/10/15 | | | | (3,952 | ) |
| MXN | | | 4,060,000 | | | | USD | | | | 271,133 | | | Credit Suisse International | | | 6/10/15 | | | | (6,264 | ) |
| MXN | | | 4,100,000 | | | | USD | | | | 263,395 | | | Credit Suisse International | | | 6/10/15 | | | | 4,084 | |
| MXN | | | 2,788,396 | | | | USD | | | | 180,224 | | | Deutsche Bank AG | | | 6/10/15 | | | | 1,687 | |
| MXN | | | 181,604 | | | | USD | | | | 11,740 | | | Morgan Stanley & Co. International PLC | | | 6/10/15 | | | | 108 | |
| MXN | | | 4,710,000 | | | | USD | | | | 306,333 | | | Morgan Stanley & Co. International PLC | | | 6/10/15 | | | | 941 | |
| MYR | | | 1,480,000 | | | | USD | | | | 399,568 | | | JPMorgan Chase Bank N.A. | | | 6/10/15 | | | | (2,421 | ) |
| NOK | | | 130,123 | | | | USD | | | | 16,596 | | | Barclays Bank PLC | | | 6/10/15 | | | | (475 | ) |
| NOK | | | 600,160 | | | | USD | | | | 73,538 | | | Credit Suisse International | | | 6/10/15 | | | | 816 | |
| NOK | | | 1,442,000 | | | | USD | | | | 179,165 | | | Credit Suisse International | | | 6/10/15 | | | | (514 | ) |
| NOK | | | 1,580,000 | | | | USD | | | | 193,593 | | | Credit Suisse International | | | 6/10/15 | | | | 2,154 | |
| NOK | | | 2,160,000 | | | | USD | | | | 265,930 | | | Credit Suisse International | | | 6/10/15 | | | | 1,674 | |
| NOK | | | 2,195,000 | | | | USD | | | | 272,226 | | | Credit Suisse International | | | 6/10/15 | | | | (286 | ) |
| NOK | | | 2,228,000 | | | | USD | | | | 275,094 | | | Credit Suisse International | | | 6/10/15 | | | | 935 | |
| NOK | | | 4,093,000 | | | | USD | | | | 501,525 | | | Credit Suisse International | | | 6/10/15 | | | | 5,560 | |
| NOK | | | 2,160,000 | | | | USD | | | | 266,791 | | | Goldman Sachs International | | | 6/10/15 | | | | 813 | |
| NOK | | | 128,000 | | | | USD | | | | 15,363 | | | HSBC Bank PLC | | | 6/10/15 | | | | 495 | |
| NOK | | | 765,000 | | | | USD | | | | 93,793 | | | HSBC Bank PLC | | | 6/10/15 | | | | 983 | |
| NOK | | | 1,880,000 | | | | USD | | | | 230,392 | | | HSBC Bank PLC | | | 6/10/15 | | | | 2,523 | |
| NOK | | | 1,707,000 | | | | USD | | | | 211,875 | | | JPMorgan Chase Bank N.A. | | | 6/10/15 | | | | (393 | ) |
| NOK | | | 1,945,000 | | | | USD | | | | 247,103 | | | JPMorgan Chase Bank N.A. | | | 6/10/15 | | | | (6,136 | ) |
See Notes to Financial Statements.
| | | | | | |
| | | BLACKROCK MANAGED VOLATILITY PORTFOLIO | | MARCH 31, 2015 | | 27 |
| | |
| Schedule of Investments (continued) | | |
As of March 31, 2015, forward foreign currency exchange contracts outstanding were as follows: (continued)
| | | | | | | | | | | | | | | | | | | | | | |
Currency
Purchased | | | Currency
Sold | | | Counterparty | | Settlement
Date | | | Unrealized
Appreciation
(Depreciation) | |
| NOK | | | 2,593,000 | | | | USD | | | | 318,648 | | | JPMorgan Chase Bank N.A. | | | 6/10/15 | | | $ | 2,601 | |
| NOK | | | 3,082,840 | | | | USD | | | | 377,397 | | | JPMorgan Chase Bank N.A. | | | 6/10/15 | | | | 4,538 | |
| NOK | | | 3,374,000 | | | | USD | | | | 414,430 | | | JPMorgan Chase Bank N.A. | | | 6/10/15 | | | | 3,577 | |
| NOK | | | 5,160,000 | | | | USD | | | | 632,577 | | | JPMorgan Chase Bank N.A. | | | 6/10/15 | | | | 6,699 | |
| NOK | | | 234,877 | | | | USD | | | | 29,948 | | | UBS AG | | | 6/10/15 | | | | (849 | ) |
| NOK | | | 2,190,000 | | | | USD | | | | 276,875 | | | UBS AG | | | 6/10/15 | | | | (5,554 | ) |
| NZD | | | 281,000 | | | | USD | | | | 205,855 | | | Goldman Sachs International | | | 6/10/15 | | | | 2,760 | |
| PLN | | | 730,000 | | | | EUR | | | | 175,976 | | | Barclays Bank PLC | | | 6/10/15 | | | | 2,775 | |
| PLN | | | 1,020,000 | | | | EUR | | | | 246,557 | | | Barclays Bank PLC | | | 6/10/15 | | | | 3,153 | |
| PLN | | | 810,000 | | | | EUR | | | | 196,243 | | | Credit Suisse International | | | 6/10/15 | | | | 2,021 | |
| PLN | | | 1,000,000 | | | | EUR | | | | 242,550 | | | Credit Suisse International | | | 6/10/15 | | | | 2,200 | |
| PLN | | | 1,200,000 | | | | EUR | | | | 289,500 | | | Credit Suisse International | | | 6/10/15 | | | | 4,319 | |
| SEK | | | 4,960,000 | | | | USD | | | | 587,148 | | | Barclays Bank PLC | | | 6/10/15 | | | | (10,566 | ) |
| SEK | | | 5,235,000 | | | | USD | | | | 619,701 | | | Barclays Bank PLC | | | 6/10/15 | | | | (11,152 | ) |
| SEK | | | 2,636,000 | | | | USD | | | | 305,386 | | | Credit Suisse International | | | 6/10/15 | | | | 1,039 | |
| SEK | | | 2,970,000 | | | | USD | | | | 344,773 | | | Credit Suisse International | | | 6/10/15 | | | | 478 | |
| SEK | | | 3,865,000 | | | | USD | | | | 457,224 | | | Credit Suisse International | | | 6/10/15 | | | | (7,932 | ) |
| SEK | | | 4,961,000 | | | | USD | | | | 587,397 | | | UBS AG | | | 6/10/15 | | | | (10,700 | ) |
| SEK | | | 5,231,000 | | | | USD | | | | 619,366 | | | UBS AG | | | 6/10/15 | | | | (11,282 | ) |
| TRY | | | 39,102 | | | | USD | | | | 14,760 | | | Barclays Bank PLC | | | 6/10/15 | | | | 9 | |
| TRY | | | 445,225 | | | | USD | | | | 171,488 | | | Barclays Bank PLC | | | 6/10/15 | | | | (3,324 | ) |
| TRY | | | 244,775 | | | | USD | | | | 94,213 | | | Deutsche Bank AG | | | 6/10/15 | | | | (1,760 | ) |
| TRY | | | 470,898 | | | | USD | | | | 177,704 | | | Deutsche Bank AG | | | 6/10/15 | | | | 157 | |
| TRY | | | 560,000 | | | | USD | | | | 215,062 | | | JPMorgan Chase Bank N.A. | | | 6/10/15 | | | | (3,547 | ) |
| TRY | | | 810,000 | | | | USD | | | | 305,603 | | | Morgan Stanley & Co. International PLC | | | 6/10/15 | | | | 339 | |
| USD | | | 653,901 | | | | AUD | | | | 847,000 | | | Citibank N.A. | | | 6/10/15 | | | | 11,382 | |
| USD | | | 56,468 | | | | AUD | | | | 72,871 | | | Credit Suisse International | | | 6/10/15 | | | | 1,190 | |
| USD | | | 71,320 | | | | AUD | | | | 91,000 | | | Credit Suisse International | | | 6/10/15 | | | | 2,289 | |
| USD | | | 84,392 | | | | AUD | | | | 109,000 | | | Credit Suisse International | | | 6/10/15 | | | | 1,707 | |
| USD | | | 370,936 | | | | AUD | | | | 485,000 | | | Credit Suisse International | | | 6/10/15 | | | | 3,023 | |
| USD | | | 32,802 | | | | AUD | | | | 42,336 | | | Deutsche Bank AG | | | 6/10/15 | | | | 686 | |
| USD | | | 62,314 | | | | AUD | | | | 80,209 | | | Goldman Sachs International | | | 6/10/15 | | | | 1,470 | |
| USD | | | 275,046 | | | | AUD | | | | 359,000 | | | Goldman Sachs International | | | 6/10/15 | | | | 2,715 | |
| USD | | | 375,781 | | | | AUD | | | | 490,000 | | | Goldman Sachs International | | | 6/10/15 | | | | 4,076 | |
| USD | | | 826,789 | | | | AUD | | | | 1,070,000 | | | Goldman Sachs International | | | 6/10/15 | | | | 15,106 | |
| USD | | | 1,297,984 | | | | AUD | | | | 1,702,000 | | | Goldman Sachs International | | | 6/10/15 | | | | 6,878 | |
| USD | | | 80,640 | | | | AUD | | | | 105,000 | | | HSBC Bank PLC | | | 6/10/15 | | | | 989 | |
| USD | | | 189,324 | | | | AUD | | | | 250,000 | | | HSBC Bank PLC | | | 6/10/15 | | | | (321 | ) |
| USD | | | 159,298 | | | | AUD | | | | 205,000 | | | JPMorgan Chase Bank N.A. | | | 6/10/15 | | | | 3,788 | |
| USD | | | 422,114 | | | | AUD | | | | 550,000 | | | JPMorgan Chase Bank N.A. | | | 6/10/15 | | | | 4,894 | |
| USD | | | 8,201 | | | | AUD | | | | 10,584 | | | Morgan Stanley & Co. International PLC | | | 6/10/15 | | | | 172 | |
| USD | | | 279,660 | | | | AUD | | | | 369,638 | | | UBS AG | | | 6/10/15 | | | | (741 | ) |
| USD | | | 40,046 | | | | AUD | | | | 52,000 | | | Westpac Banking Corp. | | | 6/10/15 | | | | 600 | |
| USD | | | 124,496 | | | | AUD | | | | 164,362 | | | Westpac Banking Corp. | | | 6/10/15 | | | | (186 | ) |
| USD | | | 164,225 | | | | AUD | | | | 216,000 | | | Westpac Banking Corp. | | | 6/10/15 | | | | 371 | |
| USD | | | 832,259 | | | | AUD | | | | 1,075,000 | | | Westpac Banking Corp. | | | 6/10/15 | | | | 16,783 | |
| USD | | | 419,734 | | | | CAD | | | | 524,000 | | | Barclays Bank PLC | | | 6/10/15 | | | | 6,410 | |
| USD | | | 94,368 | | | | CAD | | | | 118,000 | | | BNP Paribas S.A. | | | 6/10/15 | | | | 1,291 | |
| USD | | | 123,958 | | | | CAD | | | | 155,000 | | | BNP Paribas S.A. | | | 6/10/15 | | | | 1,696 | |
See Notes to Financial Statements.
| | | | | | |
| 28 | | BLACKROCK MANAGED VOLATILITY PORTFOLIO | | MARCH 31, 2015 | | |
| | |
| Schedule of Investments (continued) | | |
As of March 31, 2015, forward foreign currency exchange contracts outstanding were as follows: (continued)
| | | | | | | | | | | | | | | | | | | | | | |
Currency
Purchased | | | Currency
Sold | | | Counterparty | | Settlement
Date | | | Unrealized
Appreciation
(Depreciation) | |
| USD | | | 169,945 | | | | CAD | | | | 214,000 | | | Citibank N.A. | | | 6/10/15 | | | $ | 1,145 | |
| USD | | | 258,701 | | | | CAD | | | | 329,000 | | | JPMorgan Chase Bank N.A. | | | 6/10/15 | | | | (810 | ) |
| USD | | | 1,227,883 | | | | CAD | | | | 1,547,000 | | | UBS AG | | | 6/10/15 | | | | 7,629 | |
| USD | | | 2,110,498 | | | | CAD | | | | 2,659,000 | | | UBS AG | | | 6/10/15 | | | | 13,114 | |
| USD | | | 1,265,252 | | | | EUR | | | | 1,177,000 | | | Citibank N.A. | | | 6/10/15 | | | | (1,554 | ) |
| USD | | | 300,572 | | | | EUR | | | | 275,000 | | | Credit Suisse International | | | 6/10/15 | | | | 4,590 | |
| USD | | | 426,092 | | | | EUR | | | | 399,000 | | | Credit Suisse International | | | 6/10/15 | | | | (3,352 | ) |
| USD | | | 461,493 | | | | EUR | | | | 430,000 | | | Credit Suisse International | | | 6/10/15 | | | | (1,316 | ) |
| USD | | | 419,866 | | | | EUR | | | | 390,000 | | | Deutsche Bank AG | | | 6/10/15 | | | | 109 | |
| USD | | | 151,272 | | | | EUR | | | | 137,000 | | | Goldman Sachs International | | | 6/10/15 | | | | 3,819 | |
| USD | | | 201,019 | | | | EUR | | | | 184,863 | | | Goldman Sachs International | | | 6/10/15 | | | | 2,051 | |
| USD | | | 278,184 | | | | EUR | | | | 256,137 | | | Goldman Sachs International | | | 6/10/15 | | | | 2,504 | |
| USD | | | 373,035 | | | | EUR | | | | 343,000 | | | Goldman Sachs International | | | 6/10/15 | | | | 3,864 | |
| USD | | | 813,499 | | | | EUR | | | | 748,000 | | | Goldman Sachs International | | | 6/10/15 | | | | 8,426 | |
| USD | | | 421,939 | | | | EUR | | | | 393,000 | | | HSBC Bank PLC | | | 6/10/15 | | | | (1,047 | ) |
| USD | | | 799,588 | | | | EUR | | | | 759,000 | | | JPMorgan Chase Bank N.A. | | | 6/10/15 | | | | (17,324 | ) |
| USD | | | 306,575 | | | | EUR | | | | 285,000 | | | Morgan Stanley & Co. International PLC | | | 6/10/15 | | | | (170 | ) |
| USD | | | 810,796 | | | | EUR | | | | 744,000 | | | Morgan Stanley & Co. International PLC | | | 6/10/15 | | | | 10,029 | |
| USD | | | 375,730 | | | | EUR | | | | 342,000 | | | State Street Bank and Trust Co. | | | 6/10/15 | | | | 7,635 | |
| USD | | | 71,452 | | | | EUR | | | | 66,000 | | | UBS AG | | | 6/10/15 | | | | 416 | |
| USD | | | 220,852 | | | | EUR | | | | 204,000 | | | UBS AG | | | 6/10/15 | | | | 1,287 | |
| USD | | | 14,831 | | | | GBP | | | | 10,000 | | | Barclays Bank PLC | | | 6/10/15 | | | | 5 | |
| USD | | | 67,815 | | | | GBP | | | | 45,775 | | | Barclays Bank PLC | | | 6/10/15 | | | | (54 | ) |
| USD | | | 351,953 | | | | GBP | | | | 236,000 | | | Barclays Bank PLC | | | 6/10/15 | | | | 2,041 | |
| USD | | | 39,678 | | | | GBP | | | | 26,792 | | | Citibank N.A. | | | 6/10/15 | | | | (46 | ) |
| USD | | | 19,275 | | | | GBP | | | | 13,000 | | | Credit Suisse International | | | 6/10/15 | | | | — | |
| USD | | | 101,464 | | | | GBP | | | | 68,000 | | | Credit Suisse International | | | 6/10/15 | | | | 642 | |
| USD | | | 129,749 | | | | GBP | | | | 87,000 | | | Credit Suisse International | | | 6/10/15 | | | | 756 | |
| USD | | | 31,738 | | | | GBP | | | | 21,434 | | | Goldman Sachs International | | | 6/10/15 | | | | (41 | ) |
| USD | | | 141,684 | | | | GBP | | | | 96,000 | | | Goldman Sachs International | | | 6/10/15 | | | | (653 | ) |
| USD | | | 147,001 | | | | GBP | | | | 99,000 | | | Goldman Sachs International | | | 6/10/15 | | | | 216 | |
| USD | | | 384,176 | | | | GBP | | | | 257,000 | | | Goldman Sachs International | | | 6/10/15 | | | | 3,129 | |
| USD | | | 436,996 | | | | GBP | | | | 294,333 | | | Goldman Sachs International | | | 6/10/15 | | | | 597 | |
| USD | | | 57,471 | | | | GBP | | | | 39,000 | | | HSBC Bank PLC | | | 6/10/15 | | | | (354 | ) |
| USD | | | 78,849 | | | | GBP | | | | 53,000 | | | HSBC Bank PLC | | | 6/10/15 | | | | 267 | |
| USD | | | 128,299 | | | | GBP | | | | 85,000 | | | HSBC Bank PLC | | | 6/10/15 | | | | 2,272 | |
| USD | | | 140,181 | | | | GBP | | | | 93,000 | | | HSBC Bank PLC | | | 6/10/15 | | | | 2,292 | |
| USD | | | 205,278 | | | | GBP | | | | 136,000 | | | HSBC Bank PLC | | | 6/10/15 | | | | 3,635 | |
| USD | | | 237,889 | | | | GBP | | | | 160,000 | | | HSBC Bank PLC | | | 6/10/15 | | | | 661 | |
| USD | | | 1,420,345 | | | | GBP | | | | 941,000 | | | HSBC Bank PLC | | | 6/10/15 | | | | 25,148 | |
| USD | | | 243,282 | | | | GBP | | | | 164,000 | | | JPMorgan Chase Bank N.A. | | | 6/10/15 | | | | 123 | |
| USD | | | 1,289,289 | | | | GBP | | | | 867,000 | | | JPMorgan Chase Bank N.A. | | | 6/10/15 | | | | 3,809 | |
| USD | | | 1,052,382 | | | | GBP | | | | 705,000 | | | State Street Bank and Trust Co. | | | 6/10/15 | | | | 7,096 | |
| USD | | | 90,871 | | | | GBP | | | | 61,000 | | | UBS AG | | | 6/10/15 | | | | 428 | |
| USD | | | 208,798 | | | | GBP | | | | 140,667 | | | UBS AG | | | 6/10/15 | | | | 234 | |
| USD | | | 183,271 | | | | INR | | | | 11,700,000 | | | HSBC Bank PLC | | | 6/10/15 | | | | (798 | ) |
| USD | | | 189,804 | | | | INR | | | | 12,100,000 | | | HSBC Bank PLC | | | 6/10/15 | | | | (558 | ) |
| USD | | | 63,032 | | | | INR | | | | 4,000,000 | | | Morgan Stanley & Co. International PLC | | | 6/10/15 | | | | 102 | |
| USD | | | 265,348 | | | | INR | | | | 16,900,000 | | | UBS AG | | | 6/10/15 | | | | (530 | ) |
See Notes to Financial Statements.
| | | | | | |
| | | BLACKROCK MANAGED VOLATILITY PORTFOLIO | | MARCH 31, 2015 | | 29 |
| | |
| Schedule of Investments (continued) | | |
As of March 31, 2015, forward foreign currency exchange contracts outstanding were as follows: (continued)
| | | | | | | | | | | | | | | | | | | | | | |
Currency
Purchased | | | Currency
Sold | | | Counterparty | | Settlement
Date | | | Unrealized
Appreciation
(Depreciation) | |
| USD | | | 180,286 | | | | JPY | | | | 21,700,000 | | | Bank of America N.A. | | | 6/10/15 | | | $ | (826 | ) |
| USD | | | 113,263 | | | | JPY | | | | 13,605,836 | | | Barclays Bank PLC | | | 6/10/15 | | | | (294 | ) |
| USD | | | 132,707 | | | | JPY | | | | 16,100,000 | | | Barclays Bank PLC | | | 6/10/15 | | | | (1,666 | ) |
| USD | | | 237,049 | | | | JPY | | | | 28,476,909 | | | Barclays Bank PLC | | | 6/10/15 | | | | (624 | ) |
| USD | | | 215,670 | | | | JPY | | | | 26,100,000 | | | Citibank N.A. | | | 6/10/15 | | | | (2,164 | ) |
| USD | | | 68,620 | | | | JPY | | | | 8,238,215 | | | Credit Suisse International | | | 6/10/15 | | | | (137 | ) |
| USD | | | 206,363 | | | | JPY | | | | 25,000,000 | | | Credit Suisse International | | | 6/10/15 | | | | (2,291 | ) |
| USD | | | 413,423 | | | | JPY | | | | 49,900,000 | | | Credit Suisse International | | | 6/10/15 | | | | (3,049 | ) |
| USD | | | 75,825 | | | | JPY | | | | 9,200,000 | | | Goldman Sachs International | | | 6/10/15 | | | | (959 | ) |
| USD | | | 154,635 | | | | JPY | | | | 18,500,000 | | | Goldman Sachs International | | | 6/10/15 | | | | 231 | |
| USD | | | 194,381 | | | | JPY | | | | 23,200,000 | | | Goldman Sachs International | | | 6/10/15 | | | | 750 | |
| USD | | | 216,915 | | | | JPY | | | | 26,200,000 | | | Goldman Sachs International | | | 6/10/15 | | | | (1,755 | ) |
| USD | | | 817,594 | | | | JPY | | | | 99,200,000 | | | Goldman Sachs International | | | 6/10/15 | | | | (10,344 | ) |
| USD | | | 22,692 | | | | JPY | | | | 2,700,000 | | | HSBC Bank PLC | | | 6/10/15 | | | | 157 | |
| USD | | | 193,727 | | | | JPY | | | | 23,400,000 | | | HSBC Bank PLC | | | 6/10/15 | | | | (1,573 | ) |
| USD | | | 309,632 | | | | JPY | | | | 37,400,000 | | | HSBC Bank PLC | | | 6/10/15 | | | | (2,514 | ) |
| USD | | | 1,236,873 | | | | JPY | | | | 149,400,000 | | | HSBC Bank PLC | | | 6/10/15 | | | | (10,042 | ) |
| USD | | | 1,241,899 | | | | JPY | | | | 148,800,000 | | | JPMorgan Chase Bank N.A. | | | 6/10/15 | | | | (8 | ) |
| USD | | | 58,056 | | | | JPY | | | | 6,973,091 | | | UBS AG | | | 6/10/15 | | | | (143 | ) |
| USD | | | 113,264 | | | | JPY | | | | 13,605,949 | | | UBS AG | | | 6/10/15 | | | | (293 | ) |
| USD | | | 137,027 | | | | JPY | | | | 16,600,000 | | | UBS AG | | | 6/10/15 | | | | (1,519 | ) |
| USD | | | 211,457 | | | | JPY | | | | 25,500,000 | | | UBS AG | | | 6/10/15 | | | | (1,370 | ) |
| USD | | | 204,999 | | | | KRW | | | | 227,200,000 | | | HSBC Bank PLC | | | 6/10/15 | | | | 682 | |
| USD | | | 184,554 | | | | KRW | | | | 209,100,000 | | | Morgan Stanley & Co. International PLC | | | 6/10/15 | | | | (3,486 | ) |
| USD | | | 189,711 | | | | KRW | | | | 213,700,000 | | | Morgan Stanley & Co. International PLC | | | 6/10/15 | | | | (2,466 | ) |
| USD | | | 267,304 | | | | KRW | | | | 299,300,000 | | | Morgan Stanley & Co. International PLC | | | 6/10/15 | | | | (1,851 | ) |
| USD | | | 189,897 | | | | MXN | | | | 2,970,000 | | | Credit Suisse International | | | 6/10/15 | | | | (3,862 | ) |
| USD | | | 197,974 | | | | MXN | | | | 3,010,000 | | | Morgan Stanley & Co. International PLC | | | 6/10/15 | | | | 1,606 | |
| USD | | | 263,844 | | | | MXN | | | | 4,100,000 | | | Morgan Stanley & Co. International PLC | | | 6/10/15 | | | | (3,635 | ) |
| USD | | | 184,216 | | | | MXN | | | | 2,860,000 | | | UBS AG | | | 6/10/15 | | | | (2,367 | ) |
| USD | | | 323,319 | | | | MYR | | | | 1,200,000 | | | BNP Paribas S.A. | | | 6/10/15 | | | | 1,308 | |
| USD | | | 248,982 | | | | NOK | | | | 2,050,000 | | | Credit Suisse International | | | 6/10/15 | | | | (4,994 | ) |
| USD | | | 305,373 | | | | NOK | | | | 2,511,000 | | | Credit Suisse International | | | 6/10/15 | | | | (5,717 | ) |
| USD | | | 804,322 | | | | NOK | | | | 6,379,000 | | | JPMorgan Chase Bank N.A. | | | 6/10/15 | | | | 14,023 | |
| USD | | | 1,415,728 | | | | NOK | | | | 11,228,000 | | | JPMorgan Chase Bank N.A. | | | 6/10/15 | | | | 24,683 | |
| USD | | | 2,548 | | | | NZD | | | | 3,485 | | | BNP Paribas S.A. | | | 6/10/15 | | | | (39 | ) |
| USD | | | 53,040 | | | | NZD | | | | 72,548 | | | BNP Paribas S.A. | | | 6/10/15 | | | | (820 | ) |
| USD | | | 166,900 | | | | NZD | | | | 228,293 | | | BNP Paribas S.A. | | | 6/10/15 | | | | (2,585 | ) |
| USD | | | 168,879 | | | | NZD | | | | 231,000 | | | BNP Paribas S.A. | | | 6/10/15 | | | | (2,615 | ) |
| USD | | | 52,345 | | | | NZD | | | | 69,000 | | | Credit Suisse International | | | 6/10/15 | | | | 1,120 | |
| USD | | | 311,637 | | | | NZD | | | | 427,000 | | | Credit Suisse International | | | 6/10/15 | | | | (5,369 | ) |
| USD | | | 682,558 | | | | NZD | | | | 930,000 | | | Credit Suisse International | | | 6/10/15 | | | | (7,875 | ) |
| USD | | | 28,150 | | | | NZD | | | | 38,525 | | | Goldman Sachs International | | | 6/10/15 | | | | (450 | ) |
| USD | | | 77,840 | | | | NZD | | | | 104,849 | | | Goldman Sachs International | | | 6/10/15 | | | | — | |
| USD | | | 585,989 | | | | NZD | | | | 801,941 | | | Goldman Sachs International | | | 6/10/15 | | | | (9,373 | ) |
| USD | | | 69,784 | | | | NZD | | | | 94,151 | | | UBS AG | | | 6/10/15 | | | | (113 | ) |
| USD | | | 5,103 | | | | NZD | | | | 6,990 | | | Westpac Banking Corp. | | | 6/10/15 | | | | (86 | ) |
| USD | | | 106,232 | | | | NZD | | | | 145,511 | | | Westpac Banking Corp. | | | 6/10/15 | | | | (1,796 | ) |
| USD | | | 310,518 | | | | NZD | | | | 425,000 | | | Westpac Banking Corp. | | | 6/10/15 | | | | (5,003 | ) |
See Notes to Financial Statements.
| | | | | | |
| 30 | | BLACKROCK MANAGED VOLATILITY PORTFOLIO | | MARCH 31, 2015 | | |
| | |
| Schedule of Investments (continued) | | |
| Ÿ | | As of March 31, 2015, forward foreign currency exchange contracts outstanding were as follows: (concluded) |
| | | | | | | | | | | | | | | | | | | | | | |
Currency
Purchased | | | Currency
Sold | | | Counterparty | | Settlement
Date | | | Unrealized
Appreciation
(Depreciation) | |
| USD | | | 139,842 | | | | SEK | | | | 1,207,791 | | | Barclays Bank PLC | | | 6/10/15 | | | $ | (559 | ) |
| USD | | | 139,788 | | | | SEK | | | | 1,192,457 | | | Credit Suisse International | | | 6/10/15 | | | | 1,169 | |
| USD | | | 149,117 | | | | SEK | | | | 1,289,000 | | | Credit Suisse International | | | 6/10/15 | | | | (725 | ) |
| USD | | | 177,792 | | | | SEK | | | | 1,536,000 | | | Credit Suisse International | | | 6/10/15 | | | | (762 | ) |
| USD | | | 271,488 | | | | SEK | | | | 2,311,000 | | | Credit Suisse International | | | 6/10/15 | | | | 2,843 | |
| USD | | | 397,341 | | | | SEK | | | | 3,406,000 | | | Credit Suisse International | | | 6/10/15 | | | | 1,407 | |
| USD | | | 181,550 | | | | SEK | | | | 1,563,000 | | | Goldman Sachs International | | | 6/10/15 | | | | (143 | ) |
| USD | | | 396,091 | | | | SEK | | | | 3,356,000 | | | Goldman Sachs International | | | 6/10/15 | | | | 5,969 | |
| USD | | | 233,435 | | | | SEK | | | | 2,015,000 | | | HSBC Bank PLC | | | 6/10/15 | | | | (801 | ) |
| USD | | | 118,783 | | | | SEK | | | | 1,014,543 | | | JPMorgan Chase Bank N.A. | | | 6/10/15 | | | | 846 | |
| USD | | | 161,665 | | | | SEK | | | | 1,380,000 | | | JPMorgan Chase Bank N.A. | | | 6/10/15 | | | | 1,246 | |
| USD | | | 399,688 | | | | SEK | | | | 3,454,000 | | | JPMorgan Chase Bank N.A. | | | 6/10/15 | | | | (1,827 | ) |
| USD | | | 404,086 | | | | SEK | | | | 3,560,000 | | | JPMorgan Chase Bank N.A. | | | 6/10/15 | | | | (9,750 | ) |
| USD | | | 429,833 | | | | SEK | | | | 3,685,000 | | | JPMorgan Chase Bank N.A. | | | 6/10/15 | | | | 1,466 | |
| USD | | | 633,493 | | | | SEK | | | | 5,465,000 | | | JPMorgan Chase Bank N.A. | | | 6/10/15 | | | | (1,793 | ) |
| USD | | | 1,089,413 | | | | SEK | | | | 9,250,000 | | | JPMorgan Chase Bank N.A. | | | 6/10/15 | | | | 14,135 | |
| USD | | | 222,581 | | | | SEK | | | | 1,923,209 | | | UBS AG | | | 6/10/15 | | | | (985 | ) |
| USD | | | 188,804 | | | | TRY | | | | 510,000 | | | Credit Suisse International | | | 6/10/15 | | | | (3,826 | ) |
| USD | | | 183,027 | | | | TRY | | | | 490,000 | | | Royal Bank of Scotland PLC | | | 6/10/15 | | | | (2,049 | ) |
| USD | | | 324,174 | | | | TRY | | | | 860,000 | | | Royal Bank of Scotland PLC | | | 6/10/15 | | | | (653 | ) |
| USD | | | 17,988,503 | | | | EUR | | | | 16,456,260 | | | Citibank N.A. | | | 6/24/15 | | | | 272,836 | |
| USD | | | 102,253,599 | | | | EUR | | | | 93,543,740 | | | Citibank N.A. | | | 6/24/15 | | | | 1,550,905 | |
| USD | | | 69,939,996 | | | | JPY | | | | 8,475,000,000 | | | Standard Chartered Bank | | | 6/24/15 | | | | (810,035 | ) |
| Total | | | | | | | | | | | | | | | | | | | | $ | 4,179,029 | |
| | | | | | | | | | | | | | | | | | | | | | |
| Ÿ | | As of March 31, 2015, exchange-traded options purchased were as follows: |
| | | | | | | | | | | | | | | | | | | | | | | | |
| Description | | Put/
Call | | | Strike Price | | | Expiration
Date | | | Contracts | | | Value | |
Euro Dollar 2-Year Mid-Curve | | | Put | | | | USD | | | | 97.75 | | | | 6/12/15 | | | | 54 | | | $ | 41,175 | |
Euro Dollar 2-Year Mid-Curve | | | Put | | | | USD | | | | 96.75 | | | | 6/12/15 | | | | 53 | | | | 13,912 | |
Total | | | | | | | | | | | | | | | | | | | | | | $ | 55,087 | |
| | | | | | | | | | | | | | | | | | | | | | | | |
| Ÿ | | As of March 31, 2015, exchange-traded options written were as follows: |
| | | | | | | | | | | | | | | | | | | | | | | | |
| Description | | Put/
Call | | | Strike Price | | | Expiration
Date | | | Contracts | | | Value | |
U.S. Treasury Notes (10 Year) | | | Call | | | | USD | | | | 127.00 | | | | 4/24/15 | | | | 113 | | | $ | (229,531 | ) |
U.S. Treasury Notes (10 Year) | | | Put | | | | USD | | | | 127.00 | | | | 4/24/15 | | | | 114 | | | | (14,250 | ) |
Euro Dollar 2-Year Mid-Curve | | | Put | | | | USD | | | | 97.25 | | | | 6/12/15 | | | | 107 | | | | (48,150 | ) |
Total | | | | | | | | | | | | | | | | | | | | | | $ | (291,931 | ) |
| | | | | | | | | | | | | | | | | | | | | | | | |
| Ÿ | | As of March 31, 2015, centrally cleared interest rate swaps outstanding were as follows: |
| | | | | | | | | | | | | | | | | | | | | | | | |
Fixed Rate | | Floating Rate | | Clearinghouse | | Effective
Date | | | Expiration
Date | | | Notional
Amount (000) | | | Unrealized Depreciation | |
1.94%1 | | 3-month LIBOR | | Chicago Mercantile | | | 6/30/15 | 2 | | | 12/31/21 | | | | USD | | | | 5,410 | | | $ | (39,204 | ) |
0.64%1 | | 6-month EURIBOR | | Chicago Mercantile | | | 6/10/15 | 2 | | | 2/15/24 | | | | EUR | | | | 3,130 | | | | (36,724 | ) |
0.52%1 | | 6-month EURIBOR | | Chicago Mercantile | | | 6/10/15 | 2 | | | 2/15/24 | | | | EUR | | | | 2,150 | | | | (974 | ) |
Total | | | | | | | | | | | | | | | | | | | | | | $ | (76,902 | ) |
| | | | | | | | | | | | | | | | | | | | | | | | |
| | 1 | | Fund pays the fixed rate and receives the floating rate. |
See Notes to Financial Statements.
| | | | | | |
| | | BLACKROCK MANAGED VOLATILITY PORTFOLIO | | MARCH 31, 2015 | | 31 |
| | |
| Schedule of Investments (continued) | | |
| Ÿ | | As of March 31, 2015, centrally cleared credit default swaps — sold protection outstanding were as follows: |
| | | | | | | | | | | | | | | | | | | | | | | | | | |
| Index | | Receive
Fixed Rate | | | Clearinghouse | | Expiration
Date | | | Issuer
Credit
Rating1 | | | Notional
Amount
(000)2 | | | Unrealized
Appreciation | |
iTraxx Europe Crossover Series 23 Version 1 | | | 5.00 | % | | InterContinental Exchange | | | 6/20/20 | | | | B+ | | | | EUR | | | | 3,684 | | | $ | 14,634 | |
| | 1 | | Using S&P’s rating of the issuer of the underlying securities of the index, as applicable. |
| | 2 | | The maximum potential amount the Fund may pay should a negative credit event take place as defined under the terms of the agreement. |
| Ÿ | | As of March 31, 2015, OTC total return swaps outstanding were as follows: |
| | | | | | | | | | | | | | | | | | | | | | | | |
| Reference Entity | | Fixed Notional Amount | | | Counterparty | | Expiration
Date | | Contract
Amount | | | Value | | | Premiums
Paid
(Received) | | | Unrealized
Depreciation | |
TAIEX Futures Contracts April 2015 | | TWD | 717,478,091 | 1 | | Deutsche Bank AG | | 4/15/15 | | | 374 | | | $ | (23,793 | ) | | | — | | | $ | (23,793 | ) |
| | 1 | | Fund receives the total return of the reference entity and pays the floating amount. Net payment made at termination. |
| Ÿ | | Fair Value Measurements — Various inputs are used in determining the fair value of investments and derivative financial instruments. These inputs to valuation techniques are categorized into a disclosure hierarchy consisting of three broad levels for financial statement purposes. The hierarchy gives the highest priority to unadjusted quoted prices in active markets for identical assets or liabilities (Level 1 measurements) and the lowest priority to unobservable inputs (Level 3 measurements). Accordingly, the degree of judgment exercised in determining fair value is greatest for instruments categorized in Level 3. The inputs used to measure fair value may fall into different levels of the fair value hierarchy. In such cases, for disclosure purposes, the fair value hierarchy classification is determined based on the lowest level input that is significant to the fair value measurement in its entirety. The categorization of a value determined for investments and derivative financial instruments is based on the pricing transparency of the investment and derivative financial instruments and is not necessarily an indication of the risks associated with investing in those securities. The three levels of the fair value hierarchy are as follows: |
| | Ÿ | | Level 1 — unadjusted quoted prices in active markets/exchanges for identical assets or liabilities that the Fund has the ability to access |
| | Ÿ | | Level 2 — other observable inputs (including, but not limited to, quoted prices for similar assets or liabilities in markets that are active, quoted prices for identical or similar assets or liabilities in markets that are not active, inputs other than quoted prices that are observable for the assets or liabilities (such as interest rates, yield curves, volatilities, prepayment speeds, loss severities, credit risks and default rates) or other market–corroborated inputs) |
| | Ÿ | | Level 3 — unobservable inputs based on the best information available in the circumstances, to the extent observable inputs are not available (including the Fund’s own assumptions used in determining the fair value of investments and derivative financial instruments) |
Changes in valuation techniques may result in transfers into or out of an assigned level within the disclosure hierarchy. In accordance with the Fund’s policy, transfers between different levels of the fair value disclosure hierarchy are deemed to have occurred as of the beginning of the reporting period. For information about the Fund’s policy regarding valuation of investments and derivative financial instruments, refer to Note 2 of the Notes to Financial Statements.
As of March 31, 2015, the following tables summarize the Fund’s investments and derivative financial instruments categorized in the disclosure hierarchy:
| | | | | | | | | | | | | | | | | | | | |
| | | Level 1 | | Level 2 | | Level 3 | | Total |
Assets: | | | | | | | | | | | | | | | | | | | | |
Investments: | | | | | | | | | | | | | | | | | | | | |
Long-Term Investments: | | | | | | | | | | | | | | | | | | | | |
Asset-Backed Securities | | | | — | | | | $ | 3,900,214 | | | | | — | | | | $ | 3,900,214 | |
Common Stocks | | | $ | 84,251,709 | | | | | 225,093,075 | | | | $ | 5,632 | | | | | 309,350,416 | |
Corporate Bonds | | | | — | | | | | 68,110,470 | | | | | — | | | | | 68,110,470 | |
Foreign Agency Obligations | | | | — | | | | | 11,339,547 | | | | | — | | | | | 11,339,547 | |
Foreign Government Obligations | | | | — | | | | | 80,017,396 | | | | | — | | | | | 80,017,396 | |
Investment Companies | | | | 23,409,403 | | | | | — | | | | | — | | | | | 23,409,403 | |
Non-Agency Mortgage-Backed Securities | | | | — | | | | | 3,498,895 | | | | | — | | | | | 3,498,895 | |
U.S. Government Sponsored Agency Securities | | | | — | | | | | 25,945,508 | | | | | — | | | | | 25,945,508 | |
U.S. Treasury Obligations | | | | — | | | | | 15,114,385 | | | | | — | | | | | 15,114,385 | |
Short-Term Securities | | | | 211,570,778 | | | | | 344,954 | | | | | — | | | | | 211,915,732 | |
Options Purchased: | | | | | | | | | | | | | | | | | | | | |
Interest Rate Contracts | | | | 55,087 | | | | | — | | | | | — | | | | | 55,087 | |
| | | | | |
Total | | | $ | 319,286,977 | | | | $ | 433,364,444 | | | | | $5,632 | | | | $ | 752,657,053 | |
| | | | | |
See Notes to Financial Statements.
| | | | | | |
| 32 | | BLACKROCK MANAGED VOLATILITY PORTFOLIO | | MARCH 31, 2015 | | |
| | |
| Schedule of Investments (concluded) | | |
| | | | | | | | | | | | | | | | | | | | |
| | | Level 1 | | Level 2 | | Level 3 | | Total |
Derivative Financial Instruments1 | | | | | | | | | | | | | | | | | | | | |
Assets: | | | | | | | | | | | | | | | | | | | | |
Credit contracts | | | | — | | | | $ | 14,634 | | | | | — | | | | $ | 14,634 | |
Equity contracts | | | $ | 1,000,214 | | | | | — | | | | | — | | | | | 1,000,214 | |
Foreign currency exchange contracts | | | | 115,425 | | | | | 5,978,260 | | | | | — | | | | | 6,093,685 | |
Interest rate contracts | | | | 381,802 | | | | | — | | | | | — | | | | | 381,802 | |
Liabilities: | | | | | | | | | | | | | | | | | | | | |
Equity contracts | | | | (754,366 | ) | | | | (23,793 | ) | | | | — | | | | | (778,159 | ) |
Foreign currency exchange contracts | | | | (419,030 | ) | | | | (1,799,231 | ) | | | | — | | | | | (2,218,261 | ) |
Interest rate contracts | | | | (2,052,823 | ) | | | | (76,902 | ) | | | | — | | | | | (2,129,725 | ) |
| | | | | |
Total | | | $ | (1,728,778 | ) | | | $ | 4,092,968 | | | | | — | | | | $ | 2,364,190 | |
| | | | | |
1 Derivative financial instruments are swaps, financial futures contracts, forward foreign currency exchange contracts and options written. Swaps, financial futures contracts and forward foreign currency exchange contracts are valued at the unrealized appreciation/depreciation on the instrument and options written are shown at value. | |
|
| The Fund may hold assets and/or liabilities in which the fair value approximates the carrying amount for financial statement purposes. As of March 31, 2015, such assets and/or liabilities are categorized within the disclosure hierarchy as follows: | |
| | | | | | | | | | | | | | | | | | | | |
| | | Level 1 | | Level 2 | | Level 3 | | Total |
Assets: | | | | | | | | | | | | | | | | | | | | |
Cash pledged for financial futures contracts | | | $ | 12,358,000 | | | | | — | | | | | — | | | | $ | 12,358,000 | |
Cash pledged for centrally cleared swaps | | | | 485,000 | | | | | — | | | | | — | | | | | 485,000 | |
Foreign currency at value | | | | 6,153,754 | | | | | — | | | | | — | | | | | 6,153,754 | |
Liabilities: | | | | | | | | | | | | | | | | | | | | |
Bank overdraft | | | | — | | | | $ | (1,276,381 | ) | | | | — | | | | | (1,276,381 | ) |
Collateral on securities loaned at value | | | | — | | | | | (344,954 | ) | | | | — | | | | | (344,954 | ) |
| | | | | |
Total | | | $ | 18,996,754 | | | | $ | (1,621,335 | ) | | | | — | | | | $ | 17,375,419 | |
| | | | | |
During the six months ended March 31, 2015, there were no transfers between levels.
See Notes to Financial Statements.
| | | | | | |
| | | BLACKROCK MANAGED VOLATILITY PORTFOLIO | | MARCH 31, 2015 | | 33 |
| | |
| Statement of Assets and Liabilities | | |
| | | | |
| March 31, 2015 (Unaudited) | | | |
| | | | |
| Assets | | | | |
Investments at value — unaffiliated (including securities loaned at value of $311,234) (cost — $521,400,879) | | $ | 517,331,918 | |
Investments at value — affiliated (cost — $235,303,426) | | | 235,325,135 | |
Cash pledged for financial futures contracts | | | 12,358,000 | |
Cash pledged for centrally cleared swaps | | | 485,000 | |
Foreign currency at value (cost — $6,121,339) | | | 6,153,754 | |
Variation margin receivable on centrally cleared swaps | | | 4,614 | |
Variation margin receivable on financial futures contracts | | | 1,038,405 | |
Investments sold receivable | | | 172,792 | |
Unrealized appreciation on forward foreign currency exchange contracts | | | 5,978,260 | |
Capital shares sold receivable | | | 330,430 | |
Interest receivable | | | 1,362,558 | |
Dividends receivable — unaffiliated | | | 630,205 | |
Dividends receivable — affiliated | | | 15,165 | |
Securities lending income receivable — affiliated | | | 1,711 | |
Receivable from Manager | | | 94 | |
Prepaid expenses | | | 62,608 | |
| | | | |
Total assets | | | 781,250,649 | |
| | | | |
| | | | |
| Liabilities | | | | |
Bank overdraft | | | 1,276,381 | |
Options written at value (premiums received — $266,989) | | | 291,931 | |
Collateral on securities loaned at value | | | 344,954 | |
Variation margin payable on financial futures contracts | | | 646,926 | |
Investments purchased payable | | | 32,061,723 | |
Unrealized depreciation on forward foreign currency exchange contracts | | | 1,799,231 | |
Unrealized depreciation on OTC swaps | | | 23,793 | |
Capital shares redeemed payable | | | 945,029 | |
Investment advisory fees payable | | | 336,469 | |
Service and distribution fees payable | | | 140,282 | |
Other affiliates payable | | | 140,020 | |
Officer’s and Trustees’ fees payable | | | 5,020 | |
Other accrued expenses payable | | | 528,436 | |
| | | | |
Total liabilities | | | 38,540,195 | |
| | | | |
Net Assets | | $ | 742,710,454 | |
| | | | |
| | | | |
| Net Assets Consist of | | | | |
Paid-in capital | | $ | 700,636,486 | |
Distributions in excess of net investment income | | | (7,157,135 | ) |
Undistributed net realized gain | | | 50,704,543 | |
Net unrealized appreciation/depreciation | | | (1,473,440 | ) |
| | | | |
Net Assets | | $ | 742,710,454 | |
| | | | |
| | | | |
| Net Asset Value | | | | |
Institutional — Based on net assets of $317,475,613 and 21,039,038 shares outstanding, unlimited number of shares authorized, $0.001 par value | | $ | 15.09 | |
| | | | |
Service — Based on net assets of $1,694,785 and 112,767 shares outstanding, unlimited number of shares authorized, $0.001 par value | | $ | 15.03 | |
| | | | |
Investor A — Based on net assets of $346,138,058 and 23,043,568 shares outstanding, unlimited number of shares authorized, $0.001 par value | | $ | 15.02 | |
| | | | |
Investor B — Based on net assets of $5,527,446 and 374,140 shares outstanding, unlimited number of shares authorized, $0.001 par value | | $ | 14.77 | |
| | | | |
Investor C — Based on net assets of $71,874,552 and 4,902,940 shares outstanding, unlimited number of shares authorized, $0.001 par value | | $ | 14.66 | |
| | | | |
See Notes to Financial Statements.
| | | | | | |
| 34 | | BLACKROCK MANAGED VOLATILITY PORTFOLIO | | MARCH 31, 2015 | | |
| | | | |
| Six Months Ended March 31, 2015 (Unaudited) | | | |
| | | | |
| Investment Income | |
Interest | | $ | 1,887,166 | |
Dividends — unaffiliated | | | 1,968,736 | |
Dividends — affiliated | | | 194,709 | |
Securities lending — affiliated — net | | | 4,913 | |
Foreign taxes withheld | | | (117,329 | ) |
| | | | |
Total income | | | 3,938,195 | |
| | | | |
| | | | |
| Expenses | | | | |
Investment advisory | | | 2,037,998 | |
Service and distribution — class specific | | | 817,345 | |
Transfer agent — class specific | | | 587,662 | |
Administration | | | 211,297 | |
Administration — class specific | | | 83,646 | |
Professional | | | 61,582 | |
Accounting services | | | 48,485 | |
Registration | | | 46,014 | |
Printing | | | 30,845 | |
Custodian | | | 28,490 | |
Officer and Trustees | | | 12,492 | |
Miscellaneous | | | 37,480 | |
Recoupment of past waived and/or reimbursed fees — class specific | | | 4,099 | |
| | | | |
Total expenses | | | 4,007,435 | |
Less fees waived by Manager | | | (115,467 | ) |
Less administration fees waived — class specific | | | (693 | ) |
Less transfer agent fees waived — class specific | | | (1,983 | ) |
Less transfer agent fees reimbursed — class specific | | | (1,109 | ) |
| | | | |
Total expenses after fees waived and/or reimbursed | | | 3,888,183 | |
| | | | |
Net investment income | | | 50,012 | |
| | | | |
| | | | |
| Realized and Unrealized Gain (Loss) | | | | |
Net realized gain (loss) from: | | | | |
Investments — unaffiliated | | | 9,081,439 | |
Capital gain distributions received from affiliated investment companies | | | 28,007 | |
Options written | | | 19,285 | |
Financial futures contracts | | | 13,235,549 | |
Swaps | | | 145,048 | |
Foreign currency transactions | | | 28,245,560 | |
| | | | |
| | | 50,754,888 | |
| | | | |
Net change in unrealized appreciation/depreciation on: | | | | |
Investments — unaffiliated | | | (12,707,865 | ) |
Investments — affiliated | | | 55,456 | |
Options written | | | (23,410 | ) |
Financial futures contracts | | | (3,294,396 | ) |
Swaps | | | 995,300 | |
Foreign currency translations | | | (1,663,717 | ) |
| | | | |
| | | (16,638,632 | ) |
| | | | |
Net realized and unrealized gain | | | 34,116,256 | |
| | | | |
Net Increase in Net Assets Resulting from Operations | | $ | 34,166,268 | |
| | | | |
See Notes to Financial Statements.
| | | | | | |
| | | BLACKROCK MANAGED VOLATILITY PORTFOLIO | | MARCH 31, 2015 | | 35 |
|
| Statements of Changes in Net Assets |
| | | | | | | | |
| Increase in Net Assets: | | Six Months
Ended
March 31, 2015
(Unaudited) | | | Year Ended
September 30,
2014 | |
| | | | | | | | |
| Operations | | | | | | | | |
Net investment income | | $ | 50,012 | | | $ | 82,013 | |
Net realized gain | | | 50,754,888 | | | | 53,147,382 | |
Net change in unrealized appreciation/depreciation | | | (16,638,632 | ) | | | (9,681,308 | ) |
| | | | |
Net increase in net assets resulting from operations | | | 34,166,268 | | | | 43,548,087 | |
| | | | |
| | | | | | | | |
| Distributions to Shareholders From1 | | | | | | | | |
Net investment income: | | | | | | | | |
Institutional | | | (7,149,829 | ) | | | (2,940,379 | ) |
Service | | | (31,675 | ) | | | (17,511 | ) |
Investor A | | | (6,670,170 | ) | | | (3,753,926 | ) |
Investor B | | | (61,710 | ) | | | (78,744 | ) |
Investor C | | | (1,086,621 | ) | | | (649,050 | ) |
Net realized gain: | | | | | | | | |
Institutional | | | (16,489,741 | ) | | | (19,653,564 | ) |
Service | | | (83,973 | ) | | | (140,882 | ) |
Investor A | | | (17,397,558 | ) | | | (30,046,152 | ) |
Investor B | | | (318,235 | ) | | | (927,559 | ) |
Investor C | | | (3,827,246 | ) | | | (6,652,735 | ) |
| | | | |
Decrease in net assets resulting from distributions to shareholders | | | (53,116,758 | ) | | | (64,860,502 | ) |
| | | | |
| | | | | | | | |
| Capital Share Transactions | | | | | | | | |
Net increase (decrease) in net assets derived from capital share transactions | | | (14,294,554 | ) | | | 194,193,414 | |
| | | | |
| | | | | | | | |
| Net Assets | | | | | | | | |
Total increase (decrease) in net assets | | | (33,245,044 | ) | | | 172,880,999 | |
Beginning of period | | | 775,955,498 | | | | 603,074,499 | |
| | | | |
End of period | | $ | 742,710,454 | | | $ | 775,955,498 | |
| | | | |
Undistributed (distributions in excess of) net investment income, end of period | | $ | (7,157,135 | ) | | $ | 7,792,858 | |
| | | | |
| | 1 | | Distributions for annual periods determined in accordance with federal tax regulations. |
See Notes to Financial Statements.
| | | | | | |
| 36 | | BLACKROCK MANAGED VOLATILITY PORTFOLIO | | MARCH 31, 2015 | | |
| | | | | | | | | | | | | | | | | | | | | | | | | | | | | | | | | | | | | | | | | | | | | | | | |
| | | Institutional | | | Service | |
| | | Six Months
Ended
March 31,
2015
(Unaudited) | | | Year Ended September 30, | | | Six Months
Ended
March 31,
2015
(Unaudited) | | | Year Ended September 30, | |
| | | | 2014 | | | 2013 | | | 2012 | | | 2011 | | | 2010 | | | | 2014 | | | 2013 | | | 2012 | | | 2011 | | | 2010 | |
| Per Share Operating Performance | | | | | | | | | | | | | | | | | | | | | | | | | | | | | |
Net asset value, beginning of period | | $ | 15.52 | | | $ | 15.95 | | | $ | 15.37 | | | $ | 14.03 | | | $ | 14.31 | | | $ | 13.28 | | | $ | 15.44 | | | $ | 15.90 | | | $ | 15.31 | | | $ | 13.99 | | | $ | 14.27 | | | $ | 13.24 | |
| | | | | | | | |
Net investment income (loss)1 | | | 0.02 | | | | 0.04 | | | | 0.19 | | | | 0.23 | | | | 0.29 | | | | 0.29 | | | | (0.01 | ) | | | (0.01 | ) | | | 0.15 | | | | 0.19 | | | | 0.25 | | | | 0.25 | |
Net realized and unrealized gain (loss) | | | 0.70 | | | | 1.04 | | | | 1.19 | | | | 1.68 | | | | (0.26 | ) | | | 1.02 | | | | 0.70 | | | | 1.02 | | | | 1.19 | | | | 1.67 | | | | (0.26 | ) | | | 1.03 | |
| | | | | | | | |
Net increase (decrease) from investment operations | | | 0.72 | | | | 1.08 | | | | 1.38 | | | | 1.91 | | | | 0.03 | | | | 1.31 | | | | 0.69 | | | | 1.01 | | | | 1.34 | | | | 1.86 | | | | (0.01 | ) | | | 1.28 | |
| | | | | | | | |
Distributions from:2 | | | | | | | | | | | | | | | | | | | | | | | | | | | | | | | | | | | | | | | | | | | | | | | | |
Net investment income | | | (0.35 | ) | | | (0.20 | ) | | | (0.22 | ) | | | (0.26 | ) | | | (0.31 | ) | | | (0.28 | ) | | | (0.30 | ) | | | (0.16 | ) | | | (0.17 | ) | | | (0.23 | ) | | | (0.27 | ) | | | (0.25 | ) |
Net realized gain | | | (0.80 | ) | | | (1.31 | ) | | | (0.58 | ) | | | (0.31 | ) | | | — | | | | — | | | | (0.80 | ) | | | (1.31 | ) | | | (0.58 | ) | | | (0.31 | ) | | | — | | | | — | |
| | | | | | | | |
Total distributions | | | (1.15 | ) | | | (1.51 | ) | | | (0.80 | ) | | | (0.57 | ) | | | (0.31 | ) | | | (0.28 | ) | | | (1.10 | ) | | | (1.47 | ) | | | (0.75 | ) | | | (0.54 | ) | | | (0.27 | ) | | | (0.25 | ) |
| | | | | | | | |
Net asset value, end of period | | $ | 15.09 | | | $ | 15.52 | | | $ | 15.95 | | | $ | 15.37 | | | $ | 14.03 | | | $ | 14.31 | | | $ | 15.03 | | | $ | 15.44 | | | $ | 15.90 | | | $ | 15.31 | | | $ | 13.99 | | | $ | 14.27 | |
| | | | | | | | |
| | | | | | | | | | | | | | | | | | | | | | | | | | | | | | | | | | | | | | | | | | | | | | | | |
| Total Return3 | | | | | | | | | | | | | | | | | | | | | | | | | | | | | |
Based on net asset value | | | 4.92 | %4 | | | 7.02 | % | | | 9.35 | % | | | 13.89 | % | | | 0.06 | % | | | 9.99 | % | | | 4.77 | %4 | | | 6.57 | % | | | 9.06 | % | | | 13.53 | % | | | (0.21 | )% | | | 9.74 | % |
| | | | | | | | |
| | | | | | | | | | | | | | | | | | | | | | | | | | | | | | | | | | | | | | | | | | | | | | | | |
| Ratios to Average Net Assets | | | | | | | | | | | | | | | | | | | | | | | | | | | | | |
Total expenses5 | | | 0.82 | %6,7 | | | 0.85 | %6 | | | 0.91 | %6 | | | 0.95 | %6 | | | 0.94 | % | | | 0.95 | % | | | 1.20 | %7,8 | | | 1.21 | %8 | | | 1.24 | %8 | | | 1.27 | % | | | 1.24 | % | | | 1.27 | % |
| | | | | | | | |
Total expenses after fees waived and/or reimbursed and paid indirectly5 | | | 0.79 | %7 | | | 0.82 | % | | | 0.87 | % | | | 0.90 | % | | | 0.90 | % | | | 0.91 | % | | | 1.17 | %7 | | | 1.17 | % | | | 1.17 | % | | | 1.18 | % | | | 1.18 | % | | | 1.19 | % |
| | | | | | | | |
Total expenses after fees waived and/or reimbursed and paid indirectly and excluding interest expense5 | | | 0.79 | %7 | | | 0.82 | % | | | 0.87 | % | | | 0.89 | % | | | 0.89 | % | | | 0.89 | % | | | 1.17 | %7 | | | 1.17 | % | | | 1.17 | % | | | 1.17 | % | | | 1.17 | % | | | 1.17 | % |
| | | | | | | | |
Net investment income (loss)5 | | | 0.27 | %7 | | | 0.28 | % | | | 1.22 | % | | | 1.59 | % | | | 1.91 | % | | | 2.09 | % | | | (0.10 | )%7 | | | (0.04 | )% | | | 0.95 | % | | | 1.30 | % | | | 1.63 | % | | | 1.80 | % |
| | | | | | | | |
| | | | | | | | | | | | | | | | | | | | | | | | | | | | | | | | | | | | | | | | | | | | | | | | |
| Supplemental Data | | | | | | | | | | | | | | | | | | | | | | | | | | | | | |
Net assets, end of period (000) | | $ | 317,476 | | | $ | 342,794 | | | $ | 132,007 | | | $ | 59,041 | | | $ | 40,259 | | | $ | 39,083 | | | $ | 1,695 | | | $ | 1,703 | | | $ | 1,774 | | | $ | 1,915 | | | $ | 1,676 | | | $ | 1,652 | |
| | | | | | | | |
Portfolio turnover rate9 | | | 92 | % | | | 181 | % | | | 192 | % | | | 324 | % | | | 401 | % | | | 400 | % | | | 92 | % | | | 181 | % | | | 192 | % | | | 324 | % | | | 401 | % | | | 400 | % |
| | | | | | | | |
| | 1 | | Based on average shares outstanding. |
| | 2 | | Distributions for annual periods determined in accordance with federal income tax regulations. |
| | 3 | | Where applicable, assumes the reinvestment of distributions. |
| | 4 | | Aggregate total return. |
| | 5 | | Excludes expenses incurred indirectly as a result of investments in underlying funds as follows: |
| | | | | | | | | | | | | | | | | | | | | | | | |
| | | | |
| | | Six Months Ended March 31, 2015 (Unaudited) | | | Year Ended September 30, | |
| | | | 2014 | | | 2013 | | | 2012 | | | 2011 | | | 2010 | |
Investments in underlying funds | | | 0.10 | % | | | 0.11 | % | | | 0.10 | % | | | 0.05 | % | | | — | | | | — | |
| | 6 | | Includes recoupment of past waived and/or reimbursed fees. Excluding the recoupment of past waived and/or reimbursed fees for the years ended September 30, 2013 and September 30, 2012, the ratio would have been 0.89% and 0.91%, respectively. There was no financial impact to the expense ratios for the six months ended March 31, 2015 and the year ended September 30, 2014. |
| | 8 | | Includes recoupment of past waived and/or reimbursed fees. Excluding the recoupment of past waived and/or reimbursed fees for the six months ended March 31, 2015 and the years ended September 30, 2014 and September 30, 2013, the ratios would have been 1.18%, 1.17% and 1.23%, respectively. |
| | 9 | | Includes mortgage dollar roll transactions (“MDRs”). Additional information regarding portfolio turnover rate is as follows: |
| | | | | | | | | | | | | | | | | | | | | | | | |
| | | | |
| | | Six Months Ended March 31,
2015 (Unaudited) | | | Year Ended September 30, | |
| | | | 2014 | | | 2013 | | | 2012 | | | 2011 | | | 2010 | |
Portfolio turnover rate (excluding MDRs) | | | 92 | % | | | 181 | % | | | 192 | % | | | 254 | % | | | 236 | % | | | 302 | % |
See Notes to Financial Statements.
| | | | | | |
| | | BLACKROCK MANAGED VOLATILITY PORTFOLIO | | MARCH 31, 2015 | | 37 |
| | |
| Financial Highlights (continued) | | |
| | | | | | | | | | | | | | | | | | | | | | | | | | | | | | | | | | | | | | | | | | | | | | | | |
| | | Investor A | | | Investor B | |
| | | Six Months Ended March 31, 2015 (Unaudited) | | | Year Ended September 30, | | | Six Months
Ended
March 31,
2015
(Unaudited) | | | Year Ended September 30, | |
| | | | 2014 | | | 2013 | | | 2012 | | | 2011 | | | 2010 | | | | 2014 | | | 2013 | | | 2012 | | | 2011 | | | 2010 | |
| Per Share Operating Performance | | | | | | | | | | | | | | | | | | | | | | | | | | | | | | | | | | | | | | | | | |
Net asset value, beginning of period | | $ | 15.43 | | | $ | 15.89 | | | $ | 15.30 | | | $ | 13.98 | | | $ | 14.26 | | | $ | 13.23 | | | $ | 15.12 | | | $ | 15.69 | | | $ | 15.10 | | | $ | 13.83 | | | $ | 14.10 | | | $ | 13.08 | |
| | | | | | | | |
Net investment income (loss)1 | | | (0.00 | )2 | | | (0.00 | )2 | | | 0.15 | | | | 0.19 | | | | 0.25 | | | | 0.24 | | | | (0.08 | ) | | | (0.15 | ) | | | 0.01 | | | | 0.06 | | | | 0.13 | | | | 0.12 | |
Net realized and unrealized gain (loss) | | | 0.70 | | | | 1.01 | | | | 1.19 | | | | 1.66 | | | | (0.26 | ) | | | 1.03 | | | | 0.68 | | | | 1.00 | | | | 1.16 | | | | 1.65 | | | | (0.26 | ) | | | 1.03 | |
| | | | | | | | |
Net increase (decrease) from investment operations | | | 0.70 | | | | 1.01 | | | | 1.34 | | | | 1.85 | | | | (0.01 | ) | | | 1.27 | | | | 0.60 | | | | 0.85 | | | | 1.17 | | | | 1.71 | | | | (0.13 | ) | | | 1.15 | |
| | | | | | | | |
Distributions from:3 | | | | | | | | | | | | | | | | | | | | | | | | | | | | | | | | | | | | | | | | | | | | | | | | |
Net investment income | | | (0.31 | ) | | | (0.16 | ) | | | (0.17 | ) | | | (0.22 | ) | | | (0.27 | ) | | | (0.24 | ) | | | (0.15 | ) | | | (0.11 | ) | | | (0.01 | ) | | | (0.13 | ) | | | (0.14 | ) | | | (0.13 | ) |
Net realized gain | | | (0.80 | ) | | | (1.31 | ) | | | (0.58 | ) | | | (0.31 | ) | | | — | | | | — | | | | (0.80 | ) | | | (1.31 | ) | | | (0.57 | ) | | | (0.31 | ) | | | — | | | | — | |
| | | | | | | | |
Total distributions | | | (1.11 | ) | | | (1.47 | ) | | | (0.75 | ) | | | (0.53 | ) | | | (0.27 | ) | | | (0.24 | ) | | | (0.95 | ) | | | (1.42 | ) | | | (0.58 | ) | | | (0.44 | ) | | | (0.14 | ) | | | (0.13 | ) |
| | | | | | | | |
Net asset value, end of period | | $ | 15.02 | | | $ | 15.43 | | | $ | 15.89 | | | $ | 15.30 | | | $ | 13.98 | | | $ | 14.26 | | | $ | 14.77 | | | $ | 15.12 | | | $ | 15.69 | | | $ | 15.10 | | | $ | 13.83 | | | $ | 14.10 | |
| | | | | | | | |
| | | | | | | | | | | | | | | | | | | | | | | | | | | | | | | | | | | | | | | | | | | | | | | | |
| Total Return4 | | | | | | | | | | | | | | | | | | | | | | | | | | | | | | | | | | | | | | | | | | | | | | | | |
Based on net asset value | | | 4.80 | %5 | | | 6.58 | % | | | 9.09 | % | | | 13.51 | % | | | (0.23 | )% | | | 9.70 | % | | | 4.24 | %5 | | | 5.56 | % | | | 8.04 | % | | | 12.60 | % | | | (1.01 | )% | | | 8.78 | % |
| | | | | | | | |
| | | | | | | | | | | | | | | | | | | | | | | | | | | | | | | | | | | | | | | | | | | | | | | | |
| Ratios to Average Net Assets | | | | | | | | | | | | | | | | | | | | | | | | | | | | | | | | | | | | | | | | | | | | | | | | |
Total expenses6 | | | 1.14 | %7 | | | 1.16 | %8 | | | 1.18 | % | | | 1.23 | % | | | 1.20 | % | | | 1.23 | %8 | | | 2.30 | %7 | | | 2.16 | %9 | | | 2.10 | % | | | 2.08 | % | | | 2.00 | % | | | 2.04 | %9 |
| | | | | | | | |
Total expenses after fees waived and/or reimbursed and paid indirectly6 | | | 1.11 | %7 | | | 1.13 | % | | | 1.14 | % | | | 1.20 | % | | | 1.20 | % | | | 1.22 | % | | | 2.14 | %7 | | | 2.13 | % | | | 2.06 | % | | | 2.06 | % | | | 2.00 | % | | | 2.04 | % |
| | | | | | | | |
Total expenses after fees waived and/or reimbursed and paid indirectly and excluding interest expense6 | | | 1.11 | %7 | | | 1.13 | % | | | 1.14 | % | | | 1.19 | % | | | 1.19 | % | | | 1.20 | % | | | 2.14 | %7 | | | 2.13 | % | | | 2.06 | % | | | 2.05 | % | | | 1.98 | % | | | 2.02 | % |
| | | | | | | | |
Net investment income (loss)6 | | | (0.05 | )%7 | | | (0.00 | )% | | | 0.98 | % | | | 1.28 | % | | | 1.61 | % | | | 1.75 | % | | | (1.10 | )%7 | | | (0.98 | )% | | | 0.08 | % | | | 0.45 | % | | | 0.84 | % | | | 0.91 | % |
| | | | | | | | |
| | | | | | | | | | | | | | | | | | | | | | | | | | | | | | | | | | | | | | | | | | | | | | | | |
| Supplemental Data | | | | | | | | | | | | | | | | | | | | | | | | | | | | | | | | | | | | | | | | | | | | | | | | |
Net assets, end of period (000) | | $ | 346,138 | | | $ | 350,131 | | | $ | 374,715 | | | $ | 390,209 | | | $ | 370,916 | | | $ | 385,511 | | | $ | 5,527 | | | $ | 6,861 | | | $ | 12,730 | | | $ | 19,077 | | | $ | 31,595 | | | $ | 49,315 | |
| | | | | | | | |
Portfolio turnover rate10 | | | 92 | % | | | 181 | % | | | 192 | % | | | 324 | % | | | 401 | % | | | 400 | % | | | 92 | % | | | 181 | % | | | 192 | % | | | 324 | % | | | 401 | % | | | 400 | % |
| | | | | | | | |
| | 1 | | Based on average shares outstanding. |
| | 2 | | Amount is greater than $(0.005) per share. |
| | 3 | | Distributions for annual periods determined in accordance with federal income tax regulations. |
| | 4 | | Where applicable, excludes the effects of any sales charges and assumes the reinvestment of distributions. |
| | 5 | | Aggregate total return. |
| | 6 | | Excludes expenses incurred indirectly as a result of investments in underlying funds as follows: |
| | | | | | | | | | | | | | | | | | | | |
| | | Six Months
Ended March 31, 2015 (Unaudited) | | | Year Ended September 30, |
| | | | 2014 | | | 2013 | | | 2012 | | | 2011 | | 2010 |
Investments in underlying funds | | | 0.10 | % | | | 0.11 | % | | | 0.10 | % | | | 0.05 | % | | — | | — |
7 Annualized. 8 Includes recoupment of past waived and/or reimbursed fees. Excluding the recoupment of past waived and/or reimbursed fees for the years ended September 30, 2014 and September 30, 2010, the ratios would have been 1.15% and 1.22%, respectively. 9 Includes recoupment of past waived and/or reimbursed fees. Excluding the recoupment of past waived and/or reimbursed fees for the years ended September 30, 2014 and September 30, 2010, the ratios would have been 2.15% and 2.02%, respectively. 10 Includes mortgage dollar roll transactions (“MDRs”). Additional information regarding portfolio turnover rate is as follows: |
| | | Six Months
Ended March 31, 2015 (Unaudited) | | | Year Ended September 30, |
| | | | 2014 | | | 2013 | | | 2012 | | | 2011 | | 2010 |
Portfolio turnover rate (excluding MDRs) | | | 92 | % | | | 181 | % | | | 192 | % | | | 254 | % | | 236% | | 302% |
See Notes to Financial Statements.
| | | | | | |
| 38 | | BLACKROCK MANAGED VOLATILITY PORTFOLIO | | MARCH 31, 2015 | | |
|
| Financial Highlights (concluded) |
| | | | | | | | | | | | | | | | | | | | | | | | |
| | | Investor C | |
| | | Six Months
Ended March 31,
2015 (Unaudited) | | | Year Ended September 30, | |
| | | | 2014 | | | 2013 | | | 2012 | | | 2011 | | | 2010 | |
| Per Share Operating Performance | | | | | | | | | | | | | | | | |
Net asset value, beginning of period | | $ | 15.06 | | | $ | 15.60 | | | $ | 15.02 | | | $ | 13.76 | | | $ | 14.04 | | | $ | 13.04 | |
| | | | |
Net investment income (loss)1 | | | (0.05 | ) | | | (0.10 | ) | | | 0.04 | | | | 0.08 | | | | 0.13 | | | | 0.14 | |
Net realized and unrealized gain (loss) | | | 0.68 | | | | 1.00 | | | | 1.17 | | | | 1.64 | | | | (0.25 | ) | | | 1.02 | |
| | | | |
Net increase (decrease) from investment operations | | | 0.63 | | | | 0.90 | | | | 1.21 | | | | 1.72 | | | | (0.12 | ) | | | 1.16 | |
| | | | |
Distributions from:2 | | | | | | | | | | | | | | | | |
Net investment income | | | (0.23 | ) | | | (0.13 | ) | | | (0.05 | ) | | | (0.15 | ) | | | (0.16 | ) | | | (0.16 | ) |
Net realized gain | | | (0.80 | ) | | | (1.31 | ) | | | (0.58 | ) | | | (0.31 | ) | | | — | | | | — | |
| | | | |
Total distributions | | | (1.03 | ) | | | (1.44 | ) | | | (0.63 | ) | | | (0.46 | ) | | | (0.16 | ) | | | (0.16 | ) |
| | | | |
Net asset value, end of period | | $ | 14.66 | | | $ | 15.06 | | | $ | 15.60 | | | $ | 15.02 | | | $ | 13.76 | | | $ | 14.04 | |
| | | | |
| | | | | | | | | | | | | | | | | | | | | | | | |
| Total Return3 | | | | | | | | | | | | | | | | |
Based on net asset value | | | 4.42 | %4 | | | 5.91 | % | | | 8.29 | % | | | 12.75 | % | | | (0.94 | )% | | | 8.86 | % |
| | | | |
| | | | | | | | | | | | | | | | | | | | | | | | |
| Ratios to Average Net Assets | | | | | | | | | | | | | | | | |
Total expenses5 | | | 1.83 | %6 | | | 1.84 | %7 | | | 1.88 | % | | | 1.93 | % | | | 1.93 | % | | | 1.94 | % |
| | | | |
Total expenses after fees waived and/or reimbursed and paid indirectly5 | | | 1.80 | %6 | | | 1.81 | % | | | 1.83 | % | | | 1.90 | % | | | 1.93 | % | | | 1.94 | % |
| | | | |
Total expenses after fees waived and/or reimbursed and paid indirectly and excluding interest expense5 | | | 1.80 | %6 | | | 1.81 | % | | | 1.83 | % | | | 1.90 | % | | | 1.92 | % | | | 1.92 | % |
| | | | |
Net investment income (loss)5 | | | (0.73 | )%6 | | | (0.68 | )% | | | 0.28 | % | | | 0.58 | % | | | 0.89 | % | | | 1.05 | % |
| | | | |
| | | | | | | | | | | | | | | | | | | | | | | | |
| Supplemental Data | | | | | | | | | | | | | | | | |
Net assets, end of period (000) | | $ | 71,875 | | | $ | 74,467 | | | $ | 81,850 | | | $ | 86,947 | | | $ | 81,644 | | | $ | 84,367 | |
| | | | |
Portfolio turnover rate8 | | | 92 | % | | | 181 | % | | | 192 | % | | | 324 | % | | | 401 | % | | | 400 | % |
| | | | |
| | 1 | | Based on average shares outstanding. |
| | 2 | | Distributions for annual periods determined in accordance with federal income tax regulations. |
| | 3 | | Where applicable, excludes the effects of any sales charges and assumes the reinvestment of distributions. |
| | 4 | | Aggregate total return. |
| | 5 | | Excludes expenses incurred indirectly as a result of investments in underlying funds as follows: |
| | | | | | | | | | | | |
| | | |
| | | Six Months Ended March 31, 2015 (Unaudited) | | Year Ended September 30, |
| | | | 2014 | | 2013 | | 2012 | | 2011 | | 2010 |
| Investments in underlying funds | | 0.10% | | 0.11% | | 0.10% | | 0.05% | | — | | — |
| | 7 | | Includes recoupment of past waived and/or reimbursed fees. Excluding the recoupment of past waived and/or reimbursed fees for the year ended September 30, 2014 the ratio would have been 1.83%. |
| | 8 | | Includes mortgage dollar roll transactions (“MDRs”). Additional information regarding portfolio turnover rate is as follows: |
| | | | | | | | | | | | |
| | | |
| | | Six Months Ended March 31,
2015 (Unaudited) | | Year Ended September 30, |
| | | | 2014 | | 2013 | | 2012 | | 2011 | | 2010 |
| Portfolio turnover rate (excluding MDRs) | | 92% | | 181% | | 192% | | 254% | | 236% | | 302% |
See Notes to Financial Statements.
| | | | | | |
| | | BLACKROCK MANAGED VOLATILITY PORTFOLIO | | MARCH 31, 2015 | | 39 |
| | |
| Notes to Financial Statements (Unaudited) | | |
1. Organization:
BlackRock FundsSM (the “Trust”) is registered under the Investment Company Act of 1940, as amended (the “1940 Act”), as an open-end management investment company. The Trust is organized as a Massachusetts business trust. These financial statements relate to one series of the Trust BlackRock Managed Volatility Portfolio (the “Fund”). The Fund is classified as diversified.
The Fund offers multiple classes of shares. All classes of shares have identical voting, dividend, liquidation and other rights and are subject to the same terms and conditions, except that certain classes bear expenses related to the shareholder servicing and distribution of such shares. Institutional and Service Shares are sold without a sales charge and only to certain eligible investors. Investor B Shares are only available through exchanges and distribution reinvestments by current holders and for purchase by certain employer-sponsored retirement plans. Investor A and Investor C Shares are generally available through financial intermediaries. Each class has exclusive voting rights with respect to matters relating to its shareholder servicing and distribution expenditures (except that Investor B shareholders may vote on material changes to the Investor A distribution and service plan).
| | | | | | |
| Share Class | | Initial Sales Charge | | CDSC | | Conversion Privilege |
Institutional and Service Shares | | No | | No | | None |
Investor A Shares | | Yes | | No1 | | None |
Investor B Shares | | No | | Yes | | To Investor A Shares after approximately 8 years |
Investor C Shares | | No | | Yes | | None |
| | 1 | | Investor A Shares may be subject to a CDSC where no initial sales charge was paid at the time of purchase. |
The Fund, together with certain other registered investment companies advised by the Manager or its affiliates, is included in a complex of open-end funds referred to as the Equity-Liquidity Complex.
2. Significant Accounting Policies:
The Fund’s financial statements are prepared in conformity with accounting principles generally accepted in the United States of America (“U.S. GAAP”), which may require management to make estimates and assumptions that affect the reported amounts of assets and liabilities in the financial statements and the reported amounts of increases and decreases in net assets from operations during the reporting period. Actual results could differ from those estimates. The Fund is considered an investment company under U.S. GAAP and follows the accounting and reporting guidance applicable to investment companies. The following is a summary of significant accounting policies followed by the Fund:
Valuation: The Fund’s investments are valued at fair value as of the close of trading on the New York Stock Exchange (“NYSE”) (generally 4:00 p.m., Eastern time). U.S. GAAP defines fair value as the price the Fund would receive to sell an asset or pay to transfer a liability in an orderly transaction between market participants at the measurement date. The Fund determines the fair values of its financial instruments at market value using independent dealers or pricing services under policies approved by the Board of Trustees of the Trust (the “Board”). The BlackRock Global Valuation Methodologies Committee (the “Global Valuation Committee”) is the committee formed by management to develop global pricing policies and procedures and to provide oversight of the pricing function for the Fund for all financial instruments.
Bond investments are valued on the basis of last available bid prices or current market quotations provided by dealers or pricing services. Floating rate loan interests are valued at the mean of the bid prices from one or more brokers or dealers as obtained from a pricing service. In determining the value of a particular investment, pricing services may use certain information with respect to transactions in such investments, quotations from dealers, pricing matrixes, market transactions in comparable investments, various relationships observed in the market between investments and calculated yield measures. Asset-backed and mortgage-backed securities are valued by independent pricing services using models that consider estimated cash flows of each tranche of the security, establish a benchmark yield and develop an estimated tranche-specific spread to the benchmark yield based on the unique attributes of the tranche. Financial futures contracts traded on exchanges are valued at their last sale price. To-be-announced (“TBA”) commitments are valued on the basis of last available bid prices or current market quotations provided by pricing services. Swap agreements are valued utilizing quotes received daily by the Fund’s pricing service or through brokers, which are derived using daily swap curves and models that incorporate a number of market data factors, such as discounted cash flows, trades and values of the underlying reference instruments. Certain centrally cleared swaps are valued at the price determined by the relevant exchange or clearinghouse. Investments in open-end registered investment companies are valued at NAV each business day. The market value of the Fund’s investments in the Underlying Funds is based on the published NAV of each Underlying Fund computed as of the close of regular trading on the NYSE on days when the NYSE is open.
Equity investments traded on a recognized securities exchange are valued at the official close price each day, if available. For equity investments traded on more than one exchange, the official close price on the exchange where the stock is primarily traded is used. Equity investments traded on a recognized exchange for which there were no sales on that day may be valued at the last available bid (long positions) or ask (short positions) price.
Securities and other assets and liabilities denominated in foreign currencies are translated into U.S. dollars using exchange rates determined as of the close of business on the NYSE. Forward foreign currency exchange contracts are valued at the mean between the bid and ask prices and are determined as of the close of business on the NYSE. Interpolated values are derived when the settlement date of the contract is an interim date for which quotations are not available.
| | | | | | |
| 40 | | BLACKROCK MANAGED VOLATILITY PORTFOLIO | | MARCH 31, 2015 | | |
| | |
| Notes to Financial Statements (continued) | | |
Exchange-traded options are valued at the mean between the last bid and ask prices at the close of the options market in which the options trade. An exchange-traded option for which there is no mean price is valued at the last bid (long positions) or ask (short positions) price. If no bid or ask price is available, the prior day’s price will be used, unless it is determined that the prior day’s price no longer reflects the fair value of the option. Over-the-counter (“OTC”) options and options on swaps (“swaptions”) are valued by an independent pricing service using a mathematical model, which incorporates a number of market data factors, such as the trades and prices of the underlying instruments.
The Fund values its investment in BlackRock Liquidity Series, LLC, Money Market Series (the “Money Market Series”) at fair value, which is ordinarily based upon its pro rata ownership in the underlying fund’s net assets. The Money Market Series seeks current income consistent with maintaining liquidity and preserving capital. Although the Money Market Series is not registered under the 1940 Act, its investments will follow the parameters of investments by a money market fund that is subject to Rule 2a-7 under the 1940 Act. The Fund may withdraw up to 25% of its investment daily, although the Manager of the Money Market Series, in its sole discretion, may permit an investor to withdraw more than 25% on any one day.
In the event that the application of these methods of valuation results in a price for an investment that is deemed not to be representative of the market value of such investment, or if a price is not available, the investment will be valued by the Global Valuation Committee, or its delegate, in accordance with a policy approved by the Board as reflecting fair value (“Fair Value Investments”). When determining the price for Fair Value Investments, the Global Valuation Committee, or its delegate, seeks to determine the price that the Fund might reasonably expect to receive or pay from the current sale or purchase of that asset or liability in an arm’s-length transaction. Fair value determinations shall be based upon all available factors that the Global Valuation Committee, or its delegate, deems relevant consistent with the principles of fair value measurement, which include the market approach, income approach and/or in the case of recent investments, the cost approach, as appropriate. The market approach generally consists of using comparable market transactions. The income approach generally is used to discount future cash flows to present value and is adjusted for liquidity as appropriate. These factors include but are not limited to: (i) attributes specific to the investment or asset; (ii) the principal market for the investment or asset; (iii) the customary participants in the principal market for the investment or asset; (iv) data assumptions by market participants for the investment or asset, if reasonably available; (v) quoted prices for similar investments or assets in active markets; and (vi) other factors, such as future cash flows, interest rates, yield curves, volatilities, prepayment speeds, loss severities, credit risks, recovery rates, liquidation amounts and/or default rates. Due to the inherent uncertainty of valuations of such investments, the fair values may differ from the values that would have been used had an active market existed. The Global Valuation Committee, or its delegate, employs various methods for calibrating valuation approaches for investments where an active market does not exist, including regular due diligence of the Fund’s pricing vendors, regular reviews of key inputs and assumptions, transactional back-testing or disposition analysis to compare unrealized gains and losses to realized gains and losses, reviews of missing or stale prices and large movements in market values and reviews of any market related activity. The pricing of all Fair Value Investments is subsequently reported to the Board or a committee thereof on a quarterly basis.
Generally, trading in foreign instruments is substantially completed each day at various times prior to the close of business on the NYSE. Occasionally, events affecting the values of such instruments may occur between the foreign market close and the close of business on the NYSE that may not be reflected in the computation of the Fund’s net assets. If events (e.g., a company announcement, market volatility or a natural disaster) occur during such periods that are expected to materially affect the value of such instruments, those instruments may be Fair Value Investments and be valued at their fair value, as determined in good faith by the Global Valuation Committee, or its delegate, using a pricing service and/or policies approved by the Board. Each business day, the Fund uses a pricing service to assist with the valuation of certain foreign exchange-traded equity securities and foreign exchange-traded and OTC options (the “Systematic Fair Value Price”). Using current market factors, the Systematic Fair Value Price is designed to value such foreign securities and foreign options at fair value as of the close of business on the NYSE, which follows the close of the local markets.
Foreign Currency: The Fund’s books and records are maintained in U.S. dollars. Purchases and sales of investment securities are recorded at the rates of exchange prevailing on the respective dates of such transactions. Generally, when the U.S. dollar rises in value against a foreign currency, the Fund’s investments denominated in that currency will lose value because that currency is worth fewer U.S. dollars; the opposite effect occurs if the U.S. dollar falls in relative value.
The Fund does not isolate the portion of the results of operations arising as a result of changes in the foreign exchange rates from the changes in the market prices of investments held or sold for financial reporting purposes. Accordingly, the effects of changes in foreign currency exchange rates on investments are not segregated in the Statement of Operations from the effects of changes in market prices of those investments, but are included as a component of net realized and unrealized gain (loss) from investments. The Fund reports realized currency gains (losses) on foreign currency related transactions as components of net realized gain (loss) for financial reporting purposes, whereas such components are generally treated as ordinary income for federal income tax purposes.
Segregation and Collateralization: In cases where the Fund enters into certain investments (e.g., financial futures contracts, forward foreign currency exchange contracts, options written and swaps) that would be “senior securities” for 1940 Act purposes, the Fund may segregate or designate on its books and records cash or liquid securities having a market value at least equal to the amount of the Fund’s future obligations under such investments. Doing so allows the investment to be excluded from treatment as a “senior security.” Furthermore, if required by an exchange or counterparty
| | | | | | |
| | | BLACKROCK MANAGED VOLATILITY PORTFOLIO | | MARCH 31, 2015 | | 41 |
| | |
| Notes to Financial Statements (continued) | | |
agreement, the Fund may be required to deliver/deposit cash and/or securities to/with an exchange, or broker-dealer or custodian as collateral for certain investments or obligations.
Investment Transactions and Investment Income: For financial reporting purposes, investment transactions are recorded on the dates the transactions are entered into (the trade dates). Realized gains and losses on investment transactions are determined on the identified cost basis. Dividend income is recorded on the ex-dividend date. Dividends from foreign securities where the ex-dividend date may have passed are subsequently recorded when the Fund is informed of the ex-dividend date. Under the applicable foreign tax laws, a withholding tax at various rates may be imposed on capital gains, dividends and interest. Upon notification from issuers, some of the dividend income received from a real estate investment trust may be redesignated as a reduction of cost of the related investment and/or realized gain. Interest income, including amortization and accretion of premiums and discounts on debt securities, is recognized on the accrual basis. Income, expenses and realized and unrealized gains and losses are allocated daily to each class based on its relative net assets.
Distributions: Distributions paid by the Fund are recorded on the ex-dividend dates. The character and timing of distributions are determined in accordance with federal income tax regulations, which may differ from U.S. GAAP.
Recent Accounting Standard: In June 2014, the Financial Accounting Standards Board issued guidance to improve the financial reporting of reverse repurchase agreements and other similar transactions. The guidance will require expanded disclosure for entities that enter into reverse repurchase agreements and similar transactions accounted for as secured borrowings. It is effective for financial statements with fiscal years beginning on or after December 15, 2014 and for interim periods beginning after March 15, 2015. Management is evaluating the impact, if any, of this guidance on the Fund’s financial statement disclosures.
Other: Expenses directly related to the Fund or its classes are charged to the Fund or the applicable class. Other operating expenses shared by several funds are prorated among those funds on the basis of relative net assets or other appropriate methods. Expenses directly related to the Fund and other shared expenses prorated to the Fund are allocated daily to each class based on its relative net assets or other appropriate methods.
The Fund has an arrangement with the custodian whereby fees may be reduced by credits earned on uninvested cash balances, which, if applicable, are shown as fees paid indirectly in the Statement of Operations. The custodian imposes fees on overdrawn cash balances, which can be offset by accumulated credits earned or may result in additional custody charges.
3. Securities and Other Investments:
Asset-Backed and Mortgage-Backed Securities: The Fund may invest in asset-backed securities. Asset-backed securities are generally issued as pass-through certificates, which represent undivided fractional ownership interests in an underlying pool of assets, or as debt instruments, which are also known as collateralized obligations, and are generally issued as the debt of a special purpose entity organized solely for the purpose of owning such assets and issuing such debt. Asset-backed securities are often backed by a pool of assets representing the obligations of a number of different parties. The yield characteristics of certain asset-backed securities may differ from traditional debt securities. One such major difference is that all or a principal part of the obligations may be prepaid at any time because the underlying assets (i.e., loans) may be prepaid at any time. As a result, a decrease in interest rates in the market may result in increases in the level of prepayments as borrowers, particularly mortgagors, refinance and repay their loans. An increased prepayment rate with respect to an asset-backed security subject to such a prepayment feature will have the effect of shortening the maturity of the security. In addition, the Fund may subsequently have to reinvest the proceeds at lower interest rates. If the Fund has purchased such an asset-backed security at a premium, a faster than anticipated prepayment rate could result in a loss of principal to the extent of the premium paid.
The Fund may purchase certain mortgage pass-through securities. There are a number of important differences among the agencies and instrumentalities of the U.S. Government that issue mortgage-related securities and among the securities that they issue. For example, mortgage-related securities guaranteed by Ginnie Mae are guaranteed as to the timely payment of principal and interest by Ginnie Mae and such guarantee is backed by the full faith and credit of the United States. However, mortgage-related securities issued by Freddie Mac and Fannie Mae, including Freddie Mac and Fannie Mae guaranteed mortgage pass-through certificates, which are solely the obligations of Freddie Mac and Fannie Mae, are not backed by or entitled to the full faith and credit of the United States, but are supported by the right of the issuer to borrow from the U.S. Treasury.
Collateralized Debt Obligations: The Fund may invest in collateralized debt obligations (“CDOs”), which include collateralized bond obligations (“CBOs”) and collateralized loan obligations (“CLOs”). CBOs and CLOs are types of asset-backed securities. A CDO is an entity that is backed by a diversified pool of debt securities (CBOs) or syndicated bank loans (CLOs). The cash flows of the CDO can be split into multiple segments, called “tranches,” which will vary in risk profile and yield. The riskiest segment is the subordinated or “equity” tranche. This tranche bears the greatest risk of defaults from the underlying assets in the CDO and serves to protect the other, more senior, tranches from default in all but the most severe circumstances. Since it is shielded from defaults by the more junior tranches, a “senior” tranche will typically have higher credit ratings and lower yields than
| | | | | | |
| 42 | | BLACKROCK MANAGED VOLATILITY PORTFOLIO | | MARCH 31, 2015 | | |
| | |
| Notes to Financial Statements (continued) | | |
their underlying securities, and often receive investment grade ratings from one or more of the nationally recognized rating agencies. Despite the protection from the more junior tranches, senior tranches can experience substantial losses due to actual defaults, increased sensitivity to future defaults and the disappearance of one or more protecting tranches as a result of changes in the credit profile of the underlying pool of assets.
Multiple Class Pass-Through Securities: The Fund may invest in multiple class pass-through securities, including collateralized mortgage obligations (“CMOs”) and commercial mortgage-backed securities. These multiple class securities may be issued by Ginnie Mae, U.S. Government agencies or instrumentalities or by trusts formed by private originators of, or investors in, mortgage loans. In general, CMOs are debt obligations of a legal entity that are collateralized by, and multiple class pass-through securities represent direct ownership interests in, a pool of residential or commercial mortgage loans or mortgage pass-through securities (the “Mortgage Assets”), the payments on which are used to make payments on the CMOs or multiple pass-through securities. Classes of CMOs include interest only (“IOs”), principal only (“POs”), planned amortization classes and targeted amortization classes. IOs and POs are stripped mortgage-backed securities representing interests in a pool of mortgages, the cash flow from which has been separated into interest and principal components. IOs receive the interest portion of the cash flow while POs receive the principal portion. IOs and POs can be extremely volatile in response to changes in interest rates. As interest rates rise and fall, the value of IOs tends to move in the same direction as interest rates. POs perform best when prepayments on the underlying mortgages rise since this increases the rate at which the principal is returned and the yield to maturity on the PO. When payments on mortgages underlying a PO are slower than anticipated, the life of the PO is lengthened and the yield to maturity is reduced. If the underlying Mortgage Assets experience greater than anticipated prepayments of principal, the Fund may not fully recoup its initial investment in IOs.
Forward Commitments and When-Issued Delayed Delivery Securities: The Fund may purchase securities on a when-issued basis and may purchase or sell securities on a forward commitment basis. Settlement of such transactions normally occurs within a month or more after the purchase or sale commitment is made. The Fund may purchase securities under such conditions with the intention of actually acquiring them, but may enter into a separate agreement to sell the securities before the settlement date. Since the value of securities purchased may fluctuate prior to settlement, the Fund may be required to pay more at settlement than the security is worth. In addition, the Fund is not entitled to any of the interest earned prior to settlement. When purchasing a security on a delayed delivery basis, the Fund assumes the rights and risks of ownership of the security, including the risk of price and yield fluctuations. In the event of default by the counterparty, the Fund’s maximum amount of loss is the unrealized appreciation of unsettled when-issued transactions, which is shown in the Schedule of Investments.
TBA Commitments: The Fund may enter into TBA commitments. TBA commitments are forward agreements for the purchase or sale of mortgage-backed securities for a fixed price, with payment and delivery on an agreed upon future settlement date. The specific securities to be delivered are not identified at the trade date. However, delivered securities must meet specified terms, including issuer, rate and mortgage terms. When entering into TBA commitments, the Fund may take possession of or deliver the underlying mortgage-backed securities but can extend the settlement or roll the transaction. TBA commitments involve a risk of loss if the value of the security to be purchased or sold declines or increases, respectively, prior to settlement date.
In order to better define contractual rights and to secure rights that will help the Fund mitigate its counterparty risk, TBA commitments may be entered into by the Fund under Master Securities Forward Transaction Agreements (each, an “MSFTA”). An MSFTA typically contains, among other things, collateral posting terms and netting provisions in the event of default and/or termination event. The collateral requirements are typically calculated by netting the mark to market amount for each transaction under such agreement and comparing that amount to the value of the collateral currently pledged by the Fund and the counterparty. Cash collateral that has been pledged to cover the obligations of the Fund and cash collateral received from the counterparty, if any, is reported separately on the Statement of Assets and Liabilities as cash pledged as collateral for TBA commitments or cash received as collateral for TBA commitments, respectively. Non-cash collateral pledged by the Fund, if any, is noted in the Schedule of Investments. Typically, the Fund is permitted to sell, repledge or use the collateral it receives; however, the counterparty is not permitted to do so. To the extent amounts due to the Fund are not fully collateralized, contractually or otherwise, the Fund bears the risk of loss from counterparty non-performance.
Securities Lending: The Fund may lend its securities to approved borrowers, such as brokers, dealers and other financial institutions. The borrower pledges and maintains with the Fund collateral consisting of cash, an irrevocable letter of credit issued by a bank, or securities issued or guaranteed by the U.S. Government. The initial collateral received by the Fund is required to have a value of at least 102% of the current value of the loaned securities for securities traded on U.S. exchanges and a value of at least 105% for all other securities. The collateral is maintained thereafter, at a value equal to at least 100% of the current market value of the securities on loan. The market value of the loaned securities is determined at the close of each business day of the Fund and any additional required collateral is delivered to the Fund on the next business day. During the term of the loan, the Fund is entitled to all distributions made on or in respect of the loaned securities. Loans of securities are terminable at any time and the borrower, after notice, is required to return borrowed securities within the standard time period for settlement of securities transactions.
The market value of securities on loan and the value of the related collateral are shown separately in the Statement of Assets and Liabilities as a component of investments at value — unaffiliated, and collateral on securities loaned at value, respectively. As of March 31, 2015, any securities on loan were collateralized by cash. The cash collateral invested by the securities lending agent, BlackRock Investment Management, LLC (“BIM”), if any, is disclosed in the Schedule of Investments.
| | | | | | |
| | | BLACKROCK MANAGED VOLATILITY PORTFOLIO | | MARCH 31, 2015 | | 43 |
| | |
| Notes to Financial Statements (continued) | | |
Securities lending transactions are entered into by the Fund under Master Securities Lending Agreements (each, an “MSLA”) which provide the right, in the event of default (including bankruptcy or insolvency), for the non-defaulting party to liquidate the collateral and calculate a net exposure to the defaulting party or request additional collateral. In the event that a borrower defaults, the Fund, as lender, would offset the market value of the collateral received against the market value of the securities loaned. When the value of the collateral is greater than that of the market value of the securities loaned, the lender is left with a net amount payable to the defaulting party. However, bankruptcy or insolvency laws of a particular jurisdiction may impose restrictions on or prohibitions against such a right of offset in the event of an MSLA counterparty’s bankruptcy or insolvency. Under the MSLA, the borrower can resell or re-pledge the loaned securities, and the Fund can reinvest cash collateral, or, upon an event of default, resell or re-pledge the collateral.
As of March 31, 2015, the following table is a summary of the Fund’s securities lending agreements by counterparty, which are subject to offset under an MSLA:
| | | | | | | | | | |
| Counterparty | | Securities Loaned
at Value | | | Cash Collateral
Received1 | | | Net Amount |
Deutsche Bank Securities, Inc. | | $ | 32,478 | | | $ | (32,478 | ) | | — |
Merrill Lynch, Pierce, Fenner & Smith, Inc. | | | 154,513 | | | | (154,513 | ) | | — |
Morgan Stanley | | | 48,967 | | | | (48,967 | ) | | — |
UBS Securities LLC | | | 75,276 | | | | (75,276 | ) | | — |
Total | | $ | 311,234 | | | $ | (311,234 | ) | | — |
| | | |
| | 1 | | Collateral with a value of $344,954 has been received in conjunction with securities lending agreements for the Fund. Collateral received in excess of the value of securities loaned from the individual counterparty is not shown for financial reporting purposes. |
The risks of securities lending include the risk that the borrower may not provide additional collateral when required or may not return the securities when due. To mitigate these risks, the Fund benefits from a borrower default indemnity provided by BIM. BIM’s indemnity allows for full replacement of the securities loaned if the collateral received does not cover the value on the securities loaned in the event of borrower default. The Fund could suffer a loss if the value of an investment purchased with cash collateral falls below the market value of loaned securities or if the value of an investment purchased with cash collateral falls below the value of the original cash collateral received.
4. Derivative Financial Instruments:
The Fund engages in various portfolio investment strategies using derivative contracts both to increase the returns of the Fund and/or to economically manage its exposure to certain risks such as credit risk, equity risk, interest rate risk or foreign currency exchange rate risk. These contracts may be transacted on an exchange or OTC.
Financial Futures Contracts: The Fund invests in long and/or short positions in financial futures contracts and options on financial futures contracts to gain exposure to, or economically hedge against, changes in interest rates (interest rate risk), changes in the value of equity securities (equity risk) or foreign currencies (foreign currency exchange rate risk). Financial futures contracts are agreements between the Fund and a counterparty to buy or sell a specific quantity of an underlying instrument at a specified price and at a specified date. Depending on the terms of the particular contract, financial futures contracts are settled either through physical delivery of the underlying instrument on the settlement date or by payment of a cash settlement amount on the settlement date.
Upon entering into a financial futures contract, the Fund is required to deposit initial margin with the broker in the form of cash or securities in an amount that varies depending on a contract’s size and risk profile. The initial margin deposit must then be maintained at an established level over the life of the contract. Securities deposited as initial margin are designated on the Schedule of Investments and cash deposited, if any, is recorded on the Statement of Assets and Liabilities as cash pledged for financial futures contracts. Pursuant to the contract, the Fund agrees to receive from or pay to the broker an amount of cash equal to the daily fluctuation in value of the contract. Such receipts or payments are known as variation margin. Variation margin is recorded by the Fund as unrealized appreciation or depreciation and, if applicable, as a receivable or payable for variation margin in the Statement of Assets and Liabilities.
When the contract is closed, the Fund records a realized gain or loss equal to the difference between the value of the contract at the time it was opened and the value at the time it was closed. The use of financial futures contracts involves the risk of an imperfect correlation in the movements in the price of financial futures contracts, interest or foreign currency exchange rates and the underlying assets.
Forward Foreign Currency Exchange Contracts: The Fund enters into forward foreign currency exchange contracts as an economic hedge against either specific transactions or portfolio instruments or to obtain exposure to, or hedge exposure away from, foreign currencies (foreign currency exchange rate risk). A forward foreign currency exchange contract is an agreement between two parties to buy and sell a currency at a set exchange rate on a future date. Forward foreign currency exchange contracts, when used by the Fund, help to manage the overall exposure to the currencies in which some of the investments held by the Fund are denominated. The contract is marked-to-market daily and the change in market value is recorded by the Fund as an unrealized gain or loss. When the contract is closed, the Fund records a realized gain or loss equal to the difference between the value at the
| | | | | | |
| 44 | | BLACKROCK MANAGED VOLATILITY PORTFOLIO | | MARCH 31, 2015 | | |
| | |
| Notes to Financial Statements (continued) | | |
time it was opened and the value at the time it was closed. The use of forward foreign currency exchange contracts involves the risk that the value of a forward foreign currency exchange contract changes unfavorably due to movements in the value of the referenced foreign currencies.
Options: The Fund purchases and writes call and put options to increase or decrease its exposure to underlying instruments (including equity risk and interest rate risk) and/or in the case of options written, to generate gains from options premiums. A call option gives the purchaser (holder) of the option the right (but not the obligation) to buy, and obligates the seller (writer) to sell (when the option is exercised) the underlying instrument at the exercise or strike price at any time or at a specified time during the option period. A put option gives the holder the right to sell and obligates the writer to buy the underlying instrument at the exercise or strike price at any time or at a specified time during the option period. When the Fund purchases (writes) an option, an amount equal to the premium paid (received) by the Fund is reflected as an asset (liability). The amount of the asset (liability) is subsequently marked-to-market to reflect the current market value of the option purchased (written). When an instrument is purchased or sold through an exercise of an option, the related premium paid (or received) is added to (or deducted from) the basis of the instrument acquired or deducted from (or added to) the proceeds of the instrument sold. When an option expires (or the Fund enters into a closing transaction), the Fund realizes a gain or loss on the option to the extent of the premiums received or paid (or gain or loss to the extent the cost of the closing transaction exceeds the premiums received or paid). When the Fund writes a call option, such option is “covered,” meaning that the Fund holds the underlying instrument subject to being called by the option counterparty. When the Fund writes a put option, such option is covered by cash in an amount sufficient to cover the obligation.
Swaptions are similar to options on securities except that instead of selling or purchasing the right to buy or sell a security, the writer or purchaser of the swaptions is granting or buying the right to enter into a previously agreed upon interest rate or credit default swap agreement (interest rate risk and/or credit risk) at any time before the expiration of the option.
The Fund also purchases or sells listed or OTC foreign currency options, foreign currency futures and related options on foreign currency futures as a short or long hedge against possible variations in foreign exchange rates or to gain exposure to foreign currencies (foreign currency exchange rate risk). When foreign currency is purchased or sold through an exercise of a foreign currency option, the related premium paid (or received) is added to (or deducted from) the basis of the foreign currency acquired or deducted from (or added to) the proceeds of the foreign currency sold (receipts from the foreign currency purchased). Such transactions may be effected with respect to hedges on non-U.S. dollar denominated instruments owned by the Fund but not yet delivered, or committed or anticipated to be purchased by the Fund.
In purchasing and writing options, the Fund bears the risk of an unfavorable change in the value of the underlying instrument or the risk that the Fund may not be able to enter into a closing transaction due to an illiquid market. Exercise of a written option could result in the Fund purchasing or selling a security when it otherwise would not, or at a price different from the current market value.
For the six months ended March 31, 2015, transactions in options written were as follows:
| | | | | | | | | | | | | | | | | | |
| | | Calls | | | | | Puts | |
| | | | | | | | | | |
| | | Contracts | | | Premiums
Received | | | | | Contracts | | | Premiums
Received | |
| | | | | | | | | | |
Outstanding options, beginning of period | | | 8 | | | $ | 3,270 | | | | | | 48 | | | $ | 17,323 | |
Options written | | | 294 | | | | 321,226 | | | | | | 487 | | | | 282,095 | |
Options expired | | | — | | | | — | | | | | | (40 | ) | | | (10,569 | ) |
Options closed | | | (189 | ) | | | (174,222 | ) | | | | | (274 | ) | | | (172,134 | ) |
| | | | | | | | | | |
Outstanding options, end of period | | | 113 | | | $ | 150,274 | | | | | | 221 | | | $ | 116,715 | |
| | | | | | | | | | |
Swaps: The Fund enters into swap agreements in which the Fund and a counterparty agree either to make periodic net payments on a specified notional amount or a net payment upon termination. Swap agreements are privately negotiated in the OTC market and may be entered into as a bilateral contract (“OTC swaps”) or centrally cleared (“centrally cleared swaps”). Swaps are marked-to-market daily and changes in value are recorded as unrealized appreciation (depreciation).
For OTC swaps, any upfront premiums paid are recorded as assets and any upfront fees received are recorded as liabilities and are shown as swap premiums paid and swap premiums received, respectively, in the Statement of Assets and Liabilities and amortized over the term of the OTC swap. Payments received or made by the Fund for OTC swaps are recorded in the Statement of Operations as realized gains or losses, respectively. When an OTC swap is terminated, the Fund will record a realized gain or loss equal to the difference between the proceeds from (or cost of) the closing transaction and the Fund’s basis in the contract, if any. Generally, the basis of the contract is the premium received or paid.
In a centrally cleared swap, immediately following execution of the swap agreement, the swap agreement is novated to a central counterparty (the “CCP”) and the Fund’s counterparty on the swap agreement becomes the CCP. The Fund is required to interface with the CCP through a broker. Upon entering into a centrally cleared swap, the Fund is required to deposit initial margin with the broker in the form of cash or securities in an amount that varies depending on the size and risk profile of the particular swap. Securities deposited as initial margin are designated on the Schedule of Investments and cash deposited is recorded on the Statement of Assets and Liabilities as cash pledged for centrally cleared swaps. The daily change in valuation of centrally cleared swaps is recorded as a receivable or payable for variation margin in the Statement of Assets and Liabilities. Payments received from (paid to) the counterparty, including at termination, are recorded as realized gain (loss) in the Statement of Operations.
| | | | | | |
| | | BLACKROCK MANAGED VOLATILITY PORTFOLIO | | MARCH 31, 2015 | | 45 |
| | |
| Notes to Financial Statements (continued) | | |
Swap transactions involve, to varying degrees, elements of interest rate, credit and market risk in excess of the amounts recognized in the Statement of Assets and Liabilities. Such risks involve the possibility that there will be no liquid market for these agreements, that the counterparty to the agreements may default on its obligation to perform or disagree as to the meaning of the contractual terms in the agreements, and that there may be unfavorable changes in interest rates and/or market values associated with these transactions.
| Ÿ | | Credit default swaps — The Fund enters into credit default swaps to manage its exposure to the market or certain sectors of the market, to reduce its risk exposure to defaults of corporate and/or sovereign issuers or to create exposure to corporate and/or sovereign issuers to which it is not otherwise exposed (credit risk). The Fund may either buy or sell (write) credit default swaps on single-name issuers (corporate or sovereign), a combination or basket of single-name issuers or traded indexes. Credit default swaps on single-name issuers are agreements in which the protection buyer pays fixed periodic payments to the seller in consideration for a guarantee from the protection seller to make a specific payment should a negative credit event take place with respect to the referenced entity (e.g., bankruptcy, failure to pay, obligation accelerators, repudiation, moratorium or restructuring). Credit default swaps on traded indexes are agreements in which the buyer pays fixed periodic payments to the seller in consideration for a guarantee from the seller to make a specific payment should a write-down, principal or interest shortfall or default of all or individual underlying securities included in the index occur. As a buyer, if an underlying credit event occurs, the Fund will either (i) receive from the seller an amount equal to the notional amount of the swap and deliver the referenced security or underlying securities comprising the index, or (ii) receive a net settlement of cash equal to the notional amount of the swap less the recovery value of the security or underlying securities comprising the index. As a seller (writer), if an underlying credit event occurs, the Fund will either pay the buyer an amount equal to the notional amount of the swap and take delivery of the referenced security or underlying securities comprising the index or pay a net settlement of cash equal to the notional amount of the swap less the recovery value of the security or underlying securities comprising the index. |
| Ÿ | | Total return swaps — The Fund enters into total return swaps to obtain exposure to a security or market without owning such security or investing directly in that market or to transfer the risk/return of one market (e.g., fixed income) to another market (e.g., equity or commodity prices) (equity risk, commodity price risk and/or interest rate risk). Total return swaps are agreements in which there is an exchange of cash flows whereby one party commits to make payments based on the total return (coupons plus capital gains/losses) of an underlying instrument in exchange for fixed or floating rate interest payments. To the extent the total return of the instrument or index underlying the transaction exceeds or falls short of the offsetting interest rate obligation, the Fund will receive a payment from or make a payment to the counterparty. |
| Ÿ | | Interest rate swaps — The Fund enters into interest rate swaps to gain or reduce exposure to interest rates or to manage duration, the yield curve or interest rate risk by economically hedging the value of the fixed rate bonds which may decrease when interest rates rise (interest rate risk). Interest rate swaps are agreements in which one party pays a stream of interest payments, either fixed or floating, for another party’s stream of interest payments, either fixed or floating, on the same notional amount for a specified period of time. In more complex swaps, the notional principal amount may decline (or amortize) over time. |
| Ÿ | | Forward interest rate swaps — The Fund may enter into forward interest rate swaps and forward total return swaps. In a forward swap, the Fund and the counterparty agree to make either periodic net payments beginning on a specified future effective date or a net payment at termination, unless terminated earlier. |
The following is a summary of the Fund’s derivative financial instruments categorized by risk exposure:
| | | | | | | | | | |
| Fair Values of Derivative Financial Instruments as of March 31, 2015 | |
| | | | | Value | |
| | | Statement of Assets and Liabilities Location | | Derivative
Assets | | | Derivative
Liabilities | |
| | Net unrealized appreciation/depreciation1 ; | | | | | | | | |
| | Investments at value — unaffiliated2 ; | | | | | | | | |
Interest rate contracts | | Options written at value | | $ | 436,889 | | | $ | 2,129,725 | |
Foreign currency exchange contracts | | Unrealized appreciation/depreciation on forward foreign currency exchange contacts; | | | | | | | | |
| | Net unrealized appreciation/depreciation1 | | | 6,093,685 | | | | 2,218,261 | |
Credit contracts | | Net unrealized appreciation/depreciation1 | | | 14,634 | | | | — | |
| | Net unrealized appreciation/depreciation1 | | | | | | | | |
Equity contracts | | Net unrealized depreciation on OTC swaps | | | 1,000,214 | | | | 778,159 | |
Total | | | | $ | 7,545,422 | | | $ | 5,126,145 | |
| | | | | | |
| | 1 | | Includes cumulative appreciation/depreciation on financial futures contracts and centrally cleared swaps, if any, as reported in the Schedule of Investments. Only current day’s variation margin is reported within the Statement of Assets and Liabilities. |
| | 2 | | Includes options purchased at value as reported in the Schedule of Investments. |
| | | | | | |
| 46 | | BLACKROCK MANAGED VOLATILITY PORTFOLIO | | MARCH 31, 2015 | | |
| | |
| Notes to Financial Statements (continued) | | |
| | | | | | | | | | |
The Effect of Derivative Financial Instruments in the Statement of Operations Six Months Ended March 31, 2015 |
| | | |
| Net Realized Gain (Loss)
from |
| | |
| Net Change in Unrealized
Appreciation/Depreciation on |
|
Interest rate contracts: | | | | | | | | | | |
Financial futures contracts | | | $ | (5,145,211 | ) | | | $ | (1,273,775 | ) |
Swaps | | | | (314,762 | ) | | | | (252,968 | ) |
Options1 | | | | (46,283 | ) | | | | (17,367 | ) |
Foreign currency exchange contracts: | | | | | | | | | | |
Financial futures contracts | | | | 4,369,748 | | | | | (478,842 | ) |
Foreign currency transactions/translations | | | | 27,922,698 | | | | | (1,703,670 | ) |
Credit contracts: | | | | | | | | | | |
Swaps | | | | (45,077 | ) | | | | (11,090 | ) |
Equity contracts: | | | | | | | | | | |
Financial futures contracts | | | | 14,011,012 | | | | | (1,541,779 | ) |
Swaps | | | | 504,887 | | | | | 1,259,358 | |
| | | | | | | | | | |
Total | | | $ | 41,257,012 | | | | $ | (4,020,133 | ) |
| | | | | | | | | | |
| | 1 | | Options purchased are included in the net realized gain (loss) from investments and net change in unrealized appreciation/depreciation on investments. |
For the six months ended March 31, 2015, the average quarterly balances of outstanding derivative financial instruments were as follows:
| | | | |
Financial futures contracts: | | | | |
Average notional value of contracts - long | | $ | 130,553,640 | |
Average notional value of contracts - short | | $ | 475,062,496 | |
Forward foreign currency exchange contracts: | | | | |
Average amounts purchased - in USD | | $ | 417,957,273 | |
Average amounts sold - in USD | | $ | 157,760,388 | |
Options: | | | | |
Average notional value of option contracts purchased | | $ | 27,544 | |
Average notional value of option contracts written | | $ | 145,966 | |
Credit default swaps: | | | | |
Average notional value - sell protection | | $ | 1,980,603 | |
Interest rate swaps: | | | | |
Average notional value - pays fixed rate | | $ | 10,843,649 | |
Average notional value - receives fixed rate | | $ | 1,433,913 | |
Total return swaps: | | | | |
Average notional amount | | $ | 34,566,004 | |
Counterparty Credit Risk: A derivative contract may suffer a mark-to-market loss if the value of the contract decreases due to an unfavorable change in the market rates or values of the underlying instrument. Losses can also occur if the counterparty does not perform under the contract.
The Fund’s risk of loss from counterparty credit risk on OTC derivatives is generally limited to the aggregate unrealized gain less the value of any collateral held by the Fund. For OTC options purchased, the Fund bears the risk of loss of the amount of the premiums paid plus the positive change in market values net of any collateral held by the Fund should the counterparty fail to perform under the contracts. Options written by the Fund do not typically give rise to counterparty credit risk, as options written generally obligate the Fund, and not the counterparty, to perform.
With exchange-traded purchased options and futures and centrally cleared swaps, there is less counterparty credit risk to the Fund since the exchange or clearinghouse, as counterparty to such instruments, guarantees against a possible default. The clearinghouse stands between the buyer and the seller of the contract; therefore, credit risk is limited to failure of the clearinghouse. While offset rights may exist under applicable law, the Fund does not have a contractual right of offset against a clearing broker or clearinghouse in the event of a default (including the bankruptcy or insolvency) of the clearing broker or clearinghouse. Additionally, credit risk exists in exchange-traded futures and centrally cleared swaps with respect to initial and variation margin that is held in a clearing broker’s customer accounts. While clearing brokers are required to segregate customer margin from their own assets, in the event that a clearing broker becomes insolvent or goes into bankruptcy and at that time there is a shortfall in the aggregate amount of margin held by the clearing broker for all its clients, typically the shortfall would be allocated on a pro rata basis across all the clearing broker’s customers, potentially resulting in losses to the Fund.
In order to better define its contractual rights and to secure rights that will help the Fund mitigate its counterparty risk, the Fund may enter into an International Swaps and Derivatives Association, Inc. Master Agreement (“ISDA Master Agreement”) or similar agreement with its counterparties. An ISDA Master Agreement is a bilateral agreement between the Fund and a counterparty that governs certain OTC derivatives and typically contains, among other things, collateral posting terms and netting provisions in the event of a default and/or termination event. Under an ISDA Master Agreement, the Fund may, under certain circumstances, offset with the counterparty certain derivative financial instruments’ payables and/or receivables with collateral
| | | | | | |
| | | BLACKROCK MANAGED VOLATILITY PORTFOLIO | | MARCH 31, 2015 | | 47 |
| | |
| Notes to Financial Statements (continued) | | |
held and/or posted and create one single net payment. The provisions of the ISDA Master Agreement typically permit a single net payment in the event of default including the bankruptcy or insolvency of the counterparty. Bankruptcy or insolvency laws of a particular jurisdiction may restrict or prohibit the right of offset in bankruptcy, insolvency or other events. In addition, certain ISDA Master Agreements allow counterparties to terminate derivative contracts prior to maturity in the event the Fund’s net assets decline by a stated percentage or the Fund fails to meet the terms of its ISDA Master Agreements, which would cause the Fund to accelerate payment of any net liability owed to the counterparty.
Collateral Requirements: For derivatives traded under an ISDA Master Agreement, the collateral requirements are typically calculated by netting the mark-to-market amount for each transaction under such agreement and comparing that amount to the value of any collateral currently pledged by the Fund and the counterparty.
Cash collateral that has been pledged to cover obligations of the Fund and cash collateral received from the counterparty, if any, is reported separately on the Statement of Assets and Liabilities as cash pledged as collateral and cash received as collateral, respectively. Non-cash collateral pledged by the Fund, if any, is noted in the Schedule of Investments. Generally, the amount of collateral due from or to a party has to exceed a minimum transfer amount threshold (typically either $250,000 or $500,000) before a transfer is required, which is determined at the close of business of the Fund. Any additional required collateral is delivered to/pledged by the Fund on the next business day. Typically, the Fund and counterparties are not permitted to sell, re-pledge or use the collateral they receive. To the extent amounts due to the Fund from its counterparties are not fully collateralized, the Fund bears the risk of loss from counterparty non-performance. Likewise, to the extent the Fund has delivered collateral to a counterparty and stands ready to perform under the terms of its agreement with such counterparty, the Fund bears the risk of loss from a counterparty in the amount of the value of the collateral in the event the counterparty fails to return such collateral.
For financial reporting purposes, the Fund does not offset derivative assets and derivative liabilities that are subject to netting arrangements, if any, in the Statement of Assets and Liabilities.
As of March 31, 2015, the Fund’s derivative assets and liabilities (by type) are as follows:
| | | | | | | | |
| | | Assets | | | Liabilities | |
Derivative Financial Instruments: | | | | | | | | |
Financial futures contracts | | $ | 1,038,405 | | | $ | 646,926 | |
Forward foreign currency exchange contracts | | | 5,978,260 | | | | 1,799,231 | |
Options1 | | | 55,087 | | | | 291,931 | |
Swaps-Centrally cleared | | | 4,614 | | | | — | |
Swaps-OTC | | | — | | | | 23,793 | |
| | | | |
Total derivative assets and liabilities in the Statement of Assets and Liabilities | | $ | 7,076,366 | | | $ | 2,761,881 | |
Derivatives not subject to a Master Netting Agreement or similar agreement (“MNA”) | | | (1,098,106 | ) | | | (938,857 | ) |
| | | | |
Total derivative assets and liabilities subject to an MNA | | $ | 5,978,260 | | | $ | 1,823,024 | |
| | | | |
| | 1 | | Includes options purchased at value which are included in Investments at value — unaffiliated in the Statement of Assets and Liabilities and reported in the Schedule of Investments. |
As of March 31, 2015, the following tables present the Fund’s derivative assets and/or liabilities by counterparty net of amounts available for offset under an MNA and net of the related collateral received and pledged by the Fund:
| | | | | | | | | | | | | | | | |
| Counterparty | | Derivative Assets
Subject to an MNA by
Counterparty | | | Derivatives Available
for Offset1 | | | Non-cash
Collateral
Received | | Cash
Collateral
Received | | Net Amount of Derivative Assets2 | |
Bank of America N.A. | | $ | 3,977 | | | $ | (3,977 | ) | | — | | — | | | — | |
Barclays Bank PLC | | | 23,582 | | | | (23,582 | ) | | — | | — | | | — | |
BNP Paribas S.A. | | | 8,419 | | | | (6,936 | ) | | — | | — | | $ | 1,483 | |
Citibank N.A. | | | 1,928,883 | | | | (38,724 | ) | | — | | — | | | 1,890,159 | |
Credit Suisse International | | | 59,040 | | | | (59,040 | ) | | — | | — | | | — | |
Deutsche Bank AG | | | 961,525 | | | | (163,386 | ) | | — | | — | | | 798,139 | |
Goldman Sachs International | | | 127,175 | | | | (78,477 | ) | | — | | — | | | 48,698 | |
HSBC Bank PLC | | | 52,430 | | | | (52,314 | ) | | — | | — | | | 116 | |
JPMorgan Chase Bank N.A. | | | 914,722 | | | | (141,630 | ) | | — | | — | | | 773,092 | |
Morgan Stanley & Co. International PLC | | | 833,455 | | | | (63,839 | ) | | — | | — | | | 769,616 | |
Royal Bank of Canada | | | 345 | | | | — | | | — | | — | | | 345 | |
State Street Bank and Trust Co. | | | 14,731 | | | | (14,731 | ) | | — | | — | | | — | |
UBS AG | | | 1,022,419 | | | | (113,424 | ) | | — | | — | | | 908,995 | |
Westpac Banking Corp. | | | 27,557 | | | | (17,165 | ) | | — | | — | | | 10,392 | |
| | | | |
| | $ | 5,978,260 | | | $ | (777,225 | ) | | — | | — | | $ | 5,201,035 | |
| | | | |
| | | | | | |
| 48 | | BLACKROCK MANAGED VOLATILITY PORTFOLIO | | MARCH 31, 2015 | | |
| | |
| Notes to Financial Statements (continued) | | |
| | | | | | | | | | | | | | | | | | |
| Counterparty | | Derivative Liabilities
Subject to an MNA by
Counterparty | | | Derivatives Available
for Offset1 | | | Non-cash
Collateral
Pledged | | Cash
Collateral
Pledged | | | Net Amount of
Derivative Liabiities3 | |
Bank of America N.A. | | $ | 15,041 | | | $ | (3,977 | ) | | — | | | — | | | $ | 11,064 | |
Barclays Bank PLC | | | 65,413 | | | | (23,582 | ) | | — | | | — | | | | 41,831 | |
BNP Paribas S.A. | | | 6,936 | | | | (6,936 | ) | | — | | | — | | | | — | |
Citibank N.A. | | | 38,724 | | | | (38,724 | ) | | — | | | — | | | | — | |
Credit Suisse International | | | 233,769 | | | | (59,040 | ) | | — | | | — | | | | 174,729 | |
Deutsche Bank AG | | | 163,386 | | | | (163,386 | ) | | — | | | — | | | | — | |
Goldman Sachs International | | | 78,477 | | | | (78,477 | ) | | — | | | — | | | | — | |
HSBC Bank PLC | | | 52,314 | | | | (52,314 | ) | | — | | | — | | | | — | |
JPMorgan Chase Bank N.A. | | | 141,630 | | | | (141,630 | ) | | — | | | — | | | | — | |
Morgan Stanley & Co. International PLC | | | 63,839 | | | | (63,839 | ) | | — | | | — | | | | — | |
Royal Bank of Scotland PLC | | | 2,702 | | | | — | | | — | | | — | | | | 2,702 | |
Standard Chartered Bank | | | 810,035 | | | | — | | | — | | | — | | | | 810,035 | |
State Street Bank and Trust Co. | | | 20,169 | | | | (14,731 | ) | | — | | | — | | | | 5,438 | |
UBS AG | | | 113,424 | | | | (113,424 | ) | | — | | | — | | | | — | |
Westpac Banking Corp. | | | 17,165 | | | | (17,165 | ) | | — | | | — | | | | — | |
| | | | |
| | $ | 1,823,024 | | | $ | (777,225 | ) | | — | | | — | | | $ | 1,045,799 | |
| | | | |
| | 1 | | The amount of derivatives available for offset is limited to the amount of derivative assets and/or liabilities that are subject to an MNA. |
| | 2 | | Net amount represents the net amount receivable from the counterparty in the event of default. |
| | 3 | | Net amount represents the net amount payable due to the counterparty in the event of default. |
5. Investment Advisory Agreement and Other Transactions with Affiliates:
The PNC Financial Services Group, Inc. is the largest stockholder and an affiliate of BlackRock, Inc. (“BlackRock”) for 1940 Act purposes.
The Trust, on behalf of the Fund, entered into an Investment Advisory Agreement with the Manager, the Fund’s investment advisor, an indirect, wholly owned subsidiary of BlackRock, to provide investment advisory services. The Manager is responsible for the management of the Fund’s portfolio and provides the necessary personnel, facilities, equipment and certain other services to the operations of the Fund. For such services, the Fund pays the Manager a monthly fee based on a percentage of the Fund’s average daily net assets at the following annual rates:
| | | | |
| Average Daily Net Assets | | Investment Advisory Fee | |
First $1 Billion | | | 0.550 | % |
$1 Billion - $2 Billion | | | 0.500 | % |
$2 Billion - $3 Billion | | | 0.475 | % |
Greater than $3 Billion | | | 0.450 | % |
The Manager voluntarily agreed to waive its investment advisory fees by the amount of investment advisory fees the Fund pays to the Manager indirectly through its investment in affiliated money market funds. This amount is shown as fees waived by the Manager in the Statement of Operations. For the six months ended March 31, 2015, BlackRock waived $115,467. In addition, the Manager has contractually agreed to waive the management fee on assets estimated to be attributed to the Fund’s investments in other equity and fixed-income mutual funds managed by the Manager or its affiliates, if any.
The Manager entered into a sub-advisory agreement with BlackRock International Limited (“BIL”), BlackRock Asset Management North Asia Limited (“BNA”) and BlackRock (Singapore) Limited (“BSL”), each an affiliate of the Manager. The Manager pays BIL, BNA and BSL, for services they provide, a monthly fee that is a percentage of the investment advisory fees paid by the Fund to the Manager.
The Trust, on behalf of the Fund, entered into a Distribution Agreement and a Distribution and Service Plan with BlackRock Investments, LLC (“BRIL”), an affiliate of the Manager. Pursuant to the Distribution and Service Plan and in accordance with Rule 12b-1 under the 1940 Act, the Fund pays BRIL ongoing service and distribution fees. The fees are accrued daily and paid monthly at annual rates based upon the average daily net assets of the relevant share class of the Fund as follows:
| | | | | | | | | | | | | | | | |
| | | Service | | | Investor A | | | Investor B | | | Investor C | |
Service Fee | | | 0.25 | % | | | 0.25 | % | | | 0.25 | % | | | 0.25 | % |
Distribution Fee | | | — | | | | — | | | | 0.75 | % | | | 0.75 | % |
| | | | | | |
| | | BLACKROCK MANAGED VOLATILITY PORTFOLIO | | MARCH 31, 2015 | | 49 |
| | |
| Notes to Financial Statements (continued) | | |
Pursuant to sub-agreements with BRIL, broker-dealers and BRIL provide shareholder servicing and distribution services to the Fund. The ongoing service and/or distribution fee compensates BRIL and each broker-dealer for providing shareholder servicing and/or distribution related services to Service, Investor A, Investor B and Investor C shareholders.
For the six months ended March 31, 2015, the following table shows the class specific service and distribution fees borne directly by each class of the Fund:
| | | | | | | | | | | | | | | | | | |
| Service | | | Investor A | | | Investor B | | | Investor C | | | Total | |
| $ | 2,057 | | | $ | 424,021 | | | $ | 30,414 | | | $ | 360,853 | | | $ | 817,345 | |
Pursuant to written agreements, certain financial intermediaries, some of which may be affiliates, provide the Fund with sub-accounting, recordkeeping, sub-transfer agency and other administrative services with respect to sub-accounts they service. For these services, these entities receive an asset-based fee or an annual fee per shareholder account, which will vary depending on share class and/or net assets. For the six months ended March 31, 2015, the Fund paid the following amounts to affiliates of BlackRock in return for these services, which are included in transfer agent — class specific in the Statement of Operations:
| | | | | | |
| Institutional | | Service | | Investor A | | Total |
| $119,535 | | $1,343 | | $4,904 | | $125,782 |
The Manager maintains a call center, which is responsible for providing certain shareholder services to the Fund, such as responding to shareholder inquiries and processing transactions based upon instructions from shareholders with respect to the subscription and redemption of Fund shares. For the six months ended March 31, 2015, the Fund reimbursed the Manager the following amounts for costs incurred in running the call center, which are included in transfer agent — class specific in the Statement of Operations:
| | | | | | | | | | |
| Institutional | | Service | | Investor A | | Investor B | | Investor C | | Total |
| $1,044 | | $74 | | $52,589 | | $3,080 | | $2,291 | | $59,078 |
For the six months ended March 31, 2015, the following table shows the class specific transfer agent fees borne directly by each class of the Fund:
| | | | | | | | | | |
| Institutional | | Service | | Investor A | | Investor B | | Investor C | | Total |
| $194,574 | | $1,893 | | $328,183 | | $18,163 | | $44,849 | | $587,662 |
Effective January 1, 2015, the Trust, on behalf of the Fund, entered into an Administration Agreement with the Manager, an indirect, wholly owned subsidiary of BlackRock, to provide administrative services. For these services, the Manager receives an administration fee computed daily and payable monthly, based on a percentage of the average daily net assets of the Fund. The administration fee, which is shown as administration in the Statement of Operations, is paid at the annual rates below.
| | | | |
| Average Daily Net Assets | | Administration Fee | |
First $500 Million | | | 0.0425 | % |
$500 Million - $1 Billion | | | 0.0400 | % |
$1 Billion - $2 Billion | | | 0.0375 | % |
$2 Billion - $4 Billion | | | 0.0350 | % |
$4 Billion - $13 Billion | | | 0.0325 | % |
Greater than $13 Billion | | | 0.0300 | % |
In addition, the Manager charges each of the share classes an administration fee, which is shown as administration — class specific in the Statement of Operations, at an annual rate of 0.02% of the average daily net assets of each respective class.
Prior to January 1, 2015, BNY Mellon Investment Servicing (US) Inc. (“BNYMIS”) and the Manager acted as co-administrators for the Fund. For these services, the co-administrators received an administration fee computed daily and payable monthly to each administrator pursuant to separate fee arrangements, based on a percentage of the average daily net assets of the Fund. The combined administration fee, which is shown as administration in the Statement of Operations, was paid at the annual rates below. In addition, each of the share classes was charged an administration fee, which is shown as administration — class specific in the Statement of Operations, based on the following percentages of average daily net assets of each respective class:
| | | | | | | | |
| Average Daily Net Assets | | Administration Fee | | | Administration Fee —
Class Specific | |
First $500 Million | | | 0.075 | % | | | 0.025 | % |
$500 Million - $1 Billion | | | 0.065 | % | | | 0.015 | % |
Greater than $1 Billion | | | 0.055 | % | | | 0.005 | % |
| | | | | | |
| 50 | | BLACKROCK MANAGED VOLATILITY PORTFOLIO | | MARCH 31, 2015 | | |
| | |
| Notes to Financial Statements (continued) | | |
For the six months ended March 31, 2015, the Fund paid $244,348 to the Manager in return for these services, which is included in administration and administration — class specific in the Statement of Operations.
For the six months ended March 31, 2015, the following table shows the class specific administration fees borne directly by each class of the Fund:
| | | | | | | | | | | | | | | | | | | | | | |
| Institutional | | | Service | | | Investor A | | | Investor B | | | Investor C | | | Total | |
| $ | 36,407 | | | $ | 185 | | | $ | 38,227 | | | $ | 691 | | | $ | 8,136 | | | $ | 83,646 | |
BNYMIS and the Manager may have, at their discretion, voluntarily waived all or any portion of their administration fees for the Fund or a share class, which are included in administration fees waived — class specific in the Statement of Operations.
The Manager contractually agreed to waive and/or reimburse fees or expenses in order to limit expenses, excluding interest expense, dividend expense, tax expense, acquired fund fees and expenses and certain other fund expenses, which constitute extraordinary expenses not incurred in the ordinary course of the Fund’s business. The expense limitations as a percentage of average daily net assets are as follows:
| | | | | | | | | | | | | | | | | | |
| Institutional | | | Service | | | Investor A | | | Investor B | | | Investor C | |
| | 0.89 | % | | | 1.17 | % | | | 1.37 | % | | | 2.14 | % | | | 2.14 | % |
The Manager has agreed not to reduce or discontinue this contractual waiver or reimbursement prior to February 1, 2016 unless approved by the Board, including a majority of the independent Trustees.
Class specific expense waivers or reimbursements are as follows:
| | | | | | | | | | | | |
| | | Service | | | Investor B | | | Total | |
Administration Fees Waived | | $ | 4 | | | $ | 689 | | | $ | 693 | |
Transfer Agent Fees Waived | | | — | | | $ | 1,983 | | | $ | 1,983 | |
Transfer Agent Fees Reimbursed | | | — | | | $ | 1,109 | | | $ | 1,109 | |
If during the Fund’s fiscal year the operating expenses of a share class, that at any time during the prior two fiscal years received a waiver or reimbursement from the Manager, are less than the expense limit for that share class, the Manager is entitled to be reimbursed by such share class up to the lesser of (a) the amount of fees waived or expenses reimbursed during those prior two fiscal years under the agreement and (b) the amount by which the expense limit for that share class exceeds the operating expenses of the share class for the current fiscal year, provided that: (1) the Fund has more than $50 million in assets for the fiscal year and (2) the Manager or an affiliate continues to serve as the Fund’s investment advisor or administrator. In the event the expense limit for a share class is changed subsequent to a fiscal year in which the Manager becomes entitled to reimbursement for fees waived or reimbursed, the amount available to reimburse the Manager shall be calculated by reference to the expense limit for that share class in effect at the time the Manager became entitled to receive such reimbursement, rather than the subsequently changed expense limit for that share class.
For the six months ended March 31, 2015, the Manager recouped waivers and/or reimbursements previously recorded $3,940 and $159 for Institutional Shares and Service Shares, respectively.
On March 31, 2015, the Fund level and class specific waivers and/or reimbursements subject to possible future recoupment under the expense limitation agreement are as follows:
| | | | | | | | |
| Expires September 30, | | Service | | | Investor B | |
2015 | | $ | 398 | | | | — | |
2016 | | $ | 136 | | | $ | 523 | |
2017 | | $ | 4 | | | $ | 3,781 | |
For the six months ended March 31, 2015, affiliates earned underwriting discounts, direct commissions and dealer concessions on sales of the Fund’s Investor A Shares of $8,176.
For the six months ended March 31, 2015, affiliates received CDSCs as follows:
| | | | | | | | | | | | | | |
| Investor A | | | Investor B | | | Investor C | | | Total | |
| $ | 125 | | | $ | 236 | | | $ | 1,369 | | | $ | 1,730 | |
| | | | | | |
| | | BLACKROCK MANAGED VOLATILITY PORTFOLIO | | MARCH 31, 2015 | | 51 |
| | |
| Notes to Financial Statements (continued) | | |
The U.S. Securities and Exchange Commission has issued an exemptive order which permits BIM, an affiliate of the Manager, to serve as securities lending agent for the Fund, subject to applicable conditions. As securities lending agent, BIM bears all operational costs directly related to securities lending. The Fund is responsible for expenses in connection with the investment of cash collateral received for securities on loan (the “collateral investment expenses”). The cash collateral is invested in a private investment company managed by the Manager or its affiliates. However, BIM has agreed to cap the collateral investment expenses of the private investment company to an annual rate of 0.04%. The investment advisor to the private investment company will not charge any advisory fees with respect to shares purchased by the Fund.
Securities lending income is equal to the total of income earned from the reinvestment of cash collateral, net of fees and other payments to and from borrowers of securities, and less the collateral investment expenses. The Fund retains a portion of securities lending income and remits a remaining portion to BIM as compensation for its services as securities lending agent. BIM may lend securities only when the difference between the borrower rebate rate and the risk free rate exceeds a certain level (such securities, the “specials only securities”).
Pursuant to such agreement, the Fund retains 80% of securities lending income. In addition, commencing the business day following the date that the aggregate securities lending income earned across certain funds in the Equity-Liquidity Complex in a calendar year exceeds a specified threshold, the Fund, pursuant to the securities lending agreement, will retain for the remainder of the calendar year securities lending income in an amount equal to 85% of securities lending income. The share of securities lending income earned by the Fund is shown as securities lending — affiliated — net in the Statement of Operations. For the six months ended March 31, 2015, the Fund paid BIM $1,228 for securities lending agent services.
Certain officers and/or trustees of the Trust are officers and/or directors of BlackRock or its affiliates. The Fund reimburses the Manager for a portion of the compensation paid to the Trust’s Chief Compliance Officer, which is included in officer and trustees in the Statement of Operations.
6. Purchases and Sales:
For the six months ended March 31, 2015, purchases and sales of investments, including paydowns, TBA transactions and excluding short-term securities were as follows:
| | | | | | | | |
| | | Purchases | | | Sales | |
Non-U.S. Government Securities | | $ | 564,485,761 | | | $ | 391,955,557 | |
U.S. Government Securities | | $ | 4,179,738 | | | $ | 242,453 | |
7. Income Tax Information:
It is the Fund’s policy to comply with the requirements of the Internal Revenue Code of 1986, as amended, applicable to regulated investment companies, and to distribute substantially all of its taxable income to its shareholders. Therefore, no federal income tax provision is required.
The Fund files U.S. federal and various state and local tax returns. No income tax returns are currently under examination. The statute of limitations on the Fund’s U.S. federal tax returns remains open for each of the four years ended September 30, 2014. The statutes of limitations on the Fund’s state and local tax returns may remain open for an additional year depending upon the jurisdiction.
Management has analyzed tax laws and regulations and their application to the Fund as of March 31, 2015, inclusive of the open tax return years, and does not believe there are any uncertain tax positions that require recognition of a tax liability in the Fund’s financial statements.
As of March 31, 2015, gross unrealized appreciation and depreciation based on cost for federal income tax purposes were as follows:
| | | | |
Tax cost | | $ | 756,831,941 | |
| | | | |
Gross unrealized appreciation | | $ | 19,410,254 | |
Gross unrealized depreciation | | | (23,585,142 | ) |
| | | | |
Net unrealized depreciation | | $ | (4,174,888 | ) |
| | | | |
8. Borrowings:
The Trust, on behalf of the Fund, along with certain other funds managed by the Manager and its affiliates (“Participating Funds”), was a party to a 364-day, $1.1 billion credit agreement with a group of lenders, under which the Fund may borrow to fund shareholder redemptions. Excluding commitments designated for a certain individual fund, the Participating Funds, including the Fund, could borrow up to an aggregate commitment amount of $650 million, subject to asset coverage and other limitations as specified in the agreement. Effective November 25, 2014, the credit agreement was amended to an aggregate commitment amount of $2.1 billion, of which the Participating Funds, including the Fund, can borrow up to $1.6 billion at any time outstanding, subject to asset coverage and other limitations as specified in the agreement. The agreement terminates on April 23, 2015, unless otherwise extended to November 24, 2015 or renewed for a period of 364 days from April 23, 2015. The amended agreement has the following terms: a fee of 0.06% per annum on unused commitment amounts and interest at a rate equal to the higher of (a) one-month LIBOR (but, in any event, not less than 0.00%) on the date the loan is made plus 0.80% per annum or (b) the Fed Funds rate (but, in any event, not less than 0.00%) in
| | | | | | |
| 52 | | BLACKROCK MANAGED VOLATILITY PORTFOLIO | | MARCH 31, 2015 | | |
| | |
| Notes to Financial Statements (continued) | | |
effect from time to time plus 0.80% per annum on amounts borrowed. Participating Funds paid administration, legal and arrangement fees, which are included in miscellaneous expenses in the Statement of Operations, and along with commitment fees, were allocated among such funds based upon portions of the aggregate commitment available to them and relative net assets of Participating Funds. During the six months ended March 31, 2015, the Fund did not borrow under the credit agreement.
9. Principal Risks:
In the normal course of business, the Fund invests in securities and enters into transactions where risks exist due to fluctuations in the market (market risk) or failure of the issuer of a security to meet all its obligations (issuer credit risk). The value of securities held by the Fund may decline in response to certain events, including those directly involving the issuers whose securities are owned by the Fund; conditions affecting the general economy; overall market changes; local, regional or global political, social or economic instability; and currency, interest rate and price fluctuations. Similar to issuer credit risk, the Fund may be exposed to counterparty credit risk, or the risk that an entity with which the Fund has unsettled or open transactions may fail to or be unable to perform on its commitments. The Fund manages counterparty credit risk by entering into transactions only with counterparties that it believes have the financial resources to honor their obligations and by monitoring the financial stability of those counterparties. Financial assets, which potentially expose the Fund to market, issuer and counterparty credit risks, consist principally of financial instruments and receivables due from counterparties. The extent of the Fund’s exposure to market, issuer and counterparty credit risks with respect to these financial assets is generally approximated by their value recorded in the Statement of Assets and Liabilities, less any collateral held by the Fund.
10. Capital Share Transactions:
Transactions in capital shares for each class were as follows:
| | | | | | | | | | | | | | | | | | |
| | | Six Months Ended
March 31, 2015 | | | | | Year Ended
September 30, 2014 | |
| | | Shares | | | Amount | | | | | Shares | | | Amount | |
| Institutional | | | | | | | | | | | | | | |
Shares sold | | | 1,237,824 | | | $ | 18,676,785 | | | | | | 18,459,670 | | | $ | 291,296,269 | |
Shares issued in reinvestment of distributions | | | 1,215,917 | | | | 17,582,178 | | | | | | 1,325,140 | | | | 20,157,670 | |
Shares redeemed | | | (3,508,650 | ) | | | (53,023,039 | ) | | | | | (5,967,622 | ) | | | (92,271,562 | ) |
| | | | | | | | | | |
Net increase (decrease) | | | (1,054,909 | ) | | $ | (16,764,076 | ) | | | | | 13,817,188 | | | $ | 219,182,377 | |
| | | | | | | | | | |
| | | | | | | | | | | | | | | | | | |
Service | | | | | | | | | | | | | | | | | | |
Shares sold | | | 543 | | | $ | 8,235 | | | | | | 3,606 | | | $ | 57,541 | |
Shares issued in reinvestment of distributions | | | 7,737 | | | | 111,490 | | | | | | 10,118 | | | | 153,456 | |
Shares redeemed | | | (5,819 | ) | | | (88,615 | ) | | | | | (14,985 | ) | | | (235,818 | ) |
| | | | | | | | | | |
Net increase (decrease) | | | 2,461 | | | $ | 31,110 | | | | | | (1,261 | ) | | $ | (24,821 | ) |
| | | | | | | | | | |
| | | | | | | | | | | | | | | | | | |
Investor A | | | | | | | | | | | | | | | | | | |
Shares sold and automatic conversion of shares | | | 753,376 | | | $ | 11,300,718 | | | | | | 996,006 | | | $ | 15,419,000 | |
Shares issued in reinvestment of distributions | | | 1,637,182 | | | | 23,575,411 | | | | | | 2,177,841 | | | | 33,005,225 | |
Shares redeemed | | | (2,032,925 | ) | | | (30,495,939 | ) | | | | | (4,075,561 | ) | | | (63,161,360 | ) |
| | | | | | | | | | |
Net increase (decrease) | | | 357,633 | | | $ | 4,380,190 | | | | | | (901,714 | ) | | $ | (14,737,135 | ) |
| | | | | | | | | | |
| | | | | | | | | | | | | | | | | | |
Investor B | | | | | | | | | | | | | | | | | | |
Shares sold | | | 1,939 | | | $ | 32,216 | | | | | | 5,115 | | | $ | 78,672 | |
Shares issued in reinvestment of distributions | | | 26,047 | | | | 369,876 | | | | | | 65,575 | | | | 980,348 | |
Shares redeemed and automatic conversion of shares | | | (107,527 | ) | | | (1,578,886 | ) | | | | | (428,394 | ) | | | (6,529,169 | ) |
| | | | | | | | | | |
Net decrease | | | (79,541 | ) | | $ | (1,176,794 | ) | | | | | (357,704 | ) | | $ | (5,470,149 | ) |
| | | | | | | | | | |
| | | | | | |
| | | BLACKROCK MANAGED VOLATILITY PORTFOLIO | | MARCH 31, 2015 | | 53 |
| | |
| Notes to Financial Statements (concluded) | | |
| | | | | | | | | | | | | | | | | | |
| | | Six Months Ended
March 31, 2015 | | | | | Year Ended
September 30, 2014 | |
| | | Shares | | | Amount | | | | | Shares | | | Amount | |
Investor C | | | | | | | | | | | | | | | | | | |
Shares sold | | | 174,903 | | | $ | 2,557,967 | | | | | | 271,370 | | | $ | 4,093,112 | |
Shares issued in reinvestment of distributions | | | 332,476 | | | | 4,681,259 | | | | | | 468,294 | | | | 6,958,846 | |
Shares redeemed | | | (549,465 | ) | | | (8,004,210 | ) | | | | | (1,042,063 | ) | | | (15,808,816 | ) |
| | | | | | | | | | |
Net decrease | | | (42,086 | ) | | $ | (764,984 | ) | | | | | (302,399 | ) | | $ | (4,756,858 | ) |
| | | | | | | | | | |
Total Net Increase (Decrease) | | | (816,442 | ) | | $ | (14,294,554 | ) | | | | | 12,254,110 | | | $ | 194,193,414 | |
| | | | | | | | | | |
11. Subsequent Events:
Management’s evaluation of the impact of all subsequent events on the Fund’s financial statements was completed through the date the financial statements were issued and the following item was noted:
Effective April 23, 2015, the 364-day, $2.1 billion credit agreement to which the Fund is a party, was further amended to expire on April 21, 2016, unless otherwise extended or renewed.
| | | | | | |
| 54 | | BLACKROCK MANAGED VOLATILITY PORTFOLIO | | MARCH 31, 2015 | | |
Rodney D. Johnson, Chair of the Board and Trustee
David O. Beim, Trustee
Collette Chilton, Trustee
Frank J. Fabozzi, Trustee
Dr. Matina S. Horner, Trustee
Herbert I. London, Trustee
Ian A. MacKinnon, Trustee
Cynthia A. Montgomery, Trustee
Barbara G. Novick, Trustee
Joseph P. Platt, Trustee
Robert C. Robb, Jr., Trustee
Toby Rosenblatt, Trustee
Mark Stalnecker, Trustee
Kenneth L. Urish, Trustee
Frederick W. Winter, Trustee
John M. Perlowski, President and Chief Executive Officer
Jennifer McGovern, Vice President
Neal Andrews, Chief Financial Officer
Jay Fife, Treasurer
Charles Park, Chief Compliance Officer
Fernanda Piedra, Anti-Money Laundering Compliance Officer
Benjamin Archibald, Secretary
Effective December 31, 2014, Paul L. Audet and Henry Gabbay resigned as Trustees of the Trust and Ronald W. Forbes resigned as a Trustee of the Trust and Co-Chair of the Board. Effective January 1, 2015, Collette Chilton, Barbara G. Novick and Mark Stalnecker were appointed to serve as Trustees of the Trust.
Effective March 1, 2015, Charles Park resigned as Anti-Money Laundering Compliance Officer of the Trust and Fernanda Piedra became Anti-Money Laundering Compliance Officer of the Trust.
| | | | | | |
| | | | |
Investment Advisor and Administrator BlackRock Advisors, LLC Wilmington, DE 19809 | | Accounting Agent and Transfer Agent BNY Mellon Investment Servicing (US) Inc. Wilmington, DE 19809 | | Independent Registered Public Accounting Firm Deloitte & Touche LLP Philadelphia, PA 19103 | | Address of the Trust 100 Bellevue Parkway Wilmington, DE 19809 |
| | | | | | |
Sub-Advisors BlackRock International Limited Edinburgh, EH3 8BL United Kingdom BlackRock Asset Management North Asia Limited Hong Kong BlackRock (Singapore) Limited 079912 Singapore | | Custodian The Bank of New York Mellon New York, NY 10286 | | Distributor BlackRock Investments, LLC New York, NY 10022 | | Legal Counsel Sidley Austin LLP New York, NY 10019 |
| | | | | | |
| | | BLACKROCK MANAGED VOLATILITY PORTFOLIO | | MARCH 31, 2015 | | 55 |
Householding
The Fund will mail only one copy of shareholder documents, including prospectuses, annual and semi-annual reports and proxy statements, to shareholders with multiple accounts at the same address. This practice is commonly called “householding” and is intended to reduce expenses and eliminate duplicate mailings of shareholder documents. Mailings of your shareholder documents may be householded indefinitely unless you instruct us otherwise. If you do not want the mailing of these documents to be combined with those for other members of your household, please call the Fund at (800) 441-7762.
Availability of Quarterly Schedule of Investments
The Fund files its complete schedule of portfolio holdings with the SEC for the first and third quarters of each fiscal year on Form N-Q. The Fund’s Forms N-Q are available on the SEC’s website at http://www.sec.gov and may also be reviewed and copied at the SEC’s Public Reference Room in Washington, D.C. Information on how to access documents on the SEC’s website without charge may be obtained by calling (800) SEC-0330. The Fund’s Forms N-Q may also be obtained upon request and without charge by calling (800) 441-7762.
Availability of Proxy Voting Policies and Procedures
A description of the policies and procedures that the Fund uses to determine how to vote proxies relating to portfolio securities is available upon request and without charge (1) by calling (800) 441-7762; (2) at http://www.blackrock.com; and (3) on the SEC’s website at http://www.sec.gov.
Availability of Proxy Voting Record
Information about how the Fund voted proxies relating to securities held in the Fund’s portfolio during the most recent 12-month period ended June 30 is available upon request and without charge (1) at http://www.blackrock.com or by calling (800) 441-7762 and (2) on the SEC’s website at http:// www.sec.gov.
Account Information
Call us at (800) 441-7762 from 8:00 AM to 6:00 PM EST on any business day to get information about your account balances, recent transactions and share prices. You can also reach us on the Web at http://www.blackrock.com/funds.
Automatic Investment Plans
Investor Class shareholders who want to invest regularly can arrange to have $50 or more automatically deducted from their checking or savings account and invested in any of the BlackRock funds.
Systematic Withdrawal Plans
Investor Class shareholders can establish a systematic withdrawal plan and receive periodic payments of $50 or more from their BlackRock funds, as long as their account balance is at least $10,000.
Retirement Plans
Shareholders may make investments in conjunction with Traditional, Rollover, Roth, Coverdell, Simple IRAs, SEP IRAs and 403(b) Plans.
| | | | | | |
| 56 | | BLACKROCK MANAGED VOLATILITY PORTFOLIO | | MARCH 31, 2015 | | |
| | |
| Additional Information (concluded) | | |
|
| BlackRock Privacy Principles |
BlackRock is committed to maintaining the privacy of its current and former fund investors and individual clients (collectively, “Clients”) and to safeguarding their non-public personal information. The following information is provided to help you understand what personal information BlackRock collects, how we protect that information and why in certain cases we share such information with select parties.
If you are located in a jurisdiction where specific laws, rules or regulations require BlackRock to provide you with additional or different privacy-related rights beyond what is set forth below, then BlackRock will comply with those specific laws, rules or regulations.
BlackRock obtains or verifies personal non-public information from and about you from different sources, including the following: (i) information we receive from you or, if applicable, your financial intermediary, on applications, forms or other documents; (ii) information about your transactions with us, our affiliates, or others; (iii) information we receive from a consumer reporting agency; and (iv) from visits to our websites.
BlackRock does not sell or disclose to non-affiliated third parties any non-public personal information about its Clients, except as permitted by law or as is necessary to respond to regulatory requests or to service Client accounts. These non-affiliated third parties are required to protect the confidentiality and security of this information and to use it only for its intended purpose.
We may share information with our affiliates to service your account or to provide you with information about other BlackRock products or services that may be of interest to you. In addition, BlackRock restricts access to non-public personal information about its Clients to those BlackRock employees with a legitimate business need for the information. BlackRock maintains physical, electronic and procedural safeguards that are designed to protect the non-public personal information of its Clients, including procedures relating to the proper storage and disposal of such information.
| | | | | | |
| | | BLACKROCK MANAGED VOLATILITY PORTFOLIO | | MARCH 31, 2015 | | 57 |
This report is intended for current holders. It is not authorized for use as an offer of sale or a solicitation of an offer to buy shares of the Fund unless preceded or accompanied by the Fund’s current prospectus. Past performance results shown in this report should not be considered a representation of future performance. Investment returns and principal value of shares will fluctuate so that shares, when redeemed, may be worth more or less than their original cost. Statements and other information herein are as dated and are subject to change.

| | |
| |
MV-3/15-SAR | |  |
| | |
| Item 2 – | | Code of Ethics – Not Applicable to this semi-annual report |
| |
| Item 3 – | | Audit Committee Financial Expert – Not Applicable to this semi-annual report |
| |
| Item 4 – | | Principal Accountant Fees and Services – Not Applicable to this semi-annual report |
| |
| Item 5 – | | Audit Committee of Listed Registrants – Not Applicable |
| |
| Item 6 – | | Investments |
| | (a) The registrant’s Schedule of Investments is included as part of the Report to Stockholders filed under Item 1 of this Form. |
| | (b) Not Applicable due to no such divestments during the semi-annual period covered since the previous
Form N-CSR filing. |
| |
| Item 7 – | | Disclosure of Proxy Voting Policies and Procedures for Closed-End Management Investment Companies – Not Applicable |
| |
| Item 8 – | | Portfolio Managers of Closed-End Management Investment Companies – Not Applicable |
| |
| Item 9 – | | Purchases of Equity Securities by Closed-End Management Investment Company and Affiliated Purchasers – Not Applicable |
| |
| Item 10 – | | Submission of Matters to a Vote of Security Holders –There have been no material changes to these procedures. |
| |
| Item 11 – | | Controls and Procedures |
| |
| | (a) – The registrant’s principal executive and principal financial officers, or persons performing similar functions, have concluded that the registrant’s disclosure controls and procedures (as defined in Rule 30a-3(c) under the Investment Company Act of 1940, as amended (the “1940 Act”)) are effective as of a date within 90 days of the filing of this report based on the evaluation of these controls and procedures required by
Rule 30a-3(b) under the 1940 Act and Rule 15d-15(b) under the Securities Exchange Act of 1934, as amended. |
| |
| | (b) – There were no changes in the registrant’s internal control over financial reporting (as defined in
Rule 30a-3(d) under the 1940 Act) that occurred during the second fiscal quarter of the period covered by this report that have materially affected, or are reasonably likely to materially affect, the registrant’s internal control over financial reporting. |
| |
| Item 12 – | | Exhibits attached hereto |
| |
| | (a)(1) – Code of Ethics – Not Applicable to this semi-annual report |
| |
| | (a)(2) – Certifications – Attached hereto |
| |
| | (a)(3) – Not Applicable |
| |
| | (b) – Certifications – Attached hereto |
2
Pursuant to the requirements of the Securities Exchange Act of 1934 and the Investment Company Act of 1940, the registrant has duly caused this report to be signed on its behalf by the undersigned, thereunto duly authorized.
BlackRock Funds
| | | | |
| By: | | /s/ John M. Perlowski | | |
| | John M. Perlowski | | |
| | Chief Executive Officer (principal executive officer) of | | |
| | BlackRock Funds | | |
| |
| Date: June 2, 2015 | | |
Pursuant to the requirements of the Securities Exchange Act of 1934 and the Investment Company Act of 1940, this report has been signed below by the following persons on behalf of the registrant and in the capacities and on the dates indicated.
| | | | |
| By: | | /s/ John M. Perlowski | | |
| | John M. Perlowski | | |
| | Chief Executive Officer (principal executive officer) of | | |
| | BlackRock Funds | | |
| |
| Date: June 2, 2015 | | |
| | |
| By: | | /s/ Neal J. Andrews | | |
| | Neal J. Andrews | | |
| | Chief Financial Officer (principal financial officer) of | | |
| | BlackRock Funds | | |
Date: June 2, 2015
3