Filed pursuant to Rule 424(b)(3)
File No. 333-179641
GRANT PARK FUTURES FUND
LIMITED PARTNERSHIP
________________________________________________
Supplement dated December 1, 2012
to
Prospectus and Disclosure Document
dated April 30, 2012
________________________________________________
THIS SUPPLEMENT CONTAINS INFORMATION WHICH AMENDS, SUPPLEMENTS OR MODIFIES CERTAIN INFORMATION CONTAINED IN THE PROSPECTUS AND DISCLOSURE DOCUMENT OF THE GRANT PARK FUTURES FUND LIMITED PARTNERSHIP DATED APRIL 30, 2012, AND SHOULD BE READ TOGETHER THEREWITH.
YOU SHOULD CAREFULLY CONSIDER THE “RISK FACTORS” BEGINNING ON PAGE 20 OF THE PROSPECTUS BEFORE YOU DECIDE TO INVEST.
NEITHER THE SECURITIES AND EXCHANGE COMMISSION NOR ANY STATE SECURITIES COMMISSION HAS APPROVED OR DISAPPROVED OF THESE SECURITIES OR PASSED UPON THE ACCURACY OR ADEQUACY OF THIS PROSPECTUS SUPPLEMENT. ANY REPRESENTATION TO THE CONTRARY IS A CRIMINAL OFFENSE.
THE COMMODITY FUTURES TRADING COMMISSION HAS NOT PASSED UPON THE MERITS OF PARTICIPATING IN THIS POOL NOR HAS THE COMMISSION PASSED ON THE ADEQUACY OR ACCURACY OF THIS DISCLOSURE DOCUMENT SUPPLEMENT.
SUMMARY
This supplement revises and replaces the second paragraph on page 2 of the Prospectus under the heading “SUMMARY—Legacy 1 Class and Legacy 2 Class Units” in its entirety as follows:
Effective November 1, 2012, through their respective trading companies, each of Rabar Market Research, Inc., EMC Capital Management, Inc., Eckhardt Trading Company, or ETC, Winton Capital Management Limited, Transtrend B.V., Sunrise Partners, LLC, Amplitude Capital International Limited, Quantitative Investment Management, LLC, or QIM, Alder Capital Limited, Denali Asset Management, LLLP, and Lynx Asset Management AB, or Lynx serve as Grant Park’s commodity trading advisors with respect to the Legacy 1 Class and Legacy 2 Class units. The trading advisors and their respective asset allocations with respect to the Legacy 1 Class and Legacy 2 Class units are the same as with respect to the fund’s Class A and Class B units. Effective November 1, 2012, with respect to the Class A and Class B units and the Legacy 1 Class and Legacy 2 Class, each of Amplitude, Transtrend, Winton, Rabar, EMC, ETC, QIM, Sunrise, Alder, Denali and Lynx manage between 5% to 20% of Grant Park’s net assets. As of November 1, 2012, Grant Park no longer trades through Welton Investment Corporation or Global Advisors Jersey Limited.
This supplement revises and replaces the fourth paragraph on page 2 of the Prospectus under the heading “SUMMARY—Global 1 Class, Global 2 Class and Global 3 Class” in its entirety as follows:
Effective November 1, 2012, through their respective trading companies, each of Rabar, EMC, ETC, Winton, Transtrend, QIM, Sunrise, Amplitude, Alder, Denali, and Lynx serve as Grant Park’s commodity trading advisors with respect to the Global 1 Class, Global 2 Class and Global 3 Class units. Effective November 1, 2012, with respect to the Global 1 Class, Global 2 Class and Global 3 Class units, each of Rabar, EMC, ETC, Winton, Transtrend, QIM, Sunrise, Amplitude, Alder, Denali, and Lynx manage between 5% to 20% of Grant Park’s net assets. As of November 1, 2012, Grant Park no longer trades through Welton Investment Corporation or Global Advisors Jersey Limited.
This supplement revises and replaces the second paragraph on page 5 of the Prospectus under the heading “SUMMARY—Plan of Distribution—What is the difference between Legacy 1 Class, the Legacy 2 Class, the Global 1 Class, the Global 2 Class and the Global 3 Class Units” in its entirety as follows:
Effective November 1, 2012, the trading advisors for the Legacy 1 Class and Legacy 2 Class units are Rabar, EMC , ETC, Winton, Transtrend, QIM, Sunrise, Amplitude, Alder, Denali, and Lynx. The trading advisors, asset allocations and trading philosophy with respect to the Legacy 1 Class and Legacy 2 Class units are the same as those utilized for Grant Park’s Class A and Class B units. Effective November 1, 2012, the trading advisors for the Global 1 Class, Global 2 Class and Global 3 Class units are Rabar, EMC, ETC, Winton, Transtrend, QIM, Sunrise, Amplitude, Alder, Denali, and Lynx. The investment process is uniquely managed for each class of units. As of November 1, 2012, Grant Park no longer trades through Welton Investment Corporation or Global Advisors Jersey Limited.
This supplement revises and replaces the text on page 3 of the Prospectus under the heading “SUMMARY—Breakeven Amounts for Each Class of Units” in its entirety as follows:
The following summarizes the approximate dollar returns and percentage returns required for the redemption value of a hypothetical $1,000 initial investment in offered units to equal the amount invested 12 months after the investment was made. The breakeven summary for the Global 3 Class units shows the amount required to “break-even” both with and without an early redemption fee which, for purposes of this summary, has been averaged to approximate the effect that payment of an early redemption fee will have on redemption of such units during the first year of investment.
| · | Legacy 1 Class: 5.58% (or $55.82). |
| · | Legacy 2 Class: 5.90% (or $58.98). |
| · | Global 1 Class: 4.91% (or $49.07). |
| · | Global 2 Class: 5.22% (or $52.15). |
| · | Global 3 Class: 7.42% (or $74.19) without average early redemption fee, or 8.92% (or $89.19) with average early redemption fee. |
See “Summary – Breakeven Analysis” beginning on page 12 for detailed breakeven analysis of the offered units.
This supplement revises and replaces the Breakeven Analysis tables on page 13-18 of the Prospectus under the heading “SUMMARY—Breakeven Analysis” in its entirety as follows:
| Legacy 1 Class Breakeven Analysis | | Legacy 1 Class Units | |
Assumed initial selling price per unit(1) | | $ | 1,000.00 | |
Trading advisors’ incentive fees(2) | | $ | 5.32 | |
Brokerage charge(3) (5.00%) | | $ | 50.00 | |
Operating expenses(4) (0.25%) | | $ | 2.50 | |
Offering expenses(5) (0.30%) | | $ | 3.00 | |
Interest income(6) (0.50%) | | $ | (5.00 | ) |
| Amount of trading income required for the redemption value at the end of one year to equal the initial selling price of the unit | | $ | 55.82 | |
| Percentage of initial selling price per Legacy 1 Class unit | | | 5.58 | % |
(1) The minimum investment required to invest in the Legacy 1 Class units is $10,000. For ease of comparability, $1,000 will be deemed to be the assumed selling price per unit of a Legacy 1 Class unit, and, as described below, a Legacy 2 Class unit, a Global 1 Class unit, a Global 2 Class unit and a Global 3 Class unit, for purposes of the breakeven analysis.
(2) Reflects incentive fees payable to Amplitude, EMC, ETC, Rabar, Winton, Transtrend, QIM, Sunrise, Alder, Denali, and Lynx assuming they manage between 5% and 20% of invested assets and assuming each of the advisors have equivalent performance returns for the 12-month period. Actual incentive fees are calculated quarterly or semi-annually on the basis of each trading advisor’s individual performance, not the overall performance of Grant Park or the Legacy 1 Class units. Because incentive fees payable to certain of these trading advisors are calculated on the basis of trading profits realized on the assets they manage after deduction for the allocable portion of only certain expenses charged to Grant Park, these advisors would receive an incentive fee before Grant Park has recouped all expenses and reaches the “break-even” level. Incentive fees payable to certain other of these trading advisors are calculated after deduction for the allocable portion of expenses charged to Grant Park. These advisors would not receive an incentive fee before Grant Park has recouped all expenses.
(3) The brokerage charge is paid to the general partner on a monthly basis. Effective the initial closing date, the brokerage charge for the Legacy 1 Class units equals 0.4167 % per month, a rate of 5.00% annually, of such units’ month-end adjusted net assets. Out of this amount, the general partner pays all clearing, execution and give-up, floor brokerage, exchange and NFA fees, any other transaction costs, selling agent compensation, selling agent service fees and consulting fees to the trading advisors. The general partner retains the balance as payment for its services to Grant Park. Bid-ask spreads on Grant Park’s forward and other non-exchange traded contracts are not included in this breakeven table due to the difficulty of determining those spreads.
(4) Grant Park is responsible for ongoing operating expenses, up to an amount not to exceed 0.25% of Grant Park’s average net assets per year. This amount is used for purposes of this breakeven analysis.
(5) Grant Park’s organization and offering expenses are paid by the general partner and then reimbursed to the general partner by Grant Park. To pay this reimbursement, effective the initial closing date, Legacy 1 Class units are assessed at an annual rate of 30 basis points (0.30%) of adjusted net assets, calculated and payable monthly on the basis of month-end adjusted net assets of the applicable class.
(6) Grant Park earns interest on free cash balances held in its futures trading accounts. Interest is estimated for these purposes at a rate of 0. 0.50% per year.
| Legacy 2 Class Breakeven Analysis | | Legacy 2 Class Units | |
Assumed initial selling price per unit(1) | | $ | 1,000.00 | |
Trading advisors’ incentive fees(2) | | $ | 5.98 | |
Brokerage charge(3) (5.25%) | | $ | 52.50 | |
Operating expenses(4) (0.25%) | | $ | 2.50 | |
Offering expenses(5) (0.30%) | | $ | 3.00 | |
Interest income(6) (0.0.50%) �� | | $ | (5.00 | ) |
| Amount of trading income required for the redemption value at the end of one year to equal the initial selling price of the unit | | $ | 58.98 | |
| Percentage of initial selling price per Legacy 2 Class unit | | | 5.90 | % |
(1) The minimum investment required to invest in the Legacy 2 Class units is $10,000. For ease of comparability, $1,000 will be deemed to be the assumed selling price per unit of a Legacy 2 Class unit, and, as described above, a Legacy 1 Class unit, and, as described below, a Global 1 Class unit, a Global 2 Class unit and a Global 3 Class unit, for purposes of the breakeven analysis.
(2) Reflects incentive fees payable to Amplitude, EMC, ETC, Rabar, Winton, Transtrend, QIM, Sunrise, Alder, Denali, and Lynx assuming they manage between 5% and 20% of invested assets and assuming each of the advisors have equivalent performance returns for the 12-month period. Actual incentive fees are calculated quarterly or semi-annually on the basis of each trading advisor’s individual performance, not the overall performance of Grant Park or the Legacy 1 Class units. Because incentive fees payable to certain of these trading advisors are calculated on the basis of trading profits realized on the assets they manage after deduction for the allocable portion of only certain expenses charged to Grant Park, these advisors would receive an incentive fee before Grant Park has recouped all expenses and reaches the “break-even” level. Incentive fees payable to certain other of these trading advisors are calculated after deduction for the allocable portion of expenses charged to Grant Park. These advisors would not receive an incentive fee before Grant Park has recouped all expenses.
(3) The brokerage charge is paid to the general partner on a monthly basis. Effective the initial closing date, the brokerage charge for the Legacy 2 Class units equals 0.4375% per month, a rate of 5.25% annually, of such units’ month-end adjusted net assets. Out of this amount, the general partner pays all clearing, execution and give-up, floor brokerage, exchange and NFA fees, any other transaction costs, selling agent compensation, selling agent service fees and consulting fees to the trading advisors. The general partner retains the balance as payment for its services to Grant Park. Bid-ask spreads on Grant Park’s forward and other non-exchange traded contracts are not included in this breakeven table due to the difficulty of determining those spreads.
(4) Grant Park is responsible for ongoing operating expenses, up to an amount not to exceed 0.25% of Grant Park’s average net assets per year. This amount is used for purposes of this breakeven analysis.
(5) Grant Park’s organization and offering expenses are paid by the general partner and then reimbursed to the general partner by Grant Park. To pay this reimbursement, effective the initial closing date, Legacy 2 Class units are assessed at an annual rate of 30 basis points (0.30%) of adjusted net assets, calculated and payable monthly on the basis of month-end adjusted net assets of the applicable class.
(6) Grant Park earns interest on free cash balances held in its futures trading accounts. Interest is estimated for these purposes at a rate of 0. 0.50% per year.
| Global 1 Class Breakeven Analysis | | Global 1 Class Units | |
Assumed initial selling price per unit(1) | | $ | 1,000.00 | |
Trading advisors’ incentive fees(2) | | $ | 4.07 | |
Brokerage charge(3) (4.45%) | | $ | 44.50 | |
Operating expenses(4) (0.25%) | | $ | 2.50 | |
Offering expenses(5) (0.30%) | | $ | 3.00 | |
Interest income(6) (0. 0.50%) | | $ | (5.00 | ) |
| Amount of trading income required for the redemption value at the end of one year to equal the initial selling price of the unit | | $ | 49.07 | |
| Percentage of initial selling price per Global 1 Class unit | | | 4.91 | % |
(1) The minimum investment required to invest in the Global 1 Class units is $5,000. For ease of comparability, $1,000 will be deemed to be the assumed selling price per unit of a Global 1 Class unit, and, as described above, a Legacy 1 Class unit and a Legacy 2 Class unit, and, as described below, a Global 2 Class unit and a Global 3 Class unit, for purposes of the breakeven analysis.
(2) Reflects incentive fees payable to Amplitude, Rabar, EMC, ETC, Winton, Transtrend, QIM, Sunrise, Alder, Denali, and Lynx assuming they manage between 5% and 20% of invested assets and assuming each of the advisors have equivalent performance returns for the 12-month period. Actual incentive fees are calculated quarterly on the basis of each trading advisor’s individual performance, not the overall performance of Grant Park or the Global 1 Class units. Because incentive fees payable to certain of these trading advisors are calculated on the basis of trading profits realized on the assets they manage after deduction for the allocable portion of only certain expenses charged to Grant Park, these advisors would receive an incentive fee before Grant Park has recouped all expenses and reaches the “break-even” level. Incentive fees payable to certain other of these trading advisors are calculated after deduction for the allocable portion of expenses charged to Grant Park. These advisors would not receive an incentive fee before Grant Park has recouped all expenses.
(3) The brokerage charge is paid to the general partner on a monthly basis. Effective the initial closing date, the brokerage charge for the Global 1 Class units equals 0.3708% per month, a rate of 4.45% annually, of such units’ month-end adjusted net assets. Out of this amount, the general partner pays all clearing, execution and give-up, floor brokerage, exchange and NFA fees, any other transaction costs, selling agent compensation, selling agent service fees and consulting fees to the trading advisors. The general partner retains the balance as payment for its services to Grant Park. Bid-ask spreads on Grant Park’s forward and other non-exchange traded contracts are not included in this breakeven table due to the difficulty of determining those spreads.
(4) Grant Park is responsible for ongoing operating expenses, up to an amount not to exceed 0.25% of Grant Park’s average net assets per year. This amount is used for purposes of this breakeven analysis.
(5) Grant Park’s organization and offering expenses are paid by the general partner and then reimbursed to the general partner by Grant Park. To pay this reimbursement, effective the initial closing date, Global 1 Class units are assessed at an annual rate of 30 basis points (0.30%) of adjusted net assets, calculated and payable monthly on the basis of month-end adjusted net assets of the applicable class.
(6) Grant Park earns interest on free cash balances held in its futures trading accounts. Interest is estimated for these purposes at a rate of 0. 0.50per year.
| Global 2 Class Breakeven Analysis | | Global 2 Class Units | |
Assumed initial selling price per unit(1) | | $ | 1,000.00 | |
Trading advisors’ incentive fees(2) | | $ | 4.65 | |
Brokerage charge(3) (4.70%) | | $ | 47.00 | |
Operating expenses(4) (0.25%) | | $ | 2.50 | |
Offering expenses(5) (0.30%) | | $ | 3.00 | |
Interest income(6) (0. 0.50%) | | $ | (5.00 | ) |
| Amount of trading income required for the redemption value at the end of one year to equal the initial selling price of the unit | | $ | 52.15 | |
| Percentage of initial selling price per Global 2 Class unit | | | 5.22 | % |
(1) The minimum investment required to invest in the Global 2 Class units is $5,000. For ease of comparability, $1,000 will be deemed to be the assumed selling price per unit of a Global 2 Class unit, and, as described above, a Legacy 1 Class unit, a Legacy 2 Class unit and a Global 1 Class unit, and, as described below, a Global 3 Class unit, for purposes of the breakeven analysis.
(2) Reflects incentive fees payable to Amplitude, Rabar, EMC, ETC, Winton, Transtrend, QIM, Sunrise, Alder, Denali, and Lynx assuming they manage between 5% and 20% of invested assets and assuming each of the advisors have equivalent performance returns for the 12-month period. Actual incentive fees are calculated quarterly or semi-annually on the basis of each trading advisor’s individual performance, not the overall performance of Grant Park or the Global 2 Class units. Because incentive fees payable to certain of these trading advisors are calculated on the basis of trading profits realized on the assets they manage after deduction for the allocable portion of only certain expenses charged to Grant Park, these advisors would receive an incentive fee before Grant Park has recouped all expenses and reaches the “break-even” level. Incentive fees payable to certain other of these trading advisors are calculated after deduction for the allocable portion of expenses charged to Grant Park. These advisors would not receive an incentive fee before Grant Park has recouped all expenses.
(3) The brokerage charge is paid to the general partner on a monthly basis. Effective the initial closing date, the brokerage charge for the Global 2 Class units equals 0.3917% per month, a rate of 4.70% annually, of such units’ month-end adjusted net assets. Out of this amount, the general partner pays all clearing, execution and give-up, floor brokerage, exchange and NFA fees, any other transaction costs, selling agent compensation, selling agent service fees and consulting fees to the trading advisors. The general partner retains the balance as payment for its services to Grant Park. Bid-ask spreads on Grant Park’s forward and other non-exchange traded contracts are not included in this breakeven table due to the difficulty of determining those spreads.
(4) Grant Park is responsible for ongoing operating expenses, up to an amount not to exceed 0.25% of Grant Park’s average net assets per year. This amount is used for purposes of this breakeven analysis.
(5) Grant Park’s organization and offering expenses are paid by the general partner and then reimbursed to the general partner by Grant Park. To pay this reimbursement, effective the initial closing date, Global 2 Class units are assessed at an annual rate of 30 basis points (0.30%) of adjusted net assets, calculated and payable monthly on the basis of month-end adjusted net assets of the applicable class.
(6) Grant Park earns interest on free cash balances held in its futures trading accounts. Interest is estimated for these purposes at a rate of 0. 0.50% per year.
Global 3 Class Breakeven Analysis
| | | Global 3 Class Units | |
Assumed initial selling price per unit(1) | | $ | 1,000.00 | |
Trading advisors’ incentive fees(2) | | $ | 9.19 | |
Brokerage charge(3) (6.45%) | | $ | 64.50 | |
Operating expenses(4) (0.25%) | | $ | 2.50 | |
Offering expenses(5) (0.30%) | | $ | 3.00 | |
Interest income(6) (0. 0.50%) | | $ | (5.00 | ) |
| | | | | |
| Amount of trading income required for the redemption value at the end of one year to | | | | |
| equal the initial selling price of the unit, without early redemption fee | | $ | 74.19 | |
| | | | | |
| Percentage of initial selling price per unit, without early redemption fee | | | 7.42 | % |
| Early redemption fee(7) (1.00%) | | $ | 15.00 | |
| | | | | |
| Amount of trading income required for the redemption value at the end of one year to | | | | |
| equal the initial selling price per Global 3 Class unit, with average early redemption fee | | $ | 89.19 | |
| | | | | |
| Percentage of initial selling price per Global 3 Class unit, with average early redemption fee | | | 8.92 | % |
(1) The minimum investment required to invest in the Global 3 Class units is $5,000. For ease of comparability, $1,000 will be deemed to be the assumed selling price per unit of a Global 3 Class unit, and, as described above, a Legacy 1 Class unit, a Legacy 2 Class unit and a Global 1 Class unit, and a Global 2 Class unit, for purposes of the breakeven analysis.
(2) Reflects incentive fees payable to Amplitude, Rabar, EMC, ETC, Winton, Transtrend, QIM, Sunrise, Alder, Denali, and Lynx assuming they manage between 5% and 20% of invested assets and assuming each of the advisors have equivalent performance returns for the 12-month period. Actual incentive fees are calculated quarterly or semi-annually on the basis of each trading advisor’s individual performance, not the overall performance of Grant Park or the Global 3 Class units. Because incentive fees payable to certain of these trading advisors are calculated on the basis of trading profits realized on the assets they manage after deduction for the allocable portion of only certain expenses charged to Grant Park, these advisors would receive an incentive fee before Grant Park has recouped all expenses and reaches the “break-even” level. Incentive fees payable to certain other of these trading advisors are calculated after deduction for the allocable portion of expenses charged to Grant Park. These advisors would not receive an incentive fee before Grant Park has recouped all expenses.
(3) The brokerage charge is paid to the general partner on a monthly basis. Effective the initial closing date, the brokerage charge for the Global 3 Class units equals 0.5375% per month, a rate of 6.45% annually, of such units’ month-end adjusted net assets. Out of this amount, the general partner pays all clearing, execution and give-up, floor brokerage, exchange and NFA fees, any other transaction costs, selling agent compensation, selling agent service fees and consulting fees to the trading advisors. The general partner retains the balance as payment for its services to Grant Park. Bid-ask spreads on Grant Park’s forward and other non-exchange traded contracts are not included in this breakeven table due to the difficulty of determining those spreads.
(4) Grant Park is responsible for ongoing operating expenses, up to an amount not to exceed 0.25% of Grant Park’s average net assets per year. This amount is used for purposes of this breakeven analysis.
(5) Grant Park’s organization and offering expenses are paid by the general partner and then reimbursed to the general partner by Grant Park. To pay this reimbursement, effective the initial
closing date, Global 3 Class units are assessed at an annual rate of 30 basis points (0.30%) of adjusted net assets, calculated and payable monthly on the basis of month-end adjusted net assets of the applicable class.
(6) Grant Park earns interest on free cash balances held in its futures trading accounts. Interest is estimated for these purposes at a rate of 0. 0.50% per year.
(7) Global 3 Class limited partners are prohibited from redeeming such units for three months following the subscription for units. Thereafter, Global 3 Class limited partners causing redemption of their units on or before the one-year anniversary of their subscription for the redeemed units will pay an early redemption fee of 1.5%, 1.0% or 0.5% of the net asset value of the redeemed units, depending on when the units are redeemed during the first year. For purposes of this breakeven analysis, the early redemption fee has been presented as an average of the three different early redemption fees to approximate the effect a payment of an early redemption fee would have on a redemption of Global 3 Class units at an undetermined point during the first year of investment. Because the early redemption fee has been averaged and the other fees and expenses shown assume an investment in Grant Park for one year, the breakeven analysis does not reflect the actual amount required to “break-even” for Global 3 Class units that are redeemed prior to the one-year anniversary of the investment, which will vary depending on the date of redemption.
This supplement revises and replaces the first and second paragraphs on page 8-9 of the Prospectus under the heading “SUMMARY—The Trading Advisors” in its entirety as follows:
Effective November 1, 2012, Grant Park trades through its eleven independent professional commodity trading advisors: Rabar Market Research, Inc., EMC Capital Management, Inc., Eckhardt Trading Company (or ETC), Winton Capital Management Limited, Transtrend B.V., Quantitative Investment Management LLC (or QIM), Sunrise Capital Partners, LLC, Amplitude Capital International Limited, Alder Capital Limited, Denali Asset Management, LLLP, and Lynx Asset Management AB. Each of the trading advisors is registered as a commodity trading advisor under the Commodity Exchange Act and is a member of the NFA. The general partner may terminate or replace any or all of the trading advisors, or add additional trading advisors, at any time in its sole discretion. As of November 1, 2012, Grant Park no longer trades through Welton Investment Corporation or Global Advisors Jersey Limited.
Rabar Market Research, Inc. is located at 10 Bank Street, Suite 830, White Plains, New York 10606, and its telephone number is (914) 682-8363. EMC Capital Management, Inc. is located at 2201 Waukegan Road, Suite 240 West, Bannockburn, Illinois 60015, and its telephone number is (847) 267-8700. ETC is located at 1314 North Dearborn Parkway, Carriage House, Chicago, Illinois 60610, and its telephone number is (312) 787-1107. Winton Capital Management Limited is located at 1-5 St. Mary Abbott’s Place, London, W8 6LS, United Kingdom, and its telephone number is +44-20-7610-5350. The business office of Transtrend B.V. is located at Weena 723, Unit C5.070, 3013 AM Rotterdam, The Netherlands and its telephone number is +31-10-453-6500. QIM is located at 401 East Market Street, Suite 104, Charlottesville, Virginia 22902, and its telephone number is (434) 817-4800. Sunrise Capital Partners, LLC is located at 12544 High Bluff Drive, Suite 400, San Diego, California 92130, and its telephone number is (858) 259-8911. Amplitude Capital International Limited is located at Grand Pavilion Commercial Centre, 1st Floor, 802 West Bay Road, P.O. Box 31855, KY1 1207 Cayman Islands, and its telephone number is (345) 943-2295. Alder Capital Limited is located at 61 Merrion Square, Dublin 2, Ireland, and its telephone number is +353-1-614-7232. Denali Asset Management, LLLP is located at 5020 Anchor Way, 2nd Floor, Christiansted, Virgin Islands 00826-4633, and its telephone number is (340) 778-7744. Lynx Asset Management AB is located at Norrmalmstorg 12, Box 7060, Stockholm, Sweden, SE-103 86 and its telephone number is +46-8-663-3360.
This supplement revises and replaces the paragraph titled, “Incentive Fees,” on page 11 of the Prospectus under the heading “SUMMARY—Fees and Expenses—Incentive Fees” in its entirety as follows:
Incentive Fees—Grant Park currently pays each trading advisor a quarterly or semi-annual incentive fee based on any new trading profits achieved on the trading advisor’s allocated net assets at the end of each calendar quarter or semi-annual period. Generally, new trading profits means the net increase in trading profits, realized and unrealized, experienced by the trading advisor on its allocated net assets from the most recent prior period in which an incentive fee was paid to the trading advisor, or if an incentive fee has yet to be paid to that trading advisor, the trading advisor’s initial allocation of net assets. Effective October 1, 2012, the incentive fees payable to each of Grant Park’s trading advisors are as follows: 20.0% to Rabar, 22.5% to EMC, 24.0% to ETC, 20.0% to Winton, 22.5% to Transtrend, 26.0% to QIM, 23.5% to Amplitude, 22.0% to Alder, and 24.0% to Denali. Effective November 1, 2012, the incentive fees payable to Lynx are 23%. Currently, Sunrise’s incentive fee is 23.5% but effective January 1, 2013, the incentive fees payable to Sunrise will be 20.0%. The method of calculating new trading profits on the allocated net assets of each trading advisor is described in “FEES AND EXPENSES—Fees and Expenses Paid by Grant Park—Incentive Fees.”
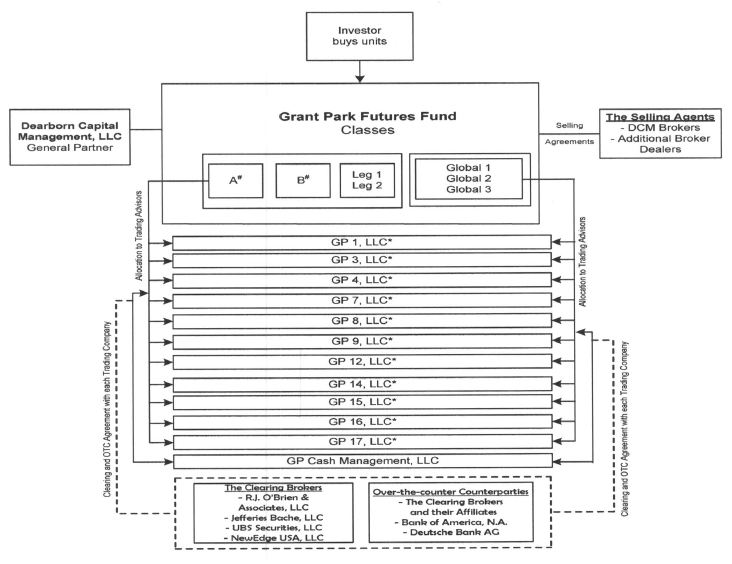
This supplement revises and replaces the chart included on page 19 of the Prospectus under the heading “SUMMARY—Organizational Chart” in its entirety as follows:
Notes:
# Classes A and B are closed to new investment. These classes are no longer offered by the Selling Agents.
* Grant Park invests through an individual trading company for each trading advisor. An Advisory Agreement is entered by each trading advisor, its corresponding trading company, Dearborn Capital Management, L.L.C., as general partner, and, in the case of some trading advisors, Grant Park.
RISK FACTORS
This supplement revises and replaces the first paragraph on page 30 of the Prospectus under the heading “RISK FACTORS—Operating Risks—The general partner places significant reliance on the trading advisors and their key personnel.” in its entirety as follows:
The general partner relies on the trading advisors to achieve trading gains for Grant Park, allocating to each of them responsibility for, and discretion over, trading of their allocated portions of Grant Park’s assets. The trading advisors, in turn, are dependent on the services of a limited number of persons to develop and refine their trading approaches and strategies and execute Grant Park’s transactions. The loss of the services of any trading advisor’s principals or key employees, or the failure of those principals or key employees to function effectively as a team, may have an adverse effect on that trading advisor’s ability to manage its trading activities successfully or may cause the trading advisor to cease operations entirely, either of which, in turn, could negatively impact Grant Park’s performance. Each of Grant Park’s trading advisors is controlled, directly or indirectly, by one or more individuals, or, in the case of Transtrend, of which 100% of the voting interest is owned by Robeco Netherlands BV, by its managing directors. These individuals are: Paul Rabar at Rabar, Elizabeth Cheval at EMC, William Eckhardt at ETC, David Winton Harding at Winton, Johannes P.A. van den Broek and Harold M. De Boer at Transtrend, Jaffrey Woodriff, Michael Geismar and Ryan Vaughan at QIM, Dr. Gary B. Davis at Sunrise, Karsten Schroeder at Amplitude, Mark Caslin at Alder, Scott T. Ramsey at Denali, Jonas Bengtsson, Svante Bergstrom, and Martin Sandquist at Lynx. The death, incapacity or other prolonged unavailability of such individuals likely would greatly hinder these trading advisors’ operations, and could result in their ceasing operations entirely, which could adversely affect the value of your investment in Grant Park.
THE TRADING ADVISORS
This supplement revises and replaces the first five paragraphs and the chart on pages 40-41 of the Prospectus under the heading “THE TRADING ADVISORS” in its entirety as follows:
Effective November 1, 2012, the general partner has retained Rabar Market Research, Inc., EMC Capital Management, Inc., Eckhardt Trading Company, or ETC, Transtrend B.V., Quantitative Investment Management LLC, or QIM, Winton Capital Management Limited, Sunrise Capital Partners, LLC, Amplitude Capital International Limited, Alder Capital Limited, Denali Asset Management, LLLP, and Lynx Asset Management AB as Grant Park’s trading advisors. As of November 1, 2012, Grant Park no longer trades through Welton Investment Corporation or Global Advisors Jersey Limited. The table below illustrates the trading advisors for each class of Grant Park’s outstanding limited partnership units:
| | | | | | | | | | | | |
Class A | X | X | X | X | X | X | X | X | X | X | X |
Class B | X | X | X | X | X | X | X | X | X | X | X |
Legacy 1 | X | X | X | X | X | X | X | X | X | X | X |
Legacy 2 | X | X | X | X | X | X | X | X | X | X | X |
Global 1 | X | X | X | X | X | X | X | X | X | X | X |
Global 2 | X | X | X | X | X | X | X | X | X | X | X |
Global 3 | X | X | X | X | X | X | X | X | X | X | X |
The trading advisors and their respective asset allocations with respect to the Legacy 1 Class and the Legacy 2 Class units are the same as with respect to the Class A and Class B units. Effective November 1, 2012, with respect to the Class A and Class B units and the Legacy 1 Class and Legacy 2 Class, each of Amplitude, Transtrend, Winton, Rabar, EMC, ETC, QIM, Sunrise, Alder, Denali, and Lynx manage between 5% to 20% of Grant Park’s net assets.
Effective November 1, 2012, for the Global 1 Class, Global 2 Class and Global 3 Class units, between 5% to 20% of Grant Park’s assets are allocated to each of Rabar, EMC, ETC, Winton, Transtrend, QIM, Sunrise, Amplitude, Alder, Denali, and Lynx.
The general partner may, in its sole discretion, reallocate assets among the trading advisors upon termination of a trading advisor or retention of any new trading advisors, or at the commencement of any month. Consequently, the allocation for all classes of units is subject to change.
Rabar and EMC have been trading on behalf of Grant Park since January 1989 and ETC has been trading on behalf of Grant Park since April 1998. Winton began trading for Grant Park on August 1, 2004. Transtrend began trading on July 1, 2008, QIM began trading for Grant Park on October 1, 2008. As of January 1, 2010, Sunrise began trading for Grant Park and as of February 1, 2010, Amplitude began trading on behalf of Grant Park as well. Alder and Denali each began trading for Grant Park on February 1, 2011. Effective November 1, 2012, Lynx will begin trading for Grant Park. The general partner may, in its sole discretion, reallocate assets among the trading advisors upon termination of a trading advisor or retention of any new trading advisors, or at the commencement of any month. Consequently, the current apportionment is subject to change.
This supplement revises and replaces the third paragraph on pages 42-43 of the Prospectus under the heading “THE TRADING ADVISORS-Rabar Market Research, Inc-Management” in its entirety as follows:
Jeffrey Izenman is the executive vice president of Rabar, having joined Rabar in that capacity in November 1998. Additionally, Mr. Izenman served as a managing member of BRI Partners LLC, a venture capital firm, between June 2001 and October 2012. He was a registered associated person and listed principal of BRI Partners LLC between June 2001 and October 2012. Mr. Izenman received his J.D. degree from the University of Michigan Law School in May 1982 and a B.S. in accountancy from the University of Illinois in May 1979. He has also passed the Uniform Certified Public Accountants exam. Mr. Izenman became a listed principal and associated person of Rabar in November 1998.
This supplement revises and replaces the ten paragraphs on pages 47 and 48 of the Prospectus under the heading “THE TRADING ADVISORS-Winton Capital Management Limited-Management” in its entirety as follows:
Management
The listed principals for Winton are David Winton Harding, Amal Osman Ali Murgian, Martin John Hunt, Anthony Daniell, Matthew D. Beddall, Rajeev Patel, Tony Fenner-Leitao, and Jeremy Dawson. Nicola Malhotra is a principal of Winton who is currently pending CFTC listing and NFA registration.
David Winton Harding founded Winton Capital Management Limited in February 1997, and is the firm’s managing director. Mr. Harding ultimately oversees all critical functions performed at Winton. Mr. Harding graduated from Cambridge University with a first class honors degree in 1982. Mr. Harding became a listed principal and associated person of Winton in January 1998.
Amal Osman Ali Murgian was appointed a non-executive director of Winton Capital Management in July 2011. Ms. Amal Murgian does not take part in any trading or operational activities of Winton. Ms. Amal Murgian has a beneficial interest of more than 10% of Winton’s share capital. This interest is held by Samur Jersey Ltd. and Amur Jersey., both of which are investment holding companies ultimately owned by Ms. Amal Murgian’s family foundation. Ms. Amal Murgian has an MBA from the University of San Francisco in international finance and a B.S. in business administration and economics from Pepperdine University. Ms. Amal Murgian became a listed principal of Winton in August 2011.
Martin John Hunt is a founding director of the firm. Mr. Hunt supervises the trading operations and has responsibility for the firm’s regulatory compliance and finance. Mr. Hunt became a listed principal and associated person of Winton in January 1998.
Anthony Hamilton Daniell joined Winton in October 2004 and became a director in October 2006. Mr. Daniell is responsible for supervising Winton’s sales and marketing team. Mr. Daniell became an associated person and listed principal of Winton in April 2005 and October 2006, respectively.
Matthew Beddall was appointed to the main Board of Directors at Winton in December 2008. He was appointed Chief Investment Officer in December 2008. Mr. Beddall joined Winton as a researcher in July 2001. As CIO, Mr. Beddall’s responsibilities are principally focused on managing the investment process behind the Winton Futures Fund and overseeing a large section of the research department. Mr. Beddall is extensively involved in all aspects of Winton’s research process and has led the development of much of the software that underlies the design and running of Winton’s trading strategy. Mr. Beddall received a first class honors degree in mathematics and computer science from Southampton University. Mr. Beddall also has an M.Sc. in applied statistics from Birkbeck College, University of London. Mr. Beddall became a listed principal of Winton in January 2009. He became registered as an associated person of Winton in February 2009.
Rajeev Patel joined Winton in April 1997 as a trader and became Director of Trading and Operations in June 2009 and Winton’s Chief Operating Officer in November 2010. Mr. Patel is responsible for overseeing all aspects of trading and is responsible for operations software development, fund accounting and settlements. Mr. Patel holds a degree in economics and business administration from Trinity and All Saints College, Leeds. Mr. Patel became registered as an associated person and listed principal of Winton effective May 1998 and June 2009, respectively.
Tony Fenner-Leitao is the deputy Chief Executive Officer of Winton. He was appointed to this position in October 2012, after joining Winton in June 2008 and working in business development. Between March 2008 and May 2008, Mr. Fenner-Leitao was on sabbatical. Prior to joining Winton, Mr. Fenner-Leitao served as the Chief Financial Officer at TIMWE, a telecom company based in Portugal, between February 2007 and February 2008. Mr. Fenner-Leitao became a listed principal of Winton effective November 2012 and registered as an associated person of Winton in July 2008.
Jeremy Dawson is the Chief Financial Officer of Winton. He was appointed to this position when he joined Winton in January 2011. Prior to joining Winton, Mr. Dawson was employed by PricewaterhouseCoopers, serving as an Assurance Director between July 2003 and January 2011. Mr. Dawson became a listed principal of Winton effective December 2012.
Nicola Malhotra is the Chief Risk and Compliance Officer of Winton. She was appointed to this position in July 2011, after joining the firm in June 2007 as Risk Manager. Ms. Malhotra is responsible for the oversight of Winton’s Risk Management and Compliance department.
This supplement revises and replaces the six paragraphs on pages 52-53 of the Prospectus under the heading “THE TRADING ADVISORS-Transtrend B.V.-Management” in its entirety as follows:
Management
The listed principals of Transtrend are Johannes P.A. van den Broek, Harold M. De Boer, Mark H.A. Van Dongen, Andre P. Honig, Robeco Nederland B.V., and Simone Bot.
Johannes “Joep” P.A. van den Broek joined Transtrend as a trader in December of 1995. In October 1997, he was appointed Deputy Director (for Trading) thereby becoming a member of Transtrend’s management team. Effective as of January 1999, Mr. Van den Broek was appointed a Managing Director of Transtrend. Mr. Van den Broek graduated in August 1995 with a masters degree in business economics from Erasmus University Rotterdam. Mr. Van den Broek has been registered as an associated person of Transtrend since October 1998, and as a listed principal of Transtrend since January 1999, and has been a member of the NFA since July 1998.
Harold M. De Boer worked in conjunction with the predecessor of Transtrend for his thesis titled “Cointegration in Commodity Futures Markets” beginning in December 1989. In April of 1990, he joined the predecessor of Transtrend as a research analyst. In 1992 he became responsible for Transtrend’s research department, and as of October 1997, he became a member of Transtrend’s management team with the title of Deputy Director. Effective August 1999, he was appointed a Director of Transtrend, and effective March 2007 he assumed the role of a Managing Director of Transtrend. Mr. De Boer’s primary responsibility remains research and product development. Mr. De Boer graduated in 1990 with a masters degree in applied mathematics from Universiteit Twente in The Netherlands. Mr. De Boer has been listed as a principal of Transtrend since November 1999.
Mark H.A. Van Dongen joined Transtrend as a research analyst in July 1992 and was appointed Deputy Director (research and operations) in October 1997. Effective as of March 2007, Mr. Van Dongen was appointed an Executive Director of Transtrend. Mr. Van Dongen graduated in 1991 with a master degree in econometrics from the Catholic University of Brabant. Mr. Van Dongen has been registered as an associated person of Transtrend since August 1998, and has been a member of the NFA since July 1998. In addition, Mr. Van Dongen has been listed as a principal of Transtrend since March 2007.
Andre P. Honig joined Transtrend as Deputy Director Investor Relations In May 2004. Effective as of March 2007, Mr. Honig was appointed an Executive Director of Transtrend. Mr. Honig is responsible for overseeing Transtrend’s client relations and marketing functions. Mr. Honig graduated in 1991 with a masters degree in business econometrics from Erasmus University Rotterdam. Mr. Honig has been registered as an associated person of Transtrend since October 2004, and has been a member of the NFA since October 2004. In addition, Mr. Honig has been listed as a principal of Transtrend since March 2007.
Robeco Nederland B.V. has been a listed principal of Transtrend since July 2002.
Simone Bot joined Transtrend as the Chief Compliance Officer in January 2009. Prior to joining Transtrend, Mrs. Bot served as a senior controller and a compliance and control specialist at Robeco, a Dutch asset manager, from November 1997 until December 2008. Ms. Bot has been registered as an Associated Person of Transtrend since June 2010 and has been listed as a principal since September 2012.
This supplement revises and replaces the eighth paragraph on pages 59 of the Prospectus under the heading “THE TRADING ADVISORS-Amplitude Capital International Limited-Management” in its entirety as follows:
Gary Linford is a director of the Amplitude Dynamic Trading Fund, the Klassik Fund and the Sinfonie Fund, and a director and beneficiary shareholder of Amplitude Capital International Limited. He was appointed to this position in August 2009. Mr. Linford does not take part in any trading or operational activities of Amplitude nor does he actively market Amplitude’s services. Mr. Linford became registered as a listed principal of Amplitude effective January 2010. Mr. Linford also serves as a non-executive director of BFAM Asian Opportunities GP Limited and BFAM Asian Opportunities Master GP Limited as of May 2012. He became listed principal of BFAM Asian Opportunities GP Limited and BFAM Asian Opportunities Master GP Limited in October 2012. Both entities are registered with the NFA as exempt Commodity Pool Operators, and currently have registrations pending as Commodity Pool Operators with the NFA.
This supplement revises and updates the discussion in the Prospectus under the heading “The Trading Advisors” by removing the 14 paragraphs on pages 49 through 51 under the heading “Welton Investment Corporation” and the 10 paragraphs on pages 51 through 52 under the heading “Global Advisors Jersey Limited (Global Advisors)” in their entirety and by adding the following paragraphs on page 62 immediately following the last paragraph under the heading “Denali Asset Management, LLLP—Denali’s Trading Program”:
Lynx Asset Management AB
Lynx Asset Management AB is a Swedish limited liability corporation. Since the firm’s inception in April 2000, the main business of Lynx has been to manage the Lynx Programme and has been supervised by Finansinspektionen, the Swedish Financial Supervisory Authority. Lynx has been registered as a commodity trading advisor with the CFTC since August 2011. The firm has been a member of the NFA since August 2011. Lynx’s offices are located at Norrmalmstorg 12, Box 7060 Stockholm, Sweden SE-103 86. The firm’s telephone number is +46-8-663-3360.
Management
The listed principals of Lynx are Svante Bergström, Jonas Bengtsson, Marcus Andersson, Filip Borgeström, Svante Elfving, Martin Sandquist, Ola Paulsson, Patrik Brummer, Joakim Schaaf and Brummer & Partners AB. The trading principals of the firm are Svante Bergstrom, Jonas Bengtsson, and Martin Sandquist.
Svante Bergström is the Chief Executive Officer and a Director of Lynx. Mr. Bergström has been listed as a principal and registered as an associated person of Lynx since July 2011 and August 2011, respectively, and has been an associate member of the NFA since August 2011. He holds a BSc. in Economics and Business Administration from the Stockholm School of Economics, having graduated in June 1992. Before commencing his studies, he was employed by Hagströmer & Qviberg Fondkommission AB, a Swedish brokerage house and fund management company, mainly as a stockbroker, from June 1984 to July 1991. Between June 1992 and September 1993, Mr. Bergström was on sabbatical. Mr. Bergström worked with quantitative analysis and portfolio management within Nordbanken AB, a banking and financial services group, between September 1993 and August 1998, where between 1996 and 1998 he was engaged in building up and running the Proprietary Trading unit, the management process of which serves as a basis for the management of Lynx. Between August 1998 and May 1999, Mr. Bergström worked in the asset management department of Östgöta Enskilda Bank, a Swedish bank, on a project to launch Lynx as a hedge fund within the bank. In June 1999, Mr. Bergström was engaged in setting up Lynx as a standalone firm. Mr. Bergström has been a manager of Lynx since its inception and a shareholder in the company since it was formed in July 1999.
Jonas Bengtsson is the Deputy Chief Executive Officer and a Director of Lynx. Mr. Bengtsson has been listed as a principal of Lynx since August 2011. Mr. Bengtsson holds a Licentiate degree in Engineering Physics from the Lund Institute of Technology, having graduated in November 1992. He continued his studies towards a doctorate until June 1993, when he was employed as a quantitative analyst and risk analyst with Gota Bank AB, a Swedish bank, until May 1994, and with Nordbanken AB, a banking and financial services group, between May 1994 and August 1998. His main responsibility within Nordbanken Proprietary Trading was portfolio construction, risk measurement and programming. Between August 1998 and May 1999, Mr. Bengtsson worked in the asset management department of Östgöta Enskilda Bank, a Swedish bank, on a project to launch Lynx as a hedge fund within the bank. In June 1999, Mr. Bengtsson was engaged in setting up Lynx as a standalone firm. Mr. Bengtsson has been a manager of Lynx since its inception and a shareholder in the company since it was formed in July 1999.
Marcus Andersson is the Chief Operating Officer of Lynx and a Partner of Lynx. Mr. Andersson has been listed as a principal of Lynx since July 2011. Mr. Andersson studied Financial Economics at the School of Business, Economics and Law, Göteborg University, ending his studies in May 2004. Between June 2004 and September 2004 Mr. Andersson worked at Securitas, a security company, as a security guard. Mr. Andersson has previously worked as a Senior Fund Accountant at Fortis Prime Fund Solutions (IOM) Ltd., a hedge fund administrator and global custody provider based in the Isle of Man, between September 2004 and June 2006. Mr. Andersson joined Lynx in June 2006, working with fund accounting and operations and became a Partner in November 2011.
Filip Borgeström is the Head of Business Development and a Partner of Lynx. Mr. Borgeström has been listed as a principal and registered as an associated person of Lynx since July 2011 and August 2011, respectively, and has been an associate member of the NFA since August 2011. He holds an MSc degree in Engineering and Business Management from the Royal Institute of Technology, where he studied from August 1998 to December 2003, and an MSc degree in Economics and Business Administration from Stockholm University, where he studied from August 2001 to December 2003. After graduation, Mr. Borgeström worked as a consultant at the Premium Pension Authority, the Swedish state pension authority, in the Fund & Finance Department, from January 2004 to August 2004. In August 2004 he joined the Institutional Client group at Brummer & Partners, a holding company that wholly or partly owns fund management companies and fund services companies, where he worked in investor relations with responsibility for the US and UK markets until April 2011. Borgeström joined Lynx in April 2011 as Head of Business Development and became a Partner in November 2011.
Svante Elfving has been a Chairman and Director of Lynx since August 2009 and a Partner of Brummer & Partners, a holding company that wholly or partly owns fund management companies and fund services companies, since May 1995. Mr. Elfving has been listed as a principal of Lynx since August 2011. He holds a degree from the Stockholm School of Economics, having graduated in June 1983. After employment as an analyst and portfolio manager with insurance company Trygg-Hansa ömsesidig livförsäkring between September 1983 and September 1987, Mr. Elfving joined the corporate finance department of Alfred Berg Kapitalförvaltning AB (“Alfred Berg”), a financial services firm, in October 1987. In 1993, Mr. Elfving became the head of the corporate finance department of Alfred Berg. Mr. Elfving left Alfred Berg in April 1995 to set up Brummer & Partners in May 1995. During his years with Alfred Berg, and subsequently as head of Brummer & Partners’ corporate finance department, which was divested between 1997 and 1998, Mr. Elfving participated in a substantial number of transactions for various clients. From May 1999 until July 2002, Mr. Elfving was the CEO of Zodiak Venture Capital AB., a wholly owned subsidiary of Brummer & Partners. Between July 2002 and July 2009, Mr. Elfving worked for Zenit, a wholly owned subsidiary of Brummer & Partners, as head of equity analysis and portfolio manager for the fund.
Martin Sandquist has been a Director of Lynx since July 1999. He has been listed as a principal of Lynx since August 2011. Mr. Sandquist studied Industrial Economics at the Royal Institute of Technology in Stockholm, ending his studies in August 1995. Mr. Sandquist previously worked at Nordbanken AB, a banking and financial services group, as a quantitative analyst between August 1995 and August 1998. He joined Nordbanken’s Proprietary Trading unit when it was set up in 1996. Between August 1998 and May 1999, Mr. Sandquist worked on a project to launch Lynx as a hedge fund within the asset management department of Östgöta Enskilda Bank, a Swedish bank. In June 1999, Mr. Sandquist was engaged in setting up Lynx as a standalone firm. He has developed many of the models upon which Lynx’s investment decisions are based. Mr. Sandquist has been a manager of Lynx since its inception and a shareholder in the company since it was formed in July 1999.
Ola Paulsson has been a Director of Lynx since August 2009. He has been listed as a principal of Lynx since July 2011. Mr. Paulsson is Deputy CEO of B & P Fund Services AB, a wholly owned subsidiary of Brummer & Partners which provides securities administration for fund management companies, and a director of various boards of companies and funds owned by Brummer &
Partners, a holding company that wholly or partly owns fund management companies and fund services companies. After graduating with an LLB from Uppsala University in September 1994, Mr. Paulsson worked for Atle IT AB, a private equity company, in mergers and acquisitions until December 1994. Mr. Paulsson served as a court clerk at Södra Roslags’ District Court from December 1994 to November 1996. Beginning in December 1996 he was appointed assistant lawyer at the law firm Gernandt & Danielsson Advokatbyrå, where he worked in general business law, corporate law, M&A and securities law until March 2004. He joined Brummer & Partners as general counsel in April 2004, a position he held until November 2009, when he became Deputy CEO of B & P Fund Services AB.
Patrik Brummer has been listed as a principal of Lynx since August 2011 due to his holdings in Brummer & Partners, a holding company that wholly or partly owns fund management companies and fund services companies, and has been the Chairman and a Partner of Brummer & Partners since May 1995. Between 1969 and 1973, Mr. Brummer studied at the Stockholm School of Economics, from which he graduated in May 1973. Following graduation, Mr. Brummer was on sabbatical until August 1973, when he joined Alfred Berg. By the time he left in 1995, he had become group chief executive of Alfred Berg with responsibility for the group’s strategic development. Mr. Brummer left Alfred Berg in April 1995 to set up Brummer & Partners in May 1995.
Joakim Schaaf has since June 2009 been Chief Compliance Officer of B & P Fund Services AB, a wholly owned subsidiary of Brummer & Partners which provides securities administration for fund management companies. B & P Fund Services AB provide compliance services to Lynx and Mr. Schaaf reports directly to the board of Lynx. Mr. Schaaf has been listed as principal of Lynx since September 2012. After graduation with an LLM from Stockholm University in June 1994, Mr. Schaaf served as a court clerk at Enforcement Services in Uppsala and Södertälje District Court from August 1994 to July 1996. From August 1996 to February 2000, Mr. Schaaf served as an Associate Judge at Katrineholm District Court, Associate Judge of Appeal at Svea Court of Appeal in Stockholm and Associate Judge at Västerås District Court (junior judge program). From March 2000 to August 2003, Mr. Schaaf worked as a Legal Advisor at the Ministry of Finance, Financial Markets Division. Beginning in September 2003, Mr. Schaaf was employed by the Swedish Financial Supervisory Authority. He was appointed Head of Legal Department and Chief Legal Counsel and worked as such until May 2009.
Brummer & Partners, AB became a listed principal of Lynx in June 2011. Brummer & Partners, AB, based in Sweden, is a holding company that wholly or partly owns fund management companies and fund services companies. It was established in May 1995.
Lynx’s Trading Program
Lynx will use its proprietary trading program, the Lynx Programme, described below, in managing assets for Grant Park.
Pursuant to the Lynx Programme, Lynx engages in trading in futures contracts on the global futures markets. The Lynx Programme is managed by applying a well-structured management process that includes a sharp focus on risk management. Lynx uses systematic futures trading programs or models to produce trading signals on a largely automated basis on futures contracts based upon equity, fixed income, commodity and foreign exchange.
As financial markets are constantly developing it is important to be continually improving the models used in the management of the program and developing new ones. Lynx has created extensive databases containing historical price information for a wide variety of different financial instruments, in which the data series often go back thirty years or more. Ideas about how to improve the models in current use are tested on historical data using software developed by Lynx. Another important activity is to attempt to improve the portfolio structure by developing methods for allocating risk between different models and different markets. The aim is for the models used in the management of the program to complement each other and contribute to greater diversification and a more uniform return. The models complement each other in terms of structure as well as the time horizons they operate within. In the really short-term models, the average duration of the positions typically is only a couple of days, while in the models with the longest horizon, the average life of a holding generally is several months.
This supplement revises and replaces the table on page 64 of the Prospectus captioned “PERFORMANCE OF GRANT PARK—CLASS A UNITS” in its entirety as follows:
PERFORMANCE OF GRANT PARK - CLASS A UNITS
(Unaudited)
As required by CFTC regulations, the past performance record of Grant Park’s Class A units for the last five full calendar years and the first nine months of 2012 is presented below. While the performance record set forth in the table below has not been independently audited, the General Partner believes that the information presented is accurate. All performance information is shown net of fees and expenses.
| Name | Grant Park Futures Fund Limited Partnership (Class A units) |
| Type | Privately offered (through February 2003); Publicly offered beginning June 30, 2003; Multi-advisor |
| Inception of Trading | January 1989 |
| Aggregate Gross Subscriptions at 9/30/2012 | $147,153,661 |
| Net Asset Value at 9/30/2012 | $ 38,492,214 |
Worst Monthly Percentage Draw-Down (Since 1/07)(1) | -7.95% 01/10 |
Worst Peak-to-Valley Draw-Down (Since 1/07)(2) | -18.66% (Start of 01/09 - End of 04/12) |
| | | Rate of Return(3) | |
| | | 2012 | | | 2011 | | | 2010 | | | 2009 | | | 2008 | | | 2007 | |
| | | | | | | | | | | | | | | | | | | |
January | | | 0.00 | % | | | -0.52 | % | | | -7.95 | % | | | -0.91 | % | | | 2.49 | % | | | 1.25 | % |
| February | | | 0.80 | % | | | 2.26 | % | | | 0.63 | % | | | -0.80 | % | | | 9.66 | % | | | -4.18 | % |
March | | | -2.21 | % | | | -2.48 | % | | | 4.08 | % | | | -3.26 | % | | | -0.63 | % | | | -4.55 | % |
April | | | 0.00 | % | | | 3.79 | % | | | 1.80 | % | | | -1.73 | % | | | -0.13 | % | | | 5.23 | % |
May | | | 6.19 | % | | | -6.93 | % | | | -3.83 | % | | | 1.64 | % | | | 2.11 | % | | | 4.60 | % |
June | | | -4.88 | % | | | -3.79 | % | | | -0.21 | % | | | -3.41 | % | | | 3.06 | % | | | 4.16 | % |
| July | | | 3.56 | % | | | 3.02 | % | | | -1.66 | % | | | -1.26 | % | | | -5.06 | % | | | -3.72 | % |
August | | | -1.30 | % | | | -1.81 | % | | | 2.77 | % | | | 1.15 | % | | | -2.41 | % | | | -3.71 | % |
September | | | -2.13 | % | | | -1.64 | % | | | 3.24 | % | | | 1.17 | % | | | 1.31 | % | | | 8.78 | % |
October | | | --- | | | | -4.51 | % | | | 4.33 | % | | | -2.59 | % | | | 4.76 | % | | | 5.23 | % |
November | | | --- | | | | -0.57 | % | | | -2.58 | % | | | 4.24 | % | | | 2.76 | % | | | -0.66 | % |
December | | | --- | | | | -0.05 | % | | | 4.57 | % | | | -3.57 | % | | | 1.08 | % | | | 0.63 | % |
Year | | | -0.41 | % | | | -12.95 | % | | | 4.45 | % | | | -9.23 | % | | | 19.91 | % | | | 12.63 | % |
________________________________________________________
(1) Worst Monthly Percentage Draw-Down is the largest monthly loss experienced by Grant Park in any calendar month expressed as a percentage of total equity in Grant Park and includes the month and year of that draw-down.
(2) Worst Peak-to-Valley Draw-Down is the greatest cumulative percentage decline in month-end net asset value of Grant Park due to losses sustained by Grant Park during a period in which the initial month-end net asset value of Grant Park is not equaled or exceeded by a subsequent month-end net asset value of Grant Park and includes the time period in which the draw-down occurred.
(3) The monthly rate of return is computed by dividing monthly performance by beginning monthly equity plus additions less redemptions. The monthly rates are then compounded to arrive at the annual rate of return.
PAST PERFORMANCE IS NOT NECESSARILY INDICATIVE OF FUTURE RESULTS
This supplement revises and replaces the table on page 65 of the Prospectus captioned “PERFORMANCE OF GRANT PARK—CLASS B UNITS” in its entirety as follows:
PERFORMANCE OF GRANT PARK - CLASS B UNITS
(Unaudited)
As required by CFTC regulations, the past performance record of Grant Park’s Class B units for the last five full calendar years and the first nine months of 2012 is presented below. While the performance record set forth in the table below has not been independently audited, the General Partner believes that the information presented is accurate. All performance information is shown net of fees and expenses.
| Name | Grant Park Futures Fund Limited Partnership (Class B units) |
| Type | Public; Multi-advisor |
| Inception of Trading | August 2003 |
| Aggregate Gross Subscriptions at 9/30/2012 | $ 872,734,726 |
| Net Asset Value at 9/30/2012 | $ 375,149,842 |
Worst Monthly Percentage Draw-Down(1) (Since 1/07) | -8.00% 01/10 |
Worst Peak-to-Valley Draw-Down(2) (Since 1/07) | -20.43% (Continuing from 01/09 - End of 04/12 ) |
| | | Rate of Return(3) | |
| | | 2012 | | | 2011 | | | 2010 | | | 2009 | | | 2008 | | | 2007 | |
| | | | | | | | | | | | | | | | | | | |
| January | | | -0.06 | % | | | -0.58 | % | | | -8.00 | % | | | -0.98 | % | | | 2.42 | % | | | 1.18 | % |
| February | | | 0.75 | % | | | 2.20 | % | | | 0.57 | % | | | -0.88 | % | | | 9.58 | % | | | -4.25 | % |
| March | | | -2.27 | % | | | -2.53 | % | | | 4.03 | % | | | -3.33 | % | | | -0.70 | % | | | -4.62 | % |
| April | | | -0.05 | % | | | 3.74 | % | | | 1.74 | % | | | -1.78 | % | | | -0.20 | % | | | 5.15 | % |
| May | | | 6.13 | % | | | -6.98 | % | | | -3.88 | % | | | 1.58 | % | | | 2.03 | % | | | 4.52 | % |
| June | | | -4.93 | % | | | -3.84 | % | | | -0.27 | % | | | -3.46 | % | | | 2.99 | % | | | 4.09 | % |
| July | | | 3.51 | % | | | 2.96 | % | | | -1.71 | % | | | -1.32 | % | | | -5.12 | % | | | -3.79 | % |
| August | | | -1.36 | % | | | -1.86 | % | | | 2.71 | % | | | 1.09 | % | | | -2.48 | % | | | -3.78 | % |
| September | | | -2.19 | % | | | -1.69 | % | | | 3.21 | % | | | 1.12 | % | | | 1.24 | % | | | 8.70 | % |
| October | | | --- | | | | -4.57 | % | | | 4.27 | % | | | -2.64 | % | | | 4.69 | % | | | 5.16 | % |
| November | | | --- | | | | -0.62 | % | | | -2.63 | % | | | 4.19 | % | | | 2.69 | % | | | -0.73 | % |
| December | | | --- | | | | -0.11 | % | | | 4.52 | % | | | -3.63 | % | | | 1.01 | % | | | 0.64 | % |
| Year | | | -0.89 | % | | | -13.52 | % | | | 3.80 | % | | | -9.87 | % | | | 18.88 | % | | | 11.76 | % |
________________________________________________________
(1) Worst Monthly Percentage Draw-Down is the largest monthly loss experienced by Grant Park in any calendar month expressed as a percentage of total equity in Grant Park and includes the month and year of that draw-down.
(2) Worst Peak-to-Valley Draw-Down is the greatest cumulative percentage decline in month-end net asset value of Grant Park due to losses sustained by Grant Park during a period in which the initial month-end net asset value of Grant Park is not equaled or exceeded by a subsequent month-end net asset value of Grant Park and includes the time period in which the draw-down occurred.
(3) The monthly rate of return is computed by dividing monthly performance by beginning monthly equity plus additions less redemptions. The monthly rates are then compounded to arrive at the annual rate of return.
PAST PERFORMANCE IS NOT NECESSARILY INDICATIVE OF FUTURE RESULTS
This supplement revises and replaces the table on page 66 of the Prospectus captioned “PERFORMANCE OF GRANT PARK—LEGACY 1 UNITS” in its entirety as follows:
PERFORMANCE OF GRANT PARK - Legacy 1 Units
(Unaudited)
As required by CFTC regulations, the past performance record of Grant Park’s Legacy 1 Class units from April 1, 2009 through September 30, 2012, is presented below. While the performance record set forth in the table below has not been independently audited, the general partner believes that the information presented is accurate. All performance information is shown net of fees and expenses.
| Name | Grant Park Futures Fund Limited Partnership (Legacy 1 Class) |
| Type | Public |
| Inception of Trading | April 2009 |
| Aggregate Gross Subscriptions at 9/30/2012 | $ 8,335,677 |
| Net Asset Value at 9/30/2012 | $ 5,678,706 |
Worst Monthly Percentage Draw-Down (Since April 2009)(1) | -7.77% 01/10 |
Worst Peak-to-Valley Draw-Down (Since April 2009)(2) | -14.83% (Start of 05/11 - End of 03/12) |
| | | Rate of Return(3) | |
| | | 2012 | | | 2011 | | | 2010 | | | 2009 | |
| | | | | | | | | | | | | |
| January | | | 0.18 | % | | | -0.35 | % | | | -7.77 | % | | | --- | |
| February | | | 1.00 | % | | | 2.37 | % | | | 0.82 | % | | | --- | |
| March | | | -2.03 | % | | | -2.21 | % | | | 4.15 | % | | | --- | |
| April | | | 0.18 | % | | | 3.84 | % | | | 1.77 | % | | | -1.59 | % |
| May | | | 6.24 | % | | | -6.63 | % | | | -3.53 | % | | | 1.66 | % |
| June | | | -4.57 | % | | | -3.62 | % | | | -0.03 | % | | | -3.10 | % |
| July | | | 3.73 | % | | | 3.23 | % | | | -1.50 | % | | | -1.08 | % |
| August | | | -1.10 | % | | | -1.62 | % | | | 2.86 | % | | | 1.27 | % |
| September | | | -1.93 | % | | | -1.47 | % | | | 3.24 | % | | | 1.21 | % |
| October | | | --- | | | | -4.34 | % | | | 4.35 | % | | | -2.42 | % |
| November | | | --- | | | | -0.40 | % | | | -2.32 | % | | | 4.04 | % |
| December | | | --- | | | | 0.14 | % | | | 4.67 | % | | | -3.19 | % |
| Year | | | 1.31 | % | | | -11.00 | % | | | 6.09 | % | | | -3.39 | % |
________________________________________________________
(1) Worst Monthly Percentage Draw-Down is the largest monthly loss experienced by Grant Park in any calendar month expressed as a percentage of total equity in Grant Park and includes the month and year of that draw-down.
(2) Worst Peak-to-Valley Draw-Down is the greatest cumulative percentage decline in month-end net asset value of Grant Park due to losses sustained by Grant Park during a period in which the initial month-end net asset value of Grant Park is not equaled or exceeded by a subsequent month-end net asset value of Grant Park and includes the time period in which the draw-down occurred.
(3) The monthly rate of return is computed by dividing monthly performance by beginning monthly equity plus additions less redemptions. The monthly rates are then compounded to arrive at the annual rate of return.
PAST PERFORMANCE IS NOT NECESSARILY INDICATIVE OF FUTURE RESULTS
This supplement revises and replaces the table on page 67 of the Prospectus captioned “PERFORMANCE OF GRANT PARK—LEGACY 2 UNITS” in its entirety as follows:
PERFORMANCE OF GRANT PARK - Legacy 2 Units
(Unaudited)
As required by CFTC regulations, the past performance record of Grant Park’s Legacy 2 Class units from April 1, 2009 through September 30, 2012, is presented below. While the performance record set forth in the table below has not been independently audited, the general partner believes that the information presented is accurate. All performance information is shown net of fees and expenses.
| Name | Grant Park Futures Fund Limited Partnership (Legacy 2 Class) |
| Type | Public |
| Inception of Trading | April 2009 |
| Aggregate Gross Subscriptions at 9/30/2012 | $ 20,068,345 |
| Net Asset Value at 9/30/2012 | $ 13,508,997 |
Worst Monthly Percentage Draw-Down (Since April 2009)(1) | -7.79% 01/10 |
Worst Peak-to-Valley Draw-Down (Since April 2009)(2) | -15.18% (Start of 05/11 - End of 03/12 ) |
| | | Rate of Return(3) | |
| | | 2012 | | | 2011 | | | 2010 | | | 2009 | |
| | | | | | | | | | | | | |
| January | | | 0.17 | % | | | -0.37 | % | | | -7.79 | % | | | --- | |
| February | | | 0.98 | % | | | 2.33 | % | | | 0.80 | % | | | --- | |
| March | | | -2.04 | % | | | -2.22 | % | | | 4.13 | % | | | --- | |
| April | | | 0.16 | % | | | 3.77 | % | | | 1.72 | % | | | -1.61 | % |
| May | | | 6.16 | % | | | -6.63 | % | | | -3.53 | % | | | 1.62 | % |
| June | | | -4.60 | % | | | -3.66 | % | | | -0.05 | % | | | -3.12 | % |
| July . | | | 3.71 | % | | | 3.18 | % | | | -1.52 | % | | | -1.09 | % |
| August | | | -1.12 | % | | | -1.69 | % | | | 2.82 | % | | | 1.26 | % |
| September | | | -1.94 | % | | | -1.57 | % | | | 3.20 | % | | | 1.21 | % |
| October | | | --- | | | | -4.40 | % | | | 4.31 | % | | | -2.44 | % |
| November | | | --- | | | | -0.42 | % | | | -2.34 | % | | | 4.04 | % |
| December | | | --- | | | | 0.12 | % | | | 4.62 | % | | | -3.22 | % |
| Year | | | 1.06 | % | | | -11.45 | % | | | 5.73 | % | | | -3.55 | % |
________________________________________________________
(1) Worst Monthly Percentage Draw-Down is the largest monthly loss experienced by Grant Park in any calendar month expressed as a percentage of total equity in Grant Park and includes the month and year of that draw-down.
(2) Worst Peak-to-Valley Draw-Down is the greatest cumulative percentage decline in month-end net asset value of Grant Park due to losses sustained by Grant Park during a period in which the initial month-end net asset value of Grant Park is not equaled or exceeded by a subsequent month-end net asset value of Grant Park and includes the time period in which the draw-down occurred.
(3) The monthly rate of return is computed by dividing monthly performance by beginning monthly equity plus additions less redemptions. The monthly rates are then compounded to arrive at the annual rate of return.
PAST PERFORMANCE IS NOT NECESSARILY INDICATIVE OF FUTURE RESULTS
This supplement revises and replaces the table on page 68 of the Prospectus captioned “PERFORMANCE OF GRANT PARK—GLOBAL 1 UNITS” in its entirety as follows:
PERFORMANCE OF GRANT PARK - Global 1 Units
(Unaudited)
As required by CFTC regulations, the past performance record of Grant Park’s Global 1 Class units from April 1, 2009 through September 30, 2012 is presented below. While the performance record set forth in the table below has not been independently audited, the general partner believes that the information presented is accurate. All performance information is shown net of fees and expenses.
| Name | Grant Park Futures Fund Limited Partnership (Global 1 Class) |
| Type | Public |
| Inception of Trading | April 2009 |
| Aggregate Gross Subscriptions at 9/30/2012 | $ 20,588,424 |
| Net Asset Value at 9/30/2012 | $ 12,475,937 |
Worst Monthly Percentage Draw-Down (Since April 2009)(1) | -7.80% 01/10 |
Worst Peak-to-Valley Draw-Down (Since April 2009)(2) | -14.60% (Start of 06/09 - End of 03/12 ) |
| | | | |
| | | 2012 | | | 2011 | | | 2010 | | | 2009 | |
| | | | | | | | | | | | | |
| January | | | 0.39 | % | | | -0.74 | % | | | -7.80 | % | | | --- | |
| February | | | 0.96 | % | | | 2.00 | % | | | 0.71 | % | | | --- | |
| March | | | -1.97 | % | | | -1.85 | % | | | 3.65 | % | | | --- | |
| April | | | 0.27 | % | | | 2.92 | % | | | 1.52 | % | | | -0.28 | % |
| May | | | 6.32 | % | | | -6.49 | % | | | -2.21 | % | | | 2.02 | % |
| June | | | -4.59 | % | | | -3.33 | % | | | 0.29 | % | | | -3.21 | % |
| July | | | 3.85 | % | | | 3.09 | % | | | -2.51 | % | | | -1.26 | % |
| August | | | -1.15 | % | | | -1.25 | % | | | 2.71 | % | | | 1.11 | % |
| September | | | -1.85 | % | | | -1.34 | % | | | 1.97 | % | | | 1.18 | % |
| October | | | --- | | | | -4.01 | % | | | 3.70 | % | | | -3.22 | % |
| November | | | --- | | | | -0.39 | % | | | -2.13 | % | | | 3.75 | % |
| December | | | --- | | | | 0.06 | % | | | 3.59 | % | | | -4.21 | % |
| Year | | | 1.84 | % | | | -11.18 | % | | | 2.88 | % | | | -4.32 | % |
________________________________________________________
(1) Worst Monthly Percentage Draw-Down is the largest monthly loss experienced by Grant Park in any calendar month expressed as a percentage of total equity in Grant Park and includes the month and year of that draw-down.
(2) Worst Peak-to-Valley Draw-Down is the greatest cumulative percentage decline in month-end net asset value of Grant Park due to losses sustained by Grant Park during a period in which the initial month-end net asset value of Grant Park is not equaled or exceeded by a subsequent month-end net asset value of Grant Park and includes the time period in which the draw-down occurred.
(3) The monthly rate of return is computed by dividing monthly performance by beginning monthly equity plus additions less redemptions. The monthly rates are then compounded to arrive at the annual rate of return.
PAST PERFORMANCE IS NOT NECESSARILY INDICATIVE OF FUTURE RESULTS
This supplement revises and replaces the table on page 69 of the Prospectus captioned “PERFORMANCE OF GRANT PARK—GLOBAL 2 UNITS” in its entirety as follows:
PERFORMANCE OF GRANT PARK - Global 2 Units
(Unaudited)
As required by CFTC regulations, the past performance record of Grant Park’s Global 2 Class units from April 1, 2009 through September 30, 2012, is presented below. While the performance record set forth in the table below has not been independently audited, the general partner believes that the information presented is accurate. All performance information is shown net of fees and expenses.
| Name | Grant Park Futures Fund Limited Partnership (Global 2 Class) |
| Type | Public |
| Inception of Trading | April 2009 |
| Aggregate Gross Subscriptions at 9/30/2012 | $ 38,222,891 |
| Net Asset Value at 9/30/2012 | $ 27,505,785 |
Worst Monthly Percentage Draw-Down (Since April 2009)(1) | -7.82% 01/10 |
Worst Peak-to-Valley Draw-Down (Since April 2009)(2) | -15.40% (Start of 06/09 - End of 03/12 ) |
| | | | |
| | | 2012 | | | 2011 | | | 2010 | | | 2009 | |
| | | | | | | | | | | | | |
| January | | | 0.37 | % | | | -0.76 | % | | | -7.82 | % | | | --- | |
| February | | | 0.94 | % | | | 1.99 | % | | | 0.69 | % | | | --- | |
| March | | | -1.99 | % | | | -1.89 | % | | | 3.56 | % | | | --- | |
| April | | | 0.25 | % | | | 2.91 | % | | | 1.50 | % | | | -0.30 | % |
| May | | | 6.27 | % | | | -6.53 | % | | | -2.24 | % | | | 1.97 | % |
| June | | | -4.59 | % | | | -3.36 | % | | | 0.29 | % | | | -3.24 | % |
| July | | | 3.80 | % | | | 3.07 | % | | | -2.53 | % | | | -1.28 | % |
| August | | | -1.16 | % | | | -1.28 | % | | | 2.70 | % | | | 1.09 | % |
| September | | | -1.85 | % | | | -1.36 | % | | | 1.94 | % | | | 1.10 | % |
| October | | | --- | | | | -4.03 | % | | | 3.68 | % | | | -3.24 | % |
| November | | | --- | | | | -0.41 | % | | | -2.15 | % | | | 3.61 | % |
| December | | | --- | | | | 0.04 | % | | | 3.56 | % | | | -4.17 | % |
| Year | | | 1.64 | % | | | -11.43 | % | | | 2.56 | % | | | -4.64 | % |
(1) Worst Monthly Percentage Draw-Down is the largest monthly loss experienced by Grant Park in any calendar month expressed as a percentage of total equity in Grant Park and includes the month and year of that draw-down.
(2) Worst Peak-to-Valley Draw-Down is the greatest cumulative percentage decline in month-end net asset value of Grant Park due to losses sustained by Grant Park during a period in which the initial month-end net asset value of Grant Park is not equaled or exceeded by a subsequent month-end net asset value of Grant Park and includes the time period in which the draw-down occurred.
(3) The monthly rate of return is computed by dividing monthly performance by beginning monthly equity plus additions less redemptions. The monthly rates are then compounded to arrive at the annual rate of return.
PAST PERFORMANCE IS NOT NECESSARILY INDICATIVE OF FUTURE RESULT
This supplement revises and replaces the table on page 70 of the Prospectus captioned “PERFORMANCE OF GRANT PARK—GLOBAL 3 UNITS” in its entirety as follows:
PERFORMANCE OF GRANT PARK - Global 3 Units
(Unaudited)
As required by CFTC regulations, the past performance record of Grant Park’s Global 3 Class units from April 1, 2009 through September 30, 2012 is presented below. While the performance record set forth in the table below has not been independently audited, the general partner believes that the information presented is accurate. All performance information is shown net of fees and expenses.
| Name | Grant Park Futures Fund Limited Partnership (Global 3 Class) |
| Type | Public |
| Inception of Trading | April 2009 |
| Aggregate Gross Subscriptions at 9/30/2012 | $ 311,196,166 |
| Net Asset Value at 9/30/2012 | $ 231,322,765 |
Worst Monthly Percentage Draw-Down (Since April 2009)(1) | -7.95% 01/10 |
Worst Peak-to-Valley Draw-Down (Since April 2009)(2) | -19.73% (Start of 06/09 - End of 03/12 ) |
| | | Rate of Return(3) | |
| | | 2012 | | | 2011 | | | 2010 | | | 2009 | |
| | | | | | | | | | | | | |
| January | | | 0.22 | % | | | -0.91 | % | | | -7.95 | % | | | --- | |
| February | | | 0.79 | % | | | 1.76 | % | | | 0.54 | % | | | --- | |
| March | | | -2.13 | % | | | -2.01 | % | | | 3.40 | % | | | --- | |
| April | | | 0.10 | % | | | 2.75 | % | | | 1.33 | % | | | -0.44 | % |
| May | | | 6.16 | % | | | -6.67 | % | | | -2.38 | % | | | 1.77 | % |
| June | | | -4.73 | % | | | -3.50 | % | | | 0.10 | % | | | -3.49 | % |
| July | | | 3.66 | % | | | 2.92 | % | | | -2.67 | % | | | -1.43 | % |
| August | | | -1.31 | % | | | -1.43 | % | | | 2.54 | % | | | 0.94 | % |
| September | | | -2.00 | % | | | -1.52 | % | | | 1.79 | % | | | 0.96 | % |
| October | | | --- | | | | -4.17 | % | | | 3.51 | % | | | -3.38 | % |
| November | | | --- | | | | -0.56 | % | | | -2.28 | % | | | 3.52 | % |
| December | | | --- | | | | -0.11 | % | | | 3.40 | % | | | -4.36 | % |
| Year | | | 0.35 | % | | | -13.05 | % | | | 0.68 | % | | | -6.04 | % |
| (1) | Worst Monthly Percentage Draw-Down is the largest monthly loss experienced by Grant Park in any calendar month expressed as a percentage of total equity in Grant Park and includes the month and year of that draw-down. |
| (2) | Worst Peak-to-Valley Draw-Down is the greatest cumulative percentage decline in month-end net asset value of Grant Park due to losses sustained by Grant Park during a period in which the initial month-end net asset value of Grant Park is not equaled or exceeded by a subsequent month-end net asset value of Grant Park and includes the time period in which the draw-down occurred. |
| (3) | The monthly rate of return is computed by dividing monthly performance by beginning monthly equity plus additions less redemptions. The monthly rates are then compounded to arrive at the annual rate of return. |
PAST PERFORMANCE IS NOT NECESSARILY INDICATIVE OF FUTURE RESULTS
MANAGEMENT’S DISCUSSION AND ANALYSIS OF FINANCIAL CONDITION AND RESULTS OF OPERATIONS
This supplement revises and replaces the third paragraph on page 71 of the Prospectus under the heading “MANAGEMENT’S DISCUSSION AND ANALYSIS OF FINANCIAL CONDITION AND RESULTS OF OPERATIONS—Organization of Grant Park” in its entirety as follows:
Grant Park invests through the trading companies with independent professional commodity trading advisors retained by the general partner. As of November 1, 2012, Rabar, EMC, ETC, Winton, Transtrend, QIM, Sunrise, Amplitude, Alder, Denali, and Lynx serve as Grant Park’s commodity trading advisors. Each of the trading advisors is registered as a commodity trading advisor under the Commodity Exchange Act and is a member of the NFA. As of November 1, 2012, the general partner allocated Grant Park’s net assets through the respective trading companies among Rabar, EMC, ETC, Winton, Transtrend, QIM, Sunrise, Amplitude, Alder, Denali, and Lynx. No more than 20% of Grant Park’s assets are allocated to any one trading company and in turn, any one trading advisor. The general partner may terminate or replace the trading advisors or retain additional trading advisors in its sole discretion. As of November 1, 2012, Grant Park no longer trades through Welton Investment Corporation or Global Advisors Jersey Limited.
CONFLICTS OF INTERESTS
This supplement revises and replaces the first paragraph on page 90 of the Prospectus under the heading “CONFLICTS OF INTERESTS—Incentive Compensation” in its entirety as follows:
The trading advisors are compensated in part by receiving a quarterly or semi-annual incentive fee for any net new profits which Grant Park generates. This may present a conflict of interest in that the trading advisors
may have an incentive to trade more aggressively (including using more leverage) or entering riskier trades in an attempt to produce greater profits.
FEES AND EXPENSES
This supplement revises and replaces the chart on page 91 of the Prospectus under the heading “FEES AND EXPENSES—Fees and Expenses Paid by Grant Park” in its entirety as follows:
| | |
| General Partner | Brokerage Charge | Class A: 7.50%* Class B: 7.95%* Legacy 1 Class: 5.00%* Legacy 2 Class: 5.25%* Global 1 Class: 4.45%* Global 2 Class: 4.70%* Global 3 Class: 6.45%* * Annualized basis. |
| Counterparties | Dealer Spreads | Grant Park pays its counterparties bid-ask spreads on Grant Park’s non-exchange traded commodity interests. |
| Trading Advisors | Incentive Fees | Grant Park pays each trading advisor a quarterly or semi-annual incentive fee ranging from 20% to 26% of the new trading profits, if any, achieved on the trading advisor’s allocated net assets as of the end of each period. |
| General Partner | Organization and Offering Expense Reimbursement | Grant Park reimburses the general partner on a monthly basis for its advancement of Grant Park’s organization and offering expenses, up to an amount not to exceed 1.0% per annum of the average month-end net assets of Grant Park. |
| Third Parties | Operating Expenses; Extraordinary Expenses | Grant Park pays its ongoing operating expenses up to a maximum of 0.25% of Grant Park’s average net assets per year. This includes expenses associated with Grant Park’s SEC reporting obligations, which for 2012 are estimated to be approximately $350,000. Grant Park also pays any extraordinary expenses it incurs. |
This supplement revises and replaces the first six paragraphs on pages 92-94 of the Prospectus under the heading “FEES AND EXPENSES—Fees and Expenses Paid by Grant Park—Incentive Fees” in its entirety as follows:
Grant Park pays each trading advisor a quarterly or semi-annual incentive fee based on any new trading profits achieved on the trading advisor’s allocated net assets at the end of each calendar period. Generally, new trading profits means the net increase in trading profits, realized and unrealized, experienced by the trading advisor on its allocated net assets from the most recent prior period in which an incentive fee was paid to the trading advisor, or if an incentive fee has yet to be paid to that trading advisor, the trading advisor’s initial allocation of net assets. Effective October 1, 2012, the incentive fees payable to each of Grant Park’s trading advisors are as follows: 20.0% to Rabar, 22.5% to EMC, 24.0% to ETC, 20.0% to Winton, 22.5% to Transtrend, 26.0% to QIM, 23.5% to Amplitude, 22.0% to Alder, 24.0% to Denali. Effective November 1, 2012, the incentive fees payable to Lynx are 23%. Currently, Sunrise’s incentive fee is 23.5% but effective January 1, 2013, the incentive fees payable to Sunrise will be 20.0%.
Calculation of New Trading Profits. New trading profits are calculated with respect to each trading advisor’s allocated net assets. Allocated net assets means that portion of the net assets of each class of Grant Park allocated to the trading advisor by the general partner through the trading company and subject to the trading advisor’s discretion (including any notional funds), together with any appreciation or depreciation in such allocated net assets. New trading profits are calculated on a high water mark basis, as described in the paragraph below. For a definition of net assets, please see “LIMITED PARTNERSHIP AGREEMENT — Nature of Classes and Determination of Net Asset Value.”
New trading profits on the allocated net assets of each trading advisor are calculated as the sum of (1) the net of any profits (excluding interest income) and losses realized on all trades closed out during the period of such allocated net assets, plus (2) the net of any unrealized profits and losses on open positions as of the end of such period on such allocated net assets, minus (3)(A) the net of any unrealized profits or losses on open positions as of the end of the preceding period on such allocated net assets, (B) all expenses (except the incentive fee payable to the trading advisor, if any, for the current period and applicable state taxes) attributable to such allocated net assets incurred or accrued during such period, including, without limitation, the brokerage charge and Grant Park’s ongoing expenses, and (C) cumulative net realized or unrealized trading losses on such allocated net assets (reduced by a proportionate share of realized and unrealized trading losses on such allocated net assets attributable to redeemed units or reallocated amounts as of any redemption or reallocation date), if any, carried forward from all preceding periods since the last period for which an incentive fee was payable to the trading advisor. The general partner may, however, in its sole discretion, adjust the computation of new trading profits on the allocated net assets of any trading advisor to exclude or include all or a portion of particular expenses for purposes of calculating that trading advisor’s incentive fee. In the case of ETC, Winton, Transtrend, QIM, Sunrise, Amplitude, Alder, Denali, and effective November 1, 2012, Lynx , only certain allocated expenses of Grant Park are included for the purpose of calculating such trading advisor’s incentive fee, while for EMC and Rabar, all allocated expenses of Grant Park are included.
Incentive fees paid at the end of a period will be retained by each trading advisor and will not be repaid to Grant Park if the net assets of Grant Park or of any class subsequently decline. This could result in substantial incentive fees being paid to a trading advisor despite the fact that an overall decline in the net assets of Grant Park or of any class has occurred. Because each trading advisor’s incentive fee will be determined independently based on new trading profits experienced on the net assets allocated to the trading advisor, it also is possible that one of the trading advisors could be paid incentive fees for a period even though, because of losses suffered by another trading advisor, the net asset value per unit of a limited partner’s units declined during the period. Incentive fees will be payable on realized and unrealized profits and, therefore, without regard to cash available for distribution.
The general partner generally reallocates assets to or from a trading advisor as of the first trading day of a calendar month. However, the advisory contracts authorize the general partner to reallocate assets among the trading advisors monthly as it determines in its sole discretion upon 10 days’ prior written notice to the affected trading advisors. If a trading advisor’s advisory contract with Grant Park is terminated other than as of the end of a calendar quarter or semi-annual period or assets are allocated away from the trading advisor on other than a quarter-end or semi-annual period end, the trading advisor will receive an incentive fee, if due, as though the termination date or reallocation date were the end of a calendar quarter or semi-annual period end. With respect to any allocated assets, in determining the trading advisor’s incentive fee, reallocated assets are transferred at the net asset value they had on the last trading day immediately prior to the date they are allocated away from the trading advisor, and the trading advisor is paid its incentive fee on the new trading profits on the reallocated assets. Below is a sample calculation of the incentive fee:
This supplement revises and replaces the first paragraph on pages 97 of the Prospectus under the heading “FEES AND EXPENSES—Fees and Expenses Paid by the General Partner—Trading Advisor Consulting Fees” in its entirety as follows:
Each trading advisor receives a consulting fee, payable by the general partner not Grant Park, ranging from 0% to 2% per year, computed and accrued monthly on the basis of the trading advisors allocated net assets either at the beginning of the month or at month-end and paid, depending on the trading advisor, either monthly or quarterly. Effective October 1, 2012, the consulting fees payable to each of Grant Park’s trading advisors are as follows: Between 0.0% and 2.0% to Rabar, 1.5% to EMC, 1.0% to ETC, 1.0% to Winton, 1.5% to Transtrend, 0.25% to QIM, 1.0% to Sunrise, 1.5% to Amplitude, 1.0% to Alder, 1.0% to Denali, and effective November 1, 2012, 0.5% to Lynx. No advisor fees are payable with respect to certain advisors.
GRANT PARK FUTURES FUND LIMITED PARTNERSHIP NOTES TO CONSOLIDATED FINANCIAL STATEMENTS
This supplement revises and replaces the first paragraph on pages 131-132 of the Prospectus under the heading “GRANT PARK FUTURES FUND LIMITED PARTNERSHIP NOTES TO CONSOLIDATED FINANCIAL STATEMENTS—NOTE 4. COMMODITY TRADING ADVISORS” in its entirety as follows:
The Partnership, through the Trading Companies, allocates assets to the commodity trading advisors. Each Trading Company has entered into an advisory contract with its own Advisor. Effective November 1, 2012, the commodity trading advisors are Rabar Market Research, Inc., EMC Capital Management, Inc., Eckhardt Trading Co., Winton Capital Management Limited, Transtrend B.V., Quantitative Investment Management LLC, Sunrise Capital Partners, LLC, Amplitude Capital International Limited, Alder Capital Limited, Denali Asset Management, LLLP, and Lynx Asset Management AB (collectively, the ‘‘Advisors’’). The Advisors are paid a consulting fee, either monthly or quarterly, ranging from 0 percent to 2 percent per annum of the Partnership’s month-end allocated net assets and a quarterly or semi-annual incentive fee ranging from 20 percent to 26 percent of the new trading profits on the allocated net assets of the Advisor.
GRANT PARK FUTURES FUND LIMITED PARTNERSHIP NOTES TO CONSOLIDATED FINANCIAL CONDITION
This supplement revises and replaces the first paragraph on pages 148 of the Prospectus under the heading “GRANT PARK FUTURES FUND LIMITED PARTNERSHIP NOTES TO CONSOLIDATED FINANCIAL CONDITION—NOTE 5. COMMODITY TRADING ADVISORS” in its entirety as follows:
Grant Park, through the Trading Companies, allocates assets to the commodity trading advisors. Each Trading Company has entered into an advisory contract with its own Advisor. Effective November 1, 2012, the commodity trading advisors are Rabar Market Research, Inc., EMC Capital Management, Inc., Eckhardt Trading Co., Winton Capital Management, Transtrend B.V., Quantitative Investment Management LLC, Sunrise Capital Partners, LLC, Amplitude Capital International Limited, Alder Capital Limited, Denali Asset Management, LLLP, and Lynx Asset Management AB (collectively, the ‘‘Advisors’’). The Advisors are paid a quarterly management fee ranging from 0 percent to 2 percent per annum of Grant Park’s month-end allocated net assets and a quarterly or semi-annual incentive fee ranging from 20 percent to 26 percent of the new trading profits on the allocated net assets of the Advisor.
POTENTIAL ADVANTAGES OF INVESTMENT
This supplement revises and replaces the first paragraph on page 170 of the Prospectus under the heading “POTENTIAL ADVANTAGES OF INVESTMENT—Professional Trading” in its entirety as follows:
Effective November 1, 2012, Grant Park’s trading decisions are made by Rabar Market Research, Inc., EMC Capital, Management, Inc., Eckhardt Trading Company, Winton Capital Management Limited, Transtrend B.V., Quantitative Investment Management LLC, Sunrise Capital Partners LLC, Amplitude Capital International Limited, Alder Capital Limited, Denali Asset Management, LLLP, and Lynx Asset Management AB. Each trading advisor uses its own proprietary trading program.
SUPPLEMENTAL PERFORMANCE INFORMATION
This supplement revises and replaces the chart on page 193 of the Prospectus titled, “SUPPLEMENTAL PERFORMANCE INFORMATION – Trading Advisor Overview” as follows:
SUPPLEMENTAL PERFORMANCE INFORMATION
Trading Advisor Overview
December 31, 2011
| | | Amplitude Capital International Ltd. | Denali Asset Management, LLLP | | | | Quantitative Investment Management, LLC | | Sunrise Capital Partners, LLC | | Winton Capital Management Ltd |
| Firm Assets Under Management | $561.9M | $1,055.8M | $1,100.0M | $709.8M | $142.2M | $5,485.0M | $4,560.3M | $294.8M | $706.0M | $9,500.0M | $29,000.0M |
Program | Global 20 | Sinfonie | Global Macro Discretionary | Standard Plus | Classic | Lynx | Global | Diversified | Expanded Diversified | Diversified Trend Program—Enhanced Risk (USD) | Diversified |
| Program Assets Under Management | $548.7M | $90.5M | $1,100.0M | $211.4M | $142.2M | $5,485.0M | $3,854.0M | $240.0M | $700.0M | $7,200.0M | $28,760.0M |
Program Inception | Feb-2001 | Sep-2009 | Jun-2000 | Oct-1991 | Jan-1985 | May-2000 | Dec-2001 | Jan-1989 | Jan-1989 | Jan-1995 | Oct-1997 |
| Began Trading for Grant Park | Feb-2011 | Apr-2010 | Feb-2011 | Jun-2007 | Jan-1989 | Nov-2012 | Oct-2008 | Jan-1989 | Jan-2010 | Jul-2008 | Aug-2004 |
| Margin/Equity Average | 9.10% | 15.19% | 2.16% | 8.32% | 13.00% | 15.38% | 8.00% | 9.18% | 8.70% | 15.00% | 6.20% |
| Roundturns per Million | 125 | 6000 | 1527 | 1382 | 2000 | 2000 | 1200 | 881 | 350 | 1350 | 661 |
| Approximate Number of Markets Traded | Pairs and Crosses using 7 currencies | 72 | 100 | 62 | 80 | 60 | 57 | 109 | 75 | 400 | 100+ |
| Number of Trading Systems | 1 | 2 | 0 | Multiple | 6 | 29 | 1 | Multiple | Multiple | Multiple | Multiple |
| Time Horizon (average holding period) | 5 days | 2 Days | 1 – 5 days | 7 – 60+ days | 24 days | 5-6 weeks | 5 – 6 days | 38 days | 60 days | 1 month | Ranges from short- to long-term |
| Compounded Annual ROR Since Inception | 7.50% | −4.78% | 16.63% | 20.79% | 21.73% | 13.95% | 13.10% | 12.92% | 12.10% | 14.99% | 16.21% |
| Compounded Annual ROR Last 5 Years * | 5.20% | −4.78% | 9.07% | 8.90% | 6.95% | 10.95% | 9.91% | 10.50% | 5.70% | 8.07% | 10.62% |
| Worst Drawdown Period Since Inception | May-2003 to Aug-2004 | Oct-2009 to Aug-2011 | Sep-2003 to Nov-2003 | Dec-1991 to May-1992 | June-1995 to Ma-1996 | Jan- 2009 to Jan-2010 | Sep-2009 to Jun-2011 | Jun-1995 to Aug-1998 | Aug-1993 to Apr-1994 | Feb-2009 to Jan-2010 | Oct-2001 to Feb-2002 |
| Worst Drawdown Percentage Since Inception | −28.60% | −11.63% | −10.70% | −40.39% | −45.16% | −12.20% | −12.48% | −29.81% | −29.80% | −15.15% | −25.59% |
| Worst Drawdown Period Last 5 Years * | Apr-2008 to Aug-2008 | Oct-2009 to Aug-2011 | Jun-2007 to Aug-2007 | Apr-2011 to Dec-2011 | Jan-2009 to Feb-2010 | Jan- 2009 to Jan-2010 | Sep-2009 to Jun-2011 | May-2011 to Dec-2011 | Dec-2009 to Jul-2010 | Feb-2009 to Jan-2010 | Jan-2007 to Mar-2007 |
| Worst Drawdown Percentage Last 5 Years * | −15.84% | −11.63% | −5.50% | −24.81% | −24.56% | −12.20% | −12.48% | −19.33% | −20.67% | −15.15% | −9.65% |
| Annualized Standard Deviation Since Inception | 15.50% | 12.62% | 10.37% | 29.80% | 48.93% | 14.46% | 11.00% | 22.21% | 21.90% | 14.25% | 17.99% |
| Annualized Standard Deviation Last 5 Years * | 13.20% | 12.62% | 8.03% | 16.61% | 17.47% | 15.98% | 10.04% | 16.45% | 16.00% | 11.82% | 10.61% |
* 5 year period=1/2006 to 12/2011 or since inception for shorter track records.
______________________________
Notes:
(1) The range and average of margin to equity ratio for Rabar is computed without giving effect to certain foreign currency contracts which are traded in the OTC foreign exchange markets. Depending upon the margin requirements imposed by the particular clearing firm, inclusion of these markets would likely increase the range and average of the margin to equity ratio, in some cases significantly.
This table and chart was prepared by Dearborn Capital Management, L.L.C.
based on unaudited information provided to Dearborn by each trading advisor.
See the glossary in Appendix E for definitions relevant to this table.
ALL PERFORMANCE REPORTED IS NET OF FEES AND EXPENSES.
PAST PERFORMANCE IS NOT INDICATIVE OF FUTURE RESULTS.