UNITED STATES
SECURITIES AND EXCHANGE COMMISSION
WASHINGTON, D. C. 20549
FORM N-CSRS
Investment Company Act file number: 811-05767
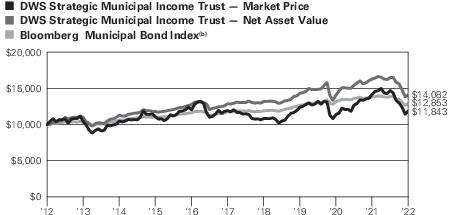
DWS Strategic Municipal Income Trust
(Exact Name of Registrant as Specified in Charter)
875 Third Avenue
New York, NY 10022-6225
(Address of Principal Executive Offices) (Zip Code)
Registrant’s Telephone Number, including Area Code: (212) 454-4500
Diane Kenneally
100 Summer Street
Boston, MA 02110
(Name and Address of Agent for Service)
| Date of fiscal year end: | 11/30 |
| Date of reporting period: | 5/31/2022 |
| ITEM 1. | REPORT TO STOCKHOLDERS |
| (a) | |


| 2 | | | DWS Strategic Municipal Income Trust |
| Performance Summary | May 31, 2022 (Unaudited) |
| Average Annual Total Returns as of 5/31/22 | ||||
| DWS Strategic Municipal Income Trust | 6-Months ‡ | 1-Year | 5-Year | 10-Year |
| Based on Net Asset Value(a) | –14.49% | –13.51% | 1.82% | 3.48% |
| Based on Market Price(a) | –19.38% | –16.36% | –0.12% | 1.71% |
| Bloomberg Municipal Bond Index(b) | –7.32% | –6.79% | 1.78% | 2.54% |
| Morningstar Closed-End High-Yield Municipal Funds Category(c) | –12.34% | –10.67% | 2.30% | 4.00% |
| ‡ | Total returns shown for periods less than one year are not annualized. |
| DWS Strategic Municipal Income Trust | | | 3 |
| (a) | Total return based on net asset value reflects changes in the Fund’s net asset value during each period. Total return based on market price reflects changes in market price. Each figure assumes that dividend and capital gain distributions, if any, were reinvested. These figures will differ depending upon the level of any discount from or premium to net asset value at which the Fund’s shares traded during the period. Expenses of the Fund include management fee, interest expense and other fund expenses. Total returns shown take into account these fees and expenses. The expense ratio of the Fund for the six months ended May 31, 2022 was 2.07% (1.16% excluding interest expense). |
| (b) | The unmanaged, unleveraged Bloomberg Municipal Bond Index covers the U.S. dollar-denominated long-term tax exempt bond market. The index has four main sectors: state and local general obligation bonds, revenue bonds, insured bonds and pre-refunded bonds. Index returns do not reflect any fees or expenses and it is not possible to invest directly into an index. |
| (c) | Morningstar’s Closed-End High-Yield Municipal Funds category represents high-yield muni portfolios that typically invest at least 50% of assets in high-income municipal securities that are not rated or that are rated by a major agency such as Standard & Poor’s or Moody’s at the level of BBB and below (considered part of the high-yield universe within the municipal industry). Morningstar figures represent the average of the total returns based on net asset value reported by all of the closed-end funds designated by Morningstar, Inc. as falling into the Closed-End High-Yield Municipal Funds category. Category returns assume reinvestment of all distributions. It is not possible to invest directly in a Morningstar category. |
| Net Asset Value and Market Price | ||
| As of 5/31/22 | As of 11/30/21 | |
| Net Asset Value | $ 10.70 | $ 12.82 |
| Market Price | $ 9.82 | $ 12.48 |
| Premium (discount) | (8.22%) | (2.65%) |
| 4 | | | DWS Strategic Municipal Income Trust |
| Distribution Information | |
| Six Months as of 5/31/22: Income Dividends (common shareholders) | $ .26 |
| May Income Dividend (common shareholders) | $ .04 |
| Current Annualized Distribution Rate (based on Net Asset Value) as of 5/31/22† | 4.49% |
| Current Annualized Distribution Rate (based on Market Price) as of 5/31/22† | 4.89% |
| Tax Equivalent Distribution Rate (based on Net Asset Value) as of 5/31/22† | 7.58% |
| Tax Equivalent Distribution Rate (based on Market Price) as of 5/31/22† | 8.26% |
| † | Current annualized distribution rate is the latest monthly dividend shown as an annualized percentage of net asset value/market price on May 31, 2022. Distribution rate simply measures the level of dividends and is not a complete measure of performance. Tax equivalent distribution rate is based on the Fund’s distribution rate and a marginal income tax rate of 40.8%. Distribution rates are historical, not guaranteed and will fluctuate. Distributions do not include return of capital or other non-income sources. |
| DWS Strategic Municipal Income Trust | | | 5 |
| 6 | | | DWS Strategic Municipal Income Trust |
| Portfolio Summary | (Unaudited) |
| Asset Allocation (As a % of Investment Portfolio excluding Open-End Investment Companies) | 5/31/22 | 11/30/21 |
| Revenue Bonds | 76% | 76% |
| General Obligation Bonds | 8% | 9% |
| Escrow to Maturity/Prerefunded Bonds | 8% | 8% |
| Lease Obligations | 7% | 7% |
| Variable Rate Demand Notes | 1% | 0% |
| 100% | 100% |
| Quality (As a % of Investment Portfolio excluding Open-End Investment Companies) | 5/31/22 | 11/30/21 |
| AAA | 1% | 1% |
| AA | 19% | 20% |
| A | 38% | 36% |
| BBB | 19% | 22% |
| BB | 6% | 5% |
| B | 0% | 0% |
| Not Rated | 17% | 16% |
| 100% | 100% |
| Top Five State/Territory Allocations (As a % of Investment Portfolio excluding Open-End Investment Companies) | 5/31/22 | 11/30/21 |
| Florida | 10% | 9% |
| New York | 10% | 10% |
| Illinois | 10% | 10% |
| Texas | 9% | 10% |
| Washington | 6% | 6% |
| DWS Strategic Municipal Income Trust | | | 7 |
| Interest Rate Sensitivity | 5/31/22 | 11/30/21 |
| Effective Maturity | 9.2 years | 5.6 years |
| Modified Duration | 6.7 years | 5.2 years |
| Leverage (As a % of Total Assets) | 5/31/22 | 11/30/21 |
| 41.25% | 36.96% |
| 8 | | | DWS Strategic Municipal Income Trust |
| Investment Portfolio | as of May 31, 2022 (Unaudited) |
| Principal Amount ($) | Value ($) | ||
| Municipal Investments 151.2% | |||
| Alabama 0.3% | |||
| Alabama, UAB Medicine Finance Authority Revenue, Series B2, 5.0%, 9/1/2041 | 325,000 | 344,075 | |
| Alaska 1.6% | |||
| Alaska, Industrial Development & Export Authority Revenue, Tanana Chiefs Conference Project, Series A, 4.0%, 10/1/2049 | 2,000,000 | 1,964,551 | |
| Arizona 3.9% | |||
| Arizona, State Industrial Development Authority, Education Facility Revenue, Odyssey Preparatory Academy Project, 144A, 5.0%, 7/1/2049 | 175,000 | 175,850 | |
| Arizona, State University, Green Bond, Series A, 5.0%, 7/1/2043 | 2,000,000 | 2,253,275 | |
| Maricopa County, AZ, Industrial Development Authority, Education Revenue, Legacy Traditional Schools Project, Series B, 144A, 5.0%, 7/1/2049 | 150,000 | 152,497 | |
| Phoenix, AZ, Civic Improvement Corp., Rental Car Facility Revenue, Series A, 4.0%, 7/1/2045 | 500,000 | 499,629 | |
| Phoenix, AZ, Industrial Development Authority, Education Facility Revenue, Leman Academy of Excellence, ORO Valley Project: | |||
| Series A, 144A, 5.0%, 7/1/2038 | 195,000 | 197,556 | |
| Series A, 144A, 5.25%, 7/1/2048 | 250,000 | 253,327 | |
| Pima County, AZ, Industrial Development Authority, Education Revenue, American Leadership Academy Project: | |||
| Series 2022, 144A, 4.0%, 6/15/2051 | 460,000 | 395,712 | |
| Series 2022, 144A, 4.0%, 6/15/2057 | 55,000 | 45,899 | |
| Yavapai County, AZ, Industrial Development Authority, Hospital Facility, Regional Medical Center, 4.0%, 8/1/2043 | 675,000 | 683,327 | |
| 4,657,072 | |||
| California 7.7% | |||
| California, Morongo Band of Mission Indians Revenue, Series B, 144A, 5.0%, 10/1/2042 | 115,000 | 124,171 | |
| California, M-S-R Energy Authority, Series B, 7.0%, 11/1/2034, GTY: Citigroup Global Markets | 1,310,000 | 1,672,265 | |
| California, Public Finance Authority Revenue, Sharp Healthcare Obligated Group, Series B, 0.57% (a), 6/1/2022, LOC: Barclays Bank PLC | 100,000 | 100,000 | |
| California, State General Obligation, 5.0%, 11/1/2043 | 1,300,000 | 1,354,349 | |
| DWS Strategic Municipal Income Trust | | | 9 |
| Principal Amount ($) | Value ($) | ||
| California, State Health Facilities Financing Authority Revenue, Adventist Health System, Series B, 0.62% (a), 6/1/2022, LOC: U.S. Bank NA | 200,000 | 200,000 | |
| California, State Municipal Finance Authority Revenue, LAX Integrated Express Solutions LLC, LINXS Apartment Project: | |||
| Series A, AMT, 5.0%, 12/31/2043 | 300,000 | 313,548 | |
| Series A, AMT, 5.0%, 12/31/2047 | 160,000 | 166,414 | |
| Series A, AMT, 5.0%, 6/1/2048 | 60,000 | 62,342 | |
| California, State Public Finance Authority Revenue, ENSO Village Project: | |||
| Series A, 144A, 5.0%, 11/15/2046 | 55,000 | 55,204 | |
| Series A, 144A, 5.0%, 11/15/2051 | 25,000 | 24,961 | |
| California, Statewide Communities Development Authority Revenue, Loma Linda University Medical Center: | |||
| Series A, 5.25%, 12/1/2044 | 195,000 | 199,913 | |
| Series A, 144A, 5.25%, 12/1/2056 | 735,000 | 748,590 | |
| Series A, 5.5%, 12/1/2054 | 195,000 | 200,639 | |
| Series A, 144A, 5.5%, 12/1/2058 | 105,000 | 108,588 | |
| California, Tobacco Securitization Authority of Northern California, Tobacco Settlement Revenue, Series B-2, Zero Coupon, 6/1/2060 | 535,000 | 99,363 | |
| Riverside County, CA, Transportation Commission Toll Revenue Senior Lien, Series A, Prerefunded, 5.75%, 6/1/2048 | 1,000,000 | 1,041,831 | |
| San Francisco, CA, City & County Airports Commission, International Airport Revenue: | |||
| Series A, AMT, 5.0%, 5/1/2044 | 1,000,000 | 1,033,942 | |
| Series A, AMT, 5.0%, 5/1/2049 | 1,110,000 | 1,196,004 | |
| San Joaquin Hills, CA, Transportation Corridor Agency, Toll Road Revenue, Series A, Prerefunded, 5.0%, 1/15/2050 | 445,000 | 478,733 | |
| San Mateo County, CA, Transportation Authority, Sales Tax Revenue, Series B, 0.52% (a), 6/1/2022, LOC: Bank of America NA | 100,000 | 100,000 | |
| 9,280,857 | |||
| Colorado 5.4% | |||
| Colorado, North Range Metropolitan District No. 3, Series A, 5.25%, 12/1/2050 | 500,000 | 496,344 | |
| Colorado, Park Creek Metropolitan District Revenue, Senior Ltd. Property Tax Supported, Series A, 5.0%, 12/1/2045 | 235,000 | 249,860 | |
| Colorado, Public Energy Authority, Natural Gas Purchased Revenue, 6.25%, 11/15/2028, GTY: Merrill Lynch & Co. | 635,000 | 719,570 | |
| Colorado, State Health Facilities Authority Revenue, CommonSpirit Health, Series A-2, 5.0%, 8/1/2044 | 1,000,000 | 1,044,154 | |
| 10 | | | DWS Strategic Municipal Income Trust |
| Principal Amount ($) | Value ($) | ||
| Colorado, State Health Facilities Authority Revenue, School Health Systems, Series A, 5.5%, 1/1/2035 | 1,000,000 | 1,045,025 | |
| Colorado, State Health Facilities Authority, Hospital Revenue, Covenant Retirement Communities Obligated Group, Series A, 5.0%, 12/1/2048 | 260,000 | 270,734 | |
| Denver City & County, CO, Special Facilities Airport Revenue, United Airlines, Inc. Project, AMT, 5.0%, 10/1/2032 | 200,000 | 200,837 | |
| Denver, CO, City & County Airport Revenue: | |||
| Series A, AMT, 5.0%, 12/1/2048 | 585,000 | 623,148 | |
| Series A, AMT, 5.25%, 11/15/2043 | 600,000 | 619,379 | |
| Denver, CO, Health & Hospital Authority, Certificate of Participations, 5.0%, 12/1/2048 | 140,000 | 148,304 | |
| Denver, CO, Health & Hospital Authority, Healthcare Revenue, Series A, 4.0%, 12/1/2040 | 300,000 | 300,375 | |
| Douglas County, CO, Rampart Range Metropolitan District No. 5, Series 2021, 4.0%, 12/1/2051 | 1,000,000 | 798,321 | |
| 6,516,051 | |||
| Connecticut 0.1% | |||
| Connecticut, Steel Point Infrastructure Improvement District Special Obligation Revenue, Steelpointe Harbor Project, 144A, 4.0%, 4/1/2051 | 100,000 | 87,011 | |
| District of Columbia 2.2% | |||
| District of Columbia, Latin American Montessori Bilingual Public Charter School, 5.0%, 6/1/2050 | 1,220,000 | 1,249,875 | |
| District of Columbia, Metropolitan Airport Authority Systems Revenue: | |||
| Series A, AMT, 5.0%, 10/1/2038 | 200,000 | 205,481 | |
| Series A, AMT, 5.0%, 10/1/2043 | 850,000 | 872,864 | |
| District of Columbia, Metropolitan Airport Authority, Dulles Toll Road Revenue, Dulles Metrorail & Capital Improvement Project, Series B, 4.0%, 10/1/2049 | 320,000 | 306,214 | |
| 2,634,434 | |||
| Florida 12.7% | |||
| Brevard County, FL, Health Facilities Authority, Hospital Revenue, Health First, Inc., Series A, 4.0%, 4/1/2052 | 500,000 | 478,402 | |
| Broward County, FL, Airport Systems Revenue: | |||
| Series A, AMT, 4.0%, 10/1/2044 | 145,000 | 144,846 | |
| Series A, AMT, 4.0%, 10/1/2049 | 230,000 | 229,297 | |
| Charlotte County, FL, Industrial Development Authority, Utility System Revenue, Town & Country Utilities Project, Series A, 144A, AMT, 4.0%, 10/1/2051, GTY: Babcock Ranch IRR LLC | 190,000 | 157,264 | |
| DWS Strategic Municipal Income Trust | | | 11 |
| Principal Amount ($) | Value ($) | ||
| Collier County, FL, Industrial Development Authority, Continuing Care Community Revenue, Arlington of Naples Project, Series A, 144A, 8.125%, 5/15/2044* (b) | 290,000 | 197,200 | |
| Davie, FL, Educational Facilities Revenue, Nova Southeastern University Project, 5.0%, 4/1/2048 | 335,000 | 360,076 | |
| Florida, Capital Trust Agency, Educational Facilities Authority, Charter Educational Foundation Project, Series A, 144A, 5.375%, 6/15/2048 | 230,000 | 231,702 | |
| Florida, Capital Trust Agency, Educational Growth Fund LLC, Charter School Portfolio Project, Series A-1, 144A, 5.0%, 7/1/2056 | 240,000 | 242,434 | |
| Florida, Development Finance Corp., Educational Facilities Revenue, Mater Academy Projects, Series A, 5.0%, 6/15/2055 | 265,000 | 271,665 | |
| Florida, Development Finance Corp., Educational Facilities Revenue, River City Science Academy Project: | |||
| Series A-1, 5.0%, 7/1/2042 | 20,000 | 20,887 | |
| Series B, 5.0%, 7/1/2042 (c) | 20,000 | 19,953 | |
| Series A-1, 5.0%, 7/1/2051 | 15,000 | 15,499 | |
| Series B, 5.0%, 7/1/2051 (c) | 30,000 | 29,355 | |
| Series A-1, 5.0%, 2/1/2057 | 25,000 | 25,542 | |
| Series B, 5.0%, 7/1/2057 (c) | 30,000 | 28,637 | |
| Florida, Development Finance Corp., Surface Transportation Facilities Revenue, Brightline Passenger Rail Project, Series B, 144A, AMT, 7.375%, 1/1/2049 | 750,000 | 758,923 | |
| Florida, Development Finance Corp., Surface Transportation Facilities Revenue, Virgin Trains USA Passenger Rail Project: | |||
| Series A, 144A, AMT, 6.375% (d), 1/1/2049 | 155,000 | 152,014 | |
| Series A, 144A, AMT, 6.5% (d), 1/1/2049 | 170,000 | 164,352 | |
| Florida, State Atlantic University Finance Corp., Capital Improvements Revenue, Student Housing Project, Series B, 4.0%, 7/1/2044 | 1,685,000 | 1,722,844 | |
| Florida, State Development Finance Corp., Senior Living Revenue, The Cabana at Jensen Dunes Project, Series A, 144A, 5.25%, 11/15/2056 | 1,000,000 | 782,860 | |
| Florida, State Higher Educational Facilities Financial Authority Revenue, Florida Institute of Technology, 4.0%, 10/1/2049 | 1,000,000 | 916,136 | |
| Florida, Tolomato Community Development District, Special Assessment: | |||
| Series 2015-2, Step-up Coupon, 0.0% to 11/1/2024, 6.61% to 5/1/2040 | 150,000 | 118,330 | |
| Series 3, 6.55%, 5/1/2027* (b) | 130,000 | 1 | |
| Series 2015-3, 6.61%, 5/1/2040* (b) | 165,000 | 2 | |
| 12 | | | DWS Strategic Municipal Income Trust |
| Principal Amount ($) | Value ($) | ||
| Florida, Village Community Development District No. 12, Special Assessment Revenue: | |||
| 144A, 4.25%, 5/1/2043 | 375,000 | 362,027 | |
| 144A, 4.375%, 5/1/2050 | 280,000 | 270,570 | |
| Florida, Village Community Development District No. 13, Special Assessment Revenue, Series 2021, 3.25%, 5/1/2052 | 265,000 | 213,063 | |
| Greater Orlando, FL, Aviation Authority Airport Facilities Revenue, Series A, AMT, 5.0%, 10/1/2047 | 400,000 | 424,249 | |
| Hillsborough County, FL, Aviation Authority, Tampa International Airport, Series A, AMT, 5.0%, 10/1/2048 | 500,000 | 534,737 | |
| Miami Beach, FL, Health Facilities Authority, Mount Sinai Medical Center, 5.0%, 11/15/2044 | 500,000 | 511,949 | |
| Miami-Dade County, FL, Aviation Revenue, Series B, AMT, 5.0%, 10/1/2040 | 470,000 | 497,645 | |
| Miami-Dade County, FL, Health Facilities Authority Hospital Revenue, Nicklaus Children’s Hospital, 5.0%, 8/1/2047 | 665,000 | 699,065 | |
| Orange County, FL, Health Facilities Authority Revenue, Orlando Health Obligated Group, 4.0%, 10/1/2052 | 1,525,000 | 1,535,208 | |
| Seminole County, FL, Industrial Development Authority, Legacy Pointe At UCF Project, Series A, 5.5%, 11/15/2049 | 365,000 | 341,502 | |
| Tallahassee, FL, Health Facilities Revenue, Memorial Healthcare, Inc. Project, Series A, 5.0%, 12/1/2055 | 1,150,000 | 1,189,205 | |
| Tampa-Hillsborough County, FL, Expressway Authority, Series A, Prerefunded, 5.0%, 7/1/2037 | 1,590,000 | 1,594,955 | |
| 15,242,396 | |||
| Georgia 4.6% | |||
| Americus-Sumter County, GA, Hospital Authority, Magnolia Manor Obligated Group, Series A, Prerefunded, 6.25%, 5/15/2033 | 1,000,000 | 1,043,412 | |
| Atlanta, GA, Development Authority Revenue Bonds, Series A-1, 5.0%, 7/1/2027 | 70,000 | 75,153 | |
| Cobb County, GA, Kennestone Hospital Authority, Revenue Anticipation Certificates, Wellstar Health System, Inc. Project, Series A, 5.0%, 4/1/2047 | 175,000 | 186,211 | |
| DeKalb County, GA, Water & Sewer Revenue, Series A, 5.25%, 10/1/2036 | 1,000,000 | 1,002,154 | |
| Fulton County, GA, Development Authority Hospital Revenue, Revenue Anticipation Certificates, Wellstar Health System, Series A, 5.0%, 4/1/2042 | 210,000 | 224,663 | |
| Fulton County, GA, Development Authority Hospital Revenue, Wellstar Health System, Obligated Inc. Project, Series A, 4.0%, 4/1/2050 | 225,000 | 225,421 | |
| DWS Strategic Municipal Income Trust | | | 13 |
| Principal Amount ($) | Value ($) | ||
| Gainesville & Hall County, GA, Hospital Authority, Northeast Georgia Health System, Inc. Project, Series A, Prerefunded, 5.5%, 8/15/2054 | 180,000 | 196,673 | |
| George L Smith II, GA, Congress Center Authority, Convention Center Hotel Second Tier, Series B, 144A, 5.0%, 1/1/2054 | 620,000 | 597,420 | |
| Georgia, Main Street Natural Gas, Inc., Gas Project Revenue, Series A, 5.5%, 9/15/2024, GTY: Merrill Lynch & Co. | 1,220,000 | 1,293,493 | |
| Georgia, Private Colleges & Universities Authority Revenue, Mercer University Project, 4.0%, 10/1/2050 | 665,000 | 645,061 | |
| 5,489,661 | |||
| Hawaii 1.2% | |||
| Hawaii, State Airports Systems Revenue, Series A, AMT, 5.0%, 7/1/2041 | 695,000 | 731,379 | |
| Hawaii, State Department of Budget & Finance, Special Purpose Revenue, 3.2%, 7/1/2039 | 745,000 | 660,831 | |
| 1,392,210 | |||
| Illinois 16.4% | |||
| Chicago, IL, Board of Education: | |||
| Series A, 4.0%, 12/1/2047 | 570,000 | 535,255 | |
| Series A, 5.0%, 12/1/2032 | 105,000 | 110,883 | |
| Series A, 5.0%, 12/1/2033 | 100,000 | 105,425 | |
| Series H, 5.0%, 12/1/2036 | 245,000 | 255,855 | |
| Series H, 5.0%, 12/1/2046 | 140,000 | 144,533 | |
| Chicago, IL, General Obligation: | |||
| Series A, 5.0%, 1/1/2036 | 500,000 | 507,434 | |
| Series A, 5.0%, 1/1/2044 | 200,000 | 208,892 | |
| Series D, 5.5%, 1/1/2037 | 750,000 | 780,287 | |
| Series A, 5.5%, 1/1/2049 | 115,000 | 123,069 | |
| Series A, 6.0%, 1/1/2038 | 555,000 | 605,219 | |
| Chicago, IL, O’Hare International Airport Revenue: | |||
| Series A, AMT, 5.0%, 1/1/2037 | 1,500,000 | 1,595,102 | |
| Series C, AMT, 5.0%, 1/1/2046 | 1,000,000 | 1,017,361 | |
| Chicago, IL, O’Hare International Airport Revenue, Senior Lien: | |||
| Series D, AMT, 5.0%, 1/1/2047 | 415,000 | 433,008 | |
| Series D, AMT, 5.0%, 1/1/2052 | 560,000 | 582,810 | |
| Chicago, IL, O’Hare International Airport, Special Facility Revenue, AMT, 5.0%, 7/1/2048 | 130,000 | 136,053 | |
| Chicago, IL, Transit Authority, Sales Tax Receipts Revenue, Second Lien, Series A, 4.0%, 12/1/2050 | 95,000 | 95,604 | |
| 14 | | | DWS Strategic Municipal Income Trust |
| Principal Amount ($) | Value ($) | ||
| Illinois, Metropolitan Pier & Exposition Authority Revenue, McCormick Place Expansion Project, Series A, 5.0%, 6/15/2057 | 390,000 | 413,562 | |
| Illinois, Metropolitan Pier & Exposition Authority, Dedicated State Tax Revenue, Capital Appreciation-McCormick, Series A, Zero Coupon, 6/15/2036, INS: NATL | 3,000,000 | 1,699,676 | |
| Illinois, State Finance Authority Revenue, Evangelical Retirement Homes, 5.0%, 2/15/2037 | 1,000,000 | 687,875 | |
| Illinois, State Finance Authority Revenue, Northshore University Health System, Series A, 5.0%, 8/15/2051 | 1,000,000 | 1,117,354 | |
| Illinois, State Finance Authority Revenue, OSF Healthcare Systems, Series A, 5.0%, 11/15/2045 | 525,000 | 547,012 | |
| Illinois, State Finance Authority, Health Services Facilities Lease Revenue, University of Health Services Facility Project, 4.0%, 10/1/2050 | 1,400,000 | 1,340,080 | |
| Illinois, State General Obligation: | |||
| Series D, 5.0%, 11/1/2027 | 500,000 | 547,261 | |
| 5.0%, 2/1/2029 | 495,000 | 531,017 | |
| Series A, 5.0%, 10/1/2033 | 620,000 | 651,154 | |
| Series B, 5.0%, 10/1/2033 | 395,000 | 414,848 | |
| 5.0%, 2/1/2039 | 2,000,000 | 2,023,743 | |
| 5.0%, 5/1/2039 | 315,000 | 319,288 | |
| Series A, 5.0%, 12/1/2042 | 435,000 | 448,617 | |
| Series A, 5.0%, 3/1/2046 | 135,000 | 140,695 | |
| Series A, 5.5%, 3/1/2042 (c) | 200,000 | 219,600 | |
| Series A, 5.5%, 3/1/2047 (c) | 185,000 | 201,803 | |
| 5.75%, 5/1/2045 | 590,000 | 644,368 | |
| Springfield, IL, Electric Revenue, Senior Lien, 5.0%, 3/1/2040, INS: AGMC | 385,000 | 408,568 | |
| 19,593,311 | |||
| Indiana 1.8% | |||
| Indiana, State Finance Authority Revenue, Greencroft Obligation Group, Series A, 7.0%, 11/15/2043 | 460,000 | 492,864 | |
| Indiana, State Finance Authority, Health Facilities Revenue, Baptist Healthcare System, Series A, 5.0%, 8/15/2051 | 1,560,000 | 1,636,726 | |
| 2,129,590 | |||
| Iowa 0.9% | |||
| Iowa, State Higher Education Loan Authority Revenue, Private College Facility, Des Moines University Project, 4.0%, 10/1/2045 | 1,000,000 | 959,635 | |
| DWS Strategic Municipal Income Trust | | | 15 |
| Principal Amount ($) | Value ($) | ||
| Iowa, Tobacco Settlement Authority Revenue: | |||
| “1", Series A-2, 4.0%, 6/1/2049 | 130,000 | 125,825 | |
| Series B-1, 4.0%, 6/1/2049 | 40,000 | 39,738 | |
| 1,125,198 | |||
| Kansas 0.2% | |||
| Wyandotte County, KS, Unified Government, Legends Apartments Garage & West Lawn Project, 4.5%, 6/1/2040 | 255,000 | 235,422 | |
| Kentucky 2.4% | |||
| Columbia, KY, Educational Development Revenue, Lindsey Wilson College Project, 5.0%, 12/1/2033 | 440,000 | 481,790 | |
| Kentucky, Public Transportation Infrastructure Authority Toll Revenue, 1st Tier-Downtown Crossing, Series A, Prerefunded, 6.0%, 7/1/2053 | 1,440,000 | 1,503,688 | |
| Kentucky, State Economic Development Finance Authority, Owensboro Health, Inc., Obligated Group: | |||
| Series A, 5.0%, 6/1/2045 | 130,000 | 134,913 | |
| Series A, 5.25%, 6/1/2041 | 190,000 | 200,299 | |
| Louisville & Jefferson county, KY, Metro Government Hospital Revenue, UOFL Health Project: | |||
| Series A, 5.0%, 5/15/2047 | 120,000 | 127,498 | |
| Series A, 5.0%, 5/15/2052 | 390,000 | 412,336 | |
| 2,860,524 | |||
| Louisiana 1.7% | |||
| Calcasieu Parish, LA, Memorial Hospital Service, District Hospital Revenue, 5.0%, 12/1/2039 | 500,000 | 531,507 | |
| Louisiana, New Orleans Aviation Board, General Airport North Terminal, Series B, AMT, 5.0%, 1/1/2048 | 140,000 | 146,963 | |
| Louisiana, Public Facilities Authority Revenue, Loyola University Project, 4.0%, 10/1/2051 | 325,000 | 310,184 | |
| Louisiana, Public Facilities Authority Revenue, Ochsner Clinic Foundation Project, 5.0%, 5/15/2046 | 1,000,000 | 1,049,973 | |
| 2,038,627 | |||
| Maryland 3.6% | |||
| Maryland, Stadium Authority Built To Learn Revenue, Series A, 4.0%, 6/1/2047 | 1,455,000 | 1,466,447 | |
| Maryland, State Economic Development Corp., Student Housing Revenue, Morgan State University Project: | |||
| 5.0%, 7/1/2050 | 125,000 | 129,199 | |
| 5.0%, 7/1/2056 | 1,225,000 | 1,264,473 | |
| 16 | | | DWS Strategic Municipal Income Trust |
| Principal Amount ($) | Value ($) | ||
| Maryland, State Health & Higher Educational Facilities Authority Revenue, Adventist Healthcare, Obligated Group, Series A, 5.5%, 1/1/2046 | 375,000 | 399,436 | |
| Maryland, State Health & Higher Educational Facilities Authority Revenue, Meritus Medical Center Obligated Group, 5.0%, 7/1/2040 | 1,000,000 | 1,036,885 | |
| 4,296,440 | |||
| Massachusetts 5.7% | |||
| Massachusetts, Educational Financing Authority, Series C, AMT, 3.0%, 7/1/2051 | 470,000 | 355,403 | |
| Massachusetts, State Development Finance Agency Revenue, Partners Healthcare System, Inc., Series Q, 5.0%, 7/1/2035 | 5,000,000 | 5,280,216 | |
| Massachusetts, State Development Finance Agency Revenue, Springfield College: | |||
| Series B, 4.0%, 6/1/2050 | 315,000 | 296,437 | |
| Series A, 4.0%, 6/1/2056 | 90,000 | 82,609 | |
| Massachusetts, State Educational Financing Authority, Educational Loan Revenue Bonds, Issue M, Series B, AMT, 2.0%, 7/1/2037 | 135,000 | 121,127 | |
| Massachusetts, State Health & Educational Facilities Authority Revenue, 0.7% (a), 6/7/2022 | 650,000 | 650,000 | |
| 6,785,792 | |||
| Michigan 1.0% | |||
| Detroit, MI, Water & Sewerage Department, Sewerage Disposal System Revenue, Series A, Prerefunded, 5.25%, 7/1/2039 | 280,000 | 280,940 | |
| Kentwood, MI, Economic Development Corp., Holland Home Obligated Group, Series 2022, 4.0%, 11/15/2043 | 420,000 | 373,228 | |
| Michigan, Finance Authority Revenue, Tobacco Settlement Asset Backed Senior Capital Appreciation Bonds, Series B-2, Zero Coupon, 6/1/2065 | 590,000 | 71,529 | |
| Michigan, State Finance Authority Revenue, Detroit Water & Sewer Department, Series C, 5.0%, 7/1/2035 | 90,000 | 94,944 | |
| Michigan, State Strategic Fund Ltd., Obligation Revenue, Graphic International LLC, Coated Recycled Board Machine Project, AMT, 4.0% (d), 10/1/2061 | 180,000 | 184,381 | |
| Tawas City, MI, Hospital Finance Authority, St. Joseph Health Services, Series A, ETM, 5.75%, 2/15/2023 | 165,000 | 165,627 | |
| 1,170,649 | |||
| Minnesota 1.0% | |||
| Duluth, MN, Economic Development Authority, Health Care Facilities Revenue, Essentia Health Obligated Group: | |||
| Series A, 5.0%, 2/15/2048 | 200,000 | 211,080 | |
| DWS Strategic Municipal Income Trust | | | 17 |
| Principal Amount ($) | Value ($) | ||
| Series A, 5.0%, 2/15/2053 | 565,000 | 594,796 | |
| Minneapolis, MN, Health Care Systems Revenue, Fairview Health Services, Series A, 5.0%, 11/15/2049 | 205,000 | 217,172 | |
| Minnesota, State Office of Higher Education Revenue, AMT, 2.65%, 11/1/2038 | 215,000 | 191,755 | |
| 1,214,803 | |||
| Mississippi 0.5% | |||
| West Rankin, MS, Utility Authority Revenue, Prerefunded, 5.0%, 1/1/2048, INS: AGMC | 500,000 | 573,187 | |
| Missouri 1.5% | |||
| Kansas City, MO, Industrial Development Authority, Airport Special Obligation, International Airport Terminal Modernization Project, Series B, AMT, 5.0%, 3/1/2046 | 1,000,000 | 1,068,884 | |
| Missouri, State Health & Educational Facilities Authority Revenue, Medical Research, Lutheran Senior Services: | |||
| 4.0%, 2/1/2042 | 365,000 | 346,362 | |
| Series A, 5.0%, 2/1/2046 | 65,000 | 66,391 | |
| Missouri, State Health & Educational Facilities Authority, Health Facilities Revenue, Lester E Cox Medical Centers, Series A, 5.0%, 11/15/2048 | 150,000 | 155,404 | |
| St. Louis, MO, Industrial Development Authority Financing Revenue, Ballpark Village Development Project, Series A, 4.75%, 11/15/2047 | 225,000 | 189,979 | |
| 1,827,020 | |||
| Nebraska 0.5% | |||
| Douglas County, NE, Hospital Authority No.2, Health Facilities, Children’s Hospital Obligated Group, 5.0%, 11/15/2047 | 535,000 | 561,405 | |
| Nebraska, Central Plains Energy Project, Gas Project Revenue, Series A, 5.0%, 9/1/2029, GTY: Goldman Sachs Group, Inc. | 70,000 | 76,902 | |
| 638,307 | |||
| Nevada 1.5% | |||
| Las Vegas Valley, NV, Water District, Series B, 5.0%, 6/1/2037 | 1,565,000 | 1,565,000 | |
| Reno, NV, Sales Tax Revenue, Transportation Rail Access, Series C, 144A, Zero Coupon, 7/1/2058 | 1,500,000 | 177,480 | |
| 1,742,480 | |||
| 18 | | | DWS Strategic Municipal Income Trust |
| Principal Amount ($) | Value ($) | ||
| New Hampshire 0.1% | |||
| New Hampshire, State Health & Educational Facilities Authority Revenue, Hillside Village: | |||
| Series A, 144A, 6.125%, 7/1/2037* (b) | 100,000 | 40,000 | |
| Series A, 144A, 6.25%, 7/1/2042* (b) | 125,000 | 50,000 | |
| 90,000 | |||
| New Jersey 6.1% | |||
| Atlantic County, NJ, Improvement Authority Lease Revenue, Atlantic City Campus Phase II Project, Series A, 4.0%, 7/1/2053, INS: AGMC | 125,000 | 125,216 | |
| Atlantic County, NJ, Improvement Authority Lease Revenue, General Obligation Bonds, Atlantic City Campus Phase II Project, Series A, 4.0%, 7/1/2047, INS: AGMC | 95,000 | 95,399 | |
| Essex County, NJ, Improvement Authority Network LLC, Student Housing Project, Series A, 4.0%, 8/1/2060, INS: BAM | 315,000 | 311,530 | |
| New Jersey, Economic Development Authority, Self Designated Social Bonds: | |||
| Series QQQ, 4.0%, 6/15/2046 | 40,000 | 39,629 | |
| Series QQQ, 4.0%, 6/15/2050 | 40,000 | 39,263 | |
| New Jersey, State Covid-19 General Obligation Emergency Bonds: | |||
| Series A, 4.0%, 6/1/2030 | 85,000 | 91,944 | |
| Series A, 4.0%, 6/1/2031 | 85,000 | 91,768 | |
| Series A, 4.0%, 6/1/2032 | 40,000 | 43,079 | |
| New Jersey, State Economic Development Authority Revenue, Series BBB, Prerefunded, 5.5%, 6/15/2030 | 895,000 | 1,024,351 | |
| New Jersey, State Economic Development Authority Revenue, Black Horse EHT Urban Renewal LLC Project, Series A, 144A, 5.0%, 10/1/2039 | 705,000 | 621,996 | |
| New Jersey, State Economic Development Authority Revenue, White Horse HMT Urban Renewal LLC Project, 144A, 5.0%, 1/1/2040 | 270,000 | 228,667 | |
| New Jersey, State Economic Development Authority, Special Facilities Revenue, Continental Airlines, Inc. Project, Series B, AMT, 5.625%, 11/15/2030 | 500,000 | 509,205 | |
| New Jersey, State Economic Development Authority, State Government Buildings Project: | |||
| Series A, 5.0%, 6/15/2042 | 115,000 | 122,422 | |
| Series A, 5.0%, 6/15/2047 | 130,000 | 137,021 | |
| New Jersey, State Health Care Facilities Financing Authority Revenue, University Hospital, Series A, 5.0%, 7/1/2046, INS: AGMC | 180,000 | 185,626 | |
| DWS Strategic Municipal Income Trust | | | 19 |
| Principal Amount ($) | Value ($) | ||
| New Jersey, State Health Care Facilities Financing Authority Revenue, Virtua Health, Inc., Series C, 0.55% (a), 6/1/2022, LOC: JPMorgan Chase Bank NA | 350,000 | 350,000 | |
| New Jersey, State Higher Education Assistance Authority, Student Loan Revenue: | |||
| Series B, AMT, 2.5%, 12/1/2040 | 205,000 | 189,471 | |
| Series B, AMT, 3.5%, 12/1/2039 | 200,000 | 199,311 | |
| New Jersey, State Transportation Trust Fund Authority, Series AA, 4.0%, 6/15/2045 | 175,000 | 174,090 | |
| New Jersey, State Transportation Trust Fund Authority, Transportation Program: | |||
| Series BB, 4.0%, 6/15/2050 | 180,000 | 176,681 | |
| Series AA, 5.0%, 6/15/2046 | 1,400,000 | 1,491,402 | |
| New Jersey, State Turnpike Authority Revenue, Series A, 4.0%, 1/1/2051 | 500,000 | 509,313 | |
| New Jersey, Tobacco Settlement Financing Corp.: | |||
| Series A, 5.0%, 6/1/2046 | 350,000 | 371,372 | |
| Series A, 5.25%, 6/1/2046 | 175,000 | 188,494 | |
| 7,317,250 | |||
| New Mexico 0.8% | |||
| New Mexico, State Mortgage Finance Authority, “I” , Series D, 3.25%, 7/1/2044 | 365,000 | 337,392 | |
| New Mexico, State Mortgage Finance Authority, Single Family Mortgage Program, “I” , Series C, 3.0%, 1/1/2052 | 660,000 | 653,764 | |
| 991,156 | |||
| New York 7.8% | |||
| Monroe County, NY, Industrial Development Corp. Revenue, St. Ann’s Community Project, 5.0%, 1/1/2050 | 750,000 | 682,240 | |
| New York, Brooklyn Arena Local Development Corp., Pilot Revenue, Barclays Center Project, Series A, 4.0%, 7/15/2035, INS: AGMC | 45,000 | 46,734 | |
| New York, Buffalo & Fort Erie Public Bridge Authority, 5.0%, 1/1/2047 | 1,000,000 | 1,097,811 | |
| New York, Metropolitan Transportation Authority Revenue: | |||
| Series D, 5.0%, 11/15/2033 | 500,000 | 534,478 | |
| Series D, 5.0%, 11/15/2038 | 275,000 | 283,710 | |
| Series E-1, 5.0%, 11/15/2042 | 70,000 | 70,750 | |
| Series E-1, Prerefunded, 5.0%, 11/15/2042 | 235,000 | 238,982 | |
| Series C-1, 5.0%, 11/15/2050 | 1,845,000 | 1,960,436 | |
| Series C-1, 5.25%, 11/15/2055 | 210,000 | 226,984 | |
| New York, Metropolitan Transportation Authority Revenue, Green Bond, Series D-3, 4.0%, 11/15/2049 | 500,000 | 484,121 | |
| 20 | | | DWS Strategic Municipal Income Trust |
| Principal Amount ($) | Value ($) | ||
| New York, Metropolitan Transportation Authority, Dedicated Tax Fund, Series A-1, 0.6% (a), 6/1/2022, LOC: TD Bank NA | 100,000 | 100,000 | |
| New York, State Dormitory Authority Revenues, Non-State Supported Debt, The New School: | |||
| Series A, 4.0%, 7/1/2047 | 50,000 | 48,653 | |
| Series A, 4.0%, 7/1/2052 | 60,000 | 57,595 | |
| New York, State Liberty Development Corp. Revenue, World Trade Center, “1-3” , 144A, 5.0%, 11/15/2044 | 415,000 | 416,793 | |
| New York, State Transportation Development Corp., Special Facilities Revenue, American Airlines, Inc., John F. Kennedy International Airport Project, AMT, 5.0%, 8/1/2031, GTY: American Airlines Group | 445,000 | 445,031 | |
| New York, State Transportation Development Corp., Special Facilities Revenue, Delta Air Lines, Inc., LaGuardia Airport C&D Redevelopment, AMT, 5.0%, 1/1/2033 | 100,000 | 103,844 | |
| New York, State Transportation Development Corp., Special Facilities Revenue, John F. Kennedy International Airport Project, AMT, 4.0%, 12/1/2042 | 300,000 | 289,067 | |
| New York, State Transportation Development Corp., Special Facilities Revenue, Laguardia Gateway Partners LLC, Redevelopment Project, Series A, AMT, 5.0%, 7/1/2041 | 1,200,000 | 1,243,818 | |
| New York, TSASC, Inc., Series A, 5.0%, 6/1/2041 | 60,000 | 63,385 | |
| New York, NY, General Obligation, Series I-4, 0.6% (a), 6/1/2022, LOC: TD Bank NA | 350,000 | 350,000 | |
| Port Authority of New York & New Jersey, Series 207, AMT, 5.0%, 9/15/2048 | 625,000 | 654,142 | |
| 9,398,574 | |||
| North Carolina 0.5% | |||
| New Hanover County, NC, Hospital Revenue, New Hanover Regional Medical Centre: | |||
| Prerefunded, 5.0%, 10/1/2042 | 260,000 | 294,743 | |
| Prerefunded, 5.0%, 10/1/2047 | 240,000 | 272,071 | |
| 566,814 | |||
| Ohio 5.2% | |||
| Buckeye, OH, Tobacco Settlement Financing Authority, “2” , Series B-2, 5.0%, 6/1/2055 | 2,360,000 | 2,397,289 | |
| Centerville, OH, Health Care Revenue, Graceworks Lutheran Services, 5.25%, 11/1/2047 | 220,000 | 221,121 | |
| Chillicothe, OH, Hospital Facilities Revenue, Adena Health System Obligated Group Project, 5.0%, 12/1/2047 | 445,000 | 469,141 | |
| Cleveland-Cuyahoga County, OH, Port Authority, Cultural Facility Revenue, Playhouse Square Foundation Project, 5.5%, 12/1/2043 | 1,290,000 | 1,369,434 | |
| DWS Strategic Municipal Income Trust | | | 21 |
| Principal Amount ($) | Value ($) | ||
| Ohio, Akron, Bath & Copley Joint Township Hospital District Revenue, 5.25%, 11/15/2046 | 615,000 | 649,119 | |
| Ohio, State Air Quality Development Authority, Exempt Facilities Revenue, Pratt Paper LLC Project: | |||
| 144A, AMT, 4.25%, 1/15/2038, GTY: Pratt Industries, Inc. | 70,000 | 69,839 | |
| 144A, AMT, 4.5%, 1/15/2048, GTY: Pratt Industries, Inc. | 225,000 | 225,766 | |
| Ohio, State Hospital Revenue, Aultman Health Foundation, 144A, 5.0%, 12/1/2048 | 500,000 | 472,945 | |
| Ohio, State Turnpike Commission, Junior Lien, Infrastructure Projects, Series A, 5.0%, 2/15/2039 (c) | 310,000 | 355,532 | |
| 6,230,186 | |||
| Oklahoma 0.9% | |||
| Oklahoma, State Development Finance Authority, Health System Revenue, OU Medicine Project: | |||
| Series B, 5.5%, 8/15/2052 | 180,000 | 184,669 | |
| Series B, 5.5%, 8/15/2057 | 880,000 | 898,127 | |
| 1,082,796 | |||
| Oregon 0.6% | |||
| Clackamas County, OR, Hospital Facilities Authority Revenue, Mary’s Woods at Marylhurst, Inc. Project, Series A, 5.0%, 5/15/2038 | 25,000 | 24,330 | |
| Oregon, Portland Airport Revenue, Series 25B, AMT, 5.0%, 7/1/2049 | 665,000 | 713,334 | |
| 737,664 | |||
| Pennsylvania 6.8% | |||
| Franklin County, PA, Industrial Development Authority Revenue, Menno Haven, Inc. Project: | |||
| 5.0%, 12/1/2043 | 60,000 | 59,454 | |
| 5.0%, 12/1/2054 | 175,000 | 168,213 | |
| Lancaster County, PA, Hospital Authority, Brethren Village Project: | |||
| 5.125%, 7/1/2037 | 100,000 | 100,952 | |
| 5.25%, 7/1/2041 | 100,000 | 101,195 | |
| Pennsylvania, Certificate of Participations, Series A, 5.0%, 7/1/2043 | 155,000 | 171,015 | |
| Pennsylvania, Commonwealth Financing Authority, Series A, 5.0%, 6/1/2035 | 315,000 | 338,260 | |
| Pennsylvania, Commonwealth Financing Authority, Tobacco Master Settlement Payment Revenue Bonds: | |||
| 5.0%, 6/1/2034 | 250,000 | 274,933 | |
| 5.0%, 6/1/2035 | 125,000 | 137,321 | |
| Pennsylvania, Geisinger Authority Health System Revenue, Series A-1, 5.0%, 2/15/2045 | 740,000 | 787,551 | |
| 22 | | | DWS Strategic Municipal Income Trust |
| Principal Amount ($) | Value ($) | ||
| Pennsylvania, State Economic Development Financing Authority Revenue, Bridges Finco LP: | |||
| 5.0%, 12/31/2034 | 1,000,000 | 1,042,865 | |
| 5.0%, 12/31/2038 | 1,000,000 | 1,037,904 | |
| Pennsylvania, State Turnpike Commission Revenue: | |||
| Series A, 4.0%, 12/1/2044 | 90,000 | 89,117 | |
| Series A, 4.0%, 12/1/2046 | 60,000 | 58,889 | |
| Series A-1, 5.0%, 12/1/2040 | 2,500,000 | 2,621,758 | |
| Series C, 5.0%, 12/1/2044 | 240,000 | 249,137 | |
| Philadelphia, PA, Authority For Industrial Development, Charter School Revenue, Philadelphia Electrical and Technology Charter High School Project, Series A, 4.0%, 6/1/2056 | 460,000 | 378,690 | |
| Philadelphia, PA, School District, Series B, 5.0%, 9/1/2043 | 500,000 | 549,651 | |
| 8,166,905 | |||
| South Carolina 3.4% | |||
| South Carolina, State Ports Authority Revenue, Series B, AMT, 4.0%, 7/1/2059 | 2,000,000 | 1,982,065 | |
| South Carolina, State Public Service Authority Revenue, Series E, 5.25%, 12/1/2055 | 1,070,000 | 1,123,696 | |
| South Carolina, State Public Service Authority Revenue, Santee Cooper, Series A, Prerefunded, 5.75%, 12/1/2043 | 890,000 | 942,885 | |
| 4,048,646 | |||
| South Dakota 0.4% | |||
| Lincon County, SD, Economic Development Revenue, Augustana College Association Project: | |||
| Series A, 4.0%, 8/1/2051 | 175,000 | 162,364 | |
| Series A, 4.0%, 8/1/2056 | 125,000 | 114,004 | |
| Series A, 4.0%, 8/1/2061 | 165,000 | 148,284 | |
| 424,652 | |||
| Tennessee 1.0% | |||
| Greeneville, TN, Health & Educational Facilities Board Hospital Revenue, Ballad Health Obligation Group: | |||
| Series A, 5.0%, 7/1/2037 | 300,000 | 321,935 | |
| Series A, 5.0%, 7/1/2044 | 400,000 | 425,228 | |
| Nashville & Davidson County, TN, Metropolitan Government Health & Education Facilities Board Revenue, Blakeford At Green Hills Corp., Series A, 4.0%, 11/1/2055 | 500,000 | 427,823 | |
| 1,174,986 | |||
| DWS Strategic Municipal Income Trust | | | 23 |
| Principal Amount ($) | Value ($) | ||
| Texas 15.7% | |||
| Central Texas, Regional Mobility Authority Revenue, Senior Lien: | |||
| Series A, Prerefunded, 5.0%, 1/1/2040 | 230,000 | 250,113 | |
| Series A, Prerefunded, 5.0%, 1/1/2043 | 1,500,000 | 1,530,569 | |
| Greater Texas, Cultural Education Facilities Finance Corp. Lease Revenue, Epicenter Multipurpose Facilities Project: | |||
| Series A, 4.0%, 3/1/2046 | 600,000 | 607,013 | |
| Series A, 4.0%, 3/1/2050 | 530,000 | 533,037 | |
| Houston, TX, Airport System Revenue, Series A, AMT, 5.0%, 7/1/2041 | 750,000 | 807,660 | |
| Matagorda County, TX, Navigation District No. 1, Pollution Control Revenue, AEP Texas Central Co. Project, Series A, 4.4%, 5/1/2030, INS: AMBAC | 1,250,000 | 1,330,279 | |
| Newark, TX, Higher Education Finance Corp., Education Revenue, Austin Achieve Public School, Inc., 5.0%, 6/15/2048 | 60,000 | 60,084 | |
| Newark, TX, Higher Education Finance Corp., Texas Revenue, Abilene Christian University Project, Series A, 4.0%, 4/1/2057 | 1,000,000 | 973,034 | |
| North Texas, Tollway Authority Revenue: | |||
| Series B, 5.0%, 1/1/2045 | 665,000 | 696,512 | |
| 5.0%, 1/1/2048 | 1,355,000 | 1,463,909 | |
| San Antonio, TX, Education Facilities Corp. Higher Education Revenue, Hallmark University Project: | �� | ||
| Series A, 5.0%, 10/1/2041 | 55,000 | 51,190 | |
| Series A, 5.0%, 10/1/2051 | 85,000 | 75,461 | |
| San Antonio, TX, Education Facilities Corp. Revenue, University of the Incarnate Word Project, Series A, 4.0%, 4/1/2054 | 690,000 | 641,065 | |
| Tarrant County, TX, Cultural Education Facilities Finance Corp. Revenue, Christus Health Obligated Group, Series B, 5.0%, 7/1/2048 | 1,000,000 | 1,065,915 | |
| Tarrant County, TX, Cultural Education Facilities Finance Corp., Buckner Retirement Services Revenue, 5.0%, 11/15/2046 | 1,000,000 | 1,061,576 | |
| Tarrant County, TX, Cultural Education Facilities Finance Corp., Hospital Revenue, Scott & White Healthcare, Prerefunded, 5.0%, 8/15/2043 | 2,100,000 | 2,184,597 | |
| Temple, TX, Tax Increment, Reinvestment Zone No. 1: | |||
| Series A, 4.0%, 8/1/2041, INS: BAM | 90,000 | 93,550 | |
| Series A, 5.0%, 8/1/2038 | 300,000 | 311,049 | |
| Texas, Grand Parkway Transportation Corp., System Toll Revenue, Series B, Prerefunded, 5.0%, 4/1/2053 | 500,000 | 521,551 | |
| 24 | | | DWS Strategic Municipal Income Trust |
| Principal Amount ($) | Value ($) | ||
| Texas, New Hope Cultural Education Facilities Finance Corp., Educational Revenue, Cumberland Academy Project, Series A, 144A, 5.0%, 8/15/2050 | 700,000 | 707,164 | |
| Texas, New Hope Cultural Education Facilities Finance Corp., Retirement Facilities Revenue, Presbyterian Village North Project: | |||
| 5.0%, 10/1/2039 | 180,000 | 175,306 | |
| Series A, 5.25%, 10/1/2055 | 2,000,000 | 1,897,558 | |
| Texas, New Hope Cultural Education Facilities Finance Corp., Retirement Facilities Revenue, Westminster Project, 4.0%, 11/1/2055 | 230,000 | 208,374 | |
| Texas, New Hope Cultural Education Facilities Finance Corp., Senior Living Revenue, Bridgemoor Plano Project, Series A, 7.25%, 12/1/2053 | 460,000 | 414,000 | |
| Texas, State Private Activity Bond, Surface Transportation Corp. Revenue, Senior Lien, North Tarrant Express Mobility Partners Segments LLC, AMT, 6.75%, 6/30/2043 | 280,000 | 291,026 | |
| Texas, State Transportation Commission, Turnpike Systems Revenue, Series C, 5.0%, 8/15/2034 | 825,000 | 851,053 | |
| 18,802,645 | |||
| Utah 2.1% | |||
| Salt Lake City, UT, Airport Revenue: | |||
| Series A, AMT, 5.0%, 7/1/2043 | 190,000 | 202,790 | |
| Series A, AMT, 5.0%, 7/1/2047 | 595,000 | 627,852 | |
| Series A, AMT, 5.0%, 7/1/2048 | 115,000 | 122,069 | |
| Utah, Infrastructure Agency Telecommunication Revenue: | |||
| 4.0%, 10/15/2041 | 100,000 | 89,152 | |
| Series 2019, 4.0%, 10/15/2042 | 650,000 | 575,230 | |
| Utah, Infrastructure Agency Telecommunications & Franchise Tax Revenue, Pleasant Gove City Project: | |||
| 4.0%, 10/15/2041 | 125,000 | 128,369 | |
| 4.0%, 10/15/2044 | 160,000 | 163,268 | |
| 4.0%, 10/15/2048 | 160,000 | 162,315 | |
| Utah, State Charter School Finance Authority, St. George Campus Project, Series A, 144A, 5.0%, 6/15/2052 | 170,000 | 170,119 | |
| Utah, State Charter School Financing Authority Revenue, Freedom Academy Foundation Project, 144A, 5.375%, 6/15/2048 | 320,000 | 328,714 | |
| 2,569,878 | |||
| Virginia 2.3% | |||
| Roanoke County, VA, Economic Development Authority, RSDL Care Facilities Revenue, Richfield Living: | |||
| Series 2020, 5.0%, 9/1/2050 | 220,000 | 160,833 | |
| Series A, 5.375%, 9/1/2054 | 500,000 | 381,150 | |
| DWS Strategic Municipal Income Trust | | | 25 |
| Principal Amount ($) | Value ($) | ||
| Virginia, Peninsula Town Center, Community Development Authority Revenue, Special Obligation: | |||
| 144A, 5.0%, 9/1/2037 | 100,000 | 100,961 | |
| 144A, 5.0%, 9/1/2045 | 400,000 | 402,897 | |
| Virginia, Small Business Financing Authority Revenue, 95 Express Lanes LLC Project, AMT, 4.0%, 1/1/2048 | 240,000 | 231,207 | |
| Virginia, Small Business Financing Authority, Elizabeth River Crossings OPCO LLC Project, AMT, 4.0%, 1/1/2040 (c) | 150,000 | 149,612 | |
| Virginia, Small Business Financing Authority, I-495 Hot Lanes Project: | |||
| AMT, 5.0%, 12/31/2052 | 250,000 | 269,445 | |
| AMT, 5.0%, 12/31/2057 | 125,000 | 133,834 | |
| Virginia, Small Business Financing Authority, Private Activity Revenue, Transform 66 P3 Project, AMT, 5.0%, 12/31/2056 | 865,000 | 897,402 | |
| 2,727,341 | |||
| Washington 5.5% | |||
| Klickitat County, WA, Public Hospital District No. 2 Revenue, Skyline Hospital: | |||
| 5.0%, 12/1/2037 | 100,000 | 97,601 | |
| 5.0%, 12/1/2046 | 500,000 | 456,504 | |
| Pierce County, WA, Bethel School District No. 403, 4.0%, 12/1/2037 | 1,000,000 | 1,059,594 | |
| Washington, Port of Seattle Revenue: | |||
| Series A, AMT, 5.0%, 5/1/2043 | 415,000 | 446,818 | |
| AMT, 5.0%, 4/1/2044 | 1,000,000 | 1,076,097 | |
| Washington, State Convention Center Public Facilities District, Series B, 3.0%, 7/1/2043 | 735,000 | 555,827 | |
| Washington, State Higher Educational Facilities Authority, Seattle University Project, 4.0%, 5/1/2050 | 1,180,000 | 1,185,433 | |
| Washington, State Housing Finance Commission, Non-Profit Housing Revenue, Rockwood Retirement Communities Project: | |||
| Series A, 144A, 5.0%, 1/1/2051 | 500,000 | 425,999 | |
| Series A, 144A, 7.375%, 1/1/2044 | 1,000,000 | 1,041,785 | |
| Washington, State Housing Finance Commission, The Hearthstone Project: | |||
| Series A, 144A, 5.0%, 7/1/2038 | 50,000 | 45,413 | |
| Series A, 144A, 5.0%, 7/1/2048 | 115,000 | 97,790 | |
| Series A, 144A, 5.0%, 7/1/2053 | 75,000 | 62,567 | |
| 6,551,428 | |||
| 26 | | | DWS Strategic Municipal Income Trust |
| Principal Amount ($) | Value ($) | ||
| West Virginia 0.7% | |||
| West Virginia, State Hospital Finance Authority, State University Health System Obligated Group, Series A, 5.0%, 6/1/2047 | 805,000 | 845,071 | |
| Wisconsin 6.5% | |||
| Wisconsin, Health Educational Facilities Authority, Covenant Communities, Inc. Project: | ��� | ||
| Series A-1, 5.0%, 7/1/2043 | 500,000 | 508,089 | |
| Series B, 5.0%, 7/1/2048 | 340,000 | 256,041 | |
| Wisconsin, Public Finance Authority, Education Revenue, Mountain Island Charter School Ltd.: | |||
| 5.0%, 7/1/2047 | 200,000 | 202,139 | |
| 5.0%, 7/1/2052 | 90,000 | 90,851 | |
| Wisconsin, Public Finance Authority, Education Revenue, Triad Educational Services Ltd., Series 2021 A, 4.0%, 6/15/2061 | 1,115,000 | 962,385 | |
| Wisconsin, Public Finance Authority, Fargo-Moorhead Metropolitan Area Flood Risk Management Project, AMT, 4.0%, 9/30/2051 | 645,000 | 598,296 | |
| Wisconsin, Public Finance Authority, Hospital Revenue, Series A, 5.0%, 10/1/2044 | 730,000 | 781,007 | |
| Wisconsin, Public Finance Authority, Hospital Revenue, Carson Valley Medical Center, Series A, 4.0%, 12/1/2051 | 310,000 | 292,861 | |
| Wisconsin, Public Finance Authority, Roseman University of Health Sciences Project: | |||
| 144A, 4.0%, 4/1/2042 | 100,000 | 90,873 | |
| 144A, 4.0%, 4/1/2052 | 100,000 | 86,199 | |
| Wisconsin, Public Finance Authority, Senior Living Community First Mortgage Revenue, Cedars Obligated Group: | |||
| 144A, 5.5%, 5/1/2039 | 520,000 | 488,377 | |
| 144A, 5.75%, 5/1/2054 | 370,000 | 343,090 | |
| Wisconsin, Public Finance Authority, Senior Living Revenue, Mary’s Woods at Marylhurst Project, Series A, 144A, 5.25%, 5/15/2052 | 1,000,000 | 964,886 | |
| Wisconsin, Public Finance Authority, Wisconsin Hotel Revenue, Senior Lien Grand Hyatt San Antonio Hotel, Series B, 144A, 6.0%, 2/1/2062 | 1,000,000 | 1,003,045 | |
| Wisconsin, Public Financing Authority, Retirement Facilities Revenue, Southminster, Inc.: | |||
| 144A, 5.0%, 10/1/2043 | 65,000 | 63,825 | |
| DWS Strategic Municipal Income Trust | | | 27 |
| Principal Amount ($) | Value ($) | ||
| 144A, 5.0%, 10/1/2053 | 535,000 | 509,774 | |
| Wisconsin, State Health & Educational Facilities Authority Revenue, Agnesian Healthcare, Inc., Series B, Prerefunded, 5.0%, 7/1/2036 | 500,000 | 518,268 | |
| 7,760,006 | |||
| Guam 0.3% | |||
| Guam, Government Waterworks Authority, Water & Wastewater System Revenue, Series A, 5.0%, 1/1/2050 | 70,000 | 76,912 | |
| Guam, International Airport Authority Revenue: | |||
| Series C, AMT, 6.375%, 10/1/2043 | 105,000 | 109,470 | |
| Series C, AMT, Prerefunded, 6.375%, 10/1/2043 | 110,000 | 116,437 | |
| Guam, Port Authority Revenue, Series A, 5.0%, 7/1/2048 | 65,000 | 69,980 | |
| 372,799 | |||
| Puerto Rico 5.8% | |||
| Puerto Rico, Commonwealth Aqueduct and Sewer Authority, Series A, 144A, 5.0%, 7/1/2047 | 1,000,000 | 1,039,017 | |
| Puerto Rico, General Obligation, Series A1, 4.0%, 7/1/2046 | 1,462,048 | 1,367,852 | |
| Puerto Rico, Sales Tax Financing Corp., Sales Tax Revenue: | |||
| Series A-1, Zero Coupon, 7/1/2046 | 3,476,000 | 1,057,648 | |
| Series A-1, 4.75%, 7/1/2053 | 2,500,000 | 2,515,254 | |
| Series A-1, 5.0%, 7/1/2058 | 1,000,000 | 1,019,216 | |
| 6,998,987 | |||
| Other 0.3% | |||
| Freddie Mac Multi-Family ML Certificates, “A-CA” , Series 2021-ML10, 2.046%, 6/25/2038 | 485,967 | 413,653 | |
| Total Municipal Investments (Cost $184,469,011) | 181,111,105 | ||
| Underlying Municipal Bonds of Inverse Floaters (e) 18.3% | |||
| Florida 4.6% | |||
| Orange County, FL, School Board, Certificate of Participations, Series C, 5.0%, 8/1/2034 (f) | 5,000,000 | 5,480,968 | |
| Trust: Orange County, FL, School Board, Series 2016-XM0182, 144A, 15.56%, 2/1/2024, Leverage Factor at purchase date: 4 to 1 | |||
| 28 | | | DWS Strategic Municipal Income Trust |
| Principal Amount ($) | Value ($) | ||
| New York 9.1% | |||
| New York, State Urban Development Corp. Revenue, Personal Income Tax, Series C-3, 5.0%, 3/15/2040 (f) | 5,000,000 | 5,523,819 | |
| Trust: New York, State Urban Development Corp. Revenue, Personal Income Tax, Series 2018-XM0580, 144A, 16.085%, 9/15/2025, Leverage Factor at purchase date: 4 to 1 | |||
| New York City, NY, Transitional Finance Authority, Building AID Revenue, Series S-1, 5.0%, 7/15/2037 (f) | 5,000,000 | 5,414,949 | |
| Trust: New York, Transitional Finance Authority Building AID Revenue, Series 2018-XM0619, 144A, 15.995%, 1/15/2024, Leverage Factor at purchase date: 4 to 1 | |||
| 10,938,768 | |||
| Washington 4.6% | |||
| Washington, State General Obligation, Series D, 5.0%, 2/1/2035 (f) | 5,000,000 | 5,513,778 | |
| Trust: Washington, State General Obligation, Series 2017-XM0477, 144A, 15.65%, 8/1/2024, Leverage Factor at purchase date: 4 to 1 | |||
| Total Underlying Municipal Bonds of Inverse Floaters (Cost $21,811,222) | 21,933,514 | ||
| Shares | Value ($) | ||
| Open-End Investment Companies 0.0% | |||
| BlackRock Liquidity Funds MuniCash Portfolio, Institutional Shares, 0.54% (g) (Cost $17,715) | 17,561 | 17,563 | |
| % of Net Assets | Value ($) | ||
| Total Investment Portfolio (Cost $206,297,948) | 169.5 | 203,062,182 | |
| Floating Rate Notes (e) | (12.5) | (15,000,000) | |
| Series 2020-1 VMTPS, net of deferred offering costs | (58.3) | (69,883,929) | |
| Other Assets and Liabilities, Net | 1.3 | 1,656,036 | |
| Net Assets Applicable to Common Shareholders | 100.0 | 119,834,289 | |
| * | Non-income producing security. |
| (a) | Variable rate demand notes are securities whose interest rates are reset periodically (usually daily mode or weekly mode) by remarketing agents based on current market levels, and are not directly set as a fixed spread to a reference rate. These securities may be redeemed at par by the holder through a put or tender feature, and are shown at their current rates as of May 31, 2022. Date shown reflects the earlier of demand date or stated maturity date. |
| (b) | Defaulted security or security for which income has been deemed uncollectible. |
| (c) | When-issued security. |
| DWS Strategic Municipal Income Trust | | | 29 |
| (d) | Variable or floating rate security. These securities are shown at their current rate as of May 31, 2022. For securities based on a published reference rate and spread, the reference rate and spread are indicated within the description above. Certain variable rate securities are not based on a published reference rate and spread but adjust periodically based on current market conditions, prepayment of underlying positions and/or other variables. Securities with a floor or ceiling feature are disclosed at the inherent rate, where applicable. |
| (e) | Securities represent the underlying municipal obligations of inverse floating rate obligations held by the Fund. The Floating Rate Notes represents leverage to the Fund and is the amount owed to the floating rate note holders. |
| (f) | Security forms part of the below inverse floater. The Fund accounts for these inverse floaters as a form of secured borrowing, by reflecting the value of the underlying bond in the investments of the Fund and the amount owed to the floating rate note holder as a liability. |
| (g) | Current yield; not a coupon rate. |
| 144A: Security exempt from registration under Rule 144A of the Securities Act of 1933. These securities may be resold in transactions exempt from registration, normally to qualified institutional buyers. |
| AGMC: Assured Guaranty Municipal Corp. |
| AMBAC: Ambac Financial Group, Inc. |
| AMT: Subject to alternative minimum tax. |
| BAM: Build America Mutual |
| ETM: Bonds bearing the description ETM (escrow to maturity) are collateralized usually by U.S. Treasury securities which are held in escrow and used to pay principal and interest on bonds so designated. |
| GTY: Guaranty Agreement |
| INS: Insured |
| LOC: Letter of Credit |
| NATL: National Public Finance Guarantee Corp. |
| Prerefunded: Bonds which are prerefunded are collateralized usually by U.S. Treasury securities which are held in escrow and used to pay principal and interest on tax-exempt issues and to retire the bonds in full at the earliest refunding date. |
| 30 | | | DWS Strategic Municipal Income Trust |
| Assets | Level 1 | Level 2 | Level 3 | Total |
| Municipal Investments (a) | $ — | $203,044,619 | $— | $203,044,619 |
| Open-End Investment Companies | 17,563 | — | — | 17,563 |
| Total | $17,563 | $203,044,619 | $ — | $203,062,182 |
| (a) | See Investment Portfolio for additional detailed categorizations. |
| DWS Strategic Municipal Income Trust | | | 31 |
| Assets | |
| Investment in securities, at value (cost $206,297,948) | $ 203,062,182 |
| Receivable for investments sold | 126,230 |
| Interest receivable | 2,890,022 |
| Other assets | 1,475 |
| Total assets | 206,079,909 |
| Liabilities | |
| Payable for investments purchased | 32,762 |
| Payable for investments purchased — when-issued securities | 1,033,426 |
| Payable for floating rate notes issued | 15,000,000 |
| Interest expense payable on preferred shares | 113,701 |
| Accrued management fee | 92,996 |
| Accrued Trustees' fees | 3,361 |
| Other accrued expenses and payables | 85,445 |
| Series 2020-1 VMTPS, net of deferred offering costs (liquidation value $70,000,000, see page 42 for more details) | 69,883,929 |
| Total liabilities | 86,245,620 |
| Net assets applicable to common shareholders, at value | $ 119,834,289 |
| Net Assets Applicable to Common Shareholders Consist of | |
| Distributable earnings (loss) | (7,222,357) |
| Paid-in capital | 127,056,646 |
| Net assets applicable to common shareholders, at value | $ 119,834,289 |
| Net Asset Value | |
| Net Asset Value per common share ($119,834,289 ÷ 11,203,941 outstanding shares of beneficial interest, $.01 par value, unlimited number of common shares authorized) | $ 10.70 |
| 32 | | | DWS Strategic Municipal Income Trust |
| Investment Income | |
| Income: | |
| Interest | $ 4,083,363 |
| Expenses: | |
| Management fee | 602,802 |
| Services to shareholders | 4,306 |
| Custodian fee | 1,456 |
| Professional fees | 46,723 |
| Reports to shareholders | 12,131 |
| Trustees' fees and expenses | 7,106 |
| Interest expense and amortization of deferred cost on Series 2020-1 VMTPS | 564,501 |
| Interest expense on floating rate notes | 73,186 |
| Stock Exchange listing fees | 11,843 |
| Other | 31,679 |
| Total expenses | 1,355,733 |
| Net investment income | 2,727,630 |
| Realized and Unrealized Gain (Loss) | |
| Net realized gain (loss) from investments | (1,291,732) |
| Change in net unrealized appreciation (depreciation) on investments | (22,348,330) |
| Net gain (loss) | (23,640,062) |
| Net increase (decrease) in net assets resulting from operations | $ (20,912,432) |
| DWS Strategic Municipal Income Trust | | | 33 |
| Increase (Decrease) in Cash: Cash Flows from Operating Activities | |
| Net increase (decrease) in net assets resulting from operations | $(20,912,432) |
| Adjustments to reconcile net increase (decrease) in net assets resulting from operations to net cash provided by (used in) operating activities: | |
| Purchases of long-term investments | (42,153,643) |
| Net amortization of premium/(accretion of discount) | 642,999 |
| Proceeds from sales and maturities of long-term investments | 41,788,558 |
| Amortization of deferred offering cost on Series 2020-1 VMTPS | 39,760 |
| (Increase) decrease in interest receivable | 90,446 |
| (Increase) decrease in other assets | 1,460 |
| (Increase) decrease in receivable for investments sold | (111,230) |
| Increase (decrease) in payable for investments purchased | 32,762 |
| Increase (decrease) in payable for investments purchased - when issued securities | (161,894) |
| Increase (decrease) in other accrued expenses and payables | (25,921) |
| Change in unrealized (appreciation) depreciation on investments | 22,348,330 |
| Net realized (gain) loss from investments | 1,291,732 |
| Cash provided by (used in) operating activities | $ 2,870,927 |
| Cash Flows from Financing Activities | |
| Distributions paid (net of reinvestment of distributions) | (2,870,927) |
| Cash provided by (used in) financing activities | (2,870,927) |
| Increase (decrease) in cash | — |
| Cash at beginning of period | — |
| Cash at end of period | $ — |
| Supplemental disclosure | |
| Interest expense paid on preferred shares | $ (482,566) |
| Interest expense paid and fees on floating rate notes issued | $ (73,186) |
| 34 | | | DWS Strategic Municipal Income Trust |
| Six Months Ended May 31, 2022 | Year Ended November 30, | |
| Increase (Decrease) in Net Assets | (Unaudited) | 2021 |
| Operations: | ||
| Net investment income | $ 2,727,630 | $ 5,780,525 |
| Net realized gain (loss) | (1,291,732) | (1,672,579) |
| Change in net unrealized appreciation (depreciation) | (22,348,330) | 4,844,069 |
| Net increase (decrease) in net assets applicable to common shareholders | (20,912,432) | 8,952,015 |
| Distributions to common shareholders | (2,913,102) | (6,379,549) |
| Increase (decrease) in net assets | (23,825,534) | 2,572,466 |
| Net assets at beginning of period applicable to common shareholders | 143,659,823 | 141,087,357 |
| Net assets at end of period applicable to common shareholders | $119,834,289 | $143,659,823 |
| Other Information: | ||
| Common shares outstanding at beginning of period | 11,203,941 | 11,203,941 |
| Common shares outstanding at end of period | 11,203,941 | 11,203,941 |
| DWS Strategic Municipal Income Trust | | | 35 |
| Six Months Ended 5/31/22 | Years Ended November 30, | |||||
| (Unaudited) | 2021 | 2020 | 2019 | 2018 | 2017 | |
| Selected Per Share Data Applicable to Common Shareholders | ||||||
| Net asset value, beginning of period | $12.82 | $12.59 | $12.69 | $11.76 | $12.39 | $12.15 |
| Income (loss) from investment operations: | ||||||
| Net investment incomea | .24 | .52 | .52 | .53 | .61 | .70 |
| Net realized and unrealized gain (loss) | (2.10) | .28 | (.10) | 1.00 | (.64) | .24 |
| Total from investment operations | (1.86) | .80 | .42 | 1.53 | (.03) | .94 |
| Less distributions applicable to common shareholders from: | ||||||
| Net investment income | (.26) | (.54) | (.50) | (.57) | (.60) | (.67) |
| Net realized gains | — | (.03) | (.02) | (.03) | (.00)* | (.03) |
| Total distributions | (.26) | (.57) | (.52) | (.60) | (.60) | (.70) |
| Net asset value, end of period | $10.70 | $12.82 | $12.59 | $12.69 | $11.76 | $12.39 |
| Market price, end of period | $9.82 | $12.48 | $11.29 | $12.32 | $10.30 | $11.91 |
| Total Return | ||||||
| Based on net asset value (%)b | (14.49) ** | 6.69 | 3.98 c | 13.68 | .31 | 7.93 |
| Based on market price (%)b | (19.38) ** | 15.82 | (3.95) c | 26.01 | (8.60) | 4.35 |
| 36 | | | DWS Strategic Municipal Income Trust |
| Six Months Ended 5/31/22 | Years Ended November 30, | |||||
| (Unaudited) | 2021 | 2020 | 2019 | 2018 | 2017 | |
| Ratios to Average Net Assets Applicable to Common Shareholders and Supplemental Data | ||||||
| Net assets, end of period ($ millions) | 120 | 144 | 141 | 142 | 132 | 139 |
| Ratio of expenses before expense reductions (%) (including interest expense)d,e | 2.07 *** | 1.85 | 2.33 | 2.89 | 2.75 | 2.37 |
| Ratio of expenses after expense reductions (%) (including interest expense)d,f | 2.07 *** | 1.85 | 2.23 | 2.89 | 2.75 | 2.37 |
| Ratio of expenses after expense reductions (%) (excluding interest expense)g | 1.16 *** | 1.11 | 1.05 | 1.12 | 1.13 | 1.11 |
| Ratio of net investment income (%) | 4.16 *** | 4.01 | 4.25 | 4.26 | 5.05 | 5.63 |
| Portfolio turnover rate (%) | 19 ** | 23 | 35 | 28 | 39 | 27 |
| Senior Securities | ||||||
| Preferred Shares information at period end, aggregate amount outstanding: | ||||||
| Series 2018 MTPS ($ millions) | — | — | — | 70 | 70 | 70 |
| Series 2020-1 VMTPS ($ millions) | 70 | 70 | 70 | — | — | — |
| Asset coverage per share ($)h | 271,192 | 305,228 | 301,553 | 75,787 | 72,050 | 74,572 |
| Liquidation and market price per share ($) | 100,000 | 100,000 | 100,000 | 25,000 | 25,000 | 25,000 |
| a | Based on average common shares outstanding during the period. |
| b | Total return based on net asset value reflects changes in the Fund’s net asset value during each period. Total return based on market price reflects changes in market price. Each figure assumes that dividend and capital gain distributions, if any, were reinvested. These figures will differ depending upon the level of any discount from or premium to net asset value at which the Fund’s shares traded during the period. |
| c | Total return would have been lower had certain expenses not been reduced. |
| d | Interest expense represents interest and fees on short-term floating rate notes issued in conjunction with inverse floating rate securities and interest paid to shareholders of Series 2018 MTPS and Series 2020-1 VMTPS. |
| DWS Strategic Municipal Income Trust | | | 37 |
| e | The ratio of expenses before expense reductions (based on net assets of common and Preferred Shares, including interest expense) was 1.35%, 1.25%, 1.54%, 1.92%, 1.81% and 1.58% for the periods ended May 31, 2022, November 30, 2021, 2020, 2019, 2018 and 2017, respectively. |
| f | The ratio of expenses after expense reductions (based on net assets of common and Preferred Shares, including interest expense) was 1.35%, 1.25%, 1.48%, 1.92%, 1.81% and 1.58% for the periods ended May 31, 2022, November 30, 2021, 2020, 2019, 2018 and 2017, respectively. |
| g | The ratio of expenses after expense reductions (based on net assets of common and Preferred Shares, excluding interest expense) was 0.75%, 0.75%, 0.70%, 0.74%, 0.74% and 0.74% for the periods ended May 31, 2022, November 30, 2021, 2020, 2019, 2018 and 2017, respectively. |
| h | Asset coverage per share equals net assets of common shares plus the liquidation value of the Preferred Shares divided by the total number of Preferred Shares outstanding at the end of the period. |
| * | Amount is less than $.005. |
| ** | Not annualized |
| *** | Annualized |
| 38 | | | DWS Strategic Municipal Income Trust |
| Notes to Financial Statements | (Unaudited) |
| A. | Organization and Significant Accounting Policies |
| DWS Strategic Municipal Income Trust | | | 39 |
| 40 | | | DWS Strategic Municipal Income Trust |
| DWS Strategic Municipal Income Trust | | | 41 |
| 42 | | | DWS Strategic Municipal Income Trust |
| DWS Strategic Municipal Income Trust | | | 43 |
| B. | Purchases and Sales of Securities |
| 44 | | | DWS Strategic Municipal Income Trust |
| C. | Related Parties |
| DWS Strategic Municipal Income Trust | | | 45 |
| D. | Concentration of Ownership |
| E. | Share Repurchases |
| F. | Other — COVID-19 Pandemic |
| 46 | | | DWS Strategic Municipal Income Trust |
| DWS Strategic Municipal Income Trust | | | 47 |
| 48 | | | DWS Strategic Municipal Income Trust |
| DWS Strategic Municipal Income Trust | | | 49 |
| 50 | | | DWS Strategic Municipal Income Trust |
| DWS Strategic Municipal Income Trust | | | 51 |
| Automated Information Line | DWS Closed-End Fund Info Line (800) 349-4281 |
| Web Site | dws.com Obtain fact sheets, financial reports, press releases and webcasts when available. |
| Written Correspondence | DWSAttn: Secretary of the DWS Funds 100 Summer Street Boston, MA 02110 |
| Legal Counsel | Vedder Price P.C. 222 North LaSalle Street Chicago, IL 60601 |
| Dividend Reinvestment Plan Agent | DST Systems, Inc. 333 W. 11th Street, 5th Floor Kansas City, MO 64105 |
| Shareholder Service Agent and Transfer Agent | DWS Service Company P.O. Box 219066 Kansas City, MO 64121-9066 (800) 294-4366 |
| Custodian | State Street Bank and Trust Company State Street Financial Center One Lincoln Street Boston, MA 02111 |
| Independent Registered Public Accounting Firm | Ernst & Young LLP 200 Clarendon Street Boston, MA 02116 |
| Proxy Voting | The Fund’s policies and procedures for voting proxies for portfolio securities and information about how the Fund voted proxies related to its portfolio securities during the most recent 12-month period ended June 30 are available on our Web site — dws.com/en-us/resources/proxy-voting — or on the SEC’s Web site — sec.gov. To obtain a written copy of the Fund’s policies and procedures without charge, upon request, call us toll free at (800) 728-3337. |
| Portfolio Holdings | Following the Fund’s fiscal first and third quarter-end, a complete portfolio holdings listing is posted on dws.com, and is available free of charge by contacting your financial intermediary, or if you are a direct investor, by calling (800) 728-3337. In addition, the portfolio holdings listing is filed with SEC on the Fund’s Form N-PORT and will be available on the SEC’s Web site at sec.gov. Additional portfolio holdings for the Fund are also posted on dws.com from time to time. |
| 52 | | | DWS Strategic Municipal Income Trust |
| Investment Management | DWS Investment Management Americas, Inc. (“DIMA” or the “Advisor” ), which is part of the DWS Group GmbH & Co. KGaA (“DWS Group” ), is the investment advisor for the Fund. DIMA and its predecessors have more than 90 years of experience managing mutual funds and DIMA provides a full range of investment advisory services to both institutional and retail clients. DIMA is an indirect, wholly owned subsidiary of DWS Group. |
| DWS Group is a global organization that offers a wide range of investing expertise and resources, including hundreds of portfolio managers and analysts and an office network that reaches the world’s major investment centers. This well-resourced global investment platform brings together a wide variety of experience and investment insight across industries, regions, asset classes and investing styles. |
| NYSE Symbol | KSM |
| CUSIP Number | Common Shares 23342Q 101 |
| DWS Strategic Municipal Income Trust | | | 53 |
| (b) Not applicable | |
| ITEM 2. | CODE OF ETHICS |
| Not applicable. | |
| ITEM 3. | AUDIT COMMITTEE FINANCIAL EXPERT |
| Not applicable | |
| ITEM 4. | PRINCIPAL ACCOUNTANT FEES AND SERVICES |
| Not applicable | |
| ITEM 5. | AUDIT COMMITTEE OF LISTED REGISTRANTS |
| Not applicable | |
| ITEM 6. | SCHEDULE OF INVESTMENTS |
| Not applicable | |
| ITEM 7. | DISCLOSURE OF PROXY VOTING POLICIES AND PROCEDURES FOR CLOSED-END MANAGEMENT INVESTMENT COMPANIES |
| Not applicable | |
| ITEM 8. | PORTFOLIO MANAGERS OF CLOSED-END MANAGEMENT INVESTMENT COMPANIES |
| Not applicable | |
| ITEM 9. | PURCHASES OF EQUITY SECURITIES BY CLOSED-END MANAGEMENT INVESTMENT COMPANY AND AFFILIATED PURCHASERS |
| (a) | (b) | (c) | (d) | |
| Period | Total Number of Shares Purchased | Average Price Paid per Share | Total Number of Shares Purchased as Part of Publicly Announced Plans or Programs | Maximum Number of Shares that May Yet Be Purchased Under the Plans or Programs |
| December 1 through December 31 | - | n/a | n/a | n/a |
| January 1 through January 31 | - | n/a | n/a | n/a |
| February 1 through February 29 | - | n/a | n/a | n/a |
| March 1 through March 31 | - | n/a | n/a | n/a |
| April 1 through April 30 | - | n/a | n/a | n/a |
| May 1 through May 31 | - | n/a | n/a | n/a |
| Total | - | n/a | n/a | n/a |
| The Fund may from time to time repurchase shares in the open market. | ||||
| On September 24, 2021, the Fund announced that the Fund’s Board of Trustees had extended the Fund’s existing open market share repurchase program for an additional 12-month period. The Fund may continue to purchase outstanding shares of common stock in open-market transactions over the period from December 1, 2021 until November 30,2022, when the Fund’s shares trade at a discount to net asset value. The Board's authorization of the repurchase program extension follows the previous repurchase program, which commenced on December 1, 2020 and ran until November 30, 2021. | ||||
| ITEM 10. | SUBMISSION OF MATTERS TO A VOTE OF SECURITY HOLDERS | ||
| There were no material changes to the procedures by which shareholders may recommend nominees to the Fund’s Board. The primary function of the Nominating and Governance Committee is to identify and recommend individuals for membership on the Board and oversee the administration of the Board Governance Guidelines. Shareholders may recommend candidates for Board positions by forwarding their correspondence by U.S. mail or courier service to Keith R. Fox, DWS Funds Board Chair, c/o Thomas R. Hiller, Ropes & Gray LLP, Prudential Tower, 800 Boylston Street, Boston, MA 02199-3600. | |||
| ITEM 11. | CONTROLS AND PROCEDURES | ||
| (a) | The Chief Executive and Financial Officers concluded that the Registrant’s Disclosure Controls and Procedures are effective based on the evaluation of the Disclosure Controls and Procedures as of a date within 90 days of the filing date of this report. | ||
| (b) | There have been no changes in the registrant’s internal control over financial reporting that occurred during the second fiscal quarter of the period covered by this report that has materially affected, or is reasonably likely to materially affect, the registrant’s internal controls over financial reporting. | ||
| ITEM 12. | Disclosure of Securities Lending Activities for Closed-End Management Investment Companies. | ||
| Not applicable | |||
| ITEM 13. | EXHIBITS | ||
| (a)(1) | Not applicable | ||
| (a)(2) | Certification pursuant to Rule 30a-2(a) under the Investment Company Act of 1940 (17 CFR 270.30a-2(a)) is filed and attached hereto as Exhibit 99.CERT. | ||
| (b) | Certification pursuant to Rule 30a-2(b) under the Investment Company Act of 1940 (17 CFR 270.30a-2(b)) is furnished and attached hereto as Exhibit 99.906CERT. | ||
SIGNATURES
Pursuant to the requirements of the Securities Exchange Act of 1934 and the Investment Company Act of 1940, the registrant has duly caused this report to be signed on its behalf by the undersigned, thereunto duly authorized.
| Registrant: | DWS Strategic Municipal Income Trust |
| By: | /s/Hepsen Uzcan Hepsen Uzcan President |
| Date: | 7/29/2022 |
Pursuant to the requirements of the Securities Exchange Act of 1934 and the Investment Company Act of 1940, this report has been signed below by the following persons on behalf of the registrant and in the capacities and on the dates indicated.
| By: | /s/Hepsen Uzcan Hepsen Uzcan President |
| Date: | 7/29/2022 |
| By: | /s/Diane Kenneally Diane Kenneally Chief Financial Officer and Treasurer |
| Date: | 7/29/2022 |