| FREE WRITING PROSPECTUS | ||
| FILED PURSUANT TO RULE 433 | ||
| REGISTRATION FILE NO.: 333-195164-01 | ||
 |  |
Free Writing Prospectus
Structural and Collateral Term Sheet
$1,487,599,794
(Approximate Aggregate Cut-off Date Balance of Mortgage Pool)
$1,266,319,000
(Approximate Aggregate Principal Balance of Offered Certificates)
WFRBS Commercial Mortgage Trust 2014-C22
as Issuing Entity
Wells Fargo Commercial Mortgage Securities, Inc.
as Depositor
Wells Fargo Bank, National Association
The Royal Bank of Scotland
Rialto Mortgage Finance, LLC
Liberty Island Group I LLC
NCB, FSB
C-III Commercial Mortgage LLC
Basis Real Estate Capital II, LLC
Walker & Dunlop Commercial Property Funding I WF, LLC
as Sponsors and Mortgage Loan Sellers
Commercial Mortgage Pass-Through Certificates
Series 2014-C22
August 29, 2014
| WELLS FARGO SECURITIES | RBS | |
Co-Lead Manager and Co-Bookrunner | Co-Lead Manager and Co-Bookrunner | |
Deutsche Bank Securities Co-Manager | ||
STATEMENT REGARDING THIS FREE WRITING PROSPECTUS
The depositor has filed a registration statement (including a prospectus) with the Securities and Exchange Commission (‘‘SEC’’) (SEC File No. 333-195164) for the offering to which this communication relates. Before you invest, you should read the prospectus in the registration statement and other documents the depositor has filed with the SEC for more complete information about the depositor, the issuing entity and this offering. You may get these documents for free by visiting EDGAR on the SEC Web site at www.sec.gov. Alternatively, the depositor, any underwriter, or any dealer participating in the offering will arrange to send you the prospectus after filing if you request it by calling toll free 1-800-745-2063 (8 a.m. – 5 p.m. EST) or by emailing wfs.cmbs@wellsfargo.com.
Nothing in this document constitutes an offer of securities for sale in any other jurisdiction where the offer or sale is not permitted. The information contained herein is preliminary as of the date hereof, supersedes any such information previously delivered to you and will be superseded by any such information subsequently delivered and ultimately by the final prospectus relating to the securities. These materials are subject to change, completion, supplement or amendment from time to time.
STATEMENT REGARDING ASSUMPTIONS AS TO SECURITIES, PRICING ESTIMATES AND OTHER INFORMATION
The attached information contains certain tables and other statistical analyses (the “Computational Materials”) which have been prepared in reliance upon information furnished by the Mortgage Loan Sellers. Numerous assumptions were used in preparing the Computational Materials, which may or may not be reflected herein. As such, no assurance can be given as to the Computational Materials’ accuracy, appropriateness or completeness in any particular context; or as to whether the Computational Materials and/or the assumptions upon which they are based reflect present market conditions or future market performance. The Computational Materials should not be construed as either projections or predictions or as legal, tax, financial or accounting advice. You should consult your own counsel, accountant and other advisors as to the legal, tax, business, financial and related aspects of a purchase of these securities. Any weighted average lives, yields and principal payment periods shown in the Computational Materials are based on prepayment and/or loss assumptions, and changes in such prepayment and/or loss assumptions may dramatically affect such weighted average lives, yields and principal payment periods. In addition, it is possible that prepayments or losses on the underlying assets will occur at rates higher or lower than the rates shown in the attached Computational Materials. The specific characteristics of the securities may differ from those shown in the Computational Materials due to differences between the final underlying assets and the preliminary underlying assets used in preparing the Computational Materials. The principal amount and designation of any security described in the Computational Materials are subject to change prior to issuance. None of Wells Fargo Securities, LLC (“WFS”), RBS Securities Inc. (“RBSSI”), Deutsche Bank Securities Inc. or any of their respective affiliates make any representation or warranty as to the actual rate or timing of payments or losses on any of the underlying assets or the payments or yield on the securities. The information in this presentation is based upon management forecasts and reflects prevailing conditions and management’s views as of this date, all of which are subject to change. In preparing this presentation, we have relied upon and assumed, without independent verification, the accuracy and completeness of all information available from public sources or which was provided to us by or on behalf of the Mortgage Loan Sellers or which was otherwise reviewed by us.
This free writing prospectus contains certain forward-looking statements. If and when included in this free writing prospectus, the words “expects”, “intends”, “anticipates”, “estimates” and analogous expressions and all statements that are not historical facts, including statements about our beliefs or expectations, are intended to identify forward-looking statements. Any forward-looking statements are made subject to risks and uncertainties which could cause actual results to differ materially from those stated. Those risks and uncertainties include, among other things, declines in general economic and business conditions, increased competition, changes in demographics, changes in political and social conditions, regulatory initiatives and changes in customer preferences, many of which are beyond our control and the control of any other person or entity related to this offering. The forward-looking statements made in this free writing prospectus are made as of the date stated on the cover. We have no obligation to update or revise any forward-looking statement.
Wells Fargo Securities is the trade name for the capital markets and investment banking services of Wells Fargo & Company and its subsidiaries, including but not limited to Wells Fargo Securities, LLC, a member of NYSE, FINRA, NFA and SIPC, Wells Fargo Institutional Securities, LLC, a member of FINRA and SIPC, Wells Fargo Prime Services, LLC, a member of FINRA, NFA and SIPC, and Wells Fargo Bank, N.A. Wells Fargo Securities, LLC carries and provides clearing services for Wells Fargo Institutional Securities, LLC customer accounts. Wells Fargo Securities, LLC, Wells Fargo Institutional Securities, LLC, and Wells Fargo Prime Services, LLC are distinct entities from affiliated banks and thrifts.
RBS is a trade name for the investment banking business of RBSSI. Securities, syndicated loan arranging, financial advisory and other investment banking activities are performed by RBSSI and their securities affiliates. Lending, derivatives and other commercial banking activities are performed by The Royal Bank of Scotland plc and their banking affiliates. RBSSI is a member of SIPC, FINRA and the NYSE.
IMPORTANT NOTICE REGARDING THE OFFERED CERTIFICATES
The Offered Certificates referred to in these materials and the asset pool backing them are subject to modification or revision (including the possibility that one or more classes of certificates may be split, combined or eliminated at any time prior to issuance or availability of a final prospectus) and are offered on a “when, as and if issued” basis. Prospective investors should understand that, when considering the purchase of the Offered Certificates, a contract of sale will come into being no sooner than the date on which the relevant class of certificates has been priced and the underwriters have confirmed the allocation of certificates to be made to investors; any “indications of interest” expressed by any prospective investor, and any “soft circles” generated by the underwriters, will not create binding contractual obligations for such prospective investors, on the one hand, or the underwriters, the depositor or any of their respective agents or affiliates, on the other hand.
As a result of the foregoing, a prospective investor may commit to purchase certificates that have characteristics that may change, and each prospective investor is advised that all or a portion of the certificates referred to in these materials may be issued without all or certain of the characteristics described in these materials. The underwriters’ obligation to sell certificates to any prospective investor is conditioned on the certificates and the transaction having the characteristics described in these materials. If the underwriters determine that a condition is not satisfied in any material respect, such prospective investor will be notified, and neither the depositor nor the underwriters will have any obligation to such prospective investor to deliver any portion of the Offered Certificates which such prospective investor has committed to purchase, and there will be no liability between the underwriters, the depositor or any of their respective agents or affiliates, on the one hand, and such prospective investor, on the other hand, as a consequence of the non-delivery.
Each prospective investor has requested that the underwriters provide to such prospective investor information in connection with such prospective investor’s consideration of the purchase of the certificates described in these materials. These materials are being provided to each prospective investor for informative purposes only in response to such prospective investor’s specific request. The underwriters described in these materials may from time to time perform investment banking services for, or solicit investment banking business from, any company named in these materials. The underwriters and/or their affiliates or respective employees may from time to time have a long or short position in any security or contract discussed in these materials.
The information contained herein supersedes any previous such information delivered to any prospective investor and will be superseded by information delivered to such prospective investor prior to the time of sale.
IMPORTANT NOTICE RELATING TO AUTOMATICALLY-GENERATED EMAIL DISCLAIMERS
Any legends, disclaimers or other notices that may appear at the bottom of any email communication to which this free writing prospectus is attached relating to (1) these materials not constituting an offer (or a solicitation of an offer), (2) no representation that these materials are accurate or complete and may not be updated or (3) these materials possibly being confidential, are not applicable to these materials and should be disregarded. Such legends, disclaimers or other notices have been automatically generated as a result of these materials having been sent via Bloomberg or another system.
THE INFORMATION IN THIS STRUCTURAL AND COLLATERAL TERM SHEET IS NOT COMPLETE AND MAY BE AMENDED PRIOR TO THE TIME OF SALE. THIS TERM SHEET IS NOT AN OFFER TO SELL THESE SECURITIES AND IT IS NOT A SOLICITATION OF AN OFFER TO BUY THESE SECURITIES IN ANY JURISDICTION WHERE THE OFFER OR SALE IS NOT PERMITTED.
2
WFRBS Commercial Mortgage Trust 2014-C22 | Certificate Structure |
I. Certificate Structure
Expected Ratings (Fitch/KBRA/Moody’s)(1) | Approximate Initial Certificate Principal Balance or Notional Amount(2) | Approx. Initial Credit Support(3) | Pass-Through Rate Description | Weighted Average Life (Years)(4) | Expected Principal Window(4) | Certificate Principal to Value Ratio(5) | Certificate Principal U/W NOI Debt Yield(6) | |||||||||
| Offered Certificates | ||||||||||||||||
| A-1 | AAAsf/AAA(sf)/Aaa(sf) | $57,333,000 | 30.000% | (7) | 2.73 | 10/14 – 7/19 | 34.0% | 18.0% | ||||||||
| A-2 | AAAsf/AAA(sf)/Aaa(sf) | $75,863,000 | 30.000% | (7) | 4.89 | 7/19 – 9/19 | 34.0% | 18.0% | ||||||||
| A-3 | AAAsf/AAA(sf)/Aaa(sf) | $59,936,000 | 30.000% | (7) | 6.92 | 7/21 – 9/21 | 34.0% | 18.0% | ||||||||
| A-4 | AAAsf/AAA(sf)/Aaa(sf) | $360,000,000 | 30.000% | (7) | 9.84 | 7/24 – 8/24 | 34.0% | 18.0% | ||||||||
| A-5 | AAAsf/AAA(sf)/Aaa(sf) | $386,043,000 | 30.000% | (7) | 9.89 | 8/24 – 9/24 | 34.0% | 18.0% | ||||||||
| A-SB | AAAsf/AAA(sf)/Aaa(sf) | $102,144,000 | 30.000% | (7) | 7.44 | 9/19 – 7/24 | 34.0% | 18.0% | ||||||||
A-S(8) | AAAsf/AAA(sf)/Aa1(sf) | $104,132,000 | 23.000% | (7) | 9.96 | 9/24 – 9/24 | 37.3% | 16.3% | ||||||||
| X-A | AAAsf/AAA(sf)/NR | $1,145,451,000(9) | N/A | Variable(10) | N/A | N/A | N/A | N/A | ||||||||
| X-B | NR/AAA(sf)/NR | $232,438,000(11) | N/A | Variable(12) | N/A | N/A | N/A | N/A | ||||||||
B(8) | AA-sf/AA-(sf)/Aa3(sf) | $68,802,000 | 18.375% | (7) | 9.96 | 9/24 – 9/24 | 39.6% | 15.4% | ||||||||
C(8) | A-sf/A-(sf)/A3(sf) | $52,066,000 | 14.875% | (7) | 9.96 | 9/24 – 9/24 | 41.3% | 14.8% | ||||||||
PEX(8) | A-sf/A-(sf)/A1(sf) | $225,000,000 | 14.875% | (7) | 9.96 | 9/24 – 9/24 | 41.3% | 14.8% | ||||||||
Non-Offered Certificates | ||||||||||||||||
| X-C | BBsf/BB(sf)/NR | $31,611,000(13) | N/A | Variable(14) | N/A | N/A | N/A | N/A | ||||||||
| X-D | Bsf/B(sf)/NR | $14,876,000(15) | N/A | Variable(16) | N/A | N/A | N/A | N/A | ||||||||
| X-E | NR/NR/NR | $63,223,793(17) | N/A | Variable(18) | N/A | N/A | N/A | N/A | ||||||||
| X-Y | NR/AAA(sf)/NR | $29,558,534(19) | N/A | Variable(20) | N/A | N/A | N/A | N/A | ||||||||
| D | BBB-sf/BBB-(sf)/NR | $111,570,000 | 7.375% | (7) | 9.96 | 9/24 – 9/24 | 44.9% | 13.6% | ||||||||
| E | BBsf/BB(sf)/NR | $31,611,000 | 5.250% | (7) | 9.96 | 9/24 – 9/24 | 46.0% | 13.3% | ||||||||
| F | Bsf/B(sf)/NR | $14,876,000 | 4.250% | (7) | 9.96 | 9/24 – 9/24 | 46.4% | 13.1% | ||||||||
| G | NR/NR/NR | $63,223,793 | 0.000% | (7) | 9.96 | 9/24 – 9/24 | 48.5% | 12.6% | ||||||||
Notes:
| (1) | The expected ratings presented are those of Fitch Ratings, Inc. (“Fitch”), Kroll Bond Rating Agency, Inc. (“KBRA”) and Moody’s Investors Service, Inc. (“Moody’s”) which the depositor hired to rate the offered certificates. One or more other nationally recognized statistical rating organizations that were not hired by the depositor may use information they receive pursuant to Rule 17g-5 under the Securities Exchange Act of 1934, as amended (the “Exchange Act”) or otherwise, to rate or provide market reports and/or published commentary related to the offered certificates. We cannot assure you as to what ratings a non-hired nationally recognized statistical rating organization would assign or that its reports will not express differing, possibly negative, views of the mortgage loans and/or the offered certificates. The ratings of each class of offered certificates address the likelihood of the timely distribution of interest and, except in the case of the Class X-A and Class X-B certificates, the ultimate distribution of principal due on those classes on or before the Rated Final Distribution Date. See “Risk Factors—Risks Related to the Offered Certificates—Ratings of the Certificates Have Substantial Limitations” and “Ratings” in the free writing prospectus, dated August 29, 2014 (the “Free Writing Prospectus”). |
| (2) | The principal balances and notional amounts set forth in the table are approximate. The actual initial principal balances and notional amounts may be larger or smaller depending on the aggregate cut-off date principal balance of the mortgage loans definitively included in the pool of mortgage loans, which aggregate cut-off date principal balance may be as much as 5% larger or smaller than the amount presented in the Free Writing Prospectus. |
| (3) | The approximate initial credit support with respect to the Class A-1, A-2, A-3, A-4, A-5 and A-SB Certificates represents the approximate credit enhancement for the Class A-1, A-2, A-3, A-4, A-5 and A-SB Certificates in the aggregate. The percentage indicated under the column “Approx. Initial Credit Support” with respect to the Class C Certificates and the Class PEX Certificates represents the approximate credit support for the Class C regular interest, which will have an initial outstanding principal balance on the closing date of $52,066,000. |
| (4) | Weighted Average Lives and Expected Principal Windows are calculated based on an assumed prepayment rate of 0% CPR and the “Structuring Assumptions” described on Annex B to the Free Writing Prospectus. |
| (5) | The Certificate Principal to Value Ratio for each Class of Certificates (other than the Class A-1, A-2, A-3, A-4, A-5 and A-SB Certificates and other than the Exchangeable Certificates) is calculated by dividing the aggregate principal balance of such class of certificates and all classes of certificates (other than the Exchangeable Certificates), if any, that are senior to such class, by the aggregate appraised value of approximately $3,066,954,811 (calculated as described in the Free Writing Prospectus) of the mortgaged properties securing the mortgage loans (excluding, with respect to each pari passu loan combination, a pro rata portion of the related appraised value allocated to the related companion loans based on their cut-off date principal balance). The Certificate Principal to Value Ratios for each of the Class A-1, A-2, A-3, A-4, A-5 and A-SB Certificates are calculated by dividing the aggregate principal balance of the Class A-1, A-2, A-3, A-4, A-5 and A-SB Certificates by such aggregate appraised value (excluding, with respect to each pari passu loan combination, a pro rata portion of the related appraised value allocated to the related companion loans based on their cut-off date principal balance). The Certificate Principal to Value Ratio for each of the Class A-S, B and C Certificates is calculated by dividing the aggregate principal balance of the Class A-S regular interest, the Class B regular interest or the Class C regular interest, as applicable, and all other classes of certificates (other than the Exchangeable Certificates) and the regular interests that are senior to such class, by such aggregate appraised value (excluding, with respect to each pari passu loan combination, a pro rata portion of the related appraised value allocated to the related companion loans based on their cut-off date principal balance). The Certificate Principal to Value Ratio of the Class PEX Certificates is equal to the Certificate Principal to Value Ratio of the Class C Certificates. In any event, however, excess mortgaged property value associated with a mortgage loan will not be available to offset losses on any other mortgage loan (unless such mortgage loans are cross-collateralized and the cross-collateralization remains in effect). |
| (6) | The Certificate Principal U/W NOI Debt Yield for each Class of Certificates (other than the Class A-1, A-2, A-3, A-4, A-5 and A-SB Certificates and other than the Exchangeable Certificates) is calculated by dividing the underwritten net operating income (which excludes, with respect to each pari passu loan combination, a pro rata portion of the related underwritten net operating income allocated to the related companion loans based on their cut-off date principal balance) for the mortgage pool of approximately $186,959,974 (calculated as described in the Free Writing Prospectus) by the aggregate certificate principal balance of such class of certificates and all classes of certificates (other than the Exchangeable Certificates), if any, that are senior to such class of certificates. The Certificate Principal U/W NOI Debt Yield for each of the Class A-1, A-2, A-3, A-4, A-5 and A-SB Certificates is calculated by dividing such mortgage pool underwritten net operating income (which excludes, with respect to each pari passu loan combination, a pro rata portion of the related underwritten net operating income allocated to the related companion loans based on their cut-off date principal balance) by the aggregate principal balance of the Class A-1, A-2, A-3, A-4, A-5 and A-SB Certificates. The Certificate Principal U/W NOI Debt Yield for each of the Class A-S, B and C Certificates is calculated by dividing the underwritten net operating income (which excludes, with respect to each pari passu loan combination, a pro rata portion of the related underwritten net operating income allocated to the related companion loans based on their cut-off date |
THE INFORMATION IN THIS STRUCTURAL AND COLLATERAL TERM SHEET IS NOT COMPLETE AND MAY BE AMENDED PRIOR TO THE TIME OF SALE. THIS TERM SHEET IS NOT AN OFFER TO SELL THESE SECURITIES AND IT IS NOT A SOLICITATION OF AN OFFER TO BUY THESE SECURITIES IN ANY JURISDICTION WHERE THE OFFER OR SALE IS NOT PERMITTED.
3
WFRBS Commercial Mortgage Trust 2014-C22 | Certificate Structure |
principal balance) for the mortgage pool of approximately $186,959,974 (calculated as described in the Free Writing Prospectus) by the aggregate principal balance of the Class A-S regular interest, the Class B regular interest or the Class C regular interest, as applicable, and all other classes of certificates (other than the Exchangeable Certificates) and the regular interests that are senior to such class. The Certificate Principal U/W NOI Debt Yield of the Class PEX Certificates is equal to the Certificate Principal U/W NOI Debt Yield for the Class C Certificates. In any event, however, cash flow from each mortgaged property supports only the related mortgage loan and will not be available to support any other mortgage loan (unless such mortgage loans are cross-collateralized and the cross-collateralization remains in effect). | |
| (7) | The pass-through rates for the Class A-1, A-2, A-3, A-4, A-5, A-SB, A-S, B, C, D, E, F and G Certificates in each case will be one of the following: (i) a fixed rate per annum, (ii) the weighted average of the net mortgage interest rates on the mortgage loans for the related distribution date, (iii) a variable rate per annum equal to the lesser of (a) a fixed rate and (b) the weighted average of the net mortgage interest rates on the mortgage loans for the related distribution date or (iv) a variable rate per annum equal to the weighted average of the net mortgage interest rates on the mortgage loans for the related distribution date minus a specified percentage. For purposes of the calculation of the weighted average of the net mortgage interest rates on the mortgage loans for each distribution date, the mortgage interest rates will be adjusted as necessary to a 30/360 basis and, in the case of certain designated mortgage loans being sold to the trust by NCB, FSB, will be net of the Class X-Y strip rate defined in footnote (20) below. The Class PEX Certificates will not have a pass-through rate, but will be entitled to receive the sum of the interest distributable on the Class PEX Components. The pass-through rate for the Class A-S Certificates, the Class A-S regular interest and the Class PEX Component A-S will, at all times, be the same. The pass-through rate for the Class B Certificates, the Class B regular interest and the Class PEX Component B will, at all times, be the same. The pass-through rate for the Class C Certificates, the Class C regular interest and the Class PEX Component C will, at all times, be the same. |
| (8) | The Class A-S, B, C and PEX Certificates are “Exchangeable Certificates”. On the closing date, the upper-tier REMIC of the issuing entity will issue the Class A-S, B and C regular interests (each a “regular interest”) which will have outstanding principal balances on the closing date of $104,132,000, $68,802,000 and $52,066,000, respectively. The regular interests will be held in a grantor trust for the benefit of the holders of the Class A-S, B, C and PEX Certificates. The Class A-S, B, C and PEX Certificates will, at all times, represent undivided beneficial ownership interests in a grantor trust that will hold those regular interests. Each class of the Class A-S, B and C Certificates will, at all times, represent an undivided beneficial ownership interest in a percentage of the outstanding certificate principal balance of the regular interest with the same alphabetical class designation. The Class PEX Certificates will, at all times, represent an undivided beneficial ownership interest in the remaining percentages of the outstanding certificate principal balances of the Class A-S, B and C regular interests and which portions of those regular interests are referred to in this Term Sheet as the Class PEX Component A-S, Class PEX Component B and Class PEX Component C (collectively, the “Class PEX Components”). Following any exchange of Class A-S, B and C Certificates for Class PEX Certificates or any exchange of Class PEX Certificates for Class A-S, B and C Certificates as described in the Free Writing Prospectus, the percentage interest of the outstanding certificate principal balances of the Class A-S, B and C regular interest that is represented by the Class A-S, B, C and PEX Certificates will be increased or decreased accordingly. The initial certificate principal balance of each of the Class A-S, B and C Certificates shown in the table represents the maximum certificate principal balance of such class without giving effect to any exchange. The initial certificate principal balance of the Class PEX Certificates is equal to the aggregate of the initial certificate principal balance of the Class A-S, B and C Certificates and represents the maximum certificate principal balance of the Class PEX Certificates that could be issued in an exchange. The certificate principal balances of the Class A-S, B and C Certificates to be issued on the closing date will be reduced, in required proportions, by an amount equal to the certificate principal balance of the Class PEX Certificates issued on the closing date. Distributions and allocations of payments and losses with respect to the Exchangeable Certificates are described in this Term Sheet under “Allocations and Distributions on the Class A-S, B, C and PEX Certificates” and under “Description of the Offered Certificates—Distributions” in the Free Writing Prospectus. The maximum certificate principal balance of the Class PEX Certificates is set forth in the table but is not included in the certificate principal balance of the certificates set forth on the cover page of this Term Sheet or on the top of the cover page of the Free Writing Prospectus. |
| (9) | The Class X-A Certificates are notional amount certificates. The Notional Amount of the Class X-A Certificates will be equal to the aggregate principal balance of the Class A-1, A-2, A-3, A-4, A-5 and A-SB Certificates and the Class A-S regular interest outstanding from time to time (without regard to any exchange of Class A-S, B and C Certificates for Class PEX Certificates). The Class X-A Certificates will not be entitled to distributions of principal. |
| (10) | The pass-through rate for the Class X-A Certificates for any distribution date will be a per annum rate equal to the excess, if any, of (a) the weighted average of the net mortgage interest rates on the mortgage loans for the related distribution date, over (b) the weighted average of the pass-through rates on the Class A-1, A-2, A-3, A-4, A-5 and A-SB Certificates and the Class A-S regular interest for the related distribution date, weighted on the basis of their respective aggregate principal balances outstanding immediately prior to that distribution date. For purposes of the calculation of the weighted average of the net mortgage interest rates on the mortgage loans for each distribution date, the mortgage interest rates will be adjusted as necessary to a 30/360 basis and, in the case of certain designated mortgage loans being sold to the trust by NCB, FSB, will be net of the Class X-Y strip rate. |
| (11) | The Class X-B Certificates are notional amount certificates. The Notional Amount of the Class X-B Certificates will be equal to the aggregate principal balance of the Class B and C regular interests and the Class D Certificates outstanding from time to time. The Class X-B Certificates will not be entitled to distributions of principal. |
| (12) | The pass-through rate for the Class X-B Certificates for any distribution date will be a per annum rate equal to the excess, if any, of (a) the weighted average of the net mortgage interest rates on the mortgage loans for the related distribution date, over (b) the weighted average of the pass-through rates on the Class B and C regular interests and the Class D Certificates for the related distribution date, weighted on the basis of their respective aggregate principal balances outstanding immediately prior to that distribution date. For purposes of the calculation of the weighted average of the net mortgage interest rates on the mortgage loans for each distribution date, the mortgage interest rates will be adjusted as necessary to a 30/360 basis and, in the case of certain designated mortgage loans being sold to the trust by NCB, FSB, will be net of the Class X-Y strip rate. |
| (13) | The Class X-C Certificates are notional amount certificates. The Notional Amount of the Class X-C Certificates will be equal to the principal balance of the Class E Certificates outstanding from time to time. The Class X-C Certificates will not be entitled to distributions of principal. |
| (14) | The pass-through rate for the Class X-C Certificates for any distribution date will be a per annum rate equal to the excess, if any, of (a) the weighted average of the net mortgage interest rates on the mortgage loans for the related distribution date, over (b) the pass-through rate on the Class E Certificates for the related distribution date. For purposes of the calculation of the weighted average of the net mortgage interest rates on the mortgage loans for each distribution date, the mortgage interest rates will be adjusted as necessary to a 30/360 basis and, in the case of certain designated mortgage loans being sold to the trust by NCB, FSB, will be net of the Class X-Y strip rate. |
| (15) | The Class X-D Certificates are notional amount certificates. The Notional Amount of the Class X-D Certificates will be equal to the principal balance of the Class F Certificates outstanding from time to time. The Class X-D Certificates will not be entitled to distributions of principal. |
| (16) | The pass-through rate for the Class X-D Certificates for any distribution date will be a per annum rate equal to the excess, if any, of (a) the weighted average of the net mortgage interest rates on the mortgage loans for the related distribution date, over (b) the pass-through rate on the Class F Certificates for the related distribution date. For purposes of the calculation of the weighted average of the net mortgage interest rates on the mortgage loans for each distribution date, the mortgage interest rates will be adjusted as necessary to a 30/360 basis and, in the case of certain designated mortgage loans being sold to the trust by NCB, FSB, will be net of the Class X-Y strip rate. |
| (17) | The Class X-E Certificates are notional amount certificates. The notional amount of the Class X-E Certificates will be equal to the principal balance of the Class G Certificates outstanding from time to time. The Class X-E Certificates will not be entitled to distributions of principal. |
| (18) | The pass-through rate for the Class X-E Certificates for any distribution date will be a per annum rate equal to the excess, if any, of (a) the weighted average of the net mortgage interest rates on the mortgage loans for the related distribution date, over (b) the pass-through rate on the Class G Certificates for the related distribution date. For purposes of the calculation of the weighted average of the net mortgage interest rates on the mortgage loans for each distribution date, the mortgage interest rates will be adjusted as necessary to a 30/360 basis and, in the case of certain designated mortgage loans being sold to the trust by NCB, FSB, will be net of the Class X-Y strip rate. |
| (19) | The Class X-Y Certificates are notional amount certificates. The Notional Amount of the Class X-Y Certificates will be equal to the aggregate principal balance of the designated NCB mortgage loans outstanding from time to time. A “designated NCB mortgage loan” is a mortgage loan sold by NCB, FSB that with respect to which the prepayment premium payable in connection with certain prepayments is equal to a stated percentage of the principal amount prepaid. This percentage declines over the term of the mortgage loan from 5% of the principal amount prepaid to 1% of the principal amount prepaid. Thirteen (13) of the twenty (20) mortgage loans being sold by NCB, FSB to the depositor, having an aggregate cut-off date principal balance of $29,558,534 and representing approximately 2.0% of the cut-off date pool balance, are sometimes referred to herein “designated NCB mortgage loans”. The Class X-Y Certificates will not be entitled to distributions of principal. |
| (20) | The pass-through rate for the Class X-Y Certificates for any distribution date will be [0.20]% per annum (the “Class X-Y strip rate”), adjusted as necessary to a 30/360 basis. |
THE INFORMATION IN THIS STRUCTURAL AND COLLATERAL TERM SHEET IS NOT COMPLETE AND MAY BE AMENDED PRIOR TO THE TIME OF SALE. THIS TERM SHEET IS NOT AN OFFER TO SELL THESE SECURITIES AND IT IS NOT A SOLICITATION OF AN OFFER TO BUY THESE SECURITIES IN ANY JURISDICTION WHERE THE OFFER OR SALE IS NOT PERMITTED.
4
| WFRBS Commercial Mortgage Trust 2014-C22 | Issue Characteristics |
| II. | Transaction Highlights |
Mortgage Loan Sellers:
Mortgage Loan Seller | Number of Mortgage Loans | Number of Mortgaged Properties | Aggregate Cut-off Date Balance | % of Cut-off Date Pool Balance | ||||
| Wells Fargo Bank, National Association | 34 | 54 | $660,152,359 | 44.4% | ||||
The Royal Bank of Scotland(1) | 18 | 32 | 311,373,307 | 20.9 | ||||
| Rialto Mortgage Finance, LLC | 21 | 22 | 158,381,467 | 10.6 | ||||
| Liberty Island Group I LLC | 9 | 9 | 109,719,609 | 7.4 | ||||
| NCB, FSB | 20 | 20 | 67,614,088 | 4.5 | ||||
| C-III Commercial Mortgage LLC | 17 | 17 | 63,291,423 | 4.3 | ||||
| Basis Real Estate Capital II, LLC | 6 | 9 | 58,594,540 | 3.9 | ||||
Walker & Dunlop Commercial Property Funding I WF, LLC | 4 | 9 | 58,473,000 | 3.9 | ||||
| Total | 129 | 172 | $1,487,599,794 | 100% |
| (1) | The mortgage loan seller referred to herein as The Royal Bank of Scotland is comprised of two affiliated companies: The Royal Bank of Scotland plc and RBS Financial Products Inc. With respect to the mortgage loans being sold to the trust by The Royal Bank of Scotland (a) thirteen (13) of the mortgage loans, having an aggregate cut-off date principal balance of $237,633,272 and representing approximately 16.0% of the aggregate principal balance of the pool of mortgage loans as of the cut-off date, were originated by and are being sold to the trust only by The Royal Bank of Scotland plc, (b) four (4) of the mortgage loans, having a cut-off date principal balance of $49,170,035 and representing approximately 3.3% of the aggregate principal balance of the pool of mortgage loans as of the cut-off date, was originated by RBS Financial Products Inc. and is being sold to the trust by RBS Financial Products Inc, and (c) one (1) of the mortgage loans, having a cut-off date principal balance of $24,570,000 and representing approximately 1.7% of the aggregate principal balance of the pool of mortgage loans as of the cut-off date, were co-originated by The Royal Bank of Scotland plc and RBS Financial Products Inc. and both The Royal Bank of Scotland plc and RBS Financial Products Inc. are selling their respective interests in the loan to the trust. |
Loan Pool:
| Cut-off Date Balance: | $1,487,599,794 | |
| Number of Mortgage Loans: | 129 | |
| Average Cut-off Date Balance per Mortgage Loan: | $11,531,781 | |
| Number of Mortgaged Properties: | 172 | |
Average Cut-off Date Balance per Mortgaged Property(1): | $8,648,836 | |
| Weighted Average Mortgage Interest Rate: | 4.506% | |
| Ten Largest Mortgage Loans as % of Cut-off Date Pool Balance: | 43.6% | |
| Weighted Average Original Term to Maturity or ARD (months): | 115 | |
| Weighted Average Remaining Term to Maturity or ARD (months): | 115 | |
Weighted Average Original Amortization Term (months)(2): | 363 | |
Weighted Average Remaining Amortization Term (months)(2): | 363 | |
| Weighted Average Seasoning (months): | 1 |
| (1) | Information regarding mortgage loans secured by multiple properties is based on an allocation according to relative appraised values or the allocated loan amounts or property-specific release prices set forth in the related loan documents or such other allocation as the related mortgage loan seller deemed appropriate. |
| (2) | Excludes any mortgage loan that does not amortize. |
Credit Statistics:
Weighted Average U/W Net Cash Flow DSCR(1): | 2.16x | |
Weighted Average U/W Net Operating Income Debt Yield(1): | 12.6% | |
Weighted Average Cut-off Date Loan-to-Value Ratio(1): | 64.6% | |
Weighted Average Balloon or ARD Loan-to-Value Ratio(1): | 57.3% | |
% of Mortgage Loans with Additional Subordinate Debt(2): | 12.7% | |
% of Mortgage Loans with Single Tenants(3): | 6.0% |
| (1) | With respect to the Bank of America Plaza mortgage loan, the Columbus Square Portfolio mortgage loan and the Stamford Plaza Portfolio mortgage loan, each of which is part of a pari passu loan combination, loan-to-value ratio, debt service coverage ratio and debt yield calculations include the related pari passu companion loans unless otherwise stated. The information for each mortgaged property that relates to a mortgage loan that is cross-collateralized with other mortgage loans is based upon the principal balance of that mortgage loan, except that the applicable loan-to-value ratio, debt service coverage ratio or debt yield for each such mortgaged property is based upon the ratio or yield (as applicable) for the aggregate indebtedness evidenced by all loans in the group. On an individual basis, without regard to the cross-collateralization feature, any mortgaged property securing a mortgage loan that is part of a cross-collateralized group of mortgage loans may have a higher loan-to-value ratio, lower debt service coverage ratio and/or lower debt yield than is presented herein. Information for each residential cooperative mortgage loan is calculated using underwritten net cash flow for the related residential cooperative property which is the projected net cash flow reflected in the most recent appraisal obtained by or otherwise in the possession of the related mortgage loan seller as of the cut-off date, and the loan-to value ratio information for residential cooperative mortgage loans is based upon the appraised value of the residential cooperative property determined as if such residential cooperative property is operated as a residential cooperative; provided, however, that the loan-to-value ratio information for the residential cooperative mortgage loan secured by the mortgaged property identified on Annex A-1 to the Free Writing Prospectus as Park Town Cooperative Homes No. 1, Inc. is based upon the value of such residential cooperative property determined as if such residential cooperative property is operated as a multifamily rental property. See Annex A-1 to the Free Writing Prospectus. Debt service coverage ratio, debt yield and loan-to-value ratio information takes no account of subordinate debt (whether or not secured by the related mortgaged property), if any, that is allowed under the terms of any mortgage loan. |
| (2) | Fourteen (14) of the mortgage loans, each of which is secured by residential cooperative properties, currently have in place subordinate secured lines of credit to the related mortgage borrowers that permit future advances (such loans, collectively, the “Subordinate Coop LOCs”). The percentage figure expressed as “% of Mortgage Loans with Additional Subordinate Debt” is determined as a percentage of cut-off date principal balance and does not take into account future subordinate debt (whether or not secured by the mortgaged property), if any, that may be permitted under the terms of any mortgage loan or the Pooling and Servicing Agreement. See “Description of the Mortgage Pool—Subordinate and/or Other Financing” and “—Additional Debt Financing for Mortgage Loans Secured by Residential Cooperatives” in the Free Writing Prospectus |
| (3) | Excludes mortgage loans that are secured by multiple single tenant properties. |
THE INFORMATION IN THIS STRUCTURAL AND COLLATERAL TERM SHEET IS NOT COMPLETE AND MAY BE AMENDED PRIOR TO THE TIME OF SALE. THIS TERM SHEET IS NOT AN OFFER TO SELL THESE SECURITIES AND IT IS NOT A SOLICITATION OF AN OFFER TO BUY THESE SECURITIES IN ANY JURISDICTION WHERE THE OFFER OR SALE IS NOT PERMITTED.
5
| WFRBS Commercial Mortgage Trust 2014-C22 | Issue Characteristics |
Loan Structural Features:
Amortization: Based on the Cut-off Date Pool Balance, 83.0% of the mortgage pool (119 mortgage loans) has scheduled amortization, as follows:
34.9% (78 mortgage loans) requires amortization during the entire loan term; and
48.2% (41 mortgage loans) provides for an interest-only period followed by an amortization period.
Interest-Only: Based on the Cut-off Date Pool Balance, 17.0% of the mortgage pool (10 mortgage loans) provides for interest-only payments during the entire loan term. The Weighted Average Cut-off Date Loan-to-Value Ratio and Weighted Average U/W Net Cash Flow DSCR for those mortgage loans is 59.7% and 3.44x, respectively.
Hard Lockboxes: Based on the Cut-off Date Pool Balance, 54.3% of the mortgage pool (31 mortgage loans) has hard lockboxes in place.
Reserves: The mortgage loans require amounts to be escrowed monthly as follows (excluding any mortgage loans with springing provisions):
| Real Estate Taxes: | 81.9% of the pool | ||
| Insurance: | 37.1% of the pool | ||
| Capital Replacements: | 80.6% of the pool | ||
| TI/LC: | 47.0% of the pool(1) |
| (1) | The percentage of Cut-off Date Balance for loans with TI/LC reserves is based on the aggregate principal balance allocable to office, retail, industrial and mixed use properties. |
Call Protection/Defeasance: Based on the Cut-off Date Pool Balance, the mortgage pool has the following call protection and defeasance features:
83.4% of the mortgage pool (93 mortgage loans) features a lockout period, then defeasance only until an open period;
12.0% of the mortgage pool (16 mortgage loans) features a lockout period, then the greater of a prepayment premium or yield maintenance until an open period;
2.4% of the mortgage pool (six mortgage loans) features no lockout period, but requires the greater of a prepayment premium or yield maintenance for a period, then a prepayment premium until an open period;
2.0% of the mortgage pool (13 mortgage loans) features no lockout period, but requires a prepayment premium equal to a stated percentage of the principal amount prepaid which declines from 5.0% of the principal amount prepaid to 1.0% of the principal amount repaid until an open period during which no prepayment premium is payable; and
0.3% of the mortgage pool (one mortgage loan) features a lockout period, then defeasance or the greater of a prepayment premium or yield maintenance until an open period.
Please refer to Annex A-1 to the Free Writing Prospectus for further description of individual loan call protection.
THE INFORMATION IN THIS STRUCTURAL AND COLLATERAL TERM SHEET IS NOT COMPLETE AND MAY BE AMENDED PRIOR TO THE TIME OF SALE. THIS TERM SHEET IS NOT AN OFFER TO SELL THESE SECURITIES AND IT IS NOT A SOLICITATION OF AN OFFER TO BUY THESE SECURITIES IN ANY JURISDICTION WHERE THE OFFER OR SALE IS NOT PERMITTED.
6
| WFRBS Commercial Mortgage Trust 2014-C22 | Issue Characteristics |
| III. | Issue Characteristics |
| Securities Offered: | $1,266,319,000 approximate monthly pay, multi-class, commercial mortgage REMIC pass-through certificates consisting of twelve classes (Classes A-1, A-2, A-3, A-4, A-5, A-SB, A-S, B, C, PEX, X-A and X-B), which are offered pursuant to a registration statement filed with the SEC. | ||
| Mortgage Loan Sellers: | Wells Fargo Bank, National Association (“WFB”); The Royal Bank of Scotland (“RBS”); Rialto Mortgage Finance, LLC (“RMF”); Liberty Island Group I LLC (“LIG I”); NCB, FSB; C-III Commercial Mortgage LLC (“CIIICM”); Basis Real Estate Capital II, LLC (“Basis”); and Walker & Dunlop Commercial Property Funding I WF, LLC (“WDCPF”). | ||
| Co-lead Bookrunning Managers: | Wells Fargo Securities, LLC and RBS Securities Inc. | ||
| Co-Manager: | Deutsche Bank Securities Inc. | ||
| Rating Agencies: | Fitch Ratings, Inc., Kroll Bond Rating Agency, Inc. and Moody’s Investors Service, Inc. | ||
| Master Servicers: | Wells Fargo Bank, National Association and NCB, FSB | ||
| Special Servicers: | CWCapital Asset Management, LLC and NCB, FSB | ||
| Certificate Administrator: | Wells Fargo Bank, National Association | ||
| Trustee: | Wilmington Trust, National Association | ||
| Trust Advisor: | Pentalpha Surveillance LLC | ||
Initial Majority Subordinate Certificateholder: | An affiliate of Seer Capital Management, LP | ||
| Cut-off Date: | The Cut-off Date with respect to each mortgage loan is the due date for the monthly debt service payment that is due in September 2014 (or, in the case of any mortgage loan that has its first due date in October 2014, the date that would have been its due date in September 2014 under the terms of that mortgage loan if a monthly debt service payment were scheduled to be due in that month). | ||
| Expected Closing Date: | On or about September 29, 2014. | ||
| Determination Dates: | The 11th day of each month (or if that day is not a business day, the next succeeding business day), commencing in October 2014. | ||
| Distribution Dates: | The fourth business day following the Determination Date in each month, commencing in October 2014. | ||
Rated Final Distribution Date: | The Distribution Date in September 2057. | ||
| Interest Accrual Period: | With respect to any Distribution Date, the calendar month preceding the month in which such Distribution Date occurs. | ||
| Day Count: | The Offered Certificates will accrue interest on a 30/360 basis. | ||
| Minimum Denominations: | $10,000 for each Class of Offered Certificates (other than the Class X-A and X-B Certificates) and $1,000,000 for the Class X-A and X-B Certificates. Investments may also be made in any whole dollar denomination in excess of the applicable minimum denomination. | ||
| Clean-up Call: | 1% | ||
| Delivery: | DTC, Euroclear and Clearstream Banking | ||
| ERISA/SMMEA Status: | Each Class of Offered Certificates is expected to be eligible for exemptive relief under ERISA. No Class of Offered Certificates will be SMMEA eligible. | ||
| Risk Factors: | THE CERTIFICATES INVOLVE CERTAIN RISKS AND MAY NOT BE SUITABLE FOR ALL INVESTORS. SEE THE “RISK FACTORS” SECTION OF THE FREE WRITING PROSPECTUS. | ||
Bond Analytics Information: | The Certificate Administrator will be authorized to make distribution date settlements, CREFC® reports and certain supplemental reports (other than confidential information) available to certain financial modeling and data provision services, including Bloomberg Financial Markets L.P., Trepp LLC, Intex Solutions, Inc., Markit Group Limited, Interactive Data Corp., BlackRock Financial Management, Inc and CMBS.com, Inc. |
THE INFORMATION IN THIS STRUCTURAL AND COLLATERAL TERM SHEET IS NOT COMPLETE AND MAY BE AMENDED PRIOR TO THE TIME OF SALE. THIS TERM SHEET IS NOT AN OFFER TO SELL THESE SECURITIES AND IT IS NOT A SOLICITATION OF AN OFFER TO BUY THESE SECURITIES IN ANY JURISDICTION WHERE THE OFFER OR SALE IS NOT PERMITTED.
7
| WFRBS Commercial Mortgage Trust 2014-C22 | Characteristics of the Mortgage Pool |
| IV. | Characteristics of the Mortgage Pool(1) |
| A. | Ten Largest Mortgage Loans |
| Mortgage Loan Seller | Mortgage Loan Name | City | State | Number of Mortgage Loans / Mortgaged Properties | Mortgage Loan Cut-off Date Balance ($) | % of Cut-off Date Pool Balance (%) | Property Type | Number of SF, Rooms or Units | Cut-off Date Balance Per SF, Room or Unit ($) | Cut-off Date LTV Ratio (%) | Balloon or ARD LTV Ratio (%) | U/W NCF DSCR (x) | U/W NOI Debt Yield (%) |
| WFB | Bank of America Plaza | Los Angeles | CA | 1 / 1 | $150,000,000 | 10.1% | Office | 1,432,285 | $279 | 66.1% | 66.1% | 2.08x | 9.3% |
| WFB | Columbus Square Portfolio | New York | NY | 1 / 1 | 125,000,000 | 8.4 | Mixed Use | 494,224 | 809 | 72.1 | 66.1 | 1.15 | 6.7 |
| RBS | Stamford Plaza Portfolio | Stamford | CT | 1 / 4 | 100,000,000 | 6.7 | Office | 982,483 | 275 | 63.2 | 57.9 | 1.38 | 9.3 |
| WFB | Hampton Inn & Suites - Brickell | Miami | FL | 1 / 1 | 54,872,138 | 3.7 | Hospitality | 221 | 248,290 | 70.3 | 57.3 | 1.63 | 10.9 |
| WFB | Offices at Broadway Station | Denver | CO | 1 / 1 | 47,612,500 | 3.2 | Office | 318,053 | 150 | 62.0 | 62.0 | 2.10 | 9.8 |
| RBS | CSM Bakery Supplies Portfolio I | Various | Various | 1 / 4 | 44,557,500 | 3.0 | Industrial | 684,768 | 65 | 65.1 | 59.6 | 1.51 | 9.9 |
| WFB | U-Haul Portfolio | Various | Various | 1 / 21 | 35,000,000 | 2.4 | Self Storage | 421,632 | 83 | 71.1 | 57.0 | 1.82 | 11.0 |
| RBS | Hermosa Pavilion | Hermosa Beach | CA | 1 / 1 | 31,875,000 | 2.1 | Mixed Use | 120,226 | 265 | 73.4 | 65.6 | 1.36 | 8.5 |
| WDCPF | Texas Portfolio | Various | TX | 1 / 3 | 31,423,000 | 2.1 | Multifamily | 520 | 60,429 | 71.8 | 64.2 | 1.59 | 9.9 |
| WFB | Hilton Lexington Downtown | Lexington | KY | 1 / 1 | 28,420,000 | 1.9 | Hospitality | 366 | 77,650 | 69.3 | 67.0 | 1.93 | 13.6 |
| Top Three Total/Weighted Average | 3 / 6 | $375,000,000 | 25.2% | 67.3% | 63.9% | 1.58x | 8.4% | ||||||
| Top Five Total/Weighted Average | 5 / 8 | $477,484,638 | 32.1% | 67.1% | 63.0% | 1.64x | 8.9% | ||||||
| Top Ten Total/Weighted Average | 10 / 38 | $648,760,138 | 43.6% | 67.9% | 62.8% | 1.64x | 9.3% | ||||||
| Non-Top Ten Total/Weighted Average | 119 / 134 | $838,839,655 | 56.4% | 62.1% | 53.0% | 2.57x | 15.1% | ||||||
| (1) | With respect to the Bank of America Plaza mortgage loan, the Columbus Square Portfolio mortgage loan and the Stamford Plaza Portfolio mortgage loan, each of which is part of a pari passu loan combination, Cut-off Date Balance per square foot, loan-to-value ratio, debt service coverage ratio and debt yield calculations include the related pari passu companion loans (unless otherwise stated). With respect to each Mortgage Loan, debt service coverage ratio, debt yield and loan-to-value ratio information takes no account of subordinate debt (whether or not secured by the related mortgaged property), if any, that is allowed under the terms of any mortgage loan. |
THE INFORMATION IN THIS STRUCTURAL AND COLLATERAL TERM SHEET IS NOT COMPLETE AND MAY BE AMENDED PRIOR TO THE TIME OF SALE. THIS TERM SHEET IS NOT AN OFFER TO SELL THESE SECURITIES AND IT IS NOT A SOLICITATION OF AN OFFER TO BUY THESE SECURITIES IN ANY JURISDICTION WHERE THE OFFER OR SALE IS NOT PERMITTED.
8
| WFRBS Commercial Mortgage Trust 2014-C22 | Characteristics of the Mortgage Pool |
| B. | Summary of Pari Passu Split Loan Structures |
| Property Name | Mortgage Loan Seller | Related Notes in Loan Group (Original Balance) | Holder of Note | Whether Note is Lead Servicing for the Entire Loan Combination | Current Master Servicer Under Related Securitization Servicing Agreement | Current Special Servicer Under Related Securitization Servicing Agreement | |
| Bank of America Plaza | WFB | $150,000,000 | WFRBS 2014-C22 | Yes | Wells Fargo Bank, National Association | CWCapital Asset Management, LLC | |
| WFB | $116,670,000 | (1) | No | TBD | TBD | ||
| Citi | $133,330,000 | (1) | No | TBD | TBD | ||
| Columbus Square Portfolio | WFB | $125,000,000 | WFRBS 2014-C22 | Yes | Wells Fargo Bank, National Association | CWCapital Asset Management, LLC | |
| WFB | $75,000,000 | (2) | No | TBD | TBD | ||
| Barclays | $103,750,000 | (2) | No | TBD | TBD | ||
| Barclays | $96,250,000 | (2) | No | TBD | TBD | ||
| Stamford Plaza Portfolio | RBS | $100,000,000 | WFRBS 2014-C22 | (4) | Wells Fargo Bank, National Association | CWCapital Asset Management, LLC | |
| Citi | $120,000,000 | (3) | (4) | TBD | TBD | ||
| Citi | $50,000,000 | (3) | (4) | TBD | TBD |
| (1) | The related pari passu companion loan Note A-2 is currently held by the mortgage loan seller for the mortgage loan included in the WFRBS 2014-C22 trust and is expected to be contributed to a future securitization. The related pari passu companion loan Note A-3 is currently held by Citigroup Global Markets Realty Corp. and is expected to be contributed to a future securitization. No assurance can be provided that Notes A-2 and A-3 will not be split further. |
| (2) | The related pari passu companion loan Note A-3 is currently held by the mortgage loan seller for the mortgage loan included in the WFRBS 2014-C22 trust and is expected to be contributed to a future securitization. The related pari passu companion loan Notes A-2 and A-4 are currently held by Barclays Bank plc and are expected to be contributed to future securitizations. No assurance can be provided that Notes A-2, A-3 and A-4 will not be split further. |
| (3) | The related pari passu companion loan Notes A-1 and A-2 are currently held by Citigroup Global Markets Realty Corp. and are expected to be contributed to future securitizations. No assurance can be provided that Note A-1 and A-2 will not be split further. |
| (4) | The Stamford Plaza Portfolio pari passu loan combination will be serviced under the WFRBS 2014-C22 pooling and servicing agreement until the securitization of the related controlling pari passu companion loan, after which such loan combination will be serviced under the pooling and servicing agreement related to the securitization of the controlling pari passu companion loan. The master servicer under the latter pooling and servicing agreement will be identified in a notice, report or statement to holders of the WFRBS 2014-C22 certificates after the securitization of the controlling pari passu companion loan. |
| C. | Mortgage Loans with Additional Secured and Mezzanine Financing(1) |
| Loan No. | Mortgage Loan Seller | Mortgage Loan Name | Mortgage Loan Cut-off Date Balance ($) | % of Cut- off Date Balance (%) | Sub Debt Cut-off Date Balance ($) | Mezzanine Debt Cut-off Date Balance ($) | Total Debt Interest Rate (%)(2) | Mortgage Loan U/W NCF DSCR (x) | Total Debt U/W NCF DSCR (x) | Mortgage Loan Cut- off Date U/W NOI Debt Yield (%) | Total Debt Cut-off Date U/W NOI Debt Yield (%) | Mortgage Loan Cut-off Date LTV Ratio (%) | Total Debt Cut-off Date LTV Ratio (%) |
| 3 | RBS | Stamford Plaza Portfolio | 100,000,000 | 6.7% | $0 | NAP(3) | NAP(3) | 1.38x | NAP(3) | 9.3% | NAP(3) | 63.2% | NAP(3) |
| 9 | WDCPF | Texas Portfolio | 31,423,000 | 2.1 | 0 | 5,377,000 | 5.102% | 1.59 | 1.24x | 9.9 | 8.5% | 71.8 | 84.1% |
| 18 | RMF | 55 Miracle Mile | 20,400,000 | 1.4 | 0 | 3,400,000 | 6.303 | 1.25 | 0.95 | 8.3 | 7.1 | 68.0 | 79.3 |
| Total/Weighted Average | $151,823,000 | 10.2% | $0 | $398,777,000 | 5.575% | 1.41x | 1.13x | 9.3% | 7.9% | 65.6% | 82.2% | ||
| (1) | In addition, fourteen (14) of the mortgage loans, each of which are secured by residential cooperative properties, currently have in place Subordinate Coop LOCs that permit future advances, but as to which there are no present outstanding balances. See “Description of the Mortgage Pool—Subordinate and/or Other Financing” and “—Additional Debt Financing for Mortgage Loans Secured by Residential Cooperatives” in the Free Writing Prospectus. |
| (2) | Total Debt Interest Rate for any specified mortgage loan reflects the weighted average of the interest rates on the respective components of the total debt. |
| (3) | Affiliates of the borrowers have five outstanding junior mezzanine loans (the “Mezzanine Loans”). Two of the Mezzanine Loans are currently owned by affiliates of the borrowers, another two of the Mezzanine Loans are majority owned by affiliates of the borrowers, and the remaining Mezzanine Loan is owned by an affiliate of the borrower who has pledged its interest in such Mezzanine Loan to Westdeutsche Immobilienbank Mainz (“WIB”) as security for another subordinate loan with an equal balance. The Mezzanine Loans are secured by the direct or indirect equity interests in such borrower affiliates. The Mezzanine Loans have an aggregate original principal balance of $390,000,000, of which approximately $276,400,000 is owned by or participated to affiliates of the borrowers, and another approximately $50,000,000 is owned by an affiliate but pledged to WIB as discussed above. See “Description of the Mortgage Pool—Subordinate and/or Other Financing” in the Free Writing Prospectus. |
THE INFORMATION IN THIS STRUCTURAL AND COLLATERAL TERM SHEET IS NOT COMPLETE AND MAY BE AMENDED PRIOR TO THE TIME OF SALE. THIS TERM SHEET IS NOT AN OFFER TO SELL THESE SECURITIES AND IT IS NOT A SOLICITATION OF AN OFFER TO BUY THESE SECURITIES IN ANY JURISDICTION WHERE THE OFFER OR SALE IS NOT PERMITTED.
9
| WFRBS Commercial Mortgage Trust 2014-C22 | Characteristics of the Mortgage Pool |
| D. | Previous Securitization History(1) |
| Loan No. | Mortgage Loan Seller | Mortgage Loan or Mortgaged Property Name | City | State | Property Type | Mortgage Loan or Mortgaged Property Cut-off Date Balance ($) | % of Cut-off Date Pool Balance (%) | Previous Securitization | |
| 1 | WFB | Bank of America Plaza | Los Angeles | CA | Office | $150,000,000 | 10.1% | MSC 2004-HQ4 | |
| 3 | RBS | Stamford Plaza Portfolio | Stamford | CT | Office | 100,000,000 | 6.7 | BALL 2007-BMB1 | |
| 7 | WFB | U-Haul Portfolio | Various | Various | Self Storage | 35,000,000 | 2.4 | MLMT 2005-CKI1 | |
| 15 | LIG I | 400 Atlantic Avenue | Boston | MA | Office | 25,000,000 | 1.7 | CGCMT 2004-C1 | |
| 17.01 | RMF | Park West Apartments | San Antonio | TX | Multifamily | 13,302,389 | 0.9 | CSMC 2007-C5 | |
| 17.02 | RMF | Parliament Bend Apartments | San Antonio | TX | Multifamily | 9,097,611 | 0.6 | COMM 2006-C8 | |
| 28 | WFB | Residence Inn - Anaheim Hills Yorba Linda | Anaheim | CA | Hospitality | 13,000,000 | 0.9 | COMM 2005-C6 | |
| 29 | WFB | Newport Beach Mini U Storage I | Newport Beach | CA | Self Storage | 12,900,000 | 0.9 | WBCMT 2004-C14 | |
| 32 | WFB | Residence Inn - Ft. Lauderdale | Weston | FL | Hospitality | 10,987,181 | 0.7 | CSFB 2005-C5 | |
| 35 | WFB | Newport Beach Mini U Storage II | Newport Beach | CA | Self Storage | 10,100,000 | 0.7 | WBCMT 2004-C14 | |
| 44 | LIG I | Rolling Hills Apartments | Nashville | TN | Multifamily | 8,479,835 | 0.6 | GMACC 2004-C3 | |
| 46 | WFB | CT Self Storage - Fullerton | Fullerton | CA | Self Storage | 7,750,000 | 0.5 | GCCFC 2005-GG5 | |
| 47 | RBS | Greenbrier Plaza | Garden Grove | CA | Office | 7,500,000 | 0.5 | CSFB 2004-C5 | |
| 49 | WFB | Hampton Inn - Greenville | Greenville | SC | Hospitality | 7,491,495 | 0.5 | CSMC 2006-C1 | |
| 50 | RMF | Orillia Station | Kent | WA | Retail | 7,100,000 | 0.5 | CGCMT 2005-C3 | |
| 54 | RMF | Powell Crossing | Powell | OH | Retail | 6,950,000 | 0.5 | MLMT 2004-KEY2 | |
| 57 | LIG I | Shoppes at Barnes Crossing | Tupelo | MS | Retail | 6,250,000 | 0.4 | JPMCC 2006-CB14 | |
| 59 | NCB, FSB | Parkside Development Company, Inc. | Bronx | NY | Multifamily | 6,000,000 | 0.4 | CSFB 2004-C4 | |
| 61 | WFB | CT Self Storage - Escondido | Escondido | CA | Self Storage | 5,750,000 | 0.4 | GCCFC 2005-GG5 | |
| 63 | RBS | KCI Fairfield Inn & Suites, Kansas City, MO | Kansas City | MO | Hospitality | 5,500,000 | 0.4 | MLMT 2006-C1 | |
| 70 | RMF | Fishers Town Center | Fishers | IN | Retail | 4,790,157 | 0.3 | LBUBS 2004-C7 | |
| 77 | NCB, FSB | 72nd Street East Corporation | New York | NY | Multifamily | 4,250,000 | 0.3 | CSMC 2006-C1 | |
| 79 | WFB | 1182-1214 Farmington Avenue | Bristol | CT | Retail | 4,190,412 | 0.3 | BSCMS 2004-PWR6 | |
| 88 | NCB, FSB | Evelyn Court Apartment Corp. | Mamaroneck | NY | Multifamily | 3,495,276 | 0.2 | CSMC 2006-C1 | |
| 89 | NCB, FSB | Park Town Cooperative Homes No.1, Inc. | Cincinnati | OH | Multifamily | 3,400,000 | 0.2 | MSC 2005-IQ9 | |
| 90 | NCB, FSB | Bay Terrace Cooperative Section VIII, Inc. | Bayside | NY | Multifamily | 3,191,475 | 0.2 | TIAA 2001-C1A | |
| 92 | WFB | Continental Self Storage | Green Valley | AZ | Self Storage | 3,142,727 | 0.2 | BSCMS 2006-T22 | |
| 93 | WFB | SaraVilla Apartments | Clinton Township | MI | Multifamily | 3,095,006 | 0.2 | JPMCC 2004-LN2 | |
| 95 | WFB | Reserve at Cinco Ranch | Katy | TX | Retail | 2,996,621 | 0.2 | LBUBS 2004-C7 | |
| 98 | WFB | Walgreens - Lima | Lima | OH | Retail | 2,522,038 | 0.2 | CSFB 2004-C5 | |
| 103 | WFB | Polo Green Apartments | Sterling Heights | MI | Multifamily | 2,372,325 | 0.2 | JPMCC 2004-LN2 | |
| 106 | RMF | S&S Plaza | Mansfield | OH | Retail | 2,297,527 | 0.2 | CSFB 2004-C3 | |
| 114 | CIIICM | The Mill MHC | Rex | GA | Manufactured Housing Community | 1,960,000 | 0.1 | CSFB 2004-C5 | |
| 121 | NCB, FSB | Drake Lane Owners, Inc. | New Rochelle | NY | Multifamily | 1,498,005 | 0.1 | CSFB 2004-C4 | |
| 122 | NCB, FSB | Michelle Tenants Corp. | Bayside | NY | Multifamily | 1,496,004 | 0.1 | MSC 2005-IQ9 | |
| 124 | NCB, FSB | 250 West 16th Street Owners Corp. | New York | NY | Multifamily | 1,250,000 | 0.1 | MSC 2003-IQ6 | |
| 126 | NCB, FSB | 406 West 46th Street Corp. | New York | NY | Multifamily | 1,246,670 | 0.1 | CSFB 2004-C4 | |
| 127 | NCB, FSB | 741 West End Avenue Owners Corp. | New York | NY | Multifamily | 1,246,670 | 0.1 | TIAA 2001-C1A | |
| 128 | NCB, FSB | 250 Equities Corp. | New York | NY | Multifamily | 1,195,161 | 0.1 | CSFB 2004-C4 | |
| Total | $497,794,585 | 33.5% | |||||||
| (1) | The table above represents the most recent securitization with respect to the mortgaged property securing the related mortgage loan, based on information provided by the related borrower or obtained through searches of a third-party database. While the above mortgage loans may have been securitized multiple times in prior transactions, mortgage loans are only listed in the above chart if the mortgage loan in this securitization paid off a mortgage loan in another securitization. The information has not otherwise been confirmed by the mortgage loan sellers. |
THE INFORMATION IN THIS STRUCTURAL AND COLLATERAL TERM SHEET IS NOT COMPLETE AND MAY BE AMENDED PRIOR TO THE TIME OF SALE. THIS TERM SHEET IS NOT AN OFFER TO SELL THESE SECURITIES AND IT IS NOT A SOLICITATION OF AN OFFER TO BUY THESE SECURITIES IN ANY JURISDICTION WHERE THE OFFER OR SALE IS NOT PERMITTED.
10
| WFRBS Commercial Mortgage Trust 2014-C22 | Characteristics of the Mortgage Pool |
| E. Mortgage Loans with Scheduled Balloon Payments and Related Classes | |
Class A-2(1) | ||||||||||||||||||||||||||||||||
| Loan No. | Mortgage Loan Seller | Mortgage Loan Name | State | Property Type | Mortgage Loan Cut-off Date Balance ($) | % of Cut-off Date Pool Balance (%) | Mortgage Loan Balance at Maturity ($) | % of Class A-2 Certificate Principal Balance (%)(2) | SF/ Rooms/ Pads/ Units | Loan per SF/ Room/ Pad/Unit ($) | U/W NCF DSCR (x) | U/W NOI Debt Yield (%) | Cut-off Date LTV Ratio (%) | Balloon or ARD LTV Ratio (%) | Rem. IO Period (mos.) | Rem. Term to Maturity (mos.) | ||||||||||||||||
| 10 | WFB | Hilton Lexington Downtown | KY | Hospitality | $28,420,000 | 1.9% | $27,454,499 | 36.2% | $366 | $77,650 | 1.93x | 13.6% | 69.3% | 67.0% | 34 | 58 | ||||||||||||||||
| 18 | RMF | 55 Miracle Mile | FL | Mixed Use | 20,400,000 | 1.4 | 19,814,096 | 26.1 | 65,233 | 313 | 1.25 | 8.3 | 68.0 | 66.0 | 36 | 60 | ||||||||||||||||
| 33 | RMF | Cherry Grove Apartments | SC | Multifamily | 10,600,000 | 0.7 | 9,903,334 | 13.1 | 172 | 61,628 | 1.34 | 8.6 | 69.7 | 65.2 | 11 | 59 | ||||||||||||||||
| 34 | RBS | Oak Hill Portfolio | GA | Office | 10,440,000 | 0.7 | 9,517,244 | 12.5 | 65,846 | 159 | 1.67 | 10.7 | 66.1 | 60.2 | 0 | 60 | ||||||||||||||||
| 67 | Basis | Best Western Plus Dallas Hotel and Conference Center | TX | Hospitality | 5,200,000 | 0.3 | 4,831,519 | 6.4 | 160 | 32,500 | 1.57 | 13.0 | 59.1 | 54.9 | 0 | 60 | ||||||||||||||||
| Total/Weighted Average | $75,060,000 | 5.0% | $71,520,693 | 94.3% | 1.60x | 11.0% | 67.9% | 64.7% | 24 | 59 | ||||||||||||||||||||||
| (1) | The table above presents the mortgage loan(s) whose balloon payments would be applied to pay down the principal balance of the Class A-2 Certificates, assuming a 0% CPR and applying the “Structuring Assumptions” described in the Free Writing Prospectus, including the assumptions that (i) none of the mortgage loans in the pool experience prepayments prior to maturity (or, in the case of an ARD loan, its anticipated repayment date), defaults or losses; (ii) there are no extensions of maturity dates of any mortgage loans in the pool; and (iii) each mortgage loan in the pool is paid in full on its stated maturity date (or, in the case of an ARD loan, its anticipated repayment date). Each Class of Certificates, including the Class A-2 Certificates, evidences undivided ownership interests in the entire pool of mortgage loans. Debt service coverage ratio, debt yield and loan-to-value ratio information takes no account of subordinate debt (whether or not secured by the mortgaged property), if any, that is allowed under the terms of any mortgage loan. See Annex A-1 to the Free Writing Prospectus. |
| (2) | Reflects the percentage equal to the Mortgage Loan Balance at Maturity divided by the initial Class A-2 Certificate Principal Balance. |
Class A-3(1) | ||||||||||||||||||||||||||||||||
| Loan No. | Mortgage Loan Seller | Mortgage Loan Name | State | Property Type | Mortgage Loan Cut-off Date Balance ($) | % of Cut-off Date Pool Balance (%) | Mortgage Loan Balance at Maturity ($) | % of Class A-3 Certificate Principal Balance (%)(2) | SF/ Rooms/ Pads/ Units | Loan per SF/ Room/Pad/ Unit ($) | U/W NCF DSCR (x) | U/W NOI Debt Yield (%) | Cut-off Date LTV Ratio (%) | Balloon or ARD LTV Ratio (%) | Rem. IO Period (mos.) | Rem. Term to Maturity (mos.) | ||||||||||||||||
| 11 | LIG I | States Addition Apartments | ND | Multifamily | $28,000,000 | 1.9% | $22,719,906 | 37.9% | $235 | $119,149 | 1.48x | 11.0% | 68.3% | 55.4% | 0 | 84 | ||||||||||||||||
| 24 | WFB | The Dorel Apartments | TX | Multifamily | 14,800,000 | 1.0 | 13,204,974 | 22.0 | 202 | 73,267 | 1.45 | 8.9 | 74.4 | 66.4 | 11 | 83 | ||||||||||||||||
| 31 | RMF | Mill Creek Run Apartments | GA | Multifamily | 12,000,000 | 0.8 | 11,013,744 | 18.4 | 223 | 53,812 | 1.52 | 9.8 | 68.6 | 62.9 | 24 | 84 | ||||||||||||||||
| 39 | WFB | StorageMart - Crofton | MD | Self Storage | 8,900,000 | 0.6 | 8,129,872 | 13.6 | 83,830 | 106 | 1.38 | 8.4 | 70.9 | 64.8 | 22 | 82 | ||||||||||||||||
| 91 | LIG I | Woodstock Crossing | GA | Retail | 3,150,000 | 0.2 | 2,770,640 | 4.6 | 66,122 | 48 | 1.81 | 13.4 | 54.1 | 47.6 | 0 | 84 | ||||||||||||||||
| 99 | CIIICM | Rite Aid Middletown | OH | Retail | 2,512,500 | 0.2 | 2,097,264 | 3.5 | 10,966 | 229 | 1.34 | 9.7 | 75.0 | 62.6 | 0 | 84 | ||||||||||||||||
| Total/Weighted Average | $69,362,500 | 4.7% | $59,936,400 | 100.0% | 1.48 | x | 10.1% | 69.6% | 60.2% | 9 | 84 | |||||||||||||||||||||
| (1) | The table above presents the mortgage loan(s) whose balloon payments would be applied to pay down the principal balance of the Class A-3 Certificates, assuming a 0% CPR and applying the “Structuring Assumptions” described in the Free Writing Prospectus, including the assumptions that (i) none of the mortgage loans in the pool experience prepayments, defaults or losses; (ii) there are no extensions of maturity dates of any mortgage loans in the pool; and (iii) each mortgage loan in the pool is paid in full on its stated maturity date. Each Class of Certificates, including the Class A-3 Certificates, evidences undivided ownership interests in the entire pool of mortgage loans. Debt service coverage ratio, debt yield and loan-to-value ratio information takes no account of subordinate debt (whether or not secured by the mortgaged property), if any, that is allowed under the terms of any mortgage loan. See Annex A-1 to the Free Writing Prospectus. |
| (2) | Reflects the percentage equal to the Mortgage Loan Balance at Maturity divided by the initial Class A-3 Certificate Principal Balance. |
THE INFORMATION IN THIS STRUCTURAL AND COLLATERAL TERM SHEET IS NOT COMPLETE AND MAY BE AMENDED PRIOR TO THE TIME OF SALE. THIS TERM SHEET IS NOT AN OFFER TO SELL THESE SECURITIES AND IT IS NOT A SOLICITATION OF AN OFFER TO BUY THESE SECURITIES IN ANY JURISDICTION WHERE THE OFFER OR SALE IS NOT PERMITTED.
11
| WFRBS Commercial Mortgage Trust 2014-C22 | Characteristics of the Mortgage Pool |
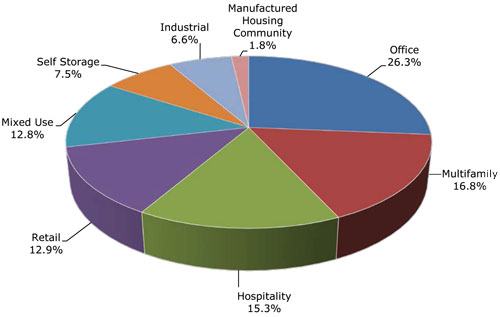
F. Property Type Distribution(1)
Property Type | Number of Mortgaged Properties | Aggregate Cut-off Date Balance ($) | % of Cut-off Date Balance (%) | Weighted Average Cut-off Date LTV Ratio (%) | Weighted Average Balloon or ARD LTV Ratio (%) | Weighted Average U/W NCF DSCR (x) | Weighted Average U/W NOI Debt Yield (%) | Weighted Average U/W NCF Debt Yield (%) | Weighted Average Mortgage Rate (%) | |||||||||||||||||
| Office | 16 | $391,595,121 | 26.3 | % | 63.3 | % | 60.2 | % | 1.86x | 9.8% | 9.0% | 4.343% | ||||||||||||||
| CBD | 9 | 306,585,399 | 20.6 | 63.4 | 60.4 | 1.83 | 9.6 | 8.8 | 4.340 | |||||||||||||||||
| Medical | 4 | 26,600,000 | 1.8 | 63.7 | 54.4 | 1.62 | 10.8 | 9.9 | 4.585 | |||||||||||||||||
| Suburban | 3 | 58,409,723 | 3.9 | 62.1 | 61.8 | 2.15 | 10.4 | 9.4 | 4.250 | |||||||||||||||||
| Multifamily | 39 | 249,635,124 | 16.8 | 54.4 | 47.0 | 4.70 | 24.7 | 24.3 | 4.453 | |||||||||||||||||
| Garden | 19 | 167,883,536 | 11.3 | 69.4 | 60.2 | 1.54 | 10.3 | 9.7 | 4.607 | |||||||||||||||||
| Cooperative | 19 | 65,551,588 | 4.4 | 12.1 | 10.2 | 13.58 | 65.2 | 65.2 | 3.986 | |||||||||||||||||
| Senior Housing | 1 | 16,200,000 | 1.1 | 70.6 | 59.1 | 1.51 | 9.7 | 9.5 | 4.750 | |||||||||||||||||
| Hospitality | 19 | 227,811,080 | 15.3 | 68.1 | 56.5 | 1.74 | 12.2 | 10.8 | 4.645 | |||||||||||||||||
| Limited Service | 18 | 199,391,080 | 13.4 | 67.9 | 55.0 | 1.71 | 12.0 | 10.8 | 4.718 | |||||||||||||||||
| Full Service | 1 | 28,420,000 | 1.9 | 69.3 | 67.0 | 1.93 | 13.6 | 11.2 | 4.130 | |||||||||||||||||
| Retail | 36 | 192,589,628 | 12.9 | 69.2 | 58.2 | 1.52 | 10.3 | 9.5 | 4.667 | |||||||||||||||||
| Anchored | 10 | 98,822,500 | 6.6 | 67.4 | 56.9 | 1.53 | 10.4 | 9.4 | 4.647 | |||||||||||||||||
| Unanchored | 9 | 38,516,528 | 2.6 | 71.5 | 60.4 | 1.54 | 10.5 | 9.7 | 4.721 | |||||||||||||||||
| Shadow Anchored | 8 | 28,697,153 | 1.9 | 72.8 | 60.8 | 1.54 | 10.6 | 9.8 | 4.683 | |||||||||||||||||
| Single Tenant | 9 | 26,553,446 | 1.8 | 68.4 | 56.8 | 1.42 | 9.4 | 8.9 | 4.649 | |||||||||||||||||
| Mixed Use | 5 | 190,075,000 | 12.8 | 71.4 | 65.3 | 1.21 | 7.3 | 7.1 | 4.599 | |||||||||||||||||
| Retail/Other/Office | 1 | 125,000,000 | 8.4 | 72.1 | 66.1 | 1.15 | 6.7 | 6.6 | 4.570 | |||||||||||||||||
| Retail/Office/Storage | 1 | 31,875,000 | 2.1 | 73.4 | 65.6 | 1.36 | 8.5 | 8.1 | 4.341 | |||||||||||||||||
| Retail/Office | 2 | 27,900,000 | 1.9 | 66.7 | 62.1 | 1.24 | 8.2 | 8.0 | 4.988 | |||||||||||||||||
| Multifamily/Retail | 1 | 5,300,000 | 0.4 | 66.3 | 60.9 | 1.56 | 10.2 | 9.8 | 4.800 | |||||||||||||||||
| Self Storage | 35 | 111,588,557 | 7.5 | 65.4 | 54.9 | 1.75 | 10.8 | 10.5 | 4.442 | |||||||||||||||||
| Self Storage | 35 | 111,588,557 | 7.5 | 65.4 | 54.9 | 1.75 | 10.8 | 10.5 | 4.442 | |||||||||||||||||
| Industrial | 13 | 97,522,157 | 6.6 | 65.8 | 60.1 | 1.48 | 10.0 | 9.1 | 4.539 | |||||||||||||||||
| Warehouse | 12 | 95,127,500 | 6.4 | 65.9 | 60.3 | 1.48 | 9.8 | 9.0 | 4.532 | |||||||||||||||||
| Flex | 1 | 2,394,657 | 0.2 | 63.0 | 51.6 | 1.87 | 16.8 | 11.8 | 4.810 | |||||||||||||||||
| Manufactured Housing Community | 9 | 26,783,126 | 1.8 | 60.3 | 50.6 | 2.09 | 12.9 | 12.6 | 4.536 | |||||||||||||||||
| Manufactured Housing Community | 9 | 26,783,126 | 1.8 | 60.3 | 50.6 | 2.09 | 12.9 | 12.6 | 4.536 | |||||||||||||||||
| Total/Weighted Average | 172 | $1,487,599,794 | 100.0 | % | 64.6 | % | 57.3 | % | 2.16x | 12.6% | 11.8% | 4.506% | ||||||||||||||
| (1) | Because this table presents information relating to the mortgaged properties and not the mortgage loans, the information for mortgage loans secured by more than one mortgaged property (other than through cross-collateralization with other mortgage loans) is based on allocated amounts (allocating the mortgage loan principal balance to each of those properties according to the relative appraised values of the mortgaged properties or the allocated loan amounts or property-specific release prices set forth in the related mortgage loan documents or such other allocation as the related mortgage loan seller deemed appropriate). The information for each mortgaged property that relates to a mortgage loan that is cross-collateralized with other mortgage loans is based upon the principal balance of that mortgage loan, except that the applicable loan-to-value ratio, debt service coverage ratio or debt yield for each such mortgaged property is based upon the ratio or yield (as applicable) for the aggregate indebtedness evidenced by all loans in the group. On an individual basis, without regard to the cross-collateralization feature, any mortgaged property securing a mortgage loan that is part of a cross-collateralized group of mortgage loans may have a higher loan-to-value ratio, lower debt service coverage ratio and/or lower debt yield than is presented herein. For mortgaged properties securing residential cooperative mortgage loans, the debt service coverage ratio or debt yield for each such mortgaged property is calculated using underwritten net cash flow for the related residential cooperative property which is the projected net cash flow reflected in the most recent appraisal obtained by or otherwise in the possession of the related mortgage loan seller as of the cut-off date, and the loan-to-value ratio is calculated based upon the appraised value of the residential cooperative property determined as if such residential cooperative property is operated as a residential cooperative; provided, however, that the loan-to-value ratio information for the residential cooperative mortgage loan secured by the mortgaged property identified on Annex A-1 to the Free Writing Prospectus as Park Town Cooperative Homes No. 1, Inc. is based upon the value of such residential cooperative property determined as if such residential cooperative property is operated as a multifamily rental property. With respect to the Bank of America Plaza mortgage loan, the Columbus Square Portfolio mortgage loan and the Stamford Plaza Portfolio mortgage loan, loan-to-value ratio, debt service coverage ratio and debt yield calculations include the related pari passu companion loans (unless otherwise stated). Debt service coverage ratio, debt yield and loan-to-value ratio information takes no account of subordinate debt (whether or not secured by the related mortgaged property) that is allowed under the terms of any mortgage loan. See Annex A-1 to the Free Writing Prospectus. |
THE INFORMATION IN THIS STRUCTURAL AND COLLATERAL TERM SHEET IS NOT COMPLETE AND MAY BE AMENDED PRIOR TO THE TIME OF SALE. THIS TERM SHEET IS NOT AN OFFER TO SELL THESE SECURITIES AND IT IS NOT A SOLICITATION OF AN OFFER TO BUY THESE SECURITIES IN ANY JURISDICTION WHERE THE OFFER OR SALE IS NOT PERMITTED.
12
| WFRBS Commercial Mortgage Trust 2014-C22 | Characteristics of the Mortgage Pool |
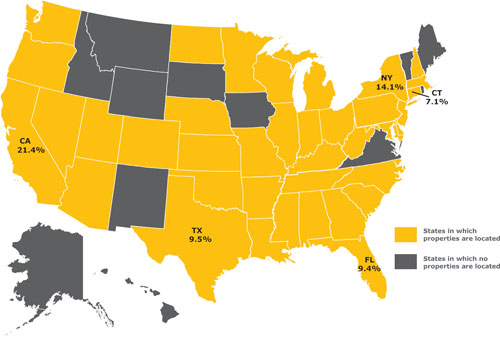
G. Geographic Distribution(1)(2)
| Location | Number of Mortgaged Properties | Aggregate Cut-off Date Balance ($) | % of Cut- off Date Balance (%) | Weighted Average Cut-off Date LTV Ratio (%) | Weighted Average Balloon or ARD LTV Ratio (%) | Weighted Average U/W NCF DSCR (x) | Weighted Average U/W NOI Debt Yield (%) | Weighted Average U/W NCF Debt Yield (%) | Weighted Average Mortgage Rate (%) | ||||||||||||||
| California | 20 | $317,661,400 | 21.4 | % | 64.6 | % | 60.4 | % | 1.91 | x | 10.2 | % | 9.5 | % | 4.252 | % | |||||||
| Southern | 14 | 277,106,344 | 18.6 | 64.8 | 61.4 | 1.95 | 10.1 | 9.4 | 4.222 | ||||||||||||||
| Northern | 6 | 40,555,057 | 2.7 | 62.9 | 53.7 | 1.67 | 10.8 | 10.1 | 4.455 | ||||||||||||||
| New York | 23 | 209,687,589 | 14.1 | 53.6 | 48.4 | 5.03 | 25.1 | 24.9 | 4.384 | ||||||||||||||
| Texas | 19 | 141,979,897 | 9.5 | 71.7 | 62.9 | 1.48 | 9.7 | 9.1 | 4.514 | ||||||||||||||
| Florida | 11 | 139,197,484 | 9.4 | 69.3 | 58.6 | 1.56 | 10.5 | 9.7 | 4.703 | ||||||||||||||
| Connecticut | 6 | 106,363,035 | 7.1 | 63.4 | 57.7 | 1.39 | 9.4 | 8.5 | 4.596 | ||||||||||||||
Other(3) | 93 | 572710388 | 38.5 | 65.9 | 56.9 | 1.71 | 11.1 | 10.2 | 4.626 | ||||||||||||||
| Total/Weighted Average | 172 | $1,487,599,794 | 100.0 | % | 64.6 | % | 57.3 | % | 2.16 | x | 12.6 | % | 11.8 | % | 4.506 | % | |||||||
| (1) | The Mortgaged Properties are located in 38 states. |
| (2) | Because this table presents information relating to the mortgaged properties and not the mortgage loans, the information for mortgage loans secured by more than one mortgaged property (other than through cross-collateralization with other mortgage loans) is based on allocated amounts (allocating the mortgage loan principal balance to each of those properties according to the relative appraised values of the mortgaged properties or the allocated loan amounts or property-specific release prices set forth in the related mortgage loan documents or such other allocation as the related mortgage loan seller deemed appropriate). The information for each mortgaged property that relates to a mortgage loan that is cross-collateralized with other mortgage loans is based upon the principal balance of that mortgage loan, except that the applicable loan-to-value ratio, debt service coverage ratio or debt yield for each such mortgaged property is based upon the ratio or yield (as applicable) for the aggregate indebtedness evidenced by all loans in the group. On an individual basis, without regard to the cross-collateralization feature, any mortgaged property securing a mortgage loan that is part of a cross-collateralized group of mortgage loans may have a higher loan-to-value ratio, lower debt service coverage ratio and/or lower debt yield than is presented herein. For mortgaged properties securing residential cooperative mortgage loans, the debt service coverage ratio or debt yield for each such mortgaged property is calculated using underwritten net cash flow for the related residential cooperative property which is the projected net cash flow reflected in the most recent appraisal obtained by or otherwise in the possession of the related mortgage loan seller as of the cut-off date, and the loan-to-value ratio is calculated based upon the appraised value of the residential cooperative property determined as if such residential cooperative property is operated as a residential cooperative; provided, however, that the loan-to-value ratio information for the residential cooperative mortgage loan secured by the mortgaged property identified on Annex A-1 to the Free Writing Prospectus as Park Town Cooperative Homes No. 1, Inc. is based upon the value of such residential cooperative property determined as if such residential cooperative property is operated as a multifamily rental property. With respect to the Bank of America Plaza mortgage loan, the Columbus Square Portfolio mortgage loan and the Stamford Plaza Portfolio mortgage loan, loan-to-value ratio, debt service coverage ratio and debt yield calculations include the related pari passu companion loans (unless otherwise stated). Debt service coverage ratio, debt yield and loan-to-value ratio information takes no account of subordinate debt (whether or not secured by the related mortgaged property), if any, that is allowed under the terms of any mortgage loan. See Annex A-1 to the Free Writing Prospectus. |
| (3) | Includes 33 other states. |
THE INFORMATION IN THIS STRUCTURAL AND COLLATERAL TERM SHEET IS NOT COMPLETE AND MAY BE AMENDED PRIOR TO THE TIME OF SALE. THIS TERM SHEET IS NOT AN OFFER TO SELL THESE SECURITIES AND IT IS NOT A SOLICITATION OF AN OFFER TO BUY THESE SECURITIES IN ANY JURISDICTION WHERE THE OFFER OR SALE IS NOT PERMITTED.
13
| WFRBS Commercial Mortgage Trust 2014-C22 | Characteristics of the Mortgage Pool |
H. Characteristics of the Mortgage Pool(1)
| CUT-OFF DATE BALANCE | |||||||||
| Number of | |||||||||
| Range of Cut-off Date | Mortgage | Aggregate Cut- | % of Cut-off | ||||||
| Balances ($) | Loans | off Date Balance | Date Balance | ||||||
| 897,778 - 1,000,000 | 1 | $897,778 | 0.1 | % | |||||
| 1,000,001 - 2,000,000 | 16 | 24,462,744 | 1.6 | ||||||
| 2,000,001 - 3,000,000 | 19 | 45,684,173 | 3.1 | ||||||
| 3,000,001 - 4,000,000 | 12 | 42,481,819 | 2.9 | ||||||
| 4,000,001 - 5,000,000 | 13 | 57,729,667 | 3.9 | ||||||
| 5,000,001 - 6,000,000 | 10 | 54,887,310 | 3.7 | ||||||
| 6,000,001 - 7,000,000 | 8 | 54,021,849 | 3.6 | ||||||
| 7,000,001 - 8,000,000 | 5 | 37,341,495 | 2.5 | ||||||
| 8,000,001 - 9,000,000 | 8 | 69,221,311 | 4.7 | ||||||
| 9,000,001 - 10,000,000 | 2 | 19,075,000 | 1.3 | ||||||
| 10,000,001 - 15,000,000 | 13 | 163,160,646 | 11.0 | ||||||
| 15,000,001 - 20,000,000 | 4 | 68,452,391 | 4.6 | ||||||
| 20,000,001 - 30,000,000 | 9 | 229,843,473 | 15.5 | ||||||
| 30,000,001 - 50,000,000 | 5 | 190,468,000 | 12.8 | ||||||
| 50,000,001 - 70,000,000 | 1 | 54,872,138 | 3.7 | ||||||
| 70,000,001 - 100,000,000 | 1 | 100,000,000 | 6.7 | ||||||
| 100,000,001 – 150,000,000 | 2 | 275,000,000 | 18.5 | ||||||
| Total: | 129 | $1,487,599,794 | 100.0 | % | |||||
| Average: | $11,531,781 | ||||||||
| UNDERWRITTEN NOI DEBT SERVICE COVERAGE RATIO | |||||||||
| Number of | |||||||||
| Range of U/W NOI | Mortgage | Aggregate Cut- | % of Cut-off | ||||||
| DSCRs (x) | Loans | off Date Balance | Date Balance | ||||||
| 1.17 - 1.20 | 1 | $125,000,000 | 8.4 | % | |||||
| 1.21 - 1.30 | 2 | 27,900,000 | 1.9 | ||||||
| 1.31 - 1.40 | 8 | 48,702,932 | 3.3 | ||||||
| 1.41 - 1.50 | 9 | 114,737,428 | 7.7 | ||||||
| 1.51 - 1.60 | 19 | 254,020,392 | 17.1 | ||||||
| 1.61 - 1.70 | 21 | 192,672,948 | 13.0 | ||||||
| 1.71 - 1.80 | 12 | 152,451,640 | 10.2 | ||||||
| 1.81 - 1.90 | 12 | 110,779,470 | 7.4 | ||||||
| 1.91 - 2.00 | 2 | 23,000,000 | 1.5 | ||||||
| 2.01 - 2.25 | 14 | 102,397,414 | 6.9 | ||||||
| 2.26 - 2.50 | 4 | 228,404,825 | 15.4 | ||||||
| 2.51 – 2.75 | 2 | 9,886,153 | 0.7 | ||||||
| 2.76 – 3.00 | 2 | 20,600,000 | 1.4 | ||||||
| 3.01 – 3.50 | 2 | 7,490,281 | 0.5 | ||||||
| 4.01 – 52.38 | 19 | 69,556,312 | 4.7 | ||||||
| Total: | 129 | $1,487,599,794 | 100.0 | % | |||||
| Weighted Average: | 2.29x | ||||||||
| UNDERWRITTEN NCF DEBT SERVICE COVERAGE RATIO | |||||||||
| Number of | |||||||||
| Range of U/W NCF | Mortgage | Aggregate Cut- | % of Cut-off | ||||||
| DSCRs (x) | Loans | off Date Balance | Date Balance | ||||||
| 1.15 - 1.20 | 1 | $125,000,000 | 8.4 | % | |||||
| 1.21 - 1.30 | 6 | 61,842,391 | 4.2 | ||||||
| 1.31 - 1.40 | 16 | 228,063,033 | 15.3 | ||||||
| 1.41 - 1.50 | 20 | 189,614,248 | 12.7 | ||||||
| 1.51 - 1.60 | 21 | 191,022,029 | 12.8 | ||||||
| 1.61 - 1.70 | 14 | 168,588,329 | 11.3 | ||||||
| 1.71 - 1.80 | 7 | 32,372,793 | 2.2 | ||||||
| 1.81 - 1.90 | 8 | 99,776,874 | 6.7 | ||||||
| 1.91 - 2.00 | 8 | 83,675,145 | 5.6 | ||||||
| 2.01 - 2.25 | 4 | 202,506,863 | 13.6 | ||||||
| 2.26 - 3.00 | 3 | 28,091,495 | 1.9 | ||||||
| 3.01 - 3.50 | 2 | 7,490,281 | 0.5 | ||||||
| 3.51 - 52.38 | 19 | 69,556,312 | 4.7 | ||||||
| Total: | 129 | $1,487,599,794 | 100.0 | % | |||||
| Weighted Average: | 2.16x | ||||||||
| LOAN PURPOSE | |||||||||
| Number of | |||||||||
| Mortgage | Aggregate Cut- | % of Cut-off | |||||||
| Loan Purpose | Loans | off Date Balance | Date Balance | ||||||
| Refinance | 100 | $1,115,823,090 | 75.0 | % | |||||
| Acquisition | 29 | 371,776,704 | 25.0 | ||||||
| Total: | 129 | $1,487,599,794 | 100.0 | % | |||||
| MORTGAGE RATE | |||||||||
| Number of | |||||||||
| Range of Mortgage Rates | Mortgage | Aggregate Cut- | % of Cut-off | ||||||
| (%) | Loans | off Date Balance | Date Balance | ||||||
| 3.840 - 4.000 | 13 | $48,408,649 | 3.3 | % | |||||
| 4.001 - 4.250 | 11 | 295,574,883 | 19.9 | ||||||
| 4.251 - 4.500 | 22 | 282,299,248 | 19.0 | ||||||
| 4.501 - 4.750 | 43 | 606,347,877 | 40.8 | ||||||
| 4.751 - 5.000 | 24 | 131,074,696 | 8.8 | ||||||
| 5.001 - 5.250 | 11 | 103,520,517 | 7.0 | ||||||
| 5.251 - 5.500 | 4 | 15,173,924 | 1.0 | ||||||
| 5.501 – 5.510 | 1 | 5,200,000 | 0.3 | ||||||
| Total: | 129 | $1,487,599,794 | 100.0 | % | |||||
| Weighted Average: | 4.506% | ||||||||
| UNDERWRITTEN NOI DEBT YIELD | |||||||||
| Number of | |||||||||
| Range of U/W NOI | Mortgage | Aggregate Cut- | % of Cut-off | ||||||
| Debt Yields (%) | Loans | off Date Balance | Date Balance | ||||||
| 6.7 - 8.0 | 2 | $132,500,000 | 8.9 | % | |||||
| 8.1 - 9.0 | 10 | 122,923,041 | 8.3 | ||||||
| 9.1 - 10.0 | 29 | 597,575,501 | 40.2 | ||||||
| 10.1 - 11.0 | 26 | 268,575,342 | 18.1 | ||||||
| 11.1 - 12.0 | 17 | 131,071,524 | 8.8 | ||||||
| 12.1 - 13.0 | 10 | 52,948,249 | 3.6 | ||||||
| 13.1 - 14.0 | 8 | 73,301,066 | 4.9 | ||||||
| 14.1 - 15.0 | 3 | 9,772,325 | 0.7 | ||||||
| 15.1 - 17.0 | 2 | 9,886,153 | 0.7 | ||||||
| 17.1 - 18.0 | 2 | 15,495,276 | 1.0 | ||||||
| 18.1 - 20.0 | 1 | 7,500,000 | 0.5 | ||||||
| 20.1 - 217.8 | 19 | 66,051,317 | 4.4 | ||||||
| Total: | 129 | $1,487,599,794 | 100.0 | % | |||||
| Weighted Average: | 12.6% | ||||||||
| UNDERWRITTEN NCF DEBT YIELD | |||||||||
| Number of | |||||||||
| Range of U/W NCF | Mortgage | Aggregate Cut- | % of Cut-off | ||||||
| Debt Yields (%) | Loans | off Date Balance | Date Balance | ||||||
| 6.6 - 8.0 | 4 | $164,000,000 | 11.0 | % | |||||
| 8.1 - 9.0 | 25 | 553,393,348 | 37.2 | ||||||
| 9.1 - 10.0 | 38 | 301,324,346 | 20.3 | ||||||
| 10.1 - 11.0 | 18 | 227,970,722 | 15.3 | ||||||
| 11.1 - 12.0 | 14 | 123,845,922 | 8.3 | ||||||
| 12.1 - 13.0 | 6 | 18,005,331 | 1.2 | ||||||
| 13.1 - 14.0 | 1 | 2,522,038 | 0.2 | ||||||
| 14.1 - 17.0 | 2 | 19,491,495 | 1.3 | ||||||
| 17.1 - 20.0 | 3 | 14,990,281 | 1.0 | ||||||
| 20.1 - 217.8 | 18 | 62,056,312 | 4.2 | ||||||
| Total: | 129 | $1,487,599,794 | 100.0 | % | |||||
| Weighted Average: | 11.8% | ||||||||
(1) | The information in this “Characteristics of the Mortgage Pool” section has been calculated in accordance with the methodologies specified in footnote (1) to the table captioned “Credit Statistics” under the “Transaction Highlights” section above. |
THE INFORMATION IN THIS STRUCTURAL AND COLLATERAL TERM SHEET IS NOT COMPLETE AND MAY BE AMENDED PRIOR TO THE TIME OF SALE. THIS TERM SHEET IS NOT AN OFFER TO SELL THESE SECURITIES AND IT IS NOT A SOLICITATION OF AN OFFER TO BUY THESE SECURITIES IN ANY JURISDICTION WHERE THE OFFER OR SALE IS NOT PERMITTED.
14
| WFRBS Commercial Mortgage Trust 2014-C22 | Characteristics of the Mortgage Pool |
| ORIGINAL TERM TO MATURITY OR ARD | |||||||||
| Number of | |||||||||
| Range of Original Terms to | Mortgage | Aggregate Cut- | % of Cut-off | ||||||
| Maturity or ARD (months) | Loans | off Date Balance | Date Balance | ||||||
| 60 | 5 | $75,060,000 | 5.0 | % | |||||
| 84 | 6 | 69,362,500 | 4.7 | ||||||
| 120 | 118 | 1,343,177,294 | 90.3 | ||||||
| Total: | 129 | $1,487,599,794 | 100.0 | % | |||||
| Weighted Average: | 115 months | ||||||||
| REMAINING TERM TO MATURITY OR ARD | |||||||||
| Number of | |||||||||
| Range of Remaining Terms | Mortgage | Aggregate Cut- | % of Cut-off | ||||||
| to Maturity or ARD (months) | Loans | off Date Balance | Date Balance | ||||||
| 58 - 60 | 5 | $75,060,000 | 5.0 | % | |||||
| 61 - 84 | 6 | 69,362,500 | 4.7 | ||||||
| 85 - 120 | 118 | 1,343,177,294 | 90.3 | ||||||
| Total: | 129 | $1,487,599,794 | 100.0 | % | |||||
| Weighted Average: | 115 months | ||||||||
ORIGINAL AMORTIZATION TERM(2) | |||||||||
| Range of Original | Number of | ||||||||
| Amortization Terms | Mortgage | Aggregate Cut- | % of Cut-off | ||||||
| (months) | Loans | off Date Balance | Date Balance | ||||||
| Interest-Only | 10 | $252,612,500 | 17.0 | % | |||||
| 240 | 1 | 2,793,376 | 0.2 | ||||||
| 241 - 300 | 11 | 93,668,991 | 6.3 | ||||||
| 301 - 360 | 104 | 989,524,927 | 66.5 | ||||||
| 361 - 420 | 1 | 125,000,000 | 8.4 | ||||||
| 421 - 480 | 2 | 24,000,000 | 1.6 | ||||||
| Total: | 129 | $1,487,599,794 | 100.0 | % | |||||
Weighted Average(3): | 363 months | ||||||||
| (2) The original amortization term shown for any mortgage loan that is interest-only for part of its term does not include the number of months in its interest-only period and reflects only the number of months as of the commencement of amortization remaining from the end of such interest-only period. | |||||||||
| (3) Excludes the non-amortizing loans. | |||||||||
REMAINING AMORTIZATION TERM(4) | |||||||||
| Range of Remaining | Number of | ||||||||
| Amortization Terms | Mortgage | Aggregate Cut- | % of Cut-off | ||||||
| (months) | Loans | off Date Balance | Date Balance | ||||||
| Interest-Only | 10 | $252,612,500 | 17.0 | % | |||||
| 181 - 240 | 1 | 2,793,376 | 0.2 | ||||||
| 241 - 300 | 11 | 93,668,991 | 6.3 | ||||||
| 301 - 360 | 104 | 989,524,927 | 66.5 | ||||||
| 361 - 480 | 3 | 149,000,000 | 10.0 | ||||||
| Total: | 129 | $1,487,599,794 | 100.0 | % | |||||
Weighted Average(5): | 363 months | ||||||||
| (4) The remaining amortization term shown for any mortgage loan that is interest-only for part of its term does not include the number of months in its interest-only period and reflects only the number of months as of the commencement of amortization remaining from the end of such interest-only period. | |||||||||
| (5) Excludes the non-amortizing loans. | |||||||||
| LOCKBOXES | |||||||||
| Number of | % of Cut- | ||||||||
| Mortgage | Aggregate Cut- | off Date | |||||||
| Type of Lockbox | Loans | off Date Balance | Balance | ||||||
| Hard/Springing Cash Management | 26 | $502,480,988 | 33.8 | % | |||||
| Springing (Without Established Account) | 54 | 390,906,510 | 26.3 | ||||||
| Hard/Upfront Cash Management | 5 | 305,952,375 | 20.6 | ||||||
| None | 34 | 143,874,994 | 9.7 | ||||||
| Soft/Springing Cash Management | 5 | 81,989,427 | 5.5 | ||||||
| Soft/Upfront Cash Management | 1 | 31,423,000 | 2.1 | ||||||
| Springing (With Established Account) | 4 | 30,972,500 | 2.1 | ||||||
| Total: | 129 | $1,487,599,794 | 100.0 | % | |||||
| PREPAYMENT PROVISION SUMMARY | |||||||||
| Number of | % of Cut- | ||||||||
| Mortgage | Aggregate Cut- | off Date | |||||||
| Prepayment Provision | Loans | off Date Balance | Balance | ||||||
| Lockout/Def./Open | 93 | $1,240,336,027 | 83.4 | % | |||||
| Lockout/GTR YM% or 1%/Open | 16 | 177,816,775 | 12.0 | ||||||
| GTR 1% or YM%/Open | 6 | 35,993,054 | 2.4 | ||||||
| 5%/4%/3%/2%/1%/Open | 13 | 29,558,534 | 2.0 | ||||||
| Lockout/Def. or GTR 1% or YM%/Open | 1 | 3,895,404 | 0.3 | ||||||
| Total: | 129 | $1,487,599,794 | 100.0 | % | |||||
| CUT-OFF DATE LOAN-TO-VALUE RATIO | |||||||||
| Number of | |||||||||
| Range of Cut-off Date LTV | Mortgage | Aggregate Cut- | % of Cut-off | ||||||
| Ratios (%) | Loans | off Date Balance | Date Balance | ||||||
| 2.7 - 20.0 | 16 | $52,656,312 | 3.5 | % | |||||
| 20.1 – 30.0 | 2 | 9,495,276 | 0.6 | ||||||
| 30.1 - 40.0 | 2 | 5,597,223 | 0.4 | ||||||
| 40.1 - 50.0 | 7 | 60,361,666 | 4.1 | ||||||
| 50.1 - 55.0 | 5 | 32,898,752 | 2.2 | ||||||
| 55.1 - 60.0 | 4 | 19,194,887 | 1.3 | ||||||
| 60.1 - 65.0 | 20 | 300,514,566 | 20.2 | ||||||
| 65.1 - 70.0 | 30 | 511,211,775 | 34.4 | ||||||
| 70.1 - 75.0 | 41 | 469,004,338 | 31.5 | ||||||
| 75.1 – 79.7 | 2 | 26,665,000 | 1.8 | ||||||
| Total: | 129 | $1,487,599,794 | 100.0 | % | |||||
| Weighted Average: | 64.6% | ||||||||
| BALLOON OR ARD LOAN-TO-VALUE RATIO | |||||||||
| Number of | |||||||||
| Range of Balloon LTV | Mortgage | Aggregate Cut- | % of Cut-off | ||||||
| Ratios (%) | Loans | off Date Balance | Date Balance | ||||||
| 2.4 - 20.0 | 16 | $52,656,312 | 3.5 | % | |||||
| 20.1 - 25.0 | 2 | 9,495,276 | 0.6 | ||||||
| 25.1 - 35.0 | 3 | 8,119,260 | 0.5 | ||||||
| 35.1 - 40.0 | 3 | 22,995,005 | 1.5 | ||||||
| 40.1 - 45.0 | 4 | 13,886,751 | 0.9 | ||||||
| 45.1 - 50.0 | 9 | 66,634,661 | 4.5 | ||||||
| 50.1 - 55.0 | 25 | 196,492,702 | 13.2 | ||||||
| 55.1 - 60.0 | 26 | 446,586,886 | 30.0 | ||||||
| 60.1 - 65.0 | 28 | 239,504,191 | 16.1 | ||||||
| 65.1 - 70.0 | 13 | 431,228,750 | 29.0 | ||||||
| Total: | 129 | $1,487,599,794 | 100.0 | % | |||||
| Weighted Average: | 57.3% | ||||||||
| AMORTIZATION TYPE | |||||||||
Number of | |||||||||
| Mortgage | Aggregate Cut- | % of Cut-off | |||||||
| Type of Amortization | Loans | off Date Balance | Date Balance | ||||||
| Interest-only, Amortizing Balloon | 38 | $621,387,125 | 41.8 | % | |||||
| Amortizing Balloon | 77 | 483,472,669 | 32.5 | ||||||
| Interest-only, Balloon | 10 | 252,612,500 | 17.0 | ||||||
| Interest-only, Amortizing ARD | 3 | 95,127,500 | 6.4 | ||||||
| Amortizing ARD | 1 | 35,000,000 | 2.4 | ||||||
| Total: | 129 | $1,487,599,794 | 100.0 | % | |||||
| ORIGINAL TERM OF INTEREST-ONLY PERIOD FOR PARTIAL IO LOANS | |||||||||
| Number of | |||||||||
| Mortgage | Aggregate Cut- | % of Cut-off | |||||||
| IO Term (months) | Loans | off Date Balance | Date Balance | ||||||
| 12 | 6 | $52,158,000 | 3.5 | % | |||||
| 13 - 24 | 11 | 97,962,500 | 6.6 | ||||||
| 25 - 36 | 11 | 115,193,625 | 7.7 | ||||||
| 37 - 48 | 4 | 195,398,000 | 13.1 | ||||||
| 49 - 60 | 8 | 245,827,500 | 16.5 | ||||||
| 61 - 72 | 1 | 9,975,000 | 0.7 | ||||||
| Total: | 41 | $716,514,625 | 48.2 | % | |||||
| Weighted Average: | 44 months | ||||||||
| SEASONING | |||||||||
| Number of | |||||||||
| Mortgage | Aggregate Cut- | % of Cut-off | |||||||
| Seasoning (months) | Loans | off Date Balance | Date Balance | ||||||
| 0 | 46 | $654,367,375 | 44.0 | ||||||
| 1 | 55 | 604,465,078 | 40.6 | ||||||
| 2 - 3 | 28 | 228,767,341 | 15.4 | ||||||
| Total: | 129 | $1,487,599,794 | 100.0 | % | |||||
| Weighted Average: | 1 month | ||||||||
THE INFORMATION IN THIS STRUCTURAL AND COLLATERAL TERM SHEET IS NOT COMPLETE AND MAY BE AMENDED PRIOR TO THE TIME OF SALE. THIS TERM SHEET IS NOT AN OFFER TO SELL THESE SECURITIES AND IT IS NOT A SOLICITATION OF AN OFFER TO BUY THESE SECURITIES IN ANY JURISDICTION WHERE THE OFFER OR SALE IS NOT PERMITTED.
15
WFRBS Commercial Mortgage Trust 2014-C22 | Certain Terms and Conditions |
V. Certain Terms and Conditions
| Interest Entitlements: | The interest entitlement of each Class of Offered Certificates on each Distribution Date generally will be the interest accrued during the related Interest Accrual Period on the related Certificate Principal Balance or Notional Amount at the related pass-through rate, net of any prepayment interest shortfalls allocated to that Class for such Distribution Date as described below. If prepayment interest shortfalls arise from voluntary prepayments (without applicable Special Servicer consent) on particular non-specially serviced mortgage loans during any collection period, the applicable Master Servicer is required to make a compensating interest payment to offset those shortfalls, generally up to an amount equal to the portion of its master servicing fees that accrue at one basis point per annum. The remaining amount of prepayment interest shortfalls will be allocated to reduce the interest entitlement on all Classes of Certificates (other than the Class X-A, X-B, X-C, X-D, X-E and X-Y Certificates), pro rata, based on their respective amounts of accrued interest for the related Distribution Date (except with respect to the allocation among the Class A-S, B, C and PEX Certificates as described below under “Allocations and Distributions on the Class A-S, B, C and PEX Certificates”). If a Class receives less than the entirety of its interest entitlement on any Distribution Date, then the shortfall, excluding any shortfall due to prepayment interest shortfalls, will be added to its interest entitlement for the next succeeding Distribution Date. Interest entitlements on the Class E and D Certificates and the Class C and B regular interests, in that order, may be reduced by certain Trust Advisor expenses (subject to the discussion below under “Allocations and Distributions on the Class A-S, B, C and PEX Certificates”). | ||
Principal Distribution Amount: | The Principal Distribution Amount for each Distribution Date generally will be the aggregate amount of principal received or advanced in respect of the mortgage loans, net of any non-recoverable advances and interest thereon that are reimbursed to the applicable Master Servicer, the applicable Special Servicer or the Trustee during the related collection period. Non-recoverable advances and interest thereon are reimbursable from principal collections and advances before reimbursement from other amounts. The Principal Distribution Amount may also be reduced, with a corresponding loss, to the Class E and D Certificates and the Class C, B and A-S regular interests, then to the Class A-1, A-2, A-3, A-4, A-5 and A-SB Certificates (with any losses on the Class A-1, A-2, A-3, A-4, A-5 and A-SB Certificates allocated pro rata according to their respective Certificate Principal Balances immediately prior to that Distribution Date), in that order, in connection with certain Trust Advisor expenses to the extent that interest entitlements on the Class B and C regular interests and the Class D and E Certificates are insufficient to absorb the effect of the expense on any particular Distribution Date. For a discussion on the allocation of amounts distributable in respect of the Class A-S, B and C regular interests, see “Allocations and Distributions on the Class A-S, B, C and PEX Certificates” below. | ||
| Distributions: | On each Distribution Date, funds available for distribution from the mortgage loans, net of specified trust fees, expenses and reimbursements will generally be distributed in the following amounts and order of priority (in each case to the extent of remaining available funds): | ||
| 1. | Class A-1, A-2, A-3, A-4, A-5, A-SB, X-A, X-B, X-C, X-D, X-E and X-Y Certificates: To interest on the Class A-1, A-2, A-3, A-4, A-5, A-SB, X-A, X-B, X-C, X-D, X-E and X-Y Certificates, pro rata, according to their respective interest entitlements. | ||
| 2. | Class A-1, A-2, A-3, A-4, A-5 and A-SB Certificates: To principal on the Class A-1, A-2, A-3, A-4, A-5 and A-SB Certificates in the following amounts and order of priority: (i) first, to principal on the Class A-SB Certificates, in an amount up to the Principal Distribution Amount for such Distribution Date until their Certificate Principal Balance is reduced to the Class A-SB Planned Principal Balance for such Distribution Date; (ii) second, to principal on the Class A-1 Certificates until their Certificate Principal Balance is reduced to zero, up to the remainder of the Principal Distribution Amount for such Distribution Date; (iii) third, to principal on the Class A-2 Certificates until their Certificate Principal Balance is reduced to zero, up to the remainder of the Principal Distribution Amount for such Distribution Date; (iv) fourth, to principal on the Class A-3 Certificates until their Certificate Principal Balance is reduced to zero, up to the remainder of the Principal Distribution Amount for such Distribution Date; (v) fifth, to principal on the Class A-4 Certificates until their Certificate Principal Balance is reduced to zero, up to the remainder of the Principal Distribution Amount for such Distribution Date; (vi) sixth, to principal on the Class A-5 Certificates until their Certificate Principal Balance is reduced to zero, up to the remainder of the Principal Distribution Amount for such Distribution Date; and (vii) seventh, to principal on the Class A-SB Certificates until their Certificate Principal Balance is reduced to zero, up to the remainder of the Principal Distribution Amount for such Distribution Date. However, if the Certificate Principal Balance of each and every Class of Principal Balance Certificates, other than the Class A-1, A-2, A-3, A-4, A-5 and A-SB Certificates, has been reduced to zero as a result of the allocation of Mortgage Loan | ||
THE INFORMATION IN THIS STRUCTURAL AND COLLATERAL TERM SHEET IS NOT COMPLETE AND MAY BE AMENDED PRIOR TO THE TIME OF SALE. THIS TERM SHEET IS NOT AN OFFER TO SELL THESE SECURITIES AND IT IS NOT A SOLICITATION OF AN OFFER TO BUY THESE SECURITIES IN ANY JURISDICTION WHERE THE OFFER OR SALE IS NOT PERMITTED.
16
WFRBS Commercial Mortgage Trust 2014-C22 | Certain Terms and Conditions |
| losses and expenses and any of the Class A-1, A-2, A-3, A-4, A-5 and A-SB Certificates remains outstanding, then the Principal Distribution Amount will be distributed on the Class A-1, A-2, A-3, A-4, A-5 and A-SB Certificates, pro rata, based on their respective outstanding Certificate Principal Balances, until their Certificate Principal Balances have been reduced to zero. | |||
| 3. | Class A-1, A-2, A-3, A-4, A-5 and A-SB Certificates: To reimburse the holders of the Class A-1, A-2, A-3, A-4, A-5 and A-SB Certificates, pro rata, for any previously unreimbursed losses (other than certain Trust Advisor expenses) on the mortgage loans that were previously allocated in reduction of the Certificate Principal Balances of such Classes. | ||
| 4. | Class A-S regular interest: To make distributions on the Class A-S regular interest as follows: (a) first, to interest on Class A-S regular interest in the amount of the interest entitlement for that Class; (b) next, to the extent of the portion of the Principal Distribution Amount remaining after distributions in respect of principal to each Class with a higher distribution priority (in this case, the Class A-1, A-2, A-3, A-4, A-5 and A-SB Certificates), to principal on the Class A-S regular interest until its principal balance is reduced to zero; and (c) next, to reimburse the holders of the Class A-S regular interest for any previously unreimbursed losses (other than certain Trust Advisor expenses) on the mortgage loans that were previously allocated to that Class in reduction of its principal balance. | ||
| 5. | Class B regular interest: To make distributions on the Class B regular interest as follows: (a) first, to interest on Class B regular interest in the amount of the interest entitlement for that Class; (b) next, to the extent of the portion of the Principal Distribution Amount remaining after distributions in respect of principal to each Class with a higher distribution priority (in this case, the Class A-1, A-2, A-3, A-4, A-5 and A-SB Certificates and the Class A-S regular interest), to principal on the Class B regular interest until its principal balance is reduced to zero; and (c) next, to reimburse the holders of the Class B regular interest for any previously unreimbursed losses (other than certain Trust Advisor expenses) on the mortgage loans that were previously allocated to that Class in reduction of its principal balance. | ||
| 6. | Class C regular interest: To make distributions on the Class C regular interest as follows: (a) first, to interest on Class C regular interest in the amount of the interest entitlement for that Class; (b) next, to the extent of the portion of the Principal Distribution Amount remaining after distributions in respect of principal to each Class with a higher distribution priority (in this case, the Class A-1, A-2, A-3, A-4, A-5 and A-SB Certificates and the Class A-S and B regular interests), to principal on the Class C regular interest until its principal balance is reduced to zero; and (c) next, to reimburse the holders of the Class C regular interest for any previously unreimbursed losses (other than certain Trust Advisor expenses) on the mortgage loans that were previously allocated to that Class in reduction of its principal balance. | ||
| 7. | Class D Certificates: To make distributions on the Class D Certificates as follows: (a) first, to interest on Class D Certificates in the amount of the interest entitlement for that Class; (b) next, to the extent of the portion of the Principal Distribution Amount remaining after distributions in respect of principal to each Class with a higher distribution priority (in this case, the Class A-1, A-2, A-3, A-4, A-5 and A-SB Certificates and the Class A-S, B and C regular interests), to principal on the Class D Certificates until its principal balance is reduced to zero; and (c) next, to reimburse the holders of the Class D Certificates for any previously unreimbursed losses (other than certain Trust Advisor expenses) on the mortgage loans that were previously allocated to that Class in reduction of its principal balance. | ||
| 8. | After the Class A-1, A-2, A-3, A-4, A-5 and A-SB Certificates, the Class A-S, B and C regular interests and the Class D Certificates are paid all amounts to which they are entitled, the remaining funds available for distribution will be used to pay interest, principal and loss reimbursement amounts (other than certain Trust Advisor expenses) on the Class E, F and G Certificates sequentially in that order in a manner analogous to the Class D Certificates. |
THE INFORMATION IN THIS STRUCTURAL AND COLLATERAL TERM SHEET IS NOT COMPLETE AND MAY BE AMENDED PRIOR TO THE TIME OF SALE. THIS TERM SHEET IS NOT AN OFFER TO SELL THESE SECURITIES AND IT IS NOT A SOLICITATION OF AN OFFER TO BUY THESE SECURITIES IN ANY JURISDICTION WHERE THE OFFER OR SALE IS NOT PERMITTED.
17
WFRBS Commercial Mortgage Trust 2014-C22 | Certain Terms and Conditions |
Allocations and Distributions on the Class A-S, B, C and PEX Certificates: | On the closing date, the upper-tier REMIC of the issuing entity will issue the Class A-S, Class B and Class C regular interests (each a “regular interest”) which will have outstanding principal balances on the closing date of $104,132,000, $68,802,000 and $52,066,000, respectively. The regular interests will be held in a grantor trust for the benefit of the holders of the Class A-S, B, C and PEX Certificates. The Class A-S, B, C and PEX Certificates will, at all times, represent undivided beneficial ownership interests in a grantor trust that will hold those regular interests. Each class of the Class A-S, B and C Certificates will, at all times, represent an undivided beneficial ownership interest in a percentage of the outstanding principal balance of the regular interest with the same alphabetical class designation. The Class PEX Certificates will, at all times, represent an undivided beneficial ownership interest in the remaining percentages of the outstanding principal balances of the Class A-S, B and C regular interests and which percentage interests are referred to in this Term Sheet as the “Class PEX Component A-S, Class PEX Component B and Class PEX Component C” (collectively, the “Class PEX Components”). Interest, principal, prepayment premiums, yield maintenance charges and voting rights that are allocated to the Class A-S, B or C regular interest will be distributed or allocated, as applicable, as between the Class A-S, B or C Certificates, as applicable, on the one hand, and Class PEX Component A-S, Class PEX Component B or Class PEX Component C, as applicable (and correspondingly, the Class PEX Certificates), on the other hand, pro rata, based on their respective percentage interests in the Class A-S, Class B or Class C regular interest, as applicable. In addition, any losses (including, without limitation, as a result of Trust Advisor expenses) that are allocated to the Class A-S, Class B or Class C regular interest will correspondingly be allocated as between the Class A-S, B or C Certificates, as applicable, on the one hand, and Class PEX Component A-S, Class PEX Component B or Class PEX Component C, as applicable (and correspondingly, the Class PEX Certificates), on the other hand, pro rata, based on their respective percentage interests in the Class A-S, Class B or Class C regular interest, as applicable. For a complete description of the allocations and distributions with respect to the Class A-S regular interest, the Class B regular interest and the Class C regular interest (and correspondingly the Class A-S, B, C and PEX Certificates and the Class PEX Component A-S, Class PEX Component B and Class PEX Component C), see “Description of the Offered Certificates” in the Free Writing Prospectus. See “Material Federal Income Tax Consequences” in the Free Writing Prospectus for a discussion of the tax treatment of the Exchangeable Certificates. | ||
Exchanging Certificates through Combination and Recombination: | If you own Class A-S, B and C Certificates, you will be able to exchange them for a proportionate interest in the Class PEX Certificates, and vice versa, as described in the Free Writing Prospectus. You can exchange your Exchangeable Certificates by notifying the Certificate Administrator. If Exchangeable Certificates are outstanding and held by certificateholders, those certificates will receive principal and interest that would otherwise have been payable on the same proportion of certificates exchanged therefor if those certificates were outstanding and held by certificateholders. Any such allocations of principal and interest between classes of Exchangeable Certificates will have no effect on the principal or interest entitlements of any other class of certificates. The Free Writing Prospectus describes the available combinations of Exchangeable Certificates eligible for exchange. | ||
Allocation of Yield Maintenance and Prepayment Premiums: | If any yield maintenance charges and prepayment premiums are collected during any particular collection period with respect to any mortgage loan, then on the distribution date corresponding to that collection period, the certificate administrator will pay a portion of the yield maintenance charges and prepayment premiums (or, in the case of a designated NCB mortgage loan, 50% of the prepayment premium) (net of liquidation fees payable therefrom) in the following manner: (1) pro rata, between (x) the group (“YM Group A”) of the Class A-1, A-2, A-3, A-4, A-5, A-SB and X-A Certificates and the Class A-S regular interest and (y) the group (“YM Group B” and, collectively with the YM Group A, the “YM Groups”) of Class B and C regular interests and the Class D and Class X-B Certificates, based upon the aggregate amount of principal distributed to the applicable classes of principal balance certificates (other than the Class A-S, B, C and PEX Certificates) and the Class A-S, B and C regular interests, as applicable, in each YM Group for that distribution date, and (2) among the classes of certificates and regular interest(s) in each YM Group, in the following manner, up to an amount equal to the product of (a) the yield maintenance or prepayment premium allocated to such YM Group, (b) the related Base Interest Fraction (as defined in the Free Writing Prospectus), and (c) a fraction, which in no event may be greater than 1.0, the numerator of which is equal to the amount of principal distributed to the holder(s) of such class or regular interest for that distribution date, and the denominator of which is the aggregate amount of principal distributed to all the certificates and the regular interests in that YM Group for that distribution date. Any yield maintenance charges or prepayment premium allocated to such YM Group remaining after such distributions to Principal Balance Certificates or regular interest(s) described above will be distributed to the Class X-A or Class X-B Certificates as applicable, in such YM Group. | ||
THE INFORMATION IN THIS STRUCTURAL AND COLLATERAL TERM SHEET IS NOT COMPLETE AND MAY BE AMENDED PRIOR TO THE TIME OF SALE. THIS TERM SHEET IS NOT AN OFFER TO SELL THESE SECURITIES AND IT IS NOT A SOLICITATION OF AN OFFER TO BUY THESE SECURITIES IN ANY JURISDICTION WHERE THE OFFER OR SALE IS NOT PERMITTED.
18
WFRBS Commercial Mortgage Trust 2014-C22 | Certain Terms and Conditions |
| The Class X-Y Certificates will be entitled to receive 50% of any prepayment premium received in connection with any designated NCB mortgage loan. No prepayment premiums or yield maintenance charges will be distributed to the holders of the Class X-C, X-D, X-E, E, F, G, V or R Certificates. The holders of the Class X-B Certificates will be entitled to receive all yield maintenance charges and prepayment premiums after the Class A-1, A-2, A-3, A-4, A-5, X-A, A-SB and D Certificates and the Class A-S, B and C regular interests (and, therefore, the Class A-S, B, C and PEX Certificates) have been retired. For a description of when prepayment premiums and yield maintenance charges are generally required on the mortgage loans, see Annex A-1 to the Free Writing Prospectus. See also “Risk Factors—Prepayments and Repurchases of the Mortgage Assets Will Affect the Timing of Your Cash Flow and May Affect Your Yield” in the prospectus attached to the Free Writing Prospectus. Prepayment premiums and yield maintenance charges will be distributed on each Distribution Date only to the extent they are actually received on the mortgage loans as of the related Determination Date. | |||
| Realized Losses: | The Certificate Principal Balances of the Class A-1, A-2, A-3, A-4, A-5, A-SB, D, E, F and G Certificates, and the Class A-S, B and C regular interests will be reduced without distribution on any Distribution Date as a write-off to the extent of any losses realized on the mortgage loans allocated to such Class or regular interest on such Distribution Date. Such losses (other than certain Trust Advisor expenses) will be applied in the following order, in each case until the related Certificate Principal Balance is reduced to zero: first, to Class G; second, to Class F; third, to Class E; fourth, to Class D; fifth, to the Class C regular interest; sixth, to the Class B regular interest; seventh, to the Class A-S regular interest; and, finally, pro rata, to Classes A-1, A-2, A-3, A-4, A-5 and A-SB based on their outstanding Certificate Principal Balances. Certain Trust Advisor expenses (if not absorbed by reductions of interest entitlements on the Class E and D Certificates and the Class C and B regular interests) will be applied as write-offs in a similar manner, except that such write-offs will be applied only to the Class E and D Certificates, the Class C, B and A-S regular interests, and the Class A-1, A-2, A-3, A-4, A-5 and A-SB Certificates (with any write-offs on the Class A-1, A-2, A-3, A-4, A-5 and A-SB Certificates to be allocated pro rata according to their respective Certificate Principal Balances immediately prior to that Distribution Date), in that order. Any realized losses allocated to the Class A-S, B and C regular interests will, in turn, be allocated to the Class A-S, B, C and PEX Certificates as described above in “Allocations and Distributions on the Class A-S, B, C and PEX Certificates”. The notional amount of the Class X-A Certificates will be reduced by the amount of all losses that are allocated to the Class A-1, A-2, A-3, A-4, A-5 or A-SB Certificates or the Class A-S regular interest as write-offs in reduction of their Certificate Principal Balances. The notional amount of the Class X-B Certificates will be reduced by the amount of all losses that are allocated to the Class B and C regular interests and the Class D Certificates as write-offs in reduction of their Certificate Principal Balances. The notional amount of the Class X-C Certificates will be reduced by the amount of all losses that are allocated to the Class E Certificates as write-offs in reduction of its Certificate Principal Balance. The notional amount of the Class X-D Certificates will be reduced by the amount of all losses that are allocated to the Class F Certificates as write-offs in reduction of its Certificate Principal Balance. The notional amount of the Class X-E Certificates will be reduced by the amount of all losses that are allocated to the Class G Certificates as write-offs in reduction of its Certificate Principal Balance. The notional amount of the Class X-Y Certificates will be reduced by the amount of all principal payments that are applied to reduce the principal balance of the designated NCB mortgage loans or by the amount of any other reductions in the principal balance of the designated NCB mortgage loans, including through default, a bankruptcy or other insolvency proceeding. | ||
| Debt Service Advances: | The related Master Servicer or, if such Master Servicer fails to do so, the Trustee, will be obligated to advance delinquent debt service payments (other than balloon payments and default interest) and assumed debt service payments on the mortgage loans (including each pari passu mortgage loan but not its related pari passu companion loans), except to the extent any such advance is deemed non-recoverable from collections on the related mortgage loan. In addition, if an Appraisal Reduction Amount exists for a given mortgage loan, the interest portion of any debt service advance for such mortgage loan will be reduced, which will have the effect of reducing the amount of interest available for distribution to the Certificates in reverse alphabetical order of their Class designations (except that interest payments on the Class A-1, A-2, A-3, A-4, A-5, A-SB, X-A, X-B, X-C, X-D, X-E and X-Y Certificates would be affected on a pari passu basis). | ||
| Servicing Advances: | The related Master Servicer or, if such Master Servicer fails to do so, the Trustee, will be obligated to make servicing advances with respect to each mortgage loan it services, including the payment of delinquent property taxes, insurance premiums and ground rent, except to the extent that those advances are deemed non-recoverable from collections on the related mortgage loan. Furthermore, after any securitization of the Stamford Plaza controlling pari passu companion loan, the master servicer under that securitization will have the primary obligation to make any servicing advances with respect to the related loan combination. | ||
THE INFORMATION IN THIS STRUCTURAL AND COLLATERAL TERM SHEET IS NOT COMPLETE AND MAY BE AMENDED PRIOR TO THE TIME OF SALE. THIS TERM SHEET IS NOT AN OFFER TO SELL THESE SECURITIES AND IT IS NOT A SOLICITATION OF AN OFFER TO BUY THESE SECURITIES IN ANY JURISDICTION WHERE THE OFFER OR SALE IS NOT PERMITTED.
19
WFRBS Commercial Mortgage Trust 2014-C22 | Certain Terms and Conditions |
Appraisal Reduction Amounts: | An Appraisal Reduction Amount generally will be created in the amount, if any, by which the principal balance of a required appraisal loan (which is a mortgage loan with respect to which certain defaults, modifications or insolvency events have occurred as further described in the Free Writing Prospectus) plus other amounts overdue or advanced in connection with such mortgage loan exceeds 90% of the appraised value of the related mortgaged property plus certain escrows and reserves (including letters of credit) held with respect to the mortgage loan. A mortgage loan will cease to be a required appraisal loan when the same has ceased to be a specially serviced mortgage loan (if applicable), has been brought current for at least three consecutive months and no other circumstances exist that would cause such mortgage loan to be a required appraisal loan. Appraisal Reduction Amounts will affect the amount of debt service advances on the related mortgage loan. Appraisal Reduction Amounts will also be taken into account in the determination of the identity of the Class whose majority constitutes the “majority subordinate certificateholder” and is entitled to appoint the subordinate class representative. | ||
Clean-Up Call and Exchange Termination: | On each Distribution Date occurring after the aggregate unpaid principal balance of the mortgage loans is reduced below 1% of the initial aggregate principal balance of the mortgage loans as of the Cut-off Date, certain specified persons will have the option to purchase all of the remaining mortgage loans (and the trust’s interest in all property acquired through exercise of remedies in respect of any mortgage loan) at the price specified in the Free Writing Prospectus. Exercise of the option will terminate the trust and retire the then-outstanding certificates. If the aggregate Certificate Principal Balances of each of the Class A-1, A-2, A-3, A-4, A-5, A-SB, PEX and D Certificates and the Class A-S, B and C regular interests have been reduced to zero, the trust may also be terminated in connection with an exchange of all the then-outstanding certificates, for the mortgage loans and REO properties then remaining in the issuing entity, but all of the holders of those Classes of outstanding certificates would have to voluntarily participate in the exchange. | ||
| Liquidation Loan Waterfall: | Following the liquidation of any loan or property, the net liquidation proceeds generally will be applied (after reimbursement of advances and certain trust fund expenses), first, as a recovery of accrued interest, other than delinquent interest that was not advanced as a result of Appraisal Reduction Amounts, second, as a recovery of principal until all principal has been recovered, and then as a recovery of delinquent interest that was not advanced as a result of Appraisal Reduction Amounts. Please see “Description of the Offered Certificates—Distributions—Application of Mortgage Loan Collections” in the Free Writing Prospectus. | ||
Majority Subordinate Certificateholder and Subordinate Class Representative: | A subordinate class representative may be appointed by the “majority subordinate certificate-holder”, which will be the holder(s) of a majority of: (a) during a “subordinate control period”, the most subordinate class among the Class F and G Certificates that has a Certificate Principal Balance, as notionally reduced by any Appraisal Reduction Amounts allocable to that class, that is at least equal to 25% of its total initial principal balance and (b) during a “collective consultation period”, the most subordinate class among the Class F and G Certificates that has a total principal balance, without regard to Appraisal Reduction Amounts, that is at least equal to 25% of its initial Certificate Principal Balance. The majority subordinate certificateholder will have a continuing right to appoint, remove or replace the subordinate class representative in its sole discretion. This right may be exercised at any time and from time to time. See “Servicing of the Mortgage Loans and Administration of the Trust Fund—The Majority Subordinate Certificateholder and the Subordinate Class Representative” in the Free Writing Prospectus. | ||
| Control and Consultation: | The rights of various parties to replace each Special Servicer and approve or consult with respect to major actions of each Special Servicer will vary according to defined periods. A “subordinate control period” will exist as long as the Class F Certificates have a Certificate Principal Balance, net of any Appraisal Reduction Amounts allocable to that class, that is not less than 25% of the initial principal balance of that class (unless a senior consultation period is deemed to occur generally or with respect to a particular mortgage loan, pursuant to clause (ii) of the definition of “senior consultation period”). In general, during a subordinate control period, (i) the subordinate class representative will be entitled to grant or withhold approval of asset status reports prepared, and material servicing actions proposed, by either Special Servicer, and (ii) the majority subordinate certificateholder, or the subordinate class representative on its behalf, will be entitled to terminate and replace each Special Servicer with or without cause, and appoint itself or another person as the applicable successor special servicer (other than with respect to the Stamford Plaza loan combination after the securitization of the related controlling pari passu companion loan). It will be a condition to such appointment that Fitch, KBRA and Moody’s confirm that the appointment would not result in a qualification, downgrade or withdrawal of any of their then-current ratings of certificates. A “collective consultation period” will exist as long as the Class F Certificates have a Certificate Principal Balance that both (i) as notionally reduced by | ||
THE INFORMATION IN THIS STRUCTURAL AND COLLATERAL TERM SHEET IS NOT COMPLETE AND MAY BE AMENDED PRIOR TO THE TIME OF SALE. THIS TERM SHEET IS NOT AN OFFER TO SELL THESE SECURITIES AND IT IS NOT A SOLICITATION OF AN OFFER TO BUY THESE SECURITIES IN ANY JURISDICTION WHERE THE OFFER OR SALE IS NOT PERMITTED.
20
WFRBS Commercial Mortgage Trust 2014-C22 | Certain Terms and Conditions |
| any Appraisal Reduction Amounts allocable to that class, is less than 25% of its initial principal balance and (ii) without regard to any Appraisal Reduction Amounts allocable to that class, is 25% or more of its initial Certificate Principal Balance (unless a senior consultation period is deemed to occur generally or with respect to a particular mortgage loan, pursuant to clause (ii) of the definition of “senior consultation period”). In general, during a collective consultation period, each Special Servicer will be required to consult with the Trust Advisor (in addition to the subordinate class representative, during a collective consultation period) in connection with asset status reports and material special servicing actions. A “senior consultation period” will exist as long as either (i) the Class F certificates have an aggregate principal balance, without regard to any Appraisal Reduction Amounts allocable to that class, that is less than 25% of its initial principal balance or (ii) during such time as the Class F certificates are the most subordinate class of control-eligible certificates that have a then outstanding principal balance, net of Appraisal Reduction Amounts, at least equal to 25% of its initial principal balance, the then-majority subordinate certificateholder has irrevocably waived its right to appoint a subordinate class representative and to exercise any of the rights of the majority subordinate certificateholder or cause the exercise of the rights of the subordinate class representative and such rights have not been reinstated to a successor majority subordinate certificateholder as set forth in the pooling and servicing agreement. In general, during a senior consultation period, each Special Servicer must seek to consult with the Trust Advisor in connection with asset status reports and material special servicing actions, and, in general, no subordinate class representative will be recognized or have any right to terminate either Special Servicer or approve, direct or consult with respect to servicing matters. With respect to the Bank of America Plaza loan combination and the Columbus Square Portfolio loan combination, the rights of the subordinate class representative described above will be subject to the consultation rights of each holder of a related pari passu companion loan described under “Loan Combinations” below. | |||
| Also, notwithstanding any contrary description set forth above, with respect to each of the Bank of America Plaza mortgage loan and the Columbus Square Portfolio mortgage loan, (a) each holder of a pari passu companion loan in the related loan combination (including any subordinate class representative or special servicer under any securitization of such pari passu companion loan) will have consultation rights with respect to asset status reports and material special servicing actions involving the related loan combination, as provided for in the related intercreditor agreement and as described in the Free Writing Prospectus, and those rights will be in addition to the rights of the subordinate class representative in this transaction described above; and (b) the existence of a subordinate control period, collective consultation period or senior consultation period under the WFRBS 2014-C22 pooling and servicing agreement will not limit the consultation rights of the holders of the related pari passu companion loans. | |||
| In general, loan combination control rights also include the right, in certain circumstances, to direct the replacement of the applicable special servicer for the related loan combination only. | |||
Replacement of Special Servicer by General Vote of Certificateholders: | During any ”collective consultation period” or “senior consultation period”, each Special Servicer may be terminated and replaced upon the affirmative direction of certificate owners holding not less than 75% of the appraisal-reduced voting rights of all certificates, following a proposal from certificate owners holding not less than 25% of the appraisal-reduced voting rights of all certificates. The certificateholders who initiate a vote on a termination and replacement of either Special Servicer without cause must cause Fitch, KBRA and Moody’s to confirm the then-current ratings of the certificates (or decline to review the matter) and cause the payment of the fees and expenses incurred in the replacement. | ||
| Appraisal Remedy: | Solely for purposes of determining whether a “subordinate control period” is in effect, whenever either Special Servicer obtains an appraisal or updated appraisal under the pooling and servicing agreement, the subordinate class representative, with respect to the mortgage loans (other than, after a securitization of the Stamford Plaza pari passu companion loan, the Stamford Plaza mortgage loan) serviced by either Special Servicer will have the right (at its or their expense) to direct such Special Servicer to hire a qualified appraiser to prepare a second appraisal of the mortgaged property. The applicable Special Servicer must thereafter determine whether, based on its assessment of such second appraisal, any recalculation of the Appraisal Reduction Amount is warranted. The Appraisal Reduction Amount, whether based on the first or the second appraisal, will become effective following the second appraisal, except that the Appraisal Reduction Amount based on the first appraisal shall become effective if the subordinate class representative declines to demand a second appraisal within a specified number of business days, or if a second appraisal is not received within 90 days after the direction of the subordinate class representative. In addition, for the same purposes, if there is a material change in the mortgaged property securing any mortgage loan for which an Appraisal Reduction Amount has been calculated, the majority certificateholder of the Class F or G Certificates or other designed certificateholders will be entitled (at its expense) to present an additional appraisal to such Special Servicer, which will generally be required to recalculate the Appraisal Reduction Amount based upon such additional appraisal. This latter right may not be exercised more frequently than | ||
THE INFORMATION IN THIS STRUCTURAL AND COLLATERAL TERM SHEET IS NOT COMPLETE AND MAY BE AMENDED PRIOR TO THE TIME OF SALE. THIS TERM SHEET IS NOT AN OFFER TO SELL THESE SECURITIES AND IT IS NOT A SOLICITATION OF AN OFFER TO BUY THESE SECURITIES IN ANY JURISDICTION WHERE THE OFFER OR SALE IS NOT PERMITTED.
21
WFRBS Commercial Mortgage Trust 2014-C22 | Certain Terms and Conditions |
| once in any 12-month period for each mortgage loan for which an Appraisal Reduction Amount was calculated and can only be exercised during a subordinate control period or a collective consultation period as further described in the Free Writing Prospectus. | |||
| Sale of Defaulted Assets: | There will be no “fair value” purchase option. Instead, the pooling and servicing agreement will authorize each Special Servicer to sell defaulted mortgage loans serviced by such Special Servicer to the highest bidder in a manner generally similar to sales of REO properties. Subject to certain limitations set forth in the related intercreditor agreement, each loan combination serviced under the WFRBS 2014-C22 pooling and servicing agreement may be sold unless that mortgage loan and the related pari passu companion loans are sold together as one whole loan. The sale of a defaulted loan (other than a non-serviced mortgage loan) for less than par plus accrued interest and certain other fees and expenses owed on the loan will be subject to consent or consultation rights of the subordinate class representative and/or Trust Advisor and, in the case of the Bank of America Plaza mortgage loan and the Columbus Square Portfolio mortgage loan, consultation rights of the holders of the related pari passu companion loans, as described in the Free Writing Prospectus. After the securitization of the Stamford Plaza pari passu companion loan, pursuant to the respective intercreditor agreement, the party acting as special servicer with respect to the Stamford Plaza loan combination pursuant to the pooling and servicing agreement for the related securitization, may offer to sell to any person (or may offer to purchase) for cash such loan combination during such time as such loan combination constitutes a defaulted mortgage loan, and, in connection with any such sale, such special servicer is required to sell both the pari passu mortgage loan and related pari passu companion loans in any such loan combination as a whole loan. | ||
| “As-Is” Appraisals: | Appraisals must be conducted on an “as-is” basis, and must be no more than 9 months old, for purposes of determining Appraisal Reduction Amounts, market value in connection with REO sales, etc. Required appraisals may consist of updates of prior appraisals. Internal valuations by the applicable Special Servicer are permitted if the principal balance of a mortgage loan is less than $2,000,000. | ||
| Trust Advisor: | The Trust Advisor will perform certain review duties that will generally include a limited annual review of and report regarding each Special Servicer to the Certificate Administrator. The review and report generally will be based on: (a) during a collective consultation period or senior consultation period, any asset status reports and additional information delivered to the Trust Advisor by either Special Servicer with respect to any mortgage loan serviced by such Special Servicer, and/or (b) during a senior consultation period, in addition to the applicable information described above, a meeting with each Special Servicer to conduct a limited review of such Special Servicer’s operational practices on a platform basis in light of the servicing standard. In addition, during any collective consultation period or senior consultation period, each Special Servicer must seek to consult with the Trust Advisor (in addition to the subordinate class representative during a collective consultation period) in connection with material special servicing actions with respect to specially serviced mortgage loans serviced by such Special Servicer. Furthermore, under certain circumstances, but only during a senior consultation period, the Trust Advisor may recommend the replacement of either Special Servicer, in which case the Certificate Administrator will deliver notice of such recommendation to the certificateholders, and certificateholders with specified percentages of the voting rights may direct the replacement of such Special Servicer at their expense. The Trust Advisor may be removed and replaced without cause upon the affirmative direction of certificates owners holding not less than 75% of the appraisal-reduced voting rights of all certificates, following a proposal from certificate owners holding not less than 25% of the appraisal-reduced voting rights of all certificates. The certificateholders who initiate a vote on a termination and replacement of the Trust Advisor without cause must cause Fitch, KBRA and Moody’s to confirm the then-current ratings of the certificates (or decline to review the matter) and cause the payment of the fees and expenses incurred in the replacement. During any “subordinate control period”, the proposed replacement trust advisor will be subject to the subordinate class representative’s consent (such consent not to be unreasonably withheld). If a proposed termination and replacement of the Trust Advisor is not consummated within 180 days following the initial request of the certificateholders who requested a vote, the proposed termination and replacement shall have no further force or effect. The Trust Advisor generally may be discharged from its duties if and when the Class A-1, A-2, A-3, A-4, A-5, A-SB, A-S, B, C, PEX, D and E Certificates are retired. | ||
THE INFORMATION IN THIS STRUCTURAL AND COLLATERAL TERM SHEET IS NOT COMPLETE AND MAY BE AMENDED PRIOR TO THE TIME OF SALE. THIS TERM SHEET IS NOT AN OFFER TO SELL THESE SECURITIES AND IT IS NOT A SOLICITATION OF AN OFFER TO BUY THESE SECURITIES IN ANY JURISDICTION WHERE THE OFFER OR SALE IS NOT PERMITTED.
22
WFRBS Commercial Mortgage Trust 2014-C22 | Certain Terms and Conditions |
| Certain Fee Offsets: | If a workout fee is earned by either Special Servicer following a loan default with respect to any mortgage loan that it services, then certain limitations will apply to the collection and retention of a modification fee from the borrower. The modification fee generally must not exceed 1% of the principal balance of the loan as modified. In addition, if the loan re-defaults within a specified period of months and other conditions are satisfied, any subsequent workout or liquidation fee on that loan must be reduced by a portion of the previously-collected modification fee. Furthermore, workout fees, liquidation fees and modification fees collected with respect to any workout, liquidation and/or partial liquidation of a mortgage loan or loan combination that is serviced by a Special Servicer will be subject to an aggregate cap equal to the greater of (i) $1,000,000 and (ii) 1.00% of the stated principal balance of the subject mortgage loan or loan combination. | ||
| Deal Website: | The Certificate Administrator will be required to maintain a deal website which will include, among other items: (a) summaries of asset status reports prepared by each Special Servicer, (b) inspection reports, (c) appraisals, (d) various “special notices” described in the Free Writing Prospectus, (e) the “Investor Q&A Forum” and (f) a voluntary “Investor Registry”. Investors may access the deal website following execution of a certification and confidentiality agreement. | ||
| Initial Majority Subordinate Certificateholder: | It is expected that an affiliate of Seer Capital Management, LP will be the initial majority subordinate certificateholder. | ||
| Loan Combinations: | Each of the mortgaged properties identified on Annex A-1 to the Free Writing Prospectus as Bank of America Plaza, Columbus Square Portfolio and Stamford Plaza Portfolio secure both a mortgage loan to be included in the trust fund and two or more other mortgage loans that will not be included in the trust fund, which will be pari passu in right of payment with the trust mortgage loan. With respect to each group of mortgage loans that we refer to as a “loan combination”, both the Bank of America Plaza loan combination and the Columbus Square Portfolio mortgage loan will be principally serviced under the pooling and servicing agreement. The Stamford Plaza loan combination will be serviced under the pooling and servicing agreement until a securitization of the related controlling pari passu companion loan, after which the Stamford Plaza loan combination will be serviced under the pooling and servicing agreement for such securitization. | ||
| As of the closing date, the pari passu companion loans in such loan combinations will be held by the parties identified above under “IV. Characteristics of the Mortgage Pool—B. Summary of Pari Passu Split Loan Structures”. | |||
THE INFORMATION IN THIS STRUCTURAL AND COLLATERAL TERM SHEET IS NOT COMPLETE AND MAY BE AMENDED PRIOR TO THE TIME OF SALE. THIS TERM SHEET IS NOT AN OFFER TO SELL THESE SECURITIES AND IT IS NOT A SOLICITATION OF AN OFFER TO BUY THESE SECURITIES IN ANY JURISDICTION WHERE THE OFFER OR SALE IS NOT PERMITTED.
23
(THIS PAGE INTENTIONALLY LEFT BLANK)
24
| BANK OF AMERICA PLAZA |
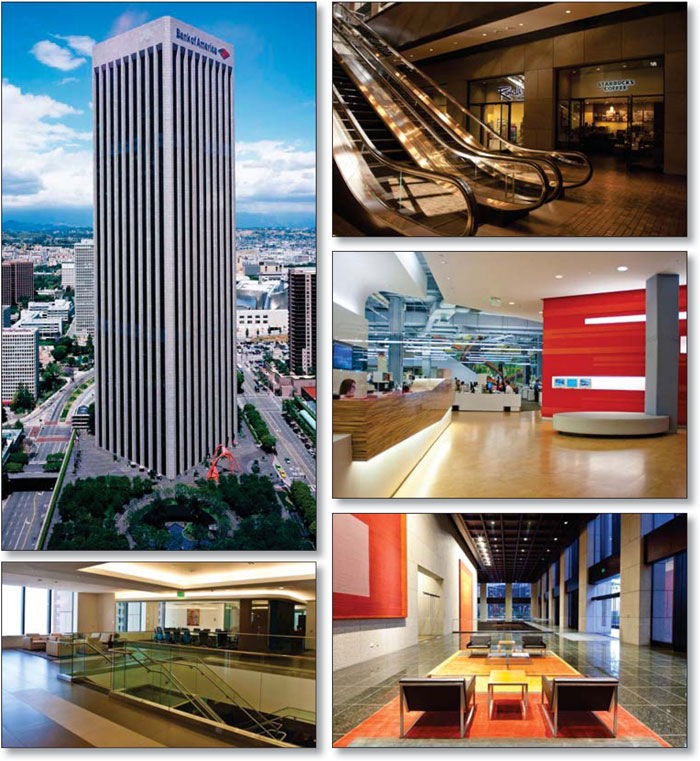
THE INFORMATION IN THIS STRUCTURAL AND COLLATERAL TERM SHEET IS NOT COMPLETE AND MAY BE AMENDED PRIOR TO THE TIME OF SALE. THIS TERM SHEET IS NOT AN OFFER TO SELL THESE SECURITIES AND IT IS NOT A SOLICITATION OF AN OFFER TO BUY THESE SECURITIES IN ANY JURISDICTION WHERE THE OFFER OR SALE IS NOT PERMITTED.
25
| BANK OF AMERICA PLAZA |
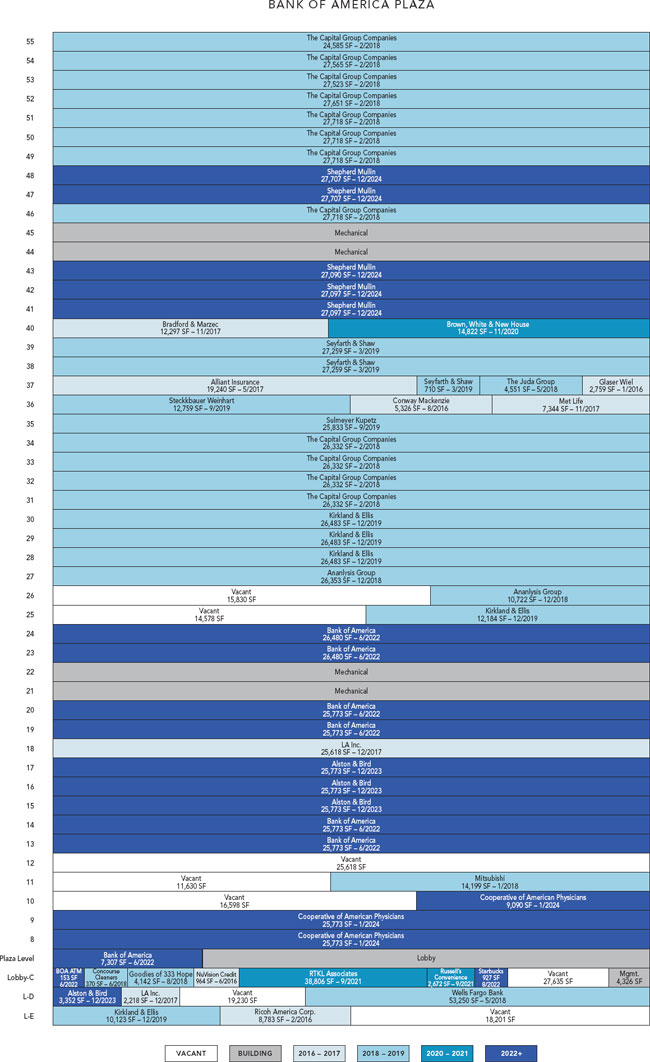
THE INFORMATION IN THIS STRUCTURAL AND COLLATERAL TERM SHEET IS NOT COMPLETE AND MAY BE AMENDED PRIOR TO THE TIME OF SALE. THIS TERM SHEET IS NOT AN OFFER TO SELL THESE SECURITIES AND IT IS NOT A SOLICITATION OF AN OFFER TO BUY THESE SECURITIES IN ANY JURISDICTION WHERE THE OFFER OR SALE IS NOT PERMITTED.
26
| BANK OF AMERICA PLAZA |
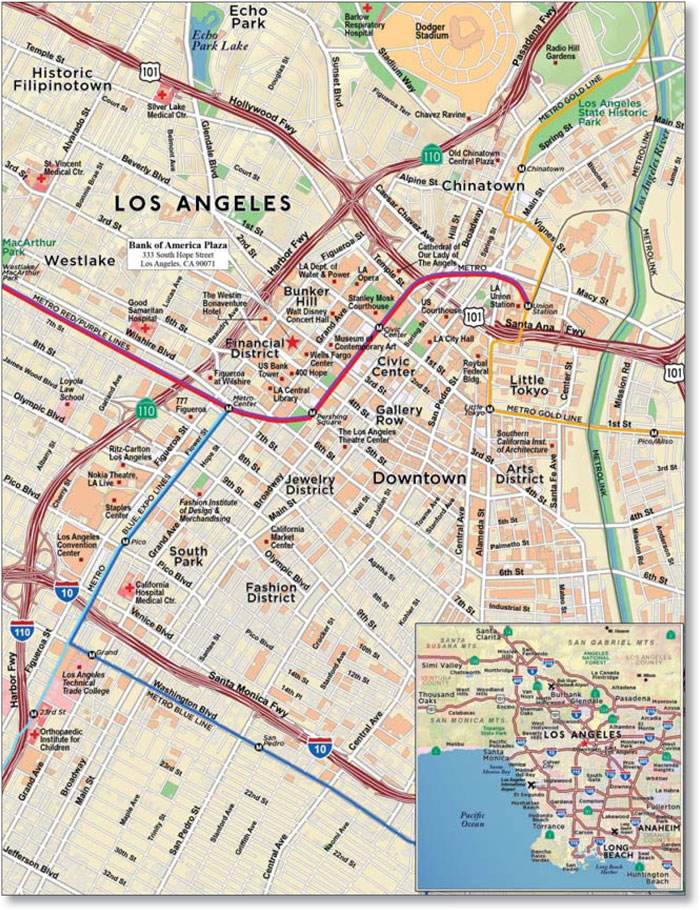
THE INFORMATION IN THIS STRUCTURAL AND COLLATERAL TERM SHEET IS NOT COMPLETE AND MAY BE AMENDED PRIOR TO THE TIME OF SALE. THIS TERM SHEET IS NOT AN OFFER TO SELL THESE SECURITIES AND IT IS NOT A SOLICITATION OF AN OFFER TO BUY THESE SECURITIES IN ANY JURISDICTION WHERE THE OFFER OR SALE IS NOT PERMITTED.
27
| No. 1 Bank of America Plaza | ||||||||
| Loan Information | Property Information | |||||||
| Mortgage Loan Seller: | Wells Fargo Bank, National Association | Single Asset/Portfolio: | Single Asset | |||||
| Credit Assessment (Fitch/KBRA/Moody’s): | NR/NR/NR | Property Type: | Office | |||||
Original Principal Balance(1): | $150,000,000 | Specific Property Type: | CBD | |||||
Cut-off Date Principal Balance(1): | $150,000,000 | Location: | Los Angeles, CA | |||||
| % of Initial Pool Balance: | 10.1% | Size: | 1,432,285 SF | |||||
| Loan Purpose: | Refinance | Cut-off Date Principal Balance Per SF(1): | $279.27 | |||||
| Borrower Names: | 333 South Hope Co. LLC; 333 South Hope Plant LLC | Year Built/Renovated: | 1974/2009 | |||||
| Sponsor: | Brookfield Office Properties Inc. | Title Vesting: | Fee | |||||
| Mortgage Rate: | 4.050% | Property Manager: | Self-managed | |||||
| Note Date: | August 7, 2014 | 3rd Most Recent Occupancy (As of): | 95.0% (12/31/2011) | |||||
| Anticipated Repayment Date: | NAP | 2nd Most Recent Occupancy (As of): | 93.0% (12/31/2012) | |||||
| Maturity Date: | September 1, 2024 | Most Recent Occupancy (As of): | 92.0% (12/31/2013) | |||||
| IO Period: | 120 months | Current Occupancy (As of): | 89.5% (8/19/2014) | |||||
| Loan Term (Original): | 120 months | |||||||
| Seasoning: | 0 months | Underwriting and Financial Information: | ||||||
| Amortization Term (Original): | NAP | |||||||
| Loan Amortization Type: | Interest-only, Balloon | 3rd Most Recent NOI (As of): | $29,607,501 (12/31/2012) | |||||
| Interest Accrual Method: | Actual/360 | 2nd Most Recent NOI (As of): | $28,864,479 (12/31/2013) | |||||
| Call Protection: | L(24),D(89),O(7) | Most Recent NOI (As of)(4): | $33,167,204 (TTM 6/30/2014) | |||||
| Lockbox Type: | Hard/Springing Cash Management | |||||||
Additional Debt(1)(2): | Yes | |||||||
Additional Debt Type(1)(2): | Pari Passu and Future Mezzanine | U/W Revenues: | $63,011,458 | |||||
| U/W Expenses: | $25,626,454 | |||||||
U/W NOI(4): | $37,385,004 | |||||||
Escrows and Reserves(3): | U/W NCF: | $34,233,977 | ||||||
U/W NOI DSCR(1): | 2.28x | |||||||
Type: | Initial | Monthly | Cap (If Any) | U/W NCF DSCR(1): | 2.08x | |||
| Taxes | $4,151,842 | $518,981 | NAP | U/W NOI Debt Yield(1): | 9.3% | |||
| Insurance | $0 | Springing | NAP | U/W NCF Debt Yield(1): | 8.6% | |||
| Replacement Reserves | $0 | $23,871 | NAP | As-Is Appraised Value: | $605,000,000 | |||
| TI/LC Reserve | $0 | Springing | NAP | As-Is Appraisal Valuation Date: | June 24, 2014 | |||
| Tenants Specific TI/LC Reserve | $2,991,870 | $0 | NAP | Cut-off Date LTV Ratio(1): | 66.1% | |||
| Tenants Specific Rent Concession Reserve | $520,213 | $0 | NAP | LTV Ratio at Maturity or ARD(1): | 66.1% | |||
| (1) | The Bank of America Plaza Loan Combination, totalling $400,000,000, is comprised of three pari passu notes. The controlling Note A-1 had an original principal balance of $150,000,000, has an outstanding principal balance as of the Cut-off Date of $150,000,000 and will be contributed to the WFRBS 2014-C22 Trust. Notes A-2 and A-3 had a combined original principal balance of $250,000,000 and are expected to be contributed to future trusts. All statistical information related to balances per square foot, loan-to-value ratios, debt service coverage ratios and debt yields are based on the Bank of America Plaza Loan Combination. |
| (2) | See “Subordinate and Mezzanine Indebtedness” section. |
| (3) | See “Escrows” section. |
| (4) | See “Cash Flow Analysis” section. |
The Mortgage Loan. The mortgage loan (the “Bank of America Plaza Loan Combination”) is evidenced by three pari passu promissory notes (the A-1, A-2 and A-3 notes, respectively) secured by a first mortgage encumbering an office building located in Los Angeles, California (the “Bank of America Plaza Property”). The Bank of America Plaza Loan Combination was co-originated on August 7, 2014 by Wells Fargo Bank, National Association and Citigroup Global Markets Realty Corp. The Bank of America Plaza Loan Combination had an original principal balance of $400,000,000, has an outstanding principal balance as of the Cut-off Date of $400,000,000 and accrues interest at an interest rate of 4.050% per annum. The Bank of America Plaza Loan Combination had an initial term of 120 months, has a remaining term of 120 months as of the Cut-off Date and requires interest-only payments through the term of the Bank of America Plaza Loan Combination. The Bank of America Plaza Loan Combination matures on September 1, 2024. See “Description of the Mortgage Pool – Split Loan Structures – The Bank of America Plaza Loan Combination” and “Servicing of the Mortgage Loans and Administration of the Trust Fund – Additional Matters Relating to the Servicing of the Bank of America Plaza Loan Combination” in the Free Writing Prospectus.
Note A-1, which represents the controlling interest in the Bank of America Plaza Loan Combination, will be contributed to the WFRBS 2014-C22 Trust, had an original principal balance of $150,000,000 and has an outstanding principal balance as of the Cut-off Date of $150,000,000. Notes A-2 and A-3 (the “Bank of America Plaza Companion Loans”), which are expected to be contributed to future trusts, had a combined original principal balance of $250,000,000 and each represents the non-controlling
THE INFORMATION IN THIS STRUCTURAL AND COLLATERAL TERM SHEET IS NOT COMPLETE AND MAY BE AMENDED PRIOR TO THE TIME OF SALE. THIS TERM SHEET IS NOT AN OFFER TO SELL THESE SECURITIES AND IT IS NOT A SOLICITATION OF AN OFFER TO BUY THESE SECURITIES IN ANY JURISDICTION WHERE THE OFFER OR SALE IS NOT PERMITTED.
28
| BANK OF AMERICA PLAZA |
interests in the Bank of American Plaza Loan Combination. As of the loan closing date, the A-2 note had an original principal balance of $116,670,000 and the A-3 note had an original principal balance of $133,330,000. However, the lender provides no assurances that the note A-2 and A-3 will not be split further.
Following the lockout period, the borrowers have the right to defease the Bank of America Plaza Loan Combination in whole, or in part (see “Partial Release” section), on any date before March 1, 2024. In addition, the Bank of America Plaza Loan Combination is prepayable without penalty on or after March 1, 2024.
Sources and Uses
| Sources | Uses | ||||||||
| Original loan combination amount | $400,000,000 | 100.0% | Loan payoff(1) | $212,736,296 | 53.2 | % | |||
| Reserves | 7,663,925 | 1.9 | |||||||
| Closing costs | 1,457,860 | 0.4 | |||||||
| Return of equity | 178,141,919 | 44.5 | |||||||
| Total Sources | $400,000,000 | 100.0% | Total Uses | $400,000,000 | 100.0 | % |
| (1) | The Bank of America Plaza Property was previously securitized in MSCM 2004-HQ4. Loan payoff represents a $168.7 million trust balance and $44.0 million of subordinate debt. |
The Property. The Bank of America Plaza Property is a 55-story, class A, LEED Gold certified office building containing 1,432,285 square feet located in Los Angeles, California. Situated on 4.2 acres, the Bank of America Plaza Property was originally constructed in 1974 and the office tower consists of 49 stories, the plaza level and four mechanical floors. Below the office tower is the concourse level which contains a 194-seat auditorium and retail space. The ground floor plaza features gardens, public art and three 24-foot waterfalls. The Bank of America Plaza Property contains nine levels of underground parking totaling 2,242 spaces, resulting in a parking ratio of 1.6 spaces per 1,000 square feet of net rentable area. Other building amenities include twenty-one escalators, a professional copy center, on-site auto repair and car wash, 24-hour building security and a web-based visitor management system. Two of the largest tenants, The Capital Group and Sheppard Mullin (together consisting of approximately 35.6% of the net rentable square footage and 39.8% of Annual U/W Base Rent) both operate their global headquarters from the Bank of America Plaza Property and have been in occupancy for 36 and 40 years, respectively. As of August 19, 2014, the Bank of America Plaza Property was 89.5% occupied by 31 tenants.
THE INFORMATION IN THIS STRUCTURAL AND COLLATERAL TERM SHEET IS NOT COMPLETE AND MAY BE AMENDED PRIOR TO THE TIME OF SALE. THIS TERM SHEET IS NOT AN OFFER TO SELL THESE SECURITIES AND IT IS NOT A SOLICITATION OF AN OFFER TO BUY THESE SECURITIES IN ANY JURISDICTION WHERE THE OFFER OR SALE IS NOT PERMITTED.
29
| BANK OF AMERICA PLAZA |
The following table presents certain information relating to the tenancy at the Bank of America Plaza Property:
Major Tenants
| Tenant Name | Credit Rating (Fitch/ Moody’s/ S&P)(1) | Tenant NRSF | % of NRSF | Annual U/W Base Rent PSF(2) | Annual U/W Base Rent(2) | % of Total Annual U/W Base Rent | Lease Expiration Date | ||||||
| Major Tenants | |||||||||||||
The Capital Group(3) | NR/NR/NR | 323,554 | 22.6% | $26.00 | $8,413,679 | 25.8% | 2/28/2018(4) | ||||||
Bank of America(5) | A/Baa2/A- | 163,512 | 11.4% | $29.31(6) | $4,793,001(6) | 14.7% | 6/30/2022(7)(8) | ||||||
Sheppard Mullin(9) | NR/NR/NR | 185,927 | 13.0% | $24.49 | $4,553,151 | 14.0% | 12/31/2024(10)(11) | ||||||
| Kirkland & Ellis | NR/NR/NR | 101,756 | 7.1% | $23.56 | $2,397,380 | 7.4% | 12/31/2019 | ||||||
| Alston & Bird | NR/NR/NR | 81,094 | 5.7% | $23.50 | $1,905,604(12) | 5.9% | 12/31/2023(13) | ||||||
| Seyfarth & Shaw | NR/NR/NR | 55,228 | 3.9% | $31.63 | $1,746,862 | 5.4% | 3/31/2019 | ||||||
| Total Major Tenants | 911,071 | 63.6% | $26.13 | $23,809,677 | 73.1% | ||||||||
| Non-Major Tenants | 371,031 | 25.9% | $23.56 | $8,742,976 | 26.9% | ||||||||
| Occupied Collateral Total | 1,282,102 | 89.5% | $25.39 | $32,552,653 | 100.0% | ||||||||
| Vacant Space | 150,183 | 10.5% | |||||||||||
| Collateral Total | 1,432,285 | 100.0% | |||||||||||
| (1) | Certain ratings are those of the parent company whether or not the parent guarantees the lease. |
| (2) | Annual U/W Base Rent PSF and Annual U/W Base Rent include contractual rent increases through August 2015. |
| (3) | The Capital Group is a private asset management firm founded in 1931 with assets in excess of one trillion dollars. |
| (4) | The Capital Group has two, five-year renewal options with 19 months’ notice. |
| (5) | Bank of America is an international financial institution that serves individual customers, corporations and governments with a range of banking, investing, asset management and other financial and risk management products and services. |
| (6) | The Annual U/W Base Rent and Annual U/W Base Rent PSF for Bank of America represent the tenant’s average rent over their lease term. The tenant’s current in-place rent is $25.78 per square foot. |
| (7) | Bank of America has a one-time right to reduce its space by one full floor or 12,000 to 13,000 square feet of its highest or lowest contiguous floors upon providing notice on June 30, 2019 with 12-months’ notice. |
| (8) | Bank of America has two, five-year renewal options with 19-months’ notice. |
| (9) | Sheppard Mullin is a law firm that practices bankruptcy, corporate law, securities law, intellectual property, litigation, real estate, and tax and estate planning. |
| (10) | Sheppard Mullin may reduce its space by one full floor on December 31, 2019 with 12-months’ notice. |
| (11) | Sheppard Mullin has two, four-year renewal options with nine months’ notice. |
| (12) | Alston & Bird has a rent abatement period that expires in June 2015. An escrow was collected at closing for the remaining rent concessions. |
| (13) | Alston & Bird may terminate 25,773 square feet on June 30, 2018 with 12-months’ notice and a termination fee of $2,410,728. |
THE INFORMATION IN THIS STRUCTURAL AND COLLATERAL TERM SHEET IS NOT COMPLETE AND MAY BE AMENDED PRIOR TO THE TIME OF SALE. THIS TERM SHEET IS NOT AN OFFER TO SELL THESE SECURITIES AND IT IS NOT A SOLICITATION OF AN OFFER TO BUY THESE SECURITIES IN ANY JURISDICTION WHERE THE OFFER OR SALE IS NOT PERMITTED.
30
| BANK OF AMERICA PLAZA |
The following table presents certain information relating to the lease rollover schedule at the Bank of America Plaza Property:
Lease Expiration Schedule(1)(2)
Year Ending December 31, | No. of Leases Expiring | Expiring NRSF | % of Total NRSF | Cumulative Expiring NRSF | Cumulative % of Total NRSF | Annual U/W Base Rent | % of Annual U/W Base Rent | Annual U/W Base Rent PSF(3) | |||||||
| MTM | 7 | 6,439 | 0.4% | 6,439 | 0.4% | $117,609 | 0.4% | $18.27 | |||||||
| 2014 | 0 | 0 | 0.0% | 6,439 | 0.4% | $0 | 0.0% | $0.00 | |||||||
| 2015 | 0 | 0 | 0.0% | 6,439 | 0.4% | $0 | 0.0% | $0.00 | |||||||
| 2016 | 4 | 17,832 | 1.2% | 24,271 | 1.7% | $485,307 | 1.5% | $27.22 | |||||||
| 2017 | 6 | 76,462 | 5.3% | 100,733 | 7.0% | $1,883,542 | 5.8% | $24.63 | |||||||
| 2018 | 8 | 437,191 | 30.5% | 537,924 | 37.6% | $10,724,524 | 32.9% | $24.53 | |||||||
| 2019 | 8 | 195,576 | 13.7% | 733,500 | 51.2% | $5,080,457 | 15.6% | $25.98 | |||||||
| 2020 | 2 | 15,450 | 1.1% | 748,950 | 52.3% | $468,606 | 1.4% | $30.33 | |||||||
| 2021 | 4 | 41,478 | 2.9% | 790,428 | 55.2% | $1,073,697 | 3.3% | $25.89 | |||||||
| 2022 | 4 | 164,439 | 11.5% | 954,867 | 66.7% | $4,825,103 | 14.8% | $29.34 | |||||||
| 2023 | 2 | 80,671 | 5.6% | 1,035,538 | 72.3% | $1,900,528 | 5.8% | $23.56 | |||||||
| 2024 | 5 | 246,564 | 17.2% | 1,282,102 | 89.5% | $5,993,280 | 18.4% | $24.31 | |||||||
| Thereafter | 0 | 0 | 0.0% | 1,282,102 | 89.5% | $0 | 0.0% | $0.00 | |||||||
| Vacant | 0 | 150,183 | 10.5% | 1,432,285 | 100.0% | $0 | 0.0% | $0.00 | |||||||
| Total/Weighted Average | 50(4) | 1,432,285 | 100.0% | $32,552,653 | 100.0% | $25.39 |
| (1) | Information obtained from the underwritten rent roll. |
| (2) | Certain tenants may have lease termination options that are exercisable prior to the originally stated expiration date of the subject lease and that are not considered in the Lease Expiration Schedule. |
| (3) | Weighted Average Annual U/W Base Rent PSF excludes vacant space. |
| (4) | Multiple tenants operate under more than one lease. There are 31 tenants subject to 50 leases. |
The following table presents historical occupancy percentages at the Bank of America Plaza Property:
Historical Occupancy
12/31/2009(1) | 12/31/2010(1) | 12/31/2011(1) | 12/31/2012(1) | 12/31/2013(1) | 8/19/2014(2) | |||||
| 94.0% | 94.0% | 95.0% | 93.0% | 92.0% | 89.5% |
| (1) | Information obtained from the borrower. |
| (2) | Information obtained from the underwritten rent roll. |
The following table presents historical base rent per square foot at Bank of America Plaza Property:
Historical Average Base Rent (PSF)(1)
12/31/2011 | 12/31/2012 | 12/31/2013 | 6/30/2014 | |||
| $21.79 | $21.92 | $21.38 | $21.20 |
| (1) | Information obtained from borrower operating statements. The average base rent is based on the gross potential rent divided by the total square footage. |
THE INFORMATION IN THIS STRUCTURAL AND COLLATERAL TERM SHEET IS NOT COMPLETE AND MAY BE AMENDED PRIOR TO THE TIME OF SALE. THIS TERM SHEET IS NOT AN OFFER TO SELL THESE SECURITIES AND IT IS NOT A SOLICITATION OF AN OFFER TO BUY THESE SECURITIES IN ANY JURISDICTION WHERE THE OFFER OR SALE IS NOT PERMITTED.
31
| BANK OF AMERICA PLAZA |
Operating History and Underwritten Net Cash Flow. The following table presents certain information relating to the historical operating performance and the Underwritten Net Cash Flow at the Bank of America Plaza Property:
Cash Flow Analysis
| 2011 | 2012 | 2013 | TTM 6/30/2014 | U/W | U/W $ per SF | ||||||||||||||
| Base Rent | $31,216,203 | $31,394,104 | $30,617,785 | $30,371,257 | $32,552,653(1) | $22.73 | |||||||||||||
| Grossed Up Vacant Space | 0 | 0 | 0 | 0 | 3,314,834 | 2.31 | |||||||||||||
| Total Reimbursables | 19,248,665 | 19,957,742 | 20,928,986 | 22,426,286 | 22,516,480 | 15.72 | |||||||||||||
| Parking Income | 6,991,844 | 7,363,885 | 7,985,629 | 8,010,994 | 8,010,994 | 5.59 | |||||||||||||
| Other Income | 618,297 | 242,045 | 176,754 | 203,246 | 203,246 | 0.14 | |||||||||||||
| Less Free Rent | (598,846) | (6,430,584) | (5,945,870) | (2,236,116) | 0(2) | 0.00 | |||||||||||||
| Less Vacancy | 0 | 0 | 0 | 0 | (3,586,749)(3) | (2.50) | |||||||||||||
| Effective Gross Income | $57,476,163 | $52,527,192 | $53,763,284 | $58,775,667 | $63,011,458 | $43.99 | |||||||||||||
| Total Operating Expenses | $22,620,951 | $22,919,691 | $24,898,805 | $25,608,463 | $25,626,454 | $17.89 | |||||||||||||
| Net Operating Income | $34,855,212 | $29,607,501 | $28,864,479 | $33,167,204 | $37,385,004 | $26.10 | |||||||||||||
| TI/LC | 0 | 0 | 0 | 0 | 2,864,570 | 2.00 | |||||||||||||
| Capital Expenditures | 0 | 0 | 0 | 0 | 286,457 | 0.20 | |||||||||||||
| Net Cash Flow | $34,855,212 | $29,607,501 | $28,864,479 | $33,167,204 | $34,233,977 | $23.90 | |||||||||||||
NOI DSCR(4) | 2.12x | 1.80x | 1.76x | 2.02x | 2.28x | ||||||||||||||
NCF DSCR(4) | 2.12x | 1.80x | 1.76x | 2.02x | 2.08x | ||||||||||||||
NOI DY(4) | 8.7% | 7.4% | 7.2% | 8.3% | 9.3% | ||||||||||||||
NCF DY(4) | 8.7% | 7.4% | 7.2% | 8.3% | 8.6% | ||||||||||||||
| (1) | The increase in the U/W Base Rent from the TTM 6/30/2014 is attributed to contractual rent increases through August 2015 ($1,567,800) and rent averaging for Bank of America, Wells Fargo and MetLife ($616,845). |
| (2) | The remaining free rent for Alston & Bird ($472,505) and Analysis Group ($47,708) expires in June 2015 and August 2015, respectively. A free rent escrow was collected at closing for all outstanding concessions. |
| (3) | The underwritten economic vacancy is 10.0%. The Bank of America Plaza Property was 89.5% physically occupied as of August 19, 2014. |
| (4) | DSCRs and debt yields are based on the Bank of America Plaza Loan Combination. |
Appraisal. As of the appraisal valuation date of June 24, 2014, the Bank of America Plaza Property had an “as-is” appraised value of $605,000,000.
Environmental Matters. According to a Phase I environmental site assessment dated July 7, 2014, a recognized environmental condition (“REC”) exists at the Bank of America Plaza Property. The REC is related to a 4,000 gallon underground storage tank (“UST”) used to store diesel for the back-up power system. No leaks or spills from the UST have been reported; however, based upon the age (40 years), the onsite UST is considered to be a REC. The UST system is equipped with a continuous automatic monitoring system, an automatic shutoff device and overfills alarm and a spill and overfill sump. An environmental consultant estimated that the potential remediation costs associated with the aforementioned REC could range from $30,000 to $100,000.
Market Overview and Competition. The Bank of America Plaza is situated along the entire block bounded by Hope Street and 4th Street to the south and east and 3rd Street and Flower Street to the north and west in the Bunker Hill District within the Los Angeles central business district. Downtown Los Angeles experienced significant investment over the past two decades from public and non-profit institutions and several public/private partnerships that have resulted in new developments including LA Live, Staples Center, an expanded Convention Center, the Cathedral, Disney Concert Hall and the Colburn School that have increased interest in downtown Los Angeles. The Bunker Hill neighborhood encompasses approximately 133 acres and comprises the northern section of the financial district. Marked by higher topography, Bunker Hill is located north of Fifth Street and east of Figueroa Street and the predominant land use consists of high rise office buildings. Other local attractions within Bunker Hill include the Museum of Contemporary Art and the Angel’s Flight Funicular. According to a third party market research report, the Bank of America Plaza Property is located within the Downtown Los Angeles submarket. As of the second quarter of 2014, the submarket had a total inventory of 77 class A office buildings comprising approximately 38.5 million square feet. The class A office submarket reported a vacancy rate of 15.4%, and the appraiser concluded to a market rent ranging between $22.00 per square foot and $25.00 per square foot, triple net for the Bank of America Plaza Property.
THE INFORMATION IN THIS STRUCTURAL AND COLLATERAL TERM SHEET IS NOT COMPLETE AND MAY BE AMENDED PRIOR TO THE TIME OF SALE. THIS TERM SHEET IS NOT AN OFFER TO SELL THESE SECURITIES AND IT IS NOT A SOLICITATION OF AN OFFER TO BUY THESE SECURITIES IN ANY JURISDICTION WHERE THE OFFER OR SALE IS NOT PERMITTED.
32
| BANK OF AMERICA PLAZA |
The following table presents certain information relating to comparable properties to the Bank of America Plaza Property:
Competitive Set(1)
Bank of America Plaza (Subject) | Figueroa at Wilshire | TCW Building | 801 Tower | Wells Fargo Tower North | Wells Fargo Tower South | Ernst & Young Plaza | ||||||||
| Location | Los Angeles, CA | Los Angeles, CA | Los Angeles, CA | Los Angeles, CA | Los Angeles, CA | Los Angeles, CA | Los Angeles, CA | |||||||
| Distance from Subject | -- | 1.5 miles | 6.5 miles | 1.6 miles | 1.2 miles | 1.2 miles | 1.6 miles | |||||||
| Property Type | Office | Office | Office | Office | Office | Office | Office | |||||||
| Year Built/Renovated | 1974/2009 | 1991 | 1991 | 1992 | 1982 | 1982 | 1985 | |||||||
| Stories | 55 | 52 | 35 | 25 | 54 | 45 | 41 | |||||||
| Total GLA | 1,432,285 SF | 1,038,971 SF | 685,402 SF | 458,149 SF | 1,404,714 SF | 1,109,326 SF | 916,756 SF | |||||||
| Total Occupancy | 90% | 87% | 99% | 88% | 84% | 83% | 87% |
| (1) | Information obtained from the appraisal. |
The Borrowers. The borrowers are 333 South Hope Co. LLC and 333 South Hope Plant LLC, which are single purpose entities with two independent directors. Legal counsel to the borrowers delivered a non-consolidation opinion in connection with the origination of the Bank of America Plaza Loan Combination. Brookfield DTLA Holdings LLC is the guarantor of certain nonrecourse carveouts under the Bank of America Plaza Loan Combination.
The Sponsor. The sponsor is Brookfield Office Properties Inc. (“Brookfield”). Brookfield is one of North America’s largest public real estate companies. Brookfield owns and manages a portfolio of 114 commercial properties in 16 cities and 20 development sites comprising over approximately 103 million square feet in markets that include New York, London (England), Toronto (Canada), Los Angeles and Washington, D.C.
Escrows. The loan documents provide for upfront reserves in the amount of $4,151,842 for taxes, $2,991,870 for tenant improvements and leasing commissions and $520,213 for rent concessions associated with the Alston & Bird ($472,505) and Analysis Group space ($47,708). The loan documents provide for the guarantor to deliver a reserve guaranty of $3,785,317 in lieu of a cash deposit for tenant improvements and leasing commissions associated with the Bank of America and Alston & Bird space. If at any time (i) an event of default has occurred and is continuing; (ii) the Bank of America Plaza Loan Combination has been assumed; (iii) the sponsor owns less than 10.0% of the borrower or no longer controls the borrower; or (iv) the reserve guaranty is no longer in full force and effect, the borrowers will deposit with the lender an amount equal to $3,785,317 less any amounts that would have been required to be distributed to the borrowers during the Bank of America Plaza Loan Combination term.
The loan documents require monthly deposits of $518,981 for real estate taxes, $23,871 for replacement reserves and beginning on September 1, 2020, monthly deposits of $119,357 for tenant improvements and leasing commissions. The loan documents do not require monthly escrows for insurance provided (i) no event of default has occurred and is continuing; (ii) the insurance required to be maintained by the borrowers is maintained pursuant to one or more blanket insurance policies; and (iii) the borrowers provides the lender with timely proof of payment of insurance premiums.
Lockbox and Cash Management. The Bank of America Plaza Loan Combination requires a lender-controlled lockbox account, which is already in place, and that the borrowers direct tenants to pay their rents directly into such lockbox account. The loan documents also require that all rents received by the borrowers or the property manager be deposited into the lockbox account within three business days of receipt. Prior to the occurrence of a Trigger Period (as defined below), all funds on deposit in the lockbox account are distributed to the borrower. During a Trigger Period, all cash flow is swept to a lender controlled cash management account.
A “Trigger Period” will commence upon a Cash Trap Event Period (as defined below), a Capital Group Cash Trap Event Period (as defined below), or the exercise of the borrowers’ right to incur mezzanine financing (see “Subordinate and Mezzanine Indebtedness” below). A Trigger Period caused by a Cash Trap Event Period or a Capital Group Cash Trap Event Period will end when the related Cash Trap Event Period or Capital Group Cash Trap Event Period ends, as described below. A Trigger Period caused by the exercise of the borrower’s right to incur mezzanine financing will end upon the repayment in full of the Bank of America Plaza Loan Combination.
A “Cash Trap Event Period” will commence upon the earlier of (i) the occurrence and continuance of an event of default; or (ii) the net cash flow debt service coverage ratio is less than 1.30x at the end of any calendar quarter. A Cash Trap Event Period will be cured, with regard to clause (i), upon the cure of such event of default; and with regard to clause (ii), (a) upon the net cash flow debt service coverage ratio being equal to or greater than 1.30x for two consecutive calendar quarters; or (b) the payment of funds by the borrower into a reserve account or in lieu of posting funds into a reserve account, posting a letter of credit that will be held as additional security during the loan term, which, if applied to reduce the outstanding principal balance of the loan, the debt service coverage ratio would be equal to or greater than 1.30x.
THE INFORMATION IN THIS STRUCTURAL AND COLLATERAL TERM SHEET IS NOT COMPLETE AND MAY BE AMENDED PRIOR TO THE TIME OF SALE. THIS TERM SHEET IS NOT AN OFFER TO SELL THESE SECURITIES AND IT IS NOT A SOLICITATION OF AN OFFER TO BUY THESE SECURITIES IN ANY JURISDICTION WHERE THE OFFER OR SALE IS NOT PERMITTED.
33
| BANK OF AMERICA PLAZA |
A “Capital Group Cash Trap Event Period” will commence (i) July 30, 2016, in the event that The Capital Group does not renew all of its space under the current lease or (ii) upon the occurrence of any event after July 30, 2016 which would cause The Capital Group’s exercise of its renewal option to be ineffective, null or void. A Capital Group Cash Trap Event Period will end upon the earlier of (a) funds have been deposited into an account in an amount equal $8,088,850 (which may be reduced if and to the extent that the actual tenant improvement and leasing commission costs relating to a qualified replacement lease is less than $25.00 per square foot for the area leased pursuant to such qualified replacement lease); or (b) the net cash flow debt service coverage ratio is equal to or greater than 1.30x at the end of any calendar quarter and the entire space previously leased by The Capital Group has been leased to a replacement tenant (or relet to The Capital Group) for a lease term of no less than five years and such tenant is in occupancy and operating within the space.
Property Management. The Bank of America Plaza Property is managed by an affiliate of the borrowers.
Assumption. The borrowers have a two-time right to transfer the Bank of America Plaza Property provided that certain conditions are satisfied, including (i) no event of default has occurred and is continuing; (ii) the lender reasonably determined that the proposed transferee and guarantor satisfy the lender’s credit review and underwriting standards, taking into consideration transferee experience, financial strength and general business standing; and (iii) the lender has received confirmation from Fitch, KBRA and Moody’s that such assumption will not result in a downgrade, withdrawal or qualification of the respective ratings assigned to the Series 2014-C22 Certificates, and similar confirmations with respect to the ratings of any securities backed by the Bank of America Plaza Companion Loans.
Partial Release. The borrowers are permitted to release any air rights with respect to a land parcel and a portion of the concourse level immediately below the air rights (“Release Parcels”) from the lien of the Bank of America Plaza Loan Combination provided (i) no event of default has occurred and is continuing; (ii) any construction associated with the improvement of the Release Parcels will not interfere with any tenant or give rise to any right for any tenant to terminate its lease; (iii) the partial defeasance of 110.0% of the allocated loan amount associated with the Release Parcels, based on a current appraisal; (iv) the remaining portion of the Bank of America Plaza Property has a net cash flow debt yield not less than the net cash flow debt yield immediately prior to the release; and (v) the remaining portion of the Bank of America Plaza Property has a loan-to-value ratio that is equal to or less than the loan-to-value ratio immediately prior to the release.
Real Estate Substitution. Not permitted.
Subordinate and Mezzanine Indebtedness. The borrower has the right to incur mezzanine financing subject to the satisfaction of certain conditions including (i) the execution of an intercreditor agreement in form and substance acceptable to the lender and each of Fitch, KBRA and Moody’s; (ii) the combined loan-to-value ratio is not greater than 66.0%; (iii) the combined debt service coverage ratio is not less than 2.10x; and (iv) receipt of rating agency confirmations from Fitch, KBRA and Moody’s that the mezzanine financing will not result in a downgrade, withdrawal or qualification of the respective ratings assigned to the Series 2014-C22 Certificates and similar confirmations with respect to the ratings of any securities backed by the Bank of America Plaza Companion Loans.
Terrorism Insurance. The loan documents require that the “all risk” insurance policy required to be maintained by the borrowers provide coverage for terrorism in an amount equal to the full replacement cost of the Bank of America Plaza Property; provided, however, if TRIPRA is discontinued or not renewed, the borrowers will be require to carry terrorism coverage in an amount at least equal to the lesser of (i) the outstanding principal balance of the Bank of America Plaza Loan Combination or (ii) the sum of the business income insurance equal to 100% of the projected gross income from the Bank of America Plaza Property for a 12-month period from the date of casualty plus the full replacement cost. However, the borrowers shall not be required to spend on terrorism coverage more than two times the amount of the premium for property insurance required to insure against physical hazards and business interruption. The loan documents also require business interruption insurance covering no less than the thirty-six month period following the occurrence of a casualty event, together with a twelve-month extended period of indemnity.
Earthquake Insurance: The loan documents do not require earthquake insurance. The seismic report indicated a probable maximum loss of 13%.
THE INFORMATION IN THIS STRUCTURAL AND COLLATERAL TERM SHEET IS NOT COMPLETE AND MAY BE AMENDED PRIOR TO THE TIME OF SALE. THIS TERM SHEET IS NOT AN OFFER TO SELL THESE SECURITIES AND IT IS NOT A SOLICITATION OF AN OFFER TO BUY THESE SECURITIES IN ANY JURISDICTION WHERE THE OFFER OR SALE IS NOT PERMITTED.
34
(THIS PAGE INTENTIONALLY LEFT BLANK)
35
(THIS PAGE INTENTIONALLY LEFT BLANK)
36
| COLUMBUS SQUARE PORTFOLIO |
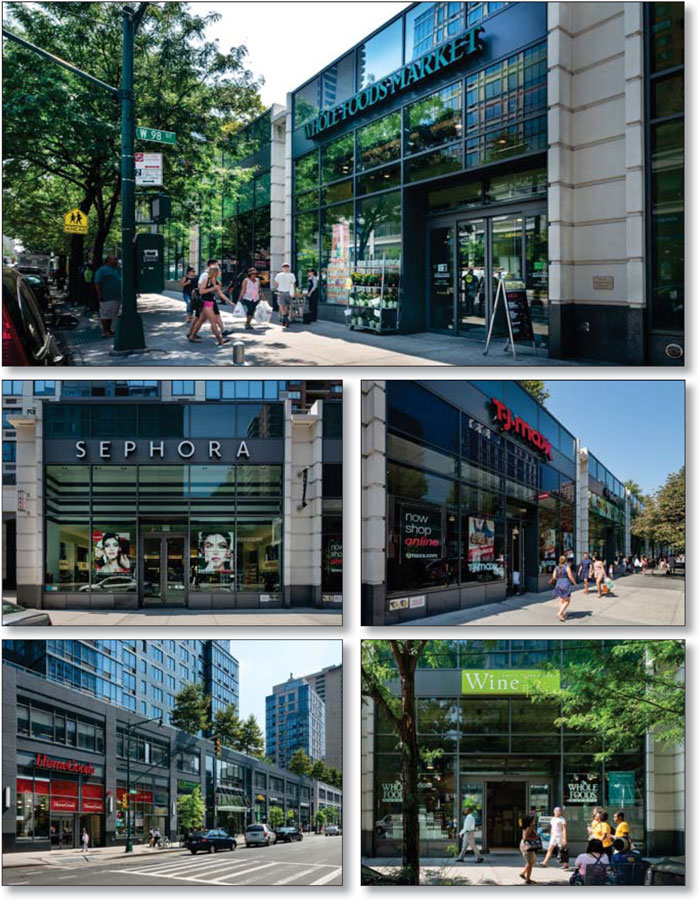
THE INFORMATION IN THIS STRUCTURAL AND COLLATERAL TERM SHEET IS NOT COMPLETE AND MAY BE AMENDED PRIOR TO THE TIME OF SALE. THIS TERM SHEET IS NOT AN OFFER TO SELL THESE SECURITIES AND IT IS NOT A SOLICITATION OF AN OFFER TO BUY THESE SECURITIES IN ANY JURISDICTION WHERE THE OFFER OR SALE IS NOT PERMITTED.
37
| COLUMBUS SQUARE PORTFOLIO |
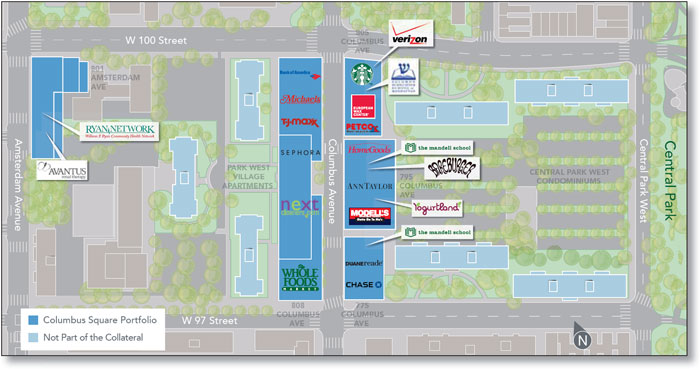
THE INFORMATION IN THIS STRUCTURAL AND COLLATERAL TERM SHEET IS NOT COMPLETE AND MAY BE AMENDED PRIOR TO THE TIME OF SALE. THIS TERM SHEET IS NOT AN OFFER TO SELL THESE SECURITIES AND IT IS NOT A SOLICITATION OF AN OFFER TO BUY THESE SECURITIES IN ANY JURISDICTION WHERE THE OFFER OR SALE IS NOT PERMITTED.
38
| COLUMBUS SQUARE PORTFOLIO |
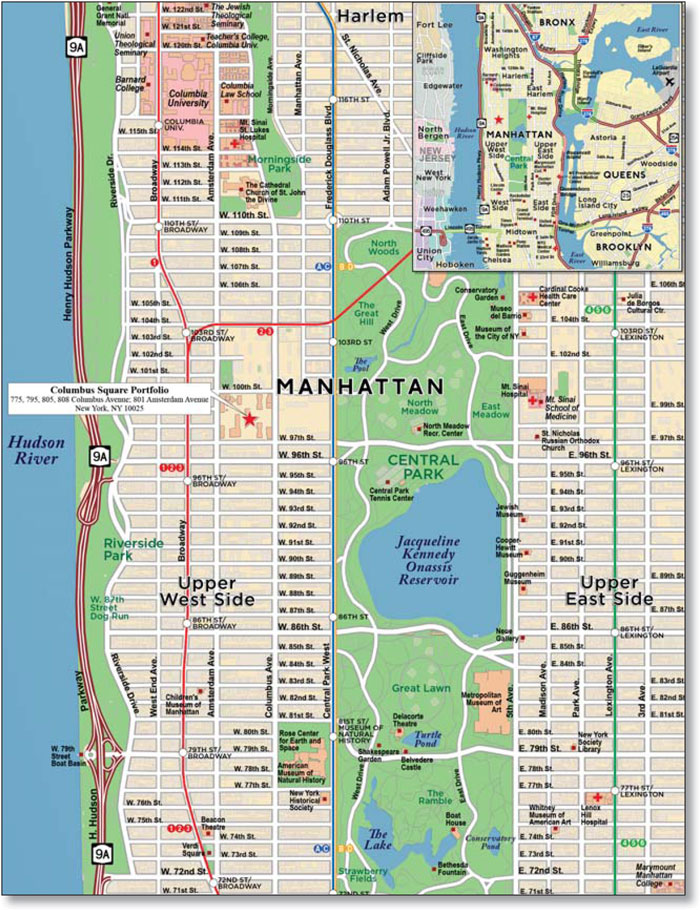
THE INFORMATION IN THIS STRUCTURAL AND COLLATERAL TERM SHEET IS NOT COMPLETE AND MAY BE AMENDED PRIOR TO THE TIME OF SALE. THIS TERM SHEET IS NOT AN OFFER TO SELL THESE SECURITIES AND IT IS NOT A SOLICITATION OF AN OFFER TO BUY THESE SECURITIES IN ANY JURISDICTION WHERE THE OFFER OR SALE IS NOT PERMITTED.
39
| No. 2 Columbus Square Portfolio | |||||||
| Loan Information | Property Information | ||||||
| Mortgage Loan Seller: | Wells Fargo Bank, National Association | Single Asset/Portfolio: | Portfolio | ||||
| Credit Assessment (Fitch/KBRA/Moody’s): | NR/NR/NR | Property Type: | Mixed Use | ||||
Original Principal Balance(1): | $125,000,000 | Specific Property Type: | Retail/Other/Office | ||||
Cut-off Date Principal Balance(1): | $125,000,000 | Location: | New York, NY | ||||
| % of Initial Pool Balance: | 8.4% | Size: | 494,224 SF | ||||
| Loan Purpose: | Refinance | Cut-off Date Principal Balance Per SF(1): | $809.35 | ||||
| Borrower Names: | Various(2) | Year Built/Renovated(5): | Various/NAP | ||||
| Sponsors: | Jacob Chetrit; Laurence Gluck | Title Vesting: | Fee | ||||
| Mortgage Rate: | 4.570% | Property Manager: | Self-managed | ||||
| Note Date: | August 8, 2014 | 3rd Most Recent Occupancy (As of)(6): | NAV | ||||
| Anticipated Repayment Date: | NAP | 2nd Most Recent Occupancy (As of)(7): | 71.9% (12/31/2012) | ||||
| Maturity Date: | August 11, 2024 | Most Recent Occupancy (As of)(7): | 75.0% (12/31/2013) | ||||
| IO Period: | 42 months | Current Occupancy (As of)(8): | 95.7% (7/31/2014) | ||||
| Loan Term (Original): | 120 months | ||||||
| Seasoning: | 1 month | Underwriting and Financial Information: | |||||
| Amortization Term (Original): | 420 months | ||||||
| Loan Amortization Type: | Interest-only, Amortizing Balloon | 3rd Most Recent NOI (As of)(6): | NAV | ||||
| Interest Accrual Method: | Actual/360 | 2nd Most Recent NOI (As of): | $20,421,271 (12/31/2012) | ||||
Call Protection(3): | L(25),D(91),O(4) | Most Recent NOI (As of)(9): | $19,333,826 (12/31/2013) | ||||
| Lockbox Type: | Hard/Upfront Cash Management | ||||||
Additional Debt(1): | Yes | ||||||
Additional Debt Type(1): | Pari Passu | U/W Revenues: | $29,269,650 | ||||
| U/W Expenses: | $2,376,810 | ||||||
U/W NOI(9): | $26,892,839 | ||||||
U/W NCF(9): | $26,393,417 | ||||||
U/W NOI DSCR(1)(9): | 1.17x | ||||||
Escrows and Reserves(4): | U/W NCF DSCR(1)(9): | 1.15x | |||||
U/W NOI Debt Yield(1)(9): | 6.7% | ||||||
Type: | Initial | Monthly | Cap (If Any) | U/W NCF Debt Yield(1)(9): | 6.6% | ||
| Taxes | $249,368 | $77,575 | NAP | As-Is Appraised Value: | $555,000,000 | ||
| Insurance | $0 | Springing | NAP | As-Is Appraisal Valuation Date: | July 16, 2014 | ||
| Replacement Reserves | $6,177 | $6,177 | $148,267 | Cut-off Date LTV Ratio(1): | 72.1% | ||
| TI/LC Reserve | $0 | Springing(4) | $4,500,000 | LTV Ratio at Maturity or ARD(1): | 66.1% | ||
| (1) | The Columbus Square Portfolio Loan Combination, totaling $400,000,000, is comprised of four pari passu notes (Notes A-1, A-2, A-3 and A-4). The controlling Note A-1 had an original balance of $125,000,000, has an outstanding principal balance of $125,000,000 as of the Cut-off Date and will be contributed to the WFRBS 2014-C22 Trust. The remaining three pari passu notes had an aggregate principal balance of $275,000,000 and are expected to be contributed to future trusts. All statistical information related to balances per square foot, loan-to-value ratios, debt service coverage ratios and debt yields are based on the Columbus Square Portfolio Loan Combination. |
| (2) | See “The Borrowers” section. |
| (3) | See “Purchase Option” section. |
| (4) | See “Escrows” section. |
| (5) | The Columbus Square Portfolio Properties were constructed in 2007 and 2008. |
| (6) | 3rd Most Recent Occupancy and 3rd Most Recent NOI are not available because historical statements prior to 2012 include the non-collateral apartment and condominium unit performance. |
| (7) | See “Historical Occupancy” section. |
| (8) | Two tenants (Avantus Renal Therapy and Bareburger) comprising 3.7% of the net rentable area and 4.2% of the underwritten base rent are not yet in occupancy. Occupancy excluding these tenants is 92.0%. |
| (9) | See “Cash Flow Analysis” section. |
The Mortgage Loan. The mortgage loan (the “Columbus Square Portfolio Loan Combination”) is evidenced by four pari passu promissory notes (the A-1, A-2, A-3 and A-4 notes, respectively) secured by a first mortgage encumbering five mixed-use condominium units located in New York, New York (the “Columbus Square Portfolio Properties”). The Columbus Square Portfolio Loan Combination was co-originated on August 8, 2014 by Wells Fargo Bank, National Association and Barclays Bank PLC. The Columbus Square Portfolio Loan Combination had an original principal balance of $400,000,000, has an outstanding principal balance as of the Cut-off Date of $400,000,000 and accrues interest at an interest rate of 4.570% per annum. The Columbus Square Portfolio Loan Combination had an initial term of 120 months, has a remaining term of 119 months as of the Cut-off Date and requires payments of interest-only for the first 42 payments following origination and, thereafter, requires payments of principal and interest based on a 35-year amortization schedule. The Columbus Square Portfolio Loan Combination matures on August 11, 2024. See “Description of the Mortgage Pool – Split Loan Structures – The Columbus Square Portfolio Loan Combination” and “Servicing of the Mortgage Loans and Administration of the Trust Fund – Additional Matters Relating to the Servicing of the Columbus Square Portfolio Loan Combination” in the Free Writing Prospectus.
THE INFORMATION IN THIS STRUCTURAL AND COLLATERAL TERM SHEET IS NOT COMPLETE AND MAY BE AMENDED PRIOR TO THE TIME OF SALE. THIS TERM SHEET IS NOT AN OFFER TO SELL THESE SECURITIES AND IT IS NOT A SOLICITATION OF AN OFFER TO BUY THESE SECURITIES IN ANY JURISDICTION WHERE THE OFFER OR SALE IS NOT PERMITTED.
40
| COLUMBUS SQUARE PORTFOLIO |
Note A-1, which represents the controlling interest in the Columbus Square Portfolio Loan Combination and will be contributed to the WFRBS 2014-C22 Trust, had an original principal balance of $125,000,000 and has an outstanding principal balance as of the Cut-off Date of $125,000,000. The remaining three pari passu notes, which collectively had an aggregate original principal balance of $275,000,000 and each represents non-controlling interests in the Columbus Square Portfolio Loan Combination, are expected to be contributed to future trusts (the “Columbus Square Portfolio Companion Loans”). As of the loan closing date, the A-2 note had an original principal balance of $103,750,000, the A-3 note had an original principal balance of $75,000,000 and the A-4 note had an original principal balance of $96,250,000; however, the lender provides no assurances that any non-securitized pari passu notes will not be split further. The holders of the respective promissory notes evidencing the Columbus Square Portfolio Loan Combination have entered into a co-lender agreement that sets forth the respective rights of each note holder.
Following the lockout period, the borrowers have the right to defease the Columbus Square Portfolio Loan Combination in whole, or prepay in connection with a certain partial release by paying a yield maintenance premium, if applicable (see “Purchase Option” section), on any date before May 11, 2024. In addition, the Columbus Square Portfolio Loan Combination is prepayable without penalty on or after May 11, 2024.
Sources and Uses
| Sources | Uses | ||||||||
| Original loan combination amount | $400,000,000 | 100.0% | Loan payoff | $271,916,460 | 68.0 | % | |||
| Reserves | 255,545 | 0.1 | |||||||
| Closing costs | 7,071,223 | 1.8 | |||||||
| Return of equity | 120,756,773 | 30.2 | |||||||
| Total Sources | $400,000,000 | 100.0% | Total Uses | $400,000,000 | 100.0 | % |
The Properties. The Columbus Square Portfolio Properties comprise five mixed-use condominium buildings (see “Description of the Mortgage Pool – Certain Characteristics of the Mortgage Loans – Condominium Structures” in the Free Writing Prospectus) situated on two separate blocks located on Manhattan’s Upper West Side within New York, New York. The Columbus Square Portfolio Properties contain 494,224 square feet of predominantly retail space constructed by the sponsors in 2007 and 2008, as detailed in the following table:
| Building Name | Year Built | NRSF | % of NRSF | Annual U/W Base Rent | % of Annual U/W Base Rent | Retail SF | % of Building SF | Community Facility SF | % of Building SF | Parking SF | % of Building SF | |||||||||||||||||||
| 775 Columbus | 2008 | 39,644 | 8.0 | % | $3,847,641 | 13.5 | % | 22,664 | 57.2 | % | 10,715 | 27.0 | % | 6,265 | 15.8 | % | ||||||||||||||
| 795 Columbus | 2007 | 104,218 | 21.1 | % | $6,927,149 | 24.3 | % | 59,911 | 57.5 | % | 44,307 | 42.5 | % | 0 | 0.0 | % | ||||||||||||||
| 805 Columbus | 2007 | 40,260 | 8.1 | % | $3,136,876 | 11.0 | % | 26,531 | 65.9 | % | 13,729 | 34.1 | % | 0 | 0.0 | % | ||||||||||||||
| 808 Columbus | 2007 | 240,852 | 48.7 | % | $12,385,867 | 43.4 | % | 157,177 | 65.3 | % | 0 | 0.0 | % | 83,675 | 34.7 | % | ||||||||||||||
| 801 Amsterdam | 2008 | 69,250 | 14.0 | % | $2,252,890 | 7.9 | % | 9,674 | 14.0 | % | 41,072 | 59.3 | % | 18,504 | 26.7 | % | ||||||||||||||
| Total/Weighted Average | 494,224 | 100.0 | % | $28,550,424 | 100.0 | % | 275,957 | 55.8 | % | 109,823 | 22.2 | % | 108,444 | 21.9 | % | |||||||||||||||
The retail space is comprised of 275,957 square feet, with approximately 98,000 square feet at grade level, and 178,000 square feet of below grade space. The retail portion of the Columbus Square Portfolio Properties is located along Columbus Avenue and is anchored by Whole Foods, who recently expanded with an adjoining 2,775 square foot wine store (the first Whole Foods wine store in New York City), TJ Maxx, which added its HomeGoods concept after experiencing high sales volumes, and Michael’s, which expanded by an additional 10,572 square feet in March 2013. Eight tenants (or their parent companies), accounting for approximately 33.1% of the net rentable area and 48.9% of the annual underwritten base rent, are rated investment-grade, and only 33.9% of the net rentable area is scheduled to expire during the loan term. The majority of the community facility portion of the Columbus Square Portfolio Properties is leased to the Mandell School, a private co-educational institution founded in 1939 for pre-school through eighth graders. The 775 and 795 Columbus properties house the Mandell School’s elementary and preparatory divisions and their Upper West Side pre-school. Three below-grade parking garages containing 392 parking spaces leased to Quik Park comprise the remainder of the Columbus Square Portfolio Properties. The sponsors began to assemble land for this project in the late 1990s, and transformed the site, previously home to condominiums and rent-controlled apartments, into a 24/7 “live, work and play” neighborhood. The Columbus Square Portfolio Properties are situated in the Columbus Square mixed-use development, which includes the Columbus Square Luxury Apartments (located above the Columbus Square Portfolio Properties), the Park West Village Apartments and Central Park West Condominiums, which include over 3,200 units and 13,000 residents combined. No portion of the Columbus Square Luxury Apartments, Park West Village Apartments or the Central Park West Condominiums is collateral for the Columbus Square Portfolio Loan Combination. As of July 31, 2014, the Columbus Square Portfolio Properties were 95.7% occupied by 23 tenants.
THE INFORMATION IN THIS STRUCTURAL AND COLLATERAL TERM SHEET IS NOT COMPLETE AND MAY BE AMENDED PRIOR TO THE TIME OF SALE. THIS TERM SHEET IS NOT AN OFFER TO SELL THESE SECURITIES AND IT IS NOT A SOLICITATION OF AN OFFER TO BUY THESE SECURITIES IN ANY JURISDICTION WHERE THE OFFER OR SALE IS NOT PERMITTED.
41
| COLUMBUS SQUARE PORTFOLIO |
The following table presents certain information relating to the tenancy at the Columbus Square Portfolio Properties:
Major Tenants
| Tenant Name | Credit Rating (Fitch/ Moody’s/ S&P)(1) | Tenant NRSF | % of NRSF | Annual U/W Base Rent PSF(2) | Annual U/W Base Rent(2) | % of Total Annual U/W Base Rent | Sales PSF(3) | Occupancy Cost(3) | Lease Expiration Date | ||||||||
| Anchor Tenants | |||||||||||||||||
Whole Foods | NR/NR/BBB- | 62,454 | 12.6% | $73.06(4) | $4,562,703(4) | 16.0% | NAV | NAV | 8/31/2029(5) | ||||||||
Michael’s | NR/B3/NR | 34,424 | 7.0% | $57.37 | $1,975,000 | 6.9% | NAV | NAV | 3/31/2020(6) | ||||||||
HomeGoods | NR/A3/A+ | 27,019 | 5.5% | $71.58(7) | $1,933,902(7) | 6.8% | $362 | 18.4% | 5/31/2021(8) | ||||||||
TJ Maxx | NR/A3/A+ | 40,550 | 8.2% | $47.21(9) | $1,914,494(9) | 6.7% | $512 | 8.4% | 10/31/2019(10) | ||||||||
| Total Anchor Tenants | 164,447 | 33.3% | $63.16 | $10,386,100 | 36.4% | ||||||||||||
| Major Tenants | |||||||||||||||||
Mandell School | NR/NR/NR | 55,022 | 11.1% | $58.79 | $3,234,757 | 11.3% | NAP | NAP | 6/30/2030(11) | ||||||||
Petco | NR/B3/B | 19,487 | 3.9% | $95.96 | $1,869,973 | 6.5% | NAP | NAP | 10/31/2020 | ||||||||
JPMorgan Chase | A+/A3/A | 4,955 | 1.0% | $330.56(12) | $1,637,944(12) | 5.7% | NAP | NAP | 11/30/2030 | ||||||||
Duane Reade | NR/Baa1/BBB | 17,196 | 3.5% | $80.46(13) | $1,383,547(13) | 4.8% | NAV | NAV | 10/31/2030 | ||||||||
Sephora | NR/NR/A+ | 5,602 | 1.1% | $216.82(14) | $1,214,617(14) | 4.3% | $812(15) | 21.5%(15) | 1/31/2026 | ||||||||
| Total Major Tenants | 102,262 | 20.7% | $91.34 | $9,340,838 | 32.7% | ||||||||||||
| Non-Major Tenants | 97,754 | 19.8% | $71.79 | $7,018,236 | 24.6% | ||||||||||||
| Total Retail & Community Facility Tenants | 364,463 | 73.7% | $73.38 | $26,745,174 | 93.7% | ||||||||||||
| Parking Tenant | |||||||||||||||||
Quik Park | 108,444 | 21.9% | $16.65 | $1,805,250 | 6.3% | 4/30/2029 | |||||||||||
| Occupied Collateral Total | 472,907 | 95.7% | $60.37 | $28,550,424 | 100.0% | ||||||||||||
| Vacant Space | 21,317 | 4.3% | |||||||||||||||
| Collateral Total | 494,224 | 100.0% | |||||||||||||||
| (1) | Certain ratings are those of the parent company whether or not the parent guarantees the lease. |
| (2) | Annual U/W Base Rent PSF and Annual U/W Base Rent include contractual rent steps through October 2015. |
| (3) | Sales and occupancy costs are based on the current in-place rent and the trailing 12-month period ending January 31, 2014 unless otherwise noted. |
| (4) | The Annual U/W Base Rent and Annual U/W Base Rent PSF for Whole Foods represent the tenant’s average rent over the lease term. The tenant’s current in-place rent is $59.75 per square foot. |
| (5) | Whole Foods has six, 5-year lease renewal options. |
| (6) | Michael’s has two 10-year lease renewal options. |
| (7) | The Annual U/W Base Rent and Annual U/W Base Rent PSF for HomeGoods represent the tenant’s average rent over the lease term. The tenant’s current in-place rent is $66.62 per square foot. |
| (8) | HomeGoods has three, 5-year lease renewal options. |
| (9) | The Annual U/W Base Rent and Annual U/W Base Rent PSF for TJ Maxx represent the tenant’s average rent over the lease term. The tenant’s current in-place rent is $43.04 per square foot. |
| (10) | TJ Maxx has three, 5-year lease renewal options. |
| (11) | Mandell School has the right to terminate their lease at any time with four months written notice and subject to the payment of a termination fee equal to three years rent (three years rent totals approximately $8.4 million through June 2015, $9.7 million through June 2020, $11.2 million through June 2025 and $12.8 million through June 2030). |
| (12) | The Annual U/W Base Rent and Annual U/W Base Rent PSF for JP Morgan Chase represent the tenant’s average rent over the lease term. The tenant’s current in-place rent is $253.48 per square foot. |
| (13) | The Annual U/W Base Rent and Annual U/W Base Rent PSF for Duane Reade represent the tenant’s average rent over the lease term. The tenant’s current in-place rent is $64.90 per square foot. |
| (14) | The Annual U/W Base Rent and Annual U/W Base Rent PSF for Sephora represent the tenant’s average rent over the lease term. The tenant’s current in-place rent is $174.94 per square foot. |
| (15) | Sales and occupancy costs are for the trailing 12-month period ending April 30, 2014. |
THE INFORMATION IN THIS STRUCTURAL AND COLLATERAL TERM SHEET IS NOT COMPLETE AND MAY BE AMENDED PRIOR TO THE TIME OF SALE. THIS TERM SHEET IS NOT AN OFFER TO SELL THESE SECURITIES AND IT IS NOT A SOLICITATION OF AN OFFER TO BUY THESE SECURITIES IN ANY JURISDICTION WHERE THE OFFER OR SALE IS NOT PERMITTED.
42
| COLUMBUS SQUARE PORTFOLIO |
The following table presents certain information relating to the lease rollover schedule at the Columbus Square Portfolio Properties:
Lease Expiration Schedule(1)(2)
Year Ending December 31, | No. of Leases Expiring | Expiring NRSF | % of Total NRSF | Cumulative Expiring NRSF | Cumulative % of Total NRSF | Annual U/W Base Rent | Annual U/W Base Rent PSF(3) | |||||||||||||
| MTM | 0 | 0 | 0.0% | 0 | 0.0% | $0 | $0.00 | |||||||||||||
| 2014 | 0 | 0 | 0.0% | 0 | 0.0% | $0 | $0.00 | |||||||||||||
| 2015 | 0 | 0 | 0.0% | 0 | 0.0% | $0 | $0.00 | |||||||||||||
| 2016 | 0 | 0 | 0.0% | 0 | 0.0% | $0 | $0.00 | |||||||||||||
| 2017 | 0 | 0 | 0.0% | 0 | 0.0% | $0 | $0.00 | |||||||||||||
| 2018 | 0 | 0 | 0.0% | 0 | 0.0% | $0 | $0.00 | |||||||||||||
| 2019 | 1 | 40,550 | 8.2% | 40,550 | 8.2% | $1,914,494 | $47.21 | |||||||||||||
| 2020 | 4 | 68,153 | 13.8% | 108,703 | 22.0% | $4,546,123 | $66.70 | |||||||||||||
| 2021 | 2 | 28,550 | 5.8% | 137,253 | 27.8% | $2,193,499 | $76.83 | |||||||||||||
| 2022 | 2 | 1,512 | 0.3% | 138,765 | 28.1% | $250,813 | $165.88 | |||||||||||||
| 2023 | 3 | 19,798 | 4.0% | 158,563 | 32.1% | $1,412,400 | $71.34 | |||||||||||||
| 2024 | 2 | 8,966 | 1.8% | 167,529 | 33.9% | $1,788,736 | $199.50 | |||||||||||||
| Thereafter | 9 | 305,378 | 61.8% | 472,907 | 95.7% | $16,444,358 | $53.85 | |||||||||||||
| Vacant | 0 | 21,317 | 4.3% | 494,224 | 100.0% | $0 | $0.00 | |||||||||||||
| Total/Weighted Average | 23 | 494,224 | 100.0% | $28,550,424 | $60.37 | |||||||||||||||
| (1) | Information obtained from the underwritten rent roll. |
| (2) | Certain tenants may have lease termination options that are exercisable prior to the originally stated expiration date of the subject lease and that are not considered in the Lease Expiration Schedule. |
| (3) | Weighted Average Annual U/W Base Rent PSF excludes vacant space. |
The following table presents historical occupancy percentages at the Columbus Square Portfolio Properties:
Historical Occupancy
12/31/2011(1) | 12/31/2012(2) | 12/31/2013(2) | 7/31/2014(3) | |||
| NAV | 71.9% | 75.0% | 95.7% |
| (1) | 12/31/2011 historical occupancy is not available because historical statements prior to 2012 include the non-collateral apartment and condominium unit performance. |
| (2) | Information obtained from the borrowers. 12/31/2012 and 12/31/2013 occupancy is lower as the Columbus Square Portfolio Properties were still in lease-up phase. While the buildings were constructed in 2007 and 2008, the final building (805 Columbus) did not open until August 2010. Approximately 134,382 square feet (27.2% of NRSF) in new leases were signed in 2013 and 2014. |
| (3) | Information obtained from the underwritten rent roll. Two tenants (Avantus Renal Therapy and Bareburger) comprising 3.7% of the net rentable area and 4.2% of the underwritten base rent are not yet in occupancy. Occupancy excluding these tenants is 92.0%. |
THE INFORMATION IN THIS STRUCTURAL AND COLLATERAL TERM SHEET IS NOT COMPLETE AND MAY BE AMENDED PRIOR TO THE TIME OF SALE. THIS TERM SHEET IS NOT AN OFFER TO SELL THESE SECURITIES AND IT IS NOT A SOLICITATION OF AN OFFER TO BUY THESE SECURITIES IN ANY JURISDICTION WHERE THE OFFER OR SALE IS NOT PERMITTED.
43
| COLUMBUS SQUARE PORTFOLIO |
Operating History and Underwritten Net Cash Flow. The following table presents certain information relating to the historical operating performance and the Underwritten Net Cash Flow at the Columbus Square Portfolio Properties:
Cash Flow Analysis
| 2012 | 2013(1) | U/W(1) | U/W $ per SF | |||||||||
| Base Rent | $22,345,979 | $21,411,531 | $28,550,424 | $57.77 | ||||||||
| Grossed Up Vacant Space | 0 | 0 | 2,917,555 | 5.90 | ||||||||
| Percentage Rent | 0 | 0 | 0 | 0.00 | ||||||||
| Total Reimbursables | 1,025,172 | 83,728 | 152,226 | 0.31 | ||||||||
| Other Income | 415,820 | 372,424 | 567,000 | 1.15 | ||||||||
| Less Vacancy & Credit Loss | (150,642) | (45,833) | (2,917,555)(2) | (5.90) | ||||||||
| Effective Gross Income | $23,636,329 | $21,821,850 | $29,269,650 | $59.22 | ||||||||
| Total Operating Expenses | $3,215,058 | $2,488,024 | $2,376,810(3) | $4.81 | ||||||||
| Net Operating Income | $20,421,271 | $19,333,826 | $26,892,839 | $54.41 | ||||||||
| TI/LC | 0 | 0 | 450,000 | 0.91 | ||||||||
| Capital Expenditures | 0 | 0 | 49,422 | 0.10 | ||||||||
| Net Cash Flow | $20,421,271 | $19,333,826 | $26,393,417 | $53.40 | ||||||||
NOI DSCR(4) | 0.89x | 0.84x | 1.17x | |||||||||
NCF DSCR(4) | 0.89x | 0.84x | 1.15x | |||||||||
NOI DY(4) | 5.1% | 4.8% | 6.7% | |||||||||
NCF DY(4) | 5.1% | 4.8% | 6.6% | |||||||||
| (1) | The increase in Base Rent from 2013 to U/W is primarily due to approximately $4.1 million (approximately 134,382 square feet; 27.2% of NRSF) in new leasing activity along with approximately $908,000 in contractual rent increases and $2.1 million rent averaging for investment-grade rated tenants. |
| (2) | The underwritten economic vacancy is 9.3%. The Columbus Square Portfolio Properties were 95.7% leased and 92.0% physically occupied as of July 31, 2014. |
| (3) | The Columbus Square Portfolio Properties benefit from Industrial and Commercial Incentive Programs (“ICIPs”) and 421a tax exemptions (the parking garages benefit from the 421a exemptions), which result in a reduced property tax expense. The property tax expense as of year-end 2013 was $140,846. The ICIPs expire in 2034 and will be gradually phased out beginning in the 2025/2026 tax year. The 421a exemptions expire in 2021 and 2022 (the 808 Columbus property’s exemption expires in 2032) and will be gradually phased out beginning in the 2013/2014 and 2014/2015 tax years (the 808 Columbus property’s exemption will be phased out beginning in the 2023/2024 tax years). The U/W property tax expense of $949,975 is based on the current abated tax expense. The taxes are projected to increase from the current level to $1,638,023 by the time the Columbus Square Portfolio Loan Combination matures. According to the leases, all tax increases may be passed through to the tenants at the Columbus Square Portfolio Properties. |
| (4) | DSCRs and debt yields are based on the Columbus Square Portfolio Loan Combination. |
Appraisal. As of the appraisal valuation date of July 16, 2014, the Columbus Square Portfolio Properties had an “as-is” appraised value of $555,000,000.
Environmental Matters. According to a Phase I environmental site assessment dated July 15, 2014, there was no evidence of any recognized environmental conditions at the Columbus Square Portfolio Properties. However, six above ground storage tanks (“ASTs”) are maintained at the Columbus Square Portfolio Properties. Based on a review of the online database, the tanks at the 775, 795 and 805 Columbus properties have current permits but the remaining two tanks are listed with expired registrations. The Phase I environmental consultant recommends provision of current permits, and if it is determined the two ASTs do not have the appropriate permits, the permits/registrations should be renewed or obtained. The borrowers are in the process of renewing the permits.
Market Overview and Competition. The Columbus Square Portfolio Properties are situated on two abutting city blocks bounded by 100th Street to the north, 97th Street to the south, Amsterdam Avenue to the west and Columbus Avenue to the east in the Upper West Side neighborhood of Manhattan. The Upper West Side is an upscale, primarily residential area known for its cultural, educational and historical institutions, including Columbia University (1.0 mile north of the Columbus Square Portfolio Properties), Lincoln Center (1.8 miles south) and the American Museum of Natural History (1.0 mile south), in addition to Central Park (less than one mile east). The Columbus Square Portfolio Properties are part of the larger Columbus Square development, which contains five buildings, 500,000 square feet of retail and community facility space, over 3,200 units and over 13,000 residents combined. Nearby and adjacent uses include a mix of high-rise, luxury and market rate residential buildings with multi-level retail and older pre-war high rise residential buildings, providing significant foot traffic for the Columbus Square Portfolio Properties. According to a third party market research report, the median household income is approximately $111,000 within a one-mile radius of the Columbus Square Portfolio Properties, while the median home value is approximately $905,000.
The Columbus Square Portfolio Properties neighborhood is serviced by an excellent transportation network via subway and public bus. The Columbus Square Portfolio Properties are located one block northwest of the 96th Street (at Central Park West) subway station, which provides access to the B and C subway lines and two blocks northeast of 96th Street (at Broadway) subway station, which provides access to the 1, 2 and 3 subway lines. Further, the Metropolitan Transit Authority bus system makes this neighborhood accessible from virtually all locations north, south and east. Crosstown buses run along 66th, 79th-81st, 86th, 96th/97th and 110th Streets. Uptown bus service is available along Central Park West, Amsterdam Avenue, Broadway and Riverside Drive, and downtown buses run along Central Park West, Columbus Avenue, Broadway and Riverside Drive.
THE INFORMATION IN THIS STRUCTURAL AND COLLATERAL TERM SHEET IS NOT COMPLETE AND MAY BE AMENDED PRIOR TO THE TIME OF SALE. THIS TERM SHEET IS NOT AN OFFER TO SELL THESE SECURITIES AND IT IS NOT A SOLICITATION OF AN OFFER TO BUY THESE SECURITIES IN ANY JURISDICTION WHERE THE OFFER OR SALE IS NOT PERMITTED.
44
| COLUMBUS SQUARE PORTFOLIO |
According to a third party market research report, the Columbus Square Portfolio Properties are located within the Upper West Side submarket. As of the second quarter of 2014, the retail submarket had a total inventory of 4.3 million square feet across 266 buildings. The retail submarket reported a vacancy rate of 1.2%, down from 6.3% as of the fourth quarter of 2007, with an average retail rent of approximately $103.49 per square foot on a gross equivalent basis. The appraiser concluded to a market rent of $55.00 per square foot on a gross basis for the community facility space, and $5,000 per licensed space for the parking garage, which equates to a rent of $18.07 per square foot of parking square footage.
The Borrowers. The borrowers are 808 Columbus Commercial Owner LLC, 775 Columbus LLC, 795 Columbus LLC, 805 Columbus LLC and 801 Amsterdam Commercial Owner LLC, all single purpose entities whose managing member has two independent directors. Legal counsel to the borrowers delivered a non-consolidation opinion in connection with the origination of the Columbus Square Portfolio Loan Combination. Jacob Chetrit and Laurence Gluck are the guarantors of certain nonrecourse carveouts under the Columbus Square Portfolio Loan Combination.
The Sponsors. The sponsors are Jacob Chetrit and Laurence Gluck. Jacob Chetrit is among the principals of The Chetrit Group. Founded by Joseph Chetrit, The Chetrit Group is a privately held real estate investment firm headquartered in Manhattan, with a portfolio of over 14.0 million square feet of commercial real estate in New York, Chicago, Miami, Los Angeles and other countries. Laurence Gluck is the founder and owner of Stellar Management, an owner-manager of over two million square feet of office space and apartments (approximately 12,000 units in 100 buildings) in New York City, Washington, D.C., San Francisco, and South Florida. Stellar Management has management teams based in New York, Washington, D.C. and San Francisco. Jacob Chetrit and Laurence Gluck have been involved in prior loan defaults, modifications and foreclosures, and Laurence Gluck is involved in ongoing litigation with a former business partner. See “Description of the Mortgage Pool - Default History, Bankruptcy Issues and Other Proceedings” and “Description of the Mortgage Pool - Litigation Considerations” in the Free Writing Prospectus.
Escrows. The loan documents provide for upfront reserves in the amount of $249,368 for real estate taxes and $6,177 for replacement reserves. The loan documents require monthly deposits of $77,575 for real estate taxes, $6,177 for replacement reserves (subject to a cap of $148,267) and monthly deposits beginning January 11, 2018 of $70,726 for tenant improvements and leasing commissions (subject to a cap of $4,500,000). The loan documents do not require monthly escrows for insurance provided (i) no event of default has occurred and is continuing; (ii) the insurance required to be maintained by the borrowers is maintained pursuant to one or more blanket insurance policies approved by the lender; (iii) the borrowers provide the lender with timely proof of payment of insurance premiums, and (iv) the borrowers provide evidence of renewal of insurance policies.
Lockbox and Cash Management. The Columbus Square Portfolio Loan Combination requires a lender-controlled lockbox account, which is already in place, and that the borrowers direct tenants to pay their rents directly into such lockbox account. The loan documents also require that all rents received by the borrowers or the property manager be deposited into the lockbox account within one business day of receipt. Funds are then swept into a cash management account controlled by the lender and prior to the occurrence of a Cash Trap Event Period (as defined below), all excess funds after application in accordance with the loan documents are distributed to the borrowers’ operating account. During a Cash Trap Event Period, all excess cash flow is retained in the cash management account.
A “Cash Trap Event Period” will commence upon the earlier of (i) the occurrence and continuance of an event of default or (ii) the net cash flow debt yield falling below 5.25% at the end of any calendar quarter. A Cash Trap Event Period will be cured, with regard to clause (i), upon the cure of such event of default; and with regard to clause (ii), upon the net cash flow debt yield being equal to or greater than 5.25% for two consecutive calendar quarters.
Property Management. The Columbus Square Portfolio Properties are managed by an affiliate of the borrowers.
Assumption. The borrowers have a two-time right to transfer the Columbus Square Portfolio Properties provided that certain conditions are satisfied, including (i) no event of default has occurred and is continuing; (ii) the lender reasonably determined that the proposed transferee and guarantor satisfy the lender’s credit review and underwriting standards, taking into consideration transferee’s experience, financial strength and general business standing; and (iii) the lender has received confirmation from Fitch, KBRA and Moody’s that such assumption will not result in a downgrade, withdrawal or qualification of the respective ratings assigned to the Series 2014-C22 Certificates, and similar confirmations with respect to the ratings of any securities backed by the Columbus Square Portfolio Companion Loans.
Partial Release. See “Purchase Option” section.
Real Estate Substitution. Not permitted.
Subordinate and Mezzanine Indebtedness. Not permitted.
Purchase Option. A tenant at the 801 Amsterdam property, William F. Ryan (24,581 square feet; 5.0% of net rentable area) may exercise a purchase option on the tenant’s leased condominium unit (provided the tenant is not in default of the lease) at a purchase price of $19.8 million. In the event the purchase option is exercised (between January 2020 and January 2030), the borrowers must release the 801 Amsterdam property from the lien of the Columbus Square Portfolio Combination Loan mortgage with payment of a release price equal to $51.5 million, together with any applicable yield maintenance charges, subject to, among other things: (i) confirmation of compliance with zoning and subdivision requirements; (ii) confirmation from Fitch, KBRA and Moody’s that such release will not result in a downgrade, withdrawal or qualification of the respective ratings assigned to the Series 2014-C22 Certificates, and similar confirmations with respect to the ratings of any securities backed by the Columbus Square
THE INFORMATION IN THIS STRUCTURAL AND COLLATERAL TERM SHEET IS NOT COMPLETE AND MAY BE AMENDED PRIOR TO THE TIME OF SALE. THIS TERM SHEET IS NOT AN OFFER TO SELL THESE SECURITIES AND IT IS NOT A SOLICITATION OF AN OFFER TO BUY THESE SECURITIES IN ANY JURISDICTION WHERE THE OFFER OR SALE IS NOT PERMITTED.
45
| COLUMBUS SQUARE PORTFOLIO |
Portfolio Companion Loans; and (iii) opinion of counsel that the REMIC trust will not fail to maintain its REMIC status due to the partial release.
Ground Lease. None.
Terrorism Insurance. The loan documents require that the “all risk” insurance policy required to be maintained by the borrower provides coverage for terrorism in an amount equal to the full replacement cost of the Columbus Square Portfolio Properties. The loan documents also require business interruption insurance covering no less than the 18-month period following the occurrence of a casualty event, together with a 12-month extended period of indemnity.
THE INFORMATION IN THIS STRUCTURAL AND COLLATERAL TERM SHEET IS NOT COMPLETE AND MAY BE AMENDED PRIOR TO THE TIME OF SALE. THIS TERM SHEET IS NOT AN OFFER TO SELL THESE SECURITIES AND IT IS NOT A SOLICITATION OF AN OFFER TO BUY THESE SECURITIES IN ANY JURISDICTION WHERE THE OFFER OR SALE IS NOT PERMITTED.
46
(THIS PAGE INTENTIONALLY LEFT BLANK)
47
| STAMFORD PLAZA PORTFOLIO |

THE INFORMATION IN THIS STRUCTURAL AND COLLATERAL TERM SHEET IS NOT COMPLETE AND MAY BE AMENDED PRIOR TO THE TIME OF SALE. THIS TERM SHEET IS NOT AN OFFER TO SELL THESE SECURITIES AND IT IS NOT A SOLICITATION OF AN OFFER TO BUY THESE SECURITIES IN ANY JURISDICTION WHERE THE OFFER OR SALE IS NOT PERMITTED.
48
| STAMFORD PLAZA PORTFOLIO |
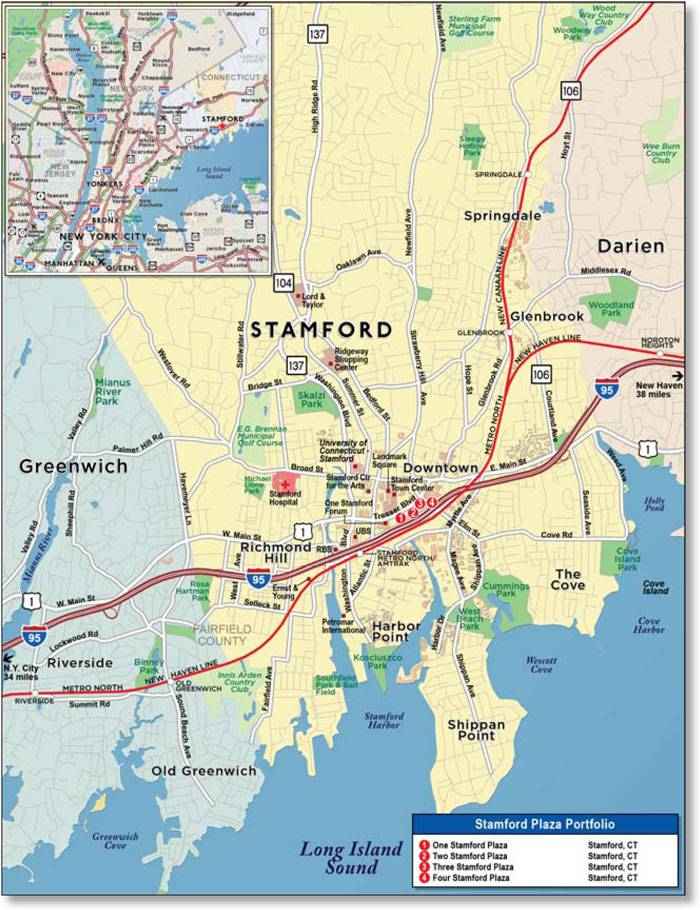
THE INFORMATION IN THIS STRUCTURAL AND COLLATERAL TERM SHEET IS NOT COMPLETE AND MAY BE AMENDED PRIOR TO THE TIME OF SALE. THIS TERM SHEET IS NOT AN OFFER TO SELL THESE SECURITIES AND IT IS NOT A SOLICITATION OF AN OFFER TO BUY THESE SECURITIES IN ANY JURISDICTION WHERE THE OFFER OR SALE IS NOT PERMITTED.
49
| No. 3 – Stamford Plaza Portfolio | ||||||
| Loan Information | Property Information | |||||
| Mortgage Loan Seller: | The Royal Bank of Scotland | Single Asset/Portfolio: | Portfolio | |||
| Credit Assessment (Fitch/KBRA/Moody’s): | NR/NR/NR | Property Type: | Office | |||
Original Principal Balance(1): | $100,000,000 | Specific Property Type: | CBD | |||
Cut-off Date Principal Balance(1): | $100,000,000 | Location: | Stamford, CT | |||
| % of Initial Pool Balance: | 6.7% | Size: | 982,483 SF | |||
| Loan Purpose: | Refinance | Cut-off Date Principal Balance Per SF(1): | $274.81 | |||
| Borrower Names: | Various(2) | Year Built/Renovated: | Various – See Table | |||
| Sponsors: | Aby Rosen and Michael Fuchs | Title Vesting: | Fee | |||
| Mortgage Rate: | 4.585% | Property Manager: | Self-managed | |||
| Note Date: | August 6, 2014 | 3rd Most Recent Occupancy (As of): | 88.2% (12/31/2011) | |||
| Anticipated Repayment Date: | NAP | 2nd Most Recent Occupancy (As of): | 91.4% (12/31/2012) | |||
| Maturity Date: | August 6, 2024 | Most Recent Occupancy (As of): | 91.4% (12/31/2013) | |||
| IO Period: | 60 months | Current Occupancy (As of): | 88.0% (6/19/2014) | |||
| Loan Term (Original): | 120 months | |||||
| Seasoning: | 1 months | Underwriting and Financial Information: | ||||
| Amortization Term (Original): | 360 months | |||||
| Loan Amortization Type: | Interest-only, Amortizing Balloon | 3rd Most Recent NOI (As of): | $16,669,524 (12/31/2012) | |||
| Interest Accrual Method: | Actual/360 | 2nd Most Recent NOI (As of)(5): | $20,938,175 (12/31/2013) | |||
| Call Protection: | L(25),D(91),O(4) | Most Recent NOI (As of)(5): | $22,769,145 (TTM 5/31/2014) | |||
| Lockbox Type: | Hard/Upfront Cash Management | |||||
Additional Debt(1)(3): | Yes | U/W Revenues: | $42,900,089 | |||
Additional Debt Type(1)(3): | Pari Passu, Mezzanine and other Affiliate Subordinate Debt | U/W Expenses: | $17,690,143 | |||
U/W NOI(5): | $25,209,946 | |||||
Escrows and Reserves(4): | U/W NCF(5): | $22,812,465 | ||||
U/W NOI DSCR(1): | 1.52x | |||||
| Type: | Initial | Monthly | Cap (If Any) | U/W NCF DSCR(1): | 1.38x | |
| Taxes | $963,416 | $481,708 | NAP | U/W NOI Debt Yield(1): | 9.3% | |
| Insurance | $0 | Springing | NAP | U/W NCF Debt Yield(1): | 8.4% | |
| Replacement Reserves | $4,470,000 | $16,375 | NAP | As-Is Appraised Value: | $427,200,000 | |
| TI/LC Reserves | $0 | $187,500 | NAP | As-Is Appraisal Valuation Date: | June 25, 2014 | |
| Deferred Maintenance | $945,000 | $0 | NAP | Cut-off Date LTV Ratio(1): | 63.2% | |
| Tenant Specific TI/LC Reserve | $665,870 | $0 | NAP | LTV Ratio at Maturity or ARD(1): | 57.9% | |
| (1) | The Stamford Plaza Portfolio Loan Combination, totaling $270,000,000, is comprised of three pari passu notes (Notes A-1, A-2, and A-3). The non-controlling Note A-3 had an original principal balance of $100,000,000, has an outstanding principal balance of $100,000,000 as of the Cut-off Date and will be contributed to the WFRBS 2014-C22 Trust. The remaining two pari passu notes had an aggregate original principal balance of $170,000,000 and are anticipated to be contributed to future trusts. All statistical information related to balances per square foot, loan-to-value ratios, debt service coverage ratios and debt yields are based on the Stamford Plaza Portfolio Loan Combination. |
| (2) | The borrower is comprised of three separate limited liability companies, collectively: One Stamford Plaza Owner LLC; Three Stamford Plaza Owner LLC; and Four Stamford Plaza Owner LLC. |
| (3) | See “Subordinate and Mezzanine Indebtedness” section. |
| (4) | See “Escrows” section. |
| (5) | See “Cash Flow Analysis” section. |
The Mortgage Loan. The mortgage loan (the “Stamford Plaza Portfolio Loan Combination”) is evidenced by three pari passu notes (the A-1, A-2, and A-3 notes, respectively) secured by a first mortgage encumbering four adjacent office properties located in Stamford, Connecticut (the “Stamford Plaza Portfolio Properties”). The Stamford Plaza Portfolio Loan Combination was co-originated on August 6, 2014 by The Royal Bank of Scotland and Citigroup Global Markets Realty Corp. The Stamford Plaza Portfolio Loan Combination had an original principal balance of $270,000,000, has an outstanding principal balance as of the Cut-off Date of $270,000,000 and accrues interest at an interest rate of 4.585% per annum. The Stamford Plaza Portfolio Loan Combination had an initial term of 120 months, has a remaining term of 119 months as of the Cut-off Date and requires interest-only payments for the first 60 payments following origination and, thereafter, requires payments of principal and interest based on a 30-year amortization schedule. The Stamford Plaza Portfolio Loan matures on August 6, 2024. See “Description of the Mortgage Pool—Additional Indebtedness—Split Loan Structures—The Stamford Plaza Portfolio Loan Combination” and “The Pooling and Servicing Agreement—Servicing Of The Mortgage Loans And Administration Of The Trust Fund—Additional Matters Relating to the Servicing of the Non-Serviced Loan Combination—Servicing of the Stamford Plaza Portfolio Loan Combination” in the Free Writing Prospectus.
Note A-3, which represents a non-controlling interest in the Stamford Plaza Portfolio Loan Combination and will be contributed to the WFRBS 2014-C22 Trust, had an original principal balance of $100,000,000 and has an outstanding principal balance as of the
THE INFORMATION IN THIS STRUCTURAL AND COLLATERAL TERM SHEET IS NOT COMPLETE AND MAY BE AMENDED PRIOR TO THE TIME OF SALE. THIS TERM SHEET IS NOT AN OFFER TO SELL THESE SECURITIES AND IT IS NOT A SOLICITATION OF AN OFFER TO BUY THESE SECURITIES IN ANY JURISDICTION WHERE THE OFFER OR SALE IS NOT PERMITTED.
50
| STAMFORD PLAZA PORTFOLIO |
Cut-off Date of $100,000,000. The remaining two pari passu notes had an aggregate original principal balance of $170,000,000 and are anticipated to be contributed to future trusts (collectively, the “Stamford Plaza Portfolio Companion Loans”). The lender provides no assurances that Note A-1 or Note A-2 will not be split further.
Following the lockout period, the borrower has the right to defease the Stamford Plaza Portfolio Loan Combination in whole, or in part (see “Partial Release” section), on any date before August 6, 2024. In addition, the Stamford Plaza Portfolio Loan Combination is prepayable without penalty on or after May 6, 2024.
Sources and Uses
| Sources | Uses | |||||||
| Original loan amount | $270,000,000 | 99.7% | Loan payoff | $262,500,217 | 97.0% | |||
| Sponsor’s new cash contribution | 695,992 | 0.3 | Reserves | 7,044,286 | 2.6 | |||
| Closing Costs | 1,151,489 | 0.4 | ||||||
| Total Sources | $270,695,992 | 100.0% | Total Uses | $270,695,992 | 100.0% |
The Properties. The Stamford Plaza Portfolio Properties are comprised of two, 15-story, class A office buildings and two, 16-story class A office buildings containing 982,483 square feet located in Stamford, Connecticut. Situated on 12.8 acres, the Stamford Plaza Portfolio Properties were built between 1979 and 1986 and renovated between 1993 and 1996. The Stamford Plaza Portfolio Properties are located at the southwestern corner of the intersection of Tresser Boulevard and Elm Street, just north of Interstate 95 and within close walking distance to the Metro-North commuter railroad (Stamford Station), which serves Stamford via the New Haven line. The Stamford Plaza Portfolio Properties are located directly adjacent to each other and form a contiguous office complex linked by common interior and exterior walkways. Shared amenities include a cafeteria, sundry shop, fitness center, conference facilities, ATM machines, and shuttle bus to the Stamford Station. Parking is provided by three covered parking structures comprising 2,575 spaces, which equates to 2.6 spaces per 1,000 square feet of rentable area. Eight investment grade tenants comprise 36.2% of the net rentable area and 43.3% of the underwritten base rent, including W.R. Berkley Corp., Merrill Lynch, Pierce, Fenner & Smith, Icon International, Inc., Noble Americas Corp, Webster Bank NA, and Chevron USA Inc. As of June 19, 2014, the Stamford Plaza Portfolio Properties were 88.0% occupied by 60 tenants.
The following table presents certain information relating to the Stamford Plaza Portfolio Properties:
| Property Name | Property Type | Allocated Cut-off Date Principal Balance | % of Portfolio Cut-off Date Principal Balance | Occupancy | Year Built/ Renovated | Net Rentable Area (SF) | Appraised Value | U/W Net Cash Flow | |||||
| Two Stamford Plaza | Office | $28,370,787 | 28.4% | 85.1% | 1986/1994 | 258,132 | $121,200,000 | $5,554,216 | |||||
| Four Stamford Plaza | Office | $24,555,243 | 24.6% | 79.7% | 1979/1996 | 261,982 | $104,900,000 | $5,128,753 | |||||
| One Stamford Plaza | Office | $23,665,730 | 23.7% | 89.8% | 1986/1994 | 216,252 | $101,100,000 | $4,942,901 | |||||
| Three Stamford Plaza | Office | $23,408,240 | 23.4% | 98.1% | 1981/1993 | 246,117 | $100,000,000 | $7,186,595 | |||||
| Total/Weighted Average | $100,000,000 | 100.0% | 88.0% | 982,483 | $427,200,000 | $22,812,465 |
THE INFORMATION IN THIS STRUCTURAL AND COLLATERAL TERM SHEET IS NOT COMPLETE AND MAY BE AMENDED PRIOR TO THE TIME OF SALE. THIS TERM SHEET IS NOT AN OFFER TO SELL THESE SECURITIES AND IT IS NOT A SOLICITATION OF AN OFFER TO BUY THESE SECURITIES IN ANY JURISDICTION WHERE THE OFFER OR SALE IS NOT PERMITTED.
51
| STAMFORD PLAZA PORTFOLIO |
The following table presents certain information relating to the tenancy at the Stamford Plaza Portfolio Properties:
Major Tenants(1)
| Tenant Name | Property(2) | Credit Rating (Fitch/Moody’s/ S&P)(3) | Tenant NRSF | % of NRSF | Annual U/W Base Rent PSF | Annual U/W Base Rent | % of Total Annual U/W Base Rent | Lease Expiration Date | ||||
| Major Tenant | ||||||||||||
W.R. Berkley Corp(4) | Three | BBB+/Baa2/BBB+ | 92,124 | 9.4% | $48.71 | $4,487,026 | 11.5% | Various(4) | ||||
| Icon International, Inc. | Four | BBB+/NR/BBB | 76,555 | 7.8% | $45.58 | $3,489,155 | 8.9% | 1/31/2018(5) | ||||
| Merrill Lynch, Pierce, Fenner | Three | A/Baa2/NR | 55,833 | 5.7% | $49.41 | $2,758,942 | 7.0% | 2/28/2018(6) | ||||
| Towers Watson Pennsylvania | One | NR/NR/NR | 68,234 | 6.9% | $38.72 | $2,642,227 | 6.7% | 10/31/2016 | ||||
| Glencore, Ltd. | Three | NR/NR/NR | 45,537 | 4.6% | $52.21 | $2,377,321 | 6.1% | 2/28/2022(7) | ||||
| Noble Americas Corp | Four | BBB-/Baa3/BBB- | 48,058 | 4.9% | $44.68 | $2,147,425 | 5.5% | 3/15/2021 | ||||
| Tronox LLC | One, Two | NR/Ba3/BB | 27,358 | 2.8% | $48.76 | $1,333,939 | 3.4% | 3/31/2023(8) | ||||
| Wiggin and Dana LLP | Two | NR/NR/NR | 22,987 | 2.3% | $47.00 | $1,080,389 | 2.8% | 1/31/2022 | ||||
| Hexcel Corporation | Two | NR/NR/BBB- | 22,023 | 2.2% | $47.00 | $1,035,081 | 2.6% | 2/28/2022 | ||||
| Boardroom Inc. | Two | NR/NR/NR | 22,360 | 2.3% | $45.00 | $1,006,200 | 2.6% | 2/29/2020(9) | ||||
| Total Major Tenants - Collateral | 481,069 | 49.0% | $46.48 | $22,357,704 | 57.1% | |||||||
| Non-Major Tenants - Collateral | 383,109 | 39.0% | $43.84 | $16,794,677 | 42.9% | |||||||
| Occupied Collateral Total | 864,178 | 88.0% | $45.31 | $39,152,381 | 100.0% | |||||||
| Vacant Space | 118,305 | 12.0% | ||||||||||
| Collateral Total | 982,483 | 100.0% | ||||||||||
| (1) | Information obtained from the underwritten rent roll. |
| (2) | “One” denotes the One Stamford Plaza Property; “Two” denotes the Two Stamford Plaza Property; “Three” denotes the Three Stamford Plaza Property; and “Four” denotes the Four Stamford Plaza Property. |
| (3) | Certain ratings are those of the parent company whether or not the parent guarantees the lease. |
| (4) | Three operating units of W.R. Berkley Corp are tenants with separate leases at the Three Stamford Plaza Property: 46,062 square feet (4.7% of NRSF and 5.8% of Annual U/W Base Rent) expiring on February 28, 2021; 35,698 square feet (3.6% of NRSF and 4.4% of Annual U/W Base Rent) expiring on June 30, 2021, and 10,364 square feet (1.1% of NRSF and 1.3% of Annual U/W Base Rent) expiring on June 30, 2021. The tenants have the option to terminate their respective leases as of March 2016, November 2016 and November 2017, respectively, with nine months written notice. In addition, the tenants each have one, five-year extension option. |
| (5) | Icon International, Inc. has a one-time option to surrender 11,895 square feet of leased space as of September 2015 with nine months’ notice. |
(6) | Merrill Lynch, Pierce, Fenner has the option to surrender up to 11,371 square feet of its leased space with 12 months’ notice. |
(7) | Glencore, Ltd. may terminate its lease as of June 2017 with 12 months notice. |
(8) | Tronox LLC may terminate its lease as of March 2019 with 12 months notice. |
| (9) | Boardroom Inc. may terminate its lease as of March 2016 with 12 months notice. |
The following table presents certain information relating to the lease rollover schedule at the Stamford Plaza Portfolio Properties:
Lease Expiration Schedule(1)(2)
Year Ending December 31, | No. of Leases Expiring | Expiring NRSF | % of Total NRSF | Cumulative Expiring NRSF | Cumulative % of Total NRSF | Annual U/W Base Rent | Annual U/W Base Rent PSF(3) | ||||
| MTM | 2 | 5,388 | 0.5% | 5,388 | 0.5% | $1,690 | $0.31 | ||||
| 2014 | 0 | 0 | 0.0% | 5,388 | 0.5% | $0 | $0.00 | ||||
| 2015 | 7 | 42,988 | 4.4% | 48,376 | 4.9% | $1,838,493 | $42.77 | ||||
| 2016 | 12 | 130,483 | 13.3% | 178,859 | 18.2% | $5,433,306 | $41.64 | ||||
| 2017 | 8 | 61,116 | 6.2% | 239,975 | 24.4% | $2,954,775 | $48.35 | ||||
| 2018 | 14 | 202,818 | 20.6% | 442,793 | 45.1% | $9,417,486 | $46.43 | ||||
| 2019 | 7 | 42,019 | 4.3% | 484,812 | 49.3% | $1,788,822 | $42.57 | ||||
| 2020 | 10 | 82,359 | 8.4% | 567,171 | 57.7% | $3,463,761 | $42.06 | ||||
| 2021 | 4 | 140,182 | 14.3% | 707,353 | 72.0% | $6,634,450 | $47.33 | ||||
| 2022 | 4 | 105,438 | 10.7% | 812,791 | 82.7% | $5,222,450 | $49.53 | ||||
| 2023 | 2 | 27,358 | 2.8% | 840,149 | 85.5% | $1,333,939 | $48.76 | ||||
| 2024 | 1 | 24,029 | 2.4% | 864,178 | 88.0% | $1,063,208 | $44.25 | ||||
| Thereafter | 0 | 0 | 0.0% | 864,178 | 88.0% | $0 | $0.00 | ||||
| Vacant | 0 | 118,305 | 12.0% | 982,483 | 100.0% | $0 | $0.00 | ||||
| Total / Weighted Average | 71 | 982,483 | 100.0% | $39,152,381 | $45.31 | ||||||
| (1) | Information obtained from the underwritten rent roll. |
| (2) | Certain tenants may have lease termination options that are exercisable prior to the originally stated expiration date of the subject lease and that are not considered in the Lease Expiration Schedule. |
| (3) | Weighted Average Annual U/W Base Rent PSF excludes vacant space. |
THE INFORMATION IN THIS STRUCTURAL AND COLLATERAL TERM SHEET IS NOT COMPLETE AND MAY BE AMENDED PRIOR TO THE TIME OF SALE. THIS TERM SHEET IS NOT AN OFFER TO SELL THESE SECURITIES AND IT IS NOT A SOLICITATION OF AN OFFER TO BUY THESE SECURITIES IN ANY JURISDICTION WHERE THE OFFER OR SALE IS NOT PERMITTED.
52
| STAMFORD PLAZA PORTFOLIO |
The following table presents historical occupancy percentages at the Stamford Plaza Portfolio Properties:
Historical Occupancy
12/31/2011(1) | 12/31/2012(1) | 12/31/2013(1) | 6/19/2014(2) | |||
| 88.2% | 91.4% | 91.4% | 88.0% |
| (1) | Information obtained from the borrower. |
| (2) | Information obtained from the underwritten rent roll. |
Operating History and Underwritten Net Cash Flow. The following table presents certain information relating to the historical operating performance and the Underwritten Net Cash Flow at the Stamford Plaza Portfolio Properties:
Cash Flow Analysis
| 2012 | 2013 | TTM 5/31/2014 | U/W(1) | U/W $ per SF(1) | ||||||
| Base Rent | $29,750,903 | $34,863,266 | $36,870,779 | $39,152,381 | $39.85 | |||||
| Grossed Up Vacant Space | 0 | 0 | 0 | 5,459,642 | 5.56 | |||||
| Total Reimbursables | 3,051,172 | 2,316,480 | 2,275,449 | 2,158,032 | 2.20 | |||||
| Other Income | 1,536,310 | 1,566,546 | 1,602,149 | 1,589,677 | 1.62 | |||||
| Less Vacancy & Credit Loss | 0 | 0 | 0 | (5,459,642)(2) | (5.56) | |||||
| Effective Gross Income | $34,338,385 | $38,746,292 | $40,748,377 | $42,900,089 | $43.66 | |||||
| Total Operating Expenses | $17,668,861 | $17,808,117 | $17,979,232 | $17,690,143 | $18.01 | |||||
| Net Operating Income | $16,669,524 | $20,938,175(3) | $22,769,145 | $25,209,946 | $25.66 | |||||
| TI/LC | 0 | 0 | 0 | 2,200,985 | 2.24 | |||||
| Replacement Reserves | 0 | 0 | 0 | 196,497 | 0.20 | |||||
| Net Cash Flow | $16,669,524 | $20,938,175 | $22,769,145 | $22,812,465 | $23.22 | |||||
NOI DSCR(4) | 1.01x | 1.26x | 1.37x | 1.52x | ||||||
NCF DSCR(4) | 1.01x | 1.26x | 1.37x | 1.38x | ||||||
NOI DY(4) | 6.2% | 7.8% | 8.4% | 9.3% | ||||||
NCF DY(4) | 6.2% | 7.8% | 8.4% | 8.4% |
| (1) | The increase in Base Rent and Net Operating Income from TTM 5/31/2014 to U/W is due to average contractual rent of $1,368,594 over the respective lease terms of eight investment grade tenants totaling 36.2% of the net rentable area and 43.3% of the U/W Base Rent and contractual rent steps through August 2015. |
| (2) | The underwritten economic vacancy is 11.7%. The Stamford Plaza Portfolio Properties were 88.0% physically occupied as of June 19, 2014. |
| (3) | 2013 NOI is higher than 2012 NOI due to new leases and renewals; three new major tenant leases totaling more than $2.4 million in rental income were signed in 2012. |
| (4) | DSCRs and debt yields are based on the Stamford Plaza Portfolio Mortgage Loan Combination. |
Appraisal. As of the appraisal valuation date of June 25, 2014, the Stamford Plaza Portfolio Properties had an aggregate “as-is” appraised value of $427,200,000.
Environmental Matters. According to the Phase I environmental site assessments dated July 8, 2014, there was no evidence of any recognized environmental conditions at the Stamford Plaza Portfolio Properties.
Market Overview. The Stamford Plaza Portfolio Properties are located in downtown Stamford, Connecticut, approximately 40 miles northeast of New York City. The City of Stamford is located within Fairfield County, which is tied both economically and culturally to Manhattan with many residents commuting to Manhattan each day. Fairfield County’s proximity to New York City, combined with less expensive office rents than Manhattan, make it an attractive destination for large corporate headquarters and regional offices. The Stamford Plaza Portfolio Properties are located within close walking proximity to the Metro North – Stamford train station. Stamford’s economy is diverse, and serves as a headquarters or very large office destination for many significant corporations including The Royal Bank of Scotland, UBS, Thomson-Reuters, General Electric and Sikorsky. According to a third party market research report, the 2014 population and average household income within a five-mile radius of the Stamford Plaza Portfolio Properties were 172,794 and $134,841, respectively.
According to the appraisal, the Stamford Plaza Portfolio Properties are located within the class A Stamford central business district (“CBD”) submarket of the Fairfield County office market. As of the first quarter 2014, the Fairfield County class A office market had a vacancy rate and average annual asking gross lease rate of 18.6% and $40.15 per square foot, respectively. As of the first quarter of 2014, the Stamford CBD class A submarket had a vacancy rate and average annual asking gross lease rate of 21.4% and $47.92 per square foot, respectively.
The Borrower. The borrower, collectively, is One Stamford Plaza Owner LLC, Three Stamford Plaza Owner LLC and Four Stamford Plaza Owner LLC, all of which are Delaware limited liability companies and single purpose entities. Legal counsel to the borrower delivered a non-consolidation opinion in connection with the origination of the Stamford Plaza Portfolio Loan Combination. Aby Rosen and Michael Fuchs are the guarantors of certain nonrecourse carveouts under the Stamford Plaza Portfolio Loan Combination.
THE INFORMATION IN THIS STRUCTURAL AND COLLATERAL TERM SHEET IS NOT COMPLETE AND MAY BE AMENDED PRIOR TO THE TIME OF SALE. THIS TERM SHEET IS NOT AN OFFER TO SELL THESE SECURITIES AND IT IS NOT A SOLICITATION OF AN OFFER TO BUY THESE SECURITIES IN ANY JURISDICTION WHERE THE OFFER OR SALE IS NOT PERMITTED.
53
| STAMFORD PLAZA PORTFOLIO |
The Sponsors. The sponsors are Aby Rosen and Michael Fuchs. Aby Rosen and Michael Fuchs are the founders of RFR Realty LLC (“RFR”), a Manhattan based global real estate investment, development and management company founded in 1991. RFR’s diverse portfolio includes signature office towers, ultra-luxury condominiums, hotels and high-end retail developments. Led by a team of senior executives whose members average over 20 years of commercial real estate experience, RFR manages more than 60 assets and development projects in New York City, Stamford, Miami, Las Vegas and Germany.
Escrows. The loan documents provide for upfront escrows in the amount of $963,416 for real estate taxes, $945,000 for deferred maintenance, $4,470,000 for replacement reserves and $665,870 for tenant-specific tenant improvements and leasing commissions. The loan documents provide for monthly escrows in the amount of $481,708 for real estate taxes, $16,375 for replacement reserves and $187,500 for tenant improvements and leasing commissions. Ongoing monthly reserves for insurance are not required as long as the Stamford Plaza Portfolio Properties are covered by an acceptable blanket insurance policy.
Lockbox and Cash Management. The Stamford Plaza Portfolio Loan Combination requires lender-controlled lockbox accounts, which are already in place and that the borrower directs tenants and the parking and property managers to pay their rents and revenue, respectively, directly into the lockbox accounts. The loan documents also require that all rents, cash revenues and all other monies received by the borrower, the property manager, or the parking manager, as applicable, be deposited into the applicable lockbox account within two business days of receipt.
In the event that a Portfolio Trigger Period (as defined below) is in effect, the borrower is required to make monthly deposits for (i) approved operating expenses and extraordinary expenses and (ii) all excess cash flow funds generated by the Stamford Plaza Portfolio Properties. So long as no Portfolio Trigger Period has occurred and is continuing, funds sufficient to pay an amount equal to such operating expense monthly deposit amount will be disbursed to the borrower, and all excess cash will be disbursed to the borrower.
A “Portfolio Trigger Period” will commence upon the earlier of (i) an event of default; (ii) the amortizing debt service coverage ratio being less than 1.20x; (iii) any Major Tenant (as defined below) becoming insolvent or subject to any bankruptcy or insolvency action; (iv) any Major Tenant being in default under its lease beyond applicable notice and cure periods; (v) any Major Tenant giving notice in writing that it is exercising a termination, cancellation and/or lease rejection right under its lease and/or such Major Lease (as defined below) otherwise fails to be in full force and effect; and (vi) the occurrence of a Major Tenant Non-Renewal Event (as defined below). A Portfolio Trigger Period will end with respect to clause (i) above, if such event of default has been cured; with respect to clause (ii) above, the amortizing debt service coverage ratio is equal to or greater than 1.20x for two consecutive calendar quarters; with respect to clause (iii) above, the Major Tenant has affirmed its lease in the applicable bankruptcy proceeding pursuant to a final, non-appealable order of a court of competent jurisdiction; with respect to clause (iv) above, borrower has provided to lender evidence satisfactory to lender that such default under such Major Lease has been cured and the Major Tenant is paying full unabated rent; with respect to clause (v) above, borrower has provided lender evidence satisfactory to lender that such Major Tenant has revoked or rescinded all termination, cancellation and/or rejection notices with respect to its lease and has re-affirmed its lease as being in full force and effect; and with respect to clause (vi) above, the debt service coverage ratio excluding any gross rents received from such Major Tenant is greater than 1.25x.
“Major Lease” is defined as (i) any lease which covers 25,000 or more rentable square feet of improvements; (ii) any lease which has any option, offer or right of first refusal to acquire any portion of the Stamford Plaza Portfolio Properties; (iii) any lease which is with an affiliate of the borrower or of the guarantor; (iv) any lease entered into during the continuance of an event of default; and (v) any instrument guaranteeing or providing credit support for any such Major Lease.
“Major Tenant” is defined as any tenant which, individually or when aggregated with all other affiliated tenants at the Stamford Plaza Portfolio Properties covers 15% or more of the total rental income for the Stamford Plaza Portfolio Properties or covers 100,000 or more rentable square feet of improvements, and any parent or any affiliate guaranteeing or providing credit support for such Major Tenant.
“Major Tenant Non-Renewal Event” means the occurrence of both (A) and (B) as follows: (A) any Major Tenant (x) fails to deliver written notice to borrower extending the term of its lease upon the earlier to occur of (i) one year prior to the expiration of the then applicable term of the applicable lease or (ii) the renewal notice period required under such lease and (y) such lease is not renewed for a minimum renewal term of five years and (B) the debt service coverage ratio for the succeeding twelve month period and excluding any gross rents to be received from such Major Tenant is less than 1.25x.
Property Management. The Stamford Plaza Portfolio Properties are managed by an affiliate of the borrower.
Assumption. The borrower has the right to transfer all, but not less than all, of the Stamford Plaza Portfolio Properties, subject to customary conditions set forth in the loan documents, including but not limited to: (i) no event of default has occurred and is continuing; (ii) the proposed transferee, the property manager and management agreement are satisfactory to the lender and applicable rating agencies; (iii) execution of a recourse guaranty and an environmental indemnity by an affiliate of the transferee; and (iv) the lender has received confirmation from Fitch, KBRA and Moody’s and each rating agency rating any securities backed by the Stamford Plaza Portfolio Companion Loans that such assumption will not result in a downgrade, withdrawal or qualification of the then-current ratings assigned to the Series 2014-C22 Certificates.
Partial Release. On any payment date after September 1, 2016, the borrower may obtain the release of an individual property from the lien of the related mortgage in connection with a partial defeasance upon the satisfaction of certain conditions including but not limited to: (i) no event of default has occurred or is continuing at the time that the release occurs; (ii) the borrower has
THE INFORMATION IN THIS STRUCTURAL AND COLLATERAL TERM SHEET IS NOT COMPLETE AND MAY BE AMENDED PRIOR TO THE TIME OF SALE. THIS TERM SHEET IS NOT AN OFFER TO SELL THESE SECURITIES AND IT IS NOT A SOLICITATION OF AN OFFER TO BUY THESE SECURITIES IN ANY JURISDICTION WHERE THE OFFER OR SALE IS NOT PERMITTED.
54
| STAMFORD PLAZA PORTFOLIO |
delivered defeasance collateral in an amount equal to the greater of (a) 90% of net proceeds of the sale of the released property; and (b) 120% of the released property’s allocated loan amount; (iii) after such release, the amortizing debt service coverage ratio of the remaining properties must be greater than the greater of (x) the amortizing debt service coverage ratio immediately preceding such release and (y) 1.38x; (iv) after such release, the loan-to-value ratio of the remaining properties must not be greater than the lesser of (x) the loan-to-value ratio immediately preceding such release and (y) 63.2%; and (v) borrower shall not be permitted to release the One Stamford Plaza and Two Stamford Plaza properties separately.
Real Estate Substitution. Not permitted.
Subordinate and Mezzanine Indebtedness. Affiliates of the borrowers have five outstanding junior mezzanine loans (the “Mezzanine Loans”). Two of the Mezzanine Loans are currently owned by affiliates of the borrowers, another two of the Mezzanine Loans are majority owned by affiliates of the borrowers, and the remaining Mezzanine Loan is owned by an affiliate of the borrower who has pledged its interest in such Mezzanine Loan to Westdeutsche Immobilienbank Mainz (“WIB”) as security for another subordinate loan with an equal balance. The Mezzanine Loans are secured by the direct or indirect equity interests in such borrower affiliates. The Mezzanine Loans have an aggregate original principal balance of $390,000,000, of which approximately $276,400,000 is owned by or participated to affiliates of the borrowers, and another approximately $50,000,000 is owned by an affiliate but pledged to WIB as discussed above. Pursuant to the Mezzanine Loan documents, a portion of the aggregate principal amount of the Mezzanine Loans has been allocated to each of the Stamford Plaza Portfolio Properties and other unrelated properties covered by the Mezzanine Loans (for purposes of Mezzanine Loan document provisions regarding, among other things, sales of individual properties at the mezzanine loan release prices and allocation of insurance proceeds). The portion of the Mezzanine Loans so allocated to the Stamford Plaza Portfolio Properties in accordance with the Mezzanine Loan documents is approximately $227,175,000. The Mezzanine Loans all mature on August 6, 2024. The mezzanine lenders have entered into subordination and standstill agreements with the mortgage lender with respect to each of the Mezzanine Loans. In addition, the mezzanine lenders and WIB do not have any cure rights, purchase options or consent rights with respect to actions under the Stamford Plaza Portfolio Loan Combination. See “Description of the Mortgage Pool—Subordinate and/or Other Financing—Existing (Secured Financing and Mezzanine and Similar Financing)” in the Free Writing Prospectus.
Ground Lease. None.
Terrorism Insurance. The loan documents require that the “all risk” insurance policy required to be maintained by the borrower provide coverage for terrorism in an amount equal to the full replacement cost of the Stamford Plaza Portfolio Properties. The loan documents also require business interruption insurance covering no less than the 18-month period following the occurrence of a casualty event, together with a six-month extended period of indemnity.
THE INFORMATION IN THIS STRUCTURAL AND COLLATERAL TERM SHEET IS NOT COMPLETE AND MAY BE AMENDED PRIOR TO THE TIME OF SALE. THIS TERM SHEET IS NOT AN OFFER TO SELL THESE SECURITIES AND IT IS NOT A SOLICITATION OF AN OFFER TO BUY THESE SECURITIES IN ANY JURISDICTION WHERE THE OFFER OR SALE IS NOT PERMITTED.
55
| HAMPTON INN & SUITES BRICKELL |

THE INFORMATION IN THIS STRUCTURAL AND COLLATERAL TERM SHEET IS NOT COMPLETE AND MAY BE AMENDED PRIOR TO THE TIME OF SALE. THIS TERM SHEET IS NOT AN OFFER TO SELL THESE SECURITIES AND IT IS NOT A SOLICITATION OF AN OFFER TO BUY THESE SECURITIES IN ANY JURISDICTION WHERE THE OFFER OR SALE IS NOT PERMITTED.
56
| HAMPTON INN & SUITES BRICKELL |
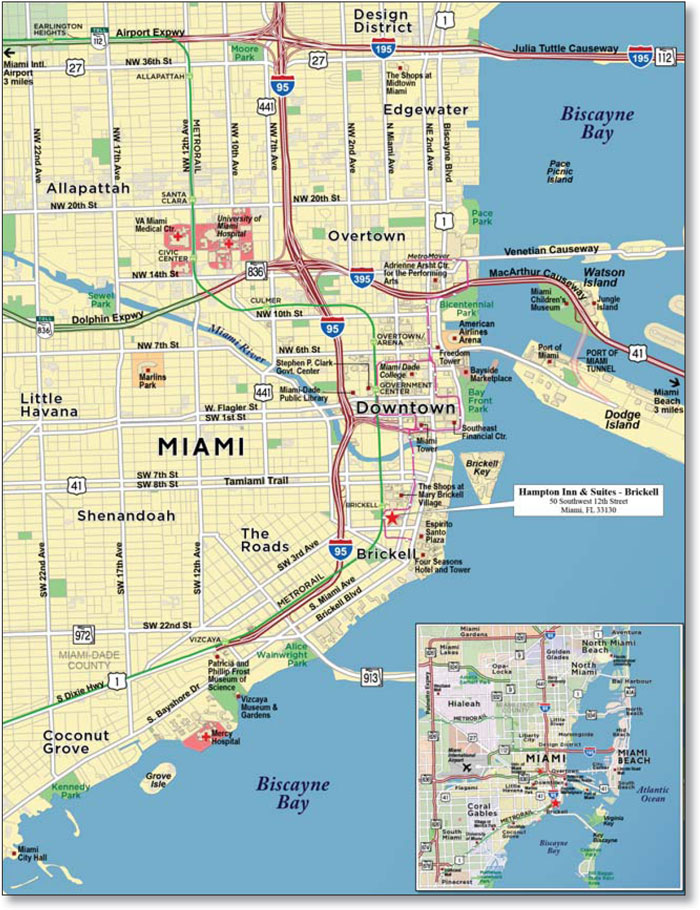
THE INFORMATION IN THIS STRUCTURAL AND COLLATERAL TERM SHEET IS NOT COMPLETE AND MAY BE AMENDED PRIOR TO THE TIME OF SALE. THIS TERM SHEET IS NOT AN OFFER TO SELL THESE SECURITIES AND IT IS NOT A SOLICITATION OF AN OFFER TO BUY THESE SECURITIES IN ANY JURISDICTION WHERE THE OFFER OR SALE IS NOT PERMITTED.
57
| No. 4 – Hampton Inn & Suites Brickell | |||||||
| Loan Information | Property Information | ||||||
| Mortgage Loan Seller: | Wells Fargo Bank, National Association | Single Asset/Portfolio: | Single Asset | ||||
Credit Assessment (Fitch/KBRA/Moody’s): | NR/NR/NR | Property Type: | Hospitality | ||||
| Original Principal Balance: | $55,000,000 | Specific Property Type(2): | Limited Service | ||||
| Cut-off Date Principal Balance: | $54,872,138 | Location: | Miami, FL | ||||
| % of Initial Pool Balance: | 3.7% | Size: | 221 Rooms | ||||
| Loan Purpose: | Refinance | Cut-off Date Principal Balance Per Room: | $248,290 | ||||
| Borrower Name: | Brickell Hotel Group, LLLP | Year Built/Renovated: | 2011/NAP | ||||
| Sponsor: | Bernard Wolfson | Title Vesting: | Fee | ||||
| Mortgage Rate: | 4.620% | Property Manager: | Hospitality America, Inc. | ||||
| Note Date: | June 19, 2014 | 3rd Most Recent Occupancy (As of)(3): | NAP | ||||
| Anticipated Repayment Date: | NAP | 2nd Most Recent Occupancy (As of): | 66.8% (12/31/2012) | ||||
| Maturity Date: | July 11, 2024 | Most Recent Occupancy (As of): | 77.6% (12/31/2013) | ||||
| IO Period: | None | Current Occupancy (As of): | 78.5% (TTM 6/30/2014) | ||||
| Loan Term (Original): | 120 months | ||||||
| Seasoning: | 2 months | Underwriting and Financial Information: | |||||
| Amortization Term (Original): | 360 months | ||||||
| Loan Amortization Type: | Amortizing Balloon | 3rd Most Recent NOI (As of): | $3,793,996 (12/31/2012) | ||||
| Interest Accrual Method: | Actual/360 | 2nd Most Recent NOI (As of): | $5,218,327 (12/31/2013) | ||||
| Call Protection: | L(26),D(90),O(4) | Most Recent NOI (As of)(4): | $5,370,923 (TTM 6/30/2014) | ||||
| Lockbox Type: | Springing (Without Established Account) | ||||||
| Additional Debt: | None | ||||||
| Additional Debt Type: | NAP | U/W Revenues: | $13,168,775 | ||||
| U/W Expenses: | $7,170,357 | ||||||
U/W NOI(4): | $5,998,417 | ||||||
| U/W NCF: | $5,533,402 | ||||||
| U/W NOI DSCR: | 1.77x | ||||||
Escrows and Reserves(1): | U/W NCF DSCR: | 1.63x | |||||
| U/W NOI Debt Yield: | 10.9% | ||||||
Type: | Initial | Monthly | Cap (If Any) | U/W NCF Debt Yield: | 10.1% | ||
| Taxes | $511,536 | $56,838 | NAP | As-Is Appraised Value: | $78,000,000 | ||
| Insurance | $0 | Springing | NAP | As-Is Appraisal Valuation Date: | May 14, 2014 | ||
| FF&E Reserve | $0 | $28,472 | NAP | Cut-off Date LTV Ratio: | 70.3% | ||
| TI/LCs | $0 | $2,083 | $100,000 | LTV Ratio at Maturity or ARD: | 57.3% | ||
| (1) | See “Escrows” section. |
| (2) | The Hampton Inn & Suites Brickell Property includes approximately 10,438 square feet of retail space that is 100.0% leased to six tenants. |
| (3) | The Hampton Inn & Suites Brickell Property opened in September 2011. Occupancy excludes the 10,438 square feet leased to retail tenants. |
| (4) | See “Cash Flow Analysis” section. |
The Mortgage Loan. The mortgage loan (the “Hampton Inn & Suites Brickell Mortgage Loan”) is evidenced by a single promissory note that is secured by a first mortgage encumbering the fee interest in a limited service hotel located in Miami, Florida (the “Hampton Inn & Suites Brickell Property”). The Hampton Inn & Suites Brickell Mortgage Loan was originated on June 19, 2014 by Wells Fargo Bank, National Association. The Hampton Inn & Suites Brickell Mortgage Loan had an original principal balance of $55,000,000, has an outstanding principal balance as of the Cut-off Date of $54,872,138 and accrues interest at an interest rate of 4.620% per annum. The Hampton Inn & Suites Brickell Mortgage Loan had an initial term of 120 months, has a remaining term of 118 months as of the Cut-Off Date, and requires payments of principal and interest based on a 30-year amortization schedule. The Hampton Inn & Suites Brickell Mortgage Loan matures on July 11, 2024.
Following the lockout period, the borrower has the right to defease the Hampton Inn & Suites Brickell Mortgage Loan in whole, but not in part, on any date before April 11, 2024. In addition, the Hampton Inn & Suites Brickell Mortgage Loan is prepayable without penalty on or after April 11, 2024.
THE INFORMATION IN THIS STRUCTURAL AND COLLATERAL TERM SHEET IS NOT COMPLETE AND MAY BE AMENDED PRIOR TO THE TIME OF SALE. THIS TERM SHEET IS NOT AN OFFER TO SELL THESE SECURITIES AND IT IS NOT A SOLICITATION OF AN OFFER TO BUY THESE SECURITIES IN ANY JURISDICTION WHERE THE OFFER OR SALE IS NOT PERMITTED.
58
| HAMPTON INN & SUITES BRICKELL |
Sources and Uses
| Sources | Uses | ||||||||
| Original loan amount | $55,000,000 | 100.0% | Loan payoff | $22,802,403 | 41.5% | ||||
| Reserves | $511,536 | 0.9 | |||||||
| Closing costs | $612,354 | 1.1 | |||||||
| Return of equity | $31,073,707 | 56.5 | |||||||
| Total Sources | $55,000,000 | 100.0% | Total Uses | $55,000,000 | 100.0% |
The Property. The Hampton Inn & Suites Brickell Property is a 221-room, 15-story, limited service hotel located immediately south of the central business district of Miami, Florida. The Hampton Inn & Suites Brickell Property was built in 2011 and is situated on a 0.9 acre site. The ground floor consists of 10,438 square feet that is primarily leased to three restaurants, which opened between October 2013 and March 2014. Additionally, floors one through five of the Hampton Inn & Suites Brickell Property consist of the parking garage, which contains 212 parking spaces. The Hampton Inn & Suites Brickell Property is comprised of 80 standard king guestrooms, 63 standard double-queen guestrooms, 60 king suite guestrooms, 8 double-queen suite guestrooms, and 10 ADA-accessible guestrooms. The guestrooms are located on floors seven through 15. All of the communal space is located on the sixth floor of the building. Amenities include a lounge, breakfast area, fitness center, business center, an outdoor pool, a sundry shop, guest laundry room, and five meeting rooms totaling 3,795 square feet. The franchise agreement with Hilton Hotels Corporation expires in August 2031.
Operating History and Underwritten Net Cash Flow. The following table presents certain information relating to the historical operating performance and the Underwritten Net Cash Flow at the Hampton Inn & Suites Brickell Property:
Cash Flow Analysis
2012(1) | 2013 | TTM 6/30/2014 | U/W | U/W $ per Room | |||||||
| Occupancy | 66.8% | 77.6% | 78.5% | 78.5% | |||||||
| ADR | $162.14 | $176.11 | $183.59 | $183.59 | |||||||
| RevPAR | $108.33 | $136.61 | $144.04 | $144.12 | |||||||
| Total Revenue | $9,453,520 | $11,943,323 | $12,592,475 | $13,168,775(2) | $59,587 | ||||||
| Total Department Expenses | 2,193,561 | 2,635,840 | 2,922,939 | 2,853,513 | 12,912 | ||||||
| Gross Operating Profit | $7,259,959 | $9,307,483 | $9,669,536 | $10,315,261 | $46,675 | ||||||
| Total Undistributed Expenses | 2,623,029 | 3,168,452 | 3,361,045 | 3,356,643 | 15,188 | ||||||
| Profit Before Fixed Charges | $4,636,930 | $6,139,031 | $6,308,491 | $6,958,618 | $31,487 | ||||||
| Total Fixed Charges | 842,934 | 920,704 | 937,568 | 960,201 | 4,345 | ||||||
| Net Operating Income | $3,793,996 | $5,218,327 | $5,370,923 | $5,998,417 | $27,142 | ||||||
| FF&E | 465,016 | 2,104 | |||||||||
| Net Cash Flow | $3,793,996 | $5,218,327 | $5,370,923 | $5,533,402 | $25,038 | ||||||
| NOI DSCR | 1.12x | 1.54x | 1.58x | 1.77x | |||||||
| NCF DSCR | 1.12x | 1.54x | 1.58x | 1.63x | |||||||
| NOI DY | 6.9% | 9.5% | 9.8% | 10.9% | |||||||
| NCF DY | 6.9% | 9.5% | 9.8% | 10.1% | |||||||
| (1) | The Hampton Inn & Suites Brickell Property opened in September 2011. |
| (2) | U/W Total Revenue includes $480,337 of base rent and reimbursements paid by six retail tenants. Tenants accounting for 93.1% of the net retail rentable area took occupancy between October 2013 and March 2014. |
Appraisal. As of the appraisal valuation date of May 14, 2014, the Hampton Inn & Suites Brickell Property had an “as-is” appraised value of $78,000,000.
Environmental Matters. According to the Phase I environmental site assessment dated May 16, 2014, there was no evidence of any recognized environmental conditions at the Hampton Inn & Suites Brickell Property.
Market Overview and Competition. The Hampton Inn & Suites Brickell Property is located in Miami, Florida along the south side of Southwest 12th Street, bounded by Southwest 1st Avenue to the west and South Miami Avenue to the east. The Hampton Inn & Suites Brickell Property is located just south of Miami’s central business district within the heart of the Brickell financial district. According to the appraisal, the Brickell financial district is home to 28 foreign consulates and six foreign trade offices. Miami also serves as the headquarters of Latin American operations for over 1,400 multinational corporations and has the largest concentration of international banks in the United States. The Hampton Inn & Suites Brickell Property is situated eight miles southeast of the Miami International Airport, which is the United States’ third largest international port of entry for foreign air passengers and the
THE INFORMATION IN THIS STRUCTURAL AND COLLATERAL TERM SHEET IS NOT COMPLETE AND MAY BE AMENDED PRIOR TO THE TIME OF SALE. THIS TERM SHEET IS NOT AN OFFER TO SELL THESE SECURITIES AND IT IS NOT A SOLICITATION OF AN OFFER TO BUY THESE SECURITIES IN ANY JURISDICTION WHERE THE OFFER OR SALE IS NOT PERMITTED.
59
| HAMPTON INN & SUITES BRICKELL |
seventh largest in the world. The Port of Miami, located approximately three miles northeast of the Hampton Inn & Suites Brickell Property, is one of the largest and most important ports in the United States for both cargo and cruise ships.
The following table presents certain information relating to the Hampton Inn & Suites Brickell Property’s competitive set:
Subject and Market Historical Occupancy, ADR and RevPAR(1)
Competitive Set | Hampton Inn & Suites Brickell | Penetration Factor | |||||||||||||||||
Year | Occupancy | ADR | RevPAR | Occupancy | ADR | RevPAR | Occupancy | ADR | RevPAR | ||||||||||
| 6/30/2014 TTM | 79.0% | $164.33 | $129.76 | 78.5% | $183.92 | $144.30 | 99.4% | 111.9% | 111.2% | ||||||||||
| 6/30/2013 TTM | 73.9% | $168.66 | $124.72 | 74.6% | $172.50 | $128.66 | 100.9% | 102.3% | 103.2% | ||||||||||
| 6/30/2012 TTM | 73.8% | $153.77 | $113.41 | 58.8% | $166.83 | $98.11 | 79.7% | 108.5% | 86.5% | ||||||||||
| (1) | Information obtained from a third party hospitality report dated July 18, 2014. The competitive set includes the following hotels: Holiday Inn Port of Miami Downtown, Courtyard Miami Downtown Hotel Brickell, b2 Miami Downtown, Conrad Miami and aloft Hotel Miami Brickell. |
The Borrower. The borrower is Brickell Hotel Group, LLLP, a Florida limited liability limited partnership and a single purpose entity with one independent director. Legal counsel to the borrower delivered a non-consolidation opinion in connection with the origination of the Hampton Inn & Suites Brickell Mortgage Loan. The borrower is 10% owned by the general partner, Brickell SPE, LLC, and 90% owned by various limited partners. Bernard Wolfson, who owns 90% of the general partner, is the guarantor of certain nonrecourse carveouts under the Hampton Inn & Suites Brickell Mortgage Loan.
The Sponsor. The sponsor is Bernard Wolfson. Bernard Wolfson serves as the managing member of the borrower and has over 40 years of real estate experience with offices, warehouses, hotels, apartments, commercial space, and vacant land. Mr. Wolfson is the president of Hospitality Operations, Inc. Hospitality Operations, Inc. has focused on developing, owning, and managing hotels since 1994; they currently own and manage six hotels in the South Florida market, totaling 866 rooms.
Escrows. The loan documents provide for upfront escrows in the amount of $511,536 for real estate taxes. The loan documents provide for monthly escrows in the amount of $56,838 for real estate taxes, and FF&E monthly deposits amount equal to the greater of $28,472 or 3.0% of operating income for months one through 12; 3.5% for months 13 through 24; and 4.0% thereafter. The loan documents also provide for monthly tenant improvements and leasing commissions in the amount of $2,083 (subject to a cap of $100,000). The loan documents do not require monthly escrows for insurance provided (i) no event of default has occurred and is continuing; (ii) the insurance is maintained by the borrower pursuant to one or more blanket insurance policies; and (iii) the borrower provides the lender with timely proof of payment of insurance premiums.
Lockbox and Cash Management. Upon the occurrence of a Cash Trap Event Period (as defined below), the borrower will be required to establish a lender-controlled lockbox account and cause all rents to be deposited directly into such lockbox account. During a Cash Trap Event Period, all excess funds on deposit in the lockbox account are swept to a lender-controlled subaccount on a monthly basis.
A “Cash Trap Event Period” will commence upon the earlier of (i) the occurrence and continuance of an event of default; (ii) the debt service coverage ratio falling below 1.20x at the end of any calendar month; or (iii) an event of default under the franchise agreement. A Cash Trap Event Period will expire with regard to clause (i), upon the cure of such event of default; with regard to clause (ii), upon the date that the debt service coverage ratio is equal to or greater than 1.25x for two consecutive calendar quarters; and with regard to clause (iii), upon the cure of such event of default or the borrower enters into a replacement franchise agreement acceptable to lender.
Property Management. The Hampton Inn & Suites Brickell Property is managed by Hospitality America, Inc.
Assumption. The borrower has the two-time right to transfer the Hampton Inn & Suites Brickell Property provided that certain conditions are satisfied, including (i) no event of default has occurred and is continuing; (ii) the lender reasonably determines that the proposed transferee and guarantor satisfy the lender’s credit review and underwriting standards, taking into consideration transferee experience, financial strength and general business standing; and (iii) the lender has received confirmations from Fitch, KBRA and Moody’s that such assumption will not result in a downgrade, withdrawal or qualification of the respective ratings assigned to the Series 2014-C22 Certificates.
Partial Release. Not permitted.
Real Estate Substitution. Not permitted.
Subordinate and Mezzanine Indebtedness. Not permitted.
Ground Lease. None.
Terrorism Insurance. The loan documents require that the “all risk” insurance policy required to be maintained by the borrower provide coverage for terrorism in an amount equal to the full replacement cost of the Hampton Inn & Suites Brickell Property, as
THE INFORMATION IN THIS STRUCTURAL AND COLLATERAL TERM SHEET IS NOT COMPLETE AND MAY BE AMENDED PRIOR TO THE TIME OF SALE. THIS TERM SHEET IS NOT AN OFFER TO SELL THESE SECURITIES AND IT IS NOT A SOLICITATION OF AN OFFER TO BUY THESE SECURITIES IN ANY JURISDICTION WHERE THE OFFER OR SALE IS NOT PERMITTED.
60
| HAMPTON INN & SUITES BRICKELL |
well as business interruption insurance covering no less than the 18-month period following the occurrence of a casualty event, together with a six-month extended period of indemnity.
Windstorm Insurance: The loan documents require windstorm insurance covering the full replacement cost of the Hampton Inn & Suites Brickell Property during the loan term. At the time of closing, the Hampton Inn & Suites Brickell had insurance coverage for windstorm.
THE INFORMATION IN THIS STRUCTURAL AND COLLATERAL TERM SHEET IS NOT COMPLETE AND MAY BE AMENDED PRIOR TO THE TIME OF SALE. THIS TERM SHEET IS NOT AN OFFER TO SELL THESE SECURITIES AND IT IS NOT A SOLICITATION OF AN OFFER TO BUY THESE SECURITIES IN ANY JURISDICTION WHERE THE OFFER OR SALE IS NOT PERMITTED.
61
(THIS PAGE INTENTIONALLY LEFT BLANK)
62
| OFFICES AT BROADWAY STATION |
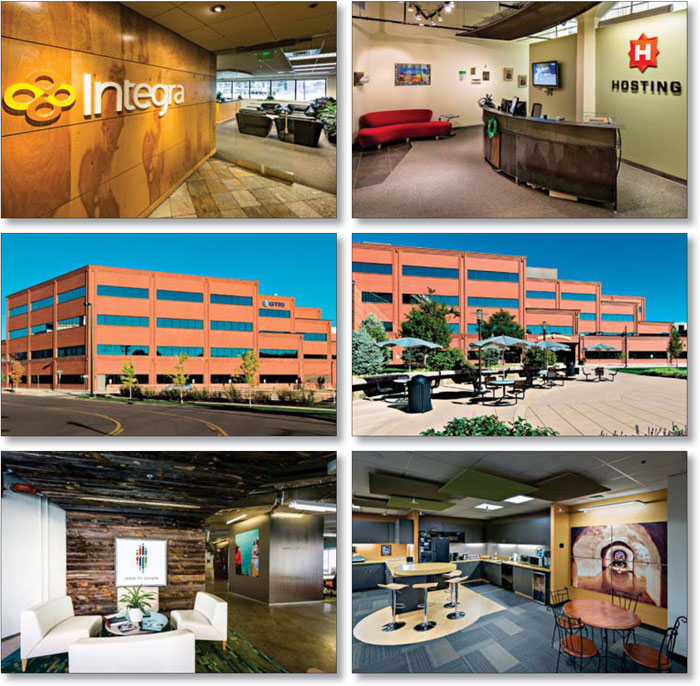
THE INFORMATION IN THIS STRUCTURAL AND COLLATERAL TERM SHEET IS NOT COMPLETE AND MAY BE AMENDED PRIOR TO THE TIME OF SALE. THIS TERM SHEET IS NOT AN OFFER TO SELL THESE SECURITIES AND IT IS NOT A SOLICITATION OF AN OFFER TO BUY THESE SECURITIES IN ANY JURISDICTION WHERE THE OFFER OR SALE IS NOT PERMITTED.
63
| OFFICES AT BROADWAY STATION |
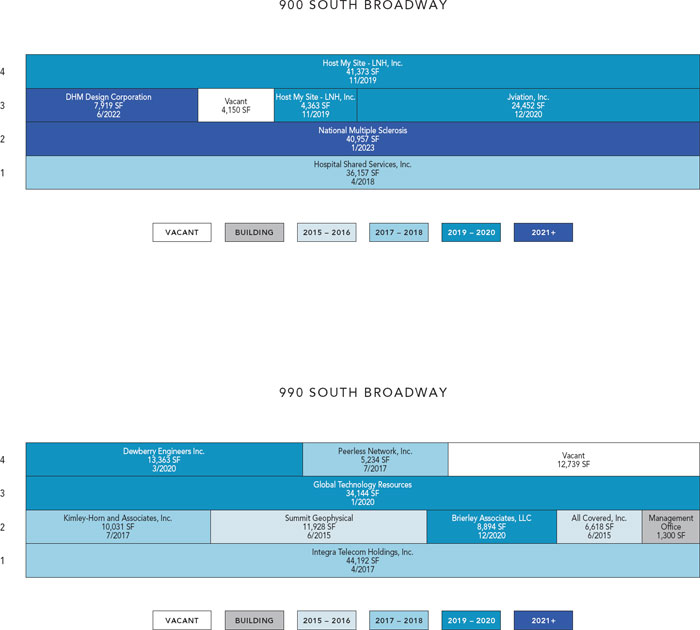
THE INFORMATION IN THIS STRUCTURAL AND COLLATERAL TERM SHEET IS NOT COMPLETE AND MAY BE AMENDED PRIOR TO THE TIME OF SALE. THIS TERM SHEET IS NOT AN OFFER TO SELL THESE SECURITIES AND IT IS NOT A SOLICITATION OF AN OFFER TO BUY THESE SECURITIES IN ANY JURISDICTION WHERE THE OFFER OR SALE IS NOT PERMITTED.
64
| OFFICES AT BROADWAY STATION |

THE INFORMATION IN THIS STRUCTURAL AND COLLATERAL TERM SHEET IS NOT COMPLETE AND MAY BE AMENDED PRIOR TO THE TIME OF SALE. THIS TERM SHEET IS NOT AN OFFER TO SELL THESE SECURITIES AND IT IS NOT A SOLICITATION OF AN OFFER TO BUY THESE SECURITIES IN ANY JURISDICTION WHERE THE OFFER OR SALE IS NOT PERMITTED.
65
| No. 5 – Offices at Broadway Station | |||||||
| Loan Information | Property Information | ||||||
| Mortgage Loan Seller: | Wells Fargo Bank, National Association | Single Asset/Portfolio: | Single Asset | ||||
Credit Assessment (Fitch/KBRA/Moody’s): | NR/NR/NR | Property Type: | Office | ||||
| Original Principal Balance: | $47,612,500 | Specific Property Type: | Suburban | ||||
| Cut-off Date Principal Balance: | $47,612,500 | Location: | Denver, CO | ||||
| % of Initial Pool Balance: | 3.2% | Size: | 318,053 SF | ||||
| Loan Purpose: | Acquisition | Cut-off Date Principal Balance Per SF: | $149.70 | ||||
| Borrower Name: | 900 South Broadway, LLC | Year Built/Renovated: | 1903/2006 | ||||
| Sponsor: | EverWest, LLC | Title Vesting: | Fee | ||||
| Mortgage Rate: | 4.230% | Property Manager: | Self-managed | ||||
| Note Date: | July 21, 2014 | 3rd Most Recent Occupancy (As of): | 88.2% (12/31/2011) | ||||
| Anticipated Repayment Date: | NAP | 2nd Most Recent Occupancy (As of): | 86.2% (12/31/2012) | ||||
| Maturity Date: | August 11, 2024 | Most Recent Occupancy (As of): | 85.5% (12/31/2013) | ||||
| IO Period: | 120 months | Current Occupancy (As of)(2): | 94.7% (7/17/2014) | ||||
| Loan Term (Original): | 120 months | ||||||
| Seasoning: | 1 month | Underwriting and Financial Information: | |||||
| Amortization Term (Original): | NAP | ||||||
| Loan Amortization Type: | Interest-only, Balloon | 3rd Most Recent NOI (As of): | $3,845,018 (12/31/2012) | ||||
| Interest Accrual Method: | Actual/360 | 2nd Most Recent NOI (As of): | $3,047,980 (12/31/2013) | ||||
| Call Protection: | L(25),D(91),O(4) | Most Recent NOI (As of): | $3,470,477 (TTM 6/30/2014) | ||||
| Lockbox Type: | Hard/Upfront Cash Management | ||||||
| Additional Debt: | None | ||||||
| Additional Debt Type: | NAP | U/W Revenues: | $8,356,744 | ||||
| U/W Expenses: | $3,691,673 | ||||||
U/W NOI(3): | $4,665,071 | ||||||
Escrows and Reserves(1): | U/W NCF(3): | $4,283,430 | |||||
| U/W NOI DSCR: | 2.28x | ||||||
| Type: | Initial | Monthly | Cap (If Any) | U/W NCF DSCR: | 2.10x | ||
| Taxes | $284,793 | $94,931 | NAP | U/W NOI Debt Yield: | 9.8% | ||
| Insurance | $0 | Springing | NAP | U/W NCF Debt Yield: | 9.0% | ||
| Replacement Reserves | $0 | $5,300 | NAP | As-Is Appraised Value: | $76,800,000 | ||
| TI/LC Reserve | $0 | $26,504 | $636,000 | As-Is Appraisal Valuation Date: | June 23, 2014 | ||
| Tenant Specific TI/LC Reserve | $45,840 | $0 | NAP | Cut-off Date LTV Ratio: | 62.0% | ||
| Rent Concession Reserve | $100,000 | $0 | NAP | LTV Ratio at Maturity or ARD: | 62.0% | ||
| (1) | See “Escrows” section. |
| (2) | See “Historical Occupancy” section. |
| (3) | See “Cash Flow Analysis” section. |
The Mortgage Loan. The mortgage loan (the “Offices at Broadway Station Mortgage Loan”) is evidenced by a single promissory note that is secured by a first mortgage encumbering two, four-story class A office buildings and a four-story parking structure totaling 318,053 square feet and located in Denver, Colorado (the “Offices at Broadway Station Property”). The Offices at Broadway Station Mortgage Loan was originated on July 21, 2014 by Wells Fargo Bank, National Association. The Offices at Broadway Station Mortgage Loan had an original principal balance of $47,612,500, has an outstanding principal balance as of the Cut-off Date of $47,612,500 and accrues interest at an interest rate of 4.230% per annum. The Offices at Broadway Station Mortgage Loan had an initial term of 120 months, has a remaining term of 119 months as of the Cut-off Date, and requires interest-only payments through the term of the Offices at Broadway Station Mortgage Loan. The Offices at Broadway Station Mortgage Loan matures on August 11, 2024.
Following the lockout period, the borrower has the right to defease the Offices at Broadway Station Mortgage Loan in whole, but not in part, on any date before May 11, 2024. In addition, the Offices at Broadway Station Mortgage Loan is prepayable without penalty on or after May 11, 2024.
THE INFORMATION IN THIS STRUCTURAL AND COLLATERAL TERM SHEET IS NOT COMPLETE AND MAY BE AMENDED PRIOR TO THE TIME OF SALE. THIS TERM SHEET IS NOT AN OFFER TO SELL THESE SECURITIES AND IT IS NOT A SOLICITATION OF AN OFFER TO BUY THESE SECURITIES IN ANY JURISDICTION WHERE THE OFFER OR SALE IS NOT PERMITTED.
66
| OFFICES AT BROADWAY STATION |
Sources and Uses
| Sources | Uses | ||||||||||
| Original loan amount | $47,612,500 | 63.7 | % | Purchase Price | $73,250,000 | 98.0 | % | ||||
| Sponsor’s new cash contribution | $27,161,677 | 36.3 | Reserves | 430,633 | 00.6 | % | |||||
| Closing costs | 1,093,544 | 01.5 | % | ||||||||
| Total Sources | $74,774,177 | 100.0 | % | Total Uses | $74,774,177 | 100.0 | % |
The Property. The Offices at Broadway Station Property is comprised of two, four-story class A office buildings and a four-story parking structure totaling 318,053 square feet of rentable area located in Denver, Colorado. The 900 South Broadway building contains 159,371 square feet of rentable area, and the 990 South Broadway building contains 148,443 square feet of rentable area. There is an additional 10,239 square feet of creative office space on the ground floor of the parking structure. The 900 South Broadway building was constructed in 1903 and renovated in 2006; the 990 Broadway building was built in 1984 and renovated in 2006; and the parking structure was built in 2009. The Offices at Broadway Station Property is situated on a 6.5-acre parcel adjacent to the Broadway Station light rail stop and contains 733 parking spaces, resulting in a parking ratio of 2.3 spaces per 1,000 square feet of rentable area. As of July 17, 2014, the Offices at Broadway Station Property was 94.7% occupied by 14 tenants. The City of Denver and the County of Denver each have a pending condemnation action against a portion of vacant land at the Offices at Broadway Station Property comprising approximately 467 square feet (the “Condemnation Parcel”)(see “Free Release” section). See “Description of the Mortgage Pool – Other Matters” in the Free Writing Prospectus.
The following table presents certain information relating to the tenancy at the Offices at Broadway Station Property:
Major Tenants
| Tenant Name | Credit Rating (Fitch/ Moody’s/ S&P) | Tenant NRSF | % of NRSF | Annual U/W Base Rent PSF(1) | Annual U/W Base Rent(1) | % of Total Annual U/W Base Rent | Lease Expiration Date | |||||||||
| Major Tenants | ||||||||||||||||
| Host My Site – LNH, Inc. | NR/NR/NR | 45,736 | 14.4% | $16.23 | $742,295 | 16.0% | 11/30/2019 | |||||||||
| Integra Telecom Holdings, Inc. | NR/NR/NR | 44,192 | 13.9% | $16.04 | $708,968 | 15.3% | 4/30/2017 | |||||||||
| National Multiple Sclerosis | NR/NR/NR | 40,957 | 12.9% | $16.50 | $675,791 | 14.5% | 1/31/2023 | |||||||||
| Global Technology Resources | NR/NR/NR | 34,144 | 10.7% | $15.00 | $512,160 | 11.0% | 1/31/2020 | |||||||||
| Hospital Shared Services, Inc. | NR/NR/NR | 36,157(2) | 11.4% | $13.56 | $490,375 | 10.6% | 4/30/2018 | |||||||||
| Total Major Tenants | 201,186 | 63.3% | $15.56 | $3,129,589 | 67.4% | |||||||||||
| Non-Major Tenants | 99,978 | 31.4% | $15.17 | $1,516,816 | 32.6% | |||||||||||
| Occupied Collateral Total | 301,164 | 94.7% | $15.43 | $4,646,405 | 100.0% | |||||||||||
| Vacant Space | 16,889 | 5.3% | ||||||||||||||
| Collateral Total | 318,053 | 100.0% | ||||||||||||||
| (1) | Annual U/W Base Rent PSF and Annual U/W Base Rent include contractual rent steps through May 2015. |
| (2) | The Worth Group subleases 7,832 square feet at a rental rate of $13.73 per square foot, triple net, on a lease that expires on May 31, 2015, and Northfield Medical, LLC subleases 260 square feet at a rental rate of $47.63 per square foot gross on a lease that expires on December 31, 2015. The Annual U/W Base Rent is based on Hospital Shared Services, Inc.’s original lease terms. |
THE INFORMATION IN THIS STRUCTURAL AND COLLATERAL TERM SHEET IS NOT COMPLETE AND MAY BE AMENDED PRIOR TO THE TIME OF SALE. THIS TERM SHEET IS NOT AN OFFER TO SELL THESE SECURITIES AND IT IS NOT A SOLICITATION OF AN OFFER TO BUY THESE SECURITIES IN ANY JURISDICTION WHERE THE OFFER OR SALE IS NOT PERMITTED.
67
| OFFICES AT BROADWAY STATION |
The following table presents certain information relating to the lease rollover schedule at the Offices at Broadway Station Property:
Lease Expiration Schedule(1)(2)
Year Ending December 31, | No. of Leases Expiring | Expiring NRSF | % of Total NRSF | Cumulative Expiring NRSF | Cumulative % of Total NRSF | Annual U/W Base Rent | Annual U/W Base Rent PSF(3) | ||||||||
MTM(4) | 1 | 1,300 | 0.4% | 1,300 | 0.4% | $0 | $0.00 | ||||||||
| 2014 | 0 | 0 | 0.0% | 1,300 | 0.4% | $0 | $0.00 | ||||||||
| 2015 | 3 | 18,546 | 5.8% | 19,846 | 6.2% | $271,572 | $14.64 | ||||||||
| 2016 | 0 | 0 | 0.0% | 19,846 | 6.2% | $0 | $0.00 | ||||||||
| 2017 | 4 | 59,457 | 18.7% | 79,303 | 24.9% | $953,208 | $16.03 | ||||||||
| 2018 | 2 | 36,157 | 11.4% | 115,460 | 36.3% | $490,375 | $13.56 | ||||||||
| 2019 | 2 | 45,736 | 14.4% | 161,196 | 50.6% | $742,295 | $16.23 | ||||||||
| 2020 | 4 | 80,853 | 25.4% | 242,049 | 76.1% | $1,251,374 | $15.48 | ||||||||
| 2021 | 0 | 0 | 0.0% | 242,049 | 76.1% | $0 | $0.00 | ||||||||
| 2022 | 2 | 18,158 | 5.7% | 260,207 | 81.8% | $261,791 | $14.42 | ||||||||
| 2023 | 1 | 40,957 | 12.9% | 301,164 | 94.7% | $675,791 | $16.50 | ||||||||
| 2024 | 0 | 0 | 0.0% | 301,164 | 94.7% | $0 | $0.00 | ||||||||
| Thereafter | 0 | 0 | 0.0% | 301,164 | 94.7% | $0 | $0.00 | ||||||||
| Vacant | 0 | 16,889 | 5.3% | 318,053 | 100.0% | $0 | $0.00 | ||||||||
| Total/Weighted Average | 19(5) | 318,053 | 100.0% | $4,646,405 | $15.43 | ||||||||||
| (1) | Information obtained from the underwritten rent roll. |
| (2) | Certain tenants may have lease termination options that are exercisable prior to the originally stated expiration date of the subject lease and that are not considered in the Lease Expiration Schedule. |
| (3) | Weighted Average Annual U/W Base Rent PSF excludes vacant space. |
| (4) | The MTM leased space is used as the management office. |
| (5) | The Offices at Broadway Station Property is leased to 14 tenants subject to 19 leases. |
The following table presents historical occupancy percentages at the Offices at Broadway Station Property:
Historical Occupancy
12/31/2011(1) | 12/31/2012(1) | 12/31/2013(1) | 7/17/2014(2)(3) | |||
| 88.2% | 86.2% | 85.5% | 94.7% |
| (1) | Information obtained from the borrower. |
| (2) | Information obtained from the underwritten rent roll. |
| (3) | Occupancy increased due to new leases signed by Dewberry Engineers Inc. (13,363 square feet), DHM Design Corporation (7,919 square feet), Peerless Network, Inc. (5,234 square feet) and Summit Geophysical (2,802 square feet). |
THE INFORMATION IN THIS STRUCTURAL AND COLLATERAL TERM SHEET IS NOT COMPLETE AND MAY BE AMENDED PRIOR TO THE TIME OF SALE. THIS TERM SHEET IS NOT AN OFFER TO SELL THESE SECURITIES AND IT IS NOT A SOLICITATION OF AN OFFER TO BUY THESE SECURITIES IN ANY JURISDICTION WHERE THE OFFER OR SALE IS NOT PERMITTED.
68
| OFFICES AT BROADWAY STATION |
Operating History and Underwritten Net Cash Flow. The following table presents certain information relating to the Underwritten Net Cash Flow at the Offices at Broadway Station Property:
Cash Flow Analysis
| 2012 | 2013 | TTM 6/30/2014 | U/W(1) | U/W $ per SF | ||||||||
| Base Rent | $3,939,169 | $3,681,503 | $3,901,629 | $4,646,405 | $14.61 | |||||||
| Grossed Up Vacant Space | 0 | 0 | 0 | 270,224 | 0.85 | |||||||
| Total Reimbursables | 2,953,973 | 3,015,461 | 3,281,299 | 3,502,340 | 11.01 | |||||||
| Other Income | 180,992 | 210,971 | 232,540 | 281,939 | 0.89 | |||||||
| Less Vacancy & Collection Loss | 0 | (286,554) | (328,682) | (344,164)(2) | (1.08) | |||||||
| Effective Gross Income | $7,074,134 | $6,621,381 | $7,086,786 | $8,356,744 | $26.27 | |||||||
| Total Operating Expenses | $3,229,116 | $3,573,401 | $3,616,309 | $3,691,673 | $11.61 | |||||||
| Net Operating Income | $3,845,018 | $3,047,980 | $3,470,477 | $4,665,071 | $14.67 | |||||||
| TI/LC | 0 | 0 | 0 | 318,030 | 1.00 | |||||||
| Capital Expenditures | 0 | 0 | 0 | 63,611 | 0.20 | |||||||
| Net Cash Flow | $3,845,018 | $3,047,980 | $3,470,477 | $4,283,430 | $13.47 | |||||||
| NOI DSCR | 1.88x | 1.49x | 1.70x | 2.28x | ||||||||
| NCF DSCR | 1.88x | 1.49x | 1.70x | 2.10x | ||||||||
| NOI DY | 8.1% | 6.4% | 7.3% | 9.8% | ||||||||
| NCF DY | 8.1% | 6.4% | 7.3% | 9.0% | ||||||||
| (1) | The increase in Base Rent, Effective Gross Income and Net Operating Income from 2013 to U/W is primarily attributable to Global Technology Resource expanding 8,720 square feet ($373,584 of U/W Base Rent), expiration of free rent periods ($262,070 of U/W Base Rent), new leases signed by Dewberry Engineers Inc. (13,363 square feet; $202,182 of U/W Base Rent), DHM Design Corporation (7,919 square feet; $128,684 of U/W Base Rent), Peerless Network, Inc. (5,234 square feet; $83,744 of U/W Base Rent), Summit Geophysical (2,802 square feet; $42,030 of U/W Base Rent) and rent steps through May 2015 ($125,665 of U/W Base Rent). |
| (2) | The underwritten economic vacancy is 7.0%. The Offices at Broadway Station Property was 94.7% physically occupied as of July 17, 2014. |
Appraisal. As of the appraisal valuation date of June 23, 2014, the Offices at Broadway Station Property had an “as-is” appraised value of $76,800,000.
Environmental Matters. According to the Phase I environmental report dated July 2, 2014, there was no evidence of any recognized environmental conditions at the Offices at Broadway Station Property.
Market Overview and Competition. The Offices at Broadway Station Property is situated at the southeast quadrant of the intersection of Interstate 25 and South Broadway, approximately three miles south of the Denver central business district and 30.0 miles southwest of Denver International Airport. South Broadway is a major arterial that passes through the Denver central business district and has a daily traffic count in excess of 41,000 vehicles. The Offices at Broadway Station Property also has frontage on Interstate 25, which has a traffic count of approximately 190,000 vehicles per day and links the states of New Mexico, Colorado and Wyoming. The Offices at Broadway Station Property is adjacent to the Broadway Station stop of the Regional Transportation District (“RTD”) light rail transit line that provides access to downtown Denver and the southeastern suburbs of Denver. RTD is in the process of expanding light rail service to the western suburbs of Denver, ending in the city of Golden, Colorado. According to the appraisal, as of year-end 2014, the population within a one-, three- and five-mile radius of the Offices at Broadway Station Property is estimated to be 13,441, 193,639 and 491,381, respectively. The estimated average household income within the same one-, three- and five-mile radius is estimated to be $89,244, $75,142 and $73,503, respectively. The population within a three-mile radius of the Offices at Broadway Station Property has increased by approximately 8.1% over the last four years.
According to the appraisal, The Offices at Broadway Station Property is located within the Colorado Boulevard/I-25 Corridor submarket. As of the first quarter of 2014, the submarket reported a total office inventory of 5.3 million square feet, representing 3.4% of the overall Denver office market. For the same period, the overall office submarket reported a 13.2% vacancy rate with average asking rents of $17.69 per square foot, full service gross, while the class A office submarket reported a 6.8% vacancy rate with average asking rents of $25.90 per square foot, full service gross. There have not been any deliveries of new space in the submarket in the past five years, and there is currently no new office space under construction.
THE INFORMATION IN THIS STRUCTURAL AND COLLATERAL TERM SHEET IS NOT COMPLETE AND MAY BE AMENDED PRIOR TO THE TIME OF SALE. THIS TERM SHEET IS NOT AN OFFER TO SELL THESE SECURITIES AND IT IS NOT A SOLICITATION OF AN OFFER TO BUY THESE SECURITIES IN ANY JURISDICTION WHERE THE OFFER OR SALE IS NOT PERMITTED.
69
| OFFICES AT BROADWAY STATION |
The following table presents certain information relating to comparable office properties for the Offices at Broadway Station Property:
Competitive Set(1)
Offices at Broadway Station (Subject) | Zang & Root Buildings | Hardware Block | Market Center | 1899 Wynkoop | 1515 Wynkoop | |
| Location | Denver, CO | Denver, CO | Denver, CO | Denver, CO | Denver, CO | Denver, CO |
| Distance from Subject | -- | 5.1 miles | 4.9 miles | 5.0 miles | 6.3 miles | 5.6 miles |
| Property Type | Office | Office | Office | Office | Office | Office |
| Year Built/Renovated | Various | 1890-1910/1985-2005 | 1910/2001 | 1890/2010 | 2000/NAV | 2008/NAP |
| Stories | 3 | 3 | 4 | 4 | 9 | 7 |
| Total GLA | 318,053 SF | 92,175 SF | 52,125 SF | 117,488 SF | 165,616 SF | 306,791 SF |
| Total Occupancy | 95% | 90% | 100% | 93% | 92% | 90% |
| (1) | Information obtained from the appraisal and a third party market research report. |
The Borrower. The borrower is 900 South Broadway, LLC, a single purpose entity with one independent director. Legal counsel to the borrower delivered a non-consolidation opinion in connection with the origination of the Offices at Broadway Station Mortgage Loan. EverWest, LLC is the guarantor of certain nonrecourse carveouts under the Offices at Broadway Station Mortgage Loan.
The Sponsor. The sponsor is EverWest LLC, formerly known as Alliance Capital Partners (“Alliance”). Founded in 1997 and headquartered in Denver, Colorado, Alliance is a privately held real estate operating and investment company with a management team containing over 100 years of combined commercial real estate experience. As of July 2014, Alliance’s commercial real estate portfolio comprised 30 office, industrial, retail and multifamily properties located in 10 states and totaling approximately 5.2 million square feet. Alliance and its affiliates have been involved with multiple loan workouts related to commercial and residential real estate investments. See “Description of the Mortgage Pool – Prior Default History, Bankruptcy Issues and Other Proceedings” in the Free Writing Prospectus.
Escrows. The loan documents provide for upfront escrows in the amount of $284,793 for real estate taxes, $45,840 for tenant improvements and leasing commissions (“TI/LCs”) associated with the Peerless Network, Inc. space and $100,000 for rent credits associated with the following tenants: Dewberry Engineers, Inc. ($55,000), Peerless Network, Inc. ($33,500) and Summit Geophysical ($11,500). The loan documents require ongoing monthly escrows in the amount of $94,931 for real estate taxes, $5,300 for replacement reserves and $26,504 for general TI/LCs (subject to a cap of $636,000). Until the earlier of (i) December 31, 2019 or (ii) the completion of the tenant improvements related to the National Multiple Sclerosis space, the initial $204,785 accumulated in the TI/LC reserve will only be available for disbursement in connection with TI/LCs for the National Multiple Sclerosis space. The loan documents do not require monthly escrows for insurance provided (i) no event of default has occurred and is continuing; (ii) the insurance required to be maintained by the borrower is maintained pursuant to one or more blanket insurance polices; and (iii) the borrower provides the lender with timely proof of payment of insurance premiums.
Lockbox and Cash Management. The Offices at Broadway Station Mortgage Loan requires a lender-controlled lockbox account, which is already in place, and that the borrower directs tenants to pay their rents directly into such lockbox account. The loan documents also require that all rents received by the borrower or the property manager be deposited into the lockbox account within one business day of receipt. Funds are then swept into a cash management account controlled by the lender and prior to the occurrence of a Cash Trap Event Period (as defined below), all excess funds after application in accordance with the loan documents are distributed to the borrower’s operating account. During a Cash Trap Event Period, all excess cash flow is retained in the cash management account.
A “Cash Trap Event Period” will commence upon the earlier of (i) the occurrence and continuance of an event of default or (ii) the debt service coverage ratio being less than 1.57x at the end of any calendar month. A Cash Trap Event Period will end, with regard to clause (i), upon the cure of such event of default; and with regard to clause (ii), upon the debt service coverage ratio being equal to or greater than 1.57x for two consecutive calendar quarters.
Property Management. The Offices at Broadway Station Property is managed by an affiliate of the borrower.
Assumption. The borrower has a two-time right to transfer the Offices at Broadway Station Property, provided that no event of default has occurred and is continuing and certain other conditions are satisfied, including (i) the lender’s reasonable determination that the proposed transferee and guarantor satisfy the lender’s credit review and underwriting standards, taking into consideration transferee’s experience, financial strength and general business standing; (ii) execution of a recourse guaranty and an environmental indemnity by an affiliate of the transferee; and (iii) if requested by the lender, rating agency confirmation from Fitch, KBRA and Moody’s that the transfer will not result in a downgrade, withdrawal or qualification of the respective ratings assigned to the Series 2014-C22 Certificates.
Partial Release. Not permitted.
THE INFORMATION IN THIS STRUCTURAL AND COLLATERAL TERM SHEET IS NOT COMPLETE AND MAY BE AMENDED PRIOR TO THE TIME OF SALE. THIS TERM SHEET IS NOT AN OFFER TO SELL THESE SECURITIES AND IT IS NOT A SOLICITATION OF AN OFFER TO BUY THESE SECURITIES IN ANY JURISDICTION WHERE THE OFFER OR SALE IS NOT PERMITTED.
70
| OFFICES AT BROADWAY STATION |
Free Release. Provided no event of default exists, the borrower is permitted to release a certain vacant parcel of land (the “Free Release Parcel”) from the lien of the Offices at Broadway Station Mortgage Loan, provided that the loan-to-value ratio immediately following the release is less than or equal to 65.0%. No value has been attributed to nor has any income been underwritten attributed to the Free Release parcel. In addition, the borrower is permitted to a free release of a separate Condemnation Parcel when required by the condemning agency (see “The Property” section).
Real Estate Substitution. Not permitted.
Subordinate and Mezzanine Indebtedness. Not permitted.
Ground Lease. None.
Terrorism Insurance. The loan documents require that the “all risk” insurance policy required to be maintained by the borrower provide coverage for terrorism in an amount equal to the full replacement cost of the Offices at Broadway Station Property, as well as business interruption insurance covering no less than the 18-month period following the occurrence of a casualty event, together with a six-month extended period of indemnity.
THE INFORMATION IN THIS STRUCTURAL AND COLLATERAL TERM SHEET IS NOT COMPLETE AND MAY BE AMENDED PRIOR TO THE TIME OF SALE. THIS TERM SHEET IS NOT AN OFFER TO SELL THESE SECURITIES AND IT IS NOT A SOLICITATION OF AN OFFER TO BUY THESE SECURITIES IN ANY JURISDICTION WHERE THE OFFER OR SALE IS NOT PERMITTED.
71
| CSM BAKERY SUPPLIES PORTFOLIO I |
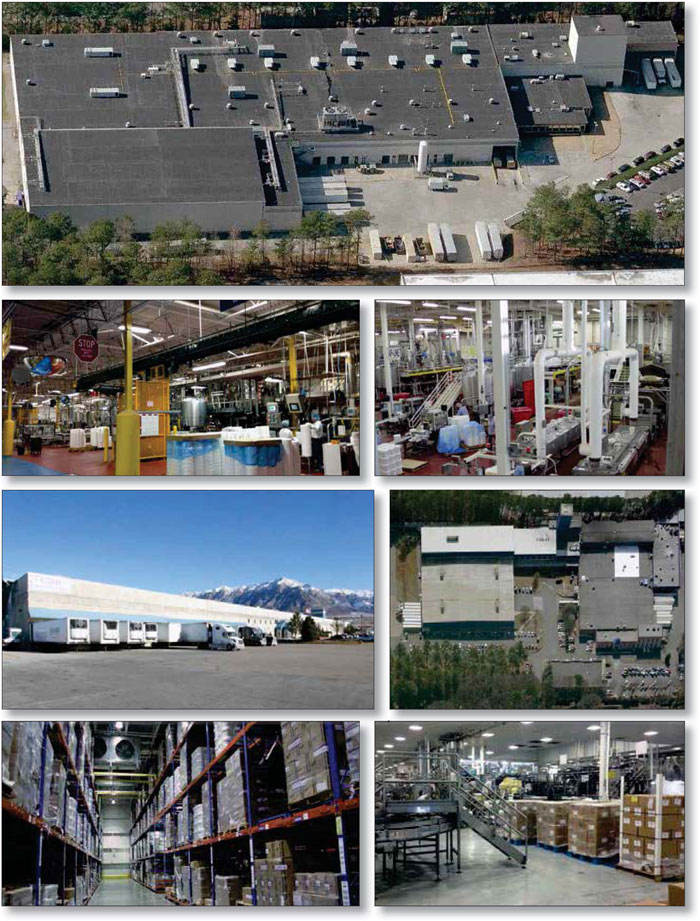
THE INFORMATION IN THIS STRUCTURAL AND COLLATERAL TERM SHEET IS NOT COMPLETE AND MAY BE AMENDED PRIOR TO THE TIME OF SALE. THIS TERM SHEET IS NOT AN OFFER TO SELL THESE SECURITIES AND IT IS NOT A SOLICITATION OF AN OFFER TO BUY THESE SECURITIES IN ANY JURISDICTION WHERE THE OFFER OR SALE IS NOT PERMITTED.
72
| CSM BAKERY SUPPLIES PORTFOLIO I |
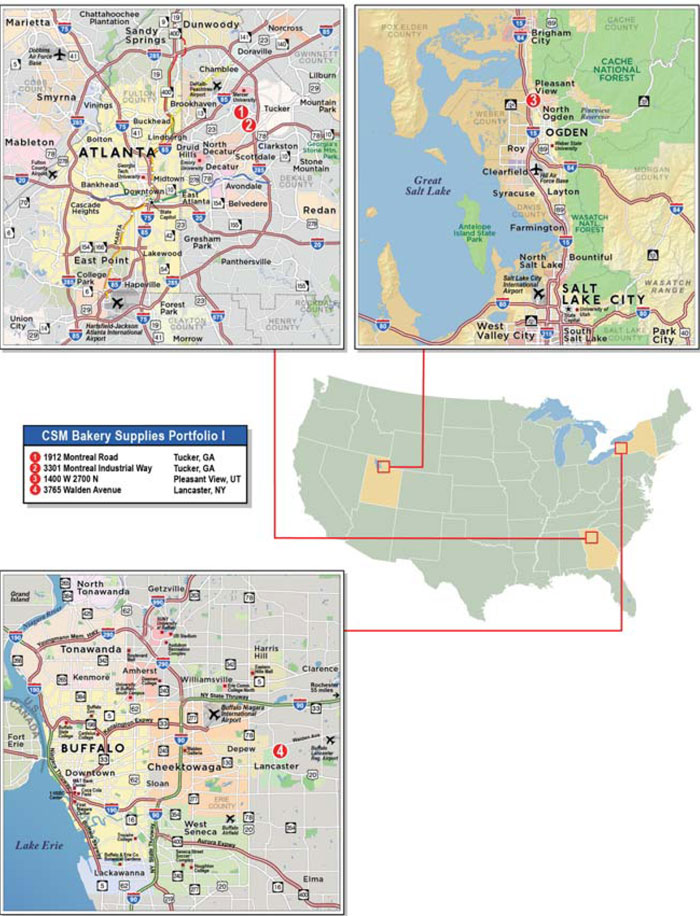
THE INFORMATION IN THIS STRUCTURAL AND COLLATERAL TERM SHEET IS NOT COMPLETE AND MAY BE AMENDED PRIOR TO THE TIME OF SALE. THIS TERM SHEET IS NOT AN OFFER TO SELL THESE SECURITIES AND IT IS NOT A SOLICITATION OF AN OFFER TO BUY THESE SECURITIES IN ANY JURISDICTION WHERE THE OFFER OR SALE IS NOT PERMITTED.
73
| No. 6 – CSM Bakery Supplies Portfolio I | ||||||
| Loan Information | Property Information | |||||
| Mortgage Loan Seller: | The Royal Bank of Scotland | Single Asset/Portfolio: | Portfolio | |||
| Credit Assessment (Fitch/KBRA/Moody’s): | NR/NR/NR | Property Type: | Industrial | |||
| Original Principal Balance: | $44,557,500 | Specific Property Type: | Warehouse | |||
| Cut-off Date Principal Balance: | $44,557,500 | Location: | Various – See Table | |||
| % of Initial Pool Balance: | 3.0% | Size: | 684,768 SF | |||
| Loan Purpose: | Acquisition | Cut-off Date Principal Balance Per Unit/SF: | $65.07 | |||
| Borrower Name: | AGNL Pastry, L.L.C. | Year Built/Renovated: | Various – See Table | |||
| Sponsor: | AG Net Lease Realty Fund III, L.P. | Title Vesting: | Fee | |||
| Mortgage Rate: | 4.563% | Property Manager: | Self-managed | |||
| Note Date: | August 21, 2014 | 3rd Most Recent Occupancy(3): | NAV | |||
| Anticipated Repayment Date: | September 6, 2024 | 2nd Most Recent Occupancy(3): | NAV | |||
| Maturity Date: | September 6, 2044 | Most Recent Occupancy(3): | NAV | |||
| IO Period: | 60 months | Current Occupancy (As of): | 100.0% (9/1/2014) | |||
| Loan Term (Original): | 120 months | |||||
| Seasoning: | 0 month | Underwriting and Financial Information: | ||||
| Amortization Term (Original): | 360 months | |||||
| Loan Amortization Type: | Interest-only, Amortizing ARD | 3rd Most Recent NOI (As of)(3): | NAV | |||
| Interest Accrual Method: | Actual/360 | 2nd Most Recent NOI (As of)(3): | NAV | |||
| Call Protection: | L(24),GRTR 1% or YM(89),O(7) | Most Recent NOI (As of)(3): | NAV | |||
| Lockbox Type: | Hard/Springing Cash Management | |||||
Additional Debt(1): | Yes | U/W Revenues: | $4,556,495 | |||
Additional Debt Type(1): | Future Mezzanine | U/W Expenses: | $136,695 | |||
| U/W NOI: | $4,419,800 | |||||
| U/W NCF: | $4,118,411 | |||||
U/W NOI DSCR : | 1.62x | |||||
Escrows and Reserves(2): | U/W NCF DSCR: | 1.51x | ||||
| U/W NOI Debt Yield: | 9.9% | |||||
| Type: | Initial | Monthly | Cap (If Any) | U/W NCF Debt Yield: | 9.2% | |
| Taxes | $0 | Springing | NAP | As-Is Appraised Value: | $68,450,000 | |
| Insurance | $0 | Springing | NAP | As-Is Appraisal Valuation Date(4): | Various | |
| Capital Expense Reserves | $0 | Springing | $875,000 | Cut-off Date LTV Ratio: | 65.1% | |
| TI/LC | $0 | Springing | $2,000,000 | LTV Ratio at Maturity or ARD: | 59.6% | |
| (1) | See “Mezzanine and Subordinate Indebtedness” section. |
| (2) | See “Escrows” section. |
| (3) | Historical occupancy and historical financial data is not available as the CSM Bakery Supplies Portfolio I was acquired in a sale-leaseback transaction in August, 2014. |
| (4) | See “Appraisal” section. |
The Mortgage Loan. The mortgage loan (the “CSM Bakery Supplies Portfolio I Mortgage Loan”) is evidenced by a single promissory note that is secured by a first mortgage encumbering four industrial warehouse buildings located in Georgia, Utah and New York (the “CSM Bakery Supplies Portfolio I Properties”). The CSM Bakery Supplies Portfolio I Mortgage Loan was originated on August 22, 2014 by The Royal Bank of Scotland. The CSM Bakery Supplies Portfolio I Mortgage Loan had an original principal balance of $44,557,500, has an outstanding principal balance as of the Cut-off Date of $44,557,500 and accrues interest at an interest rate of 4.563% per annum. The CSM Bakery Supplies Portfolio I Mortgage Loan had an initial term of 120 months, has a remaining term of 120 months as of the Cut-off Date and requires interest-only payments for the first 60 months following origination and, thereafter, requires payments of principal and interest based on a 30-year amortization schedule through the Anticipated Repayment Date (“ARD”). The ARD is September 6, 2024 and the final maturity date is September 6, 2044. In the event the CSM Bakery Supplies Portfolio I Mortgage Loan is not paid in full on or before the ARD, the CSM Bakery Supplies Portfolio I Mortgage Loan will accrue interest at an interest rate equal to the greater of (i) the initial interest rate plus 3.000% and (ii) the treasury rate plus 3.000% points per annum and will have a remaining term of 240 months. The occurrence of the ARD without the repayment of the CSM Bakery Supplies Portfolio I Mortgage Loan automatically triggers a full cash flow sweep whereby all excess cash flow will be used to pay down the outstanding principal balance.
Following the lockout period, the borrower has the right to prepay the CSM Bakery Supplies Portfolio I Mortgage Loan in whole or in part (see “Partial Release” section) on any date before March 6, 2024, provided that the borrower pays the greater of a yield maintenance premium or a prepayment premium equal to 1.0% of the principal amount being prepaid. In addition, the CSM Bakery Supplies Portfolio I Mortgage Loan is prepayable without penalty on or after March 6, 2024.
THE INFORMATION IN THIS STRUCTURAL AND COLLATERAL TERM SHEET IS NOT COMPLETE AND MAY BE AMENDED PRIOR TO THE TIME OF SALE. THIS TERM SHEET IS NOT AN OFFER TO SELL THESE SECURITIES AND IT IS NOT A SOLICITATION OF AN OFFER TO BUY THESE SECURITIES IN ANY JURISDICTION WHERE THE OFFER OR SALE IS NOT PERMITTED.
74
| CSM BAKERY SUPPLIES PORTFOLIO I |
Sources and Uses
| Sources | Uses | |||||||
| Original loan amount | $44,557,500 | 64.6% | Purchase price | $68,518,725 | 99.4% | |||
| Sponsor’s new cash contribution | 24,384,075 | 35.4 | Closing Costs | 422,851 | 0.6 | |||
| Total Sources | $68,941,575 | 100.0% | Total Uses | $68,941,575 | 100.0% |
The Properties. The CSM Bakery Supplies Portfolio I Properties is comprised of four industrial warehouse properties totaling 684,768 square feet located in Georgia, Utah and New York. The CSM Bakery Supplies Portfolio I Properties range in size from 129,511 square feet to 247,678 square feet. The CSM Bakery Supplies Portfolio I Properties are generally comprised of 62.6% warehouse space, 27.7% cold warehouse space and 9.7% office space. All of the CSM Bakery Supplies Portfolio I Properties are leased under a single 15-year lease by CSM Bakery Products NA Inc. (“CSM Bakery Supplies”), and as of September 1, 2014, the CSM Bakery Supplies Portfolio I Properties were 100.0% occupied. In most cases, CSM Bakery Supplies or a predecessor company have occupied the CSM Bakery Supplies Portfolio I Properties since construction and are considered to be mission critical locations by CSM, CSM Bakery Supplies’ parent company. The leases at the CSM Bakery Supplies Portfolio I Properties are cross-defaulted with the leases at the CSM Bakery Supplies Portfolio II Properties; however, the CSM Bakery Supplies Portfolio I Mortgage Loan is not cross-defaulted with the CSM Bakery Supplies Portfolio II Mortgage Loan, which will also be contributed to the WFRBS 2014-C22 Trust.
CSM Bakery Supplies, a wholly-owned subsidiary of Amsterdam-based CSM, is a large supplier and a leading global producer of bakery products worldwide and offers a wide variety of products including ingredients, semi-finished, frozen, almost-ready, and ready-made food products. CSM has operations in Europe, Africa, North America, Latin America and Asia. CSM operates in 60 locations with over 9,500 employees worldwide. The North American division, Bakery Supplies North America (“BSNA”), is active in the U.S., Canada, and Latin America. BSNA develops, produces and sells a wide selection of bakery ingredients and products to professional bakeries, top consumer food companies, grocers and retailers. For the 2013 fiscal year, based on company filings CSM generated net sales of approximately €2.50 billion. The company was acquired in 2013 by Rhône Capital for an enterprise value of €1.05 billion.
The following table presents certain information relating to the CSM Bakery Supplies Portfolio I Properties:
| Location (City, State) | Specific Property Type | Allocated Cut- off Date Principal Balance | % of Portfolio Cut-off Date Principal Balance | Current Occupancy | Year Built/ Renovated | Net Rentable Area (SF) | Appraised Value | ||||||||||||
| Tucker, Georgia | Warehouse | $13,520,000 | 30.3% | 100.0% | 1967/NAP | 247,678 | $20,700,000 | ||||||||||||
| Tucker, Georgia | Warehouse | $12,350,000 | 27.7% | 100.0% | 2000/NAP | 169,844 | $19,000,000 | ||||||||||||
| Pleasant View, Utah | Warehouse | $10,497,500 | 23.6% | 100.0% | 2008/NAP | 137,735 | $16,150,000 | ||||||||||||
| Lancaster, New York | Warehouse | $8,190,000 | 18.4% | 100.0% | 1971/1991 | 129,511 | $12,600,000 | ||||||||||||
| Total/Weighted Average | $44,557,500 | 100.0% | 100.0% | 684,768 | $68,450,000 | ||||||||||||||
The following table presents certain information relating to the tenancy at the CSM Bakery Supplies Portfolio I Properties:
Major Tenants
| Tenant Name | Credit Rating (Fitch/Moody’s/ S&P) | Tenant NRSF | % of NRSF | Annual U/W Base Rent PSF | Annual U/W Base Rent | % of Total Annual U/W Base Rent | Lease Expiration Date | ||||||
| Major Tenants | |||||||||||||
| CSM Bakery Products NA, Inc. | NR/NR/NR | 684,768 | 100.0% | $7.00 | $4,796,311 | 100.0% | 6/1/2029 | ||||||
| Occupied Collateral Total | 684,768 | 100.0% | $7.00 | $4,796,311 | 100.0% | ||||||||
THE INFORMATION IN THIS STRUCTURAL AND COLLATERAL TERM SHEET IS NOT COMPLETE AND MAY BE AMENDED PRIOR TO THE TIME OF SALE. THIS TERM SHEET IS NOT AN OFFER TO SELL THESE SECURITIES AND IT IS NOT A SOLICITATION OF AN OFFER TO BUY THESE SECURITIES IN ANY JURISDICTION WHERE THE OFFER OR SALE IS NOT PERMITTED.
75
| CSM BAKERY SUPPLIES PORTFOLIO I |
The following table presents certain information relating to the lease rollover schedule at the CSM Bakery Supplies Portfolio I Properties:
Lease Expiration Schedule(1)
Year Ending December 31, | No. of Leases Expiring | Expiring NRSF | % of Total NRSF | Cumulative Expiring NRSF | Cumulative % of Total NRSF | Annual U/W Base Rent | Annual U/W Base Rent PSF | ||||||||
| MTM | 0 | 0 | 0.0% | 0 | 0.0% | $0 | $0.00 | ||||||||
| 2014 | 0 | 0 | 0.0% | 0 | 0.0% | $0 | $0.00 | ||||||||
| 2015 | 0 | 0 | 0.0% | 0 | 0.0% | $0 | $0.00 | ||||||||
| 2016 | 0 | 0 | 0.0% | 0 | 0.0% | $0 | $0.00 | ||||||||
| 2017 | 0 | 0 | 0.0% | 0 | 0.0% | $0 | $0.00 | ||||||||
| 2018 | 0 | 0 | 0.0% | 0 | 0.0% | $0 | $0.00 | ||||||||
| 2019 | 0 | 0 | 0.0% | 0 | 0.0% | $0 | $0.00 | ||||||||
| 2020 | 0 | 0 | 0.0% | 0 | 0.0% | $0 | $0.00 | ||||||||
| 2021 | 0 | 0 | 0.0% | 0 | 0.0% | $0 | $0.00 | ||||||||
| 2022 | 0 | 0 | 0.0% | 0 | 0.0% | $0 | $0.00 | ||||||||
| 2023 | 0 | 0 | 0.0% | 0 | 0.0% | $0 | $0.00 | ||||||||
| 2024 | 0 | 0 | 0.0% | 0 | 0.0% | $0 | $0.00 | ||||||||
| Thereafter | 1 | 684,768 | 100.0% | 684,768 | 100.0% | $4,796,311 | $7.00 | ||||||||
| Vacant | 0 | 0 | 0.0% | 684,768 | 100.0% | $0 | $0.00 | ||||||||
| Total/Weighted Average | 1 | 684,768 | 100.0% | $4,796,311 | $7.00 | ||||||||||
| (1) | Information obtained from the underwritten rent roll. |
The following table presents historical occupancy percentages at the CSM Bakery Supplies Portfolio I Properties:
Historical Occupancy(1)
9/1/2014(2) |
| 100.0% |
| (1) | Historical occupancy is unavailable because this transaction constitutes a sale-leaseback. In most cases, CSM Bakery Supplies or a predecessor company occupied the CSM Bakery Supplies Portfolio I Properties since construction. |
| (2) | Information obtained from the underwritten rent roll. |
Operating History and Underwritten Net Cash Flow. The following table presents certain information relating to the in-place operating performance and the Underwritten Net Cash Flow at the CSM Bakery Supplies Portfolio I Properties:
Cash Flow Analysis(1)
| In-Place | U/W | U/W $ per SF | |||||
| Base Rent | $4,796,311 | $4,796,311 | $7.00 | ||||
| Grossed Up Vacant Space | 0 | 0 | 0.00 | ||||
| Total Reimbursables | 0 | 0 | 0.00 | ||||
| Other Income | 0 | 0 | 0.00 | ||||
| Less Vacancy & Credit Loss | 0 | (239,816)(2) | (0.35) | ||||
| Effective Gross Income | $4,796,311 | $4,556,495 | $6.65 | ||||
| Total Operating Expenses | $0 | $136,695 | $0.20 | ||||
| Net Operating Income | $4,796,311 | $4,419,800 | $6.45 | ||||
| TI/LC | 0 | 198,674 | 0.29 | ||||
| Capital Expenditures | 0 | 102,715 | 0.15 | ||||
| Net Cash Flow | $4,796,311 | $4,118,411 | $6.01 | ||||
| NOI DSCR | 1.76x | 1.62x | |||||
| NCF DSCR | 1.76x | 1.51x | |||||
| NOI DY | 10.8% | 9.9% | |||||
| NCF DY | 10.8% | 9.2% |
| (1) | No historical financial information is available as the sponsor purchased the CSM Bakery Supplies Portfolio I Properties in August, 2014 in a sale-leaseback transaction. |
| (2) | The underwritten economic vacancy is 5.0%. The CSM Bakery Supplies Portfolio I Properties were 100.0% physically occupied as of September 1, 2014. |
THE INFORMATION IN THIS STRUCTURAL AND COLLATERAL TERM SHEET IS NOT COMPLETE AND MAY BE AMENDED PRIOR TO THE TIME OF SALE. THIS TERM SHEET IS NOT AN OFFER TO SELL THESE SECURITIES AND IT IS NOT A SOLICITATION OF AN OFFER TO BUY THESE SECURITIES IN ANY JURISDICTION WHERE THE OFFER OR SALE IS NOT PERMITTED.
76
| CSM BAKERY SUPPLIES PORTFOLIO I |
Appraisal. As of the appraisal valuation dates ranging from June 11, 2014 to June 18, 2014, the CSM Bakery Supplies Portfolio I Properties had an aggregate “as-is” appraised value of $68,450,000.
Environmental Matters. According to the Phase I environmental site assessments dated August 6, 2014, there was no evidence of any recognized environmental conditions at the CSM Bakery Supplies Portfolio I Properties.
Market Overview. The CSM Bakery Supplies Portfolio I Properties are located in Tucker, Georgia (2); Pleasant View, Utah; and Lancaster, New York.
The two Tucker, Georgia properties are located approximately 14 miles northeast of the Atlanta central business district. According to the appraisal, the Tucker properties are located within the Atlanta industrial market and Northeast industrial submarket. The Northeast Atlanta industrial submarket had a vacancy rate of 9.5% and average net asking rents of $3.94 per square foot as of the first quarter of 2014. The city of Atlanta has 10 Fortune 500 headquartered firms, which places Atlanta fourth among cities in the United States behind New York, Houston, and Dallas. Furthermore, more than 700 Fortune 1,000 companies have local operations in Atlanta, and of these companies, 20 are headquartered in Atlanta. Atlanta’s Hartsfield International Airport is a major cargo center, and international air cargo traffic through Hartsfield grew by 111% during the past decade.
The Pleasant View, Utah property is located approximately 47 miles north of the Salt Lake City central business district. According to the appraisal, the Pleasant View property is located near the Airport industrial submarket of the Salt Lake City industrial market. The Airport industrial submarket had a vacancy of 5.8% and average net asking rents of $4.80 per square foot as of the first quarter 2014.
The Lancaster, New York property is located approximately 12 miles east of the Buffalo central business district. According to the appraisal, the Lancaster property is located in Buffalo’s East Industrial submarket. The East Industrial submarket had a vacancy of 6.8% and average net asking rents of $6.80 per square foot as of the first quarter 2014.
The Borrower. The borrower is AGNL Pastry, L.L.C., a single purpose entity with two independent directors. The borrower is ultimately controlled by AG Net Lease III Corp and AG Net Lease III (SO) Corp, the guarantors of certain nonrecourse carveouts under the CSM Bakery Supplies Portfolio I Mortgage Loan.
The Sponsor. The sponsor is AG Net Lease Realty Fund III, L.P. (“AG Net Lease”), a subsidiary of Angelo, Gordon & Co. AG Net Lease is a real estate investment firm that focuses on the management, acquisition, financing, disposition, leasing and construction of commercial real estate throughout North America and select international markets. AG Net Lease was founded in 1993 and has acquired over $13 billion of properties with transactions ranging from $5.0 million to $200.0 million.
Escrows. Monthly tax, insurance, replacement and TI/LC reserves are not required as long as no Cash Management Period (as defined below) has occurred and is continuing.
Lockbox and Cash Management. The CSM Bakery Supplies Portfolio I Mortgage Loan requires a lender-controlled lockbox account, which is already in place, and that the borrower directs tenants to pay their rents directly to such lockbox account. The loan documents also require that all cash revenues and all other monies received by the borrower or manager be deposited into the lockbox account within one business day after receipt. Prior to the occurrence of a Cash Management Period (as defined below), all funds on deposit in the lockbox account are swept into the borrower’s operating account. During a Cash Management Period, all funds on deposit in the lockbox account are swept to a lender-controlled cash management account.
A “Cash Management Period” will commence (i) if an event of default has occurred and is continuing; (ii) if the amortizing debt service coverage ratio is less than 1.25x; (iii) with the commencement of a Lease Sweep Period (as defined below); or (iv) with the making of any approved mezzanine loan. A Cash Management Period will end, with respect to clause (i) with the cure of such event of default; with respect to clause (ii) upon the achievement of an amortizing debt service coverage ratio of 1.25x for two consecutive calendar quarters; and with respect to clause (iii) when such Lease Sweep Period has ended.
A “Lease Sweep Period” will commence on the first payment date under the CSM Bakery Supplies Portfolio I Mortgage Loan following the occurrence of any of the following: (i) any Major Lease (as defined below) at any of the CSM Bakery Supplies Portfolio I Properties is surrendered, cancelled or terminated prior to its then current expiration date; (ii) if any tenant under a Major Lease discontinues its business at the premises; (iii) upon the occurrence of an insolvency proceeding by any tenant under a Major Lease. A Lease Sweep Period will end, with respect to clause (i) the date on which such space has been fully leased pursuant to a replacement lease and all associated expenses have been paid in full; with respect to clause (ii) when the tenant under the Major Lease commences operations again at its premises in accordance with the terms of the Major Lease; and with respect to clause (iii) if the applicable insolvency proceeding regarding the tenant under the applicable Major Lease has terminated and the applicable Major Lease has been affirmed, assumed or assigned in accordance with the applicable bankruptcy code.
A “Major Lease” is defined as the CSM Bakery Supplies lease and any other lease entered into which demises more than 20% of the leasable area of any of the CSM Bakery Supplies Portfolio I Properties.
Property Management. The CSM Bakery Supplies Portfolio I Properties are managed by the tenant under the CSM lease.
Assumption. The CSM Bakery Supplies Portfolio I Mortgage Loan borrower has the right to transfer all, but not less than all, of the CSM Bakery Supplies Portfolio I Properties, subject to customary conditions set forth in the loan documents, including but not limited to: (i) no event of default has occurred and is continuing; (ii) the proposed transferee, property manager and management
THE INFORMATION IN THIS STRUCTURAL AND COLLATERAL TERM SHEET IS NOT COMPLETE AND MAY BE AMENDED PRIOR TO THE TIME OF SALE. THIS TERM SHEET IS NOT AN OFFER TO SELL THESE SECURITIES AND IT IS NOT A SOLICITATION OF AN OFFER TO BUY THESE SECURITIES IN ANY JURISDICTION WHERE THE OFFER OR SALE IS NOT PERMITTED.
77
| CSM BAKERY SUPPLIES PORTFOLIO I |
agreement are satisfactory to the lender and applicable rating agencies; (iii) the anticipated repayment date has not occurred; and (iv) the lender has received confirmation from Fitch, KBRA and Moody’s that such assumption will not result in a downgrade, withdrawal or qualification of the then current ratings assigned to the Series 2014-C22 Certificates.
Partial Release. On any payment date, the borrower may obtain the release of an individual property from the lien of the related mortgage (and the related loan documents) in connection with a partial release upon the satisfaction of certain conditions including but not limited to: (i) the property to be released must be the subject of a sale to a bona fide third party purchaser who is neither a Restricted Party (as defined below) nor an affiliate of a Restricted Party; (ii) the borrower will provide the lender a written request at least 20 days prior to the proposed release date; (iii) no event of default has occurred or is continuing at the time that the release occurs; (iv) prepayment by the borrower in an amount equal to 110% of the allocated loan amount for the individual property to be released, along with any applicable yield maintenance or prepayment premium; (v) after such release, the amortizing debt service coverage ratio of the remaining properties must not be less than the greater of (x) the amortizing debt service coverage ratio immediately preceding such release and (y) 1.63x; (vi) after such release, the loan to value ratio of the remaining properties must not be greater than the lesser of (x) the loan to value ratio immediately preceding such release and (y) 65.0%.
A “Restricted Party” means the borrower, any principal or the guarantor or any affiliate thereof under the CSM Bakery Supplies Portfolio I Mortgage Loan.
Real Estate Substitution. The substitution of one or more of the CSM Bakery Supplies Portfolio I Properties is permitted following the lockout period subject to (i) the aggregate sum of all allocated loan amounts for all substituted properties cannot exceed 25% of the loan amount; (ii) receipt of rating agency confirmation from Fitch, KBRA and Moody’s that such substitution will not result in a downgrade of any of the Series 2014-C22 Certificates; (iii) substitution collateral must have rent at or higher than the CSM Bakery Supplies lease being substituted; (iv) after such substitution, the amortizing debt service coverage ratio must not be less than 1.63x; (v) after such substitution, the loan to value ratio must not be greater than 65.0%.
Subordinate and Mezzanine Indebtedness. There is no existing mezzanine debt related to the CSM Bakery Supplies Portfolio I Mortgage Loan. However, future mezzanine debt is permitted subject to satisfaction of certain conditions, including (i) execution of an intercreditor agreement in form and substance acceptable to Fitch, KBRA and Moody’s and reasonably acceptable to the lender; (ii) the combined debt service coverage ratio is not less than 1.20x; (iii) the combined loan-to-value ratio will not be greater than 72.5%; (iv) the combined debt yield is not less than 8.5%; and (v) mezzanine loan documents acceptable to Fitch, KBRA and Moody’s and reasonably acceptable to the lender have been delivered to the lender.
Ground Lease. None.
Terrorism Insurance. The loan documents require that the “all risk” insurance policy required to be maintained by the borrower provide coverage for terrorism in an amount equal to the full replacement cost of the CSM Bakery Supplies Portfolio I Properties. The loan documents also require business interruption insurance covering no less than the 18-month period following the occurrence of a casualty event.
THE INFORMATION IN THIS STRUCTURAL AND COLLATERAL TERM SHEET IS NOT COMPLETE AND MAY BE AMENDED PRIOR TO THE TIME OF SALE. THIS TERM SHEET IS NOT AN OFFER TO SELL THESE SECURITIES AND IT IS NOT A SOLICITATION OF AN OFFER TO BUY THESE SECURITIES IN ANY JURISDICTION WHERE THE OFFER OR SALE IS NOT PERMITTED.
78
(THIS PAGE INTENTIONALLY LEFT BLANK)
79
| U-HAUL PORTFOLIO |
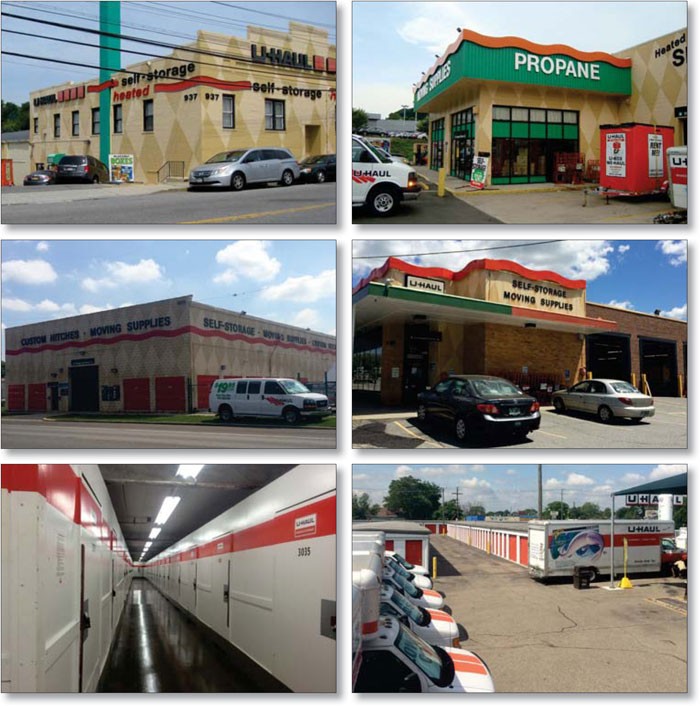
THE INFORMATION IN THIS STRUCTURAL AND COLLATERAL TERM SHEET IS NOT COMPLETE AND MAY BE AMENDED PRIOR TO THE TIME OF SALE. THIS TERM SHEET IS NOT AN OFFER TO SELL THESE SECURITIES AND IT IS NOT A SOLICITATION OF AN OFFER TO BUY THESE SECURITIES IN ANY JURISDICTION WHERE THE OFFER OR SALE IS NOT PERMITTED.
80
| U-HAUL PORTFOLIO |
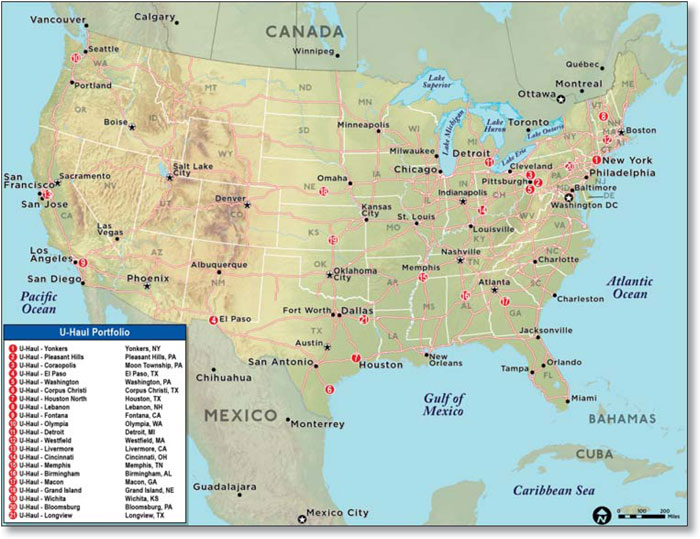
THE INFORMATION IN THIS STRUCTURAL AND COLLATERAL TERM SHEET IS NOT COMPLETE AND MAY BE AMENDED PRIOR TO THE TIME OF SALE. THIS TERM SHEET IS NOT AN OFFER TO SELL THESE SECURITIES AND IT IS NOT A SOLICITATION OF AN OFFER TO BUY THESE SECURITIES IN ANY JURISDICTION WHERE THE OFFER OR SALE IS NOT PERMITTED.
81
| No. 7 – U-Haul Portfolio | |||||||
| Loan Information | Property Information | ||||||
| Mortgage Loan Seller: | Wells Fargo Bank, National Association | Single Asset/Portfolio: | Portfolio | ||||
Credit Assessment (Fitch/KBRA/Moody’s): | NR/NR/NR | Property Type: | Self Storage | ||||
| Original Principal Balance: | $35,000,000 | Specific Property Type: | Self Storage | ||||
| Cut-off Date Principal Balance: | $35,000,000 | Location: | Various – See Table | ||||
| % of Initial Pool Balance: | 2.4% | Size: | 421,632 SF | ||||
| Loan Purpose: | Refinance | Cut-off Date Principal Balance Per SF: | $83.01 | ||||
| Borrower Names: | UHIL 7, LLC; AREC 7, LLC | Year Built/Renovated: | Various – See Table | ||||
| Sponsor: | AMERCO | Title Vesting: | Fee | ||||
| Mortgage Rate: | 4.220% | Property Manager: | Self-managed | ||||
| Note Date: | August 22, 2014 | 3rd Most Recent Occupancy (As of): | 83.0% (12/31/2011) | ||||
| Anticipated Repayment Date: | September 11, 2024 | 2nd Most Recent Occupancy (As of): | 83.9% (12/31/2012) | ||||
| Maturity Date: | September 11, 2044 | Most Recent Occupancy (As of): | 84.7% (12/31/2013) | ||||
| IO Period: | None | Current Occupancy (As of): | 90.0% (6/25/2014) | ||||
| Loan Term (Original): | 120 months | ||||||
| Seasoning: | 0 months | Underwriting and Financial Information: | |||||
| Amortization Term (Original): | 360 months | ||||||
| Loan Amortization Type: | Amortizing ARD | 3rd Most Recent NOI (As of): | $3,967,508 (12/31/2012) | ||||
| Interest Accrual Method: | Actual/360 | 2nd Most Recent NOI (As of): | $4,166,472 (12/31/2013) | ||||
| Call Protection: | L(24),D(92),O(4) | Most Recent NOI (As of): | $4$4,288,369 (TTM 4/30/2014) | ||||
| Lockbox Type: | Soft/Springing Cash Management | ||||||
| Additional Debt: | None | ||||||
| Additional Debt Type: | NAP | ||||||
| U/W Revenues: | $6,275,348 | ||||||
| U/W Expenses: | $2,429,465 | ||||||
| U/W NOI: | $3,845,883 | ||||||
| U/W NCF: | $3,743,935 | ||||||
| U/W NOI DSCR: | 1.87x | ||||||
Escrows and Reserves(1): | U/W NCF DSCR: | 1.82x | |||||
| U/W NOI Debt Yield: | 11.0% | ||||||
| Type: | Initial | Monthly | Cap (If Any) | U/W NCF Debt Yield: | 10.7% | ||
| Taxes | $0 | Springing | NAP | As-Is Appraised Value: | $49,205,000 | ||
| Insurance | $0 | Springing | NAP | As-Is Appraisal Valuation Date: | Various | ||
| Deferred Maintenance | $128,381 | $0 | NAP | Cut-off Date LTV Ratio: | 71.1% | ||
| Replacement Reserves | $0 | $8,433 | $198,449 | LTV Ratio at Maturity or ARD: | 57.0% | ||
| (1) | See “Escrows” section. |
The Mortgage Loan. The mortgage loan (the “U-Haul Portfolio Mortgage Loan”) is evidenced by a single promissory note that is secured by a first mortgage encumbering 21 self storage properties totaling 421,632 square feet and located in 14 states (the “U-Haul Portfolio Properties”). The U-Haul Portfolio Mortgage Loan was originated on August 22, 2014 by Wells Fargo Bank, National Association. The U-Haul Portfolio Mortgage Loan had an original principal balance of $35,000,000, has an outstanding principal balance as of the Cut-off Date of $35,000,000 and accrues interest at an interest rate of 4.220% per annum. The U-Haul Portfolio Mortgage Loan had an initial term of 120 months, has a remaining term of 120 months as of the Cut-off Date, and requires principal and interest payments based on a 30-year amortization schedule through the Anticipated Repayment Date (“ARD”). The ARD is September 11, 2024, and the final maturity date is September 11, 2044. In the event the U-Haul Portfolio Mortgage Loan is not paid off on or before the ARD, the borrower will be required to make payments of principal and interest based on an interest rate equal to the lesser of (i) the initial mortgage rate plus 5.00% and (ii) 3.00% plus the greater of (a) the initial interest rate and (b) the 10-year swap yield as of the ARD plus 1.65%. The ARD automatically triggers a Cash Trap Event Period (see “Lockbox and Cash Management” section) whereby all excess cash flow will be used to pay down the principal balance of the U-Haul Portfolio Mortgage Loan.
THE INFORMATION IN THIS STRUCTURAL AND COLLATERAL TERM SHEET IS NOT COMPLETE AND MAY BE AMENDED PRIOR TO THE TIME OF SALE. THIS TERM SHEET IS NOT AN OFFER TO SELL THESE SECURITIES AND IT IS NOT A SOLICITATION OF AN OFFER TO BUY THESE SECURITIES IN ANY JURISDICTION WHERE THE OFFER OR SALE IS NOT PERMITTED.
82
| U-HAUL PORTFOLIO |
Following the lockout period, the borrower has the right to defease the U-Haul Portfolio Mortgage Loan in whole, but not in part, on any date before June 11, 2024. In addition, the U-Haul Portfolio Mortgage Loan is prepayable without penalty on or after June 11, 2024.
Sources and Uses
| Sources | Uses | |||||||
| Original loan amount | $35,000,000 | 100.0% | Loan payoff(1) | $20,622,995 | 58.9% | |||
| Reserves | 128,381 | 00.4% | ||||||
| Closing costs | 871,959 | 02.5% | ||||||
| Return of equity | 13,376,665 | 38.2% | ||||||
| Total Sources | $35,000,000 | 100.0% | Total Uses | $35,000,000 | 100.0% | |||
| (1) | The U-Haul Portfolio Properties were previously securitized in MLMT 2005-CKI1. |
The Properties. The U-Haul Portfolio Properties comprise 21 self storage properties totaling 421,632 square feet and located in 14 states (see table below). The U-Haul Portfolio Properties were constructed between 1920 and 1990, and four properties were renovated between 1961 and 2000. As of June 25, 2014, the U-Haul Portfolio Properties were 90.0% occupied.
The following table presents certain information relating to the U-Haul Portfolio Properties:
| Property Name – Location | Allocated Cut-off Date Principal Balance | % of Portfolio Cut-off Date Principal Balance | Occupancy | Year Built/ Renovated | Net Rentable Area (SF) | Appraised Value | ||||||||
| U-Haul – Yonkers, NY | $9,577,876 | 27.4% | 89.8% | 1950/NAP | 65,687 | $12,400,000 | ||||||||
| U-Haul – Pleasant Hills, PA | $2,987,501 | 8.5% | 97.7% | 1978/NAP | 27,412 | $4,200,000 | ||||||||
| U-Haul – Coraopolis, PA | $2,240,626 | 6.4% | 92.6% | 1980/NAP | 18,431 | $3,150,000 | ||||||||
| U-Haul – El Paso, TX | $2,096,281 | 6.0% | 79.4% | 1971/NAP | 36,570 | $3,650,000 | ||||||||
| U-Haul – Washington, PA | $1,778,275 | 5.1% | 90.0% | 1980/NAP | 11,900 | $2,500,000 | ||||||||
| U-Haul – Corpus Christi, TX | $1,715,393 | 4.9% | 96.7% | 1951/1981 | 37,199 | $2,750,000 | ||||||||
| U-Haul – Houston North, TX | $1,614,882 | 4.6% | 99.8% | 1978/NAP | 34,711 | $2,200,000 | ||||||||
| U-Haul – Lebanon, NH | $1,451,489 | 4.1% | 97.7% | 1976/2000 | 12,796 | $1,900,000 | ||||||||
| U-Haul – Fontana, CA | $1,274,086 | 3.6% | 75.4% | 1970/NAP | 20,596 | $2,300,000 | ||||||||
| U-Haul – Olympia, WA | $1,260,566 | 3.6% | 92.3% | 1939/1961 | 11,569 | $1,730,000 | ||||||||
| U-Haul – Detroit, MI | $1,216,444 | 3.5% | 75.9% | 1965/NAP | 28,768 | $1,675,000 | ||||||||
| U-Haul – Westfield, MA | $1,173,661 | 3.4% | 95.8% | 1955/NAP | 15,000 | $1,650,000 | ||||||||
| U-Haul – Livermore, CA | $1,102,530 | 3.2% | 86.5% | 1982/NAP | 11,100 | $1,550,000 | ||||||||
| U-Haul – Cincinnati, OH | $1,095,834 | 3.1% | 97.4% | 1920/NAP | 13,450 | $1,400,000 | ||||||||
| U-Haul – Memphis, TN | $991,965 | 2.8% | 93.7% | 1966/1984 | 18,140 | $1,500,000 | ||||||||
| U-Haul – Birmingham, AL | $782,441 | 2.2% | 83.0% | 1970/NAP | 10,150 | $1,100,000 | ||||||||
| U-Haul – Macon, GA | $640,179 | 1.8% | 82.1% | 1966/NAP | 12,669 | $900,000 | ||||||||
| U-Haul – Grand Island, NE | $569,048 | 1.6% | 96.6% | 1979/NAP | 9,515 | $800,000 | ||||||||
| U-Haul – Wichita, KS | $547,917 | 1.6% | 87.9% | 1970/NAP | 10,150 | $700,000 | ||||||||
| U-Haul – Bloomberg, PA | $451,786 | 1.3% | 97.1% | 1990/NAP | 8,858 | $600,000 | ||||||||
| U-Haul – Longview, TX | $431,220 | 1.2% | 89.5% | 1939/NAP | 6,961 | $550,000 | ||||||||
| Total/Weighted Average | $35,000,000 | 100.0% | 90.0% | 421,632 | $49,205,000 | |||||||||
The following table presents historical occupancy percentages at the U-Haul Portfolio Properties:
Historical Occupancy
12/31/2011(1) | 12/31/2012(1) | 12/31/2013(1) | 6/25/2014(2) | |||
| 83.0% | 83.9% | 84.7% | 90.0% |
| (1) | Information obtained from the borrower. |
| (2) | Information obtained from the underwritten rent roll. |
THE INFORMATION IN THIS STRUCTURAL AND COLLATERAL TERM SHEET IS NOT COMPLETE AND MAY BE AMENDED PRIOR TO THE TIME OF SALE. THIS TERM SHEET IS NOT AN OFFER TO SELL THESE SECURITIES AND IT IS NOT A SOLICITATION OF AN OFFER TO BUY THESE SECURITIES IN ANY JURISDICTION WHERE THE OFFER OR SALE IS NOT PERMITTED.
83
| U-HAUL PORTFOLIO |
Operating History and Underwritten Net Cash Flow. The following table presents certain information relating to the historical operating performance and Underwritten Net Cash Flow at the U-Haul Portfolio Properties:
Cash Flow Analysis
| 2012 | 2013 | TTM 4/30/2014 | U/W | U/W $ per SF | ||||||||
| Base Rent | $4,722,597 | $4,830,786 | $4,997,556 | $4,997,798 | $11.85 | |||||||
| Grossed Up Vacant Space | 0 | 0 | 0 | 1,071,390 | 2.54 | |||||||
| Other Income | 1,229,254 | 1,311,490 | 1,276,753 | 1,277,550 | 3.03 | |||||||
| Less Vacancy & Collection Loss | 0 | 0 | 0 | (1,071,390)(1) | (2.54) | |||||||
| Effective Gross Income | $5,951,851 | $6,142,276 | $6,274,309 | $6,275,348 | $14.88 | |||||||
| Total Operating Expenses | $1,984,343 | $1,975,804 | $1,985,940 | $2,429,465(2) | $5.76 | |||||||
| Net Operating Income | $3,967,508 | $4,166,472 | $4,288,369 | $3,845,883 | $9.12 | |||||||
| Capital Expenditures | 0 | 0 | 0 | 101,948 | 0.24 | |||||||
| Net Cash Flow | $3,967,508 | $4,166,472 | $4,288,369 | $3,743,935 | $8.88 | |||||||
| NOI DSCR | 1.93x | 2.02x | 2.08x | 1.87x | ||||||||
| NCF DSCR | 1.93x | 2.02x | 2.08x | 1.82x | ||||||||
| NOI DY | 11.3% | 11.9% | 12.3% | 11.0% | ||||||||
| NCF DY | 11.3% | 11.9% | 12.3% | 10.7% | ||||||||
| (1) | The underwritten economic vacancy is 17.7%. The U-Haul Portfolio Properties were 90.0% physically occupied as of June 25, 2014. |
| (2) | The increase in underwritten operating expenses is primarily due to a 6.0% underwritten management fee. The historical operating statements do not include a management fee, as the U-Haul Portfolio Properties are self-managed. |
Appraisal. As of the appraisal valuation dates ranging from June 13, 2014 to June 26, 2014, the U-Haul Portfolio Properties had an “as-is” appraised value of $49,205,000.
Environmental Matters. According to the Phase I environmental reports dated June and July 2014, there was no evidence of any recognized environmental conditions (“RECs”) at 13 of the U-Haul Portfolio Properties. RECs were identified at the following eight U-Haul Portfolio Properties: Fontana, California; El Paso, Texas; Grand Island, Nebraska; Detroit, Michigan; Lebanon, New Hampshire; Westfield, Massachusetts; Bloomsburg, Pennsylvania; and Cincinnati, Ohio. See “Description of the Mortgage Pool – Assessments of Property Value and Condition – Environmental Assessments” in the Free Writing Prospectus.
In lieu of undergoing additional investigation related to the RECs, the borrower obtained a $15.0 million environmental insurance policy.
The Borrowers. The borrowers are UHIL 7, LLC and AREC 7, LLC, each of which is a single purpose entity with two independent directors. Legal counsel to the borrower delivered a non-consolidation opinion in connection with the origination of the U-Haul Portfolio Mortgage Loan. AMERCO is the guarantor of certain nonrecourse carveouts under the U-Haul Portfolio Mortgage Loan.
The Sponsor. The sponsor is AMERCO, which engages in the manufacturing, repair and rental of U-Haul equipment and storage space. As of July 15, 2014, AMERCO owned and managed approximately 1,540 U-Haul retail centers throughout the United States and Canada. AMERCO filed for chapter 11 bankruptcy in 2003 and emerged from bankruptcy in 2004. See “Description of the Mortgage Pool – Default History, Bankruptcy Issues and Other Proceedings” in the Free Writing Prospectus.
Escrows. The loan documents provide for an upfront escrow in the amount of $128,381 for deferred maintenance. The borrower is also required to make ongoing monthly deposits of $8,433 for replacement reserves (subject to a cap of $198,449). Ongoing monthly reserves for real estate taxes are not required as long as (i) no event of default has occurred and is continuing; (ii) the borrower provides the lender with timely proof of payment; and (iii) there is an amount equal to $290,000 deposited and maintained in the real estate tax escrow account. Ongoing monthly reserves for insurance are not required as long as (i) no event of default has occurred and is continuing; (ii) the borrower provides the lender with evidence of renewal of the insurance policies and timely proof of payment of insurance premiums; and (iii) either (a) the U-Haul Portfolio Properties are covered by an acceptable blanket insurance policy or (b) if the U-Haul Portfolio Properties are not covered by an acceptable blanket insurance policy, there is an amount equal to $42,000 deposited and maintained in the insurance escrow account.
Lockbox and Cash Management. The U-Haul Portfolio Mortgage Loan requires a lender-controlled lockbox account, which is already in place, and that the borrower and property manager deposit all cash revenues and all other monies received into such lockbox account within two business days after receipt. Prior to the occurrence of a Cash Trap Event Period (as defined below), all funds on deposit in the lockbox account are disbursed to the borrower. During a Cash Trap Event Period, all funds on deposit in the lockbox account are swept to a lender-controlled cash management account on a daily basis.
A “Cash Trap Event Period” will commence upon the earlier of (i) the occurrence and continuance of an event of default; (ii) the debt service coverage ratio being less than 1.15x for two consecutive calendar quarters; (iii) the borrower’s failure to provide timely evidence of payment of taxes or to provide timely evidence that the U-Haul Portfolio Properties are insured in accordance with the loan documents; or (iv) the payment date that is three payment dates prior to the ARD. A Cash Trap Event Period will end, with regard to clause (i), upon the cure of such event of default (except for a Cash Trap Event Period triggered by an event of default
THE INFORMATION IN THIS STRUCTURAL AND COLLATERAL TERM SHEET IS NOT COMPLETE AND MAY BE AMENDED PRIOR TO THE TIME OF SALE. THIS TERM SHEET IS NOT AN OFFER TO SELL THESE SECURITIES AND IT IS NOT A SOLICITATION OF AN OFFER TO BUY THESE SECURITIES IN ANY JURISDICTION WHERE THE OFFER OR SALE IS NOT PERMITTED.
84
| U-HAUL PORTFOLIO |
caused by a bankruptcy action of the borrower, which will not expire); with regard to clause (ii), upon the debt service coverage ratio being equal to or greater than 1.25x for four consecutive calendar quarters; and with regard to clause (iii), upon the borrower providing evidence to the lender of the applicable payment of taxes and/or evidence of insurance. A Cash Trap Event Period triggered by clause (iv) will not expire until the full repayment of the U-Haul Portfolio Mortgage Loan. In addition, a Cash Trap Event Period cure shall occur no more than five times during the term of the U-Haul Portfolio Mortgage Loan.
Property Management. The U-Haul Portfolio Properties are managed by an affiliate of the borrower.
Assumption. The borrower has a one-time right to transfer the U-Haul Portfolio Properties, provided that no event of default has occurred and is continuing and certain other conditions are satisfied, including (i) the lender’s reasonable determination that the proposed transferee and guarantor satisfy the lender’s credit review and underwriting standards, taking into consideration transferee experience, financial strength and general business standing; (ii) execution of a recourse guaranty and an environmental indemnity by an affiliate of the transferee; and (iii) if requested by the lender, rating agency confirmation from Fitch, KBRA and Moody’s that the transfer will not result in a downgrade, withdrawal or qualification of the respective ratings assigned to the Series 2014-C22 Certificates.
Partial Release. Not permitted.
Real Estate Substitution. Not permitted.
Subordinate and Mezzanine Indebtedness. Not permitted.
Ground Lease. None.
Terrorism Insurance. The loan documents require that the “all risk” insurance policy required to be maintained by the borrower provide coverage for terrorism in an amount equal to the full replacement cost of the U-Haul Portfolio Properties, as well as business interruption insurance covering no less than the 18-month period following the occurrence of a casualty event, together with a six-month extended period of indemnity.
THE INFORMATION IN THIS STRUCTURAL AND COLLATERAL TERM SHEET IS NOT COMPLETE AND MAY BE AMENDED PRIOR TO THE TIME OF SALE. THIS TERM SHEET IS NOT AN OFFER TO SELL THESE SECURITIES AND IT IS NOT A SOLICITATION OF AN OFFER TO BUY THESE SECURITIES IN ANY JURISDICTION WHERE THE OFFER OR SALE IS NOT PERMITTED.
85
| HERMOSA PAVILION |
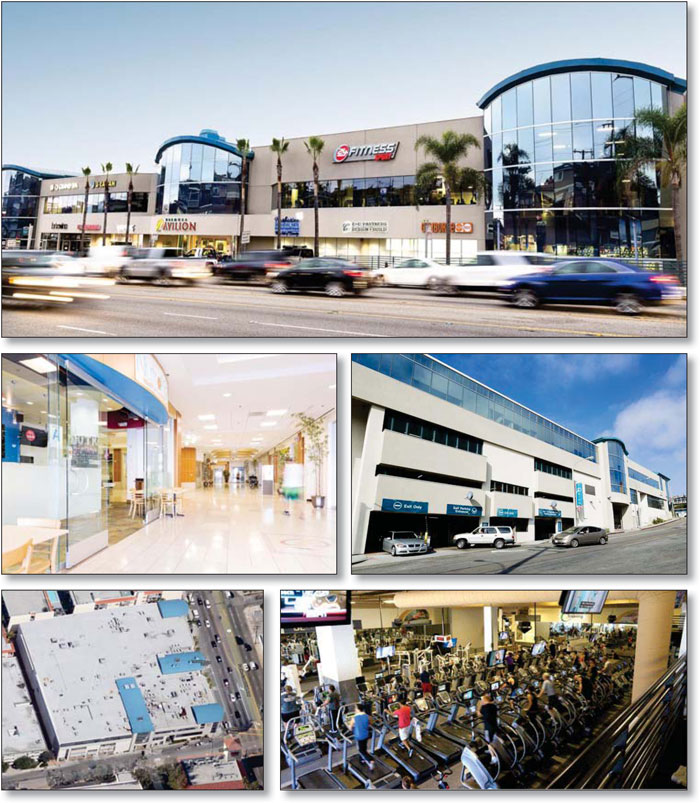
THE INFORMATION IN THIS STRUCTURAL AND COLLATERAL TERM SHEET IS NOT COMPLETE AND MAY BE AMENDED PRIOR TO THE TIME OF SALE. THIS TERM SHEET IS NOT AN OFFER TO SELL THESE SECURITIES AND IT IS NOT A SOLICITATION OF AN OFFER TO BUY THESE SECURITIES IN ANY JURISDICTION WHERE THE OFFER OR SALE IS NOT PERMITTED.
86
| HERMOSA PAVILION |
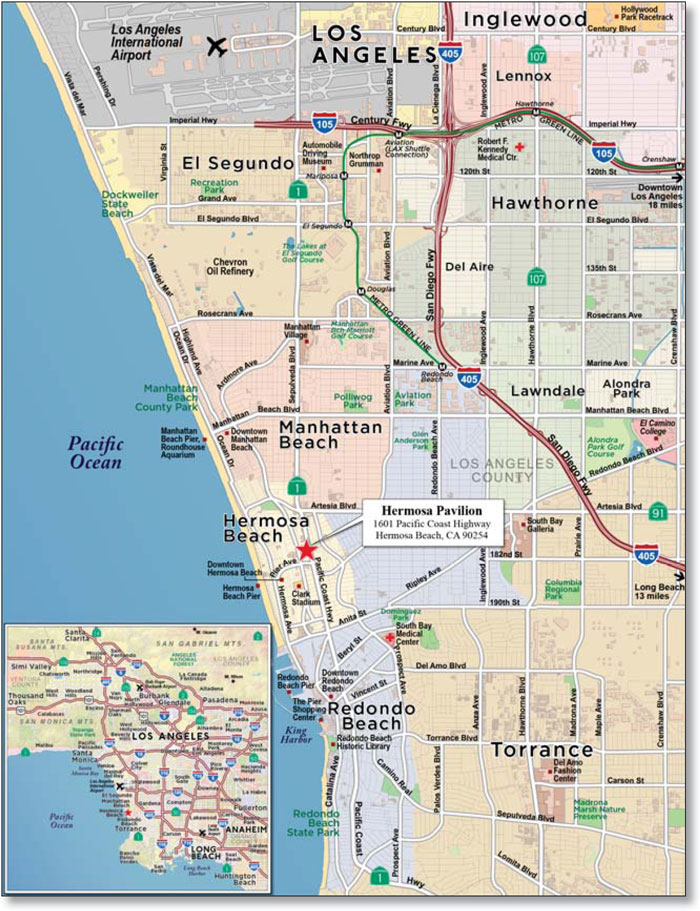
THE INFORMATION IN THIS STRUCTURAL AND COLLATERAL TERM SHEET IS NOT COMPLETE AND MAY BE AMENDED PRIOR TO THE TIME OF SALE. THIS TERM SHEET IS NOT AN OFFER TO SELL THESE SECURITIES AND IT IS NOT A SOLICITATION OF AN OFFER TO BUY THESE SECURITIES IN ANY JURISDICTION WHERE THE OFFER OR SALE IS NOT PERMITTED.
87
| No. 8 – Hermosa Pavilion | ||||||||
| Loan Information | Property Information | |||||||
| Mortgage Loan Seller: | The Royal Bank of Scotland | Single Asset/Portfolio: | Single Asset | |||||
Credit Assessment (Fitch/KBRA/Moody’s): | NR/NR/NR | Property Type: | Mixed Use | |||||
| Original Principal Balance: | $31,875,000 | Specific Property Type(2): | Retail/Office/Storage | |||||
| Cut-off Date Principal Balance: | $31,875,000 | Location: | Hermosa Beach, CA | |||||
| % of Initial Pool Balance: | 2.1% | Size(2): | 120,226 SF | |||||
| Loan Purpose: | Refinance | Cut-off Date Principal Balance Per SF: | $265.13 | |||||
| Borrower Name: | 1601 PCH, LP | Year Built/Renovated: | 1988/2005 | |||||
| Sponsor: | Shaoul J. Levy | Title Vesting: | Fee | |||||
| Mortgage Rate: | 4.341% | Property Manager: | Platinum Realty Management, Inc. | |||||
| Note Date: | August 12, 2014 | 3rd Most Recent Occupancy (As of): | 85.7% (12/31/2011) | |||||
| Anticipated Repayment Date: | NAP | 2nd Most Recent Occupancy (As of): | 87.8% (12/31/2012) | |||||
| Maturity Date: | September 6, 2024 | Most Recent Occupancy (As of): | 95.0% (12/31/2013) | |||||
| IO Period: | 48 months | Current Occupancy (As of)(3): | 94.3% (6/30/2014) | |||||
| Loan Term (Original): | 120 months | |||||||
| Seasoning: | 0 months | Underwriting and Financial Information: | ||||||
| Amortization Term (Original): | 360 months | |||||||
| Loan Amortization Type: | Interest-only, Amortizing Balloon | 3rd Most Recent NOI (As of)(4): | $1,955,974 (12/31/2012) | |||||
| Interest Accrual Method: | Actual/360 | 2nd Most Recent NOI (As of)(4): | $2,170,559 (12/31/2013) | |||||
| Call Protection: | L(24),D(91),O(5) | Most Recent NOI (As of)(4): | $2,347,484 (TTM 6/30/2014) | |||||
| Lockbox Type: | Hard/Springing Cash Management | |||||||
| Additional Debt: | None | |||||||
| Additional Debt Type: | NAP | U/W Revenues: | $3,744,201 | |||||
| U/W Expenses: | $1,030,521 | |||||||
U/W NOI(4): | $2,715,680 | |||||||
U/W NCF(4): | $2,584,713 | |||||||
Escrows and Reserves(1): | U/W NOI DSCR: | 1.43x | ||||||
| U/W NCF DSCR: | 1.36x | |||||||
Type: | Initial | Monthly | Cap (If Any) | U/W NOI Debt Yield: | 8.5% | |||
| Taxes | $136,844 | $22,807 | NAP | U/W NCF Debt Yield: | 8.1% | |||
| Insurance | $19,000 | $1,583 | NAP | As-Is Appraised Value(5): | $42,500,000 | |||
| Replacement Reserves | $0 | $1,938 | NAP | As-Is Appraisal Valuation Date: | June 5, 2014 | |||
| TI/LC Reserve | $0 | $8,331 | $200,000 | Cut-off Date LTV Ratio(5): | 73.4% | |||
| Salon Republic Reserve | $968,019 | $0 | NAP | LTV Ratio at Maturity or ARD(5): | 65.6% | |||
| (1) | See “Escrows” section. |
| (2) | The property type mix by square feet is as follows: Retail - 55,446 square feet (46.1% of net rentable area); Office – 53,397 square feet (44.4% of net rentable area); Storage – 4,476 square feet (3.7% of net rentable area) |
| (3) | Includes Salon Republic (16,179 square feet; 13.5% of net rentable area), which has a lease in place and is expected to open for business in October 2014. |
| (4) | See “Cash Flow Analysis” section. |
| (5) | The appraiser concluded to an as-completed appraised value of $43,400,000 as of June 5, 2014 based on improvements resulting from the completion of Salon Republic’s planned $800,000 build-out of the Hermosa Pavilion Property. The Cut-off Date LTV Ratio and LTV Ratio at Maturity shown are based on the as-completed appraised value of $43,400,000. The Cut-off Date LTV Ratio and LTV Ratio at Maturity based on the as-is appraised value are 75.0% and 67.0%, respectively. |
The Mortgage Loan. The mortgage loan (the “Hermosa Pavilion Mortgage Loan”) is evidenced by a single promissory note that is secured by a first mortgage encumbering a mixed use primarily retail and office center located in Hermosa Beach, California (the “Hermosa Pavilion Property”). The Hermosa Pavilion Mortgage Loan was originated on August 12, 2014 by The Royal Bank of Scotland. The Hermosa Pavilion Mortgage Loan had an original principal balance of $31,875,000, has an outstanding principal balance as of the Cut-off Date of $31,875,000 and accrues interest at an interest rate of 4.341% per annum. The Hermosa Pavilion Mortgage Loan had an initial term of 120 months, has a remaining term of 120 months as of the Cut-off Date and requires payments of interest-only for the first 48 payments following origination and, thereafter, requires payments of principal and interest based on a 30-year amortization schedule. The Hermosa Pavilion Mortgage Loan matures on September 6, 2024.
Following the lockout period, the borrower has the right to defease the Hermosa Pavilion Mortgage Loan in whole, but not in part, on any date before May 1, 2024. In addition, the Hermosa Pavilion Mortgage Loan is prepayable without penalty on or after May 1, 2024.
THE INFORMATION IN THIS STRUCTURAL AND COLLATERAL TERM SHEET IS NOT COMPLETE AND MAY BE AMENDED PRIOR TO THE TIME OF SALE. THIS TERM SHEET IS NOT AN OFFER TO SELL THESE SECURITIES AND IT IS NOT A SOLICITATION OF AN OFFER TO BUY THESE SECURITIES IN ANY JURISDICTION WHERE THE OFFER OR SALE IS NOT PERMITTED.
88
| HERMOSA PAVILION |
Sources and Uses
| Sources | Uses | |||||||
| Original loan amount | $31,875,000 | 100.0% | Loan payoff | $21,412,279 | 67.2% | |||
| Reserves | 1,123,863 | 3.5 | ||||||
| Closing costs | 519,855 | 1.6 | ||||||
| Return of equity | 8,819,003 | 27.7 | ||||||
| Total Sources | $31,875,000 | 100.0% | Total Uses | $31,875,000 | 100.0% |
The Property. The Hermosa Pavilion Property is a mixed use, retail and office property containing approximately 120,226 square feet located in Hermosa Beach, California. Originally constructed in 1988 as a movie theatre anchored retail center, the Hermosa Pavilion Property was extensively remodeled in 2005 to accommodate 24 Hour Fitness. The Hermosa Pavilion Property consists of an enclosed two-story building that contains retail and office uses and is situated on a 1.92-acre parcel. The two-story building has an enclosed mall design and contains multiple commercial and retail tenants with a central interior plaza on the ground floor. The second level is accessed via a central stairway and elevator and contains commercial, office, and executive suite tenants. The anchor, 24 Hour Fitness, occupies both levels with a private stairway. The Hermosa Pavilion Property includes a six-level parking garage providing 458 parking spaces resulting in a parking ratio of 3.8 spaces per 1,000 square feet of net rentable area. As of June 30, 2014 the Hermosa Pavilion Property was 94.3% occupied by 42 tenants.
The following table presents certain information relating to the tenancy at the Hermosa Pavilion Property:
Major Tenants
| Tenant Name | Credit Rating (Fitch/Moody’s/ S&P)(1) | Tenant NRSF | % of NRSF | Annual U/W Base Rent PSF | Annual U/W Base Rent | % of Total Annual U/W Base Rent | Sales PSF(2) | Occupancy Cost(2) | Lease Expiration Date | |||||||
| Anchor Tenant | ||||||||||||||||
| 24 Hour Fitness | B3/NR/B | 50,765 | 42.2% | $26.41 | $1,340,947 | 42.1% | NAV | NAV | 7/31/2020(3) | |||||||
| Total Anchor Tenant | 50,765 | 42.2% | $26.41 | $1,340,947 | 42.1% | |||||||||||
| Major Tenants | ||||||||||||||||
Salon Republic(4) | NR/NR/NR | 16,179 | 13.5% | $22.19 | $358,980 | 11.3% | NAV | NAV | 9/30/2029 | |||||||
| Fusion Learning | NR/NR/NR | 6,486 | 5.4% | $33.72 | $218,708 | 6.9% | NAV | NAV | 2/28/2017 | |||||||
| Precision Development | NR/NR/NR | 4,738 | 3.9% | $35.28 | $167,157 | 5.2% | NAV | NAV | 4/9/2017 | |||||||
| Keller Williams Beach Cities | NR/NR/NR | 4,800 | 4.0% | $30.00 | $144,000 | 4.5% | NAV | NAV | 2/29/2016 | |||||||
| Your Event, Inc. | NR/NR/NR | 4,476 | 3.7% | $16.59 | $74,243 | 2.3% | NAV | NAV | MTM | |||||||
| Total Major Tenants | 36,679 | 30.5% | $26.26 | $963,087 | 30.2% | |||||||||||
| Non-Major Tenants | 25,875 | 21.5% | $34.01 | $880,039 | 27.6% | |||||||||||
| Occupied Collateral Total | 113,319 | 94.3% | $28.10 | $3,184,073 | 100.0% | |||||||||||
| Vacant Space | 6,907 | 5.7% | ||||||||||||||
| Collateral Total | 120,226 | 100.0% | ||||||||||||||
| (1) | Certain ratings are those of the parent company whether or not the parent guarantees the lease. |
| (2) | Tenants are not required to report sales. |
| (3) | 24 Hour Fitness does not report sales but membership as of July 2014 was approximately 16,000 members, compared to the chain average of 9,000 per location, per the tenant. 24 Hour Fitness has three, 5-year lease renewal options. |
| (4) | Salon Republic is expected to open for business in October 2014. The Salon Republic Reserve includes $104,706 for the Salon Republic gap rent and rent abatement through March 2015. |
THE INFORMATION IN THIS STRUCTURAL AND COLLATERAL TERM SHEET IS NOT COMPLETE AND MAY BE AMENDED PRIOR TO THE TIME OF SALE. THIS TERM SHEET IS NOT AN OFFER TO SELL THESE SECURITIES AND IT IS NOT A SOLICITATION OF AN OFFER TO BUY THESE SECURITIES IN ANY JURISDICTION WHERE THE OFFER OR SALE IS NOT PERMITTED.
89
| HERMOSA PAVILION |
The following table presents certain information relating to the lease rollover schedule at the Hermosa Pavilion Property:
Lease Expiration Schedule(1)(2)
Year Ending December 31, | No. of Leases Expiring | Expiring NRSF | % of Total NRSF | Cumulative Expiring NRSF | Cumulative % of Total NRSF | Annual U/W Base Rent | Annual U/W Base Rent PSF(3) | |||||||
| MTM | 20 | 11,131 | 9.3% | 11,131 | 9.3% | $343,314 | $30.84 | |||||||
| 2014 | 4 | 752 | 0.6% | 11,883 | 9.9% | $29,280 | $38.94 | |||||||
| 2015 | 5 | 1,607 | 1.3% | 13,490 | 11.2% | $67,090 | $41.75 | |||||||
| 2016 | 3 | 10,535 | 8.8% | 24,025 | 20.0% | $313,116 | $29.72 | |||||||
| 2017 | 2 | 11,224 | 9.3% | 35,249 | 29.3% | $385,865 | $34.38 | |||||||
| 2018 | 5 | 9,315 | 7.7% | 44,564 | 37.1% | $293,615 | $31.52 | |||||||
| 2019 | 1 | 1,811 | 1.5% | 46,375 | 38.6% | $51,867 | $28.64 | |||||||
| 2020 | 1 | 50,765 | 42.2% | 97,140 | 80.8% | $1,340,947 | $26.41 | |||||||
| 2021 | 0 | 0 | 0.0% | 97,140 | 80.8% | $0 | $0.00 | |||||||
| 2022 | 0 | 0 | 0.0% | 97,140 | 80.8% | $0 | $0.00 | |||||||
| 2023 | 0 | 0 | 0.0% | 97,140 | 80.8% | $0 | $0.00 | |||||||
| 2024 | 0 | 0 | 0.0% | 97,140 | 80.8% | $0 | $0.00 | |||||||
| Thereafter | 1 | 16,179 | 13.5% | 113,319 | 94.3% | $358,980 | $22.19 | |||||||
| Vacant | 0 | 6,907 | 5.7% | 120,226 | 100.0% | $0 | $0.00 | |||||||
| Total/Weighted Average | 42 | 120,226 | 100.0% | $3,184,073 | $28.10 |
| (1) | Information obtained from the underwritten rent roll. |
| (2) | Certain tenants may have lease termination options that are exercisable prior to the originally stated expiration date of the subject lease and that are not considered in the Lease Expiration Schedule. |
| (3) | Weighted Average Annual U/W Base Rent PSF excludes vacant space. |
The following table presents historical occupancy percentages at the Hermosa Pavilion Property:
Historical Occupancy
12/31/2011(1) | 12/31/2012(1) | 12/31/2013(1) | 6/30/2014(2) | |||
| 85.7% | 87.8% | 95.0% | 94.3% |
| (1) | Information obtained from the borrower. |
| (2) | Information obtained from the underwritten rent roll. |
Operating History and Underwritten Net Cash Flow. The following table presents certain information relating to the historical operating performance and Underwritten Net Cash Flow at the Hermosa Pavilion Property:
Cash Flow Analysis
2012(1) | 2013(1) | TTM 6/30/2014 | U/W(2) | U/W $ per SF | |||||||
| Base Rent | $2,292,225 | $2,506,825 | $2,697,470 | $3,184,073 | $26.48 | ||||||
| Grossed Up Vacant Space | 0 | 0 | 0 | 185,876 | 1.55 | ||||||
| Percentage Rent | 0 | 0 | 0 | 0 | 0.00 | ||||||
| Total Reimbursables | 521,979 | 551,267 | 559,460 | 598,853 | 4.98 | ||||||
| Other Income | 8,787 | 4,322 | 1,620 | 1,620 | 0.01 | ||||||
| Less Vacancy & Credit Loss | 0 | 0 | 0 | (226,222)(3) | (1.88) | ||||||
| Effective Gross Income | $2,822,991 | $3,062,414 | $3,258,550 | $3,744,201 | $31.14 | ||||||
| Total Operating Expenses | $867,017 | $891,855 | $911,066 | $1,030,521 | $8.57 | ||||||
| Net Operating Income | $1,955,974 | $2,170,559 | $2,347,484 | $2,713,680 | $22.57 | ||||||
| TI/LC | 0 | 0 | 0 | 104,921 | 0.87 | ||||||
| Capital Expenditures | 0 | 0 | 0 | 24,045 | 0.20 | ||||||
| Net Cash Flow | $1,955,974 | $2,170,559 | $2,347,484 | $2,584,713 | $21.50 | ||||||
| NOI DSCR | 1.03x | 1.14x | 1.23x | 1.43x | |||||||
| NCF DSCR | 1.03x | 1.14x | 1.23x | 1.36x | |||||||
| NOI DY | 6.1% | 6.8% | 7.4% | 8.5% | |||||||
| NCF DY | 6.1% | 6.8% | 7.4% | 8.1% |
| (1) | The Hermosa Pavilion Property entered foreclosure in 2009 and was sold to the sponsor in 2010. At the time of sale, occupancy was approximately 50.0%. Through a repositioning strategy and capital investment, the sponsor has increased occupancy from 50.0% to 94.3% as of June 30, 2014. |
| (2) | The increase in U/W Base Rents from TTM 6/30/2014 is due to the Salon Republic lease that is scheduled to commence in October 2014 which will increase base rental income at the Hermosa Pavilion Property by $358,980. The Salon Republic Reserve includes $104,706 for the Salon Republic gap rent and rent abatement through March 2015. |
| (3) | The underwritten economic vacancy is 5.7%. The Hermosa Pavilion Property was 94.3% occupied as of June 30, 2014. |
THE INFORMATION IN THIS STRUCTURAL AND COLLATERAL TERM SHEET IS NOT COMPLETE AND MAY BE AMENDED PRIOR TO THE TIME OF SALE. THIS TERM SHEET IS NOT AN OFFER TO SELL THESE SECURITIES AND IT IS NOT A SOLICITATION OF AN OFFER TO BUY THESE SECURITIES IN ANY JURISDICTION WHERE THE OFFER OR SALE IS NOT PERMITTED.
90
| HERMOSA PAVILION |
Appraisal. As of the appraisal valuation date of June 5, 2014, the Hermosa Pavilion Property had an “as-is” appraised value of $42,500,000 and an “as-completed” appraised value of $43,400,000.
Environmental Matters. According to the Phase I environmental report dated June 24, 2014, there was no evidence of any recognized environmental conditions at the Hermosa Pavilion Property.
Market Overview. The Hermosa Pavilion Property is located approximately 21.4 miles south of downtown Los Angeles and approximately 6.1 miles south of the Los Angeles International Airport. The Hermosa Pavilion Property is located at the northwest corner of 16th Street and Pacific Coast Highway, a primary commercial thoroughfare that provides access to the regional freeway system including the San Diego (Interstate 405) freeway. The Hermosa Pavilion Property is located between the City of Manhattan Beach, the Hermosa Beach pier, and the City of Redondo, in a commercial corridor that includes a Vons anchored shopping center immediately to the south. According to the appraisal, as of 2014, the estimated population within a three- and five-mile radius of the Hermosa Pavilion Property is 177,516 and 416,300, respectively. The estimated average household income within the same three- and five-mile radius was $118,490 and $96,344, respectively. The Hermosa Pavilion Property falls within both the South Bay/Torreance retail submarket and the El Segundo/Beach Cities office submarket.
According to a third party report, the South Bay/Torrance retail submarket is a coastal zone home to upper income beachfront cities in Los Angeles County, including Hermosa Beach, Manhattan Beach, and Redondo Beach. The community’s main, shopping, dining, and entertainment area is the Hermosa Beach Pier, less than one mile west of the Hermosa Pavilion Property. As of the first quarter of 2014, the South Bay/Torrance submarket had a reported vacancy of 4.1% and an average asking rate of $32.30 per square foot, on a triple-net basis.
According to a third party report, the El Segundo/Beach Cities office submarket contains a concentration of high technology, aerospace/defense and business companies. The submarket is located within the greater Los Angeles South Bay and contains newer office buildings and commercial amenities. According to a third party market research report, as of the first quarter of 2014, the El Segundo/ Beach Cities submarket had a reported market vacancy of 17.9% and a class A rent average asking rate of $31.32 per square foot, on full service gross basis while posting a positive net absorption of 151,972 square feet in 2013.
The Borrower. The borrower is a recycled special purpose entity and is 70.0% owned by Sofiya Machulskaya, 15.0% owned by the Lion Property Trust, and the remainder divided among another four partners. Legal counsel to the borrower delivered a non-consolidation opinion in connection with the origination of the Hermosa Pavilion Mortgage Loan. Shaoul J. Levy is the guarantor of certain nonrecourse carveouts under the Hermosa Pavilion Mortgage Loan.
The Sponsor. The sponsor is Shaoul J. Levy, the founder of Levy Affiliated. Mr. Levy has over 25 years of experience investing in real estate and acquired his first major commercial property in 1988. Mr. Levy formed Levy Affiliated to invest in real estate in Southern California on behalf of high net worth individuals, and has since grown the company to a team of 50 individuals overseeing a real estate portfolio of nearly $500 million spread across the western United States. He has extensive experience investing across a variety of deal structures, having sourced, negotiated and executed over $630 million of real estate transactions. In total, he has acquired 56 commercial properties, representing approximately 4.0 million square feet of buildings.
Escrows. The loan documents provide for upfront escrows in the amount of $136,844 for real estate taxes, $19,000 for insurance, and $968,019 for the Salon Republic Reserve. The loan documents provide for monthly on-going escrows in the amount of $22,807 for real estate tax, $1,583 for insurance, $1,938 for replacement reserves, and $8,331 for TI/LCs (capped at $200,000). Additionally, during a Lease Sweep Period (as defined below), all excess cash flow is deposited into the TI/LC reserve until such time that $560,000 has been deposited into the TI/LC reserve.
Lockbox and Cash Management. The Hermosa Pavilion Mortgage Loan requires a lender-controlled lockbox account, which is already in place, and that the borrower directs tenant to pay their rents directly into such lockbox account. Prior to the occurrence of a Cash Trap Event Period (as defined below), all funds on deposit in the lockbox account are swept into the borrowers’ operating account on a daily basis. During a Cash Trap Event Period, all funds on deposit in the lockbox account are swept to a lender-controlled cash management account on a monthly basis.
A “Cash Trap Event Period” will commence upon the earlier of (i) the maturity date of the mortgage loan, (ii) the occurrence and continuation of an event of default, (iii) an amortizing debt service coverage ratio less than 1.05x, or (iv) the commencement of a Lease Sweep Period. A Cash Trap Event Period will end when, with respect to clause (i), the Hermosa Pavilion Mortgage Loan and all other obligations under the loan documents have been repaid in full; with respect to clause (ii), any event of default has been cured and no other event of default has occurred and is continuing; with respect to clause (iii), the lender has determined that the Hermosa Pavilion Property has achieved an amortizing debt service coverage ratio of 1.05x for two consecutive calendar quarters; and with respect to clause (iv) the Lease Sweep Period has ended.
A “Lease Sweep Period” shall commence on the first payment date following the occurrence of any of the following: (i) the date that is six months prior to the end of the term of any Major Lease (as defined below) (including any renewal terms); (ii) the date required under a Major Lease by which the applicable Major Tenant (as defined below) is required to give notice of its exercise of a renewal option thereunder (and such renewal has not been so exercised); (iii) any Major Lease is surrendered, cancelled or terminated prior to its then current expiration date; (iv) any Major Tenant shall discontinue its business at its premises (i.e., “goes dark”); (v) the occurrence and continuance (beyond any applicable notice and cure periods) of a material monetary default under any Major Lease by the applicable Major Tenant thereunder; or (vi) the occurrence of certain insolvency proceedings related to a Major Tenant.
THE INFORMATION IN THIS STRUCTURAL AND COLLATERAL TERM SHEET IS NOT COMPLETE AND MAY BE AMENDED PRIOR TO THE TIME OF SALE. THIS TERM SHEET IS NOT AN OFFER TO SELL THESE SECURITIES AND IT IS NOT A SOLICITATION OF AN OFFER TO BUY THESE SECURITIES IN ANY JURISDICTION WHERE THE OFFER OR SALE IS NOT PERMITTED.
91
| HERMOSA PAVILION |
A Lease Sweep Period will end upon the earlier to occur of (x) the accumulation of $560,000 in the reserve to pay for all anticipated expenses in connection with the re-leasing of the space under the applicable Major Lease that gave rise to the subject Lease Sweep Period, including brokerage commissions and tenant improvements, and any anticipated shortfalls of payments required hereunder during any period of time that rents are insufficient as a result of down-time or free rent periods, or (y) the occurrence of any of the following: (1) with respect to a Lease Sweep Period caused by clauses (i), (ii), (iii) or (iv), upon the earlier to occur of (A) the date on which the Major Tenant irrevocably exercises its renewal or extension option (or otherwise enters into an extension agreement with the borrower that is acceptable to lender) with respect to all of the space demised under its Major Lease, and in lender’s judgment, sufficient funds have been accumulated in the reserve (during the continuance of the Lease Sweep Period) to pay for all anticipated leasing expenses for such Major Lease and any other anticipated expenses in connection with such renewal or extension, or (B) the date on which all of the space demised under the Major Lease that gave rise to the Lease Sweep Period has been fully leased pursuant to a replacement lease or replacement leases approved by lender, and all Major Lease leasing expenses (and any other expenses in connection with the re-tenanting of such space) have been paid in full whether from funds contained in any reserve accounts; (2) with respect to clause (v) if the Major Tenant default has been cured, and no other Major Tenant default has occurred for a period of three consecutive months following such cure; or (3) with respect to a lease Sweep Period caused by clause (vi) if the applicable Major Tenant insolvency proceeding has terminated and the applicable Major Lease has been affirmed, assumed or assigned in a manner satisfactory to lender.
A “Major Lease” is the 24 Hour Fitness lease and any other lease which covers 30,000 or more rentable square feet of the Hermosa Pavilion Property.
A “Major Tenant” is any tenant under either a Major Lease, or under one or more leases, which when taken together cover in the aggregate 30,000 or more rentable square feet of the Hermosa Pavilion Property.
Property Management. The Hermosa Pavilion Property is managed by Platinum Realty Management, Inc.
Assumption. The borrower has the right to transfer the Hermosa Pavilion Property, provided that no event of default has occurred and is continuing and certain other conditions are satisfied, including, but not limited to the following: (i) the lender’s reasonable determination that the proposed transferee and guarantor satisfy the lender’s credit review and underwriting standards, taking into consideration transferee’s experience, financial strength and general business standing; (ii) execution of a recourse guaranty and an environmental indemnity by an affiliate of the transferee; and (iii) if requested by the lender, rating agency confirmation from Fitch, KBRA, and Moody’s that the transfer will not result in a downgrade, withdrawal or qualification of the respective ratings assigned to the Series 2014-C22 Certificates.
Partial Release. Not permitted.
Real Estate Substitution. Not permitted.
Subordinate and Mezzanine Indebtedness. Not permitted.
Ground Lease. None.
Terrorism Insurance. The loan documents require that the “all risk” insurance policy required to be maintained by the borrower provide coverage for terrorism in an amount equal to the full replacement cost of the Hermosa Pavilion. The loan documents also require business interruption insurance covering no less than the 12-month period following the occurrence of a casualty event, together with a six-month extended period of indemnity.
Earthquake Insurance: The loan documents do not require earthquake insurance. The seismic report indicated a probable maximum loss of 8%.
THE INFORMATION IN THIS STRUCTURAL AND COLLATERAL TERM SHEET IS NOT COMPLETE AND MAY BE AMENDED PRIOR TO THE TIME OF SALE. THIS TERM SHEET IS NOT AN OFFER TO SELL THESE SECURITIES AND IT IS NOT A SOLICITATION OF AN OFFER TO BUY THESE SECURITIES IN ANY JURISDICTION WHERE THE OFFER OR SALE IS NOT PERMITTED.
92
(THIS PAGE INTENTIONALLY LEFT BLANK)
93
| TEXAS PORTFOLIO |
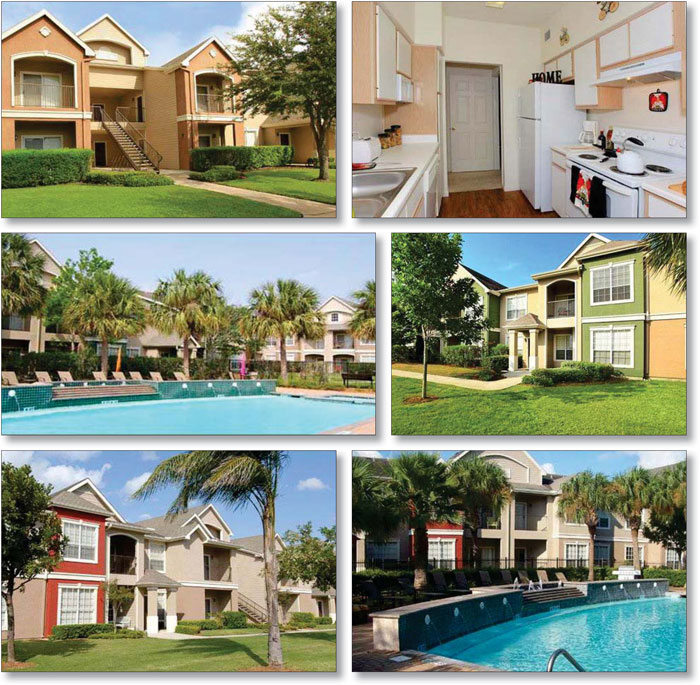
THE INFORMATION IN THIS STRUCTURAL AND COLLATERAL TERM SHEET IS NOT COMPLETE AND MAY BE AMENDED PRIOR TO THE TIME OF SALE. THIS TERM SHEET IS NOT AN OFFER TO SELL THESE SECURITIES AND IT IS NOT A SOLICITATION OF AN OFFER TO BUY THESE SECURITIES IN ANY JURISDICTION WHERE THE OFFER OR SALE IS NOT PERMITTED.
94
| TEXAS PORTFOLIO |
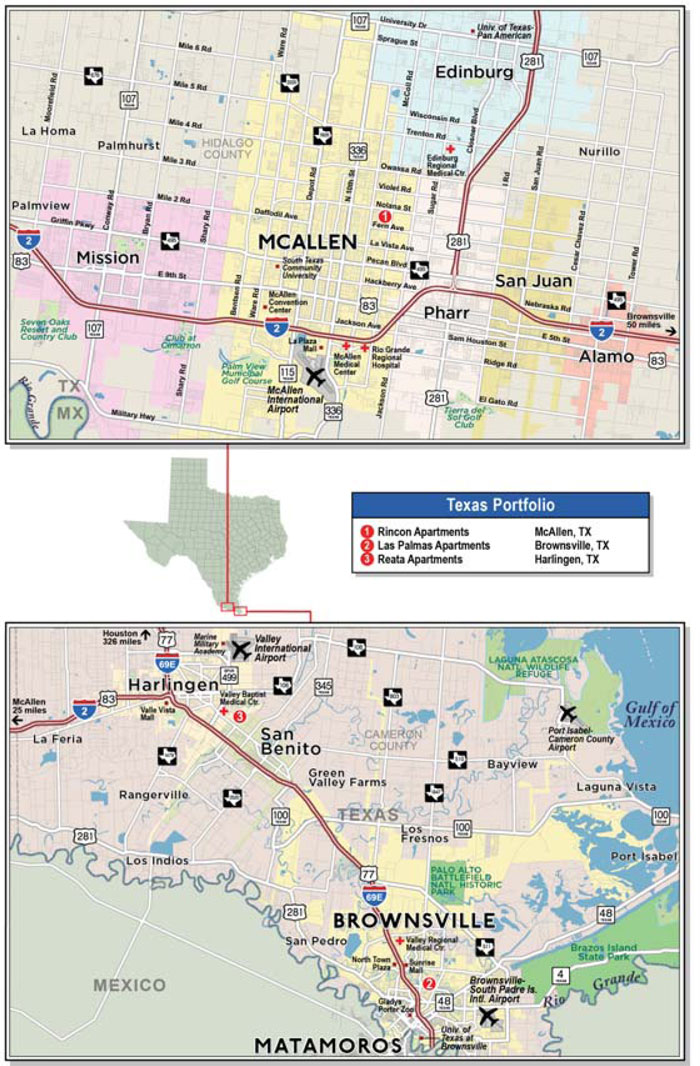
THE INFORMATION IN THIS STRUCTURAL AND COLLATERAL TERM SHEET IS NOT COMPLETE AND MAY BE AMENDED PRIOR TO THE TIME OF SALE. THIS TERM SHEET IS NOT AN OFFER TO SELL THESE SECURITIES AND IT IS NOT A SOLICITATION OF AN OFFER TO BUY THESE SECURITIES IN ANY JURISDICTION WHERE THE OFFER OR SALE IS NOT PERMITTED.
95
| TEXAS PORTFOLIO |
| No. 9 – Texas Portfolio | |||||||
| Loan Information | Properties Information | ||||||
| Mortgage Loan Seller: | Walker & Dunlop Commercial Property Funding I WF, LLC | Single Asset/Portfolio: | Portfolio | ||||
| Credit Assessment (Fitch/KBRA/Moody’s): | NR/NR/NR | Property Type: | Multifamily | ||||
| Original Principal Balance: | $31,423,000 | Specific Property Type: | |||||
| Cut-off Date Principal Balance: | $31,423,000 | Location: | Various – See Table | ||||
| % of Initial Pool Balance: | 2.1% | Size: | 520 units | ||||
| Loan Purpose: | Acquisition | Cut-off Date Principal Balance Per Unit(1): | $60,429 | ||||
| Borrower Names: | AMG Rincon, LLC; AMG Reata, LLC; AMG Las Palmas, LLC | Year Built/Renovated: | Various – See Table | ||||
| Sponsors: | Anthony Iarocci, III; Brian Gibbs; Gary Solomon, Sr. | Title Vesting: | Fee | ||||
| Mortgage Rate: | 4.358% | Properties Manager: | Self-managed | ||||
| Note Date: | July 30, 2014 | 3rd Most Recent Occupancy (As of)(3): | 93.4% (12/31/2011) | ||||
| Anticipated Repayment Date: | NAP | 2nd Most Recent Occupancy (As of)(3): | 89.2% (12/31/2012) | ||||
| Maturity Date: | August 11, 2024 | Most Recent Occupancy (As of)(3): | 88.1% (12/31/2013) | ||||
| IO Period: | 48 months | Current Physical Occupancy (As of): | 94.0% (7/21/2014) | ||||
| Loan Term (Original): | 120 months | ||||||
| Seasoning: | 1 month | Underwriting and Financial Information: | |||||
| Amortization Term (Original): | 360 months | ||||||
| Loan Amortization Type: | Interest-only, Amortizing Balloon | 3rd Most Recent NOI (As of): | $2,919,939 (12/31/2012) | ||||
| Interest Accrual Method: | Actual/360 | 2nd Most Recent NOI (As of): | $2,719,687 (12/31/2013) | ||||
| Call Protection: | L(25),D(91),O(4) | Most Recent NOI (As of)(4): | $2,754,481 (TTM 6/30/2014) | ||||
| Lockbox Type: | Soft/In-Place Cash Management | ||||||
Additional Debt(1): | Yes | U/W Revenues: | $5,279,048 | ||||
Additional Debt Type(1): | Mezzanine | U/W Expenses: | $2,159,204 | ||||
U/W NOI(4): | $3,119,844 | ||||||
| U/W NCF: | $2,989,844 | ||||||
Escrows and Reserves(2): | U/W NOI DSCR(1): | 1.66x | |||||
U/W NCF DSCR(1): | 1.59x | ||||||
Type: | Initial | Monthly | Cap (If Any) | U/W NOI Debt Yield(1): | 9.9% | ||
| Taxes | $360,832 | $45,104 | NAP | U/W NCF Debt Yield(1): | 9.5% | ||
| Insurance | $24,302 | $12,151 | NAP | As-Is Appraised Value: | $43,750,000 | ||
| Replacement Reserve | $987,632 | $10,833 | NAP | As-Is Appraisal Valuation Date: | June 16, 2014 | ||
| Deferred Maintenance | $118,363 | $0 | NAP | Cut-off Date LTV Ratio(1): | 71.8% | ||
| Renovation Reserve | $210,950 | $0 | NAP | LTV Ratio at Maturity or ARD(1): | 64.3% | ||
| (1) | See “Subordinate and Mezzanine Indebtedness” section. The equity interests in the borrowers under the Texas Portfolio Mortgage Loan have been pledged to secure mezzanine indebtedness with a balance as of the Cut-off Date of $5,377,000. All LTV, DSCR, debt yield and Cut-off Date Principal Balance Per Unit numbers shown in the chart above are based solely on the $31,423,000 mortgage loan financing. As of the Cut-off Date, the combined U/W NCF DSCR is 1.24x (based on a 9.45% interest rate on the mezzanine indebtedness), the combined LTV ratio is 84.1% and the combined U/W NCF Debt Yield is 8.1%. |
| (2) | See “Escrows” section. |
| (3) | See “Historical Occupancy” section. |
| (4) | See “Cash Flow Analysis” section. |
The Mortgage Loan. The mortgage loan (the “Texas Portfolio Mortgage Loan”) is evidenced by a single promissory note that is secured by deeds of trust encumbering three garden style multifamily properties totaling 520 units located in McAllen, Texas, Harlingen, Texas, and Brownsville, Texas (the “Texas Portfolio Properties”). The Texas Portfolio Mortgage Loan was originated on July 30, 2014 by Walker & Dunlop Commercial Property Funding I WF, LLC. The Texas Portfolio Mortgage Loan had an original principal balance of $31,423,000, has an outstanding principal balance as of the Cut-off Date of $31,423,000 and accrues interest at an interest rate of 4.358% per annum. The Texas Portfolio Mortgage Loan had an initial term of 120 months, has a remaining term of 119 months as of the Cut-off Date and requires interest-only payments for the first 48 payments following origination and, thereafter, requires payments of principal and interest based on a 30-year amortization schedule. The Texas Portfolio Mortgage Loan matures on August 11, 2024.
Following the lockout period, the borrowers have the right to defease the Texas Portfolio Mortgage Loan in whole, or in part (see “Partial Release” section), on any due date before May 11, 2024. In addition, the Texas Portfolio Mortgage Loan is prepayable without penalty on or after May 11, 2024.
THE INFORMATION IN THIS STRUCTURAL AND COLLATERAL TERM SHEET IS NOT COMPLETE AND MAY BE AMENDED PRIOR TO THE TIME OF SALE. THIS TERM SHEET IS NOT AN OFFER TO SELL THESE SECURITIES AND IT IS NOT A SOLICITATION OF AN OFFER TO BUY THESE SECURITIES IN ANY JURISDICTION WHERE THE OFFER OR SALE IS NOT PERMITTED.
96
| TEXAS PORTFOLIO |
Sources and Uses
| Sources | Uses | |||||||
| Original loan amount | $31,423,000 | 71.8% | Purchase price(1) | $41,292,000 | 94.4% | |||
| Mezzanine loan | 5,377,000 | 12.3 | Reserves | 1,702,079 | 3.9 | |||
| Sponsors’ new cash contribution | 6,955,857 | 15.9 | Closing costs | 761,778 | 1.7 | |||
| Total Sources | $43,755,857 | 100.0% | Total Uses | $43,755,857 | 100.0% |
| (1) | The Texas Portfolio Properties were part of a six-property portfolio acquisition. The purchase price reflects the purchase price allocated to the Texas Portfolio Properties as reflected in the settlement statements and title policies. |
The Properties. The Texas Portfolio Properties consist of three multifamily properties containing 520 units located in McAllen, Texas (Rincon Apartments), Harlingen, Texas (Reata Apartments), and Brownsville, Texas (Las Palmas Apartments). The Texas Portfolio Properties were built between 2001 and 2002 and the unit mix is made up of 304 one-bedroom units and 216 two-bedroom units. As of July 21, 2014, the Texas Portfolio Properties were 94.0% occupied.
The Rincon Apartments property consists of 14 two-story, garden-style multifamily buildings and one single-story clubhouse/office situated on a 12.7-acre parcel in McAllen, Texas. Built in 2001, the property contains 232 units comprised of 136 one-bedroom units (averaging 668 square feet) and 96 two-bedroom units (averaging 1,038 square feet).
Las Palmas Apartments property consists of nine two-story, garden-style multifamily buildings and one single-story clubhouse/office situated on an 8.7-acre parcel in Brownsville, Texas. Built in 2002, the property contains 144 units comprised of 80 one-bedroom units (averaging 656 square feet) and 64 two-bedroom units (averaging 1,022 square feet).
The Reata Apartments property consists of nine two-story, garden-style multifamily buildings and one single-story clubhouse/office situated on a 6.3-acre parcel in Harlingen, Texas. Built in 2002, the property contains 144 units comprised of 88 one-bedroom units (averaging 660 square feet) and 56 two-bedroom units (averaging 1,026 square feet).
Common area amenities at each of the Texas Portfolio Properties include a swimming pool, picnic area and barbeque grills, fitness center, business center, covered parking and gated access.
The following table presents certain information relating to the Texas Portfolio Properties:
Property Name - Location | Allocated Cut-off Date Principal Balance | % of Portfolio Cut-off Date Principal Balance | Occupancy | Year Built/ Renovated | No. of Units | ||||||
Rincon Apartments – McAllen, TX | $14,907,000 | 47.4% | 91.4% | 2001/NAP | 232 | ||||||
Las Palmas Apartments – Brownsville, TX | $8,573,000 | 27.3% | 97.9% | 2002/NAP | 144 | ||||||
Reata Apartments – Harlingen, TX | $7,943,000 | 25.3 % | 94.4% | 2002/NAP | 144 | ||||||
| Total/Weighted Average | $31,423,000 | 100.0% | 94.0% | 520 | |||||||
The following table presents certain information relating to the unit mix of the Texas Portfolio Properties:
Apartment Unit Summary(1)
| Unit Type | No. of Units | % of Total Units | Average Unit Size (SF) | Average In-Place Monthly Rent per Unit | ||||
| 1 Bedroom | 304 | 58.5% | 667 | $749 | ||||
| 2 Bedroom | 216 | 41.5% | 1,022 | $948 | ||||
| Total/Weighted Average | 520 | 100.0% | 814 | $832 |
| (1) | Information obtained from the underwritten rent rolls. |
The following table presents historical occupancy percentages at the Texas Portfolio Properties:
Historical Occupancy
12/31/2011(1) | 12/31/2012(1) | 12/31/2013(1) | 7/21/2014(2) | |||
| 93.4% | 89.2% | 88.1% | 94.0% |
| (1) | Economic occupancy for the entirety of each calendar year. Information obtained from the borrowers. |
| (2) | Physical occupancy as of July 21, 2014. Information obtained from the borrowers. |
THE INFORMATION IN THIS STRUCTURAL AND COLLATERAL TERM SHEET IS NOT COMPLETE AND MAY BE AMENDED PRIOR TO THE TIME OF SALE. THIS TERM SHEET IS NOT AN OFFER TO SELL THESE SECURITIES AND IT IS NOT A SOLICITATION OF AN OFFER TO BUY THESE SECURITIES IN ANY JURISDICTION WHERE THE OFFER OR SALE IS NOT PERMITTED.
97
| TEXAS PORTFOLIO |
Operating History and Underwritten Net Cash Flow. The following table presents certain information relating to the historical operating performance and Underwritten Net Cash Flow at the Texas Portfolio Properties:
Cash Flow Analysis
| 2013 | TTM 6/30/2014 | U/W | U/W $ per Unit | |||||||||||||
| Base Rent | $5,211,706 | $5,165,813 | $5,161,171 | $4,833,022 | $9,294 | |||||||||||
| Grossed Up Vacant Space | 0 | 0 | 345,680 | 665 | ||||||||||||
Other Income(1) | 515,228 | 560,728 | 550,959 | 550,920 | 1,059 | |||||||||||
| Less Vacancy & Credit Loss | ) | (679,003 | ) | (558,901 | ) | (450,574 | )(2) | (866 | ) | |||||||
| Effective Gross Income | $5,047,538 | $5,153,229 | $5,279,048 | $10,152 | ||||||||||||
| Total Operating Expenses | $2,327,850 | $2,398,748 | $2,159,204 | $4,152 | ||||||||||||
| Net Operating Income | $2,719,688 | $2,754,481 | $3,119,844 | (3) | $6,000 | |||||||||||
| Capital Expenditures | 0 | 36,000 | 130,000 | 250 | ||||||||||||
| Net Cash Flow | $2,919,939 | $2,719,688 | $2,718,481 | $2,989,844 | $5,750 | |||||||||||
| NOI DSCR | 1.45x | 1.47x | 1.66x | |||||||||||||
| NCF DSCR | 1.55x | 1.45x | 1.45x | 1.59x | ||||||||||||
| NOI DY | 8.7% | 8.8% | 9.9% | |||||||||||||
| NCF DY | 9.3% | 8.7% | 8.7% | 9.5% | ||||||||||||
| (1) | Other Income is largely comprised of water/sewer reimbursements, trash reimbursements, parking and garage fees, cable television fees, late fees, pet fees and other forms of miscellaneous income. |
| (2) | The underwritten economic vacancy is 8.7%. The Texas Portfolio Properties were 94.0% physically occupied as of July 21, 2014. |
| (3) | Based on trailing 9 months collections with respect to net rental income and trailing 12 months collections with respect to Other Income. |
Appraisal. As of the appraisal valuation date of June 16, 2014, the Texas Portfolio Properties had an aggregate “as-is” appraised value of $43,750,000.
Environmental Matters. According to Phase I environmental assessments dated June 27, 2014, there was no evidence of any recognized environmental conditions at the Texas Portfolio Properties.
Market Overview. The Texas Portfolio Properties are located in the cities of McAllen, Harlingen and Brownsville, all of which are within the far southern portion of the State of Texas.
Rincon Apartments
The Rincon Apartments property is located in McAllen, Texas, within the McAllen-Edinburg-Pharr metropolitan statistical area (“McAllen MSA”). According to third-party market research reports, the McAllen MSA had an estimated population of 840,500 as of March 2014. In addition, the McAllen MSA population has grown roughly 17.5% since 2007 and is projected to increase 9.0% by 2018. The number of households within a five-mile radius of the Rincon Apartments property is expected to increase through 2019 with an annual growth rate of 1.4%. The average household income within a one-mile radius in 2014 is $68,865. The economy of the McAllen MSA is heavily influenced by its proximity to the Mexican border. Major employment sectors in the McAllen MSA are education and health services (25.7%), trade, transportation and utilities (21.4%), government (23.3%), and leisure and hospitality (9.1%). The McAllen MSA had a vacancy rate of 2.5% as of the first quarter of 2014, which is lower than the national rate of 4.1% and represents a significant decrease from a five-year high of 6.9% in 2009. Furthermore, the average asking rent for the McAllen MSA as of the first quarter of 2014 was $684 per unit per month.
Reata Apartments & Las Palmas Apartments The Reata Apartments property (Harlingen, Texas) and the Las Palmas Apartments property (Brownsville, Texas) are located within the Brownsville-Harlingen Metropolitan Statistical Area (the “Brownsville MSA”). According to third-party market research reports, the Brownsville MSA had an estimated population of 428,500 as of March 2014. In addition, the average household income within a one-mile radius of the Reata Apartments property and the Las Palmas Apartment property in 2014 is $74,403 and $44,833, respectively. The Brownsville MSA’s economy is based on international trade with Mexico through the North America Free Trade Agreement and is home to a growing manufacturing sector. The Port of Brownsville is a major economic growth driver for the region and provides an important link between the road networks of nearby Mexico and the Gulf Intracoastal Waterway of Texas. The Brownsville MSA had a vacancy rate of 4.7% as of the first quarter of 2014, which represents a significant decrease from a five-year high of 7.5% in 2009. For the same period, the average asking rent for the Brownsville MSA was $627 per unit per month. |
The Borrowers. The borrowers are AMG Rincon, LLC, AMG Reata, LLC and AMG Las Palmas, LLC, each a newly formed single purpose entity with two independent directors. Anthony Iarocci, III, Brian Gibbs, and Gary Solomon, Sr. are the guarantors of certain nonrecourse carveouts under the Texas Portfolio Mortgage Loan.
The Sponsors. The sponsors are Anthony Iarocci, III, Brian Gibbs, and Gary Solomon, Sr. Mr. Iarocci’s real estate experience has primarily been in the new construction area, having been a principal in the development of over 1,000 apartment units in the past
THE INFORMATION IN THIS STRUCTURAL AND COLLATERAL TERM SHEET IS NOT COMPLETE AND MAY BE AMENDED PRIOR TO THE TIME OF SALE. THIS TERM SHEET IS NOT AN OFFER TO SELL THESE SECURITIES AND IT IS NOT A SOLICITATION OF AN OFFER TO BUY THESE SECURITIES IN ANY JURISDICTION WHERE THE OFFER OR SALE IS NOT PERMITTED.
98
| TEXAS PORTFOLIO |
four years. Brian Gibbs is a developer, owner and operator of real estate in New Orleans. Gary Solomon, Sr. has been an active venture capitalist for the past 24 years and is currently involved with companies that employ approximately 1,200 employees. In 1991, Mr. Solomon purchased Crescent Bank & Trust which currently has $600 million in assets and 400 employees.
Escrows. The loan documents provide for upfront reserves in the amount of $360,832 for real estate taxes, $24,302 for insurance, $118,363 for deferred maintenance, $987,632 for replacement reserves and $210,950 for a renovation reserve. The renovation reserve will be primarily used to (i) complete minor roof repairs at the Las Palmas Apartments property ($13,600), the Reata Apartments property ($16,050) and the Rincon Apartments property ($21,300), (ii) add new parking spots at the Las Palmas Apartments property ($10,000), and (iii) complete ongoing interior upgrades at the Rincon Palmas Apartments property ($150,000). The loan documents also provide for ongoing monthly reserves in the amount of $45,104 for real estate taxes, $12,151 for insurance and $10,833 for replacement reserves.
Lockbox and Cash Management. The loan documents require a lender-controlled lockbox account, which is already in place, and that all cash revenues and all other monies received by the borrowers or the property manager be deposited into the lockbox account within one business day of receipt. All amounts on deposit in the lockbox account are swept on a daily basis into a lender-controlled cash management account. Prior to the occurrence of a Cash Trap Event (as defined below), all excess funds remaining on deposit in the cash management account after application to debt service and other expenses in accordance with the cash management agreement will be swept to the borrowers’ operating account. Upon the occurrence of a Cash Trap Event, all such excess funds will be swept into the excess cash flow account and held as additional collateral for the Texas Portfolio Mortgage Loan.
A “Cash Trap Event” will commence (i) upon the occurrence of an event of default, or (ii) if the aggregate debt service coverage ratio (including the debt service for the Texas Portfolio Mezzanine Loan (as defined below)) calculated based on the trailing three calendar months is less than 1.10x.
Property Management. The Texas Portfolio Properties are managed by an affiliate of the borrowers.
Assumption. Commencing on July 30, 2015, the borrowers have the right to transfer the Texas Portfolio Properties, provided that, among other things, (i) no event of default has occurred and is continuing, (ii) the proposed transferee and guarantor satisfy the lender’s credit review and underwriting standards, taking into consideration transferee’s experience, financial strength and general business standing; (iii) the Texas Portfolio Mezzanine Lender (see “Subordinate and Mezzanine Indebtedness” below) consents in writing to such transfer, (iv) a recourse guaranty and an environmental indemnity are executed by an affiliate of the transferee, and (v) rating agency confirmations are provided (or deemed provided) from each of Fitch, KBRA and Moody’s that such assumption will not result in a downgrade, withdrawal or qualification of the respective ratings assigned to the Series 2014-C22 certificates.
Partial Release. Following the lockout period, as long as no event of default has occurred and is continuing, the borrowers are permitted to release any individual property from the lien of the Texas Portfolio Mortgage Loan (in connection with a partial defeasance), subject to certain conditions, including (i) the payment of a release price equal to the greatest of (A) 115% of the allocated loan amount of the property being released, (B) the amount that would result in the debt service coverage ratio with respect to the remaining properties being no less than 1.58x, and (C) the amount that would result in the debt service coverage ratio with respect to the remaining properties being no less than the debt service coverage ratio immediately prior to the release, and (ii) rating agency confirmations are provided (or deemed provided) from each of Fitch, KBRA and Moody’s that such partial release will not result in a downgrade, withdrawal or qualification of the respective ratings assigned to the Series 2014-C22 certificates.
Real Estate Substitution. Not permitted.
Subordinate and Mezzanine Indebtedness. ColFin Texas Portfolio Funding, LLC (the “Texas Portfolio Mezzanine Lender”) has made a $5,377,000 mezzanine loan (the “Texas Portfolio Mezzanine Loan”) to AMG Mezz Borrower, LLC, the limited liability company that owns 100% of the borrowers under the Texas Portfolio Mortgage Loan. The Texas Portfolio Mezzanine Loan accrues interest at an interest rate of 9.450% per annum and requires interest-only payments for the initial 48 months of the term and, thereafter, requires payments of principal and interest based on a 30-year amortization schedule. The rights of the Texas Portfolio Mezzanine Lender are further described under “Description of the Mortgage Pool—Subordinate and/or Other Financing—Existing (Secured Financing and Mezzanine and Similar Financing)” in the Free Writing Prospectus.
Ground Lease. None.
Terrorism Insurance. The loan documents require that the “all risk” insurance policy required to be maintained by the borrowers provide coverage for terrorism in an amount equal to the full replacement cost of the Texas Portfolio Properties. The loan documents also require business interruption insurance covering no less than the 12-month period following the occurrence of a casualty event, together with a six-month extended period of indemnity.
THE INFORMATION IN THIS STRUCTURAL AND COLLATERAL TERM SHEET IS NOT COMPLETE AND MAY BE AMENDED PRIOR TO THE TIME OF SALE. THIS TERM SHEET IS NOT AN OFFER TO SELL THESE SECURITIES AND IT IS NOT A SOLICITATION OF AN OFFER TO BUY THESE SECURITIES IN ANY JURISDICTION WHERE THE OFFER OR SALE IS NOT PERMITTED.
99
HILTON LEXINGTON DOWNTOWN |

THE INFORMATION IN THIS STRUCTURAL AND COLLATERAL TERM SHEET IS NOT COMPLETE AND MAY BE AMENDED PRIOR TO THE TIME OF SALE. THIS TERM SHEET IS NOT AN OFFER TO SELL THESE SECURITIES AND IT IS NOT A SOLICITATION OF AN OFFER TO BUY THESE SECURITIES IN ANY JURISDICTION WHERE THE OFFER OR SALE IS NOT PERMITTED.
100
HILTON LEXINGTON DOWNTOWN |
THE INFORMATION IN THIS STRUCTURAL AND COLLATERAL TERM SHEET IS NOT COMPLETE AND MAY BE AMENDED PRIOR TO THE TIME OF SALE. THIS TERM SHEET IS NOT AN OFFER TO SELL THESE SECURITIES AND IT IS NOT A SOLICITATION OF AN OFFER TO BUY THESE SECURITIES IN ANY JURISDICTION WHERE THE OFFER OR SALE IS NOT PERMITTED.
101
| No. 10 – Hilton Lexington Downtown | |||||||
| Loan Information | Property Information | ||||||
| Mortgage Loan Seller: | Wells Fargo Bank, National Association | Single Asset/Portfolio: | Single Asset | ||||
Credit Assessment (Fitch/KBRA/Moody’s): | NR/NR/NR | Property Type: | Hospitality | ||||
| Original Principal Balance: | $28,420,000 | Specific Property Type: | Full Service | ||||
| Cut-off Date Principal Balance: | $28,420,000 | Location: | Lexington, KY | ||||
| % of Initial Pool Balance: | 1.9% | Size: | 366 rooms | ||||
| Loan Purpose: | Acquisition | Cut-off Date Principal Balance Per Room: | $77,650 | ||||
| Borrower Name: | Lexington Downtown Hotel, LLC | Year Built/Renovated: | 1982/2010 | ||||
| Sponsor: | Lexington Downtown Hotel Investment, LLC | Title Vesting: | Fee | ||||
| Mortgage Rate: | 4.130% | Property Manager: | New Castle Hotels & Resorts | ||||
| Note Date: | June 19, 2014 | 3rd Most Recent Occupancy (As of): | 58.7% (12/31/2011) | ||||
| Anticipated Repayment Date: | NAP | 2nd Most Recent Occupancy (As of): | 65.1% (12/31/2012) | ||||
| Maturity Date: | July 11, 2019 | Most Recent Occupancy (As of): | 69.0% (12/31/2013) | ||||
| IO Period: | 36 months | Current Occupancy (As of): | 68.5% (4/30/2014) | ||||
| Loan Term (Original): | 60 months | ||||||
| Seasoning: | 2 months | Underwriting and Financial Information: | |||||
| Amortization Term (Original): | 360 months | ||||||
| Loan Amortization Type: | Interest-only, Amortizing Balloon | 3rd Most Recent NOI (As of): | $3,018,246 (12/31/2012) | ||||
| Interest Accrual Method: | Actual/360 | 2nd Most Recent NOI (As of): | $3,719,414 (12/31/2013) | ||||
| Call Protection: | L(26),D(30),O(4) | Most Recent NOI (As of): | $3,790,988 (TTM 4/30/2014) | ||||
| Lockbox Type: | Hard/Springing Cash Management | ||||||
| Additional Debt: | None | ||||||
| Additional Debt Type: | NAP | ||||||
| U/W Revenues: | $16,547,442 | ||||||
| U/W Expenses: | $12,695,992 | ||||||
| U/W NOI: | $3,851,450 | ||||||
Escrows and Reserves(1): | U/W NCF: | $3,189,552 | |||||
| U/W NOI DSCR: | 2.33x | ||||||
Type: | Initial | Monthly | Cap (If Any) | U/W NCF DSCR: | 1.93x | ||
| Taxes | $174,996 | $19,444 | NAP | U/W NOI Debt Yield: | 13.6% | ||
| Insurance | $0 | Springing | NAP | U/W NCF Debt Yield: | 11.2% | ||
| FF&E | $0 | (1) | NAP | As-Is Appraised Value: | $41,000,000 | ||
| PIP Reserve | $1,800,000 | Springing | NAP | As-Is Appraisal Valuation Date: | May 27, 2014 | ||
| Parking Rent Reserve | $56,250 | Springing | NAP | Cut-off Date LTV Ratio: | 69.3% | ||
| Seasonality Reserve | $249,951 | $35,707 | $249,951 | LTV Ratio at Maturity or ARD: | 67.0% | ||
| (1) | See “Escrows” section. |
The Mortgage Loan. The mortgage loan (the “Hilton Lexington Downtown Mortgage Loan”) is evidenced by a single promissory note that is secured by a first mortgage encumbering the fee interest in a full service hotel located in Lexington, Kentucky (the “Hilton Lexington Downtown Property”). The Hilton Lexington Downtown Mortgage Loan was originated on June 19, 2014 by Wells Fargo Bank, National Association. The Hilton Lexington Downtown Mortgage Loan had an original principal balance of $28,420,000, has an outstanding principal balance as of the Cut-off Date of $28,420,000 and accrues interest at an interest rate of 4.130% per annum. The Hilton Lexington Downtown Mortgage Loan had an initial term of 60 months, has a remaining term of 58 months as of the Cut-off Date and requires interest-only payments for the first 36 payments following origination and, thereafter, requires payments of principal and interest based on a 30-year amortization schedule. The Hilton Lexington Downtown Mortgage Loan matures on July 11, 2019.
Following the lockout period, the borrower has the right to defease the Hilton Lexington Downtown Mortgage Loan in whole, but not in part, on any date before April 11, 2019. In addition, the Hilton Lexington Downtown Mortgage Loan is prepayable without penalty on or after April 11, 2019.
THE INFORMATION IN THIS STRUCTURAL AND COLLATERAL TERM SHEET IS NOT COMPLETE AND MAY BE AMENDED PRIOR TO THE TIME OF SALE. THIS TERM SHEET IS NOT AN OFFER TO SELL THESE SECURITIES AND IT IS NOT A SOLICITATION OF AN OFFER TO BUY THESE SECURITIES IN ANY JURISDICTION WHERE THE OFFER OR SALE IS NOT PERMITTED.
102
HILTON LEXINGTON DOWNTOWN |
Sources and Uses
| Sources | Uses | |||||||
| Original loan amount | $28,420,000 | 66.2% | Purchase price | $38,930,000 | 90.7% | |||
| Buyer credits | 2,805,000(1) | 06.5% | Reserves | 2,281,197 | 5.3 | |||
| Sponsor’s new cash contribution | 11,700,867 | 27.3% | Closing costs | 1,714,670 | 4.0 | |||
| Total Sources | $42,925,867 | 100.0% | Total Uses | $42,925,867 | 100.0% |
| (1) | Represents a $1,830,000 credit for property improvement plan (“PIP”) work and a $975,000 credit for equity rollover from the prior ownership structure. |
The Property. The Hilton Lexington Downtown Property is a 366-room full service hotel located in the central business district of Lexington, Kentucky. Built in 1982 and renovated in 2010, the Hilton Lexington Downtown Property is situated on floors 1-17 of a 22-story high rise tower; floors 18-22 comprise 38 leasehold condominium units, which are owned by a third-party through an air rights lease and are not part of the collateral. See “Description of the Mortgage Pool – Certain Characteristics of the Mortgage Pool – Condominium Structures” in the Free Writing Prospectus. The Hilton Lexington Downtown Property is part of a mixed use development which also includes a 240,000 square foot office building and the 476-space Vine Center parking garage (both properties are not part of the collateral). Through July 2038, the borrower leases and operates (via a third party vendor) the Vine Center parking garage. The Hilton Lexington Downtown Property was formerly operated as a Radisson hotel and was re-flagged to a Hilton in 2009, along with $16.0 million of capital improvements. In addition, the borrower plans to complete a $1.8 million property improvement plan (“PIP”) by February 2016. The Hilton Lexington Downtown Property comprises 366 guestrooms, including 185 king guestrooms, 173 two-queen guestrooms and eight suites. Amenities at the Hilton Lexington Downtown Property include two food and beverage outlets, room service, indoor pool, exercise room, business center and 16 conference rooms totaling 20,209 square feet. The Hilton Lexington Downtown Property is subject to a franchise agreement that expires in June 2029.
Operating History and Underwritten Net Cash Flow. The following table presents certain information relating to the historical operating performance and the Underwritten Net Cash Flow at the Hilton Lexington Downtown Property:
Cash Flow Analysis
| 2012 | 2013 | TTM 4/30/2014 | U/W | U/W $ per Room | ||||||||||||
| Occupancy | 65.1% | 69.0% | 68.5% | 68.5% | ||||||||||||
| ADR | $118.23 | $123.37 | $123.67 | $123.67 | ||||||||||||
| RevPAR | $77.02 | $85.16 | $84.76 | $84.76 | ||||||||||||
| Total Revenue | $14,832,962 | $16,316,787 | $ 16,424,935 | $16,547,442 | $45,212 | |||||||||||
| Total Department Expenses | 6,009,268 | 6,448,835 | 6,469,375 | 6,469,375 | 17,676 | |||||||||||
| Gross Operating Profit | $8,823,694 | $9,867,952 | $9,955,560 | $10,078,067 | $27,536 | |||||||||||
| Total Undistributed Expenses | 5,419,061 | 5,765,974 | 5,757,889 | 5,797,165 | 15,839 | |||||||||||
| Profit Before Fixed Charges | $3,404,633 | $4,101,978 | $4,197,671 | $4,280,902 | $11,696 | |||||||||||
| Total Fixed Charges | 386,387 | 382,564 | 406,683 | 429,452 | 1,173 | |||||||||||
| Net Operating Income | $3,018,246 | $3,719,414 | $3,790,988 | $3,851,450 | $10,523 | |||||||||||
| FF&E | 0 | 0 | 0 | 661,898 | 1,808 | |||||||||||
| Net Cash Flow | $3,018,246 | $3,719,414 | $3,790,988 | $3,189,552 | $8,715 | |||||||||||
| NOI DSCR | 1.82x | 2.25x | 2.29x | 2.33x | ||||||||||||
| NCF DSCR | 1.82x | 2.25x | 2.29x | 1.93x | ||||||||||||
| NOI DY | 10.6% | 13.1% | 13.3% | 13.6% | ||||||||||||
| NCF DY | 10.6% | 13.1% | 13.3% | 11.2% | ||||||||||||
Appraisal. As of the appraisal valuation date of May 27, 2014, the Hilton Lexington Downtown Property had an “as-is” appraised value of $41,000,000.
Environmental Matters. According to the Phase I environmental site assessment dated May 29, 2014, there was no evidence of any recognized environmental conditions at the Hilton Lexington Downtown Property.
Market Overview and Competition. The Hilton Lexington Downtown Property is located at the northeast corner of the intersection of West Vine Street and South Mill Street, in the central business district of Lexington, Kentucky. Lexington is the second largest city in Kentucky and is home to the headquarters of Lexmark International, the Kentucky Horse Park and the University of Kentucky. Primary access to the local area is provided by Interstate 75 from the north and south and Interstate 64 from the east and west. The Hilton Lexington Downtown Property is within walking distance to Rupp Arena (the University of Kentucky basketball arena), the Lexington Convention Center and an array of restaurants and nightlife. Directly adjacent to the Hilton Lexington Downtown Property is Triangle Park, which serves as a community gathering site and hosts Lexington’s Christmas tree and ice skating rink in the winter as well as outdoor concerts and festivals in the spring and summer. In addition, the Hilton Lexington Downtown Property is located less than one mile north of the main campus of the University of Kentucky.
THE INFORMATION IN THIS STRUCTURAL AND COLLATERAL TERM SHEET IS NOT COMPLETE AND MAY BE AMENDED PRIOR TO THE TIME OF SALE. THIS TERM SHEET IS NOT AN OFFER TO SELL THESE SECURITIES AND IT IS NOT A SOLICITATION OF AN OFFER TO BUY THESE SECURITIES IN ANY JURISDICTION WHERE THE OFFER OR SALE IS NOT PERMITTED.
103
HILTON LEXINGTON DOWNTOWN |
The following table presents certain information relating to the Hilton Lexington Downtown Property’s competitive set:
Subject and Market Historical Occupancy, ADR and RevPAR(1)
Competitive Set | Hilton Lexington Downtown | Penetration Factor | |||||||||||||||||
Year | Occupancy | ADR | RevPAR | Occupancy | ADR | RevPAR | Occupancy | ADR | RevPAR | ||||||||||
| 4/30/2014 TTM | 58.7% | $125.81 | $73.90 | 68.0% | $124.72 | $84.76 | 115.7% | 99.1% | 114.7% | ||||||||||
| 4/30/2013 TTM | 58.5% | $122.45 | $71.66 | 67.4% | $120.90 | $81.47 | 115.2% | 98.7% | 113.7% | ||||||||||
| 4/30/2012 TTM | 58.0% | $120.80 | $70.06 | 61.4% | $119.47 | $73.30 | 105.8% | 98.9% | 104.6% | ||||||||||
| (1) | Information obtained from a third party hospitality report dated May 19, 2014. The competitive set includes the following hotels: The Campbell House, Hyatt Regency Lexington, Marriott Griffin Gate Resort & Spa and Embassy Suites Lexington. |
The Borrower. The borrower is Lexington Downtown Hotel, LLC, a Delaware limited liability company and a single purpose entity with one independent director. Legal counsel to the borrower delivered a non-consolidation opinion in connection with the origination of the Hilton Lexington Downtown Mortgage Loan. Bryan E. Gordon and Seth M. Wolkov are the guarantors of certain nonrecourse carveouts under the Hilton Lexington Downtown Mortgage Loan.
The Sponsor. The sponsor is Lexington Downtown Hotel Investment, LLC. The executive officers of the sponsor are Bryan E. Gordon and Seth M. Wolkov, who serve as chairman/managing director and senior vice president, respectively, of Madison Capital Management. Founded in 1996, Madison Capital Management is a private investment holding company that has invested over $1 billion into a diverse portfolio of investments including hospitality and multifamily commercial real estate assets.
Escrows. The loan documents provide for an upfront real estate tax escrow in the amount of $174,996 and ongoing monthly escrows of $19,444.
The loan documents provide for an upfront escrow in the amount of $1,800,000 for a PIP reserve. Additional deposits into the PIP Reserve may be required if the lender determines in its reasonable discretion that any future PIP work may be required. Future deposits into the PIP Reserve shall be in an amount equal to 125% of the estimated costs to complete such additional PIP work.
The loan documents provide for an upfront escrow in the amount of $56,250, which represents three months’ rent for the parking structure located adjacent to the Hilton Lexington Downtown Property, which the borrower leases in its entirety. If disbursements are made from the Parking Rent Reserve due to insufficient cash flow from the Hilton Lexington Downtown Property to pay the rent then due under the parking agreement, the borrower shall replenish the account on the following monthly payment date.
The loan documents provide for an upfront escrow in the amount of $249,951 for a Seasonality Reserve, which may be used for the payment of any monthly debt service payment in December or January of each year, only to the extent that there is insufficient cash flow from the Hilton Lexington Downtown Property to make such debt service payment or pay operating expenses. The borrower is also required to make deposits of $35,707 into the Seasonality Reserve account in February, March, April, May, September, October and November of each year (subject to a cap of $249,951).
Ongoing monthly reserves for insurance are not required as long as (i) no event of default has occurred and is continuing; (ii) the Hilton Lexington Downtown Property is covered by an acceptable blanket insurance policy; and (iii) the borrower provides the lender with evidence of renewal of the insurance policies and timely proof of payment of insurance premiums.
Prior to February 2016, ongoing monthly FF&E reserves are not required as long as no event of default has occurred and is continuing. Commencing February 2016, ongoing monthly FF&E reserves are required in an amount equal to one-twelfth of 4.0% of gross revenue for the prior fiscal year.
Lockbox and Cash Management. The Hilton Lexington Downtown Mortgage Loan requires a lender-controlled lockbox account, which is already in place, and that the borrower and property manager cause all receipts payable with respect to the Hilton Lexington Downtown Property to be deposited directly into the lockbox account. The loan documents also require all revenues received by the borrower or the property manager to be deposited into the lockbox account within one business day of receipt. Prior to the occurrence of a Cash Trap Event Period (as defined below), all funds on deposit in the lockbox account are swept to the borrower’s operating account on a monthly basis. During a Cash Trap Event Period, all funds on deposit in the lockbox account are swept to a lender-controlled cash management account on a monthly basis.
A “Cash Trap Event Period” will commence upon the earlier of (i) the occurrence and continuance of an event of default or (ii) the amortizing debt service coverage ratio falling below 1.15x at the end of any calendar month (unless, within 10 business days, the borrower provides the lender with a letter of credit in an amount which, if applied to the outstanding principal balance of the Hilton Lexington Downtown Mortgage Loan, would cause the debt service coverage ratio to be equal to or greater than 1.15x). A Cash Trap Event Period will expire, with regard to clause (i), upon the cure of such event of default, or with regard to clause (ii), upon the amortizing debt service coverage ratio being equal to or greater than 1.20x for one calendar quarter.
Property Management. The Hilton Lexington Downtown Property is managed by New Castle Hotels & Resorts.
THE INFORMATION IN THIS STRUCTURAL AND COLLATERAL TERM SHEET IS NOT COMPLETE AND MAY BE AMENDED PRIOR TO THE TIME OF SALE. THIS TERM SHEET IS NOT AN OFFER TO SELL THESE SECURITIES AND IT IS NOT A SOLICITATION OF AN OFFER TO BUY THESE SECURITIES IN ANY JURISDICTION WHERE THE OFFER OR SALE IS NOT PERMITTED.
104
HILTON LEXINGTON DOWNTOWN |
Assumption. The borrower has the two-time right to transfer the Hilton Lexington Downtown Property provided that certain conditions are satisfied, including (i) no event of default has occurred and is continuing; (ii) the lender reasonably determines that the proposed transferee and guarantor satisfy the lender’s credit review and underwriting standards, taking into consideration transferee experience, financial strength and general business standing; and (iii) the lender has received confirmation from Fitch, KBRA and Moody’s that such assumption will not result in a downgrade, withdrawal or qualification of the respective ratings assigned to the Series 2014-C22 Certificates.
Partial Release. Not permitted.
Real Estate Substitution. Not permitted.
Subordinate and Mezzanine Indebtedness. Not permitted.
Ground Lease. None.
Terrorism Insurance. The loan documents require that the “all risk” insurance policy required to be maintained by the borrower provide coverage for terrorism in an amount equal to the full replacement cost of the Hilton Lexington Downtown Property, as well as business interruption insurance covering no less than the 18-month period following the occurrence of a casualty event, together with a six-month extended period of indemnity.
THE INFORMATION IN THIS STRUCTURAL AND COLLATERAL TERM SHEET IS NOT COMPLETE AND MAY BE AMENDED PRIOR TO THE TIME OF SALE. THIS TERM SHEET IS NOT AN OFFER TO SELL THESE SECURITIES AND IT IS NOT A SOLICITATION OF AN OFFER TO BUY THESE SECURITIES IN ANY JURISDICTION WHERE THE OFFER OR SALE IS NOT PERMITTED.
105
No. 11 – States Addition Apartments | ||||||
| Loan Information | Property Information | |||||
| Mortgage Loan Seller: | Liberty Island Group I LLC | Single Asset/Portfolio: | Single Asset | |||
| Credit Assessment (Fitch/KBRA/Moody’s): | NR/NR/NR | Property Type: | Multifamily | |||
| Original Principal Balance: | $28,000,000 | Specific Property Type: | Garden | |||
| Cut-off Date Principal Balance: | $28,000,000 | Location: | Dickinson, ND | |||
| % of Initial Pool Balance: | 1.9% | Size: | 235 units | |||
| Loan Purpose: | Acquisition | Cut-off Date Principal Balance Per Unit: | $119,149 | |||
Borrower Names(1): | Dakota West 235, LLC and UOPG, LLC | Year Built/Renovated(2): | 2010-2013/NAP | |||
| Sponsors: | Chris Vrame, Patrick Gardner, and Gus C. Gianulias | Title Vesting: | Fee | |||
| Mortgage Rate: | 5.010% | Property Manager: | Roers Property Management, LLC | |||
| Note Date: | August 20, 2014 | 3rd Most Recent Occupancy: | NAV | |||
| Anticipated Repayment Date: | NAP | 2nd Most Recent Occupancy (As of): | 99.5% (12/31/2012) | |||
| Maturity Date: | September 1, 2021 | Most Recent Occupancy (As of): | 99.2% (12/31/2013) | |||
| IO Period: | None | Current Occupancy (As of): | 100.0% (3/31/2014) | |||
| Loan Term (Original): | 84 months | |||||
| Seasoning: | 0 months | Underwriting and Financial Information: | ||||
| Amortization Term (Original): | 276 months | |||||
| Loan Amortization Type: | Amortizing Balloon | 3rd Most Recent NOI (As of): | $2,456,032 (12/31/2012) | |||
| Interest Accrual Method: | Actual/360 | 2nd Most Recent NOI (As of): | $3,029,152 (12/31/2013) | |||
| Call Protection: | L(25), GRTR 1% or YM(55),O(4) | Most Recent NOI (As of): | $3,037,517 (TTM 3/31/2014) | |||
| Lockbox Type: | Soft/Springing Cash Management | |||||
| Additional Debt: | None | |||||
| Additional Debt Type: | NAP | U/W Revenues: | $4,054,250 | |||
| U/W Expenses: | $965,179 | |||||
| U/W NOI: | $3,089,071 | |||||
| U/W NCF: | $3,036,196 | |||||
| U/W NOI DSCR: | 1.50x | |||||
Escrows and Reserves: | U/W NCF DSCR: | 1.48x | ||||
| U/W NOI Debt Yield: | 11.0% | |||||
Type: | Initial | Monthly | Cap (If Any) | U/W NCF Debt Yield: | 10.8% | |
| Taxes | $213,255 | $23,695 | NAP | As-Is Appraised Value: | $41,000,000 | |
| Insurance | $18,852 | $6,284 | NAP | As-Is Appraisal Valuation Date: | May 15, 2014 | |
| Replacement Reserves | $4,410 | $4,410 | NAP | Cut-off Date LTV Ratio: | 68.3% | |
| LTV Ratio at Maturity or ARD: | 55.4% | |||||
| (1) | An affiliate of the borrower, States Addition Properties, LLC, acts as master tenant of the States Addition Apartments Property via a master lease agreement. |
| (2) | Construction of the buildings commenced in 2010 and was completed in 2013. |
The States Addition Apartments mortgage loan is evidenced by a single promissory note that is secured by a first mortgage encumbering three contiguous multifamily properties containing a total of eight garden/low-rise buildings located in Dickinson, North Dakota (the “States Addition Apartments Property”). The complexes were built between 2010 and 2013, and comprise 235 units totaling 242,279 square feet. The unit mix is made up of 43 one bedroom/one bathroom units, eight two bedroom/one bathroom units, 143 two bedroom/two bathroom units, 40 three bedroom/two bathroom units, and one efficiency unit. Each unit features a balcony or patio, air conditioning, dishwasher, and in-unit washer/dryers.
The States Addition Apartments Property is located off of Interstate 94. St. Joseph’s Hospital, the primary hospital in the region, is building a new $85.0 million facility a few blocks northeast of the States Addition Apartments Property. Sanford Health recently opened a clinic less than one mile northeast from the States Addition Apartments Property. A new retail property, which will include a movie theater, is being developed west of the property across the business loop. Less than one mile northwest, a new retail center anchored by a SpartanNash grocery store and a new Menards home improvement store recently opened. Other demand drivers for the States Addition Apartments Property include Dickinson State University with less than 2,000 students enrolled and limited on-campus housing, a community recreation center, and a baseball field complex, located a few blocks to the east.
THE INFORMATION IN THIS STRUCTURAL AND COLLATERAL TERM SHEET IS NOT COMPLETE AND MAY BE AMENDED PRIOR TO THE TIME OF SALE. THIS TERM SHEET IS NOT AN OFFER TO SELL THESE SECURITIES AND IT IS NOT A SOLICITATION OF AN OFFER TO BUY THESE SECURITIES IN ANY JURISDICTION WHERE THE OFFER OR SALE IS NOT PERMITTED.
106
STATES ADDITION APARTMENTS |
Sources and Uses
| Sources | Uses | ||||||||
| Original loan amount | $28,000,000 | 68.6% | Purchase price | $40,000,000 | 98.0 | % | |||
| Sponsor’s new cash contribution | 12,800,285 | 31.4 | Reserves | 236,517 | 0.6 | ||||
| Closing Costs | 563,768 | 1.4 | |||||||
| Total Sources | $40,800,285 | 100.0% | Total Uses | $40,800,285 | 100.0 | % |
The following table presents certain information relating to the unit mix of the States Addition Apartments Property:
Unit Mix Summary(1)
| Unit Type | No. of Units | % of Total Units | Average Unit Size (SF) | U/W Average Rent | |||||||
1 Bedroom/1 Bathroom | 43 | 18.3 | % | 778 | $1,112 | ||||||
2 Bedroom/1 Bathroom | 8 | 3.4 | % | 1,065 | $1,357 | ||||||
2 Bedroom/2 Bathroom | 143 | 60.9 | % | 1,065 | $1,581 | ||||||
3 Bedroom/2 Bathroom | 40 | 17.0 | % | 1,173 | $1,696 | ||||||
Efficiency Unit(2) | 1 | 0.4 | % | 308 | NAV | ||||||
| Total/Weighted Average | 235 | 100.0 | % | 1,028 | $1,506 | ||||||
| (1) | Information obtained from the underwritten rent roll. |
| (2) | Efficiency unit not included in underwriting. |
The following table presents historical occupancy percentages at the States Addition Apartments Property:
Historical Occupancy
12/31/2011(1) | 12/31/2012(2) | 12/31/2013(2) | 3/31/2014(3) | |||
| NAV | 99.5% | 99.2% | 100.0% |
| (1) | Occupancy unavailable during lease-up period. |
| (2) | Information obtained from underwritten rent roll. |
| (3) | Information obtained from the borrower. |
Operating History and Underwritten Net Cash Flow. The following table presents certain information relating to the historical operating performance and the Underwritten Net Cash Flow at the States Addition Apartments Property:
Cash Flow Analysis
| 2012 | 2013 | TTM 3/31/2014 | U/W | U/W $ per Unit | ||||||||||||
| Base Rent | $3,128,015 | $3,993,976 | $4,035,001 | $4,219,800 | $17,957 | |||||||||||
| Grossed Up Vacant Space | 0 | 0 | 0 | 0 | 0 | |||||||||||
| Less Concessions | 0 | 0 | 0 | 0 | 0 | |||||||||||
| Other Income | 33,875 | 56,679 | 45,440 | 45,440 | 193 | |||||||||||
| Less Vacancy & Credit Loss | (15,635) | (42,569) | (31,328) | (210,990)(1) | (898) | |||||||||||
| Effective Gross Income | $3,146,255 | $4,008,086 | $4,049,113 | $4,054,250 | $17,252 | |||||||||||
| Total Operating Expenses | $690,223 | $978,934 | $1,011,596 | $965,179 | $4,107 | |||||||||||
| Net Operating Income | $2,456,032 | $3,029,152 | $3,037,517 | $3,089,071 | $13,145 | |||||||||||
| Replacement Reserves | 0 | 0 | 0 | 52,875 | 225 | |||||||||||
| Net Cash Flow | $2,456,032 | $3,029,152 | $3,037,517 | $3,036,196 | $12,920 | |||||||||||
| NOI DSCR | 1.20x | 1.48x | 1.48x | 1.50x | ||||||||||||
| NCF DSCR | 1.20x | 1.48x | 1.48x | 1.48x | ||||||||||||
| NOI DY | 8.8% | 10.8% | 10.8% | 11.0% | ||||||||||||
| NCF DY | 8.8% | 10.8% | 10.8% | 10.8% | ||||||||||||
| (1) | The underwritten economic vacancy is 5.0%. The States Addition Apartments Property was 100.0% physically occupied as of March 31, 2014. |
THE INFORMATION IN THIS STRUCTURAL AND COLLATERAL TERM SHEET IS NOT COMPLETE AND MAY BE AMENDED PRIOR TO THE TIME OF SALE. THIS TERM SHEET IS NOT AN OFFER TO SELL THESE SECURITIES AND IT IS NOT A SOLICITATION OF AN OFFER TO BUY THESE SECURITIES IN ANY JURISDICTION WHERE THE OFFER OR SALE IS NOT PERMITTED.
107
| No. 12 – North Valley Plaza | ||||||||
| Loan Information | Property Information | |||||||
| Mortgage Loan Seller: | Wells Fargo Bank, National Association | Single Asset/Portfolio: | Single Asset | |||||
Credit Assessment (Fitch/KBRA/Moody’s): | NR/NR/NR | Property Type: | Retail | |||||
| Original Principal Balance: | $27,785,000 | Specific Property Type: | Anchored | |||||
| Cut-off Date Principal Balance: | $27,785,000 | Location: | Chico, CA | |||||
| % of Initial Pool Balance: | 1.9% | Size: | 241,419 SF | |||||
| Loan Purpose: | Refinance | Cut-off Date Principal Balance Per SF: | $115.09 | |||||
| Borrower Name: | North Valley Mall II, LLC | Year Built/Renovated: | 1968/2005 | |||||
Sponsor(1): | Various | Title Vesting: | Fee | |||||
| Mortgage Rate: | 4.410% | Property Manager: | Talon Property Management, LLC | |||||
| Note Date: | June 27, 2014 | 3rd Most Recent Occupancy (As of)(6): | 59.8% (12/31/2011) | |||||
| Anticipated Repayment Date: | NAP | 2nd Most Recent Occupancy (As of) (6): | 59.2% (12/31/2012) | |||||
| Maturity Date: | July 11, 2024 | Most Recent Occupancy (As of)(6): | 70.5% (12/31/2013) | |||||
| IO Period: | 24 months | Current Occupancy (As of)(6): | 86.7% (6/16/2014) | |||||
| Loan Term (Original): | 120 months | |||||||
| Seasoning: | 2 months | Underwriting and Financial Information: | ||||||
| Amortization Term (Original): | 360 months | |||||||
| Loan Amortization Type: | Interest-only, Amortizing Balloon | 3rd Most Recent NOI (As of): | $1,786,590 (12/31/2012) | |||||
| Interest Accrual Method: | Actual/360 | 2nd Most Recent NOI (As of): | $2,008,322 (12/31/2013) | |||||
| Call Protection: | L(26),D(90),O(4) | Most Recent NOI (As of): | $2,177,757 (TTM 4/30/2014) | |||||
| Lockbox Type: | Hard/Upfront Cash Management | |||||||
| Additional Debt: | None | |||||||
| Additional Debt Type: | NAP | U/W Revenues: | $3,999,485 | |||||
| U/W Expenses: | $986,290 | |||||||
U/W NOI(7): | $3,013,196 | |||||||
Escrows and Reserves: | U/W NCF: | $2,789,785 | ||||||
| U/W NOI DSCR: | 1.80x | |||||||
| Type: | Initial | Monthly | Cap (If Any) | U/W NCF DSCR: | 1.67x | |||
| Taxes | $51,458 | $25,729 | NAP | U/W NOI Debt Yield: | 10.8% | |||
| Insurance | $0 | $4,719 | NAP | U/W NCF Debt Yield: | 10.0% | |||
| Replacement Reserves | $0 | $4,627 | NAP | As-Is Appraised Value: | $44,000,000 | |||
| TI/LC Reserve | $0 | $13,963 | $700,000(2) | As-Is Appraisal Valuation Date: | May 20, 2014 | |||
Tenant Specific TI/LC Reserve(3) | $1,994,734 | $0 | NAP | Cut-off Date LTV Ratio: | 63.1% | |||
Free Rent Reserve(4) | $520,036 | $0 | NAP | LTV Ratio at Maturity or ARD: | 53.8% | |||
Starbucks Reserve(5) | $600,000 | $0 | NAP | |||||
| (1) | The sponsors are Lucia Parks and Richard Parks as individuals and as trustees of the Parks Family Trust. Lucia Parks and Richard Parks filed Chapter 11 bankruptcy in 2009 and 2010. In addition, Lucia Parks and Richard Parks were involved with a loan re-structuring in 2011, which was related to the North Valley Plaza Property, and a deed-in-lieu of foreclosure in 2012. See “Description of the Mortgage Pool – Default History, Bankruptcy Issues and Other Proceedings” in the Free Writing Prospectus. |
| (2) | The TI/LC Reserve will be capped at $700,000 as long as (i) no event of default has occurred and is continuing or (ii) the amortizing net cash flow DSCR is greater than 1.25x. |
| (3) | Upfront Tenant Specific TI/LC Reserves are required for Sportsman’s Warehouse ($1,218,660), 99¢ Only Stores ($417,323), Galaxies Sports Bar ($180,000) and Buffalo Wild Wings ($178,750). |
| (4) | Upfront Free Rent Reserves are required for Galaxies Sports Bar ($233,211), 99¢ Only Stores ($185,610) and Buffalo Wild Wings ($104,215). |
| (5) | The upfront Starbucks Reserve is required for the development of a pad site for Starbucks. Lender will disburse (i) $400,000 upon (a) receipt of an executed lease acceptable to lender and (b) evidence that all required permits have been received; and (ii) $200,000 upon (a) confirmation that no liens exist as a result of the construction and (b) receipt of a certificate of occupancy. |
| (6) | See “Historical Occupancy” section. |
| (7) | See “Cash Flow Analysis” section. |
The North Valley Plaza mortgage loan is evidenced by a single promissory note that is secured by a first mortgage encumbering a 241,419 square foot anchored retail center (the “North Valley Plaza Property”) located in Chico, California. The North Valley Plaza Property, originally built in 1968 as an enclosed mall, was redeveloped as an open air community center in 2001, and additional shop space was added in 2005. The North Valley Plaza Property comprises seven single-story retail buildings situated on a 33.6-acre site. The North Valley Plaza Property is anchored by a 14-screen Cinemark movie theater, Sportsman’s Warehouse, Goodwill Industries and 99¢ Only Stores, and includes five pad sites that are ground leased by Buffalo Wild Wings, Galaxies Sports Bar & Grill, Panda Express, Taco Bell and Wendy’s. The North Valley Plaza Property features 1,931 surface parking spaces, resulting in a parking ratio of 8.0 spaces per 1,000 square feet of rentable area. The North Valley Plaza Property was 86.7% leased to 26 tenants as of June 16, 2014.
THE INFORMATION IN THIS STRUCTURAL AND COLLATERAL TERM SHEET IS NOT COMPLETE AND MAY BE AMENDED PRIOR TO THE TIME OF SALE. THIS TERM SHEET IS NOT AN OFFER TO SELL THESE SECURITIES AND IT IS NOT A SOLICITATION OF AN OFFER TO BUY THESE SECURITIES IN ANY JURISDICTION WHERE THE OFFER OR SALE IS NOT PERMITTED.
108
NORTH VALLEY PLAZA |
Sources and Uses
| Sources | Uses | ||||||||
| Original loan amount | $27,785,000 | 100.0% | Loan Payoff | $24,037,352 | 86.5 | % | |||
| Reserves | 3,166,228 | 11.4 | |||||||
| Closing costs | 549,815 | 0 2.0 | % | ||||||
| Return of equity | 31,605 | 0.1 | |||||||
| Total Sources | $27,785,000 | 100.0% | Total Uses | $27,785,000 | 100.0 | % | |||
The following table presents certain information relating to the tenancy at the North Valley Plaza Property:
Major Tenants
| Tenant Name | Credit Rating (Fitch/ Moody’s/ S&P)(1) | Tenant NRSF | % of NRSF | Annual U/W Base Rent PSF | Annual U/W Base Rent | % of Total Annual U/W Base Rent | Sales PSF | Occupancy Cost | Lease Expiration Date | |||||||||
| Anchor Tenants | ||||||||||||||||||
Cinemark | NR/NR/BB- | 50,494 | 20.9% | $11.50 | $580,681 | 18.4% | (2) | 10.8% | 9/30/2019 | |||||||||
Sportsman’s Warehouse | NR/NR/B+ | 40,622 | 16.8% | $9.00 | $365,598 | 11.6% | NAV | NAV | 5/31/2024(3) | |||||||||
Goodwill Industries | NR/NR/NR | 26,432 | 10.9% | $9.60 | $253,747 | 8.0% | NAV | NAV | 10/21/2023 | |||||||||
99¢ Only Stores(4) | NR/NR/NR | 18,176 | 7.5% | $12.50 | $227,200 | 7.2% | NAV | NAV | 9/30/2024(5) | |||||||||
| Total Anchor Tenants | 135,724 | 56.2% | $10.52 | $1,427,226 | 45.2% | |||||||||||||
| Major Tenants | ||||||||||||||||||
Galaxies Sports Bar & Restaurant(6) | NR/NR/NR | (7) | (7) | (7) | $180,000 | 5.7% | NAV | NAV | 5/31/2030 | |||||||||
Bank of America | A/Baa2/A- | 7,260 | 3.0% | $23.10 | $167,706 | 5.3% | NAV | NAV | 12/31/2018 | |||||||||
Trader Joes | NR/NR/NR | 12,130 | 5.0% | $12.00 | $145,560 | 4.6% | NAV | NAV | 1/31/2016 | |||||||||
| Total Major Tenants | 19,390 | 8.0% | $25.44(7) | $493,266 | 15.6% | |||||||||||||
| Non-Major Tenants | 54,150 | 22.4% | $22.89 | $1,239,503 | 39.2% | |||||||||||||
| Occupied Collateral Total | 209,259 | 86.7% | $15.10(7) | $3,159,995 | 100.0% | |||||||||||||
| Vacant Space | 32,160 | 13.3% | ||||||||||||||||
| Collateral Total | 241,419 | 100.0% | ||||||||||||||||
| (1) | Credit Ratings are those of the parent company whether or not the parent guarantees the lease. |
| (2) | Cinemark generated gross sales of $7,141,216 ($510,087 per screen) for the trailing 12-month period ending December 31, 2013. |
| (3) | Sportsman’s Warehouse may terminate its lease with 60 days’ notice if gross sales do not exceed $8,000,000 (approximately $197 per square foot) in the fifth lease year (anticipated to end May 31, 2019). The tenant took occupancy in June 2014 and sales information is not yet available. |
| (4) | 99¢ Only Stores is currently completing its buildout and once buildout is complete, the tenant is allowed a 90 day free rent period. 99¢ Only Stores is expected to commence rent payments in January 2015 and lender has reserved an amount equal to nine months’ rent. |
| (5) | 99¢ Only Stores may terminate its lease with 180 days’ notice if gross annual sales are less than $3,000,000 (approximately $165 per square foot) for the third year following the lease commencement date (anticipated to be October 2014). However, the termination cannot be effective prior to the fifth lease year or later than the sixth lease year. If the tenant exercises its termination option, the tenant must pay a termination fee equal to all unamortized leasing commissions incurred by the landlord and the unamortized portion of the tenant improvement allowance. |
| (6) | Galaxies Sports Bar & Restaurant executed a lease in May 2014 and has 270 days to obtain all necessary permits and complete planned construction. Tenant may terminate its lease if it is not able to obtain all necessary permits and licenses within the 270 day period. Rental payments are anticipated to commence June 2015. Lender has reserved an amount equal to one year’s rent. |
| (7) | Galaxies Sports Bar & Restaurant owns its own improvements and is the lessee under a ground lease from the borrower, which has no attributed square footage. The Annual U/W Base Rent PSF for Total Major Tenants and Occupied Collateral Total exclude the Annual U/W Base Rent PSF associated with the tenant. |
THE INFORMATION IN THIS STRUCTURAL AND COLLATERAL TERM SHEET IS NOT COMPLETE AND MAY BE AMENDED PRIOR TO THE TIME OF SALE. THIS TERM SHEET IS NOT AN OFFER TO SELL THESE SECURITIES AND IT IS NOT A SOLICITATION OF AN OFFER TO BUY THESE SECURITIES IN ANY JURISDICTION WHERE THE OFFER OR SALE IS NOT PERMITTED.
109
NORTH VALLEY PLAZA |
The following table presents certain information relating to the lease rollover schedule at the North Valley Plaza Property:
Lease Expiration Schedule(1)(2)
Year Ending December 31, | No. of Leases Expiring | Expiring NRSF | % of Total NRSF | Cumulative Expiring NRSF | Cumulative % of Total NRSF | Annual U/W Base Rent | Annual U/W Base Rent PSF(3) | ||||||||
| MTM | 2 | 2,700 | 1.1% | 2,700 | 1.1% | $74,520 | $27.60 | ||||||||
| 2014 | 1 | 13,898 | 5.8% | 16,598 | 6.9% | $86,862 | $6.25 | ||||||||
| 2015 | 4 | 9,284 | 3.8% | 25,882 | 10.7% | $194,990 | $21.00 | ||||||||
| 2016 | 4 | 22,250 | 9.2% | 48,132 | 19.9% | $303,827 | $13.66 | ||||||||
| 2017 | 1 | 1,524 | 0.6% | 49,656 | 20.6% | $40,234 | $26.40 | ||||||||
| 2018 | 3 | 15,873 | 6.6% | 65,529 | 27.1% | $348,379 | $21.95 | ||||||||
| 2019 | 2 | 54,334 | 22.5% | 119,863 | 49.6% | $640,681 | $11.79 | ||||||||
| 2020 | 0 | 0 | 0.0% | 119,863 | 49.6% | $0 | $0.00 | ||||||||
| 2021 | 1 | 4,166 | 1.7% | 124,029 | 51.4% | $128,697 | $30.89 | ||||||||
| 2022 | 0 | 0 | 0.0% | 124,029 | 51.4% | $0 | $0.00 | ||||||||
| 2023 | 1 | 26,432 | 10.9% | 150,461 | 62.3% | $253,747 | $9.60 | ||||||||
| 2024 | 2 | 58,798 | 24.4% | 209,259 | 86.7% | $592,798 | $10.08 | ||||||||
| Thereafter | 5 | 0(4) | 0.0% | 209,259 | 86.7% | $495,259 | $0.00(4) | ||||||||
| Vacant | 0 | 32,160 | 13.3% | 241,419 | 100.0% | $0 | $0.00 | ||||||||
| Total/Weighted Average | 26 | 241,419 | 100.0% | $3,159,995 | $15.10(4) |
| (1) | Information obtained from the underwritten rent roll. |
| (2) | Certain tenants may have lease termination options that are exercisable prior to the originally stated expiration date of the subject lease and that are not considered in the Lease Expiration Schedule. |
| (3) | Weighted Average Annual U/W Base Rent PSF excludes vacant space. |
| (4) | Galaxies Sports Bar & Restaurant, Buffalo Wild Wing’s, Panda Express, Wendy’s and Taco Bell own their own improvements and have no attributed square footage. The Annual U/W Base Rent PSF excludes the Annual U/W Base Rent PSF associated with those tenants. |
The following table presents historical occupancy percentages at the North Valley Plaza Property:
Historical Occupancy
12/31/2011(1) | 12/31/2012(1) | 12/31/2013(1) | 6/16/2014(2) | |||
59.8%(3) | 59.2% | 70.5%(4) | 86.7%(5) |
| (1) | Information obtained from the borrower. |
| (2) | Information obtained from the underwritten rent roll. |
| (3) | Mervyn’s (34.6% of the net rentable area) declared bankruptcy in 2008 and vacated. |
| (4) | Goodwill Industries (10.9% of the net rentable area) took occupancy. |
| (5) | Sportsman’s Warehouse (16.8% of the net rentable area) took occupancy. |
THE INFORMATION IN THIS STRUCTURAL AND COLLATERAL TERM SHEET IS NOT COMPLETE AND MAY BE AMENDED PRIOR TO THE TIME OF SALE. THIS TERM SHEET IS NOT AN OFFER TO SELL THESE SECURITIES AND IT IS NOT A SOLICITATION OF AN OFFER TO BUY THESE SECURITIES IN ANY JURISDICTION WHERE THE OFFER OR SALE IS NOT PERMITTED.
110
NORTH VALLEY PLAZA |
Operating History and Underwritten Net Cash Flow. The following table presents certain information relating to the historical operating performance and the Underwritten Net Cash Flow at the North Valley Plaza Property:
Cash Flow Analysis
| 2012 | 2013 | TTM 4/30/2014 | U/W | U/W $ per SF | |||||||||||
| Base Rent | $2,164,584 | $2,341,252 | $2,299,793 | $3,159,995 | $13.09 | ||||||||||
| Grossed Up Vacant Space | 0 | 0 | 0 | 507,234 | 2.10 | ||||||||||
| Total Reimbursables | 365,020 | 289,785 | 291,279 | 621,083 | 2.57 | ||||||||||
| Percentage Rent | 181,357 | 233,909 | 234,259 | 218,407 | 0.90 | ||||||||||
| Less Vacancy & Credit Loss | 0 | 0 | 0 | (507,234)(1) | (2.10) | ||||||||||
| Effective Gross Income | $2,710,960 | $2,864,946 | $2,825,330 | $3,999,485(2) | $16.57 | ||||||||||
| Total Operating Expenses | $924,370 | $856,624 | $647,574 | $986,290 | $4.09 | ||||||||||
| Net Operating Income | $1,786,590 | $2,008,322 | $2,177,757 | $3,013,196(2) | $12.48 | ||||||||||
| TI/LC | 0 | 0 | 0 | 167,883 | 0.70 | ||||||||||
| Capital Expenditures | 0 | 0 | 0 | 55,528 | 0.23 | ||||||||||
| Net Cash Flow | $1,786,590 | $2,008,322 | $2,177,757 | $2,789,785 | $11.56 | ||||||||||
| NOI DSCR | 1.07x | 1.20x | 1.30x | 1.80x | |||||||||||
| NCF DSCR | 1.07x | 1.20x | 1.30x | 1.67x | |||||||||||
| NOI DY | 6.4% | 7.2% | 7.8% | 10.8% | |||||||||||
| NCF DY | 6.4% | 7.2% | 7.8% | 10.0% |
| (1) | The underwritten economic vacancy is 13.8%. The North Valley Plaza Property was 86.7% physically occupied as of June 16, 2014. |
| (2) | The increase in U/W Effective Gross Income and U/W Net Operating Income is due to new leases signed with Sportsman’s Warehouse, 99¢ Only Stores, Galaxies Sports Bar & Restaurant and Buffalo Wild Wings which represent 27.2% of the U/W Base Rent. |
THE INFORMATION IN THIS STRUCTURAL AND COLLATERAL TERM SHEET IS NOT COMPLETE AND MAY BE AMENDED PRIOR TO THE TIME OF SALE. THIS TERM SHEET IS NOT AN OFFER TO SELL THESE SECURITIES AND IT IS NOT A SOLICITATION OF AN OFFER TO BUY THESE SECURITIES IN ANY JURISDICTION WHERE THE OFFER OR SALE IS NOT PERMITTED.
111
| No. 13 – Courtyard by Marriott - Aventura | ||||||||
| Loan Information | Property Information | |||||||
| Mortgage Loan Seller: | Wells Fargo Bank, National Association | Single Asset/Portfolio: | Single Asset | |||||
Credit Assessment (Fitch/KBRA/Moody’s): | NR/NR/NR | Property Type: | Hospitality | |||||
| Original Principal Balance: | $27,300,000 | Specific Property Type: | Limited Service | |||||
| Cut-off Date Principal Balance: | $27,268,473 | Location: | Aventura, FL | |||||
| % of Initial Pool Balance: | 1.8% | Size: | 166 Rooms | |||||
| Loan Purpose: | Refinance | Cut-off Date Principal Balance Per Room: | $164,268 | |||||
| Borrower Name: | Champion Retail Limited Partnership | Year Built/Renovated: | 1999/2012 | |||||
Sponsor(1): | Jeffrey Soffer | Title Vesting: | Fee | |||||
| Mortgage Rate: | 4.640% | Property Manager: | Self-managed | |||||
| Note Date: | July 17, 2014 | 3rd Most Recent Occupancy (As of): | 77.9% (12/31/2011) | |||||
| Anticipated Repayment Date: | NAP | 2nd Most Recent Occupancy (As of)(6): | 71.9% (12/31/2012) | |||||
| Maturity Date: | August 11, 2024 | Most Recent Occupancy (As of): | 83.8% (12/31/2013) | |||||
| IO Period: | None | Current Occupancy (As of): | 85.7% (5/31/2014) | |||||
| Loan Term (Original): | 120 months | |||||||
| Seasoning: | 1 month | Underwriting and Financial Information: | ||||||
| Amortization Term (Original): | 360 months | |||||||
| Loan Amortization Type: | Amortizing Balloon | 3rd Most Recent NOI (As of)(6): | $1,979,655 (12/31/2012) | |||||
| Interest Accrual Method: | Actual/360 | 2nd Most Recent NOI (As of): | $2,875,374 (12/31/2013) | |||||
| Call Protection: | L(25),D(91),O(4) | Most Recent NOI (As of): | $3,165,798 (TTM 5/31/2014) | |||||
| Lockbox Type: | Springing (Without Established Account) | |||||||
| Additional Debt: | None | |||||||
| Additional Debt Type: | NAP | |||||||
| U/W Revenues: | $8,996,055 | |||||||
| U/W Expenses: | $5,886,743 | |||||||
| U/W NOI: | $3,109,312 | |||||||
| U/W NCF: | $2,749,470 | |||||||
Escrows and Reserves: | U/W NOI DSCR: | 1.84x | ||||||
| U/W NCF DSCR: | 1.63x | |||||||
Type: | Initial | Monthly | Cap (If Any) | U/W NOI Debt Yield: | 11.4% | |||
| Taxes | $179,697 | $19,967 | NAP | U/W NCF Debt Yield: | 10.1% | |||
Insurance(2) | $0 | Springing | NAP | As-Is Appraised Value: | $39,000,000 | |||
| FF&E Reserve | $0 | $29,987(3) | NAP | As-Is Appraisal Valuation Date: | June 16, 2014 | |||
PIP Reserve(4) | $0 | Springing | NAP | Cut-off Date LTV Ratio: | 69.9% | |||
Seasonality Reserve(5) | $170,215 | $28,369 | $170,215 | LTV Ratio at Maturity or ARD: | 56.9% | |||
| (1) | Jeffrey Soffer is involved in various pending litigation matters involving claims resulting from the Fontainebleau Las Vegas project filing for Chapter 11 bankruptcy protection in mid-2009 (converted to Chapter 7 bankruptcy at the end of 2009), as well as other matters. See “Description of the Mortgage Pool – Default History, Bankruptcy Issues and Other Proceedings” and “Description of the Mortgage Pool – Litigation Considerations” in the Free Writing Prospectus. |
| (2) | Ongoing monthly reserves for insurance are not required as long as (i) no event of default has occurred and is continuing; (ii) the Courtyard by Marriott - Aventura Property is covered by an acceptable blanket insurance policy; and (iii) the borrower provides the lender with evidence of renewal of the insurance policies and timely proof of payment of insurance premiums. |
| (3) | Monthly FF&E deposits are required in an amount equal to one twelfth of 4.0% of total revenue. The initial monthly estimate of $29,987 can be adjusted subject to re-balancing over the loan term. |
| (4) | If any additional replacements or alterations to the Courtyard by Marriott - Aventura Property as required by the franchisor (“PIP Work”), the borrower must deposit an amount equal to 115% of the estimated costs to complete such additional PIP Work, as reasonably determined by lender. |
| (5) | The Seasonality Reserve may be used towards payment of any monthly debt service payments occurring in June, July, August and September of each year; however, each disbursement can be no greater than $42,553.75. Ongoing monthly reserves are required in November, December, January, February, March and April subject to a $170,215 cap. |
| (6) | See “Cash Flow Analysis” section. |
The Courtyard by Marriott - Aventura mortgage loan is evidenced by a single promissory note secured by a first mortgage encumbering a five-story, limited service hotel, located in Aventura, Florida approximately 15.0 miles south of Fort Lauderdale (the “Courtyard by Marriott - Aventura Property”). The Courtyard by Marriott - Aventura Property was built in 1999, and the lobby and guest rooms were renovated in 2011 and 2012, respectively, for a total cost of approximately $3.6 million. The Courtyard by Marriott - Aventura Property comprises 166 guest rooms, which includes 91 king guestrooms, 61 double queen guestrooms and 14 king suites. Amenities at the Courtyard by Marriott - Aventura Property include a full-service restaurant, heated outdoor swimming pool, outdoor patio lounge area, fitness center, two meeting rooms totaling approximately 1,300 square feet and a 24-hour sundry shop. The Courtyard by Marriott - Aventura Property is located 0.5 mile south of the 2.7 million square foot Aventura Mall and two miles south of the Gulfstream Park Racing and Casino complex. The Courtyard by Marriott franchise agreement expires in April 2024.
THE INFORMATION IN THIS STRUCTURAL AND COLLATERAL TERM SHEET IS NOT COMPLETE AND MAY BE AMENDED PRIOR TO THE TIME OF SALE. THIS TERM SHEET IS NOT AN OFFER TO SELL THESE SECURITIES AND IT IS NOT A SOLICITATION OF AN OFFER TO BUY THESE SECURITIES IN ANY JURISDICTION WHERE THE OFFER OR SALE IS NOT PERMITTED.
112
| COURTYARD BY MARRIOTT AVENTURA |
Sources and Uses
| Sources | Uses | |||||||
| Original loan amount | $27,300,000 | 100.0% | Loan payoff | $18,004,989 | 66.0% | |||
| Reserves | 349,912 | 1.2 | ||||||
| Closing costs | 272,326 | 1.0 | ||||||
| Return of equity | 8,672,773 | 31.8 | ||||||
| Total Sources | $27,300,000 | 100.0% | Total Uses | $27,300,000 | 100.0% |
The following table presents certain information relating to the Courtyard by Marriott - Aventura Property’s competitive set:
Subject and Market Historical Occupancy, ADR and RevPAR(1)
Competitive Set | Courtyard by Marriott Aventura | Penetration Factor | |||||||||||||||
Year | Occupancy | ADR | RevPAR | Occupancy | ADR | RevPAR | Occupancy | ADR | RevPAR | ||||||||
| 4/30/2014 TTM | 82.8% | $115.98 | $96.05 | 84.7% | $155.77 | $131.96 | 102.3% | 134.3% | 137.4% | ||||||||
| 4/30/2013 TTM | 79.4% | $111.60 | $88.61 | 74.9% | $142.10 | $106.46 | 94.4% | 127.3% | 120.1% | ||||||||
| 4/30/2012 TTM | 79.6% | $105.12 | $83.71 | 78.7% | $129.38 | $101.81 | 98.8% | 123.1% | 121.6% | ||||||||
| (1) | Information obtained from a third party hospitality report dated May 19, 2014. The competitive set includes: Springhill Suites Fort Lauderdale Airport & Cruise Port, Hampton Inn Hallandale Beach Aventura, Hilton Garden Inn Fort Lauderdale Airport Cruise Port, Courtyard Fort Lauderdale Airport & Cruise Port and Best Western Plus Fort Lauderdale Airport South Inn & Suites. |
Operating History and Underwritten Net Cash Flow. The following table presents certain information relating to the historical operating performance and the Underwritten Net Cash Flow at the Courtyard by Marriott - Aventura Property:
Cash Flow Analysis
| 2011 | 2012 | 2013 | TTM 5/31/2014 | U/W | U/W $ per Room | |||||||
| Occupancy | 77.9% | 71.9%(1) | 83.8% | 85.7% | 85.7% | |||||||
| ADR | $130.48 | $136.34 | $150.51 | $157.07 | $157.07 | |||||||
| RevPAR | $101.70 | $98.00 | $126.20 | $134.55 | $134.55 | |||||||
| Total Revenue | $6,496,115 | $6,647,137 | $8,414,161 | $8,996,055 | $8,996,055 | $54,193 | ||||||
| Total Department Expenses | 1,944,935 | 2,015,059 | 2,398,118 | 2,532,478 | 2,532,478 | 15,256 | ||||||
| Gross Operating Profit | $4,551,180 | $4,632,078 | $6,016,043 | $6,463,577 | $6,463,577 | $38,937 | ||||||
| Total Undistributed Expenses | 2,232,829 | 2,190,339 | 2,725,096 | 2,884,061 | 2,884,113 | 17,374 | ||||||
| Profit Before Fixed Charges | $2,318,351 | $2,441,739 | $3,290,947 | $3,579,516 | $3,579,464 | $21,563 | ||||||
| Total Fixed Charges | 462,240 | 462,084 | 415,573 | 413,718 | 470,152 | 2,832 | ||||||
| Net Operating Income | $1,856,111 | $1,979,655 | $2,875,374 | $3,165,798 | $3,109,312 | $18,731 | ||||||
| FF&E | 0 | 0 | 0 | 0 | 359,842 | 2,168 | ||||||
| Net Cash Flow | $1,856,111 | $1,979,655 | $2,875,374 | $3,165,798 | $2,749,470 | $16,563 | ||||||
| NOI DSCR | 1.10x | 1.17x | 1.70x | 1.88x | 1.84x | |||||||
| NCF DSCR | 1.10x | 1.17x | 1.70x | 1.88x | 1.63x | |||||||
| NOI DY | 6.8% | 7.3% | 10.5% | 11.6% | 11.4% | |||||||
| NCF DY | 6.8% | 7.3% | 10.5% | 11.6% | 10.1% | |||||||
| (1) | The Courtyard by Marriott - Aventura Property underwent a guestroom renovation in 2012 and two full floors consisting of approximately 76 rooms were taken offline on a rolling basis. |
THE INFORMATION IN THIS STRUCTURAL AND COLLATERAL TERM SHEET IS NOT COMPLETE AND MAY BE AMENDED PRIOR TO THE TIME OF SALE. THIS TERM SHEET IS NOT AN OFFER TO SELL THESE SECURITIES AND IT IS NOT A SOLICITATION OF AN OFFER TO BUY THESE SECURITIES IN ANY JURISDICTION WHERE THE OFFER OR SALE IS NOT PERMITTED.
113
| No. 14 – Preferred Freezer Houston | |||||||
| Loan Information | Property Information | ||||||
| Mortgage Loan Seller: | The Royal Bank of Scotland | Single Asset/Portfolio: | Single Asset | ||||
Credit Assessment (Fitch/KBRA/Moody’s): | NR/NR/NR | Property Type: | Industrial | ||||
| Original Principal Balance: | $26,000,000 | Specific Property Type: | Warehouse | ||||
| Cut-off Date Principal Balance: | $26,000,000 | Location: | Houston, TX | ||||
| % of Initial Pool Balance: | 1.7% | Size: | 226,596 SF | ||||
| Loan Purpose: | Refinance | Cut-off Date Principal Balance Per SF: | $114.74 | ||||
| Borrower Name: | 7080 Express Lane Owner, LLC | Year Built/Renovated: | 1990/2014 | ||||
| Sponsor: | H.N. Gorin, Inc. | Title Vesting: | Fee | ||||
| Mortgage Rate: | 4.450% | Property Manager: | Self-managed | ||||
| Note Date: | August 27, 2014 | 3rd Most Recent Occupancy(3): | NAV | ||||
| Anticipated Repayment Date: | September 1, 2024 | 2nd Most Recent Occupancy(3): | NAV | ||||
| Maturity Date: | September 1, 2044 | Most Recent Occupancy(3): | NAV | ||||
| IO Period: | 60 months | Current Occupancy (As of): | 100.0% (9/1/2014) | ||||
| Loan Term (Original): | 120 months | ||||||
| Seasoning: | 0 months | ||||||
| Amortization Term (Original): | 360 months | Underwriting and Financial Information: | |||||
| Loan Amortization Type: | Interest-only, Amortizing ARD | ||||||
| Interest Accrual Method: | Actual/360 | 3rd Most Recent NOI(3): | NAV | ||||
| Call Protection: | L(24),D(92),O(4) | 2nd Most Recent NOI(3): | NAV | ||||
| Lockbox Type: | Hard/Springing Cash Management | Most Recent NOI(3): | NAV | ||||
| Additional Debt: | None | ||||||
| Additional Debt Type: | NAP | U/W Revenues: | $2,538,344 | ||||
| U/W Expenses: | $50,767 | ||||||
| U/W NOI: | $2,487,577 | ||||||
| Escrows and Reserves | U/W NCF: | $2,252,348 | |||||
U/W NOI DSCR : | 1.58x | ||||||
| Type: | Initial | Monthly | Cap (If Any) | U/W NCF DSCR: | 1.43x | ||
| Taxes | $0 | Springing | NAP | U/W NOI Debt Yield: | 9.6% | ||
| Insurance | $0 | Springing | NAP | U/W NCF Debt Yield: | 8.7% | ||
| Replacement Reserve | $0 | Springing | NAP | As-Is Appraised Value(4): | $32,500,000 | ||
| TI/LC Reserve | $0 | Springing | NAP | As-Is Appraisal Valuation Date: | July 14, 2014 | ||
Rent Discount Reserve(1) | $170,000 | $0 | $0 | Cut-off Date LTV Ratio(4): | 68.1% | ||
Holdback(2) | $5,000,000 | $0 | $0 | LTV Ratio at Maturity or ARD(4): | 62.2% | ||
| (1) | Preferred Freezer Services is currently paying a discounted annualized in-place base rent of $2,250,000, which is anticipated to be completed in September 2014. The Rent Discount Reserve funds will be partially released in an amount equal to $42,500 on each payment date beginning on October 1, 2014. |
| (2) | At closing, the lender held back $5,000,000 of loan proceeds ($22.07 per square foot) in connection with renovating and expanding the Preferred Freezer Houston Property from 129,271 square feet to 226,596 square feet. The renovation and expansion are anticipated to be completed in September 2014, and the holdback will not be released until all construction is completed. |
| (3) | Historical occupancy and historical financial data is not available as the Preferred Freezer Houston Property was acquired in May 2013. |
| (4) | The appraiser concluded to an as-completed appraised value of $38,200,000 as of December 1, 2014 based on improvements resulting from the completion of the borrower’s planned $5,000,000 renovation and expansion of the Preferred Freezer Houston Property. The Cut-off Date LTV Ratio and LTV Ratio at ARD shown are based on the Cut-off Date Balance inclusive of the $5,000,000 holdback and the as-completed appraised value of $38,200,000. The Cut-off Date LTV Ratio and LTV Ratio at ARD based on the Cut-off Date Balance inclusive of the $5,000,000 holdback and the as-is appraised value are 80.0% and 73.2%, respectively. |
The Preferred Freezer Houston mortgage loan is evidenced by a single promissory note that is secured by a first mortgage encumbering a 226,596 square foot warehouse and cold storage portfolio located in Houston, Texas (the “Preferred Freezer Houston Property”). The Preferred Freezer Houston Property is 100.0% leased by Preferred Freezer Services, Inc. on a 20-year, triple-net lease. The Preferred Freezer Houston Property was built in 1990 and is currently undergoing a renovation and expansion expected to be completed in September 2014. There are five dock doors on the west side of the building and 29 dock high doors on the north side of the building with levelers, automatic roll-up doors, air locks and safety lights. The dock area is cooled to 36 degrees Fahrenheit and has a 20-foot ceiling clear height, while the majority of the building is freezer space that is cooled to negative 10 degrees Fahrenheit and has 20-foot to 54-foot ceiling clear heights. Additionally, the Preferred Freezer Houston Property includes a 4,700 square foot office area.
THE INFORMATION IN THIS STRUCTURAL AND COLLATERAL TERM SHEET IS NOT COMPLETE AND MAY BE AMENDED PRIOR TO THE TIME OF SALE. THIS TERM SHEET IS NOT AN OFFER TO SELL THESE SECURITIES AND IT IS NOT A SOLICITATION OF AN OFFER TO BUY THESE SECURITIES IN ANY JURISDICTION WHERE THE OFFER OR SALE IS NOT PERMITTED.
114
PREFERRED FREEZER HOUSTON |
Sources and Uses
| Sources | Uses | |||||||
| Original loan amount | $26,000,000 | 100.0% | Loan payoff | $14,111,753 | 54.3% | |||
| Holdback | 5,000,000 | 19.2 | ||||||
| Reserves | 170,000 | 0.6 | ||||||
| Closing costs | 638,334 | 2.5 | ||||||
| Return of equity | 6,079,913 | 23.4 | ||||||
| Total Sources | $26,000,000 | 100.0% | Total Uses | $26,000,000 | 100.0% |
The following table presents certain information relating to the tenancy at the Preferred Freezer Houston Property:
Major Tenant
| Tenant Name | Credit Rating (Fitch/Moody’s/ S&P) | Tenant NRSF | % of NRSF | Annual U/W Base Rent PSF(1) | Annual U/W Base Rent(1) | % of Total Annual U/W Base Rent | Lease Expiration Date |
| Major Tenant | |||||||
| Preferred Freezer Services | NR/NR/NR | 226,596 | 100.0% | $11.79 | $2,671,941 | 100.0% | 6/30/2034(2) |
| Occupied Collateral Total | 226,596 | 100.0% | $11.79 | $2,671,941 | 100.0% | ||
| (1) | Annual U/W Base Rent PSF and Annual U/W Base Rent are based on an amount equal to 9% of the total estimated construction costs of approximately $29,700,000. Total construction costs incurred as of July 31, 2014 are approximately $24,500,000, and approximately $5,000,000 of in-process renovation work is expected to be completed in September, 2014. Preferred Freezer Services is currently paying a discounted annualized in-place base rent of $2,250,000, and a Rent Discount Reserve was funded at closing. |
| (2) | Preferred Freezer Services has four, 5-year lease renewal options. |
The following table presents certain information relating to the lease rollover schedule at the Preferred Freezer Houston Property:
Lease Expiration Schedule(1)
Year Ending December 31, | No. of Leases Expiring | Expiring NRSF | % of Total NRSF | Cumulative Expiring NRSF | Cumulative % of Total NRSF | Annual U/W Base Rent | Annual U/W Base Rent PSF | |
| MTM | 0 | 0 | 0.0% | 0 | 0.0% | $0 | $0.00 | |
| 2014 | 0 | 0 | 0.0% | 0 | 0.0% | $0 | $0.00 | |
| 2014 | 0 | 0 | 0.0% | 0 | 0.0% | $0 | $0.00 | |
| 2015 | 0 | 0 | 0.0% | 0 | 0.0% | $0 | $0.00 | |
| 2016 | 0 | 0 | 0.0% | 0 | 0.0% | $0 | $0.00 | |
| 2017 | 0 | 0 | 0.0% | 0 | 0.0% | $0 | $0.00 | |
| 2018 | 0 | 0 | 0.0% | 0 | 0.0% | $0 | $0.00 | |
| 2019 | 0 | 0 | 0.0% | 0 | 0.0% | $0 | $0.00 | |
| 2020 | 0 | 0 | 0.0% | 0 | 0.0% | $0 | $0.00 | |
| 2021 | 0 | 0 | 0.0% | 0 | 0.0% | $0 | $0.00 | |
| 2022 | 0 | 0 | 0.0% | 0 | 0.0% | $0 | $0.00 | |
| 2024 | 0 | 0 | 0.0% | 0 | 0.0% | $0 | $0.00 | |
| Thereafter | 1 | 226,596 | 100.0% | 226,596 | 100.0% | $2,671,941 | $11.79 | |
| Vacant | 0 | 0 | 0.0% | 226,596 | 100.0% | $0 | $0.00 | |
| Total/Weighted Average | 1 | 226,596 | 100.0% | $2,671,941 | $11.79 |
| (1) | Information obtained from the underwritten rent roll. |
The following table presents historical occupancy percentages at the Preferred Freezer Houston Property:
Historical Occupancy(1)
9/1/2014(2) |
| 100.0% |
| (1) | Historical occupancy is unavailable as the Preferred Freezer Houston Property was acquired in May 2013. |
| (2) | Information obtained from the underwritten rent roll. |
THE INFORMATION IN THIS STRUCTURAL AND COLLATERAL TERM SHEET IS NOT COMPLETE AND MAY BE AMENDED PRIOR TO THE TIME OF SALE. THIS TERM SHEET IS NOT AN OFFER TO SELL THESE SECURITIES AND IT IS NOT A SOLICITATION OF AN OFFER TO BUY THESE SECURITIES IN ANY JURISDICTION WHERE THE OFFER OR SALE IS NOT PERMITTED.
115
PREFERRED FREEZER HOUSTON |
Operating History and Underwritten Net Cash Flow. The following table presents certain information relating to the in-place operating performance and the Underwritten Net Cash Flow at the Preferred Freezer Houston Property:
Cash Flow Analysis(1)
| In Place | As Completed | U/W | U/W $ per SF | |||||
| Base Rent | $2,250,000 | $2,671,920(2) | $2,671,941(2) | $11.79 | ||||
| Grossed Up Vacant Space | 0 | 0 | 0 | 0.00 | ||||
| Total Reimbursables | 376,967 | 376,967 | 0 | 0.00 | ||||
| Other Income | 0 | 0 | 0 | 0.00 | ||||
| Less Vacancy & Credit Loss | 0 | 0 | (133,597)(3) | (0.59) | ||||
| Effective Gross Income | $2,626,967 | $3,048,884 | $2,538,344 | $11.20 | ||||
| Total Operating Expenses | $376,967 | $376,967 | $50,767 | $0.22 | ||||
| Net Operating Income | $2,250,000 | $2,671,917 | $2,487,577 | $10.98 | ||||
| Capital Expenditures | 0 | 235,229 | 1.04 | |||||
| Net Cash Flow | $2,250,000 | $2,671,917 | $2,252,348 | $9.94 | ||||
| NOI DSCR | 1.43x | 1.70x | 1.58x | |||||
| NCF DSCR | 1.43x | 1.70x | 1.43x | |||||
| NOI DY | 8.7% | 10.3% | 9.6% | |||||
| NCF DY | 8.7% | 10.3% | 8.7% |
| (1) | No historical financial information is available as the sponsor purchased the Preferred Freezer Houston Property in May 2013. |
| (2) | Annual U/W Base Rent is based on an amount equal to 9% of the total estimated construction costs of approximately $29,700,000. Total construction costs incurred to date are approximately $24,500,000, and approximately $5,000,000 of in-process renovation work is expected to be completed in September 2014. Preferred Freezer Services is currently paying a discounted annualized in-place base rent of $2,250,000, and a Rent Discount Reserve was funded at closing. |
| (3) | The underwritten economic vacancy is 5.0%. The Preferred Freezer Houston Property was 100.0% physically occupied as of September 1, 2014. |
THE INFORMATION IN THIS STRUCTURAL AND COLLATERAL TERM SHEET IS NOT COMPLETE AND MAY BE AMENDED PRIOR TO THE TIME OF SALE. THIS TERM SHEET IS NOT AN OFFER TO SELL THESE SECURITIES AND IT IS NOT A SOLICITATION OF AN OFFER TO BUY THESE SECURITIES IN ANY JURISDICTION WHERE THE OFFER OR SALE IS NOT PERMITTED.
116
(THIS PAGE INTENTIONALLY LEFT BLANK)
117
| No. 15 – 400 Atlantic Avenue | ||||||||
| Loan Information | Property Information | |||||||
| Mortgage Loan Seller: | Liberty Island Group I LLC | Single Asset/Portfolio: | Single Asset | |||||
Credit Assessment (Fitch/KBRA/Moody’s): | NR/NR/NR | Property Type: | Office | |||||
| Original Principal Balance: | $25,000,000 | Specific Property Type: | CBD | |||||
| Cut-off Date Principal Balance: | $25,000,000 | Location: | Boston, MA | |||||
| % of Initial Pool Balance: | 1.7% | Size: | 99,749 SF | |||||
| Loan Purpose: | Acquisition | Cut-off Date Principal Balance Per SF: | $250.63 | |||||
| Borrower Name: | 400 Atlantic Avenue, LLC | Year Built/Renovated: | 1890/1996 | |||||
| Sponsor: | Dr. Stephen Zuellig | Title Vesting: | Fee | |||||
| Mortgage Rate: | 4.550% | Property Manager: | Cushman & Wakefield of Massachusetts, Inc. | |||||
| Note Date: | July 31, 2014 | 3rd Most Recent Occupancy (As of): | 100.0% (12/31/2011) | |||||
| Anticipated Repayment Date: | NAP | 2nd Most Recent Occupancy (As of): | 100.0% (12/31/2012) | |||||
| Maturity Date: | August 1, 2024 | Most Recent Occupancy (As of): | 100.0% (12/31/2013) | |||||
| IO Period: | 120 months | Current Occupancy (As of): | 100.0% (6/30/2014) | |||||
| Loan Term (Original): | 120 months | |||||||
| Seasoning: | 1 month | Underwriting and Financial Information: | ||||||
| Amortization Term (Original): | None | |||||||
| Loan Amortization Type: | Interest Only, Balloon | 3rd Most Recent NOI (As of): | $2,087,028 (12/31/2011) | |||||
| Interest Accrual Method: | Actual/360 | 2nd Most Recent NOI (As of): | $1,988,295 (12/31/2012) | |||||
| Call Protection: | L(25), D(91),O(4) | Most Recent NOI (As of)(5): | $1,659,788 (12/31/2013) | |||||
| Lockbox Type: | Hard/Springing Cash Management | |||||||
Additional Debt(1): | Yes | |||||||
Additional Debt Type(1): | Unsecured Subordinate Debt | U/W Revenues: | $4,002,538 | |||||
| U/W Expenses: | $1,650,476 | |||||||
U/W NOI(5): | $2,352,063 | |||||||
| U/W NCF: | $2,116,380 | |||||||
Escrows and Reserves: | U/W NOI DSCR: | 2.04x | ||||||
| U/W NCF DSCR: | 1.84x | |||||||
Type: | Initial | Monthly | Cap (If Any) | U/W NOI Debt Yield: | 9.4% | |||
Taxes(2) | $0 | Springing | NAP | U/W NCF Debt Yield: | 8.5% | |||
Insurance(3) | $0 | Springing | NAP | As-Is Appraised Value: | $52,000,000 | |||
| TI/LC Reserve | $3,000,000 | NAP | NAP | As-Is Appraisal Valuation Date: | June 25, 2014 | |||
Flood Insurance Reserve(4) | $50,000 | NAP | NAP | Cut-off Date LTV Ratio: | 48.1% | |||
| LTV Ratio at Maturity or ARD: | 48.1% | |||||||
| (1) | See “Sources and Uses” section. |
| (2) | Monthly tax escrows are not required provided that no event of default has occurred and is continuing. |
| (3) | Monthly insurance escrows are not required provided that no event of default has occurred and is continuing. |
| (4) | The borrower deposited $50,000 into a reserve which will be used by lender to acquire force place flood insurance in the event that the borrower does not purchase the required insurance within 30 days. Funds in this reserve will be released to borrower within five business days after delivery to lender of policies of insurance. |
| (5) | See “Cash Flow Analysis” section. |
The 400 Atlantic Avenue mortgage loan is evidenced by a single promissory note that is secured by a first mortgage encumbering an office building located in Boston, Massachusetts (the “400 Atlantic Avenue Property”). The building was originally built in 1890 and subsequently renovated (most recently in 1984 and 1996). The 400 Atlantic Avenue Property is a six-story (the sixth floor was added in 1984), class B, single-tenant, “boutique”, urban office building with 99,749 rentable square feet fully occupied by Goulston & Storrs. Goulston & Storrs is an Am Law 200 law firm that was established in Boston in 1900 and currently has offices in Boston, New York, Washington, DC and Beijing. Goulston & Storrs has operated out of the 400 Atlantic Avenue property since June 1985. Initially, Goulston & Storrs occupied approximately 52,981 square feet but has expanded twice, in 1990 (approximately 25,210 square feet) and 1994 (approximately 21,558 square feet). The 400 Atlantic Avenue Property is centrally located proximate to various modes of transportation and desirable waterfront views. The 400 Atlantic Avenue Property is located within the Boston central business district and within walking distance from the Seaport District.
THE INFORMATION IN THIS STRUCTURAL AND COLLATERAL TERM SHEET IS NOT COMPLETE AND MAY BE AMENDED PRIOR TO THE TIME OF SALE. THIS TERM SHEET IS NOT AN OFFER TO SELL THESE SECURITIES AND IT IS NOT A SOLICITATION OF AN OFFER TO BUY THESE SECURITIES IN ANY JURISDICTION WHERE THE OFFER OR SALE IS NOT PERMITTED.
118
| 400 ATLANTIC AVENUE |
Sources and Uses
| Sources | Uses | |||||||
| Original loan amount | $25,000,000 | 50.4 | % | Purchase price | $46,342,568 | 93.4% | ||
| Borrower’s contribution | 14,344,803 | 28.9 | Upfront escrows | 3,050,000 | 6.1 | |||
Other sources(1) | 10,300,000 | 20.7 | Closing costs | 135,711 | 0.3 | |||
Other uses(2) | 116,524 | 0.2 | ||||||
| Total Sources | $49,644,803 | 100.0 | % | Total Uses | $49,644,803 | 100.0% | ||
| (1) | Unsecured Subordinated Debt: The borrower has obtained a $10.3 million subordinate shareholder loan from Pryiform Limited, the 100% direct owner of the borrower. The shareholder loan is fully subordinate to the 400 Atlantic Avenue mortgage loan. The shareholder loan accrues at an interest rate of 7.50%, has a term of 121 months and is interest-only for the full term of the loan. |
| (2) | Other uses include title and legal fees. |
The following table presents certain information relating to the tenancy at the 400 Atlantic Avenue Property:
Major Tenants
| Tenant Name | Credit Rating (Fitch/ Moody’s/ S&P) | Tenant NRSF | % of NRSF | Annual U/W Base Rent PSF | Annual U/W Base Rent | % of Total Annual U/W Base Rent | Lease Expiration Date | |
| Major Tenants | ||||||||
| Goulston & Storrs | NR/NR/NR | 99,749 | 100.0% | $38.50(1) | $3,840,337 | 100.0% | 5/31/2024(2) | |
| Total Major Tenants | 99,749 | 100.0% | $38.50 | $3,840,337 | 100.0% | |||
| (1) | Goulston & Storrs’ rent increases to $40.50 per square foot on June 1, 2018 and increases to $42.50 per square foot on June 1, 2021. |
| (2) | Goulston & Storrs has one, 5 or 10-year extension option remaining. |
The following table presents certain information relating to the lease rollover schedule at the 400 Atlantic Avenue Property:
Lease Expiration Schedule(1)
Year Ending December 31, | No. of Leases Expiring | Expiring NRSF | % of Total NRSF | Cumulative of Total NRSF | Cumulative % of Total NRSF | Annual U/W Base Rent | Annual U/W Base Rent PSF |
| MTM | 0 | 0 | 0.0% | 0 | 0.0% | $0 | $0.00 |
| 2014 | 0 | 0 | 0.0% | 0 | 0.0% | $0 | $0.00 |
| 2015 | 0 | 0 | 0.0% | 0 | 0.0% | $0 | $0.00 |
| 2016 | 0 | 0 | 0.0% | 0 | 0.0% | $0 | $0.00 |
| 2017 | 0 | 0 | 0.0% | 0 | 0.0% | $0 | $0.00 |
| 2018 | 0 | 0 | 0.0% | 0 | 0.0% | $0 | $0.00 |
| 2019 | 0 | 0 | 0.0% | 0 | 0.0% | $0 | $0.00 |
| 2020 | 0 | 0 | 0.0% | 0 | 0.0% | $0 | $0.00 |
| 2021 | 0 | 0 | 0.0% | 0 | 0.0% | $0 | $0.00 |
| 2022 | 0 | 0 | 0.0% | 0 | 0.0% | $0 | $0.00 |
| 2023 | 0 | 0 | 0.0% | 0 | 0.0% | $0 | $0.00 |
| 2024 | 1 | 99,749 | 100.0 | 99,749 | 100.0% | $3,840,337 | $38.50 |
| Thereafter | 0 | 0 | 0.0% | 99,749 | 100.0% | $0 | $0.00 |
| Vacant | 0 | 0 | 0.0% | 99,749 | 100.0% | $0 | $0.00 |
| Total/Weighted Average | 1 | 99,749 | 100.0% | $3,840,337 | $38.50 |
| (1) | Information obtained from the underwritten rent roll. |
The following table presents historical occupancy percentages at the 400 Atlantic Avenue Property:
Historical Occupancy
12/31/2011(1) | 12/31/2012(1) | 12/31/2013(1) | 6/30/2014(2) | |||
| 100.0% | 100.0% | 100.0% | 100.0% |
| (1) | Information obtained from the borrower. |
| (2) | Information obtained from the underwritten rent roll. |
THE INFORMATION IN THIS STRUCTURAL AND COLLATERAL TERM SHEET IS NOT COMPLETE AND MAY BE AMENDED PRIOR TO THE TIME OF SALE. THIS TERM SHEET IS NOT AN OFFER TO SELL THESE SECURITIES AND IT IS NOT A SOLICITATION OF AN OFFER TO BUY THESE SECURITIES IN ANY JURISDICTION WHERE THE OFFER OR SALE IS NOT PERMITTED.
119
| 400 ATLANTIC AVENUE |
Operating History and Underwritten Net Cash Flow. The following table presents certain information relating to the historical operating performance and Underwritten Net Cash Flow at the 400 Atlantic Avenue Property:
Cash Flow Analysis
| 2011 | 2012 | 2013 | U/W(1) | U/W $ per SF | ||||||
| Base Rent | $3,248,158 | $3,216,339 | $2,952,309 | $3,840,337 | $38.50 | |||||
| Grossed Up Vacant Space | 0 | 0 | 0 | 0 | 0.00 | |||||
| Total Reimbursables | 478,641 | 360,220 | 397,028 | 280,537 | 2.81 | |||||
| Other Income | 7,200 | 7,200 | 7,200 | 88,054 | 0.88 | |||||
| Less Vacancy & Credit Loss | 0 | 0 | 0 | (206,389)(2) | (2.07) | |||||
| Effective Gross Income | $3,734,000 | $3,583,760 | $3,356,537 | $4,002,538 | $40.13 | |||||
| Total Operating Expenses | $1,646,970 | $1,595,464 | $1,696,749 | $1,650,476 | $16.55 | |||||
| Net Operating Income | $2,087,028 | $1,988,295 | $1,659,788 | $2,352,063 | $23.58 | |||||
| TI/LC | 0 | 0 | 0 | 210,746 | 2.11 | |||||
| Capital Expenditures | 0 | 0 | 0 | 24,937 | 0.25 | |||||
| Net Cash Flow | $2,087,028 | $1,988,295 | $1,659,788 | $2,116,380 | $21.22 | |||||
| NOI DSCR | 1.81x | 1.72x | 1.44x | 2.04x | ||||||
| NCF DSCR | 1.81x | 1.72x | 1.44x | 1.84x | ||||||
| NOI DY | 8.3% | 8.0% | 6.6% | 9.4% | ||||||
| NCF DY | 8.3% | 8.0% | 6.6% | 8.5% |
| (1) | The increase in U/W Base Rent and U/W Net Operating Income over 2013 is due to the extension of the Goulston & Storr’s lease to 2024 and the increase in annual rent, effective as of June 1, 2014, to $3,840,337. Additionally, the 2013 Base Rent numbers include six months’ free rent. |
| (2) | The underwritten vacancy is 4.9%. The 400 Atlantic Avenue was 100.0% physically occupied as of June 30, 2014. |
THE INFORMATION IN THIS STRUCTURAL AND COLLATERAL TERM SHEET IS NOT COMPLETE AND MAY BE AMENDED PRIOR TO THE TIME OF SALE. THIS TERM SHEET IS NOT AN OFFER TO SELL THESE SECURITIES AND IT IS NOT A SOLICITATION OF AN OFFER TO BUY THESE SECURITIES IN ANY JURISDICTION WHERE THE OFFER OR SALE IS NOT PERMITTED.
120
(THIS PAGE INTENTIONALLY LEFT BLANK)
121
WFRBS Commercial Mortgage Trust 2014-C22 | Transaction Contact Information |
VI. Transaction Contact Information
Questions regarding this Structural and Collateral Term Sheet may be directed to any of the following individuals:
| Wells Fargo Securities, LLC | RBS Securities Inc. | ||
| Brigid Mattingly | Tel. (312) 269-3062 | Todd Jaeger - Trading | Tel. (203) 897-2900 |
| Fax (312) 658-0140 | |||
| A.J. Sfarra | Tel. (212) 214-5613 | Adam Ansaldi | Tel. (203) 897-0881 |
| Fax (212) 214-8970 | Fax (203) 873-3542 | ||
| Alex Wong | Tel. (212) 214-5615 | Jim Barnard | Tel. (203) 897-4417 |
| Fax (212) 214-8970 | Fax (203) 873-4310 | ||
THE INFORMATION IN THIS STRUCTURAL AND COLLATERAL TERM SHEET IS NOT COMPLETE AND MAY BE AMENDED PRIOR TO THE TIME OF SALE. THIS TERM SHEET IS NOT AN OFFER TO SELL THESE SECURITIES AND IT IS NOT A SOLICITATION OF AN OFFER TO BUY THESE SECURITIES IN ANY JURISDICTION WHERE THE OFFER OR SALE IS NOT PERMITTED.
122