Item 1: Report to Shareholders| Institutional Foreign Equity Fund | April 30, 2005 |
The views and opinions in this report were current as of April 30, 2005. They are not guarantees of performance or investment results and should not be taken as investment advice. Investment decisions reflect a variety of factors, and the managers reserve the right to change their views about individual stocks, sectors, and the markets at any time. As a result, the views expressed should not be relied upon as a forecast of the fund’s future investment intent. The report is certified under the Sarbanes-Oxley Act of 2002, which requires mutual funds and other public companies to affirm that, to the best of their knowledge, the information in their financial reports is fairly and accurately stated in all material respects.
Dear Investor
International stocks outpaced U.S. equities over the 6- and 12-month periods ended April 30, 2005. Performance was strong despite a pullback during the past two months as rising oil prices and interest rates led to caution among investors. Emerging markets were the star performers during the past six months and year, but European stocks also did well in both periods. Japan’s results were respectable in the six-month period but lackluster for the entire year.
| Performance Comparison | |
| Periods Ended 4/30/05 | 6 Months | 12 Months |
| Institutional Foreign | | |
| Equity Fund | 7.40% | 11.00% |
| MSCI EAFE Index | 8.95 | 15.42 |
| Lipper International Large-Cap | | |
| Core Funds Average | 7.37 | 12.00 |
| Please see the fund’s quarter-end returns following this letter. |
The fund gained ground during the six months ended April 30, 2005, falling short of the results for the unmanaged MSCI EAFE Index but performing in line with the Lipper International Large-Cap Core Growth Funds Average, as shown in the table. The fund’s return trailed both benchmarks for the 12-month period.
Our regional allocations contributed positively to relative performance versus the MSCI EAFE Index over the past six months, particularly an overweight position in emerging markets, but overall stock selection was generally negative. We maintained a neutral position in Japan, since we view the economic slowdown there as a pause rather than a long-term downturn. We were underweight in Europe, primarily as a result of our low exposure to U.K. banks and major oil companies. Health care was one area where stock selection helped buoy results as our key pharmaceutical holdings outperformed during the period. Value stocks remained dominant over growth, which restrained results for the fund with its growth stock bias.
MARKET REVIEW
| Market Performance | | |
| Six Months | Local | Local Currency | U.S. |
| Ended 4/30/05 | Currency | vs. U.S. Dollars | Dollars |
| France | 5.97% | 1.49% | 7.55% |
| Germany | 5.75 | 1.49 | 7.32 |
| Hong Kong | 11.63 | -0.16 | 11.45 |
| Italy | 10.77 | 1.49 | 12.42 |
| Japan | 3.61 | 1.22 | 4.87 |
| Mexico | 6.78 | 4.00 | 11.06 |
| Netherlands | 7.52 | 1.49 | 9.11 |
| Singapore | 6.70 | 1.88 | 8.70 |
| Sweden | 10.21 | -0.16 | 10.03 |
| Switzerland | 11.11 | 0.92 | 12.13 |
| United Kingdom | 5.77 | 4.24 | 10.25 |
| Source: RIMES Online, using MSCI indices. | |
Despite weakness in March and April, international stocks performed solidly during the past six months. Higher oil prices, fears of global inflation, and rising bond yields triggered the late-period sell-off. Emerging markets continued to lead the way, although they suffered most during the correction as risk-averse investors redirected their assets to less volatile regions.
Among the developed markets, Japan lagged once again because of the strong yen and a pause in the country’s economic recovery. Japan’s economy remains dependent on global consumers as domestic demand is still fragile. Europe performed solidly, notwithstanding the sluggish economic environment in Germany and France.
Sector leaders during the period included energy and consumer staples. Higher oil prices and improved investor sentiment drove energy stocks, while food and tobacco stocks were particularly strong in the consumer staples segment. Utilities shares were also outstanding performers as investors sought defensive issues with relatively high dividend yields. Pharmaceuticals did well, but the information technology (IT) sector was a major disappointment, largely due to weakness in the semiconductor and Internet industries. Poor global demand, input prices, and falling capacity utilization in the semiconductor industry were primarily responsible for poor results in the group.
PORTFOLIO PERFORMANCE AND STRATEGY
| Geographic Diversification | |
| Periods Ended | 10/31/04 | 4/30/05 |
| Europe | 64.5% | 61.3% |
| Japan | 21.5 | 21.0 |
| Pacific Rim | 8.1 | 7.9 |
| Latin America | 3.5 | 3.6 |
| North America | 0.0 | 0.7 |
| Middle East | 0.2 | 0.6 |
| Other and Reserves | 2.2 | 4.9 |
| Total | 100.0% | 100.0% |
As mentioned, stock selection overall impaired results; one exception was the health care sector where several holdings, primarily major pharmaceuticals, boosted performance. In particular, U.K. pharmaceutical GlaxoSmithKline posted quarterly earnings that were ahead of consensus expectations because of the company’s cost controls. While revenue growth fell a bit short of the mark, recent prescription data show a clear acceleration in U.S. growth for key products. Another major contributor in the segment was France’s Sanofi-Aventis, where performance was enhanced by strong earnings, a positive outlook for products in the company’s pipeline, and a favorable legal decision regarding its anti-stroke drug Plavix. (Please refer to our detailed list of holdings and the amount each represents of the portfolio.)
The portfolio also benefited from healthy returns in financials, mainly in our commercial banks and capital markets holdings. Swiss majors Credit Suisse Group and UBS were the biggest contributors in the sector; during the past three months the companies reaped the rewards of significant cash inflows to their private banking divisions.
Our oil stocks added value in absolute terms, benefiting from rising oil prices and bumper profits for the industry. Shell Transport & Trading of the U.K. was among the portfolio’s top absolute contributors as record oil prices, strong refining margins, and a cyclical recovery in chemicals boosted 2004 profits. Oil company PetroKazakhstan detracted, however, as the company is involved in several legal disputes, including one regarding excess profits from noncompetitive pricing practices. As a result, oil production has been cut dramatically.
IT as a group was a disappointment, with most of our holdings detracting from absolute performance. Two holdings in the group did reasonably well, however: Taiwan Semiconductor Manufacturing and Samsung Electronics, whose share prices rose as a result of better-than-expected earnings.
Utilities were among the major detractors from performance since we were underweight in the group, which delivered robust results. The consumer discretionary sector overall was a strong detriment to relative performance, and U.K. home improvement retailer Kingfisher was the worst detractor over the six-month period. The firm’s main operation is expected to report a decline in sales for the first time in years, and consensus earnings projections, which have been sliding for months, may drop a further 10%.
The financials sector was the worst detractor from relative results, primarily due to our position in French asset manager Credit Agricole. The stock was among the 10 worst detractors from absolute performance, reflecting weaker-than-expected earnings over the last two quarters because of higher expenses across most of the company’s divisions. While we believe the downside for this stock is limited, we sold shares since we believe prospects are better at other European banks, including Spain’s Banco Bilbao Vizcaya Argenta, National Bank of Greece, and Credit Suisse Group. We also reduced our weighting in Kingfisher.
Our largest trades do not indicate a strategic shift in investment strategy. We have done some fine-tuning among retail, banking, and telecom stocks and anticipate changes in other sectors, but these trades are determined by our conviction levels on various holdings resulting from comprehensive bottom-up research. We purchased shares of Japanese bank Resona Holdings, which specializes in lending to individuals and small and medium companies. The bank had been troubled by bad loans, but a government bailout has boosted our outlook for the company. Merger activity among Japanese banks should increase following a general restructuring, and companies like Resona have good exposure to a domestic recovery. One of our largest purchases was National Bank of Greece, which we expect to benefit from high growth rates in Eastern European countries such as Romania and Bulgaria.
| Sector Diversification | |
| | Percent of | Percent of |
| | Net Assets | Net Assets |
| | 10/31/04 | 4/30/05 |
| Financials | 23.2% | 28.5% |
| Consumer Discretionary | 17.2 | 16.7 |
| Industrials and Business Services | 8.9 | 8.8 |
| Health Care | 8.3 | 8.8 |
| Telecommunication Services | 10.0 | 8.8 |
| Energy | 8.0 | 8.3 |
| Consumer Staples | 7.7 | 6.1 |
| Information Technology | 8.9 | 6.1 |
| Materials | 4.0 | 3.2 |
| Utilities | 1.6 | 1.5 |
| Other and Reserves | 2.2 | 3.2 |
| Total | 100.0% | 100.0% |
| Historical weightings reflect current industry/sector classifications. |
INVESTMENT OUTLOOK
Company balance sheets are strong and we expect earnings to rise, although at a more measured rate than in 2004. Several factors are creating slightly greater risk than in the recent past, however. Low bond yields have supported stock prices for some time, but shorter-term yields have been rising in the U.S., and risk premiums could go up if the Federal Reserve decides to tighten monetary policy beyond the measured pace it has so far adopted. The price of oil remains elevated, and the dollar is still weak. That said, growth stocks tend to do best when the economy is growing steadily, and large-caps normally do better than small-caps in this environment. If this scenario unfolds as we expect, our large-cap growth bias should position the portfolio well in coming months.
The outlook for European profits remains largely positive. With European equities currently trading at attractive earnings multiples, we believe the downside risk for stocks in this arena is limited. In addition, the balance sheet restructuring that has been taking place is leading to healthy cash generation. We continue to be troubled by the strong euro versus the dollar and stubbornly high oil prices. Both have affected consumer confidence, but these issues should be mitigated to some extent.
Japan’s economy should regain momentum in the second half of 2005, underpinned by an uplift in consumer spending. The risks here are the same as for Europe, namely high oil prices, rising U.S. interest rates, and the weak dollar—as well as an upward trend in raw materials prices. We believe, however, that resilient domestic consumer demand will overcome the negatives.
Emerging markets continue to look healthy to us. Recent stock market declines were driven by the same issues discussed in regard to Europe and Japan. While ensuing risk-aversion on the part of investors has prompted caution, we believe domestic demand is now driving growth in emerging markets, which are increasingly less dependent on global trade factors. In addition, political and economic stability is improving in these regions. Stock valuations appear attractive compared with those of developed markets, and our focus on high-quality stocks in consumer-sensitive industries such as media, retailers, banks, and mobile phone operators bodes well for investors, in our view.
Respectfully submitted,

David J.L. Warren
President, T. Rowe Price International Funds, Inc.
May 20, 2005
| Risks of International Investing |
Funds that invest overseas generally carry more risk than funds that invest strictly in U.S. assets. Funds investing in a single country or in a limited geographic region tend to be riskier than more diversified funds. Risks can result from varying stages of economic and political development, differing regulatory environments, trading days, and accounting standards, and higher transaction costs of non-U.S. markets. Non-U.S. investments are also subject to currency risk, or a decline in the value of a foreign currency versus the U.S. dollar, which reduces the dollar value of securities denominated in that currency.
Lipper averages: The averages of available mutual fund performance returns for specified periods in defined categories as tracked by Lipper Inc.
MSCI EAFE Index: Widely accepted as the benchmark for international stock performance (EAFE refers to Europe, Australasia, and Far East). The index represents the major markets of the world.
Price/earnings ratio: Calculated by dividing a stock’s market value per share by the company’s earnings per share for the past 12 months or by expected earnings for the coming year.
GDP: Gross domestic product is the total market value of all goods and services produced in a country in a given year.
| Portfolio Highlights | |
| |
| Twenty-Five Largest Holdings | |
| | Percent of |
| | Net Assets |
| | 4/30/05 |
| GlaxoSmithKline, United Kingdom | 3.3% |
| Total, France | 2.5 |
| UBS, Switzerland | 2.3 |
| Sanofi-Aventis, France | 2.1 |
| Vodafone, United Kingdom | 2.0 |
| Royal Bank of Scotland, United Kingdom | 1.8 |
| Shell Transport & Trading, United Kingdom | 1.7 |
| Nestle, Switzerland | 1.7 |
| Banco Bilbao Vizcaya Argenta, Spain | 1.6 |
| Credit Suisse Group, Switzerland | 1.5 |
| ENI S.p.A., Italy | 1.3 |
| British Sky Broadcasting, United Kingdom | 1.3 |
| Securitas, Sweden | 1.2 |
| Reed Elsevier, United Kingdom | 1.1 |
| Carnival, United States/United Kingdom | 1.1 |
| National Bank of Greece, Greece | 1.1 |
| Mitsubishi Corporation, Japan | 1.1 |
| Fortis, Belgium | 1.1 |
| AstraZeneca, United Kingdom | 1.0 |
| Mitsubishi Tokyo Financial, Japan | 1.0 |
| BNP Paribas, France | 1.0 |
| France Telecom, France | 1.0 |
| Nokia, Finland | 1.0 |
| Telefonica, Spain | 1.0 |
| UniCredito, Italy | 0.9 |
| Total | 36.7% |
| Note: Table excludes investments in the T. Rowe Price Reserve Investment |
| Fund and collateral for securities lending. | |
| Summary of Investments and Cash | | |
| April 30, 2005 | | | | |
| | | | | Percent of |
| | Equities | Cash | Total | MSCI EAFE |
| EUROPE | | | | |
| Austria | – | – | – | 0.4% |
| Belgium | 1.4% | – | 1.4% | 1.4% |
| Denmark | 0.6% | – | 0.6% | 0.8% |
| Finland | 1.0% | – | 1.0% | 1.5% |
| France | 11.7% | – | 11.7% | 9.5% |
| Germany | 2.8% | – | 2.8% | 6.7% |
| Greece | 1.1% | – | 1.1% | 0.6% |
| Ireland | 1.1% | – | 1.1% | 0.8% |
| Italy | 5.7% | – | 5.7% | 4.1% |
| Kazakhstan | 0.3% | – | 0.3% | – |
| Luxembourg | – | – | – | – |
| Netherlands | 1.0% | – | 1.0% | 4.8% |
| Norway | 1.2% | – | 1.2% | 0.7% |
| Portugal | – | – | – | 0.3% |
| Russia | 0.6% | – | 0.6% | – |
| Spain | 4.2% | – | 4.2% | 4.0% |
| Sweden | 1.2% | – | 1.2% | 2.4% |
| Switzerland | 7.4% | – | 7.4% | 6.8% |
| United Kingdom | 20.0% | – | 20.0% | 25.5% |
| Total Europe | 61.3% | 0.0% | 61.3% | 70.3% |
| PACIFIC BASIN | | | | |
| Australia | 0.9% | – | 0.9% | 5.3% |
| China | 0.6% | – | 0.6% | – |
| Hong Kong | 1.7% | – | 1.7% | 1.7% |
| India | 0.8% | – | 0.8% | – |
| Indonesia | 0.3% | – | 0.3% | – |
| Japan | 21.0% | – | 21.0% | 21.5% |
| Malaysia | 0.3% | – | 0.3% | – |
| New Zealand | – | – | – | 0.2% |
| Singapore | 0.6% | – | 0.6% | 0.9% |
| South Korea | 1.0% | – | 1.0% | – |
| Taiwan | 1.1% | – | 1.1% | – |
| Thailand | 0.7% | – | 0.7% | – |
| Total Pacific Basin | 29.0% | 0.0% | 29.0% | 29.6% |
| MIDDLE EAST | | | | |
| Egypt | – | – | – | – |
| Israel | – | – | – | – |
| Turkey | 0.6% | – | 0.6% | – |
| Total Middle East | 0.6% | 0.0% | 0.6% | 0.0% |
| AMERICAS | | | | |
| Argentina | – | – | – | – |
| Brazil | 1.4% | – | 1.4% | – |
| Canada | 0.7% | – | 0.7% | – |
| Chile | – | – | – | – |
| Mexico | 2.2% | – | 2.2% | – |
| Panama | – | – | – | – |
| Peru | – | – | – | – |
| United States | 1.2% | 1.6% | 2.8% | – |
| Venezuela | – | – | – | – |
| Total Americas | 5.5% | 1.6% | 7.1% | 0.0% |
| SOUTH AFRICA | | | | |
| South Africa | 0.4% | – | 0.4% | – |
| Total South Africa | 0.4% | 0.0% | 0.4% | 0.0% |
| | | | | |
| Other Assets Less Liabilities | 1.6% | | 1.6% | |
| TOTAL* | 98.4% | 1.6% | 100.0% | 99.9% |
| |
| * Total may not add to 100.0% due to rounding. |
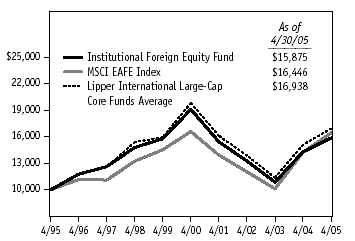
This chart shows the value of a hypothetical $10,000 investment in the fund over the past 10 fiscal year periods or since inception (for funds lacking 10-year records). The result is compared with benchmarks, which may include a broad-based market index and a peer group average or index. Market indexes do not include expenses, which are deducted from fund returns as well as mutual fund averages and indexes.
| Institutional Foreign Equity Fund |
| Average Annual Compound Total Return | |
| |
| Periods Ended 4/30/05 | 1 Year | 5 Years | 10 Years |
| Institutional Foreign Equity Fund | 11.00% | -3.65% | 4.73% |
| MSCI EAFE Index | 15.42 | -0.19 | 5.10 |
| Lipper International Large-Cap | | | |
| Core Funds Average | 12.00 | -3.28 | 5.17 |
| Returns do not reflect taxes that the shareholder may pay on fund distributions |
| or the redemption of portfolio shares. Past performance cannot guarantee |
| future results. | | | |
Fund Expense Example
As a mutual fund shareholder, you may incur two types of costs: (1) transaction costs such as redemption fees or sales loads and (2) ongoing costs, including management fees, distribution and service (12b-1) fees, and other fund expenses. The following example is intended to help you understand your ongoing costs (in dollars) of investing in the fund and to compare these costs with the ongoing costs of investing in other mutual funds. The example is based on an investment of $1,000 invested at the beginning of the most recent six-month period and held for the entire period.
Actual Expenses
The first line of the following table (“Actual”) provides information about actual account values and actual expenses. You may use the information in this line, together with your account balance, to estimate the expenses that you paid over the period. Simply divide your account value by $1,000 (for example, an $8,600 account value divided by $1,000 = 8.6), then multiply the result by the number in the first line under the heading “Expenses Paid During Period” to estimate the expenses you paid on your account during this period.
Hypothetical Example for Comparison Purposes
The information on the second line of the table (“Hypothetical”) is based on hypothetical account values and expenses derived from the fund’s actual expense ratio and an assumed 5% per year rate of return before expenses (not the fund’s actual return). You may compare the ongoing costs of investing in the fund with other funds by contrasting this 5% hypothetical example and the 5% hypothetical examples that appear in the shareholder reports of the other funds. The hypothetical account values and expenses may not be used to estimate the actual ending account balance or expenses you paid for the period.
You should also be aware that the expenses shown in the table highlight only your ongoing costs and do not reflect any transaction costs, such as redemption fees or sales loads. Therefore, the second line of the table is useful in comparing ongoing costs only and will not help you determine the relative total costs of owning different funds. To the extent a fund charges transaction costs, however, the total cost of owning that fund is higher.
| T. Rowe Price Institutional Foreign Equity Fund | |
| |
| | | | Expenses |
| | Beginning | Ending | Paid During |
| | Account | Account | Period* |
| | Value | Value | 11/1/04 to |
| | 11/1/04 | 4/30/05 | 4/30/05 |
| Actual | $1,000.00 | $1,074.00 | $3.96 |
| Hypothetical | | | |
| (Assumes 5% return | | | |
| before expenses) | 1,000.00 | $1,020.98 | $3.86 |
| |
| * Expenses are equal to the fund’s annualized expense ratio for the six-month |
| period (0.77%), multiplied by the average account value over the period, multi- |
| plied by the number of days in the most recent fiscal half year (181) divided by |
| the days in the year (365) to reflect the half year period. | |
| Quarter-End Returns | | | |
| |
| Periods Ended 3/31/05 | 1 Year | 5 Years | 10 Years |
| |
| Institutional Foreign Equity Fund | 9.36% | -4.35% | 5.41% |
| MSCI EAFE Index | 15.49% | -0.81% | 5.73% |
| Lipper International Large-Cap Core | | | |
| Funds Average | 11.39% | -3.96% | 5.79% |
| |
| Current performance may be higher or lower than the quoted past perfor- |
| mance, which cannot guarantee future results. Share price, principal |
| value, and return will vary, and you may have a gain or loss when you |
| sell your shares. For the most recent month-end performance information, |
| please visit our Web site (troweprice.com) or contact a T. Rowe Price rep- |
| resentative at 1-800-638-8790. The performance information shown does |
| not reflect the deduction of a 2% redemption fee on shares held for less |
| than 90 days. If it did, the performance would be lower. | |
| This table provides returns through the most recent calendar quarter-end rather |
| than through the end of the fund’s fiscal period. Average annual total return fig- |
| ures include changes in principal value, reinvested dividends, and capital gain |
| distributions. Returns do not reflect taxes that the shareholder may pay on fund |
| distributions or the redemption of fund shares. When assessing performance, |
| investors should consider both short- and long-term returns. | |
| Financial Highlights | | | | | | | | | | | | |
| T. Rowe Price Institutional Foreign Equity Fund |
| (Unaudited) | | | | | | | | | | | | |
| |
| | | | | | | For a share outstanding throughout each period |
| |
| | | 6 Months | | Year | | | | | | | | |
| | | Ended | | Ended | | | | | | | | |
| | | 4/30/05** | | 10/31/04 | | 10/31/03 | | 10/31/02 | | 10/31/01 | | 10/31/00 |
| NET ASSET VALUE | | | | | | | | | | | | |
| Beginning of period | $ | 14.19 | $ | 12.82 | $ | 10.65 | $ | 12.70 | $ | 19.16 | $ | 20.08 |
|
|
| Investment activities | | | | | | | | | | | | |
| Net investment income (loss) | | 0.09 | | 0.26 | | 0.23 | | 0.18 | | 0.39 | | 0.13 |
| Net realized and | | | | | | | | | | | | |
| unrealized gain (loss) | | 0.96 | | 1.38 | | 2.11 | | (1.81) | | (5.35) | | 0.46 |
|
|
| Total from | | | | | | | | | | | | |
| investment activities | | 1.05 | | 1.64 | | 2.34 | | (1.63) | | (4.96) | | 0.59 |
|
|
| Distributions | | | | | | | | | | | | |
| Net investment income | | (0.26) | | (0.25) | | (0.15) | | (0.42) | | (0.11) | | (0.17) |
| Net realized gain | | – | | (0.02) | | (0.02) | | – | | (1.39) | | (1.34) |
|
|
| Total distributions | | (0.26) | | (0.27) | | (0.17) | | (0.42) | | (1.50) | | (1.51) |
|
|
| NET ASSET VALUE | | | | | | | | | | | | |
| End of period | $ | 14.98 | $ | 14.19 | $ | 12.82 | $ | 10.65 | $ | 12.70 | $ | 19.16 |
|
|
| |
| Ratios/Supplemental Data | | | | | | | | | | | | |
| Total return^ | | 7.40% | | 12.96% | | 22.33% | | (13.43)% | | (28.02)% | | 2.45% |
| Ratio of total expenses to | | | | | | | | | | | | |
| average net assets | | 0.77%† | | 0.76% | | 0.76% | | 0.75% | | 0.74% | | 0.74% |
| Ratio of net investment | | | | | | | | | | | | |
| income (loss) to average | | | | | | | | | | | | |
| net assets | | 1.21%† | | 1.35% | | 1.64% | | 1.06% | | 2.25% | | 0.57% |
| Portfolio turnover rate | | 45.6%† | | 28.8% | | 27.8% | | 20.0% | | 21.4% | | 39.7% |
| Net assets, end of period | | | | | | | | | | | | |
| (in millions) | $ | 511 | $ | 743 | $ | 1,061 | $ | 1,168 | $ | 1,903 | $ | 3,138 |
| ^ | Total return reflects the rate that an investor would have earned on an investment in the fund during each |
| period assuming reinvestment of all distributions and payment of no redemption or account fees. |
| ** | Per share amounts calculated using average shares outstanding method. |
| † | Annualized |
| |
| The accompanying notes are an integral part of these financial statements. |
| |
| Portfolio of Investments (1)++ | |
| T. Rowe Price Institutional Foreign Equity Fund | |
| April 30, 2005 | | |
| (Unaudited) | | |
| | Shares | Value |
| (Cost and value in $ 000s) | | |
| | | |
| AUSTRALIA 0.9% | | |
| | | |
| Common Stocks 0.9% | | |
| BHP Billiton | 253,043 | 3,207 |
| Brambles Industries § | 240,400 | 1,483 |
| Total Australia (Cost $2,658) | 4,690 |
| |
| BELGIUM 1.4% | | |
| | | |
| Common Stocks 1.4% | | |
| Fortis | 198,907 | 5,541 |
| UCB | 27,417 | 1,339 |
| Total Belgium (Cost $5,460) | | 6,880 |
| |
| BRAZIL 1.4% | | |
| | | |
| Common Stocks 1.4% | | |
| Petroleo Brasileiro ADR (USD) | 120,660 | 4,434 |
| Tele Norte Leste ADR (USD) | 187,000 | 2,768 |
| Total Brazil (Cost $4,200) | | 7,202 |
| |
| CANADA 0.7% | | |
| | | |
| Common Stocks 0.7% | | |
| Research In Motion (USD) * | 22,900 | 1,475 |
| Telus (Non-voting shares) (USD) | 69,500 | 2,073 |
| Total Canada (Cost $3,421) | | 3,548 |
| |
| CHINA 0.6% | | |
| | | |
| Common Stocks 0.6% | | |
| China Telecom (HKD) | 1,558,000 | 530 |
| China Telecom 144A (HKD) * | 3,786,000 | 1,289 |
| China Unicom (HKD) | 1,566,000 | 1,268 |
| Total China (Cost $2,960) | | 3,087 |
| |
| DENMARK 0.6% | | |
| | | |
| Common Stocks 0.6% | | |
| Novo Nordisk, Series B | 60,001 | 3,038 |
| Total Denmark (Cost $1,920) | 3,038 |
| |
| FINLAND 1.0% | | |
| | | |
| Common Stocks 1.0% | | |
| Nokia § | 315,196 | 5,057 |
| Total Finland (Cost $505) | | 5,057 |
| | | |
| FRANCE 11.7% | | |
| | | |
| Common Stocks 11.7% | | |
| AXA § | 136,071 | 3,367 |
| BNP Paribas § | 77,195 | 5,106 |
| Compagnie De Saint-Gobain § | 52,204 | 2,957 |
| France Telecom *§ | 172,126 | 5,058 |
| Groupe Danone § | 24,814 | 2,335 |
| Hermes International | 15,922 | 3,045 |
| L’Oreal | 17,309 | 1,247 |
| LVMH § | 42,624 | 3,024 |
| Sanofi-Aventis § | 121,977 | 10,843 |
| Schneider Electric § | 38,334 | 2,771 |
| Societe Generale § | 23,149 | 2,317 |
| Sodexho Alliance § | 72,579 | 2,442 |
| Television Francaise *§ | 39,855 | 1,133 |
| THOMSON Multimedia § | 58,755 | 1,455 |
| Total § | 56,820 | 12,659 |
| Total France (Cost $26,039) | | 59,759 |
| |
| GERMANY 2.8% | | |
| | | |
| Common Stocks 2.8% | | |
| Allianz § | 12,199 | 1,466 |
| Commerzbank * | 126,100 | 2,780 |
| E.ON AG § | 26,466 | 2,239 |
| Hypo Real Estate Holding * | 104,104 | 4,340 |
| SAP | 12,390 | 1,956 |
| Siemens | 22,946 | 1,689 |
| Total Germany (Cost $9,987) | | 14,470 |
| |
| GREECE 1.1% | | |
| | | |
| Common Stocks 1.1% | | |
| National Bank of Greece | 170,055 | 5,718 |
| Total Greece (Cost $5,554) | | 5,718 |
| |
| HONG KONG 1.6% | | |
| | | |
| Common Stocks 1.6% | | |
| Cheung Kong Holdings | 272,000 | 2,573 |
| Esprit Holdings | 263,500 | 1,973 |
| Li & Fung | 898,000 | 1,725 |
| Sun Hung Kai Properties | 223,000 | 2,142 |
| Total Hong Kong (Cost $5,704) | 8,413 |
| | | |
| INDIA 0.8% | | |
| | | |
| Common Stocks 0.8% | | |
| I-Flex Solutions | 131,000 | 1,815 |
| Zee Telefilms | 686,300 | 2,059 |
| Total India (Cost $3,581) | | 3,874 |
| |
| INDONESIA 0.3% | | |
| | | |
| Common Stocks 0.3% | | |
| Telekomunikasi | 3,543,000 | 1,587 |
| Total Indonesia (Cost $1,821) | 1,587 |
| |
| IRELAND 1.1% | | |
| | | |
| Common Stocks 1.1% | | |
| Anglo Irish Bank | 366,000 | 4,241 |
| CRH | 58,600 | 1,466 |
| Total Ireland (Cost $6,204) | | 5,707 |
| |
| ITALY 5.7% | | |
| | | |
| Common Stocks 5.7% | | |
| Alleanza Assicurazioni | 220,360 | 2,629 |
| Assicurazioni Generali | 133,525 | 4,125 |
| Banco Popolare Di Verona § | 63,600 | 1,177 |
| Eni SPA § | 272,663 | 6,875 |
| Intesabci Spa Rnc | 602,900 | 2,620 |
| Mediaset § | 107,581 | 1,405 |
| Mediobanca | 203,400 | 3,363 |
| Telecom Italia-RNC § | 742,064 | 2,100 |
| UniCredito § | 858,453 | 4,835 |
| Total Italy (Cost $19,011) | | 29,129 |
| |
| JAPAN 21.0% | | |
| | | |
| Common Stocks 21.0% | | |
| AIFUL | 22,600 | 1,693 |
| AIFUL (Bonus shares) * | 12,450 | 931 |
| Astellas Pharma | 129,200 | 4,705 |
| Benesse § | 43,200 | 1,406 |
| Canon | 42,700 | 2,231 |
| Credit Saison | 37,200 | 1,276 |
| Dai Nippon Printing | 178,000 | 2,867 |
| Daikin Industries | 60,800 | 1,522 |
| Daito Trust Construction | 23,400 | 940 |
| Daiwa Securities Group | 292,000 | 1,854 |
| Fanuc | 44,200 | 2,622 |
| Funai Electric § | 14,900 | 1,681 |
| HOYA | 18,700 | 1,960 |
| INPEX | 335 | 1,832 |
| JFE Holdings | 55,600 | 1,546 |
| JSR § | 94,300 | 1,909 |
| KDDI | 902 | 4,183 |
| Keyence | 7,500 | 1,664 |
| Kyocera | 24,600 | 1,803 |
| Leopalace21 | 112,800 | 1,735 |
| Marui § | 155,200 | 2,000 |
| Mitsubishi Corporation | 409,200 | 5,618 |
| Mitsubishi Estate | 146,000 | 1,572 |
| Mitsubishi Tokyo Financial § | 597 | 5,197 |
| Mitsui Fudosan | 366,000 | 4,095 |
| Mitsui Trust Holdings § | 206,000 | 2,051 |
| NEC | 338,000 | 1,869 |
| Nidec | 16,600 | 1,953 |
| Nissan | 248,900 | 2,463 |
| Nomura Securities | 330,000 | 4,206 |
| NTT DoCoMo | 553 | 857 |
| Oji Paper § | 204,000 | 1,092 |
| ORIX | 18,600 | 2,541 |
| Resona Holdings * | 1,510,000 | 2,860 |
| Rohm Company | 18,200 | 1,721 |
| Secom | 102,000 | 4,100 |
| Sega Sammy Holdings | 19,400 | 1,136 |
| Seven-Eleven Japan § | 98,800 | 2,789 |
| Shin-Etsu Chemical | 70,000 | 2,595 |
| SMC | 10,800 | 1,142 |
| Sumitomo Mitsui Financial § | 685 | 4,438 |
| Suzuki Motor | 110,700 | 1,894 |
| T&D Holdings § | 32,700 | 1,620 |
| Toray Industries | 279,000 | 1,249 |
| Toyota Motor | 131,300 | 4,791 |
| USS | 15,560 | 1,234 |
| Total Japan (Cost $92,566) | | 107,443 |
| |
| KAZAKHSTAN 0.3% | | |
| | | |
| Common Stocks 0.3% | | |
| PetroKazakhstan (USD) | 55,463 | 1,610 |
| Total Kazakhstan (Cost $1,488) | 1,610 |
| | | |
| MALAYSIA 0.3% | | |
| | | |
| Common Stocks 0.3% | | |
| Astro All Asia * | 1,191,500 | 1,634 |
| Total Malaysia (Cost $1,327) | | 1,634 |
| |
| MEXICO 2.2% | | |
| | | |
| Common Stocks 2.2% | | |
| America Movil ADR | | |
| Series L (USD) | 71,800 | 3,565 |
| Grupo Financiero Banorte | 186,900 | 1,204 |
| Grupo Modelo, Series C | 467,000 | 1,327 |
| Grupo Televisa ADR (USD) | 34,300 | 1,927 |
| Wal-Mart de Mexico, Series V | 876,173 | 3,240 |
| Total Mexico (Cost $6,686) | | 11,263 |
| |
| NETHERLANDS 1.0% | | |
| | | |
| Common Stocks 1.0% | | |
| Koninklijke Numico * | 67,006 | 2,786 |
| Philips Electronics | 92,179 | 2,308 |
| Total Netherlands (Cost $2,470) | 5,094 |
| |
| NORWAY 1.2% | | |
| | | |
| Common Stocks 1.2% | | |
| Norsk Hydro § | 27,413 | 2,171 |
| Orkla § | 42,995 | 1,447 |
| Statoil ASA § | 128,900 | 2,281 |
| Total Norway (Cost $5,008) | | 5,899 |
| |
| RUSSIA 0.6% | | |
| | | |
| Common Stocks 0.6% | | |
| Lukoil ADR 144A (USD) | 12,790 | 1,744 |
| VimpelCommunication | | |
| ADR (USD) * | 43,700 | 1,430 |
| Total Russia (Cost $2,058) | | 3,174 |
| |
| SINGAPORE 0.6% | | |
| | | |
| Common Stocks 0.6% | | |
| United Overseas Bank | 235,060 | 2,061 |
| Venture | 119,000 | 1,017 |
| Total Singapore (Cost $2,560) | 3,078 |
| | | |
| SOUTH AFRICA 0.4% | | |
| | | |
| Common Stocks 0.4% | | |
| Naspers (N shares) | 84,400 | 1,023 |
| Standard Bank Group | 108,100 | 1,087 |
| Total South Africa (Cost $2,130) | 2,110 |
| |
| SOUTH KOREA 1.0% | | |
| | | |
| Common Stocks 1.0% | | |
| Hyundai GDR 144A (USD) | 57,100 | 1,518 |
| Samsung Electronics | 7,573 | 3,474 |
| Total South Korea (Cost $2,545) | 4,992 |
| |
| SPAIN 4.2% | | |
| | | |
| Common Stocks 4.2% | | |
| Banco Bilbao Vizcaya Argenta | 528,003 | 8,211 |
| Endesa | 85,515 | 1,876 |
| Gas Natural § | 69,870 | 2,000 |
| Inditex § | 152,600 | 4,545 |
| Telefonica § | 203,971 | 3,482 |
| Telefonica ADR (USD) | 29,607 | 1,510 |
| Total Spain (Cost $15,220) | | 21,624 |
| |
| SWEDEN 1.2% | | |
| | | |
| Common Stocks 1.2% | | |
| Securitas, Series B § | 366,735 | 5,913 |
| Total Sweden (Cost $5,293) | | 5,913 |
| |
| SWITZERLAND 7.4% | | |
| | | |
| Common Stocks 7.4% | | |
| Adecco | 93,359 | 4,530 |
| Cie Financ Richemont | | |
| Equity Units, Class A | 88,400 | 2,645 |
| Credit Suisse Group *§ | 179,320 | 7,582 |
| Nestle § | 32,191 | 8,491 |
| Roche Holding | 23,804 | 2,893 |
| UBS § | 145,061 | 11,682 |
| Total Switzerland (Cost $19,470) | 37,823 |
| |
| TAIWAN 1.1% | | |
| | | |
| Common Stocks 1.1% | | |
| E.Sun Financial Holding | 1,802,000 | 1,476 |
| Far Eastone Telecom GDR (USD) | 106,700 | 1,947 |
| Taiwan Semiconductor | 1,271,456 | 2,125 |
| Total Taiwan (Cost $4,913) | | 5,548 |
| | | |
| THAILAND 0.7% | | |
| | | |
| Common Stocks 0.7% | | |
| Bangkok Bank NVDR, GDR | 525,800 | 1,320 |
| Kasikornbank NVDR, GDR | 968,300 | 1,313 |
| True Corporation *§ | 4,826,800 | 1,003 |
| TRUE NVDR * | 165,800 | 34 |
| Total Thailand (Cost $4,013) | | 3,670 |
| |
| TURKEY 0.6% | | |
| | | |
| Common Stocks 0.6% | | |
| Turkiye Garanti Bankasi * | 358,800 | 1,280 |
| Turkiye Is Bankasi | 384,000 | 1,953 |
| Total Turkey (Cost $2,959) | | 3,233 |
| |
| UNITED KINGDOM 20.0% | | |
| | | |
| Common Stocks 20.0% | | |
| AstraZeneca | 121,655 | 5,348 |
| British Sky Broadcasting | 660,243 | 6,851 |
| Cadbury Schweppes | 118,893 | 1,199 |
| Capita Group | 480,600 | 3,466 |
| Carnival | 46,874 | 2,426 |
| Centrica | 356,889 | 1,515 |
| Compass Group | 385,950 | 1,731 |
| Electrocomponents | 262,050 | 1,155 |
| Emap | 118,500 | 1,808 |
| GlaxoSmithKline | 676,447 | 17,070 |
| Hays | 1,185,261 | 2,966 |
| HSBC | 109,207 | 1,750 |
| Kingfisher | 939,103 | 4,437 |
| Reed Elsevier | 595,049 | 5,834 |
| Rio Tinto | 112,436 | 3,399 |
| Royal Bank of Scotland | 305,991 | 9,256 |
| Shell Transport & Trading | 972,705 | 8,733 |
| Standard Chartered | 52,200 | 944 |
| Tesco | 572,124 | 3,385 |
| Unilever | 312,246 | 2,979 |
| United Business Media | 165,889 | 1,578 |
| Vodafone | 3,859,717 | 10,100 |
| WPP Group | 411,270 | 4,487 |
| Total United Kingdom (Cost $67,982) | | 102,417 |
| | | |
| UNITED STATES 1.2% | | |
| | | |
| Common Stocks 1.2% | | |
| Carnival | 67,500 | 3,299 |
| News Corp. CDI GDR | | |
| Class A (AUD) § | 184,339 | 2,820 |
| Total United States (Cost $4,909) | | 6,119 |
| | | |
| SHORT-TERM INVESTMENTS 1.7% | | |
| | | |
| Money Market Funds 1.7% | | |
| T. Rowe Price Reserve Investment | | |
| Fund, 2.93% #† | 8,563,056 | 8,563 |
| Total Short-Term Investments | | |
| (Cost $8,563) | | 8,563 |
| | | |
| SECURITIES LENDING COLLATERAL 23.3% | | |
| | | |
| Money Market Pooled Account 23.3% | | |
| Investment in money market pooled | | |
| account managed by JP Morgan Chase | | |
| Bank, London, 2.902% # | 119,035,233 | 119,035 |
| Total Securities Lending Collateral | | |
| (Cost $119,035) | | 119,035 |
| | | |
| Total Investments in Securities | | |
| 121.7% of Net Assets (Cost $470,220) | $ | 622,401 |
| (1) | Denominated in currency of the country of incorporation |
| | unless otherwise noted |
| # | Seven-day yield |
| * | Non-income producing |
| ++ | At April 30, 2005, a substantial number of the fund’s |
| | international securities were valued by the T. Rowe Price |
| | Valuation Committee, established by the fund’s Board of |
| | Directors. See Note 1 |
| † | Affiliated company – See Note 5 |
| § | All or a portion of this security is on loan at April 30, 2005 – |
| | See Note 2 |
| 144A | Security was purchased pursuant to Rule 144A under the |
| | Securities Act of 1933 and may be resold in transactions |
| | exempt from registration only to qualified institutional |
| | buyers—total value of such securities at period-end |
| | amounts to $4,551 and represents 0.9% of net assets |
| ADR | American Depository Receipts |
| AUD | Australian dollar |
| GDR | Global Depository Receipts |
| HKD | Hong Kong dollar |
| NVDR | Non Voting Depository Receipt |
| USD | United States dollar |
The accompanying notes are an integral part of these financial statements.
| Statement of Assets and Liabilities | | |
| T. Rowe Price Institutional Foreign Equity Fund | | |
| April 30, 2005 (Unaudited) | | |
| (In thousands except shares and per share amounts) | | |
| |
| Assets | | |
| Investments in securities, at value | | |
| Affiliated companies (cost $8,563) | $ | 8,563 |
| Non-affiliated companies (cost $461,657) | | 613,838 |
| |
|
| Total investments in securities | | 622,401 |
| Cash | | 52 |
| Dividends and interest receivable | | 2,059 |
| Receivable for investment securities sold | | 12,430 |
| Receivable for shares sold | | 272 |
| Other assets | | 7,202 |
| |
|
| Total assets | | 644,416 |
| |
|
| |
| Liabilities | | |
| Investment management fees payable | | 323 |
| Payable for investment securities purchased | | 8,570 |
| Payable for shares redeemed | | 570 |
| Obligation to return securities lending collateral | | 119,035 |
| Due to affiliates | | 10 |
| Other liabilities | | 4,491 |
| |
|
| Total liabilities | | 132,999 |
| |
|
| |
| NET ASSETS | $ | 511,417 |
| |
|
| Net Assets Consist of: | | |
| Undistributed net investment income (loss) | $ | 3,316 |
| Undistributed net realized gain (loss) | | (225,666) |
| Net unrealized gain (loss) | | 152,213 |
| Paid-in-capital applicable to 34,151,303 shares of | | |
| $0.01 par value capital stock outstanding; | | |
| 1,000,000,000 shares of the Corporation authorized | | 581,554 |
| |
|
| |
| NET ASSETS | $ | 511,417 |
| |
|
| NET ASSET VALUE PER SHARE | $ | 14.98 |
| |
|
The accompanying notes are an integral part of these financial statements.
| Statement of Operations | | |
| T. Rowe Price Institutional Foreign Equity Fund | | |
| (Unaudited) | | |
| ($ 000s) | | |
| |
| | | 6 Months |
| | | Ended |
| | | 4/30/05 |
| Investment Income (Loss) | | |
| Income | | |
| Dividend (net of foreign taxes of $384) | $ | 6,276 |
| Securities lending | | 218 |
| Interest | | 41 |
| |
|
| Total income | | 6,535 |
| |
|
| Expenses | | |
| Investment management | | 2,311 |
| Custody and accounting | | 160 |
| Registration | | 27 |
| Legal and audit | | 13 |
| Shareholder servicing | | 6 |
| Prospectus and shareholder reports | | 6 |
| Directors | | 3 |
| Miscellaneous | | 6 |
| |
|
| Total expenses | | 2,532 |
| |
|
| Net investment income (loss) | | 4,003 |
| |
|
| Realized and Unrealized Gain (Loss) | | |
| Net realized gain (loss) | | |
| Securities | | 122,766 |
| Foreign currency transactions | | (113) |
| |
|
| Net realized gain (loss) | | 122,653 |
| |
|
| Change in net unrealized gain (loss) | | |
| Securities | | (68,857) |
| Other assets and liabilities | | |
| denominated in foreign currencies | | (33) |
| |
|
| Change in net unrealized gain (loss) | | (68,890) |
| |
|
| Net realized and unrealized gain (loss) | | 53,763 |
| |
|
| |
| INCREASE (DECREASE) IN NET | | |
| ASSETS FROM OPERATIONS | $ | 57,766 |
| |
|
The accompanying notes are an integral part of these financial statements.
| Statement of Changes in Net Assets | | | | |
| T. Rowe Price Institutional Foreign Equity Fund | | | | |
| (Unaudited) | | | | |
| ($ 000s) | | | | |
| |
| | | 6 Months | | Year |
| | | Ended | | Ended |
| | | 4/30/05 | | 10/31/04 |
| Increase (Decrease) in Net Assets | | | | |
| Operations | | | | |
| Net investment income (loss) | $ | 4,003 | $ | 12,762 |
| Net realized gain (loss) | | 122,653 | | 111,624 |
| Change in net unrealized gain (loss) | | (68,890) | | (6,930) |
|
|
| Increase (decrease) in net assets from operations | | 57,766 | | 117,456 |
|
|
| Distributions to shareholders | | | | |
| Net investment income | | (12,965) | | (18,935) |
| Net realized gain | | – | | (1,515) |
|
|
| |
| Decrease in net assets from distributions | | (12,965) | | (20,450) |
|
|
| Capital share transactions * | | | | |
| Shares sold | | 25,999 | | 163,466 |
| Distributions reinvested | | 12,024 | | 17,964 |
| Shares redeemed | | (314,522) | | (596,441) |
|
|
| Increase (decrease) in net assets from capital | | | | |
| share transactions | | (276,499) | | (415,011) |
|
|
| |
| Net Assets | | | | |
| Increase (decrease) during period | | (231,698) | | (318,005) |
| Beginning of period | | 743,115 | | 1,061,120 |
|
|
| End of period | $ | 511,417 | $ | 743,115 |
|
|
| (Including undistributed net investment income of $3,316 at 4/30/05 and | | | | |
| $12,278 at 10/31/04) | | | | |
| |
| *Share information | | | | |
| Shares sold | | 1,713 | | 11,790 |
| Distributions reinvested | | 804 | | 1,369 |
| Shares redeemed | | (20,752) | | (43,551) |
|
|
| Increase (decrease) in shares outstanding | | (18,235) | | (30,392) |
The accompanying notes are an integral part of these financial statements.
| Notes to Financial Statements |
| T. Rowe Price Institutional Foreign Equity Fund |
| April 30, 2005 |
| (Unaudited) |
NOTE 1 - SIGNIFICANT ACCOUNTING POLICIES
T. Rowe Price Institutional International Funds, Inc. (the corporation) is registered under the Investment Company Act of 1940 (the 1940 Act). The Institutional Foreign Equity Fund (the fund), a diversified, open-end management investment company, is one portfolio established by the corporation. The fund commenced operations on September 7, 1989. The fund seeks long-term growth of capital through investments primarily in the common stocks of established, non-U.S. companies.
The accompanying financial statements were prepared in accordance with accounting principles generally accepted in the United States of America, which require the use of estimates made by fund management.
Valuation The fund values its investments and computes its net asset value per share at the close of the New York Stock Exchange (NYSE), normally 4 p.m. ET, each day that the NYSE is open for business. Equity securities listed or regularly traded on a securities exchange or in the over-the-counter market are valued at the last quoted sale price or, for certain markets, the official closing price at the time the valuations are made, except for OTC Bulletin Board securities, which are valued at the mean of the latest bid and asked prices. A security that is listed or traded on more than one exchange is valued at the quotation on the exchange determined to be the primary market for such security. Listed securities not traded on a particular day are valued at the mean of the latest bid and asked prices for domestic securities and the last quoted sale price for international securities.
Investments in mutual funds are valued at the mutual fund’s closing net asset value per share on the day of valuation.
Other investments, including restricted securities, and those for which the above valuation procedures are inappropriate or are deemed not to reflect fair value are stated at fair value as determined in good faith by the T. Rowe Price Valuation Committee, established by the fund’s Board of Directors.
Most foreign markets close before the close of trading on the NYSE. If the fund determines that developments between the close of a foreign market and the close of the NYSE will, in its judgment, materially affect the value of some or all of its portfolio securities, which in turn will affect the fund’s share price, the fund will adjust the previous closing prices to reflect the fair value of the securities as of the close of the NYSE, as determined in good faith by the T. Rowe Price Valuation Committee, established by the fund’s Board of Directors. A fund may also fair value securities in other situations, such as when a particular foreign market is closed but the fund is open. In deciding whether to make fair value adjustments, the fund reviews a variety of factors, including developments in foreign markets, the performance of U.S. securities markets, and the performance of instruments trading in U. S. markets that represent foreign securities and baskets of foreign securities. The fund uses outside pricing services to provide it with closing market prices and information used for adjusting those prices. The fund cannot predict how often it will use closing prices and how often it will adjust those prices. As a means of evaluating its fair value process, the fund routinely compares closing market prices, the next day’s opening prices in the same markets, and adjusted prices.
Currency Translation Assets, including investments, and liabilities denominated in foreign currencies are translated into U.S. dollar values each day at the prevailing exchange rate, using the mean of the bid and asked prices of such currencies against U.S. dollars as quoted by a major bank. Purchases and sales of securities, income, and expenses are translated into U.S. dollars at the prevailing exchange rate on the date of the transaction. The effect of changes in foreign currency exchange rates on realized and unrealized security gains and losses is reflected as a component of security gains and losses.
Redemption Fees A 2% fee is assessed on redemptions of fund shares held less than 90 days to deter short-term trading and protect the interests of long-term shareholders. Redemption fees are withheld from proceeds that shareholders receive from the sale or exchange of fund shares. The fees are paid to the fund, and are recorded as an increase to paid-in capital. The fees may cause the redemption price per share to differ from the net asset value per share.
In-Kind Redemptions In certain circumstances, the fund may distribute portfolio securities rather than cash as payment for a redemption of fund shares (in-kind redemption). For financial reporting purposes, the fund recognizes a gain on in-kind redemptions to the extent the value of the distributed securities on the date of redemption exceeds the cost of those securities. Gains and losses realized on in-kind redemptions are not recognized for tax purposes, and are reclassified from undistributed realized gain (loss) to paid-in capital. During the six months ended April 30, 2005, the fund realized $22,414,000 of net gain on $62,226,000 of in-kind redemptions.
Investment Transactions, Investment Income, and Distributions Income and expenses are recorded on the accrual basis. Dividends received from mutual fund investments are reflected as dividend income; capital gain distributions are reflected as realized gain/loss. Dividend income and capital gain distributions are recorded on the ex-dividend date. Investment transactions are accounted for on the trade date. Realized gains and losses are reported on the identified cost basis. Distributions to shareholders are recorded on the ex-dividend date. Income distributions are declared and paid on an annual basis. Capital gain distributions, if any, are declared and paid by the fund, typically on an annual basis.
Other In the normal course of business, the fund enters into contracts that provide general indemnifications. The fund’s maximum exposure under these arrangements is dependent on claims that may be made against the fund in the future and, therefore, cannot be estimated; however, based on experience, the risk of material loss from such claims is considered remote.
NOTE 2 - INVESTMENT TRANSACTIONS
Consistent with its investment objective, the fund engages in the following practices to manage exposure to certain risks or enhance performance. The investment objective, policies, program, and risk factors of the fund are described more fully in the fund’s prospectus and Statement of Additional Information.
Emerging Markets At April 30, 2005, approximately 14% of the fund’s net assets were invested in securities of companies located in emerging markets or denominated in or linked to the currencies of emerging market countries. Future economic or political developments could adversely affect the liquidity or value, or both, of such securities.
Restricted Securities The fund may invest in securities that are subject to legal or contractual restrictions on resale. Although certain of these securities may be readily sold, for example, under Rule 144A, others may be illiquid, and their sale may involve substantial delays and additional costs, and prompt sale at an acceptable price may be difficult.
Securities Lending The fund lends its securities to approved brokers to earn additional income. It receives as collateral cash and U.S. government securities valued at 102% to 105% of the value of the securities on loan. Cash collateral is invested in a money market pooled account managed by the fund’s lending agent in accordance with investment guidelines approved by fund management. Collateral is maintained over the life of the loan in an amount not less than the value of loaned securities, as determined at the close of fund business each day; any additional collateral required due to changes in security values is delivered to the fund the next business day. Although risk is mitigated by the collateral, the fund could experience a delay in recovering its securities and a possible loss of income or value if the borrower fails to return the securities. Securities lending revenue recognized by the fund consists of earnings on invested collateral and borrowing fees, net of any rebates to the borrower and compensation to the lending agent. At April 30, 2005, the value of loaned securities was $113,352,000; aggregate collateral consisted of $119,035,000 in the money market pooled account.
Other Purchases and sales of portfolio securities, other than short-term securities, aggregated $145,230,000 and $430,951,000, respectively, for the six months ended April 30, 2005.
NOTE 3 - FEDERAL INCOME TAXES
No provision for federal income taxes is required since the fund intends to continue to qualify as a regulated investment company under Subchapter M of the Internal Revenue Code and distribute to shareholders all of its taxable income and gains. Federal income tax regulations differ from generally accepted accounting principles; therefore, distributions determined in accordance with tax regulations may differ in amount or character from net investment income and realized gains for financial reporting purposes. Financial reporting records are adjusted for permanent book/tax differences to reflect tax character. Financial records are not adjusted for temporary differences. The amount and character of tax-basis distributions and composition of net assets are finalized at fiscal year-end; accordingly, tax-basis balances have not been determined as of April 30, 2005.
The fund intends to retain realized gains to the extent of available capital loss carryforwards. As of October 31, 2004, the fund had $348,327,000 of unused capital loss carryforwards, of which $94,844,000 expire in fiscal 2009, $214,055,000 expire in fiscal 2010, and $39,428,000 expire in fiscal 2011.
At April 30, 2005, the cost of investments for federal income tax purposes was $470,220,000. Net unrealized gain aggregated $152,213,000 at period-end, of which $158,534,000 related to appreciated investments and $6,321,000 related to depreciated investments.
NOTE 4 - FOREIGN TAXES
The fund is subject to foreign income taxes imposed by certain countries in which it invests. Foreign income taxes are accrued by the fund as a reduction of income.
Gains realized upon disposition of certain Indian securities held by the fund are subject to capital gains tax in India, payable prior to repatriation of sale proceeds. The tax is computed on net realized gains, and realized losses in excess of gains may be carried forward eight years to offset future gains. In addition, the fund accrues a deferred tax liability for net unrealized gains on Indian securities when applicable.
NOTE 5 - RELATED PARTY TRANSACTIONS
The fund is managed by T. Rowe Price International, Inc. (the manager), a wholly owned subsidiary of T. Rowe Price Associates, Inc. (Price Associates), which is wholly owned by T. Rowe Price Group, Inc.] The investment management agreement between the fund and the manager provides for an annual investment management fee equal to 0.70% of the fund’s average daily net assets. The fee is computed daily and paid monthly.
In addition, the fund has entered into service agreements with Price Associates and a wholly owned subsidiary of Price Associates. Price Associates computes the daily share price and maintains the financial records of the fund. T. Rowe Price Services, Inc., provides shareholder and administrative services in its capacity as the fund’s transfer and dividend disbursing agent. For the six months ended April 30, 2005, expenses incurred pursuant to these service agreements were $53,000 for Price Associates and $8,000 for T. Rowe Price Services. The total amount payable at period end pursuant to these service agreements is reflected as due to affiliates in the accompanying financial statements.
The fund may invest in the T. Rowe Price Reserve Investment Fund and the T. Rowe Price Government Reserve Investment Fund (collectively, the Reserve Funds), open-end management investment companies managed by Price Associates and affiliates of the fund.
The Reserve Funds are offered as cash management options to mutual funds, trusts, and other accounts managed by Price Associates and/or its affiliates, and are not available for direct purchase by members of the public. The Reserve Funds pay no investment management fees. During the six months ended April 30, 2005, dividend income from the Reserve Funds totaled $134,000, and the value of shares of the Reserve Funds held at April 30, 2005 and October 31, 2004 was $8,563,000 and $12,633,000, respectively.
| Information on Proxy Voting Policies, Procedures, and Records |
A description of the policies and procedures used by T. Rowe Price funds and portfolios to determine how to vote proxies relating to portfolio securities is available in each fund’s Statement of Additional Information, which you may request by calling 1-800-225-5132 or by accessing the SEC’s Web site, www.sec.gov. The description of our proxy voting policies and procedures is also available on our Web site, www.troweprice.com. To access it, click on the words “Company Info” at the top of our homepage for individual investors. Then, in the window that appears, click on the “Proxy Voting Policy” navigation button in the top left corner.
Each fund’s most recent annual proxy voting record is available on our Web site and through the SEC’s Web site. To access it through our Web site, follow the directions above, then click on the words “Proxy Voting Record” at the bottom of the Proxy Voting Policy page.
| How to Obtain Quarterly Portfolio Holdings |
The fund files a complete schedule of portfolio holdings with the Securities and Exchange Commission for the first and third quarters of each fiscal year on Form N-Q. The fund’s Form N-Q is available electronically on the SEC’s Web site (www.sec.gov); hard copies may be reviewed and copied at the SEC’s Public Reference Room, 450 Fifth St. N.W., Washington, DC 20549. For more information on the Public Reference Room, call 1-800-SEC-0330.
| Approval of Investment Management Agreement |
On March 2, 2005, the fund’s Board of Directors unanimously approved the investment advisory contract (“Contract”) between the fund and its investment manager, T. Rowe Price International, Inc. (“Manager”). The Board considered a variety of factors in connection with its review of the Contract, also taking into account information provided by the Manager during the course of the year, as discussed below:
Services Provided by the Manager
The Board considered the nature, quality, and extent of the services provided to the fund by the Manager. These services included, but were not limited to, management of the fund’s portfolio and a variety of activities related to portfolio management. The Board also reviewed the background and experience of the Manager’s senior management team and investment personnel involved in the management of the fund. The Board had previously conducted a detailed review of the organization, structure, and investment teams of the Manager at a meeting held in October 2004. The Board concluded that it was satisfied with the nature, quality, and extent of the services provided by the Manager and that the Manager was addressing its concerns regarding the fund’s performance (see below).
Investment Performance of the Fund
The Board reviewed the fund’s average annual total return over the past 10 years and compared these returns to a wide variety of previously agreed upon comparable performance measures and market data, including those supplied by Lipper, an independent provider of mutual fund data. The information indicated that the fund’s results for certain time periods were less than satisfactory. The Manager provided its assessment of the fund’s investment results and reviewed steps taken to address issues raised by the Board. The Board concluded that the Manager’s response was appropriate.
Costs, Benefits, Profits, and Economies of Scale
The Board was provided with detailed information regarding the revenues received by the Manager under the Contract and other benefits that the Manager (and its affiliates) may have realized from its relationship with the fund (including research received under “soft dollar” agreements). The Board also received information on the estimated costs incurred and profits realized by the Manager and its affiliates from advising T. Rowe Price mutual funds, as well as estimates of the gross profits realized from managing the fund in particular. The Board concluded that the Manager’s profits were reasonable in light of the services provided to the fund. The Board also considered the extent to which economies of scale were being realized by the Manager and whether the fund or other funds benefit from any such economies of scale under the fee levels set forth in the Contract. The Board concluded that the advisory fee structure for the fund continued to provide for a reasonable sharing of benefits from economies of scale with the fund’s investors.
Fees
The Board reviewed the fund’s management fee rate, operating expenses, and total expense ratio and compared them to fees and expenses of other comparable funds based on information and data supplied by Lipper. The information provided to the Board showed that the fund’s management fee and expense ratio were generally at or below the median for comparable funds. The Board also reviewed the fee schedules for comparable privately managed accounts of the Manager and its affiliates. Management informed the Board that the Manager’s responsibilities for privately managed accounts are more limited than its responsibilities for the fund and other T. Rowe Price mutual funds that it or its affiliates advise. On the basis of the information provided, the Board concluded that the fees paid by the fund under the Contract were reasonable.
Approval of the Contract
As noted, the Board approved the continuation of the Contract. No single factor was considered in isolation or to be determinative to the decision. Rather, the Board concluded, in light of a weighting and balancing of all factors considered, that it was in the best interests of the fund to approve the continuation of the Contract, including the fees to be charged for services thereunder.
Item 2. Code of Ethics.
A code of ethics, as defined in Item 2 of Form N-CSR, applicable to its principal executive officer, principal financial officer, principal accounting officer or controller, or persons performing similar functions is filed as an exhibit to the registrant’s annual Form N-CSR. No substantive amendments were approved or waivers were granted to this code of ethics during the registrant’s most recent fiscal half-year.
Item 3. Audit Committee Financial Expert.
Disclosure required in registrant’s annual Form N-CSR.
Item 4. Principal Accountant Fees and Services.
Disclosure required in registrant’s annual Form N-CSR.
Item 5. Audit Committee of Listed Registrants.
Not applicable.
Item 6. Schedule of Investments.
Not applicable. The complete schedule of investments is included in Item 1 of this Form N-CSR.
Item 7. Disclosure of Proxy Voting Policies and Procedures for Closed-End Management Investment Companies.
Not applicable.
Item 8. Portfolio Managers of Closed-End Management Investment Companies.
Not applicable.
Item 9. Purchases of Equity Securities by Closed-End Management Investment Company and Affiliated Purchasers.
Not applicable.
Item 10. Submission of Matters to a Vote of Security Holders.
Not applicable.
Item 11. Controls and Procedures.
(a) The registrant’s principal executive officer and principal financial officer have evaluated the registrant’s disclosure controls and procedures within 90 days of this filing and have concluded that the registrant’s disclosure controls and procedures were effective, as of that date, in ensuring that information required to be disclosed by the registrant in this Form N-CSR was recorded, processed, summarized, and reported timely.
(b) The registrant’s principal executive officer and principal financial officer are aware of no change in the registrant’s internal control over financial reporting that occurred during the registrant’s second fiscal quarter covered by this report that has materially affected, or is reasonably likely to materially affect, the registrant’s internal control over financial reporting.
| Item 12. Exhibits. |
| |
| (a)(1) The registrant’s code of ethics pursuant to Item 2 of Form N-CSR is filed with the registrant’s |
| annual Form N-CSR. |
| |
| (2) Separate certifications by the registrant's principal executive officer and principal financial |
| officer, pursuant to Section 302 of the Sarbanes-Oxley Act of 2002 and required by Rule 30a-2(a) |
| under the Investment Company Act of 1940, are attached. |
| |
| (3) Written solicitation to repurchase securities issued by closed-end companies: not applicable. |
| |
| (b) A certification by the registrant's principal executive officer and principal financial officer, |
| pursuant to Section 906 of the Sarbanes-Oxley Act of 2002 and required by Rule 30a-2(b) under the |
| Investment Company Act of 1940, is attached. |
Pursuant to the requirements of the Securities Exchange Act of 1934 and the Investment Company Act of 1940, the registrant has duly caused this report to be signed on its behalf by the undersigned, thereunto duly authorized.
T. Rowe Price Institutional International Funds, Inc.
| By | /s/ James S. Riepe |
| | James S. Riepe |
| | Principal Executive Officer |
| |
| Date | June 16, 2005 |
Pursuant to the requirements of the Securities Exchange Act of 1934 and the Investment Company Act of 1940, this report has been signed below by the following persons on behalf of the registrant and in the capacities and on the dates indicated.
| By | /s/ James S. Riepe |
| | James S. Riepe |
| | Principal Executive Officer |
| |
| Date | June 16, 2005 |
| |
| |
| |
| By | /s/ Joseph A. Carrier |
| | Joseph A. Carrier |
| | Principal Financial Officer |
| |
| Date | June 16, 2005 |