Item 1: Report to Shareholders| Institutional Emerging Markets Equity Fund | April 30, 2005 |
The views and opinions in this report were current as of April 30, 2005. They are not guarantees of performance or investment results and should not be taken as investment advice. Investment decisions reflect a variety of factors, and the managers reserve the right to change their views about individual stocks, sectors, and the markets at any time. As a result, the views expressed should not be relied upon as a forecast of the fund’s future investment intent. The report is certified under the Sarbanes-Oxley Act of 2002, which requires mutual funds and other public companies to affirm that, to the best of their knowledge, the information in their financial reports is fairly and accurately stated in all material respects.
Fellow Shareholders
Emerging stock markets posted solid gains in the 6- and 12-month periods through April 30, 2005, that far surpassed the returns for developed stock markets. During the past year, world economies staged a broad-based recovery, and emerging markets generally benefited from ongoing price increases of oil and raw materials and stronger currencies. However, in the last two months of the period, investors grew cautious about rising oil prices, inflation, and U.S. interest rates, which led to a sell-off and a flight to lower-risk assets. As in the developed markets, small-cap emerging markets stocks outperformed large-caps and value generally outperformed growth.
Performance Review
| Performance Comparison | |
| Periods Ended 4/30/05 | 6 Months | 12 Months |
| Institutional Emerging | | |
| Markets Equity Fund | 16.11% | 27.38% |
| MSCI Emerging | | |
| Markets Index | 13.63 | 24.04 |
| Lipper Emerging Markets | | |
| Funds Average | 12.45 | 22.48 |
| Please see the fund’s quarter-end returns following this letter. |
We are pleased to report that your portfolio generated a solid 16.11% return for the past six months and 27.38% for the 12-month period ended April 30, 2005. As shown in the table, the portfolio handily outperformed the Lipper Emerging Markets Funds Average and the MSCI Emerging Markets Index. Our outperformance versus these benchmarks was driven by stock selection and to a lesser extent by country or sector allocation decisions. For the past six months, the consumer staples sector generated strong relative performance gains, led by household products and tobacco stocks. The next best sector contributor was financials, thanks to the benign interest rate environment and ongoing loan growth in emerging markets. Our materials, consumer discretionary, energy, and information technology holdings lagged.
| Market Performance | | |
| Six Months | Local | Local Currency | U.S. |
| Ended 4/30/05 | Currency | vs. U.S. Dollars | Dollars |
| Brazil | 8.30% | 12.38% | 21.72% |
| India | 6.82 | 4.22 | 11.32 |
| Israel | 18.65 | 2.02 | 20.47 |
| Korea | 8.06 | 12.28 | 21.33 |
| Malaysia | 2.73 | 0.00 | 2.73 |
| Mexico | 6.78 | 4.00 | 11.06 |
| Russia | -3.57 | 3.47 | -3.57 |
| South Africa | 7.44 | 1.24 | 8.78 |
| Taiwan | 1.39 | 6.82 | 8.31 |
| Thailand | 8.90 | 4.07 | 13.33 |
| Source: RIMES Online, using MSCI Indexes. | |
From a regional perspective, Latin American stocks, driven by rising oil and materials prices and stellar results in Brazil, performed the best. In the past six months, Brazil benefited from the weak dollar, high commodity prices, and strong economic growth. Asian emerging markets performed in line with the overall region. High sovereign risk markets, including Pakistan and Indonesia, generated solid results although China lagged. We’ve also seen a bit of reversion to the mean in the region: countries that generated good returns early in the period, such as India, lagged by the end of the period, while South Korea, which had been weak, rebounded nicely. Emerging Europe, the Middle East, and Africa (EMEA) stocks underperformed global emerging markets. Although central European markets, including the Czech Republic and Hungary, and smaller markets such as Egypt were strong, Russia, South Africa, and Turkey lagged.
Portfolio Review
Far East
| Geographic Diversification | |
| Periods Ended | 10/31/04 | 4/30/05 |
| Far East | 44.0% | 43.0% |
| Africa and Middle East | 20.4 | 25.3 |
| Latin America | 19.2 | 18.2 |
| Europe | 9.0 | 5.4 |
| Other and Reserves | 7.4 | 8.1 |
| Total | 100.0% | 100.0% |
China continued to be the major economic growth engine throughout Asia and had a sustained, profound impact on world trade and high commodity prices. Oil prices rose and provided the impetus for the rising prices of exploration company stocks, good demand in the oilfield services sector, and record initial public offering activity in the energy sector. Although economic growth was generally robust, we think there is an absence of high-quality, industry-leading companies that can sustain profitability throughout a full business cycle. We trimmed our holdings in China because of the paucity of attractive investment opportunities, concerns about an economic hard landing as growth slows, and because we are finding better prospects in India.
In general, we are underweight in North Asia because of its reliance on manufacturing and exporting companies, and overweight in South Asia, where we have increased our holdings in India, because of its push toward economic liberalization that continues to gain traction and breadth. New listings and government divestments are leading to a broader potential investment universe. Stock selection in India generated good absolute and relative results during the period. Several of the portfolio’s best-performing Indian contributors for the past six months included textile manufacturer Arvind Mills, UTI Bank, Kotak Mahindra Finance, energy holding Petronet LNG, and telecom services provider Bharti Tele-Ventures. (Please refer to our portfolio of investments for a complete listing of the fund’s holdings and the amount each represents in the portfol io.)
We added to our stake in South Korea-based Samsung Electronics, the portfolio’s largest holding and the largest allocation in the emerging markets index. Samsung has a record of strong execution in high-growth product lines (flash memory and LCDs), and the company’s long-term position in the technology industry remains solid. However, it appears that operating profit in several business lines is nearing cyclical peaks. We added to our position because we think this year’s earnings trough is fully priced into the stock and expect earnings growth to resume in 2006. We established a new position in Malayan Banking Berhad, Malaysia’s largest banking group, which is in the midst of a capital restructuring. We expect it will deliver at or above expectations on operational reform, and the firm is likely to reward shareholders with higher dividends.
Cathay Financial Holdings, a diversified financial services holding company based in Taiwan, was among our largest sales and a significant detractor for the six-month period. We reduced our position because we think there are better growth opportunities in other emerging market banking stocks. We also sold our entire stake in SK Telecom due to concerns about the regulatory environment in South Korea that could hurt profit margins. We eliminated LG Chemical after it reported weak results, and because we expect a downturn in the petrochemicals cycle and softer demand from China.
Europe, Middle East, and Africa
Our overweight in emerging the EMEA region—especially Egypt—and stock selection in South Africa and Israel generated strong returns. The portfolio’s largest country allocation overweight was Egypt, where the market gained 93% for the past six months. Although our Egyptian holdings underperformed the overall Egyptian market, they produced solid gains that easily outperformed the MSCI benchmark. Our telecommunication services sector holdings generated the best absolute performance led by Egyptian wireless holdings Orascom Telecom, which has excellent growth prospects because the company’s operations are not restricted to Egypt, and Egyptian Company for Mobile Services, Vodafone Egypt, Orascom Construction, and Commercial International Bank were also strong contributors.
Stock selection in South Africa and Israel generated solid performance. In South Africa, overweight positions in Naspers (media) and ABSA Group (financials) coupled with underweights in underperforming miners Harmony Gold, Gold Fields, and Anglo American generated good relative returns. In Israel, overweighting Bank Leumi, Bank Hapoalim, and Makhteshim-Agan Industries (materials), and underweighting Check Point Software Technologies and Partner Communications helped us outperform our benchmark. On the negative side of the ledger, our overweight allocation in Turkey, which struggled due to its sensitivity to U.S. interest rates, detracted.
Two of the portfolio’s largest EMEA-region detractors for the six-month period include VimpelCommunication, a Russian mobile operator that is suffering from lower-than-expected revenues and earnings and a shareholder dispute. Hurriyet Gazetecilik, a Turkish media stock, was hurt by the lira’s weakness, but we remain guardedly optimistic about better earnings as advertising revenues recover later in 2005. We have trimmed our position in PetroKazakhstan, which declined on news of litigation relating to pricing, delivery, and the anti-monopoly commission. Although Arcelik is gaining market share in Europe and should benefit from the strengthening Turkish consumer, this large household appliance manufacturer’s shares have tumbled as profits were squeezed by rising materials costs and tough do mestic competition.
| Sector Diversification | |
| | Percent of | Percent of |
| | Net Assets | Net Assets |
| | 10/31/04 | 4/30/05 |
| Financials | 22.7% | 27.7% |
| Consumer Discretionary | 13.7 | 14.4 |
| Telecommunication Services | 14.6 | 14.2 |
| Energy | 11.7 | 9.3 |
| Information Technology | 8.0 | 8.5 |
| Consumer Staples | 7.7 | 8.1 |
| Industrials and Business Services | 3.9 | 4.2 |
| Materials | 8.9 | 3.4 |
| Utilities | 1.4 | 2.1 |
| Trusts and Mutual Funds | 2.0 | 1.7 |
| Health Care | 0.0 | 0.0 |
| Other and Reserves | 5.4 | 6.4 |
| Total | 100.0% | 100.0% |
| Historical weightings reflect current industry/sector classifications. |
After Orascom Telecom, South Africa-based wireless telecom services provider MTN Group was our largest purchase for the past six months. The company provides services in six African countries and is the second-largest provider in South Africa. The firm is increasing earnings through a combination of subscriber growth and improving profitability. Another significant addition since last October was Finansbank; a second-tier Turkish bank that we believe is undervalued compared with other emerging market banks. In addition to having a clean balance sheet, it is benefiting from domestic economic growth and increased demand for banking services.
To raise the funds for the additions, we sold our entire position in South African mining company Impala Platinum. Although we like the company’s long-term prospects, the stock lacks a near-term catalyst and we’ve become more bearish on the metals sector. We unloaded our Anglo American position for similar reasons.
Overall, we increased our exposure in Turkey, Egypt, and South Africa in recent months. The Turkish economy is improving, and inflation and interest rates are declining. The country continues to implement economic and sociopolitical reforms as it heads toward European Union membership. Egypt is experiencing rapid market growth and is implementing political and economic reforms. By emerging market standards, top-tier Egyptian corporations are good quality and many operate in “cozy” duopoly industry structures, which can lead to high return on equity. They also tend to have management teams focused on capital appreciation thanks to substantial insider ownership. We’re bullish on South Africa because we think GDP growth, rising disposable income and real wages, and an improving housing market are trends that can continue for quite some time. Although unemployment is a concern, interest rates are at their lowest levels in 20 years and spending power is increasing, especially amo ng the emerging middle class.
Latin America
Latin American stocks continued their strong performance over the past six months, posting the best results among emerging markets and contributing to the portfolio’s solid returns. Markets in the region generally benefited from stronger currencies and ongoing increases in the price of oil and raw materials, which led energy and materials stocks higher for the period. Consumer and financial stocks also performed well in the region as economic growth fueled stronger consumer demand.
Brazilian stocks, ahead almost 22% for the past six months, paced the Latin American region’s advance. Financials were the region’s top-performing sector. In Brazil, Banco Itau Holdings Financiera was among the portfolio’s top contributors. In our view, it is one of the best run banks in Brazil with high returns, strong loan growth in excess of 20%, and an attractive valuation. Mexico’s Grupo Financiero Banorte was another solid contributor from the sector, helped by increased loan demand and a successful restructuring of the bank’s operations.
In consumer staples, Natura Cosmeticos, a new purchase for the fund last year, was a key contributor. Natura is one of the leading cosmetics companies in Brazil, and we are impressed with its strong revenue growth, quality products, direct distribution model, and excellent corporate governance. Our telecommunications holdings generally performed well. Brazil’s Tele Norte Leste, which has a strong market position insulated from competition, and Mexico’s America Movil, which is increasing subscriber growth and profitability, were solid contributors.
Other contributors included Mexican homebuilder Urbi Desarrollos Urbanos, which saw rising revenues and improvement in its sales mix, and Mexico’s Grupo Aeroportuario del Sureste, where revenues have benefited from higher passenger traffic. The fund’s second-largest holding, Petroleo Brasileiro (Petrobras), rose on accelerating oil production and higher oil prices, while Companhia Vale do Rio Doce (CVRD), another large holding, benefited from surging iron ore prices. We added to CVRD based on our belief that iron ore price increases would be considerably higher than the 20% generally anticipated by market participants. Negotiations have subsequently resulted in a 71.5% increase in the iron ore price.
Brazilian holding Telesp Celular Participacoes was one of the few Latin American holdings that dragged on performance. The company faced margin pressure from increased competition despite its strong subscriber growth.
OUTLOOK
Emerging equity markets have produced good returns for the past four years, and we continue to believe that the fundamentals remain generally healthy. Recent declines were driven by external factors, such as oil price increases, rising global inflation fears, and Federal Reserve rate hikes. This backdrop makes us cautious. However, we believe that growth in our markets will increasingly be powered by domestic demand, with less dependence on global trade factors. In line with this outlook, we favor high-quality stocks in consumer-sensitive industries such as media, retailing, mobile phones, and commercial banks that can produce positive results in this environment.
Respectfully submitted,

| David J.L. Warren |
| President, T. Rowe Price International Funds, Inc. |
| |
| May 19, 2005 |
| Risks of International Investing |
Funds that invest overseas generally carry more risk than funds that invest strictly in U.S. assets. Funds investing in a single country or in a limited geographic region tend to be riskier than more diversified funds. Risks can result from varying stages of economic and political development, differing regulatory environments, trading days, and accounting standards, and higher transaction costs of non-U.S. markets. Non-U.S. investments are also subject to currency risk, or a decline in the value of a foreign currency versus the U.S. dollar, which reduces the dollar value of securities denominated in that currency.
Lipper averages: The averages of available mutual fund performance returns for specified time periods in defined categories as tracked by Lipper Inc.
MSCI Emerging Markets Index: A capitalization-weighted index of stocks from 26 emerging market countries that only includes securities that may be traded by foreign investors.
Portfolio Highlights
| Twenty-Five Largest Holdings |
| | Percent of |
| | Net Assets |
| | 4/30/05 |
| Samsung Electronics, South Korea | 3.9% |
| Petrobras, Brazil | 3.3 |
| America Movil, Mexico | 2.4 |
| Orascom Telecom, Egypt | 2.0 |
| Naspers, South Africa | 2.0 |
| iShares MSCI Emerging Markets Index Fund, | |
| Europe/Far East | 1.7 |
| Companhia Vale do Rio Doce, Brazil | 1.6 |
| Banco Itau Holdings Financiera, Brazil | 1.5 |
| Hyundai Motor, South Korea | 1.5 |
| Wal-Mart de Mexico, Mexico | 1.4 |
| MTN Group Limited, South Africa | 1.4 |
| Orascom Construction Industries, Egypt | 1.2 |
| ABSA Group, South Africa | 1.2 |
| Lukoil, Russia | 1.1 |
| Chinatrust Financial, Taiwan | 1.1 |
| Tele Norte Leste, Brazil | 1.1 |
| Turkiye Is Bankasi, Turkey | 1.1 |
| Commercial International Bank, Egypt | 1.0 |
| VimpelCommunication, Russia | 1.0 |
| Egyptian Company for Mobile Services, Egypt | 1.0 |
| S-Oil, South Korea | 1.0 |
| LG Electronics, South Korea | 0.9 |
| Shinsegae, South Korea | 0.9 |
| UTI Bank, India | 0.9 |
| Grupo Financiero Banorte, Mexico | 0.9 |
| Total | 37.1% |
Note: Table excludes investments in the T. Rowe Price Reserve Investment Fund.
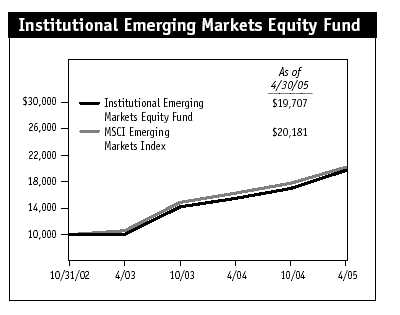
This chart shows the value of a hypothetical $10,000 investment in the fund over the past 10 fiscal year periods or since inception (for funds lacking 10-year records). The result is compared with benchmarks, which may include a broad-based market index and a peer group average or index. Market indexes do not include expenses, which are deducted from fund returns as well as mutual fund averages and indexes.
This table shows how the portfolio and its benchmarks would have performed each year if their actual (or cumulative) returns for the periods shown were earned at a constant rate.
| Average Annual Compound Total Return |
| | | Since |
| | | Inception |
| Periods Ended 4/30/05 | 1 Year | (10/31/02) |
| Institutional Emerging Markets Equity Fund | 27.38% | 31.25% |
| MSCI Emerging Markets Index | 24.04 | 32.51 |
| Lipper Emerging Markets Funds Average | 22.48 | 31.37 |
Returns do not reflect taxes that the shareholder may pay on distributions or the redemption of portfolio shares. Past performance cannot guarantee future results.
Fund Expense Example
As a mutual fund shareholder, you may incur two types of costs: (1) transaction costs such as redemption fees or sales loads and (2) ongoing costs, including management fees, distribution and service (12b-1) fees, and other fund expenses. The following example is intended to help you understand your ongoing costs (in dollars) of investing in the fund and to compare these costs with the ongoing costs of investing in other mutual funds. The example is based on an investment of $1,000 invested at the beginning of the most recent six-month period and held for the entire period.
Actual Expenses
The first line of the following table (“Actual”) provides information about actual account values and actual expenses. You may use the information in this line, together with your account balance, to estimate the expenses that you paid over the period. Simply divide your account value by $1,000 (for example, an $8,600 account value divided by $1,000 = 8.6), then multiply the result by the number in the first line under the heading “Expenses Paid During Period” to estimate the expenses you paid on your account during this period.
Hypothetical Example for Comparison Purposes
The information on the second line of the table (“Hypothetical”) is based on hypothetical account values and expenses derived from the fund’s actual expense ratio and an assumed 5% per year rate of return before expenses (not the fund’s actual return). You may compare the ongoing costs of investing in the fund with other funds by contrasting this 5% hypothetical example and the 5% hypothetical examples that appear in the shareholder reports of the other funds. The hypothetical account values and expenses may not be used to estimate the actual ending account balance or expenses you paid for the period.
You should also be aware that the expenses shown in the table highlight only your ongoing costs and do not reflect any transaction costs, such as redemption fees or sales loads. Therefore, the second line of the table is useful in comparing ongoing costs only and will not help you determine the relative total costs of owning different funds. To the extent a fund charges transaction costs, however, the total cost of owning that fund is higher.
| T. Rowe Price Institutional Emerging Markets Equity Fund |
| | | | Expenses |
| | Beginning | Ending | Paid During |
| | Account | Account | Period* |
| | Value | Value | 11/1/04 to |
| | 11/1/04 | 4/30/05 | 4/30/05 |
| Actual | $1,000.00 | $1,161.10 | $5.89 |
| Hypothetical | | | |
| (assumes 5% return | | | |
| before expenses) | 1,000.00 | 1,019.34 | 5.51 |
| *Expenses are equal to the fund’s annualized expense ratio for the six-month |
| period (1.10%), multiplied by the average account value over the period, |
| multiplied by the number of days in the most recent fiscal half year (181) |
| divided by the days in the year (365) to reflect the half-year period. |
| | | Since |
| | | Inception |
| Periods Ended 3/31/05 | 1 Year | 10/31/02 |
| Institutional Emerging Markets Equity Fund | 17.83% | 33.08% |
| MSCI Emerging Markets Index | 17.02 | 35.29 |
| Lipper Emerging Markets Funds Average | 15.47 | 33.88 |
Current performance may be higher or lower than the quoted past performance, which cannot guarantee future results. Share price, principal value, and return will vary, and you may have a gain or loss when you sell your shares. For the most recent month-end performance information, please contact a T. Rowe Price representative at 1-800-638-8790. The performance information shown does not reflect the deduction of a 2% redemption fee on shares held for three months or less. If it did, the performance would be lower.
This table provides returns through the most recent calendar quarter-end rather than through the end of the fund’s fiscal period. Average annual total return figures include changes in principal value, reinvested dividends, and capital gain distributions. Returns do not reflect taxes that the shareholder may pay on fund distributions or the redemption of fund shares. When assessing performance, investors should consider both short- and long-term returns.
Financial Highlights
T. Rowe Price Institutional Emerging Markets Equity Fund
Unaudited
| | For a share outstanding throughout each period |
| |
| | 6 Months | | Year | 10/31/02 |
| | | Ended | | Ended | Through |
| | | 4/30/05** | 10/31/04 | 10/31/03 |
| NET ASSET VALUE | | | | | | |
| Beginning of period | $ | 16.61 | $ | 14.18 | $ | 10.00 |
|
|
| Investment activities | | | | | | |
| Net investment income (loss) | | 0.12 | | 0.15 | | 0.09 |
| Net realized and | | | | | | |
| unrealized gain (loss) | | 2.53 | | 2.58 | | 4.10 |
|
|
| Total from | | | | | | |
| investment activities | | 2.65 | | 2.73 | | 4.19 |
|
|
| Distributions | | | | | | |
| Net investment income | | (0.07) | | (0.09) | | (0.01) |
| Net realized gain | | (0.42) | | (0.21) | | – |
|
|
| Total distributions | | (0.49) | | (0.30) | | (0.01) |
|
|
| |
| NET ASSET VALUE | | | | | | |
| End of period | $ | 18.77 | $ | 16.61 | $ | 14.18 |
|
|
| |
| Ratios/Supplemental Data | | | | | | |
| Total return^ | | 16.11% | | 19.58% | | 41.94% |
| Ratio of total expenses to | | | | | | |
| average net assets | | 1.10%† | | 1.10% | | 1.10% |
| Ratio of net investment | | | | | | |
| income (loss) to average | | | | | | |
| net assets | | 1.33%† | | 1.28% | | 1.34% |
| Portfolio turnover rate | | 44.1%† | | 69.1% | | 70.4% |
| Net assets, end of period | | | | | | |
| (in thousands) | $ | 67,744 | $ | 34,182 | $ | 15,650 |
| ^ | Total return reflects the rate that an investor would have earned on an investment in the fund during |
| | each period, assuming reinvestment of all distributions and payment of no redemption or account |
| fees. |
| ** Per share amounts calculated using average shares outstanding method. |
| † | Annualized |
The accompanying notes are an integral part of these financial statements.
Portfolio of Investments (1)++
T. Rowe Price Institutional Emerging Markets Equity Fund
April 30, 2005 (Unaudited)
| | | | Shares | Value |
| (Cost and value in $ 000s) | | | | |
| | | | | |
| ARGENTINA 0.8% | | | | |
| Common Stocks 0.8% | | | | |
| Tenaris ADR (USD) | | | 9,600 | 549 |
| Total Argentina (Cost $395) | | | 549 |
| |
| BRAZIL 10.1% | | | | |
| Common Stocks 8.4% | | | | |
| Banco do Brasil * | | | 16,700 | 193 |
| Cia Energetica Minas | | | | |
| Gerais (Cemig) | 11,567,000 | 333 |
| Companhia Siderurgica Nacional | | 14,135 | 308 |
| Companhia Vale do Rio Doce ADR | |
| (1 ADR represents 1 | | | | |
| common share)(USD) | | | 25,930 | 699 |
| Companhia Vale do Rio Doce ADR | |
| (1 ADR represents 1 preference | | |
| ‘A’ share) (USD) | | | 17,300 | 401 |
| Gol-Linhas Aereas Inteligentes | | | |
| ADR (USD) | | | 7,200 | 204 |
| Natura Cosmeticos | | | 11,400 | 342 |
| Petroleo Brasileiro (Petrobras) | | | |
| ADR (1 ADR represents 1 | | | |
| common share)(USD) | | | 16,300 | 683 |
| Petroleo Brasileiro (Petrobras) | | | |
| ADR (1 ADR represents 1 | | | |
| preference share) (USD) | | 42,500 | 1,562 |
| Tele Norte Leste, Rights 5/24/05* | 233 | 0 |
| Tele Norte Leste ADR (USD) | | 18,600 | 275 |
| Tele Norte Leste Participaco | | 22,599 | 450 |
| Telesp Celular Participacoes | | | |
| ADR (USD) * | | | 40,600 | 214 |
| | | | | 5,664 |
| Preferred Stocks 1.7% | | | | |
| Banco Itau Holdings Financiera | | 5,831 | 1,017 |
| Caemi Mineracao e Metalurgica | 194,100 | 148 |
| | | | | 1,165 |
| Total Brazil (Cost $5,326) | | | 6,829 |
| |
| CHINA 3.4% | | | | |
| Common Stocks 3.4% | | | | |
| China Netcom (HKD) * | | 183,000 | 247 |
| China Telecom (HKD) | | 702,000 | 239 |
| China Unicom (HKD) | | 318,000 | 257 |
| CNOOC (HKD) | 721,500 | 389 |
| Gome Electrical | | |
| Appliances (HKD) | 218,000 | 213 |
| Luen Thai Holdings (HKD) * | 424,000 | 160 |
| Shanghai Forte Land | | |
| Company (HKD) | 616,000 | 162 |
| Silver Grant (HKD) | 408,000 | 200 |
| tom.com (HKD) * | 952,000 | 178 |
| ZTE (HKD) | 92,200 | 265 |
| Total China (Cost $2,292) | | 2,310 |
| |
| CZECH REPUBLIC 0.4% | | |
| Common Stocks 0.4% | | |
| Komercni Banka | 2,417 | 306 |
| Total Czech Republic (Cost $285) | 306 |
| |
| EGYPT 5.8% | | |
| Common Stocks 5.8% | | |
| Commercial International Bank | 88,235 | 711 |
| Egyptian Company for | | |
| Mobile Services | 20,485 | 671 |
| Orascom Construction Industries | 36,400 | 828 |
| Orascom Telecom * | 8,770 | 718 |
| Orascom Telecom GDR (USD) * | 15,400 | 634 |
| Vodafone Egypt | 25,200 | 337 |
| Total Egypt (Cost $2,481) | | 3,899 |
| |
| EUROPE/FAR EAST 1.7% | | |
| Common Stocks 1.7% | | |
| iShares MSCI Emerging Markets | | |
| Index Fund (USD) | 5,800 | 1,162 |
| Total Europe/Far East (Cost $1,132) | 1,162 |
| |
| HONG KONG 0.6% | | |
| Common Stocks 0.6% | | |
| China Insurance International | 618,000 | 233 |
| Kingboard Chemical Holdings | 56,000 | 167 |
| Total Hong Kong (Cost $395) | | 400 |
| |
| HUNGARY 0.9% | | |
| Common Stocks 0.9% | | |
| OTP Bank | 19,300 | 596 |
| Total Hungary (Cost $590) | | 596 |
| INDIA 8.7% | | |
| Common Stocks 8.7% | | |
| Arvind Mills * | 179,036 | 483 |
| Ballarpur Industries | 30,900 | 73 |
| Ballarpur Industries, 144A | 26,518 | 63 |
| Ballarpur Industries | | |
| (Regulation S shares) | 3,403 | 8 |
| Bharti Tele-Ventures * | 91,000 | 432 |
| HDFC Bank | 28,000 | 343 |
| HDFC Bank ADR (USD) | 3,300 | 143 |
| I-Flex Solutions | 26,400 | 366 |
| ITC | 13,210 | 434 |
| Kotak Mahindra Finance | 33,000 | 228 |
| LIC Housing Finance * | 52,804 | 302 |
| National Thermal Power | 275,100 | 520 |
| Petronet LNG * | 384,700 | 348 |
| Power Trading | 112,700 | 109 |
| Tata Tea | 27,600 | 325 |
| UTI Bank | 86,400 | 458 |
| UTI Bank GDR (USD) * | 34,100 | 170 |
| Videsh Sanchar Nigam | | |
| ADR (USD) | 52,300 | 489 |
| Zee Telefilms | 190,900 | 573 |
| Total India (Cost $4,858) | | 5,867 |
| |
| INDONESIA 0.7% | | |
| Common Stocks 0.7% | | |
| Indosat | 625,800 | 283 |
| Telekomunikasi | 442,000 | 198 |
| Total Indonesia (Cost $476) | | 481 |
| |
| ISRAEL 2.6% | | |
| Common Stocks 2.6% | | |
| Bank Hapoalim | 176,700 | 608 |
| Bank Leumi | 200,900 | 568 |
| Makhteshim-Agan Industries | 91,600 | 572 |
| Total Israel (Cost $1,360) | | 1,748 |
| |
| KAZAKHSTAN 0.5% | | |
| Common Stocks 0.5% | | |
| PetroKazakhstan (USD) | 11,571 | 336 |
| Total Kazakhstan (Cost $340) | | 336 |
| MALAYSIA 3.4% | | |
| Common Stocks 3.4% | | |
| Astro All Asia * | 405,000 | 555 |
| CIMB Berhad | 288,100 | 377 |
| Hong Leong Bank | 180,100 | 242 |
| IJM | 168,800 | 212 |
| Malayan Banking Berhad | 188,400 | 577 |
| Malaysian Industrial Development | |
| Finance Berhad | 89,100 | 29 |
| MK Land Holdings | 246,300 | 88 |
| Symphony House | 70,150 | 10 |
| Symphony House | | |
| Warrants, 4/28/09 * | 32,250 | 1 |
| Tenaga Nasional | 87,000 | 243 |
| Total Malaysia (Cost $2,412) | | 2,334 |
| |
| MEXICO 7.3% | | |
| Common Stocks 7.3% | | |
| America Movil ADR | | |
| Series L (USD) | 32,100 | 1,594 |
| Grupo Aeroportuario del Sureste | | |
| ADR (USD) | 7,900 | 234 |
| Grupo Financiero Banorte | 97,300 | 627 |
| Grupo Modelo, Series C | 87,000 | 247 |
| Grupo Televisa ADR (USD) | 10,224 | 574 |
| Organizacion Soriana, Series B | 93,000 | 342 |
| Urbi Desarrollos Urbanos * | 81,800 | 399 |
| Wal-Mart de Mexico, Series V | 250,734 | 927 |
| Total Mexico (Cost $3,937) | | 4,944 |
| |
| RUSSIA 3.6% | | |
| Common Stocks 3.6% | | |
| AFK Sistema GDR, 144A (USD) * | 8,300 | 129 |
| Gazprom ADR (USD) | 5,900 | 199 |
| Lukoil (USD) | 6,410 | 219 |
| Lukoil ADR (USD) | 3,930 | 536 |
| MMC Norilsk Nickel (USD) | 300 | 17 |
| Mobile Telesystems ADR (USD) | 10,400 | 350 |
| Sberbank (USD) | 450 | 294 |
| VimpelCommunication | | |
| ADR (USD) * | 21,000 | 687 |
| Total Russia (Cost $1,962) | | 2,431 |
| |
| SOUTH AFRICA 11.5% | | |
| Common Stocks 11.5% | | |
| ABSA Group | 63,000 | 807 |
| African Bank Investments | 164,500 | 441 |
| Edgars Consolidated Stores | 12,200 | 506 |
| FirstRand | 174,900 | 373 |
| Investec | 9,600 | 277 |
| JD Group | 43,210 | 445 |
| Massmart Holdings | 40,200 | 291 |
| MTN Group | 129,000 | 917 |
| Naspers (N shares) | 111,100 | 1,347 |
| Pick ‘N Pay Stores | 48,100 | 179 |
| SABMiller | 24,900 | 369 |
| Sanlam | 306,800 | 582 |
| Standard Bank Group | 51,396 | 517 |
| Sun International | 36,200 | 348 |
| Truworths | 155,700 | 412 |
| Total South Africa (Cost $6,685) | 7,811 |
| |
| SOUTH KOREA 15.7% | | |
| Common Stocks 14.2% | | |
| Amorepacific | 2,255 | 559 |
| Cheil Communications | 1,610 | 265 |
| CJ Internet * | 6,550 | 59 |
| Daewoo Shipbuilding & Marine | | |
| Engineering | 13,750 | 250 |
| Hanaro Telecom * | 67,134 | 173 |
| Hyundai Department Store | 4,630 | 204 |
| Hyundai Motor GDR, 144A (USD) | 6,100 | 162 |
| Hyundai Heavy Industries | 4,120 | 211 |
| Hyundai Motor | 1,460 | 80 |
| Kookmin Bank | 12,680 | 538 |
| Kookmin Bank ADR (USD) | 1,700 | 73 |
| Kumgang Korea Chemical | 3,460 | 582 |
| Kumho Tire GDR, 144A (USD) * | 9,400 | 65 |
| LG Electronics | 9,550 | 642 |
| Lotte Chilsung Beverage | 485 | 478 |
| NCsoft * | 4,690 | 363 |
| S-Oil | 9,370 | 652 |
| Samsung Electronics | 5,180 | 2,377 |
| Shinhan Financial | 14,300 | 371 |
| Shinsegae | 1,980 | 634 |
| SK Corporation | 5,690 | 319 |
| Woori Finance Holdings | 61,930 | 568 |
| | | 9,625 |
| Preferred Stocks 1.5% | | |
| Hyundai Motor | 21,360 | 744 |
| Samsung Electronics | 980 | 296 |
| | | 1,040 |
| Total South Korea (Cost $8,784) | 10,665 |
| |
| TAIWAN 7.9% | | |
| Common Stocks 7.9% | | |
| Advantech | 187,795 | 439 |
| Basso Industry | 113,000 | 280 |
| Cathay Financial Holdings | 165,000 | 300 |
| Chinatrust Financial Holding | 641,733 | 738 |
| E.Sun Financial Holding | 678,000 | 555 |
| Far Eastern Department Stores | 309,000 | 147 |
| Far Eastern Textile | 481,505 | 329 |
| Formosa Petrochemical * | 125,000 | 261 |
| Foxconn Technology * | 108,000 | 309 |
| MediaTek | 37,000 | 283 |
| Polaris Securities | 273,000 | 121 |
| Quanta Computer | 287,226 | 482 |
| Taishin Financial Holdings | 642,887 | 579 |
| Via Technologies * | 263,537 | 136 |
| Yuanta Core Pacific | 229,063 | 164 |
| Zyxel Communications | 89,000 | 206 |
| Total Taiwan (Cost $5,062) | | 5,329 |
| |
| THAILAND 2.6% | | |
| Common Stocks 2.6% | | |
| Bangkok Bank NVDR, GDR | 162,200 | 407 |
| C.P. 7-Eleven | 184,400 | 139 |
| Kasikornbank NVDR, GDR | 302,200 | 410 |
| Land & Houses NVDR | 1,372,700 | 246 |
| PTT Exploration & Production | 26,400 | 233 |
| Ratchaburi Electricity | | |
| Generating Holding | 237,800 | 233 |
| Siam Commercial Bank | 64,300 | 77 |
| Siam Commercial Bank | | |
| NVDR, GDR | 40,000 | 48 |
| Total Thailand (Cost $1,746) | | 1,793 |
| |
| TURKEY 5.4% | | |
| Common Stocks 5.4% | | |
| Akbank | 46,900 | 226 |
| Anadolou Efes Biracilik | | |
| ve Malt Sanayii | 10,200 | 199 |
| Arcelik * | 40,300 | 183 |
| Denizbank * | 162,749 | 455 |
| Dogus Otomotiv * | 6,000 | 14 |
| Finansbank * | 218,700 | 595 |
| Hurriyet Gazetecilik | | |
| ve Matbaacilik | 283,100 | 507 |
| Turkcell Iletisim Hizmet | 44,800 | 275 |
| Turkcell Iletisim Hizmet | | |
| ADR (USD) | 3,269 | 51 |
| Turkiye Garanti Bankasi * | 118,600 | 423 |
| Turkiye Is Bankasi | 141,400 | 719 |
| Total Turkey (Cost $3,252) | | 3,647 |
| |
| SHORT-TERM INVESTMENTS 5.0% | | |
| | | |
| Money Market Funds 5.0% | | |
| T. Rowe Price Reserve | | |
| Investment Fund, 2.93% # † | 3,389,372 | 3,389 |
| Total Short-Term Investments | | |
| (Cost $3,389) | | 3,389 |
| |
| Total Investments in Securities | | |
| 98.6% of Net Assets (Cost $57,159) | $66,826 |
| (1) | Denominated in currency of the country of incorporation |
| | unless otherwise noted |
| # | Seven-day yield |
| * | Non-income producing |
| ++ | At April 30, 2005, a substantial number of the fund’s inter- |
| | national securities were valued by the T. Rowe Price |
| | Valuation Committee, established by the fund’s Board of |
| | Directors. See Note 1 |
| † | Affiliated company – See Note 5 |
| 144A | Security was purchased pursuant to Rule 144A under |
| | the Securities Act of 1933 and may be resold in transactions |
| | exempt from registration only to qualified institutional |
| | buyers—total value of such securities at period-end |
| | amounts to $419 and represents 0.6% of net assets |
| ADR | American Depository Receipts |
| GDR | Global Depository Receipts |
| HKD | Hong Kong dollar |
| NVDR | Non Voting Depository Receipt |
| USD | United States dollar |
The accompanying notes are an integral part of these financial statements.
Statement of Assets and Liabilities
T. Rowe Price Institutional Emerging Markets Equity Fund
April 30, 2005 (Unaudited)
(In thousands except shares and per share amounts)
| Assets | | |
| Investments in securities, at value | | |
| Affiliated companies (cost $3,389) | $ | 3,389 |
| Non-affiliated companies (cost $53,770) | | 63,437 |
|
|
| Total investments in securities | | 66,826 |
| Cash | | 25 |
| Dividends receivable | | 179 |
| Receivable for investment securities sold | | 747 |
| Receivable for shares sold | | 309 |
| Other assets | | 635 |
|
|
| Total assets | | 68,721 |
|
|
| |
| Liabilities | | |
| Payable for investment securities purchased | | 817 |
| Due to affiliates | | 69 |
| Other liabilities | | 91 |
|
|
| Total liabilities | | 977 |
|
|
| |
| NET ASSETS | $ | 67,744 |
|
|
| Net Assets Consist of: | | |
| Undistributed net investment income (loss) | $ | 326 |
| Undistributed net realized gain (loss) | | 839 |
| Net unrealized gain (loss) | | 9,673 |
| Paid-in-capital applicable to 3,609,718 shares of | | |
| $0.01 par value capital stock outstanding; | | |
| 1,000,000,000 shares of the Corporation authorized | | 56,906 |
|
|
| |
| NET ASSETS | $ | 67,744 |
|
|
| NET ASSET VALUE PER SHARE | $ | 18.77 |
|
|
The accompanying notes are an integral part of these financial statements.
Statement of Operations
T. Rowe Price Institutional Emerging Markets Equity Fund
Unaudited
($ 000s)
| | | 6 Months |
| | | Ended |
| | | 4/30/05 |
| Investment Income (Loss) | | |
| Dividend income (net of foreign taxes of $67) | $ | 627 |
| Investment management and administrative expense | | 284 |
|
|
| Net investment income (loss) | | 343 |
|
|
| Realized and Unrealized Gain (Loss) | | |
| Net realized gain (loss) | | |
| Securities (net of foreign taxes of $1) | | 934 |
| Foreign currency transactions | | (74) |
|
|
| Net realized gain (loss) | | 860 |
|
|
| Change in net unrealized gain (loss) | | |
| Securities | | 4,302 |
| Other assets and liabilities | | |
| denominated in foreign currencies | | 3 |
|
|
| Change in net unrealized gain (loss) | | 4,305 |
|
|
| Net realized and unrealized gain (loss) | | 5,165 |
|
|
| |
| INCREASE (DECREASE) IN NET | | |
| ASSETS FROM OPERATIONS | $ | 5,508 |
|
|
The accompanying notes are an integral part of these financial statements.
Statement of Changes in Net Assets
T. Rowe Price Institutional Emerging Markets Equity Fund
Unaudited
($ 000s)
| | | 6 Months | | Year |
| | | Ended | | Ended |
| | | 4/30/05 | | 10/31/04 |
| Increase (Decrease) in Net Assets | | | | |
| Operations | | | | |
| Net investment income (loss) | $ | 343 | $ | 323 |
| Net realized gain (loss) | | 860 | | 874 |
| Change in net unrealized gain (loss) | | 4,305 | | 2,834 |
|
|
| Increase (decrease) in net assets from operations | | 5,508 | | 4,031 |
|
|
| Distributions to shareholders | | | | |
| Net investment income | | (172) | | (115) |
| Net realized gain | | (1,031) | | (268) |
|
|
| Decrease in net assets from distributions | | (1,203) | | (383) |
|
|
| Capital share transactions * | | | | |
| Shares sold | | 33,164 | | 19,092 |
| Distributions reinvested | | 714 | | 280 |
| Shares redeemed | | (4,622) | | (4,488) |
| Redemption fees received | | 1 | | – |
|
|
| Increase (decrease) in net assets from capital | | | | |
| share transactions | | 29,257 | | 14,884 |
|
|
| |
| Net Assets | | | | |
| Increase (decrease) during period | | 33,562 | | 18,532 |
| Beginning of period | | 34,182 | | 15,650 |
|
|
| |
| End of period | $ | 67,744 | $ | 34,182 |
|
|
| (Including undistributed net investment income of $326 at 4/30/05 and | | | | |
| $155 at 10/31/04) | | | | |
| |
| *Share information | | | | |
| Shares sold | | 1,765 | | 1,228 |
| Distributions reinvested | | 40 | | 19 |
| Shares redeemed | | (252) | | (293) |
|
|
| Increase (decrease) in shares outstanding | | 1,553 | | 954 |
The accompanying notes are an integral part of these financial statements.
Notes to Financial Statements
T. Rowe Price Institutional Emerging Markets Equity Fund
April 30, 2005 (Unaudited)
NOTE 1 - SIGNIFICANT ACCOUNTING POLICIES
T. Rowe Price Institutional International Funds, Inc. (the corporation) is registered under the Investment Company Act of 1940 (the 1940 Act). The Institutional Emerging Markets Equity Fund (the fund), a diversified, open-end management investment company, is one portfolio established by the corporation. The fund commenced operations on October 31, 2002. The fund seeks long-term growth of capital through investments primarily in the common stocks of companies located (or with primary operations) in emerging markets.
The accompanying financial statements were prepared in accordance with accounting principles generally accepted in the United States of America, which require the use of estimates made by fund management.
Valuation The fund values its investments and computes its net asset value per share at the close of the New York Stock Exchange (NYSE), normally 4 p.m. ET, each day that the NYSE is open for business. Equity securities listed or regularly traded on a securities exchange or in the over-the-counter market are valued at the last quoted sale price or, for certain markets, the official closing price at the time the valuations are made, except for OTC Bulletin Board securities, which are valued at the mean of the latest bid and asked prices. A security that is listed or traded on more than one exchange is valued at the quotation on the exchange determined to be the primary market for such security. Listed securities not traded on a particular day are valued at the mean of the latest bid and asked prices for domestic securities and the last quoted sale price for international securities.
Investments in mutual funds are valued at the mutual fund’s closing net asset value per share on the day of valuation.
Other investments, including restricted securities, and those for which the above valuation procedures are inappropriate or are deemed not to reflect fair value are stated at fair value as determined in good faith by the T. Rowe Price Valuation Committee, established by the fund’s Board of Directors.
Most foreign markets close before the close of trading on the NYSE. If the fund determines that developments between the close of a foreign market and the close of the NYSE will, in its judgment, materially affect the value of some or all of its portfolio securities, which in turn will affect the fund’s share price, the fund will adjust the previous closing prices to reflect the fair value of the securities as of the close of the NYSE, as determined in good faith by the T. Rowe Price Valuation Committee, established by the fund’s Board of Directors. A fund may also fair value securities in other situations, such as when a particular foreign market is closed but the fund is open. In deciding whether to make fair value adjustments, the fund reviews a variety of factors, including developments in foreign markets, the performance of U.S. securities markets, and the performance of instruments trading in U.S. markets that represent foreign securities and baskets of foreign securities. The fund uses outside pricing services to provide it with closing market prices and information used for adjusting those prices. The fund cannot predict how often it will use closing prices and how often it will adjust those prices. As a means of evaluating its fair value process, the fund routinely compares closing market prices, the next day’s opening prices in the same markets, and adjusted prices.
Currency Translation Assets, including investments, and liabilities denominated in foreign currencies are translated into U.S. dollar values each day at the prevailing exchange rate, using the mean of the bid and asked prices of such currencies against U.S. dollars as quoted by a major bank. Purchases and sales of securities, income, and expenses are translated into U.S. dollars at the prevailing exchange rate on the date of the transaction. The effect of changes in foreign currency exchange rates on realized and unrealized security gains and losses is reflected as a component of security gains and losses.
Redemption Fees A 2% fee is assessed on redemptions of fund shares held less than 90 days to deter short-term trading and protect the interests of long-term shareholders. Redemption fees are withheld from proceeds that shareholders receive from the sale or exchange of fund shares. The fees are paid to the fund, and are recorded as an increase to paid-in capital. The fees may cause the redemption price per share to differ from the net asset value per share.
Investment Transactions, Investment Income, and Distributions Income and expenses are recorded on the accrual basis. Dividends received from mutual fund investments are reflected as dividend income; capital gain distributions are reflected as realized gain/loss. Dividend income and capital gain distributions are recorded on the ex-dividend date. Investment transactions are accounted for on the trade date. Realized gains and losses are reported on the identified cost basis. Distributions to shareholders are recorded on the ex-dividend date. Income distributions are declared and paid on an annual basis. Capital gain distributions, if any, are declared and paid by the fund, typically on an annual basis.
Other In the normal course of business, the fund enters into contracts that provide general indemnifications. The fund’s maximum exposure under these arrangements is dependent on claims that may be made against the fund in the future and, therefore, cannot be estimated; however, based on experience, the risk of material loss from such claims is considered remote.
NOTE 2 - INVESTMENT TRANSACTIONS
Consistent with its investment objective, the fund engages in the following practices to manage exposure to certain risks or enhance performance. The investment objective, policies, program, and risk factors of the fund are described more fully in the fund’s prospectus and Statement of Additional Information.
Emerging Markets At April 30, 2005, approximately 94% of the fund’s net assets were invested in securities of companies located in emerging markets or denominated in or linked to the currencies of emerging market countries. Future economic or political developments could adversely affect the liquidity or value, or both, of such securities.
Restricted Securities The fund may invest in securities that are subject to legal or contractual restrictions on resale. Although certain of these securities may be readily sold, for example, under Rule 144A, others may be illiquid, and their sale may involve substantial delays and additional costs, and prompt sale at an acceptable price may be difficult.
Other Purchases and sales of portfolio securities, other than short-term securities, aggregated $36,849,000 and $10,983,000, respectively, for the six months ended April 30, 2005.
NOTE 3 - FEDERAL INCOME TAXES
No provision for federal income taxes is required since the fund intends to continue to qualify as a regulated investment company under Subchapter M of the Internal Revenue Code and distribute to shareholders all of its taxable income and gains. Federal income tax regulations differ from generally accepted accounting principles; therefore, distributions determined in accordance with tax regulations may differ in amount or character from net investment income and realized gains for financial reporting purposes. Financial reporting records are adjusted for permanent book/tax differences to reflect tax character. Financial records are not adjusted for temporary differences. The amount and character of tax-basis distributions and composition of net assets are finalized at fiscal year-end; accordingly, tax-basis balances have not been determined as of April 30, 2005.
At April 30, 2005, the cost of investments for federal income tax purposes was $57,159,000. Net unrealized gain aggregated $9,673,000 at period-end, of which $10,566,000 related to appreciated investments and $893,000 related to depreciated investments.
NOTE 4 - FOREIGN TAXES
The fund is subject to foreign income taxes imposed by certain countries in which it invests. Foreign income taxes are accrued by the fund as a reduction of income.
Gains realized upon disposition of certain Indian securities held by the fund are subject to capital gains tax in India, payable prior to repatriation of sale proceeds. The tax is computed on net realized gains, and realized losses in excess of gains may be carried forward eight years to offset future gains. In addition, the fund accrues a deferred tax liability for net unrealized gains on Indian securities when applicable. At April 30, 2005, the fund had a capital gain tax refund receivable of $4,000, no deferred tax liability, and no capital loss carryforwards.
NOTE 5 - RELATED PARTY TRANSACTIONS
The fund is managed by T. Rowe Price International, Inc. (the manager), a wholly owned subsidiary of T. Rowe Price Associates, Inc. (Price Associates), which is wholly owned by T. Rowe Price Group, Inc. The investment management and administrative agreement between the fund and the manager provides for an all-inclusive annual fee equal to 1.10% of the fund’s average daily net assets. The fee is computed daily and paid monthly. The agreement provides that investment management, shareholder servicing, transfer agency, accounting, and custody services are provided to the fund, and interest, taxes, brokerage commissions, directors’ fees and expenses, and extraordinary expenses are paid directly by the fund.
The fund may invest in the T. Rowe Price Reserve Investment Fund and the T. Rowe Price Government Reserve Investment Fund (collectively, the Reserve Funds), open-end management investment companies managed by Price Associates and affiliates of the fund. The Reserve Funds are offered as cash management options to mutual funds, trusts, and other accounts managed by Price Associates and/or its affiliates, and are not available for direct purchase by members of the public. The Reserve Funds pay no investment management fees. During the six months ended April 30, 2005, dividend income from the Reserve Funds totaled $27,000, and the value of shares of the Reserve Funds held at April 30, 2005, and October 31, 2004, was $3,389,000 and $2,093,000, respectively.
As of April 30, 2005, T. Rowe Price Group, Inc. and/or its wholly owned subsidiaries owned 209,982 shares of the fund, representing 6% of the fund’s net assets.
| Information on Proxy Voting Policies, Procedures, and Records |
A description of the policies and procedures used by T. Rowe Price funds and portfolios to determine how to vote proxies relating to portfolio securities is available in each fund’s Statement of Additional Information, which you may request by calling 1-800-225-5132 or by accessing the SEC’s Web site, www.sec.gov. The description of our proxy voting policies and procedures is also available on our Web site, www.troweprice.com. To access it, click on the words “Company Info” at the top of our homepage for individual investors. Then, in the window that appears, click on the “Proxy Voting Policy” navigation button in the top left corner.
Each fund’s most recent annual proxy voting record is available on our Web site and through the SEC’s Web site. To access it through our Web site, follow the directions above, then click on the words “Proxy Voting Record” at the bottom of the Proxy Voting Policy page.
| How to Obtain Quarterly Portfolio Holdings |
The fund files a complete schedule of portfolio holdings with the Securities and Exchange Commission for the first and third quarters of each fiscal year on Form N-Q. The fund’s Form N-Q is available electronically on the SEC’s Web site (www.sec.gov); hard copies may be reviewed and copied at the SEC’s Public Reference Room, 450 Fifth St. N.W., Washington, DC 20549. For more information on the Public Reference Room, call 1-800-SEC-0330.
| Approval of Investment Management Agreement |
On March 2, 2005, the fund’s Board of Directors unanimously approved the investment advisory contract (“Contract”) between the fund and its investment manager, T. Rowe Price International, Inc. (“Manager”). The Board considered a variety of factors in connection with its review of the Contract, also taking into account information provided by the Manager during the course of the year, as discussed below:
Services Provided by the Manager
The Board considered the nature, quality, and extent of the services provided to the fund by the Manager. These services included, but were not limited to, management of the fund’s portfolio and a variety of activities related to portfolio management. The Board also reviewed the background and experience of the Manager’s senior management team and investment personnel involved in the management of the fund. The Board had previously conducted a detailed review of the organization, structure, and investment teams of the Manager at a meeting held in October 2004. The Board concluded that it was satisfied with the nature, quality, and extent of the services provided by the Manager.
Investment Performance of the Fund
The Board reviewed the fund’s annual total returns since October 31, 2002, and compared these returns to a wide variety of previously agreed upon comparable performance measures and market data, including those supplied by Lipper, an independent provider of mutual fund data. On the basis of this evaluation and the Board’s ongoing review of investment results, the Board concluded that the fund’s performance was satisfactory.
Costs, Benefits, Profits, and Economies of Scale
The Board was provided with detailed information regarding the revenues received by the Manager under the Contract and other benefits that the Manager (and its affiliates) may have realized from its relationship with the fund (including research received under “soft dollar” agreements). The Board also received information on the estimated costs incurred and profits realized by the Manager and its affiliates from advising T. Rowe Price mutual funds. Because the Manager is currently waiving a portion of its fee, the Board was not provided with estimates of the gross profits realized from managing the fund in particular. The Board concluded that the Manager’s profits were reasonable in light of the services provided to the fund. In this regard, the Board noted that a portion of the advisory fees were being waived. The Board also considered the extent to which economies of scale were being realized by the Manager and concluded that the Manager had not realized any material econo mies of scale from managing the fund.
Fees
The Board reviewed the fund’s management fee rate, operating expenses, and total expense ratio and compared them to fees and expenses of other comparable funds based on information and data supplied by Lipper. The information provided to the Board showed that the fund’s management fee (after waivers) and expense ratio were generally below the median of comparable funds. The Board also reviewed the fee schedules for comparable privately managed accounts of the Manager and its affiliates. Management informed the Board that the Manager’s responsibilities for privately managed accounts are more limited than its responsibilities for the fund and other T. Rowe Price mutual funds that it or its affiliates advise. On the basis of the information provided, the Board concluded that the fees paid by the fund under the Contract were reasonable.
Approval of the Contract
As noted, the Board approved the continuation of the Contract. No single factor was considered in isolation or to be determinative to the decision. Rather, the Board concluded, in light of a weighting and balancing of all factors considered, that it was in the best interests of the fund to approve the continuation of the Contract, including the fees to be charged for services thereunder.
Item 2. Code of Ethics.
A code of ethics, as defined in Item 2 of Form N-CSR, applicable to its principal executive officer, principal financial officer, principal accounting officer or controller, or persons performing similar functions is filed as an exhibit to the registrant’s annual Form N-CSR. No substantive amendments were approved or waivers were granted to this code of ethics during the registrant’s most recent fiscal half-year.
Item 3. Audit Committee Financial Expert.
Disclosure required in registrant’s annual Form N-CSR.
Item 4. Principal Accountant Fees and Services.
Disclosure required in registrant’s annual Form N-CSR.
Item 5. Audit Committee of Listed Registrants.
Not applicable.
Item 6. Schedule of Investments.
Not applicable. The complete schedule of investments is included in Item 1 of this Form N-CSR.
Item 7. Disclosure of Proxy Voting Policies and Procedures for Closed-End Management Investment Companies.
Not applicable.
Item 8. Portfolio Managers of Closed-End Management Investment Companies.
Not applicable.
Item 9. Purchases of Equity Securities by Closed-End Management Investment Company and Affiliated Purchasers.
Not applicable.
Item 10. Submission of Matters to a Vote of Security Holders.
Not applicable.
Item 11. Controls and Procedures.
(a) The registrant’s principal executive officer and principal financial officer have evaluated the registrant’s disclosure controls and procedures within 90 days of this filing and have concluded that the registrant’s disclosure controls and procedures were effective, as of that date, in ensuring that information required to be disclosed by the registrant in this Form N-CSR was recorded, processed, summarized, and reported timely.
(b) The registrant’s principal executive officer and principal financial officer are aware of no change in the registrant’s internal control over financial reporting that occurred during the registrant’s second fiscal quarter covered by this report that has materially affected, or is reasonably likely to materially affect, the registrant’s internal control over financial reporting.
| Item 12. Exhibits. |
| |
| (a)(1) The registrant’s code of ethics pursuant to Item 2 of Form N-CSR is filed with the registrant’s |
| annual Form N-CSR. |
| |
| (2) Separate certifications by the registrant's principal executive officer and principal financial |
| officer, pursuant to Section 302 of the Sarbanes-Oxley Act of 2002 and required by Rule 30a-2(a) |
| under the Investment Company Act of 1940, are attached. |
| |
| (3) Written solicitation to repurchase securities issued by closed-end companies: not applicable. |
| |
| (b) A certification by the registrant's principal executive officer and principal financial officer, |
| pursuant to Section 906 of the Sarbanes-Oxley Act of 2002 and required by Rule 30a-2(b) under the |
| Investment Company Act of 1940, is attached. |
SIGNATURES
Pursuant to the requirements of the Securities Exchange Act of 1934 and the Investment Company Act of 1940, the registrant has duly caused this report to be signed on its behalf by the undersigned, thereunto duly authorized.
T. Rowe Price Institutional International Funds, Inc.
| By | /s/ James S. Riepe |
| | James S. Riepe |
| | Principal Executive Officer |
| |
| Date | June 16, 2005 |
Pursuant to the requirements of the Securities Exchange Act of 1934 and the Investment Company Act of 1940, this report has been signed below by the following persons on behalf of the registrant and in the capacities and on the dates indicated.
| By | /s/ James S. Riepe |
| | James S. Riepe |
| | Principal Executive Officer |
| |
| Date | June 16, 2005 |
| By | /s/ Joseph A. Carrier |
| | Joseph A. Carrier |
| | Principal Financial Officer |
| |
| Date | June 16, 2005 |