Table of Contents
UNITED STATES
SECURITIES AND EXCHANGE COMMISSION
WASHINGTON, D.C. 20549
FORM 20-F/A
(Amendment No. 2)
Annual Report Pursuant to Section 13 or 15(d) of the Securities Exchange Act of 1934
For the fiscal year ended December 31, 2002
| Commission file number 1-3788 | Commission file number 1-4039 | |
N.V. KONINKLIJKE NEDERLANDSCHE | THE “SHELL” TRANSPORT AND TRADING | |
| PETROLEUM MAATSCHAPPIJ | COMPANY, PUBLIC LIMITED COMPANY | |
| (Exact name of registrant as specified in its charter) | (Exact name of registrant as specified in its charter) | |
ROYAL DUTCH PETROLEUM COMPANY | ||
| (Translation of registrant’s name into English) | ||
The Netherlands | England | |
| (Jurisdiction of incorporation or organisation) | (Jurisdiction of incorporation or organisation) | |
| 30, Carel van Bylandtlaan, 2596 HR The Hague, The Netherlands | Shell Centre, London SE1 7NA, England | |
| tel. no: (011 31 70) 377 9111 | tel. no: (011 44 20) 7934 1234 | |
| (Address of principal executive offices) | (Address of principal executive offices) | |
Securities Registered Pursuant to Section 12(b) of the Act
Title of Each Class | Name of Each Exchange on Which Registered | Title of Each Class | Name of Each Exchange on Which Registered | |||
| Ordinary shares of the nominal (par) value of 0.56 Euro (€0.56) each | New York Stock Exchange* | New York Shares representing Ordinary shares of the issuer of an aggregate nominal amount of £1.50 each and evidenced by Depositary Receipts (“New York Shares”) | New York Stock Exchange** | |||
| Ordinary shares of 25p each*** | ||||||
| *Also admitted to unlisted trading privileges on the following Stock Exchanges: Boston, Cincinnati, Midwest, Pacific and Philadelphia. | **Also admitted to unlisted trading privileges on the following Stock Exchanges: Boston, Cincinnati, Midwest, Pacific and Philadelphia. ***Not for trading, but only in connection with the listing of New York Shares on the New York Stock Exchange | |||||
Securities Registered Pursuant to Section 12(g) of the Act
None
Securities For Which There is a Reporting Obligation
Pursuant to Section 15(d) of the Act
None
| Indicate the number of outstanding shares of each of the issuer’s classes of capital or common stock as of the close of the period covered by the annual report. Outstanding as of December 31, 2002: 2,099,285,000 ordinary shares of€0.56 each. | Indicate the number of outstanding shares of each of the issuer’s classes of capital or common stock as of the close of the period covered by the annual report. Outstanding as of December 31, 2002: 9,667,500,000 Ordinary shares of the nominal amount of 25p each. |
Indicate by check mark whether the registrants (1) have filed all reports required to be filed by Section 13 or 15(d) of the Securities Exchange Act of 1934 during the preceding 12 months (or for such shorter period that the registrants were required to file such reports), and (2) have been subject to such filing requirements for the past 90 days. Yesü No
Indicate by check mark which financial statement item the registrants have elected to follow.
Item 17ü
Item 18
Copies of notices and communications from the Securities and Exchange Commission should be sent to:
CRAVATH, SWAINE & MOORE LLP,
CityPoint, One Ropemaker Street, London EC2Y 9HR, England
Attn: William P. Rogers, Jr.
20-F/A (Amendment No. 2) 2002
Table of Contents
Explanatory Note
Introduction
This Amendment No. 2 (Amendment No. 2) to the Annual Report on Form 20-F for the year ended December 31, 2002, as filed with the U.S. Securities and Exchange Commission (the SEC) on March 3, 2003 and amended by Amendment No. 1 thereto, as filed with the SEC on July 2, 2004 (as so amended, the Original Form 20-F), amends portions of the Original Form 20-F to give effect to the Reserves Restatement (as defined below) and the Financial Restatement (as defined below) by the registrants (including the Financial Statements of the Royal Dutch/ Shell Group of Companies (the Group)) as described in further detail below. Except as otherwise stated in this Amendment No. 2, and except as set forth in the Financial Statements with respect to information presented therein, all information presented in this Amendment No. 2, including forward looking statements, is as at March 3, 2003 and has not been updated for events subsequent to the date of the original filing. Certain disclosures are expressly presented as of an earlier date in accordance with disclosure requirements applicable to Form 20-F.
This Amendment No. 2 amends and restates in their entirety Items 3, 4, 5, 6, 8, 11, 15, 17, 18 and 19 of the Original Form 20-F, and no other information included in the Original Form 20-F is amended hereby.
The Original Form 20-F includes a restatement of unaudited oil and gas reserves and the standardized measure of discounted future net cash flows as at December 31, 2002 and prior years (the First Reserves Restatement) and a restatement of the Financial Statements of the Group and each of the Parent Companies for the year ended December 31, 2002, and prior periods (the First Financial Restatement, and collectively, the First Restatement).
This Amendment No. 2 does not amend the registrants’ Annual Reports on Form 20-F filed with the SEC for the year ended December 31, 2001 or any prior period. In addition, the registrants have not amended any financial information furnished to the SEC under cover of Form 6-K for any period to reflect either the Reserves Restatement or the Financial Restatement. The Financial Statements and related financial information and unaudited oil and gas reserves information contained in such documents have been superseded by the information contained in this Amendment No. 2.
Reserves Restatement
On February 3, 2005, as a result of reservoir level reviews conducted during July 2004 through December 2004 of substantially all of the Group’s proved reserves volumes reported as at December 31, 2003, (collectively, the Second Half Review), the Group announced that it would remove from proved reserves a 1.37 billion barrels of oil equivalent (boe) of oil and gas that were reported as at December 31, 2003 (1.15 billion boe previously reported at December 31, 2002) and restate the unaudited oil and gas reserves disclosures contained in the supplementary information accompanying the Financial Statements contained in the Original Form 20-F (the Second Reserves Restatement and together with the First Reserves Restatement, the Reserves Restatement) to give effect to the removal of these volumes as of the earliest date on which they did not represent “proved reserves” within the applicable rules of the SEC (which in many cases is the date on which the volumes were initially booked as proved reserves). 43% of the volumes de-booked had been categorized as proved developed reserves and 57% had been categorised as proved undeveloped reserves. The Original Form 20-F gives effect to the First Restatement. This Amendment No. 2 includes information regarding proved oil and gas reserves that have been restated to give effect to the Second Reserves Restatement. Please refer to “Supplementary information — Oil and Gas (unaudited)” on pages G54 to G69 of this Amendment No. 2 for additional information regarding the Second Reserves Restatement.
Financial Restatement
In view of the inappropriate overstatement of unaudited proved reserves information resulting in the Second Reserves Restatement, it was determined to restate the Financial Statements of the Group and each of the Parent Companies for the year ended December 31 2003 and prior periods (the Second Financial Restatement and together with the First Financial Restatement, the Financial Restatement) to reflect the impact of the Second Reserves Restatement on those Financial Statements (as announced on February 3, 2005). This overstatement of unaudited proved reserves information had the effect of understating the depreciation, depletion and amortisation charges related to Exploration and Production in each of the years covered by the Second Financial Restatement. As capitalised costs relating to Exploration and Production were amortised across fewer proved reserves (following the Second Reserves Restatement), depreciation, depletion and amortisation associated with annual production volumes increased proportionally. The Second Financial Restatement reduced previously reported net assets as at December 31, 2002 by $168 million (2001: $102 million).
ii
20-F/A (Amendment No. 2) 2002
Table of Contents
The following table sets forth the adjustments made to reported results to eliminate the effect of the inappropriate overstatement of reserves as described above under Reserves Restatement:
| Net income Second Reserves Restatement effects | $ million | |||||||||||||||
| 2000 | 2001 | 2002 | ||||||||||||||
| Depreciation, depletion and amortisation | (112 | ) | (94 | ) | (118 | ) | ||||||||||
| Share of operating profit of associated companies | (2 | ) | (2 | ) | (6 | ) | ||||||||||
Income before taxation | (114 | ) | (96 | ) | (124 | ) | ||||||||||
Total tax | 54 | 44 | 54 | |||||||||||||
| Income after taxation | (60 | ) | (52 | ) | (70 | ) | ||||||||||
| Minority interest | 7 | 3 | 4 | |||||||||||||
| Net income | (53 | ) | (49 | ) | (66 | ) | ||||||||||
Refer to Notes 2(a) and 2(b) on pages G5 and G8 for additional disclosure on the Reserves Restatement.
General
This Amendment No. 2 includes restated Financial Statements as at December 31, 2002 and 2001 and for the years ended December 31, 2002, 2001 and 2000. Additional disclosure is contained in Notes 2(a) and 2(b) Restatement of previously issued Financial Statements, to the Group Financial Statements included herein regarding the nature of the restatement adjustments and shows the impact of restatement adjustments on fixed assets and inventories as at December 31, 2002 and 2001; the line items in which depreciation, depletion and amortisation expense relating to Exploration and Production is reflected; cost of sales; and operating profit and net income for each year in the three-year period ended December 31, 2002.
iii
20-F/A (Amendment No. 2) 2002
Table of Contents
Cross Reference Sheet for Annual Report on Form 20-F
| Headings* in this Amendment No. 2 which relate to: | ||||
| N.V. Koninklijke Nederlandsche | The “Shell” Transport and | |||
| Petroleum Maatsschappij | Trading Company, Public | |||
| Item number and captions | (Royal Dutch Petroleum Company) | Limited Company | ||
| 1 Identity of Directors, Senior Management and Advisers | Not applicable | Not applicable | ||
| 2 Offer Statistics and Expected Timetable | Not applicable | Not applicable | ||
| 3 Key Information | Selected Financial Data – Royal DutchDiscussion and Analysis of Financial Condition and Results of Operations – Group Group –Business and Property – risk factors | Selected Financial Data – Shell TransportDiscussion and Analysis of Financial Condition and Results of Operations – Group Group –Business and Property – risk factors | ||
| 4 Information on the Company | Introduction – Parent Companies, Group Discussion and Analysis of Financial Condition and Results of Operations – Group Group –Business and Property Supplementary information – Oil and Gas (unaudited) Introduction | Introduction – Parent Companies, Group Discussion and Analysis of Financial Condition and Results of Operations – Group Group –Business and Property Supplementary information – Oil and Gas (unaudited) Introduction | ||
| 5 Operating and Financial Review and Prospects | Discussion and Analysis of Financial Condition and Results of Operations – Royal Dutch, Group Group –Business and Property – business environment, description of activities, research | Discussion and Analysis of Financial Condition and Results of Operations – Shell Transport, Group Group –Business and Property – business environment, description of activities, research | ||
| 6 Directors, Senior Management and Employees | Royal Dutch – control of registrant, management, share ownership Note 11 to Royal DutchFinancial Statements Group –Business and Property – personnel | Shell Transport – control of registrant, management, share ownership Note 11 to Shell TransportFinancial Statements Group –Business and Property – personnel | ||
| 7 Major Shareholders and Related Party Transactions | Royal Dutch – control of registrant | Shell Transport – control of registrant | ||
| 8 Financial Information | Index to Financial Statements and Exhibits Financial Statements – Royal Dutch, Group Selected Financial Data – Royal Dutch Discussion and Analysis of Financial Condition and Results of Operations – Royal Dutch, Group | Index to Financial Statements and Exhibits Financial Statements – Shell Transport, Group Selected Financial Data – Shell Transport Discussion and Analysis of Financial Condition and Results of Operations – Shell Transport, Group | ||
| 9 The Offer and Listing | Royal Dutch – Nature of trading market | Shell Transport – Nature of trading market | ||
| 10 Additional Information | Royal Dutch – Articles of Association, exchange controls and other limitations affecting security holders, taxation Introduction – documents on display | Shell Transport – Memorandum and Articles of Association, exchange controls and other limitations affecting security holders, taxation Introduction – documents on display | ||
| 11 Quantitative and Qualitative Disclosures about Market Risk | Discussion and Analysis of Financial Condition and Results of Operations – Group – risk management and internal control, treasury and trading risks Supplementary information – Derivatives and other Financial Instruments and Derivative Commodity Instruments | Discussion and Analysis of Financial Condition and Results of Operations – Group – risk management and internal control, treasury and trading risks Supplementary information – Derivatives and other Financial Instruments and Derivative Commodity Instruments | ||
| 12 Description of Securities Other than Equity Securities | Not applicable | Not applicable | ||
| 13 Defaults, Dividend Arrearages and Delinquencies | None | None | ||
| 14 Material Modifications to the Rights of Security Holders and Use of Proceeds | None | None | ||
| 15 Controls and Procedures | Controls and Procedures | Controls and Procedures | ||
| 17 Financial Statements | Financial Statements – Royal Dutch, Group | Financial Statements – Shell Transport, Group | ||
| 18 Financial Statements | Not applicable | Not applicable | ||
| 19 Exhibits | Index to Financial Statements and Exhibits | Index to Financial Statements and Exhibits | ||
| * | Names of the registrants and references to the Royal Dutch/ Shell Group of Companies appearing in headings have been abbreviated to Royal Dutch, Shell Transport and Group, respectively. |
iv
20-F/A (Amendment No. 2) 2002
N.V. Koninklijke Nederlandsche Petroleum Maatschappij
(Royal Dutch Petroleum Company),
The “Shell” Transport and Trading Company, Public Limited Company
| List of contents | Page | |||||||
| vi | ||||||||
| 2 | ||||||||
| 3 | ||||||||
| 3 | ||||||||
| 4 | ||||||||
| 5 | ||||||||
| 6 | ||||||||
| 6 | ||||||||
| 7 | ||||||||
| 7 | ||||||||
| 20 | ||||||||
| 23 | ||||||||
| 29 | ||||||||
| 32 | ||||||||
| 33 | ||||||||
| 33 | ||||||||
| 34 | ||||||||
| 35 | ||||||||
| 35 | ||||||||
| 36 | ||||||||
| 37 | ||||||||
| 38 | ||||||||
| 66 | ||||||||
| 70 | ||||||||
| 70 | ||||||||
| 71 | ||||||||
| 74 | ||||||||
| 74 | ||||||||
| 75 | ||||||||
| 78 | ||||||||
| 79 | ||||||||
| 79 | ||||||||
| 80 | ||||||||
| 83 | ||||||||
| 83 | ||||||||
| 84 | ||||||||
| 88 | ||||||||
| 89 | ||||||||
| R2 | ||||||||
| S2 | ||||||||
| G2 | ||||||||
| G54 | ||||||||
| G70 | ||||||||
| E1 | ||||||||
| Exhibit 23.1 | ||||||||
| Exhibit 23.2 | ||||||||
| Exhibit 23.3 | ||||||||
| Exhibit 23.4 | ||||||||
| Exhibit 23.5 | ||||||||
| Exhibit 23.6 | ||||||||
| Exhibit 23.7 | ||||||||
| Exhibit 99.1 | ||||||||
| Exhibit 99.2 | ||||||||
| Exhibit 99.3 | ||||||||
| Exhibit 99.4 | ||||||||
| Exhibit 99.5 | ||||||||
| Exhibit 99.6 | ||||||||
v
20-F/A (Amendment No. 2) 2002
Table of Contents
Introduction
A THE PARENT COMPANIES
N.V. Koninklijke Nederlandsche Petroleum Maatschappij (Royal Dutch Petroleum Company, hereinafter referred to as “Royal Dutch”) was incorporated on June 16, 1890, under the laws of the Netherlands.
The “ Shell ” Transport and Trading Company, Public Limited Company (hereinafter referred to as “Shell Transport”) was incorporated on October 18, 1897, under the laws of England.
Royal Dutch and Shell Transport do not engage in operational activities. They derive the whole of their respective incomes – except for interest income on cash balances or short-term investments – from their respective interests in the companies known collectively as the Royal Dutch/ Shell Group of Companies.
On October 28, 2004, the Royal Dutch and Shell Transport Boards announced that they had unanimously agreed to propose to their shareholders a transaction through which each Parent Company will become a subsidiary of Royal Dutch Shell plc, which will become a publicly-listed company incorporated in England and Wales and headquartered and tax resident in the Netherlands. Please refer to “Discussion and Analysis of Financial Condition and Results of Operations — Recent Developments” for additional information on this transaction.
vi
20-F/A (Amendment No. 2) 2002
Table of Contents
Introduction 1
20-F/A (Amendment No. 2) 2002
Table of Contents
B ROYAL DUTCH/ SHELL GROUP OF COMPANIES
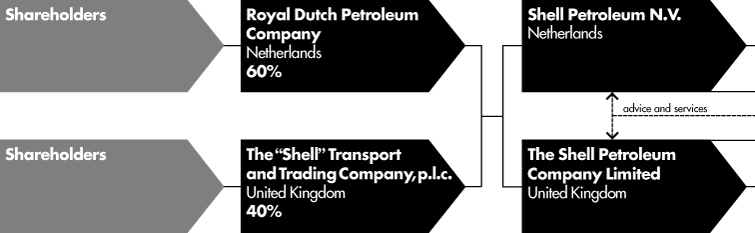
The numerous companies in which Royal Dutch and Shell Transport own investments are collectively referred to as the Royal Dutch/ Shell Group of Companies. Royal Dutch and Shell Transport are the Parent Companies of the Group but are not themselves part of it. The Royal Dutch/ Shell Group of Companies has grown out of an alliance made in 1907 between Royal Dutch and Shell Transport, by which the two companies agreed to merge their interests on a 60:40 basis while remaining separate and distinct entities. Arrangements between Royal Dutch and Shell Transport provide,inter alia, that, notwithstanding variations in shareholdings, Royal Dutch and Shell Transport shall share in the aggregate net assets and in the aggregate dividends and interest received from Group companies in the proportion of 60:40. It is further arranged that the burden of all taxes in the nature of or corresponding to an income tax leviable in respect of such dividends and interests shall fall in the same proportion.
The illustration on the previous page shows the relationship between the Parent Companies and the Royal Dutch/ Shell Group of Companies.
Group Holding Companies
There are two Group Holding Companies: Shell Petroleum N.V. in the Netherlands and The Shell Petroleum Company Limited in the UK. The Group Holding Companies between them hold all the shares in the Service Companies and, directly or indirectly, all Group interests in the Operating Companies. Some of these interests, including all the shares in the US-based Shell Oil Company (hereinafter referred to as “Shell Oil”, which expression shall include its subsidiaries), are held by Shell Petroleum Inc., a Delaware Corporation. Shell Petroleum N.V. holds equity shares in Shell Petroleum Inc. that entitle it to the dividend flow from that company, but direct controlling interest in Shell Petroleum Inc. is jointly held by Royal Dutch and Shell Transport.
Royal Dutch is entitled to have its nominees elected as a majority of, and Shell Transport is entitled to have its nominees elected as the balance of, the members of the Boards of Directors of the two Group Holding Companies. Every member of the Board of Management of Royal Dutch and every Managing Director of Shell Transport is also a member of the Presidium of the Board of Directors of Shell Petroleum N.V. and a Managing Director of The Shell Petroleum Company Limited. As such, they are generally known as “Group Managing Directors”. They are also appointed by the Boards of Shell Petroleum N.V. and The Shell Petroleum Company Limited to a joint committee known as the Committee of Managing Directors, which considers and develops objectives and long-term plans.
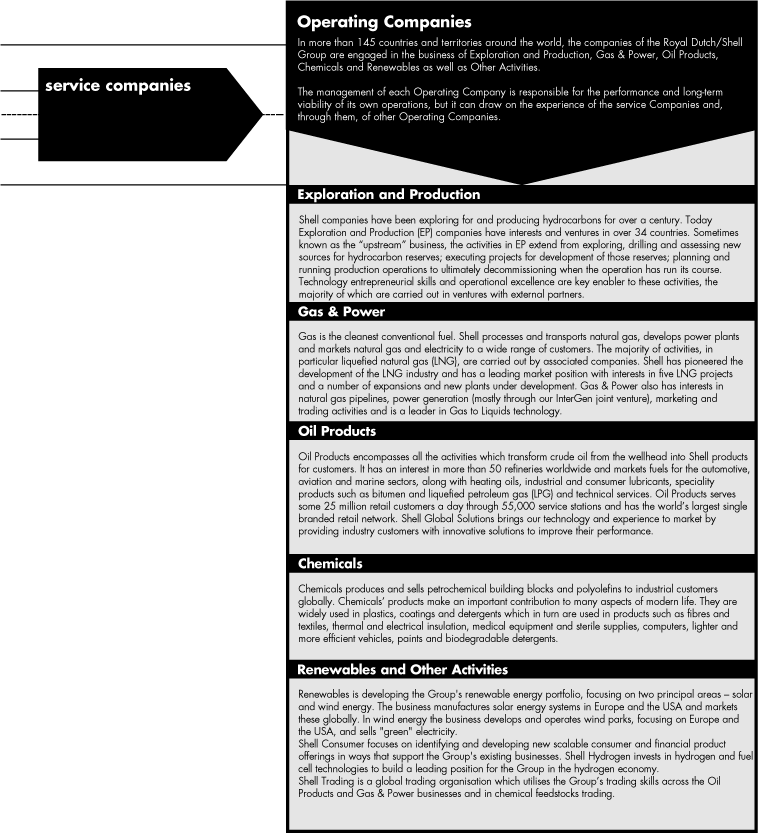
Service Companies
The main business of the Service Companies is to provide advice and services to other Shell companies.
Operating Companies
Present in more than 145 countries and territories around the world, the companies of the Royal Dutch/ Shell Group are engaged in the business of Exploration and Production, Gas & Power, Oil Products, Chemicals and Renewables as well as Other Activities.
Exploration and Production: Searches for, finds and produces crude oil and natural gas. Builds and operates the infrastructure needed to deliver hydrocarbons to market.
Gas & Power: Liquefies and transports natural gas, develops gas markets and infrastructure, develops gas-fired power plants and engages in the marketing and trading of natural gas and electricity. Converts natural gas to liquids to provide clean fuels.
Oil Products: Markets transportation fuels, lubricants and speciality products. Refines, supplies, trades and ships crude oil and petroleum products. Provides technical consultancy services.
Chemicals: Produces and sells petrochemical building blocks and polyolefins globally.
Renewables: Generates “green” electricity and provides renewable energy solutions. Develops and operates wind parks; manufactures and markets solar systems.
Other Activities include Shell Consumer and Shell Hydrogen.
The management of each Operating Company is responsible for the performance and long-term viability of its own operations, but it can draw on the experience of the Service Companies and, through them, of other Operating Companies.
The information contained on the list of significant Group companies, including the jurisdiction of incorporation and the Parent Companies’ proportion of ownership, filed as Exhibit 8 to the Original Form 20-F, is incorporated herein by reference.
2 Introduction
20-F/A (Amendment No. 2) 2002
Table of Contents
C PRESENTATION OF INFORMATION
The information in this Amendment No. 2 relating to Royal Dutch has been provided by Royal Dutch and that relating to Shell Transport has been provided by Shell Transport.
The information given in this Amendment No. 2 for the Royal Dutch/ Shell Group of Companies reflects the operational and financial results of Group companies throughout the world. The financial information given is an aggregation of the accounts of all Group companies (except where otherwise indicated) expressed in US dollars.
The companies in which Royal Dutch and Shell Transport directly or indirectly own investments are separate and distinct entities, but in this Amendment No. 2 the collective expressions “Shell” and “Group” are sometimes used for convenience in contexts where reference is made to the companies of the Royal Dutch/ Shell Group in general. Likewise the words “we”, “us” and “our” are sometimes used in some places to refer to companies of the Royal Dutch/ Shell Group in general, and in others to those who work in those companies. These expressions are also used where no useful purpose is served by identifying the particular company or companies. The expression “Group companies” as used in this Amendment No. 2 refers to companies in which Royal Dutch and Shell Transport either directly or indirectly have control, by having either a majority of the voting rights or the right to exercise a controlling influence. The companies in which Group companies have significant influence but not control are referred to as “associated companies”.
The expression “Operating Companies” as used in this Amendment No. 2 refers to those Group and associated companies which are engaged in various branches of the businesses of oil, natural gas, chemicals, power generation and renewable energy as well as in other businesses. The term “Group interest” is used for convenience to indicate the direct or indirect equity interest held by the Group Holding Companies in a venture or partnership or company (i.e., after exclusion of all third-party interests).
The figures shown in most of the tables in this Amendment No. 2 represent those in respect of Group companies only, without deduction of minority interests. However, where figures are given specifically for oil production (net of royalties in kind), natural gas production available for sale, and both the refinery processing intake and total oil product sales volumes of Equilon and the Motiva joint venture (following the Group’s additional share purchases in 2002, Equilon is no longer a joint venture), the term “Group share” is used for convenience to indicate not only the volumes to which Group companies are entitled (without deduction in respect of minority interests in Group companies) but also the portion of the volumes of associated companies to which Group companies are entitled or which is proportionate to the Group interest in those companies.
Certain information in this Amendment No. 2 identified “as restated” was restated as part of the First Reserves Restatement and the First Financial Restatement and not the Second Reserves Restatement and the Second Financial Restatement, as more fully described under “Discussion and Analysis of Financial Condition and Results of Operations — Recent Developments”.
Except as otherwise specified or as contained in the Financial Statements, all financial information contained in this Amendment No. 2 is presented in accordance with accounting principles generally accepted in the United States.
The discussion and analysis in this Amendment No. 2 contains forward-looking statements that are subject to risk factors associated with the oil, gas, chemicals, power generation and renewable resources businesses. It is believed that the expectations reflected in these statements are reasonable, but they may be affected by a variety of variables which could cause actual results or trends to differ materially, including, but not limited to: price fluctuations, actual demand, currency fluctuations, drilling and production results, reserve estimates, loss of market, industry competition, environmental risks, physical risks, the risks of doing business in developing countries, legislative, fiscal and regulatory developments, potential litigation and regulatory effects arising from recategorisation of reserves, economic and financial market conditions in various countries and regions, political risks, project delay or advancement, approvals and cost estimates.
D DOCUMENTS ON DISPLAY
Documents concerning Royal Dutch, Shell Transport or the Royal Dutch/ Shell Group of Companies referred to in this Amendment No. 2 that have been filed with the SEC may be examined and copied at the public reference facility maintained by the SEC at 450 Fifth Street, N.W., Room 1300, Washington, D.C. 20549. You may also obtain copies of these materials by mail. For further information on the operation of the public reference room and the copy charges, please call the SEC at (800) SEC–0330. All of the SEC filings made electronically by Royal Dutch and Shell Transport are available to the public at the SEC website at www.sec.gov.
Introduction 3
20-F/A (Amendment No. 2) 2002
Table of Contents
Royal Dutch/ Shell Group of Companies –
Business and Property
A ACTIVITIES AND MAJOR INTERESTS
The companies of the Royal Dutch/ Shell Group are engaged worldwide in all the principal aspects of the oil and natural gas industry. They also have interests in chemicals and additional interests in power generation, renewable energy (chiefly in wind and solar energy), and other businesses.
Oil and gas, by far the largest of the Group companies’ business activities, accounted for over 90% of net proceeds in 2002. In fact, Group and associated companies constitute one of the largest oil and gas enterprises in the world. They market their oil products in more countries than any other oil company, and have a strong position not only in the major industrialised countries but also in the developing ones. The distinctive Shell pecten (a trademark in use since the early part of the twentieth century) and trademarks in which the word “Shell” appears, support this marketing effort throughout the world. Taken together, Group and associated companies also rank among the world’s major chemical companies; in 2002 chemicals accounted for around 8% of the net proceeds of Group companies. The Group’s interests in power generation and renewable energy are considerably smaller. Nevertheless, the Group’s Renewables business is now one of the largest global solar enterprises following the acquisition of the Siemens solar business early in 2002. Renewables also has plans to become a leading player in the wind energy sector. The Group’s various activities are conducted – to one extent or another – in more than 145 countries and territories.
The breakdown of net proceeds of Group companies by industry segment and by geographical region for the years 2000 to 2002 is set out in the following tables:
| Net Proceeds by Industry Segment (as restated) | ||||||||||||
| (including inter-segment sales) | $ million | |||||||||||
| 2002 | 2001 | 2000 | ||||||||||
Exploration and Production | ||||||||||||
| Third parties | 11,901 | 12,057 | 13,375 | |||||||||
| Inter-segment | 14,680 | 13,790 | 14,195 | |||||||||
| 26,581 | 25,847 | 27,570 | ||||||||||
Gas & Power | ||||||||||||
| Third parties | 16,992 | 15,721 | 15,991 | |||||||||
| Inter-segment | 620 | 705 | 496 | |||||||||
| 17,612 | 16,426 | 16,487 | ||||||||||
Oil Products | ||||||||||||
| Third parties | 135,544 | 93,517 | 104,002 | |||||||||
| Inter-segment | 3,080 | 2,108 | 2,280 | |||||||||
| 138,624 | 95,625 | 106,282 | ||||||||||
Chemicals | ||||||||||||
| Third parties | 14,125 | 13,260 | 15,205 | |||||||||
| Inter-segment | 1,082 | 990 | 1,102 | |||||||||
| 15,207 | 14,250 | 16,307 | ||||||||||
Corporate and other | ||||||||||||
| Third parties | 753 | 576 | 480 | |||||||||
| Inter-segment | 17 | 2 | – | |||||||||
| 770 | 578 | 480 | ||||||||||
| 198,794 | 152,726 | 167,126 | ||||||||||
| Net Proceeds by Geographical Area (as restated) | ||||||||||||
| (excluding inter-segment sales) | $ million | |||||||||||
| 2002 | 2001 | 2000 | ||||||||||
| Europe | 65,073 | 62,259 | 68,060 | |||||||||
| Other Eastern Hemisphere | 33,322 | 31,866 | 34,144 | |||||||||
| USA | 62,632 | 21,095 | 26,089 | |||||||||
| Other Western Hemisphere | 18,288 | 19,911 | 20,760 | |||||||||
| 179,315 | 135,131 | 149,053 | ||||||||||
The Group Financial Statements have been restated. See Notes 2(a) and 2(b) to the Group Financial
Statements.
4 Royal Dutch/Shell Group of Companies – Business and Property
20-F/A (Amendment No. 2) 2002
Table of Contents
B BUSINESS ENVIRONMENT
In 2002, Brent crude prices averaged $25.05 a barrel compared with $24.45 a barrel in 2001. Crude oil prices recovered steadily in the first three quarters of 2002 from below $20 to in excess of $30 a barrel amid production restraints by key producing countries. Prices subsequently weakened as major oil producers increased output significantly to meet higher seasonal demand in the fourth quarter, falling close to $24 a barrel by late November. In December prices rebounded when supply from Venezuela was disrupted and had risen to just above $30 a barrel by year-end.
From 1983 through 2002 the Brent crude oil price has averaged around $20 a barrel, from 1998 through 2002 averaged approximately $22 a barrel and from 2000 through 2002 the price averaged almost $26 a barrel.
The Group uses a range of prices for crude oil to test opportunities on the downside and look at the upside of potential projects. This method is applied to understand the composition of projects in the portfolio and how these respond over a broad range of prices or margins. The crude oil price outlook for 2003 is uncertain and impacted by developments in the Middle East and Venezuela. The Group evaluates investments using multiple price conditions, including price conditions of less than $20 a barrel to assess the resilience of investments at low-price conditions.
Crude oil reference price conditions are determined after careful assessment of short, medium and long-term drivers of oil and gas prices under different sets of assumptions, yielding a range of prices to be used in evaluation. With regard to 2002, crude oil prices were higher than the conservative expectations of our reference price conditions but within the bounds of our sensitivity analyses. Historical analysis, trends and statistical volatility are part of this assessment, as well as analysis of global and regional economic conditions, geopolitics, OPEC actions, supply and demand. Sensitivity analyses are used to test the impact of low price drivers (economic weakness, rapid resumption of Iraqi production, greater than expected increase in non-OPEC production) and high price drivers (greater than expected economic growth, slower than expected resumption of Iraqi production). Short-term events (such as relatively warm winters or cool summers and the resulting effects on demand and inventory levels) contribute to volatility.
Oil demand growth was exceptionally weak in 2002 at just under 0.2 million barrels/day due to a slow economic recovery in the USA and a first quarter mild winter, and fell well below the average annual increase of 1.0 million barrels/day for the past ten years. Demand growth for 2003 is expected to move closer to this ten-year average, but there are more uncertainties than usual given continued weakness of equity markets, risk of further terrorist actions, impact of high oil prices due to supply disruptions from Venezuela and Iraq and a tight OPEC supply policy.
The drivers of natural gas prices are more regionalized than the relatively global nature of crude oil pricing. Whilst Henry Hub prices are recognised price benchmarks in North America, the Group also produces natural gas in other areas that have significantly different supply, demand and regulatory circumstances.
For the full year 2002, Henry Hub gas prices averaged $3.33 per million British Thermal Units (Btu) compared to $4.10 per million Btu in 2001 (when gas prices spiked to around $10 in the 2000/2001 winter). Prices strengthened towards the end of 2002. In the fourth quarter of 2002, Henry Hub gas prices averaged $4.27 per million Btu, with prices over $1 higher than in the third quarter of 2002 and almost $2 more than a year ago. Higher prices were driven by a rundown in levels of gas in storage below prior year levels. Concerns about production declines onshore USA and Western Canada also contributed to higher prices. In contrast, a year ago, storage was reaching record levels. Henry Hub prices for 2003 are expected to firm.
Natural gas prices in Continental Europe and Asia are predominantly indexed to oil prices. In 2002, Japan industry wide LNG (cif) prices averaged $4.27 per million Btu versus $4.64 per million Btu in 2001. Shell LNG is primarily sold through associated companies, with prices closely related to industry averages. Realised Shell gas prices in Europe averaged $2.70 per million Btu in 2002 versus $2.78 per million Btu in 2001.
Excess supply conditions that exist in certain parts of the world cannot easily serve to mitigate high-price conditions in the United States or other markets because of lack of infrastructure and difficulties in transporting natural gas. The Group is planning to increase investment in long-term projects in areas of excess supply to install needed infrastructure to produce and liquefy natural gas for transport by tanker and regasification in markets where demand is strong. Consistent with other Group investments, projects of this type are evaluated using multiple oil price conditions, including price conditions of less than $20 a barrel to assess the resilience of investments at low price conditions.
A weak global economy reduced demand for oil products, together with rising oil prices, put pressure on refining and marketing margins. Industry refining margins were at their lowest level for a decade throughout most of the year, and gross fuel marketing margins declined in all regions. Refining margins recovered temporarily in October and November when the seasonal product demand increase coincided with falling crude oil prices.
Royal Dutch/Shell Group of Companies – Business and Property 5
20-F/A (Amendment No. 2) 2002
Table of Contents
Refining margins are expected to recover in 2003 modestly from the low levels in 2002 with improved product demand but much will depend on crude oil supply availability, the severity of the northern hemisphere winter and the pace of global economic recovery, particularly in the USA. Refining margin levels in Asia Pacific are likely to continue to be depressed by surplus refinery capacity in the region. Marketing margins will remain subject to competitive pressures in individual markets and to the direction of crude oil price and exchange rate movements.
Chemicals saw some signs of improvement in the business environment but it was still a very challenging year due to difficult trading conditions, particularly in the USA. Industry utilisation remained flat in Europe but improved in the USA from historically low levels in 2001. Cracker margins in both regions were down from 2001.
C GENERAL DEVELOPMENT OF THE BUSINESS
Total capital investment in 2002 amounted to $24.6 billion, including acquisitions. Four important acquisitions were completed in 2002; Enterprise Oil (Enterprise) in the UK, DEA Oil (DEA) in Germany, and in the USA Pennzoil-Quaker State and Texaco’s interests in Equilon and Motiva. Excluding major acquisitions, capital investment totalled $14.2 billion.
The total five year (1998-2002) reserves replacement ratio is 68% (70% for oil, including natural gas liquids, and 65% for gas). These replacement ratios reflect a restatement of the information contained under the same heading in the Original Form 20-F.
Group and associated companies’ natural gas production available for sale through the end of 2002 has increased by 10% since 2000. Investment continues in the expansion of existing operations and in major new pipelines. Moreover, additional liquefied natural gas (LNG) projects and Gas to Liquids plants are being considered in several countries. Gas is the environmentally preferred fuel for power generation and demand for both gas and electricity is expected to grow.
Group companies continue to pursue a policy of a diversified supply base, and they trade actively in crude oil and its refined products throughout the world. Major acquisitions in the USA, the world’s largest market and in Germany, Europe’s largest market, have strengthened Oil Products’ competitive position and enhanced the quality of the global portfolio. This has reinforced the objective of Oil Products of leading the global downstream industry. Furthermore, the Group will continue to address environmental concerns through tighter product specifications. Above all, Group companies will maintain their emphasis on innovative customer offers, portfolio optimisation and structural cost reduction. Both refining and marketing operations have maintained efforts to improve their health, safety and environmental performance.
After a period when the focus has been on divestment, attention in the Chemicals business in 2002 turned to strengthening and enhancing the portfolio. A single marketing and supply company for Europe was established in order to improve speed and efficiency for customers and suppliers. The final investment decision to proceed with construction of the $4.3 billion Nanhai petrochemicals complex in southern China was taken during 2002. The completion during 2002 of a new olefins and alcohols unit at the Geismar plant in Louisiana consolidated the Group’s position as a major player in these products. Further strengthening of the portfolio was achieved through the completion during 2002 of a styrene monomer/ propylene oxide business unit in Singapore, and a benzene plant at Moerdijk, the Netherlands.
In 2002, Renewables became one of the largest global solar photovotaic (pv) participants by acquiring the balance of shares in its solar joint venture with Siemens and E.On, and continued its growth in the wind energy sector with the development of two wind parks in California, Whitewater Hill and Cabazon Pass.
All the business activities described in this section are supported by research. The finding of oil and gas, the enhancement of recovery from existing fields and the engineering of offshore structures, are subjects that receive particular attention, as do the products and processes of oil refining, gas processing and chemicals manufacturing.
D RISK FACTORS
The Group and its businesses are subject to various risks relating to changing competitive, economic, political, legal, social, industry, business and financial conditions. These conditions are described below and discussed in greater detail elsewhere in this Amendment No. 2.
Price fluctuations
Oil, natural gas and chemical prices can vary as a result of changes in supply and demand for products, which may be global or limited to specific regions and influenced by factors such as economic conditions, weather conditions or action taken by major oil exporting countries.
6 Royal Dutch/Shell Group of Companies – Business and Property
20-F/A (Amendment No. 2) 2002
Table of Contents
Currency fluctuations
The Group is present in more than 145 countries and territories throughout the world and is subject to risks from changes in currency values and exchange controls.
Drilling and production results
The Group’s future oil and gas production is significantly dependent on successful drilling and well development. There are risks in this process in interpretation of geological and engineering data, project delay, cost overruns and technical, fiscal and other conditions.
Reserve estimates
Restated unaudited information on oil and gas reserves is set forth on pages G54 to G69. Oil and gas reserves cannot be measured exactly since estimation of reserves involves subjective judgement and determinations based on available technical and economic information. These judgements may change based on new information or changes in economic conditions. Accordingly, oil and gas reserves are subject to revisions, which may have an adverse impact on the Group.
Loss of market
Group companies are subject to differing economic and financial market conditions in countries and regions throughout the world. There are risks to such markets from political or economic instability, as well as from industry competition.
Environmental risks
Group companies are subject to a number of different environmental laws, regulations and reporting requirements. Costs are incurred for prevention, control, abatement or elimination of releases into the air and water, as well as in the disposal and handling of wastes at operating facilities. Expenditures of a capital nature include both remedial measures on existing plants and integral features of new plants.
Physical risks
The Group’s assets are subject to risk from operational hazards, natural disasters and expropriation of property.
Legislative, fiscal and regulatory developments
The Group’s operations are subject to risk of change in legislation, taxation and regulation. For exploration and production activities, these matters include land tenure, entitlement to produced hydrocarbons, production rates, royalties, pricing, environmental protection, social impact, exports, taxes and foreign exchange.
Risks of doing business in politically sensitive or unstable countries
The Group’s operations and earnings throughout the world have been, and may in the future be, affected from time to time in varying degree by other political developments and laws and regulations, such as forced divestiture of assets; restrictions on production, imports and exports; war or other international conflicts; civil unrest and local security concerns that threaten the safe operation of company facilities; price controls; tax increases and other retroactive tax claims; expropriation of property; cancellation of contract rights; and environmental regulations. Both the likelihood of such occurrences and their overall effect upon the Group vary greatly from country to country and are not predictable.
Global political developments
Political developments, including war, embargoes and political strife in oil producing regions can affect world oil supply and prices.
E DESCRIPTION OF ACTIVITIES
1 Exploration and Production
Unless otherwise noted, the information contained in this section is as at or for the year ended December 31, 2002, as applicable.
(a) General
Group and associated companies involved in the exploration for and production of crude oil and natural gas operate under a broad range of legislation and regulations that change over time. These laws and rules cover virtually all aspects of exploration and production activities, including matters such as land tenure, entitlement to produced hydrocarbons, production rates, royalties, pricing, environmental protection, social impact, exports, taxes and foreign exchange. The conditions of the leases, licences and contracts under which oil and gas interests are held vary from country to country. In almost all cases, the legal agreements
Royal Dutch/Shell Group of Companies – Business and Property 7
20-F/A (Amendment No. 2) 2002
Table of Contents
generally have in common that they are granted by or entered into with a government, government entity or state oil company, and that the exploration risk practically always rests with the oil company. Of these agreements, the following are most relevant to Group interests:
| • | Licences (or concessions) which entitle the holder to explore for hydrocarbons and exploit any commercial discoveries. Under a licence, the holder bears the risk of exploration, development and production activities and of financing these activities. In principle, the licence holder is entitled to the totality of production minus any royalties in kind. The state or state oil company may sometimes enter as a joint-venture partner sharing the rights and obligations of the licence but usually without sharing the exploration risk. In a few cases the state oil company or agency has an option to purchase a certain share of production. |
| • | Production sharing contracts entered into with a state or state oil company obligate the oil company, as contractor, to provide all the financing and bear the risk of exploration, development and production activities in exchange for a share of the production. Usually this share consists of a fixed or variable part, which is reserved for the recovery of contractor’s cost (cost oil); the remainder is split with the state or state oil company on a fixed or volume/ revenue-dependent basis. In some cases the state oil company will participate in the rights and obligations of the contractor and will share in the costs of development and production. Such participation can be across the venture or be on a per-field basis. |
Group companies’ exploration and production interests, including acreage holdings and statistics on wells drilled and drilling, are shown on pages 14 to 15.
Details of Group companies’ and the Group share of associated companies’ estimated net proved reserves are summarised in the following table and are set out in the restated unaudited supplementary oil and gas information on pages G54 to G69. Particular reference is made to the statement: Oil and gas reserves cannot be measured exactly since estimation of reserves involves subjective judgement. Estimates remain subject to revision. It should be noted that totals are further influenced by acquisition and divestment activities. Proved reserves are shown net of any quantities of crude oil or natural gas that are expected to be taken by others as royalties in kind but do not exclude certain quantities related to royalties expected to be paid in cash (except in North America and in other situations in which the royalty quantities are owned by others) or those related to fixed margin contracts. Proved reserves also include certain quantities of crude oil or natural gas which will be produced under arrangements which involve Group companies in upstream risks and rewards but which do not transfer title of the product to those Group companies.
For information regarding the Reserves Restatement please refer to “Supplementary information – Oil and Gas (unaudited)”.
As described in the Explanatory Note at ii, the Group has restated its proved reserves.
Proved Developed and Undeveloped Reserves (as restated)a
| (at December 31) | million barrels | |||||||||||
| 2002 | 2001 | 2000 | ||||||||||
Crude oil and natural gas liquids | ||||||||||||
| Group companies | 5,782 | 5,600 | 5,563 | |||||||||
| Group share of associated companies | 858 | 664 | 842 | |||||||||
| 6,640 | 6,264 | 6,405 | ||||||||||
| thousand million standard cubic feet | ||||||||||||
Natural gas | ||||||||||||
| Group companies | 37,757 | 40,530 | 39,890 | |||||||||
| Group share of associated companies | 3,308 | 3,006 | 3,414 | |||||||||
| 41,065 | 43,536 | 43,304 | ||||||||||
| a | Excludes oil sands. |
Capital Expenditure and Exploration Expense
by Geographical Areaa (as restated)
| (oil and gas exploration and production only) | $ million | |||||||||||
| 2002 | 2001 | 2000 | ||||||||||
| Europe | 7,519 | 1,236 | 1,024 | |||||||||
Africab | 1,674 | 1,235 | 749 | |||||||||
Asia Pacificc | 537 | 1,506 | 404 | |||||||||
Middle East, Russia, CISd | 785 | 473 | 398 | |||||||||
| USA | 2,015 | 2,009 | 1,217 | |||||||||
| Other Western Hemisphere | 600 | 426 | 355 | |||||||||
| 13,130 | 6,885 | 4,147 | ||||||||||
8 Royal Dutch/Shell Group of Companies – Business and Property
20-F/A (Amendment No. 2) 2002
Table of Contents
| a | Capital expenditure Capital expenditure is the cost of acquiring property, plant and equipment, and – following the successful efforts method in accounting for exploration costs – includes exploration drilling costs capitalised pending determination of commercial reserves. In the case of material capital projects, the related interest cost is included until these are substantially complete. The amounts above exclude capital expenditure relating to the Athabasca Oil Sands Project. In addition, the amount shown above includes acquisitions and the costs of acquiring Enterprise Oil in 2002 of $5.3 billion has been included within the amount shown for Europe. |
| Exploration expense is the cost of geological and geophysical surveys and of other exploratory work charged to income as incurred, and exploratory drilling costs which were initially taken up in capital expenditure pending determination of commercial reserves but where the efforts are subsequently determined to be unsuccessful and then charged to income (with a corresponding reduction in capital expenditure). Exploration expense excludes depreciation and release of currency translation differences. |
| b | Excludes Egypt. |
| c | Excludes Sakhalin. |
| d | Middle East and Former Soviet Union/Commonwealth of Independent States. Includes Caspian region, Egypt and Sakhalin. |
Average Production Costs of Group Companies by Geographical Area (as restated)
| $/barrel of oil equivalent | ||||||||||||
| 2002 | 2001 | 2000 | ||||||||||
| Europe | 2.94 | 2.35 | 2.42 | |||||||||
Africaa | 2.75 | 2.54 | 2.44 | |||||||||
Asia Pacificb | 2.31 | 1.92 | 1.77 | |||||||||
Middle East, Russia, CISc | 2.64 | 2.38 | 2.56 | |||||||||
| USA | 2.61 | 2.38 | 2.10 | |||||||||
| Other Western Hemisphere | 4.52 | 3.79 | 4.61 | |||||||||
| Total Group | 2.81 | 2.41 | 2.45 | |||||||||
| a | Excludes Egypt. |
| b | Excludes Sakhalin. |
| c | Middle East and Former Soviet Union/Commonwealth of Independent States. Includes Caspian region, Egypt and Sakhalin. |
Royal Dutch/Shell Group of Companies – Business and Property 9
20-F/A (Amendment No. 2) 2002
Table of Contents
Crude oil and natural gas liquids productiona (as restated)
thousand barrels daily
| 2002b | 2001 | 2000 | 1999 | 1998 | |||||||||||||||||
Europe | |||||||||||||||||||||
| UK | 402 | 311 | 378 | 402 | 373 | ||||||||||||||||
| Denmark | 140 | 130 | 129 | 118 | 109 | ||||||||||||||||
| Norway | 131 | 89 | 87 | 83 | 87 | ||||||||||||||||
| Netherlands | 9 | 10 | 13 | 13 | 14 | ||||||||||||||||
| Germany | 5 | 6 | 6 | 6 | 7 | ||||||||||||||||
| Others | 9 | 1 | * | * | * | ||||||||||||||||
| 696 | 547 | 613 | 622 | 590 | |||||||||||||||||
Other Eastern Hemisphere | |||||||||||||||||||||
Africa | |||||||||||||||||||||
| Nigeria | 215 | 250 | 239 | 212 | 232 | ||||||||||||||||
| Gabon | 46 | 56 | 69 | 89 | 110 | ||||||||||||||||
| Cameroon | 17 | 19 | 21 | 22 | 25 | ||||||||||||||||
| Others | 2 | 3 | 3 | 3 | 3 | ||||||||||||||||
| 280 | 328 | 332 | 326 | 370 | |||||||||||||||||
Asia Pacific | |||||||||||||||||||||
| Australia | 92 | 99 | 111 | 47 | 54 | ||||||||||||||||
| Brunei | 101 | 97 | 95 | 86 | 74 | ||||||||||||||||
| Malaysia | 59 | 60 | 56 | 66 | 76 | ||||||||||||||||
| China | 24 | 23 | 25 | 20 | 27 | ||||||||||||||||
| Thailand | 15 | 16 | 18 | 18 | 18 | ||||||||||||||||
| New Zealand | 29 | 30 | 9 | 10 | 12 | ||||||||||||||||
| Others | 5 | – | – | – | – | ||||||||||||||||
| 325 | 325 | 314 | 247 | 261 | |||||||||||||||||
Middle East, Russia, CIS | |||||||||||||||||||||
Omanc | 319 | 327 | 326 | 299 | 284 | ||||||||||||||||
| Abu Dhabi | 100 | 94 | 96 | 82 | 90 | ||||||||||||||||
| Syria | 49 | 48 | 50 | 71 | 88 | ||||||||||||||||
| Yemen | – | – | – | – | 14 | ||||||||||||||||
Egyptd | 11 | 14 | 10 | 7 | 7 | ||||||||||||||||
| Others | 46 | 23 | 9 | 1 | – | ||||||||||||||||
| 525 | 506 | 491 | 460 | 483 | |||||||||||||||||
Total Other Eastern Hemisphere | 1,130 | 1,159 | 1,137 | 1,033 | 1,114 | ||||||||||||||||
USA | 442 | 411 | 417 | 504 | 521 | ||||||||||||||||
Other Western Hemisphere | |||||||||||||||||||||
| Canada | 43 | 47 | 46 | 48 | 68 | ||||||||||||||||
| Colombia | – | – | – | – | 18 | ||||||||||||||||
| Others | 48 | 47 | 49 | 48 | 43 | ||||||||||||||||
| 91 | 94 | 95 | 96 | 129 | |||||||||||||||||
Total | 2,359 | 2,211 | 2,262 | 2,255 | 2,354 | ||||||||||||||||
| * | Less than one thousand barrels daily |
| million tonnes a year | ||||||||||||||||||||
Metric equivalent | 118 | 111 | 113 | 113 | 118 | |||||||||||||||
| a | Of Group companies, plus Group share of associated companies, and including natural gas liquids (Group share of associated companies is assumed to be equivalent to Group interest). Royalty purchases are excluded. In those countries where production-sharing contracts operate, the figures shown represent the entitlements of the Group companies concerned under those contracts. |
| b | The acquisition of Enterprise contributed some 180 thousand barrels of oil equivalent per day to 2002 total hydrocarbon production (9 months of production averaged over the full year). Production came mainly from assets in the UK and Norway. |
| c | Exceptionally, the minority interest is deducted in respect of production volumes given for Petroleum Development Oman. |
| d | Egypt was previously included in Africa. |
10 Royal Dutch/Shell Group of Companies – Business and Property
20-F/A (Amendment No. 2) 2002
Table of Contents
| Natural gas production available for salea (as restated) |
| million standard cubic feet daily | ||||||||||||||||||||
| 2002b | 2001 | 2000 | 1999 | 1998 | ||||||||||||||||
Europe | ||||||||||||||||||||
| Netherlands | 1,527 | 1,555 | 1,431 | 1,520 | 1,616 | |||||||||||||||
| UK | 1,148 | 1,196 | 1,118 | 967 | 824 | |||||||||||||||
| Germany | 408 | 428 | 450 | 484 | 489 | |||||||||||||||
| Denmark | 313 | 309 | 300 | 312 | 310 | |||||||||||||||
| Norway | 242 | 176 | 199 | 230 | 202 | |||||||||||||||
| Others | 29 | 20 | 17 | 16 | 14 | |||||||||||||||
| 3,667 | 3,684 | 3,515 | 3,529 | 3,455 | ||||||||||||||||
Other Eastern Hemisphere | ||||||||||||||||||||
Africa | ||||||||||||||||||||
| Nigeria | 244 | 219 | 177 | 78 | 84 | |||||||||||||||
| 244 | 219 | 177 | 78 | 84 | ||||||||||||||||
Middle East | ||||||||||||||||||||
| Oman | 786 | 553 | 459 | 119 | – | |||||||||||||||
| Egypt | 232 | 248 | 140 | 105 | 103 | |||||||||||||||
| Syria | 16 | 18 | 23 | 27 | 47 | |||||||||||||||
| 1,034 | 819 | 622 | 251 | 150 | ||||||||||||||||
Asia Pacific | ||||||||||||||||||||
| Malaysia | 664 | 580 | 553 | 634 | 597 | |||||||||||||||
| Brunei | 508 | 491 | 450 | 455 | 480 | |||||||||||||||
| Australia | 373 | 379 | 367 | 361 | 360 | |||||||||||||||
| New Zealand | 461 | 470 | 157 | 148 | 129 | |||||||||||||||
| Others | 119 | 108 | 98 | 86 | 48 | |||||||||||||||
| 2,125 | 2,028 | 1,625 | 1,684 | 1,614 | ||||||||||||||||
Total Other Eastern Hemisphere | 3,403 | 3,066 | 2,424 | 2,013 | 1,848 | |||||||||||||||
USA | 1,679 | 1,598 | 1,644 | 1,774 | 1,738 | |||||||||||||||
Other Western Hemisphere | ||||||||||||||||||||
| Canada | 473 | 507 | 478 | 473 | 587 | |||||||||||||||
| Others | 64 | 47 | 35 | 46 | 51 | |||||||||||||||
| 537 | 554 | 513 | 519 | 638 | ||||||||||||||||
Total | 9,286 | 8,902 | 8,096 | 7,835 | 7,679 | |||||||||||||||
| a | By country of origin from gas produced by Group and associated companies (Group share). In those countries where production sharing contracts operate, the figures shown represent the entitlements of the Group companies concerned under those contracts. | |
| b | The acquisition of Enterprise contributed some 180 thousand barrels of oil equivalent per day to 2002 total hydrocarbon production (9 months of production averaged over the full year). Production came mainly from assets in the UK and Norway. |
Royal Dutch/Shell Group of Companies – Business and Property 11
20-F/A (Amendment No. 2) 2002
Table of Contents
| Natural gas production available for sale (as restated) |
| million standard cubic metres daily | ||||||||||||||||||||
| 2002a | 2001 | 2000 | 1999 | 1998 | ||||||||||||||||
Europe | ||||||||||||||||||||
| Netherlands | 43 | 44 | 40 | 43 | 46 | |||||||||||||||
| UK | 32 | 34 | 32 | 27 | 23 | |||||||||||||||
| Germany | 12 | 12 | 13 | 14 | 14 | |||||||||||||||
| Denmark | 9 | 9 | 8 | 9 | 9 | |||||||||||||||
| Norway | 7 | 5 | 6 | 7 | 6 | |||||||||||||||
| Others | 1 | * | * | * | * | |||||||||||||||
| 104 | 104 | 99 | 100 | 98 | ||||||||||||||||
Other Eastern Hemisphere | ||||||||||||||||||||
Africa | ||||||||||||||||||||
| Nigeria | 7 | 6 | 5 | 2 | 2 | |||||||||||||||
| 7 | 6 | 5 | 2 | 2 | ||||||||||||||||
Middle East | ||||||||||||||||||||
| Oman | 22 | 16 | 13 | 4 | – | |||||||||||||||
| Egypt | 7 | 7 | 4 | 3 | 3 | |||||||||||||||
| Syria | * | 1 | 1 | 1 | 2 | |||||||||||||||
| 29 | 24 | 18 | 8 | 5 | ||||||||||||||||
Asia Pacific | ||||||||||||||||||||
| Malaysia | 19 | 16 | 16 | 18 | 17 | |||||||||||||||
| Brunei | 14 | 14 | 13 | 13 | 13 | |||||||||||||||
| Australia | 11 | 11 | 10 | 10 | 10 | |||||||||||||||
| New Zealand | 13 | 13 | 4 | 4 | 4 | |||||||||||||||
| Others | 3 | 3 | 3 | 2 | 1 | |||||||||||||||
| 60 | 57 | 46 | 47 | 45 | ||||||||||||||||
Total Other Eastern Hemisphere | 96 | 87 | 69 | 57 | 52 | |||||||||||||||
USA | 48 | 45 | 46 | 50 | 49 | |||||||||||||||
Other Western Hemisphere | ||||||||||||||||||||
| Canada | 13 | 15 | 14 | 13 | 17 | |||||||||||||||
| Others | 2 | 1 | 1 | 1 | 1 | |||||||||||||||
| 15 | 16 | 15 | 14 | 18 | ||||||||||||||||
Total | 263 | 252 | 229 | 221 | 217 | |||||||||||||||
| * | Less than one million cubic metres daily |
| a | The acquisition of Enterprise contributed some 180 thousand barrels of oil equivalent per day to 2002 total hydrocarbon production (9 months of production averaged over the full year). Production came mainly from assets in the UK and Norway. |
12 Royal Dutch/Shell Group of Companies – Business and Property
20-F/A (Amendment No. 2) 2002
Table of Contents
| Location of activitiesa,b(at December 31, 2002) | ||||||||||||||||||||||||
| Exploration | Production | Shell Operatorc | ||||||||||||||||||||||
| Onshore | Offshore | Onshore | Offshore | Onshore | Offshore | |||||||||||||||||||
Europe | ||||||||||||||||||||||||
| Austria | l | l | l | |||||||||||||||||||||
| Denmark | l | l | ||||||||||||||||||||||
| Germany | l | l | l | |||||||||||||||||||||
| Ireland | l | l | ||||||||||||||||||||||
| Italy | l | l | l | |||||||||||||||||||||
| Netherlands | l | l | l | l | l | l | ||||||||||||||||||
| Norway | l | l | l | |||||||||||||||||||||
| UK | l | l | l | |||||||||||||||||||||
Africa | ||||||||||||||||||||||||
| Angola | l | |||||||||||||||||||||||
| Cameroon | l | l | l | |||||||||||||||||||||
| Gabon | l | l | l | l | l | |||||||||||||||||||
| Morocco | l | l | ||||||||||||||||||||||
| Nigeria | l | l | l | l | l | l | ||||||||||||||||||
Asia Pacific | ||||||||||||||||||||||||
| Australia | l | l | l | l | ||||||||||||||||||||
| Bangladesh | l | l | l | l | l | |||||||||||||||||||
| Brunei | l | l | l | l | l | l | ||||||||||||||||||
| China | l | l | l | l | l | |||||||||||||||||||
| Malaysia | l | l | l | |||||||||||||||||||||
| New Zealand | l | l | l | l | l | l | ||||||||||||||||||
| Pakistan | l | l | l | l | ||||||||||||||||||||
| Philippines | l | l | l | |||||||||||||||||||||
| Thailand | l | l | l | l | ||||||||||||||||||||
Middle East, Russia, CIS | ||||||||||||||||||||||||
| U.A.E. (Abu Dhabi) | l | l | ||||||||||||||||||||||
| Azerbaijan | l | |||||||||||||||||||||||
| Egypt | l | l | l | l | l | l | ||||||||||||||||||
| Iran | l | l | ||||||||||||||||||||||
| Kazakhstan | l | l | l | |||||||||||||||||||||
| Oman | l | l | l | |||||||||||||||||||||
| Russia | l | l | l | l | l | l | ||||||||||||||||||
| Syria | l | l | ||||||||||||||||||||||
USA | ||||||||||||||||||||||||
| USA | l | l | l | l | l | l | ||||||||||||||||||
Other Western Hemisphere | ||||||||||||||||||||||||
| Argentina | l | l | l | |||||||||||||||||||||
| Canada | l | l | l | l | l | |||||||||||||||||||
| Brazil | l | l | l | |||||||||||||||||||||
| Trinidad | l | l | ||||||||||||||||||||||
| Venezuela | l | l | ||||||||||||||||||||||
| a | Including associated companies. | |
| b | Where an associated company has properties outside its base country, those properties are not shown in this table. | |
| c | In several countries where “Shell Operator” is indicated, a Group interest company is operator of some but not all exploration and/or production ventures. |
Royal Dutch/Shell Group of Companies – Business and Property 13
20-F/A (Amendment No. 2) 2002
Table of Contents
| Oil and gas acreage (at December 31)a,b,c(as restated) | thousand acres | thousand acres | ||||||||||||||||||||||||||||||
| 2002 | 2001 | |||||||||||||||||||||||||||||||
| Developed | Undeveloped | Developed | Undeveloped | |||||||||||||||||||||||||||||
| Gross | Net | Gross | Net | Gross | Net | Gross | Net | |||||||||||||||||||||||||
| Europe | 10,417 | 3,259 | 19,752 | 6,930 | 9,570 | 3,031 | 12,616 | 4,581 | ||||||||||||||||||||||||
Africad | 6,289 | 1,886 | 25,394 | 15,516 | 6,489 | 1,984 | 20,804 | 11,658 | ||||||||||||||||||||||||
Asia Pacifice | 3,963 | 1,864 | 118,471 | 40,446 | 3,762 | 1,816 | 115,294 | 41,691 | ||||||||||||||||||||||||
Middle East, Russia, CISf | 35,448 | 11,435 | 18,544 | 12,771 | 34,509 | 11,021 | 22,921 | 15,379 | ||||||||||||||||||||||||
| USA | 1,557 | 754 | 4,670 | 3,183 | 1,599 | 702 | 3,931 | 2,609 | ||||||||||||||||||||||||
| Other Western Hemisphere | 832 | 509 | 33,338 | 22,840 | 767 | 492 | 35,709 | 22,001 | ||||||||||||||||||||||||
| 58,506 | 19,707 | 220,169 | 101,686 | 56,696 | 19,046 | 211,275 | 97,919 | |||||||||||||||||||||||||
| Number of productive wells (at December 31)a,b(as restated) | ||||||||||||||||||||||||||||||||
| 2002 | 2001 | |||||||||||||||||||||||||||||||
| Oil | Gas | Oil | Gas | |||||||||||||||||||||||||||||
| Gross | Net | Gross | Net | Gross | Net | Gross | Net | |||||||||||||||||||||||||
| Europe | 2,002 | 533 | 1,454 | 458 | 1,618 | 429 | 1,299 | 427 | ||||||||||||||||||||||||
Africad | 1,399 | 446 | 42 | 13 | 1,614 | 550 | 45 | 15 | ||||||||||||||||||||||||
Asia Pacifice | 1,317 | 726 | 205 | 95 | 1,242 | 588 | 199 | 91 | ||||||||||||||||||||||||
Middle East, Russia, CISf | 3,456 | 1,085 | 179 | 115 | 3,210 | 1,031 | 131 | 91 | ||||||||||||||||||||||||
| USA | 15,686 | 8,294 | 945 | 686 | 16,717 | 8,511 | 956 | 658 | ||||||||||||||||||||||||
| Other Western Hemisphere | 112 | 110 | 314 | 259 | 86 | 86 | 298 | 251 | ||||||||||||||||||||||||
| 23,972 | 11,194 | 3,139 | 1,626 | 24,487 | 11,195 | 2,928 | 1,533 | |||||||||||||||||||||||||
| Number of net productive wells and dry holes drilleda(as restated) | ||||||||||||||||||||||||||||||||||||||||
| 2002 | 2001 | 2000 | 1999 | 1998 | ||||||||||||||||||||||||||||||||||||
| Productive | Dry | Productive | Dry | Productive | Dry | Productive | Dry | Productive | Dry | |||||||||||||||||||||||||||||||
Exploration | ||||||||||||||||||||||||||||||||||||||||
| Europe | 9 | 4 | 6 | 4 | 7 | 3 | 5 | 2 | 6 | 6 | ||||||||||||||||||||||||||||||
Africad | 6 | 4 | 7 | 1 | 4 | 1 | 4 | 1 | 1 | 3 | ||||||||||||||||||||||||||||||
Asia Pacifice | 3 | 3 | 8 | 12 | 5 | 6 | 8 | 9 | 4 | 12 | ||||||||||||||||||||||||||||||
Middle East, Russia, CISf | 5 | 4 | 6 | 4 | 8 | 4 | 3 | 5 | 8 | 4 | ||||||||||||||||||||||||||||||
| USA | 10 | 4 | 2 | 4 | 9 | 4 | 8 | 9 | 18 | 16 | ||||||||||||||||||||||||||||||
| Other Western Hemisphere | 2 | 2 | 3 | 3 | 1 | 2 | – | 13 | 6 | 9 | ||||||||||||||||||||||||||||||
| 35 | 21 | 32 | 28 | 34 | 20 | 28 | 39 | 43 | 50 | |||||||||||||||||||||||||||||||
Development | ||||||||||||||||||||||||||||||||||||||||
| Europe | 47 | – | 38 | – | 15 | – | 32 | 2 | 46 | 1 | ||||||||||||||||||||||||||||||
Africad | 39 | – | 14 | – | 12 | – | 26 | – | 23 | 1 | ||||||||||||||||||||||||||||||
Asia Pacifice | 42 | 1 | 56 | 2 | 40 | 3 | 38 | – | 42 | 3 | ||||||||||||||||||||||||||||||
Middle East, Russia, CISf | 83 | 12 | 90 | 8 | 98 | 6 | 84 | 2 | 113 | 2 | ||||||||||||||||||||||||||||||
| USA | 559 | 1 | 549 | 2 | 492 | 3 | 290 | – | 555 | 8 | ||||||||||||||||||||||||||||||
| Other Western Hemisphere | 31 | – | 25 | – | 11 | 1 | 14 | 2 | 49 | – | ||||||||||||||||||||||||||||||
| 801 | 14 | 772 | 12 | 668 | 13 | 484 | 6 | 828 | 15 | |||||||||||||||||||||||||||||||
| a | Including associated companies. |
| b | The term “gross” relates to the total activity in which Group and associated companies have an interest, and the term “net” relates to the sum of the fractional interests owned by Group companies plus the Group share of associated companies’ fractional interests. |
| c | One thousand acres equals approximately four square kilometres. |
| d | Excludes Egypt. |
| e | Excludes Sakhalin. |
| f | Middle East and Former Soviet Union/Commonwealth of Independent States. Includes Caspian region, Egypt and Sakhalin. |
14 Royal Dutch/Shell Group of Companies – Business and Property
20-F/A (Amendment No. 2) 2002
Table of Contents
| thousand acres | thousand acres | thousand acres | ||||||||||||||||||||||||||||||||||||||||||||||
| 2000 | 1999 | 1998 | ||||||||||||||||||||||||||||||||||||||||||||||
| Developed | Undeveloped | Developed | Undeveloped | Developed | Undeveloped | |||||||||||||||||||||||||||||||||||||||||||
| Gross | Net | Gross | Net | Gross | Net | Gross | Net | Gross | Net | Gross | Net | |||||||||||||||||||||||||||||||||||||
| 9,399 | 2,973 | 13,951 | 4,920 | 10,162 | 3,218 | 16,697 | 5,790 | 10,078 | 3,189 | 20,141 | 7,640 | |||||||||||||||||||||||||||||||||||||
| 6,491 | 1,973 | 18,963 | 11,261 | 6,224 | 1,916 | 18,535 | 9,077 | 6,527 | 2,142 | 41,518 | 20,183 | |||||||||||||||||||||||||||||||||||||
| 3,766 | 1,599 | 85,219 | 37,893 | 4,114 | 1,712 | 87,569 | 47,060 | 4,454 | 2,197 | 85,651 | 49,694 | |||||||||||||||||||||||||||||||||||||
| 34,504 | 10,962 | 25,546 | 18,648 | 34,342 | 10,902 | 29,694 | 18,969 | 33,915 | 10,608 | 31,211 | 17,130 | |||||||||||||||||||||||||||||||||||||
| 1,967 | 934 | 4,280 | 2,743 | 3,642 | 1,245 | 6,074 | 3,499 | 4,290 | 1,331 | 8,054 | 4,485 | |||||||||||||||||||||||||||||||||||||
| 1,197 | 824 | 49,219 | 27,368 | 1,149 | 850 | 61,344 | 33,215 | 1,430 | 1,052 | 39,910 | 25,699 | |||||||||||||||||||||||||||||||||||||
| 57,324 | 19,265 | 197,178 | 102,833 | 59,633 | 19,843 | 219,913 | 117,610 | 60,694 | 20,519 | 226,485 | 124,831 | |||||||||||||||||||||||||||||||||||||
| 2000 | 1999 | 1998 | ||||||||||||||||||||||||||||||||||||||||||||||
| Oil | Gas | Oil | Gas | Oil | Gas | |||||||||||||||||||||||||||||||||||||||||||
| Gross | Net | Gross | Net | Gross | Net | Gross | Net | Gross | Net | Gross | Net | |||||||||||||||||||||||||||||||||||||
| 1,640 | 442 | 1,349 | 438 | 1,642 | 447 | 1,359 | 436 | 1,603 | 437 | 1,334 | 424 | |||||||||||||||||||||||||||||||||||||
| 1,663 | 565 | 47 | 16 | 1,700 | 573 | 46 | 15 | 1,513 | 540 | 35 | 11 | |||||||||||||||||||||||||||||||||||||
| 1,162 | 542 | 199 | 77 | 1,638 | 753 | 226 | 77 | 1,616 | 763 | 197 | 80 | |||||||||||||||||||||||||||||||||||||
| 3,085 | 990 | 86 | 66 | 2,961 | 945 | 102 | 61 | 2,908 | 946 | 43 | 28 | |||||||||||||||||||||||||||||||||||||
| 17,870 | 8,870 | 1,044 | 627 | 28,165 | 11,636 | 1,631 | 845 | 27,818 | 10,679 | 1,909 | 938 | |||||||||||||||||||||||||||||||||||||
| 338 | 193 | 274 | 230 | 413 | 267 | 259 | 223 | 1,009 | 650 | 260 | 226 | |||||||||||||||||||||||||||||||||||||
| 25,758 | 11,602 | 2,999 | 1,454 | 36,519 | 14,621 | 3,623 | 1,657 | 36,467 | 14,015 | 3,778 | 1,707 | |||||||||||||||||||||||||||||||||||||
| Number of wells drilling (at December 31, 2002)a,b(as restated) | ||||||||||||||||||||||||
| Exploration | Development | Total | ||||||||||||||||||||||
| Gross | Net | Gross | Net | Gross | Net | |||||||||||||||||||
| Europe | 3 | 1 | 27 | 7 | 30 | 8 | ||||||||||||||||||
Africac | 3 | 1 | 8 | 3 | 11 | 4 | ||||||||||||||||||
Asia Pacificd | 3 | 1 | 6 | 3 | 9 | 4 | ||||||||||||||||||
Middle East, Russia, CISe | 4 | 1 | 49 | 18 | 53 | 19 | ||||||||||||||||||
| USA | 6 | 3 | 16 | 10 | 22 | 13 | ||||||||||||||||||
| Other Western Hemisphere | 3 | 2 | 7 | 5 | 10 | 7 | ||||||||||||||||||
| 22 | 9 | 113 | 46 | 135 | 55 | |||||||||||||||||||
| a | Including associated companies. |
| b | The term “gross” relates to the total activity in which Group and associated companies have an interest, and the term “net” relates to the sum of the fractional interests owned by Group companies plus the Group share of associated companies’ fractional interests. |
| c | Excludes Egypt. |
| d | Excludes Sakhalin. |
| e | Middle East and Former Soviet Union/Commonwealth of Independent States. Includes Caspian region, Egypt and Sakhalin. |
(b) Major oil and gas interests
Major oil and gas interests as well as recent developments in countries where Group or associated companies have exploration and production interests are summarised, by country, in the following pages. Certain aspects of the legislation, regulations or agreements affecting the activities of the significant companies are also included.
Europe
Denmark A Group company has a 46% non-operator interest in a producing concession due to expire in 2012, as well as varying percentage interests in 6 (non-operated) exploration licences.
Germany A Group company holds a 50% interest in the Brigitta & Elwerath Betriebsfuehrungsgesellschaft (BEB) joint venture (50:50) which is the major producer of oil and gas in Germany. Since September 2002, the BEB upstream and operational midstream activities have been contracted out to a service company. Activities include onshore and offshore exploration and production activities, gas storage, the operation of two large sour gas treatment plants, numerous compression stations and some 3,000km of pipelines. BEB is also one of the major transmission and distribution companies in Germany. (See also page 21).
Exploration and Production licences are awarded under the terms of Germany’s Federal Mining Law. Most licences are awarded to more than one company and are governed by consortia (joint-ventures). Operatorship is normally awarded to the party holding
Royal Dutch/Shell Group of Companies – Business and Property 15
20-F/A (Amendment No. 2) 2002
Table of Contents
the highest equity share. BEB is involved in some 30 consortia with varying interests and is the main operator in Germany. Further German interests include the 43% Group share in the outside operated Deutsche Offshore Konsortium. Royalties are determined by the individual German states on a yearly basis and are different for the production of natural gas and oil. Royalty incentives are given for the development of tight gas reservoirs.
Ireland During 2002 EO Ireland (Group interest 100%) was acquired as a part of the Group’s acquisition of Enterprise Oil. The main assets are offshore, north west of Ireland and include a 45% interest in the Corrib project (a potential gas development) and exploration prospects that include the Dooish discovery.
Italy During 2002 the Italian business of Enterprise Oil (Group interest 100%) was acquired as a part of the Group’s acquisition of Enterprise Oil. The main assets are onshore in southern Italy and include various interests in producing assets (Monte Alpi, Monte Enoch and Cerro Falcone), development projects (including Tempa Rossa) and nearby exploration prospects.
Netherlands The Group share of natural gas and crude oil is produced by Nederlandse Aardolie Maatschappij B.V. (NAM), (Group interest 50%) in a 50:50 joint venture. An important part of NAM’s gas production is from its very large onshore Groningen gas field in which the Dutch State has a 40% financial interest.
NAM’s production of oil and gas is covered by concessions (onshore) and production licences (offshore). Government participation in development and production varies between 0% and 50%, depending mainly on the legislation applicable when the concessions or licences were granted and whether the participation covered gas or oil. Production is preceded by a drilling permit (onshore) or an exploration licence (offshore), the duration of which, since 1997, varies with the work programme that has to be submitted with the application for a permit or licence. In practice, this means a period of about 3 to 10 years, which can be shortened by the authorities when the exploration effort falls short of the licence or permit programme. Upon making a commercial discovery, a concession (onshore) or production licence (offshore) is granted. The onshore concessions are not currently limited in time but the duration of the offshore licences vary with the estimated production period – normally a period of 15 to 45 years.
Norway A/S Norske Shell (Group interest 100%) holds an interest in a number of Production Licences (PL), three of which encompass currently producing oil and gas fields, Statfjord area (PL 37, expiring in 2009), Draugen area (PL 93, expiring in 2024), and Troll area (PL 54, expiring in 2030). A/S Norske Shell also holds interests in three non-producing licences (PL 208, PL 209 and PL 250, expiring in 2039, 2041 and 2041 respectively) which straddle the large undeveloped Ormen Lange gas field discovered in 1997. Shell International Pipelines Inc. (Group interest 100%) holds interests in gas transportation and processing systems (pipelines and terminals). The licence period for these assets expire in the period from 2010 to 2020.
Various Norwegian assets were part of the Group’s acquisition of Enterprise Oil in 2002, including 10 producing fields, the largest of which were Jotun (45% interest) and Valhall (28.09% interest). Also during 2002 A/S Norske Shell increased their ownership interest in the Draugen area to 26.2%.
United Kingdom Shell UK Limited (Group interest 100%) is one of the largest integrated oil and gas exploration and production companies operating in the UK. It operates in the North Sea on behalf of a 50:50 joint venture and has interests in the UK Continental Shelf on behalf of this venture and with other partners.
Most of Shell UK’s production comes from the North Sea. Natural gas comes from associated gas in mixed oil and gas fields in the northern North Sea and gas fields in the southern sector of the North Sea, whereas crude oil comes from the central and northern fields, which include the large Brent field. Shell UK also has interests, as a non-operator partner, in another joint venture in the North Sea in the Atlantic margin, West of Shetlands. Group production in the West of Shetlands comes from the Schiehallion/ Loyal fields. Licences issued before August 20, 1976 were for an initial period of six years and, following successful exploration, were extended for a further 40 years in respect of half the original licence area. Licences issued between August 20, 1976 and June 13, 1980 were for an initial period of four years followed by a second period of three years. In cases of successful exploration, these licences were extended for a further 30 years after relinquishment of two-thirds of the acreage. From June 14, 1980, licences were granted for an initial period of six years (nine years for deepwater) and in successful cases extended for a further 30 years (40 years for deepwater) in respect of no more than half the licence area. Licences issued since July 1988 carry an additional requirement that if, after 12 years of the 30-year period, no field development has been approved, the licence must be surrendered. No royalty is payable on production from fields for which development approval was granted after April 1982; royalties for other fields has been abolished with effect from January 2003. In August 2002, and with effect from April 2002, a new oil tax on firms operating in the British North Sea was enacted raising the marginal tax rate from 30% to 40%.
The acquisition of Enterprise Oil in 2002 for cash consideration of $5.3 billion was the most significant change to the Group’s upstream portfolio, adding new developments and exploration acreage in Ireland, Italy, Norway, the UK, the USA, Brazil and Russia (see respective write-ups in this section). In the UK, interest in various exploratory and producing assets such as Pierce, Nelson and Beryl, was acquired as part of the Group’s acquisition of Enterprise Oil.
16 Royal Dutch/Shell Group of Companies – Business and Property
20-F/A (Amendment No. 2) 2002
Table of Contents
Also during 2002 Shell UK increased its ownership interest in the Goldeneye development from 41.5% to 48%.
Other Eastern Hemisphere
Abu Dhabi Crude oil and natural gas liquids are produced by the Abu Dhabi Company for Onshore Oil Operations in which a Group company’s concessionary share is 9.5% (licence expiry in 2014), arising from a 23.75% Group interest in the Abu Dhabi Petroleum Company, which in turn holds a 40% interest in the concession granted by the Abu Dhabi government. A Group company has a 15% interest in Abu Dhabi Gas Industries Limited, which extracts propane and butane, as well as heavier liquid hydrocarbons, for export sales from wet associated natural gas produced by Abu Dhabi Petroleum Company.
Australia Shell Development Australia (SDA) (Group interest 100%) has interests in some 50 offshore production and exploration licences in the North-West Shelf (NWS), in the Browse basin and Timor Sea area. The interests are held by SDA directly, or indirectly through its shareholding (34%) in Woodside Petroleum Ltd. (Woodside) which is the operator on behalf of six joint-venture partners of the NWS gas/condensate and oil fields. (See also page 21.) Gas and condensate are produced from the North Rankin and Goodwyn facilities to an onshore treatment and LNG facility at Burrup. Woodside is also the operator of the producing Laminaria and Corallina fields situated in the Timor Sea. Together with its partner Woodside, SDA also has interests in significant liquid-rich gas fields in the Timor Sea as well as the Browse basin.
SDA is also a participant in another joint venture that carries out exploration and production operations in the NWS region. As party to this joint venture, SDA has non-operator interest (ranging from 12.5% to 28.57%) in the gas fields known as greater Gorgon, which are situated West of Barrow Island.
Brunei A Group company is a 50% shareholder in Brunei Shell Petroleum Company Sendirian Berhad (the other 50% shareholder being the Brunei government). The company, which has renewable long-term oil and gas concession rights both onshore and offshore Brunei, sells most of its natural gas production to Brunei LNG Sendirian Berhad (Group interest 25%) (see also page 22.)
A Group company has a 35% share in the non-operated Block B Joint Venture (BBJV) concession where gas is produced from the Maharaja Lela Field.
Egypt Shell Egypt (Group interest 100%) participates in four exploration concessions (operator in three and non-operator in Rosetta) and in five development leases (operator in four and non-operator in Rashid). All concessions and leases are granted on the basis of production-sharing agreements. Included in Shell Egypt’s portfolio is an 84% interest in the North-eastern Mediterranean deepwater concession. Shell Egypt has a 50% interest in Badr Petroleum Company (Bapetco), a joint venture company with the Egyptian General Petroleum Corporation (the Egyptian national oil company). Bapetco operates two producing fields, Badr El Din and Obaiyed.
Gabon Shell Gabon (Group interest 75%) has interests in 6 onshore mining concessions/ exploitation permits, two of which (Rabi/Kounga and Gamba/ Ivinga) are operated by the company. The Rabi/Kounga concession was transferred to a production sharing contract as of January 1, 2003. This production sharing contract expires in 2013 and may be extended until 2018. The Gamba/ Ivinga concession expires in 2042 and all other concessions expire between 2010 and 2018. Production in Gabon is dominated by the Rabi field, which is operated by Shell Gabon holding 42.5% equity in the field. Shell Gabon’s portfolio also includes 4 exploration permits, one around the Gamba/ Ivinga concession, two near the Rabi field, and one directly offshore Libreville.
Two Group companies Shell Offshore North Gabon BV (SONG) and Shell Offshore Gabon BV (SOSG) hold 7 permits in the Ultra-Deepwater areas in the north and south.
Malaysia Four 100%-owned Group companies have production-sharing contracts with the state oil company Petronas. In most of these contracts Petronas Carigali Sendirian Berhad (PCSB), a 100% Petronas subsidiary, is the sole joint-venture partner. One Group company, Sarawak Shell Berhad (SSB) is the operator, with a 50% equity stake, of five non-associated producing gas fields. The majority of the gas is supplied to Malaysian LNG Sendirian Berhad (Group interest 15%) for deliveries of liquefied natural gas to customers mainly in Japan and Korea. (See page 22.) SSB operates one oil field (D35) and has a 50% equity stake in the non-operated Baram Delta production-sharing contract. SSB has exploration interests in the deepwater SK-E block and shallow-water blocks SK-307, SK-308 and SK-8. SSB also holds exploration acreage in SB-301, SB-J and the deepwater block SB-G. Sabah Shell Petroleum Company (SSPC) operates five producing fields in Sabah waters of which Kinabalu (80% equity share) is the largest. SSPC and Shell Sabah Selatan Sdn Bhd (SSS) also have a PSC for the exploration and production in Block SB-303, offshore Sabah. Shell Exploration and Production Malaysia (SEPM) operates an exploration licence in Peninsula Malaysia (PM-303) where they also have 50% interest in Block PM-301/302.
New Zealand Shell New Zealand BV (SNZ) (Group interest 100%) has 77.5% interest in the production licences for the large offshore Maui gas field, in which another wholly owned Group company has a further 6.25% indirect interest, and a 50% interest in the onshore Kapuni gas field. The gas produced is sold domestically, mainly under long-term contracts. SNZ also has interests
Royal Dutch/Shell Group of Companies – Business and Property 17
20-F/A (Amendment No. 2) 2002
Table of Contents
in other exploration licence areas in the Taranaki Basin. All of these interests are operated by Shell Todd Oil Services Ltd, a service company (Group interest 50%).
During 2002 the Group completed the divestment of a number of New Zealand interests which were a condition of the New Zealand Commerce Commission granting approval for the acquisition of Fletcher Challenge Energy which was completed in 2001.
Nigeria The Shell Petroleum Development Company of Nigeria Ltd. (SPDC) (Group interest 100%) is operator of a joint venture (Group interest 30%) with the Nigerian National Petroleum Corporation and two other companies. The venture’s offshore oil and gas mining leases expire in 2008 and its onshore leases in 2019. At the end of 2002 production began from the EA field offshore Nigeria.
Shell Nigeria Exploration and Production Company (SNEPCO) (Group interest 100%) operates production-sharing contracts with 30-year terms with a 55% equity for two deepwater blocks (OML-118 and OPL-219). SNEPCO also has non-operator interests in four other deepwater blocks (OPL-209, OPL-316, OPL-211 and OPL-250).
Oman A Group company has a 34% interest in Petroleum Development Oman (PDO), which is the operator of an oil concession expiring in 2012, or at such a later date as the government and the 40% concession-owning company Private Oil Holdings Oman Ltd. (in which a Group company has an 85% shareholding) may agree.
Gas Investment and Services Company Ltd. (GISCO) (in which a Group company has an 85% shareholding) holds a gas operating agreement which appoints PDO as the operator for any gas discovered in central Oman until 2024, with provisions for extension upon agreement with the government. The first major central Oman gas project involves the supply of gas to customers in the Sur area of north-east Oman, the largest of which is Oman LNG (Group interest 30%). (See page 22.) The upstream investment required to develop and supply the gas is being provided to the government by GISCO.
Syria Group companies have interests varying from 62.5% to 66.7% in five production-sharing contracts with the government and with the state-owned Syrian Petroleum Company (SPC). Under the contracts, they have certain rights and obligations in respect of the production of petroleum. Three contracts (Ash Sham, Deir Ez-Zor and Fourth Annex expiring between 2008 and 2014) concern development activities. In addition, Group companies are parties to a gas utilisation agreement with the government and SPC for the collection and processing of natural gas from the contract areas for use in Syrian power generation and other industrial plants.
USA
Shell Oil Company (SOC) (Group interest 100%) produces crude oil, natural gas and natural gas liquids principally in the Gulf of Mexico, California, Texas, Wyoming and Michigan. The majority of SOC’s oil and gas production interests are acquired under leases granted by the owner of the minerals underlying relevant acreage (including many leases for federal onshore and offshore tracts). Such leases are generally obtained for an initial fixed term that is automatically extended by the establishment of production for so long as production continues, subject to compliance with the terms of the lease (including, in the case of federal leases, extensive regulations imposed by federal law).
As part of the Group’s acquisition of Enterprise Oil, SOC acquired interests in the Boomvang development, which started production in 2002, and in the Tahiti discovery. SOC also acquired additional interests in the Pinedale field in the Rocky Mountain region as a result of two separate transactions.
Shell Oil holds a 52% interest in a USA-based exploration and production joint venture: Aera Energy LLC, holding exploration and production assets in California. This venture is accounted for using the equity method of accounting.
Other Western Hemisphere
Brazil Shell Brasil Ltda. (Group interest 100%) has interests in fourteen deepwater exploration blocks – five operated (BS-4, BC-10, BM-C-10, BM-ES-10 and BM-C-25) and nine non-operated (BC-2, BM-FZA-1, BM-S-8, BM-C-8, BM-C-14, BM-S-17, BM-S-19, BM-SEAL-5 and BM-S-31). Group interest in these blocks ranges from 15% to 100%.
During 2002, as a part of the Group’s acquisition of Enterprise Oil, Shell Brasil acquired and retained interests in six of these deepwater exploration blocks – one operated (BM-ES-10) and five non-operated (BM-C-8, BM-C-14, BM-S-17, BM-S-19, BM-SEAL-5). Interest in these blocks ranges from 15% to 100%. Also acquired was an 80% interest in the Bijupirá and Salema oil fields, currently under development.
The Group retains an interest through Pecten Victoria Inc. in the revenue stream from the producing offshore Merluza gas field. The field is operated by Petrobras.
18 Royal Dutch/Shell Group of Companies – Business and Property
20-F/A (Amendment No. 2) 2002
Table of Contents
Canada Shell Canada (Group interest 78%) is a major producer of natural gas, natural gas liquids and sulphur. The majority of its gas production comes from Alberta and the Sable gas field offshore Nova Scotia (where Shell Canada has 34% interest in the onshore assets and 31% interest in the offshore assets). Exploration rights in Canada are generally granted for terms ranging from one to nine years. Subject to certain conditions, exploration rights can be converted to production leases, which may be extended as long as there is commercial production pursuant to the lease.
Shell Canada produces heavy oil through thermal recovery in the Peace River project and is nearing completion of its new heavy oil project in the Athabasca oil sands area. Shell Canada holds 60% interest in the Athabasca Oil Sands Project (AOSP) under a joint venture agreement to develop and produce synthetic crude from oil sand leases in northern Alberta. The AOSP is comprised of the following:
| The Muskeg River mine, is located 75 kilometers north of Fort McMurray, Alberta. The mine uses trucks and shovels to excavate the oil sands, as well as advanced extraction technologies to separate the bitumen from the sands. AOSP is expected to produce 155,000 barrels of bitumen per day, approximately 10% of Canada’s oil supply. | |
| The Scotford upgrader is adjacent to Shell Canada’s existing Scotford refinery north of Fort Saskatchewan, Alberta. The Scotford upgrader will process the bitumen from the Muskeg River mine into a range of premium, synthetic crude oils and will be operated by Shell Canada. | |
| Production of bitumen from the Muskeg River Mine commenced in October 2002, with commissioning of the bitumen pipeline and upgrader also progressing on schedule. First synthetic crude from the upgrader is scheduled for early 2003. The production of bitumen and synthetic crude is considered under the SEC’s regulations to be mining activity rather than oil and gas activities. |
Venezuela Shell Venezuela S.A. (Group interest 100%) holds an Operating Service Agreement (expiring 2013) with a subsidiary of the state oil company, Petroleos de Venezuela, to develop and produce the Urdaneta West Unit in Lake Maracaibo.
(c) Other oil and gas interests
Other oil and gas interests as well as recent developments in countries where Group or associated companies have exploration and production interests are summarised, by country, in the following pages. Certain aspects of the legislation, regulations or agreements affecting the activities of the significant companies are also included.
Angola Shell Development Angola B.V. (SDAN) has interest of 50% in Block 18, 10% in Block 21 and 15% in Block 34. During 2004, divestment of SDAN’s interest in Block 18 has been announced and is likely to be completed in 2004.
Argentina Shell Compania Argentina de Petroleo (CAPSA) (Group interest 100%) holds an interest with rights to operatorship and 51.25% of production in the Valle Morado Exploitation Lot and a 22.5% interest in the Acambuco concession. During 2002 CNO-4 Exploration Permit Rio Colorado (CAPSA interest 51.25%) was relinquished.
Azerbaijan A Group company holds a 25% interest in the non-operated Inam licence, offshore Azerbaijan.
Bangladesh A Group company held a 50% interest in and was operator of Blocks 15 and 16, a 37.5% interest in the producing Sangu gas field (located in Block 16) and a 22% interest in Block 7. Another Group company held 45% interest in and is operator of a joint venture owning Block 5 and Block 10 (exploration only). These interests have been disposed of.
Cameroon Pecten Cameroon Company (PCC) (Group interest 80%) has 40% working interest in a PCC operated property (Lokele), 24.5% interest in non-operated property (Rio del Rey) and 25% interest in exploratory opportunities with the state (SNH) and another partner.
China Group companies (Shell China Exploration & Production Company (SCEP), formerly Shell Exploration China Limited, and Pecten Orient China) hold a 47.5% interest in the offshore South China Sea Block 15/22 (Xijiang 30-2 producing field) and 24.5% in Block 15/11 (Xijiang 24-1 & 24-3 producing fields). In addition, SCEP operates an exploration licence to the north of the Xijiang fields (Block 15/12). SCEP also holds 100% of the contractors interest in the Changbei Petroleum Contract with China National Petroleum Corporation (CNPC), to assess the development potential of the Changbei gas field in the Ordos Basin of western onshore China.
SCEP, as part of a Consortium of International Companies (IOC), signed a Joint Venture Framework Agreement with PetroChina for the potential participation (IOC 45%, PetroChina 55%) in the China West to East project. This integrated project includes the development of upstream natural gas resources in the Tarim Basin, construction of a 40-inch diameter, 3,920km cross country gas pipeline from Xinjang province in the West to Shanghai in the East and development and supply of clean energy to the emerging gas markets in the Eastern Industrial provinces.
Royal Dutch/Shell Group of Companies – Business and Property 19
20-F/A (Amendment No. 2) 2002
Table of Contents
Democratic Republic of Congo In 2002 the Group sold its share in Shell Lirex and Shell Kirex which held 45% non-operator interest in the East-Mibale, Liawenda-Kinkasi and Maunda-Banana concessions.
India A Group company divested its 50% interest in the production-sharing contract for the Rajisthan Block RJ-ON-90/1.
Iran After ownership dilutions in 2002, a Group company has a 70% interest in an agreement with the National Iranian Oil Company (NIOC) to develop the Soroosh and Nowrooz field in the northern Persian Gulf. This Group company will establish operations with a view to handing over operatorship to NIOC once full production has been reached.
Kazakhstan After pre-emptive purchase in 2002 of an additional 2.38% interest, a Group company holds a 16.67% interest in the North Caspian Production Sharing Agreement in respect of some 6,000km2 offshore in the Kazakhstan sector of the Caspian Sea. During 2002 the Kashagan field was declared commercial and an oil & gas discovery was made in the Kalamkas structure, which is located 80km southwest of the Kashagan field.
Morocco A Group company owns an exploration licence for 5 deepwater blocks named Rimella. The exploration contract calls for 7% royalty on oil and 3.5% royalty on gas. The exploration licence is for a period of two years with two extensions of two years subject to a minimum work commitment.
In 2002, an interest in the adjacent Cap Draa concession was acquired as part of the Enterprise Oil acquisition.
Namibia Shell Exploration and Production Namibia BV (SEPN) (Group interest 100%) withdrew as operator of the Kudu gas field offshore Namibia and no longer holds interest in this field.
Pakistan A Group company holds 28% interest in the Bhit Development and Production Lease and 33.25% interest in the Kirthar Exploration licence.
Philippines Two Group companies hold interest in the deepwater block SC-38 which includes the Malampaya gas field. Shell Philippines Exploration B.V. (SPEX) holds 20% and is operator and Shell Philippines LLC holds 25%.
Russia Shell Sakhalin Holdings B.V. (Group interest 100%) holds 55% interest in Sakhalin Energy Investment Company Ltd. (Sakhalin Energy). Seasonal oil production continued from the Molikpaq facility on the Piltun field, offshore Sakhalin island. The planned next steps will be the full development of the Piltun oil field and Lunskoye gas field including an LNG plant in the south of Sakhalin Island for export to the Asia Pacific LNG markets.
During 2002 a group company acquired 49% interest in KMOC (Khanty Mansiysk Oil Corporation) as part of the Group’s acquisition of Enterprise Oil.
Salym Petroleum Development (Group interest 50%) has the licence to develop the Salym fields.
Saudi Arabia The Group holds an interest in two core venture agreements, Core Venture 3 (projects in South Rub al Khali and Shaybah areas; Group interest 40% and appointed project leadership) and Core Venture 1 (South Ghawar gas development and related projects; Group interest 25%).
Thailand A Group company held a 75% interest in and is operator of the producing Sirikit concession and an interest in the non-producing offshore Block B6/27. These interests were disposed of in 2004.
Trinidad Trinidad Shell EP (TSEP) (Group interest 100%) holds 55% interest in and is operator of deepwater Block 25a.
2 Gas & Power
Unless otherwise noted, the information contained in this section is as at or for the year ended December 31, 2002, as applicable.
The Gas & Power business encompasses: processing, selling and delivering natural gas by long-distance pipeline and – in liquefied form – by tanker; selling and delivering liquid by-products of natural gas processing and Gas to Liquids conversion; marketing and trading of natural gas and electricity to industrial and commercial customers; and developing and operating independent power plants.
| Utilisation of plant capacity | % | |||||||||||||||||||
| 2002 | 2001 | 2000 | 1999 | 1998 | ||||||||||||||||
Liquefied natural gas (LNG) | 97 | 92 | 89 | 93 | 89 | |||||||||||||||
20 Royal Dutch/Shell Group of Companies – Business and Property
20-F/A (Amendment No. 2) 2002
Table of Contents
| ProcessingLiquefied natural gas (LNG) plants | Group | 100% capacity | ||||||||
| Location, Group interest in plantsaand capacity (at December 31, 2002) | interest | million tonnes | ||||||||
| % | a year | |||||||||
| Malaysia | Bintulu | 15 | 15.9 | |||||||
| Australia | Karratha | 22 | 7.5 | |||||||
| Brunei | Lumut | 25 | 7.1 | |||||||
| Oman | Qalhat | 30 | 6.6 | |||||||
| Nigeria | Bonny | 26 | 8.8 | |||||||
| Regasification terminal | ||||||||||
| Belgium | Zeebrugge | 17 | 3.9 | |||||||
| Liquefied natural gas sales volumes | million tonnes | |||||||||||||||||||
| 2002 | 2001 | 2000 | 1999 | 1998 | ||||||||||||||||
| Malaysia | 2.3 | 2.3 | 2.3 | 2.2 | 2.2 | |||||||||||||||
| Australia | 1.7 | 1.7 | 1.7 | 1.7 | 1.7 | |||||||||||||||
| Brunei | 1.7 | 1.7 | 1.7 | 1.6 | 1.5 | |||||||||||||||
| Oman | 1.9 | 1.7 | 0.7 | – | – | |||||||||||||||
| Nigeria | 1.5 | 1.5 | 1.1 | – | – | |||||||||||||||
Total | 9.1 | 8.9 | 7.5 | 5.5 | 5.4 | |||||||||||||||
| a | Percentage rounded to nearest whole percentage point where appropriate. |
Europe
Belgium A 16.7% Group interest is held in both Distrigaz, now a Belgian gas marketing and trading company, and Fluxys, into which Distrigaz’s pipeline and transportation interests were transferred in 2001.
Germany Brigitta & Elwerath Betriebsfuehrungsgesellschaft (BEB), a joint venture with ExxonMobil in which a Group company holds a 50% interest, is the major producer of oil and gas in Germany, and also one of the country’s major gas transmission companies. Group companies have minority shareholdings in major gas transmission and distribution companies, including Thyssengas (25%), Avacon (1.2%, through BEB), Erdgas Munster (15% through BEB), Verbundnetz Gas (5.3% through BEB), and in pipeline companies METG, SETG and NETG (12.5% through Thyssengas). In 2002 the Group divested its indirect participation in HEIN GAS Hamburger Gas Werke (5.1% through BEB) and its direct participations of 16.7% in METG and 25% in SETG. In 2002, the sale of the indirect 14.75% interest in Ruhrgas was agreed subject to final clearance. In March 2003 the sale was closed.
Greece The Group holds a 24% interest in EPA Attikis, a local gas distribution company currently with some 10,000 customers (mainly residential, but also commercial and industrial). Other shareholders are Cinergy 25%, and DEPA (State Gas Company) 51%. EPA Attikis holds a 30-year exclusive distribution licence to market and distribute gas to industrial, commercial and residential customers.
Netherlands Contracts between Nederlandse Gasunie (Group interest 25%) and customers in Europe will provide for long-term sales of Dutch gas for the future. In 2002, Gasunie sold approximately 79 billion cubic metres of gas for both export and domestic consumption.
Spain Shell Espana a wholly-owned Group subsidiary launched a natural gas marketing business in 1999.
United Kingdom A wholly Group-owned gas marketing company, Shell Gas Direct, maintained its market position during 2002 selling in the industrial and commercial market. The wholly owned Shell Energy, established in 1999, continues to develop sales of gas and power in a number of European markets.
Other European Countries Wholly owned Shell Group companies in other European countries continue to seek opportunities to develop the gas and power business. For this purpose they receive advice and assistance from Shell Energy Limited, a wholly owned Group company.
Other Eastern Hemisphere
Australia A Group company directly and indirectly has a 22.3% interest in the liquefied natural gas (LNG) export phase and a 25.5% interest in the domestic gas phase of a joint venture formed to develop the gas fields of the North-West Shelf (NWS) (see page 17). Sale and purchase agreements with eight Japanese utilities call for the supply of LNG at a rate of some 7.3 million tonnes a year, equivalent to some 27 million cubic metres of gas a day. Currently, the joint venture is constructing a fourth LNG
Royal Dutch/Shell Group of Companies – Business and Property 21
20-F/A (Amendment No. 2) 2002
Table of Contents
train with a 4.2 million tonnes capacity a year. This new LNG train is planned to start up in 2004 and will supply both existing and new customers. In 2002, the NWS joint venture was awarded the supply contract for the first LNG terminal in China, to be located in the Guangdong province in south-east China. The contract volume is 3.3 million tonnes per annum and first deliveries are planned in 2006.
The Group has a 28.6% interest in the Gorgon area joint venture that is considering various LNG and domestic gas project options.
A wholly owned Group company is also involved in a number of licences in the Timor Sea between the Northern Territory and Timor Leste with opportunities for both domestic gas and LNG export. The Sunrise gas fields are the most mature of these licences where a proposal to develop these fields using Shell’s floating LNG technology has been made.
Brunei Gas is liquefied and sold to customers in Japan and Korea by Brunei LNG Sendirian Berhad (Group interest 25%). In March 1993 the company’s main contract, to supply LNG to three power and gas utilities in Tokyo and Osaka, was extended for a further 20 years at an increased sales quantity of some 5.5 million tonnes a year. In 2002, the total sales quantity was some 6.8 million tonnes, mainly to Japan and Korea, but supplemented by small sales to the US and Europe. The LNG continues to be delivered in a fleet of 7 LNG vessels owned by Brunei Shell Tankers Sendirian Berhad (Group interest now 25%, following sale of 25% to a partner in BLNG during 2002), as well as a larger vessel, brought into service in June 2002, owned by Brunei Gas Carriers Sendirian Berhad (Group interest 10%).
India The Group holds 100% interest in three companies – Shell Hazira Gas Private Ltd., Hazira Port Private Ltd. and Hazira LNG Private Ltd., all of which are located in the State of Gujarat. Under a Build-Own-Operate-Transfer (BOOT) Concession Agreement with the Gujarat Maritime Board (with an initial term of 30 years) Hazira Port Private Ltd., together with Hazira LNG Private Ltd., is constructing a port and LNG terminal at Hazira in Gujarat. The initial capacity of this terminal is 2.5 mtpa, expandable to 5 mtpa and then 10 mtpa. Currently under construction the terminal is intended to be commissioned at the end of 2004. Shell Hazira Gas Private Ltd., will use these facilities to import LNG and to market and supply regasified LNG to customers in Gujarat and North West India.
Malaysia Exports of LNG from Sarawak by Malaysia LNG Sendirian Berhad (MLNG – Group interest 15%) began in January 1983 to two Japanese customers. The contract delivery rate was increased to 7.6 million tonnes of LNG a year in 1993. Three additional liquefaction trains (Group interest 15%) came on stream at the end of 1995 (MLNG Dua), doubling capacity to some 15.9 million tonnes a year, with customers in Japan, South Korea and Taiwan. For the export volume, gas is supplied from fields operated by Group companies (see page 17). Construction of a third expansion to the Bintulu facilities, MLNG Tiga (Group interest 15%), is on-going and scheduled for completion in the first half of 2003.
The Group shareholding in the first venture, MLNG, reverts to Petronas in 2003 under a transfer agreement contained in the original joint venture agreement. A continuing role in the gas supply to MLNG has already been extended to 2020, and work is ongoing with Petronas to assess the feasibility of a continuing role in MLNG itself.
Adjacent to the LNG facilities is a Gas to Liquids plant, operated by Shell MDS (Malaysia) Sendirian Berhad (Group interest 71.8%). This plant converts approximately three million cubic meters a day of natural gas into some 12,500 barrels a day high-quality middle distillates and other products using Shell-developed technology. First commercial production of middle distillates and solvents from the plant occurred during 1993 using feedstock from offshore gas fields. Following an incident in late 1997, the plant re-started successfully in mid 2000. A full range of liquid and wax products is being sold into specialty markets in Asia Pacific, the USA and Europe.
Nigeria A LNG plant owned by Nigeria LNG Limited (NLNG) (Group interest 25.6%) started up in October 1999. The plant produces some 5.9 million tonnes of LNG a year from two LNG trains (Trains 1&2) for export under long-term contracts to customers in Europe. A final investment decision was taken in February 1999 by the shareholders of NLNG to expand the existing venture, through the construction of an additional 2.9 million tonnes per annum LNG train and associated LPG facilities. The third train commenced production in the fourth quarter 2002, three months ahead of schedule. LNG volumes from this expansion have been sold under long-term contracts to existing customers. In the first quarter of 2002, the shareholders of NLNG committed to the “NLNG Plus” project, a further two-train expansion (Trains 4&5), to supply US and European markets. NLNG Plus will increase NLNG’s production capacity to approximately 16.7 million tonnes a year of LNG and 2.5 million tonnes a year of LPG in 2006.
Oman The LNG plant owned by Oman LNG (Group interest 30%) commenced operations in April 2000. The annual capacity of the plant is some 6.6 million tonnes per annum. The majority of the LNG is sold to Korea and Japan on long term contracts with remaining volumes sold to customers on short term sales agreements.
Russia A Group company holds a 55% interest in Sakhalin Energy Investment Company Ltd. (Sakhalin Energy). Following the successful first phase oil development in July 1999, the potential second phase includes construction, in the south of Sakhalin Island, of a two-train LNG plant with 9.6 million tonnes a year capacity for export to the Asia Pacific LNG markets.
22 Royal Dutch/Shell Group of Companies – Business and Property
20-F/A (Amendment No. 2) 2002
Table of Contents
USA
During 2002, Gas & Power in the USA conducted business in the following areas: transportation of natural gas through offshore pipelines in the Gulf of Mexico, power equity investments, holding of LNG capacity rights in US import terminals, gas storage and arbitrage activities in Texas, natural gas marketing and trading in the USA and Canada, power marketing and trading in the USA, and energy management services.
Shell US Gas & Power (Group interest 100%) manages LNG import capacity rights at the Cove Point and Elba Island terminals, the offshore pipelines in the Gulf of Mexico, an equity position in Enterprise Product Partners L.P., an equity position in Tenaska Gateway power plant in Texas, and long-term gas transportation contracts in Canada. Additionally, during 2002 Shell US Gas & Power evaluated various options to expand its LNG import capabilities.
Following the 2001 acquisition by InterGen of 30% interest in Coral Energy Holdings, Shell Trading continues to operate and manage all of Coral’s gas and power activities in the USA and Canada. In 2002, Kinder Morgan purchased InterGen’s Tejas gas pipeline and storage system.
Other Western Hemisphere
Bolivia In 1997, a Group company acquired a 25% interest in Transredes, an oil and gas pipeline company in Bolivia. In 1999, gas exports to Brazil commenced through a pipeline owned by GTB, a Transredes subsidiary in which the Group has both direct and indirect interests totalling 29.75%.
Brazil In 1997, Group companies acquired a minority interest in Comgas, a Brazilian natural gas distribution company in the state of São Paulo. In 1999, a joint venture was formed with BG International that successfully bid for the final and controlling block of Comgas (total Group interest now 18.2%). In 1998, an interest (25-30%) was acquired in a power station and associated gas supply pipeline at Cuiaba in western Brazil; the pipeline also crosses through eastern Bolivia. In 2000, Group companies, jointly with Enron, acquired the Transredes interests in the Cuiaba pipeline and power plant (Group interest in the various project entities now average 37%). The Cuiaba gas-fired power plant (480MW) became commercially operational in 2002. In 1998, an agreement was signed with Petrobras to develop an LNG import terminal in north eastern Brazil.
Venezuela In 2002, a Group company signed a Framing Agreement (June) and a Preliminary Development Agreement (November) covering a 30% interest in the Mariscal Sucre LNG scheme.
LNG Supply and Shipping
Two operations, Shell Western LNG (SWLNG) and Shell Eastern LNG (SELNG) have been established to secure supplies and terminal capacity for downstream markets that Shell is developing. SWLNG sources LNG in the West and supplies Shell’s outlets in the Atlantic Basin (currently Spain and the USA), while SELNG sources supplies in the East, and may eventually supply Shell’s terminal in India, and other potential outlets in the region including Taiwan and China. These operations will primarily use ships which have been acquired by Shell Tankers Singapore Limited (currently a fleet of 3, but with 2 more to be delivered by early 2004), and also transact short-term supplies and charters.
InterGen
InterGen is a major international developer of private power projects in which the Group has a 68% non-controlling equity interest. InterGen brought five new facilities in Egypt, Mexico, Turkey and Australia into operation in 2002, bringing the total generating capacity to 5.2 Gigawatt (GW) (InterGen net equity interest) at year-end. At the end of December 2002, the company had interests in seven other power stations under construction, with 6.9GW (InterGen net equity interest) capacity, in the UK, Turkey, Mexico, the Netherlands and the USA. Three projects in the UK, Mexico and the Netherlands secured financing in 2002.
3 Oil Products
Unless otherwise noted, the information contained in this section is as at or for the year ended December 31, 2002, as applicable.
(a) Overview
Oil Products encompasses all the activities which transform crude oil from the wellhead into Shell products for customers.
The Group has an interest in more than 50 refineries worldwide and markets fuels for the automotive, aviation and marine sectors, along with heating oils, industrial and consumer lubricants, speciality products such as bitumen and liquefied petroleum gas (LPG) and technical services.
Royal Dutch/Shell Group of Companies – Business and Property 23
20-F/A (Amendment No. 2) 2002
Table of Contents
The Oil Products business operates the world’s largest single branded retail network, serving some 25 million retail customers a day through 55,000 service stations. Convenience retailing, offering a wide range of products, continues to show steady growth in revenues, gross margin and income. In addition, the Oil Products business serves around one million industrial and commercial customers; from small family-run businesses through to multinational companies. Lubricants, fuels and other speciality products are supplied to industrial sectors as diverse as mining, automotive manufacturing, food processing and steel-making. Underpinning Shell’s marketing strength is the Shell brand. The Shell brand is one of the most trusted and reputable in the world. The Shell Global Brand Tracker is run annually, measuring in a structured and objective way the health of the Shell brand across the world, and enables Shell companies to assess their competitive strength and brand appeal. The latest study confirmed Shell’s global lead in terms of Brand Preference – it was the most preferred brand in 30 of the 50 markets covered. The reach of the brand – with a Shell presence in over 145 countries and territories – provides the opportunity to combine the benefits of global operations with a strong brand affiliation.
Group companies continue to be leaders in automotive fuel performance and quality. The range of innovative products and services offered to customers has been further expanded, drawing upon extensive research and development. The differentiated fuels programme has now been launched in 46 countries with 9 product launches in 2002. Environmentally friendlier products continued to be introduced more widely, such as low-sulphur diesel, lead replacement fuel and LPG.
Shell Global Solutions brings the Group’s technology and experience to market by providing industry customers with innovative solutions to improve their performance.
Oil Products actively manages the health and safety risk of its operations and products for staff, contractors, customers and neighbours. All Oil Products business activities are covered by structured HSE management systems.
USA Oil Products activities in the USA are carried out through various Shell Oil Company subsidiaries.
In early 2002, Shell Oil Company acquired the 44% Texaco Inc. interest in Equilon Enterprises LLC, which is now doing business as Shell Oil Products US. At the same time Shell Oil Company and Saudi Refining, Inc. acquired Texaco’s interest in Motiva Enterprises LLC, making each company a 50% owner of that business. Shell Oil Company also holds a 50% interest in the Deer Park Refining Limited Partnership, which is a joint venture between Shell Oil Company and a subsidiary of Mexico’s national oil company Petroleos Mexicanos (Pemex).
Together, Shell Oil Products US and Motiva hold a significant position in the US refined products industry, having an approximate 15% share of the US gasoline market. At the end of 2002, the two companies together with Deer Park Refining Limited Partnership had 9 refineries with a combined capacity of approximately 1.7 million barrels per day, interests in approximately 25,000 miles of pipelines and some 21,000 retail outlets.
Shell Oil Products US and Motiva both market petroleum and other products directly and through independent wholesalers and retailers and have the exclusive rights to use the “Shell” brand on refined oil product sales in those areas of the USA where each company is authorised to conduct its respective business. In addition, Shell Oil Products US and Motiva have the exclusive rights to use the “Texaco” brand on refined oil product sales in their respective areas through June 2004, and non-exclusive rights through June 2006. Shell Oil Products US also has the non-exclusive right to use the Texaco lubricant brands through August 2003. Shell Oil Products US and Motiva plan to reduce the number of service stations in the overall network by around 30%. Furthermore a re-branding programme is underway to re-brand Texaco branded sites to the Shell brand, which will be largely completed by mid-2004.
The purchase of Pennzoil-Quaker State Company was completed in October 2002 after regulatory clearance. The transaction has a total equity value of $1.9 billion and debt of $1.3 billion. This acquisition will make the Group a leader in both passenger car motor oil and diesel engine oil in the USA. This acquisition aligns with the Group’s strategy to become a leader in the global lubricants market.
In 2002, Shell Oil Company sold its pipeline assets in West Texas including the Permian Basin gathering system and the Basin and Rancho pipelines to Plains All American Pipeline, L.P.
In February 2003, Shell Oil Company announced the proposed sale of the majority of the company’s onshore crude pipeline systems. The assets to be sold are the Ozark pipeline, the W. Tulsa 10-inch pipeline, the Cushing Tank Farms, Poplar pipeline and the Powder River and Baker gathering systems. In addition, Shell Pipeline’s ownership interest in the Capline, Capwood, Woodpat, Osage and Little Missouri pipeline systems will be sold. During 2003, several of these transactions were completed, including the Michigan gathering system sale completed in December; the Poplar/Butte/Baker Gathering/Powder River/Little Missouri sale completed in December; the Cushing Ozark/Woodpat/Osage sale closed in quarter one 2004; and the Capline/Capwood sale also closed in quarter one 2004.
Canada Shell Canada (Group interest 78%) owns 3 refineries in Alberta, Ontario and Quebec, with a total refinery capacity of 0.3 million barrels per day and a network of some 1,800 service stations. Under a joint agreement Shell Canada holds 60 per cent interest in the Athabasca Oil Sands Project in Northern Alberta. This includes the Muskeg River mine and the Scotford upgrader. Bitumen production started late in 2002, with synthetic crude production coming soon after.
24 Royal Dutch/Shell Group of Companies – Business and Property
20-F/A (Amendment No. 2) 2002
Table of Contents
The synthetic crude feedstock from the upgrader will be processed at the Scotford refinery, which was ranked as “Best-in-Class” (first out of 132 refineries in North America) in the 2000 Solomon benchmarking study.
Shell Europe Oil Products (SEOP)
SEOP has a presence in 34 countries. Group companies have 11 refineries with a total capacity of 1.6 million barrels per day. In addition, associated companies have 8 refineries with a capacity of 1.1 million barrels per day (Group interest 0.3 million barrels per day). There are a total of some 13,000 service stations. Growth has been realised in recent years in Central and Eastern Europe and in the launch of differentiated fuels which are now present in 20 countries.
In January 2002, a Group company entered into a refining and marketing joint venture (50:50) with RWE-DEA in Germany, the largest oil products market in Europe and in July took ownership of 100% of the venture. The cash consideration of $1.3 billion will be paid in July 2003.
The acquisition of 86 service stations from Agip in Italy was announced in 2002 strengthening Shell’s network in the north of the country. In two linked transactions 56 sites in Germany and 35 sites in France were sold to AGIP in order to comply with regulatory requirements relating to the purchase of RWE-DEA. In the first quarter of 2003, the Group announced its intention to seek buyers for the shares in AB Svenska Shell, a 100% owned subsidiary. It is the intention to retain the lubricants, LPG and Marine Products businesses in Sweden.
Shell Oil Products East (SOPE)
SOPE, encompassing the Middle East and Asia Pacific, operates in 38 countries. At the end of 2002 Group companies have 6 refineries with a refinery capacity of some 1.0 million barrels per day. Furthermore, associated companies have 8 refineries with total capacity at the end of 2002 of 1.0 million barrels per day (Group interest 0.3 million barrels per day).
There are a total of some 10,000 service stations in retail markets. Differentiated fuels are now available in 7 countries.
In quarter 3, the Group initialled a draft Joint Venture Contract with China Petroleum and Chemicals Corporation (Sinopec Corp.) for the establishment of an oil products marketing joint venture in Jiangsu Province. The joint venture is for the development of a network of 500 service stations in that province. Discussions towards full agreement are progressing.
Africa, South and Central America
The Group has a presence in 72 countries. As at the end of 2002 Group companies have 2 refineries with a combined refinery capacity of some 0.3 million barrels per day. Associated companies have 8 refineries with a total capacity at the end of 2002 of 0.3 million barrels per day (Group interest 0.1 million barrels per day).
There are a total of some 9,000 service stations in retail markets. Differentiated fuels are now available in 18 countries.
The sale of a 25% interest in Shell’s marketing businesses in South Africa to the Thebe Investment Corporation was completed in the first quarter 2002. This sale is a positive response to the South African Government’s Black Economic Empowerment initiative.
Global Businesses The Group manages its Aviation, Marine Products, LPG and Global Solutions businesses on a global basis. This global approach has allowed the Group to better meet the needs of its global customers, share best practice and common processes and drive for lower cost structures and supply chain optimisation. The simplification of structures in the USA will allow the Group to further extend these benefits, which will yield additional business and growth opportunities. The acquisition of Pennzoil-Quaker State Company will allow the Group to build a further global platform in lubricants. This will be in transition in 2003 and will be completed in 2004.
Shell Aviation is a world leader in the marketing of aviation fuel and in the operation of airport fuelling. Every day at over 800 airports in 90 countries, Shell Aviation fuels some 20,000 aircraft and supplies over 23 million gallons (87 million litres) of fuel. In 2002 Shell Aviation was recognised by global airlines as the World’s best Jet Fuel Marketer, winning the coveted Armbrust Aviation award for the third time in five years.
Shell Marine Products is one of the world’s leading suppliers of premium quality marine fuels, lubricants and services, working with international and local marine customers worldwide. The business supplies 20 different types of marine fuel oil to power diesel engine, steam and gas turbine vessels, together with around 100 different types of marine lubricants blended to provide optimum protection in the toughest environments. The business serves more than 15,000 customer vessels ranging from large ocean-going tankers to small fishing boats.
Shell Gas LPG markets LPG to around 40 million customers in over 55 countries and territories, supplying LPG for domestic purposes (heating, cooking etc), commercial (restaurants), agriculture and industry; in developed countries LPG is becoming
Royal Dutch/Shell Group of Companies – Business and Property 25
20-F/A (Amendment No. 2) 2002
Table of Contents
increasingly popular as an automotive fuel. Typically LPG is distributed by cylinders, small tanks and large bulk tanks. During 2002 Shell Gas LPG completed the acquisition of Sihirgaz in Turkey, acquired the LPG business and assets of the Bharat Shell joint venture, as well as finalising the acquisition of Unipetrol’s 55% share in Kralupol in the Czech Republic, giving the Group 100% ownership of the company.
Shell Global Solutions brings the Group’s technology and technical experience to market by providing industry and other Group companies with innovative solutions to improve their performance. Shell Global Solutions has an extensive network of offices around the world, with primary commercial centres now operating in the USA, Europe and Asia Pacific. The business has shown a steady growth in revenues over the last 3-4 years.
A Memorandum of Understanding was signed in November 2002 between Shell Global Solutions International and China Petroleum and Chemical Corporation (Sinopec). It provides for Shell Global Solutions to provide a programme to improve the profitability of the Jinling refinery in Nanjing based on transferring industry ‘best practices’ to the refinery.
Shell Services offers industrial customers a range of services, including fluid management, asset management and maintenance, logistical support and power optimisation.
26 Royal Dutch/Shell Group of Companies – Business and Property
20-F/A (Amendment No. 2) 2002
Table of Contents
REFININGa
| Cost of crude oil processed or consumed | $ per barrel |
(including upstream margin on crude supplied by Group and associated exploration and production companies)
| 2002 | 2001 | 2000 | 1999 | 1998 | ||||||||||||||||
| 24.35 | 23.56 | 27.50 | 17.58 | 12.58 | ||||||||||||||||
| Operable crude oil distillation capacityb | thousand barrels dailyc |
| 2002 | 2001 | 2000 | 1999 | 1998 | ||||||||||||||||
| Europe | 1,809 | 1,400 | 1,395 | 1,546 | 1,591 | |||||||||||||||
| Other Eastern Hemisphere | 1,108 | 1,155 | 1,099 | 1,073 | 1,072 | |||||||||||||||
| USA | 1,075 | 689 | 222 | 222 | 324 | |||||||||||||||
| Other Western Hemisphere | 395 | 398 | 372 | 371 | 364 | |||||||||||||||
| 4,387 | 3,642 | 3,088 | 3,212 | 3,351 | ||||||||||||||||
| Crude oil processedd | thousand barrels dailyc |
| 2002 | 2001 | 2000 | 1999 | 1998 | ||||||||||||||||
| Europe | 1,701 | 1,309 | 1,337 | 1,531 | 1,602 | |||||||||||||||
| Other Eastern Hemisphere | 870 | 933 | 899 | 918 | 968 | |||||||||||||||
| USA | 996 | 624 | 196 | 188 | 282 | |||||||||||||||
| Other Western Hemisphere | 314 | 361 | 355 | 352 | 355 | |||||||||||||||
| 3,881 | 3,227 | 2,787 | 2,989 | 3,207 | ||||||||||||||||
| Group share of associated companies | 473 | 480 | 1,117 | 1,139 | 1,072 | |||||||||||||||
Crude oil distillation unit intake as percentage
| of operable capacitye | % |
| 2002 | 2001 | 2000 | 1999 | 1998 | ||||||||||||||||
| Europe | 94 | 95 | 97 | 99 | 101 | |||||||||||||||
| Other Eastern Hemisphere | 84 | 90 | 85 | 90 | 93 | |||||||||||||||
| USA | 91 | 91 | 88 | 86 | 87 | |||||||||||||||
| Other Western Hemisphere | 86 | 91 | 98 | 97 | 97 | |||||||||||||||
| Worldwide | 90 | 92 | 92 | 95 | 97 | |||||||||||||||
| Refinery processing intakef | thousand barrels dailyc |
| 2002 | 2001 | 2000 | 1999 | 1998 | ||||||||||||||||
| Crude oil | 3,881 | 3,227 | 2,787 | 2,989 | 3,207 | |||||||||||||||
| Feedstocks | 203 | 173 | 136 | 148 | 164 | |||||||||||||||
| 4,084 | 3,400 | 2,923 | 3,137 | 3,371 | ||||||||||||||||
| Europe | 1,761 | 1,358 | 1,394 | 1,602 | 1,670 | |||||||||||||||
| Other Eastern Hemisphere | 941 | 1,018 | 971 | 983 | 1,034 | |||||||||||||||
| USA | 1,064 | 663 | 198 | 192 | 308 | |||||||||||||||
| Other Western Hemisphere | 318 | 361 | 360 | 360 | 359 | |||||||||||||||
| 4,084 | 3,400 | 2,923 | 3,137 | 3,371 | ||||||||||||||||
million tonnes a year | ||||||||||||||||||||
Metric equivalent | 201 | 166 | 147 | 157 | 169 | |||||||||||||||
| Refinery processing outturng | thousand barrels dailyc |
| 2002 | 2001 | 2000 | 1999 | 1998 | ||||||||||||||||
| Gasolines | 1,537 | 1,242 | 957 | 1,021 | 1,088 | |||||||||||||||
| Kerosines | 400 | 369 | 320 | 368 | 387 | |||||||||||||||
| Gas/Diesel oils | 1,287 | 1,068 | 974 | 1,035 | 1,079 | |||||||||||||||
| Fuel oil | 355 | 339 | 316 | 361 | 434 | |||||||||||||||
| Other products | 546 | 417 | 350 | 283 | 324 | |||||||||||||||
| 4,125 | 3,435 | 2,917 | 3,068 | 3,312 | ||||||||||||||||
Group share of Equilon and Motiva volumes
| (not included above) | thousand barrels dailyc |
| 2000 | 1999 | 1998 | ||||||||||
| Refinery processing intake | 656 | 797 | 656 | |||||||||
| a | For the period 1998–2000 Equilon and Motiva were reported as associated companies. The Group share of refinery processing intake of Equilon and Motiva was reported separately. The basis of reporting in 2002 has been changed to reflect only those activities relating to the Oil Products business; previously the volumes of the Mobile refinery in Alabama, a refinery owned by Chemicals, was included within the USA volumes. The 2001 figures have been restated on a similar basis. Furthermore, the 2002 USA reported volumes include 100% of Equilon (now Shell Oil Products US) and 50% of Motiva; the 2001 figures have been restated in accordance with the ownership interests prevailing at the time. |
| b | Group average operating capacity for the year and excluding mothballed capacity. |
| c | One barrel daily is equivalent to approximately 50 tonnes a year, depending on the specific gravity of the crude oil. Daily signifies per calendar day. |
| d | Including natural gas liquids; includes processing for others and excludes processing by others. |
| e | Including crude oil and feedstocks processed in crude oil distillation units, and based on calendar-day capacities. |
| f | Including crude oil and natural gas liquids plus feedstocks processed in crude oil distillation units and in secondary conversion units. |
| g | Excluding “own use” and products acquired for blending purposes. |
Royal Dutch/Shell Group of Companies – Business and Property 27
20-F/A (Amendment No. 2) 2002
Table of Contents
OIL SALESa, b, c
| Product volumesd | thousand barrels daily |
| 2002 | 2001 | 2000 | 1999 | 1998 | ||||||||||||||||
Europe | ||||||||||||||||||||
| Gasolines | 647 | 531 | 510 | 506 | 490 | |||||||||||||||
| Kerosines | 190 | 164 | 178 | 192 | 187 | |||||||||||||||
| Gas/Diesel oils | 950 | 776 | 718 | 747 | 764 | |||||||||||||||
| Fuel oil | 177 | 174 | 192 | 186 | 208 | |||||||||||||||
| Other products | 209 | 207 | 212 | 199 | 193 | |||||||||||||||
| 2,173 | 1,852 | 1,810 | 1,830 | 1,842 | ||||||||||||||||
Other Eastern Hemisphere | ||||||||||||||||||||
| Gasolines | 332 | 328 | 334 | 344 | 347 | |||||||||||||||
| Kerosines | 142 | 132 | 124 | 131 | 147 | |||||||||||||||
| Gas/Diesel oils | 476 | 460 | 452 | 437 | 432 | |||||||||||||||
| Fuel oil | 188 | 200 | 203 | 220 | 221 | |||||||||||||||
| Other products | 149 | 138 | 138 | 130 | 124 | |||||||||||||||
| 1,287 | 1,258 | 1,251 | 1,262 | 1,271 | ||||||||||||||||
USA | ||||||||||||||||||||
| Gasolines | 1,239 | 737 | 189 | 185 | 283 | |||||||||||||||
| Kerosines | 221 | 138 | 31 | 31 | 54 | |||||||||||||||
| Gas/Diesel oils | 401 | 266 | 82 | 74 | 59 | |||||||||||||||
| Fuel oil | 105 | 65 | 17 | 25 | 38 | |||||||||||||||
| Other products | 173 | 111 | 114 | 71 | 269 | |||||||||||||||
| 2,139 | 1,317 | 433 | 386 | 703 | ||||||||||||||||
Other Western Hemisphere | ||||||||||||||||||||
| Gasolines | 317 | 315 | 306 | 321 | 310 | |||||||||||||||
| Kerosines | 74 | 80 | 81 | 85 | 93 | |||||||||||||||
| Gas/Diesel oils | 246 | 252 | 275 | 277 | 279 | |||||||||||||||
| Fuel oil | 92 | 100 | 107 | 104 | 118 | |||||||||||||||
| Other products | 49 | 54 | 128 | 123 | 148 | |||||||||||||||
| 778 | 801 | 897 | 910 | 948 | ||||||||||||||||
Export sales | ||||||||||||||||||||
| Gasolines | 251 | 202 | �� | 455 | 279 | 257 | ||||||||||||||
| Kerosines | 155 | 154 | 128 | 128 | 113 | |||||||||||||||
| Gas/Diesel oils | 222 | 194 | 204 | 222 | 253 | |||||||||||||||
| Fuel oil | 196 | 168 | 204 | 175 | 163 | |||||||||||||||
| Other products | 198 | 197 | 192 | 174 | 166 | |||||||||||||||
| 1,022 | 915 | 1,183 | 978 | 952 | ||||||||||||||||
Total product sales | ||||||||||||||||||||
| Gasolines | 2,786 | 2,113 | 1,794 | 1,635 | 1,687 | |||||||||||||||
| Kerosines | 782 | 668 | 542 | 567 | 594 | |||||||||||||||
| Gas/Diesel oils | 2,295 | 1,948 | 1,731 | 1,757 | 1,787 | |||||||||||||||
| Fuel oil | 758 | 707 | 723 | 710 | 748 | |||||||||||||||
| Other products | 778 | 707 | 784 | 697 | 900 | |||||||||||||||
| 7,399 | 6,143 | 5,574 | 5,366 | 5,716 | ||||||||||||||||
Group share of Equilon and Motiva volumes
| (not included above) | thousand barrels daily |
| 2000 | 1999 | 1998 | ||||||||||
| Total oil products sales | 1,508 | 1,429 | 1,070 | |||||||||
| Sales by product as percentage of total product sales | % | |||||||||||||||||||
| 2002 | 2001 | 2000 | 1999 | 1998 | ||||||||||||||||
| Gasolines | 37.7 | 34.4 | 32.2 | 30.5 | 29.5 | |||||||||||||||
| Kerosines | 10.6 | 10.9 | 9.7 | 10.6 | 10.4 | |||||||||||||||
| Gas/Diesel oils | 31.0 | 31.7 | 31.0 | 32.7 | 31.3 | |||||||||||||||
| Fuel oil | 10.2 | 11.5 | 13.0 | 13.2 | 13.1 | |||||||||||||||
| Other products | 10.5 | 11.5 | 14.1 | 13.0 | 15.7 | |||||||||||||||
| 100.0 | 100.0 | 100.0 | 100.0 | 100.0 | ||||||||||||||||
| Net product proceeds | $ million | |||||||||||||||||||
| by product | 2002 | 2001 | 2000 | 1999 | 1998 | |||||||||||||||
| Gasolines | 38,861 | 30,455 | 27,046 | 18,594 | 18,603 | |||||||||||||||
| Kerosines | 9,170 | 8,710 | 7,877 | 5,300 | 4,748 | |||||||||||||||
| Gas/Diesel oils | 28,077 | 25,735 | 25,211 | 16,985 | 16,018 | |||||||||||||||
| Fuel oil | 6,591 | 5,900 | 6,752 | 4,309 | 3,546 | |||||||||||||||
| Other products | 11,420 | 9,845 | 10,470 | 8,243 | 7,631 | |||||||||||||||
| Total oil products | 94,119 | 80,645 | 77,356 | 53,431 | 50,546 | |||||||||||||||
| by geographical area | ||||||||||||||||||||
| Europe | 30,228 | 25,077 | 26,189 | 18,648 | 16,944 | |||||||||||||||
| Other Eastern Hemisphere | 16,801 | 17,371 | 18,278 | 13,254 | 12,000 | |||||||||||||||
| USA | 26,200 | 17,199 | 5,068 | 3,202 | 3,916 | |||||||||||||||
| Other Western Hemisphere | 10,836 | 12,118 | 14,226 | 11,300 | 12,240 | |||||||||||||||
| Export sales | 10,054 | 8,880 | 13,595 | 7,027 | 5,446 | |||||||||||||||
| Total oil products | 94,119 | 80,645 | 77,356 | 53,431 | 50,546 | |||||||||||||||
| Average net product proceeds | $ per barrel | |||||||||||||||||||
| by product | 2002 | 2001 | 2000 | 1999 | 1998 | |||||||||||||||
| Gasolines | 38.22 | 39.50 | 41.20 | 31.16 | 30.22 | |||||||||||||||
| Kerosines | 32.12 | 35.70 | 39.69 | 25.61 | 21.91 | |||||||||||||||
| Gas/Diesel oils | 33.52 | 36.19 | 39.79 | 26.49 | 24.55 | |||||||||||||||
| Fuel oil | 23.82 | 22.85 | 25.52 | 16.62 | 12.98 | |||||||||||||||
| Other products | 40.21 | 38.14 | 36.51 | 32.38 | 23.23 | |||||||||||||||
| Total oil products | 34.85 | 35.96 | 37.92 | 27.28 | 24.23 | |||||||||||||||
| by geographical area | ||||||||||||||||||||
| Europe | 38.11 | 37.09 | 39.52 | 27.92 | 25.20 | |||||||||||||||
| Other Eastern Hemisphere | 35.77 | 37.83 | 39.93 | 28.78 | 25.87 | |||||||||||||||
| USA | 33.55 | 35.78 | 31.98 | 22.70 | 15.27 | |||||||||||||||
| Other Western Hemisphere | 38.18 | 41.47 | 43.34 | 34.00 | 35.37 | |||||||||||||||
| Export sales | 26.95 | 26.59 | 31.40 | 19.69 | 15.67 | |||||||||||||||
| Total oil products | 34.85 | 35.96 | 37.92 | 27.28 | 24.23 | |||||||||||||||
| a | For the period 1998–2000 the Group share of Equilon and Motiva volumes was reported separately. |
| b | The basis of reporting in 2002 has been changed to reflect only those activities which relate to the Oil Products business – previously some volumes handled by other businesses were included; the 2001 figures have been restated on a similar basis. The 2002 reported volumes include 100% of Equilon (now Shell Oil Products US) and 50% of Motiva sales to third parties; the 2001 figures have been restated in accordance with the ownership interests prevailing at that time. |
| c | Sales figures exclude deliveries to other companies under reciprocal purchase and sale arrangements which are in the nature of exchanges. Sales of condensate and natural gas liquids are included. |
| d | By country of destination, except where the ultimate destination is not known at the time of sale, in which case the sales are shown as export sales. |
28 Royal Dutch/Shell Group of Companies – Business and Property
20-F/A (Amendment No. 2) 2002
Table of Contents
(b) Trading
In 2002, Shell Trading (US) Company (STUSCO) assumed the trading activities that had previously been conducted on behalf of Equilon Enterprises LLC and Motiva Enterprises LLC by Equiva Trading Company and its subsidiary Equiva Trading International.
(c) Shipping
During 2002, two new LNG carriers, each with a capacity of 134,500 cubic metres, were acquired to meet the growing demand for LNG shipping. One 32,477 deadweight tonne oil tanker was sold to a third party for further trading. The end 2002 tanker fleet numbers include the STUSCO US flag coastal products vessels.
| Oil tankersa(at December 31) | number of ships | million deadweight tonnes | ||||||||||||||||||||||||||||||||||||||
| Owned/demise-hired | 2002 | 2001 | 2000 | 1999 | 1998 | 2002 | 2001 | 2000 | 1999 | 1998 | ||||||||||||||||||||||||||||||
| VLCCs (very large crude carriers over 160,000 dwt) | 7 | 7 | 8 | 9 | 9 | 2.1 | 2.1 | 2.3 | 2.6 | 2.6 | ||||||||||||||||||||||||||||||
| Large range (45,000 to 160,000 dwt) | 16 | 16 | 16 | 17 | 18 | 1.3 | 1.3 | 1.3 | 1.4 | 1.4 | ||||||||||||||||||||||||||||||
| Medium range (25,000 to 45,000 dwt) | 5 | 6 | 5 | 7 | 8 | 0.2 | 0.2 | 0.1 | 0.2 | 0.3 | ||||||||||||||||||||||||||||||
| General purpose (10,000 to 25,000 dwt)/Specialist | 2 | 2 | 1 | 1 | 2 | 0.1 | 0.1 | 0.1 | 0.1 | 0.1 | ||||||||||||||||||||||||||||||
| 30 | 31 | 30 | 34 | 37 | 3.7 | 3.7 | 3.8 | 4.3 | 4.4 | |||||||||||||||||||||||||||||||
Time-chartered | ||||||||||||||||||||||||||||||||||||||||
| VLCCs (very large crude carriers over 160,000 dwt) | 1 | – | – | – | – | 0.3 | – | – | – | – | ||||||||||||||||||||||||||||||
| Large range (45,000 to 160,000 dwt) | 18 | 17 | 9 | 9 | 15 | 1.5 | 1.5 | 0.7 | 0.8 | 1.3 | ||||||||||||||||||||||||||||||
| Medium range (25,000 to 45,000 dwt) | 15 | 7 | 8 | 7 | 8 | 0.6 | 0.3 | 0.3 | 0.3 | 0.3 | ||||||||||||||||||||||||||||||
| General purpose (10,000 to 25,000 dwt)/Specialist | 6 | 7 | 1 | 1 | 1 | 0.1 | 0.1 | 0.1 | 0.1 | 0.1 | ||||||||||||||||||||||||||||||
| 40 | 31 | 18 | 17 | 24 | 2.5 | 1.9 | 1.1 | 1.2 | 1.7 | |||||||||||||||||||||||||||||||
Total oil tankers | 70 | 62 | 48 | 51 | 61 | 6.2 | 5.6 | 4.9 | 5.5 | 6.1 | ||||||||||||||||||||||||||||||
| Owned/ demise-hired under construction or on order | – | – | – | – | 1 | – | – | – | – | 0.1 | ||||||||||||||||||||||||||||||
| Gas carriersa(at December 31) | number of ships | million deadweight tonnes | ||||||||||||||||||||||||||||||||||||||
| 2002 | 2001 | 2000 | 1999 | 1998 | 2002 | 2001 | 2000 | 1999 | 1998 | |||||||||||||||||||||||||||||||
| Owned/ demise-hired (LNG) | 4 | 2 | – | – | – | 522 | 253 | – | – | – | ||||||||||||||||||||||||||||||
| Time-chartered (LNG) | – | – | 2 | 2 | 2 | – | – | 253 | 253 | 253 | ||||||||||||||||||||||||||||||
| Owned/ demise-hired (LPG) | 1 | 1 | 1 | 1 | 2 | 59 | 59 | 59 | 59 | 118 | ||||||||||||||||||||||||||||||
| Time-chartered (LPG) | 3 | 2 | 2 | 2 | 4 | 145 | 113 | 155 | 157 | 317 | ||||||||||||||||||||||||||||||
Total gas carriers | 8 | 5 | 5 | 5 | 8 | 726 | 425 | 467 | 469 | 688 | ||||||||||||||||||||||||||||||
| Owned/ demise-hired under construction or on order (LNG) | 2 | 4 | – | – | – | 277 | 556 | – | – | – | ||||||||||||||||||||||||||||||
| a | Excluding ships of less than 10,000 deadweight tonnes. |
| 4 | Chemicals |
Unless otherwise noted, the information contained in this section is as at or for the year ended December 31, 2002, as applicable.
Our Chemicals business produces and sells petrochemicals including polyolefins to industrial customers globally. Chemicals’ products are widely used in plastics, coatings and detergents, which in turn are used in products such as fibres and textiles, thermal and electrical insulation, medical equipment and sterile supplies, computers, lighter and more efficient vehicles, paints and biodegradable detergents.
The long-term Chemicals portfolio consists of eight product business areas and four stand-alone companies or ventures – Basell, CRI International, Infineum, and Saudi Petrochemical Company.
Basell, a 50:50 joint venture between Group companies and BASF, is a global polyolefins company with customers in more than 120 countries and manufacturing facilities in 18 countries. CRI International Group is a major player in the refinery, petrochemical and environmental catalyst markets. It is a wholly owned Group subsidiary and is participating in three 50:50 joint ventures. Infineum, a 50:50 joint venture between Group companies and ExxonMobil with manufacturing locations in 12 countries, formulates, manufactures and markets high-quality fuel, lubricant and specialty additives and components.
In November 2002, the final investment decision was taken to proceed with the construction of the $4.3 billion Nanhai petrochemicals complex in southern China.
At December 31, 2002, Group companies had major interests in chemical manufacturing plants, as described below and on the following pages.
Royal Dutch/Shell Group of Companies – Business and Property 29
20-F/A (Amendment No. 2) 2002
Table of Contents
| Sales | $ million | |||||||||||||||||||
| Net proceeds by main product categorya | 2002 | 2001 | 2000 | 1999 | 1998 | |||||||||||||||
| Base and Intermediates | 5,689 | 5,376 | 5,822 | 4,285 | 4,124 | |||||||||||||||
| Performance products | 3,634 | 3,032 | 6,000 | 5,962 | 5,479 | |||||||||||||||
| Differentiated products | 922 | 670 | 1,649 | 1,617 | 2,127 | |||||||||||||||
| Other | 1,245 | 1,538 | 1,734 | 1,022 | 542 | |||||||||||||||
| 11,490 | 10,616 | 15,205 | 12,886 | 12,272 | ||||||||||||||||
| Net proceeds by geographical areaa | $ million | |||||||||||||||||||
| 2002 | 2001 | 2000 | 1999 | 1998 | ||||||||||||||||
| Europe | 4,086 | 3,721 | 5,657 | 5,365 | 5,381 | |||||||||||||||
| Other Eastern Hemisphere | 2,192 | 1,659 | 1,921 | 1,621 | 1,324 | |||||||||||||||
| USA | 4,710 | 4,950 | 7,095 | 5,327 | 4,991 | |||||||||||||||
| Other Western Hemisphere | 502 | 286 | 532 | 573 | 576 | |||||||||||||||
| 11,490 | 10,616 | 15,205 | 12,886 | 12,272 | ||||||||||||||||
| Sales volumes by main product categoryb | thousand tonnes | |||||||||||||||||||
| 2002 | 2001 | 2000 | 1999 | 1998 | ||||||||||||||||
| Base and Intermediates | 13,658 | 13,143 | 11,606 | 11,358 | 10,910 | |||||||||||||||
| Performance products | 5,444 | 4,442 | 7,562 | 8,282 | 6,880 | |||||||||||||||
| Differentiated products | 2,290 | 1,293 | 1,120 | 1,266 | 2,194 | |||||||||||||||
| Ethylene capacitycGroup and associated companies | ||||||||||||||||||||
| 2002 | 2001 | 2000 | 1999 | 1998 | ||||||||||||||||
| Nominal capacity (thousand tonnes/year) | 6,231 | 5,808 | 5,438 | 5,307 | 5,259 | |||||||||||||||
| Utilisation (%) | 92 | 86 | 94 | 94 | 88 | |||||||||||||||
| a | Excluding proceeds from chemical trading activity. |
| b | Excluding volumes from chemical trading activity. |
| c | Data includes the ethylene complex at Mossmorran, UK, in which a Group company has 50% offtake rights but no equity interest. |
Europe
Belgium CRI Catalyst Co Belgium N.V. manufactures catalysts at plants in Ghent. Bayer-Shell Isocyanates N.V., a 50:50 joint venture, produces toluene diisocyanate (TDI) and diphenyl methane diisocyanate (MDI) in Antwerp. All of the TDI production is allocated to the Group. During December 2002, Belgian Shell disposed of its 50% stake in North Sea Petrochemicals.
France At Berre L’Etang, Shell Pétrochimie Méditerranée (Group interest 100%) manufactures aromatics, butadiene, solvents, diisobutylene (DIB) and some fine Chemicals (cyclo-octadiene/ cyclo-dodecatriene). It operates polypropylene and polyethylene plants on behalf of Basell and a cracker on behalf of a 50:50 Shell Pétrochimie Méditerranée-Basell joint venture. It also operates additives plants on behalf of Infineum and several polymer units on behalf of third party companies. Basell also manufactures low-density polyethylene at Fos. The Basell polyethylene plant started at the beginning of 2001.
Germany At Godorf, Shell DEA Oil GmbH, (SDO) (Group interest 100% since July 2002) manufactures benzene and toluene. Ex DEA plants also operated by SDO are: Wesseling (benzene and ethylene); Heide (benzene and ethylene); Karlsruhe, SDO 32.25% (propylene and MTBE); Schwedt, SDO 37.5% (propylene, benzene, toluene and xylene).
Netherlands Shell Nederland Chemie B.V. (SNC) (Group interest 100%) manufactures solvents, MTBE, brake fluids, glycolethers and urethanes (polyols) at Pernis, and lower olefins, benzene, ethyl benzene, ethylene oxide, styrene and propylene oxide at Moerdijk. At Pernis, SNC operates a polypropylene plant owned by Basell. At Moerdijk, SNC operates a styrene monomer and propylene oxide (SM/PO) plant, which is owned by Ellba CV, a 50:50 joint venture between the Group and BASF.
In late 2001, Shell Nederland Chemie brought a 100,000 tonne per year propylene oxide glycol ether plant on stream at Pernis, the Netherlands. The plant makes propylene glycol monomethyl ether, dipropylene glycol monomethyl ether, and propylene glycol monoethyl ether, some of which is esterified to form acetates. It adjoins a multipurpose plant in Pernis, which is producing 65,000 tonnes per year of ethylene oxide glycol ethers and brake fluids. The unit is connected by pipeline to cost-competitive propylene oxide supplies from Ellba’s existing styrene monomer and propylene oxide operations in Moerdijk. Demand for propylene oxide glycol ethers as high-performance solvents is increasing worldwide in order to meet environmental quality legislation.
30 Royal Dutch/Shell Group of Companies – Business and Property
20-F/A (Amendment No. 2) 2002
Table of Contents
In November 2002, a new 500,000 tonnes per year benzene extraction unit came on stream one month ahead of schedule in Moerdijk. The unit will take benzene-rich streams from SNC’s Moerdijk cracker and other Group European locations and the output will be used for styrene monomer/ propylene oxide production on the same site.
Using the Group’s SMPO process, Ellba produces simultaneously styrene monomer, of which the vast majority is used in polystyrene production, and propylene oxide, a chemical building block in a series of products, from industrial foams to surfactants, solvents, additives and lubricants.
As part of the ongoing drive to streamline chemicals operations a new supply and marketing company, Shell Chemicals Europe B.V., was established in the Netherlands. It started operations during November 2002. The new company is responsible for all chemicals sales contracts, supply chain management, and procurement of feedstocks and process chemicals across Western Europe. The primary contacts for customers and suppliers have remained unchanged.
The new structure is designed to improve speed and efficiency and overall ease of doing business for customers and suppliers, both today and in the future with new e-business systems. It is an important milestone in Chemicals’ drive to simplify and streamline business processes and in making it easy to do business with Shell chemicals companies. The move builds on the steps already taken by Shell chemicals companies to operate on a regional and global basis and also ensures that they are well positioned to respond to European harmonisation.
United Kingdom Shell U.K. Limited on behalf of Shell Chemicals UK Limited (both Group interest 100%) operates plants at Stanlow, where base chemicals, detergents and intermediates, and industrial chemicals are produced. Basell produces polypropylene and low-density polyethylene at Carrington. Derivatives from ethylene oxide and propylene oxide are also manufactured at Carrington on behalf of Shell Chemicals UK. On the former ICI site at Wilton, Shell Chemicals UK has rights to an ethylene oxide supply and owns an ethoxylation unit. At Fife in Scotland, ExxonMobil operates an ethylene plant in which Shell Chemicals UK has an investment in a processing rights agreement entitling it to 50% of the output.
Other Eastern Hemisphere
Australia Basell produces polypropylene at plants in Clyde and Geelong, and operates a propylene splitting unit at Clyde.
China On December 28, 2000, Chinese authorities granted a business licence to the newly formed joint venture CNOOC and Shell Petrochemicals Company Limited. This is a 50:50 joint venture between Shell Nanhai BV (Group interest 100%) and CNOOC Petrochemicals Investment Limited. A final investment decision was made by the venture partners in November 2002 to proceed with the joint venture plans to construct a petrochemicals complex in the Huizhou municipality of the Guangdong province. Its major products would include ethylene and propylene; styrene monomer/ propylene oxide; mono-ethylene glycol; polypropylene; high-density polyethylene; low-density polyethylene; and butadiene. Construction is in process with the plant scheduled to be completed in late 2005.
Saudi Arabia The Saudi Petrochemical Company (SADAF), a 50:50 joint venture with Saudi Basic Industries Corporation, owns a one million tonne a year ethylene cracker and downstream plants capable of producing 3.6 million tonnes a year of crude industrial ethanol, ethylene dichloride, caustic soda, styrene and methyl tertiary butyl ether. The marketing arms of both partners handle local and international marketing of SADAF products. The Group’s marketing effort is co-ordinated by Shell Trading (M.E.) Private Limited (Group interest 100%) located in Dubai, United Arab Emirates.
Singapore Group companies own equity interests of 50% and 30% in two Sumitomo-managed joint ventures, namely Petrochemical Corporation of Singapore Private Limited (PCS) and The Polyolefin Company (Singapore) Pte Limited (TPC) respectively. PCS owns and operates two ethylene crackers with a total capacity of one million tonnes a year of ethylene and 500,000 tonnes a year of propylene. In 2000, a condensate splitter unit, owned 50:50 by PCS and the Group, but located in and operated by the Group’s refinery on Pulau Bukom, was started up. This splitter supplies half of PCS’s feedstock requirements. Group companies also own 70% of Ethylene Glycols (Singapore) Pte Ltd and 100% of Seraya Chemicals Singapore (Pte) Ltd, which own and operate an ethylene oxide/ glycols plant and a styrene monomer/ propylene oxide (SMPO) plant respectively. A new world-scale SMPO plant started operations in mid 2002 on a 50:50 basis with BASF, on the Seraya site. Mitsubishi Chemical Corporation has acquired capacity rights for up to 380,000 tonnes of styrene monomer with regard to the existing and new SMPO plants.
USA
Shell Chemical LP (Group interest 99.1%) has manufacturing facilities located at Mobile, Alabama; Martinez, California; St. Rose, Geismar and Norco, Louisiana; and Deer Park, Texas. Manufactured chemical products include lower olefins, aromatics/ phenol, solvents, ethylene oxide/ glycol, higher olefins and their derivatives, propanediol (PDO), styrene monomer-propylene, additives and
Royal Dutch/Shell Group of Companies – Business and Property 31
20-F/A (Amendment No. 2) 2002
Table of Contents
catalysts. These chemical products are used in many consumer and industrial products and processes and are sold primarily to industrial markets in the United States.
In 2002 Shell Chemical LP completed a major expansion project at its Geismar, Louisiana facility, securing its position as an integrated global producer of higher olefins, alcohols and ethoxylates. This expansion significantly increased current production capability for higher olefins and detergent alcohols. The new linear alpha olefin unit that uses the SHOP process (Shell Higher Olefins Process) has a capacity to produce 320,000 tonnes per year, bringing the Group’s total higher olefins capacity to 1,250,000 tonnes per year. Linear alpha olefins are used to make products such as linear low-density polyethylene, high-performance synthetic lubricants, biodegradable detergents, and environmentally compliant oilfield drilling fluids.
In addition, a debottlenecking project has expanded Geismar’s capacity to produce NEODOL detergent alcohols and LINEVOL plasticiser alcohols by about 150,000 tonnes per year. NEODOL alcohols are used primarily to produce biodegradable surfactants for use in household detergents.
Sabina Petrochemicals, a joint venture (Group interest 62%) between Shell Chemicals, BASF Corporation and ATOFINA Petrochemicals, Inc., a division of Totalfinaelf SA, continues with the construction of a world-scale integrated butadiene complex (including a world-scale butadiene extraction unit, indirect alkylation unit, pipelines, and other offsite facilities) in Port Arthur, Texas. Planned for start up in early 2004, the butadiene extraction facility will have a production capacity of 400,000 tonnes a year and will meet the growing needs of customers in the area’s butadiene triangle, including many tyre manufacturers. With this expansion, the Group is bringing production close to the largest concentration of butadiene consumers in the world.
A cracker in Deer Park is also being expanded through a major debottleneck project. The additional capacity of approximately 540,000 tonnes of ethylene a year is planned to come on stream in late 2003. When completed, the world-scale Deer Park facility is expected to produce about 1.3 million tonnes of ethylene a year. A major part of the Deer Park output will feed the above-mentioned higher olefins and detergent development project at Geismar and the butadiene joint venture at Port Arthur. Chemicals is planning to connect these developments by pipelines with Deer Park.
In addition, Basell operates polyolefin plants in Bayport, Texas; Jackson, Tennessee; and Lake Charles, Louisiana. Infineum has manufacturing facilities in Argo, Illinois; Baytown, Texas; Bayway, New Jersey; and Belpre, Ohio. CRI’s catalyst manufacturing locations are at Martinez, Pittsburgh and Azusa, in California; Lafayette, Louisiana; Michigan City, Indiana; and Willow Island, West Virginia.
Other Western Hemisphere
Puerto Rico Shell Chemical Yabucoa Inc owns and operates a 77,000-barrels a day refinery producing feedstock for Shell’s Deer Park, TX and Norco, LA chemical plants. The facility also produces gasoline, diesel, jet fuel and residual fuels, which are primarily being used in Puerto Rico. This refinery was acquired in 2001 from Puerto Rico Sun Oil Company, LLC.
Canada Shell Chemicals Canada Limited (Group interest 100%) produces styrene, isopropyl alcohol, and ethylene glycol, and markets a broad range of petrochemicals. Manufacturing locations are at Scotford, Alberta, and Sarnia, Ontario. Basell owns and operates a polypropylene unit both at Varennes, Quebec, and at Sarnia. Basell also operates the isopropyl alcohol plant at Sarnia on behalf of Shell Chemicals Canada Ltd.
In 2002, a joint venture contract was signed with SGF Chimie, a subsidiary of the Société Générale de Financement du Québec, to form a 50:50 joint venture that plans to build and operate the first world-scale polytrimethylene terephthalate (PTT) plant near Montreal. The 95,000 tonnes per year plant is expected to start production at the end of 2003. The Group markets PTT under the trademark CORTERRA™ Polymers, with their main use in carpet and textile fibres.
5 Renewables
Unless otherwise noted, the information contained in this section is as at or for the year ended December 31, 2002, as applicable.
Group companies also seek opportunities in other businesses aimed at enhancing longer-term prospects for growth and profitability. Shell Renewables is developing the Group’s options in renewable energy, focusing on two principle areas – solar and wind energy. The business manufactures and markets solar energy systems, and develops and operates wind parks.
Shell Solar moved into the top five global players with the acquisition of Siemens Solar in April 2002. The company manufactures solar photovoltaic products in Europe, the US and Asia. Sales operations based in over 90 countries around the world provide customers with solar solutions to their energy requirements working through a network of distributors, dealers and Shell owned outlets. The main customer segments for the Shell Solar business are grid connected, industrial, rural and consumer markets. Shell WindEnergy is focusing on developing and operating wind farms and selling green electricity, building on its strengths in project
32 Royal Dutch/Shell Group of Companies – Business and Property
20-F/A (Amendment No. 2) 2002
Table of Contents
management, financing and engineering design. Business development activity is concentrated in Europe and North America. In 2002 the company brought on stream two wind parks in California – Cabazon and White Water Hill – bringing the overall portfolio to 240MW.
6 Other Activities
For information on Shell Consumer and Shell Hydrogen see page 55.
| 7 | Research |
Unless otherwise noted, the information contained in this section is as at or for the year ended December 31, 2002, as applicable.
Group research and development (R&D) programmes are carried out through a worldwide network of laboratories, with major efforts concentrated in the Netherlands, UK and USA; other laboratories are located in Belgium, Canada, France, Germany, Japan and Singapore. Group companies’ R&D expenses (including depreciation) for the years 1998 to 2002 are set out below:
| Research and development expenditure | $ million | |||||||||||||||||||
| 2002 | 2001 | 2000 | 1999 | 1998 | ||||||||||||||||
| Total (including depreciation) | 472 | 387 | 389 | 505 | 799 | |||||||||||||||
Exploration and Production
Shell’s R&D division is responsible for the research, development and application of integrated technology solutions for Group operating assets around the world. The division’s primary business objectives are: select, develop and implement technologies that enable the Group operating assets to successfully discover and produce greater levels of hydrocarbons; achieve continual improvement of cost efficiency, increase operational safety and reduce environmental impact.
In-house capabilities are used in the research, development and application of proprietary E&P technologies in conjunction with service industry or academic capabilities where applicable.
Primary technology focus areas of the division are: enhanced sub-surface imaging, complex reservoir performance modelling, enhanced well construction, and smaller, more efficient production facilities both onshore and offshore including subsea.
Gas & Power
The focus of R&D has been on cost leadership and the creation of viable business opportunities through maintaining Shell’s competitive position in liquefied natural gas (LNG) technology, particularly LNG processing, safety, transport and storage. Recently the Floating LNG (FLNG) concept has been added to Shell technology portfolio. The concept benefits mainly from the elimination of a long pipeline needed to deliver feed gas to shore-based plants in the commercialisation of remote gas reserves. The Group is further developing its leading position in Gas to Liquids (GTL) conversion through R&D programmes aimed at improving catalysts and process technology to further reduce capital costs and improve process efficiency. GTL product development is also an important focus of work. Group companies have a high international reputation in matters of safety and the environment, and are leading participants in the setting of safety standards for gas operations. Furthermore R&D efforts are focused on maintaining a leading edge with regard to sustainable development across the Gas & Power technology portfolio.
Oil Products
R&D programmes continue to emphasise the improvement of key products and their applications and the further advancement of process technologies including related technical services that provide Group companies with a competitive advantage. For the fuels business, top tier differentiated fuels have been launched in more than 40 countries. Further effort was focused on the cost effective formulation of new products and cost reduction in current formulations. Product stewardship considerations, particularly those related to health and the environment, continue to be given high priority in all areas.
Key drivers in process research have been the need to achieve best-in-class performance in terms of reliability and availability, supply chain optimisation, cost reduction and further reduction in energy consumption and CO2 emissions. Catalyst development has contributed to increased margin generation. Environmentally focused programmes provide solutions ranging from soil remediation techniques to explosion hazard assessments.
A strategic programme aimed at developing break-through options in sustainable energy and sustainable mobility is pursued, covering new routes from biomass to bio-fuels and a new approach to CO2 sequestration by mineralisation. The further development of the catalytic partial oxidation technology continues to be followed up commercially with the shorter-term focus on stationary applications.
Royal Dutch/Shell Group of Companies – Business and Property 33
20-F/A (Amendment No. 2) 2002
Table of Contents
Chemicals
R&D and other technical services continue to improve key products and technologies that provide Shell Chemicals with sustainable leadership positions in selected products. Improvements in manufacturing processes – achieved by means of increased feedstock flexibility, product yield, energy efficiency or plant throughput – are leading to lower production costs at existing facilities. Process intensification and manufacturing integration is resulting in lower unit investment costs. Market positions are being enhanced through the introduction of new product concepts, close technical links with important industrial customers, and the full integration of R&D into the business.
F PERSONNEL
| Employees by segment(average numbers)a | thousands | |||||||||||||||||||
| 2002 | 2001 | 2000 | 1999 | 1998 | ||||||||||||||||
| Exploration and Production | 17 | 14 | 13 | 14 | 16 | |||||||||||||||
| Gas & Power | 2 | 2 | 2 | 1 | 1 | |||||||||||||||
| Oil Products | 75 | 58 | 58 | 57 | 58 | |||||||||||||||
| Chemicals | 9 | 9 | 14 | 18 | 20 | |||||||||||||||
| Corporate and Other | 8 | 7 | 8 | 9 | 7 | |||||||||||||||
| 111 | 90 | 95 | 99 | 102 | ||||||||||||||||
| Employees by geographical area(average numbers)a | thousands | |||||||||||||||||||
| 2002 | 2001 | 2000 | 1999 | 1998 | ||||||||||||||||
| Europe | ||||||||||||||||||||
| Netherlands | 11 | 10 | 10 | 9 | 9 | |||||||||||||||
| UK | 9 | 10 | 10 | 11 | 12 | |||||||||||||||
| Others | 26 | 18 | 21 | 22 | 20 | |||||||||||||||
| 46 | 38 | 41 | 42 | 41 | ||||||||||||||||
| Other Eastern Hemisphere | 27 | 24 | 24 | 25 | 27 | |||||||||||||||
| USA | 23 | 12 | 14 | 15 | 17 | |||||||||||||||
| Other Western Hemisphere | 15 | 16 | 16 | 17 | 17 | |||||||||||||||
| 111 | 90 | 95 | 99 | 102 | ||||||||||||||||
| Employees by segment(at December 31)a | thousands | |||||||||||||||||||
| 2002 | 2001 | 2000 | 1999 | 1998 | ||||||||||||||||
| Exploration and Production | 17 | 15 | 13 | 13 | 15 | |||||||||||||||
| Gas & Power | 2 | 2 | 2 | 1 | 1 | |||||||||||||||
| Oil Products | 80 | 58 | 58 | 56 | 58 | |||||||||||||||
| Chemicals | 9 | 9 | 10 | 17 | 20 | |||||||||||||||
| Corporate and Other | 8 | 7 | 7 | 9 | 8 | |||||||||||||||
| 116 | 91 | 90 | 96 | 102 | ||||||||||||||||
| Employee emoluments | $ million | |||||||||||||||||||
| 2002 | 2001 | 2000 | 1999 | 1998 | ||||||||||||||||
| Remuneration | 6,096 | 4,651 | 4,560 | 4,980 | 5,260 | |||||||||||||||
| Social law taxes | 518 | 395 | 390 | 467 | 476 | |||||||||||||||
| Pensions and similar obligations | (201 | ) | (580 | ) | (577 | ) | (10 | ) | 245 | |||||||||||
| 6,413 | 4,466 | 4,373 | 5,437 | 5,981 | ||||||||||||||||
| a | Excludes employees of associated companies such as those in Brunei, Germany, Oman and USA. Includes 50% of the employees of Shell Expro in the UK and of NAM in the Netherlands and 30% of Shell Petroleum Development Nigeria. |
34 Royal Dutch/Shell Group of Companies – Business and Property
20-F/A (Amendment No. 2) 2002
Table of Contents
Selected Financial Data
| Royal Dutch (Netherlands GAAP) | ||||||||||||||||||||
| (as restated) | per€0.56 ordinary sharea | |||||||||||||||||||
| 2002 | 2001 | 2000 | 1999 | 1998b | ||||||||||||||||
Net assets –€ | 17.72 | 19.55 | 18.80 | 15.91 | 13.47 | |||||||||||||||
Total assets –€ | 18.73 | 20.52 | 19.74 | 16.77 | 14.31 | |||||||||||||||
Basic earnings –€c | 2.96 | 3.30 | 3.91 | 2.27 | 0.12 | |||||||||||||||
Diluted earnings –€c | 2.96 | 3.30 | 3.91 | 2.27 | 0.12 | |||||||||||||||
Dividends declared –€ | 1.72 | d | 1.66 | 1.59 | 1.51 | 1.45 | ||||||||||||||
| Dividends – equivalent payment in dollars | 1.80 | e | 1.50 | 1.40 | 1.47 | 1.60 | ||||||||||||||
| a | Following the redenomination from guilders into euros in May 2002, the authorised share capital of Royal Dutch as set forth in its Articles of Association consists of 3,198,800,000 ordinary shares, par value€0.56 each, and 1,500 priority shares, par value€448 each. The number of ordinary shares and priority shares issued and paid up at the end of 2000, 1999 and 1998 were 2,144,296,352 ordinary shares and 1,500 priority shares, at the end of 2001 were 2,126,647,800 ordinary shares and 1,500 priority shares, and at the end of 2002 were 2,099,285,000 ordinary shares and 1,500 priority shares. The issued and paid-up share capital at the end of 2000, 1999 and 1998 was€1,216,979,748b, at the end of 2001 was€1,206,969,043b and at the end of 2002 was€1,176,271,600. |
| b | The euro figures are translated from the guilder amounts at the fixed conversion rate of 2.20371. |
| c | The basic earnings per share amounts shown are related to profit after taxation and after deducting the 4% cumulative preference dividend on priority shares. The 2002 calculation uses a weighted-average number of shares of 2,057,657,737 (2001: 2,095,731,261; 2000: 2,128,592,305; 1999: 2,132,712,920; 1998: 2,139,076,447). The basic earnings per share number has been restated to exclude shares held by Group companies for stock options and other incentive compensation plans (see Note 22 to the Group Financial Statements). For the purpose of the calculation, shares repurchased under the buyback programme are deemed to have been cancelled on purchase date. |
| The diluted earnings per share are based on the same profit figures. For this calculation, weighted-average number of shares is increased by 442,580 for 2002 (2001: 1,124,897; 2000: 1,394,975; 1999: 987,827; 1998: 1,051,045). These numbers relate to stock options schemes as mentioned above. |
| d | Figure includes proposed final dividend of€1.00 per€0.56 ordinary share, which was finalised by the General Meeting of Shareholders held on April 23, 2003. |
| e | The 2002 final dividend in dollars was determined by the dollar/euro exchange rate ruling on April 28, 2003. |
| Shell Transport | ||||||||||||||||||||
| (as restated) | per 25p Ordinary sharea | |||||||||||||||||||
| 2002 | 2001 | 2000 | 1999 | 1998 | ||||||||||||||||
| Net assets – pence | 168.4 | 174.9 | 168.4 | 143.4 | 135.1 | |||||||||||||||
| Total assets – pence | 178.0 | 184.1 | 177.5 | 152.1 | 144.0 | |||||||||||||||
| Adjusted basic | ||||||||||||||||||||
earnings (pro forma) – penceb | 26.5 | 29.3 | 35.4 | 21.5 | 0.5 | |||||||||||||||
| Adjusted diluted | ||||||||||||||||||||
earnings (pro forma) – penceb | 26.5 | 29.3 | 35.3 | 21.4 | 0.5 | |||||||||||||||
| Dividends declared – pence | 15.25 | c | 14.80 | 14.60 | 14.00 | 13.50 | ||||||||||||||
| a | The authorised share capital of Shell Transport as set forth in its Memorandum of Association consists of £2,500,000,000 divided into 9,948,000,000 Ordinary shares of 25 pence each and 3,000,000 First Preference shares of £1 each and 10,000,000 Second Preference shares of £1 each. |
| The number of issued and paid up Ordinary shares, First Preference shares and Second Preference shares of Shell Transport at the end of 1998-2002 inclusive was: |
| Number of issued shares | ||||||||||||
| 2002 | 2001 | 1998-2000 | ||||||||||
| Ordinary share | 9,667,500,000 | 9,748,625,000 | 9,943,509,726 | |||||||||
| First Preference | 2,000,000 | 2,000,000 | 2,000,000 | |||||||||
| Second Preference | 10,000,000 | 10,000,000 | 10,000,000 | |||||||||
| The amount of issued and paid up share capital of Shell Transport at the end of 1998-2002 inclusive was: |
| Issued and paid up capital £ | ||||||||||||
| 2002 | 2001 | 1998-2000 | ||||||||||
| 2,428,875,000 | 2,449,156,250 | 2,497,877,432 | ||||||||||
| b | Adjusted earnings includes Shell Transport’s share of earnings retained by companies of the Royal Dutch/ Shell Group. A reconciliation between this Adjusted earnings per share measure and Shell Transport’s earnings per share is provided on page S2. The basic earnings per share amounts shown are calculated after deducting 5.5% and 7% cumulative dividend on First and Second Preference shares respectively. The calculation uses a weighted-average number of shares of 9,608,614,760 (2001: 9,758,574,437; 2000: 9,882,388,055; 1999: 9,881,501,981; 1998: 9,889,663,639). The basic earnings per share calculation has been restated to exclude shares held by Group companies for share options and other incentive compensation plans (see Note 22 to the Group Financial Statements). The same earnings figure is used in the basic and diluted earnings per share calculation. For the diluted earnings per share calculation the weighted-average number of shares is increased by 4,661,292 for 2002 (2001: 12,602,362; 2000: 17,170,048; 1999: 28,844,995; 1998: 30,523,532). These numbers relate to share option schemes as mentioned above. |
| c | Includes final dividend of 9.30p per 25p Ordinary share, which was approved at the Annual General Meeting of Shell Transport on April 23, 2003. |
| Shell Transport | per New York Sharea | |||||||||||||||||||
| 2002 | 2001 | 2000 | 1999 | 1998 | ||||||||||||||||
| Dividends and tax credits – equivalent payment in dollars | 1.44 | 1.29 | 1.24 | 1.31 | 1.33 | |||||||||||||||
| a | One New York Share or American Depositary Receipt (ADR) = six 25p Ordinary shares. |
Under the provisions of the UK/USA Double Taxation Conventions, US resident holders of American Depositary Receipts (New York Shares) receive a tax credit (currently 10/90 of the net dividend) concurrently with their dividend – less a deduction for UK withholding tax at 15% or the value of the tax credit, whichever is the lower. The tax credit was 1/4 of the net dividend for dividends paid in years prior to 1999. US portfolio shareholders are subject to tax on the gross dividend (net dividend plus tax credit) with credit for the UK withholding tax. The dividends paid in 1998 (1997 final and 1998 interim) were foreign income dividends and, as such, carried no tax credit and were not subject to withholding tax.
The payment of future dividends on shares of Royal Dutch and Shell Transport will depend upon the Group’s earnings, financial condition (including its cash needs), future earnings prospects and other factors. Additional information on dividends is given under Royal Dutch Petroleum Company – Articles of Association (page 71) and The Shell Transport and Trading Company, Public Limited Company – Memorandum and Articles of Association (page 80).
35
Selected Financial Data
20-F/A (Amendment No. 2) 2002
Table of Contents
Discussion and Analysis of Financial Condition
and Results of Operations
Royal Dutch Petroleum Company (Netherlands GAAP)
Translated into euros, Royal Dutch’s share in the net income of the Royal Dutch/ Shell Group of Companies for the years 2002, 2001 and 2000 respectively amounts to€6,076 million,€6,897 million and€8,314 million (each as restated). The dividends distributed from Group companies to Royal Dutch for the years 2002, 2001 and 2000 were respectively€3,317 million (including dividends yet to be distributed),€6,148 million and€5,694 million. When interest income has been added and administrative expenses deducted, after-tax net income for the year 2002 amounted to€6,091 million compared with€6,914 million for 2001 and€8,327 million for 2000 (each as restated).
Royal Dutch’s 60% interest in the Group net assets, expressed in dollars, has been translated into a euro amount at the year-end rate ($1 =€0.9556 at December 31, 2002). The amount thus obtained, which appears in the Balance Sheet on page R2, should be regarded as a reflection of the dollar value of Royal Dutch’s interest in the Group’s assets and liabilities. Consequently, changes in the dollar/euro rate lead to translation effects in the Royal Dutch Financial Statements. The movements in the value of the dollar, between $1=€1.1302 at December 31, 2001 and $1=€0.9556 at December 31, 2002, led to a negative translation effect of€6,236 million, compared with a positive translation effect of€1,970 million in 2001. These effects are dealt with separately from the “Translation effect arising from movements in dollar/euro rate”, as shown in Note 5 on pages R5 and R6. The translation effects are dealt with in the Balance Sheet items “Investments in companies of the Royal Dutch/ Shell Group” and “Investment reserves”.
As further described in Notes 2(a) and 2(b) to the Royal Dutch Financial Statements, the Group Financial Statements have been restated for all periods included in this Amendment No. 2.
The final dividend for 2002 proposed by the Supervisory Board and the Board of Management was€1.00 on each of the ordinary shares of€0.56 outstanding at December 31, 2002 (excluding the shares acquired and held by the Company in its own capital). This proposal was approved by the General Meeting of Shareholders held on April 23, 2003, and payment of the final dividend resulted in a total dividend for 2002 of€1.72 on each of the said shares (compared with€1.66 and€1.59 per ordinary share for the years 2001 and 2000, respectively).
The Discussion and Analysis of Financial Condition and Results of Operations of the Royal Dutch/Shell Group of Companies is an integral part of the Discussion and Analysis of Financial Condition and Results of Operations for Royal Dutch Petroleum Company.
Euro reporting
With effect from 1999 euro reporting has been adopted instead of guilder reporting for the Financial Statements of Royal Dutch. Comparative data previously reported in guilders have been translated into euro amounts using the fixed conversion rate of 2.20371 guilders per euro. However, the Financial Statements of the Royal Dutch/ Shell Group of Companies will continue to be stated in dollars.
Share buyback and cancellation of shares
The General Meeting of Shareholders held on May 16, 2002 adopted a proposal to reduce the Company’s issued share capital with€15,323,168 by cancellation of 27,362,800 ordinary shares which the Company had acquired between the General Meeting of May 17, 2001 and the General Meeting held on May 16, 2002 under the share buyback programme that took effect in February 2001. This cancellation effectively took place on August 21, 2002.
The General Meeting of Shareholders further renewed the authorisation of the Board of Management, with effect from July 1, 2002, and for a period of 18 months, for the acquisition by the Company, with due observance of the statutory provisions and for its own account, of shares in its capital up to a maximum of 10% of the issued capital. Such shares can be acquired on the stock exchange or otherwise at a price between an amount equal to the par value of the shares and an amount equal to 110% of the opening price quoted for shares of the Company at Euronext Amsterdam on the day of the acquisition or, in absence of such a price, the last previous price quoted there.
In 2002 Royal Dutch repurchased a total of 17,935,000 shares.
At the General Meeting of Shareholders held on April 23, 2003, the shareholders voted to cancel the shares acquired by Royal Dutch in the period between the General Meetings in 2002 and 2003 and to renew the authorisation of the Board of Management for the acquisition by Royal Dutch of its own shares for a period of 18 months with effect from July 1, 2003.
Since the beginning of the programme until March 3, 2003 a total number of 60,796,352 ordinary shares has been acquired by Royal Dutch, of which so far 45,011,352 shares have been cancelled.
Since December 31, 2002 Royal Dutch has not purchased any shares on the market as at March 3, 2003.
36 Discussion and Analysis of Financial Condition and Results of Operations
20-F/A (Amendment No. 2) 2002
Table of Contents
The “Shell” Transport and Trading Company, Public Limited Company
Shell Transport’s earnings for the year 2002 amounted to £2,544.7 million (as restated) (£2,863.5 million in 2001 (as restated); £3,493.6 million in 2000 (as restated)). The amount available for distribution (inclusive of distributions from companies of the Royal Dutch/ Shell Group) was £1,404.0 million in 2002 (as restated) (£2,547.3 million in 2001 (as restated); £2,308.3 million in 2000 (as restated)).
Shell Transport’s net assets at December 31, 2002 were £16,096.2 million (as restated), in comparison with £16,909.0 million at the end of 2001 (as restated). Of these two amounts, £15,654.6 million (as restated) and £16,026.8 million (as restated) respectively represented Shell Transport’s share in the net assets of companies of the Royal Dutch/ Shell Group.
As further described in Notes 2(b) and 2(c) to the Shell Transport Financial Statements, the Group Financial Statements have been restated for all periods included in this Amendment No. 2.
A final dividend of 9.3p per 25p Ordinary share has been declared for 2002. This was approved at the Annual General Meeting held on April 23, 2003 resulting in payment of dividends totalling 15.25p per 25p Ordinary share in respect of 2002, in comparison with dividends paid of 14.8p and 14.6p for 2001 and 2000, respectively.
Share buyback
Since December 31, 2002 Shell Transport had, under the Share buyback programme, purchased no Ordinary shares on the market as at March 3, 2003. Shares purchased under the buyback programme will be cancelled and will not rank for dividends, but any shares purchased on or after April 2, 2003 will be entitled to the dividend payable on May 6, 2003.
Discussion and Analysis of Financial Condition and Results of Operations 37
20-F/A (Amendment No. 2) 2002
Table of Contents
Royal Dutch/ Shell Group of Companies
Summarised Financial Data (US GAAP)
| Income data | $ million | |||||||||||||||||||
| 2002 | 2001 | 2000 | 1999 | 1998 | ||||||||||||||||
| as restateda | as restateda | as restateda | as restateda | |||||||||||||||||
Sales proceeds | ||||||||||||||||||||
| Oil and gas | 220,056 | 162,845 | 175,279 | 135,472 | 124,712 | |||||||||||||||
| Chemicals | 14,659 | 13,767 | 15,658 | 13,408 | 12,795 | |||||||||||||||
| Other | 767 | 589 | 481 | 826 | 767 | |||||||||||||||
Gross proceeds | 235,482 | 177,201 | 191,418 | 149,706 | 138,274 | |||||||||||||||
| Sales taxes, excise duties and similar levies | 56,167 | 42,070 | 42,365 | 44,340 | 44,582 | |||||||||||||||
Net proceeds | 179,315 | 135,131 | 149,053 | 105,366 | 93,692 | |||||||||||||||
Earnings by industry segment | ||||||||||||||||||||
| Exploration and Production | 6,726 | 7,911 | 9,871 | 4,749 | (86 | ) | ||||||||||||||
| Gas & Power | 774 | 1,226 | 112 | 398 | (155 | ) | ||||||||||||||
| Oil Products | 2,627 | 1,970 | 2,681 | 3,587 | 1,909 | |||||||||||||||
| Chemicals | 565 | 127 | 1,033 | 1,148 | (580 | ) | ||||||||||||||
| Other industry segments | (110 | ) | (287 | ) | (12 | ) | (28 | ) | (46 | ) | ||||||||||
Total operating segments | 10,582 | 10,947 | 13,685 | 9,854 | 1,042 | |||||||||||||||
| Corporate | (751 | ) | (320 | ) | (825 | ) | (538 | ) | (810 | ) | ||||||||||
| Minority interests | (175 | ) | (326 | ) | (47 | ) | (265 | ) | (129 | ) | ||||||||||
Net income | 9,656 | 10,301 | 12,813 | 9,051 | 103 | |||||||||||||||
| Assets and liabilities data(at December 31) | $ million | |||||||||||||||||||
| Total fixed and other long-term assets | 111,476 | 80,729 | 76,836 | 83,837 | 87,414 | |||||||||||||||
| Net current assets/(liabilities) | (13,546 | ) | (2,750 | ) | 3,778 | (2,730 | ) | (8,567 | ) | |||||||||||
| Total debt | 19,691 | 5,820 | 7,427 | 12,931 | 13,810 | |||||||||||||||
Parent Companies’ interest in Group net assets | 60,276 | 56,142 | 57,616 | 56,602 | 54,928 | |||||||||||||||
| Minority interests | 3,568 | 3,466 | 2,897 | 2,855 | 2,690 | |||||||||||||||
Capital employed | 83,535 | 65,428 | 67,940 | 72,388 | 71,428 | |||||||||||||||
| Cash flow data | $ million | |||||||||||||||||||
Cash flow provided by operating activities | 16,283 | 16,905 | 18,278 | 11,053 | 14,690 | |||||||||||||||
| Capital expenditure (including acquisitions) | 21,027 | 9,598 | 6,128 | 7,403 | 12,820 | |||||||||||||||
Cash flow used in investing activities | 20,633 | 9,080 | 1,490 | 3,017 | 12,461 | |||||||||||||||
| Dividends paid | 7,189 | 9,627 | 5,501 | 5,611 | 5,993 | |||||||||||||||
Cash flow used in financing activities | 53 | 11,562 | 9,125 | 6,256 | 3,582 | |||||||||||||||
Increase/(decrease) in cash and cash equivalents | (5,114 | ) | (4,761 | ) | 7,388 | 1,326 | (1,589 | ) | ||||||||||||
| Other statistics | ||||||||||||||||||||
Total debt ratiob | 23.6% | 8.9% | 10.9% | 17.9% | 19.3% | |||||||||||||||
| a | The Group Financial Statements have been restated. See Notes 2(a) and 2(b) to the Group Financial Statements. |
| b | The total debt ratio is defined as short-term plus long-term debt as a percentage of capital employed. Capital employed is Group net assets before deduction of minority interests plus short-term and long-term debt. Management of the Group believes that the debt ratio calculated on this basis (rather than the ratio of total debt to shareholders’ equity) is useful to investors because it takes account of all amounts of capital employed in the business. Management uses this measure to assess the level of debt relative to the capital invested in the business. The derivation of capital employed from Group net assets is shown in the table above. |
38 Discussion and Analysis of Financial Condition and Results of Operations
20-F/A (Amendment No. 2) 2002
Table of Contents
| Capital investment (as restated) | $ million | ||||||||||||||||||||
| 2002 | 2001 | 2000 | 1999 | 1998 | |||||||||||||||||
Capital expenditurea | |||||||||||||||||||||
Exploration and Productionb | 13,064 | 6,847 | 3,720 | 4,131 | 6,435 | ||||||||||||||||
| Gas & Power | 471 | 313 | 288 | 470 | 1,816 | ||||||||||||||||
| Oil Products | 7,653 | 1,462 | 1,258 | 1,338 | 2,776 | ||||||||||||||||
| Chemicals | 680 | 685 | 726 | 1,178 | 1,491 | ||||||||||||||||
| Other | 494 | 291 | 136 | 286 | 302 | ||||||||||||||||
| 22,362 | 9,598 | 6,128 | 7,403 | 12,820 | |||||||||||||||||
Exploration expense(excluding depreciation and release of currency translation differences) | 997 | 885 | 834 | 1,068 | 1,634 | ||||||||||||||||
New equity investments in associated companies | 684 | 704 | 605 | 630 | 871 | ||||||||||||||||
New loans to associated companies | 605 | 370 | 556 | 394 | 411 | ||||||||||||||||
Other investments | – | 224 | 414 | – | – | ||||||||||||||||
Total capital investment* | 24,648 | 11,781 | 8,537 | 9,495 | 15,736 | ||||||||||||||||
| *comprising | |||||||||||||||||||||
| Exploration and Production | 14,082 | 8,000 | 4,839 | 5,390 | 8,316 | ||||||||||||||||
| Gas & Power | 682 | 810 | 483 | 675 | 1,986 | ||||||||||||||||
| Oil Products | 7,945 | 1,518 | 1,565 | 1,356 | 2,843 | ||||||||||||||||
| Chemicals | 839 | 751 | 941 | 1,384 | 1,869 | ||||||||||||||||
| Other segments | 495 | 332 | 153 | 296 | 311 | ||||||||||||||||
| New loans to associated companies | 605 | 370 | 556 | 394 | 411 | ||||||||||||||||
| 24,648 | 11,781 | 8,537 | 9,495 | 15,736 | |||||||||||||||||
| Quarterly income data (as restated) | $ million | |||||||||||||||||||||||||||||||||||||||||||||||||||||||||||
| 2002 | 2001 | 2000 | ||||||||||||||||||||||||||||||||||||||||||||||||||||||||||
| Q4 | Q3 | Q2 | Q1 | Full Year | Q4 | Q3 | Q2 | Q1 | Full Year | Q4 | Q3 | Q2 | Q1 | Full Year | ||||||||||||||||||||||||||||||||||||||||||||||
| Gross proceeds | 64,236 | 63,389 | 57,598 | 50,259 | 235,482 | 40,382 | 43,059 | 45,965 | 47,795 | 177,201 | 50,783 | 49,452 | 46,025 | 45,158 | 191,418 | |||||||||||||||||||||||||||||||||||||||||||||
| less sales taxes, excise duties and similar levies | 15,734 | 14,518 | 13,221 | 12,694 | 56,167 | 10,670 | 10,430 | 10,170 | 10,800 | 42,070 | 10,538 | 10,802 | 10,111 | 10,914 | 42,365 | |||||||||||||||||||||||||||||||||||||||||||||
| Net proceeds | 48,502 | 48,871 | 44,377 | 37,565 | 179,315 | 29,712 | 32,629 | 35,795 | 36,995 | 135,131 | 40,245 | 38,650 | 35,914 | 34,244 | 149,053 | |||||||||||||||||||||||||||||||||||||||||||||
| Cost of sales | 40,549 | 41,337 | 37,674 | 31,269 | 150,829 | 24,755 | 26,306 | 28,389 | 28,795 | 108,245 | 31,996 | 31,434 | 28,260 | 26,585 | 118,275 | |||||||||||||||||||||||||||||||||||||||||||||
| Gross profit | 7,953 | 7,534 | 6,703 | 6,296 | 28,486 | 4,957 | 6,323 | 7,406 | 8,200 | 26,886 | 8,249 | 7,216 | 7,654 | 7,659 | 30,778 | |||||||||||||||||||||||||||||||||||||||||||||
| Operating profit | 4,285 | 5,209 | 4,308 | 4,400 | 18,202 | 1,445 | 4,586 | 6,173 | 6,887 | 19,091 | 5,576 | 6,045 | 6,533 | 6,465 | 24,619 | |||||||||||||||||||||||||||||||||||||||||||||
Net income | 2,275 | 2,606 | 2,324 | 2,451 | 9,656 | 608 | 2,417 | 3,505 | 3,771 | 10,301 | 2,917 | 3,079 | 3,236 | 3,581 | 12,813 | |||||||||||||||||||||||||||||||||||||||||||||
| a | Includes acquisitions. 2002 includes $1.3 billion for DEA (payable in July 2003). |
| b | Includes capital expenditure on the Athabasca Oil Sands Project. |
| US dollar exchange ratesa | €1 = $ | ||||||||||||||||||
| Averageb | High | Low | Period end | ||||||||||||||||
| Year: | |||||||||||||||||||
1997c | 0.8887 | ||||||||||||||||||
1998c | 0.8996 | ||||||||||||||||||
| 1999 | 1.0588 | ||||||||||||||||||
| 2000 | 0.9209 | ||||||||||||||||||
| 2001 | 0.8909 | ||||||||||||||||||
| 2002 | 0.9495 | ||||||||||||||||||
| Month: | |||||||||||||||||||
| 2002 | July | 1.0156 | 0.9730 | ||||||||||||||||
| August | 0.9882 | 0.9640 | |||||||||||||||||
| September | 0.9959 | 0.9685 | |||||||||||||||||
| October | 0.9881 | 0.9708 | |||||||||||||||||
| November | 1.0139 | 0.9895 | |||||||||||||||||
| December | 1.0485 | 0.9927 | |||||||||||||||||
| 2003 | January | 1.0861 | 1.0361 | ||||||||||||||||
| February | 1.0875 | 1.0708 | |||||||||||||||||
| As at March 3, 2003 | 1.0835 | ||||||||||||||||||
Discussion and Analysis of Financial Condition and Results of Operations 39
20-F/A (Amendment No. 2) 2002
Table of Contents
| £1 = $ | |||||||||||||||||||
| Averageb | High | Low | Period end | ||||||||||||||||
| Year: | |||||||||||||||||||
| 1997 | 1.6397 | ||||||||||||||||||
| 1998 | 1.6602 | ||||||||||||||||||
| 1999 | 1.6146 | ||||||||||||||||||
| 2000 | 1.5138 | ||||||||||||||||||
| 2001 | 1.4382 | ||||||||||||||||||
| 2002 | 1.5084 | ||||||||||||||||||
| Month: | |||||||||||||||||||
| 2002 | July | 1.5800 | 1.5206 | ||||||||||||||||
| August | 1.5709 | 1.5192 | |||||||||||||||||
| September | 1.5700 | 1.5343 | |||||||||||||||||
| October | 1.5708 | 1.5418 | |||||||||||||||||
| November | 1.5915 | 1.5440 | |||||||||||||||||
| December | 1.6095 | 1.5555 | |||||||||||||||||
| 2003 | January | 1.6482 | 1.5975 | ||||||||||||||||
| February | 1.6480 | 1.5727 | |||||||||||||||||
| As at March 3, 2003 | 1.5755 | ||||||||||||||||||
| a | Exchange rates are based upon the noon buying rate in New York City for cable transfers in foreign currencies as certified for customs purposes by the Federal Reserve Bank of New York. | |
| b | Calculated by using the average of the exchange rates on the last business day of each month during the year. | |
| c | The euro-to-dollar exchange rates prior to the fixing of the euro conversion rate in January 1999 are derived from guilders-per-dollar exchange rates and the fixed guilders-per-euro conversion rate of 2.20371. |
40 Discussion and Analysis of Financial Condition and Results of Operations
20-F/A (Amendment No. 2) 2002
Table of Contents
OVERVIEW
The Group engages worldwide in all the principal aspects of the oil and natural gas business and also has interests in chemicals, power generation, renewable energy and certain other businesses. The Group conducts its business through five principal segments: Exploration and Production, Gas & Power, Oil Products, Chemicals and Other Industry Segments.
Group strategy
Over time, and across the commodity price cycle, the Group has achieved higher earnings, cashflow and returns on investment in the Exploration and Production business compared with its other businesses, and sees greater growth potential in demand for natural gas than crude oil products. Downstream businesses (Oil Products and Chemicals) continue to offer attractive returns and growth potential in certain business lines and geographies, and provide useful balance in the portfolio to reduce exposure to commodity price movements. The Group’s core competencies include the application of technology, financial and project management skills to large oil and gas projects; the ability to develop and manage a diverse and international business portfolio; and the development of customer focused businesses built around the strength of the Shell brand.
The Group’s strategic direction has four main elements:
| 1. | Increasing the proportion of the portfolio in the upstream businesses (Exploration and Production and Gas & Power), and whilst also increasing the share of natural gas production relative to oil production. This is expected to be achieved primarily through the allocation of capital investment over time. |
| 2. | Maintaining profitable growth in downstream businesses, focusing on areas of strength. This provides balance in the portfolio, reducing exposure to volatile commodity prices, and provides cash generation to support investment in the upstream businesses. |
| 3. | Generation of new income streams; these include activities arising from new technology such as oil sands production and gas to liquids conversion, from provision of oil and gas processing services, and from new energy sources such as wind and solar power. |
| 4. | Focusing on geographical opportunities; in the upstream businesses on areas of resource opportunity such as Russia and West Africa, and in Oil Products in growing markets (such as China) and in North America, where the Group has increased its presence, and in Chemicals in China. |
Exploration and Production
Crude oil prices, production volumes and cost levels are the most significant factors affecting earnings. In 2002, Brent crude oil prices were on average around $0.60 a barrel higher than in 2001. Declining production in mature areas, including North America and Europe, is generally being offset by production from new investments in other geographic areas. In 2002, the Group’s oil production benefited from the acquisition of Enterprise Oil.
Volatility in crude oil prices, potential cost increases and replacement of reserves at a rate matching or exceeding production are the key challenges and risks in Exploration and Production. The geographic balance of the portfolio in the business is the main mitigator of these risks. Around one-half of current total production has a lower sensitivity to short-term fluctuations in crude oil prices, as it is either gas-price related or because the terms of the contracts limit the Group’s exposure to crude oil price fluctuations. Another key challenge for Exploration and Production is the management of the uncertainties inherent in projects as large and complex as those it typically undertakes.
Gas & Power
In Gas & Power, the overall aim is to monetise Shell gas. This is achieved through participation in all phases of the liquefied natural gas (LNG) business, in distribution, marketing and trading of natural gas, in power generation, in gas to liquids conversion and also in coal gasification. Each of the three main gas markets (North America, Europe and Asia Pacific) continues to grow. Prices and LNG sales volumes are the key drivers of results in Gas & Power. Gas prices tend to be linked to oil prices, except in the USA, where the relationship has historically been weaker. Shell has an equity share in projects supplying approximately 40% of global LNG production and has a significant market share in the LNG business.
The Group continues to invest in LNG and is seeking to achieve a 6% average annual increase in equity share of contracted LNG sales from 2000 to 2005. Principal investments during 2002 related to LNG supply, shipping and re-gasification projects and power developments.
Principal challenges and risks in the Gas & Power business are to ensure assets are developed in each part of the LNG value chain in areas with market growth, and to achieve profitability for the assets in the power generation markets, particularly in North America. The Group is addressing the first challenge through the development of a number of supply, shipping and
Discussion and Analysis of Financial Condition and Results of Operations 41
20-F/A (Amendment No. 2) 2002
Table of Contents
importation facilities in the various key markets, and the latter challenge through focus on current operations and completion of current projects, rather than new development in power, supplemented by asset divestments. A continuing risk related to the LNG business is the ability to secure long-term contracts at prices that are more favourable than short-term spot prices.
Oil Products
The key drivers of the Oil Products business are customer demand for oil products, the global refining supply/demand balance, and the Group’s competitive positioning in key markets. The strength of the Shell brand, the quality of the assets and the level of operational cost associated with meeting customer requirements are key drivers to our competitive position.
The business environment for oil products deteriorated in 2002, with historically low refining margins over the first half of the year and pressure on marketing margins from rising crude oil prices. In the USA, a key challenge is to achieve a stronger competitive position. The first phase of the development of a stronger competitive position in the USA was completed through the acquisitions of Pennzoil-Quaker State Company (PQS) and the Texaco downstream assets. The European portfolio was strengthened in 2002 with the acquisition of DEA in Germany. In mature markets such as the USA and Western Europe, portfolio rationalisation, in the form of divestments of underperforming assets, and cost reductions have been industry trends that are likely to continue. Central and Eastern Europe and Asian markets present opportunities for growth. The key challenges and uncertainties in Oil Products are volatility in industry refining margins and maintaining competitive cost levels.
Chemicals
In Chemicals, industry conditions during the past four years have been difficult with high and volatile feedstock costs continuing into 2002. The business environment showed some improvement after the extremely challenging conditions in 2001, although trading conditions, especially in the USA, remained difficult. Feedstock costs are linked to both crude oil and natural gas prices, both of which have been high by historical levels. There also continues to be surplus manufacturing capacity in chemicals relative to demand, particularly in North America and Europe. In response to these challenges, the Group has focused on reducing costs, asset restructuring and closing underperforming assets. Reduced levels of capital investments have been targeted at upgrading existing facilities, and new investment in China. The Group’s strategy has been to focus on producing petrochemical building blocks and polyolefins, in fewer and larger manufacturing facilities, and on marketing to a reduced number of large customers. Another key challenge for Chemicals is the management of the uncertainties inherent in projects as large and complex as certain of those it typically undertakes.
Financial framework
The Group manages its portfolio of businesses to balance sources and uses of cash over time, based on conservative assumptions relating to crude oil prices, relative to average historic price levels. From 1983 through 2002, the Brent crude oil price has averaged around $20 a barrel, and from 1998 through 2002 averaged approximately $22 a barrel and from 2000 through 2002 the price averaged almost $26 a barrel. Project investment decisions are based on an assessment of future prices over the long term.
The dividend policy is to provide per share increase at least in line with inflation of the currencies of the Parent Companies’ base countries over a period of years. After dividends and capital investment, the priority for use of cash generated is the maintenance of a prudent balance sheet. Since the total debt of the Group increased by $13.9 billion during 2002, debt reduction will be a priority for the Group in 2003.
Recent Developments
Reserves Restatement and Financial Restatement
On January 9, 2004, the Group announced the removal from proved reserves of approximately 3.9 billion barrels of oil equivalent (boe) of oil and gas that were originally reported as of December 31, 2002. As a result of further field level reviews concluded in April 2004 with the assistance of external petroleum consultants of over 90% of the Group’s proved reserves volumes, the Group determined to increase the total volume of reserves to be removed from the proved category to 4.47 billion barrels of oil equivalent (boe) and to restate the unaudited oil and gas reserves disclosures contained in the supplementary information accompanying the Financial Statements (the First Reserves Restatement) to give effect to the removal of these volumes as of the earliest date on which they did not represent “proved reserves” within the applicable rules of the SEC (which in many cases is the date on which the volumes were initially booked as proved reserves). 12% of the volumes de-booked had been in the proved developed reserves category and 88% had been categorised as proved undeveloped reserves.
On February 3, 2005, as a result of reservoir level reviews conducted during July 2004 through December 2004 of substantially all of the Group’s proved reserves volumes reported as at December 31, 2003, (collectively, the Second Half Review), the Group announced that it would remove from proved reserves an additional 1.37 billion boe of oil and gas that were reported as at December 31, 2003 (1.15 billion boe previously reported at December 31, 2002) and further restate the unaudited oil and gas
42 Discussion and Analysis of Financial Condition and Results of Operations
20-F/A (Amendment No. 2) 2002
Table of Contents
reserves disclosures contained in the supplementary information accompanying the Financial Statements (the Second Reserves Restatement) to give effect to the removal of these volumes as of the earliest date on which they did not represent “proved reserves” within the applicable rules of the SEC (which in many cases is the date on which the volumes were initially booked as proved reserves). 43% of the volumes de-booked had been categorized as proved developed reserves and 57% had been categorised as proved undeveloped reserves.
Please refer to “Supplementary information – Oil and Gas (unaudited)” on pages G54 to G69 for additional information regarding the First Reserves Restatement and the Second Reserves Restatement.
In view of the inappropriate overstatement of unaudited proved reserves information resulting in the First Reserves Restatement, it was determined to restate the Financial Statements of the Group, and each of the Parent Companies, for the year ended December 31, 2002 and prior periods (the First Financial Restatement) to reflect the impact of the First Reserves Restatement on those Financial Statements (as announced on April 19, 2004). As part of the First Financial Restatement, the financial statements were also restated to correct an inappropriate departure from US GAAP relating to certain exploratory drilling costs, to correct an inappropriate departure from US GAAP (for 2002 only) for certain gas contracts and to correct an error in the calculation of earnings per share of the Parent Companies and to reflect a change in accounting principle relating to inventories. The First Financial Restatement also included a separate presentation of the Group Financial Statements under US GAAP and Netherlands GAAP, and a reconciliation of the differences between the presentations. This discussion and analysis is based on the US GAAP Group Financial Statements.
In view of the inappropriate overstatement of unaudited proved reserves information resulting in the Second Reserves Restatement, it was determined to restate the Financial Statements of the Group and each of the Parent Companies for the year ended December 31 2003 and prior periods (the Second Financial Restatement) to reflect the impact of the Second Reserves Restatement on those Financial Statements (as announced on February 3, 2005).
On February 4, 2005, Standard & Poor’s Ratings Services (S&P) downgraded to “AA” from “AA+” its long-term ratings on the Royal Dutch/ Shell Group of Companies (through a downgrade of the Group Holding Companies, Shell Petroleum N.V. and The Shell Petroleum Co. Ltd and their subsidiary Shell Oil Company). Moody’s Investors Services (Moody’s) continues to rate the long-term debt of Shell Finance (Netherlands) B.V. and Shell Finance (U.K.) PLC, the guaranteed subsidiaries of the Group Holding Companies as “Aa1”. The credit ratings given to the commercial paper programmes of the guaranteed subsidiaries have been confirmed by S&P and Moody’s at their original levels of “A-1+” and “Prime-1”, respectively.
Investigation and report to the Group Audit Committee; management changes
Following the January 9, 2004 announcement of the reserves recategorisation, the Group Audit Committee (GAC) appointed Davis Polk & Wardwell to lead an independent review of the facts and circumstances surrounding the recategorisation, and to report its findings and any proposed remedial actions to the GAC for its consideration. That report, dated March 31, 2004, was presented to the GAC and subsequently to the Supervisory Board of Royal Dutch and non-executive Directors of Shell Transport. The report was accepted in full by the GAC on April 15, 2004 and by the members of the Supervisory Board of Royal Dutch and the non-executive Directors of Shell Transport on April 16, 2004.
Following an interim report to the GAC dated March 1, 2004, which was presented to the Parent Company Boards on March 2, 2004, Sir Philip Watts, Chairman of the Committee of Managing Directors, and Walter van de Vijver, Chief Executive of Exploration and Production, submitted their resignations on March 3, 2004 from all director and officer positions within the Group and the Parent Companies. Following acceptance of the final report to the GAC by the members of the Supervisory Board of Royal Dutch and the non-executive Directors of Shell Transport, Judith Boynton resigned from her position as Group Chief Financial Officer, Group Managing Director and Executive Director of Shell Transport on April 18, 2004. On June 23, 2004, Peter Voser was appointed Group Chief Financial Officer and a Director of Shell Transport with effect from October 4, 2004.
Jeroen van der Veer, President and Managing Director of Royal Dutch, succeeded Sir Philip Watts as Chairman of the Group’s Committee of Managing Directors; Lord Oxburgh has been appointed non-executive Chairman of Shell Transport and Chairman of Conference; and Malcolm Brinded has been appointed Chief Executive of Exploration and Production, a Managing Director of Shell Transport and Vice-Chairman of the Committee of Managing Directors. Malcolm Brinded resigned from his position as a Managing Director of Royal Dutch and has been appointed as a Managing Director of Shell Transport; he remains Chief Executive of Gas & Power. Tim Morrison, currently Group Controller, has also been appointed Acting Chief Financial Officer.
Restructuring
On October 28, 2004, the Royal Dutch and Shell Transport Boards announced that they had unanimously agreed to propose to their shareholders a transaction (the “Transaction”) through which each Parent Company will become a subsidiary of Royal Dutch Shell plc, which will become a publicly-listed company incorporated in England and Wales and headquartered and tax resident in The Netherlands (“Royal Dutch Shell”). Reflecting the existing 60:40 ownership by Royal Dutch and Shell Transport of the Group, it is
Discussion and Analysis of Financial Condition and Results of Operations 43
20-F/A (Amendment No. 2) 2002
Table of Contents
proposed that Royal Dutch shareholders will be offered 60% of the ordinary share capital in Royal Dutch Shell and Shell Transport shareholders will receive 40% of the ordinary share capital in Royal Dutch Shell. To implement the proposal, it is intended that (i) Royal Dutch Shell will make an offer to acquire all of the issued and outstanding ordinary shares of Royal Dutch in exchange for Royal Dutch Shell Class A ordinary shares or American depositary shares (“ADSs”) representing Royal Dutch Shell Class A ordinary shares and (ii) Royal Dutch Shell will become the parent company of Shell Transport pursuant to a United Kingdom reorganisational procedure referred to as a “scheme of arrangement” under section 425 of the UK Companies Act 1985, as amended. As a result of the scheme of arrangement, holders of Shell Transport ordinary shares (and holders of Shell Transport bearer warrants) will receive Royal Dutch Shell Class B ordinary shares and holders of Shell Transport ADSs will receive ADSs representing Royal Dutch Shell Class B ordinary shares. The Class A ordinary shares and Class B ordinary shares will have identical voting rights and will vote together as a single class on all matters, including the election of directors, unless a matter affects the rights of one class as a separate class. Class A ordinary shares and Class B ordinary shares will have identical rights upon a liquidation of Royal Dutch Shell and dividends declared on each will be equivalent in amount. However, for tax purposes, holders of Class A ordinary shares will receive Dutch source dividends, while holders of Class B ordinary shares will receive dividends that are UK source to the extent that these dividends are paid through a dividend access mechanism to be established. Implementation of the Transaction will be the subject of appropriate consultation with relevant employee representative bodies as required as well as the satisfaction of certain other conditions. It is currently expected that the Transaction will be completed in July 2005.
SUMMARY OF GROUP RESULTS
| Earnings (as restated) | ||||||||||||
| (US GAAP) | $ million | |||||||||||
| 2002 | 2001 | 2000 | ||||||||||
Net income | 9,656 | 10,301 | 12,813 | |||||||||
Change from previous year | -6% | -20% | +42% | |||||||||
2002 compared to 2001
The Group’s net income for the year was $9,656 million, showing a 6% decline from 2001. Despite a 6% increase in production volumes, earnings in Exploration and Production were weakened by lower gas realisations, higher depreciation and costs, as well as changes to the UK tax regime. Earnings were adversely affected in Gas & Power by lower liquefied natural gas (LNG) prices and in Oil Products by historically low refining margins and weaker marketing margins. Chemicals’ earnings were sharply up reflecting improved volumes, improved margins in associated companies, lower costs and an incremental tax credit.
Four major acquisitions were completed: Enterprise Oil (Enterprise) in the UK, DEA Oil (DEA) in Germany, and Pennzoil-Quaker State and the Texaco downstream assets in the USA. Total investment in these acquisitions, including acquired debt, was over $16 billion.
Total capital investment for the year amounted to $24.6 billion including acquisitions. Excluding major acquisitions, capital investment totalled $14.2 billion. At the end of the year, the debt ratio was 23.6% (2001: 8.9%) and cash, cash equivalents and short-term securities amounted to $1.6 billion (2001: $6.7 billion).
Hydrocarbon production was the highest in recent history at four million barrels of oil equivalent per day. Brent crude oil prices averaged $25.05 a barrel compared with $24.45 a barrel in 2001. Production constraints in some countries led to a steady price increase in the first three quarters of the year. Crude oil prices subsequently weakened only to rebound to $30 a barrel at the end of the year when Venezuelan supply was disrupted. In 2004, the Group restated oil and gas volumes to remove volumes from the proved category.
In Gas & Power, the LNG business continued to grow delivering record volumes, although lower realised gas prices led to a decline in earnings. Global demand for LNG remained firm. In Oil Products, industry refining margins over the year were poor, at their lowest for a decade, while marketing margins were squeezed by rising crude oil prices.
Chemicals saw some signs of improvement in the business environment but it was still a very challenging year due to difficult trading conditions, particularly in the USA. Industry utilisation rates remained flat in Europe but improved in the USA from historically low levels in 2001. Cracker margins in both regions were down from a year ago.
2001 compared to 2000
The Group’s net income for 2001 was $10,301 million, showing a 20% decline from 2000. Lower average crude oil prices in 2001 (a 15% decline from 2000) were partially offset by a 2% increase in production volumes. Earnings were positively affected in Gas & Power by higher LNG volumes and in Oil Products by cost reductions, partially offset by lower refining earnings. Despite
44 Discussion and Analysis of Financial Condition and Results of Operations
20-F/A (Amendment No. 2) 2002
Table of Contents
2001 being one of the most challenging years (due to difficult trading conditions) for the chemicals industry, the business remained profitable.
Cost of sales in 2001 were $10.0 billion lower than 2000, resulting mainly from a reduction in supply costs and lower operating expenses than in 2000, reflecting management focus on cost reductions.
Total capital investment for the year amounted to $11.8 billion. At the end of the year, the debt ratio was 8.9% (2000: 10.9%) and cash, cash equivalents amounted to $6.7 billion.
Total hydrocarbon production was at its highest levels in recent history at 3.8 million barrels of oil equivalent per day. Brent crude oil prices averaged $24.45 a barrel compared with $28.50 a barrel in 2000. Oil production fell by 2% because of natural decline in some fields, divestments and field performance. However, production of natural gas, for which demand is rising faster than that for oil, was 10% higher than in 2000. In Gas & Power, the LNG business continued to grow delivering record volumes, which reached 8.9 million tonnes in 2001. Global demand for LNG remained firm.
In Oil Products, the improved marketing performance due to lower costs of supplies in 2001 was partly offset by a decline in refining earnings. Crude oil and product prices were lower towards the end of 2001 compared to 2000. Trading conditions for the Chemicals business were challenging, especially in the USA, where the impact of falling demand was exacerbated by new capacity. Chemical volumes were essentially unchanged from 2000.
EXPLORATION AND PRODUCTION
Our Exploration and Production business searches for and recovers oil and gas around the world and in 2002 was active in more than 34 countries. The majority of these activities are carried out in ventures with external partners.
| Earnings (as restated) | ||||||||||||
| (US GAAP) | $ million | |||||||||||
| 2002 | 2001 | 2000 | ||||||||||
| Net proceeds (including inter-segment sales) | 26,581 | 25,847 | 27,570 | |||||||||
| Purchases (including change in inventories) | (1,050 | ) | (1,444 | ) | (1,038 | ) | ||||||
| Exploration | (1,073 | ) | (910 | ) | (836 | ) | ||||||
| Depreciation | (5,610 | ) | (3,969 | ) | (3,804 | ) | ||||||
| Operating expenses | (6,751 | ) | (5,474 | ) | (4,537 | ) | ||||||
| Operating profit of Group companies | 12,097 | 14,050 | 17,355 | |||||||||
| Group share of operating profit of associated companies | 1,316 | 1,548 | 2,005 | |||||||||
| Operating profit | 13,413 | 15,598 | 19,360 | |||||||||
| Other income/(expense) | 72 | 48 | 23 | |||||||||
| Taxation | (6,759 | ) | (7,735 | ) | (9,512 | ) | ||||||
Segment earnings | 6,726 | 7,911 | 9,871 | |||||||||
2002 compared to 2001
Earnings
Segment earnings for the year were $6,726 million, 15% lower than the prior year. This reflects the impact of lower gas price realisations, changes to the UK tax rates, higher depreciation and higher costs resulting from the acquisition of Enterprise Oil. These were partially offset by a 6% increase in hydrocarbon production (including the effect of the Enterprise acquisition) to four million barrels of oil equivalent per day (boe/d),2 the highest in recent years.
In 2002, the Group’s realised gas prices in the USA averaged $3.31 per thousand standard cubic feet compared with $4.44 in 2001. Outside the USA, realised gas prices were also lower than in 2001 and averaged $2.15 per thousand standard cubic feet, representing a 7% reduction from 2001 price of $2.30. Declines in market gas prices during 2002 contributed to the Group’s lower realised gas prices. In 2002, Henry Hub gas prices averaged $3.33 per million Btu, compared to $4.10 in the previous year when gas prices spiked to around $10 per million Btu during the 2000/2001 winter. The first three quarters of 2002 showed lower gas prices compared to 2001 due to the build up of storage.
In 2002, the Group’s realised oil prices for world outside USA averaged $23.54 a barrel compared with $23.19 in 2001, while USA realised oil prices averaged $22.72 a barrel compared with $22.14 in 2001. In 2002, Brent crude oil prices averaged $25.05 a barrel compared with $24.45 in the previous year. This was in line with sensitivity analyses developed in 2001, when
| 2 | For this purpose, the Group has converted natural gas to crude oil equivalent using a factor of 5,800 standard cubic feet per barrel. |
Discussion and Analysis of Financial Condition and Results of Operations 45
20-F/A (Amendment No. 2) 2002
Table of Contents
end year crude oil prices were at around $20 a barrel after September 11 but tightening of the global supply/demand balance was expected to increase prices. Brent crude oil prices recovered steadily in the first three quarters of the year from below $20 to exceed $30 a barrel reflecting production constraints in certain countries. Prices subsequently weakened only to rebound to $30 a barrel at the end of the year when supply from Venezuela was disrupted. Overall, levels of realised crude oil and gas prices in 2002 decreased segment earnings (after taxes) by approximately $600 million compared to 2001.
In addition to the lower gas price realisations, costs and depreciation were higher, with significant impacts related to the Enterprise Oil acquisition and approximately $170 million in feasibility study costs in the Sakhalin project (Russia). The increase in operating expenses also reflects unfavourable exchange rate movements of the US dollar against other major currencies, including the euro and the Pound sterling.
Segment earnings in 2002 were also negatively impacted by some $300 million of provisions for deferred taxation, resulting from a non-recurring charge due to fiscal changes in the UK.
Total hydrocarbon production for 2002 rose by 6%, comprising a 7% increase in oil production and a 4% increase in gas production. Oil production benefited from the acquisitions of Enterprise, an additional interest in the Draugen field in Norway and new fields in the USA and Denmark. These increases were partly offset by lower OPEC production quotas, normal field declines, and divestments in New Zealand and elsewhere. Gas production also increased as a result of the acquisition of Enterprise and from new fields in the USA. These increases were partly offset by decreases in production as a result of lower demand due to warmer weather in Europe; normal field declines in the USA and divestments in New Zealand. Excluding the contribution of Enterprise volumes, total hydrocarbon production was 1% higher in 2002 than 2001.
Portfolio actions
The acquisition of Enterprise in 2002 for cash consideration of $5.3 billion and the assumption of $2.4 billion of debt was the most significant change to strengthen the Group’s upstream portfolio, adding new developments and exploration acreage in several countries and contributing some $100 million to earnings and some $850 million to cash from operating activities.
These new assets provided an immediate boost to global production and are contributing an additional 240,000 boe/day. The portfolio was further enhanced by the acquisition of an increased stake in the Norwegian Draugen field where Group interest was increased by 10% to 26.2%. The North American gas portfolio was improved through the acquisition of new fields in the Pinedale, Wyoming area. The exploration portfolio was refreshed and achieved an exploration and appraisal global success-rate of some 55% including significant discoveries in the USA Gulf of Mexico, such as Great White, Deimos and Tahiti. In Kazakhstan, the Kashagan Field (Group interest 16.7%) was declared commercial, however, in the restated proved reserves figures contained herein, no proved reserves have been reflected pending government approval for the development. The more recent discovery of the Kalamkas field further underlines the immense potential of the Kazakhstan region. Major discoveries were also made in Brazil, Ireland and Nigeria. New exploration licences were acquired in geographic areas where the Group has strategic interests such as USA Gulf of Mexico and Norway.
The result of these portfolio actions, together with the Group’s ability to develop and implement technology strengthens the Group’s portfolio.
Capital investment
Capital investment of $14.1 billion was $6.1 billion higher than in 2001, mainly as a result of the acquisition of Enterprise ($5.3 billion) and increased investment in growth projects. These include the Athabasca Oil Sands Project in Canada and EA project in Nigeria, both of which began production late 2002, the offshore development Na Kika in the USA and Bonga in Nigeria. Work also began on the Goldeneye gas field in the North Sea, which is scheduled to start production in late 2004.
Reserves
As announced on January 9, 2004, March 18, 2004, and April 19, 2004, the Group reviewed its proved reserves inventory (with the assistance of external consultants) during the period from late 2003 to April 2004 (collectively, the First Half Review). Following the First Half Review, 4,474 million barrels of oil equivalent (boe)1 previously booked at December 31, 2002 as proved reserves have been recategorised as not proved (this was the subject of the announcement made on January 9, 2004, as updated on March 18, 2004 and April 19, 2004 and herein). The results of the First Half Review were reflected in the restatement of proved reserves and of the standardised measure of discounted future net cash flows contained in the 2003 Annual Report on Form 20-F as originally filed on June 30, 2004 (the First Reserves Restatement).
As announced on October 28, 2004, November 26, 2004 and February 3, 2005, the Group performed additional reviews of its proved reserves inventory (with the assistance of external consultants) during the period from July 2004 to December 2004
| 1 | For this purpose, the Group has converted natural gas to crude oil equivalent using a factor of 5,800 standard cubic feet per barrel. |
46 Discussion and Analysis of Financial Condition and Results of Operations
20-F/A (Amendment No. 2) 2002
Table of Contents
(collectively, the Second Half Review and, together with the First Half Review, the Reserves Reviews). As a result of the Second Half Review, 1.37 billion boe previously booked at December 31, 2003 (1.15 billion boe previously booked at December 31, 2002) as proved reserves have been recategorised as not proved (this was also the subject of the announcement made on February 3, 2005 and herein). These changes are reflected in the further restatement of proved reserves and the standardised measure of future cash flows contained herein (the Second Reserves Restatement and together with the First Reserves Restatement, the Reserves Restatement).
The impact of the Reserves Restatement, when taken together with production in 2002 (1.44 billion boe) and net additions to reserves in 2002 (1.39 billion boe) leads to proved reserves of 13.72 billion boe at December 31, 2002.
As at December 31, 2002, 82% of the de-booked proved reserves had originally been disclosed in the “proved undeveloped” reserves category; the balance was a reduction in the “proved developed” reserves category. Approximately 61% of the de-booked volumes relate to crude oil and natural gas liquids with the remaining 39% relating to natural gas.
As at December 31, 2002, proved reserves, excluding the impact of the Reserves Restatement, had been equivalent to 13.3 years of production. Including the impact of the Reserves Restatement, the figure was 9.5 years.
Reserves replacement
Including all effects of the Reserves Restatement, the net reserves addition in 2002 was 97% of 2002 production. This figure includes the effects of acquisitions and divestments. On an organic basis (not including acquisitions and divestments), the reserves addition was 49% of 2002 production. Oil sands, which have not been included in these figures, would have reduced the reserves replacement ratio by 5% if they had been included. The 1.39 billion boe addition in 2002 comprises revisions (189 million boe), improved recovery (153 million boe), extensions and discoveries (367 million boe) and acquisitions and divestments (686 million boe).
The overall proved reserves replacement ratio for the five years from 1998 to 2002 amounts to 68% taking into account all effects of the Reserves Restatement. This is clearly a concern and reflects the exploration strategy in the 1990s, and our relatively low investment in the post 1998 period. Exploration has since been refocused and investment levels increased. It is vital that our reserves replacement ratio improves significantly in the coming years.
2001 compared to 2000
Earnings
Segment earnings for the year were $7,911 million, 20% lower than in 2000. This reflects the impact of lower oil price realisations and increased depreciation and exploration expenses, partly offset by higher realised gas prices. Hydrocarbon production in 2001 was 2% higher than in 2000. The decline in earnings from 2000 also reflects gains in 2000 of $623 million, mainly reflecting profits on the sale of a number of assets in the USA, the UK and Australia.
In 2001, the Group’s realised oil prices outside the USA averaged $23.19 a barrel compared with $27.30 in 2000, while USA realised oil prices averaged $22.14 a barrel compared with $26.55 in 2000. Overall, the Group’s realised oil prices were 15% lower than in 2000. In 2001, Brent crude oil prices averaged $24.45 a barrel compared with $28.50 in the previous year. The lower crude oil price in 2001, compared to 2000, was mainly due to the deterioration of the global economy in 2001 and the resulting reduction in demand for crude oil.
In 2001, the Group’s realised gas prices in the USA averaged $4.44 per thousand standard cubic feet compared with $3.98 in 2000. Outside the USA, realised gas prices averaged $2.30 per thousand standard cubic feet compared to $2.20 in 2000. Overall, the Group’s average realised gas price was 7% higher in 2001 compared to 2000. Henry Hub gas prices averaged $4.10 per million Btu in 2001, compared to $4.25 in the previous year. The lower 2001 Henry Hub average price was mainly due to the fourth quarter 2000 peak price of $6.25 per million Btu when US gas stocks were at record low levels. Natural gas prices outside the USA remained linked to crude oil and LNG prices, and therefore in 2001 displayed similar volatility as in 2000, declining in the second half of the year. Overall, levels of realised crude oil and gas prices in 2001 decreased segment earnings (after taxes) by approximately $1,300 million compared to 2000.
Total hydrocarbon production increased by 2% in 2001 versus 2000 to 3.7 million boe/day.
Gas production increased by 10% to 1.5 million boe/d versus 2000, mainly as a result of the acquisition of Fletcher Challenge Energy (FCE) in New Zealand, new fields in the UK, USA and Egypt and higher demand in the Netherlands, UK and Nigeria. These increases were partly offset by natural declines in production in mature fields and divestments in the USA.
Oil production declined by 2% to 2.2 million boe/d, mainly as a result of declines in production in mature fields in the UK, USA, Gabon and Australia and divestments in USA and UK. There was also some disappointing field performance in the UK as a result
Discussion and Analysis of Financial Condition and Results of Operations 47
20-F/A (Amendment No. 2) 2002
Table of Contents
of unexpected downtime on certain production platforms. These decreases were partly offset by production volumes attributable to FCE acquired in the spring of 2001 and from fields that came on stream in the USA and UK.
Portfolio actions
The portfolio was enhanced by the acquisitions of FCE ($1 billion) in New Zealand and McMurry Energy Company (McMurry) ($300 million) in the USA. The acquisition of FCE strengthened the Group’s presence in Asia Pacific. McMurry added proved natural gas reserves in the Rocky Mountains. There were no significant divestments in 2001.
Capital investment
Capital investment of $8.0 billion was $3.2 billion higher than in 2000, as a result of the acquisitions of FCE and McMurry, as well as increased exploration and production activities, especially in Canada, the USA and Nigeria. Two major developments in the technologically demanding but high potential deepwater environment came on-stream in 2001. Brutus, the Group’s fifth successful tension-leg platform in the Gulf of Mexico (Group interest 100%), was completed ahead of schedule and below budget. Malampaya (Group interest 45%), located in 850 metres of water off the Philippines, came on-stream on time and within budget.
Reserves
After giving effect to the Reserves Restatement, the proved hydrocarbon reserves replacement ratio for 2001 was 93%. After giving effect to the Reserves Restatement (and excluding the effect of acquisitions and divestments), the proved hydrocarbon reserves replacement ratio for 2001 was 74%.
Outlook and strategy
We will retain our focus on maintaining and developing existing well-established areas while building new positions. Increased attention will remain on development of unconventional resources (for example, heavy oil) while retaining our strong positions in gas, which support our LNG position, and deepwater development. This work will take place in the context of increasing global hydrocarbon demand, driven by economic growth.
From 1983 through 2002 the Brent crude oil price has averaged around $20 a barrel, from 1998 through 2002 averaged approximately $22 a barrel and from 2000 through 2002 the price averaged $26 a barrel.
The Group uses a range of prices for crude oil to test opportunities on the downside and look at the upside of potential projects. This method is applied to understand the composition of projects in the portfolio and how these respond over a broad range of prices or margins. The crude oil price outlook for 2003 is uncertain and impacted by developments in the Middle East and Venezuela. The Group evaluates investments using multiple price conditions, including price conditions of less than $20 a barrel to assess the resilience of investments at low-price conditions.
Crude oil reference price conditions are determined after careful assessment of short, medium and long-term drivers of oil and gas prices under different sets of assumptions, yielding a range of prices to be used in evaluation. With regard to 2002, crude oil prices were higher than the conservative expectations of our reference price conditions but within the bounds of our sensitivity analyses. Historical analysis, trends and statistical volatility are part of this assessment, as well as analysis of global and regional economic conditions, geopolitics, OPEC actions, supply and demand. Sensitivity analyses are used to test the impact of low price drivers (economic weakness, rapid resumption of Iraqi production, greater than expected increase in non-OPEC production) and high price drivers (greater than expected economic growth, slower than expected resumption of Iraqi production). Short-term events (such as relatively warm winters or cool summers and the resulting effects on demand and inventory levels) contribute to volatility.
GAS & POWER
Our Gas & Power business liquefies and transports natural gas, and develops gas markets and infrastructure, including gas-fired power plants. It also markets and trades gas and electricity and converts natural gas to liquids to provide clean fuels. The majority of activities, in particular LNG, are carried out by associated companies.
48 Discussion and Analysis of Financial Condition and Results of Operations
20-F/A (Amendment No. 2) 2002
Table of Contents
| Earnings | ||||||||||||
| (US GAAP) | $ million | |||||||||||
| 2002 | 2001 | 2000 | ||||||||||
| Net proceeds (including inter-segment sales) | 17,612 | 16,426 | 16,487 | |||||||||
| Purchases (including change in inventories) | (16,444 | ) | (14,961 | ) | (15,236 | ) | ||||||
| Depreciation | (128 | ) | (106 | ) | (841 | ) | ||||||
| Operating expenses | (933 | ) | (821 | ) | (770 | ) | ||||||
| Operating profit of Group companies | 107 | 538 | (360 | ) | ||||||||
| Group share of operating profit of associated companies | 751 | 941 | 646 | |||||||||
| Operating profit | 858 | 1,479 | 286 | |||||||||
| Other income/(expense) | 124 | 132 | 89 | |||||||||
| Taxation | (208 | ) | (385 | ) | (263 | ) | ||||||
Segment earnings | 774 | 1,226 | 112 | |||||||||
2002 compared to 2001
Earnings
Segment earnings of $774 million in 2002 were 37% lower than the $1,226 million record reported in 2001. Lower earnings were mainly due to lower LNG prices and lower income from trading activities. The decrease in earnings compared with 2001 also reflects the receipt of a $77 million bonus (after taxes) in 2001 related to the sale in a prior year of midstream assets in the USA. Partially offsetting these negative impacts was the favourable impact of gains from asset divestments.
Our average realised LNG prices were 11% lower than 2001 as a result of the time-lagged effect on LNG prices of the decline in crude oil prices during the second half of 2001 and the first quarter of 2002 and a higher proportion of LNG sales on the spot market (which generally experienced lower prices than in the contract market) compared to 2001. This reduction more than offsets the record Group share LNG sales of 9.1 million tonnes, which was 3% higher than 2001. Increased sales came mainly from uncommitted capacity available from the Oman LNG plant (Group interest 30%) and from continued higher demand in Japan.
Results from trading activities were lower by $177 million (after taxes) primarily due to gas and power trading losses in North America. The power generation business saw increased capacity, improved operations and lower costs (mainly relating to assets outside the USA with long-term sales contracts) but these favourable impacts were more than offset by a $150 million write-down related to the Group’s carrying value of InterGen (an associated company, Group interest 68%) due to a reassessment of the impact of continued poor merchant power market conditions in the USA and UK.
Earnings included $163 million of gains from the sale of Shell’s direct and indirect interests in Midstream assets in Europe and the USA and a share of the Group’s interest in Brunei Shell Tankers.
Capital investment
Capital investment of $682 million in 2002 (including approximately $200 million in investments in associated companies) related mainly to LNG supply, shipping and re-gasification projects and power developments. This was $128 million lower than 2001 mainly as a result of lower investments in power ($143 million decline) and midstream assets ($127 million decline), partly offset by higher investments in LNG ($137 million increase). The increased investment in LNG related primarily to the re-gasification development project in India while the reduction in Power asset expenditure related mainly to InterGen. In support of the business’s global LNG strategy of linking new markets with the Group’s portfolio of LNG supply sources, two of the four new build LNG carriers were commissioned and delivered. Construction began on the Hazira Port and LNG terminal to access the growing Indian market.
Actions by associated companies
Gas & Power’s LNG business continued to grow, with new supplies targeting key markets, reinforcing Shell’s leading position in the industry. The North West Shelf joint venture (Group interest 22%) in Australia was selected to supply the first LNG to China through the import terminal in Guangdong Province. Additional sales agreements with Japanese utilities were completed for supplies from Malaysia Tiga (Group interest 15%) and the North West Shelf project. Malaysia Tiga’s two-train LNG plant is due to commence operations in 2003. In Australia, a 4.2 million tonnes per annum (mtpa) fourth train (the basic LNG processing unit) is under construction for completion in 2004 and will supply existing and new Japanese customers. Train 3 of Nigeria LNG (Group interest 26%) was completed in 2002, three months ahead of schedule and within budget. Additionally, Nigeria LNG secured a loan of over $1 billion, the largest ever project financing in Sub-Saharan Africa, towards the construction of a 4th and 5th train expansion. These two trains are due on stream in 2005 and will supply markets in the Atlantic Basin, bringing the annual capacity of the plant to 17 million tonnes and making it the third largest LNG facility in the world. In Venezuela, Shell was selected as a partner with Mitsubishi and PDVSA for the Mariscal Sucre LNG project (Group interest 30%). This project aims to develop
Discussion and Analysis of Financial Condition and Results of Operations 49
20-F/A (Amendment No. 2) 2002
Table of Contents
substantial gas resources in the Norte de Paria fields for both export and domestic markets. Successful development of the project is subject to the completion of project negotiations.
In addition, the Group is actively progressing access to the North American market through LNG terminal capacity at Cove Point and Elba Island in the USA, and other potential sites. Gas & Power’s other businesses also progressed during 2002. In the Middle East, significant progress was made towards the development of world-scale Gas to Liquids facilities.
In power, InterGen (Group interest 68%), a joint venture with Bechtel, started operations at projects in Turkey, Egypt and Mexico, increasing InterGen’s operational capacity by 70% during the year to 5.2 Gigawatts. There were long-term power purchase agreements in place for this new capacity.
Portfolio actions
As part of the business’s active portfolio management, half of the Group’s interest in Brunei Shell Tankers was divested, as was the 5% interest in HEIN GAS in Germany and part of the Group’s minority interest in other midstream assets in Germany. In 2002, the sale of the indirect 14.75% interest in Ruhrgas, for some€1.5 billion, was agreed. In March 2003, the sale was closed. In 2002, InterGen completed the sale of its onshore Texas pipelines.
2001 compared to 2000
Earnings
Segment earnings for 2001 of $1,226 million were a record, and compared with $112 million reported in 2000, which included a write down of US onshore pipeline assets ($672 million) as a result of portfolio restructuring. The higher earnings in 2001, excluding the impact of the write down in 2000, were mainly due to growth in LNG volumes at the Nigeria and Oman facilities that came on-stream in 2000. Higher income from the marketing and trading business and receipt in 2001 of a $77 million bonus (after taxes) related to the sale in a prior year of midstream assets in the USA also contributed to the increase in segment earnings. These improvements were partly offset by lower results in power generation, which reflected turbine problems at a UK plant, and higher project development costs associated with growing the Gas & Power business.
The larger contribution to earnings from LNG reflected a 19% increase in equity LNG sales volumes, which reached 8.9 million tonnes in 2001, compared to 7.5 million tonnes in 2000. Average realised LNG prices in 2001 were $4.31 per million Btu.
Capital investment
Capital investment totalled $810 million (including approximately $470 million in investments in associated companies) in 2001 and related to LNG projects, LNG shipping, power developments, offshore pipelines in the USA and the acquisition of equity stakes in gas distribution companies in Egypt and Greece. Capital investments were $327 million higher than 2000 as a result of higher investments in LNG ($170 million increase), midstream assets (principally pipelines and gas distribution assets) ($59 million increase) and power ($169 million increase), partly offset by lower investments in related businesses ($71 million decrease).
The portfolio of LNG supply projects continued to grow during 2001. Final Investment Decision was taken by the Group in the first quarter of 2001 on a fourth train with a capacity of 4.2 million tonnes per annum in Australia for the North West Shelf project for start up in 2004 (initial Group investment: $250 million through the end of 2004). In addition, the Group won bids for the refurbishment of two power projects in Nigeria.
Actions by associated companies
Shell also secured access to several emerging LNG markets, including capacity rights in re-gasification terminals close to growing gas markets such as Cove Point and Elba Island in the USA. Construction began in 2001 on the Hazira terminal in Gujarat to supply the growing Indian market.
During 2001, four new power plants in the USA, UK, Australia and China were commissioned by InterGen, an associated company (Group interest 68%), with twelve more plants under construction. Two power plants designed to supply electricity during peak demand periods were commissioned to supply the growing energy market in California. These were the first to be approved under the California Energy Commission’s emergency procedures. In the first quarter of 2002, Kinder Morgan purchased InterGen’s Tejas Gas pipeline and storage system.
Outlook and strategy
Demand for natural gas is expected to grow at a faster rate than crude oil over the next decade, driven by its economic and environmental advantages, particularly in power generation. LNG is expected to expand at double the rate of overall gas growth due to its delivery flexibility and competitive costs. Demand for LNG in Southern Europe is expected to grow rapidly to meet rising power demand. In North America, LNG is expected to play an increasingly important role as domestic gas supply struggles to meet demand. In Asia Pacific, strong long-term LNG growth in emerging gas markets such as China and India is expected to
50 Discussion and Analysis of Financial Condition and Results of Operations
20-F/A (Amendment No. 2) 2002
Table of Contents
complement renewed growth in the world’s largest LNG market, Japan, especially if nuclear power generation does not materialise. In the short term, economic weakness and uncertainty may continue to constrain gas growth in some markets and success in emerging markets may at times be slow and not without economic risk. However, over the longer term, the abundance and flexibility of gas is expected to make it the preferred fuel for power generation, heat and the production of ultra-clean liquid fuels.
In close alignment with Exploration and Production, Gas & Power intends to develop opportunities provided by the growing penetration of natural gas in world energy markets. The Gas & Power business focuses on accessing gas markets in order to accelerate the monetisation of existing fields and secure new upstream resources. We will continue to strengthen and develop our leading role in LNG, mainly through associated companies, building on our strong commercial relationships. Over the next three years, five new LNG trains in associated companies in Malaysia, Australia and Nigeria will significantly increase the Group’s share of worldwide LNG capacity. New technologies such as Gas to Liquids will be developed to provide additional income streams. As a number of power markets may continue to face near-term over-supply, parts of our portfolio may continue to see depressed returns. Over the long term, selective power investments that enable or add value to gas monetization remain an appropriate part of our strategy. The same is the case for selective midstream (pipeline and gas storage) opportunities. Our gas marketing and trading businesses will be used to secure customers for long-term sales agreements and increase the return from our gas sales.
OIL PRODUCTS
Our Oil Products business markets fuels and lubricants for domestic and industrial use and for the range of transport modes from road to shipping and aviation. It also refines, supplies, trades and ships crude oil and petroleum products around the world and provides technical consultancy and research services.
| Earnings (as restated) | ||||||||||||
| (US GAAP) | $ million | |||||||||||
| 2002 | 2001 | 2000 | ||||||||||
| Net proceeds (including inter-segment sales) | 138,624 | 95,625 | 106,282 | |||||||||
| Purchases (including change in inventories) | (120,493 | ) | (83,037 | ) | (92,603 | ) | ||||||
| Gross margin | 18,131 | 12,588 | 13,679 | |||||||||
| Depreciation | (2,406 | ) | (1,617 | ) | (2,590 | ) | ||||||
| Operating expenses | (12,537 | ) | (8,490 | ) | (8,158 | ) | ||||||
| Operating profit of Group companies | 3,188 | 2,481 | 2,931 | |||||||||
| Group share of operating profit of associated companies | 556 | 241 | 1,232 | |||||||||
| Operating profit | 3,744 | 2,722 | 4,163 | |||||||||
| Other income/(expense) | (50 | ) | (62 | ) | 57 | |||||||
| Taxation | (1,067 | ) | (690 | ) | (1,539 | ) | ||||||
Segment earnings | 2,627 | 1,970 | 2,681 | |||||||||
2002 compared to 2001
Earnings
Segment earnings for the year were $2,627 million compared with $1,970 million in 2001, an increase of 33%. This increase reflects primarily inventory holding gains resulting from FIFO accounting and to a lesser extent contributions to earnings resulting from the three acquisitions completed during the year of DEA in Germany and Pennzoil-Quaker State Company (PQS) and the Texaco downstream assets in the USA. These increases were partially offset by the general deterioration in the business environment that began in late 2001. A weak global economy reduced demand for oil products, together with rising oil prices, put pressure on refining and marketing margins. Refining margins recovered temporarily in October and November when the seasonal product demand increase coincided with falling crude oil prices.
In 2002, net proceeds increased by some $1 billion outside the USA and some $42 billion in the USA. This increase in the USA largely reflects a $43 billion change in proceeds associated with the acquisition of Texaco’s interests in Equilon Enterprises (previously accounted for as an associated company) and the fourth quarter acquisition of PQS. Gross margin (calculated as net proceeds minus purchases) similarly increased by some $5 billion in large part due to the US acquisitions in 2002.
Operating expenses increased by $4,047 million and depreciation by $789 million primarily in the USA as a result of the consolidation of the 2002 acquisitions. As a percentage of gross margin, operating expenses increased by two percentage points while depreciation remained fairly flat. The increase in operating expenses and depreciation in the USA was offset slightly by
Discussion and Analysis of Financial Condition and Results of Operations 51
20-F/A (Amendment No. 2) 2002
Table of Contents
lower restructuring charges in 2002, as 2001 included $219 million (after taxes) charge related to the acquisition of the Texaco downstream assets (which acquisition was agreed to in 2001 and completed in February 2002).
Capital investment
Capital investment in 2002 amounted to $7.9 billion which included $5.1 billion relating to the three major acquisitions and an increase in non-acquisition capital investment of $0.8 billion, which accompanied the consolidation of Equilon Enterprises (Group interest now 100%). This reflects an increase in underlying capital investment of $500 million versus investment levels in 2001 of $1.5 billion. This additional capital investment was predominantly made in Europe for refinery upgrades.
Portfolio actions
The Oil Products portfolio was strengthened in 2002 through the acquisitions of DEA in Germany and PQS and the Texaco downstream assets in the USA, which will reinforce the Group’s objective of being the leading global downstream company.
In January 2002, Oil Products formed a 50:50 joint venture in Germany with RWE-DEA and in July the Group took ownership of 100% of the venture for cash consideration of $1.3 billion, payable in July 2003.
The acquisition of the Texaco downstream assets in the USA was completed in February 2002. Business structures have been streamlined and some 800 of the Texaco stations have been rebranded to Shell at the end of 2002, which reflects approximately 10% of the rebranding programme that is expected to be completed by the end of 2004. As part of the upgrading of the quality of the overall retail network in the USA, the total number of combined Texaco and Shell sites will be reduced by some 30%.
The purchase of PQS in the USA was completed in October 2002 after regulatory clearance. The transaction has a total equity value of $1.9 billion and the Group has also taken on $1.3 billion of debt. The acquisition will make Shell a leader in both the US and global lubricants markets. The transaction resulted in the recognition of $1.7 billion of goodwill, reflecting strong positions in a variety of market channels.
2001 compared to 2000
Earnings
Segment earnings for the year were $1,970 million representing a decline of 27% from 2000. This decrease reflected a deterioration in the business environment for oil products following the general economic slowdown in fourth quarter offset in part by cost reduction efforts during the year.
Refining margins came under pressure, particularly in the second half of the year as a result of lower demand due to the economic slowdown, a consequent rise in stocks and increased competition exacerbated by surplus industry capacity. Industry refining margins in Rotterdam and the USA were on average 50% lower in the fourth quarter of 2001 than they were in the first quarter of that year.
Outside the USA, earnings decreased by 8% or $181 million in 2001 versus 2000. In the USA earnings declined by some $529 million or 143%, largely a result of lower earnings in the Equilon and Motiva joint ventures. Contributing to this decline in US associated company income were restructuring and re-branding expenses connected with the acquisition of Texaco’s interests in the Equilon and Motiva joint ventures ($219 million).
In 2001, net sales proceeds declined by some $10 billion outside the USA and some $0.3 billion within the USA. The decline in both regions reflects the reduction in margins and sales volumes during the year. Increased operating expenses of $332 million (or 4%) impacted 2001 earnings negatively, with the majority of this increase relating to Europe. In total, operating expenses increased as a percentage of gross margin to 67% in 2001 from 60% in 2000, with the majority of this increase coming from businesses outside the USA. Depreciation declined in 2001 compared to 2000, reflecting impairment charges of $824 million, mainly relating to the Rayong refinery as a result of the downward revision in 2000 of the long-term expectations for certain refinery margins.
Capital Investment
Capital investment for 2001 totalled $1,518 million, compared with $1,565 million in 2000. The investment focus in 2001 was on marketing operations in key countries. In 2001, these accounted for $1,102 million of the total, predominantly for retail network expansion in all regions, while $360 million was spent on refining assets, primarily on network-wide integrity work and on modifications to the Scotford refinery in Canada, and $56 million on investment in associated companies. Spending increases in Europe were more than offset by reductions in the USA and Asia Pacific.
52 Discussion and Analysis of Financial Condition and Results of Operations
20-F/A (Amendment No. 2) 2002
Table of Contents
Portfolio Actions
The Oil Products portfolio was strengthened by a number of acquisitions in 2001. In December 2001, regulatory approval was received for a 50:50 joint venture with RWE AG in Germany. In early 2002, the Group acquired the Texaco downstream assets in the USA and announced in March 2002 that it had entered into an agreement to acquire Pennzoil-Quaker State Company in the USA.
Outlook and strategy
Oil demand growth was exceptionally weak in 2002 at just under 0.2 million barrels/day due to a slow economic recovery in the USA and a first quarter mild winter, and fell well below the average annual increase of 1.0 million barrels/day for the past ten years. Demand growth for 2003 is expected to move closer to this ten-year average, but there are more uncertainties than usual given continued weakness of equity markets, risk of further terrorist actions, impact of high oil prices due to supply disruptions from Venezuela and Iraq and a tight OPEC supply policy. Refining margins are expected to recover modestly from the low levels in 2002 with improved product demand but much will depend on crude oil supply availability, the severity of the northern hemisphere winter and the pace of global economic recovery, particularly in the USA. Refining margin levels in Asia Pacific are likely to continue to be depressed by surplus refinery capacity in the region. Marketing margins will remain subject to competitive pressures in individual markets and to the direction of crude oil price and exchange rate movements.
Potential risks to future earnings centre around the successful integration of our acquisitions, the economic recovery in major markets in Latin America and the performance of the US dollar against other major currencies. Continued improvement in refinery reliability and cost discipline will also have a significant effect on our ability to deliver sustained future earnings.
Our Oil Products business will continue to focus on ways of meeting the needs of millions of Shell customers around the world. This will include continuing to develop new products such as differentiated retail fuels. We will progress the integration of the acquisitions of PQS and the Texaco downstream assets in the USA, and DEA in Germany and will continue to focus on upgrading the portfolio. Of particular emphasis in 2003 and 2004 will be the divestment of non-performing assets. We will continue to pursue cost-reduction programmes, while remaining committed to further improvement in environmental performance and continued development of the employee talent base.
CHEMICALS
Our Chemicals business produces and sells petrochemicals including polyolefins to industrial customers globally. Chemicals’ products are widely used in plastics, coatings and detergents, which in turn are used in products such as fibres and textiles, thermal and electrical insulation, medical equipment and sterile supplies, computers, lighter and more efficient vehicles, paints and biodegradable detergents.
| Earnings (as restated) | ||||||||||||
| (US GAAP) | $ million | |||||||||||
| 2002 | 2001 | 2000 | ||||||||||
| Net proceeds (including inter-segment sales) | 15,207 | 14,250 | 16,307 | |||||||||
| Purchases (including change in inventories) | (12,035 | ) | (11,041 | ) | (11,120 | ) | ||||||
| Depreciation | (401 | ) | (404 | ) | (724 | ) | ||||||
| Other cost of sales | (1,518 | ) | (1,866 | ) | (2,190 | ) | ||||||
| Operating expenses | (815 | ) | (973 | ) | (1,334 | ) | ||||||
| Operating profit/(loss) of Group companies | 438 | (34 | ) | 939 | ||||||||
| Group share of operating profit/(loss) of associated companies | 213 | (27 | ) | 240 | ||||||||
| Operating profit/(loss) | 651 | (61 | ) | 1,179 | ||||||||
| Other income/(expense) | (13 | ) | (4 | ) | 15 | |||||||
| Taxation | (73 | ) | 192 | (161 | ) | |||||||
Segment earnings | 565 | 127 | 1,033 | |||||||||
2002 compared to 2001
Earnings
The business environment for chemicals showed some improvement after the extremely challenging conditions in 2001 although trading conditions, especially in the USA, remained difficult. Segment earnings of $565 million were a significant improvement compared with $127 million the previous year.
Discussion and Analysis of Financial Condition and Results of Operations 53
20-F/A (Amendment No. 2) 2002
Table of Contents
Operating profit from Group companies increased by $472 million primarily due to lower fixed costs and higher sales volumes, partly offset by a decline in unit margins (defined as proceeds less cost of feedstock, energy and distribution divided by sales volumes). In addition for certain inventories in North America, Shell has changed the method of inventory costing from the last-in first-out to the first-in first-out method. The cumulative impact on operating profit in 2002 relative to 2001 was an increase of $275 million. Industry utilisation remained flat in Europe, but improved in the USA from historically low levels in 2001. Lower gas feedstock prices relative to crude oil prices in the USA made the economics of cracking liquid feedstocks less favourable. Fixed costs decreased from 2001 and reflected portfolio changes including the effects of prior year divestments (approximately $60 million), lower planned asset maintenance expenditure (approximately $40 million) and reduced information technology costs (approximately $35 million). Total unit costs, excluding feedstock costs, improved by 7% versus 2001 mainly as a result of higher volumes and lower fixed costs. The benefit of volume growth, mainly from new production capacity coming on stream, was partially negated by depressed unit margins thus making a net contribution of some $50 million to operating profit. In 2002, Chemicals earnings include $62 million of charges for asset rationalisation, mainly related to plant closures.
Group share of operating profit from associated companies increased by $240 million. This reflected a recovery in polyolefins margins relative to 2001, when margins were very depressed and margin improvements from low cost supply positions in the Middle East. In addition, associate earnings benefited from cost reductions, primarily in Basell, the 50:50 joint venture with BASF.
Taxation for the year included a credit of $102 million (2001: $65 million) associated with the reassessment of the Group’s ability to utilise prior year tax losses upon the formation of Shell Chemicals Europe B.V. Excluding these and the effects of divestments in 2001, the higher tax rate in 2002 was associated with the incidence and the nature of taxable gains and losses generated by the Chemicals business.
Capital investment
Capital investment in 2002 totalled $839 million compared with $751 million in 2001. Approximately half of the capital investment was related to regulatory compliance, maintenance and upgrading of existing facilities. The remainder was for new projects to manufacture and sell bulk petrochemical building blocks to large industrial customers. Some 20% of the capital expenditure was new investment in associated companies and included the initial equity investment in southern China for the Nanhai petrochemicals project.
Portfolio actions
After a period when the focus has been on restructuring (including divestments), attention in 2002 turned to strengthening and enhancing the retained Chemicals portfolio.
The final investment decision on the Nanhai petrochemicals project in Guangdong in China was taken. The Group has a 50% share in this $4.3 billion project, which constitutes its largest ever single Chemicals investment. Construction work is due to start in 2003, with the plant scheduled to be completed in late 2005. A key challenge for Chemicals is the management of the uncertainties inherent in projects as large and complex as those it typically undertakes. Project management processes are used on projects of this type, whereby risks are closely monitored and actions taken to mitigate as appropriate.
In 2002, Chemicals brought on-line some 2 million tonnes of new production capacity, which is approximately equal to 9% of the Group’s operated production capacity in that year. Successful completion of a fourth olefins and alcohols unit at Geismar in the USA consolidated the Group’s position as one of the world’s largest suppliers of higher olefins and detergent alcohols. The $500 million Ellba Eastern complex in Singapore started operation. This is a 50:50 joint venture with BASF to produce styrene monomer, propylene oxide and polyolefins.
A new benzene unit in the Netherlands was completed ahead of schedule. The plant uses new technology to minimise environmental impact and help reduce transportation of benzene in the Group’s European businesses. The unit will take benzene-rich streams from the Moerdijk cracker and other Shell European locations and the output will be used for styrene monomer/propylene oxide production on the same site.
Construction started at the new polymer polyol plant at Pernis in the Netherlands. The plant, which is expected to be completed in 2003, will be the largest in Europe and will consolidate the Group’s position as a leader in the global polyols market. A joint venture (Group interest 50%) was established with SGF Chimie to build and operate a polytrimethylene terephthalate plant in Montreal, Canada. These products are used in carpeting and textiles. The plant is expected to start production at the end of 2003.
The drive to simplify and streamline business processes and to make it easy to do business with Shell Chemical companies continued. A single marketing and supply company for Europe was established in order to improve speed and efficiency for customers and suppliers.
54 Discussion and Analysis of Financial Condition and Results of Operations
20-F/A (Amendment No. 2) 2002
Table of Contents
2001 compared to 2000
Earnings
Despite 2001 being one of the most challenging years for the chemical industry, the business remained profitable with segment earnings of $127 million compared with $1,033 million the previous year.
Operating profit from Group companies declined by $973 million with the largest decreases in lower olefins (approximately $400 million) and styrene monomer propylene oxide (approximately $130 million). Unit margins were lower in most businesses, particularly in the USA. Underlying volumes (excluding feedstock trading and divested businesses) were in line with the previous year despite weak markets. In the USA, Shell cracker margins were weak and were also impacted by a mid year reversal of the normally favourable economics of the liquid feedstocks used by Shell crackers. Cracker margins in Europe, although generally lower than in 2000, were more favourable than in the USA.
Group share of operating profit from associated companies was a loss of $27 million as trading conditions were particularly difficult in polyolefins as surplus industry capacity resulted in reduced operating rates leading to a decline in industry unit margins.
Portfolio actions
The large-scale divestment programme announced in 1998, leading to a significant restructuring of the chemicals business and a reduction in capital employed from $12.7 billion to $8.5 billion, was essentially completed in early 2001. The $15 million acquisition of the Yabucoa refinery in Puerto Rico was made at the end of 2001, improving the supply of feedstocks to Shell operations in Texas and Louisiana. Construction continued on the expansion of higher olefins and alcohols production capacity at the Geismar Louisiana site with project completion expected in mid year 2002. Additionally, work progressed on the construction of a new styrene monomer and propylene oxide plant in Singapore (Ellba Eastern a 50:50 joint venture with BASF). Basell, the 50:50 joint venture with BASF, announced restructuring plans involving the closure of polyolefin capacity at the Wilton UK site and the shutdown of two facilities in Tarragona Spain. In addition, cost reductions and manufacturing improvement projects were undertaken.
Outlook and strategy
Industry operating rates were at historically low levels in 2001 with some recovery in 2002. The outlook for the Chemicals business remains uncertain and further improvement in 2003 will depend upon global economic growth leading to higher product demand against a background of limited investment in additional industry capacity. These risks combined with the potential for high and volatile energy prices may delay improvements in asset utilisation and profitability. Asia remains the main source of greatest anticipated growth. Enhanced customer service, low cost and asset utilisation remain the central contributors to business resilience in a demanding climate.
Over the medium term, Shell Chemical companies are seeking to be among the best performers in petrochemicals, in line with the industry’s top quartile performers. We will focus on crackers and first-line derivatives, delivering bulk petrochemicals to large industrial customers. Lower total delivered cost will be achieved through a combination of advantaged feed, scale, integration and technology. The commitment to contribute to sustainable development will be maintained to ensure longer term value creation.
OTHER INDUSTRY SEGMENTS
Other industry segments include Renewables, Shell Consumer and Shell Hydrogen. Renewables works to develop significant commercially viable businesses based on renewable sources of energy, including wind and solar power. Shell Consumer is delivering a range of products and services to individual customers. Shell Hydrogen works to develop business opportunities in hydrogen and fuel cell technology.
| (US GAAP) | $ million | |||||||||||
| 2002 | 2001 | 2000 | ||||||||||
Segment earnings | (110 | ) | (287 | ) | (12 | ) | ||||||
2002 compared to 2001
The smaller loss in 2002 compared to 2001 principally reflects a smaller loss in Shell Consumer. Capital investment for 2002 totalled $329 million, including $142 million relating to the acquisition of solar assets and $157 million for the acquisition of two wind parks in the USA.
2001 compared to 2000
Earnings declined to a $287 million loss compared to a loss of $12 million in 2000 principally as a result of increased overall spending in 2001 on business development activities in Renewables, Hydrogen, Capital, Consumer and Internet Works, and charges in 2001 relating to a writedown of assets prior to disposal and a gain in 2000 on the divestment of coal operations.
Discussion and Analysis of Financial Condition and Results of Operations 55
20-F/A (Amendment No. 2) 2002
Table of Contents
CORPORATE
Corporate is a non-operating segment consisting primarily of interest expense on Group debt and certain other non-allocated costs of the Group.
| (US GAAP) | $ million | |||||||||||
| 2002 | 2001 | 2000 | ||||||||||
Segment earnings | (751 | ) | (320 | ) | (825 | ) | ||||||
2002 compared to 2001
Segment earnings for 2002 showed a loss of $751 million compared with $320 million in the previous year. The increased loss is mainly a result of higher net interest costs, reflecting the increase in debt as a result of the 2002 acquisitions.
2001 compared to 2000
In 2001, the segment losses of $320 million were an improvement over the $825 million loss recorded in 2000, reflecting reduced net interest expense from 2000, favourable currency exchange effects and the endowment of The Shell Foundation in 2000.
Earnings in 2000 included a charge of $174 million ($250 million before tax) related to the endowment of The Shell Foundation. The Foundation has been established and incorporated as a charitable company in May 2000 to reinforce and complement the Group’s business approach to sustainable development and social performance. The purpose of the endowment was to provide resources which the Foundation could use to fund its programmes. The Foundation pursues its objectives through grants made through its Sustainable Energy Programme, Sustainable Communities Programme and the Youth Enterprise Programme. The Board of the Foundation consists of 6 members (called Trustees), three of whom are not otherwise affiliated with the Group.
LIQUIDITY AND CAPITAL RESOURCES
2002 compared to 2001
Statement of Cash Flows
Cash flow provided by operating activities decreased to $16.3 billion in 2002 from $16.9 billion in 2001, or 3.6%, while net income decreased to $9.7 billion from $10.3 billion, or 6.3%. The primary factors causing the 2002 change in cash flow provided by operating activities were weakness in both refining and marketing margins in Oil Products and lower realised gas prices, partially offset by higher crude oil prices and higher hydrocarbon production volume. Additionally, $1.6 billion of cash flows were realised from sales of assets in 2002 ($1.8 billion in 2001).
Cash inflow during 2002 has been deployed mainly in investments, with capital expenditure and new investments in associated companies of $13.4 billion and acquisition expenditures accounting for a further $9 billion, comprising the purchases of Enterprise Oil ($5 billion cash consideration), Pennzoil-Quaker State ($2 billion cash consideration) and Texaco’s downstream assets in the USA ($2 billion cash consideration). Capital expenditure and new investments in associated companies in 2001 was $10.7 billion and included acquisitions of Exploration and Production companies Fletcher Challenge Energy ($1.0 billion) and McMurry ($0.3 billion).
Other major uses of funds were dividends paid to Parent Companies ($7.0 billion in 2002 compared to $9.4 billion in 2001) and net purchases of Parent Company shares for stock option and other incentive compensation programs of $0.9 billion. Royal Dutch and Shell Transport paid dividends to their shareholders totaling $5.5 billion and executed share buybacks of $1.3 billion in 2002 compared to $5.1 billion and $4.0 billion, respectively, in 2001. The net effect of the flow of funds for 2002 was a decrease of $5.1 billion in cash and cash equivalents and a net increase in short and long-term debt of $6.7 billion.
Outlook
In general, the most significant factors affecting year-to-year comparisons of cash flow provided by operating activities are changes in realised prices for crude oil and natural gas, crude oil and natural gas production levels and refining and marketing margins. These factors are also the most significant affecting net income. Acquisitions, such as Enterprise and Pennzoil Quaker State, and divestments, such as Ruhrgas, can affect the comparability of cash flows in the year of the transaction. On a longer term basis, the ability to replace proved reserves that are produced affects cash provided by operating activities, as well as net income.
Because the contribution of Exploration and Production to earnings is significantly larger than the Group’s other businesses, changes affecting Exploration and Production, particularly changes in realised crude oil and natural gas prices and production levels, have a significant impact on overall Group results. While Exploration and Production benefits from higher realised crude oil and natural gas prices, the extent of such benefit (and the extent of a detriment from a decline in these prices) will be dependent
56 Discussion and Analysis of Financial Condition and Results of Operations
20-F/A (Amendment No. 2) 2002
Table of Contents
on the extent to which the prices of individual types of crude oil follow the Brent benchmark, the dynamics of production sharing contracts, the existence of agreements with governments or national oil companies that have limited sensitivity to crude oil price, tax impacts, the extent to which crude oil price changes flow through into operating costs and the impacts of natural gas prices (for example, in 2002, average realised crude oil prices rose, while average realised natural gas prices fell). Accordingly, changes in benchmark prices for crude oil and natural gas only provide a broad indicator of changes in the earnings experienced in any particular period by Exploration and Production.
In Oil Products, our second largest business, decreases in crude oil and natural gas prices can generally be expected to lead to short-term increases in refining and marketing margins at the time the change occurs, while increases generally result in lower margins. However, this relationship is complex, and the impact and timing of any particular change will depend upon whether and when prices of specific grades of refined products follow benchmark crude oil prices, as well as local market factors including the actions of competitors and the availability of supply of particular grades of refined oil products in the relevant market. In addition, there do not exist commonly agreed benchmarks for refinery and marketing margins, to the same extent that Brent crude oil prices and Henry Hub natural gas prices, in the USA, serve as benchmarks in the Exploration and Production business.
In the longer term, reserve replacement will affect the ability of the Group to continue to maintain or increase production levels in Exploration and Production, which in turn will affect the Group’s cash flow provided by operating activities and net income. After giving effect to the Reserves Restatement, the Group’s five year reserves replacement ratio for the period 1998-2002 was 68%. The field decline rate for Exploration and Production’s existing business is approximately 6 to 8 percent per year. The Group will need to take measures to maintain or increase production levels and cash flows in future periods, which measures may include developing new fields, continuing to develop and apply new technologies and recovery processes to existing fields, and making appropriate acquisitions. The Group strives to offset the effects of field decline through these measures and, as a result, production increased in 2001 and 2002. The Group’s goal is to offset declines from production and increase reserve replacements. However, volume increases are subject to a variety of risks and other factors, including the uncertainties of exploration, project execution, operational interruptions, reservoir performance and regulatory changes. The Group currently expects overall production to dip in 2005 and then to increase beginning in 2006 as additional production from new projects begin to come on-stream.
The Group has a diverse portfolio of development projects and exploration opportunities, which helps mitigate the overall political and technical risks of Exploration and Production and the associated cash flow provided by operating activities. As a result of its financial strength and debt capacity, the risk associated with failure or delay of any single project would not have a significant impact on the Group’s liquidity or ability to generate sufficient cash flows for operations and fixed commitments.
It is the Group’s intention to continue to divest and, where appropriate, acquire assets as part of active portfolio management. However, the Group does not generally expect that the purchase and sale of assets in the normal course of business will have a significant effect on cash flow provided by operating activities. The amount of divestments will depend on market opportunities and therefore all related assets have not yet been recorded as assets held for sale. During the second quarter of 2002, an agreement to divest the Group’s 14.75% interest in Ruhrgas for consideration of approximately€1.5 billion was announced. This transaction was completed in March 2003.
The Group manages its portfolio of businesses to balance cash flow provided by operating activities against uses of cash over time based on conservative assumptions relating to crude oil prices relative to average historic crude oil prices. From 1983 through 2002, the Brent crude oil price has averaged around $20 a barrel, from 1998 through 2002, it averaged approximately $22 a barrel and from 2000 through 2002 the price averaged almost $26 a barrel.
As described in Note 2(a) to the Group Financial Statements the treatment of exploration costs has been changed such that certain costs that had previously been capitalised for longer than 12 months following the completion of exploratory drilling are now expensed. In connection with this change in accounting treatment, certain costs were reclassified from capital expenditures to exploration expense. This change in accounting treatment does not impact cash flows and is not anticipated to affect the future levels of exploration investment. In addition, this change in accounting treatment will mean that in future years drilling costs for some wells will be expensed earlier than in the past. The effect of this change on net income and depreciation, depletion and amortisation will depend on the actual exploration success and the timing of the progression of development projects associated with exploratory drilling.
Financial condition and liquidity
Cash and cash equivalents amounted to $1.6 billion at the end of 2002, compared to $6.7 billion at the end of 2001, principally reflecting the acquisition activity during 2002. Total short and long-term debt increased $13.9 billion between 2001 and 2002, reflecting additional borrowings of $6.7 billion and assumed debt of companies acquired in 2002. Maturing long-term debt in the next twelve months is $2.2 billion, whilst commercial paper borrowings, which are short term, totalled $7.7 billion at the end of 2002.
Discussion and Analysis of Financial Condition and Results of Operations 57
20-F/A (Amendment No. 2) 2002
Table of Contents
The Group currently maintains $2.3 billion of committed bank facilities to provide full back-up coverage of commercial paper maturing within 30 days. The maturity profile of the Group’s outstanding commercial paper is managed to ensure that the amount of commercial paper maturing within 30 days does not at any point in time exceed the amount available from internal liquidity and under the back-up facilities. These committed facilities, which are with a number of international banks, are renewed on an annual basis. The Group expects to be able to renew these facilities on commercially acceptable terms. The Group expects that commercial paper issuances in 2003 could range up to $9.0 billion, with maturities of up to 12 months.
A debt covenant (interest cover ratio) on $1.3 billion of non-recourse debt within a Group company was breached in 2001. This breach is continuing and the company has defaulted on $115 million of scheduled principal payments during 2002. As this debt is non-recourse, the breach has had no impact on the Group’s other borrowing arrangements. Total debt at the end of 2002 amounted to $19.7 billion and the Group’s debt ratio (defined as total debt as a percentage of capital employed) increased from 8.9% in 2001 to 23.6% in 2002. The level of the debt ratio remains in accordance with the medium-term gearing philosophy of the Group, which targets a gearing between 20%-30%. The total debt outstanding (excluding capital leases) at December 31, 2002 will mature as follows: 67% in 2003, 6% in 2004, 5% in 2005, 7% in 2006 and 15% in 2007 and after.
Credit Ratings
On April 19, 2004, Standard & Poor’s Ratings Services (S&P), downgraded to “AA+” from “AAA” its long-term ratings on the Royal Dutch/ Shell Group of Companies (through a downgrade of the Group Holding Companies, Shell Petroleum N.V. and The Shell Petroleum Company Ltd.) and their subsidiary Shell Oil Company. On April 21, 2004, Moody’s (Moody’s) Investors Services downgraded the long-term debt ratings of Shell Finance (Netherlands) B.V. and Shell Finance (U.K.) PLC, the guaranteed subsidiaries of the Group to “Aa1” from “Aaa”. These new ratings remain under review for possible further downgrade. The credit ratings given to the commercial paper programmes of the guaranteed subsidiaries have been confirmed by S&P and Moody’s at their original levels of “A-1+” and “Prime-1”, respectively.
The Group, having locked in long-term debt for periods of up to 5 years, will notice an increase in its funding cost only as outstanding debt matures and is replaced with new issues. The average maturity of currently outstanding debt is approximately 2.5 years. If the $5 billion long-term debt currently (April 2004) borrowed under the borrowing programmes to which the ratings apply is fully refinanced, our annual pre-tax borrowing cost is expected to increase by approximately $5 million. In light of the unchanged short-term credit ratings, it is expected that there will be no impact on the cost of commercial paper borrowing.
Capital investment and dividends
Group companies’ capital investment is defined as capital expenditure, plus exploration expense, new investments in associated companies and other investments of a significant and strategic nature. These amounted to $24.6 billion in 2002 ($11.8 billion in 2001), mainly reflecting the high level of acquisition expenditures in 2002. Exploration and Production expenditures of $14.1 billion (compared to $8.0 billion in 2001) accounted for more than half this total. Oil Products investment amounted to $7.9 billion (compared to $1.5 billion in 2001). Chemicals investment was $0.8 billion (compared to $0.8 billion in 2001), whilst Gas & Power accounted for $0.7 billion (compared to $0.8 billion in 2001). An amount of $0.5 billion capital investment was spent in other industry segments, (compared to $0.3 billion in 2001) and $0.6 billion was spent across all segments in the form of loans from the Group to its associated companies (compared to $0.4 billion in 2001).
Capital investment in 2003 is estimated at end 2002 to be approximately $12 billion, excluding the contribution made by minority interests on the Sakhalin project. Spending will continue to be subjected to investment discipline, stringent project selection and the need to balance profitability with growth. Exploration and Production will continue to be the major element. It is expected that the Group companies’ investments will mainly be financed from internally generated funds.
The Parent Companies’ dividend objective is to provide a per share increase at least in line with inflation of the currencies of the Parent Companies’ home countries over a period of years. In 2002, total dividends paid out to shareholders were $5.5 billion, a 7.5% increase over the prior year. Since underlying dividends are declared in euros and pounds sterling, the US dollar dividend amount depends on exchange rates between these currencies and the US dollar. The Group estimates that, under current conservative price assumptions and taking account of revisions to all Group cash commitments, capital investment of around $13 billion on average is required each year (which includes capital expenditures to bring proved undeveloped reserves into production but excludes the contribution made by holders of minority interests in the Sakhalin project) to grow the capital base. This level is higher than in the recent past. After dividends and capital investment, the priority for use of cash generated is the maintenance of a prudent balance sheet.
Since the total debt of the Group increased by $13.9 billion during 2002, debt reduction will be a priority for the Group in 2003. Focus will remain on improvement of underlying operational performance in order to continue to deliver a sufficient level of cash flows provided by operating activities.
58 Discussion and Analysis of Financial Condition and Results of Operations
20-F/A (Amendment No. 2) 2002
Table of Contents
2001 compared to 2000
Statement of Cash Flows
Cash flow provided by operating activities decreased to $16.9 billion in 2001 from $18.3 billion in 2000, or 7.7%, while net income decreased to $10.4 billion from $12.9 billion, or 19.4%. The primary factors causing the 2001 change in cash flow provided by operating activities were lower crude oil and natural gas prices and lower refining margins outside the USA.
Financial condition and liquidity
Cash inflow during 2001 was deployed mainly in investments. Capital investment amounted to $11.8 billion in 2001 ($8.5 billion in 2000), with capital expenditure and new investments in associated companies totalling $10.7 billion in 2001 ($7.3 billion in 2000). Exploration and Production expenditures of $8.0 billion (compared to $4.8 billion in 2000) accounted for approximately 68% of this total. Oil Products investment amounted to $1.5 billion (compared to $1.6 billion in 2000). Chemicals investment was $0.8 billion (compared to $0.9 billion in 2000), whilst Gas & Power accounted for $0.8 billion (compared to $0.5 billion in 2000). An amount of $0.3 billion capital investment was spent in other industry segments (compared to $0.2 billion in 2000), and $0.4 billion was spent across all segments in the form of loans from the Group to its associated companies (compared to $0.5 billion in 2000).
Cash and cash equivalents amounted to $6.7 billion at the end of 2001, compared to $11.4 billion at the end of 2000. There was additional dividend funding for buybacks of Parent Company shares of $4.0 billion and net debt repayment of $1.7 billion in 2001. The net cash position reduction is the result of cash movements as described in the Statement of Cash Flows included in the Group Financial Statements.
A debt covenant (interest cover ratio) on $1.3 billion of non-recourse debt within a Group company was breached in 2001. Total debt at the end of 2001 amounted to $5.8 billion and the Group’s debt ratio decreased from 10.9% in 2000 to 8.9% in 2001.
Guarantees and other off-balance sheet obligations
Guarantees increased by $0.9 billion from $3.2 billion at December 31, 2001 to $4.1 billion in 2002. At December 31, 2002, $2.1 billion were guarantees of debt of associated companies, $1.0 billion were guarantees for customs duties and other tax liabilities and $1.0 billion were other guarantees. Guarantees of debt of associated companies were mainly for InterGen ($1.3 billion).
At December 31, 2002, the Group had operating leases under which total minimum payments were $8.6 billion, long-term purchase obligations associated with financing programmes requiring aggregate payments of $3.6 billion and certain power generation contracts (referred to as tolling agreements) amounting to $6.9 billion (of which approximately $700 million is conditional upon the exercise of a renewal option by the owner of one of the plants). The items referred to in this paragraph are also included in the table of purchase and other obligations below.
Purchase and other obligations
The table below summarises the Group companies’ contractual obligations and commercial commitments as at December 31, 2002.
| $ billion | ||||||||||||||||||||
| Less than | After | |||||||||||||||||||
| 1 year | 2-3 years | 4-5 years | 5 years | |||||||||||||||||
| Contractual Obligations | Total | (2003) | (2004/2005) | (2006/2007) | (>2007) | |||||||||||||||
Long term debta | 8.5 | 2.2 | 2.1 | 3.4 | 0.8 | |||||||||||||||
| Leasing arrangements | 9.4 | 2.0 | 2.1 | 1.3 | 4.0 | |||||||||||||||
| Long term purchase obligations | 3.6 | 0.3 | 0.5 | 0.5 | 2.3 | |||||||||||||||
| Long term power capacity obligations | 6.9 | 0.2 | 0.6 | 0.7 | 5.4 | |||||||||||||||
| Other long term liabilities | 6.1 | – | 3.7 | 1.5 | 0.9 | |||||||||||||||
Total | 34.5 | 4.7 | 9.0 | 7.4 | 13.4 | |||||||||||||||
| a | Comprised of $6.8 billion as disclosed on the Group balance sheet, plus long term debt due within one year, less capitalised lease payments. |
Please also refer to Notes 15, 16 and 18 of the Group Financial Statements for additional detail. In addition to the amounts presented in above table, pension fund contributions for 2003 are expected to be approximately $1.3 billion.
Discussion and Analysis of Financial Condition and Results of Operations 59
20-F/A (Amendment No. 2) 2002
Table of Contents
OTHER MATTERS
Risk management and internal control
The Group’s approach to internal control is based on the underlying principle of line management’s accountability for risk and control management. The Group’s risk and internal control policy explicitly states that the Group has a risk-based approach to internal control and that management in the Group is responsible for implementing, operating and monitoring the system of internal control, which is designed to provide reasonable but not absolute assurance of achieving business objectives.
The Group’s approach to internal control includes a number of general and specific risk management processes and policies. Within the essential framework provided by the Statement of General Business Principles, the Group’s primary control mechanisms are self-appraisal processes in combination with strict accountability for results. These mechanisms are underpinned by established Group policies, standards and guidance material that relate to particular types of risk; structured investment decision processes, timely and effective reporting systems and performance appraisal.
Examples of specific risk management mechanisms include:
| – | regular review of significant risks by the Committee of Managing Directors and the Conference (meetings between the members of the Supervisory Board and the Board of Management of Royal Dutch and the Directors of Shell Transport); |
| – | a common health, safety and environment (HSE) policy, a common requirement for HSE management systems, and external certification of the environmental component of such systems for major installations; |
| – | a financial control handbook that establishes standards for the application of internal financial controls; |
| – | arrangements for the management of property, liability and treasury risks; and |
| – | a business control incident reporting process that enables monitoring and appropriate follow-up actions for incidents arising as a result of control breakdowns. Lessons learned from these incidents are used to improve the Group’s overall control framework. |
A formalised self-appraisal and assurance letter process is in place. Annually the management of every business unit provides assurance as to the adequacy of governance arrangements, risk and internal control management, HSE management, financial controls and reporting, treasury management, brand management and information management. Country Chairs also provide assurance regarding compliance with the Statement of General Business Principles and other important topics; as part of this process business integrity concerns or instances of bribery or illegal payments are to be reported. Assurance letter results including any material qualifications are reviewed by the GAC and support representations made to the external auditors.
In addition to these structured self-appraisals, the assurance framework relies upon objective appraisals by internal audit. The results of internal audit’s risk-based reviews of Group operations provide the GAC with an independent view regarding the effectiveness of risk and control management systems.
These established review, reporting and assurance processes enable the Conference to regularly consider the overall effectiveness of the system of internal control and to perform a full annual review of the system’s effectiveness.
Taken together, these processes and practices provide confirmation to the Group Holding Companies that relevant policies are adopted and procedures implemented with respect to risk and control management.
As discussed below under “Controls and Procedures”, the Parent Companies have determined, based largely on the investigation and report to the GAC, that there were deficiencies and material weaknesses in the internal controls relating to proved reserve bookings and disclosure controls that allowed volumes of oil and gas to be improperly booked and maintained as proved reserves, which also had an effect on the financial statements.
Property and liability risks
The Group’s Operating Companies insure against most major property and liability risks with the Group’s captive insurance companies. These companies reinsure part of their major catastrophe risks with a variety of international insurers. The effect of these arrangements is that uninsured losses for any one incident are unlikely to exceed $400 million.
Treasury and trading risks
As further discussed in Note 28 to the Group Financial Statements, Group companies, in the normal course of their business, use financial instruments of various kinds for the purposes of managing exposure to currency, commodity price and interest rate movements.
The Group has Treasury Guidelines applicable to all Group companies and each Group company is required to adopt a treasury policy consistent with these guidelines. These policies cover financing structure, foreign exchange and interest rate risk
60 Discussion and Analysis of Financial Condition and Results of Operations
20-F/A (Amendment No. 2) 2002
Table of Contents
management, insurance, counterparty risk management and derivative instruments, as well as the treasury control framework. Wherever possible, treasury operations are operated through specialist Group regional organisations without removing from each Group company the responsibility to formulate and implement appropriate treasury policies.
Each Group company measures its foreign currency exposures against the underlying currency of its business (its “functional currency”), reports foreign exchange gains and losses against its functional currency and has treasury policies in place which are designed to manage foreign exchange exposure so defined. The functional currency for most upstream companies and for other companies with significant international business is the US dollar, but other companies normally have their local currency as their functional currency.
The financing of most Operating Companies is structured on a floating-rate basis and, except in special cases, further interest rate risk management is discouraged.
Apart from forward foreign exchange contracts to meet known commitments, the use of derivative financial instruments by most Group companies is not permitted by their treasury policy.
Specific Group companies have a mandate to operate as traders in crude oil, natural gas, oil products and other energy related products, using commodity swaps, options and futures as a means of managing price and timing risks arising from this trading. In effecting these transactions, the companies concerned operate within procedures and policies designed to ensure that risks, including those relating to the default of counterparties, are minimised.
Other than in exceptional cases, the use of external derivative instruments is generally confined to specialist oil and gas trading and central treasury organisations which have appropriate skills, experience, supervision and control and reporting systems.
Supplementary information on derivatives and other financial instruments and derivative commodity instruments is given on pages G70 to G82 of this report.
Pension funds
The estimated actuarial valuation of the Group’s four main pension funds in aggregate at end 2002 shows a modest surplus of assets over liabilities. This actuarial valuation, rather than the Group accounting policy FAS 87 measure (Note 20 to the Group Financial Statements), is the basis on which the funds’ trustees steer the funds and define the required contributions from the member companies.
Environmental and decommissioning costs
Group companies are present in over 145 countries and territories throughout the world and are subject to a number of different environmental laws, regulations and reporting requirements. It is the responsibility of each Group company to implement a health, safety and environmental management system that is suited to its particular circumstances.
The costs of prevention, control, abatement or elimination of releases into the air and water, as well as the disposal and handling of wastes at operating facilities, are considered to be an ordinary part of business. As such, these amounts are included within operating expenses. An estimate of the order of magnitude of amounts incurred in 2002 for Group companies, based on allocations and managerial judgement, is $1.1 billion (2001: $0.6 billion).
Expenditures of a capital nature to limit or monitor hazardous substances or releases include both remedial measures on existing plants and integral features of new plants. Whilst some environmental expenditures are discrete and readily identifiable, others must be reasonably estimated or allocated based on technical and financial judgements which develop over time. Consistent with the preceding, estimated environmental capital expenditures made by companies with major capital programmes during 2002 were $0.8 billion (2001: $0.4 billion). Those Group companies are expected to incur environmental capital costs of at least $0.8 billion during both 2003 and 2004.
It is not possible to predict with certainty the magnitude of the effect of required investments in existing facilities on Group companies’ future earnings, since this will depend amongst other things on the ability to recover the higher costs from customers and through fiscal incentives offered by governments.
Nevertheless, it is anticipated that over time there will be no material impact on the total of Group companies’ earnings. These risks are comparable to those faced by other companies in similar businesses.
At the end of 2002, the total liabilities being carried for environmental clean-up were $797 million (2001: $454 million). In 2002, there were payments of $139 million and increases of provisions of $120 million. Provisions being carried for expenditures on decommissioning and site restoration, including oil and gas platforms, amounted to $3,528 million (2001: $2,615 million).
Discussion and Analysis of Financial Condition and Results of Operations 61
20-F/A (Amendment No. 2) 2002
Table of Contents
Employees
Overall, the number of employees in the Group has increased by over 25% during 2002 primarily as a result of the acquisitions in the Oil Products business (Equilon, Pennzoil-Quaker State and DEA). Further increases resulted from the consolidation of former associate companies, the start-up of new operations and from business expansion. These were only partially offset by the conversion of certain retail operations to an agency basis. Further streamlining across the Group will continue, due to the integration of acquisitions and the ongoing restructuring of companies across the Group.
Research and development costs
The Group’s research and development (R&D) programmes are designed to enable the Group to reduce costs and improve operations. Total R&D expenses for 2002 were $472 million, compared with $387 million for 2001.
International Financial Reporting Standards
Under a 2002 EU Regulation, publicly-listed companies will be required to prepare consolidated financial statements in accordance with International Financial Reporting Standards (IFRS) from 2005. The Group’s IFRS implementation project is on target to meet this requirement. At June 2004 the impact cannot be determined, as there are a number of decisions and choices still to be made as a first time adopter of IFRS.
The Group expects to follow the Committee of European Securities Regulators’ recommendations regarding disclosures during the period leading up to publication of the 2005 financial statements, including impact analysis in the 2004 financial statements and quarterly information in accordance with IFRS during 2005.
Cautionary statement
This discussion and Analysis of Financial Condition and Results of Operations and other sections of this Amendment No. 2 contain forward-looking statements that are subject to risk factors associated with the oil, gas, power, chemicals, power generation and renewables businesses. It is believed that the expectations reflected in these statements are reasonable, but they may be affected by a variety of variables which could cause actual results or trends to differ materially, including, but not limited to: price fluctuations, actual demand, currency fluctuations, drilling and production results, reserve estimates, loss of market, industry competition, environmental risks, physical risks, the risks of doing business in developing countries, legislative, fiscal and regulatory developments, economic and financial market conditions in various countries and regions, political risks, project delay or advancement, approvals and cost estimates.
CRITICAL ACCOUNTING ESTIMATES
In order to prepare the Group Financial Statements in conformity with generally accepted accounting principles in the Netherlands and the United States, management of the Group has to make estimates and judgements. The matters described below are considered to be the most critical in understanding the judgements that are involved in preparing the Group Financial Statements and the uncertainties that could impact the amounts reported on the results of operations, financial condition and cash flows. Accounting policies are described in Note 3 to the Group Financial Statements.
Estimation of oil and gas reserves
Oil and gas reserves are key elements in the Group’s investment decision-making process. They are also an important element in testing for impairment. Changes in proved oil and gas reserves will also affect the standardised measure of discounted cash flows presented in our “Supplementary Information – Oil and Gas (unaudited)” and changes in proved oil and gas reserves, particularly developed reserves, will affect unit-of-production depreciation charges to income.
Proved oil and gas reserves are the estimated quantities of crude oil, natural gas and natural gas liquids which geological and engineering data demonstrate with reasonable certainty to be recoverable in future years from known reservoirs under existing economic and operating conditions, i.e., prices and costs as of the date the estimate is made. Proved developed reserves are reserves that can be expected to be recovered through existing wells with existing equipment and operating methods. Estimates of oil and gas reserves are inherently imprecise, require the application of judgement and are subject to future revision. Accordingly, financial and accounting measures (such as the standardised measure of discounted cash flows, depreciation, depletion and amortisation charges, and decommissioning provisions) that are based on proved reserves are also subject to change.
Proved reserves are estimated by reference to available reservoir and well information, including production and pressure trends for producing reservoirs and, in some cases, subject to definitional limits, to similar data from other producing reservoirs. Proved reserves estimates are attributed to future development projects only where there is a significant commitment to project funding and execution and for which applicable governmental and regulatory approvals have been secured or are reasonably certain to be secured. Furthermore, estimates of proved reserves only include volumes for which access to market is assured with reasonable certainty. All proved reserve estimates are subject to revision, either upward or downward, based on new information, such as
62 Discussion and Analysis of Financial Condition and Results of Operations
20-F/A (Amendment No. 2) 2002
Table of Contents
from development drilling and production activities or from changes in economic factors, including product prices, contract terms or development plans. In general, changes in the technical maturity of hydrocarbon reserves resulting from new information becoming available from development and production activities have tended to be the most significant cause of annual revisions.
In general, estimates of reserves for undeveloped or partially developed fields are subject to greater uncertainty over their future life than estimates of reserves for fields that are substantially developed and depleted. As a field goes into production, the amount of proved reserves will be subject to future revision once additional information becomes available through, for example, the drilling of additional wells or the observation of long-term reservoir performance under producing conditions. Some of our Deepwater Gulf of Mexico proved undeveloped reserves may not have had a production flow test to surface. In such situations, we have used other technologies that we believe are reliable to establish economic producibility. As those fields are further developed, new information may lead to revisions.
As announced on January 9, 2004, March 18, 2004, April 19, 2004, October 28, 2004, November 26, 2004 and February 3, 2005 the Group reviewed its proved reserves inventory (with the assistance of external consultants) during the period from late 2003 to December 2004. These reviews lead to the Reserves Restatement described herein. As at December 31, 2002, after giving effect to the Reserves Restatement, the proportion of the Group’s total proved reserves that was categorised as proved developed reserves was 57%, the remaining 43% being proved undeveloped reserves.
As noted above, changes in the estimated amounts of proved reserves can have a significant impact on the standardised measure of discounted cash flows presented under “Supplementary information – Oil and Gas (unaudited)” beginning on page G54. The Reserves Restatement resulted in a 17% reduction in the standardised measure at end of 2002. Apart from the effects of the Reserves Restatement, however, revisions to proved reserves have had a relatively modest impact on standardised measure compared to changes in prices and costs, sales and transfers and income tax. A summary of changes to the standardised measure is given on page G68.
Changes to our estimates of proved reserves, particularly proved developed reserves, also affect the amount of depreciation, depletion and amortisation recorded in our financial statements for fixed assets related to hydrocarbon production activities. These changes most often result from production and revisions. However, the Reserves Restatement also affected proved developed reserves. A reduction in proved developed reserves will increase depreciation, depletion and amortisation charges (assuming constant production) and reduce net income.
Although the possibility exists for changes in reserves to have a critical effect on depreciation, depletion and amortisation charges and, therefore, net income, it is expected that in the normal course of business the diversity of the Shell portfolio will constrain the likelihood of this occurring.
The Reserves Restatement resulted in a 5% change in total Exploration and Production depreciation, depletion and amortisation charges (excluding impairments) in 2002, because approximately 82% of the affected reserves had been in the proved undeveloped category, which does not affect this calculation.
Recoverability of assets
For oil and gas properties with no proved reserves, the capitalisation of exploration costs and the basis for carrying those costs on the balance sheet are explained in Note 3 to the Group Financial Statements. For properties with proved reserves, the carrying amounts of major fixed assets are reviewed for possible impairment annually, while all assets are reviewed whenever events or changes in circumstances indicate that the carrying amounts for those assets may not be recoverable. If assets are determined to be impaired, (i.e. the estimated undiscounted cash flows related to such assets are less than the carrying amounts of such assets) the carrying amounts of those assets are written down to fair value, usually determined as the amount of estimated discounted future cash flows. For this purpose, assets are grouped based on separately identifiable and largely independent cash flows. Impairments can also occur when decisions are taken to dispose of assets.
Estimates of future cash flows are based on management estimates of future commodity prices, market supply and demand, product margins and, in the case of oil and gas properties, the expected future production volumes. Other factors that can lead to changes in estimates include restructuring plans and variations in regulatory environments. Expected future production volumes, which include both proved reserves as well as volumes that are expected to constitute proved reserves in the future, are used for testing asset recoverability because the Group believes this to be the most appropriate measure of expected future cash flows, used as a measure of fair value. Estimates of future cash flows are risk weighted and consistent with those used in Group companies’ business plans. A discount rate based on the Group’s risk free rate is used in impairment testing, adapted where required to specific local circumstances. Changes in the discount rate can result from inflation rates, individual country risks and currency risks. The Group reviews the discount rate to be applied on an annual basis but the risk free rate has been stable in recent years.
Discussion and Analysis of Financial Condition and Results of Operations 63
20-F/A (Amendment No. 2) 2002
Table of Contents
Asset impairments have the potential to significantly impact net income. For example, in recent years there have been significant impairment charges in 1998 ($3,013 million pre-tax) and in 2000 ($1,785 million pre-tax). The changes in estimates that most precipitated those impairments were in relation to future commodity prices or margins and portfolio transactions. In particular the longer term assumption for oil price was revised from $18 per barrel in 1998 to $14 per barrel and the outlook for oil refinery margins in Asia Pacific was reduced in 2000. Significant portfolio transactions in the Gas & Power segments occurred in both those years and in Chemicals in 1998.
As described above, the Group has a portfolio of assets across a number of business lines and geographic regions. The factors that influence estimated future cash flows from assets also vary depending on the nature of the business activity in which those assets are used and geographical market conditions impacting the businesses in which assets are used. This wide business and geographic spread is such that it is not practicable to determine the likelihood or magnitude of impairments under different sets of assumptions. The assumption on future oil prices is higher than in 1998 and tends to be stable because the Group does not consider short-term increases or decreases in prices as being indicative of long term levels. At the end of 2002 the estimated oil and gas prices used for asset recoverability testing were lower than prices prevailing in the market at that time.
Provisions and liabilities
Provisions are recognised for the future decommissioning and restoration of oil and gas production facilities and pipelines at the end of their economic lives. The estimated cost is provided over the life of the proved developed reserves on a unit-of production basis. Changes in the estimates of costs to be incurred, proved developed reserves or in the rate of production will therefore impact net income, over the remaining economic life of oil and gas assets.
Other provisions and liabilities are recognised in the period when it becomes probable that there will be a future outflow of funds resulting from past operations or events which can be reasonably estimated. The timing of recognition requires the application of judgement to existing facts and circumstances, which can be subject to change.
Estimates of the amounts of provisions and liabilities recognised are based on current legal and constructive requirements, technology and price levels. Because actual outflows can differ from estimates due to changes in laws, regulations, public expectations, technology, prices and conditions, and can take place many years in the future, the carrying amounts of provisions and liabilities are regularly reviewed and adjusted to take account of such changes.
As further described in Note 27 to the Group Financial Statements, the Group is subject to claims and actions. The facts and circumstances relating to particular cases are evaluated in determining whether it is “probable” that there will be a future outflow of funds and, once established, whether a provision relating to a specific litigation is sufficient. Accordingly, significant management judgment relating to contingent liabilities is required since the outcome of litigation is difficult to predict. Despite this uncertainty, actual payments related to litigation during the three years ended December 31, 2002 have not been material to the Group’s financial condition or results of operations.
Notwithstanding the possibility of outcomes outside expected ranges, in recent years the Group’s experience has been that estimates used in determining the appropriate levels of provisions have been materially adequate in anticipating actual outcomes.
A change in estimate of a recognised provision or liability would result in a charge or credit to net income, in the period in which the change occurs (with the exception of decommissioning and restoration costs as described above).
Employee retirement plans
Retirement plans are provided for permanent employees of all major Group companies and generally provide defined benefits based on employees’ years of service and average final remuneration. The plans are typically structured as separate legal entities managed by trustees.
The amounts reported for the Group’s employee retirement plans are disclosed in Note 20 to the Group Financial Statements, and are calculated in line with Statement of Financial Accounting Standards No. 87 (FAS 87). These calculations require assumptions to be made of future outcomes, the principal ones being in respect of increases in remuneration and pension benefit levels, the expected long-term return on plan assets and the discount rate used to convert future cash flows to current values. The assumptions used vary for the different plans as they are determined in consultation with independent actuaries in the light of local conditions. The assumptions are reviewed annually. Expected rates of return on plan assets are calculated based on a projection of real long-term bond yields and an equity risk premium which are combined with local inflation assumptions and applied to the actual asset mix of each plan. The amount of the expected return on plan assets is calculated using the expected rate of return for the year and the market-related value at the beginning of the year. Discount rates used to calculate year-end liabilities are based on prevailing AA long-term corporate bond rates at year end. Weighted average values for the assumptions used are contained in Note 20 to the Group Financial Statements and have remained relatively constant over the last three years.
64 Discussion and Analysis of Financial Condition and Results of Operations
20-F/A (Amendment No. 2) 2002
Table of Contents
Pension cost under FAS 87 primarily represents the increase in actuarial present value of the obligation for benefits based on employee service during the year and the interest on the obligation in respect of employee service in previous years, net of the expected return on plan assets. The FAS 87 calculations are sensitive to changes in the underlying assumptions. A change of 1% in the expected rate of return on plan assets would result in a change in pension cost charged to income of approximately $450 million (pre-tax) per annum. FAS 87 generally reduces income volatility because unexpected changes in the amounts of plan assets and liabilities (“actuarial gains and losses”) are amortised over the average remaining employee work life.
The trustees manage the pension funds and set the required contributions from Group companies based on independent actuarial valuation rather than the FAS 87 measures.
Discussion and Analysis of Financial Condition and Results of Operations 65
20-F/A (Amendment No. 2) 2002
Table of Contents
Controls and Procedures
As of the end of the period covered by this Report, the management of each of the Parent Companies (with the participation in the case of Royal Dutch of its President and Managing Director and the Acting Group Chief Financial Officer and, in the case of Shell Transport its Managing Director and the Acting Group Chief Financial Officer) conducted an evaluation pursuant to Rule 13a-15 promulgated under the Securities Exchange Act of 1934, as amended (the Exchange Act), of the effectiveness of the design and operation of the disclosure controls and procedures of the Parent Companies and the Group. Based on this evaluation, the President and Managing Director of Royal Dutch, the Managing Director of Shell Transport and the Acting Group Chief Financial Officer concluded that, except as described below under “Deficiencies Relating to Reserves Reporting”, as of the end of the period covered by this Report, such disclosure controls and procedures were effective to provide reasonable assurance that information required to be disclosed by each of the Parent Companies in reports they file or submit under the Exchange Act is recorded, processed, summarised and reported, within the time periods specified in the rules and forms of the Securities and Exchange Commission.
Except as described below, there has not been any change in the internal controls over financial reporting of the Group or either Parent Company that occurred during the period covered by this Report, that has materially affected, or is reasonably likely to affect, such internal controls over financial reporting.
Investigation and Report to the Group Audit Committee; Management Changes
Following the January 9, 2004 announcement of the reserves recategorisation, the Group Audit Committee (GAC) appointed Davis Polk & Wardwell to lead an independent review of the facts and circumstances surrounding the recategorisation, and to report its findings and any proposed remedial actions to the GAC for its consideration. That report, dated March 31, 2004, was presented to the GAC and subsequently to the Supervisory Board of Royal Dutch and non-executive directors of Shell Transport. The report was accepted in full by the GAC on April 15, 2004 and by the members of the Supervisory Board of Royal Dutch and the non-executive directors of Shell Transport (the Parent Company Boards) on April 16, 2004.
Following an interim report to the GAC dated March 1, 2004, which was presented to the Parent Company Boards on March 2, 2004, Sir Philip Watts, Chairman of the Committee of Managing Directors and Mr. Walter Van de Vijver, Chief Executive of Exploration and Production, submitted their resignations on March 3, 2004 from all director and officer positions within the Group and the Parent Companies. Following acceptance of the final report to the GAC by the members of the Supervisory Board of Royal Dutch and the non-executive Directors of Shell Transport, Judith Boynton resigned from her position as Group Chief Financial Officer, Group Managing Director and Executive Director of Shell Transport on April 18, 2004.
Jeroen van der Veer, President and Managing Director of Royal Dutch, has succeeded Sir Philip Watts as Chairman of the Group’s Committee of Managing Directors; Lord Oxburgh has been appointed non-executive Chairman of Shell Transport and Chairman of Conference; and Malcolm Brinded has been appointed Chief Executive of Exploration and Production, a Director of Shell Transport and Vice Chairman of the Committee of Managing Directors. Mr. Brinded has resigned from his position as a Managing Director of Royal Dutch; he remains Chief Executive of Gas & Power. Tim Morrison, currently Group Controller, has also been appointed Acting Chief Financial Officer. On June 23, 2004, Peter Voser was appointed Group Chief Financial Officer and a Director of Shell Transport with effect from October 4, 2004.
Deficiencies relating to reserves reporting
As described in greater detail elsewhere herein, this Amendment No. 2 gives effect to the Reserves Restatement and the Financial Restatement. In connection with the First Reserves Restatement, Royal Dutch and Shell Transport have determined, based largely upon the investigation and report to the GAC, that there were deficiencies and material weaknesses in the internal controls relating to proved reserves bookings and disclosure controls that allowed volumes of oil and gas to be improperly booked and maintained as proved reserves. The inappropriate booking of certain proved reserves had an effect on the financial statements, mainly understating depreciation, depletion and amortisation. To eliminate the effects on the financial statements of the inappropriate reserves bookings, Royal Dutch and Shell Transport elected to make the First Financial Restatement. The identified deficiencies and material weaknesses relating to the booking of proved reserves consist of the following:
| • | The Group’s guidelines for booking proved reserves were inadequate in several respects, including (i) containing inconsistencies with the SEC’s rules and published guidance relating to proved reserves and (ii) failing to clearly and sufficiently impart these requirements and guidance to users of the guidelines. |
| • | There was a lack of appropriate resources and a confusion of roles and responsibilities with respect to the Group Reserves Coordinator and the Group Reserves Auditor. |
| • | The Group’s Committee of Managing Directors and the Parent Company Boards were not provided with appropriate information to inform disclosure judgements. |
66
Controls and Procedures
20-F/A (Amendment No. 2) 2002
Table of Contents
| • | There were weaknesses in the finance function whereby the Chief Financial Officers of the businesses did not have direct reporting responsibility to the Group Chief Financial Officer. |
| • | There were unclear lines of responsibility for booking proved reserves. |
| • | There was a lack of understanding at various levels of the Group of the meaning and importance of disclosure obligations under the SEC’s rules and published guidance relating to proved reserves. |
| • | There was a control environment that did not emphasise the paramount importance of the compliance element of proved reserves decisions. |
Remedial Actions
To address the weaknesses in the controls relating to reserves bookings identified above, the Parent Companies and the Group have implemented a number of remedial actions. During March 2004 through April 2004, the Group conducted an extensive special review of the global reserves portfolio with the assistance of external reserve consultants, Ryder Scott Company. During July 2004 through December 2004, asset teams in each operating unit, using the revised guidelines and assisted in certain cases by external consultants, undertook a reservoir-by-reservoir review of substantially all of the Group’s proved reserves volumes reported as at December 31, 2003, as part of the Group’s annual reserves determination process. In addition, teams from internal audit, assisted by separate external consultants, conducted on-site reviews as part of an audit process that covered approximately 90% of such originally reported proved reserves. These reviews led to the Second Reserves Restatement. See “Supplementary information – Oil and Gas (unaudited)”. The Parent Companies and the Group have also effected the management changes described above under “Investigation and Report to Group Audit Committee; Management Changes”. In addition, as discussed in the report to the GAC, the following remedial actions have also been taken or are proposed to be taken:
| • | Global Reserves Committee. In 2003, the Group established the Global Exploration and Production Reserves Committee (the Reserves Committee) in order to improve consistency of standards and their application across the Group’s operations globally and strengthen the oversight of the process for approving the booking of proved reserves. |
| • | Group Reserves Guidelines. The Group’s guidelines for booking proved reserves have been revised with the assistance of independent petroleum engineers and counsel to conform fully these guidelines with applicable SEC rules and guidance, clarify the criteria for booking and de-booking of proved reserves (and the distinctions between regulatory requirements and the Group’s internal reserves classifications) and improve their utility for all users. It is expected that future revisions of the guidelines will occur only as necessary and as early as possible in the year to allow engineers to understand the implications well in advance of the submission of reserves volumes at year-end. |
| • | Training Reserves Guidelines Users. In 2004, the Group began and substantially completed the training of approximately 3,000 staff members in the revised Group Reserves Guidelines in order to impart the requirements and guidance of these Guidelines and improve their utility for users. |
| • | Overhaul of the office of Group Reserves Co-ordinator. Given the technical and compliance elements of reserves determinations, the Group Reserves Co-ordinator will no longer report to business planning or strategy executives in Exploration and Production but rather to the Director of Technology. More staff will be employed to resource the vital function of the Group Reserves Co-ordinator who will also regularly use independent petroleum engineers as deemed necessary, including for the systematic training of engineers in the field. The Group Reserves Co-ordinator will be responsible for the revision and ongoing maintenance and application of the Group’s Guidelines, and as such will be responsible for identifying and resolving difficult areas of interpretation with the Reserves Committee and the Group Reserves Auditor as well as for identifying training needs and facilitating training sessions from both a technical and regulatory perspective. The Group Reserves Coordinator will also have an obligation to liaise with internal legal staff on disclosure judgments on the basis of technical compliance and/or materiality. |
| • | Overhaul of the office of Group Reserves Auditor. More staff will also be dedicated to the Group Reserve Auditor function so that the audit cycle of the Group’s reserves can be made more frequent and each audit can be made more rigorous. The Group Reserves Auditor and his or her staff will now report to the Group Chief Internal Auditor to increase the independence of the Group Reserves Auditor function. The Group Reserves Auditor will also regularly use independent external petroleum engineers to complement and develop in-house expertise. |
| • | Clarification of roles and responsibilities of the Group Reserves Auditor and the Group Reserves Coordinator. The roles of the Group Reserves Auditor and Group Reserves Coordinator have been redefined to make clear that they must retain a respectful separation and independence so as to allow the Group Reserves Auditor to challenge the Group Reserves Coordinator and Exploration and Production reserve booking decisions more effectively as parts of the Group internal audit function. |
67
Control and Procedures
20-F/A (Amendment No. 2) 2002
Table of Contents
| • | Removal of reserves from scorecards. Reserves bookings have been removed from performance scorecards (used internally to gauge the performance of the Group’s businesses against identified goals for purposes of management evaluation and for calculating management bonuses) of individuals associated with the reserves assurance process, including senior executives. |
| • | Improved visibility and accounting of reserves issues by senior management and Directors. The Group’s Committee of Managing Directors will collectively approve the reserve bookings and de-bookings taken by Exploration and Production. Following this approval, a review of the overall outcome will be considered by the GAC. |
| • | Enhanced accountability of Business CFOs to the Group CFO. The Chief Financial Officers of the businesses now report directly to the Group Chief Financial Officer. This reorganisation is designed to improve the ability of the Group Chief Financial Officer to have effective oversight of financial issues relating to the business units. It will also enable the Group Chief Financial Officer, in turn, to inform colleagues and directors of important disclosure issues, as required. |
| • | Strengthening of Line Responsibilities for Reserve Reporting. The line authorities and accountabilities for reserve reporting are being reinforced as follows: |
| – | clarifying that the local Chief Reservoir Engineer is responsible for ensuring that reserves bookings and de-bookings are compliant with SEC rules and requiring that any booking and de-booking decisions are only made with appropriate, auditable documentation and after completion of the appropriate challenge processes; | |
| – | placing business and financial responsibility on the local Chief Executive Officer and Chief Financial Officer, respectively, for the decisions of their Chief Reservoir Engineer; | |
| – | clarifying that ultimate responsibility for booking and de-booking decisions rests with the Chief Financial Officer of Exploration and Production and the Director of Technology of Exploration and Production, working together with the Group Reserves Coordinator; | |
| – | providing for the endorsement of these decisions by the Group’s Committee of Managing Directors; and |
| – finally, providing for review by the GAC. |
| • | Enhancement of the Legal Function. To improve the ability of the senior management to benefit from appropriate legal advice, provision has been made for the Group Legal Director to have the ability to attend meetings of the Group’s Committee of Managing Directors, the Conference and the Parent Company Boards. Similarly, the General Counsel of the various businesses, who attend the executive committee meetings of those businesses, have been expressly given the task of identifying disclosure issues for consideration at a higher level. All lawyers at the Group level and the Parent Companies, including the Corporate Secretaries of the Parent Companies, now report to the Group Legal Director, except to the extent inappropriate under applicable legal and fiduciary requirements. The legal function has been given responsibility for actively identifying training needs in areas of disclosure, reporting obligations and corporate governance and devise training programs to address those needs. |
| • | Enhancement of the Disclosure Committee. The Group’s existing Disclosure Committee has been enhanced to require that the Group Legal Director be a member. The Disclosure Committee has also been given quarterly access to the Group’s Committee of Managing Directors to assess the adequacy of disclosures and ensure the awareness and approval of the Group’s Committee of Managing Directors of those disclosures. In carrying out its responsibility to ensure accuracy, completeness and consistency with other disclosures, the Disclosure Committee will be asked to provide a second level of control over the substantive content of disclosures. |
| • | Reduction of Job Rotation. The Group will examine the tenure of individuals in key functions. While it is important for numerous reasons to expose people to different experiences within the Group, it is accepted that the period of rotation of certain positions should be extended and, upon rotation, complete and detailed handover notes should form the basis for a formal transfer. |
| • | Document Retention Policy. A consistent policy is being prepared to be put into place. Following implementation, this policy will be widely disseminated. |
| • | Promoting Communication and Compliance. Group-wide communications programs are being planned in which the Group’s senior management will emphasize to all employees that integrity and compliance concerns must be raised with the internal audit or legal functions, and must be investigated thoroughly and openly, regardless of who is involved. This policy will be communicated forcefully and frequently. Moreover, a working group of senior executives has been formed to evaluate ways to enhance the effectiveness of the Group’s compliance efforts and to promote consistent communication of compliance requirements throughout the Group. |
68
Control and Procedures
20-F/A (Amendment No. 2) 2002
Table of Contents
2004 Disclosure Controls Review
Subsequent to the January 9, 2004 announcement of the first reserves recategorisation, and under the sponsorship of the Group Disclosure Committee, a review of the control framework in relation to corporate disclosure processes was conducted by Group internal audit. The results of this review identified areas for improvement, including with respect to strengthening and increasing the formalisation of the existing framework, and are consistent with a number of the remedial actions arising out of the independent review described above. The outcome of this internal review was considered by both the Group Disclosure Committee and the GAC, to ensure integrated implementation of agreed actions.
69
Control and Procedures
20-F/A (Amendment No. 2) 2002
Table of Contents
Royal Dutch Petroleum Company
CONTROL OF REGISTRANT
Royal Dutch is not directly or indirectly owned or controlled by another corporation or by any government. On October 28, 2004, the Royal Dutch and Shell Transport Boards announced that they had unanimously agreed to propose to their shareholders a transaction through which each Parent Company will become a subsidiary of Royal Dutch Shell plc, which will become a publicly-listed company incorporated in England and Wales and headquartered and tax resident in the Netherlands. Please refer to “Discussion and Analysis of Financial Condition and Results of Operations — Recent Developments” for additional information on this transaction.
Ordinary shares and priority shares
The General Meeting of Shareholders held on May 16, 2002, adopted a resolution to redenominate the nominal (par) value of the priority and ordinary shares from guilders into euro. The new nominal (par) value of the priority shares is€448 each and of the ordinary shares€0.56 each. The rights of the holders of the ordinary shares have not been impaired. Of Royal Dutch’s outstanding ordinary shares, with a nominal (par) value of€0.56 each, approximately 73.5% is in bearer form; the remainder is registered. As at March 3, 2003, no interests had been notified to the Company in 5% or more of the Company’s issued ordinary share capital. As at the same date the Directors and officers of Royal Dutch owned in aggregate (including shares under option) less than 1% of the ordinary share capital of Royal Dutch. See “Management – Share Ownership” on page 77.
Royal Dutch has 1,500 priority shares outstanding. Each of the members of the Supervisory Board and each Managing Director is the holder of six priority shares. Taken together, the members of the Supervisory Board and the Managing Directors hold 66 priority shares. The other 1,434 priority shares were held, as at March 3, 2003, by the Royal Dutch Priority Shares Foundation. The Board of the Foundation consists of all the members of the Supervisory Board and the Managing Directors of Royal Dutch. The important special rights attaching to these shares are as follows:
| • | determining of the number of members of the Supervisory Board and the number of Managing Directors, provided that the Supervisory Board should consist of at least five members and the Board of Management of at least two members; |
| • | drawing-up of a binding nomination consisting of two persons for filling vacancies on the Supervisory Board and the Board of Management; |
| • | granting of consent required for amendment of the Articles of Association or for dissolution of Royal Dutch; |
| • | granting of consent required for the assignment of priority shares. |
The above-mentioned rights are exercised by the meeting of holders of priority shares. At this meeting one vote may be cast for each priority share, but no one may cast more than six votes in all.
NATURE OF TRADING MARKET
The principal trading markets for the ordinary shares of Royal Dutch are the stock exchanges in Amsterdam and New York. Royal Dutch ordinary shares are also listed on stock exchanges in Austria, Belgium, France, Germany, Luxembourg, Switzerland and the United Kingdom.
Royal Dutch ordinary shares are issuable in bearer or registered form.
Royal Dutch shares of New York Registry may be transferred on the books of Royal Dutch and exchanged for bearer shares, for shares of Hague Registry or for shares of New York Registry of other denominations at JPMorgan Chase Bank (c/o JPMorgan Service Center, PO Box 43013, Providence, RI 02940-3013) as Transfer Agent and Registrar. The Transfer Agent maintains “drop facilities” at the offices of Securities Transfer and Reporting Services (STARS), 100 William Street, Galleria, New York, NY 10038, where stock certificates and related instruments may be received and redelivered. Besides being listed and traded on the New York Stock Exchange, Royal Dutch shares of New York Registry are also admitted to unlisted trading privileges on the following stock exchanges: Boston, Cincinnati, Midwest, Pacific and Philadelphia.
Royal Dutch ordinary shares other than those of New York Registry are predominantly in bearer form.
At March 3, 2003, there were outstanding 522,321,706 shares of New York Registry representing approximately 24.9% of the ordinary share capital of Royal Dutch, held by approximately 19,000 holders of record.
70 Royal Dutch Petroleum Company
20-F/A (Amendment No. 2) 2002
Table of Contents
The following tables set forth the high and low prices for Royal Dutch€0.56 par value ordinary shares on Euronext Amsterdam and for Royal Dutch shares of New York Registry on the New York Stock Exchange for the periods specified:
| Euronext | New York | |||||||||||||||
| Amsterdam | Stock Exchange | |||||||||||||||
| High | Low | High | Low | |||||||||||||
| Period | € | € | $ | $ | ||||||||||||
| 1998 | 56.95 | 36.57 | 60.38 | 39.75 | ||||||||||||
| 1999 | 64.10 | 34.90 | 67.38 | 39.56 | ||||||||||||
| 2000 | 75.90 | 51.51 | 65.69 | 50.44 | ||||||||||||
| 2001 | 73.48 | 43.72 | 64.15 | 39.75 | ||||||||||||
| 2002 | 63.20 | 39.21 | 57.30 | 38.60 | ||||||||||||
| Euronext | New York | |||||||||||||||
| Amsterdam | Stock Exchange | |||||||||||||||
| High | Low | High | Low | |||||||||||||
| Period | € | € | $ | $ | ||||||||||||
2001 | ||||||||||||||||
| 1st Quarter | 68.59 | 60.95 | 64.15 | 53.63 | ||||||||||||
| 2nd Quarter | 73.48 | 59.01 | 62.46 | 53.30 | ||||||||||||
| 3rd Quarter | 69.10 | 43.72 | 59.09 | 39.75 | ||||||||||||
| 4th Quarter | 60.23 | 51.75 | 54.48 | 45.62 | ||||||||||||
2002 | ||||||||||||||||
| 1st Quarter | 62.80 | 52.50 | 55.48 | 46.62 | ||||||||||||
| 2nd Quarter | 63.20 | 51.95 | 56.34 | 50.48 | ||||||||||||
| 3rd Quarter | 58.80 | 39.21 | 57.30 | 38.60 | ||||||||||||
| 4th Quarter | 46.30 | 40.23 | 44.93 | 39.76 | ||||||||||||
| Euronext | New York | |||||||||||||||
| Amsterdam | Stock Exchange | |||||||||||||||
| High | Low | High | Low | |||||||||||||
| Period | € | € | $ | $ | ||||||||||||
2002 | ||||||||||||||||
| July | 58.80 | 40.26 | 57.30 | 39.65 | ||||||||||||
| August | 48.70 | 41.41 | 47.22 | 40.99 | ||||||||||||
| September | 46.43 | 39.21 | 44.98 | 38.60 | ||||||||||||
| October | 46.30 | 40.23 | 44.75 | 39.76 | ||||||||||||
| November | 44.90 | 42.00 | 44.93 | 42.13 | ||||||||||||
| December | 44.41 | 41.00 | 44.50 | 41.80 | ||||||||||||
2003 | ||||||||||||||||
| January | 44.58 | 35.86 | 46.88 | 38.91 | ||||||||||||
| February | 39.44 | 35.32 | 42.09 | 38.26 | ||||||||||||
ARTICLES OF ASSOCIATION
The following are brief summaries of certain provisions of the Articles of Association of Royal Dutch and of Dutch law. Such descriptions do not purport to be complete and are qualified in their entirety by reference to Royal Dutch’s Articles of Association, Book 2 of the Netherlands Civil Code and other Dutch laws. A copy of Royal Dutch’s Articles of Association translated into English is incorporated by reference into this Amendment No.2.
General
Royal Dutch was founded in the Netherlands on June 16, 1890 and is registered with the Commercial Register in The Hague, the Netherlands under number 27002690. The object of Royal Dutch, as described in Article 2 of its Articles of Association, is the foundation of, participation in and management and financing of limited liability and other companies or undertakings which are engaged in one or more branches of the oil, natural gas, chemical industry, in mining, power generation and distribution, renewables or in one or more other branches of business. Royal Dutch is further entitled in general to do all that is necessary for the attainment of its object or that is connected therewith in the widest sense.
Royal Dutch Petroleum Company 71
20-F/A (Amendment No. 2) 2002
Table of Contents
Managing Directors and members of the Supervisory Board
Royal Dutch is managed by a Board of Management under the supervision of a Supervisory Board.
| (a) | A Managing Director or member of the Supervisory Board shall not vote in respect of a proposal, arrangement or contract in which he is materially interested. |
| (b) | A Managing Director shall not vote in respect of any matter regarding compensation to himself or to any of the other Managing Directors. Each of the Managing Directors receives a remuneration, which shall be fixed by the Supervisory Board. The maximum aggregate remuneration of the members of the Supervisory Board is fixed by the General Meeting of Shareholders for division by the Supervisory Board among its members. |
| (c) | The Managing Directors are empowered to exercise all powers of Royal Dutch to borrow money subject to the authorisation of the Supervisory Board being required for contracting loans that will mature in more than one year. |
| (d) | Managing Directors and members of the Supervisory Board are not required to hold shares of Royal Dutch in order to be qualified. |
Rights attaching to each class of shares
| (a) | Dividend rights |
Under Dutch law, dividend distributions are limited to the amount by which, prior to such distributions, net assets exceed the aggregate of paid-up share capital and undistributable reserves.
Annual accounts consisting of a balance sheet, profit and loss account and notes to these documents, prepared by the Board of Management and reflecting the reservation of such amounts as the Board of Management, with the approval of the Supervisory Board, determines, are to be submitted each year by the Supervisory Board to a General Meeting of Shareholders for approval.
Out of the profit which is available for distribution, there shall first be distributed on each priority share an amount equal to 4 per cent of its par value. The balance of profit available for distribution then remaining is distributed to the holders of ordinary shares, unless the General Meeting of Shareholders resolves that the whole or part of such profit be carried forward to the following year. Shares acquired and held by Royal Dutch in its own capital are not included in the profit distribution calculation and no distributions are made thereon.
The Board of Management, with the approval of the Supervisory Board, may pay interim dividends on the ordinary shares and priority shares. On the recommendation of the Board of Management and the Supervisory Board, the General Meeting of Shareholders may resolve that a dividend or interim dividend on shares shall be payable in shares of Royal Dutch.
The right to claim payment of a dividend becomes forfeited upon the expiration of six years from the date on which the dividend was first made obtainable, at which time it reverts to Royal Dutch.
| (b) | Voting rights |
Pursuant to Royal Dutch’s Articles of Association, for each ordinary share with a nominal (par) value of€0.56, one vote may be cast at a General Meeting of Shareholders. For each priority share with a nominal (par) value of€448 eight hundred votes may be cast.
| (c) | Rights to share in the company’s profits |
Reference is made to (a) above regarding dividend rights.
| (d) | Liquidation rights |
In the event of a dissolution and liquidation of Royal Dutch, the holders of priority shares are entitled to receive the nominal amount thereof, plus accrued dividends thereon. The balance of the net proceeds of liquidation is to be divided among the holders of ordinary shares in proportion to their nominal amount.
| (e) | Redemption provisions |
Neither the ordinary shares nor the priority shares are subject to any redemption provisions.
| (f) | Sinking fund provisions |
Neither the ordinary shares nor the priority shares are subject to any sinking fund provisions under Royal Dutch’s Articles of Association or as a matter of Dutch law.
| (g) | Liability to further Capital calls |
Since all of the registrant’s issued and outstanding ordinary shares and priority shares have been fully paid in, Royal Dutch has no further capital calls.
| (h) | Discriminating provisions |
There are no provisions under Royal Dutch’s Articles of Association or under Dutch law discriminating against a shareholder because of his ownership of a particular number of ordinary shares.
72 Royal Dutch Petroleum Company
20-F/A (Amendment No. 2) 2002
Table of Contents
| (i) | Pre-emptive rights |
When new ordinary shares are issued, the existing holders of ordinary shares shall have a pre-emptive right in proportion to their holdings, unless the payment is to be other than in cash or the shares are issued to employees of Royal Dutch or a legal entity with which Royal Dutch is associated in a group. With the approval of the Supervisory Board, the Board of Management may resolve to suspend the pre-emptive right if the Board of Management has been designated by the General Meeting of Shareholders as competent to do so. Such designation can only take place for a period in each case of not longer than five years. The resolutions of the Board of Management and the Supervisory Board referred to above may only be passed by unanimous vote of all the Managing Directors and all of the members of the Supervisory Board present or represented at the meeting.
Holders of priority shares have no preferential right in the event of an issue of new shares.
Changing the rights of holders of shares
The rights of holders of ordinary and priority shares can be changed by amendment of the Articles of Association of Royal Dutch. Only the General Meeting of Shareholders can pass resolutions to that effect. Resolutions providing for the amendment of the Articles of Association, or for the dissolution of Royal Dutch, may only be adopted by the General Meeting of Shareholders with the prior consent, or, in the case of the former, subject to the subsequent approval, of a meeting of the holders of priority shares. A resolution providing for the dissolution of Royal Dutch may only be passed by a majority of at least two-thirds of the votes cast at a General Meeting of Shareholders at which at least three-fourths of the issued capital of Royal Dutch is represented. If such proportion of the issued capital is not so represented, such resolution may be adopted at a second general meeting to be held within eight weeks after the first meeting, at which meeting only an absolute majority of the votes cast, irrespective of the part of the issued capital which is represented thereat, shall be required to adopt the resolutions.
General Meetings of Shareholders
General Meetings of Shareholders are to be held in Amsterdam, The Hague or Rotterdam. Notice of the meeting is to be given by advertisement at least three weeks in advance in at least one daily newspaper published in The Hague and two national daily newspapers published in the Netherlands. This period may be reduced to fifteen days in urgent cases. At least one General Meeting of Shareholders is to be held annually. In order to attend a General Meeting of Shareholders and exercise voting rights thereat in person or by proxy, shareholders must be registered as such at a time to be determined by the Board of Management on either the register of shareholders or, in the case of holders of bearer share certificates, on a register designated by the Board of Management, and, in each case, they must have notified Royal Dutch in writing of their desire to exercise these rights not later than at the time and at the place specified in the notice of convocation of the meeting. Failing the designation of a register of holders of bearer share certificates by the Board of Management, holders of bearer share certificates must deposit their certificates against receipt not later than at the time and the place specified in the notice of convocation. None of the times referred to in the previous two sentences may be set on a date earlier than the seventh day before that of the meeting.
General Meetings of Shareholders may be held as often as the Board of Management or the Supervisory Board deem advisable, and may also be held when holders of ordinary shares representing at least one-tenth of the issued share capital address to the Board of Management and to the Supervisory Board a written request to convene a general meeting, specifying the subjects to be discussed. If such request is not acted upon so as to enable the meeting to be held within six weeks, the persons making the request may be empowered by the President of the District Court in The Hague to convene the meeting themselves.
The Agenda for a General Meeting of Shareholders is to be specified in the notice of convocation of the meeting. No other business may be transacted at the meeting.
An absolute majority of the votes cast is required for the adoption of resolutions, except in those cases where Dutch law or the Articles of Association prescribe a larger majority. An absolute majority of the votes cast is required for the appointment of persons to office, provided that, if after two polls such majority has not been obtained, another poll is to be taken between the two persons obtaining the highest number of votes in the second poll, after which in the event of an equality of votes, the election is to be decided by the drawing of lots.
Limitations on rights to own shares
There are no limitations imposed by Dutch law or Royal Dutch’s Articles of Association on the rights to own ordinary shares, including the rights of non-resident or shareholders to hold or exercise voting rights on the ordinary shares.
Provisions, which would delay, defer or prevent a change of control
None, other than the provisions regarding the rights of holders of priority shares as described in “Control of Registrant – Ordinary shares and priority shares”.
Royal Dutch Petroleum Company 73
20-F/A (Amendment No. 2) 2002
Table of Contents
Threshold for disclosure of share ownership
There are no provisions in the Articles of Association of Royal Dutch requiring disclosure of ownership of shares, but Dutch law requires owners of 5% or more of the share capital of a company listed on a Stock Exchange in the European Union or the European Economic Area to notify their interest to the company.
Changes in capital
The conditions imposed by Royal Dutch’s Articles of Association for changes in capital are not more stringent than required under Dutch law.
EXCHANGE CONTROLS AND OTHER LIMITATIONS AFFECTING SECURITY HOLDERS
The Dutch External Financial Relations Act of 1994 enables the Minister of Finance or the Central Bank of the Netherlands, as the case may be, to issue regulations with regard to a number of financial transactions relating to the import and export of capital. The regulations as issued and applied to date have not restricted the activities and operations of Royal Dutch and the Dutch Group companies.
There is no legislative or other legal provision currently in force in the Netherlands or arising under the constituent documents of Royal Dutch restricting remittances to non-resident holders of Royal Dutch’s securities.
TAXATION
Income tax
Royal Dutch is generally required by Dutch law to withhold tax at a rate of 25% on dividends. Under the current income tax convention between the United States and the Netherlands, dividends paid by a Dutch corporation to an individual resident of the United States, a corporation organised under the laws of the United States (or of any state or territory thereof) or any other legal person subject to US Federal income tax with respect to its worldwide income (a “US shareholder”) that qualifies for benefits under the convention are generally subject to Dutch withholding tax at a reduced rate of 15% of the amount of the dividend (provided the shares on which the dividend is paid are not part of the business property of a permanent establishment of the shareholder in the Netherlands). In general, the entire dividend (including the withheld amount) will be dividend income to the US shareholder, not eligible for the dividends received deduction allowed to corporations, and the withholding tax will be treated as a foreign income tax that is eligible for credit against the shareholder’s US income taxes or a deduction subject to certain limitations. Under a provision of the Dutch dividend tax act, Royal Dutch will apply a credit (up to a maximum of 3% of the gross dividend amount) against the amount of the dividend tax withheld before remittance to the Dutch tax authorities. For the 2002 final dividend this credit is 3% of the gross dividend from which dividend tax is withheld. The benefit of this credit is passed to the Group in accordance with the arrangements between Royal Dutch and Shell Transport. Because of this credit, the US tax authorities may take the view that the Dutch withholding tax eligible for credit or a deduction by a US shareholder against its US income tax liability should be limited accordingly. Under said convention, some US organisations that are generally exempt from US Federal income tax and that are constituted and operated exclusively to administer or provide pension, retirement or other employee benefits are exempt at source from withholding tax on dividends received from a Dutch corporation. Under the income tax convention between the United States and the Netherlands rules relating to the qualification of pension funds have been issued. These rules determine the treatment under said convention. US organisations that are exempt from US Federal income tax, that are operated exclusively for religious, charitable, scientific, educational or public purposes and that would be exempt from tax in the Netherlands if they were organised, and carried on all their activities, therein, are subject to withholding tax but may file for a full refund.
For Royal Dutch shareholders resident in any country other than the United States and the Netherlands, the availability of a whole or partial exemption or refund of the Dutch withholding tax is governed by the tax convention, if any, between the Netherlands and the country of the shareholder’s residence.
Taxation on capital gains
Capital gains on the sale of shares of a Dutch company by a US shareholder are generally not subject to taxation by the Netherlands unless the US shareholder has a permanent establishment in the Netherlands and the capital gain is derived from the sale of shares which are part of the business property of the permanent establishment.
Succession duty and gift taxes
Shares of a Netherlands corporation held by an individual who is not a resident or a deemed resident of the Netherlands will generally not be subject to succession duty in the Netherlands on the individual’s death unless the shares are part of the business property of a permanent establishment situated in the Netherlands.
A gift of shares of a Dutch company by a person who is not a resident or a deemed resident of the Netherlands is generally not subject to Dutch gift tax.
74 Royal Dutch Petroleum Company
20-F/A (Amendment No. 2) 2002
Table of Contents
MANAGEMENT
In accordance with its Articles of Association, Royal Dutch is managed by a Board of Management consisting of at least two Managing Directors, under the supervision of a Supervisory Board consisting of at least five members. Managing Directors are appointed by the General Meeting of Shareholders from the persons nominated by the meeting of holders of priority shares and hold office until they retire unless discharged earlier by the General Meeting of Shareholders.
The Supervisory Board is a separate body which does not include the Managing Directors. Members of the Supervisory Board are appointed by the General Meeting of Shareholders from the persons nominated by the meeting of holders of priority shares. Each year, one of the members of the Supervisory Board retires by rotation but is eligible for re-election. Further, a member of the Supervisory Board retires after having served on the Supervisory Board for a period of 10 years or retires effective on the first day of July following the initial April 1 on which the member is 70 years of age.
Nominations for the appointment of a Managing Director or a member of the Supervisory Board shall be made by a meeting of holders of priority shares and may also be made by one or more holders of ordinary shares representing in the aggregate at least 1% of the issued share capital, if approved by the meeting of holders of priority shares. Each such nomination shall contain the names of at least two qualified persons. Shareholders cast all of their votes on either of the two qualified persons. Votes cast at a General Meeting of Shareholders in favour of the election of other persons are void.
If a vacancy occurs on the Board of Management when there are still at least two Managing Directors in office, or on the Supervisory Board when there are still at least five members in office, the Board of Management shall notify the Chairman of the meeting of holders of priority shares, which meeting shall decide, after consulting the Supervisory Board and the Board of Management, whether the vacancy is to be filled. If it is resolved to fill the vacancy, the appointment shall be made at the next General Meeting of Shareholders. If there are not at least two Managing Directors or at least five members of the Supervisory Board still in office, a General Meeting of Shareholders shall be held within three months after that situation has arisen in order to fill the vacancy.
Please see “Controls and Procedures — Investigation and Report to the Group Audit Committee; Management Changes” for information on management changes occurring subsequent to March 3, 2003.
The Managing Directors, members of the Supervisory Board and officers of Royal Dutch at March 3, 2003, were:
Managing Directors
Jeroen van der VeerPresident
Born October 27, 1947. A Dutch citizen. A Managing Director of the Company since 1997 and President since 2000. A Group Managing Director since 1997. Joined the Group in 1971 in refinery process design and held a number of positions in refining and marketing in the Netherlands, Curacao and the UK. Area Co-ordinator Sub-Saharan Africa 1990 – 92 and a Managing Director of Shell Nederland with responsibility for the Pernis refinery and petrochemical complexes at Pernis and Moerdijk as well as the chemicals business 1992 – 95. President and Chief Executive Officer of Shell Chemical Company in the USA 1995 – 97. A member of the Supervisory Board of De Nederlandsche Bank and an Advisory Director to Unilever.
Malcolm Brindeda
Born March 18, 1953. A UK citizen. A Managing Director of the Company since July 2002. A Group Managing Director since July 2002. Joined the Group in 1974. Held various positions in the Netherlands, Brunei, Oman and the UK. General Manager of Shell U.K. Exploration and Production in Aberdeen 1998 – 2001. Country Chairman in the UK 1999 – 2002. Director of Planning, Environment and External Affairs at Shell International Ltd. 2001 – 02.
Walter van de Vijverb
Born November 1, 1955. A Dutch citizen. A Managing Director of the Company since 2001. A Group Managing Director since 2001. Joined the Group in 1979 as a petroleum engineer. Worked in Exploration and Production in Qatar, Oman, the USA, the UK and the Netherlands. General Manager Brent Business Unit of Shell U.K. Exploration and Production in Aberdeen 1993 – 97. Chief Executive Officer of Shell International Gas Ltd. and Chief Executive Officer of Shell Coal International Ltd. in London 1997 – 98. President and Chief Executive Officer of Shell Exploration & Production Company in the USA 1998 – 2001.
Supervisory Board
Aad JacobsChairman
Born May 28, 1936. A Dutch citizen. Chairman of the Supervisory Board since July 2002 and a member of the Supervisory Board since 1998. Due to retire by rotation in 2003. A member of the Board of Management of ING Group 1991 – 98 and its
| a | On March 3, 2004, Malcolm Brinded resigned from the Board of Management of Royal Dutch and was appointed a Director and Managing Director of Shell Transport. |
| b | On March 3, 2004, Walter van de Vijver resigned from the Board of Management of Royal Dutch and as a Group Managing Director. |
Royal Dutch Petroleum Company 75
20-F/A (Amendment No. 2) 2002
Table of Contents
Chairman 1992 – 98. Chairman of the Supervisory Boards of Joh. Enschedé and Imtech. Vice-Chairman of the Supervisory Boards of Buhrmann and VNU and a member of the Supervisory Boards of Euronext, IHC Caland and ING Group.
Maarten van den Bergh
Born April 19, 1942. A Dutch citizen. A member of the Supervisory Board since 2000. Due to retire by rotation in 2004. A Managing Director of the Company 1992 – 2000 and President 1998 – 2000. A Group Managing Director 1992 – 2000. Chairman of the Board of Directors of Lloyds TSB and a member of the Boards of Directors of British Telecom and British Airways.
Jonkheer Aarnout Loudon
Born December 10, 1936. A Dutch citizen. A member of the Supervisory Board since 1997. Due to retire in 2007. A member of the Board of Management of Akzo (which became Akzo Nobel in 1994) 1977 – 94 and its Chairman 1982 – 94. A member of the First Chamber of the Dutch Parliament 1995 – 99. Chairman of the Supervisory Boards of ABN AMRO Bank and Akzo Nobel and a member of the International Advisory Board of Allianz.
Professor Hubert Markl
Born August 17, 1938. A German citizen. A member of the Supervisory Board since July 2002. Due to retire by rotation in 2007. President of the Max-Planck-Gesellschaft 1996 – 2002. Professor of biology at the University of Constance since 1974. A member of the Supervisory Boards of Aventis, BMW and Münchener Rückversicherungsgesellschaft.
Professor Joachim Milberg
Born April 10, 1943. A German citizen. A member of the Supervisory Board since 2000. Due to retire by rotation in 2005. A member of the Board of Management of BMW 1993 – 2002 and its Chairman 1999 – 2002. A member of the Supervisory Boards of Allianz Versicherungs-AG, BMW, John Deere & Company and MAN.
Lawrence Ricciardi
Born August 14,1940. A US citizen. A member of the Supervisory Board since 2001. Due to retire by rotation in 2006. President of RJR Nabisco 1993 – 95. Senior Vice-President and General Counsel of IBM 1995 – 2002. Senior Advisor to Jones Day and Lazard Freres & Co. A member of the Board of Directors of The Reader’s Digest Association.
Henny de Ruiter
Born March 3, 1934. A Dutch citizen. A member of the Supervisory Board since 1994. Due to retire in 2004. A Managing Director of the Company 1983 – 94. A Group Managing Director 1983 – 94. Chairman of the Supervisory Boards of Royal Ahold, Univar and Wolters Kluwer. Vice-Chairman of the Supervisory Board of Aegon and a member of the Supervisory Board of Heineken.
Jan Timmer
Born February 20, 1933. A Dutch citizen. A member of the Supervisory Board since 1996. Due to retire in 2003. President and Chairman of the Board of Management of Royal Philips Electronics 1990 – 96. Chairman of the Supervisory Board of PSV. A member of the Supervisory Board of ING Group.
General Attorney
Robbert van der Vlist
Born February 20, 1944. A Dutch citizen. Joined the Group in 1970 as a Legal Adviser. General Attorney of the Company since 1987.
Nominations
The Supervisory Board and the Board of Directors will propose to the General Meeting of Shareholders of Royal Dutch, to be held on April 23, 2003, to appoint Rob Routs as a Managing Director of Royal Dutch with effect from July 1, 2003.
The Supervisory Board and the Board of Directors will propose to the General Meeting of Shareholders of Royal Dutch, to be held on April 23, 2003, to appoint Wim Kok to the Supervisory Board of Royal Dutch with effect from July 1, 2003.
Aad Jacobs will retire by rotation as member of the Supervisory Board effective July 1, 2003, but it will be recommended to the General Meeting of Shareholders that he be re-elected. Jan Timmer will retire as member of the Supervisory Board effective July 1, 2003.
Relationships between members of the Board of Management, members of the Supervisory Board and officers
There are no arrangements or understandings between Managing Directors, members of the Supervisory Board or officers and any other person pursuant to which they were selected as Managing Directors, members of the Supervisory Board or officers.
There are no family relationships between any Managing Director, member of the Supervisory Board or officer and any other Managing Director, member of the Supervisory Board or officer.
76 Royal Dutch Petroleum Company
20-F/A (Amendment No. 2) 2002
Table of Contents
Share Ownership
The interests in ordinary shares of Royal Dutch, including outstanding share options, of the members of the Supervisory Board and the Managing Directors of Royal Dutch at March 3, 2003, were:
| Share optionsa | Ordinary shares | |||||||
Supervisory Board | ||||||||
| Aad Jacobs | – | – | ||||||
Maarten van den Berghb | 37,950 | 4,000 | ||||||
| Jonkheer Aarnout Loudon | – | 75,000 | ||||||
| Professor Hubert Markl | – | – | ||||||
| Professor Joachim Milberg | – | – | ||||||
| Lawrence Ricciardi | – | – | ||||||
| Henny de Ruiter | – | – | ||||||
| Jan Timmer | – | – | ||||||
Managing Directors | ||||||||
| Jeroen van der Veer | 270,850 | 9,012 | ||||||
| Malcolm Brinded | 50,000 | c | 2,500 | |||||
| Walter van de Vijver | 187,000 | 10,668 | ||||||
| a | Additional information is included in the Notes to the Royal Dutch Financial Statements under “Remuneration – Long-term incentives” on pages R13 and R14. |
| b | No options are granted to members of the Supervisory Board, but options may be outstanding to members who have formerly been a Managing Director. |
| c | Excluding 713,900 options on Shell Transport shares. |
Group Audit Committee
In 1976 the Supervisory Board of Royal Dutch, jointly with the Board of Shell Transport, established a Group Audit Committee. Under its terms of reference, the Committee acts in an advisory capacity to the Boards, providing them with quarterly and annual updates regarding its activities and related recommendations. The Committee regularly considers the effectiveness of risk management processes and internal control within the Group and reviews the financial accounts and reports of the Royal Dutch/ Shell Group of Companies. The Committee also considers both internal and external audit reports (including the results of the examination of the Group Financial Statements) and assesses the performance of internal and external audit.
The members appointed by the Supervisory Board of Royal Dutch are Aad Jacobs (Chairman of the Committee), Henny de Ruiter and Jan Timmer; the members appointed by the Board of Shell Transport are Sir Peter Burt, Luis Giusti and Nina Henderson.
Remuneration and Succession Review Committee
In 1967 the Supervisory Board of Royal Dutch, jointly with the Board of Shell Transport, established a Remuneration Committee. Following restatement of its terms of reference in 1980, this Committee was renamed the Remuneration and Succession Review Committee. The functions of the Committee are to make recommendations on all forms of remuneration with respect to Group Managing Directors and to review matters relating to the succession to the positions of Group Managing Directors.
The members appointed by the Supervisory Board of Royal Dutch are Jonkheer Aarnout Loudon (Chairman of the Committee), Professor Joachim Milberg and Henny de Ruiter; the members appointed by the Board of Shell Transport are Nina Henderson, Sir Peter Job and Sir Mark Moody-Stuart.
Social Responsibility Committee
In 1997 the Supervisory Board of Royal Dutch, jointly with the Board of Shell Transport, established a Social Responsibility Committee. The Committee reviews the policies and conduct of the Royal Dutch/ Shell Group of Companies with respect to the Group’s Statement of General Business Principles as well as the Group’s Health, Safety and Environment Commitment and Policy.
The members appointed by the Supervisory Board of Royal Dutch are Maarten van den Bergh, Jonkheer Aarnout Loudon and Jan Timmer. The members appointed by the Board of Shell Transport are Teymour Alireza, Dr Eileen Buttle and Lord Oxburgh (Chairman of the Committee).
Shell companies have long been open about the values and principles which guide them, and the Group’s Statement of General Business Principles has been publicly available since 1976. The latest revision followed extensive internal and external consultation. The Statement of General Business Principles includes commitments to support fundamental human rights and to contribute to sustainable development.
The Annual Report and Accounts 2002 is distributed together with a copy of The Shell Report 2002 – Meeting the energy challenge, which reviews how Group companies are living up to the Group’s Business Principles and contributing to sustainable development.
Royal Dutch Petroleum Company 77
20-F/A (Amendment No. 2) 2002
Table of Contents
Code of Ethics
For the guidance of principal executives and senior finance officers, a Code of Ethics has been drawn up in conjunction with the Group’s Statement of General Business Principles. This Code of Ethics can be found on the Shell website (see www.shell.com/codeofethics).
Compensation of Directors and Officers
The aggregate amount of remuneration paid to or accrued for all members of the Supervisory Board, the Managing Directors and officers of Royal Dutch as a group by Royal Dutch and companies of the Royal Dutch/ Shell Group of Companies for services in all capacities during the fiscal year ended December 31, 2002, was€8,294,688. In addition,€1,135,727 was paid during 2002 for service during the fiscal year ended December 31, 2001. The aggregate amount set aside to provide pension, retirement and similar benefits for Managing Directors and officers of Royal Dutch by Royal Dutch and companies of the Royal Dutch/ Shell Group of Companies during the fiscal year ended December 31, 2002, was a credit of€163,788. Reference is made to the information given in the Remuneration section on pages R12 to R17 relating to emoluments of the members of the Board of Management and the Supervisory Board.
None of the Managing Directors and members of the Supervisory Board of Royal Dutch has service contracts with Royal Dutch, their employing company or any other Group company providing for benefits upon termination.
SHARES UNDER OPTION AND SHARE PURCHASE PLAN
Five Group companies, one in the Netherlands (Shell Petroleum N.V.), one in the United Kingdom (The Shell Petroleum Company Limited) and three in the United States of America (Shell Oil Company, Shell Petroleum Inc. and Shell Solar Employment Services Inc.) have stock option plans under which options have been or may be granted to executives and other employees of those and other Group companies. Options granted under these plans are for terms of not more than five or ten years at an exercise price of not less than the market value on the date of granting the option.
The securities of Royal Dutch involved in the plans as of March 3, 2003, are 30,006,028 issued and outstanding ordinary shares.
The number of ordinary shares of Royal Dutch under option at March 3, 2003, and the option prices of the shares at the dates the options were granted, per share and in total, were as follows:
| Plan | Exercise pricea | |||||||||||||
| Number of shares | Average | Term | ||||||||||||
| under option | per share | Total | (expiration dates) | |||||||||||
| Shell Petroleum N.V. | 12,689,390 | € | 60.31 | €765,344,026 | 10 years (10/12/07 – 13/11/12) | |||||||||
| The Shell Petroleum Company Limited | 6,249,361 | € | 59.69 | €373,037,036 | 10 years (10/12/07 – 13/11/12) | |||||||||
| Shell Oil Company | 3,460,272 | $ | 52.95 | $ | 183,226,608 | 10 years (01/03/10 – 21/12/10) | ||||||||
Shell Petroleum Inc.b | 10,919,958 | $ | 56.75 | $ | 619,727,128 | 10 years (01/03/10 – 14/11/12) | ||||||||
| a | Euro-denominated exercise prices prior to the fixing of the euro conversion rate in January 1999 are derived from the quotient of guilder prices and the fixed guilders-per-euro conversion rate of 2.20371. |
| b | Including the shares under option of Shell Solar Employment Services Inc. |
The Global Employee Share Purchase Plan enables employees to make contributions, which are applied quarterly to purchase Royal Dutch or Shell Transport Shares at current market value. If the acquired shares are retained in the plan until the end of the twelve-month cycle the employee receives an additional 15% share match. In the USA a variant of this plan is operated where contributions are applied to buy Royal Dutch Shares at the end of the twelve-month cycle. The purchase price is the lower of the market price on the first or last trading day of the cycle reduced by 15%. Group Managing Directors are not eligible to participate in the Global Employee Share Purchase Plan. At March 3, 2003, Group companies held 3,302 Royal Dutch ordinary shares (2002: 25,927) in connection with this plan.
No issue of new shares is involved under any of the plans mentioned above.
78 Royal Dutch Petroleum Company
20-F/A (Amendment No. 2) 2002
Table of Contents
The “Shell” Transport and Trading Company,
Public Limited Company
CONTROL OF REGISTRANT
Shell Transport is not directly or indirectly owned or controlled by another corporation or by any government. As of March 3, 2003, there were the following interests in more than 3% of the issued Ordinary share capital of Shell Transport. Barclays PLC (more than 3% but less than 4%); this interest has subsisted since December 2002. Legal & General Group Plc (more than 3% but less than 4%); this interest has subsisted since January 2003. Between May 2001 and March 2002 The Capital Group Companies Inc. held more than 3% but less than 4% of the issued Ordinary share capital. Prudential plc held more than 3% but less than 4% of the issued Ordinary share capital between March 1998 and March 1999. As of March 3, 2003 the Directors and officers of Shell Transport beneficially owned in aggregate (including shares under option) less than 1% of the total shares of that class outstanding. See “Management – Share Ownership” on page 86.
On October 28, 2004, the Royal Dutch and Shell Transport Boards announced that they had unanimously agreed to propose to their shareholders a transaction through which each Parent Company will become a subsidiary of Royal Dutch Shell plc, which will become a publicly-listed company incorporated in England and Wales and headquartered and tax resident in the Netherlands. Please refer to “Discussion and Analysis of Financial Condition and Results of Operations — Recent Developments” for additional information on this transaction.
NATURE OF TRADING MARKET
The principal trading market for the Ordinary shares of Shell Transport is the London Stock Exchange. Shell Transport Ordinary shares are also listed and traded on stock exchanges in Belgium, France and Germany. Shell Transport Ordinary shares are traded in registered or bearer form, but predominantly in registered form.
American Depositary Receipts representing New York Shares are listed and traded on the New York Stock Exchange and are also admitted to unlisted trading privileges on the Boston, Cincinnati, Midwest, Pacific and Philadelphia Stock Exchanges. The depositary receipts are issued and exchanged at the office of The Bank of New York, 101 Barclay Street, New York, NY 10286, as depositary under a deposit agreement between Shell Transport and the depositary and the holders of receipts.
Each New York Share represents six 25p Ordinary shares of Shell Transport deposited under the deposit agreement. At March 3, 2003, there were outstanding 48,414,148 New York Shares representing approximately 3.00% of the Ordinary share capital of Shell Transport, held by 1,876 holders of record.
At March 3, 2003 there were 3,320,907 Ordinary shares of 25p each representing approximately 0.03% of the Ordinary share capital of Shell Transport held by 884 holders of record registered with an address in the United States.
The following tables set forth the high and low closing sales prices for Shell Transport’s registered Ordinary shares (of 25p nominal value) on the London Stock Exchange and for Shell Transport’s New York Shares (of £1.50 nominal value) on the New York Stock Exchange for the periods specified:
| London | New York | |||||||||||||||
| High | Low | High | Low | |||||||||||||
| Period | £ | £ | $ | $ | ||||||||||||
| 1998 | 4.64 | 3.16 | 46.50 | 31.00 | ||||||||||||
| 1999 | 5.41 | 3.04 | 52.56 | 30.50 | ||||||||||||
| 2000 | 6.27 | 4.12 | 54.06 | 40.00 | ||||||||||||
| 2001 | 6.38 | 4.30 | 53.65 | 38.72 | ||||||||||||
| 2002 | 5.41 | 3.70 | 47.03 | 34.59 | ||||||||||||
| London | New York | |||||||||||||||
| High | Low | High | Low | |||||||||||||
| Period | £ | £ | $ | $ | ||||||||||||
2001 | ||||||||||||||||
| 1st Quarter | 6.01 | 5.25 | 52.44 | 46.35 | ||||||||||||
| 2nd Quarter | 6.38 | 5.39 | 53.65 | 45.70 | ||||||||||||
| 3rd Quarter | 6.00 | 4.30 | 50.97 | 38.72 | ||||||||||||
| 4th Quarter | 5.49 | 4.49 | 47.90 | 39.38 | ||||||||||||
2002 | ||||||||||||||||
| 1st Quarter | 5.26 | 4.51 | 44.87 | 38.48 | ||||||||||||
| 2nd Quarter | 5.41 | 4.67 | 47.03 | 41.99 | ||||||||||||
| 3rd Quarter | 5.09 | 3.70 | 46.70 | 34.59 | ||||||||||||
| 4th Quarter | 4.28 | 3.81 | 40.02 | 35.56 | ||||||||||||
The “ Shell ” Transport and Trading Company, Public Limited Company 79
20-F/A (Amendment No. 2) 2002
Table of Contents
| London | New York | |||||||||||||||
| High | Low | High | Low | |||||||||||||
| Period | £ | £ | $ | $ | ||||||||||||
2002 | ||||||||||||||||
| July | 5.09 | 3.80 | 46.70 | 35.30 | ||||||||||||
| August | 4.60 | 4.06 | 41.85 | 37.27 | ||||||||||||
| September | 4.34 | 3.70 | 39.23 | 34.59 | ||||||||||||
| October | 4.28 | 3.81 | 40.02 | 35.56 | ||||||||||||
| November | 4.19 | 3.99 | 39.33 | 37.34 | ||||||||||||
| December | 4.16 | 3.91 | 38.96 | 37.43 | ||||||||||||
2003 | ||||||||||||||||
| January | 4.21 | 3.50 | 41.05 | 34.40 | ||||||||||||
| February | 3.79 | 3.45 | 36.99 | 34.01 | ||||||||||||
At March 3, 2003 there were 350 First Preference shares of £1 each representing approximately 0.01% of the issued shares of the class held by 2 holders of record registered with an address in the United States of America. At the same date there were 1,375 Second Preference shares of £1 each representing approximately 0.01% of the issued shares of the class held by 7 holders of record registered with an address in the United States of America. (Reference is made to page S10 for additional information on the Preference shares).
MEMORANDUM AND ARTICLES OF ASSOCIATION
The following summarises certain provisions of Shell Transport’s Memorandum and Articles of Association and of English law. This summary is qualified in its entirety by reference to the UK Companies Act of 1985, as amended (the Companies Act), and Shell Transport’s Memorandum and Articles of Association. Copies of Shell Transport’s Memorandum and Articles of Association are incorporated by reference into this Amendment No. 2.
General
Shell Transport was incorporated in England on October 18, 1897 under registered number 54485 for the purpose of carrying on the business of producing, refining, storage, transport, supply and distribution of petroleum and petroleum products as set forth in clause 4 of Shell Transport’s Memorandum of Association.
Directors
Under the Articles of Association of Shell Transport:
| (1) | a Director shall not vote or be counted in the quorum in respect of any matter in which he is materially interested including any matter related to his own compensation; |
| (2) | the Directors may exercise Shell Transport’s power to borrow provided that the borrowings of Shell Transport and its subsidiaries (if any) shall not without the consent of an ordinary resolution of shareholders of Shell Transport exceed the nominal amount of the issued and paid-up share capital of Shell Transport; |
| (3) | Directors over age 70 must retire at each Annual General Meeting, but are eligible for re-election; |
| (4) | Directors are not required to hold shares of Shell Transport to be qualified. |
Rights attaching to shares
| (a) | Dividend rights and rights to share in the company’s profits |
Under English law, dividends are payable on Shell Transport’s shares only out of profits available for distribution, as determined in accordance with accounting principles generally accepted in the United Kingdom and by the Companies Act. Holders of Shell Transport’s Ordinary shares are entitled to receive such dividends as may be declared by the shareholders in general meeting, rateably according to the amounts paid up on such shares, provided that the dividend cannot exceed the amount recommended by the Directors.
Shell Transport’s Board of Directors may pay holders of Ordinary shares such interim dividends as appear to it to be justified by Shell Transport’s financial position. If authorised by an ordinary resolution of the shareholders, the Board of Directors may also make payment of a dividend in whole or in part by the distribution of specific assets (and in particular of paid-up shares or debentures of any other company).
Any dividend unclaimed after 12 years from the date the dividend was due for payment will be forfeited and will revert to Shell Transport.
80 The “ Shell ” Transport and Trading Company, Public Limited Company
20-F/A (Amendment No. 2) 2002
Table of Contents
The holders of Ordinary shares have unrestricted rights to participate in distributions of dividend and capital subject to the rights of the holders of the First Preference shares and Second Preference shares as described below.
The First and Second Preference shares (the Preference shares) confer on the holders the right to a fixed cumulative dividend and rank in priority to Ordinary shares. The fixed dividend on the First Preference shares is payable at the rate of 5.5% per annum and the fixed dividend on the Second Preference shares is payable at the rate of 7% per annum. On a winding-up or repayment the Preference shares also rank in priority to the Ordinary shares for the nominal value of £1 per share (plus a premium, if any, equal to the excess of the daily average price for the respective shares quoted in the London Stock Exchange Daily Official List for a six month period preceding the repayment or winding-up) but do not have any further rights of participation in the profits or assets of Shell Transport.
| (b) | Voting rights and General Meetings of Shareholders |
The holders of Ordinary shares have the right to attend and vote at all General Meetings of the shareholders of Shell Transport.
Voting at any General Meeting of Shareholders is by a show of hands unless a poll, which is a written vote, is duly demanded. On a show of hands, every shareholder entitled to vote, who is present in person, has one vote regardless of the number of shares held. On a poll, every shareholder who is present in person or by proxy has one vote for every £1 in nominal amount of shares held by that shareholder.
A poll may be demanded by any of the following:
| • | the chairman of the meeting; |
| • | at least five shareholders entitled to vote at the meeting; |
| • | any shareholder or shareholders representing in the aggregate not less than one-tenth of the total voting rights of all shareholders entitled to vote at the meeting; or |
| • | any shareholder or shareholders holding shares conferring a right to vote at the meeting on which there have been paid-up sums in the aggregate equal to not less than one-tenth of the total sum paid up on all the shares conferring that right or such shares with a nominal value of not less than £3,000. |
A proxy form will be treated as giving the proxy the authority to demand a poll, or to join others in demanding one.
The necessary quorum for a general meeting is ten persons carrying a right to vote upon the business to be transacted, whether present in person or by proxy.
Matters are transacted at General Meetings of Shareholders by the proposing and passing of resolutions of which there are three kinds:
| • | an ordinary resolution, which includes resolutions for the election of Directors, the approval of financial statements, the payment of dividends, the appointment of auditors, the increase of authorised share capital or the grant of authority to allot shares; |
| • | a special resolution, which includes resolutions amending Shell Transport’s Memorandum and Articles of Association, disapplying statutory pre-emption rights or changing Shell Transport’s name; and |
| • | an extraordinary resolution, which includes resolutions modifying the rights of any class of Shell Transport’s shares at a meeting of the holders of such class or relating to certain matters concerning Shell Transport’s winding up. |
An ordinary resolution requires the affirmative vote of a majority of the votes of those persons voting at a meeting at which there is a quorum.
Special and extraordinary resolutions require the affirmative vote of not less than three-fourths of the persons voting at a meeting at which there is a quorum.
In the case of an equality of votes, whether on a show of hands or on a poll, the chairman of the meeting is entitled to cast the deciding vote in addition to any other vote he may have.
Annual General Meetings must be convened upon advance written notice of 21 days. Other meetings must be convened upon advance written notice of 21 days for the passing of a special resolution and 14 days for any other resolution. The notice must specify the nature of the business to be transacted. The Board of Directors may if they choose make arrangements for shareholders who are unable to attend the place of the meeting to participate at other places.
The “ Shell ” Transport and Trading Company, Public Limited Company 81
20-F/A (Amendment No. 2) 2002
Table of Contents
Under English law, the Directors must convene an extraordinary general meeting of a company on the requisition of members holding not less than one-tenth of such paid-up capital of the company as carries the right of voting at general meetings of the company.
Preference shares do not have voting rights unless their dividend is in arrears or the proposal concerns a reduction of capital, winding-up, an alteration of the Articles of Association or otherwise directly affects their class rights.
| (c) | Rights in a winding-up |
Upon Shell Transport’s winding-up, the balance of assets available for distribution:
| • | after the payment of all creditors including certain preferential creditors, whether statutorily preferred creditors or normal creditors; and |
| • | subject to the rights attached to the First and Second Preference shares (see “Dividend rights and rights to share in the company’s profits” on pages 80 and 81) and to any special rights attaching to any other class of shares, of which there are currently none, is to be distributed among the holders of Ordinary shares according to the amounts paid-up on the shares held by them. This distribution is generally to be made in cash. A liquidator may, however, upon the adoption of an extraordinary resolution of the shareholders, divide among the shareholders the whole or any part of Shell Transport’s assets in kind. |
| (d) | Redemption provisions |
The Ordinary shares and the Preference shares are not subject to any redemption provisions.
| (e) | Sinking fund provisions |
Neither the Ordinary shares nor the Preference shares are subject to any sinking fund provision under Shell Transport’s Memorandum and Articles of Association or as a matter of English law.
| (f) | Liability to further calls |
No holder of Shell Transport’s shares will be required to make additional contributions of capital in respect of Shell Transport’s shares in the future.
| (g) | Discriminating provisions |
There are no provisions discriminating against a shareholder because of his ownership of a particular number of shares.
Variation of rights
The rights attached to any class may be varied, subject to the provisions of the Companies Act, with the consent in writing of holders of three-fourths in value of the shares of that class or upon the adoption of an extraordinary resolution passed at a separate meeting of the holders of the shares of that class. At every such separate meeting, all of the provisions of the Articles of Association relating to proceedings at a general meeting apply, except that the quorum is to be the number of persons who hold or represent by proxy not less than one-third in nominal value of the issued shares of the class. These provisions are not more stringent than required by law in England.
Limitations on rights to own shares
There are no limitations imposed by English law or Shell Transport’s Memorandum or Articles of Association on the rights to own shares, including the right of non-residents or foreign persons to hold or vote Shell Transport’s shares, other than limitations that would generally apply to all of Shell Transport’s shareholders.
Change of control
There are no provisions in the Memorandum or Articles of Association of Shell Transport or of corporate legislation in England that would delay, defer or prevent a change of control.
Threshold for disclosure of share ownership
English law requires disclosure by beneficial owners of 3% or more of the voting share capital of a company listed on a Stock Exchange in the European Union or the European Economic Area to notify their interest to the company. English law also enables a company to require a shareholder to confirm whether he holds the shares as beneficial owner and if not to name the beneficial owner or owners. Under the Articles of Association of Shell Transport, if Shell Transport has not received a response to a statutory notice requiring disclosure of the beneficial owner of shares in Shell Transport within 14 days of issue the Directors may determine
82 The “ Shell ” Transport and Trading Company, Public Limited Company
20-F/A (Amendment No. 2) 2002
Table of Contents
that the shareholder holding the shares in question should be subject to restrictions in respect of those shares. The restrictions may be one or more of the following:
| (i) | withdrawal of right to attend and vote at general meetings; |
| (ii) | no transfer shall be registered in respect of the shares; |
| (iii) | no dividend shall be paid in respect of the shares. |
Capital changes
The conditions imposed by Shell Transport’s Memorandum and Articles of Association for changes in capital are not more stringent than required by English law.
New York Shares (American Depositary Receipts)
One New York Share is equivalent to six Ordinary shares of 25p each. The agent of the Depositary is the registered shareholder and enjoys the rights of a shareholder under the Memorandum and Articles of Association; the rights of the holder of a New York share are specified in the agreement with the Depositary.
EXCHANGE CONTROLS AND OTHER LIMITATIONS AFFECTING SECURITY HOLDERS
There is no legislative or other legal provision currently in force in the United Kingdom or arising under the constituent documents of Shell Transport restricting remittances to non-resident holders of Shell Transport’s securities or affecting the import or export of capital for use by Shell Transport or UK Group companies.
TAXATION
Dividends and Tax Credit
Individual shareholders resident in the UK are entitled to receive a tax credit with dividends received from Shell Transport. The amount of the credit is equal to 10/90ths of the cash dividend. The credit is not repayable in cash when it exceeds the shareholder’s UK tax liability.
There is generally no withholding tax on UK dividends.
Under the current Double Taxation Conventions between the United Kingdom and both the United States and Canada, a US or Canadian resident holder of American Depositary Receipts (ADRs) will (so long as a UK resident individual shareholder is entitled to a tax credit) be entitled to receive an amount equal to the tax credit less UK income tax of up to 15% of the combined amount of the dividend and such tax credit (provided the shares on which the dividend is paid are not effectively connected with a permanent establishment of the shareholder in the UK).
2002 Dividends
US and Canadian resident shareholders will be entitled to a tax credit repayment under the Double Taxation Convention at a rate of 11.11% of the cash dividend, but subject to a withholding tax of 15% based on the combined amount of the dividend and tax credit, with the result that the amount of the repayment will be zero. (It cannot go negative.)
Dividends received by a US shareholder will represent dividend income not eligible for the dividends received deduction allowed to corporations. By default, US shareholders will be taxed on the amount of dividend actually received. However, a US shareholder may elect to be treated as having paid UK withholding tax (at an 11.11% rate) with respect to the receipt of such dividends. As a result of such a choice, any such withholding tax would be treated as increasing the amount of the dividend received by the US shareholder, and subject to certain limitations, may be claimed as a credit or deduction for US Federal income tax purposes.
The entitlement to a tax credit of a shareholder who is resident neither in the UK nor in the USA depends upon such double tax arrangements as exist between the UK and the country of the shareholder’s residence.
Taxation on Capital Gains
Under the current Double Taxation Convention between the United States and the United Kingdom, capital gains of residents of the USA may be taxed in accordance with the provisions of UK domestic law. Under present UK law, residents of the USA who are not resident and not ordinarily resident in the UK will not be liable for UK taxation on capital gains made on the disposal of their shares unless the shares are held in connection with a trade or business carried on in the UK through a branch or agency.
Inheritance Tax
Under the current Estate and Gift Tax Convention between the United States and the United Kingdom, Ordinary shares held by an individual who is domiciled for the purpose of the Convention in the USA and is not for the purpose of the Convention a national
The “ Shell ” Transport and Trading Company, Public Limited Company 83
20-F/A (Amendment No. 2) 2002
Table of Contents
of the UK will not be subject to UK inheritance tax on the individual’s death or on a gift of the shares in the seven years prior to death unless the shares are part of the business property of a permanent establishment of the individual in the UK, or, in the case of a shareholder who performs independent personal services, pertain to a fixed base situated in the UK.
Stamp Duty Reserve Tax
The United Kingdom Government currently imposes a 1.5% stamp duty reserve tax on the creation of new depository receipts representing shares of UK companies. The tax does not apply to the purchase and subsequent transfer of depository receipts already in issue, nor where the holder surrenders an existing depository receipt in exchange for the underlying shares. In the case of New York shares represented by ADRs issued on or after March 18, 1991 by the Bank of New York, the depository under the deposit agreement referred to under the Item entitled “Nature of trading market” on page 79, the tax payable is calculated on the value of the underlying registered shares at the date such shares are transferred to the Bank of New York.
MANAGEMENT
The business of Shell Transport is managed by a Board of Directors of not less than three and not more than 20 in number. There are 11 Directors in office, of whom two are Managing Directors. Managing Directors are appointed by the Board from among the members of the Board. Pursuant to Shell Transport’s Articles of Association, a minimum of one third of the Directors (or if their number is not a multiple of three, the number nearest to one third) shall retire by rotation at each Annual General Meeting of Shareholders. The Directors to retire by rotation on each occasion shall be those of the Directors who held office at the time of the two preceding annual general meetings and who did not retire at either of them. If the number of Directors so retiring is less than the minimum additional Directors up to that number shall retire. The additional Directors to retire on each occasion shall be the Directors who have been longest in office, and if some Directors have been in office for an equal period of time, the Director(s) to retire shall (unless they otherwise agree between themselves) be chosen by lot. In 2003 four Directors will retire at the Annual General Meeting in accordance with these arrangements. Directors appointed by the Board vacate office at the next Annual General Meeting and offer themselves for election. Under the Articles of Association of Shell Transport such new Directors are not included in the number of Directors liable to retire by rotation at the next Annual General Meeting. Sir Peter Burt and Sir John Kerr will be vacating office and offering themselves for election at the Annual General Meeting in accordance with this provision.
On June 23, 2004, Peter Voser was appointed Group Chief Financial Officer and a Director of Shell Transport with effect from October 4, 2004.
Please see “Controls and Procedures – Investigation and Report to the Group Audit Committee; Management Changes” for additional information on management changes occurring subsequent to March 3, 2003.
The Directors, Managing Directors and officers of Shell Transport at March 3, 2003, were:
Managing Directors
Sir Philip WattsKCMG Chairmana
Born June 25, 1945. A UK citizen. A Director and a Managing Director of Shell Transport since July 1, 1997 and Chairman since July 1, 2001. A Group Managing Director since 1997. Joined the Group as a seismologist in 1969, and held positions in Asia Pacific and Europe leading to Exploration Director, Shell UK 1983 – 85. Head of various Exploration and Production functions in The Hague 1985 – 91. Chairman and Managing Director in Nigeria 1991 – 94, and Regional Co-ordinator, Europe 1994 – 95. Director Planning, Environment and External Affairs, Shell International 1996 – 97. Chief Executive Officer, Exploration and Production 1997 – 2001. Currently Chairman of the Executive Committee of the World Business Council for Sustainable Development. Also Chairman of the International Chamber of Commerce’s UK governing body and Trustee of the Said Business School Foundation, University of Oxford.
Paul Skinner
Born December 24, 1944. A UK citizen. A Director and a Managing Director of Shell Transport and a Group Managing Director since January 1, 2000. Chief Executive Officer, Oil Products since 1999. Joined the Group as a student in 1963 and then worked in Chemicals from 1966 in sales and marketing assignments in the UK, Greece and Nigeria. Moved to the oil business in 1979, holding a succession of senior roles in the UK, New Zealand and Norway. President, Shell International Trading Company, 1991 – 95 and additionally responsible for the shipping business 1995 – 96. Director, Strategy and Business Services, Oil Products 1996 – 98. President, Shell Europe Oil Products 1998 – 99. Currently a non-executive Director of Rio Tinto plc and Rio Tinto Limited and a member of the Board of INSEAD, the European/ Asian business school.
| a | On March 3, 2004, Sir Philip Watts resigned as Chairman of the Board of Shell Transport and as Managing Director. At that time, Malcom Brinded resigned from the Board of Management of Royal Dutch and was appointed a Director and Managing Director of Shell Transport and Lord Oxburgh was appointed interim non-executive chairman of Shell Transport. |
84 The “ Shell ” Transport and Trading Company, Public Limited Company
20-F/A (Amendment No. 2) 2002
Table of Contents
Non-executive Directors
Teymour Alireza
Born September 7, 1939. A Saudi Arabian citizen. A Director of Shell Transport since November 12, 1997. President and Deputy Chairman, The Alireza Group. Chairman National Pipe Company Ltd, Saudi Arabia. Director Arabian Gulf Investments (Far East) Ltd, Hong Kong and of Riyad Bank Saudi Arabia. Member of the International Board of Trustees of the World Wide Fund for Nature.
Sir Peter BurtFRSE
Born March 6, 1944. A UK citizen. A Director of Shell Transport since July 25, 2002. Executive Deputy Chairman of HBOS plc and Governor of the Bank of Scotland 2001 – 03. Group Chief Executive of Bank of Scotland 1996 – 2001. Joined the Bank of Scotland in 1975. Chief General Manager of the Bank 1988 – 96. Worked in the computer industry in the USA and the UK 1968 – 74. A Director of a number of charitable organisations.
Dr Eileen ButtleCBE
Born October 19, 1937. A UK citizen. A Director of Shell Transport since July 8, 1998. Retired in 1994 from a career of public scientific appointments. Member of a number of Government and EU advisory committees of environmental aspects of national and European research and of Boards of Trustees of environmental non-governmental organisations.
Luis Giusti
Born November 27, 1944. A Venezuelan citizen. A Director of Shell Transport since September 13, 2000. Joined the Venezuelan Shell oil company in 1966, and the Venezuelan state oil company, Petroleos de Venezuela, SA (PDVSA) in 1976. Chairman and CEO of PDVSA 1994 – 99. Currently a Senior Adviser at the Center for Strategic and International Studies in Washington DC and also acts as a consultant in oil and energy.
Mary (Nina) Henderson
Born July 6, 1950. A US citizen. A Director of Shell Transport since May 17, 2001. 1972 – 2001 wide experience in marketing consumer goods with Bestfoods, a major US foods company, rising to President of a major division and Corporate Vice President responsible for worldwide core business development. Currently a non-executive Director of Pactiv Corporation, AXA Financials Inc., Del Monte Foods Company and Visiting Nurse Service of New York.
Sir Peter JobKBE
Born July 13, 1941. A UK citizen. A Director of Shell Transport since August 2, 2001. Chief Executive of Reuters plc, 1991 – 2001 following wide experience in that company from 1963 in Latin America, Africa, Asia and the Middle East. Currently a non-executive Director of Schroders plc, GlaxoSmithKline plc, TIBCO Software Inc, Instinet Group Inc, Multex.com, Inc and a member of the Supervisory Board of Deutsche Bank AG and of Bertelsmann AG.
Sir John KerrGCMG
Born February 22, 1942. A UK citizen. A Director of Shell Transport since July 25, 2002. Member of United Kingdom Diplomatic Service 1966 – 2002 and Head of the Service 1997 – 2002. Principal Private Secretary to the Chancellor of the Exchequer 1981 – 84. UK Permanent Representative to the EU 1990 – 95. British Ambassador to the United States 1995 – 97. Foreign Office Permanent Under Secretary of State 1997 – 2002. Secretary-General of the Convention, chaired by President Giscard d’Estaing, on future EU institutional arrangements. Currently a non-executive Director of Scottish American Investment Trust plc; Trustee of National Gallery and of Rhodes Trust.
Sir Mark Moody-StuartKCMG
Born September 15, 1940. A UK citizen. A Director pf Shell Transport since July 1, 1991. Chairman 1997 – 2001 and a Group Managing Director 1991 – 2001. A non-executive Director since July, 2001. Currently Chairman of Anglo American plc and a Director of HSBC Holdings plc and Accenture. Member of the UN Secretary General’s Advisory Council for the Global Compact.
Lord OxburghKBE FRS
Born November 2, 1934. A UK citizen. A Director of Shell Transport since January 10, 1996. Scientific and University appointments 1960 – 88. Chief Scientific Adviser, Ministry of Defence 1988 – 93. Rector, Imperial College of Science, Technology and Medicine, 1993 – 2001. Currently Chairman SETNET and Chairman House of Lords Select Committee on Science and Technology.
The “ Shell ” Transport and Trading Company, Public Limited Company 85
20-F/A (Amendment No. 2) 2002
Table of Contents
Company Secretary
Jyoti Munsiff
Joined the Group in 1969 as a Legal Adviser. Appointed Company Secretary in 1993.
Directors offering themselves for election or re-election
The Directors retiring by rotation at the Annual General Meeting to be held on April 23, 2003 are: Sir Philip Watts, Mr Teymour Alireza, Sir Mark Moody-Stuart and Paul Skinner. All will offer themselves for re-election. Sir Peter Burt and Sir John Kerr were appointed as Directors by the Board with effect from July 25, 2002 and will be vacating office and offering themselves for election by the shareholders at the Annual General Meeting.
The Board will recommend to the Annual General Meeting the election of Judith Boynton as a Director of the Company with effect from July 1, 2003, it is intended that she will be appointed a Managing Director of the Company. Ms. Boynton is the Director of Finance and Chief Financial Officer for the Royal Dutch/ Shell Group of Companies, which roles she will retain.c
Mr Paul Skinner will be retiring after 40 years service with the Royal Dutch/ Shell Group of Companies on September 30, 2003.
Arrangements and/or relationships between Directors and officers
There are no arrangements or understandings between Directors or officers and any other person pursuant to which they were selected as Directors or officers. There are no family relationships between any Director or executive officer and any other Director or executive officer.
Share Ownership
Directors of Shell Transport had the following beneficial interests in Shell Transport at March 3, 2003:
| Share Optionsa | 25p Ordinary shares | |||||||
Managing Directors | ||||||||
| Sir Philip Watts | 2,003,001 | 66,723 | ||||||
| Paul Skinner | 1,803,151 | 60,502 | ||||||
Non-executive Directors | ||||||||
| Teymour Alireza | – | 29,093 | ||||||
| Sir Peter Burt | – | 10,000 | ||||||
| Dr Eileen Buttle | – | 3,400 | ||||||
| Luis Giusti | – | – | ||||||
| Nina Henderson | – | 9,000 | ||||||
| Sir Peter Job | – | – | ||||||
| Sir John Kerr | – | 10,000 | ||||||
| Sir Mark Moody-Stuart | 927,800 | 600,000 | ||||||
| Lord Oxburgh | – | 5,829 | ||||||
| a | Additional information is included in the Notes to the Shell Transport Financial Statements under “Remuneration Report – Share options” on page S20. |
Directors’ share interests in Shell Transport under the Deferred Bonus Planb
The interests of Directors in the Ordinary shares of Shell Transport pursuant to the Deferred Bonus Plan at March 3, 2003:
| 25p Ordinary shares | ||||||||||||||||
| Matching/ | ||||||||||||||||
| 2001 Bonus | dividend | Total | ||||||||||||||
| deferred | awards | Dec 31, 2002 | Release date | |||||||||||||
| Sir Philip Watts | 28,455 | 15,374 | 43,829 | 11.03.05 | ||||||||||||
| Paul Skinner | 21,138 | 11,421 | 32,559 | 11.03.05 | ||||||||||||
| b | Additional information is included in the notes to the Shell Transport Financial Statements under “Remuneration Report – Remuneration of the Directors” on page S19. |
Group Audit Committee
In 1976 the Board of Shell Transport, jointly with the Supervisory Board of Royal Dutch, established a Group Audit Committee. Under its terms of reference the Committee acts in an advisory capacity to the Boards, providing them with quarterly and annual updates regarding its activities and related recommendations. The Committee regularly considers the effectiveness of risk
| c | On April 18, 2004, Judith Boynton stepped aside from her position as Group Chief Financial Officer. |
86 The “ Shell ” Transport and Trading Company, Public Limited Company
20-F/A (Amendment No. 2) 2002
Table of Contents
management processes and internal control within the Group and reviews the financial accounts and reports of the Royal Dutch/ Shell Group of Companies. The Committee also considers both internal and external audit reports (including the results of the examination of the Group Financial Statements) and assesses the performance of internal and external audit.
The Directors of Shell Transport appointed to the Committee are currently Sir Peter Burt, Luis Giusti and Nina Henderson; the members appointed by the Supervisory Board of Royal Dutch are currently Aad Jacobs (Chairman of the Committee), Henny de Ruiter and Jan Timmer.
Remuneration and Succession Review Committee
In 1967 the Board of Shell Transport, jointly with the Supervisory Board of Royal Dutch, established a Remuneration Committee. Following restatement of its terms of reference in 1980, this Committee was renamed as Remuneration and Succession Review Committee. The functions of the Committee are to make recommendations on all forms of remuneration with respect to Group Managing Directors and to review matters relating to the succession to the positions of Group Managing Directors.
The members appointed by the Board of Shell Transport are currently Nina Henderson, Sir Peter Job and Sir Mark Moody-Stuart; the members appointed by the Supervisory Board of Royal Dutch are currently Jonkheer Aarnout Loudon (Chairman of the Committee), Professor Joachim Milberg and Henny de Ruiter. The Chairman of the Committee is currently an appointee of Royal Dutch and Sir Peter Job has been nominated by the Board of Shell Transport to respond at the Annual General Meeting to any questions relating to remuneration issues.
Social Responsibility Committee
In 1997 the Board of Shell Transport, jointly with the Supervisory Board of Royal Dutch, established a Social Responsibility Committee. The Committee reviews the policies and conduct of the Royal Dutch/ Shell Group of Companies with respect to the Group’s Statement of General Business Principles as well as the Group’s Health, Safety and Environment Commitment and Policy.
The members appointed by the Board of Shell Transport are currently Teymour Alireza, Dr Eileen Buttle and Lord Oxburgh (Chairman of the Committee). The members appointed by the Supervisory Board of Royal Dutch are currently Maarten van den Bergh, Jonkheer Aarnout Loudon and Jan Timmer.
Shell companies have long been open about the values and principles which guide them, and the Group’s Statement of General Business Principles has been publicly available since 1976. The latest revision followed extensive internal and external consultation. The Statement of General Business Principles includes commitments to support fundamental human rights and to contribute to sustainable development.
The Annual Report and Accounts 2002 is distributed with a copy of The Shell Report 2002 – Meeting the energy challenge, which reviews how Group companies are living up to the Group’s Business Principles and contributing to sustainable development.
Code of Ethics
For the guidance of principle executives and senior financial officers, a Code of Ethics has been drawn up in conjunction with the Group’s Statement of General Business Principles. This Code of Ethics can be found on the Shell website (see www.shell.com/codeofethics).
Compensation of Directors and Officers
The aggregate amount of remuneration paid to or accrued for Directors, Managing Directors and officers of Shell Transport as a group by Shell Transport and companies of the Royal Dutch/ Shell Group of Companies for services in all capacities during the fiscal year ended December 31, 2002, was £3,734,394. In addition, £1,247,218 was paid during 2002 for service during the fiscal year ended December 31, 2001. The aggregate amount set aside to provide pension, retirement and similar benefits for Directors, Managing Directors and officers of Shell Transport by Shell Transport and companies of the Royal Dutch/ Shell Group of Companies during the fiscal year ended December 31, 2002, was nil.
Reference is made to the information given in the Remuneration section on pages S15 to S20 relating to Directors’ emoluments.
None of the Directors of Shell Transport has service contracts with Shell Transport, their employing company or any other Group company providing for benefits upon termination.
The “ Shell ” Transport and Trading Company, Public Limited Company 87
20-F/A (Amendment No. 2) 2002
Table of Contents
SHARES UNDER OPTION AND SHARE PURCHASE PLAN
Two Group companies, one in the Netherlands (Shell Petroleum N.V.) and one in the United Kingdom (The Shell Petroleum Company Limited), have stock option plans under which options have been or may be granted to executives and other employees of those and other Group companies. Options granted under these plans are at a price of not less than the market value at the date of granting the option and for the terms indicated in the tabulation below.
The securities of Shell Transport involved in the plans as of March 3, 2003, are 101,286,254 issued and outstanding Ordinary shares.
The number of Ordinary shares under option at March 3, 2003, and the option prices of the Ordinary shares at the date the options were granted, per share and in total, were as follows:
| Option price | ||||||||||||||
| Number of shares | Average | Term | ||||||||||||
| Plan | under option | per share | Total | (expiration dates) | ||||||||||
| Shell Petroleum N.V. | 1,200 | £4.39 | £5,268 | 5 yearsa | ||||||||||
| (04/10/02 – 03/10/03) | ||||||||||||||
| Shell Petroleum N.V. | 26,559,900 | £5.23 | £138,997,378 | 10 years | ||||||||||
| (10/12/07 – 13/11/12) | ||||||||||||||
| The Shell Petroleum Company Limited | 74,725,154 | £5.10 | £380,961,270 | 10 years (10/12/07 – 13/11/12) | ||||||||||
| a | A five year option under the Shell Petroleum N.V. plan with a normal expiration date of 10/12/02 has in accordance with its terms been extended to an expiration date of 03/10/03 due to the death of the participant who was granted the option. |
During 1986 The Shell Petroleum Company Limited established a savings-related share option scheme approved by the United Kingdom Inland Revenue pursuant to the Finance Act 1980 (now consolidated into the Income and Corporation Taxes Act 1988) under which options have been or may be granted over Ordinary shares of Shell Transport to eligible employees of certain Group companies in the United Kingdom. Options granted under the scheme are at a price of not less than the market value shortly before the date of grant and are normally exercisable after completion of a contractual savings period of either three or five years. In 1998 Shell Petroleum N.V. established a similar savings related share option scheme. At March 3, 2003 there were 15,847,077 issued and outstanding Ordinary shares of Shell Transport under option to such employees pursuant to the rules of those schemes at prices between £3.55 and £5.69.
The Global Employee Share Purchase Plan implemented in 2001, enables employees to make contributions, which are applied quarterly to purchase Royal Dutch or Shell Transport shares at current market value. If the acquired shares are retained in the Plan until the end of the twelve-month cycle the employee receives an additional 15% share match. In the USA a variant of the plan is operated where contributions are applied to buy Royal Dutch shares at the end of the twelve-month cycle. The purchase price is the lower of the market price on the first or last trading day of the cycle reduced by 15%. Group Managing Directors are not eligible to participate in the Global Employee Share Purchase Plan. At March 3, 2003, 14,578 Shell Transport Ordinary shares (2001: 77,604) were held by Group companies in connection with this Plan.
No issue of new shares is involved under any of the plans or schemes mentioned above.
88 The “ Shell ” Transport and Trading Company, Public Limited Company
20-F/A (Amendment No. 2) 2002
Table of Contents
Index to the Financial Statements and Exhibits
| (A) Financial Data* | Page | |||
Royal Dutch Petroleum Company: | ||||
Report of Registered Independent Public Accountants | R1 | |||
Financial Statements | ||||
| Profit and Loss Account | R2 | |||
| Statement of Appropriation of Profit | R2 | |||
| Earnings per ordinary share | R2 | |||
| Balance Sheet | R2 | |||
| Statement of Cash Flows | R2 | |||
| Notes to the Financial Statements | R3 | |||
| Remuneration | R12 | |||
The “Shell” Transport and Trading Company, Public Limited Company: | ||||
Report of Registered Independent Public Accountants | S1 | |||
Financial Statements | ||||
| Profit and Loss Account | S2 | |||
| Earnings per Ordinary share | S2 | |||
| Balance Sheet | S2 | |||
| Statement of Total Recognised Gains and Losses | S3 | |||
| Statement of Retained Profit | S3 | |||
| Statement of Cash Flows | S4 | |||
| Notes to the Financial Statements | S5 | |||
| Remuneration Report | S15 | |||
Royal Dutch/ Shell Group of Companies: | ||||
Report of Registered Independent Public Accountants on the | G1 | |||
US GAAP Financial Statements | ||||
| Statement of Income | G2 | |||
| Statement of Comprehensive Income and Parent Companies’ Interest in Group Net Assets | G2 | |||
| Statement of Assets and Liabilities | G3 | |||
| Statement of Cash Flows | G4 | |||
| Notes to the US GAAP Financial Statements | G5 | |||
Report of Registered Independent Public Accountants on the | G43 | |||
Netherlands GAAP Financial Statements | ||||
| Statement of Income | G44 | |||
| Statement of Comprehensive Income and Parent Companies’ Interest in Group Net Assets | G44 | |||
| Statement of Assets and Liabilities | G45 | |||
| Notes to the Netherlands GAAP Financial Statements | G46 | |||
Supplementary information – Oil and Gas (unaudited) | G54 | |||
| Reserves | G54 | |||
| Standardised measure of discounted future cash flows | G68 | |||
Supplementary information – Derivatives and other Financial Instruments and Derivative Commodity Instruments | G70 | |||
Index to the Financial Statements and Exhibits 89
20-F/A (Amendment No. 2) 2002
Table of Contents
| (B) Exhibits | Page | |||||
| (B) Exhibits | E1 | |||||
| 1.1 | Articles of Association of Royal Dutch (incorporated by reference to Exhibit 1.1 to the Annual Report on Form 20-F (Commission File Nos. 1-3788 and 1-4039) of Royal Dutch and Shell Transport filed with the Securities and Exchange Commission on March 31, 2003) | |||||
| 1.2 | Memorandum and Articles of Association of Shell Transport (incorporated by reference to the Report of Foreign Issuer on Form 6-K (Commission File No. 1-4039) of Shell Transport furnished to the Securities and Exchange Commission on June 21, 2002) | |||||
| 4.1 | Adjustment Agreement between Royal Dutch and Shell Transport dated July 5, 1907, and certain amendments thereto (incorporated by reference to Exhibit 4.1 to the Annual Report on Form 20-F (Commission File Nos. 1-3788 and 1-4039) of Royal Dutch and Shell Transport filed with the Securities and Exchange Commission on March 31, 2003) | |||||
| 4.2 | Shell Petroleum N.V. Stock Option Plan, as amended (incorporated by reference to the Post-Effective Amendment No. 1 to Registration Statement on Form S-8 (Registration No. 333-7590) of Royal Dutch and Shell Transport filed with the Securities and Exchange Commission on June 28, 2001) | |||||
| 4.3 | Shell Petroleum Company Limited Stock Option Plan (1967), as amended (incorporated by reference to the Post-Effective Amendment No. 1 to Registration Statement on Form S-8 (Registration No. 333-7590) of Royal Dutch and Shell Transport filed with the Securities and Exchange Commission on June 28, 2001) | |||||
| 8 | Significant Group companies as at December 31, 2002 (incorporated by reference to Exhibit 8 to the Annual Report on Form 20-F (Commission File Nos. 1-3788 and 1-4039) of Royal Dutch and Shell Transport filed with the Securities and Exchange Commission on March 31, 2003) | |||||
| 23.1 | Consent of KPMG Accountants N.V., The Hague | E2 | ||||
| 23.2 | Consent of PricewaterhouseCoopers LLP, London | E3 | ||||
| 23.3 | Consent of KPMG Accountants N.V., The Hague and PricewaterhouseCoopers LLP, London | E4 | ||||
| 23.4 | Consent of KPMG Accountants N.V., The Hague | E5 | ||||
| 23.5 | Consent of KPMG Accountants N.V., The Hague and PricewaterhouseCoopers LLP, London | E6 | ||||
| 23.6 | Consent of KPMG Accountants N.V., The Hague and PricewaterhouseCoopers LLP, London | E7 | ||||
| 23.7 | Consent of KPMG Accountants N.V., The Hague and PricewaterhouseCoopers LLP, London | E8 | ||||
| 99.1 | Section 302 Certification of Royal Dutch | E9 | ||||
| 99.2 | Section 302 Certification of Royal Dutch | E10 | ||||
| 99.3 | Section 302 Certification of Shell Transport | E11 | ||||
| 99.4 | Section 302 Certification of Shell Transport | E12 | ||||
| 99.5 | Section 906 Certification of Royal Dutch | E13 | ||||
| 99.6 | Section 906 Certification of Shell Transport | E14 | ||||
| * | Schedules not included have been omitted because they are not applicable or not required. Alternatively, the required information is shown in the financial statements or notes thereto. Summarised financial information in aggregate for majority-owned subsidiaries not consolidated and 50% or less-owned persons, the investments in which are accounted for by the equity method, has been provided in the notes to the financial statements. Separate financial statements for any such individual majority-owned subsidiary not consolidated or 50% or less-owned person, the investments in which are accounted for by the equity method, have been omitted because none constitutes a “significant subsidiary”. |
90 Index to the Financial Statements and Exhibits
20-F/A (Amendment No. 2) 2002
Table of Contents
Royal Dutch Petroleum Company
Report of Registered Independent Public Accountants
To: Royal Dutch Petroleum Company
We have audited the Financial Statements of Royal Dutch Petroleum Company for the years 2002, 2001 and 2000 appearing on pages R2 to R11. The preparation of these Financial Statements is the responsibility of the Board of Management. Our responsibility is to express an opinion on the Financial Statements based on our audits.
We conducted our audits in accordance with the standards of the Public Company Accounting Oversight Board (United States). Those standards require that we plan and perform the audits to obtain reasonable assurance about whether the Financial Statements are free of material misstatement. An audit includes examining, on a test basis, evidence supporting the amounts and disclosures in the Financial Statements. An audit also includes assessing the accounting principles used and significant estimates made by the Board of Management in the preparation of the Financial Statements, as well as evaluating the overall Financial Statement presentation. We believe that our audits provide a reasonable basis for our opinion.
In our opinion, the Financial Statements referred to above present fairly, in all material respects, the financial position of Royal Dutch Petroleum Company at December 31, 2002 and 2001, and the results of its operations and its cash flows for each of the three years in the period ended December 31, 2002 in accordance with generally accepted accounting policies in the Netherlands.
The report of Registered independent public accountants on the 2002, 2001 and 2000 Financial Statements of the Royal Dutch/ Shell Group of Companies, which form part of the Financial Statements of Royal Dutch Petroleum Company, appears on page G43.
As discussed in Note 2(a) on pages R3 and R4, the Company has restated its Financial Statements for the three years ended December 31, 2002 and made certain changes in its accounting principles.
As discussed in Note 2(b) on page R4, the Company restated its Financial Statements for the three years ended December 31, 2002, to correct for the impact of the Second Reserves Restatement.
As discussed in Note 12 on pages R8 and R9, the Company has restated its Financial Statements for the three years ended December 31, 2002 to change its method of accounting for earnings per share.
Accounting principles generally accepted in the Netherlands vary in certain significant respects from accounting principles generally accepted in the United States of America. Information relating to the nature and effect of such differences is presented in Note 15 on pages R9 and R10.
/s/ KPMG Accountants N.V.
-----------------------------------------------------
KPMG Accountants N.V., The Hague — The Netherlands
Registered independent public accountants
March 5, 2003, except for Note 2(a) (First Restatement of previously issued financial statements), Note 12 (Earnings per share), and Note 15 (Reconciliation between Netherlands GAAP and US GAAP (as restated)), which are as of May 22 2004, and except for Note 2(b) (Second Restatement of previously issued financial statements) and Note 16 (Subsequent events), which are as of March 3, 2005.
Royal Dutch Petroleum Company R 1
20-F/A (Amendment No. 2) 2002
Table of Contents
Financial Statements
| Profit and Loss Account (as restated) | € million | |||||||||||||||
| Note | 2002 | 2001 | 2000 | |||||||||||||
| Share in the net income of companies of the Royal Dutch/ Shell Group | 4 | 6,076 | 6,897 | 8,314 | ||||||||||||
| lessAdministrative expenses | 5 | 6 | 4 | |||||||||||||
| 6,071 | 6,891 | 8,310 | ||||||||||||||
| Interest income | 28 | 33 | 24 | |||||||||||||
| Profit before taxation | 6,099 | 6,924 | 8,334 | |||||||||||||
| lessTaxation | 8 | 10 | 7 | |||||||||||||
| Profit after taxation | 6,091 | 6,914 | 8,327 | |||||||||||||
| Statement of Appropriation of Profit (as restated) | € million | |||||||||||||||
| Note | 2002 | 2001 | 2000 | |||||||||||||
| Profit after taxation | 6,091 | 6,914 | 8,327 | |||||||||||||
| Taken from/(to) Statutory investment reserve | 5 | (2,759 | ) | (749 | ) | (2,620 | ) | |||||||||
| Undistributed profit at beginning of year | 2,670 | 2,701 | 402 | |||||||||||||
| Repurchase of share capital | (847 | ) | (2,654 | ) | – | |||||||||||
| Unclaimed dividends forfeited | 1 | 1 | 1 | |||||||||||||
| Available for distribution | 5,156 | 6,213 | 6,110 | |||||||||||||
| lessInterim dividenda | 1,506 | b | 1,501 | 1,436 | ||||||||||||
| Final dividend | 2,084 | b c | 2,042 | 1,973 | ||||||||||||
| 3,590 | 3,543 | 3,409 | ||||||||||||||
| Undistributed profit at end of year | 1,566 | 2,670 | 2,701 | |||||||||||||
| a | Including 4% cumulative preference dividend amounting to€26,880 on priority shares (2000 and 2001: €27,227). |
| b | No dividends are paid on ordinary shares acquired and held by the Company in its own capital. |
| c | Proposed final dividend, subject to finalisation by the General Meeting of Shareholders to be held on April 23, 2003. |
| Earnings per ordinary share (as restated)a | € | |||||||||||||||
| 2002 | 2001 | 2000 | ||||||||||||||
| Net income/profit after taxation | 2.96 | 3.30 | 3.91 | |||||||||||||
| The earnings per share amounts shown above are directly related to profit after taxation. In the opinion of the Board of Management, these are the most meaningful since they reflect the full entitlement of the Company in the income of Group companies. The earnings per share calculation includes shares held to back share options (refer to Note 22 of the Group Financial Statements). There is no difference between basic and diluted earnings per share. |
| a | On weighted average 2,092,718,616 shares in issue during the year 2002 (2001: on 2,119,873,567 and 2000: on 2,144,296,352 shares in issue). For this purpose shares repurchased under the buyback programme are deemed to have been cancelled on purchase date. |
| Balance Sheet (as restated)a | € million | ||||||||||||
| Dec 31 | Dec 31 | ||||||||||||
| Note | 2002 | 2001 | |||||||||||
| Fixed assets | |||||||||||||
| Financial fixed assets | |||||||||||||
| Investments in companies of the Royal Dutch/ Shell Group | 5 | 34,986 | 38,418 | ||||||||||
| Current assets | |||||||||||||
| Receivables | |||||||||||||
| Dividends receivable from companies of the Royal Dutch/ Shell Group | 2,982 | 4,111 | |||||||||||
| Other receivables | 6 | 36 | 23 | ||||||||||
| Cash and cash equivalents | 589 | 549 | |||||||||||
| 3,607 | 4,683 | ||||||||||||
| Current liabilities | |||||||||||||
| Final dividend | 2,084 | b | 2,042 | ||||||||||
| Other liabilities | 7 | 11 | 9 | ||||||||||
| 2,095 | 2,051 | ||||||||||||
| Current assets less current liabilities | 1,512 | 2,632 | |||||||||||
| Total assets less current liabilities | 36,498 | 41,050 | |||||||||||
| Shareholders’ equity | |||||||||||||
| Paid-up capital | 8 | ||||||||||||
| Ordinary shares | 1,175 | 1,206 | |||||||||||
| Priority shares | 1 | 1 | |||||||||||
| 1,176 | 1,207 | ||||||||||||
| Share premium reserve | 1 | 1 | |||||||||||
| Investment reserves | 5 | ||||||||||||
| Statutory | 23,052 | 25,466 | |||||||||||
| Currency translation differences | (2,370 | ) | (4,299 | ) | |||||||||
| Other | 13,058 | 16,005 | |||||||||||
| 33,740 | 37,172 | ||||||||||||
| Other statutory reserves | 9 | 15 | – | ||||||||||
| Undistributed profit | 1,566 | 2,670 | |||||||||||
| 36,498 | 41,050 | ||||||||||||
| a | The appropriation of profit has already been incorporated in the Balance Sheet. |
| b | Proposed final dividend, subject to finalisation by the General Meeting of Shareholders to be held on April 23, 2003. |
| Statement of Cash Flows | € million | |||||||||||
| 2002 | 2001 | 2000 | ||||||||||
| Returns on investments and servicing of finance | ||||||||||||
| Dividends received from Group companies | 4,446 | 6,342 | 3,352 | |||||||||
| Interest received | 32 | 30 | 26 | |||||||||
| Other | (5 | ) | (5 | ) | – | |||||||
| Net cash inflow/(outflow) from returns on investments and servicing of finance | 4,473 | 6,367 | 3,378 | |||||||||
| Taxation | ||||||||||||
| Tax (paid)/recovered | (8 | ) | (14 | ) | (3 | ) | ||||||
| Financing | ||||||||||||
| Repurchase of share capital, including expenses | (889 | ) | (2,700 | ) | – | |||||||
| Dividends paid | (3,536 | ) | (3,459 | ) | (3,283 | ) | ||||||
| Increase/(decrease) in cash and cash equivalents | 40 | 194 | 92 | |||||||||
| Cash at January 1 | 549 | 355 | 263 | |||||||||
| Cash at December 31 | 589 | 549 | 355 | |||||||||
R 2 Royal Dutch Petroleum Company
20-F/A (Amendment No. 2) 2002
Table of Contents
Notes to the Financial Statements
1 The Company
Royal Dutch, one of the Parent Companies of the Royal Dutch/ Shell Group of Companies is a holding company which, in conjunction with Shell Transport, owns, directly or indirectly, investments in the numerous companies known collectively as the Royal Dutch/ Shell Group of Companies.
The Financial Statements of the Royal Dutch/ Shell Group of Companies and the Notes thereto on pages G2 to G42 and G44 to G53 form part of the Notes to the Annual Accounts.
Arrangements between Royal Dutch and Shell Transport provide, inter alia, that notwithstanding variations in shareholdings, Royal Dutch and Shell Transport shall share in the aggregate net assets and in the aggregate dividends and interest received from Group companies in the proportion of 60:40. It is further arranged that the burden of all taxes in the nature of, or corresponding to, an income tax leviable in respect of such dividends and interest shall fall in the same proportion.
2(a) First Restatement of previously issued financial statements
The Group Financial Statements included in this Amendment No. 2 are presented in accordance with US GAAP and include separate financial information prepared under Netherlands GAAP. The accounting policies under Netherlands GAAP have been changed to correct inappropriate departures from Netherlands GAAP, in respect of inventory accounting and the amortisation of goodwill, in order to more closely reflect accounting practice generally accepted in the Netherlands. In addition, errors in the depreciation, depletion and amortisation charges related to the restatement of reserves resulting from field reviews concluded in April 2004 (the First Reserves Restatement) (see note 32(a) of the Netherlands GAAP Financial Statements of the Royal Dutch/ Shell Group of Companies on pages G46 to G47) have been adjusted with restatement of prior years (beginning on page G48 of the Netherlands GAAP information of the Royal Dutch/ Shell Group of Companies). The accounting principles in the Netherlands GAAP Financial Statements of the Royal Dutch/ Shell Group of Companies have also been revised at the election of the Group in respect of exploration costs and certain contracts for the sale and delivery of own natural gas production. The effect on the determination of the share of Royal Dutch in the net income of companies of the Royal Dutch/ Shell Group is disclosed in Notes 32(a) to the Netherlands GAAP Financial Statements of the Royal Dutch/ Shell Group of Companies on pages G46 to G48.
Prior year amounts related to these accounting changes have been restated to conform with current year presentation.
Royal Dutch Petroleum Company R 3
20-F/A (Amendment No. 2) 2002
Table of Contents
The effect on profit after taxation and the Shareholders’ equity of Royal Dutch is as follows:
| € million | |||||||||||||||||||||
| Shareholders’ | |||||||||||||||||||||
| Profit after taxation | equity | ||||||||||||||||||||
| December 31, | December 31, | ||||||||||||||||||||
| 2002 | 2001 | 2000 | 2002 | 2001 | |||||||||||||||||
| As previously reported | 6,004 | 7,282 | 8,285 | 36,446 | 41,063 | ||||||||||||||||
| First Reserves Restatement | (69 | ) | (28 | ) | (52 | ) | (176 | ) | (111 | ) | |||||||||||
| Changes in accounting principles of the Royal Dutch/ Shell Group of Companies | |||||||||||||||||||||
| Valuation of inventories | 324 | (299 | ) | 175 | 537 | 230 | |||||||||||||||
| Goodwill amortisation | (76 | ) | (76 | ) | |||||||||||||||||
| Exploration costs | (39 | ) | (9 | ) | (27 | ) | (99 | ) | (62 | ) | |||||||||||
| Valuation of certain gas contracts | (25 | ) | (25 | ) | |||||||||||||||||
| Currency translation effect | (11 | ) | 1 | 10 | (13 | ) | (1 | ) | |||||||||||||
As restated | 6,108 | 6,947 | 8,391 | 36,594 | 41,119 | ||||||||||||||||
2(b) Second Restatement of previously issued financial statements
On February 3, 2005, as a result of reservoir level reviews conducted during July 2004 through December 2004 of substantially all of the Group’s proved reserves volumes reported as at December 31, 2003, (collectively, the Second Half Review), the Group announced that it would remove from proved reserves an additional 1.37 billion boe of oil and gas that were reported as at December 31, 2003 and further restate the unaudited oil and gas reserves disclosures contained in the supplementary information accompanying the Financial Statements (the Second Reserves Restatement and together with the First Reserves Restatement, the Reserves Restatement) to give effect to the removal of these volumes as of the earliest date on which they did not represent “proved reserves” within the applicable rules of the SEC (which in many cases is the date on which the volumes were initially booked as proved reserves). 43% of the volumes de-booked had been categorised as proved developed reserves and 57% had been categorised as proved undeveloped reserves.
Please refer to “Supplementary information – Oil and Gas (unaudited)” on pages G54 to G69 for additional information regarding the First Reserves Restatement and Second Reserves Restatement.
The Second Half Review reflected the implementation of certain remedial actions undertaken following the First Half Review and the First Reserves Restatement and in light of the report of Davis, Polk & Wardwell to the Group Audit Committee. See “Supplemental Information – Oil and Gas (unaudited)” on page G54 to G69.
In view of the inappropriate overstatement of unaudited proved reserves information resulting in the Second Reserves Restatement, it was determined to restate the Financial Statements of the Group and each of the Parent Companies for the year ended December 31, 2003 and prior periods (the Second Financial Restatement) to reflect the impact of the Second Reserves Restatement on those Financial Statements (as announced on February 3, 2005). This overstatement of unaudited proved reserves information had the effect of understating the depreciation, depletion and amortisation charges in the Group Financial Statements in each of the years covered by the Second Financial Restatement. The effect of the Second Financial Restatement was to reduce the net income of the Company in 2002 by€17 million (2001:€33 million; 2000:€64 million), and to reduce the previously reported Shareholders’ equity of the Company as at December 31, 2002 by€96 million (2001:€69 million).
3 Accounting principles
The Annual Accounts of Royal Dutch include the Netherlands GAAP Financial Statements of the Royal Dutch/Shell Group of Companies. These Annual Accounts have been prepared in accordance with legal requirements and generally accepted accounting principles in the Netherlands.
The investments in and the share in the net income of companies of the Royal Dutch/Shell Group are accounted for by the equity method (see also Notes 4 and 5). Accounting principles used by the Group are given in the Notes to the Netherlands GAAP Financial Statements of the Royal Dutch/Shell Group of Companies on page G46.
Current assets and liabilities are stated at their nominal value. Assets and liabilities in foreign currencies are translated into euros at year-end rates of exchange, whereas results for the year are translated at average rates. For the Profit and Loss Account euros are translated from dollars at the weighted average rate of exchange. Currency translation differences arising from translating the investments in companies of the Royal Dutch/Shell Group are taken to Investment reserves (see Note 5).
Administrative expenses, Interest income and Taxation are stated at the amounts attributable to the respective financial years.
R 4 Royal Dutch Petroleum Company
20-F/A (Amendment No. 2) 2002
Table of Contents
4 Share in the net income of companies of the Royal Dutch/ Shell Group
The amount dealt with under this heading in the Profit and Loss Account has been calculated as 60% of the net income of the Royal Dutch/ Shell Group as presented in the Group Financial Statements on page G52. The Royal Dutch share in the net income of the Royal Dutch/ Shell Group amounts to€6,076 million, the equivalent of $5,722 million (2001:€6,897 million, the equivalent of $6,180 million). Net income has been translated into euros using the weighted-average rate of exchange for the year.
The dividend for 2002 distributed and yet to be distributed by Group companies to Royal Dutch amounted to€3,317 million, the equivalent of $3,261 million (2001:€6,148 million, the equivalent of $5,498 million).
5 Investments and reserves
The 60% interest in Group net assets is equal to the interest applicable to Royal Dutch as shown in Note 36 to the Financial Statements of the Royal Dutch/ Shell Group of Companies (on pages G51 to G53) .
Royal Dutch’s investments in the companies of the Royal Dutch/ Shell Group are stated at an amount equal to the 60% share in Group net assets, translated into euros at the year-end rate. Movements during the year are translated at different rates of exchange. The resulting difference is included in Translation effect arising from movements in dollar/euro rate.
The difference of€33,740 million between the cost of the investments and the amounts at which the investments are stated in the Balance Sheet has been taken to Investment reserves.
The Statutory investment reserve comprises Royal Dutch’s 60% share in the undistributed net income of Group companies which has arisen as from January 1, 1984; Royal Dutch’s share in the undistributed net income of Group companies accumulated until that date is included in Investment reserves – Other.
Royal Dutch’s 60% share in the cumulative Group currency translation differences arises as a result of translating the assets and liabilities of non-dollar companies to dollars at year-end rates of exchange (see Note 4 to the Financial Statements of the Royal Dutch/ Shell Group of Companies on pages G13 and G14) and is shown under Investment reserves as Currency translation differences.
The net increase/ decrease in Parent Companies’ shares held by Group companies represents the balance of sales and purchases of these shares minus dividends received on these shares.
Other comprehensive income, net of tax, consists of currency translation differences, unrealised gains/ losses on securities and on cash flow hedges and minimum pension liability adjustments and is translated at year-end rate (see Note 5 to the Financial Statements of the Royal Dutch/ Shell Group of Companies on page G14).
The movements during the year in the value of the Group reporting currency (dollar) against the Royal Dutch reporting currency (euro) lead to currency translation differences.
As the amounts dealt with under Investment reserves have been, or will be, substantially reinvested by the companies concerned, it is not meaningful to provide for taxes on possible future distributions out of earnings retained by those companies; no such provision has therefore been made. Furthermore, it is not practicable to estimate the full amount of tax or the withholding tax element.
Royal Dutch Petroleum Company R 5
20-F/A (Amendment No. 2) 2002
Table of Contents
Movements in Investments and Investment reserves (as restated)
| $ million | € million | |||||||||||||||||||||||||||
| Investment reserves | ||||||||||||||||||||||||||||
| 60% interest | Currency | |||||||||||||||||||||||||||
| in Group | Exchange | Royal Dutch | translation | |||||||||||||||||||||||||
| net assets | Rate (€/$) | investments | Statutory | differences | Other | Total | ||||||||||||||||||||||
Balance at December 31, 2000 (as previously reported) | 34,252 | 36,988 | 23,298 | (2,994 | ) | 15,438 | 35,742 | |||||||||||||||||||||
Cumulative restatement per December 31, 2000 as described in Notes 2(a) and 2(b) | 318 | 1.07 | 341 | 336 | 5 | 341 | ||||||||||||||||||||||
Balance at December 31, 2000a | 34,570 | 37,329 | 23,634 | (2,989 | ) | 15,438 | 36,083 | |||||||||||||||||||||
Deduct: 60% of the book value of Shell Transport shares held by Group companies at December 31, 2000 | (212 | ) | (212 | ) | (212 | ) | ||||||||||||||||||||||
Share of Group net assets at December 31, 2000 | 34,570 | 1.07 | 37,117 | 23,634 | (2,989 | ) | 15,226 | 35,871 | ||||||||||||||||||||
Movements during the year 2001 | ||||||||||||||||||||||||||||
| Share in the net income of Group companies | 6,180 | 1.12 | 6,897 | |||||||||||||||||||||||||
| Distribution to Royal Dutch | (5,498 | ) | 1.12 | (6,148 | ) | |||||||||||||||||||||||
| Undistributed net income of Group companies | 682 | 1.10 | 749 | 749 | 749 | |||||||||||||||||||||||
| Net (increase)/decrease in Parent Companies’ shares held by Group companies | (385 | ) | 1.12 | (430 | ) | (430 | ) | (430 | ) | |||||||||||||||||||
| Other comprehensive income, net of tax | (1,182 | ) | 1.13 | (1,335 | ) | (183 | ) | (1,152 | ) | (1,335 | ) | |||||||||||||||||
| Translation effect arising from movements in dollar/euro rate | 1,970 | 1,266 | (158 | ) | 862 | 1,970 | ||||||||||||||||||||||
Share of Group net assets at December 31, 2001 | 33,685 | 1.13 | 38,071 | 25,466 | (4,299 | ) | 15,658 | 36,825 | ||||||||||||||||||||
Add: 60% of the book value of Shell Transport shares held by Group companies at December 31, 2001 | 347 | 347 | 347 | |||||||||||||||||||||||||
Balance at December 31, 2001 | 38,418 | 25,466 | (4,299 | ) | 16,005 | 37,172 | ||||||||||||||||||||||
Deduct: 60% of the book value of Shell Transport shares held by Group companies at December 31, 2001 | (347 | ) | (347 | ) | (347 | ) | ||||||||||||||||||||||
| 33,685 | 1.13 | 38,071 | 25,466 | (4,299 | ) | 15,658 | 36,825 | |||||||||||||||||||||
Movements during the year 2002 | ||||||||||||||||||||||||||||
| Share in the net income of Group companies | 5,722 | 1.06 | 6,076 | |||||||||||||||||||||||||
| Distribution to Royal Dutch | (3,261 | ) | 1.02 | (3,317 | ) | |||||||||||||||||||||||
| Undistributed net income of Group companies | 2,461 | 1.12 | 2,759 | 2,759 | 2,759 | |||||||||||||||||||||||
| Net (increase)/decrease in Parent Companies’ shares held by Group companies | (507 | ) | 1.06 | (538 | ) | (538 | ) | (538 | ) | |||||||||||||||||||
| Other comprehensive income, net of tax | 455 | 0.96 | 434 | (831 | ) | 1,265 | 434 | |||||||||||||||||||||
| Translation effect arising from movements in dollar/euro rate | (6,236 | ) | (4,342 | ) | 664 | (2,558 | ) | (6,236 | ) | |||||||||||||||||||
Share of Group net assets at December 31, 2002 | 36,094 | 0.96 | 34,490 | 23,052 | (2,370 | ) | 12,562 | 33,244 | ||||||||||||||||||||
Add: 60% of the book value of Shell Transport shares held by Group companies at December 31, 2002 | 496 | 496 | 496 | |||||||||||||||||||||||||
Balance at December 31, 2002 | 36,094 | 34,986 | 23,052 | (2,370 | ) | 13,058 | 33,740 | |||||||||||||||||||||
| a | See Note 36 to the Netherlands GAAP Financial Statements of the Royal Dutch/Shell Group of Companies. |
6 Other receivables
| € million | ||||||||
| Dec 31 | Dec 31 | |||||||
| 2002 | 2001 | |||||||
| Dividend tax receivable | 35 | 19 | ||||||
| Other receivables | 1 | 4 | ||||||
| 36 | 23 | |||||||
R 6 Royal Dutch Petroleum Company
20-F/A (Amendment No. 2) 2002
Table of Contents
7 Other liabilities
| € million | ||||||||
| Dec 31 | Dec 31 | |||||||
| 2002 | 2001 | |||||||
| Dividends and dividend tax payable | 8 | 7 | ||||||
| Accounts payable | 1 | 1 | ||||||
| Corporation tax | 2 | 1 | ||||||
| 11 | 9 | |||||||
8 Share capital
The authorised capital as laid down in the Articles of Association is expressed in euros and amounts to€1,792,000,000. The authorised share capital is divided into 3,198,800,000 ordinary shares with a par value of€0.56 each and 1,500 priority shares with a par value of€448 each. The movements in issued and paid-up capital during 2002 were as follows:
| Number of shares | € | ||||||||
| Ordinary shares of N.fl.1.25 | |||||||||
| At beginning of year | 2,126,647,800 | 1,206,288,373 | |||||||
Redenomination to€0.56 | (15,365,605 | ) | |||||||
| Cancelled during 2002 | (27,362,800 | ) | (15,323,168 | ) | |||||
| At end of year | 2,099,285,000 | 1,175,599,600 | |||||||
| Priority shares of N.fl.1,000 | |||||||||
| At beginning of year | 1,500 | 680,670 | |||||||
Redenomination to€448 | (8,670 | ) | |||||||
| At end of year | 1,500 | 672,000 | |||||||
Total ordinary and priority shares at end of year | 2,099,286,500 | 1,176,271,600 | |||||||
9 Other Statutory reserves
The other statutory reserves resulted from the redenomination from guilders into euros of the nominal values of the shares.
10 Royal Dutch shares held by Group companies
The movements in 2002 in Royal Dutch shares held by Group companies were as follows:
| Number of shares | € million | |||||||||||
| Royal Dutch | ||||||||||||
| 60% interest | ||||||||||||
| in the | ||||||||||||
| Book value | book value | |||||||||||
Balance at beginning of year | 26,674,267 | 1,549 | 929 | |||||||||
| Purchases | 12,769,100 | 716 | 430 | |||||||||
| Deliveries and other movements | (328,174 | ) | (147 | ) | (88 | ) | ||||||
Balance at end of year | 39,115,193 | 2,118 | 1,271 | |||||||||
These movements relate to the granting and exercise of stock options and to other incentive plans as mentioned in Note 22 to the Financial Statements of the Royal Dutch/ Shell Group of Companies.
Royal Dutch Petroleum Company R 7
20-F/A (Amendment No. 2) 2002
Table of Contents
| 11 | Remuneration of members of the Supervisory Board and Managing Directors |
For the amounts borne in 2002 by Royal Dutch and by the Royal Dutch/Shell Group of Companies in respect of remuneration of the Managing Directors, reference is made to the relevant tables on pages R15 to R16.
For the amounts borne in 2002 by Royal Dutch and by companies of the Royal Dutch/Shell Group in respect of remuneration of the members of the Supervisory Board, reference is made to the relevant table on page R17. This table also includes amounts borne by companies of the Royal Dutch/Shell Group in respect of remuneration for two members of the Supervisory Board who served simultaneously as Directors of these companies.
In addition to the pensions from a pension fund, ten former Managing Directors receive retirement benefits for duties performed by them simultaneously in the past as Directors of Group Companies, as referred to in the previous paragraph. These retirement benefits have not been insured but provisions have been made in respect thereof in accordance with applicable accounting principles. In 2002, an amount of€463,004 (2001:€459,645) has been added to the provision for retirement benefits of former Managing Directors.
The breakdown of these charges per former Managing Director is as follows:
| € | ||||||||
| 2002 | 2001 | |||||||
| Drs M.A. van den Bergh | 71,779 | 71,848 | ||||||
| A.P. Bénard | 31,188 | 29,641 | ||||||
| Ir. J.H. Choufoer | 35,094 | 34,963 | ||||||
| Ir. J.M.H. van Engelshoven | 47,368 | 47,057 | ||||||
| R.M. Hart | 52,006 | 51,083 | ||||||
| Drs C.A.J. Herkströter | 52,580 | 52,671 | ||||||
| Ir. H. de Ruiter | 68,670 | 68,824 | ||||||
| Ir. K. Swart | 14,292 | 14,115 | ||||||
| Ir. L.C. van Wachem | 66,422 | 66,236 | ||||||
| Ir. E.G.G. Werner | 23,605 | 23,207 | ||||||
Totala | 463,004 | 459,645 | ||||||
| a | These amounts differ from actual relevant pensions paid. |
| 12 | Earnings per share |
The basic earnings per share amounts shown are related to profit after taxation and after deducting the 4% cumulative preference dividend on priority shares. The calculation uses a weighted average number of shares of 2,057,657,737 (2001: 2,095,731,261 shares; 2000: 2,128,592,305 shares). This amount is based on outstanding shares, after deduction of shares held by Group companies in respect of stock options and other incentive compensation plans. For the purpose of the calculation, shares repurchased under the buyback programme are deemed to have been cancelled on purchase date.
The diluted earnings per share are based on the same profit figures. For this calculation the weighted number of shares is increased by 442,580 for 2002 (2001: 1,124,897; 2000: 1,394,975). These numbers relate to share options schemes as mentioned above.
Basic earnings per share reported in previous years have been restated reflecting (i) a correction in the weighted number of outstanding shares for the number of shares held by Group companies in respect of stock options, which shares were erroneously not deducted in the calculation of the weighted average number of shares, and (ii) the Reserves Restatement and changes in accounting principles.
Quantitative information concerning the effect of the above restatement and changes in accounting principles is set forth in the table below and additional information regarding the nature of these items is contained in Note 2(a) and 2(b).
R 8 Royal Dutch Petroleum Company
20-F/A (Amendment No. 2) 2002
Table of Contents
| 2002 | 2001 | 2000 | |||||||||||
Basic earnings per ordinary share (as previously reported) | 2.87 | 3.44 | 3.86 | ||||||||||
| Adjustments | |||||||||||||
| Correction number of weighted shares | 0.05 | 0.03 | 0.03 | ||||||||||
| First Reserves Restatement | (0.03 | ) | (0.01 | ) | (0.02 | ) | |||||||
| Valuation of Inventories | 0.16 | (0.14 | ) | 0.08 | |||||||||
| Amortisation of goodwill | (0.04 | ) | |||||||||||
| Exploration costs | (0.02 | ) | (0.01 | ) | |||||||||
| Valuation of natural gas contracts | (0.01 | ) | |||||||||||
| Currency translation effect | (0.01 | ) | – | ||||||||||
| Basic earnings per share (as previously restated) | 2.97 | 3.32 | 3.94 | ||||||||||
| Adjustments | |||||||||||||
| Second Reserves Restatement | (0.02 | ) | (0.02 | ) | (0.02 | ) | |||||||
| Currency Translation effect | 0.01 | (0.01 | ) | ||||||||||
As restated | 2.96 | 3.30 | 3.91 | ||||||||||
Diluted earnings per ordinary share | |||||||||||||
| As previously reported | 2.87 | 3.44 | 3.86 | ||||||||||
| As previously restated | 2.97 | 3.32 | 3.94 | ||||||||||
As restated | 2.96 | 3.30 | 3.91 | ||||||||||
| 13 | List of companies of the Royal Dutch/Shell Group |
A list of companies drawn up with due observance of the provisions in Articles 379 and 414, Book 2 of the Netherlands Civil Code, has been deposited at the office of the Commercial Registrar in The Hague.
| 14 | Employee numbers |
Royal Dutch did not have any employees at year-end 2002 or 2001. The Managing Directors of Royal Dutch have a contract of employment with Shell Petroleum N.V.
| 15 | Reconciliation between Netherlands GAAP and US GAAP (as restated) |
| € | € million | |||||||||||||||||||||||||||||||||||
| Basic earnings per ordinary share | Net income | Net assets | ||||||||||||||||||||||||||||||||||
| 2002 | 2001 | 2000 | 2002 | 2001 | 2000 | 2002 | 2001 | 2000 | ||||||||||||||||||||||||||||
| In accordance with Netherlands GAAP: | 2.96 | 3.30 | 3.91 | 6,091 | 6,914 | 8,327 | 36,498 | 41,050 | 40,002 | |||||||||||||||||||||||||||
Adjustments for US GAAP: | ||||||||||||||||||||||||||||||||||||
| Amortisation of goodwill | 0.04 | – | – | 76 | – | – | 69 | – | – | |||||||||||||||||||||||||||
| In accordance with US GAAP | 3.00 | 3.30 | 3.91 | 6,167 | 6,914 | 8,327 | 36,567 | 41,050 | 40,002 | |||||||||||||||||||||||||||
The difference affecting basic earnings per share, net income and net assets, between Netherlands GAAP, as applied to the preparation of these Financial Statements (and after giving effect to the restatement described above), and US GAAP is that under US GAAP, commencing in 2002, goodwill is no longer amortised but instead is tested for impairment annually or when certain events occur that indicate potential impairment. Under Netherlands GAAP, goodwill is amortised on a straight-line basis over its estimated useful economic life, which is assumed not to exceed 20 years unless there are grounds to rebut this assumption.
Royal Dutch Petroleum Company R 9
20-F/A (Amendment No. 2) 2002
Table of Contents
| 60% interest of Royal Dutch in line items as derived from | ||||||||
| the Netherlands GAAP Group Financial Statements (as restated) | € million | $ million | ||||||
Balance Sheet | ||||||||
2002: | ||||||||
| Current assets | 23,883 | 24,993 | ||||||
| Non current assets | 65,607 | 68,657 | ||||||
| Current liabilities | (31,650 | ) | (33,121 | ) | ||||
| Non current liabilities | (21,304 | ) | (22,294 | ) | ||||
| Minority interests in Group companies (60% of Group amount on page G45 translated at year end rate on page R6) | (2,046 | ) | (2,141 | ) | ||||
| Royal Dutch share of Group net assets (see pages R6-Euro & G53-$) | 34,490 | 36,094 | ||||||
| Add 60% interest of Parent Company shares held by the Group (R6) | 496 | |||||||
| Balance of Royal Dutch investment in the Group (Pages R2 and R6) | 34,986 | |||||||
| Other assets and liabilities of Royal Dutch | 1,512 | |||||||
| Net Assets | 36,498 | |||||||
2001: | ||||||||
| Current assets | 20,830 | 18,430 | ||||||
| Non current assets | 56,255 | 49,775 | ||||||
| Current liabilities | (22,695 | ) | (20,080 | ) | ||||
| Non current liabilities | (13,969 | ) | (12,360 | ) | ||||
| Minority interests in Group companies (60% of Group amount on page G45 translated at year end rate on page R6) | (2,350 | ) | (2,080 | ) | ||||
| Royal Dutch share of Group net assets (see pages R6-Euro & G53-$) | 38,071 | 33,685 | ||||||
| Add 60% interest of Parent Company shares held by the Group (R6) | 347 | |||||||
| Balance of Royal Dutch investment in the Group (Pages R2 and R6) | 38,418 | |||||||
| Other assets and liabilities of Royal Dutch | 2,632 | |||||||
| Net Assets | 41,050 | |||||||
Profit and Loss account | ||||||||
2002: | ||||||||
| Sales proceeds (Revenue) | 149,426 | 141,289 | ||||||
| Operating profit | 11,474 | 10,849 | ||||||
| Net income for the year | 6,076 | 5,722 | ||||||
| Distribution for the year | 3,317 | 3,261 | ||||||
2001: | ||||||||
| Sales proceeds (Revenue) | 118,640 | 106,321 | ||||||
| Operating profit | 12,782 | 11,455 | ||||||
| Net income for the year | 6,897 | 6,180 | ||||||
| Distribution for the year | 6,148 | 5,498 | ||||||
2000: | ||||||||
| Sales proceeds (Revenue) | 124,212 | 114,851 | ||||||
| Operating profit | 15,975 | 14,771 | ||||||
| Net income for the year | 8,314 | 7,688 | ||||||
| Distribution for the year | 5,694 | 5,147 | ||||||
| 16 | Subsequent events |
Contingencies and Litigation
Subsequent to the year ended December 31, 2002, in connection with the recategorisation of certain hydrocarbon reserves announced on January 9, 2004, a number of shareholder class action complaints were filed in the United States District Court of New Jersey, the United States Securities and Exchange Commission has issued a formal order of private investigation, the United States Department of Justice has commenced a criminal investigation, the UK Financial Services Authority has served formal notice of investigation under the Financial Services and Markets Act 2000 and Euronext Amsterdam and the Dutch Authority Financial Markets are investigating the issues related to the reserves recategorisation. Royal Dutch is unable to estimate the range of possible losses from such matters and does not believe their resolution will have a material impact on Royal Dutch’s financial condition although they could have a significant effect on periodic results. On 29 July 2004, the Group announced that it had reached agreements in principle with the SEC and the FSA to resolve their investigations. In connection with the agreement in principle with the SEC, Shell consented, without admitting or denying the SEC’s findings or conclusions, to an administrative order finding that Shell violated, and requiring Shell to cease and desist from future violations of, the antifraud, reporting, recordkeeping and internal control provisions of the US Federal securities laws and related SEC rules, agreed to pay a $120 million civil penalty and has undertaken to spend an additional $5 million developing a comprehensive internal compliance program. In connection with the agreement in principle with the FSA, Shell agreed, without admitting or denying the FSA’s findings or conclusions, to the entry of a Final Notice by the FSA finding that Shell breached market abuse provisions of the UK’s Financial Services and Markets Act 2000 and the Listing Rules make under it and agreed to pay a penalty of £17 million.
R 10 Royal Dutch Petroleum Company
20-F/A (Amendment No. 2) 2002
Table of Contents
Priority Share
On June 17, 2004, the Board of Directors of Royal Dutch announced that it will propose to its Annual General Meeting of Shareholders to be held on June 28, 2005 to abolish the priority shares.
Restructuring
On October 28, 2004, the Royal Dutch and Shell Transport Boards announced that they had unanimously agreed to propose to their shareholders a transaction (the “Transaction”) through which each Parent Company will become a subsidiary of Royal Dutch Shell plc, which will become a publicly-listed company incorporated in England and Wales and headquartered and tax resident in The Netherlands (“Royal Dutch Shell”). Reflecting the existing 60:40 ownership by Royal Dutch and Shell Transport of the Group, it is proposed that Royal Dutch shareholders will be offered 60% of the ordinary share capital in Royal Dutch Shell and Shell Transport shareholders will receive 40% of the ordinary share capital in Royal Dutch Shell. To implement the proposal, it is intended that (i) Royal Dutch Shell will make an offer to acquire all of the issued and outstanding ordinary shares of Royal Dutch in exchange for Royal Dutch Shell Class A ordinary shares or American depositary shares (“ADSs”) representing Royal Dutch Shell Class A ordinary shares and (ii) Royal Dutch Shell will become the parent company of Shell Transport pursuant to a United Kingdom reorganisational procedure referred to as a “scheme of arrangement” under section 425 of the UK Companies Act 1985, as amended. As a result of the scheme of arrangement, holders of Shell Transport ordinary shares (and holders of Shell Transport bearer warrants) will receive Royal Dutch Shell Class B ordinary shares and holders of Shell Transport ADSs will receive ADSs representing Royal Dutch Shell Class B ordinary shares. The Class A ordinary shares and Class B ordinary shares will have identical voting rights and will vote together as a single class on all matters, including the election of directors, unless a matter affects the rights of one class as a separate class. Class A ordinary shares and Class B ordinary shares will have identical rights upon a liquidation of Royal Dutch Shell, and dividends declared on each will be equivalent in amount. However, for tax purposes, holders of Class A ordinary shares will receive Dutch source dividends, while holders of Class B ordinary shares will receive dividends that are UK source to the extent that these dividends are paid through a dividend access mechanism to be established. Implementation of the Transaction will be the subject of appropriate consultation with relevant employee representative bodies as required as well as the satisfaction of certain other conditions. It is currently expected that the Transaction will be completed in July 2005.
Royal Dutch Petroleum Company R 11
20-F/A (Amendment No. 2) 2002
Table of Contents
Remuneration
The following comprises the report on Managing Directors’ and Supervisory Board members’ remuneration for the year ended December 31, 2002.
This report deals with the remuneration policy as it applies and will apply to Group Managing Directors, including those who are also Managing Directors of Royal Dutch, and to the members of the Supervisory Board of Royal Dutch. The remuneration policy is subject to regular review. This report also contains the disclosure of the individual remuneration of the Managing Directors and members of the Supervisory Board of Royal Dutch.
Remuneration and Succession Review Committee
The Remuneration and Succession Review Committee (REMCO) is a joint committee of the Supervisory Board of Royal Dutch and the Board of Shell Transport (see page 77) and has responsibility for making recommendations on all forms of remuneration with respect to Group Managing Directors.
During the year under review, the REMCO members appointed by the Supervisory Board of Royal Dutch were Jonkheer Aarnout Loudon, Professor Joachim Milberg, Henny de Ruiter (appointed July 1, 2002) and Lodewijk van Wachem (retired June 30, 2002), and the members appointed by the Board of Shell Transport were Nina Henderson, Sir Peter Job and Sir Mark Moody-Stuart. The Chairman of the Committee is currently Jonkheer Aarnout Loudon.
In accordance with the Articles of Association, the remuneration of the members of the Royal Dutch Supervisory Board is the responsibility of the Supervisory Board as a whole, with due observance of the aggregate amount fixed by the General Meeting of Shareholders.
Remuneration policy
Group Managing Directors’ Remuneration
Philosophy
The objective of the remuneration philosophy is to attract and retain high calibre individuals and motivate them towards the achievement of exceptional performance that enhances the value of the Group. The remuneration structures for Group Managing Directors are therefore designed to support alignment of Group Managing Directors’ interests with the goals of the Group and its various businesses and with shareholders’ interests.
Competitive framework
Remuneration levels are set by reference to the practice of global companies of comparable size, complexity and international scope to that of the Group. Among such companies there is an increasing emphasis on performance-linked variable short and long-term pay. Consistent with this and the philosophy outlined above, for on-target performance more than half of a Group Managing Director’s total remuneration will be performance-linked. This proportion is expected to increase in line with market practice.
REMCO is provided with market data on the basis of which it annually reviews remuneration levels and the proportions between fixed and variable pay.
Base salary and fees
The purpose of base salary (which is inclusive of Directors’ fees) is to provide an element of fixed remuneration set at a competitive level that is appropriate to the scope and complexity of the role of a Group Managing Director.
Salary levels are set by reference to market-based salary scales that reflect the collegiate nature of the Committee of Managing Directors. The scales were increased by 6% with effect from July 1, 2002. The salary scales are reviewed annually by REMCO and will be adjusted in line with market practice with effect from July 1, 2003. Progression of an individual Group Managing Director’s salary to the target position is usually over a three-year period from appointment.
Annual and deferred bonus
The purpose of the annual bonus plan is to motivate Group Managing Directors to achieve annual results that further the Group’s long-term objectives.
The target level of bonus for the year 2002 was 100% of base salary (2001 was 65% of base salary). The target for 2003 will be 100% of base salary.
Bonus awards are recommended by REMCO based on the extent of achievement of challenging Group targets that are set as part of the annual Group business plan. These targets encompass financial, customer, people, sustainable development and other operational objectives. For 2002, financial targets related to Total Shareholder Return (TSR) measured annually by the average weighted share price performance plus dividends of Royal Dutch and Shell Transport relative to other major integrated oil
R 12 Royal Dutch Petroleum Company
20-F/A (Amendment No. 2) 2002
Table of Contents
companies and Return on Average Capital Employed (ROACE). Having regard to the Group’s performance against all targets, REMCO has recommended that the bonus payable to Group Managing Directors in respect of the year 2002 is 115% of base salary. The same approach will be adopted in 2003.
Since 2001, Group Managing Directors have been able to elect to defer up to one-third of their annual bonus into shares, in the case of Royal Dutch Managing Directors, Royal Dutch shares. The deferred bonus shares, together with shares equivalent to the value of dividends payable on the deferred bonus shares, are released three years after deferral. Provided the participants remain in Group employment for three years following the deferral, or reach normal retirement within the three-year period, they will also receive one additional share for every two shares accumulated.
The purposes of the deferred bonus plan are to reward performance over a single financial year, to align Group Managing Directors’ interests with shareholders’ interests during the deferment period and to encourage share ownership in the Company. There is accordingly no further performance test beyond that governing performance in the relevant bonus year.
Neither annual nor deferred bonuses are pensionable.
Long-term incentives
The objective of long-term incentive arrangements is to ensure that Group Managing Directors share the interests of shareholders by being rewarded for share price growth, the creation of shareholder value and the achievement of superior relative shareholder returns. The policy in relation to long-term incentives applies to each of the Group Managing Directors.
Long-term incentives are currently awarded in the form of stock options. Options are granted once a year under the Group Stock Option Plan which applies to Group Managing Directors and senior staff.
Options granted before 2003 to Group Managing Directors may vest three years after grant and remain exercisable until ten years after grant. Of the options granted, 50% are subject to performance conditions and the proportion of such 50% which will either vest and become unconditional or lapse, will be determined for Group Managing Directors at the discretion of REMCO using the criteria below.
REMCO will only exercise its discretion in favour of vesting to the extent that it is satisfied that the performance of the Group over the three-year vesting period reflects the objective for long-term incentives. Accordingly, when making its decision, REMCO takes into account a combination of TSR over the three-year vesting period (measured by the average weighted share price performance plus dividends of Royal Dutch and Shell Transport over the ten-day period at the beginning and end of the vesting period) relative to a peer group of other major integrated oil companies and other long-term indicators of Group performance.
The latest tranche of stock options to vest was granted in March 2000 and the stock options vested in March 2003. The measurement period for the options was January 1, 2000 to December 31, 2002. The peer companies were BP, ChevronTexaco, ExxonMobil and Total. The Royal Dutch/ Shell Group of Companies ranked fourth. REMCO considered other performance indicators including profits over the three years and ROACE relative to the peer group.
Having considered all of these factors REMCO determined that 50% of the options granted in March 2000 that were subject to its discretion should vest.
Options granted in 2003, and in subsequent years, will be 100% performance linked. Performance will be measured over the three financial years prior to grant. The policy, which will continue in future years, is that the levels of grant will vary according to the ratings given by REMCO to the Group’s achievements against financial targets and will reflect competitive market practice. The current financial targets are TSR relative to the other major integrated oil companies and ROACE. These financial targets have been chosen as they are consistent with the objective for long-term incentives and represent a balanced test of the Group’s internal operating efficiency and external performance.
In addition it is proposed to introduce a new Long-term Incentive Plan (the Plan). This proposal was put to shareholders at the 2003 General Meetings of Royal Dutch and Shell Transport.
Group Managing Directors and other selected senior executives will be eligible to participate in the Plan. Group Managing Directors will be selected for participation on the recommendation of REMCO. Participants will be made a conditional award of shares in either Royal Dutch or Shell Transport. The receipt of shares comprised in the award will be conditional on the participant remaining in employment (subject to certain exceptions, including normal retirement) and on the satisfaction of performance targets over the performance period. The performance period will not be less than three consecutive financial years. In the case of Group Managing Directors, REMCO will make recommendations on the number of shares which may be conditionally awarded in any year. Awards in any one year can range from zero to two times base salary, but the maximum number of shares will only be received for exceptional performance as described below.
Royal Dutch Petroleum Company R 13
20-F/A (Amendment No. 2) 2002
Table of Contents
If the adoption of the Plan is approved, the performance targets will be linked to TSR (the average weighted share price performance plus dividends of Royal Dutch and Shell Transport) relative to two separate groups of comparator companies, over a performance period of three financial years. Two separate comparator groups have been chosen because REMCO considers that it is appropriate to test performance both against major home markets and industry competitors. Relative TSR has been chosen as the performance test that most closely aligns the interests of Group Managing Directors and senior executives with those of shareholders.
The first comparator group will consist of the largest ten companies (by way of market capitalisation) in the AEX index together with the largest twenty companies (also by way of market capitalisation) in the FTSE 100 share index, in each case, at the beginning of the relevant performance period. As at January 1, 2003, the first comparatory group in addition to Royal Dutch and Shell Transport, was AEX: ABN AMRO, AEGON, Ahold, Akzo Nobel, Heineken, ING Group, KPN, Philips and Unilever N.V.; and FTSE: Anglo American, AstraZeneca, Aviva, Barclays, BG Group, BP, British American Tobacco, BT Group, Diageo, GlaxoSmithKline, HBOS, HSBC Holdings, Lloyds TSB Group, National Grid Transco, Rio Tinto, The Royal Bank of Scotland, Tesco, Unilever PLC and Vodafone Group. In the case of Royal Dutch and Shell Transport, and Unilever N.V. and Unilever PLC, the weighted average TSR of the two companies will be used.
The second comparator group will be the five major integrated oil companies, which, as at January 1, 2003, were BP, ChevronTexaco, ExxonMobil, the Royal Dutch/ Shell Group of Companies and Total.
Half of each conditional award will be tested against the first comparator group and half against the second comparator group. If shareholders approve the adoption of the Plan, the comparator groups described above will be used for the first performance period which will be from January 1, 2003 to December 31, 2005.
For the first comparator group, 100% of the shares tested against that group will be received for 75th percentile and above performance and 25% will be received for median performance with a straight-line calculation between these two points. No shares will be received for performance below the median. This method of calculation has been chosen because it is consistent both with shareholders’ expectations and market practice.
For the second comparator group, 100% of the shares tested against that group will be received if the Royal Dutch/ Shell Group of Companies is in first place, 75% for second place and 50% for third place. No shares will be received for fourth or fifth place.
All-employee Share Schemes
Group Managing Directors are not eligible to participate in the Global Employee Share Purchase Plan.
Pensions
For the Dutch Managing Directors of Royal Dutch the principal source of their pensions is the Stichting Shell Pensioenfonds. This is a defined benefit fund to which Managing Directors contribute the same percentage of relevant earnings as other employees. For employees in the Netherlands this percentage was zero during the year. The employing companies contribute to the pension fund on the advice of actuaries, and the employing company contribution rate in 2002 was 0%. The principal source of pension for the non-Dutch Managing Director of Royal Dutch is the Shell Overseas Contributory Pension Fund (“SOCPF”). This is also a defined benefit fund to which the Managing Director contributes 4% of relevant earnings. The employing company also contributes to the Fund and, upon actuarial advice, the employing company’s contribution rate in 2002 was 10% of relevant earnings. Managing Directors retire on June 30, following their 60th birthday. There are provisions in both pension funds for a surviving dependant benefit of 70% or, in the case of SOCPF, 60% of actual or prospective pension. In the case of death-in-service, a lump sum of two times annual salary is paid, or, in the case of SOCPF, three times annual salary.
Advisors
In reaching its decisions on Group Managing Directors’ remuneration, REMCO was materially assisted by advice from John Hofmeister (Group Human Resources Director) and Michael Reiff (Group Head of Remuneration and Benefits).
External data are collated by internal sources and used in the preparation of internal briefing papers that REMCO considers, in common with other factors, when making its decisions. Accordingly, there is no single external source that provides material advice or services, nor is there a formal external advisor appointed by REMCO. At its discretion, REMCO may seek external advice on its own account and, in the year under review, it received such advice from Towers Perrin, which also provided companies within the Group with advice on pensions, compensation, communication and HR management.
Managing Directors’ Contracts of Service
No Managing Director has or, during the financial year, had a contract of service with Royal Dutch. The Managing Directors of Royal Dutch have employment contracts with one of the Group holding companies that provide entitlement to the statutory notice period applicable to employees in the Netherlands – no more than three months. Similarly, such contracts expire on the expected
R 14 Royal Dutch Petroleum Company
20-F/A (Amendment No. 2) 2002
Table of Contents
date of retirement which, in the case of the Managing Directors, is June 30 following their 60th birthday. There are no predetermined termination compensation arrangements in place for Managing Directors of Royal Dutch.
Harry Roels resigned from his positions as Managing Director of Royal Dutch and a Group Managing Director for personal reasons on June 30, 2002 at his own request. He was paid€2.2 million upon termination of his contract of service. In recommending this departure arrangement, REMCO took into account his more than 30 years valuable service to the Group and considered it appropriate to base the calculation of this amount on a formula applicable to all senior staff in the Netherlands with whom severance arrangements are made.
| Emoluments of Managing Directors | € | |||||||||||
| 2002 | 2001 | 2000 | ||||||||||
Jeroen van der Veer | ||||||||||||
| Salaries | 1,013,729 | 923,929 | 824,201 | |||||||||
Performance-related elementa | 1,230,500 | b | 619,450 | b | 398,601 | |||||||
| Total cash | 2,244,229 | 1,543,379 | 1,222,802 | |||||||||
Other compensationc | 4,768 | 4,620 | 4,486 | |||||||||
| Realised share option gains upon exercise | – | 293,440 | 339,600 | |||||||||
| 2,248,997 | 1,841,439 | 1,566,888 | ||||||||||
Malcolm Brinded | ||||||||||||
| Salaries | 372,500 | – | – | |||||||||
Performance-related elementa | 428,375 | b | – | – | ||||||||
| Total cash | 800,875 | – | – | |||||||||
Other compensationc | 2,210 | d | – | – | ||||||||
| Realised share option gains upon exercise | – | – | – | |||||||||
| 803,085 | – | – | ||||||||||
Harry Roels | ||||||||||||
| Salaries | 2,587,973 | e | 743,779 | 697,598 | ||||||||
Performance-related elementa | – | 501,430 | 318,145 | |||||||||
| Total cash | 2,587,973 | 1,245,209 | 1,015,743 | |||||||||
Other compensationc | 2,282 | 4,553 | 4,421 | |||||||||
| Realised share option gains upon exercise | – | – | – | |||||||||
| 2,590,255 | 1,249,762 | 1,020,164 | ||||||||||
Walter van de Vijverf | ||||||||||||
| Salaries | 735,095 | 342,536 | – | |||||||||
Performance-related elementa | 902,750 | 221,330 | – | |||||||||
| Total cash | 1,637,845 | 563,866 | – | |||||||||
Other compensationc | 18,091 | g | 2,162 | – | ||||||||
| Realised share option gains upon exercise | – | – | – | |||||||||
| 1,655,936 | 566,028 | – | ||||||||||
| a | The performance-related element is included in the year to which it relates. | |
| b | Of which one-third was deferred under the Deferred Bonus Plan. | |
| c | Includes social security premiums paid by the employer and employer’s contribution to the health insurance plan and, where applicable, other benefits stated at a value employed by the Fiscal Authorities in the Netherlands. | |
| d | Exclusive of deferred payment in shares amounting to £386,000 granted in 1999. | |
| e | Includes lump sum on departure. | |
| f | On March 3, 2004, Mr. Walter van de Vijver stepped down from the Board of Management of Royal Dutch and as a Group Managing Director, by mutual consent. | |
| g | Exclusive of deferred payment in shares amounting to€688,839 granted in 1999. |
| Pensions | € thousand | |||||||||||||||||||
| Years of | Increase in | Accumulated | Pension | |||||||||||||||||
| Group | accrued | annual | premium | |||||||||||||||||
| service | pension | pension | 2002 | |||||||||||||||||
| Age as at | as at | during | as at | paid by | ||||||||||||||||
| 31.12.02 | 31.12.02 | 2002 | 31.12.02 | employer | ||||||||||||||||
| Jeroen van der Veer | 55 | 31 | 67 | 599 | 0 | |||||||||||||||
| Malcolm Brinded | 49 | 28 | 7 | a | 418 | 37 | a | |||||||||||||
Harry Roelsb | 54 | 30 | (18 | ) | 435 | 0 | ||||||||||||||
| Walter van de Vijver | 47 | 23 | 27 | 314 | 0 | |||||||||||||||
| a | As from July 1, 2002. | |
| b | Mr Roels left Group service on June 30, 2002, with a deferred pension payable as from his normal retirement date. |
Royal Dutch Petroleum Company R 15
20-F/A (Amendment No. 2) 2002
Table of Contents
Share options
The interests of the Managing Directors and former Managing Directors under the Group Share Plans in Royal Dutch and Shell Transport are shown below:
| Options Royal Dutch | ||||||||||||||||||||||||||
| Number of options | € | |||||||||||||||||||||||||
| Exercised | Market | |||||||||||||||||||||||||
| Granted | (cancelled) | price at | ||||||||||||||||||||||||
| At | during | during | At | Exercise | date of | Expiry | ||||||||||||||||||||
| 01.01.02 | the year | the year | 31.12.02 | price | exercise | date | ||||||||||||||||||||
| Jeroen van der Veer | ||||||||||||||||||||||||||
| 16,500 | – | (16,500) | – | 48.92 | – | 10.12.02 | ||||||||||||||||||||
| 40,850 | – | – | 40,850 | 41.16 | – | 21.12.08 | ||||||||||||||||||||
| 45,000 | – | – | 45,000 | 59.54 | – | 22.03.10 | ||||||||||||||||||||
| 80,000 | – | – | 80,000 | 62.60 | – | 25.03.11 | ||||||||||||||||||||
| – | 105,000 | – | 105,000 | 62.10 | – | 20.03.12 | ||||||||||||||||||||
| Malcolm Brinded | ||||||||||||||||||||||||||
| – | 50,000 | – | 50,000 | 62.10 | – | 20.03.12 | ||||||||||||||||||||
| Harry Roels | ||||||||||||||||||||||||||
| 14,000 | – | (14,000) | – | 48.92 | – | 10.12.02 | ||||||||||||||||||||
| 28,000 | – | – | 28,000 | 41.16 | – | 29.06.07 | ||||||||||||||||||||
| 45,000 | – | – | 45,000 | 59.54 | – | 29.06.07 | ||||||||||||||||||||
| 62,000 | – | – | 62,000 | 62.60 | – | 29.06.07 | ||||||||||||||||||||
| Walter van de Vijver | ||||||||||||||||||||||||||
| 10,000 | – | – | 10,000 | 48.92 | – | 10.12.07 | ||||||||||||||||||||
| 20,000 | – | – | 20,000 | 41.16 | – | 21.12.08 | ||||||||||||||||||||
| 32,000 | – | – | 32,000 | 59.54 | – | 22.03.10 | ||||||||||||||||||||
| 10,000 | – | – | 10,000 | 68.73 | – | 22.08.10 | ||||||||||||||||||||
| 40,000 | – | – | 40,000 | 62.60 | – | 25.03.11 | ||||||||||||||||||||
| – | 75,000 | – | 75,000 | 62.10 | – | 20.03.12 | ||||||||||||||||||||
| Maarten van den Bergh | ||||||||||||||||||||||||||
| 57,950 | – | 20,000 | 37,950 | 41.16 | 59.35 | 29.06.05 | ||||||||||||||||||||
| Options Shell Transport | ||||||||||||||||||||||||||
| Number of options | € | |||||||||||||||||||||||||
| Exercised | Market | |||||||||||||||||||||||||
| Granted | (cancelled) | price at | ||||||||||||||||||||||||
| At | during | during | At | Exercise | date of | Expiry | ||||||||||||||||||||
| 01.01.02 | the year | the year | 31.12.02 | price | exercise | date | ||||||||||||||||||||
| Malcolm Brinded | ||||||||||||||||||||||||||
| 37,500 | – | – | 37,500 | 439 | – | 10.12.07 | ||||||||||||||||||||
| 139,200 | – | – | 139,200 | 363 | – | 21.12.08 | ||||||||||||||||||||
| 245,000 | – | – | 245,000 | 505 | – | 22.03.10 | ||||||||||||||||||||
| 14,000 | – | – | 14,000 | 563 | – | 12.11.10 | ||||||||||||||||||||
| 278,200 | – | – | 278,200 | 552 | – | 25.03.11 | ||||||||||||||||||||
R 16 Royal Dutch Petroleum Company
20-F/A (Amendment No. 2) 2002
Table of Contents
Remuneration of Members of the Supervisory Board
The Articles of Association provide for an amount to be fixed by the General Meeting that shall serve as the basis for the remuneration of members of the Supervisory Board. At the General Meeting held on May 16, 2002, that amount was set at€75,000 multiplied by the number of members of the Supervisory Board holding office during any year or proportionately during part of a year. The amount so fixed constitutes the maximum aggregate remuneration in respect of any year for all members of the Supervisory Board. Out of the funds so earmarked, the Supervisory Board fixes the amount of the remuneration for each of its members, taking into account any special duties performed by a member.
Within the limits set by shareholders, the levels of remuneration are reviewed by the Supervisory Board from time to time and are adjusted when appropriate. At its last review the Supervisory Board resolved to increase the Board fees to€55,000 per annum and the additional fee for the Chairman to€15,000 per annum, with effect from January 1, 2003. Also an attendance fee amounting to€2,375 per meeting will be payable to Board members required to make intercontinental trips to attend Board meetings. Fees for membership of the Committees of the Board were not changed.
| Emoluments of the Members of the Supervisory Board | € | |||||||||||
| 2002 | 2001 | 2000 | ||||||||||
Aad Jacobs | ||||||||||||
| Supervisory Board fees | 51,750 | 45,378 | 45,378 | |||||||||
| Committee fees | 7,000 | 6,807 | 10,210 | |||||||||
| 58,750 | 52,185 | 55,588 | ||||||||||
Maarten van den Bergh | ||||||||||||
| Supervisory Board fees | 46,000 | 45,378 | 22,689 | |||||||||
| Committee fees | 7,000 | 6,807 | 3,403 | |||||||||
| Holding Company fees | 29,021 | 29,148 | 14,808 | |||||||||
| 82,021 | 81,333 | 40,900 | ||||||||||
Jonkheer Aarnout Loudon | ||||||||||||
| Supervisory Board fees | 46,000 | 45,378 | 45,378 | |||||||||
| Committee fees | 14,000 | 13,613 | 13,613 | |||||||||
| 60,000 | 58,991 | 58,991 | ||||||||||
Professor Hubert Markl | ||||||||||||
| Supervisory Board fees | 23,000 | – | – | |||||||||
| Committee fees | – | – | – | |||||||||
| 23,000 | – | – | ||||||||||
Professor Joachim Milberg | ||||||||||||
| Supervisory Board fees | 46,000 | 45,378 | 22,689 | |||||||||
| Committee fees | 7,000 | 6,807 | 3,403 | |||||||||
| 53,000 | 52,185 | 26,092 | ||||||||||
Lawrence Ricciardi | ||||||||||||
| Supervisory Board fees | 46,000 | 22,689 | – | |||||||||
| Committee fees | – | – | – | |||||||||
| 46,000 | 22,689 | – | ||||||||||
Henny de Ruiter | ||||||||||||
| Supervisory Board fees | 46,000 | 45,378 | 45,378 | |||||||||
| Committee fees | 10,500 | 6,807 | 6,807 | |||||||||
| Holding Company fees | 29,021 | 29,148 | 29,520 | |||||||||
| 85,521 | 81,333 | 81,705 | ||||||||||
Jan Timmer | ||||||||||||
| Supervisory Board fees | 46,000 | 45,378 | 45,378 | |||||||||
| Committee fees | 14,000 | 13,613 | 13,613 | |||||||||
| 60,000 | 58,991 | 58,991 | ||||||||||
Lodewijk van Wachem | ||||||||||||
| Supervisory Board fees | 28,750 | 56,723 | 56,723 | |||||||||
| Committee fees | 3,500 | 6,807 | 6,807 | |||||||||
| Holding Company fees | 14,570 | 29,148 | 29,520 | |||||||||
| 46,820 | 92,678 | 93,050 | ||||||||||
Royal Dutch Petroleum Company R 17
20-F/A (Amendment No. 2) 2002
Table of Contents
Group Share Plans
Set out below is a summary of the principal employee share schemes operated by Group companies*. The shares subject to the plans are existing issued shares of the Company and no dilution of shareholders’ equity is involved. Shares to be delivered by a Group company under these plans are generally bought in the market at the time the commitment thereto is being made.
Group Stock Option Plans
Under these plans, eligible employees are granted options over shares of Royal Dutch or Shell Transport. The price at which the shares can be bought (the exercise price) will not be less than the fair market value of the shares at the date the options were granted. This is calculated as the average of the stock exchange opening and closing prices over the five business days ending on the date of grant, except for the USA where the grant price is the average of the stock exchange opening and closing prices on the date of grant.
Options are exercisable three years from grant. Options lapse ten years after grant or, if earlier, on resignation from Group employment (subject to certain exceptions). For Group Managing Directors and the most senior executives, a proportion of the options granted is subject to performance conditions.
For Group Managing Directors and the most senior executives 100% of options granted in 2003 and in subsequent years will be subject to performance conditions.
Restricted Stock Plan
Grants are made under this plan on a highly selective basis for recruitment and retention of senior staff. A maximum of 250,000 Royal Dutch shares (or equivalent value in Shell Transport shares) can be granted under the plan in any year. Shares are granted subject to a three-year restriction period. The shares, together with additional shares equivalent to the value of the dividends payable over the restriction period, are released to the individual at the end of the three-year period, provided that the individual has remained in employment. Group Managing Directors are not eligible to participate in the Restricted Stock Plan.
Global Employee Share Purchase Plan
This broad-based plan enables employees to make contributions, which are applied quarterly to purchase Royal Dutch or Shell Transport shares at current market value. If the acquired shares are retained in the Plan until the end of the twelve-month cycle the employee receives an additional 15% share match. In the USA a variant of this plan is operated where contributions are applied to buy Royal Dutch shares at the end of the twelve-month cycle. The purchase price is the lower of the market price on the first or last trading day of the cycle reduced by 15%. Group Managing Directors are not eligible to participate in the Global Employee Share Purchase Plan.
Shell Sharesave Scheme
In lieu of the Global Employee Share Purchase Plan employees in the UK continue to participate in the Shell Sharesave Scheme. Options are granted over shares of Shell Transport at prices not less than market value on a date not more than 30 days before grant and are normally exercisable after a three-year or five-year contractual savings period.
Shell All-employee Share Purchase Plan
Employees in the UK may now participate in the Shell All-employee Share Purchase Plan which is designed to encourage employee participation in their company. Employees invest amounts up to a maximum of £125 per month in Shell Transport shares at the current market value using funds deducted from their monthly salary. The contributions are not liable to income tax but, to maintain the tax benefit, the shares must be held in the Plan for a defined period (normally five years).
| * | Details of the number of shares held by Group companies in connection with the above plans are shown in Note 22 of the Group Financial Statements on pages G30 to G32. |
R 18 Royal Dutch Petroleum Company
20-F/A (Amendment No. 2) 2002
Table of Contents
The “Shell” Transport and Trading Company,
Public Limited Company
Report of Registered Independent Public Accountants
To: The Board of Directors and Shareholders of The “ Shell ” Transport and Trading Company, Public Limited Company
We have audited the Financial Statements of The “ Shell ” Transport and Trading Company, Public Limited Company for the years 2002, 2001 and 2000 appearing on pages S2 to S14. The preparation of the Financial Statements is the responsibility of the Company’s Directors. Our responsibility is to express an opinion on those Financial Statements based on our audits.
We conducted our audits in accordance with the standards of the Public Company Accounting Oversight Board (United States). Those standards require that we plan and perform the audit to obtain reasonable assurance about whether the Financial Statements are free of material misstatement. An audit includes examining, on a test basis, evidence supporting the amounts and disclosures in the Financial Statements. An audit also includes assessing the accounting principles used and significant estimates made by the Company’s Directors in the preparation of the Financial Statements, as well as evaluating the overall Financial Statement presentation. We believe that our audits provide a reasonable basis for our opinion.
In our opinion, the Financial Statements referred to above present fairly, in all material respects, the financial position of The “ Shell ” Transport and Trading Company, Public Limited Company at December 31, 2002 and 2001, and the results of its operations and its cash flows for each of the three years in the period ended December 31, 2002 in conformity with the accounting principles generally accepted in the United Kingdom.
As discussed in Note 2(b) on page S5, the Company has restated its Financial Statements for the three years ended December 31, 2002, and made certain changes in its accounting principles.
As discussed in Note 2(c) on page S6, the Company restated its Financial Statements for the three years ended December 31, 2002 to correct for the impact of the Second Reserves Restatement.
As discussed in Note 5 on page S8, the Company has restated its Financial Statements for the three years ended December 31, 2002 to change its method of accounting for earnings per share.
Accounting principles generally accepted in the United Kingdom vary in certain significant respects from accounting principles generally accepted in the United States of America. Information relating to the nature and effect of such differences is presented in Note 12 on pages S12 and S13.
/s/ PricewaterhouseCoopers LLP
-----------------------------------------------------
PricewaterhouseCoopers LLP, London — United Kingdom
Registered independent public accountants
March 6, 2003, except for Note 2(b) (First Restatement of previously issued financial statements) and Note 5 (Earnings per share), which are as of May 23, 2004, and except for Notes 2(c) (Second Restatement of previously issued financial statements), Note 12 (Reconciliation between US GAAP and UK GAAP(as restated)) and Note 13 (Subsequent events), which are as of March 3, 2005.
The “ Shell ” Transport and Trading Company, Public Limited Company S 1
20-F/A (Amendment No. 2) 2002
Table of Contents
Financial Statements
of The “Shell” Transport and Trading Company, p.l.c.
| Profit and Loss Account | £ million |
| Note | 2002 | 2001 | 2000 | |||||||||||||
| Income from shares in companies of the Royal Dutch/ Shell Group | 3 | 1,403.2 | 2,545.6 | 2,307.4 | ||||||||||||
| Interest and other income | 5.4 | 5.8 | 4.5 | |||||||||||||
| 1,408.6 | 2,551.4 | 2,311.9 | ||||||||||||||
| Administrative expenses | 4.2 | 3.4 | 3.3 | |||||||||||||
| Profit on ordinary activities before taxation | 1,404.4 | 2,548.0 | 2,308.6 | |||||||||||||
| Tax on profit on ordinary activities | 4 | 0.4 | 0.7 | 0.3 | ||||||||||||
| Distributable profit for the year | 1,404.0 | 2,547.3 | 2,308.3 | |||||||||||||
| As restated | As restated | As restated | |||||||||||||||
| Distributable profit for the year | 1,404.0 | 2,547.3 | 2,308.3 | ||||||||||||||
| Share of earnings retained by companies of the Royal Dutch/Shell Group | 2,6 | 1,140.7 | 316.2 | 1,185.3 | |||||||||||||
| Earnings for the year attributable to shareholders | 2,544.7 | 2,863.5 | 3,493.6 | ||||||||||||||
| Aggregate dividends paid and proposed | 1,475.0 | 1,440.6 | 1,452.6 | ||||||||||||||
All results relate to continuing operations.
| Earnings per 25p Ordinary sharea | Pence |
| 2002 | 2001 | 2000 | |||||||||||||||
| As restated | As restated | As restated | |||||||||||||||
| Distributable profit for the year | 5 | 14.6 | 26.1 | 23.4 | |||||||||||||
| Distributable profit for the year | 14.6 | 26.1 | 23.4 | ||||||||||||||
| Share of earnings retained by companies of the Royal Dutch/Shell Group | 11.9 | 3.2 | 12.0 | ||||||||||||||
| Earnings for the year attributable to shareholders | 26.5 | 29.3 | 35.4 | ||||||||||||||
| a | Of the earnings per share amounts shown above, those relating to earnings for the year attributable to shareholders are, in the opinion of the Directors, the most meaningful since they reflect the full entitlement of the Company in the income of Group companies. |
| Balance Sheet | £ million |
| 2002 | 2001 | |||||||||||||
| Note | As restated | As restated | ||||||||||||
Fixed assets | ||||||||||||||
| Investments | ||||||||||||||
| Shares (unlisted) in companies of the Royal Dutch/ Shell Group | 6 | 15,654.6 | 16,026.8 | |||||||||||
Current assets | ||||||||||||||
| Debtors | ||||||||||||||
| Dividends receivable from companies of the Royal Dutch/ Shell Group | 1,263.7 | 1,699.3 | ||||||||||||
| Other debtors | 0.1 | 0.4 | ||||||||||||
| 1,263.8 | 1,699.7 | |||||||||||||
| Cash at bank: | ||||||||||||||
| Short-term deposits | 89.9 | 67.5 | ||||||||||||
| Cash | 0.4 | 0.6 | ||||||||||||
| 1,354.1 | 1,767.8 | |||||||||||||
| Creditors: amounts due within one year | ||||||||||||||
| Amounts due to companies of the Royal Dutch/ Shell Group | 1.1 | 1.0 | ||||||||||||
| Corporation tax | 0.2 | 0.4 | ||||||||||||
| Unclaimed dividends | 9.5 | 9.1 | ||||||||||||
| Other creditors and accruals | 2.3 | 2.3 | ||||||||||||
| Preference dividends accrued | 0.3 | 0.3 | ||||||||||||
| Ordinary dividend proposed | 899.1 | 872.5 | ||||||||||||
| 912.5 | 885.6 | |||||||||||||
Net current assets | 441.6 | 882.2 | ||||||||||||
Total assets less current liabilities | 16,096.2 | 16,909.0 | ||||||||||||
Capital and reserves | ||||||||||||||
| Equity interests: | ||||||||||||||
| Called-up share capital; Ordinary shares | 7 | 2,416.9 | 2,437.2 | |||||||||||
| Capital redemption reserve | 8 | 69.0 | 48.7 | |||||||||||
| Revaluation reserve | 6 | 13,154.9 | 13,527.1 | |||||||||||
| Profit and Loss Account | 443.4 | 884.0 | ||||||||||||
| 16,084.2 | 16,897.0 | |||||||||||||
| Non-equity interests | ||||||||||||||
| Called-up share capital: | 7 | |||||||||||||
| First Preference shares | 2.0 | 2.0 | ||||||||||||
| Second Preference shares | 10.0 | 10.0 | ||||||||||||
| 12.0 | 12.0 | |||||||||||||
Shareholders’ funds | 9 | 16,096.2 | 16,909.0 | |||||||||||
Lord Oxburgh
Chairman
March 3, 2005
S 2 The “ Shell ” Transport and Trading Company, Public Limited Company
20-F/A (Amendment No. 2) 2002
Table of Contents
| Statement of Total Recognised Gains and Losses (as restated) | ||||||||||||||||
| £ million | ||||||||||||||||
| Note | 2002 | 2001 | 2000 | |||||||||||||
| Distributable profit for the year | 1,404.0 | 2,547.3 | 2,308.3 | |||||||||||||
| Unrealised surplus/(deficit) on revaluation of investments in companies of the Royal Dutch/ Shell Group | 6 | (372.2 | ) | 256.3 | 1,617.2 | |||||||||||
| Total recognised gains and losses relating to the year | 1,031.8 | 2,803.6 | 3,925.5 | |||||||||||||
| Prior year adjustment | 2 | (5.4 | ) | – | – | |||||||||||
| Total recognised gains and losses since last annual report | 1,026.4 | 2,803.6 | 3,925.5 | |||||||||||||
| Statement of Retained Profit | £ million | |||||||||||||||||
| 2002 | 2001 | 2000 | ||||||||||||||||
| Distributable profit for the year | 1,404.0 | 2,547.3 | 2,308.3 | |||||||||||||||
| Distributable retained profit | ||||||||||||||||||
| at beginning of year | 884.0 | 876.3 | 20.6 | |||||||||||||||
| 2,288.0 | 3,423.6 | 2,328.9 | ||||||||||||||||
| Dividends on non-equity shares: | 7 | |||||||||||||||||
| First Preference shares | 0.1 | 0.1 | 0.1 | |||||||||||||||
| Second Preference shares | 0.7 | 0.7 | 0.7 | |||||||||||||||
| 0.8 | 0.8 | 0.8 | ||||||||||||||||
| 2,287.2 | 3,422.8 | 2,328.1 | ||||||||||||||||
| Dividends on equity shares: | 7 | |||||||||||||||||
| 25p Ordinary shares | ||||||||||||||||||
| Interim of 5.95p in 2002, 5.85p in 2001 and 5.7p in 2000 | 578.0 | 574.4 | 566.8 | |||||||||||||||
| Final of 9.30p in 2002, 8.95p in 2001 and 8.9p in 2000 | 899.1 | 872.5 | 885.0 | |||||||||||||||
| Reduction due to share buyback and unclaimed dividends | (2.9 | ) | (7.1 | ) | – | |||||||||||||
| 1,474.2 | 1,439.8 | 1,451.8 | ||||||||||||||||
| Share repurchase including expenses | 369.6 | 1,099.0 | – | |||||||||||||||
| Distributable retained profit at end of year | 443.4 | 884.0 | 876.3 | |||||||||||||||
The “ Shell ” Transport and Trading Company, Public Limited Company S 3
20-F/A (Amendment No. 2) 2002
Table of Contents
| Statement of Cash Flows | £ million | |||||||||||
| 2002 | 2001 | 2000 | ||||||||||
| Returns on investments and servicing of finance | ||||||||||||
| Dividends received from companies of the Royal Dutch/ Shell Group | 1,838.8 | 2,586.9 | 1,412.0 | |||||||||
| Interest received | 5.6 | 5.5 | 4.3 | |||||||||
| Preference dividends paid | (0.8 | ) | (0.8 | ) | (0.8 | ) | ||||||
| Other | (3.7 | ) | (2.6 | ) | (2.4 | ) | ||||||
| Net cash inflow from returns on investments and servicing of finance | 1,839.9 | 2,589.0 | 1,413.1 | |||||||||
| Taxation | ||||||||||||
| Tax paid | (0.6 | ) | (0.5 | ) | (0.3 | ) | ||||||
| Equity dividends paid | ||||||||||||
| Ordinary shares | (1,447.6 | ) | (1,452.3 | ) | (1,412.0 | ) | ||||||
| Management of liquid resources (short-term deposits) | ||||||||||||
| Net cash inflow/(outflow) from management of liquid resources | (22.4 | ) | (38.0 | ) | (0.5 | ) | ||||||
| Financing | ||||||||||||
| Repurchase of share capital, including expenses | (369.6 | ) | (1,099.0 | ) | – | |||||||
| Net (decrease)/increase in amounts due to companies of the Royal Dutch/ Shell Group | 0.1 | 0.5 | 0.1 | |||||||||
| Increase/(Decrease) in cash | (0.2 | ) | (0.3 | ) | 0.4 | |||||||
| Cash at January 1 | 0.6 | 0.9 | 0.5 | |||||||||
| Cash at December 31 | 0.4 | 0.6 | 0.9 | |||||||||
Net debts, being amounts due to the companies of the Royal Dutch/ Shell Group less cash, increased during 2002 from £0.4 million to £0.7 million (2001: net debts increased from £0.4 million net funds to £0.4 million net debts).
The Company adopts a policy of minimising cash holdings whilst ensuring that operating costs, the financing of dividend payments and funding of the Company’s share buyback programme, are met. The Company’s debtors and creditors are short term and are all denominated in sterling.
At December 31, 2002 the Company had £89.9 million (2001: £67.5 million) on short-term deposit with third-party banks. The fixed interest rate earned on these sterling deposits at year-end was 4.4% (2001: 4.5%). The carrying amount and fair value of these deposits are the same.
S 4 The “ Shell ” Transport and Trading Company, Public Limited Company
20-F/A (Amendment No. 2) 2002
Table of Contents
Notes to the Financial Statements
1 The Company
Shell Transport, one of the Parent Companies of the Royal Dutch/ Shell Group of Companies, is a holding company which, in conjunction with Royal Dutch Petroleum Company (Royal Dutch), owns, directly or indirectly, investments in the numerous companies referred to collectively as “the Group”. Shell Transport has no investments in associated undertakings other than in companies of the Group.
Arrangements between Royal Dutch and Shell Transport provide, inter alia, that notwithstanding variations in shareholdings, Royal Dutch and Shell Transport shall share in the aggregate net assets and in the aggregate dividends and interest received from Group companies in the proportion of 60:40. It is further arranged that the burden of all taxes in the nature of or corresponding to an income tax leviable in respect of such dividends and interest shall fall in the same proportion.
2(a) Accounting policies and convention
The Financial Statements on pages S2 to S14 herein have been prepared in accordance with the United Kingdom Companies Act 1985 and with applicable United Kingdom accounting standards. They have been prepared under the historical cost convention modified by the revaluation of the investments in companies of the Royal Dutch/Shell Group (see Note 6). The disclosures described in Note 3 have been derived from the Group Financial Statements.
The Company records income from shares in Group companies, in the form of dividends, in its Profit and Loss Account. The Company’s investments in Group companies comprises a 40% interest in the Group’s net assets. An amount equal to 40% of the net assets of the Group, as presented in the Group Financial Statements in accordance with Group accounting policies, is included in the Company’s Financial Statements as the Directors’ valuation of this investment. The difference between the cost and the amount at which the investments are stated in the Balance Sheet has been taken to the Revaluation Reserve.
2(b) First Restatement of previously issued financial statements
In this Amendment No. 2 the Group Financial Statements are presented in accordance with US GAAP with separate information presented under Netherlands GAAP. The accounting policies under Netherlands GAAP in the Group Financial Statements, in respect of inventory accounting, the amortisation of goodwill, exploration costs, and certain contracts for the sale and delivery of own natural gas production, have been revised in this Amendment No. 2. The Netherlands GAAP basis of presentation in the Group Financial Statements is more closely aligned with UK GAAP, particularly in the requirement to amortise goodwill. In addition, following a European Union directive, both UK and Netherlands GAAP are converging towards International Financial Reporting Standards for adoption in 2005. Therefore, in this Amendment No. 2 the Company has elected to present its investments in the Group at a Directors’ valuation based on 40% of the revised separate Netherlands GAAP information presented by the Group.
This is a change in accounting policy, and all amounts set forth herein have been restated accordingly. The Group Financial Statements also include a restatement of the Group’s depreciation, depletion, amortisation and other charges arising from the overstatement of unaudited proved oil and gas reserves resulting from field level reviews concluded in April 2004 (the First Reserve Restatement). The effect of the First Reserves Restatement is not significant to the Directors’ valuation of the Company’s investment in Group companies and has been treated as a prior period adjustment so that the impact can be separately identified.
The “ Shell ” Transport and Trading Company, Public Limited Company S 5
20-F/A (Amendment No. 2) 2002
Table of Contents
2(c) Second Restatement of previously issued financial statements
The restatement of the Group Financial Statements (the Second Financial Restatement) following the restatement of unaudited oil and gas reserves disclosure contained in the supplementary information accompanying the Group Financial Statements (the Second Reserves Restatement and together with the First Reserves Restatement, the Reserves Restatement), as a result of reservoir level reviews conducted during July 2004 through December 2004 of substantially all of the Group’s proved reserves volumes reported as at December 31, 2003, (collectively, the Second Half Review) includes a restatement of the Group’s depreciation, depletion, amortisation and other charges arising from the overstatement of unaudited proved oil and gas reserves. Refer to Note 32(b) of the Group Financial Statements on G48.
The effect of the Second Financial Restatement was to reduce the Company’s earnings for the year attributable to shareholders in 2002 by £15.6 million (2001: £13.5 million; 2000: £13.4 million), and to reduce the previously reported net assets of the Company as at December 31, 2002 by £41.8 million (2001: £27.9 million). There was no impact on the Profit and Loss Account of the Company (2001: nil, 2000: nil). The effect of the Second Reserves Restatement is not significant to the Directors’ valuation of the Company’s investment in Group Companies and has been treated as a prior year period adjustment so that the impact can be separately identified.
2(d) Effect of First Restatement and Second Restatement
The effect of the changes in Notes 2(b) and 2(c) on the Company’s investments, including the effect on the Company’s 2002 Financial Statements, is as follows:
| £ million | ||||||||||||||
| 2002 | 2001 | 2000 | ||||||||||||
| Investments as previously reported | 15,632.3 | 16,032.2 | 15,629.4 | |||||||||||
| Impact of changes in the presentation of the Group Financial Statements: | ||||||||||||||
| Effect of changes in accounting policies under Netherlands GAAP | 132.8 | 68.9 | 188.7 | |||||||||||
| Oil and gas reserves related adjustments: | ||||||||||||||
| First Reserves Restatement | (68.7 | ) | (46.4 | ) | (33.7 | ) | ||||||||
| Second Reserve Restatement | (41.8 | ) | (27.9 | ) | (13.9 | ) | ||||||||
| 22.3 | (5.4 | ) | 141.1 | |||||||||||
| Investments as restated | 15,654.6 | 16,026.8 | 15,770.5 | |||||||||||
There is an equivalent effect on the Revaluation reserve, which is reflected in the Company’s share of earnings retained by companies of the Royal Dutch/Shell Group. There is no impact on the Company’s distributable profit.
S 6 The “ Shell ” Transport and Trading Company, Public Limited Company
20-F/A (Amendment No. 2) 2002
Table of Contents
3 Share in the income and assets of Group companies
Shell Transport’s share in certain items relating to the two Group Holding Companies and Shell Petroleum Inc., described in Note 6, is set out below. These companies own directly or indirectly the investments, which, with them, comprise the Group. The following supplementary information has therefore been provided in respect of the Group Holding Companies and Shell Petroleum Inc. in the aggregate and is derived from the Group Financial Statements on pages G2 to G4.
| £ million | ||||||||
| 2002 | 2001 | |||||||
| As restateda | As restateda | |||||||
| Fixed assets including Parent Companies’ shares | 27,327.4 | 21,296.6 | ||||||
| Current assets including other long-term assets | 12,182.2 | 10,602.6 | ||||||
| Current liabilities | 13,727.6 | 9,233.0 | ||||||
| Long-term liabilities | 3,994.2 | 2,365.9 | ||||||
| Provisions | 5,245.9 | 3,317.3 | ||||||
| £ million | ||||||||||||
| 2002 | 2001 | 2000 | ||||||||||
| As restateda | As restateda | As restateda | ||||||||||
| Sales proceeds | 62,819.9 | 49,229.9 | 52,178.2 | |||||||||
| Sales taxes, excise duties and similar levies | 14,983.8 | 11,687.9 | 11,548.2 | |||||||||
Net proceeds | 47,836.1 | 37,542.0 | 40,630.0 | |||||||||
| Operating profit after net currency gains/ losses | 4,817.6 | 5,295.5 | 6,679.8 | |||||||||
| Interest and other income | 202.2 | 294.2 | 265.5 | |||||||||
| Interest expense | 363.9 | 314.8 | 360.9 | |||||||||
Income before taxation | 4,655.9 | 5,274.9 | 6,584.4 | |||||||||
| Taxation | 2,065.3 | 2,322.6 | 3,078.9 | |||||||||
| Minority interests | 46.7 | 90.5 | 12.8 | |||||||||
Net income for the year | 2,543.9 | 2,861.8 | 3,492.7 | |||||||||
| $ million | ||||||||||||
Net income for the yearb | 3,814 | 4,121 | 5,125 | |||||||||
| a | Restated to reflect information presented under Netherlands GAAP. | |
| b | Refer to Note 36 to the Group Financial Statements on pages G51 to G53. |
The “ Shell ” Transport and Trading Company, Public Limited Company S 7
20-F/A (Amendment No. 2) 2002
Table of Contents
This supplementary information has been calculated in conformity with the accounting policies of the Group Financial Statements set out on pages G10 to G13 as adjusted on page G46 to conform with Netherlands GAAP. These policies differ in certain respects from accounting principles generally accepted in the United Kingdom. If this supplementary information was presented in conformity with accounting principles generally accepted in the United Kingdom, the impact on net assets at December 31, 2002 would not be significant, although current assets including other long-term assets would increase by approximately £0.3 billion (2001: £nil), fixed assets would decrease by approximately £0.8 billion (2001: increase £0.9 billion), long-term liabilities would decrease by approximately £0.1 billion (2001 increase £0.2 billion) and provisions would decrease by approximately £0.9 billion (2001: increase £0.3 billion). The impact on net income for the year is not significant.
Shell Transport’s distributions from Group companies were as follows:
| £ million | ||||||||||||
| 2002 | 2001 | 2000 | ||||||||||
| Distributions from Group companies | 1,403.2 | 2,545.6 | 2,307.4 | |||||||||
| $ million | ||||||||||||
Distributions from Group companiesa | 2,174 | 3,665 | 3,432 | |||||||||
| a | Refer to Note 36 to the Group Financial Statements on pages G51 to G53. |
4 Tax on profit on ordinary activities
| £ million | ||||||||||||
| 2002 | 2001 | 2000 | ||||||||||
| Corporation tax at 30% (2001 and 2000: 30%) in respect of interest income less administrative expenses | 0.4 | 0.7 | 0.3 | |||||||||
No taxation liability arises in respect of income from shares in companies of the Group as this income consists of a distribution, which is not subject to taxation, from a UK resident company. Consequently, the effective tax rate is substantially lower than the UK Corporation tax rate of 30%.
Shell Transport’s share of taxation borne by Group and associated companies is given in Note 3.
5 Earnings per share
The basic earnings per share amounts shown are calculated after deducting 5.5% and 7% cumulative dividend on First and Second Preference shares respectively. The calculation uses a weighted average number of shares of 9,608,614,760 (2001: 9,758,574,437 shares; 2000: 9,882,388,055 shares). The earnings per share calculation excludes shares held by Group companies for share options and other incentive compensation plans (refer to Note 22 of the Group Financial Statements on pages G30 to G32). Prior year amounts have been restated accordingly. The effect is to increase earnings per share for 2002 by 0.1 pence and for 2001 by 0.2 pence and for 2000 by 0.2 pence. There is no difference between basic and diluted earnings per share for 2002 and 2001. The diluted earnings per share for 2000, as restated, was 23.3 pence. The same earnings figure is used in the basic and diluted earnings per share calculation. For the diluted earnings per share calculation the weighted average number of shares is increased by 4,661,292 for 2002 (2001: 12,602,362; 2000: 17,170,048). These numbers relate to share options schemes as mentioned above.
6 Investments in Group companies
Shell Transport has 40% equity shareholdings in The Shell Petroleum Company Limited, which is registered in England and Wales, (consisting of the whole of its 102,342,930 issued “B” shares of £1 each) and in Shell Petroleum N.V., which is incorporated in the Netherlands (consisting of the whole of its 44 issued “B” shares of N.fl.5,000,000 each). The remaining 60% equity shareholdings in these two companies (consisting of 153,514,395 “A” shares of £1 each of The Shell Petroleum Company Limited and 66 “A” shares of N.fl.5,000,000 each of Shell Petroleum N.V.) are held by Royal Dutch.
Shell Transport also holds 1,600 Class “B” shares of US $1 each in Shell Petroleum Inc., which is incorporated in the State of Delaware, USA. These shares, together with the 2,400 Class “A” shares of US $1 each in that company held by Royal Dutch, carry voting control of Shell Petroleum Inc. but are restricted in regard to dividends to 12% of their par value per annum. Shell Petroleum N.V. holds the remaining 1,000 shares of US $1 each in Shell Petroleum Inc., which are unrestricted in regard to dividends.
The Shell Petroleum Company Limited, Shell Petroleum N.V. and Shell Petroleum Inc. own, directly or indirectly, the investments representing the total Group interest in the other companies which, with them, comprise the Group.
S 8 The “ Shell ” Transport and Trading Company, Public Limited Company
20-F/A (Amendment No. 2) 2002
Table of Contents
Movements in Investments and Revaluation reserves
The Directors’ valuation of Shell Transport’s investment in Group companies comprises the following:
| $ million | £ million | ||||||||||||||||
| Shell | |||||||||||||||||
| Exchange | Transport | Revaluation | |||||||||||||||
| 40% interest in | rate | investments | reserve | ||||||||||||||
| Group net assetsa,d | ($/£) | As restated | As restated | ||||||||||||||
Balance at December 31, 2000 as previously reported | 23,358 | 0.67 | 15,629.4 | 13,129.7 | |||||||||||||
| Cumulative restatement at December 31, 2000 as described in Note 2(a) | 212 | 0.67 | 141.1 | 141.1 | |||||||||||||
Balance at December 31, 2000 as restated | 23,570 | 0.67 | 15,770.5 | 13,270.8 | |||||||||||||
| Deduct: 40% of the book value of Parent Companies’ shares held by Group companies at December 31, 2000 | (524 | ) | 0.67 | (350.8 | )c | (350.8 | )c | ||||||||||
Share of Group net assets at December 31, 2000 as restated | 23,046 | 0.67 | 15,419.7 | 12,920.0 | |||||||||||||
Movements during the year 2001: | |||||||||||||||||
| Share in the net income of Group companies | 4,121 | 0.69 | 2,861.8 | 2,861.8 | |||||||||||||
| Distribution to Shell Transport | (3,665 | ) | 0.69 | (2,545.6 | ) | (2,545.6 | ) | ||||||||||
| Undistributed net income of Group companies | 456 | 0.69 | 316.2 | 316.2 | |||||||||||||
| Net (increase)/decrease in Parent Companies’ shares held by Group companies | (257 | ) | c | (187.9 | ) | (187.9 | ) | ||||||||||
Other comprehensive incomeb | (788 | ) | 0.69 | (543.2 | ) | (543.2 | ) | ||||||||||
| Translation effect arising from movements in the dollar/sterling rate | 483.3 | 483.3 | |||||||||||||||
Share of Group net assets at December 31, 2001 as restated | 22,457 | 0.69 | 15,488.1 | 12,988.4 | |||||||||||||
| Add: 40% of the book value of Parent Companies’ shares held by Group companies at December 31, 2001 | 538.7 | c | 538.7 | c | |||||||||||||
Balance at December 31, 2001 as restated | 16,026.8 | 13,527.1 | |||||||||||||||
| Deduct: 40% of the book value of Parent Companies’ shares held by Group companies at December 31, 2001 | (538.7 | )c | (538.7 | )c | |||||||||||||
| 15,488.1 | 12,988.4 | ||||||||||||||||
Movements during the year 2002: | |||||||||||||||||
| Share in the net income of Group companies | 3,814 | 0.67 | 2,543.9 | 2,543.9 | |||||||||||||
| Distribution to Shell Transport | (2,174 | ) | 0.65 | (1,403.2 | ) | (1,403.2 | ) | ||||||||||
| Undistributed net income of Group companies | 1,640 | 0.69 | 1,140.7 | 1,140.7 | |||||||||||||
| Net (increase)/decrease in Parent Companies’ shares held by Group companies | (337 | ) | c | (156.9 | ) | (156.9 | ) | ||||||||||
Other comprehensive incomeb | 302 | 0.62 | 188.3 | 188.3 | |||||||||||||
| Translation effect arising from movements in the dollar/ sterling rate | (1,701.2 | ) | (1,701.2 | ) | |||||||||||||
Share of Group net assets at December 31, 2002 as restated | 24,062 | 0.62 | 14,959.0 | 12,459.3 | |||||||||||||
| Add: 40% of the book value of Parent Companies’ shares held by Group companies at December 31, 2002 | 695.6 | c | 695.6c | ||||||||||||||
Balance at December 31, 2002 as restated | 15,654.6 | 13,154.9 | |||||||||||||||
| $ million | ||||||||||||
| 2002 | 2001 | 2000 | ||||||||||
| As restated | As restated | As restated | ||||||||||
| Shell Transport’s 40% interest in Group net assets at December 31 (see Note 36 on pages G51 to G53) | 24,062 | 22,457 | 23,046 | |||||||||
| £ million | |||||||||||||
| 2002 | 2001 | 2000 | |||||||||||
| As restated | As restated | As restated | |||||||||||
| Comprising: | |||||||||||||
| Cost of Shell Transport’s investment in Group companies | 178.4 | 178.4 | 178.4 | ||||||||||
| Shell Transport’s share of: | |||||||||||||
| Retained earnings of Group companies | 16,723.0 | 15,582.3 | 15,266.1 | ||||||||||
Cumulative other comprehensive incomea | (1,579.7 | ) | (1,768.0 | ) | (1,224.8 | ) | |||||||
| Currency translation differences | 332.9 | 2,034.1 | 1,550.8 | ||||||||||
| 15,654.6 | 16,026.8 | 15,770.5 | |||||||||||
| £/$ exchange rate at December 31 | 0.62 | 0.69 | 0.67 | ||||||||||
| a | The Group Financial Statements have been restated (see Notes 2(a) and (b) to the Group Financial Statements and pages G2 to G53). |
| b | Other comprehensive income comprises principally cumulative currency translation differences arising within the Group Financial Statements. |
| c | The cumulative Parent Companies’ shares held by Group companies at December 31 of each year is translated at the year-end dollar/ sterling exchange rate. The net (increase)/decrease in Parent Companies’ shares held by Group companies comprises the movement between these cumulative year-end balances including the translation effect arising from movements in the dollar/ sterling exchange rate year on year. |
| d | See Notes 32 and 36 to the Netherlands GAAP Financial Statements. |
The “ Shell ” Transport and Trading Company, Public Limited Company S 9
20-F/A (Amendment No. 2) 2002
Table of Contents
The earnings retained by Group companies have been, or will be, substantially reinvested by the companies concerned, and any taxation unprovided on possible future distributions out of any uninvested retained earnings will not be material.
The Company will continue to hold its investments in Group companies. However, as the investments are stated in the Balance Sheet on a valuation basis, it is necessary to report that, if the investments were to be disposed of for the amount stated, a taxation liability of approximately £1.1 billion would arise (2001: £1.4 billion).
7 Share capital and dividends
At December 31, 2001 and December 31, 2002 the authorised share capital of the Company was £2,500,000,000 divided into 9,948,000,000 Ordinary shares of 25 pence each, 3,000,000 First Preference shares of £1 each and 10,000,000 Second Preference shares of £1 each.
The allotted, called up and fully paid share capital at December 31, 2002 was as follows:
| Number of shares | £ | ||||||||
| Equity shares | |||||||||
| Ordinary shares of 25p each | |||||||||
| As at January 1 | 9,748,625,000 | 2,437,156,250 | |||||||
| Shares repurchased for cancellation | 81,125,000 | 20,281,250 | |||||||
| As at December 31 | 9,667,500,000 | 2,416,875,000 | |||||||
| Non-equity shares | |||||||||
| First Preferences shares of £1 each | 2,000,000 | 2,000,000 | |||||||
| Second Preference shares of £1 each | 10,000,000 | 10,000,000 | |||||||
| 12,000,000 | 12,000,000 | ||||||||
The First and Second Preference shares (the Preference shares) confer on the holders the right to a fixed cumulative dividend (5.5% and 7% on First and Second Preference shares respectively) and rank in priority to Ordinary shares. On a winding up or repayment the Preference shares also rank in priority to the Ordinary shares for the nominal value of £1 per share (plus a premium, if any, equal to the excess over £1 of the daily average price for the respective shares quoted in the London Stock Exchange Daily Official List for a six months period preceding the repayment or winding up) but do not have any further rights of participation in the profits or assets of the Company. The Preference shares do not have voting rights unless their dividend is in arrears or the proposal concerns a reduction of capital, winding up, sanctioning the sale of undertaking, an alteration of the Articles of Association or otherwise directly affects their class rights.
The Preference shares are irredeemable and form part of the permanent capital of the Company. The number in issue has remained unchanged since 1922. The fair value of the Preference shares based on market valuations at December 31, 2002 was 97.6 pence per share (2001: 92.17 pence per share) for the First Preference shares and 135.0 pence per share (2001: 128.0 pence per share) for the Second Preference shares.
Ordinary dividends paid and proposed are as follows:
| £ million | ||||||||||||
| 2002 | 2001 | 2000 | ||||||||||
| Interim of 5.95p in 2002, 5.85p in 2001 and 5.7p in 2000 | 578.0 | 574.4 | 566.8 | |||||||||
| Final of 9.30p in 2002, final of 8.95p in 2001 and final of 8.9p in 2000 | 899.1 | 872.5 | 885.0 | |||||||||
| Reduction due to share buyback and unclaimed dividends | (2.9 | ) | (7.1 | ) | – | |||||||
| 1,474.2 | 1,439.8 | 1,451.8 | ||||||||||
The charges for 2002 ordinary dividends of £1,477.1 million were reduced by the release of £2.5 million from the provisions for the final dividend at December 31, 2001 and interim dividend at June 30, 2002. This was due to the subsequent cancellation of shares resulting from the Company’s share buyback programme during the period.
8 Capital redemption reserve
| £ million | ||||||||
| 2002 | 2001 | |||||||
| As at January 1 | 48.7 | – | ||||||
| Movement relating to shares bought by Shell Transport and cancelled | 20.3 | 48.7 | ||||||
| As at December 31 | 69.0 | 48.7 | ||||||
S 10 The “ Shell ” Transport and Trading Company, Public Limited Company
20-F/A (Amendment No. 2) 2002
Table of Contents
Share capital was cancelled on all shares repurchased under the Company’s share buyback programme. As required by the Companies Act 1985, the equivalent of the nominal value of the shares cancelled is transferred to a capital redemption reserve.
9 Reconciliation of movements in Shareholders’ funds
| £ million | ||||||||
| 2002 | 2001 | |||||||
| As restated | As restated | |||||||
| Distributable profit for the year | 1,404.0 | 2,547.3 | ||||||
| Dividends | (1,475.0 | ) | (1,440.6 | ) | ||||
| Repurchase of share capital, including expenses | (369.6 | ) | (1,099.0 | ) | ||||
| Unrealised surplus/(deficit) on revaluation of investments in companies of the Royal Dutch/ Shell Group (Note 6) | (372.2 | ) | 256.3 | |||||
| Net addition/(reduction) to Shareholders’ funds | (812.8 | ) | 264.0 | |||||
| Shareholders’ funds as at January 1 (originally £16,914.4 million before adjusting for the effect of the prior year adjustment as described in Note 2 of £5.4 million) | 16,909.0 | 16,645.0 | ||||||
| Shareholders’ funds as at December 31 | 16,096.2 | 16,909.0 | ||||||
10 Auditors’ remuneration
Audit fees of Shell Transport amounted to £31,000 in 2002, £25,500 in 2001 and £16,015 in 2000. Fees payable to PricewaterhouseCoopers for non-audit services in the UK amounted to £23,000 in 2002, £30,000 in 2001 and £nil in 2000. The non-audit fees relate to advice in respect of a review of the financial reporting impact of developments in accounting policies and business activities of the Royal Dutch/ Shell Group on the financial statements of Shell Transport, including proposed developments in International Financial Reporting Standards. A portion of the non-audit fees relates to the prior year and is disclosed accordingly.
11 Aggregate Directors’ emoluments
| £ | ||||||||||||
| 2002 | 2001 | 2000 | ||||||||||
| Salaries, fees and benefits | 1,716,378 | 1,979,253 | 1,974,161 | |||||||||
| Performance-related element | 1,663,325 | 1,157,218 | a | 760,050 | ||||||||
| 3,379,703 | 3,136,471 | 2,734,211 | ||||||||||
“Excess” retirement benefitsb | 23,495 | 41,800 | 34,056 | |||||||||
| Realised share option gains | 16,476 | 1,653,429 | 1,376,544 | |||||||||
| Of the emoluments disclosed, £458,162 in 2002, £326,783 in 2001 and £329,666 in 2000, were borne by Shell Transport and charged in the Profit and Loss Account. |
| a | Prior year numbers have been restated to include the Deferred Bonus Plan entitlement awarded during 2002 in respect of 2001. | |
| b | Excess retirement benefits are the amount of unfunded retirement benefits paid to or receivable by past Directors which exceed those to which they were entitled on the date on which the benefits first became payable or March 31, 1997, whichever is the later. |
The “ Shell ” Transport and Trading Company, Public Limited Company S 11
20-F/A (Amendment No. 2) 2002
Table of Contents
12 Reconciliation between US GAAP and UK GAAP (as restated)
On a UK GAAP basis, net income is represented by “Distributable profit”; however, on a US GAAP basis the net income equivalent would be “Earnings attributable to shareholders” adjusted for US GAAP differences.
| Reconciliation between US GAAP and UK GAAP | ||||||||||||||||||||||||||||||||
| pence | £ million | £ million | ||||||||||||||||||||||||||||||
| Earnings per share | Net Income | Net Assets | ||||||||||||||||||||||||||||||
| 2002 | 2001 | 2000 | 2002 | 2001 | 2000 | 2002 | 2001 | |||||||||||||||||||||||||
| In accordance with UK GAAP: | 14.6 | 26.1 | 23.4 | 1,404.0 | 2,547.3 | 2,308.3 | 16,096.2 | 16,909.0 | ||||||||||||||||||||||||
Exclude 40% of Parent Companies’ shares held by Group companies | (695.6 | ) | (538.7 | ) | ||||||||||||||||||||||||||||
Less: Income from shares in companies of the Royal Dutch/Shell Group | (14.6 | ) | (26.1 | ) | (23.4 | ) | (1,403.2 | ) | (2,545.6 | ) | (2,307.4 | ) | ||||||||||||||||||||
Share in the Netherlands GAAP net income of companies of the Royal Dutch/Shell Group | 26.5 | 29.3 | 35.4 | 2,543.9 | 2,861.8 | 3,492.7 | ||||||||||||||||||||||||||
Amortisation of Goodwill | 0.4 | — | — | 33.3 | — | — | 29.8 | — | ||||||||||||||||||||||||
Ordinary dividend proposed | 899.1 | 872.5 | ||||||||||||||||||||||||||||||
Share in the US GAAP net income of companies of the Royal Dutch/Shell Group | 26.9 | 29.3 | 35.4 | 2,577.2 | 2,861.8 | 3,492.7 | ||||||||||||||||||||||||||
| In accordance with US GAAP | 26.9 | 29.3 | 35.4 | 2,578.0 | 2,863.5 | 3,493.6 | 16,329.5 | 17,242.8 | ||||||||||||||||||||||||
Under UK GAAP Shell Transport, as a parent company with no subsidiaries, accounts for its share of earnings in the Group on a dividend receivable basis in its profit and loss account. Its investment in the Group is at a Directors’ valuation based on 40% of the revised separate Netherlands GAAP information presented by the Group, together with 40% of the carrying value of Parent Companies’ shares held by Group companies. This is not in accordance with US GAAP which, in the circumstances of Shell Transport, would require equity accounting. In addition under UK GAAP dividends are recorded in the year in respect of which they are declared (in the case of interim dividends) or proposed by the board of directors to the shareholders (in the case of final dividends). US GAAP requires dividends to be recorded in the period in which they are declared. The reconciliation between US GAAP and UK GAAP in the table above has been updated for this item, which increases the US GAAP net assets in previously issued financial statements of £15,472.2 million (2001: £16,398.2 million) by £899.1 million (2001: £872.5 million). In addition, the net assets under both UK GAAP and US GAAP have reduced by £41.8 million (2001: £27.9 million) for the Second Financial Restatement as detailed in Note 2(c) and 2(d). The dividend adjustment has no impact on net income for 2002 (2001: nil).
The adjustment to net income and earnings per share represents the impact on net income for Shell Transport if the equity method of accounting was applied incorporating Shell Transport’s share of net income of Group companies on a US GAAP basis. This includes an adjustment to Shell Transport’s share of net income of Group companies for the amortisation of goodwill. Under US GAAP, commencing in 2002, goodwill is no longer amortised but instead tested for impairment annually or when certain events occur that indicates potential impairment. Under Netherlands GAAP, goodwill is amortised on a straight-line basis over its estimated useful economic life, which is assumed not to exceed 20 years unless there are grounds to rebut this assumption.
The adjustment to net assets represents the effect of adopting equity accounting, together with the deduction of 40% of the carrying value of Parent Companies’ shares and of recording dividends in the period in which they are declared as required by US GAAP.
S 12 The “ Shell ” Transport and Trading Company, Public Limited Company
20-F/A (Amendment No. 2) 2002
Table of Contents
| 40% interest of Shell Transport in line items as derived from | ||||||||
| the Netherlands GAAP Group Financial Statements | £ million | $ million | ||||||
Balance Sheet | ||||||||
2002: | ||||||||
| Current assets | 10,358.7 | 16,662 | ||||||
| Non current assets | 28,455.3 | 45,769 | ||||||
| Current liabilities | (13,727.6 | ) | (22,080 | ) | ||||
| Non current liabilities | (9,240.1 | ) | (14,862 | ) | ||||
| Minority interests in Group companies (40% of Group amount on page G45 translated at year end rate on page S9) | (887.3 | ) | (1,427 | ) | ||||
| Shell Transport share of Group net assets (pages S9-GBP & G45-$) | 14,959.0 | 24,062 | ||||||
| Add 40% interest of Parent Company shares held by the Group (S9) | 695.6 | |||||||
| Shell Transport investment in the Group (Pages S2 and S9) | 15,654.6 | |||||||
| Other assets and liabilities of Shell Transport | 441.6 | |||||||
| Net Assets | 16,096.2 | |||||||
2001: | ||||||||
| Current assets | 8,474.1 | 12,287 | ||||||
| Non current assets | 22,886.4 | 33,183 | ||||||
| Current liabilities | (9,233.0 | ) | (13,387 | ) | ||||
| Non current liabilities | (5,683.2 | ) | (8,240 | ) | ||||
| Minority interests in Group companies (40% of Group amount on page G45 translated at year end rate on page S9) | (956.2 | ) | (1,386 | ) | ||||
| Shell Transport share of Group net assets (pages S9-GBP & G45-$) | 15,488.1 | 22,457 | ||||||
| Add 40% interest of Parent Company shares held by the Group (S9) | 538.7 | |||||||
| Shell Transport investment in the Group (Pages S2 and S9) | 16,026.8 | |||||||
| Other assets and liabilities of Shell Transport | 882.2 | |||||||
| Net Assets | 16,909.0 | |||||||
Profit and Loss account | ||||||||
2002: | ||||||||
| Sales proceeds | 62,819.9 | 94,193 | ||||||
| Operating profit | 4,823.8 | 7,233 | ||||||
| Net income for the year | 2,543.9 | 3,814 | ||||||
| Distribution for the year | 1,403.2 | 2,174 | ||||||
2001: | ||||||||
| Sales proceeds | 49,229.9 | 70,880 | ||||||
| Operating profit | 5,303.9 | 7,636 | ||||||
| Net income for the year | 2,861.8 | 4,121 | ||||||
| Distribution for the year | 2,545.6 | 3,665 | ||||||
2000: | ||||||||
| Sales proceeds | 52,178.2 | 76,567 | ||||||
| Operating profit | 6,710.8 | 9,848 | ||||||
| Net income for the year | 3,492.7 | 5,124 | ||||||
| Distribution for the year | 2,307.4 | 3,432 | ||||||
13 Subsequent events
Contingencies and Litigation
Subsequent to the year ended December 31, 2002, in connection with the recategorisation of certain hydrocarbon reserves announced on January 9, 2004, a number of shareholder class action complaints were filed in the United States District Court of New Jersey, the United States Securities and Exchange Commission (SEC) has issued a formal order of private investigation, the United States Department of Justice has commenced a criminal investigation, the UK Financial Services Authority (FSA) has served formal notice of investigation under the Financial Services and Markets Act 2000 and Euronext Amsterdam and the Dutch Authority Financial Markets are investigating the issues related to the reserves recategorisation. Shell Transport is unable to estimate the range of possible losses from such matters and does not believe their resolution will have a material impact on Shell Transport’s financial condition although they could have a significant effect on periodic results.
On 29 July 2004, the Group announced that it had reached agreements in principle with the SEC and the FSA to resolve their investigations. In connection with the agreement in principle with the SEC, Shell consented, without admitting or denying the SEC’s findings or conclusions, to an administrative order finding that Shell violated, and requiring Shell to cease and desist from future violations of, the antifraud, reporting, recordkeeping and internal control provisions of the US Federal securities laws and related SEC rules, agreed to pay a $120 million civil penalty and has undertaken to spend an additional $5 million developing a comprehensive internal compliance program. In connection with the agreement in principle with the FSA, Shell agreed, without admitting or denying the FSA’s findings or conclusions, to the entry of a Final Notice by the FSA finding that Shell breached
The “ Shell ” Transport and Trading Company, Public Limited Company S 13
20-F/A (Amendment No. 2) 2002
Table of Contents
market abuse provisions of the UK’s Financial Services and Markets Act 2000 and the Listing Rules made under it and agreed to pay a penalty of £17 million.
Restructuring
On October 28, 2004, the Royal Dutch and Shell Transport Boards announced that they had unanimously agreed to propose to their shareholders a transaction (the “Transaction”) through which each Parent Company will become a subsidiary of Royal Dutch Shell plc, which will become a publicly-listed company incorporated in England and Wales and headquartered and tax resident in The Netherlands (“Royal Dutch Shell”). Reflecting the existing 60:40 ownership by Royal Dutch and Shell Transport of the Group, it is proposed that Royal Dutch shareholders will be offered 60% of the ordinary share capital in Royal Dutch Shell and Shell Transport shareholders will receive 40% of the ordinary share capital in Royal Dutch Shell. To implement the proposal, it is intended that (i) Royal Dutch Shell will make an offer to acquire all of the issued and outstanding ordinary shares of Royal Dutch in exchange for Royal Dutch Shell Class A ordinary shares or American depositary shares (“ADSs”) representing Royal Dutch Shell Class A ordinary shares and (ii) Royal Dutch Shell will become the parent company of Shell Transport pursuant to a United Kingdom reorganisational procedure referred to as a “scheme of arrangement” under section 425 of the UK Companies Act 1985, as amended. As a result of the scheme of arrangement, holders of Shell Transport ordinary shares (and holders of Shell Transport bearer warrants) will receive Royal Dutch Shell Class B ordinary shares and holders of Shell Transport ADSs will receive ADSs representing Royal Dutch Shell Class B ordinary shares. The Class A ordinary shares and Class B ordinary shares will have identical voting rights and will vote together as a single class on all matters, including the election of directors, unless a matter affects the rights of one class as a separate class. Class A ordinary shares and Class B ordinary shares will have identical rights upon a liquidation of Royal Dutch Shell and dividends declared on each will be equivalent in amount. However, for tax purposes, holders of Class A ordinary shares will receive Dutch source dividends, while holders of Class B ordinary shares will receive dividends that are UK source to the extent that these dividends are paid through a dividend access mechanism to be established. Implementation of the Transaction will be the subject of appropriate consultation with relevant employee representative bodies as required as well as the satisfaction of certain other conditions. It is currently expected that the Transaction will be completed in July 2005.
S 14 The “ Shell ” Transport and Trading Company, Public Limited Company
20-F/A (Amendment No. 2) 2002
Table of Contents
Remuneration Report
The Board presents its report on Directors’ remuneration for the year ended December 31, 2002.
This report deals with the remuneration policy as it applies and will apply to Group Managing Directors, including those who are also Managing Directors of Shell Transport, and to the non-executive Directors of Shell Transport. The remuneration policy is subject to regular review. This report also contains the disclosure of the individual remuneration of the Directors of Shell Transport.
Remuneration and Succession Review Committee
The Remuneration and Succession Review Committee (REMCO) is a joint committee of the Board of Shell Transport and the Supervisory Board of Royal Dutch (see page 77) and has responsibility for making recommendations on all forms of remuneration with respect to Group Managing Directors.
During the year under review, the REMCO members appointed by the Board of Shell Transport were Nina Henderson, Sir Peter Job and Sir Mark Moody-Stuart, and the members appointed by the Supervisory Board of Royal Dutch were Jonkheer Aarnout Loudon, Professor Joachim Milberg, Henny de Ruiter (appointed July 1, 2002) and Lodewijk van Wachem (retired June 30, 2002). The Chairman of the Committee is currently Jonkheer Aarnout Loudon.
The remuneration of the non-executive Directors of Shell Transport is, in accordance with the Articles of Association, the responsibility of the Board of Shell Transport as a whole and is determined within the limits set by shareholders.
Remuneration policy
Group Managing Directors’ Remuneration
Philosophy
The objective of the remuneration philosophy is to attract and retain high calibre individuals and motivate them towards the achievement of exceptional performance that enhances the value of the Group. The remuneration structures for Group Managing Directors are therefore designed to support alignment of Group Managing Directors’ interests with the goals of the Group and its various businesses and with shareholders’ interests.
Competitive framework
Remuneration levels are set by reference to the practice of global companies of comparable size, complexity and international scope to that of the Group. Among such companies there is an increasing emphasis on performance-linked variable short and long-term pay. Consistent with this and the philosophy outlined above, for on-target performance more than half of a Group Managing Director’s total remuneration will be performance-linked. This proportion is expected to increase in line with market practice.
REMCO is provided with market data on the basis of which it annually reviews remuneration levels and the proportions between fixed and variable pay.
Base salary and fees
The purpose of base salary (which is inclusive of Directors’ fees) is to provide an element of fixed remuneration set at a competitive level that is appropriate to the scope and complexity of the role of a Group Managing Director.
Salary levels are set by reference to market-based salary scales that reflect the collegiate nature of the Committee of Managing Directors. The scales were increased by 6% with effect from July 1, 2002. The salary scales are reviewed annually by REMCO and will be adjusted in line with market practice with effect from July 1, 2003. Progression of an individual Group Managing Director’s salary to the target position is usually over a three-year period from appointment.
Annual and deferred bonus
The purpose of the annual bonus plan is to motivate Group Managing Directors to achieve annual results that further the Group’s long-term objectives.
The target level of bonus for the year 2002 was 100% of base salary (2001 was 65% of base salary). The target for 2003 will be 100% of base salary.
Bonus awards are recommended by REMCO based on the extent of achievement of challenging Group targets that are set as part of the annual Group business plan. These targets encompass financial, customer, people, sustainable development and other operational objectives. For 2002, financial targets related to Total Shareholder Return (TSR) measured annually by the average weighted share price performance plus dividends of Shell Transport and Royal Dutch relative to other major integrated oil companies and Return on Average Capital Employed (ROACE). Having regard to the Group’s performance against all targets, REMCO has recommended that the bonus payable to Group Managing Directors in respect of the year 2002 is 115% of base salary. The same approach will be adopted in 2003.
The “ Shell ” Transport and Trading Company, Public Limited Company S 15
20-F/A (Amendment No. 2) 2002
Table of Contents
Since 2001, Group Managing Directors have been able to elect to defer up to one-third of their annual bonus into shares, in the case of Managing Directors of the Company, Shell Transport shares. The deferred bonus shares, together with shares equivalent to the value of dividends payable on the deferred bonus shares, are released three years after deferral. Provided the participants remain in Group employment for three years following the deferral, or reach normal retirement within the three-year period, they will also receive one additional share for every two shares accumulated.
The purposes of the deferred bonus plan are to reward performance over a single financial year, to align Group Managing Directors’ interests with shareholders’ interests during the deferment period and to encourage share ownership in the Company. There is accordingly no further performance test beyond that governing performance in the relevant bonus year.
Neither annual nor deferred bonuses are pensionable.
Long-term incentives
The objective of long-term incentive arrangements is to ensure that Group Managing Directors share the interests of shareholders by being rewarded for share price growth, the creation of shareholder value and the achievement of superior relative shareholder returns. The policy in relation to long-term incentives applies to each of the Group Managing Directors.
Long-term incentives are currently awarded in the form of stock options. Options are granted once a year under the Group Stock Option plan which applies to Group Managing Directors and senior staff.
Options granted before 2003 to Group Managing Directors may vest three years after grant and remain exercisable until ten years after grant. Of the options granted, 50% are subject to performance conditions and the proportion of such 50% which will either vest and become unconditional or lapse, will be determined for Group Managing Directors at the discretion of REMCO using the criteria below.
REMCO will only exercise its discretion in favour of vesting to the extent that it is satisfied that the performance of the Group over the three-year vesting period reflects the objective for long-term incentives. Accordingly, when making its decision, REMCO takes into account a combination of TSR over the three-year vesting period (measured by the average weighted share price performance plus dividends of Shell Transport and Royal Dutch over the ten-day period at the beginning and end of the vesting period) relative to a peer group of other major integrated oil companies and other long-term indicators of Group performance.
The latest tranche of stock options to vest was granted in March 2000 and the stock options vested in March 2003. The measurement period for the options was January 1, 2000 to December 31, 2002. The peer companies were BP, ChevronTexaco, ExxonMobil and Total. The Royal Dutch/ Shell Group of Companies ranked fourth. REMCO considered other performance indicators including profits over the three years and ROACE relative to the peer group.
Having considered all of these factors REMCO determined that 50% of the options granted in March 2000 that were subject to its discretion should vest.
Options granted in 2003, and in subsequent years, will be 100% performance linked. Performance will be measured over the three financial years prior to grant. The policy, which will continue in future years, is that the levels of grant will vary according to the ratings given by REMCO to the Group’s achievements against financial targets and will reflect competitive market practice. The current financial targets are TSR relative to the other major integrated oil companies and ROACE. These financial targets have been chosen as they are consistent with the objective for long-term incentives and represent a balanced test of the Group’s internal operating efficiency and external performance.
In addition, it is proposed to introduce a new Long-term Incentive Plan (the Plan). This proposal will be put to shareholders at the 2003 Annual General Meetings of Shell Transport and Royal Dutch.
Group Managing Directors and other selected senior executives will be eligible to participate in the Plan. Group Managing Directors will be selected for participation on the recommendation of REMCO. Participants will be made a conditional award of shares in either Shell Transport or Royal Dutch. The receipt of shares comprised in the award will be conditional on the participant remaining in employment (subject to certain exceptions, including normal retirement) and on the satisfaction of performance targets over the performance period. The performance period will not be less than three consecutive financial years. In the case of Group Managing Directors, REMCO will make recommendations on the number of shares which may be conditionally awarded in any year. Awards in any one year can range from zero to two times base salary, but the maximum number of shares will only be received for exceptional performance as described below.
If the adoption of the Plan is approved, the performance targets will be linked to TSR (the average weighted share price performance plus dividends of Shell Transport and Royal Dutch) relative to two separate groups of comparator companies, over a performance period of three financial years. Two separate comparator groups have been chosen because REMCO considers that it is appropriate to test performance both against major home markets and industry competitors. Relative TSR has been chosen as
S 16 The “ Shell ” Transport and Trading Company, Public Limited Company
20-F/A (Amendment No. 2) 2002
Table of Contents
the performance test that most closely aligns the interests of Group Managing Directors and senior executives with those of shareholders.
The first comparator group will consist of the largest twenty companies (by way of market capitalisation) in the FTSE 100 share index together with the ten largest companies (also by way of market capitalisation) in the AEX index, in each case, at the beginning of the relevant performance period. As at January 1, 2003, the first comparator group, in addition to Shell Transport and Royal Dutch, was FTSE: Anglo American, AstraZeneca, Aviva, Barclays, BG Group, BP, British American Tobacco, BT Group, Diageo, GlaxoSmithKline, HBOS, HSBC Holdings, Lloyds TSB Group, National Grid Transco, Rio Tinto, The Royal Bank of Scotland, Tesco, Unilever PLC and Vodafone Group and AEX: ABN AMRO, AEGON, Ahold, Akzo Nobel, Heineken, ING Group, KPN, Philips and Unilever N.V. In the case of Shell Transport and Royal Dutch, and Unilever PLC and Unilever N.V., the weighted average TSR of the two companies will be used.
The second comparator group will be the five major integrated oil companies, which, as at January 1, 2003, were BP, ChevronTexaco, ExxonMobil, the Royal Dutch/ Shell Group of Companies and Total.
Half of each conditional award will be tested against the first comparator group and half against the second comparator group. If shareholders approve the adoption of the Plan, the comparator groups described above will be used for the first performance period which will be from January 1, 2003 to December 31, 2005.
For the first comparator group, 100% of the shares tested against that group will be received for 75th percentile and above performance and 25% will be received for median performance with a straight-line calculation between these two points. No shares will be received for performance below the median. This method of calculation has been chosen because it is consistent both with shareholders’ expectations and market practice.
For the second comparator group, 100% of the shares tested against that group will be received if the Royal Dutch/ Shell Group of Companies is in first place, 75% for second place and 50% for third place. No shares will be received for fourth or fifth place.
All-employee Share Schemes
Group Managing Directors who are Directors of the Company are, in common with other UK employees, eligible to participate in the Shell Sharesave Scheme and the Shell All-employee Share Ownership Plan. However, they are not eligible to participate in the Global Employee Share Purchase Plan.
Pensions
For Shell Transport Managing Directors’ pensions the principal sources are the Shell Contributory Pension Fund (for service in the UK) and the Shell Overseas Contributory Pension Fund (for previous service overseas). Both Funds are defined benefit plans to which Managing Directors contribute 4% of relevant earnings. The latest date on which Managing Directors retire is June 30, following their 60th birthday, and the maximum pension is two-thirds of their final remuneration, excluding bonuses. There are also provisions, as for all members of the above Funds, for a dependant benefit of 60% of actual or prospective pension, and a lump sum death-in-service payment of three times annual salary. During 2002 two Managing Directors accrued retirement benefits under defined benefit plans (2001: three; 2000: three). No Managing Director has accrued benefits under a money purchase benefit scheme. Salaries/fees payable to Managing Directors, totalling £1,214,000 in 2002, £1,328,500 in 2001, £1,514,500 in 2000 count for pension purposes in the Shell Contributory Pension Fund.
The payment of employers’ contributions to the Shell Contributory Pension Fund, which is open to United Kingdom employees of the member companies, has upon actuarial advice been suspended since January 1, 1990. Managing Directors accrued pension benefits during the year are as detailed in the table on page S20. The transfer values are calculated using the cash equivalent transfer value method in accordance with Actuarial Guidance Note GN11.
Advisors
In reaching its decisions on Group Managing Directors’ remuneration, REMCO was materially assisted by advice from John Hofmeister (Group Human Resources Director) and Michael Reiff (Group Head of Remuneration and Benefits).
External data are collated by internal sources and used in the preparation of internal briefing papers that REMCO considers, in common with other factors, when making its decisions. Accordingly, there is no single external source that provides material advice or services, nor is there a formal external advisor appointed by REMCO. At its discretion, REMCO may seek external advice on its own account and, in the year under review, it received such advice from Towers Perrin, which also provided companies within the Group with advice on pensions, compensation, communication and HR management.
The “ Shell ” Transport and Trading Company, Public Limited Company S 17
20-F/A (Amendment No. 2) 2002
Table of Contents
Directors’ Contracts of Service
No Director has or, during the financial year had, a contract of service with Shell Transport. The Managing Directors of Shell Transport have employment contracts with one of the Group holding or service companies that provide entitlement to notice in line with the standard policy applicable to other senior staff in the United Kingdom – three months. Similarly, such contracts expire on the latest expected date of retirement which, in the case of the Managing Directors, is June 30 following their 60th birthday (as at December 2002, Sir Philip Watts was aged 57 and Paul Skinner 58). There are no predetermined termination compensation arrangements in place for Directors of Shell Transport and no payments on termination were made to retiring or past Directors during the year under review.
Sir Philip Watts’ and Paul Skinner’s current employment contracts are effective from July 1, 2002 and January 1, 2000 respectively.*
Non-executive Directors’ Fees
In accordance with the Articles of Association, the remuneration of Directors of the Company is determined by the Board within a limit set by shareholders. All Directors are entitled to an annual fee (currently £50,000) with additional fees for acting as Chairman of the Board or of a Joint Committee. An additional fee is payable to any Director who undertakes intercontinental travel to attend a meeting.
The fees for non-executive Directors are reviewed from time to time and were last adjusted from July 1, 2002 after approval at the 2002 Annual General Meeting of an increase in the maximum sum available. There are no current proposals to increase fees in 2003.
Performance graph
The following graph compares, on the basis required by the Directors’ Remuneration Report Regulations 2002, the TSR of Shell Transport and that of the companies comprising the FTSE 100 share index over the five-year period from 1998 to 2002. The Board regards the FTSE 100 share index as an appropriate broad market equity index for comparison as it is the leading market index in Shell Transport’s home market.
Five-year historical TSR Performance
| Growth in the value of a hypothetical £100 holding over five years FTSE 100 comparison based on 30 Trading Day Average values |
| * | On March 3, 2004, Sir Philip Watts stepped down as Chairman of the Board of Shell Transport and as Managing Director, by mutual consent. At that time Malcom Brinded stepped down from the Board of Management of Royal Dutch and was appointed a Director and Managing Director of Shell Transport and Lord Oxburgh was appointed interim non-excutive chairman of Shell Transport. |
S 18 The “ Shell ” Transport and Trading Company, Public Limited Company
20-F/A (Amendment No. 2) 2002
Table of Contents
Remuneration of the Directors
| Emoluments of Directors in office during 2002 | £ | |||||||||||
| 2002 | 2001 | 2000 | ||||||||||
Sir Philip Watts: | ||||||||||||
| Salaries and fees | 745,969 | 607,398 | 496,302 | |||||||||
Car benefita | 21,922 | 20,089 | 17,323 | |||||||||
| Other benefits | – | – | – | |||||||||
Performance-related elementb | 874,000 | c | 455,000c | 225,000 | ||||||||
Deferred bonus plan adjustmentd | 152,069 | 75,834 | – | |||||||||
| 1,793,960 | 1,158,321 | 738,625 | ||||||||||
| Realised share option gains | 8,238 | 508,167 | 134,400 | |||||||||
| 1,802,198 | 1,666,488 | 873,025 | ||||||||||
Paul Skinner: | ||||||||||||
| Salaries and fees | 553,830 | 504,703 | 458,802 | |||||||||
Car benefita | 13,181 | 14,924 | 14,965 | |||||||||
| Other benefits | – | – | 655 | |||||||||
Performance-related elementb | 632,500 | 338,000 | c | 213,750 | ||||||||
Deferred bonus plan adjustmentd | 4,756 | 56,334 | – | |||||||||
| 1,204,267 | 913,961 | 688,172 | ||||||||||
| Realised share option gains | 8,238 | 505,902 | 349,704 | |||||||||
| 1,212,505 | 1,419,863 | 1,037,876 | ||||||||||
Sir Mark Moody-Stuart:e | ||||||||||||
| Salaries and fees | – | 583,401 | 710,427 | |||||||||
| Directors’ fees | 39,375 | – | – | |||||||||
| Holding Company fees | 18,314 | – | – | |||||||||
Performance-related elementb | – | 232,050 | 321,300 | |||||||||
| 57,689 | 815,451 | 1,031,727 | ||||||||||
| Realised share option gains | – | 639,360 | 892,440 | |||||||||
| 57,689 | 1,454,811 | 1,924,167 | ||||||||||
Teymour Alireza:Directors’ fees | 45,375 | 28,750 | 28,750 | |||||||||
Sir Peter Burt:Directors’ fees | 21,795 | – | – | |||||||||
Dr Eileen Buttle:Directors’ fees | 39,375 | 31,875 | 30,625 | |||||||||
Luis Giusti:Directors’ fees | 45,375 | 26,875 | 7,500 | |||||||||
Nina Henderson:Directors’ fees | 45,375 | 17,516 | – | |||||||||
Sir Peter Job:Directors’ fees | 39,375 | 11,042 | – | |||||||||
Sir John Kerr:Directors’ fees | 21,795 | – | – | |||||||||
Professor Robert O’Neill:Directors’ fees | 10,910 | 30,000 | 30,000 | |||||||||
Lord Oxburgh:Directors’ fees | 42,800 | 32,475 | 36,850 | |||||||||
Sir William Purves:Directors’ fees | 11,612 | 34,333 | 34,333 | |||||||||
| a | Car benefit is the Inland Revenue defined cash equivalent of the cost of company provided vehicles. | |
| b | The performance-related element is included in the year to which it relates. |
| c | Of which one-third was deferred under the Deferred Bonus Plan. |
| d | These amounts are the increases accruing during the year in respect of entitlements under the Deferred Bonus Plan in respect of additional shares that will be granted (provided the participant remains in Group employment for three years following initial deferral or reaches normal retirement age within the three-year period). | |
| e | Sir Mark Moody-Stuart retired as Chairman and Managing Director on June 30, 2001. His remuneration in 2001 included a “full service bonus” of £198,000. A bonus under this arrangement is paid on retirement to all UK employees with qualifying service. |
The “ Shell ” Transport and Trading Company, Public Limited Company S 19
20-F/A (Amendment No. 2) 2002
Table of Contents
Pensions
| Sir Philip Watts | Paul Skinner | |||||||
Accrued pension | £ thousand per annum | |||||||
| Pension accrued at 31.12.02 | 479.69 | 404.86 | ||||||
| Increase in accrued pension over year | 83.92 | 66.16 | ||||||
| Increase in accrued pension over year (excluding inflation) | 72.30 | 56.20 | ||||||
Transfer values of accrued benefits | £ thousand | |||||||
| At 31.12.01 | 6,411.60 | 5,410.40 | ||||||
| At 31.12.02 | 7,913.00 | 6,586.50 | ||||||
| Increase over year less Director’s contributions | 1,476.80 | 1,176.10 | ||||||
| Increase over year (excluding inflation) less Director’s contributions | 1,167.60 | 914.20 | ||||||
| The transfer values have been calculated in accordance with Actuarial Guidance Note GN11. |
Share options
| Number of 25p Ordinary shares under option | ||||||||||||||||||||||||||
| Exercised | ||||||||||||||||||||||||||
| (cancelled/ | ||||||||||||||||||||||||||
| Granted | lapsed) | |||||||||||||||||||||||||
| At | during | during | At | Exercise | Exercisable | Exercisable | ||||||||||||||||||||
| 1.1.02 | the year | the year | 31.12.02 | price | from date | to date | ||||||||||||||||||||
| Sir Philip Watts | ||||||||||||||||||||||||||
| 272,000 | – | (272,000 | ) | – | 439p | 11.12.97 | 10.12.02 | |||||||||||||||||||
| 308,750 | – | – | 308,750 | 363p | 22.12.01 | 21.12.08 | ||||||||||||||||||||
| 341,000 | – | – | 341,000 | 505p | 23.03.03 | 22.03.10 | ||||||||||||||||||||
| 465,000 | – | – | 465,000 | 552p | 26.03.04 | 25.03.11 | ||||||||||||||||||||
| 5,214 | a | – | 5,214 | b | – | 330p | 01.02.02 | 31.07.02 | ||||||||||||||||||
| – | 3,251 | a | – | 3,251 | 509p | 01.02.07 | 31.07.07 | |||||||||||||||||||
| – | 885,000 | – | 885,000 | 523p | 21.03.05 | 20.03.12 | ||||||||||||||||||||
| Paul Skinner | ||||||||||||||||||||||||||
| 139,200 | – | – | 139,200 | 439p | 11.12.00 | 10.12.07 | ||||||||||||||||||||
| 194,700 | – | – | 194,700 | 363p | 22.12.01 | 21.12.08 | ||||||||||||||||||||
| 341,000 | – | – | 341,000 | 505p | 23.03.03 | 22.03.10 | ||||||||||||||||||||
| 465,000 | – | – | 465,000 | 552p | 26.03.04 | 25.03.11 | ||||||||||||||||||||
| 5,214 | a | – | 5,214 | b | – | 330p | 01.02.02 | 31.07.02 | ||||||||||||||||||
| – | 3,251 | a | – | 3,251 | 509p | 01.02.07 | 31.07.07 | |||||||||||||||||||
| – | 660,000 | – | 660,000 | 523p | 21.03.05 | 20.03.12 | ||||||||||||||||||||
| Sir Mark Moody-Stuart | ||||||||||||||||||||||||||
| 387,000 | – | (387,000 | ) | – | 439p | 11.12.97 | 10.12.02 | |||||||||||||||||||
| 440,800 | – | – | 440,800 | 363p | 22.12.01 | 30.06.06 | ||||||||||||||||||||
| 487,000 | – | – | 487,000 | 505p | 23.03.03 | 30.06.06 | ||||||||||||||||||||
| All the options listed above relate to Shell Transport Ordinary shares. All options are exercisable at market price (no discount) at grant. The options with an expiry up to and including 2002 were exercisable from grant except for the Shell Sharesave Scheme (see footnote a). The remaining options were granted for 10 years and are not exercisable within three years of grant; 50% of those options are subject to a performance condition with the exception of those granted prior to appointment as a Director of the Company. Upon vesting in 2003, of the performance-related options granted in 2000, 50% became unconditional. | ||
| The price range of the Ordinary shares during the year was 361p to 543p. | ||
| There were no other changes in the above interests in options during the period from December 31, 2002 to March 4, 2003. |
| a | These options are held under the Shell Sharesave Scheme of The Shell Petroleum Company Limited. | |
| b | The only options exercised in 2002: the market price at exercise was 488p. |
Signed on behalf of the Board
Jyoti Munsiff, Secretary
March 6, 2003
S 20 The “ Shell ” Transport and Trading Company, Public Limited Company
20-F/A (Amendment No. 2) 2002
Table of Contents
Group Share Plans
Set out below is a summary of the principal employee share schemes operated by Group companies*. The shares subject to the plans are existing issued shares of Royal Dutch or Shell Transport and no dilution of shareholders’ equity is involved. Shares to be delivered by a Group company under these plans are generally bought in the market at the time the commitment thereto is being made.
Group Stock Option Plans
Under these plans, eligible employees are granted options over shares of Royal Dutch or Shell Transport. The price at which the shares can be bought (the exercise price) will not be less than the fair market value of the shares at the date the options were granted. This is calculated as the average of the stock exchange opening and closing prices over the five business days ending on the date of grant, except for the USA where the grant price is the average of the stock exchange opening and closing prices on the date of grant.
Options are exercisable three years from grant. Options lapse ten years after grant or, if earlier, on resignation from Group employment (subject to certain exceptions). For Group Managing Directors and the most senior executives, a proportion of the options granted is subject to performance conditions.
For Group Managing Directors and the most senior executives 100% of options granted in 2003 and in subsequent years will be subject to performance conditions.
Restricted Stock Plan
Grants are made under this plan on a highly selective basis for recruitment and retention of senior staff. A maximum of 250,000 Royal Dutch shares (or equivalent value in Shell Transport shares) can be granted under the plan in any year. Shares are granted subject to a three-year restriction period. The shares, together with additional shares equivalent to the value of the dividends payable over the restriction period, are released to the individual at the end of the three-year period, provided that the individual has remained in employment. Group Managing Directors are not eligible to participate in the Restricted Stock Plan.
Global Employee Share Purchase Plan
This broad-based plan enables employees to make contributions, which are applied quarterly to purchase Royal Dutch or Shell Transport shares at current market value. If the acquired shares are retained in the Plan until the end of the twelve-month cycle the employee receives an additional 15% share match. In the USA a variant of this plan is operated where contributions are applied to buy Royal Dutch shares at the end of the twelve-month cycle. The purchase price is the lower of the market price on the first or last trading day of the cycle reduced by 15%. Group Managing Directors are not eligible to participate in the Global Employee Share Purchase Plan.
Shell Sharesave Scheme
In lieu of the Global Employee Share Purchase Plan employees in the UK continue to participate in the Shell Sharesave Scheme. Options are granted over shares of Shell Transport at prices not less than market value on a date not more than 30 days before grant and are normally exercisable after a three-year or five-year contractual savings period.
Shell All-employee Share Purchase Plan
Employees in the UK may now participate in the Shell All-employee Share Purchase Plan which is designed to encourage employee participation in their company. Employees invest amounts up to a maximum £125 per month in Shell Transport shares at the current market value using funds deducted from their monthly salary. The contributions are not liable to income tax, but to maintain the tax benefit, the shares must be held in the Plan for a defined period (normally five years).
| * | Details of the number of shares held by Group companies in connection with the above plans are shown in Note 22 of the Group Financial Statements on pages G30 to G32. |
The “ Shell ” Transport and Trading Company, Public Limited Company S 21
20-F/A (Amendment No. 2) 2002
Table of Contents
(This page intentionally left blank)
Table of Contents
Royal Dutch/ Shell Group of Companies
Report of Registered Independent Public Accountants
on the US GAAP Financial Statements
on the US GAAP Financial Statements
We have audited the Financial Statements appearing on pages G2 to G42 of the Royal Dutch/ Shell Group of Companies for the years 2002, 2001 and 2000. The preparation of Financial Statements is the responsibility of management. Our responsibility is to express an opinion on the Financial Statements based on our audits.
We conducted our audits in accordance with the standards of the Public Company Accounting Oversight Board (United States). Those standards require that we plan and perform the audit to obtain reasonable assurance about whether the Financial Statements are free of material misstatement. An audit includes examining, on a test basis, evidence supporting the amounts and disclosures in the Financial Statements. An audit also includes assessing the accounting principles used and significant estimates made by management in the preparation of the Financial Statements, as well as evaluating the overall Financial Statement presentation. We believe that our audits provide a reasonable basis for our opinion.
In our opinion, the Financial Statements referred to above present fairly, in all material respects, the financial position of the Royal Dutch/ Shell Group of Companies at December 31, 2002 and 2001 and the results of its operations and its cash flows for each of the three years in the period ended December 31, 2002 in accordance with generally accepted accounting principles in the United States.
As discussed in Note 2(a) on pages G5 to G8, the Group has restated its Financial Statements for the three years ended December 31, 2002 to correct for inappropriate departures from US GAAP.
As discussed in Note 2(a) on pages G5 to G8, the Group has restated its Financial Statements for the three years ended December 31, 2002 to change its method of accounting for certain inventories in North America from the last-in first-out method to the first-in first-out method.
As discussed in Note 2(b) on pages G8 to G10, the Group has restated its Financial Statements for the three years ended December 31, 2002 to correct for the impact of the Second Reserves Restatement.
/s/ KPMG Accountants N.V.
-----------------------------------------------------
KPMG Accountants N.V., The Hague - The Netherlands
Registered independent public accountants
/s/ PricewaterhouseCoopers LLP
PricewaterhouseCoopers LLP, London - United Kingdom
Registered independent public accountants
March 5, 2003, except for Note 2(a) (First Restatement of previously issued financial statements), which is as of May 22, 2004 and except for Note 2(b) (Second Restatement of previously issued financial statements) and Note 30 (Subsequent events) which are as of March 3, 2005.
Royal Dutch/Shell Group of Companies G 1
20-F/A (Amendment No. 2) 2002
Table of Contents
Financial Statements
| Statement of Income (as restated) | $ million | |||||||||||||||
| Note | 2002 | 2001 | 2000 | |||||||||||||
| Sales proceeds | 235,482 | 177,201 | 191,418 | |||||||||||||
| Sales taxes, excise duties and similar levies | 56,167 | 42,070 | 42,365 | |||||||||||||
Net proceeds | 179,315 | 135,131 | 149,053 | |||||||||||||
| Cost of sales | 150,829 | 108,245 | 118,275 | |||||||||||||
Gross profit | 28,486 | 26,886 | 30,778 | |||||||||||||
| Selling and distribution expenses | 9,954 | 7,898 | 7,896 | |||||||||||||
| Administrative expenses | 1,601 | 1,244 | 1,137 | |||||||||||||
| Exploration | 1,073 | 910 | 836 | |||||||||||||
| Research and development | 472 | 387 | 389 | |||||||||||||
| Operating profit of Group companies | 15,386 | 16,447 | 20,520 | |||||||||||||
| Share of operating profit of associated companies | 6 | 2,816 | 2,644 | 4,099 | ||||||||||||
Operating profit | 18,202 | 19,091 | 24,619 | |||||||||||||
| Interest and other income | 7 | 758 | 1,059 | 974 | ||||||||||||
| Interest expense | 8 | 1,364 | 1,133 | 1,324 | ||||||||||||
| Currency exchange gains/(losses) | (23 | ) | (30 | ) | (114 | ) | ||||||||||
Income before taxation | 17,573 | 18,987 | 24,155 | |||||||||||||
| Taxation | 9 | 7,742 | 8,360 | 11,295 | ||||||||||||
| Income after taxation | 9,831 | 10,627 | 12,860 | |||||||||||||
| Income applicable to minority interests | 175 | 326 | 47 | |||||||||||||
Net income | 9,656 | 10,301 | 12,813 | |||||||||||||
| Statement of Comprehensive Income and Parent Companies’ Interest in Group Net Assets (as restated) | $ million | ||||||||||||||||
| Note | 2002 | 2001 | 2000 | ||||||||||||||
Net income | 29 | 9,656 | 10,301 | 12,813 | |||||||||||||
| Other comprehensive income, net of tax: | 5 | ||||||||||||||||
| currency translation differences | 19 | 2,432 | (1,686 | ) | (2,711 | ) | |||||||||||
| unrealised gains/(losses) on securities | 25 | (143 | ) | (238 | ) | ||||||||||||
| unrealised gains/(losses) on cash flow hedges | (225 | ) | (14 | ) | |||||||||||||
| minimum pension liability adjustments | (1,475 | ) | (127 | ) | (70 | ) | |||||||||||
Comprehensive income | 10,413 | 8,331 | 9,794 | ||||||||||||||
| Distributions to Parent Companies | 29 | (5,435 | ) | (9,163 | ) | (8,579 | ) | ||||||||||
| Increase in Parent Companies’ shares held, net of dividends received | 22 | (844 | ) | (642 | ) | (200 | ) | ||||||||||
| Parent Companies’ interest in Group net assets at January 1 | 56,142 | 57,616 | 56,601 | ||||||||||||||
Parent Companies’ interest in Group net assets at December 31 | 3,4,29 | 60,276 | 56,142 | 57,616 | |||||||||||||
The Notes on pages G5 to G42 are an integral part of these statements.
G 2 Royal Dutch/ Shell Group of Companies
20-F/A (Amendment No. 2) 2002
Table of Contents
| Statement of Assets and Liabilities (as restated) | $ million | |||||||||||||
| Dec 31 | Dec 31 | |||||||||||||
| Note | 2002 | 2001 | ||||||||||||
Fixed assets | ||||||||||||||
| Tangible assets | 10 | 78,363 | 50,721 | |||||||||||
| Intangible assets | 10 | 4,696 | 939 | |||||||||||
| Investments: | ||||||||||||||
| associated companies | 6 | 17,945 | 18,331 | |||||||||||
| securities | 14 | 1,719 | 1,914 | |||||||||||
| other | 1,420 | 1,108 | ||||||||||||
Total fixed assets | 104,143 | 73,013 | ||||||||||||
Other long-term assets | 11 | 7,333 | 7,716 | |||||||||||
Current assets | ||||||||||||||
| Inventories | 12 | 11,338 | 6,580 | |||||||||||
| Accounts receivable | 13 | 28,761 | 17,467 | |||||||||||
| Cash and cash equivalents | 14 | 1,556 | 6,670 | |||||||||||
Total current assets | 41,655 | 30,717 | ||||||||||||
Current liabilities:amounts due within one year | ||||||||||||||
| Short-term debt | 15 | 12,874 | 3,988 | |||||||||||
| Accounts payable and accrued liabilities | 17 | 32,189 | 18,884 | |||||||||||
| Taxes payable | 9 | 4,985 | 4,494 | |||||||||||
| Dividends payable to Parent Companies | 5,153 | 6,101 | ||||||||||||
Total current liabilities | 55,201 | 33,467 | ||||||||||||
Net current assets/(liabilities) | (13,546 | ) | (2,750 | ) | ||||||||||
Total assets less current liabilities | 97,930 | 77,979 | ||||||||||||
Long-term liabilities:amounts due after more than one year | ||||||||||||||
| Long-term debt | 15 | 6,817 | 1,832 | |||||||||||
| Other | 18 | 6,174 | 4,515 | |||||||||||
| 12,991 | 6,347 | |||||||||||||
Provisions | ||||||||||||||
| Deferred taxation | 9 | 12,551 | 7,078 | |||||||||||
| Pensions and similar obligations | 20 | 5,016 | 2,331 | |||||||||||
| Decommissioning and restoration costs | 23 | 3,528 | 2,615 | |||||||||||
| 21,095 | 12,024 | |||||||||||||
Group net assets before minority interests | 63,844 | 59,608 | ||||||||||||
| Minority interests | 3,568 | 3,466 | ||||||||||||
Net assets | 60,276 | 56,142 | ||||||||||||
The Notes on pages G5 to G42 are an integral part of these statements.
Royal Dutch/Shell Group of Companies G 3
20-F/A (Amendment No. 2) 2002
Table of Contents
| Statement of Cash Flows (as restated)(see Note 19) | $ million | ||||||||||||||||||
| Note | 2002 | 2001 | 2000 | ||||||||||||||||
Cash flow provided by operating activities | |||||||||||||||||||
| Net income | 9,656 | 10,301 | 12,813 | ||||||||||||||||
| Adjustments to reconcile net income to cash flow provided by operating activities | |||||||||||||||||||
| Depreciation, depletion and amortisation | 10 | 8,739 | 6,295 | 8,130 | |||||||||||||||
| Profit on sale of assets | (367 | ) | (133 | ) | (1,026 | ) | |||||||||||||
| Movements in: | |||||||||||||||||||
| inventories | (2,079 | ) | 1,375 | (1,473 | ) | ||||||||||||||
| accounts receivable | (5,830 | ) | 8,518 | (10,007 | ) | ||||||||||||||
| accounts payable and accrued liabilities | 6,989 | (7,785 | ) | 9,746 | |||||||||||||||
| taxes payable | (735 | ) | (1,443 | ) | 967 | ||||||||||||||
| Associated companies: dividends more/ (less) than net income | 6 | 117 | 666 | (373 | ) | ||||||||||||||
| Deferred taxation and other provisions | 423 | (207 | ) | 516 | |||||||||||||||
| Long-term liabilities and other | (805 | ) | (1,008 | ) | (1,062 | ) | |||||||||||||
| Income applicable to minority interests | 175 | 326 | 47 | ||||||||||||||||
Cash flow provided by operating activities | 16,283 | 16,905 | 18,278 | ||||||||||||||||
Cash flow used in investing activities | |||||||||||||||||||
| Capital expenditure (including capitalised leases) | 10 | (12,102 | ) | (9,598 | ) | (6,128 | ) | ||||||||||||
| Acquisitions (Enterprise Oil, Pennzoil-Quaker State and additional shares in Equilon) | 10 | (8,925 | ) | ||||||||||||||||
| Proceeds from sale of assets | 1,099 | 1,265 | 3,852 | ||||||||||||||||
| New investments in associated companies | 6 | (1,289 | ) | (1,074 | ) | (1,161 | ) | ||||||||||||
| Disposals of investments in associated companies | 501 | 507 | 2,283 | ||||||||||||||||
| Proceeds from sale and other movement in investments | 83 | (180 | ) | (336 | ) | ||||||||||||||
Cash flow used in investing activities | (20,633 | ) | (9,080 | ) | (1,490 | ) | |||||||||||||
Cash flow used in financing activities | |||||||||||||||||||
| Long-term debt (including short-term part) | |||||||||||||||||||
| new borrowings | 5,267 | 180 | 945 | ||||||||||||||||
| repayments | (5,610 | ) | (1,115 | ) | (1,276 | ) | |||||||||||||
| (343 | ) | (935 | ) | (331 | ) | ||||||||||||||
| Net increase/(decrease) in short-term debt | 7,058 | (794 | ) | (3,271 | ) | ||||||||||||||
| Change in minority interests | 421 | (206 | ) | (22 | ) | ||||||||||||||
| Dividends paid to: | |||||||||||||||||||
| Parent Companies | (6,961 | ) | (9,406 | ) | (5,239 | ) | |||||||||||||
| minority interests | (228 | ) | (221 | ) | (262 | ) | |||||||||||||
Cash flow used in financing activities | (53 | ) | (11,562 | ) | (9,125 | ) | |||||||||||||
Parent Companies’ shares: net sales/(purchases) and dividends received | (864 | ) | (773 | ) | (200 | ) | |||||||||||||
| Currency translation differences relating to cash and cash equivalents | 153 | (251 | ) | (75 | ) | ||||||||||||||
Increase/(decrease) in cash and cash equivalents | (5,114 | ) | (4,761 | ) | 7,388 | ||||||||||||||
| Cash and cash equivalents at January 1 | 6,670 | 11,431 | 4,043 | ||||||||||||||||
| Cash and cash equivalents at December 31 | 1,556 | 6,670 | 11,431 | ||||||||||||||||
The Notes on pages G5 to G42 are an integral part of these statements.
G 4 Royal Dutch/ Shell Group of Companies
20-F/A (Amendment No. 2) 2002
Table of Contents
Notes to the US GAAP Financial Statements
1 The Royal Dutch/ Shell Group of Companies
The Parent Companies, Royal Dutch Petroleum Company (Royal Dutch) and The “Shell” Transport and Trading Company, p.l.c. (Shell Transport) are holding companies which together own, directly or indirectly, investments in numerous companies known collectively as the Royal Dutch/Shell Group. Group companies are engaged in all principal aspects of the oil and natural gas industry. They also have interests in chemicals and additional interests in power generation, renewable energy (chiefly in wind and solar energy) and other businesses. The Group conducts its business through five principal segments, Exploration and Production, Gas & Power, Oil Products, Chemicals and Other businesses. These activities are conducted in more than 145 countries and territories and are subject to changing economic, regulatory and political conditions.
Arrangements between Royal Dutch and Shell Transport provide,inter alia, that notwithstanding variations in shareholdings, Royal Dutch and Shell Transport shall share in the aggregate net assets and in the aggregate dividends and interest received from Group companies in the proportion of 60:40. It is further arranged that the burden of all taxes in the nature of, or corresponding to, an income tax leviable in respect of such dividends and interest shall fall in the same proportion. Dividends are paid by Group companies to Royal Dutch and Shell Transport in euros and pounds sterling, respectively.
2(a) First Restatement of previously issued financial statements
First Reserves Restatement
On January 9, 2004, the Group announced the removal from proved reserves of approximately 3.9 billion barrels of oil equivalent (boe) of oil and gas that were originally reported as of December 31, 2002. As a result of further field level reviews concluded in April 2004 with the assistance of external petroleum consultants of over 90% of the Group’s proved reserves volumes (collectively, the First Half Review), the Group determined to increase the total volume of reserves to be removed from the proved category to 4.47 billion boe and to restate the unaudited oil and gas reserves disclosures contained in the supplementary information accompanying the Financial Statements (the First Reserves Restatement) to give effect to the removal of these volumes as of the earliest date on which they did not represent “proved reserves” within the applicable rules of the SEC (which in many cases is the date on which the volumes were initially booked as proved reserves). 12% of the volumes debooked had been in the proved developed reserves category and 88% had been categorised as proved undeveloped reserves.
Please refer to “Supplementary information – Oil and Gas (unaudited)” on pages G54 to G69 for additional information regarding the First Reserves Restatement.
Following the January 9, 2004 announcement of the initial reserves recategorisation, the Group Audit Committee (GAC) appointed Davis Polk & Wardwell to lead an independent review of the facts and circumstances surrounding the recategorisation, and to report its findings and any proposed remedial actions to the GAC for its consideration. Based largely on the Davis Polk & Wardwell report, the Parent Companies, Royal Dutch and Shell Transport, have determined that the principal causes that permitted the initial booking and maintenance of the volumes impacted by the First Reserves Restatement as proved reserves are as follows:
| • | the Group’s guidelines for booking proved reserves were inadequate in several respects, including (i) containing inconsistencies with the SEC’s rules and published guidance relating to proved reserves and (ii) failing to clearly and sufficiently impart these requirements and guidance to users of the guidelines. In addition, users of the guidelines in certain cases misapplied or disregarded SEC rules and published guidance and in some cases only applied changes in the guidelines prospectively rather than retrospectively. There was also insufficient knowledge and training among users of the guidelines of the SEC requirements relating to proved reserves; | |
| • | executives and employees encouraged the booking of proved reserves, while discouraging the debooking of previously booked reserves. This fostered an atmosphere that failed to emphasise the paramount importance of the compliance element of proved reserves decisions; and | |
| • | there were other material weaknesses in the Group’s controls relating to the booking of proved reserves, including insufficient resources allocated to the Group Reserves Auditor and Group Reserves Co-ordinator functions, a lack of clarity in the allocation of responsibilities between the Group Reserves Auditor and the Group Reserves Co-ordinator and a lack of direct reporting responsibility of the Group Reserves Auditor to the Group internal audit function and of the business chief financial officers to the Group Chief Financial Officer. |
Royal Dutch/Shell Group of Companies G 5
20-F/A (Amendment No. 2) 2002
Table of Contents
First Financial Restatement relating to prior year financial statements
Reserves related adjustments
In view of the inappropriate overstatement of unaudited proved reserves information resulting in the First Reserves Restatement, it was determined to restate the Financial Statements of the Group, and each of the Parent Companies, for the year ended December 31, 2002 and prior periods (the First Financial Restatement) to reflect the impact of the First Reserves Restatement on those Financial Statements (as announced on April 19, 2004). This overstatement of unaudited proved reserves information had the effect of understating the depreciation, depletion and amortisation charges related to Exploration and Production in each of the years covered by the First Financial Restatement. The majority of the impact on the Financial Statements relates to proved developed reserves that were debooked, with the remaining amount relating to well cost write-offs. As capitalised costs relating to the Group’s Exploration and Production operations were amortised across fewer proved reserves (following the First Reserves Restatement), depreciation, depletion and amortisation associated with annual production volumes increased proportionally. The effect of the First Financial Restatement was to reduce net income in 2002 by $108 million (2001: $42 million; 2000: $80 million), of which additional depreciation in 2002 was $166 million (2001: $84 million; 2000: $132 million), and to reduce the previously reported net assets as at December 31, 2002 by $276 million (2001: $164 million).
Treatment of exploration costs
As part of the First Financial Restatement, the treatment of exploration costs has been changed, with restatement of prior period information, to correct an inappropriate departure from US GAAP relating to certain exploratory drilling costs in an area requiring major capital expenditure before production can begin and where commercially producible quantities of reserves have been found. Previously these costs remained capitalised for longer than 12 months following the completion of exploratory drilling provided that the project was being actively progressed towards the development phase. The costs of drilling such exploration wells are now expensed unless either (a) drilling of additional exploratory wells is under way or firmly planned for the near future or (b) proved reserves are booked within 12 months following the completion of exploratory drilling. The effect of this change is a reduction in previously reported net income for 2002 of $61 million (2001: $14 million; 2000: $42 million), and a reduction in previously reported net assets at December 31, 2002 of $155 million (2001: $91 million; 2000: $78 million).
Treatment of certain gas contracts
As part of the First Financial Restatement, the treatment of certain gas contracts has been changed, with restatement of prior period information, to correct an inappropriate departure from US GAAP relating to the failure to mark to market in 2002 certain contracts for the sale and delivery of own natural gas production from the UK North Sea. The effect of this change is a reduction in previously reported net income for 2002 and net assets at December 31, 2002 of $39 million.
Change in accounting policy for inventories
The First Financial Restatement also gives effect to the Group’s election to make a change in accounting principle in 2003 relating to inventories. Previously, the cost of certain North American inventories had been determined on the last-in first-out (LIFO) method. As a result of this change in accounting principle, the cost of these inventories will be determined on the first-in first-out (FIFO) method. This change from the LIFO method for these North American inventories to the FIFO method is being made to achieve a consistent method of determining inventory cost across the Group and harmonises the US GAAP inventory costing method with the method employed by the Group under Netherlands GAAP. Additionally, the Group will be adopting International Financial Reporting Standards (IFRS) in 2005. Under IFRS, LIFO is not a permitted method for valuing inventory. The effect of this change in accounting principle is an increase in previously reported net income for 2002 of $511 million (2001: decrease of $446 million; 2000: increase of $269 million; prior to 2000: increase of $514 million in net income and $825 million pre-tax), and to increase previously reported net assets as at December 31, 2002 by $850 million (2001: $339 million; 2000: $783 million). The impact on investments at December 31, 2002 relates to Motiva (2001: Equilon and Motiva).
G 6 Royal Dutch/ Shell Group of Companies
20-F/A (Amendment No. 2) 2002
Table of Contents
The impact of the First Reserves Restatement on the information included in these Financial Statements is summarised in the tables below:
| Statement of Income | $ million | |||||||||||||||||||||||||||||||||||||||||||||||||||||||||||||||||||||||||||
| 2002 | 2001 | 2000 | ||||||||||||||||||||||||||||||||||||||||||||||||||||||||||||||||||||||||||
| Restated | Restated | Restated | ||||||||||||||||||||||||||||||||||||||||||||||||||||||||||||||||||||||||||
| As | First | prior to | As | First | prior to | As | First | prior to | ||||||||||||||||||||||||||||||||||||||||||||||||||||||||||||||||||||
| originally | Reserves | Exploration | Gas | Inventory | As | originally | Reserves | Exploration | Inventory | As | originally | Reserves | Exploration | Inventory | As | |||||||||||||||||||||||||||||||||||||||||||||||||||||||||||||
| reported | Restatement | costs | contracts | Adjustment | Inventories | restated | reported | Restatement | costs | Adjustment | Inventories | restated | reported | Restatement | costs | Adjustment | Inventories | restated | ||||||||||||||||||||||||||||||||||||||||||||||||||||||||||
| Net proceeds | 179,431 | (52 | ) | – | (64 | ) | 179,315 | – | 179,315 | 135,211 | (80 | ) | – | 135,131 | – | 135,131 | 149,146 | (93 | ) | – | 149,053 | – | 149,053 | |||||||||||||||||||||||||||||||||||||||||||||||||||||
| Cost of sales | 151,214 | 114 | – | – | 151,328 | (617 | ) | 150,711 | 107,839 | 4 | – | 107,843 | 308 | 108,151 | 118,328 | 39 | – | 118,367 | (204 | ) | 118,163 | |||||||||||||||||||||||||||||||||||||||||||||||||||||||
| Exploration | 991 | – | 82 | – | 1,073 | – | 1,073 | 882 | 7 | 21 | 910 | – | 910 | 755 | 7 | 74 | 836 | – | 836 | |||||||||||||||||||||||||||||||||||||||||||||||||||||||||
| Other operating expenses | 12,027 | – | – | – | 12,027 | – | 12,027 | 9,529 | – | – | 9,529 | – | 9,529 | 9,422 | – | – | 9,422 | – | 9,422 | |||||||||||||||||||||||||||||||||||||||||||||||||||||||||
| Share of operating profit of associated companies | 2,624 | – | – | – | 2,624 | 198 | 2,822 | 3,041 | 18 | – | 3,059 | (413 | ) | 2,646 | 3,859 | – | – | 3,859 | 242 | 4,101 | ||||||||||||||||||||||||||||||||||||||||||||||||||||||||
Operating profit | 17,823 | (166 | ) | (82 | ) | (64 | ) | 17,511 | 815 | 18,326 | 20,002 | (73 | ) | (21 | ) | 19,908 | (721 | ) | 19,187 | 24,500 | (139 | ) | (74 | ) | 24,287 | 446 | 24,733 | |||||||||||||||||||||||||||||||||||||||||||||||||
| Net interest expense and currency exchange gains/losses | 629 | – | – | – | 629 | – | 629 | 104 | – | – | 104 | – | 104 | 464 | – | – | 464 | – | 464 | |||||||||||||||||||||||||||||||||||||||||||||||||||||||||
Income before taxation | 17,194 | (166 | ) | (82 | ) | (64 | ) | 16,882 | 815 | 17,697 | 19,898 | (73 | ) | (21 | ) | 19,804 | (721 | ) | 19,083 | 24,036 | (139 | ) | (74 | ) | 23,823 | 446 | 24,269 | |||||||||||||||||||||||||||||||||||||||||||||||||
| Taxation | 7,617 | (65 | ) | (21 | ) | (25 | ) | 7,506 | 290 | 7,796 | 8,694 | (27 | ) | (7 | ) | 8,660 | (256 | ) | 8,404 | 11,273 | (53 | ) | (32 | ) | 11,188 | 161 | 11,349 | |||||||||||||||||||||||||||||||||||||||||||||||||
| Minority interests | 158 | 7 | – | – | 165 | 14 | 179 | 352 | (4 | ) | – | 348 | (19 | ) | 329 | 44 | (6 | ) | – | 38 | 16 | 54 | ||||||||||||||||||||||||||||||||||||||||||||||||||||||
Net income | 9,419 | (108 | ) | (61 | ) | (39 | ) | 9,211 | 511 | 9,722 | 10,852 | (42 | ) | (14 | ) | 10,796 | (446 | ) | 10,350 | 12,719 | (80 | ) | (42 | ) | 12,597 | 269 | 12,866 | |||||||||||||||||||||||||||||||||||||||||||||||||
| Earnings by Industry Segment | $ million | |||||||||||||||||||||||||||||||||||||||||||||||||||||||||||||||||||||||||||
| 2002 | 2001 | 2000 | ||||||||||||||||||||||||||||||||||||||||||||||||||||||||||||||||||||||||||
| Restated | Restated | Restated | ||||||||||||||||||||||||||||||||||||||||||||||||||||||||||||||||||||||||||
| As | First | prior to | As | First | prior to | As | First | prior to | ||||||||||||||||||||||||||||||||||||||||||||||||||||||||||||||||||||
| originally | Reserves | Exploration | Gas | Inventory | As | originally | Reserves | Exploration | Inventory | As | originally | Reserves | Exploration | Inventory | As | |||||||||||||||||||||||||||||||||||||||||||||||||||||||||||||
| reported | Restatement | costs | contracts | Adjustment | Inventories | restated | reported | Restatement | costs | Adjustment | Inventories | restated | reported | Restatement | costs | Adjustment | Inventories | restated | ||||||||||||||||||||||||||||||||||||||||||||||||||||||||||
| Exploration and Production | 6,997 | (101 | ) | (61 | ) | (39 | ) | 6,796 | – | 6,796 | 8,023 | (46 | ) | (14 | ) | 7,963 | – | 7,963 | 10,059 | (86 | ) | (42 | ) | 9,931 | – | 9,931 | ||||||||||||||||||||||||||||||||||||||||||||||||||
| Gas & Power | 774 | – | – | – | 774 | – | 774 | 1,226 | – | – | 1,226 | – | 1,226 | 112 | – | – | 112 | – | 112 | |||||||||||||||||||||||||||||||||||||||||||||||||||||||||
| Oil Products | 2,178 | – | – | – | 2,178 | 449 | 2,627 | 2,332 | – | – | 2,332 | (362 | ) | 1,970 | 2,437 | – | – | 2,437 | 244 | 2,681 | ||||||||||||||||||||||||||||||||||||||||||||||||||||||||
| Chemicals | 489 | – | – | – | 489 | 76 | 565 | 230 | – | – | 230 | (103 | ) | 127 | 992 | – | – | 992 | 41 | 1,033 | ||||||||||||||||||||||||||||||||||||||||||||||||||||||||
| Corporate and Other | (861 | ) | – | – | – | (861 | ) | – | (861 | ) | (607 | ) | – | – | (607 | ) | – | (607 | ) | (837 | ) | – | – | (837 | ) | – | (837 | ) | ||||||||||||||||||||||||||||||||||||||||||||||||
| Minority interests | (158 | ) | (7 | ) | – | – | (165 | ) | (14 | ) | (179 | ) | (352 | ) | 4 | – | (348 | ) | 19 | (329 | ) | (44 | ) | 6 | – | (38 | ) | (16 | ) | (54 | ) | |||||||||||||||||||||||||||||||||||||||||||||
Net income | 9,419 | (108 | ) | (61 | ) | (39 | ) | 9,211 | 511 | 9,722 | 10,852 | (42 | ) | (14 | ) | 10,796 | (446 | ) | 10,350 | 12,719 | (80 | ) | (42 | ) | 12,597 | 269 | 12,866 | |||||||||||||||||||||||||||||||||||||||||||||||||
| Statement of Assets and Liabilities | $ million | ||||||||||||||||||||||||||||||||||||||||||||||||||||
| December 31, 2002 | December 31, 2001 | ||||||||||||||||||||||||||||||||||||||||||||||||||||
| Restated | Restated | ||||||||||||||||||||||||||||||||||||||||||||||||||||
| As | First | prior to | As | First | prior to | ||||||||||||||||||||||||||||||||||||||||||||||||
| originally | Reserves | Exploration | Gas | Inventory | As | originally | Reserves | Exploration | Inventory | As | |||||||||||||||||||||||||||||||||||||||||||
| reported | Restatement | costs | contracts | Adjustment | Inventories | restated | reported | Restatement | costs | Adjustment | Inventories | restated | |||||||||||||||||||||||||||||||||||||||||
| Fixed assets | |||||||||||||||||||||||||||||||||||||||||||||||||||||
| Tangible | 79,390 | (467 | ) | (236 | ) | – | 78,687 | – | 78,687 | 51,370 | (293 | ) | (150 | ) | 50,927 | – | 50,927 | ||||||||||||||||||||||||||||||||||||
| Intangible | 4,696 | – | – | – | 4,696 | – | 4,696 | 939 | – | – | 939 | – | 939 | ||||||||||||||||||||||||||||||||||||||||
| Investments | 20,760 | 2 | – | – | 20,762 | 325 | 21,087 | 21,040 | 2 | – | 21,042 | 312 | 21,354 | ||||||||||||||||||||||||||||||||||||||||
| Other long-term assets | 7,299 | – | – | 34 | 7,333 | – | 7,333 | 7,716 | – | – | 7,716 | – | 7,716 | ||||||||||||||||||||||||||||||||||||||||
| Inventories | 10,298 | – | – | – | 10,298 | 1,040 | 11,338 | 6,341 | – | – | 6,341 | 239 | 6,580 | ||||||||||||||||||||||||||||||||||||||||
| Other current assets | 30,248 | – | – | 69 | 30,317 | – | 30,317 | 24,137 | – | – | 24,137 | – | 24,137 | ||||||||||||||||||||||||||||||||||||||||
| Current liabilities | 55,115 | – | – | 86 | 55,201 | – | 55,201 | 33,467 | – | – | 33,467 | – | 33,467 | ||||||||||||||||||||||||||||||||||||||||
| Long-term liabilities | 12,935 | – | – | 56 | 12,991 | – | 12,991 | 6,347 | – | – | 6,347 | – | 6,347 | ||||||||||||||||||||||||||||||||||||||||
| Provisions | |||||||||||||||||||||||||||||||||||||||||||||||||||||
| Deferred taxation | 12,471 | (186 | ) | (81 | ) | – | 12,204 | 492 | 12,696 | 7,146 | (117 | ) | (59 | ) | 6,970 | 203 | 7,173 | ||||||||||||||||||||||||||||||||||||
| Pensions and decommissioning | 8,544 | – | – | – | 8,544 | – | 8,544 | 4,946 | – | – | 4,946 | – | 4,946 | ||||||||||||||||||||||||||||||||||||||||
| Minority interests | 3,562 | (3 | ) | – | – | 3,559 | 23 | 3,582 | 3,477 | (10 | ) | – | 3,467 | 9 | 3,476 | ||||||||||||||||||||||||||||||||||||||
Net assets | 60,064 | (276 | ) | (155 | ) | (39 | ) | 59,594 | 850 | 60,444 | 56,160 | (164 | ) | (91 | ) | 55,905 | 339 | 56,244 | |||||||||||||||||||||||||||||||||||
Royal Dutch/Shell Group of Companies G 7
20-F/A (Amendment No. 2) 2002
Table of Contents
| Parent Companies’ interest in Group net assets | $ million | |||||||||||||
| 2002 | 2001 | 2000 | ||||||||||||
| At December 31 as originally reported | 60,064 | 56,160 | 57,086 | |||||||||||
| Effect of the adjustments: | ||||||||||||||
| Interest at the beginning of the year | ||||||||||||||
| Cumulative effect of First Reserves Restatement | (164 | ) | (122 | ) | (46 | )a | ||||||||
| Cumulative effect of exploration costs change | (91 | ) | (78 | ) | (37 | )a | ||||||||
| Total before inventory adjustment | 59,809 | 55,960 | 57,003 | |||||||||||
| Cumulative effect of change in policy for inventories | 339 | 783 | 513 | a | ||||||||||
| 60,148 | 56,743 | 57,516 | ||||||||||||
| Net income for the year | ||||||||||||||
| First Reserves Restatement | (108 | ) | (42 | ) | (80 | ) | ||||||||
| Exploration costs change | (61 | ) | (14 | ) | (42 | ) | ||||||||
| Gas contracts change | (39 | ) | – | – | ||||||||||
| Total before inventory adjustment | 59,940 | 56,687 | 57,394 | |||||||||||
| Change in policy for inventories | 511 | (446 | ) | 269 | ||||||||||
| 60,451 | 56,241 | 57,663 | ||||||||||||
| Currency translation differences for the year | (7 | ) | 3 | 6 | ||||||||||
At December 31 as restated | 60,444 | 56,244 | 57,669 | |||||||||||
| a | Cumulative effect as at January 1, 2000. |
Amounts relating to prior periods have been restated in the following notes where applicable.
2(b) Second Restatement of previously issued financial statements
Second Reserves Restatement
On February 3, 2005, as a result of reservoir level reviews conducted during July 2004 through December 2004 of substantially all of the Group’s proved reserves volumes reported as at December 31, 2003, (collectively, the Second Half Review), the Group announced that it would remove from proved reserves an additional 1.37 billion boe of oil and gas that were reported as at December 31, 2003 and further restate the unaudited oil and gas reserves disclosures contained in the supplementary information accompanying the Financial Statements (the Second Reserves Restatement and together with the First Reserves Restatement, the Reserves Restatement), to give effect to the removal of these volumes as of the earliest date on which they did not represent “proved reserves” within the applicable rules of the SEC (which in many cases is the date on which the volumes were initially booked as proved reserves). 43% of the volumes de-booked had been categorised as proved developed reserves and 57% had been categorised as proved undeveloped reserves.
Please refer to “Supplementary information – Oil and Gas (unaudited)” on pages G54 to G69 for additional information regarding the Second Reserves Restatement.
The Second Half Review reflected the implementation of certain remedial actions undertaken following the First Half Review and the First Reserves Restatement and in light of the report of Davis Polk & Wardwell to the GAC. See “Supplementary information — Oil and Gas (unaudited)” on pages G54 to G69.
Second Financial Restatement
Reserves related adjustments
In view of the inappropriate overstatement of unaudited proved reserves information resulting in the Second Reserves Restatement, it was determined to restate the Financial Statements of the Group and each of the Parent Companies for the year ended December 31, 2003 and prior periods (the Second Financial Restatement) to reflect the impact of the Second Reserves Restatement on those Financial Statements (as announced on February 3, 2005). This overstatement of unaudited proved reserves information had the effect of understating the depreciation, depletion and amortisation charges related to Exploration and Production in each of the years covered by the Second Financial Restatement. As capitalised costs relating to Exploration and Production were amortised across fewer proved reserves (following the Second Reserves Restatement), depreciation, depletion and amortisation associated with annual production volumes increased proportionally. The effect of the Second Financial Restatement was to reduce net income in 2002 by $66 million (2001: $49 million; 2000: $53 million), of which additional depreciation in 2002 was $118 million (2001: $94 million; 2000: $112 million), and to reduce the previously reported net assets as at December 31, 2002 by $168 million (2001: $102 million).
G 8 Royal Dutch/ Shell Group of Companies
20-F/A (Amendment No. 2) 2002
Table of Contents
The impact of the Second Reserves Restatement on the information included in these Financial Statements is summarised in the tables below:
| Statement of Income | $ million | |||||||||||||||||||||||||||||||||||
| 2002 | 2001 | 2000 | ||||||||||||||||||||||||||||||||||
| Second | Second | Second | ||||||||||||||||||||||||||||||||||
| As previously | Reserves | As previously | Reserves | As previously | Reserves | |||||||||||||||||||||||||||||||
| restated | Restatement | As restated | restated | Restatement | As restated | restated | Restatement | As restated | ||||||||||||||||||||||||||||
| Net proceeds | 179,315 | – | 179,315 | 135,131 | – | 135,131 | 149,053 | – | 149,053 | |||||||||||||||||||||||||||
| Cost of sales | 150,711 | 118 | 150,829 | 108,151 | 94 | 108,245 | 118,163 | 112 | 118,275 | |||||||||||||||||||||||||||
| Exploration | 1,073 | – | 1,073 | 910 | – | 910 | 836 | – | 836 | |||||||||||||||||||||||||||
| Other operating expenses | 12,027 | – | 12,027 | 9,529 | – | 9,529 | 9,422 | – | 9,422 | |||||||||||||||||||||||||||
| Share of operating profit of associated companies | 2,822 | (6 | ) | 2,816 | 2,646 | (2 | ) | 2,644 | 4,101 | (2 | ) | 4,099 | ||||||||||||||||||||||||
Operating profit | 18,326 | (124 | ) | 18,202 | 19,187 | (96 | ) | 19,091 | 24,733 | (114 | ) | 24,619 | ||||||||||||||||||||||||
| Net interest expense and currency exchange gains/losses | 629 | – | 629 | 104 | – | 104 | 464 | – | 464 | |||||||||||||||||||||||||||
Income before taxation | 17,697 | (124 | ) | 17,573 | 19,083 | (96 | ) | 18,987 | 24,269 | (114 | ) | 24,155 | ||||||||||||||||||||||||
| Taxation | 7,796 | (54 | ) | 7,742 | 8,404 | (44 | ) | 8,360 | 11,349 | (54 | ) | 11,295 | ||||||||||||||||||||||||
| Minority interests | 179 | (4 | ) | 175 | 329 | (3 | ) | 326 | 54 | (7 | ) | 47 | ||||||||||||||||||||||||
Net income | 9,722 | (66 | ) | 9,656 | 10,350 | (49 | ) | 10,301 | 12,866 | (53 | ) | 12,813 | ||||||||||||||||||||||||
The total impact of the Reserves Restatement is a reduction in net income of $174 million in 2002 (2001: $91 million; 2000: $133 million).
| Earnings by Industry Segment | $ million | |||||||||||||||||||||||||||||||||||
| 2002 | 2001 | 2000 | ||||||||||||||||||||||||||||||||||
| Second | Second | Second | ||||||||||||||||||||||||||||||||||
| As previously | Reserves | As previously | Reserves | As previously | Reserves | |||||||||||||||||||||||||||||||
| restated | Restatement | As restated | restated | Restatement | As restated | restated | Restatement | As restated | ||||||||||||||||||||||||||||
| Exploration and Production | 6,796 | (70 | ) | 6,726 | 7,963 | (52 | ) | 7,911 | 9,931 | (60 | ) | 9,871 | ||||||||||||||||||||||||
| Gas & Power | 774 | – | 774 | 1,226 | – | 1,226 | 112 | – | 112 | |||||||||||||||||||||||||||
| Oil Products | 2,627 | – | 2,627 | 1,970 | – | 1,970 | 2,681 | – | 2,681 | |||||||||||||||||||||||||||
| Chemicals | 565 | – | 565 | 127 | – | 127 | 1,033 | – | 1,033 | |||||||||||||||||||||||||||
| Corporate and Other | (861 | ) | – | (861 | ) | (607 | ) | – | (607 | ) | (837 | ) | – | (837 | ) | |||||||||||||||||||||
| Minority interests | (179 | ) | 4 | (175 | ) | (329 | ) | 3 | (326 | ) | (54 | ) | 7 | (47 | ) | |||||||||||||||||||||
| Net income | 9,722 | (66 | ) | 9,656 | 10,350 | (49 | ) | 10,301 | 12,866 | (53 | ) | 12,813 | ||||||||||||||||||||||||
The total impact of the Reserves Restatement is a reduction in Exploration and Production earnings of $171 million in 2002 (2001: $98 million; 2000: $146 million) and an increase in minority interests of $3m in 2002 (2001: reduction of $7 million; 2000: reduction of $13 million).
| Statement of Assets and Liabilities | $ million | ||||||||||||||||||||||||
| December 31, 2002 | December 31, 2001 | ||||||||||||||||||||||||
| Second | Second | ||||||||||||||||||||||||
| As previously | Reserves | As previously | Reserves | ||||||||||||||||||||||
| restated | Restatement | As restated | restated | Restatement | As restated | ||||||||||||||||||||
| Fixed assets | |||||||||||||||||||||||||
| Tangible | 78,687 | (324 | ) | 78,363 | 50,927 | (206 | ) | 50,721 | |||||||||||||||||
| Intangible | 4,696 | – | 4,696 | 939 | – | 939 | |||||||||||||||||||
| Investments | 21,087 | (3 | ) | 21,084 | 21,354 | (1 | ) | 21,353 | |||||||||||||||||
| Other long-term assets | 7,333 | – | 7,333 | 7,716 | – | 7,716 | |||||||||||||||||||
| Current assets | 41,655 | – | 41,655 | 30,717 | – | 30,717 | |||||||||||||||||||
| Current liabilities | 55,201 | – | 55,201 | 33,467 | – | 33,467 | |||||||||||||||||||
| Long-term liabilities | 12,991 | – | 12,991 | 6,347 | – | 6,347 | |||||||||||||||||||
| Provisions | |||||||||||||||||||||||||
| Deferred taxation | 12,696 | (145 | ) | 12,551 | 7,173 | (95 | ) | 7,078 | |||||||||||||||||
| Pensions and decommissioning | 8,544 | – | 8,544 | 4,946 | – | 4,946 | |||||||||||||||||||
| Minority interests | 3,582 | (14 | ) | 3,568 | 3,476 | (10 | ) | 3,466 | |||||||||||||||||
Net assets | 60,444 | (168 | ) | 60,276 | 56,244 | (102 | ) | 56,142 | |||||||||||||||||
Royal Dutch/Shell Group of Companies G 9
20-F/A (Amendment No. 2) 2002
Table of Contents
| $ | |||||||||||||
| Parent Companies’ interest in Group net assets | million | ||||||||||||
| 2002 | 2001 | 2000 | |||||||||||
| At December 31 as previously restated | 60,444 | 56,244 | 57,669 | ||||||||||
| Effect of the Second Reserves Restatement: | |||||||||||||
| Interest at the beginning of the year | (102 | ) | (53 | ) | — | ||||||||
| Net income for the year | (66 | ) | (49 | ) | (53 | ) | |||||||
At December 31 as restated | 60,276 | 56,142 | 57,616 | ||||||||||
The total impact of the Reserves Restatement is a reduction in Group net assets of $444 million at December 31, 2002 (2001: $266 million; 2000: $175 million).
Amounts relating to prior periods have been restated in the following notes where applicable.
3 Accounting policies
Nature of the Financial Statements
The accounts of the Parent Companies are not included in the Financial Statements, the objective of which is to demonstrate the financial position, results of operations and cash flows of a group of undertakings in which each Parent Company has an interest in common whilst maintaining its separate identity. The Financial Statements reflect an aggregation in US dollars of the accounts of companies in which Royal Dutch and Shell Transport together, either directly or indirectly, have control either through a majority of the voting rights or the right to exercise a controlling influence.
Investments in companies over which Group companies have significant influence but not control are classified as associated companies and are accounted for on the equity basis. Investments in companies over which the Group has no significant influence are stated at cost and dividends received from these companies are accounted for when received. Certain joint ventures in oil and gas production activities are taken up in the Financial Statements in proportion to the relevant Group interest.
In this Amendment No. 2, the Financial Statements are presented in accordance with US GAAP, with separate Financial Statements presented under Netherlands GAAP beginning on page G44.
The preparation of Financial Statements in conformity with generally accepted accounting principles requires management to make estimates and judgments that affect the amounts reported in the Financial Statements and Notes thereto. Actual results could differ from those estimates.
The Financial Statements have been prepared under the historical cost convention.
Currency translation
Assets and liabilities of non-dollar Group companies are translated to dollars at year-end rates of exchange, whilst their statements of income and cash flows are translated at quarterly average rates. Translation differences arising on aggregation are taken directly to a currency translation differences account, which forms part of Parent Companies’ interest in Group net assets. Upon divestment or liquidation of a non-dollar Group company, cumulative currency translation differences related to that company are taken to income.
The dollar equivalents of exchange gains and losses arising as a result of foreign currency transactions (including those in respect of inter-company balances unless related to transactions of a long-term investment nature) are included in Group net income.
Revenue recognition
Sales of oil, gas, chemicals and all other products are recorded when title passes to the customer. Revenue from the production of oil and natural gas properties in which the Group has an interest with other producers are recognised on the basis of the Group’s working interest (entitlement method). The difference between actual production and net working interest volumes is not significant. Purchase and sale of hydrocarbons under exchange contracts that are necessary to obtain or reposition feedstock utilised in our refinery operations are shown net in the Statement of Income. Sales between Group companies, as disclosed in the segment information, are based on prices generally equivalent to commercially available prices.
In Exploration and Production and Gas & Power title typically passes (and revenues are recognised) when a product is physically transferred into a vessel, pipe or other delivery mechanism. For sales by refining companies, title typically passes (and revenues are recognised) either when product is placed onboard a vessel or offloaded from the vessel, depending on the contractually agreed terms. Revenues on wholesale sales of oil products and chemicals are recognised when transfer of ownership occurs and title is passed, either at the point of delivery or the point of receipt, depending on contractual conditions.
G 10 Royal Dutch/ Shell Group of Companies
20-F/A (Amendment No. 2) 2002
Table of Contents
Depreciation, depletion and amortisation
Tangible fixed assets related to oil and gas production activities are depreciated on a unit-of-production basis over the proved developed reserves of the field concerned, except in the case of assets whose useful life is shorter than the lifetime of the field, in which case the straight-line method is applied. Rights and concessions are depleted on the unit-of-production basis over the total proved reserves of the relevant area. Unproved properties are amortised as required by particular circumstances. Other tangible fixed assets are generally depreciated on a straight-line basis over their estimated useful lives which is generally 20 years for refineries and chemicals plants, and 15 years for retail service station facilities. From the beginning of 2002, goodwill, and other intangible fixed assets with an indefinite life, are no longer amortised but instead tested for impairment annually. Other intangible fixed assets are amortised on a straight-line basis over their estimated useful lives (with a maximum of forty years).
Recoverability of assets
Other than properties with no proved reserves (where the basis for carrying costs on the balance sheet is explained under “Exploration costs“), the carrying amounts of major Exploration and Production fixed assets are reviewed for possible impairment annually, while all assets are reviewed whenever events or changes in circumstances indicate that the carrying amounts for those assets may not be recoverable. If assets are determined to be impaired, the carrying amounts of those assets are written down to fair value, usually determined as the amount of estimated discounted future cash flows. For this purpose, assets are grouped based on separately identifiable and largely independent cash flows. Assets held for sale are written down to the amount of estimated net realisable value.
Estimates of future cash flows used in the evaluation for impairment for assets related to hydrocarbon production are made using risk assessments on field and reservoir performance and include outlooks on proved reserves and unproved volumes, which are then discounted or risk-weighted utilising the results from projections of geological, production, recovery and economic factors.
Administrative expenses
Administrative expenses are those which do not relate directly to the activities of a single business segment and include expenses incurred in the management and co-ordination of multi-segment enterprises.
Exploration costs
Group companies follow the successful efforts method of accounting for oil and gas exploration costs. Exploration costs are charged to income when incurred, except that exploratory drilling costs are included in tangible fixed assets, pending determination of proved reserves. Exploration wells that are more than 12 months old are expensed unless (a)(i) they are in an area requiring major capital expenditure before production can begin and (ii) they have found commercially producible quantities of reserves and (iii) they are subject to further exploration or appraisal activity in that either drilling of additional exploratory wells is under way or firmly planned for the near future, or (b) proved reserves are booked within 12 months following the completion of exploratory drilling.
See Note 2(a) regarding a change in treatment of exploration costs.
Research and development
Research and development expenditure is charged to income as incurred, with the exception of that on buildings and major items of equipment which have alternative use.
Deferred taxation
Deferred taxation is provided using the comprehensive liability method of accounting for income taxes based on provisions of enacted laws. Recognition is given to deferred tax assets and liabilities for the expected future tax consequences of events that have been recognised in the Financial Statements or in the tax returns. In estimating these tax consequences, consideration is given to expected future events. The measurement of deferred tax assets is reduced, if necessary, by a valuation allowance representing the amount of any tax benefits for which there is uncertainty of realisation.
Leasing
Agreements under which Group companies make payments to owners in return for the right to use an asset for a period are accounted for as leases. Leases that transfer substantially all the risks and benefits of ownership are recorded at inception as capital leases within tangible fixed assets and debt. All other leases are recorded as operating leases and the costs are charged to income as incurred.
Royal Dutch/Shell Group of Companies G 11
20-F/A (Amendment No. 2) 2002
Table of Contents
Interest capitalisation
Interest is capitalised, as an increase in tangible fixed assets, on significant capital projects during construction. Interest is also capitalised, as an increase in investments in associated companies, on funds invested by Group companies which are used by associated companies for significant capital projects during construction.
Securities
Securities of a trading nature are carried at fair value with unrealised holding gains and losses being included in net income. Securities intended to be held to maturity are carried at cost, unless permanently impaired in which case they are carried at fair value. All other securities are classified as available for sale and are carried at fair value, with unrealised holding gains and losses being taken directly to Parent Companies’ interest in Group net assets. Upon sale or maturity, the net gains and losses are included in net income.
Short-term securities with a maturity from acquisition of three months or less and that are readily convertible into known amounts of cash are classified as cash equivalents. Securities forming part of a portfolio which is required to be held long term are classified under fixed assets – investments.
Parent Companies’ shares held by Group companies are not included in the Group’s net assets but reflected as a deduction from Parent Companies’ interest in Group net assets.
Cash flows resulting from movements in securities of a trading nature are reported under cash flow provided by operating activities while cash flows resulting from movements in other securities are reported under cash flow used in investing activities.
Inventories
Inventories are stated at cost to the Group or net realisable value, whichever is lower. Such cost is determined by the FIFO method and comprises direct purchase costs, cost of production, transportation and manufacturing expenses and taxes. See “Changes in accounting policy” for a description of a change in the method of accounting for certain inventories in North America from the LIFO to the FIFO method.
Derivative instruments
Group companies use derivatives in the management of interest rate risk, foreign currency risk and commodity price risk. The carrying amount of all derivatives, other than those meeting the normal purchases and sales exception, is measured using market prices. Those derivatives qualifying and designated as hedges are either: (1) a hedge of the fair value of a recognised asset or liability or of an unrecognised firm commitment (“fair value” hedge), or (2) a hedge of the variability of cash flows to be received or paid related to a recognised asset or liability or a forecasted transaction (“cash flow” hedge), or (3) a hedge of the foreign currency exposure of an unrecognised firm commitment or an available for sale security (“foreign currency fair value” hedge) or the foreign currency exposure of a foreign currency denominated forecasted transaction (“foreign currency cash flow” hedge).
A change in the carrying amount of a fair value hedge is taken to income, together with the consequential adjustment to the carrying amount of the hedged item. The effective portion of a change in the carrying amount of a cash flow hedge is recorded in other comprehensive income, until income reflects the variability of underlying cash flows; any ineffective portion is taken to income. A change in the carrying amount of a foreign currency hedge is recorded on the basis of whether the hedge is a fair value hedge or a cash flow hedge. A change in the carrying amount of other derivatives is taken to income.
Group companies formally document all relationships between hedging instruments and hedged items, as well as risk management objectives and strategies for undertaking various hedge transactions. The effectiveness of a hedge is also continually assessed. When effectiveness ceases, hedge accounting is discontinued.
See Note 2(a) regarding a change in treatment for certain gas contracts.
Environmental expenditures
Liabilities for environmental remediation resulting from ongoing or past operations or events are recognised in the period in which an obligation, legal or constructive, to a third party arises and the amount can be reasonably estimated. Measurement of liabilities is based on current legal requirements and existing technology. Recognition of any joint and several liability is based upon Group companies’ best estimate of their final prorata share of the liability. Liabilities are determined independently of expected insurance recoveries. Recoveries are recognised and reported as separate events and brought into account when reasonably certain of realisation. The carrying amount of liabilities is regularly reviewed and adjusted for new facts or changes in law or technology.
Employee retirement plans
Retirement plans to which employees contribute and many non-contributory plans are generally funded by payments to independent trusts. Where, due to local conditions, a plan is not funded, a provision which is not less than the present value of
G 12 Royal Dutch/ Shell Group of Companies
20-F/A (Amendment No. 2) 2002
Table of Contents
accumulated pension benefits, based on present salary levels, is included in the Financial Statements. Valuations of both funded and unfunded plans are carried out by independent actuaries.
For plans which define the amount of pension benefit to be provided, pension cost primarily represents the increase in actuarial present value of the obligation for pension benefits based on employee service during the year and the interest on this obligation in respect of employee service in previous years, net of the expected return on plan assets.
For plans where benefits depend solely on the amount contributed to the employee’s account and the returns earned on investments of those contributions, pension cost is the amount contributed by Group companies for the period.
Postretirement benefits other than pensions
Some Group companies provide certain postretirement healthcare and life insurance benefits to retirees, the entitlement to which is usually based on the employee remaining in service up to retirement age and the completion of a minimum service period. The expected costs of these benefits are accrued over the periods employees render service to the Group. These plans are not funded. A provision is included in the Financial Statements which is sufficient to cover the present value of the accumulated postretirement benefit obligation based on current assumptions. Valuations of these obligations are carried out by independent actuaries.
Stock-based compensation plans
Group companies account for stock-based compensation plans in accordance with the intrinsic value method. This method requires no recognition of compensation expense for plans where the exercise price is not at a discount to the market value at the date of the grant, and the number of options is fixed on the date of grant. However, recognition of compensation expense is required for variable award (performance-related) plans over the vesting periods of such plans, based on the then current market values of the underlying stock.
Decommissioning and restoration costs
Estimated decommissioning and restoration costs are based on current requirements, technology and price levels. In respect of oil and gas production activities, the estimated cost is provided over the life of the proved developed reserves on a unit-of-production basis. The recorded liabilities are reflected as a provision in the Statement of Assets and Liabilities. For other activities, the estimated cost is provided over the remaining life of a facility on a straight-line basis once an obligation, whether legal or constructive, crystallises and the amount can be reasonably estimated. Changes in estimates of costs are accrued on a prospective basis.
Acquisitions
Acquisitions are accounted for using the purchase method. Assets acquired and liabilities assumed are recognised at their fair value at the date of acquisition; the amount of the purchase consideration above this value is reflected as goodwill.
Reclassifications
Certain prior year amounts have been reclassified to conform with current year presentation.
Change in accounting policies
The Group has changed its accounting policy for those inventories in North America for which cost was previously determined on the basis of the LIFO method. In the Financial Statements included in this Amendment No. 2, in order to implement a globally consistent accounting policy, the cost is determined by the FIFO method and prior periods have been restated. The rationale and the effect of this change are described in Note 2(a) on page G5.
4 Parent Companies’ interest in Group net assets (as restated)
| $ million | |||||||||||||
| 2002 | 2001 | 2000 | |||||||||||
| Invested by Parent Companies | 741 | 741 | 741 | ||||||||||
| Retained earnings of Group companies | 68,254 | 64,033 | 62,895 | ||||||||||
| Parent Companies’ shares held, net of dividends received (Note 22) | (2,797 | ) | (1,953 | ) | (1,311 | ) | |||||||
| Cumulative currency translation differences | (3,894 | ) | (6,326 | ) | (4,640 | ) | |||||||
| Unrealised gains/(losses) on: | |||||||||||||
| securities | 11 | (14 | ) | 129 | |||||||||
| cash flow hedges | (239 | ) | (14 | ) | – | ||||||||
| Minimum pension liability adjustments | (1,800 | ) | (325 | ) | (198 | ) | |||||||
| Balance at December 31 | 60,276 | 56,142 | 57,616 | ||||||||||
Royal Dutch/Shell Group of Companies G 13
20-F/A (Amendment No. 2) 2002
Table of Contents
Earnings retained by the subsidiary and associated companies of the Group Holding Companies (namely Shell Petroleum N.V. and The Shell Petroleum Company Limited) and Shell Petroleum Inc. amounted to $18,227 million at December 31, 2002 (2001: $21,699 million; 2000: $23,191 million). Provision has not been made for taxes on possible future distribution of these undistributed earnings as these earnings have been, or will be, substantially reinvested by the companies concerned. It is not, therefore, meaningful to provide for these taxes nor is it practicable to estimate their full amount or the withholding tax element.
5 Other comprehensive income
| 2002 (as restated) | $ million | |||||||||||
| Net credit/(charge) | ||||||||||||
| Pre-tax | Tax | After tax | ||||||||||
| Currency translation differences | 2,773 | (303 | ) | 2,470 | ||||||||
| Reclassifications | (38 | ) | – | (38 | ) | |||||||
| Currency translation differences | ||||||||||||
| net of reclassifications | 2,735 | (303 | ) | 2,432 | ||||||||
| Unrealised gains/(losses) on securities | 26 | 10 | 36 | |||||||||
| Reclassifications | (12 | ) | 1 | (11 | ) | |||||||
| Unrealised gains/(losses) on securities | ||||||||||||
| net of reclassifications | 14 | 11 | 25 | |||||||||
| Unrealised gains/(losses) on cash flow hedges | (209 | ) | (7 | ) | (216 | ) | ||||||
| Reclassifications | (9 | ) | – | (9 | ) | |||||||
| Unrealised gains/(losses) on cash flow hedges | ||||||||||||
| net of reclassifications | (218 | ) | (7 | ) | (225 | ) | ||||||
| Minimum pension liability adjustments | (2,446 | ) | 971 | (1,475 | ) | |||||||
| Other comprehensive income | 85 | 672 | 757 | |||||||||
| 2001 (as restated) | $ million | |||||||||||
| Net credit/(charge) | ||||||||||||
| Pre-tax | Tax | After tax | ||||||||||
| Currency translation differences | (1,654 | ) | 95 | (1,559 | ) | |||||||
| Reclassifications | (127 | ) | – | (127 | ) | |||||||
| Currency translation differences | ||||||||||||
| net of reclassifications | (1,781 | ) | 95 | (1,686 | ) | |||||||
| Unrealised gains/(losses) on securities | (114 | ) | (9 | ) | (123 | ) | ||||||
| Reclassifications | (32 | ) | 12 | (20 | ) | |||||||
| Unrealised gains/(losses) on securities | ||||||||||||
| net of reclassifications | (146 | ) | 3 | (143 | ) | |||||||
| Unrealised gains/(losses) on cash flow hedges | (1 | ) | (13 | ) | (14 | ) | ||||||
| Reclassifications | – | – | – | |||||||||
| Unrealised gains/(losses) on cash flow hedges | ||||||||||||
| net of reclassifications | (1 | ) | (13 | ) | (14 | ) | ||||||
| Minimum pension liability adjustments | (209 | ) | 82 | (127 | ) | |||||||
| Other comprehensive income | (2,137 | ) | 167 | (1,970 | ) | |||||||
| 2000 (as restated) | $ million | |||||||||||
| Net credit/(charge) | ||||||||||||
| Pre-tax | Tax | After tax | ||||||||||
| Currency translation differences | (2,671 | ) | (51 | ) | (2,722 | ) | ||||||
| Reclassifications | 11 | – | 11 | |||||||||
| Currency translation differences | ||||||||||||
| net of reclassifications | (2,660 | ) | (51 | ) | (2,711 | ) | ||||||
| Unrealised gains/(losses) on securities | (205 | ) | 8 | (197 | ) | |||||||
| Reclassifications | (50 | ) | 9 | (41 | ) | |||||||
| Unrealised gains/(losses) on securities | ||||||||||||
| net of reclassifications | (255 | ) | 17 | (238 | ) | |||||||
| Minimum pension liability adjustments | (115 | ) | 45 | (70 | ) | |||||||
| Other comprehensive income | (3,030 | ) | 11 | (3,019 | ) | |||||||
| 2002 | 2001 | 2000 | ||||||||||
| Rates of exchange at December 31 were: | €/$ | 0.96 | 1.13 | 1.07 | ||||||||
| £/$ | 0.62 | 0.69 | 0.67 | |||||||||
G 14 Royal Dutch/ Shell Group of Companies
20-F/A (Amendment No. 2) 2002
Table of Contents
6 Associated companies
(a) Income
Associated companies engage in similar businesses to Group companies and play an important part in the overall operating activities of the Group. Consequently, the Group share of operating profits arising from associated companies is seen as a contribution to the total Group operating profit and is shown as such in the Statement of Income. The Group share of interest income, interest expense, currency exchange gains/ losses and taxation of associated companies has been included within those items in the Statement of Income.
A summarised Statement of Income with respect to the Group share of net income from associated companies, together with a segment analysis, is set out below:
| $ million | ||||||||||||
| 2002 | 2001 | 2000 | ||||||||||
| As restated | As restated | As restated | ||||||||||
| Net proceeds | 33,522 | 55,767 | 60,896 | |||||||||
| Cost of sales | 26,744 | 47,540 | 51,445 | |||||||||
| Gross profit | 6,778 | 8,227 | 9,451 | |||||||||
| Other operating expenses | 3,962 | 5,583 | 5,352 | |||||||||
| Operating profit | 2,816 | 2,644 | 4,099 | |||||||||
| Interest and other income | 102 | 98 | 111 | |||||||||
| Interest expense | 451 | 503 | 498 | |||||||||
| Currency exchange gains/(losses) | (15 | ) | (20 | ) | 7 | |||||||
| Income before taxation | 2,452 | 2,219 | 3,719 | |||||||||
| Taxation | 998 | 1,085 | 1,514 | |||||||||
| Net income | 1,454 | 1,134 | 2,205 | |||||||||
As stated in Note 2(a), the Group changed its accounting for certain North American inventories from LIFO to FIFO. This change has been reflected in the restated 2001 and 2000 comparative information.
| Income by segment | $ million | |||||||||||
| 2002 | 2001 | 2000 | ||||||||||
| As restated | As restated | As restated | ||||||||||
| Exploration and Production | 541 | 757 | 989 | |||||||||
| Gas & Power | 589 | 746 | 505 | |||||||||
| Oil Products | 448 | 43 | 892 | |||||||||
| Chemicals | 153 | (26 | ) | 174 | ||||||||
| Corporate and Other | (277 | ) | (386 | ) | (355 | ) | ||||||
| 1,454 | 1,134 | 2,205 | ||||||||||
(b) Investments
| $ million | ||||||||||||||||
| 2002 | 2001 | |||||||||||||||
| As restated | As restated | |||||||||||||||
| Shares | Loans | Total | Total | |||||||||||||
| At January 1 | 16,034 | 2,297 | 18,331 | 19,362 | ||||||||||||
| New investments | 684 | 605 | 1,289 | 1,074 | ||||||||||||
| Net asset transfers to/(from) associates, disposals and other movements | (2,027 | ) | (382 | ) | (2,409 | ) | (1,031 | ) | ||||||||
| Net income | 1,454 | – | 1,454 | 1,134 | ||||||||||||
| Dividends | (1,571 | ) | – | (1,571 | ) | (1,800 | ) | |||||||||
| Currency translation differences | 743 | 108 | 851 | (408 | ) | |||||||||||
| At December 31 | 15,317 | 2,628 | 17,945 | 18,331 | ||||||||||||
In 2002, the net asset transfers to/from associates, disposals and other movements mainly comprise the effects of the reclassification of Equilon from an associate to a Group company consequent on the acquisition of the outstanding 44% interest.
Royal Dutch/Shell Group of Companies G 15
20-F/A (Amendment No. 2) 2002
Table of Contents
The amount in 2001 mainly relates to the effects of the reclassification of Sakhalin Energy from an associate to a Group company and repayments of loans.
Net income for 2002 includes $150 million write-down in the carrying amount of InterGen (Gas & Power), due to a reassessment of the impact of continued poor merchant power market conditions in the USA and UK.
A summarised Statement of Assets and Liabilities with respect to the Group share of investments in associated companies is set out below:
| $ million | ||||||||
| 2002 | 2001 | |||||||
| Fixed assets | 27,603 | 26,169 | ||||||
| Current assets | 7,029 | 7,841 | ||||||
| Total assets | 34,632 | 34,010 | ||||||
| Current liabilities | 7,107 | 8,588 | ||||||
| Long-term liabilities | 9,580 | 7,091 | ||||||
| Net assets | 17,945 | 18,331 | ||||||
An analysis by segment is shown in Note 24.
The Group’s major investments in associated companies at December 31, 2002 comprised:
| Segment | Country of | ||||||||
| Name | Group interest | incorporation | |||||||
| Exploration and Production | |||||||||
| Aera | 52% | USA | |||||||
| Brunei Shell | 50% | Brunei | |||||||
| Woodside | 34% | Australia | |||||||
| Gas & Power | |||||||||
| InterGen | 68% | The Netherlands | |||||||
| Nigeria LNG | 26% | Nigeria | |||||||
| Oil Products | |||||||||
| Motiva | 50% | USA | |||||||
| Showa Shell | 50% | Japan | |||||||
| Chemicals | |||||||||
| Basell | 50% | The Netherlands | |||||||
| Saudi Petrochemical | 50% | Saudi Arabia | |||||||
Although the Group has a 52% investment in Aera and a 68% investment in InterGen, the governing agreements and constitutive documents for these entities do not allow the Group to control these entities, as voting control is either split 50:50 between the shareholders or requires unanimous approval of the shareholders or their representatives and, therefore, these entities have not been consolidated.
(c) Transactions between Group companies and associated companies
Transactions between Group and associated companies mainly comprise sales and purchases of goods and services in the ordinary course of business and in total amounted to:
| $ million | ||||||||||||
| 2002 | 2001 | 2000 | ||||||||||
| Charges to associated companies | 10,573 | 13,415 | 15,590 | |||||||||
| Charges from associated companies | 5,623 | 5,053 | 5,792 | |||||||||
Balances outstanding at December 31, 2002 and 2001 in respect of the above transactions are shown in Notes 13 and 17.
G 16 Royal Dutch/ Shell Group of Companies
20-F/A (Amendment No. 2) 2002
Table of Contents
7 Interest and other income
| $ million | |||||||||||||
| 2002 | 2001 | 2000 | |||||||||||
| Group companies | |||||||||||||
| Interest income | 491 | 784 | 627 | ||||||||||
| Other income | 165 | 177 | 236 | ||||||||||
| 656 | 961 | 863 | |||||||||||
| Associated companies | 102 | 98 | 111 | ||||||||||
| 758 | 1,059 | 974 | |||||||||||
8 Interest expense
| $ million | |||||||||||||
| 2002 | 2001 | 2000 | |||||||||||
| Group companies | |||||||||||||
| Interest incurred | 956 | 662 | 877 | ||||||||||
lessinterest capitalised | 43 | 32 | 51 | ||||||||||
| 913 | 630 | 826 | |||||||||||
| Associated companies | 451 | 503 | 498 | ||||||||||
| 1,364 | 1,133 | 1,324 | |||||||||||
9 Taxation
(a) Taxation charge for the year
| $ million | |||||||||||||
| 2002 | 2001 | 2000 | |||||||||||
| As restated | As restated | As restated | |||||||||||
| Group companies | |||||||||||||
| Current tax charge | 6,727 | 7,722 | 9,251 | ||||||||||
| Deferred tax charge/(credit) | 17 | (447 | ) | 530 | |||||||||
| 6,744 | 7,275 | 9,781 | |||||||||||
| Associated companies | 998 | 1,085 | 1,514 | ||||||||||
| 7,742 | 8,360 | 11,295 | |||||||||||
Reconciliations of the expected tax charge of Group companies to the actual tax charge are as follows:
| $ million | ||||||||||||
| 2002 | 2001 | 2000 | ||||||||||
| As restated | As restated | As restated | ||||||||||
| Expected tax charge at statutory rates | 6,596 | 7,397 | 9,786 | |||||||||
| Adjustments in respect of prior years | (251 | ) | (258 | ) | (89 | ) | ||||||
| Other reconciling items | 399 | 136 | 84 | |||||||||
| Taxation charge of Group companies | 6,744 | 7,275 | 9,781 | |||||||||
The taxation charge of Group companies includes not only income taxes of general application but also income taxes at special rates levied on income from Exploration and Production activities and various additional income and other taxes to which these activities are subject.
Tax adjustments in respect of prior years relate to events in the current period and reflect the effects of changes in rules, facts or other factors compared to those used in establishing the tax position or deferred tax balance.
Other reconciling items in 2002 include $415 million due to the increase in UK upstream corporate tax rate during the year.
Royal Dutch/Shell Group of Companies G 17
20-F/A (Amendment No. 2) 2002
Table of Contents
(b) Taxes payable
| $ million | ||||||||
| 2002 | 2001 | |||||||
| Taxes on activities of Group companies | 1,988 | 2,220 | ||||||
| Sales taxes, excise duties and similar levies and social law taxes | 2,997 | 2,274 | ||||||
| 4,985 | 4,494 | |||||||
(c) Provision for deferred taxation
The provision for deferred taxation comprises the following tax effects of temporary differences:
| $ million | |||||||||
| 2002 | 2001 | ||||||||
| As restated | As restated | ||||||||
| Tangible and intangible fixed assets | 16,692 | 9,012 | |||||||
| Other items | 3,504 | 3,169 | |||||||
| Total deferred tax liabilities | 20,196 | 12,181 | |||||||
| Tax losses carried forward | (2,171 | ) | (1,642 | ) | |||||
| Provisions | |||||||||
| Pensions and similar obligations | (1,293 | ) | (671 | ) | |||||
| Decommissioning and restoration costs | (1,700 | ) | (1,162 | ) | |||||
| Environmental and other provisions | (445 | ) | (322 | ) | |||||
| Other items | (4,510 | ) | (2,936 | ) | |||||
| Total deferred tax assets | (10,119 | ) | (6,733 | ) | |||||
| Asset valuation allowance | 2,474 | 1,630 | |||||||
| Net deferred tax assets | (7,645 | ) | (5,103 | ) | |||||
| Net deferred tax liability | 12,551 | 7,078 | |||||||
The increase in temporary differences for tangible and intangible fixed assets includes the deferred tax assumed on acquisition of Enterprise Oil (see Note 10).
The Group has tax losses carried forward amounting to $6,687 million at December 31, 2002. Of these, $5,108 million can be carried forward indefinitely. The remaining $1,579 million expires in the following years:
| $ million | ||||
| 2003 | 97 | |||
| 2004 | 160 | |||
| 2005 | 342 | |||
| 2006 | 142 | |||
| 2007 – 2011 | 65 | |||
| 2012 – 2017 | 773 | |||
G 18 Royal Dutch/ Shell Group of Companies
20-F/A (Amendment No. 2) 2002
Table of Contents
10 Tangible and intangible fixed assets
| 2002 | 2001 | |||||||||||||||||||||||
| As restated | As restated | |||||||||||||||||||||||
| Other | Total | Total | Total | |||||||||||||||||||||
| Tangible | Goodwill | intangible | intangible | Group | Group | |||||||||||||||||||
Cost | ||||||||||||||||||||||||
| At January 1 | 117,542 | 1,512 | 902 | 2,414 | 119,956 | 113,891 | ||||||||||||||||||
| Capital expenditure | 11,755 | 129 | 218 | 347 | 12,102 | 9,598 | ||||||||||||||||||
| Assets assumed on acquisitions (Enterprise Oil, Pennzoil-Quaker State and DEA and additional shares in Equilon) | 20,178 | 1,743 | 1,364 | 3,107 | 23,285 | – | ||||||||||||||||||
| Sales, retirements and other movementsa | (1,746 | ) | 30 | 410 | 440 | (1,306 | ) | (589 | ) | |||||||||||||||
| Currency translation differences | 9,770 | 86 | 64 | 150 | 9,920 | (2,944 | ) | |||||||||||||||||
| At December 31 | 157,499 | 3,500 | 2,958 | 6,458 | 163,957 | 119,956 | ||||||||||||||||||
Depreciation | ||||||||||||||||||||||||
| At January 1 | 66,821 | 1,147 | 328 | 1,475 | 68,296 | 66,018 | ||||||||||||||||||
| Depreciation, depletion and amortisation charge | 8,534 | 13 | 192 | 205 | 8,739 | 6,295 | ||||||||||||||||||
| Sales, retirements and other movements | (1,539 | ) | (27 | ) | 42 | 15 | (1,524 | ) | (2,295 | ) | ||||||||||||||
| Currency translation differences | 5,320 | 43 | 24 | 67 | 5,387 | (1,722 | ) | |||||||||||||||||
| At December 31 | 79,136 | 1,176 | 586 | 1,762 | 80,898 | 67,296 | ||||||||||||||||||
Net 2002 | 78,363 | 2,324 | 2,372 | 4,696 | 83,059 | |||||||||||||||||||
| 2001 | 50,721 | 365 | 574 | 939 | 52,660 | |||||||||||||||||||
Intangible fixed assets include $1.1 billion in respect of Pennzoil and Quaker State trademarks acquired. These are being amortised over an estimated useful life of forty years. Continued brand maintenance in addition to the established long-term leadership of these brands in automotive lubricants and vehicle care markets support this estimate.
Tangible fixed assets at year-end, capital expenditure, together with acquisitions and new investments in associated companies, and the depreciation, depletion and amortisation charges are shown in Note 24, classified, consistent with oil and gas industry practice, according to operating activities. Such a classification, rather than one according to type of asset, is given in order to permit a better comparison with other companies having similar activities.
The net balances at December 31 include:
| $ million | |||||||||
| 2002 | 2001 | ||||||||
| As restated | As restated | ||||||||
| Capitalised costs in respect of assets not yet used in operations | |||||||||
| Unproved properties | 4,443 | 2,218 | |||||||
| Proved properties under development and other assets in the course of construction | 6,814 | 5,941 | |||||||
| 11,257 | 8,159 | ||||||||
Depreciation, depletion and amortisation charges for the year in the table above are included within the following expense headings in the Statement of Income:
| $ million | ||||||||||||
| 2002 | 2001 | 2000 | ||||||||||
| As restated | As restated | As restated | ||||||||||
| Cost of sales | 7,469 | 5,165 | 6,934 | |||||||||
| Selling and distribution expenses | 1,095 | 1,007 | 1,087 | |||||||||
| Administrative expenses | 62 | 53 | 57 | |||||||||
| Exploration | 80 | 42 | 10 | |||||||||
| Research and development | 33 | 28 | 42 | |||||||||
| 8,739 | 6,295 | 8,130 | ||||||||||
Royal Dutch/Shell Group of Companies G 19
20-F/A (Amendment No. 2) 2002
Table of Contents
Depreciation, depletion and amortisation charges for 2002 include $191 million (2001: $88 million; 2000: $1,345 million) relating to the impairment of tangible fixed assets, and $6 million (2001: nil; 2000: $440 million) relating to the impairment of intangible fixed assets. Such charges are recorded within cost of sales. The impairment charges relate to assets held for use (2002: $105 million; 2001: nil; 2000: $1,433 million) and to assets held for sale (2002: $92 million; 2001: $88 million; 2000: $352 million). For 2002 the majority of the impairment charges (in total $197 million) were in Oil Products, reflecting plans in the USA to close surplus base oil production facilities, the closure of the Pililla base oil and bitumen refinery in the Philippines and a change in outlook for liquefied petroleum gas assets in Argentina coupled with the country’s economic downturn. For 2001, the impairment charges (in total $88 million) were mainly in Chemicals, reflecting plans to close the Taft polymer plant and close a catalyst production line in the USA, and in Renewables based on bids received for their South American forestry assets. The majority of the impairment charges in 2000 were in Oil Products ($824 million), mainly resulting from a downward revision in the long-term expectation for certain refinery margins, and in Gas & Power ($697 million), mainly resulting from restructuring of the business in the USA.
Net fixed assets at December 31, 2002 include assets held for sale totalling $0.2 billion (2001: $0.8 billion; 2000: $0.9 billion), consisting primarily of assets in Chemicals and Other industry segments. It is expected that the sales of these assets will occur in 2003. Operating losses included in the Statement of Income relating to these assets totalled $37 million in 2002 (2001: $49 million; 2000: $33 million).
2002 acquisitions
Exploration and Production
The Group acquired all the outstanding shares of Enterprise Oil in the second quarter of 2002 for aggregate cash consideration of $5.3 billion and assumed debt of $2.4 billion to strengthen the Group’s upstream portfolio, adding new developments and exploration acreage in several countries.
Oil Products
Following the merger of Chevron and Texaco, the Group acquired the outstanding shares (44%) in Equilon in the first quarter 2002 for aggregate cash consideration of $1.8 billion and assumed debt of $2.3 billion. Prior to the acquisition of the remaining shares in Equilon, the Group accounted for its investment in Equilon as an associated company since the governing agreements and constitutive documents for Equilon did not permit the Group to control it. This acquisition provides the Group with the opportunity to gain further presence in the US market, which is key to the Oil Products business.
The Group formed DEA, a joint venture with RWE AG, in the first quarter of 2002 to provide the Group with an enhanced position in Germany, the largest oil products market in Europe. Under the relevant governing agreements and constitutive documents, the Group has controlled DEA since its formation and as a result has included DEA in the Group’s consolidated results throughout 2002. The Group acquired the remaining shares in DEA in the third quarter of 2002 for an aggregate cash consideration of $1.3 billion, payable in July 2003.
The Group acquired all the outstanding shares of Pennzoil-Quaker State Company (PQS) in the fourth quarter of 2002 for aggregate cash consideration of $1.9 billion and assumed debt of $1.3 billion, aligned with the Group’s strategy to become a leader in the global lubricants market by strengthening its position in the USA.
The following table sets forth the fair values of assets acquired, and liabilities assumed, in these acquisitions, including for Enterprise Oil $6.6 billion of rights and concessions and for PQS $1.1 billion of trademarks and $1.7 billion of goodwill (of which $0.3 billion is tax-deductible) recognised as a reflection of the value of growth opportunities.
G 20 Royal Dutch/ Shell Group of Companies
20-F/A (Amendment No. 2) 2002
Table of Contents
| 2002 | $ million | ||||||||||||
| Exploration and | Oil | ||||||||||||
| Production | Products | Total | |||||||||||
| Tangible and intangible fixed assets | 11,286 | 11,999 | 23,285 | ||||||||||
including: | |||||||||||||
PQS goodwill | 1,743 | 1,743 | |||||||||||
PQS trademarks | 1,101 | 1,101 | |||||||||||
| Other assets | 736 | 5,772 | 6,508 | ||||||||||
| Total assets acquired | 12,022 | 17,771 | 29,793 | ||||||||||
| Current liabilities (excluding debt) | 252 | 3,609 | 3,861 | ||||||||||
| Debt | 2,359 | 3,608 | 5,967 | ||||||||||
| Deferred taxation | 3,771 | 638 | 4,409 | ||||||||||
| Other long-term liabilities and provisions | 346 | 2,220 | 2,566 | ||||||||||
| Total liabilities assumed | 6,728 | 10,075 | 16,803 | ||||||||||
| Less: Existing equity in Equilon | 2,730 | 2,730 | |||||||||||
| Purchase considerationa | 5,294 | 4,966 | 10,260 | ||||||||||
| a Includes $1.3 billion relating to DEA, paid in July 2003. | |||||||||||||
Pro forma information (unaudited)
Pro forma information for the Group, as if the four companies had been purchased (and paid for) on 1 January, 2001, is presented below.
| $ million | |||||||||||||||||
| Net proceeds | Net income | ||||||||||||||||
| 2002 | 2001 | 2002 | 2001 | ||||||||||||||
| As reported | 179,315 | 135,131 | 9,656 | 10,301 | |||||||||||||
| Results before financing costs: | |||||||||||||||||
| Enterprise Oil | 403 | 2,002 | (32 | ) | 94 | ||||||||||||
| Equilon | – | 44,463 | – | 45 | |||||||||||||
| DEA | – | 6,422 | (27 | ) | 153 | ||||||||||||
| PQS | 1,691 | 2,315 | 81 | 117 | |||||||||||||
| Financing costs (after tax) | (165 | ) | (461 | ) | |||||||||||||
| Pro forma | 181,409 | 190,333 | 9,513 | 10,249 | |||||||||||||
| ($) | ||||||||||||||||
| 2002 | 2001 | |||||||||||||||
| As | Pro | As | Pro | |||||||||||||
| reported | forma | reported | forma | |||||||||||||
| Basic earnings per share attributable to Royal Dutch | 2.82 | 2.77 | 2.95 | 2.93 | ||||||||||||
| Diluted earnings per share attributable to Royal Dutch | 2.81 | 2.77 | 2.95 | 2.93 | ||||||||||||
| Basic earnings per ADR attributable to Shell Transport | 2.41 | 2.38 | 2.53 | 2.52 | ||||||||||||
| Diluted earnings per ADR attributable to Shell Transport | 2.41 | 2.37 | 2.53 | 2.52 | ||||||||||||
The pro forma information above is based on the following:
| • | the preparation of this information has required use of certain estimates, utilising both pre- and post-acquisition data, in particular for fully-integrated businesses; |
| • | where applicable, pro forma amounts have been calculated taking into account additional depreciation, depletion or amortisation resulting from fair value accounting, and have been adjusted on to a US GAAP basis. The Group accounting policies as in effect in 2002 have been applied, adjusted to reflect changes in 2003 which have resulted in the restatement of prior information; |
| • | financing costs comprise additional interest charges on the purchase considerations, plus the acquired companies’ interest charges on their existing debt up to the date of acquisition; |
Royal Dutch/Shell Group of Companies G 21
20-F/A (Amendment No. 2) 2002
Table of Contents
| • | taxes have been calculated using the relevant statutory rate for each of the jurisdictions involved. A tax rate of 35% has been applied to calculate the tax relief on the interest charge on Group debt incurred to finance the acquisitions; |
| • | for 2001, pro forma data is provided for all acquisitions for the entire year. Both Equilon and DEA were included in Group results for all of 2002. For Enterprise Oil, the first quarter of 2002 is on a pro forma basis and for PQS the first three quarters of 2002 are reported on a pro forma basis; |
| • | PQS trademarks are being amortised over 40 years, with no residual value expected; and |
| • | restructuring costs incurred have remained in the period originally recorded. The Equilon acquisition resulted in a restructuring expense of approximately $300 million (pre-tax) in 2001. |
11 Other long-term assets
Reflecting their non-current nature, deferred charges and prepayments due after one year and other non-current assets are presented separately as “Other long-term assets”. At December 31, 2002 these include $6,766 million (2001: $6,487 million) of deferred charges and prepayments (including amounts in respect of risk management activities), of which $4,506 million (2001: $4,714 million) relates to prepaid pension costs.
12 Inventories
| $ million | ||||||||
| 2002 | 2001 | |||||||
| As restated | As restated | |||||||
| Inventories of oil and chemicals | 10,423 | 5,943 | ||||||
| Inventories of materials | 915 | 637 | ||||||
| 11,338 | 6,580 | |||||||
13 Accounts receivable
| $ million | ||||||||
| 2002 | ||||||||
| As restated | 2001 | |||||||
| Trade receivables | 15,475 | 9,824 | ||||||
| Amounts owed by associated companies | 4,834 | 1,875 | ||||||
| Other receivables | 3,458 | 2,692 | ||||||
| Deferred charges and prepayments | 4,994 | 3,076 | ||||||
| 28,761 | 17,467 | |||||||
Provisions for doubtful items deducted from accounts receivable amounted to $415 million at December 31, 2002 (2001: $312 million). Deferred charges and prepayments include amounts in respect of risk management activities.
14 Securities
(a) Investments – securities
Investments – securities mainly comprises a portfolio of equity and debt securities required to be held long-term by the Group insurance companies as security for their insurance activities. These securities are classified as available for sale. Of these, $689 million at December 31, 2002 (2001: $590 million) are debt securities. The maturities of $362 million of these are between two and five years, and those of $312 million exceed five years.
(b) Short-term securities (including those classified as cash equivalents)
The total carrying amount of short-term securities, including those classified as cash equivalents, is $49 million at December 31, 2002 (2001: $2,233 million). Of these, none is of a trading nature (2001: $2,177 million). The remainder are debt securities which are classified as available for sale.
Short-term securities at December 31, 2002 amounting to $4 million (2001: $189 million) are listed on recognised stock exchanges.
G 22 Royal Dutch/ Shell Group of Companies
20-F/A (Amendment No. 2) 2002
Table of Contents
15 Debt
(a) Short-term debt
| $ million | ||||||||
| 2002 | 2001 | |||||||
| Debentures and other loans | 9,963 | 1,636 | ||||||
| Amounts due to banks and other credit institutions (including long-term debt due within one year) | 2,846 | 2,344 | ||||||
| 12,809 | 3,980 | |||||||
| Capitalised lease obligations | 65 | 8 | ||||||
Short-term debt | 12,874 | 3,988 | ||||||
lesslong-term debt due within one year | 2,253 | 1,682 | ||||||
| Short-term debt excluding long-term debt due within one year | 10,621 | 2,306 | ||||||
In 2001, $1.3 billion of non-recourse debt owed by a company (Group interest 64%) was reclassified as short-term debt when a debt covenant (the interest cover ratio) was breached. This covenant breach is continuing and the company has defaulted on $115 million of scheduled principal payments in 2002.
The following relates only to short-term debt excluding long-term debt due within one year:
| $ million | |||||||||
| 2002 | 2001 | ||||||||
| Maximum amount outstanding at the end of any quarter | 13,098 | 2,306 | |||||||
| Average amount outstanding | 8,153 | 1,859 | |||||||
| Amounts due to banks and other credit institutions | 2,378 | 2,039 | |||||||
| Unused lines of short-term credit | 3,625 | 3,679 | |||||||
| Approximate average interest rate on: | |||||||||
| average amount outstanding | 3% | 11% | |||||||
| amount outstanding at December 31 | 3% | 9% | |||||||
The amount outstanding at December 31, 2002 includes $6,908 million of fixed rate and $1,364 million of variable rate dollar debt at an average interest rate of 2% and 3% respectively.
(b) Long-term debt
| $ million | ||||||||
| 2002 | 2001 | |||||||
| Debentures and other loans | 5,523 | 937 | ||||||
| Amounts due to banks and other credit institutions | 794 | 667 | ||||||
| 6,317 | 1,604 | |||||||
| Capitalised lease obligations | 500 | 228 | ||||||
Long-term debt | 6,817 | 1,832 | ||||||
addlong-term debt due within one year | 2,253 | 1,682 | ||||||
| Long-term debt including long-term debt due within one year | 9,070 | 3,514 | ||||||
The following relates to long-term debt including the short-term part but excluding capitalised lease obligations.
Long-term debt denominated in dollars amounted to $5,165 million at December 31, 2002 (2001: $2,904 million). The majority of the amount at December 31, 2002 is fixed rate debt with an average interest rate of 4%; non-dollar denominated debt comprised mainly fixed rate debt at an average interest rate of 4%. The approximate weighted average interest rate in 2002 was 2% for dollar debt and 3% for total debt.
Royal Dutch/Shell Group of Companies G 23
20-F/A (Amendment No. 2) 2002
Table of Contents
The aggregate maturities of long-term debts are:
| $ million | ||||
| 2003 | 2,188 | |||
| 2004 | 1,190 | |||
| 2005 | 926 | |||
| 2006 | 1,268 | |||
| 2007 | 2,153 | |||
| 2008 and after | 780 | |||
During 2002, the Medium Term Note and Commercial Paper Facilities have been increased to a total level of $26.0 billion. As at December 31, 2002, debt outstanding under central borrowing programmes, which includes these facilities, totalled $13.9 billion with the remaining indebtedness raised by Group companies with no recourse beyond the immediate borrower and/or the local assets.
In accordance with the risk management policy, Group companies have entered into interest rate swap agreements against most of the fixed rate debt. The use of interest rate swaps is further discussed in Note 28.
16 Commitments
(a) Leasing arrangements
The future minimum lease payments under operating leases and capital leases, and the present value of net minimum capital lease payments at December 31, 2002 are as follows:
| $ million | ||||||||
| Operating | Capital | |||||||
| leases | leases | |||||||
| 2003 | 1,906 | 91 | ||||||
| 2004 | 1,192 | 52 | ||||||
| 2005 | 806 | 51 | ||||||
| 2006 | 647 | 49 | ||||||
| 2007 | 512 | 56 | ||||||
| 2008 and after | 3,553 | 495 | ||||||
| Total minimum payments | 8,616 | 794 | ||||||
lessexecutory costs and interest | 229 | |||||||
| Present value of net minimum capital lease payments | 565 | |||||||
The figures above for operating lease payments represent minimum commitments existing at December 31, 2002 and are not a forecast of future total rental expense.
Total rental expense for all operating leases was as follows:
| $ million | ||||||||||||
| 2002 | 2001 | 2000 | ||||||||||
| Minimum rentals | 1,557 | 1,377 | 1,197 | |||||||||
| Contingent rentals | 104 | 105 | 121 | |||||||||
| Sub-lease rentals | (300 | ) | (174 | ) | (107 | ) | ||||||
| 1,361 | 1,308 | 1,211 | ||||||||||
G 24 Royal Dutch/ Shell Group of Companies
20-F/A (Amendment No. 2) 2002
Table of Contents
(b) Long-term purchase obligations
Group companies have unconditional long-term purchase obligations associated with financing arrangements. The aggregate amount of payments required under such obligations at December 31, 2002 is as follows:
| $ milliona | ||||
| 2003 | 318 | |||
| 2004 | 285 | |||
| 2005 | 236 | |||
| 2006 | 219 | |||
| 2007 | 212 | |||
| 2008 and after | 2,301 | |||
| 3,571 | ||||
| a Includes reclassification of certain purchase obligations in Canada. | ||||
The agreements under which these unconditional purchase obligations arise relate mainly to the purchase of chemicals feedstock, utilities and to the use of pipelines.
Payments under these agreements, which include additional sums depending upon actual quantities of supplies, amounted to $360 million in 2002 (2001: $309 million).
(c) Long-term power capacity obligations
Group companies have obligations under certain power generation contracts (“tolling agreements”) at December 31, 2002 amounting to $6.9 billion (2001: $7.4 billion), of which $0.7 billion (2001: $0.7 billion) is conditional upon the exercise of a renewal option by the owner of one of the plants. ($2.2 billion of the amount at December 31, 2001 was conditional upon the ability of power plant owners to secure financing.) The timing of the payments under such obligations at December 31, 2002 is as follows:
| $ million | ||||
| 2003 | 169 | |||
| 2004 | 308 | |||
| 2005 | 338 | |||
| 2006 | 330 | |||
| 2007 | 333 | |||
| 2008 and after | 5,392 | |||
| 6,870 | ||||
The fair value of tolling agreements at December 31, 2002 and December 31, 2001, which are included in assets and liabilities in respect of risk management activities (see Notes 13 and 17), and the resultant effect on net income for 2002, 2001 and 2000, was not significant.
17 Accounts payable and accrued liabilities
| $ million | ||||||||
| 2002 | ||||||||
| As restated | 2001 | |||||||
| Trade payables | 13,049 | 8,476 | ||||||
| Amounts due to associated companies | 2,075 | 1,070 | ||||||
| Pensions and similar obligations | 250 | 193 | ||||||
| Other payables | 10,699 | 4,677 | ||||||
| Accruals and deferred income | 6,116 | 4,468 | ||||||
| 32,189 | 18,884 | |||||||
Other payables include amounts in respect of risk management activities and, at December 31, 2002, $1.3 billion for the acquisition of DEA, payable in July 2003.
Royal Dutch/Shell Group of Companies G 25
20-F/A (Amendment No. 2) 2002
Table of Contents
18 Long-term liabilities – Other
This includes amounts in respect of risk management activities, advance payments under long-term supply contracts, deposits, liabilities under staff benefit programmes, deferred income and environmental liabilities. The amount includes $926 million at December 31, 2002 (2001: $754 million) which does not fall due until more than five years after the respective balance sheet dates.
19 Statement of Cash Flows
This statement reflects the cash flows arising from the activities of Group companies as measured in their own currencies, translated to dollars at quarterly average rates of exchange.
Accordingly, the cash flows recorded in the Statement of Cash Flows exclude both the currency translation differences which arise as a result of translating the assets and liabilities of non-dollar Group companies to dollars at year-end rates of exchange (except for those arising on cash and cash equivalents) and non-cash investing and financing activities. These currency translation differences and non-cash investing and financing activities must therefore be added to the cash flow movements at average rates in order to arrive at the movements derived from the Statement of Assets and Liabilities.
| 2002 (as restated) | $ million | |||||||||||||||
| Movements | ||||||||||||||||
| Movements | Movements | derived from | ||||||||||||||
| from | arising from | Statement of | ||||||||||||||
| Statement of | currency | Non-cash | Assets and | |||||||||||||
| Cash Flows | translation | movements | Liabilities | |||||||||||||
| Tangible and intangible fixed assets | 11,815 | 4,533 | 15,051 | 31,399 | ||||||||||||
| Investments – associates | 654 | 851 | (1,891 | ) | (386 | ) | ||||||||||
| Other long-term assets | 807 | 547 | (1,737 | ) | (383 | ) | ||||||||||
| Inventories | 2,079 | 704 | 1,975 | 4,758 | ||||||||||||
| Accounts receivable | 5,830 | 1,551 | 3,913 | 11,294 | ||||||||||||
| Cash and cash equivalents | (5,267 | ) | 153 | – | (5,114 | ) | ||||||||||
| Short-term debt | (7,058 | ) | (855 | ) | (402 | ) | (8,315 | ) | ||||||||
| Short-term part of long-term debt | (554 | ) | (17 | ) | – | (571 | ) | |||||||||
| Accounts payable and accrued liabilities | (6,989 | ) | (2,376 | ) | (3,940 | ) | (13,305 | ) | ||||||||
| Taxes payable | 735 | (728 | ) | (498 | ) | (491 | ) | |||||||||
| Long-term debt | 688 | (502 | ) | (5,171 | ) | (4,985 | ) | |||||||||
| Other long-term liabilities | (292 | ) | (346 | ) | (1,021 | ) | (1,659 | ) | ||||||||
| Deferred taxation | 13 | (1,214 | ) | (4,272 | ) | (5,473 | ) | |||||||||
| Other provisions | (434 | ) | (619 | ) | (2,545 | ) | (3,598 | ) | ||||||||
| Other items | (196 | ) | (347 | ) | 558 | 15 | ||||||||||
| Distributions to Parent Companies | 1,526 | (578 | ) | – | 948 | |||||||||||
| Adjustment for Parent Companies’ shares and Other comprehensive income excluding currency translation differences | 864 | 1,675 | (20 | ) | ||||||||||||
| – | ||||||||||||||||
| Movement in retained earnings of | ||||||||||||||||
| Group companies (Note 4) | 4,221 | |||||||||||||||
| Movement in cumulative currency | ||||||||||||||||
| translation differences (Note 5) | 2,432 | |||||||||||||||
| Movement in net assets (Note 4) | 4,134 | |||||||||||||||
Income taxes paid by Group companies totalled $6.7 billion in 2002 (2001: $9.3 billion; 2000: $8.8 billion). Interest paid by Group companies was $1.0 billion in 2002 (2001: $0.7 billion; 2000: $0.9 billion).
The main non-cash movements reflect the assets acquired and liabilities assumed resulting from major acquisitions during the year (see Note 10).
G 26 Royal Dutch/ Shell Group of Companies
20-F/A (Amendment No. 2) 2002
Table of Contents
| 20 | Employee retirement plans and other postretirement benefits |
Retirement plans are provided for permanent employees of all major Group companies. The nature of such plans varies according to the legal and fiscal requirements and economic conditions of the country in which the employees are engaged. Generally, the plans provide defined benefits based on employees’ years of service and average final remuneration.
Some Group companies have established unfunded defined benefit plans to provide certain postretirement health care and life insurance benefits to their retirees, the entitlement to which is usually based on the employee remaining in service up to retirement age and the completion of a minimum service period.
Plan assets principally comprise marketable securities and property holdings.
| $ million | |||||||||||||||||||||||||||||||||
| Pension benefits | Other benefits | ||||||||||||||||||||||||||||||||
| 2002 | 2001 | 2002 | 2001 | ||||||||||||||||||||||||||||||
| USA | Other | Total | USA | Other | Total | ||||||||||||||||||||||||||||
Change in benefit obligation | |||||||||||||||||||||||||||||||||
| Obligations for benefits based on employee service to date at January 1 | 32,239 | 31,420 | 906 | 344 | 1,250 | 838 | 262 | 1,100 | |||||||||||||||||||||||||
| Increase in present value of the obligation for benefits based on employee service during the year | 899 | 681 | 32 | 7 | 39 | 10 | 3 | 13 | |||||||||||||||||||||||||
| Interest on the obligation for benefits in respect of employee service in previous years | 2,001 | 1,784 | 111 | 21 | 132 | 61 | 15 | 76 | |||||||||||||||||||||||||
| Benefit payments made | (1,780 | ) | (1,559 | ) | (72 | ) | (21 | ) | (93 | ) | (52 | ) | (18 | ) | (70 | ) | |||||||||||||||||
| Currency translation effects | 3,938 | (1,071 | ) | – | 45 | 45 | – | (14 | ) | (14 | ) | ||||||||||||||||||||||
Other componentsa | 1,812 | 984 | 1,091 | (19 | ) | 1,072 | 49 | 96 | 145 | ||||||||||||||||||||||||
| Obligations for benefits based on employee service to date at December 31b | 39,109 | 32,239 | 2,068 | 377 | 2,445 | 906 | 344 | 1,250 | |||||||||||||||||||||||||
Change in plan assets | |||||||||||||||||||||||||||||||||
| Plan assets held in trust at fair value at January 1 | 36,420 | 42,333 | |||||||||||||||||||||||||||||||
| Actual return on plan assets | (5,943 | ) | (3,420 | ) | |||||||||||||||||||||||||||||
| Employer contributions | 227 | 173 | |||||||||||||||||||||||||||||||
| Plan participants’ contributions | 17 | 11 | |||||||||||||||||||||||||||||||
| Benefit payments made | (1,780 | ) | (1,559 | ) | |||||||||||||||||||||||||||||
| Currency translation effects | 3,709 | (1,407 | ) | ||||||||||||||||||||||||||||||
Other componentsa | 385 | 289 | |||||||||||||||||||||||||||||||
Plan assets held in trust at fair value at December 31b | 33,035 | 36,420 | |||||||||||||||||||||||||||||||
| Plan assets in excess of/(less than) the present value of obligations for benefits at December 31 | (6,074 | ) | 4,181 | (2,068 | ) | (377 | ) | (2,445 | ) | (906 | ) | (344 | ) | (1,250 | ) | ||||||||||||||||||
| Unrecognised net (gains)/losses remaining from the adoption of current method of determining pension costs | 9 | (62 | ) | ||||||||||||||||||||||||||||||
| Unrecognised net (gains)/losses since adoption | 9,125 | (1,334 | ) | 692 | 93 | 785 | 61 | 105 | 166 | ||||||||||||||||||||||||
| Unrecognised prior service cost/(credit) | 1,254 | 1,016 | (26 | ) | – | (26 | ) | (4 | ) | (1 | ) | (5 | ) | ||||||||||||||||||||
| Net amount recognised | 4,314 | 3,801 | (1,402 | ) | (284 | ) | (1,686 | ) | (849 | ) | (240 | ) | (1,089 | ) | |||||||||||||||||||
| Amounts recognised in the Statement of Assets and Liabilities: | |||||||||||||||||||||||||||||||||
| Intangible assets | 420 | – | |||||||||||||||||||||||||||||||
| Prepaid benefit costs | 4,506 | 4,714 | |||||||||||||||||||||||||||||||
| Accrued benefit liabilities: | |||||||||||||||||||||||||||||||||
| Short-term | (177 | ) | (125 | ) | (51 | ) | (22 | ) | (73 | ) | (51 | ) | (17 | ) | (68 | ) | |||||||||||||||||
| Long-term | (3,403 | ) | (1,310 | ) | (1,351 | ) | (262 | ) | (1,613 | ) | (798 | ) | (223 | ) | (1,021 | ) | |||||||||||||||||
| Amount recognised in Parent Companies’ Interest in Group Net Assets: | |||||||||||||||||||||||||||||||||
| Accumulated other comprehensive income | 2,968 | 522 | |||||||||||||||||||||||||||||||
| Net amount recognised | 4,314 | 3,801 | (1,402 | ) | (284 | ) | (1,686 | ) | (849 | ) | (240 | ) | (1,089 | ) | |||||||||||||||||||
| a | Other components comprise mainly the effect of acquisitions and changes in actuarial assumptions. |
| b | For employee retirement plans with benefit obligation in excess of plan assets, the respective amounts at December 31, 2002 were benefit obligations of $25,698 million (2001: $1,627 million) and plan assets of $21,072 million (2001: $1,222 million). The obligation for pension benefits at December 31, 2002 in respect of unfunded plans was $1,964 million (2001: $1,175 million). |
Royal Dutch/Shell Group of Companies G 27
20-F/A (Amendment No. 2) 2002
Table of Contents
| 20 | Employee retirement plans and other postretirement benefits continued |
Benefit costs for the year comprise:
| $ million | ||||||||||||||||||||||||||||||||||||||||||||||||
| Pension benefits | Other benefits | |||||||||||||||||||||||||||||||||||||||||||||||
| 2002 | 2001 | 2000 | 2002 | 2001 | 2000 | |||||||||||||||||||||||||||||||||||||||||||
| USA | Other | Total | USA | Other | Total | USA | Other | Total | ||||||||||||||||||||||||||||||||||||||||
| Service cost | 899 | 681 | 681 | 32 | 7 | 39 | 10 | 3 | 13 | 10 | 4 | 14 | ||||||||||||||||||||||||||||||||||||
| Interest cost | 2,001 | 1,784 | 1,700 | 111 | 21 | 132 | 61 | 15 | 76 | 61 | 16 | 77 | ||||||||||||||||||||||||||||||||||||
| Expected return on plan assets | (3,339 | ) | (3,005 | ) | (2,839 | ) | ||||||||||||||||||||||||||||||||||||||||||
| Other components | (100 | ) | (216 | ) | (284 | ) | 76 | 7 | 83 | (2 | ) | 2 | – | (3 | ) | 2 | (1 | ) | ||||||||||||||||||||||||||||||
| Cost of defined benefit plans | (539 | ) | (756 | ) | (742 | ) | 219 | 35 | 254 | 69 | 20 | 89 | 68 | 22 | 90 | |||||||||||||||||||||||||||||||||
| Payments to defined contribution plans | 84 | 87 | 75 | |||||||||||||||||||||||||||||||||||||||||||||
| (455 | ) | (669 | ) | (667 | ) | 219 | 35 | 254 | 69 | 20 | 89 | 68 | 22 | 90 | ||||||||||||||||||||||||||||||||||
Discount rates, projected rates of remuneration growth and expected rates of return on plan assets vary for the different plans as they are determined in the light of local conditions. The weighted averages applicable for the principal plans in the Group are:
| Pension benefits | Other benefits | |||||||||||||||||||||||
| 2002 | 2001 | 2002 | 2001 | |||||||||||||||||||||
| USA | Other | USA | Other | |||||||||||||||||||||
| Discount rate | 5.9% | 6.0% | 6.5% | 5.6% | 7.0% | 6.0% | ||||||||||||||||||
| Projected rate of remuneration growth | 4.0% | 4.0% | ||||||||||||||||||||||
| Expected rate of return on plan assets | 8.0% | 7.8% | ||||||||||||||||||||||
| Health care cost trend rate in year after reporting year | 7.8% | 4.6% | 6.5% | 4.7% | ||||||||||||||||||||
| Ultimate health care cost trend rate | 5.0% | 2.9% | 5.0% | 2.9% | ||||||||||||||||||||
| Year ultimate health care cost trend rate is applicable | 2010 | 2004 | 2005 | 2003 | ||||||||||||||||||||
The effect of a one percentage point increase/(decrease) in the annual rate of increase in the assumed health care cost trend rates would be to increase/(decrease) annual postretirement benefit cost by approximately $27 million/($24 million) and the accumulated postretirement benefit obligation by approximately $341 million/($287 million).
21 Employee emoluments and numbers
(a) Emoluments
| $ million | ||||||||||||
| 2002 | 2001 | 2000 | ||||||||||
| Remuneration | 6,096 | 4,651 | 4,560 | |||||||||
| Social law taxes | 518 | 395 | 390 | |||||||||
| Pensions and similar obligations (Note 20) | (201 | ) | (580 | ) | (577 | ) | ||||||
| 6,413 | 4,466 | 4,373 | ||||||||||
(b) Average numbers
| thousands | ||||||||||||
| 2002 | 2001 | 2000 | ||||||||||
| Exploration and Production | 17 | 14 | 13 | |||||||||
| Gas & Power | 2 | 2 | 2 | |||||||||
| Oil Products | 75 | 58 | 58 | |||||||||
| Chemicals | 9 | 9 | 14 | |||||||||
| Corporate and Other | 8 | 7 | 8 | |||||||||
| 111 | 90 | 95 | ||||||||||
G 28 Royal Dutch/ Shell Group of Companies
20-F/A (Amendment No. 2) 2002
Table of Contents
(c) Year-end numbers
| thousands | ||||||||||||
| 2002 | 2001 | 2000 | ||||||||||
| Exploration and Production | 17 | 15 | 13 | |||||||||
| Gas & Power | 2 | 2 | 2 | |||||||||
| Oil Products | 80 | 58 | 58 | |||||||||
| Chemicals | 9 | 9 | 10 | |||||||||
| Corporate and Other | 8 | 7 | 7 | |||||||||
| 116 | 91 | 90 | ||||||||||
In addition to remuneration above, there were charges for redundancy of $215 million in 2002 (2001: $110 million; 2000: $120 million).
The liabilities for redundancies at December 31, 2002 totalled $395 million (2001: $222 million; 2000: $300 million), including $98 million remaining from liabilities assumed on acquisitions in 2002.
Royal Dutch/Shell Group of Companies G 29
20-F/A (Amendment No. 2) 2002
Table of Contents
22 Stock-based compensation plans and Parent Companies’ shares held by Group companies
Stock-based compensation plans
Certain Group companies have in place various stock-based plans for senior staff and other employees of those and other Group companies. Details of the principal plans are given below.
The Group Stock Option Plans offer eligible employees options over Royal Dutch ordinary shares (Royal Dutch shares) or Shell Transport Ordinary shares (Shell Transport shares) at a price not less than the fair market value of the shares at the date the options were granted. The options are exercisable three years from grant, except for those granted under the US plans, which vest a third per year for three years. The options lapse ten years after grant, however leaving Group employment may cause options to lapse earlier.
Under the Restricted Stock Plan, grants are made on a highly selective basis to senior staff. A maximum of 250,000 Royal Dutch shares (or equivalent value in Shell Transport shares) can be granted under the plan in any year. Shares are granted subject to a three-year restriction period and the number of shares awarded is based on the share price at the start of the restricted period. The shares, together with additional shares equivalent to the value of the dividends payable over the restriction period, are released to the individual at the end of the three-year period.
The following table shows for 2001 and 2002, in respect of option plans, the number of shares under option at the beginning of the year, the number of options granted, exercised and expired during the year and the number of shares under option at the end of the year, together with their weighted average exercise price translated at the respective year-end exchange rates:
| Royal Dutch shares | Shell Transport shares | Shell Canada common sharesa | ||||||||||||||||||||||
| Weighted | Weighted | Weighted | ||||||||||||||||||||||
| average | average | average | ||||||||||||||||||||||
| exercise | exercise | exercise | ||||||||||||||||||||||
| Number | price | Number | price | Number | price | |||||||||||||||||||
| (thousands) | ($) | (thousands) | ($) | (thousands) | ($) | |||||||||||||||||||
| Under option at 1 January, 2001 | 10,214 | 47.86 | 41,937 | 6.34 | 2,560 | 15.81 | ||||||||||||||||||
| Granted | 11,302 | 59.24 | 30,601 | 8.33 | 1,311 | 22.95 | ||||||||||||||||||
| Exercised | (886 | ) | 34.23 | (6,882 | ) | 5.21 | (240 | ) | 13.59 | |||||||||||||||
| Expired | (229 | ) | 41.65 | (644 | ) | 5.97 | (15 | ) | 20.13 | |||||||||||||||
| Under option at December 31, 2001 | 20,401 | 54.10 | 65,012 | 7.30 | 3,616 | 17.89 | ||||||||||||||||||
| Granted | 13,792 | 59.71 | 39,210 | 8.45 | 1,567 | 28.36 | ||||||||||||||||||
| Exercised | (180 | ) | 47.12 | (796 | ) | 6.21 | (394 | ) | 14.45 | |||||||||||||||
| Expired | (632 | ) | 54.50 | (1,979 | ) | 7.53 | (12 | ) | 25.21 | |||||||||||||||
| Under option at December 31, 2002 | 33,381 | 59.86 | 101,447 | 8.26 | 4,777 | 21.71 | ||||||||||||||||||
| a | Unissued. |
The following tables provide further information about the options outstanding at December 31, 2002:
| Royal Dutch shares | ||||||||||||||||||||
| Options outstanding | Options exercisable | |||||||||||||||||||
| Weighted | ||||||||||||||||||||
| average | Weighted | Weighted | ||||||||||||||||||
| remaining | average | average | ||||||||||||||||||
| contractual | exercise | exercise | ||||||||||||||||||
| Number | life | price | Number | price | ||||||||||||||||
| Range of exercise prices | (thousands) | (years) | ($) | (thousands) | ($) | |||||||||||||||
| $40 to $45 | 2,062 | 5.3 | 42.98 | 1,873 | 43.07 | |||||||||||||||
| $45 to $50 | 11 | 8.8 | 47.98 | 4 | 47.98 | |||||||||||||||
| $50 to $55 | 10,231 | 7.9 | 53.46 | 2,784 | 51.75 | |||||||||||||||
| $55 to $60 | 814 | 7.7 | 56.92 | 425 | 56.44 | |||||||||||||||
| $60 to $65 | 14,263 | 8.5 | 62.74 | 1,195 | 60.77 | |||||||||||||||
| $65 to $70 | 2,637 | 7.8 | 65.51 | – | – | |||||||||||||||
| $70 to $75 | 3,363 | 8.3 | 73.79 | – | – | |||||||||||||||
| $40 to $75 | 33,381 | 8.0 | 59.86 | 6,281 | 51.19 | |||||||||||||||
G 30 Royal Dutch/ Shell Group of Companies
20-F/A (Amendment No. 2) 2002
Table of Contents
| 22 | Stock-based compensation plans and Parent Companies’ shares held by Group companies continued |
| Shell Transport shares | ||||||||||||||||||||
| Weighted | ||||||||||||||||||||
| average | Weighted | Weighted | ||||||||||||||||||
| remaining | average | average | ||||||||||||||||||
| contractual | exercise | exercise | ||||||||||||||||||
| Number | life | price | Number | price | ||||||||||||||||
| Range of exercise prices | (thousands) | (years) | ($) | (thousands) | ($) | |||||||||||||||
| $5 to $6 | 11,511 | 4.9 | 5.84 | 11,511 | 5.84 | |||||||||||||||
| $6 to $7 | 512 | 9.8 | 6.47 | – | – | |||||||||||||||
| $7 to $8 | 7,384 | 3.9 | 7.06 | 7,384 | 7.06 | |||||||||||||||
| $8 to $9 | 69,252 | 8.3 | 8.51 | – | – | |||||||||||||||
| $9 to $10 | 12,788 | 5.9 | 9.84 | – | – | |||||||||||||||
| $5 to $10 | 101,447 | 7.3 | 8.26 | 18,895 | 6.32 | |||||||||||||||
In the UK, The Shell Petroleum Company Limited and Shell Petroleum N.V. each operate a savings-related stock option scheme, under which options are granted over shares of Shell Transport at prices not less than the market value on a date not more than 30 days before the date of the grant of option and are normally exercisable after completion of a three-year or five-year contractual savings period. The following table shows for 2001 and 2002, in respect of these plans, the number of Shell Transport shares under option at the beginning of the year, the number of options granted, exercised and expired during the year and the number of shares under option at the end of the year:
| thousands | ||||||||
| 2002 | 2001 | |||||||
| Under option at 1 January | 17,549 | 19,538 | ||||||
| Granted | 6,898 | 4,291 | ||||||
| Exercised | (4,911 | ) | (4,818 | ) | ||||
| Expired | (856 | ) | (1,462 | ) | ||||
| Under option at December 31 | 18,680 | 17,549 | ||||||
In 2001, the Global Employee Share Purchase Plan was implemented giving eligible employees the opportunity to buy Royal Dutch or Shell Transport shares, with 15% added after a specified holding period. At December 31, 2002, 3,310 (2001: 25,990) Royal Dutch shares and 14,578 (2001: 77,627) Shell Transport shares were held by Group companies in connection with the Global Employee Share Purchase Plan.
Effects on Group net income and Earnings per share under the fair value method
A comparison of the Group’s net income and Earnings per share for both Royal Dutch and Shell Transport as reported under the intrinsic value method and on a pro forma basis calculated as if the fair value of options and share purchase rights granted would have been considered as compensation expense is as follows:
| 2002 | 2001 | 2000 | ||||||||||||||||||||||
| As restated | As restated | As restated | ||||||||||||||||||||||
| (see | (see | (see | ||||||||||||||||||||||
| Note 2(a)) | Pro forma | Note 2(a)) | Pro forma | Note 2(a)) | Pro forma | |||||||||||||||||||
| Group net income ($ million) | 9,656 | 9,453 | 10,301 | 10,192 | 12,813 | 12,781 | ||||||||||||||||||
| Basic earnings per share attributable to Royal Dutch ($) | 2.82 | 2.76 | 2.95 | 2.92 | 3.61 | 3.60 | ||||||||||||||||||
| Diluted earnings per share attributable to Royal Dutch ($) | 2.81 | 2.76 | 2.95 | 2.92 | 3.61 | 3.60 | ||||||||||||||||||
| Basic earnings per ADR attributable to Shell Transport ($) | 2.41 | 2.36 | 2.53 | 2.51 | 3.11 | 3.10 | ||||||||||||||||||
| Diluted earnings per ADR attributable to Shell Transport ($) | 2.41 | 2.36 | 2.53 | 2.50 | 3.11 | 3.10 | ||||||||||||||||||
The fair value of the Group’s 2002 option grants was estimated using a Black-Scholes option pricing model and the following assumptions for US dollar, euro and sterling denominated options respectively: risk-free interest rates of 4.6, 4.9 and 5.3 percent; dividend yield of 2.8, 2.7 and 2.8 percent; volatility of 31.2, 30.1 and 32.6 percent and expected lives of five years.
Parent Companies’ shares held by Group companies
Group companies purchase shares of the Parent Companies in the open market with the purpose of covering their future obligations arising from the stock options granted to their employees and employees of other Group companies. At December 31, 2002, 29.9 million Royal Dutch shares (2001: 17.4 million) and 111.1 million Shell Transport shares (2002: 80.4 million) were held by Group companies.
Royal Dutch/Shell Group of Companies G 31
20-F/A (Amendment No. 2) 2002
Table of Contents
| 22 | Stock-based compensation plans and Parent Companies’ shares held by Group companies continued |
In connection with other incentive compensation plans linked to the appreciation in value of Royal Dutch and of Shell Transport shares, 9.2 million Royal Dutch shares and 0.4 million Shell Transport shares were held by Group companies at December 31, 2002 and 2001. In addition, 33,600 shares of Royal Dutch were held by Group companies at December 31, 2002 and 2001.
The carrying amount of these and all Parent Company shares held in connection with the stock-based compensation plans at December 31, 2002 is $2,797 million (2001: $1,953 million).
| 23 | Decommissioning and restoration costs |
For the purposes of calculating provisions for decommissioning and restoration costs, estimated total ultimate liabilities of $5.2 billion at December 31, 2002 (2001: $4.3 billion) were used. Such estimates are subject to various regulatory and technological developments.
New US accounting standard FAS 143 (Asset Retirement Obligations) requires that an entity shall recognise the discounted ultimate liability for an asset retirement obligation in the period in which it is incurred together with an offsetting asset. This standard was effective for the Group from 2003 and the amount of the transition adjustment was a credit to income of $0.3 billion after tax.
| 24 | Information by geographical area and by industry segment |
(a) Geographical area (as restated)
| $ million | ||||||||||||||||||||||||
| 2002 | 2001 | 2000 | ||||||||||||||||||||||
| Net | Fixed | Net | Fixed | Net | Fixed | |||||||||||||||||||
| proceeds | assets | proceeds | assets | proceeds | assets | |||||||||||||||||||
| Europe | 65,073 | 36,516 | 62,259 | 19,131 | 68,060 | 22,011 | ||||||||||||||||||
| Other Eastern Hemisphere | 33,322 | 28,492 | 31,866 | 26,228 | 34,144 | 22,550 | ||||||||||||||||||
| USA | 62,632 | 27,266 | 21,095 | 17,849 | 26,089 | 16,517 | ||||||||||||||||||
| Other Western Hemisphere | 18,288 | 11,869 | 19,911 | 9,805 | 20,760 | 8,920 | ||||||||||||||||||
Total Group | 179,315 | 104,143 | 135,131 | 73,013 | 149,053 | 69,998 | ||||||||||||||||||
G 32 Royal Dutch/ Shell Group of Companies
20-F/A (Amendment No. 2) 2002
Table of Contents
| 24 | Information by geographical area and by industry segmentcontinued |
(b) Industry segment
| 2002 (as restated) | $ million | ||||||||||||||||||||||||
| Exploration | |||||||||||||||||||||||||
| Total | and | Gas & | Oil | Corporate | |||||||||||||||||||||
| Group | Production | Power | Products | Chemicals | and Other | ||||||||||||||||||||
| Sales | |||||||||||||||||||||||||
| third parties | 179,315 | 11,901 | 16,992 | 135,544 | 14,125 | 753 | |||||||||||||||||||
| inter-segment | 14,680 | 620 | 3,080 | 1,082 | 17 | ||||||||||||||||||||
Net proceeds | 26,581 | 17,612 | 138,624 | 15,207 | 770 | ||||||||||||||||||||
| Operating profit/(loss) | |||||||||||||||||||||||||
| Group companies | 15,386 | 12,097 | 107 | 3,188 | 438 | (444 | ) | ||||||||||||||||||
| Group share of associated companies | 2,816 | 1,316 | 751 | 556 | 213 | (20 | ) | ||||||||||||||||||
| 18,202 | 13,413 | 858 | 3,744 | 651 | (464 | ) | |||||||||||||||||||
| Interest and other income | 758 | 98 | 118 | 14 | 3 | 525 | |||||||||||||||||||
| Interest expense | 1,364 | 1,364 | |||||||||||||||||||||||
| Currency exchange gains/(losses) | (23 | ) | (26 | ) | 6 | (64 | ) | (16 | ) | 77 | |||||||||||||||
| Taxation | 7,742 | 6,759 | 208 | 1,067 | 73 | (365 | ) | ||||||||||||||||||
| Income applicable to minority interests | 175 | ||||||||||||||||||||||||
Net income | 9,656 | 6,726 | 774 | 2,627 | 565 | (861 | ) | ||||||||||||||||||
Total assets at December 31 | 153,131 | 56,988 | 16,057 | 60,549 | 14,172 | 5,365 | |||||||||||||||||||
Total liabilities at December 31 | (89,287 | ) | (45,191 | ) | (12,223 | ) | (41,826 | ) | (7,903 | ) | 17,856 | ||||||||||||||
Tangible fixed assets at December 31 | |||||||||||||||||||||||||
| Cost | 157,499 | 93,333 | 2,843 | 47,689 | 12,010 | 1,624 | |||||||||||||||||||
| Depreciation | (79,136 | ) | (47,076 | ) | (763 | ) | (23,926 | ) | (6,711 | ) | (660 | ) | |||||||||||||
Goodwill at December 31 | 2,324 | – | 184 | 1,989 | 22 | 129 | |||||||||||||||||||
Investments in associated companies at December 31 | 17,945 | 3,591 | 4,679 | 5,344 | 4,154 | 177 | |||||||||||||||||||
| Capital expenditure, acquisitions and new investments in associated companies | 23,651 | 13,155 | 952 | 7,968 | 998 | 578 | |||||||||||||||||||
Depreciation, depletion and amortisation charge | |||||||||||||||||||||||||
| Impairment | 197 | 33 | 4 | 111 | 29 | 20 | |||||||||||||||||||
| Other | 8,542 | 5,658 | 124 | 2,295 | 372 | 93 | |||||||||||||||||||
| 2001 (as restated) | $ million | ||||||||||||||||||||||||
| Exploration | |||||||||||||||||||||||||
| Total | and | Gas & | Oil | Corporate | |||||||||||||||||||||
| Group | Production | Power | Products | Chemicals | and Other | ||||||||||||||||||||
| Sales | |||||||||||||||||||||||||
| third parties | 135,131 | 12,057 | 15,721 | 93,517 | 13,260 | 576 | |||||||||||||||||||
| inter-segment | 13,790 | 705 | 2,108 | 990 | 2 | ||||||||||||||||||||
Net proceeds | 25,847 | 16,426 | 95,625 | 14,250 | 578 | ||||||||||||||||||||
| Operating profit/(loss) | |||||||||||||||||||||||||
| Group companies | 16,447 | 14,050 | 538 | 2,481 | (34 | ) | (588 | ) | |||||||||||||||||
| Group share of associated companies | 2,644 | 1,548 | 941 | 241 | (27 | ) | (59 | ) | |||||||||||||||||
| 19,091 | 15,598 | 1,479 | 2,722 | (61 | ) | (647 | ) | ||||||||||||||||||
| Interest and other income | 1,059 | 52 | 128 | (12 | ) | 2 | 889 | ||||||||||||||||||
| Interest expense | 1,133 | 1,133 | |||||||||||||||||||||||
| Currency exchange gains/(losses) | (30 | ) | (4 | ) | 4 | (50 | ) | (6 | ) | 26 | |||||||||||||||
| Taxation | 8,360 | 7,735 | 385 | 690 | (192 | ) | (258 | ) | |||||||||||||||||
| Income applicable to minority interests | 326 | ||||||||||||||||||||||||
Net income | 10,301 | 7,911 | 1,226 | 1,970 | 127 | (607 | ) | ||||||||||||||||||
Total assets at December 31 | 111,446 | 39,270 | 11,815 | 38,007 | 12,145 | 10,209 | |||||||||||||||||||
Total liabilities at December 31 | (51,838 | ) | (23,895 | ) | (7,277 | ) | (21,367 | ) | (6,383 | ) | 7,084 | ||||||||||||||
Tangible fixed assets at December 31 | |||||||||||||||||||||||||
| Cost | 117,543 | 68,572 | 2,275 | 34,577 | 10,782 | 1,337 | |||||||||||||||||||
| Depreciation | (66,822 | ) | (39,025 | ) | (679 | ) | (20,449 | ) | (6,064 | ) | (605 | ) | |||||||||||||
Goodwill at December 31 | 365 | – | 189 | 154 | 22 | – | |||||||||||||||||||
Investments in associated companies at December 31 | 18,331 | 3,462 | 4,614 | 6,384 | 3,740 | 131 | |||||||||||||||||||
| Capital expenditure and new investments in associated companies | 10,672 | 7,136 | 908 | 1,527 | 760 | 341 | |||||||||||||||||||
Depreciation, depletion and amortisation charge | |||||||||||||||||||||||||
| Impairment | 88 | 8 | (8 | ) | (4 | ) | 40 | 52 | |||||||||||||||||
| Other | 6,207 | 4,004 | 114 | 1,621 | 364 | 104 | |||||||||||||||||||
Royal Dutch/Shell Group of Companies G 33
20-F/A (Amendment No. 2) 2002
Table of Contents
| 2000 (as restated) | $ million | ||||||||||||||||||||||||
| Exploration | |||||||||||||||||||||||||
| Total | and | Gas & | Oil | Corporate & | |||||||||||||||||||||
| Group | Production | Power | Products | Chemicals | Other | ||||||||||||||||||||
| Sales | |||||||||||||||||||||||||
| third parties | 149,053 | 13,375 | 15,991 | 104,002 | 15,205 | 480 | |||||||||||||||||||
| inter-segment | 14,195 | 496 | 2,280 | 1,102 | – | ||||||||||||||||||||
Net proceeds | 27,570 | 16,487 | 106,282 | 16,307 | 480 | ||||||||||||||||||||
| Operating profit/(loss) | |||||||||||||||||||||||||
| Group companies | 20,520 | 17,355 | (360 | ) | 2,931 | 939 | (345 | ) | |||||||||||||||||
| Group share of associated companies | 4,099 | 2,005 | 646 | 1,232 | 240 | (24 | ) | ||||||||||||||||||
| 24,619 | 19,360 | 286 | 4,163 | 1,179 | (369 | ) | |||||||||||||||||||
| Interest and other income | 974 | 15 | 83 | 92 | 6 | 778 | |||||||||||||||||||
| Interest expense | 1,324 | 1,324 | |||||||||||||||||||||||
| Currency exchange gains/(losses) | (114 | ) | 8 | 6 | (35 | ) | 9 | (102 | ) | ||||||||||||||||
| Taxation | 11,295 | 9,512 | 263 | 1,539 | 161 | (180 | ) | ||||||||||||||||||
| Income applicable to minority interests | 47 | ||||||||||||||||||||||||
Net income | 12,813 | 9,871 | 112 | 2,681 | 1,033 | (837 | ) | ||||||||||||||||||
Total assets at December 31 | 123,312 | 35,698 | 17,766 | 42,885 | 13,236 | 13,727 | |||||||||||||||||||
Total liabilities at December 31 | (62,799 | ) | (19,495 | ) | (13,902 | ) | (23,880 | ) | (5,688 | ) | 166 | ||||||||||||||
Tangible fixed assets at December 31 | |||||||||||||||||||||||||
| Cost | 111,408 | 60,828 | 2,473 | 35,656 | 11,250 | 1,201 | |||||||||||||||||||
| Depreciation | (64,540 | ) | (36,091 | ) | (755 | ) | (20,675 | ) | (6,480 | ) | (539 | ) | |||||||||||||
Goodwill at December 31 | 417 | – | 208 | 170 | 39 | – | |||||||||||||||||||
Investments in associated companies at December 31 | 19,362 | 4,213 | 3,929 | 7,253 | 3,899 | 68 | |||||||||||||||||||
Capital expenditure and new investments in associated companies | 7,289 | 3,913 | 768 | 1,457 | 977 | 174 | |||||||||||||||||||
Depreciation, depletion and amortisation charge | |||||||||||||||||||||||||
| Impairment | 1,785 | 105 | 697 | 824 | 104 | 55 | |||||||||||||||||||
| Other | 6,345 | 3,709 | 144 | 1,766 | 620 | 106 | |||||||||||||||||||
G 34 Royal Dutch/ Shell Group of Companies
20-F/A (Amendment No. 2) 2002
Table of Contents
| 25 | Oil and gas exploration and production activities |
(a) Capitalised costs
The aggregate amount of tangible and intangible fixed assets of Group companies relating to oil and gas exploration and production activities and the aggregate amount of the related depreciation, depletion and amortisation at December 31 are shown in the table below:
| $ million | ||||||||||||
| 2002a | 2001a | 2000a | ||||||||||
| As restated | As restated | As restated | ||||||||||
Cost | ||||||||||||
| Proved properties | 83,964 | 63,115 | 56,983 | |||||||||
| Unproved properties | 4,768 | 2,430 | 1,746 | |||||||||
| Support equipment and facilities | 2,352 | 1,718 | 1,586 | |||||||||
| 91,084 | 67,263 | 60,315 | ||||||||||
Depreciation | ||||||||||||
| Proved properties | 45,525 | 37,761 | 34,917 | |||||||||
| Unproved properties | 325 | 212 | 141 | |||||||||
| Support equipment and facilities | 1,224 | 1,051 | 1,032 | |||||||||
| 47,074 | 39,024 | 36,090 | ||||||||||
Net capitalised costs | 44,010 | 28,239 | 24,225 | |||||||||
Oil sands: net capitalised costs | 2,246 | 1,309 | 513 | |||||||||
| a Includes the impact of reclassifications between asset classes. | ||||||||||||
| The Group share of associated companies’ net capitalised costswas $3,173 million at December 31, 2002 (2001: $2,924 million; 2000: $3,791 million). |
(b) Costs incurred
Costs incurred by Group companies during the year in oil and gas property acquisition, exploration and development activities, whether capitalised or charged to income currently, are shown in the table below. Development costs exclude costs of acquiring support equipment and facilities, but include depreciation thereon.
| 2002 | $ million | ||||||||||||||||||||||||||||
| Eastern Hemisphere | Western Hemisphere | ||||||||||||||||||||||||||||
| Middle | |||||||||||||||||||||||||||||
| East, | |||||||||||||||||||||||||||||
| Asia | Russia, | Total | |||||||||||||||||||||||||||
| Europe | Africa | Pacific | CIS | USA | Other | ||||||||||||||||||||||||
| Acquisition of properties | |||||||||||||||||||||||||||||
| Proved | 3,776 | – | – | 122 | 565 | 801 | 5,264 | ||||||||||||||||||||||
| Unproved | 1,693 | 53 | – | 3 | 368 | 412 | 2,529 | ||||||||||||||||||||||
| Exploration | 217 | 279 | 115 | 170 | 328 | 182 | 1,291 | ||||||||||||||||||||||
Developmenta | |||||||||||||||||||||||||||||
| Excluding oil sands | 1,605 | 1,370 | 442 | 685 | 1,465 | 407 | 5,974 | ||||||||||||||||||||||
| Oil sands | 931 | 931 | |||||||||||||||||||||||||||
| 2001 | $ million | ||||||||||||||||||||||||||||
| Eastern Hemisphere | Western Hemisphere | ||||||||||||||||||||||||||||
| Middle | |||||||||||||||||||||||||||||
| East, | |||||||||||||||||||||||||||||
| Asia | Russia, | Total | |||||||||||||||||||||||||||
| Europe | Africa | Pacific | CIS | USA | Other | ||||||||||||||||||||||||
| Acquisition of properties | |||||||||||||||||||||||||||||
| Proved | 5 | – | 839 | 82 | 290 | 9 | 1,225 | ||||||||||||||||||||||
| Unproved | 23 | 61 | 162 | 91 | 157 | (19 | ) | 475 | |||||||||||||||||||||
| Exploration | 114 | 163 | 119 | 203 | 303 | 203 | 1,105 | ||||||||||||||||||||||
Developmenta | |||||||||||||||||||||||||||||
| Excluding oil sands | 852 | 992 | 449 | 289 | 1,214 | 230 | 4,026 | ||||||||||||||||||||||
| Oil sands | 847 | 847 | |||||||||||||||||||||||||||
| a Includes the impact of reclassifications between geographical regions and cost categories. | |||||||||||||||||||||||||||||
Royal Dutch/Shell Group of Companies G 35
20-F/A (Amendment No. 2) 2002
Table of Contents
| 2000 | $ million | ||||||||||||||||||||||||||||
| Eastern Hemisphere | Western Hemisphere | ||||||||||||||||||||||||||||
| Middle | |||||||||||||||||||||||||||||
| East, | |||||||||||||||||||||||||||||
| Asia | Russia, | Total | |||||||||||||||||||||||||||
| Europe | Africa | Pacific | CIS | USA | Other | ||||||||||||||||||||||||
| Acquisition of properties | |||||||||||||||||||||||||||||
| Proved | 1 | 69 | – | 70 | |||||||||||||||||||||||||
| Unproved | 4 | 82 | 36 | 34 | 57 | 213 | |||||||||||||||||||||||
| Exploration | 79 | 113 | 170 | 138 | 305 | 115 | 920 | ||||||||||||||||||||||
Developmenta | |||||||||||||||||||||||||||||
| Excluding oil sands | 834 | 554 | 290 | 297 | 809 | 169 | 2,953 | ||||||||||||||||||||||
| Oil Sands | 406 | 406 | |||||||||||||||||||||||||||
| a Includes the impact of reclassifications between geographical regions and cost categories. | |||||||||||||||||||||||||||||
| The Group share of associated companies’ costs incurredwas $551 million in 2002 (2001: $415 million; 2000: $227 million). |
G 36 Royal Dutch/ Shell Group of Companies
20-F/A (Amendment No. 2) 2002
Table of Contents
(c) Earnings
Earnings of Group companies from exploration and production activities are given in the table below. Certain purchases of traded product are netted into sales.
| 2002 (as restated) | $ million | ||||||||||||||||||||||||||||
| Western | |||||||||||||||||||||||||||||
| Eastern Hemisphere | Hemisphere | ||||||||||||||||||||||||||||
| Middle | |||||||||||||||||||||||||||||
| East, | |||||||||||||||||||||||||||||
| Asia | Russia, | Total | |||||||||||||||||||||||||||
| Europe | Africa | Pacific | CIS | USA | Other | ||||||||||||||||||||||||
| Sales | |||||||||||||||||||||||||||||
| third parties | 5,472 | 73 | 969 | 1,764 | 1,997 | 892 | 11,167 | ||||||||||||||||||||||
| intra-group | 4,572 | 2,538 | 1,186 | 3,087 | 2,863 | 433 | 14,679 | ||||||||||||||||||||||
| Net proceeds | 10,044 | 2,611 | 2,155 | 4,851 | 4,860 | 1,325 | 25,846 | ||||||||||||||||||||||
Production costsa | 1,826 | 754 | 477 | 1,515 | 589 | 298 | 5,459 | ||||||||||||||||||||||
| Exploration expense | 177 | 219 | 62 | 82 | 249 | 208 | 997 | ||||||||||||||||||||||
| Depreciation, depletion and amortisation | 2,293 | 393 | 600 | 794 | 1,352 | 257 | 5,689 | ||||||||||||||||||||||
| Other income/(costs) | (604 | ) | (162 | ) | 149 | (358 | ) | (330 | ) | (227 | ) | (1,532 | ) | ||||||||||||||||
| Earnings before taxation | 5,144 | 1,083 | 1,165 | 2,102 | 2,340 | 335 | 12,169 | ||||||||||||||||||||||
| Taxation | 2,340 | 789 | 330 | 1,638 | 791 | 93 | 5,981 | ||||||||||||||||||||||
| Earnings from operations | 2,804 | 294 | 835 | 464 | 1,549 | 242 | 6,188 | ||||||||||||||||||||||
| Earnings from oil sands | (3 | ) | (3 | ) | |||||||||||||||||||||||||
| 2001 (as restated) | $ million | ||||||||||||||||||||||||||||
| Western | |||||||||||||||||||||||||||||
| Eastern Hemisphere | Hemisphere | ||||||||||||||||||||||||||||
| Middle | |||||||||||||||||||||||||||||
| East, | |||||||||||||||||||||||||||||
| Asia | Russia, | Total | |||||||||||||||||||||||||||
| Europe | Africa | Pacific | CIS | USA | Other | ||||||||||||||||||||||||
| Sales | |||||||||||||||||||||||||||||
| third parties | 4,971 | 98 | 1,013 | 1,322 | 2,771 | 836 | 11,011 | ||||||||||||||||||||||
| intra-group | 3,723 | 2,759 | 1,171 | 3,201 | 2,306 | 630 | 13,790 | ||||||||||||||||||||||
| Net proceeds | 8,694 | 2,857 | 2,184 | 4,523 | 5,077 | 1,466 | 24,801 | ||||||||||||||||||||||
Production costsa | 1,276 | 820 | 406 | 1,362 | 496 | 268 | 4,628 | ||||||||||||||||||||||
| Exploration expense | 98 | 109 | 121 | 125 | 289 | 143 | 885 | ||||||||||||||||||||||
| Depreciation, depletion and amortisation | 1,330 | 332 | 478 | 518 | 1,072 | 282 | 4,012 | ||||||||||||||||||||||
| Other income/(costs) | (395 | ) | (97 | ) | (58 | ) | (74 | ) | (305 | ) | (247 | ) | (1,176 | ) | |||||||||||||||
| Earnings before taxation | 5,595 | 1,499 | 1,121 | 2,444 | 2,915 | 526 | 14,100 | ||||||||||||||||||||||
| Taxation | 2,454 | 1,026 | 403 | 1,849 | 1,028 | 185 | 6,945 | ||||||||||||||||||||||
| Earnings from operations | 3,141 | 473 | 718 | 595 | 1,887 | 341 | 7,155 | ||||||||||||||||||||||
| Earnings from oil sands | – | – | |||||||||||||||||||||||||||
Royal Dutch/Shell Group of Companies G 37
20-F/A (Amendment No. 2) 2002
Table of Contents
| 25 | Oil and gas exploration and production activities |
(c) Earnings continued
| 2000 (as restated) | $ million | ||||||||||||||||||||||||||||
| Eastern Hemisphere | Western Hemisphere | Total | |||||||||||||||||||||||||||
| Asia | Middle East, | ||||||||||||||||||||||||||||
| Europe | Africa | Pacific | Russia, CIS | USA | Other | ||||||||||||||||||||||||
| Sales | |||||||||||||||||||||||||||||
| third parties | 5,378 | 161 | 919 | 1,216 | 3,199 | 1,104 | 11,977 | ||||||||||||||||||||||
| intra-group | 3,714 | 3,181 | 842 | 3,740 | 2,165 | 534 | 14,176 | ||||||||||||||||||||||
| Net proceeds | 9,092 | 3,342 | 1,761 | 4,956 | 5,364 | 1,638 | 26,153 | ||||||||||||||||||||||
Production costsa | 1,493 | 901 | 332 | 1,462 | 427 | 313 | 4,928 | ||||||||||||||||||||||
| Exploration expense | 118 | 151 | 159 | 105 | 226 | 75 | 834 | ||||||||||||||||||||||
| Depreciation, | |||||||||||||||||||||||||||||
| depletion and | |||||||||||||||||||||||||||||
| amortisation | 1,476 | 308 | 378 | 327 | 953 | 372 | 3,814 | ||||||||||||||||||||||
| Other income/(costs) | 206 | 13 | 594 | (78 | ) | 378 | (313 | ) | 800 | ||||||||||||||||||||
| Earnings before | |||||||||||||||||||||||||||||
| taxation | 6,211 | 1,995 | 1,486 | 2,984 | 4,136 | 565 | 17,377 | ||||||||||||||||||||||
| Taxation | 2,752 | 1,487 | 507 | 2,211 | 1,391 | 148 | 8,496 | ||||||||||||||||||||||
| Earnings from operations | 3,459 | 508 | 979 | 773 | 2,745 | 417 | 8,881 | ||||||||||||||||||||||
| Earnings from oil sands | – | – | |||||||||||||||||||||||||||
| a Includes certain royalties paid in cash amounting to $1,449 million in 2002 (2001: $1,364 million; 2000: $1,698 million). | |||||||||||||||||||||||||||||
| The Group share of associated companies’ earnings was $541 million in 2002 (2001: $757 million; 2000: $989 million) mainly in the USA $330 million (2001: $303 million; 2000: $569 million) and Asia Pacific $170 million (2001: $428 million; 2000: $369 million). |
| 26 | Auditors’ remuneration |
| $ million | ||||||||||||
| Remuneration of KPMG and PricewaterhouseCoopers | 2002 | 2001 | 2000 | |||||||||
| As restated | ||||||||||||
| Audit fees | 27 | 18 | 17 | |||||||||
| Fees for non-audit services | 35 | 32 | 47 | |||||||||
27 Contingencies and litigation
Contingent liabilities of Group companies arising from guarantees related to commitments of non-consolidated entities amounted to $4.1 billion at December 31, 2002 (2001: $3.2 billion). An analysis of the guarantees outstanding at December 31, 2002 is given in the following table:
| $ billion | ||||
| In respect of debt | 2.1 | |||
| In respect of customs duties | 1.0 | |||
| Other | 1.0 | |||
| Total | 4.1 | |||
The $2.1 billion of guarantees in respect of debt relate to project finance. Guarantees in respect of customs duties mainly relate to a cross guarantee, renewable annually, for amounts payable by industry participants in a western European country.
Shell Oil Company (including subsidiaries and affiliates, referred to collectively as SOC), along with other oil companies, has been sued by public and quasi-public water purveyors, as well as governmental entities, alleging responsibility for groundwater contamination caused by releases of gasoline containing oxygenate additives. Most of these suits assert among other claims, product liability theories, and seek to recover damages from SOC and others, including clean-up costs. As of December 31, 2002, there were eleven pending suits by such plaintiffs that asserted claims against SOC, which cases involve a number of defendants (including a number of other major energy and refining companies). A majority of these cases do not specify the damages sought and, in the cases where damages are specified, management of the Group believes that the amount of damages claimed is speculative and, therefore, not indicative of the range of possible outcomes. Management of the Group cannot currently
G 38 Royal Dutch/ Shell Group of Companies
20-F/A (Amendment No. 2) 2002
Table of Contents
predict the manner and timing of the resolution of pending oxygenate-related matters and is currently unable to estimate the range of possible additional losses from such matters because of the preliminary stage of the proceedings, the number of defendants involved in these cases and the related issue of determining the allocation of potential liability among defendants. However, based on the facts and circumstances currently known, management of the Group does not currently believe that the outcome of the oxygenate-related litigation pending as of December 31, 2002 will have a material impact on the Group’s financial condition, although such resolutions could have a significant effect on periodic results for the period in which they are recognised.
A $490 million dollar judgment in favour of 466 plaintiffs was rendered in 2002 by a Nicaraguan court against SOC and others, based upon Nicaraguan Special Law 364 for claimed personal injuries resulting from alleged exposure to dibromochloropropane (DBCP) – a pesticide manufactured by SOC prior to 1978. This special law imposes strict liability (in a predetermined amount) on international manufacturers of DBCP. The statute also provides that unless a deposit (based on a predetermined formula) of an amount denominated in Nicaraguan cordobas (which in this case was in excess of $20 million) is made by each defendant for each case into the Nicaraguan courts, the claims would be submitted to the US courts. SOC chose not to make this deposit and thereafter judgment was entered without giving effect to the provision of Special Law 364 that submits the matter to the US courts. Special Law 364 requires each defendant in a case to post a deposit equal to $100 thousand plus 300 million Nicaraguan cordobas. Since SOC was a defendant in one case, it was required to post a deposit equal to between $19 and $20 million ($100 thousand plus 300 million Nicaraguan cordobas at an exchange rate of between 15 and 16 cordobas per dollar). Further, SOC was not afforded the opportunity to present any defences in the Nicaraguan court, including that it was not subject to Nicaraguan jurisdiction because it had neither shipped nor sold DBCP to parties in Nicaragua. It is the opinion of management of the Group that this judgment does not meet due process standards in the United States and is unenforceable as a matter of law. No reserves have been established for this judgment.
Since 1984, SOC has been named with others as a defendant in numerous product liability cases, including class actions, involving the failure of residential plumbing systems and municipal water distribution systems constructed with polybutylene plastic pipe. SOC fabricated the resin for this pipe while the co-defendants fabricated the raw materials for the pipe fittings. As a result of two class action settlements in 1995, SOC and the co-defendants agreed on a mechanism to fund until 2009 the settlement of most of the residential plumbing claims in the United States. Reserves have been taken by SOC for its settlement funding needs anticipated at this time. Additionally, claims that are not part of these class action settlements or that challenge these settlements continue to be filed primarily involving alleged problems with polybutylene pipe used in municipal water distribution systems. It is the opinion of management of the Group that exposure from this other polybutylene litigation pending as at December 31, 2002, is not material. Management of the Group cannot currently predict when or how all polybutylene matters will be finally resolved.
Group companies are subject to a number of other loss contingencies arising out of litigation and claims brought by governmental and private parties. While it is not feasible to predict the outcome of pending litigation and claims with certainty, the management of the Group believes that any reasonably possible additional loss related to such matters, in excess of provisions made, would have no material adverse effect on the Group’s financial statements or cash flows as of December 31, 2002.
The operations and earnings of Group companies continue, from time to time, to be affected to varying degrees by political, legislative, fiscal and regulatory developments, including those relating to environmental protection, in the countries in which they operate. The industries in which Group companies are engaged are also subject to physical risks of various types. The nature and frequency of these developments and events, not all of which are covered by insurance, as well as their effect on future operations and earnings, are unpredictable.
Subsequent to the year ended December 31, 2002, in connection with the recategorisation of certain hydrocarbon reserves announced on January 9, 2004, a number of shareholder class action complaints were filed in the United States District Court of New Jersey, the United States Securities and Exchange Commission has issued a formal order of private investigation, the United States Department of Justice has commenced a criminal investigation, the UK Financial Services Authority has served formal notice of investigation under the Financial Services and Markets Act 2000 and Euronext Amsterdam and the Dutch Authority Financial Markets are investigating the issues related to the reserves recategorisation. Management of the Group cannot currently predict the manner and timing of the resolution of these pending matters, is currently unable to estimate the range of possible losses from such matters and does not currently believe the resolution of these pending matters will have a material impact on the Group’s financial condition, although such resolutions could have a significant effect on periodic results for the period in which they are recognised.
| 28 | Financial instruments |
Group companies, in the normal course of business, use various types of financial instruments which expose the Group to market or credit risk. Group companies have procedures and policies in place to limit the amount of credit exposure to any counterparty or market. These procedures and the broad geographical spread of Group companies’ activities limit the Group’s exposure to concentrations of credit or market risk.
Royal Dutch/Shell Group of Companies G 39
20-F/A (Amendment No. 2) 2002
Table of Contents
Some Group companies enter into derivatives such as interest rate swaps/forward rate agreements to manage interest rate exposure. The financing of most Operating Companies is structured on a floating-rate basis and, except in special cases, further interest rate risk management is discouraged. Foreign exchange derivatives, such as forward exchange contracts and currency swaps/options, are used by some Group companies to manage foreign exchange risk. Commodity swaps, options and futures are used to manage price and timing risks mainly involving crude oil, natural gas and oil products.
The contract/notional amount, together with the estimated fair value (carrying amount) of derivatives held by Group companies at December 31 is as follows:
| 2002 | 2001 | |||||||||||||||
| Estimated | ||||||||||||||||
| Contract/ | fair | Contract/ | ||||||||||||||
| notional | value | notional | Estimated | |||||||||||||
| amount | As restated | amount | fair value | |||||||||||||
| Interest rate swaps/ forward rate agreements | 5,557 | 169 | 1,962 | 18 | ||||||||||||
| Forward exchange contracts and currency swaps/ options | 16,922 | (88 | ) | 5,827 | 21 | |||||||||||
| Commodity swaps, options and futures | 56,642 | 55 | 32,808 | 17 | ||||||||||||
| 79,121 | 136 | 40,597 | 56 | |||||||||||||
Other financial instruments in the Statement of Assets and Liabilities include fixed assets: investments – securities, trade receivables, short-term securities, cash and cash equivalents, short and long-term debt, and assets and liabilities in respect of risk management activities. The estimated fair values of these instruments approximate their carrying amounts.
| 29 | Division of Group net assets between the Parent Companies and movements therein |
The division of Group net assets and movements therein, including Group net income, in accordance with Note 1, is as follows:
| $ million | ||||||||||||
| Royal Dutch | Shell Transport | |||||||||||
| Total | (60%) | (40%) | ||||||||||
| As restated | As restated | As restated | ||||||||||
| At January 1, 2000 | 56,601 | 33,961 | 22,640 | |||||||||
| Movements during the year 2000 Group net income | 12,813 | 7,688 | 5,125 | |||||||||
| less: distributions to Parent Companies | (8,579 | ) | (5,147 | ) | (3,432 | ) | ||||||
| Undistributed net income | 4,234 | 2,541 | 1,693 | |||||||||
| Movement in Parent Companies’ shares held by Group companies, net of dividends received | (200 | ) | (120 | ) | (80 | ) | ||||||
| Other comprehensive income (see Note 5) | (3,019 | ) | (1,812 | ) | (1,207 | ) | ||||||
| At December 31, 2000 | 57,616 | 34,570 | 23,046 | |||||||||
| Movements during the year 2001 | ||||||||||||
| Group net income | 10,301 | 6,180 | 4,121 | |||||||||
| less: distributions to Parent Companies | (9,163 | ) | (5,498 | ) | (3,665 | ) | ||||||
| Undistributed net income | 1,138 | 682 | 456 | |||||||||
| Movement in Parent Companies’ shares held by Group companies, net of dividends received | (642 | ) | (385 | ) | (257 | ) | ||||||
| Other comprehensive income (see Note 5) | (1,970 | ) | (1,182 | ) | (788 | ) | ||||||
| At December 31, 2001 | 56,142 | 33,685 | 22,457 | |||||||||
| Movements during the year 2002 | ||||||||||||
| Group net income | 9,656 | 5,794 | 3,862 | |||||||||
| less: distributions to Parent Companies | (5,435 | ) | (3,261 | ) | (2,174 | ) | ||||||
| Undistributed net income | 4,221 | 2,533 | 1,688 | |||||||||
| Movement in Parent Companies’ shares held by Group companies, net of dividends received | (844 | ) | (507 | ) | (337 | ) | ||||||
| Other comprehensive income (see Note 5) | 757 | 455 | 302 | |||||||||
| At December 31, 2002 | 60,276 | 36,166 | 24,110 | |||||||||
The above table is based on the Group’s US GAAP results. See the “Reconciliation between US GAAP and Netherlands GAAP” table in Note 32(c) for the impact of differences between US GAAP and Netherlands GAAP on the Group’s net assets.
G 40 Royal Dutch/ Shell Group of Companies
20-F/A (Amendment No. 2) 2002
Table of Contents
| Restatement of previously issued Financial Statements | $ million | |||||||||||||||||||||||||||||||||||
| Royal Dutch | Shell Transport | |||||||||||||||||||||||||||||||||||
| Previously | Previously | (60%) | Previously | (40%) | ||||||||||||||||||||||||||||||||
| reported | Adjustments | As restated | reported | Adjustments | As restated | reported | Adjustments | As restated | ||||||||||||||||||||||||||||
| At January 1, 2000 | 56,171 | 430 | 56,601 | 33,703 | 258 | 33,961 | 22,468 | 172 | 22,640 | |||||||||||||||||||||||||||
| Movements during the year 2000 | ||||||||||||||||||||||||||||||||||||
| Group net income | 12,719 | 94 | 12,813 | 7,631 | 57 | 7,688 | 5,088 | 37 | 5,125 | |||||||||||||||||||||||||||
| less: distributions to Parent Companies | (8,579 | ) | – | (8,579 | ) | (5,147 | ) | – | (5,147 | ) | (3,432 | ) | – | (3,432 | ) | |||||||||||||||||||||
| Undistributed net income | 4,140 | 94 | 4,234 | 2,484 | 57 | 2,541 | 1,656 | 37 | 1,693 | |||||||||||||||||||||||||||
| Movement in Parent Companies’ shares held by Group companies, net of dividends received | (200 | ) | – | (200 | ) | (120 | ) | – | (120 | ) | (80 | ) | – | (80 | ) | |||||||||||||||||||||
| Other comprehensive income (see Note 5) | (3,025 | ) | 6 | (3,019 | ) | (1,815 | ) | 3 | (1,812 | ) | (1,210 | ) | 3 | (1,207 | ) | |||||||||||||||||||||
| At December 31, 2000 | 57,086 | 530 | 57,616 | 34,252 | 318 | 34,570 | 22,834 | 212 | 23,046 | |||||||||||||||||||||||||||
| Movements during the year 2001 | ||||||||||||||||||||||||||||||||||||
| Group net income | 10,852 | (551 | ) | 10,301 | 6,511 | (331 | ) | 6,180 | 4,341 | (220 | ) | 4,121 | ||||||||||||||||||||||||
| less: distributions to Parent Companies | (9,163 | ) | – | (9,163 | ) | (5,498 | ) | – | (5,498 | ) | (3,665 | ) | – | (3,665 | ) | |||||||||||||||||||||
| Undistributed net income | 1,689 | (551 | ) | 1,138 | 1,013 | (331 | ) | 682 | 676 | (220 | ) | 456 | ||||||||||||||||||||||||
| Movement in Parent Companies’ shares held by Group companies, net of dividends received | (642 | ) | – | (642 | ) | (385 | ) | – | (385 | ) | (257 | ) | – | (257 | ) | |||||||||||||||||||||
| Other comprehensive income (see Note 5) | (1,973 | ) | 3 | (1,970 | ) | (1,184 | ) | 2 | (1,182 | ) | (789 | ) | 1 | (788 | ) | |||||||||||||||||||||
| At December 31, 2001 | 56,160 | (18 | ) | 56,142 | 33,696 | (11 | ) | 33,685 | 22,464 | (7 | ) | 22,457 | ||||||||||||||||||||||||
| Movements during the year 2002 | ||||||||||||||||||||||||||||||||||||
| Group net income | 9,419 | 237 | 9,656 | 5,651 | 143 | 5,794 | 3,768 | 94 | 3,862 | |||||||||||||||||||||||||||
| less: distributions to Parent Companies | (5,435 | ) | – | (5,435 | ) | (3,261 | ) | – | (3,261 | ) | (2,174 | ) | – | (2,174 | ) | |||||||||||||||||||||
| Undistributed net income | 3,984 | 237 | 4,221 | 2,390 | 143 | 2,533 | 1,594 | 94 | 1,688 | |||||||||||||||||||||||||||
| Movement in Parent Companies’ shares held by Group companies, net of dividends received | (844 | ) | – | (844 | ) | (507 | ) | – | (507 | ) | (337 | ) | – | (337 | ) | |||||||||||||||||||||
| Other comprehensive income (Note 5) | 764 | (7 | ) | 757 | 459 | (4 | ) | 455 | 305 | (3 | ) | 302 | ||||||||||||||||||||||||
| At December 31, 2002 | 60,064 | 212 | 60,276 | 36,038 | 128 | 36,166 | 24,026 | 84 | 24,110 | |||||||||||||||||||||||||||
| 30 | Subsequent events |
Settlements
On 29 July 2004, the Group announced that it had reached agreements in principle with the SEC and the FSA to resolve their investigations. In connection with the agreement in principle with the SEC, Shell consented, without admitting or denying the SEC’s findings or conclusions, to an administrative order finding that Shell violated, and requiring Shell to cease and desist from future violations of, the antifraud, reporting, recordkeeping and internal control provisions of the US Federal securities laws and related SEC rules, agreed to pay a $120 million civil penalty and has undertaken to spend an additional $5 million developing a comprehensive internal compliance program. In connection with the agreement in principle with the FSA, Shell agreed, without admitting or denying the FSA’s findings or conclusions, to the entry of a Final Notice by the FSA finding that Shell breached market abuse provisions of the UK’s Financial Services and Markets Act 2000 and the Listing Rules made under it and agreed to pay a penalty of £17 million.
Restructuring
On October 28, 2004, the Royal Dutch and Shell Transport Boards announced that they had unanimously agreed to propose to their shareholders a transaction (the “Transaction”) through which each Parent Company will become a subsidiary of Royal Dutch Shell plc, which will become a publicly-listed company incorporated in England and Wales and headquartered and tax resident in The Netherlands (“Royal Dutch Shell”). Reflecting the existing 60:40 ownership by Royal Dutch and Shell Transport of the Group, it is proposed that Royal Dutch shareholders will be offered 60% of the ordinary share capital in Royal Dutch Shell and Shell Transport shareholders will receive 40% of the ordinary share capital in Royal Dutch Shell. To implement the proposal, it is intended that (i) Royal Dutch Shell will make an offer to acquire all of the issued and outstanding ordinary shares of Royal Dutch in exchange for Royal Dutch Shell Class A ordinary shares or American depositary shares (“ADSs”) representing Royal Dutch Shell Class A ordinary shares and (ii) Royal Dutch Shell will become the parent company of Shell Transport pursuant to a United Kingdom reorganisational procedure referred to as a “scheme of arrangement” under section 425 of the UK Companies Act
Royal Dutch/Shell Group of Companies G 41
20-F/A (Amendment No. 2) 2002
Table of Contents
1985, as amended. As a result of the scheme of arrangement, holders of Shell Transport ordinary shares (and holders of Shell Transport bearer warrants) will receive Royal Dutch Shell Class B ordinary shares and holders of Shell Transport ADSs will receive ADSs representing Royal Dutch Shell Class B ordinary shares. The Class A ordinary shares and Class B ordinary shares will have identical voting rights and will vote together as a single class on all matters, including the election of directors, unless a matter affects the rights of one class as a separate class. Class A ordinary shares and Class B ordinary shares will have identical rights upon a liquidation of Royal Dutch Shell and dividends declared on each will be equivalent in amount. However, for tax purposes, holders of Class A ordinary shares will receive Dutch source dividends, while holders of Class B ordinary shares will receive dividends that are UK source to the extent that these dividends are paid through a dividend access mechanism to be established. Implementation of the Transaction will be the subject of appropriate consultation with relevant employee representative bodies as required as well as the satisfaction of certain other conditions. It is currently expected that the Transaction will be completed in July 2005.
G 42 Royal Dutch/ Shell Group of Companies
20-F/A (Amendment No. 2) 2002
Table of Contents
Royal Dutch/ Shell Group of Companies
Report of Registered Independent Public Accountants
on the Netherlands GAAP Financial Statements
We have audited the Netherlands GAAP Financial Statements of the Royal Dutch/ Shell Group of Companies for the years 2002, 2001 and 2000 (which include notes on pages G5 to G42 and on pages G44 to G53). The preparation of the Financial Statements is the responsibility of management. Our responsibility is to express an opinion on these Financial Statements based on our audits.
We conducted our audits in accordance with the Standards of Public Company Accounting Oversight Board (United States). Those standards require that we plan and perform the audits to obtain reasonable assurance about whether the Financial Statements are free of material misstatement. An audit includes examining, on a test basis, evidence supporting the amounts and disclosures in the Financial Statements. An audit also includes assessing the accounting principles used and significant estimates made by management in the preparation of the Financial Statements, as well as evaluating the overall presentation of the Financial Statements. We believe that our audit provides a reasonable basis for our opinion.
In our opinion, the Financial Statements referred to above present fairly, in all material respects the financial position of the Royal Dutch/ Shell Group of Companies at 31 December 2002 and 2001 and the results of its operations and its cash flows for each of the three years in the period ended December 31, 2002 in accordance with the accounting principles generally accepted in the Netherlands.
As discussed in Note 32(a) on pages G46 to G48, the Royal Dutch/ Shell Group of Companies has restated comparative data for the three years ended December 31, 2002.
As discussed in Note 32(b) on pages G48 and G49, the Royal Dutch/Shell Group of Companies has restated its financial statements for the three years ended December 31, 2002 to correct for the impact of the Second Reserves Restatement.
/s/ KPMG Accountants N.V.
-----------------------------------------------------
KPMG Accountants N.V., The Hague — The Netherlands
Registered independent public accountants
/s/ PricewaterhouseCoopers LLP
-----------------------------------------------------
PricewaterhouseCoopers LLP, London — United Kingdom
Registered independent public accountants
March 5, 2003, except for Note 32(a) (Changes in accounting policies and first restatement of previously issued financial statements), which is as of May 22, 2004, and except for Note 32(b) (Second restatement of previously issued financial statements), which is as of March 3, 2005.
Royal Dutch/Shell Group of Companies G 43
20-F/A (Amendment No. 2) 2002
Table of Contents
Netherlands GAAP Financial Statements
| Statement of Income (as restated) | $ million | |||||||||||||||
| Note | 2002 | 2001 | 2000 | |||||||||||||
| Sales proceeds | 235,482 | 177,201 | 191,418 | |||||||||||||
| Sales taxes, excise duties and similar levies | 56,167 | 42,070 | 42,365 | |||||||||||||
Net proceeds | 179,315 | 135,131 | 149,053 | |||||||||||||
| Cost of sales | 150,949 | 108,245 | 118,275 | |||||||||||||
Gross profit | 28,366 | 26,886 | 30,778 | |||||||||||||
| Selling and distribution expenses | 9,954 | 7,898 | 7,896 | |||||||||||||
| Administrative expenses | 1,601 | 1,244 | 1,137 | |||||||||||||
| Exploration | 1,073 | 910 | 836 | |||||||||||||
| Research and development | 472 | 387 | 389 | |||||||||||||
| Operating profit of Group companies | 15,266 | 16,447 | 20,520 | |||||||||||||
| Share of operating profit of associated companies | 6 | 2,816 | 2,644 | 4,099 | ||||||||||||
Operating profit | 18,082 | 19,091 | 24,619 | |||||||||||||
| Interest and other income | 7 | 758 | 1,059 | 974 | ||||||||||||
| Interest expense | 8 | 1,364 | 1,133 | 1,324 | ||||||||||||
| Currency exchange gains/(losses) | (23 | ) | (30 | ) | (114 | ) | ||||||||||
Income before taxation | 17,453 | 18,987 | 24,155 | |||||||||||||
| Taxation | 9 | 7,742 | 8,360 | 11,295 | ||||||||||||
| Income after taxation | 9,711 | 10,627 | 12,860 | |||||||||||||
| Income applicable to minority interests | 175 | 326 | 47 | |||||||||||||
Net income | 9,536 | 10,301 | 12,813 | |||||||||||||
| Statement of Comprehensive Income and Parent Companies’ Interest in Group Net Assets (as restated) | $ million | ||||||||||||||||
| Note | 2002 | 2001 | 2000 | ||||||||||||||
Net income | 36 | 9,536 | 10,301 | 12,813 | |||||||||||||
| Other comprehensive income, net of tax: | 5 | ||||||||||||||||
| currency translation differences | 19 | 2,432 | (1,686 | ) | (2,711 | ) | |||||||||||
| unrealised gains/(losses) on securities | 25 | (143 | ) | (238 | ) | ||||||||||||
| unrealised gains/(losses) on cash flow hedges | (225 | ) | (14 | ) | |||||||||||||
| minimum pension liability adjustments | (1,475 | ) | (127 | ) | (70 | ) | |||||||||||
Comprehensive income | 10,293 | 8,331 | 9,794 | ||||||||||||||
| Distributions to Parent Companies | 36 | (5,435 | ) | (9,163 | ) | (8,579 | ) | ||||||||||
| Increase in Parent Companies’ shares held, net of dividends received | 22 | (844 | ) | (642 | ) | (200 | ) | ||||||||||
| Parent Companies’ interest in Group net assets at January 1 | 56,142 | 57,616 | 56,601 | ||||||||||||||
Parent Companies’ interest in Group net assets at December 31 | 36 | 60,156 | 56,142 | 57,616 | |||||||||||||
G 44 Royal Dutch/ Shell Group of Companies
20-F/A (Amendment No. 2) 2002
Table of Contents
| Statement of Assets and Liabilities (as restated) | $ million | |||||||||||||
| Dec 31, | Dec 31, | |||||||||||||
| Note | 2002 | 2001 | ||||||||||||
Fixed assets | ||||||||||||||
| Tangible assets | 33 | 81,433 | 52,950 | |||||||||||
| Intangible assets | 33 | 4,576 | 939 | |||||||||||
| Investments: | ||||||||||||||
| associated companies | 6 | 17,945 | 18,331 | |||||||||||
| securities | 14 | 1,719 | 1,914 | |||||||||||
| other | 1,420 | 1,108 | ||||||||||||
Total fixed assets | 107,093 | 75,242 | ||||||||||||
Other long-term assets | 11 | 7,333 | 7,716 | |||||||||||
Current assets | ||||||||||||||
| Inventories | 12 | 11,338 | 6,580 | |||||||||||
| Accounts receivable | 13 | 28,761 | 17,467 | |||||||||||
| Cash and cash equivalents | 14 | 1,556 | 6,670 | |||||||||||
Total current assets | 41,655 | 30,717 | ||||||||||||
Current liabilities:amounts due within one year | ||||||||||||||
| Short-term debt | 15 | 12,874 | 3,988 | |||||||||||
| Accounts payable and accrued liabilities | 17 | 32,189 | 18,884 | |||||||||||
| Taxes payable | 9 | 4,985 | 4,494 | |||||||||||
| Dividends payable to Parent Companies | 5,153 | 6,101 | ||||||||||||
Total current liabilities | 55,201 | 33,467 | ||||||||||||
Net current assets/(liabilities) | (13,546 | ) | (2,750 | ) | ||||||||||
Total assets less current liabilities | 100,880 | 80,208 | ||||||||||||
Long-term liabilities:amounts due after more than one year | ||||||||||||||
| Long-term debt | 34 | 9,887 | 4,061 | |||||||||||
| Other | 18 | 6,174 | 4,515 | |||||||||||
| 16,061 | 8,576 | |||||||||||||
Provisions | ||||||||||||||
| Deferred taxation | 9 | 12,551 | 7,078 | |||||||||||
| Pensions and similar obligations | 20 | 5,016 | 2,331 | |||||||||||
| Decommissioning and restoration costs | 23 | 3,528 | 2,615 | |||||||||||
| 21,095 | 12,024 | |||||||||||||
Group net assets before minority interests | 63,724 | 59,608 | ||||||||||||
| Minority interests | 3,568 | 3,466 | ||||||||||||
Net assets | 60,156 | 56,142 | ||||||||||||
Statement of Cash Flows
The differences in accounting policy between Netherlands GAAP and US GAAP do not affect the underlying cash flows of the Group and therefore a separate Statement of Cash Flows is not presented under Netherlands GAAP. Reference is made to the Statement of Cash Flows presented on page G4.
Royal Dutch/Shell Group of Companies G 45
20-F/A (Amendment No. 2) 2002
Table of Contents
Notes to the Netherlands GAAP Financial Statements
| 31 | Basis of Presentation of Group Financial Statements under Netherlands GAAP |
These Financial Statements have been prepared in conformity with generally accepted accounting principles in the Netherlands (Netherlands GAAP). These accounting principles are consistent with the accounting principles applied in the preparation of the Group’s Financial Statements prepared in conformity with generally accepted accounting principles in the United States (US GAAP), as set out in the Group accounting policies on pages G10 to G13, except as set forth below. The Notes to the Financial Statements prepared in conformity with US GAAP appearing on pages G5 to G42 are an integral part of these Financial Statements prepared under Netherlands GAAP.
The differences between Netherlands GAAP, as applied to the preparation of these Financial Statements (and after giving effect to the restatement described below), and US GAAP, as applied to the Group’s Financial Statements prepared in conformity with US GAAP, are as follows:
| (i) | goodwill: Under US GAAP, commencing in 2002, goodwill is no longer amortised but instead is tested for impairment annually or when certain events occur that indicate potential impairment. Under Netherlands GAAP, goodwill is amortised on a straight-line basis over its estimated useful economic life, which is assumed not to exceed 20 years unless there are grounds to rebut this assumption; and |
| (ii) | long-term commitments: Under US GAAP, certain power generation contracts (“tolling agreements”) are recognised in the Financial Statements at fair value. Under Netherlands GAAP, these commitments, together with certain other agreements not recognised on the Group’s balance sheet under US GAAP are accounted for in 2002 and prior years as capital leases upon inception. The Group’s balance sheet under Netherlands GAAP as of December 31, 2002 includes tangible fixed assets and debt of $3.1 billion (2001: $2.2 billion) relating to such agreements. |
| 32(a) | Changes in accounting policies and first restatement of previously issued financial statements |
The Group accounting policies under Netherlands GAAP have been changed from the policies used in previous Financial Statements to correct inappropriate departures from Netherlands GAAP relating to:
| (i) | the accounting for certain inventories in North America under the LIFO method, which in combination with the adoption of FIFO as the basis for accounting of the Group’s inventories in the rest of the world is not an acceptable method under Netherlands GAAP (note that the Group has elected to make a similar change in accounting policy under US GAAP to eliminate the use of the LIFO method — see Note 3). Net income for 2002 has increased by $511 million (2001: decreased by $446 million; 2000: increased by $269 million; prior to 2000: increase of $513 million in net income and $825 million pre-tax). Net assets at December 31, 2002 have increased by $850 million (2001: $339 million; 2000: $783 million); |
| (ii) | the failure to amortise goodwill, which is required under Netherlands GAAP. Net income for 2002, and net assets at December 31, 2002, have decreased by $120 million. There is no impact for prior periods; and |
| (iii) | the failure to include certain assets and debt, relating principally to power generation contracts (“tolling agreements”) and lease contracts, in the Group’s balance sheet, as required under Netherlands GAAP. There is no impact on prior period net income or net assets. |
The restatement of the Financial Statements also gives effect to changes in accounting policy relating to exploration costs and certain gas contracts, as discussed in Note 2(a) as corrections under US GAAP. This change aligns the Group accounting policy under Netherlands GAAP with oil and gas specific accounting standards applicable under US GAAP. The effect of the change for exploration costs is a reduction in previously reported net income for 2002 of $61 million (2001: $14 million; 2000: $42 million), and a reduction in previously reported net assets at December 31, 2002 of $155 million (2001: $91 million). The effect of the change for certain gas contracts is a reduction in previously reported net income for 2002 and net assets at December 31, 2002 of $39 million.
In addition, errors in the depreciation, depletion and amortisation charge presented in previous Financial Statements, arising as a result of the overstatement of proved reserves as corrected by the First Reserves Restatement, have been adjusted in the Netherlands GAAP financial statements through a restatement of the comparative results for the years ended December 31, 2002, 2001 and 2000.
Quantitative information concerning the effect of the above changes in accounting policies and adjustments is set forth in the tables below and additional information is contained in Note 2(a) on pages G5 to G8.
G 46 Royal Dutch/ Shell Group of Companies
20-F/A (Amendment No. 2) 2002
Table of Contents
| Statement of Income | $ million | |||||||||||||||||||||||||||||||||||||||||||||||||||||||||||||||||||||||||||||||
| 2002 | 2001 | 2000 | ||||||||||||||||||||||||||||||||||||||||||||||||||||||||||||||||||||||||||||||
| Restated | Restated | Restated | ||||||||||||||||||||||||||||||||||||||||||||||||||||||||||||||||||||||||||||||
| As | First | prior to | As | First | prior to | As | First | prior to | ||||||||||||||||||||||||||||||||||||||||||||||||||||||||||||||||||||||||
| originally | Reserves | policy | Exploration | Gas | As | originally | Reserves | policy | Exploration | As | originally | Reserves | policy | Exploration | As | |||||||||||||||||||||||||||||||||||||||||||||||||||||||||||||||||
| reported | Restatement | Inventories | Goodwill | election | costs | contracts | restated | reported | Restatement | Inventories | election | costs | restated | reported | Restatement | Inventories | election | costs | restated | |||||||||||||||||||||||||||||||||||||||||||||||||||||||||||||
| Net proceeds | 179,431 | (52 | ) | – | – | 179,379 | – | (64 | ) | 179,315 | 135,211 | (80 | ) | – | 135,131 | – | 135,131 | 149,146 | (93 | ) | – | 149,053 | – | 149,053 | ||||||||||||||||||||||||||||||||||||||||||||||||||||||||
| Cost of sales | 151,214 | 114 | (617 | ) | 120 | 150,831 | – | – | 150,831 | 107,839 | 4 | 308 | 108,151 | – | 108,151 | 118,328 | 39 | (204 | ) | 118,163 | – | 118,163 | ||||||||||||||||||||||||||||||||||||||||||||||||||||||||||
| Exploration | 991 | – | – | – | 991 | 82 | – | 1,073 | 882 | 7 | – | 889 | 21 | 910 | 755 | 7 | – | 762 | 74 | 836 | ||||||||||||||||||||||||||||||||||||||||||||||||||||||||||||
| Other operating expenses | 12,027 | – | – | – | 12,027 | – | – | 12,027 | 9,529 | – | – | 9,529 | – | 9,529 | 9,422 | – | – | 9,422 | – | 9,422 | ||||||||||||||||||||||||||||||||||||||||||||||||||||||||||||
| Share of operating profit of associates | 2,624 | – | 198 | – | 2,822 | – | – | 2,822 | 3,041 | 18 | (413 | ) | 2,646 | – | 2,646 | 3,859 | – | 242 | 4,101 | – | 4,101 | |||||||||||||||||||||||||||||||||||||||||||||||||||||||||||
| Operating profit | 17,823 | (166 | ) | 815 | (120 | ) | 18,352 | (82 | ) | (64 | ) | 18,206 | 20,002 | (73 | ) | (721 | ) | 19,208 | (21 | ) | 19,187 | 24,500 | (139 | ) | 446 | 24,807 | (74 | ) | 24,733 | |||||||||||||||||||||||||||||||||||||||||||||||||||
| Net interest expense and currency exchange gains/losses | 629 | – | – | – | 629 | – | – | 629 | 104 | – | – | 104 | – | 104 | 464 | – | – | 464 | – | 464 | ||||||||||||||||||||||||||||||||||||||||||||||||||||||||||||
| Income before taxation | 17,194 | (166 | ) | 815 | (120 | ) | 17,723 | (82 | ) | (64 | ) | 17,577 | 19,898 | (73 | ) | (721 | ) | 19,104 | (21 | ) | 19,083 | 24,036 | (139 | ) | 446 | 24,343 | (74 | ) | 24,269 | |||||||||||||||||||||||||||||||||||||||||||||||||||
| Taxation | 7,617 | (65 | ) | 290 | – | 7,842 | (21 | ) | (25 | ) | 7,796 | 8,694 | (27 | ) | (256 | ) | 8,411 | (7 | ) | 8,404 | 11,273 | (53 | ) | 161 | 11,381 | (32 | ) | 11,349 | ||||||||||||||||||||||||||||||||||||||||||||||||||||
| Minority interests | 158 | 7 | 14 | – | 179 | – | – | 179 | 352 | (4 | ) | (19 | ) | 329 | – | 329 | 44 | (6 | ) | 16 | 54 | – | 54 | |||||||||||||||||||||||||||||||||||||||||||||||||||||||||
| Net income | 9,419 | (108 | ) | 511 | (120 | ) | 9,702 | (61 | ) | (39 | ) | 9,602 | 10,852 | (42 | ) | (446 | ) | 10,364 | (14 | ) | 10,350 | 12,719 | (80 | ) | 269 | 12,908 | (42 | ) | 12,866 | |||||||||||||||||||||||||||||||||||||||||||||||||||
| Statement of Assets and Liabilities | $ million | ||||||||||||||||||||||||||||||||||||||||||||||||||||||||||||||||
| December 31, 2002 | December 31, 2001 | ||||||||||||||||||||||||||||||||||||||||||||||||||||||||||||||||
| Restated | Restated | ||||||||||||||||||||||||||||||||||||||||||||||||||||||||||||||||
| As | First | prior to | As | First | prior to | ||||||||||||||||||||||||||||||||||||||||||||||||||||||||||||
| originally | Reserves | Long-term | policy | Exploration | Gas | As | originally | Reserves | Long-term | policy | Exploration | As | |||||||||||||||||||||||||||||||||||||||||||||||||||||
| reported | Restatement | Inventories | Goodwill | commitments | election | costs | contracts | restated | reported | Restatement | Inventories | commitments | election | costs | restated | ||||||||||||||||||||||||||||||||||||||||||||||||||
| Fixed assets | |||||||||||||||||||||||||||||||||||||||||||||||||||||||||||||||||
| Tangible assets | 79,390 | (467 | ) | – | – | 3,070 | 81,993 | (236 | ) | – | 81,757 | 51,370 | (293 | ) | – | 2,229 | 53,306 | (150 | ) | 53,156 | |||||||||||||||||||||||||||||||||||||||||||||
| Intangible assets | 4,696 | – | – | (120 | ) | – | 4,576 | – | – | 4,576 | 939 | – | – | – | 939 | – | 939 | ||||||||||||||||||||||||||||||||||||||||||||||||
| Investments | 20,760 | 2 | 325 | – | – | 21,087 | – | ��� | 21,087 | 21,040 | 2 | 312 | – | 21,354 | – | 21,354 | |||||||||||||||||||||||||||||||||||||||||||||||||
| Other long-term assets | 7,299 | – | – | – | – | 7,299 | – | 34 | 7,333 | 7,716 | – | – | – | 7,716 | – | 7,716 | |||||||||||||||||||||||||||||||||||||||||||||||||
| Inventories | 10,298 | – | 1,040 | – | – | 11,338 | – | – | 11,338 | 6,341 | – | 239 | – | 6,580 | – | 6,580 | |||||||||||||||||||||||||||||||||||||||||||||||||
| Other current assets | 30,248 | – | – | – | – | 30,248 | – | 69 | 30,317 | 24,137 | – | – | – | 24,137 | – | 24,137 | |||||||||||||||||||||||||||||||||||||||||||||||||
| Current liabilities | 55,115 | – | – | – | – | 55,115 | – | 86 | 55,201 | 33,467 | – | – | – | 33,467 | – | 33,467 | |||||||||||||||||||||||||||||||||||||||||||||||||
| Long-term liabilities | |||||||||||||||||||||||||||||||||||||||||||||||||||||||||||||||||
| Long-term debt | 6,817 | – | – | – | 3,070 | 9,887 | – | – | 9,887 | 1,832 | – | – | 2,229 | 4,061 | – | 4,061 | |||||||||||||||||||||||||||||||||||||||||||||||||
| Other | 6,118 | – | – | – | – | 6,118 | – | 56 | 6,174 | 4,515 | – | – | – | 4,515 | – | 4,515 | |||||||||||||||||||||||||||||||||||||||||||||||||
| Provisions | |||||||||||||||||||||||||||||||||||||||||||||||||||||||||||||||||
| Deferred taxation | 12,471 | (186 | ) | 492 | – | – | 12,777 | (81 | ) | – | 12,696 | 7,146 | (117 | ) | 203 | – | 7,232 | (59 | ) | 7,173 | |||||||||||||||||||||||||||||||||||||||||||||
| Pensions and decommissioning | 8,544 | – | – | – | – | 8,544 | – | – | 8,544 | 4,946 | – | – | – | 4,946 | – | 4,946 | |||||||||||||||||||||||||||||||||||||||||||||||||
| Minority interests | 3,562 | (3 | ) | 23 | – | – | 3,582 | – | – | 3,582 | 3,477 | (10 | ) | 9 | – | 3,476 | – | 3,476 | |||||||||||||||||||||||||||||||||||||||||||||||
| Net assets | 60,064 | (276 | ) | 850 | (120 | ) | – | 60,518 | (155 | ) | (39 | ) | 60,324 | 56,160 | (164 | ) | 339 | – | 56,335 | (91 | ) | 56,244 | |||||||||||||||||||||||||||||||||||||||||||
Royal Dutch/Shell Group of Companies G 47
20-F/A (Amendment No. 2) 2002
Table of Contents
| Parent Companies’ interest in Group net assets | $ million | |||||||||||||
| 2002 | 2001 | 2000 | ||||||||||||
| At December 31 as previously reported | 60,064 | 56,160 | 57,086 | |||||||||||
| Effect of the adjustments: | ||||||||||||||
| Interest at the beginning of the year | ||||||||||||||
| Cumulative effect of First Reserves Restatement | (164 | ) | (122 | ) | (46 | )a | ||||||||
| Cumulative effect of change in policy for inventories | 339 | 783 | 513 | a | ||||||||||
| Total before elective changes | 60,239 | 56,821 | 57,553 | |||||||||||
| Cumulative effect of exploration costs change | (91 | ) | (78 | ) | (37 | )a | ||||||||
| 60,148 | 56,743 | 57,516 | ||||||||||||
| Net income for the year | ||||||||||||||
| First Reserves Restatement | (108 | ) | (42 | ) | (80 | ) | ||||||||
| Change in policy for inventories | 511 | (446 | ) | 269 | ||||||||||
| Goodwill change | (120 | ) | – | – | ||||||||||
| Total before elective changes | 60,431 | 56,255 | 57,705 | |||||||||||
| Exploration costs change | (61 | ) | (14 | ) | (42 | ) | ||||||||
| Gas contracts change | (39 | ) | – | – | ||||||||||
| 60,331 | 56,241 | 57,663 | ||||||||||||
| Currency translation differences for the year | (7 | ) | 3 | 6 | ||||||||||
At December 31 as restated | 60,324 | 56,244 | 57,669 | |||||||||||
| a Cumulative effect as at January 1, 2000. | ||||||||||||||
32(b) Second restatement of previously issued financial statements
Errors in the depreciation, depletion and amortisation charge presented in previous Financial Statements, arising as a result of the overstatement of proved reserves as corrected by the Second Reserves Restatement, have been adjusted in the Netherlands GAAP financial statements through a restatement of the comparative results for the years ended December 31, 2002, 2001 and 2000.
Quantitative information concerning the effect of the above changes in accounting policies and adjustments is set forth in the tables below and additional information is contained in Note 2(b) on pages G8 to G10.
| Statement of Income | $ million | |||||||||||||||||||||||||||||||||||
| 2002 | 2001 | 2000 | ||||||||||||||||||||||||||||||||||
| Second | Second | Second | ||||||||||||||||||||||||||||||||||
| As previously | Reserves | As | As previously | Reserves | As | As previously | Reserves | As | ||||||||||||||||||||||||||||
| restated | Restatement | restated | restated | Restatement | restated | restated | Restatement | restated | ||||||||||||||||||||||||||||
| Net proceeds | 179,315 | – | 179,315 | 135,131 | – | 135,131 | 149,053 | – | 149,053 | |||||||||||||||||||||||||||
| Cost of sales | 150,831 | 118 | 150,949 | 108,151 | 94 | 108,245 | 118,163 | 112 | 118,275 | |||||||||||||||||||||||||||
| Exploration | 1,073 | – | 1,073 | 910 | – | 910 | 836 | – | 836 | |||||||||||||||||||||||||||
| Other operating expenses | 12,027 | – | 12,027 | 9,529 | – | 9,529 | 9,422 | – | 9,422 | |||||||||||||||||||||||||||
| Share of operating profit of associated companies | 2,822 | (6 | ) | 2,816 | 2,646 | (2 | ) | 2,644 | 4,101 | (2 | ) | 4,099 | ||||||||||||||||||||||||
Operating profit | 18,206 | (124 | ) | 18,082 | 19,187 | (96 | ) | 19,091 | 24,733 | (114 | ) | 24,619 | ||||||||||||||||||||||||
| Net interest expense and currency exchange gains/losses | 629 | – | 629 | 104 | – | 104 | 464 | – | 464 | |||||||||||||||||||||||||||
Income before taxation | 17,577 | (124 | ) | 17,453 | 19,083 | (96 | ) | 18,987 | 24,269 | (114 | ) | 24,155 | ||||||||||||||||||||||||
| Taxation | 7,796 | (54 | ) | 7,742 | 8,404 | (44 | ) | 8,360 | 11,349 | (54 | ) | 11,295 | ||||||||||||||||||||||||
| Minority interests | 179 | (4 | ) | 175 | 329 | (3 | ) | 326 | 54 | (7 | ) | 47 | ||||||||||||||||||||||||
Net income | 9,602 | (66 | ) | 9,536 | 10,350 | (49 | ) | 10,301 | 12,866 | (53 | ) | 12,813 | ||||||||||||||||||||||||
G 48 Royal Dutch/ Shell Group of Companies
20-F/A (Amendment No. 2) 2002
Table of Contents
The total impact of the Reserves Restatement is a reduction in net income of $174 million in 2002 (2001: $91 million; 2000: $133 million).
| Statement of Assets and Liabilities | $ million | ||||||||||||||||||||||||
| December 31, 2002 | December 31, 2001 | ||||||||||||||||||||||||
| As previously | Second Reserves | As previously | Second Reserves | ||||||||||||||||||||||
| restated | Restatement | As restated | restated | Restatement | As restated | ||||||||||||||||||||
| Fixed assets | |||||||||||||||||||||||||
| Tangible | 81,757 | (324 | ) | 81,433 | 53,156 | (206 | ) | 52,950 | |||||||||||||||||
| Intangible | 4,576 | – | 4,576 | 939 | – | 939 | |||||||||||||||||||
| Investments | 21,087 | (3 | ) | 21,084 | 21,354 | (1 | ) | 21,353 | |||||||||||||||||
| Other long-term assets | 7,333 | – | 7,333 | 7,716 | – | 7,716 | |||||||||||||||||||
| Current assets | 41,655 | – | 41,655 | 30,717 | – | 30,717 | |||||||||||||||||||
| Current liabilities | 55,201 | – | 55,201 | 33,467 | – | 33,467 | |||||||||||||||||||
| Long-term liabilities | 16,061 | – | 16,061 | 8,576 | – | 8,576 | |||||||||||||||||||
| Provisions | |||||||||||||||||||||||||
| Deferred taxation | 12,696 | (145 | ) | 12,551 | 7,173 | (95 | ) | 7,078 | |||||||||||||||||
| Pensions and decommissioning | 8,544 | – | 8,544 | 4,946 | – | 4,946 | |||||||||||||||||||
| Minority interests | 3,582 | (14 | ) | 3,568 | 3,476 | (10 | ) | 3,466 | |||||||||||||||||
Net assets | 60,324 | (168 | ) | 60,156 | 56,244 | (102 | ) | 56,142 | |||||||||||||||||
| Parent Companies’ Interest in Group net assets | $ million | ||||||||||||
| 2002 | 2001 | 2000 | |||||||||||
| At December 31 as previously restated | 60,324 | 56,244 | 57,669 | ||||||||||
| Effect of the Second Reserves Restatement: | |||||||||||||
| Interest at the beginning of the year | (102 | ) | (53 | ) | – | ||||||||
| Net income for the year | (66 | ) | (49 | ) | (53 | ) | |||||||
At December 31 as restated | 60,156 | 56,142 | 57,616 | ||||||||||
The total impact of the Reserves Restatement is a reduction in Group net assets of $444 million at December 31, 2002 (2001: $266 million; 2000: $175 million).
32(c) Reconciliation between US GAAP and Netherlands GAAP (as restated)
Please refer to the Notes to the Financial Statements prepared in accordance with US GAAP on pages G5 to G42. The following table provides a reconciliation between US GAAP and Netherlands GAAP for Group net income and net assets.
| $ million | ||||||||||||||||||||
| Net income | Net assets | |||||||||||||||||||
| 2002 | 2001 | 2000 | Dec 31, 2002 | Dec 31, 2001 | ||||||||||||||||
| In accordance with US GAAP | 9,656 | 10,301 | 12,813 | 60,276 | 56,142 | |||||||||||||||
Adjustment for Netherlands GAAP: | ||||||||||||||||||||
| Goodwill amortisation | (120 | ) | – | – | (120 | ) | – | |||||||||||||
| Long-term commitments | – | – | – | – | – | |||||||||||||||
| In accordance with Netherlands GAAP | 9,536 | 10,301 | 12,813 | 60,156 | 56,142 | |||||||||||||||
Where applicable, differences between Netherlands GAAP and US GAAP affecting these Notes are disclosed below.
The above table should be used to understand the differences in the movements in the Group’s net assets found in Notes 29 and 36 as the tables are prepared based on US GAAP and Netherlands GAAP respectively.
Royal Dutch/Shell Group of Companies G 49
20-F/A (Amendment No. 2) 2002
Table of Contents
| 33 Tangible and intangible fixed assets (as restated) | $ million | |||||||||||||||||||||||
| 2002 | 2001 | |||||||||||||||||||||||
| Other | Total | Total | Total | |||||||||||||||||||||
| Tangible | Goodwill | intangibles | intangibles | Group | Group | |||||||||||||||||||
Cost | ||||||||||||||||||||||||
| At January 1 | 119,771 | 1,512 | 902 | 2,414 | 122,185 | 115,624 | ||||||||||||||||||
| Capital expenditure | 11,755 | 129 | 218 | 347 | 12,102 | 9,598 | ||||||||||||||||||
| Assets assumed on acquisitions (Enterprise Oil, Pennzoil-Quaker State and DEA and additional shares in Equilon) | 20,178 | 1,743 | 1,364 | 3,107 | 23,285 | – | ||||||||||||||||||
| Sales, retirements and other movements | (905 | ) | 30 | 410 | 440 | (465 | ) | (93 | ) | |||||||||||||||
| Currency translation differences | 9,770 | 86 | 64 | 150 | 9,920 | (2,944 | ) | |||||||||||||||||
| At December 31 | 160,569 | 3,500 | 2,958 | 6,458 | 167,027 | 122,185 | ||||||||||||||||||
Depreciation | ||||||||||||||||||||||||
| At January 1 | 66,821 | 1,147 | 328 | 1,475 | 68,296 | 66,018 | ||||||||||||||||||
| Depreciation, depletion and amortisation charge | 8,534 | 133 | 192 | 325 | 8,859 | 6,295 | ||||||||||||||||||
| Sales, retirements and other movements | (1,539 | ) | (27 | ) | 42 | 15 | (1,524 | ) | (2,295 | ) | ||||||||||||||
| Currency translation differences | 5,320 | 43 | 24 | 67 | 5,387 | (1,722 | ) | |||||||||||||||||
| At December 31 | 79,136 | 1,296 | 586 | 1,882 | 81,018 | 68,296 | ||||||||||||||||||
Net 2002 | 81,433 | 2,204 | 2,372 | 4,576 | 86,009 | |||||||||||||||||||
| 2001 | 52,950 | 365 | 574 | 939 | 53,889 | |||||||||||||||||||
There is an increase in depreciation, depletion and amortisation for intangible fixed assets recorded in cost of sales in 2002 of $120 million (2001: $ nil), with a cumulative impact of $120 million at December 31, 2002, compared with Note 10 prepared under US GAAP. This relates to the amortisation of goodwill under Netherlands GAAP. The increase in the cost of tangible fixed assets at December 31, 2002 of $3.1 billion (2001: $2.2 billion) compared with Note 10 relates to the different treatment of certain long-term commitments. Goodwill arising on the acquisition of Pennzoil-Quaker State is amortised over forty years. Continued brand maintenance in addition to the established long-term leadership of these brands in automotive lubricants and vehicle care markets support this amortisation period.
| 34 | Debt |
The increase in debt at December 31, 2002 of $3.1 billion (2001: $2.2 billion), compared with Note 15 prepared under US GAAP, relates to the different treatment of certain long-term commitments.
| (a) | Long-term debt |
| $ million | ||||||||
| 2002 | 2001 | |||||||
| As restated | As restated | |||||||
| Debentures and other loans | 5,523 | 937 | ||||||
| Amounts due to banks and other credit institutions | 794 | 667 | ||||||
| 6,317 | 1,604 | |||||||
| Capitalised lease obligations | 3,570 | 2,457 | ||||||
Long-term debt | 9,887 | 4,061 | ||||||
| add long-term debt due within one year | 2,253 | 1,682 | ||||||
| Long-term debt including long-term debt due within one year | 12,140 | 5,743 | ||||||
G 50 Royal Dutch/ Shell Group of Companies
20-F/A (Amendment No. 2) 2002
Table of Contents
| (b) | Capitalised lease obligations |
The future minimum lease payments under capital leases and the present value of net minimum capital lease payments at December 31, 2002 are as follows:
| $ million | ||||
| Capital | ||||
| leases | ||||
| 2003 | 939 | |||
| 2004 | 288 | |||
| 2005 | 320 | |||
| 2006 | 323 | |||
| 2007 | 335 | |||
| 2008 and after | 4,195 | |||
| Total minimum payments | 6,400 | |||
lessexecutory costs and interest | 2,765 | |||
| Present value of net minimum capital lease payments | 3,635 | |||
| 35 | Information by geographical area and by industry segment |
See Note 24 prepared under US GAAP. The difference under Netherlands GAAP for net income, arises from increased depreciation, depletion and amortisation in 2002 as shown in Note 31 (the majority of which relates to the Oil Products segment). The difference in tangible fixed assets at December 31, 2002 and 2001 and in goodwill at December 31, 2002 is shown in Note 33 and the difference in total liabilities at December 31, 2002 and 2001 is shown in Note 34.
| 36 | Division of Group net assets between the Parent Companies and movements therein |
Arrangements between Royal Dutch and Shell Transport provide,inter alia, that notwithstanding variations in shareholdings, Royal Dutch and Shell Transport shall share in the aggregate net assets and in the aggregate dividends and interest received from Group companies in the proportion of 60:40. It is further arranged that the burden of all taxes in the nature of, or corresponding to, an income tax leviable in respect of such dividends and interest shall fall in the same proportion.
Royal Dutch/Shell Group of Companies G 51
20-F/A (Amendment No. 2) 2002
Table of Contents
The division of Group net assets and movements therein, including Group net income, is as follows:
| $ million | ||||||||||||
| Royal | Shell | |||||||||||
| Total | Dutch (60%) | Transport (40%) | ||||||||||
| As restated | As restated | As restated | ||||||||||
| At January 1, 2000 | 56,601 | 33,961 | 22,640 | |||||||||
| Movements during the year 2000: | ||||||||||||
| Group net income | 12,813 | 7,688 | 5,125 | |||||||||
| less: distributions to Parent Companies | (8,579 | ) | (5,147 | ) | (3,432 | ) | ||||||
| Undistributed net income | 4,234 | 2,541 | 1,693 | |||||||||
| Movement in Parent Companies’ shares held by Group companies, net of dividends received | (200 | ) | (120 | ) | (80 | ) | ||||||
| Other comprehensive income (see Note 5) | (3,019 | ) | (1,812 | ) | (1,207 | ) | ||||||
| At December 31, 2000 | 57,616 | 34,570 | 23,046 | |||||||||
| Movements during the year 2001: | ||||||||||||
| Group net income | 10,301 | 6,180 | 4,121 | |||||||||
| less: distributions to Parent Companies | (9,163 | ) | (5,498 | ) | (3,665 | ) | ||||||
| Undistributed net income | 1,138 | 682 | 456 | |||||||||
| Movement in Parent Companies’ shares held by Group companies, net of dividends received | (642 | ) | (385 | ) | (257 | ) | ||||||
| Other comprehensive income (see Note 5) | (1,970 | ) | (1,182 | ) | (788 | ) | ||||||
| At December 31, 2001 | 56,142 | 33,685 | 22,457 | |||||||||
| Movements during the year 2002: | ||||||||||||
| Group net income | 9,536 | 5,722 | 3,814 | |||||||||
| less: distributions to Parent Companies | (5,435 | ) | (3,261 | ) | (2,174 | ) | ||||||
| Undistributed net income | 4,101 | 2,461 | 1,640 | |||||||||
| Movement in Parent Companies’ shares held by Group companies, net of dividends received | (844 | ) | (507 | ) | (337 | ) | ||||||
| Other comprehensive income (see Note 5) | 757 | 455 | 302 | |||||||||
At December 31, 2002 | 60,156 | 36,094 | 24,062 | |||||||||
The above table is based on the Group’s Netherlands GAAP results. See the “Reconciliation between US GAAP and Netherlands GAAP (as restated)” table in Note 32(c) for the impact of differences between US GAAP and Netherlands GAAP on the Group’s net assets.
G 52 Royal Dutch/ Shell Group of Companies
20-F/A (Amendment No. 2) 2002
Table of Contents
| Restatement of previously issued Financial Statements | $ million | |||||||||||||||||||||||||||||||||||
| Royal | Shell | |||||||||||||||||||||||||||||||||||
| Dutch | Transport | |||||||||||||||||||||||||||||||||||
| (60%) | (40%) | |||||||||||||||||||||||||||||||||||
| Previously | As | Previously | As | Previously | As | |||||||||||||||||||||||||||||||
| reported | Adjustments | restated | reported | Adjustments | restated | reported | Adjustments | restated | ||||||||||||||||||||||||||||
| At January 1, 2000 | 56,171 | 430 | 56,601 | 33,703 | 258 | 33,961 | 22,468 | 172 | 22,640 | |||||||||||||||||||||||||||
| Movements during the year 2000: | ||||||||||||||||||||||||||||||||||||
| Group net income | 12,719 | 94 | 12,813 | 7,631 | 57 | 7,688 | 5,088 | 37 | 5,125 | |||||||||||||||||||||||||||
| less: distributions to Parent Companies | (8,579 | ) | – | (8,579 | ) | (5,147 | ) | – | (5,147 | ) | (3,432 | ) | – | (3,432 | ) | |||||||||||||||||||||
| Undistributed net income | 4,140 | 94 | 4,234 | 2,484 | 57 | 2,541 | 1,656 | 37 | 1,693 | |||||||||||||||||||||||||||
| Movement in Parent Companies’ shares held by Group companies, net of dividends received | (200 | ) | – | (200 | ) | (120 | ) | – | (120 | ) | (80 | ) | – | (80 | ) | |||||||||||||||||||||
| Other comprehensive income (see Note 5) | (3,025 | ) | 6 | (3,019 | ) | (1,815 | ) | 3 | (1,812 | ) | (1,210 | ) | 3 | (1,207 | ) | |||||||||||||||||||||
| At December 31, 2000 | 57,086 | 530 | 57,616 | 34,252 | 318 | 34,570 | 22,834 | 212 | 23,046 | |||||||||||||||||||||||||||
| Movements during the year 2001: | ||||||||||||||||||||||||||||||||||||
| Group net income | 10,852 | (551 | ) | 10,301 | 6,511 | (331 | ) | 6,180 | 4,341 | (220 | ) | 4,121 | ||||||||||||||||||||||||
| less: distributions to Parent Companies | (9,163 | ) | – | (9,163 | ) | (5,498 | ) | – | (5,498 | ) | (3,665 | ) | – | (3,665 | ) | |||||||||||||||||||||
| Undistributed net income | 1,689 | (551 | ) | 1,138 | 1,013 | (331 | ) | 682 | 676 | (220 | ) | 456 | ||||||||||||||||||||||||
| Movement in Parent Companies’ shares held by Group companies, net of dividends received | (642 | ) | – | (642 | ) | (385 | ) | – | (385 | ) | (257 | ) | – | (257 | ) | |||||||||||||||||||||
| Other comprehensive income (see Note 5) | (1,973 | ) | 3 | (1,970 | ) | (1,184 | ) | 2 | (1,182 | ) | (789 | ) | 1 | (788 | ) | |||||||||||||||||||||
| At December 31, 2001 | 56,160 | (18 | ) | 56,142 | 33,696 | (11 | ) | 33,685 | 22,464 | (7 | ) | 22,457 | ||||||||||||||||||||||||
| Movements during the year 2002: | ||||||||||||||||||||||||||||||||||||
| Group net income | 9,419 | 117 | 9,536 | 5,651 | 71 | 5,722 | 3,768 | 46 | 3,814 | |||||||||||||||||||||||||||
| less distributions to Parent Companies | (5,435 | ) | – | (5,435 | ) | (3,261 | ) | – | (3,261 | ) | (2,174 | ) | – | (2,174 | ) | |||||||||||||||||||||
| Undistributed net income | 3,984 | 117 | 4,101 | 2,390 | 71 | 2,461 | 1,594 | 46 | 1,640 | |||||||||||||||||||||||||||
| Movement in Parent Companies’ shares held by Group companies, net of dividends received | (844 | ) | – | (844 | ) | (507 | ) | – | (507 | ) | (337 | ) | – | (337 | ) | |||||||||||||||||||||
| Other comprehensive income (Note 5) | 764 | (7 | ) | 757 | 459 | (4 | ) | 455 | 305 | (3 | ) | 302 | ||||||||||||||||||||||||
| At December 31, 2002 | 60,064 | 92 | 60,156 | 36,038 | 56 | 36,094 | 24,026 | 36 | 24,062 | |||||||||||||||||||||||||||
| Parent Companies’ interest in Group net assets | $ million | ||||||||||||
| 2002 | 2001 | 2000 | |||||||||||
| As restated | As restated | As restated | |||||||||||
| Invested by Parent Companies | 741 | 741 | 741 | ||||||||||
| Retained earnings of Group companies | 68,134 | 64,033 | 62,895 | ||||||||||
| Parent Companies’ shares held, net of dividends received (Note 22) | (2,797 | ) | (1,953 | ) | (1,311 | ) | |||||||
| Cumulative currency translation differences | (3,894 | ) | (6,326 | ) | (4,640 | ) | |||||||
| Unrealised gains/(losses) on: | |||||||||||||
| securities | 11 | (14 | ) | 129 | |||||||||
| cash flow hedges | (239 | ) | (14 | ) | – | ||||||||
| Minimum pension liability adjustments | (1,800 | ) | (325 | ) | (198 | ) | |||||||
| Balance of December 31 | 60,156 | 56,142 | 57,616 | ||||||||||
The reduction in retained earnings of Group companies at December 31, 2002 of $120 million compared with Note 4 prepared in accordance with US GAAP, relates to the amortisation of goodwill under Netherlands GAAP.
Royal Dutch/Shell Group of Companies G 53
20-F/A (Amendment No. 2) 2002
Table of Contents
Supplementary information – Oil and Gas (unaudited)
Preliminary Note: The information contained in this section constitutes a restatement of the information contained under the same heading in the Original Form 20-F. The restatement is described more fully below under “Recategorisation and restatement of unaudited proved reserves volumes”.
Reserves
Net quantities (which are unaudited) of proved oil and gas reserves are shown in the tables on pages G60 through G67. Proved reserves are the estimated quantities of crude oil, natural gas and natural gas liquids which geological and engineering data demonstrate with reasonable certainty to be recoverable in future years from known reservoirs under existing economic and operating conditions,ie, prices and costs as of the date the estimate is made. Proved developed oil and gas reserves are reserves that can be expected to be recovered through existing wells with existing equipment and operating methods. The unaudited reserve volumes reported exclude volumes attributable to oil and gas discoveries which are not at present considered proved. Such volumes will be included when technical, fiscal and other conditions allow them to be economically developed and produced.
Proved reserves are shown net of any quantities of crude oil or natural gas that are expected to be taken by others as royalties in kind but do not exclude quantities related to royalties expected to be paid in cash (except in North America and in other situations in which the royalty quantities are owned by others) or those related to fixed margin contracts. Proved reserves include certain quantities of crude oil or natural gas which will be produced under arrangements which involve Group companies in upstream risks and rewards but do not transfer title of the product to those companies.
Oil and gas reserves cannot be measured exactly since estimation of reserves involves subjective judgment. These estimates remain subject to revision and are unaudited supplementary information.
Recategorisation and restatement of unaudited proved reserves volumes
First Half Review
As announced on January 9, 2004, March 18, 2004, and April 19, 2004, the Group reviewed its proved reserves inventory (with the assistance of external consultants) during the period from late 2003 to April 2004 (collectively, the First Half Review). Following the First Half Review, 4,474 million barrels of oil equivalent (boe)1 previously booked at December 31, 2002 as proved reserves have been recategorised as not proved (this was the subject of the announcement made on January 9, 2004, as updated on March 18, 2004 and April 19, 2004 and herein).
The results of the First Half Review were reflected in the restatement of proved reserves and of the standardised measure of discounted future net cash flows contained in the 2003 Annual Report on Form 20-F as originally filed on June 30, 2004 (the First Reserves Restatement).
Second Half Review
As announced on October 28, 2004, November 26, 2004 and February 3, 2005, the Group performed additional reviews of its proved reserves inventory (with the assistance of external consultants) during the period from July 2004 to December 2004 (collectively, the Second Half Review and, together with the First Half Review, the Reserves Reviews). As a result of the Second Half Review, 1,153 million boe previously booked at December 31, 2002 as proved reserves have been recategorised as not proved (this was also the subject of the announcement made on February 3, 2005 and herein). These changes are reflected in the further restatement of proved reserves and the standardised measure of future cash flows contained herein (the Second Reserves Restatement).
The Second Half Review reflected the implementation of certain remedial actions undertaken following the First Half Review and First Reserves Restatement, and in light of the report of Davis, Polk & Wardwell to the Group Audit Committee. These actions were designed to strengthen the controls relating to the reporting of proved reserves and included the following:
| • | The Group’s reserves reporting guidelines have been revised to comply with SEC requirements and published SEC staff guidance. | |
| • | The Group implemented a program to train approximately 3,000 staff members in the revised proved reserve guidelines. This training effort was substantially completed during the fourth quarter of 2004. | |
| • | Beginning in July 2004, asset teams in each operating unit, using the revised guidelines and in some cases assisted by external consultants, undertook a reservoir-by-reservoir review of the Group’s proved reserve base as part of its annual reserves determination process. |
| 1 | For this purpose, the Group has converted natural gas to crude oil equivalent using a factor of 5,800 standard cubic feet per barrel. |
G 54 Royal Dutch/ Shell Group of Companies
20-F/A (Amendment No. 2) 2002
Table of Contents
Supplementary information – Oil and Gas (unaudited)
| • | Teams from Group internal audit, assisted by separate external consultants, conducted on-site reviews to evaluate compliance of reported volumes with SEC requirements, as well as the functioning of the reserves control framework and governance. For 2004, this audit process covered approximately 90% of the Group’s proved reserves originally reported in the 2003 Form 20-F as filed on June 30, 2004 (14,350 million boe). The findings of Group internal audit are reported directly to management and the Group Audit Committee. | |
| • | All changes to proved reserves, have been agreed by the Regional Reserves Committee and the Global Reserves Committee and reviewed by the Executive Committee, the Group Audit Committee and the boards of the Parent Companies. |
See “Controls and Procedures – Remedial Actions” for an additional discussion of the remedial actions taken following the First Half Review and in light of the report to the Group Audit Committee of Davis, Polk & Wardwell.
Reserves Restatement
The cumulative effects of the First Reserves Restatement and Second Reserves Restatement (collectively, the Reserves Restatement) are set forth in the reconciliation table on pages G60 to G63 and in the tables on pages G64 to G69, which reflect a restatement of the Group’s unaudited proved reserve volumes for the three years ended December 31, 2000, December 31, 2001 and December 31, 2002, as well as a restatement of the standardised measure of discounted future cash flows.
In addition to the reduction in proved reserves set out in the tables on pages G64 to G69, the Reserves Restatement reflects changes in the timing of the initial booking or de-booking of certain proved reserves. Approximately 930 million boe of proved reserves situated in the West Africa Deep Water province and Australia (North West Shelf) were compliant with proved reserves definitions as at December 31, 2002, but the First Half Review has indicated that the original bookings in 2000 and prior years were made in advance of a sufficient investment commitment and/or assurance of market availability to support the booking. These changes bring the timing of these proved reserves additions into line with commitments to investment and/or contractual product sales, most of which were made in the period 1999 to 2002. Accordingly, these quantities do not change the total reduction in proved reserves as at December 31, 2002, because they qualified as proved reserves at that date, although they do affect the trend of reserves bookings over the period covered by this report and affect the calculation of the reserves replacement ratio.
Variations from SEC Requirements
The Group has determined that during the periods prior to the Reserves Restatement, its reserves bookings were not fully consistent with the definition of proved reserves as set forth in Rule 4-10 of Regulation S-X under the U.S. Securities Exchange Act of 1934 (Rule 4-10), and the interpretations of that Rule by the staff of the Division of Corporation Finance of the US Securities and Exchange Commission (SEC). In particular, the Group has determined that its prior guidelines contained interpretations and allowed for reserve determinations that were not consistent with Rule 4-10 and SEC staff interpretations of Rule 4-10. The principal areas of variation that are reflected in the Reserves Restatement are discussed below.
First Reserves Restatement
Investment commitment
Volumes of hydrocarbons were booked as proved reserves with respect to certain projects for which there was found subsequently not to be a sufficient level of investment commitment to conclude that there was “reasonable certainty” of recovery of those volumes in future years under existing economic and operating conditions (as defined in SEC staff interpretations of Rule 4-10). Under prior Group guidelines, proved reserves were booked in some cases upon progress with development planning. However, this did not in all cases meet the requirement under Rule 4-10 to demonstrate specific commitment to development actions. Examples include properties in Nigeria (various fields), Norway (Ormen Lange field) and New Zealand (Pohokura field). This factor was also a consideration in Australia (Gorgon field).
Market assurance
Volumes of hydrocarbons were booked as proved reserves with respect to certain projects for which there was insufficient evidence of future market demand at the date of booking to conclude that there was “reasonable certainty” that it would be economic to recover those volumes under conditions existing at the date of booking. The primary example of this category was Australia (Gorgon field and other North West Shelf properties), but it was also a factor in determining reserves restatements for other properties that rely on the long-term extension or renewal of existing sales contracts.
Governmental or regulatory approval
Volumes of hydrocarbons were booked as proved reserves with respect to certain projects for which governmental or regulatory approvals were not sufficiently assured for there to be “reasonable certainty” of the recovery of those volumes in future years. The
Royal Dutch/Shell Group of Companies G 55
20-F/A (Amendment No. 2) 2002
Table of Contents
Supplementary information – Oil and Gas (unaudited)
main examples of such properties are in Kazakhstan (Kashagan field), Ireland (Corrib field), Italy (Tempa Rossa field) and the Netherlands (Waddenzee fields).
Field performance and project delivery
Volumes of hydrocarbons were booked and maintained as proved reserves with respect to certain development projects in producing fields notwithstanding a deferment in project execution or a decline in actual production volumes and forecasts when these indications should have suggested that there was no longer “reasonable certainty” that the originally estimated volumes would be recovered in the future. These issues arose mainly in fields in the Middle East and Nigeria.
Year-end pricing
Volume entitlements under Production Sharing Contracts, and other agreements for which reserves are estimated using the “economic entitlement” method, were determined using the prices that were used internally by the Group for screening investment decisions and for business planning, rather than the year-end price as required under Rule 4-10. When applying year-end prices to such reserves estimates, the resulting reserves figure is usually inversely related to product price, such that at times of high price there will be a lower reserves entitlement than at times of low price, all other factors being equal. Several properties in the Group’s portfolio are affected in this manner.
Technical definition
Volumes of hydrocarbons were booked as proved reserves with respect to some projects prior to the development of sufficient data to meet certain technical requirements established by the SEC staff in interpreting the definition of “reasonable certainty” in Rule 4-10. The primary examples are:
| • | Lowest Known Hydrocarbon: In some cases, volumes occurring below the “Lowest Known Hydrocarbon” (ie, the deepest point that has been logged as hydrocarbon-bearing) had been included in proved reserves estimates. Such volumes were considered defensible prior to 2003 generally on the grounds that evidence of the location of fluid contacts was available through measurements of the pressure gradients in the reservoirs concerned. This volume was estimated to be 172 million boe at the end of 2003 and has been accounted for as a revision during the year 2003. It has not been included in the Reserves Restatement for prior years. | |
| • | Proved Area – Lateral Extent: In some cases, volumes occurring in parts of the reservoir that are more than one offset development well location from existing well penetrations had been booked as proved reserves in the absence of sufficient proof of continuous and economically productive reservoir in the areas concerned. This volume was estimated to be 180 million boe at the end of 2003 and substantially all has been accounted for through restatement of proved reserves for prior years. The 2003 reserves additions as announced on February 5, 2004 were also reduced by approximately 180 million boe as a result of these issues. | |
| • | Improved Recovery – Availability of Suitable Analogues: In some cases, volumes related to the successful implementation of improved recovery processes had been booked as proved reserves in the absence of either qualifying analogues or sufficient performance proof SEC guidance requires “reasonable certainty” that the processes would be effective in the specific reservoirs concerned. This volume was estimated to be 160 million boe at the end of 2003 and substantially all has been accounted for through restatement of proved reserves for prior years. | |
| • | Recovery Factor Forecasting Methodology: In some cases, volumes booked on the basis of sophisticated computer modelling were not sufficiently supported by actual reservoir performance, as seen principally in decline curve analysis, to satisfy the requirement of “reasonable certainty” in the estimation of proved reserves. This volume was estimated to be 160 million boe at the end of 2003 and substantially all has been accounted for through the revisions occurring during the year 2003. | |
| • | Economic Producibility: In some cases, proved reserves may have been assigned to reservoirs in the absence of information from a combination of electrical and other type logs and core analyses sufficient to indicate the reservoirs were analogous to similar reservoirs in the same field which were producing or had demonstrated the ability to produce on a formation test. However, there were no material instances of reserves being debooked solely for this reason. |
Royalty
For the years ended 1999 to 2002, proved reserves and production had been recorded with respect to royalties paid in cash on properties in Canada. These have been removed from proved reserves, resulting in a reduction in unaudited proved reserves of
G 56 Royal Dutch/ Shell Group of Companies
20-F/A (Amendment No. 2) 2002
Table of Contents
Supplementary information – Oil and Gas (unaudited)
103 million boe at December 31, 2003 and 89 million boe at December 31 2002, and a reduction in production of 9 million boe for 2003 and 14 million boe for 2002.
Second Reserves Restatement
Lowest Known Hydrocarbon: In some cases, volumes occurring below the “Lowest Known Hydrocarbon” (ie, the deepest point that has been logged as hydrocarbon-bearing) had been included in proved reserves estimates. Such volumes were considered defensible prior to 2003 on the grounds that evidence of the location of fluid contacts was available through measurements of the pressure gradients in the reservoirs concerned. The volume identified in the Second Half Review was estimated to be 71 million boe at the end of 2003 (5% of the Second Reserves Restatement) and has been accounted for as a revision during in 2003. Africa accounts for 60% of this volume followed by Asia Pacific (25%) and Europe (15%).
Proved Area – Lateral Extent: In some cases, volumes occurring in parts of the reservoir that are more than one offset development well location from existing well penetrations had been booked as proved reserves in the absence of sufficient proof of continuous and economically productive reservoir in the areas concerned. The volume identified in the Second Half Review was estimated to be 420 million boe at the end of 2003 (31% of the Second Reserves Restatement) and has been accounted for through restatement of proved reserves for prior years. Africa accounts for 48% of this volume followed by Asia Pacific (32%) and Middle East (13%).
Improved Recovery – Availability of Suitable Analogues: In some cases, volumes related to the successful implementation of improved recovery processes had been booked as proved reserves in the absence of either qualifying analogues or sufficient performance proof. SEC guidance requires “reasonable certainty” that the processes will be effective in the specific reservoirs concerned. The volume identified in the Second Half Review was estimated to be 127 million boe at the end of 2003 (9% of the Second Reserves Restatement) and has been accounted for through restatement of proved reserves for prior years. Western Hemisphere (excluding USA) accounts for 48% of this volume followed by Africa (42%) and Europe (10%).
Recovery Factor Forecasting Methodology: In some cases, volumes booked on the basis of sophisticated computer modelling were not sufficiently supported by actual reservoir performance, as seen principally in decline curve analysis, to satisfy the requirement of “reasonable certainty” in the estimation of proved reserves. The volume identified in the Second Half Review was estimated to be 681 million boe at the end of 2003 (50% of the Second Reserves Restatement) and has been accounted for through restatement of proved reserves for prior years. Europe accounts for 45% of this volume followed by Asia Pacific (27%) and Africa (26%).
Other Reasons: In some cases, volumes have been removed from proved reserves for other reasons, principally lack of investment commitment. The volume identified in the Second Half Review was approximately 73 million boe at the end of 2003 (5% of the Second Reserves Restatement).
Effect of Reserves Restatement
The tables on pages G64 to G69 show restated amounts of unaudited proved reserve volumes and a restated calculation of the standardised measure of discounted future net cash flows for 2002, 2001 and 2000 giving effect to the First Reserves Restatement and Second Reserves Restatement. The allocation to particular years of quantities to be removed from the proved reserves category for some of the mature producing areas has involved the use of estimates as to timing, owing to the practical difficulties in associating particular volumes with particular projects at specific times in the past. Effect has been given to the Reserves Restatement through the removal of proved reserves either in the year in which those reserves were originally booked or the year during which those reserves no longer constituted proved reserves under the SEC rules, as applicable. The tables on pages G60 to G63 presents a statement of proved reserves (or standardised measure) as originally reported, the effects of the First Reserves Restatement and the Second Reserves Restatement on the opening reserves or standardised measure balances for each year concerned, the effect of the First Reserves Restatement and the Second Reserves Restatement on movements during each year and the restated closing balance.
All tables have been reformatted compared with previous years’ disclosures to provide further geographical detail. The “Europe” and “USA” groupings remain unchanged in terms of the definition of constituent countries, as does the “Western Hemisphere, Other” region. The previously reported “Eastern Hemisphere, Other” region has been divided into three new geographical groupings: “Africa”, “Asia Pacific” and “Middle East, Russia and Commonwealth of Independent States (CIS)”, the latter also being referred to as the “Middle East” region below for convenience. Egypt is included in the “Middle East” region, as are Sakhalin and states bordering the Caspian Sea. The revised geographical grouping is aligned with the division of the Group’s Exploration and Production business into regional directorates for internal management purposes.
Royal Dutch/Shell Group of Companies G 57
20-F/A (Amendment No. 2) 2002
Table of Contents
Supplementary information – Oil and Gas (unaudited)
The effect of the Reserves Restatement on unaudited proved reserve volumes and the standardised measure for each of the years covered by this report is summarised as follows:
Year ended December 31, 2002
At December 31, 2002 (and January 1, 2003), the aggregated effect on unaudited proved reserve volumes of the Reserves Restatement was 5,626 million boe, comprising 3,493 million barrels of crude oil and natural gas liquids and 12,373 thousand million standard cubic feet of gas. This amounts to 29% of the total unaudited proved reserve volumes originally stated at that date (19,346 million boe). Of the total unaudited proved reserves restated, 90% (5,051 million boe) was attributable to Group companies and the remainder was attributable to associated companies. 18% of the total had been in the proved developed reserves category and 82% had been categorised as proved undeveloped reserves. Africa accounts for 36% of the total restatement, Asia Pacific 29%, Middle East 17%, Europe 12%, and Other Western Hemisphere 6%. Various properties in Nigeria accounted for 35% of the restated volume and the Gorgon field and other properties in Australia accounted for 16%. The effect of applying year-end pricing accounted for 6% of the total. Please refer to the narrative above for explanation of the principal reasons for the Reserves Restatement. After giving effect to the Reserves Restatement, the proportion of total unaudited proved reserve volumes that was accounted for as proved developed reserves at that date increased from 46%, as originally stated, to 57%.
The Reserves Restatement gave rise to an estimated reduction of $10,542 million in the standardised measure of discounted future net cash flow for Group companies and a further $1,470 million for associated companies. Together, these effects equate to approximately 17% of the total standardised measure that was originally stated at that date. The reduction of the net present value disclosed by the standardised measure includes an offset due to the correction of an error in the original statement that was discovered during compilation of the restated figures. The error related to the application of an incorrect net margin accruing to production on a fixed margin contract and resulted in an understatement of approximately 1% of the standardised measure value originally reported for the year 2002. The percentage effect is even less in 2001.
Year ended December 31, 2001
At December 31, 2001 (and January 1, 2002), the aggregated effect on unaudited proved reserve volumes of the Reserves Restatement was 5,324 million boe, comprising 3,205 million barrels of crude oil and natural gas liquids and 12,293 thousand million standard cubic feet of gas. This amounts to 28% of the total unaudited proved reserve volumes originally stated at that date (19,095 million boe). Of the volumes restated, 88% (4,683 million boe) were attributable to Group companies and the remainder were attributable to associated companies. 16% of the total had been in the proved developed reserves category and 84% had been categorised as proved undeveloped reserves. Africa accounts for 45% of the total restatement, Asia Pacific 33%, Middle East 11%, Europe 7%, and Other Western Hemisphere 4%. Various properties in Nigeria accounted for 43% of the restated volumes at that date, Australia accounted for 19% of the total. The effect of applying year end pricing accounted for 4% of the total. After giving effect to the Reserves Restatement, the proportion of total proved reserves that was accounted for as proved developed reserves at December 31, 2001 increased from 46%, as originally stated, to 58%.
The Reserves Restatement gave rise to an estimated reduction of $7,968 million in the standardised measure of discounted future net cash flow for Group companies and a further $1,033 million reduction for associated companies. Together, these effects equate to approximately 18% of the total standardised measure that was originally stated at that date.
Year ended December 31, 2000
At December 31, 2000 (and January 1, 2001), the aggregated effect on unaudited proved reserve volumes of the Reserves Restatement was 5,584 million boe, comprising 3,346 million barrels of crude oil and natural gas liquids and 12,979 thousand million standard cubic feet of gas. This amounts to 29% of the total unaudited proved reserve volumes originally stated at that date (19,455 million boe). Of the total aggregated effect, 89% (4,995 million boe) was attributable to Group companies and the remainder was attributable to associated companies. 15% of the total had been in the proved developed reserves category and 85% had been categorised as proved undeveloped reserves. Africa accounts for 44% of the total restatement, Asia Pacific 31%, Middle East 14%, Europe 5%, and Other Western Hemisphere 5%. Various properties in Nigeria accounted for 42% of the restated volume at that date, Australia accounted for 19%. The effect of applying year-end pricing accounted for 8% of the total. After giving effect to the Reserves Restatement, the proportion of total unaudited proved reserve volumes that was accounted for as proved developed reserves at December 31, 2000 increased from 46%, as originally stated, to 59%.
The Reserves Restatement gave rise to an estimated reduction of $8,071 million in the standardised measure of discounted future net cash flow for Group companies and a further $1,198 million for associated companies. Together, these effects equate to approximately 13% of the total standardised measure that was originally stated at that date.
G 58 Royal Dutch/ Shell Group of Companies
20-F/A (Amendment No. 2) 2002
Table of Contents
Supplementary information – Oil and Gas (unaudited)
Year ended December 31, 1999
At December 31, 1999 (and January 1, 2000), the aggregated effect on unaudited proved reserve volumes of the Reserves Restatement was 5,207 million boe, comprising 2,802 million barrels of crude oil and natural gas liquids and 13,947 thousand million standard cubic feet of gas. This amounts to 26% of the total proved reserves originally stated at that date (19,868 million boe). Of the total aggregated effect, 89% (4,630 million boe) was attributable to Group companies and the remainder was attributable to associated companies. 19% of the total had been in the proved developed reserves category and 81% had been categorised as proved undeveloped reserves. Africa accounts for 47% of the total restatement, Asia Pacific 32%, Middle East 11%, Europe 5%, and Other Western Hemisphere 5%. Various properties in Nigeria accounted for 47% of the restated volume at that date, Australia accounted for 22%. The effect of applying year-end pricing accounted for 10% of the total. After giving effect to the Reserves Restatement, the proportion of total proved reserves that was accounted for as proved developed reserves at December 31, 1999 increased from 49%, as originally stated, to 60%.
Years prior to 1999
In certain cases, the affected unaudited proved reserve volumes have been removed from the proved category in years prior to 2000. Although not tabulated in detail in this report, a summary of the estimated effects on prior years is as follows:
| • | at December 31, 1998 (and January 1, 1999), the aggregate effect on proved reserves of the Reserves Restatement was 4,111 million boe, comprising 2,314 million barrels of crude oil and natural gas liquids and 10,423 thousand million standard cubic feet of gas. This amounts to 20% of the total proved reserves originally stated at that date (20,455 million boe). Of the total aggregate effect, 85% (3,501 million boe) was attributable to Group companies and the remainder was attributable to associated companies. 17% of the total had been in the proved developed reserves category and 83% had been categorised as proved undeveloped reserves. Africa accounts for 57% of the total restatement, Asia Pacific 39%, and Europe 4%. Various properties in Nigeria and Australia together accounted for 85% of the restated volume at that date; and | |
| • | at December 31, 1997 (January 1, 1998), the aggregate effect on proved reserves of the Reserves Restatement was 3,462 million boe, comprising 1,776 million barrels of crude oil and natural gas liquids and 9,779 thousand million standard cubic feet of gas. This amounts to 18% of the total proved reserves originally stated at that date (19,359 million boe). Of the total aggregate effect, 83% (2,883 million boe) was attributable to Group companies and the remainder was attributable to associated companies. 9% of the total had been in the proved developed reserves category and 91% had been categorised as proved undeveloped reserves. Africa accounts for 52% of the total restatement, Asia Pacific 45% and Europe 4%. Various properties in Nigeria and Australia together accounted for 85% of the restated volume at that date. |
Reserves replacement ratio
For the three years covered by this report (2000 – 2002), after giving effect to the Reserves Restatement, the proved oil and natural gas reserves replacement ratio (net additions to proved reserves as a percentage of production) for these three years is 77% (87% for oil, including natural gas liquids, and 63% for gas).
The five-year (1998 – 2002) reserves replacement ratio is 68% (70% for oil, including natural gas liquids, and 65% for gas).
These figures include both Group and associated companies, they include minority interests in Group companies and they include the effects of acquisitions and divestment. They exclude any contribution from oil sands projects, which do not qualify as oil and gas producing activities.
Royal Dutch/Shell Group of Companies G 59
20-F/A (Amendment No. 2) 2002
Table of Contents
Supplementary information – Oil and Gas (unaudited)
Reconciliation of previously reported Supplementary information – Oil and Gas
The following tables set forth the effect of the First Reserves Restatement and the Second Reserves Restatement on (i) the proved developed and undeveloped crude oil and nature gas reserves and natural gas reserves of Group companies and the Group Share of associated companies at December 31, 2002, 2001 and 2000, (ii) the standardised measure of discounted future net cash flows at each such date and (iii) a geographic analysis of each of the First Reserves Restatement and the Second Reserves Restatement.
Reconciliation of Proved Reserves Volumes and Standardised Measure
| million barrels | |||||||||||||||||||||||||
| Reserves: crude oil and natural gas liquids | |||||||||||||||||||||||||
| Proved developed and | Proved developed | ||||||||||||||||||||||||
| undeveloped reserves | reserves | ||||||||||||||||||||||||
| 2002 | 2001 | 2000 | 2002 | 2001 | 2000 | ||||||||||||||||||||
Group companies | |||||||||||||||||||||||||
| As originally reported at December 31 | 9,026 | 8,544 | 8,670 | 3,959 | 3,734 | 3,812 | |||||||||||||||||||
| Effect of the First Reserves Restatement | |||||||||||||||||||||||||
| Amounts at beginning of year | (2,437 | ) | (2,658 | ) | (2,246 | )b | (202 | ) | (255 | ) | (278 | )b | |||||||||||||
| Movements during the year | (184 | ) | 221 | (412 | ) | (73 | ) | 53 | 23 | ||||||||||||||||
Total | (2,621 | ) | (2,437 | ) | (2,658 | ) | (275 | ) | (202 | ) | (255 | ) | |||||||||||||
| At December 31 as previously restated | 6,405 | 6,107 | 6,012 | 3,684 | 3,532 | 3,557 | |||||||||||||||||||
| Effect of the Second Reserves Restatement | |||||||||||||||||||||||||
| Amounts at beginning of year | (507 | ) | (449 | ) | (394 | ) | (145 | ) | (79 | ) | (53 | )b | |||||||||||||
| Movements during the year | (116 | ) | (58 | ) | (55 | ) | (23 | ) | (66 | ) | (26 | ) | |||||||||||||
Total | (623 | ) | (507 | ) | (449 | ) | (168 | ) | (145 | ) | (79 | ) | |||||||||||||
At December 31 as restated | 5,782 | 5,600 | 5,563 | 3,516 | 3,387 | 3,478 | |||||||||||||||||||
Group share of associated companies | |||||||||||||||||||||||||
| As originally reported at December 31 | 1,107 | 925 | 1,081 | 667 | 598 | 657 | |||||||||||||||||||
| Effect of the First Reserves Restatement | |||||||||||||||||||||||||
| Amounts at beginning of year | (206 | ) | (186 | ) | (162 | )b | (6 | ) | (6 | ) | (1 | )b | |||||||||||||
| Movements during the year | 32 | (20 | ) | (24 | ) | (2 | ) | – | (5 | ) | |||||||||||||||
Total | (174 | ) | (206 | ) | (186 | ) | (8 | ) | (6 | ) | (6 | ) | |||||||||||||
| At December 31 as previously restated | 933 | 719 | 895 | 659 | 592 | 651 | |||||||||||||||||||
| Effect of the Second Reserves Restatement | |||||||||||||||||||||||||
| Amounts at beginning of year | (55 | ) | (53 | ) | – | (54 | ) | (52 | ) | – | |||||||||||||||
| Movements during the year | (20 | ) | (2 | ) | (53 | ) | (19 | ) | (2 | ) | (52 | ) | |||||||||||||
Total | (75 | ) | (55 | ) | (53 | ) | (73 | ) | (54 | ) | (52 | ) | |||||||||||||
At December 31 as restated | 858 | 664 | 842 | 586 | 538 | 599 | |||||||||||||||||||
Geographical analysis of the effect of First Reserves Restatement
| million barrels | |||||||||||||||||||||||||
| Reserves: crude oil and natural gas liquids | |||||||||||||||||||||||||
| Proved developed and | Proved developed | ||||||||||||||||||||||||
| undeveloped reserves | reserves | ||||||||||||||||||||||||
| 2002 | 2001 | 2000b | 2002 | 2001 | 2000b | ||||||||||||||||||||
Group companies | |||||||||||||||||||||||||
| Europe | (147 | ) | (27 | ) | (21 | ) | (2 | ) | (2 | ) | – | ||||||||||||||
Africac | (1,409 | ) | (1,745 | ) | (1,828 | ) | (235 | ) | (141 | ) | (147 | ) | |||||||||||||
Asia Pacificd | (101 | ) | (116 | ) | (108 | ) | (20 | ) | (29 | ) | (19 | ) | |||||||||||||
Middle East, Russia, CISe | (854 | ) | (494 | ) | (621 | ) | 15 | (10 | ) | (61 | ) | ||||||||||||||
| USA | – | – | – | – | – | – | |||||||||||||||||||
| Other Western Hemisphere | (110 | ) | (55 | ) | (80 | ) | (33 | ) | (20 | ) | (28 | ) | |||||||||||||
Total | (2,621 | ) | (2,437 | ) | (2,658 | ) | (275 | ) | (202 | ) | (255 | ) | |||||||||||||
Group share of associated companies | |||||||||||||||||||||||||
| Europe | – | – | – | – | – | – | |||||||||||||||||||
Africac | – | – | – | – | – | – | |||||||||||||||||||
Asia Pacificd | (174 | ) | (205 | ) | (191 | ) | (8 | ) | (6 | ) | (6 | ) | |||||||||||||
Middle East, Russia, CISe | – | (1 | ) | 5 | – | – | – | ||||||||||||||||||
| USA | – | – | – | – | – | – | |||||||||||||||||||
| Other Western Hemisphere | – | – | – | – | – | – | |||||||||||||||||||
Total | (174 | ) | (206 | ) | (186 | ) | (8 | ) | (6 | ) | (6 | ) | |||||||||||||
| a | These quantities have not been adjusted to standard heat content. |
| b | Cumulative effect of Reserves Restatements as at January 1, 2000. |
| c | Excludes Egypt |
| d | Excludes Sakhalin |
| e | Middle East and Former Soviet Union/Commonwealth of Independent States. Includes Caspian region, Egypt and Sakhalin. |
G 60 Royal Dutch/ Shell Group of Companies
20-F/A (Amendment No. 2) 2002
Table of Contents
Supplementary information – Oil and Gas (unaudited)
| thousand million standard cubic feeta | $ million | |||||||||||||||||||||||||||||||||
| Reserves: Natural gas | ||||||||||||||||||||||||||||||||||
| Standardised measure of | ||||||||||||||||||||||||||||||||||
| Proved developed and | discounted | |||||||||||||||||||||||||||||||||
| undeveloped reserves | Proved developed reserves | future cash flows | ||||||||||||||||||||||||||||||||
| 2002 | 2001 | 2000 | 2002 | 2001 | 2000 | 2002 | 2001 | 2000 | ||||||||||||||||||||||||||
| 48,240 | 50,613 | 50,842 | 22,530 | 23,938 | 24,189 | 65,702 | 45,878 | 63,041 | ||||||||||||||||||||||||||
| (8,554 | ) | (9,389 | ) | (10,209 | )b | (1,088 | ) | (1,299 | ) | (2,529 | )b | (5,464 | ) | (6,083 | ) | (5,813b | ) | |||||||||||||||||
| 604 | 835 | 820 | (80 | ) | 211 | 1,230 | 124 | 619 | (270 | ) | ||||||||||||||||||||||||
| (7,950 | ) | (8,554 | ) | (9,389 | ) | (1,168 | ) | (1,088 | ) | (1,299 | ) | (5,340 | ) | (5,464 | ) | (6,083 | ) | |||||||||||||||||
| 40,290 | 42,059 | 41,453 | 21,362 | 22,850 | 22,890 | 60,362 | 40,414 | 56,958 | ||||||||||||||||||||||||||
| (1,529 | ) | (1,563 | ) | (1,339 | )b | (1,453 | ) | (1,367 | ) | (1,258 | )b | (2,504 | ) | (1,988 | ) | (1,235 | ) | |||||||||||||||||
| (1,004 | ) | 34 | (224 | ) | 52 | (86 | ) | (109 | ) | (2,698 | ) | (516 | ) | (753 | ) | |||||||||||||||||||
| (2,533 | ) | (1,529 | ) | (1,563 | ) | (1,401 | ) | (1,453 | ) | (1,367 | ) | (5,202 | ) | (2,504 | ) | (1,988 | ) | |||||||||||||||||
| 37,757 | 40,530 | 39,890 | 19,961 | 21,397 | 21,523 | 55,160 | 37,910 | 54,970 | ||||||||||||||||||||||||||
| 5,198 | 5,216 | 5,441 | 2,072 | 1,806 | 1,854 | 7,070 | 3,888 | 6,120 | ||||||||||||||||||||||||||
| (2,397 | ) | (2,209 | ) | (2,399 | )b | (13 | ) | (14 | ) | (14 | )b | (1,005 | ) | (1,153 | ) | (1,200 | )b | |||||||||||||||||
| 611 | (188 | ) | 190 | (212 | ) | 1 | – | (303 | ) | 148 | 47 | |||||||||||||||||||||||
| (1,786 | ) | (2,397 | ) | (2,209 | ) | (225 | ) | (13 | ) | (14 | ) | (1,308 | ) | (1,005 | ) | (1,153 | ) | |||||||||||||||||
| 3,412 | 2,819 | 3,232 | 1,847 | 1,793 | 1,840 | 5,762 | 2,883 | 4,967 | ||||||||||||||||||||||||||
| 187 | 182 | – | 18 | 88 | – | (28 | ) | (45 | ) | – | ||||||||||||||||||||||||
| (291 | ) | 5 | 182 | (34 | ) | (70 | ) | 88 | (134 | ) | 17 | (45 | ) | |||||||||||||||||||||
| (104 | ) | 187 | 182 | (16 | ) | 18 | 88 | (162 | ) | (28 | ) | (45 | ) | |||||||||||||||||||||
| 3,308 | 3,006 | 3,414 | 1,831 | 1,811 | 1,928 | 5,600 | 2,855 | 4,922 | ||||||||||||||||||||||||||
| thousand million standard cubic feeta | $ million | |||||||||||||||||||||||||||||||||
| Reserves: Natural gas | ||||||||||||||||||||||||||||||||||
| Standardised measure of | ||||||||||||||||||||||||||||||||||
| Proved developed and | discounted | |||||||||||||||||||||||||||||||||
| undeveloped reserves | Proved developed reserves | future cash flows | ||||||||||||||||||||||||||||||||
| 2002 | 2001 | 2000b | 2002 | 2001 | 2000b | 2002 | 2001 | 2000b | ||||||||||||||||||||||||||
| (1,570 | ) | (1,195 | ) | (1,079 | ) | (44 | ) | (44 | ) | (7 | ) | (1,493 | ) | (869 | ) | (1,231 | ) | |||||||||||||||||
| (1,259 | ) | (1,478 | ) | (1,352 | ) | (528 | ) | (376 | ) | (93 | ) | (1,146 | ) | (3,103 | ) | (3,030 | ) | |||||||||||||||||
| (4,197 | ) | (5,159 | ) | (5,555 | ) | (15 | ) | (128 | ) | (144 | ) | (1,066 | ) | (909 | ) | (1,337 | ) | |||||||||||||||||
| (499 | ) | (289 | ) | (907 | ) | (254 | ) | (184 | ) | (688 | ) | (1,392 | ) | (531 | ) | (603 | ) | |||||||||||||||||
| – | – | – | – | – | – | – | – | – | ||||||||||||||||||||||||||
| (425 | ) | (433 | ) | (496 | ) | (327 | ) | (356 | ) | (367 | ) | (243 | ) | (52 | ) | 118 | ||||||||||||||||||
| (7,950 | ) | (8,554 | ) | (9,389 | ) | (1,168 | ) | (1,088 | ) | (1,299 | ) | (5,340 | ) | (5,464 | ) | (6,083 | ) | |||||||||||||||||
| – | – | – | – | – | – | – | – | – | ||||||||||||||||||||||||||
| – | – | – | – | – | – | – | – | – | ||||||||||||||||||||||||||
| (1,786 | ) | (2,397 | ) | (2,209 | ) | (225 | ) | (13 | ) | (14 | ) | (1,308 | ) | (1,005 | ) | (1,137 | ) | |||||||||||||||||
| – | – | – | – | – | – | – | – | (16 | ) | |||||||||||||||||||||||||
| – | – | – | – | – | – | – | – | – | ||||||||||||||||||||||||||
| – | – | – | – | – | – | – | – | – | ||||||||||||||||||||||||||
| (1,786 | ) | (2,397 | ) | (2,209 | ) | (225 | ) | (13 | ) | (14 | ) | (1,308 | ) | (1,005 | ) | (1,153 | ) | |||||||||||||||||
Royal Dutch/Shell Group of Companies G 61
20-F/A (Amendment No. 2) 2002
Table of Contents
Supplementary information – Oil and Gas (unaudited)
Geographical analysis of the effect of the Second Reserves Restatement
| (million barrels) | |||||||||||||||||||||||||
| Reserves: crude oil and natural gas liquids | |||||||||||||||||||||||||
| Proved developed and | Proved developed | ||||||||||||||||||||||||
| undeveloped reserves | reserves | ||||||||||||||||||||||||
| 2002 | 2001 | 2000a | 2002 | 2001 | 2000a | ||||||||||||||||||||
Group companies | |||||||||||||||||||||||||
| Europe | (111 | ) | (65 | ) | (30 | ) | (64 | ) | (35 | ) | (27 | ) | |||||||||||||
Africab | (379 | ) | (363 | ) | (390 | ) | (64 | ) | (62 | ) | (37 | ) | |||||||||||||
Asia Pacificc | (15 | ) | (19 | ) | (3 | ) | (5 | ) | (4 | ) | 3 | ||||||||||||||
Middle East, Russia, CISd | (38 | ) | (40 | ) | (3 | ) | (33 | ) | (33 | ) | (3 | ) | |||||||||||||
| USA | (3 | ) | (3 | ) | (2 | ) | (2 | ) | – | – | |||||||||||||||
| Other Western Hemisphere | (77 | ) | (17 | ) | (21 | ) | – | (11 | ) | (15 | ) | ||||||||||||||
Total | (623 | ) | (507 | ) | (449 | ) | (168 | ) | (145 | ) | (79 | ) | |||||||||||||
Group share of associated companies | |||||||||||||||||||||||||
| Europe | – | – | – | – | – | – | |||||||||||||||||||
Africab | – | – | – | – | – | – | |||||||||||||||||||
Asia Pacificc | (75 | ) | (55 | ) | (53 | ) | (72 | ) | (53 | ) | (52 | ) | |||||||||||||
Middle East, Russia, CISd | – | – | – | – | – | – | |||||||||||||||||||
| USA | – | – | – | (1 | ) | (1 | ) | – | |||||||||||||||||
| Other Western Hemisphere | – | – | – | – | – | – | |||||||||||||||||||
Total | (75 | ) | (55 | ) | (53 | ) | (73 | ) | (54 | ) | (52 | ) | |||||||||||||
| a | Cumulative effect of Reserves Restatements as at January 1, 2000. |
| b | Excludes Egypt |
| c | Excludes Sakhalin |
| d | Middle East and Former Soviet Union/Commonwealth of Independent States. Includes Caspian region, Egypt and Sakhalin. |
G 62 Royal Dutch/ Shell Group of Companies
20-F/A (Amendment No. 2) 2002
Table of Contents
Supplementary information – Oil and Gas (unaudited)
| Thousand million standard cubic feet | ||||||||||||||||||||||||||||||||||
| Reserves: Natural gas | $ million | |||||||||||||||||||||||||||||||||
| Standardised measure of | ||||||||||||||||||||||||||||||||||
| Proved developed and | discounted | |||||||||||||||||||||||||||||||||
| undeveloped reserves | Proved developed reserves | future cash flows | ||||||||||||||||||||||||||||||||
| 2002 | 2001 | 2000 | 2002 | 2001 | 2000 | 2002 | 2001 | 2000 | ||||||||||||||||||||||||||
| (762 | ) | (505 | ) | (383 | ) | (589 | ) | (442 | ) | (366 | ) | (1,343 | ) | (654 | ) | (402 | ) | |||||||||||||||||
| (152 | ) | (141 | ) | (139 | ) | (446 | ) | (441 | ) | (396 | ) | (2,910 | ) | (1,484 | ) | (927 | ) | |||||||||||||||||
| (1,132 | ) | (425 | ) | (340 | ) | (370 | ) | (331 | ) | (103 | ) | (556 | ) | (202 | ) | (174 | ) | |||||||||||||||||
| – | – | – | – | – | – | 7 | 31 | (25 | ) | |||||||||||||||||||||||||
| (32 | ) | (31 | ) | (4 | ) | (5 | ) | – | – | (37 | ) | (27 | ) | (31 | ) | |||||||||||||||||||
| (455 | ) | (427 | ) | (697 | ) | 9 | (239 | ) | (502 | ) | (363 | ) | (168 | ) | (429 | ) | ||||||||||||||||||
| (2,533 | ) | (1,529 | ) | (1,563 | ) | (1,401 | ) | (1,453 | ) | (1,367 | ) | (5,202 | ) | (2,504 | ) | (1,988 | ) | |||||||||||||||||
| – | – | – | – | – | – | – | – | – | ||||||||||||||||||||||||||
| – | – | – | – | – | – | |||||||||||||||||||||||||||||
| (104 | ) | 187 | 182 | (16 | ) | 18 | 88 | (162 | ) | (28 | ) | (45 | ) | |||||||||||||||||||||
| – | – | – | – | – | – | – | – | – | ||||||||||||||||||||||||||
| – | – | – | – | – | – | – | – | – | ||||||||||||||||||||||||||
| – | – | – | – | – | – | – | – | – | ||||||||||||||||||||||||||
| (104 | ) | 187 | 182 | (16 | ) | 18 | 88 | (162 | ) | (28 | ) | (45 | ) | |||||||||||||||||||||
Royal Dutch/Shell Group of Companies G 63
20-F/A (Amendment No. 2) 2002
Table of Contents
Supplementary information – Oil and Gas (unaudited)
Crude oil and natural gas liquids (Restated)
Group companies’ estimated net proved reserves of crude oil and natural gas liquids at the end of the year, their share of the net proved reserves of associated companies at the end of the year, and the changes in such reserves during the year are set out below.
| Proved developed reserves and undeveloped reservesa | million barrels | |||||||||||||||||||||||||||
| 2002 | ||||||||||||||||||||||||||||
| Eastern Hemisphere | Western Hemisphere | |||||||||||||||||||||||||||
| Asia | Middle East | |||||||||||||||||||||||||||
| Europe | Africab | Pacificc | Russia, CISd | USA | Other | Total | ||||||||||||||||||||||
Group companies | ||||||||||||||||||||||||||||
At January 1 (restated) | 1,013 | 1,308 | 426 | 1,677 | 672 | 504 | 5,600 | |||||||||||||||||||||
| Revisions and reclassifications | 99 | 89 | (27 | ) | (26 | ) | 77 | (42 | ) | 170 | ||||||||||||||||||
| Improved recovery | 13 | – | 6 | 47 | 51 | – | 117 | |||||||||||||||||||||
| Extensions and discoveries | – | 173 | 6 | – | 33 | – | 212 | |||||||||||||||||||||
| Purchases of minerals in place | 507 | – | – | – | 7 | 41 | 555 | |||||||||||||||||||||
| Sales of minerals in place | (1 | ) | (19 | ) | (19 | ) | (62 | ) | (3 | ) | – | (104 | ) | |||||||||||||||
| Production | (254 | ) | (102 | ) | (69 | ) | (190 | ) | (120 | ) | (33 | ) | (768 | ) | ||||||||||||||
At December 31 | 1,377 | 1,449 | 323 | 1,446 | 717 | 470 | 5,782 | |||||||||||||||||||||
Group share of associated companies | ||||||||||||||||||||||||||||
At January 1 (restated) | 1 | – | 307 | – | 356 | – | 664 | |||||||||||||||||||||
| Revisions and reclassifications | 1 | – | 55 | – | 65 | – | 121 | |||||||||||||||||||||
| Improved recovery | – | – | 4 | – | – | – | 4 | |||||||||||||||||||||
| Extensions and discoveries | – | – | 9 | – | 33 | – | 42 | |||||||||||||||||||||
| Purchases of minerals in place | – | – | – | 121 | – | – | 121 | |||||||||||||||||||||
| Sales of minerals in place | – | – | – | (1 | ) | – | – | (1 | ) | |||||||||||||||||||
| Production | – | – | (50 | ) | (2 | ) | (41 | ) | – | (93 | ) | |||||||||||||||||
At December 31 | 2 | – | 325 | 118 | 413 | – | 858 | |||||||||||||||||||||
Total | 1,379 | 1,449 | 648 | 1,564 | 1,130 | 470 | 6,640 | |||||||||||||||||||||
Minority interests’ share of proved reserves of Group companies | ||||||||||||||||||||||||||||
At December 31 | – | 23 | 1 | 126 | – | 61 | 211 | |||||||||||||||||||||
| Proved developed reserves (as restated) | million barrels | |||||||||||||||||||||||||||
| 2002 | ||||||||||||||||||||||||||||
| Eastern Hemisphere | Western Hemisphere | |||||||||||||||||||||||||||
| Asia | Middle East | |||||||||||||||||||||||||||
| Europe | Africab | Pacificc | Russia, CISd | USA | Other | Total | ||||||||||||||||||||||
Group companies | ||||||||||||||||||||||||||||
At January 1 (restated) | 750 | 662 | 245 | 1,089 | 429 | 212 | 3,387 | |||||||||||||||||||||
At December 31 | 1,063 | 674 | 194 | 1,023 | 371 | 191 | 3,516 | |||||||||||||||||||||
Group share of associated companies | ||||||||||||||||||||||||||||
At January 1 (restated) | 1 | – | 208 | – | 329 | – | 538 | |||||||||||||||||||||
At December 31 | 1 | – | 206 | 15 | 364 | – | 586 | |||||||||||||||||||||
Oil sandse | million barrels | |||||||||||||||||||||||||||
Group companies | ||||||||||||||||||||||||||||
| At January 1 | 594 | 594 | ||||||||||||||||||||||||||
| Revisions and reclassifications | (77 | ) | (77 | ) | ||||||||||||||||||||||||
| Extensions and discoveries | – | – | ||||||||||||||||||||||||||
| Production | – | – | ||||||||||||||||||||||||||
| At December 31 | 517 | 517 | ||||||||||||||||||||||||||
Minority interests’ share of oil sands | ||||||||||||||||||||||||||||
| At December 31 | 115 | 115 | ||||||||||||||||||||||||||
| a | As applicable, amounts relating to prior years have been restated. A summary of the changes is shown in the tables in pages G60 to G63. |
| b | Excludes Egypt. |
| c | Excludes Sakhalin. |
| d | Middle East and Former Soviet Union / Commonwealth of Independent States. Includes Caspian region, Egypt and Sakhalin. |
| e | Petroleum reserves from operations that do not qualify as oil and gas producing activities, such as our Athabasca Oil Sands Project, are not included in oil and gas reserves and are not considered in the standardised measure of discounted future cash flows for oil and gas reserves, which is found on pages G68 and G69. The petroleum reserves for the Athabasca Oil Sands Project are presented net of royalty volumes. |
G 64 Royal Dutch/ Shell Group of Companies
20-F/A (Amendment No. 2) 2002
Table of Contents
Supplementary information – Oil and Gas (unaudited)
| million barrels | million barrels | |||||||||||||||||||||||||||||||||||||||||||||||||||||
| 2001 | 2000 | |||||||||||||||||||||||||||||||||||||||||||||||||||||
| Eastern Hemisphere | Western Hemisphere | Eastern Hemisphere | Western Hemisphere | |||||||||||||||||||||||||||||||||||||||||||||||||||
| Asia | Middle East | Asia | Middle East | |||||||||||||||||||||||||||||||||||||||||||||||||||
| Europe | Africab | Pacific | Russia, CISd | USA | Other | Total | Europe | Africab | Pacificc | Russia, CISd | USA | Other | Total | |||||||||||||||||||||||||||||||||||||||||
| 1,122 | 1,321 | 433 | 1,569 | 609 | 509 | 5,563 | 1,303 | 1,318 | 458 | 1,843 | 576 | 371 | 5,869 | |||||||||||||||||||||||||||||||||||||||||
| 34 | 16 | (23 | ) | 288 | 30 | 43 | 388 | 59 | 127 | 32 | (103 | ) | 15 | 86 | 216 | |||||||||||||||||||||||||||||||||||||||
| 39 | 2 | 11 | (4 | ) | – | – | 48 | 43 | 1 | 18 | 19 | – | 86 | 167 | ||||||||||||||||||||||||||||||||||||||||
| 17 | 89 | 6 | – | 139 | 1 | 252 | 12 | 1 | 17 | – | 126 | 1 | 157 | |||||||||||||||||||||||||||||||||||||||||
| – | – | 69 | – | 3 | – | 72 | – | – | – | – | – | – | – | |||||||||||||||||||||||||||||||||||||||||
| – | – | – | – | (1 | ) | (14 | ) | (15 | ) | (71 | ) | (5 | ) | (26 | ) | (13 | ) | (6 | ) | – | (121 | ) | ||||||||||||||||||||||||||||||||
| (199 | ) | (120 | ) | (70 | ) | (176 | ) | (108 | ) | (35 | ) | (708 | ) | (224 | ) | (121 | ) | (66 | ) | (177 | ) | (102 | ) | (35 | ) | (725 | ) | |||||||||||||||||||||||||||
| 1,013 | 1,308 | 426 | 1,677 | 672 | 504 | 5,600 | 1,122 | 1,321 | 433 | 1,569 | 609 | 509 | 5,563 | |||||||||||||||||||||||||||||||||||||||||
| 1 | – | 300 | 100 | 441 | – | 842 | 1 | – | 286 | – | 817 | – | 1,104 | |||||||||||||||||||||||||||||||||||||||||
| – | – | 40 | (92 | ) | (35 | ) | – | (87 | ) | – | – | 6 | 53 | (26 | ) | – | 33 | |||||||||||||||||||||||||||||||||||||
| – | – | 12 | – | 1 | – | 13 | – | – | 18 | – | 2 | – | 20 | |||||||||||||||||||||||||||||||||||||||||
| – | – | 4 | – | – | – | 4 | – | – | 39 | – | 1 | – | 40 | |||||||||||||||||||||||||||||||||||||||||
| – | – | – | – | – | – | 0 | – | – | – | 62 | – | – | 62 | |||||||||||||||||||||||||||||||||||||||||
| – | – | – | – | (9 | ) | – | (9 | ) | – | – | – | (12 | ) | (302 | ) | – | (314 | ) | ||||||||||||||||||||||||||||||||||||
| – | – | (49 | ) | (8 | ) | (42 | ) | – | (99 | ) | – | – | (49 | ) | (3 | ) | (51 | ) | – | (103 | ) | |||||||||||||||||||||||||||||||||
| 1 | – | 307 | 0 | 356 | – | 664 | 1 | – | 300 | 100 | 441 | – | 842 | |||||||||||||||||||||||||||||||||||||||||
| 1,014 | 1,308 | 733 | 1,677 | 1,028 | 504 | 6,264 | 1,123 | 1,321 | 733 | 1,669 | 1,050 | 509 | 6,405 | |||||||||||||||||||||||||||||||||||||||||
| – | 22 | 1 | 116 | – | 66 | 205 | – | 30 | – | 11 | – | 68 | 109 | |||||||||||||||||||||||||||||||||||||||||
| million barrels | million barrels | |||||||||||||||||||||||||||||||||||||||||||||||||||||
| 2001 | 2000 | |||||||||||||||||||||||||||||||||||||||||||||||||||||
| Eastern Hemisphere | Western Hemisphere | Eastern Hemisphere | Western Hemisphere | |||||||||||||||||||||||||||||||||||||||||||||||||||
| Asia | Middle East | Asia | Middle East | |||||||||||||||||||||||||||||||||||||||||||||||||||
| Europe | Africab | Pacificc | Russia, CISd | USA | Other | Total | Europe | Africab | Pacificc | Russia, CISd | USA | Other | Total | |||||||||||||||||||||||||||||||||||||||||
| 845 | 703 | 217 | 1,148 | 351 | 214 | 3,478 | 911 | 687 | 253 | 1,295 | 340 | 218 | 3,704 | |||||||||||||||||||||||||||||||||||||||||
| 750 | 662 | 245 | 1,089 | 429 | 212 | 3,387 | 845 | 703 | 217 | 1,148 | 351 | 214 | 3,478 | |||||||||||||||||||||||||||||||||||||||||
| 1 | – | 197 | 37 | 364 | – | 599 | 1 | – | 212 | – | 638 | – | 851 | |||||||||||||||||||||||||||||||||||||||||
| 1 | – | 208 | – | 329 | – | 538 | 1 | – | 197 | 37 | 364 | – | 599 | |||||||||||||||||||||||||||||||||||||||||
| million barrels | million barrels | |||||||||||||||||||||||||||||||||||||||||||||||||||||
| 594 | 594 | 594 | 594 | |||||||||||||||||||||||||||||||||||||||||||||||||||
| – | – | – | – | |||||||||||||||||||||||||||||||||||||||||||||||||||
| – | – | – | – | |||||||||||||||||||||||||||||||||||||||||||||||||||
| – | – | – | – | |||||||||||||||||||||||||||||||||||||||||||||||||||
| 594 | 594 | 594 | 594 | |||||||||||||||||||||||||||||||||||||||||||||||||||
| 132 | 132 | 131 | 131 | |||||||||||||||||||||||||||||||||||||||||||||||||||
Royal Dutch/Shell Group of Companies G 65
20-F/A (Amendment No. 2) 2002
Table of Contents
Supplementary information – Oil and Gas (unaudited)
Natural gas (Restated)
Group companies’ estimated net proved reserves of natural gas at the end of the year, their share of the net proved reserves of associated companies at the end of the year, and the changes in such reserves during the year are set out below. The volumes set out below have not been adjusted to standard heat content, which means that volumes of gas are reported on an “as-sold” basis and are treated as equivalent without regard to the quality of the gas (e.g., with respect to the inert gas content thereof or the various hydrocarbon components). The price used to calculate future revenues and cash flows from proved gas reserves is that realised at year-end based on “as-sold” volumes. As such, the realised price reflects the quality of the gas, both in terms of inert components which reduce gas quality and hydrocarbon components with high molecular weights which enrich the quality of the gas.
| Proved developed and undeveloped reserves (as restated)a | thousand million standard cubic feetb | |||||||||||||||||||||||||||
| 2002 | ||||||||||||||||||||||||||||
| Eastern Hemisphere | Western Hemisphere | |||||||||||||||||||||||||||
| Asia | Middle East | |||||||||||||||||||||||||||
| Europe | Africac | Pacificd | Russia, CISe | USA | Other | Total | ||||||||||||||||||||||
Group companies | ||||||||||||||||||||||||||||
At January 1 (restated) | 22,022 | 1,780 | 9,031 | 1,777 | 3,663 | 2,257 | 40,530 | |||||||||||||||||||||
| Revisions and reclassifications | (110 | ) | 1 | (680 | ) | (282 | ) | 162 | (123 | ) | (1,032 | ) | ||||||||||||||||
| Improved recovery | 6 | – | 150 | – | 20 | – | 176 | |||||||||||||||||||||
| Extensions and discoveries | 29 | – | 126 | – | 410 | 9 | 574 | |||||||||||||||||||||
| Purchases of minerals in place | 673 | – | – | – | 208 | 12 | 893 | |||||||||||||||||||||
| Sales of minerals in place | (5 | ) | – | (212 | ) | – | (10 | ) | – | (227 | ) | |||||||||||||||||
| Production | (1,331 | ) | (89 | ) | (553 | ) | (377 | ) | (611 | ) | (196 | ) | (3,157 | ) | ||||||||||||||
At December 31 | 21,284 | 1,692 | 7,862 | 1,118 | 3,842 | 1,959 | 37,757 | |||||||||||||||||||||
Group share of associated companies | ||||||||||||||||||||||||||||
At January 1 (restated) | 48 | – | 2,943 | – | 15 | – | 3,006 | |||||||||||||||||||||
| Revisions and reclassifications | 1 | – | 434 | – | 7 | – | 442 | |||||||||||||||||||||
| Improved recovery | – | – | 8 | – | – | – | 8 | |||||||||||||||||||||
| Extensions and discoveries | 3 | – | 80 | – | 1 | – | 84 | |||||||||||||||||||||
| Purchases of minerals in place | – | – | – | – | – | – | – | |||||||||||||||||||||
| Sales of minerals in place | – | – | – | – | – | – | – | |||||||||||||||||||||
| Production | (8 | ) | – | (222 | ) | – | (2 | ) | – | (232 | ) | |||||||||||||||||
At December 31 | 44 | – | 3,243 | – | 21 | – | 3,308 | |||||||||||||||||||||
Total | 21,328 | 1,692 | 11,105 | 1,118 | 3,863 | 1,959 | 41,065 | |||||||||||||||||||||
| Minority Interests’ share of proved reserves of Group companies | ||||||||||||||||||||||||||||
At December 31 | – | – | 61 | 59 | – | 342 | 462 | |||||||||||||||||||||
| Proved developed reserves (as restated)a | thousand million standard cubic feetb | |||||||||||||||||||||||||||
| 2002 | ||||||||||||||||||||||||||||
| Eastern Hemisphere | Western Hemisphere | |||||||||||||||||||||||||||
| Asia | Middle East | |||||||||||||||||||||||||||
| Europe | Africac | Pacificd | Russia, CISe | USA | Other | Total | ||||||||||||||||||||||
Group companies | ||||||||||||||||||||||||||||
At January 1 (restated) | 11,880 | 668 | 3,635 | 1,097 | 2,363 | 1,754 | 21,397 | |||||||||||||||||||||
At December 31 | 11,472 | 735 | 3,405 | 574 | 2,311 | 1,464 | 19,961 | |||||||||||||||||||||
Group share of associated companies | ||||||||||||||||||||||||||||
At January 1 (restated) | 41 | – | 1,759 | – | 11 | – | 1,811 | |||||||||||||||||||||
At December 31 | 38 | – | 1,776 | – | 17 | – | 1,831 | |||||||||||||||||||||
| a | As applicable, amounts relating to prior years have been restated. A summary of the changes in shown in the tables on pages G60 to G63. |
| b | These quantities have not been adjusted to standard heat content. |
| c | Excludes Egypt. |
| d | Excludes Sakhalin. |
| e | Middle East and Former Soviet Union/Commonwealth of Independent States. Includes Caspian region, Egypt and Sakhalin. |
G 66 Royal Dutch/ Shell Group of Companies
20-F/A (Amendment No. 2) 2002
Table of Contents
Supplementary information – Oil and Gas (unaudited)
| thousand million standard cubic feetb | thousand million standard cubic feetb | |||||||||||||||||||||||||||||||||||||||||||||||||||||
| 2001 | 2000 | |||||||||||||||||||||||||||||||||||||||||||||||||||||
| Eastern Hemisphere | Western Hemisphere | Eastern Hemisphere | Western Hemisphere | |||||||||||||||||||||||||||||||||||||||||||||||||||
| Asia | Middle East | Asia | Middle East | |||||||||||||||||||||||||||||||||||||||||||||||||||
| Europe | Africac | Pacificd | Russia, CISe | USA | Other | Total | Europe | Africac | Pacificd | Russia, CISe | USA | Other | Total | |||||||||||||||||||||||||||||||||||||||||
| 22,339 | 1,786 | 7,999 | 2,054 | 3,399 | 2,313 | 39,890 | 23,589 | 1,778 | 8,922 | 1,072 | 3,396 | 2,542 | 41,299 | |||||||||||||||||||||||||||||||||||||||||
| 815 | (47 | ) | 175 | (73 | ) | 114 | 13 | 997 | (45 | ) | 73 | (634 | ) | 1,196 | (39 | ) | (43 | ) | 508 | |||||||||||||||||||||||||||||||||||
| (9 | ) | – | 266 | – | – | – | 257 | 138 | – | 201 | 14 | – | – | 353 | ||||||||||||||||||||||||||||||||||||||||
| 214 | 121 | 8 | 95 | 385 | 132 | 955 | 55 | – | 16 | – | 656 | 28 | 755 | |||||||||||||||||||||||||||||||||||||||||
| – | – | 1,095 | – | 355 | 9 | 1,459 | – | – | 5 | – | 50 | – | 55 | |||||||||||||||||||||||||||||||||||||||||
| – | – | – | – | (9 | ) | (8 | ) | (17 | ) | (117 | ) | – | (139 | ) | – | (78 | ) | (27 | ) | (361 | ) | |||||||||||||||||||||||||||||||||
| (1,337 | ) | (80 | ) | (512 | ) | (299 | ) | (581 | ) | (202 | ) | (3,011 | ) | (1,281 | ) | (65 | ) | (372 | ) | (228 | ) | (586 | ) | (187 | ) | (2,719 | ) | |||||||||||||||||||||||||||
| 22,022 | 1,780 | 9,031 | 1,777 | 3,663 | 2,257 | 40,530 | 22,339 | 1,786 | 7,999 | 2,054 | 3,399 | 2,313 | 39,890 | |||||||||||||||||||||||||||||||||||||||||
| 56 | – | 3,272 | – | 86 | – | 3,414 | 52 | – | 2,648 | – | 595 | – | 3,295 | |||||||||||||||||||||||||||||||||||||||||
| (5 | ) | – | 62 | – | (29 | ) | – | 28 | 6 | – | 718 | – | (209 | ) | – | 515 | ||||||||||||||||||||||||||||||||||||||
| – | – | 17 | – | – | – | 17 | – | – | – | – | 2 | – | 2 | |||||||||||||||||||||||||||||||||||||||||
| 4 | – | 2 | – | – | – | 6 | 4 | – | 147 | – | 5 | – | 156 | |||||||||||||||||||||||||||||||||||||||||
| – | – | – | – | – | – | – | – | – | – | – | – | – | – | |||||||||||||||||||||||||||||||||||||||||
| – | – | (181 | ) | – | (40 | ) | – | (221 | ) | – | – | (19 | ) | – | (292 | ) | – | (311 | ) | |||||||||||||||||||||||||||||||||||
| (7 | ) | – | (229 | ) | – | (2 | ) | – | (238 | ) | (6 | ) | – | (222 | ) | – | (15 | ) | – | (243 | ) | |||||||||||||||||||||||||||||||||
| 48 | – | 2,943 | – | 15 | – | 3,006 | 56 | – | 3,272 | – | 86 | – | 3,414 | |||||||||||||||||||||||||||||||||||||||||
| 22,070 | 1,780 | 11,974 | 1,777 | 3,678 | 2,257 | 43,536 | 22,395 | 1,786 | 11,271 | 2,054 | 3,485 | 2,313 | 43,304 | |||||||||||||||||||||||||||||||||||||||||
| – | – | 77 | 153 | – | 401 | 631 | – | – | – | 177 | – | 433 | 610 | |||||||||||||||||||||||||||||||||||||||||
| thousand million standard cubic feetb | thousand million standard cubic feetb | |||||||||||||||||||||||||||||||||||||||||||||||||||||
| 2001 | 2000 | |||||||||||||||||||||||||||||||||||||||||||||||||||||
| Eastern Hemisphere | Western Hemisphere | Eastern Hemisphere | Western Hemisphere | |||||||||||||||||||||||||||||||||||||||||||||||||||
| Asia | Middle East | Asia | Middle East | |||||||||||||||||||||||||||||||||||||||||||||||||||
| Europe | Africac | Pacificd | Russia, CISe | USA | Other | Total | Europe | Africac | Pacificd | Russia, CISe | USA | Other | Total | |||||||||||||||||||||||||||||||||||||||||
| 12,613 | 713 | 2,795 | 1,382 | 2,347 | 1,673 | 21,523 | 13,341 | 445 | 2,710 | 569 | 2,713 | 1,785 | 21,563 | |||||||||||||||||||||||||||||||||||||||||
| 11,880 | 668 | 3,635 | 1,097 | 2,363 | 1,754 | 21,397 | 12,613 | 713 | 2,795 | 1,382 | 2,347 | 1,673 | 21,523 | |||||||||||||||||||||||||||||||||||||||||
| 53 | – | 1,809 | – | 66 | – | 1,928 | 51 | – | 1,714 | – | 453 | – | 2,218 | |||||||||||||||||||||||||||||||||||||||||
| 41 | – | 1,759 | – | 11 | – | 1,811 | 53 | – | 1,809 | – | 66 | – | 1,928 | |||||||||||||||||||||||||||||||||||||||||
Royal Dutch/Shell Group of Companies G 67
20-F/A (Amendment No. 2) 2002
Table of Contents
Supplementary information – Oil and Gas (unaudited)
Standardised measure of discounted future cash flows (Restated)
United States accounting principles require the disclosure of a standardised measure of discounted future cash flows, relating to proved oil and gas reserve quantities and based on spot pricesa and costs at the end of each year, currently enacted tax rates and a 10% annual discount factor. The information so calculated does not provide a reliable measure of future cash flows from proved reserves, nor does it permit a realistic comparison to be made of one entity with another because the assumptions used cannot reflect the varying circumstances within each entity. In addition a substantial but unknown proportion of future real cash flows from oil and gas production activities is expected to derive from reserves which have already been discovered, but which cannot yet be regarded as proved.
| $ million | ||||||||||||||||||||||||||||
| 2002 | ||||||||||||||||||||||||||||
| Eastern Hemisphere | Western Hemisphere | |||||||||||||||||||||||||||
| Asia | Middle East, | |||||||||||||||||||||||||||
| Europe | Africac | Pacificd | Russia, CISe | USA | Other | Total | ||||||||||||||||||||||
Group companiesa | ||||||||||||||||||||||||||||
| Future cash inflows | 98,126 | 36,427 | 22,243 | 36,513 | 32,541 | 16,280 | 242,130 | |||||||||||||||||||||
| Future production costs | 18,721 | 5,034 | 3,563 | 5,174 | 4,841 | 3,673 | 41,006 | |||||||||||||||||||||
| Future development costs | 4,783 | 4,670 | 2,397 | 2,844 | 3,201 | 1,532 | 19,427 | |||||||||||||||||||||
| Future tax expenses | 32,125 | 18,690 | 4,538 | 17,443 | 9,103 | 3,447 | 85,346 | |||||||||||||||||||||
| Future net cashflows | 42,497 | 8,033 | 11,745 | 11,052 | 15,396 | 7,628 | 96,351 | |||||||||||||||||||||
| Effect of discounting | 19,511 | 3,601 | 5,343 | 4,166 | 5,427 | 3,143 | 41,191 | |||||||||||||||||||||
Standardised measure of discounted future cash flows | 22,986 | 4,432 | 6,402 | 6,886 | 9,969 | 4,485 | 55,160 | |||||||||||||||||||||
Group share of associated companies | 5,600 | |||||||||||||||||||||||||||
Minority interests | – | 123 | 22 | 753 | – | 468 | 1,366 | |||||||||||||||||||||
| Change in standardised measure of discounted future cash flows (as restated) | $ million | |||||||||||
| 2002 | 2001 | 2000 | ||||||||||
At January 1 (Restated) | 37,910 | 54,970 | 47,751 | |||||||||
| Net changes in prices and production costs | 34,592 | (26,790 | ) | 16,972 | ||||||||
| Extensions, discoveries and improved recovery | 5,177 | 3,293 | 4,958 | |||||||||
| Purchases/(sales) of minerals in place | 7,319 | 1,916 | (1,073 | ) | ||||||||
| Revisions of previous reserve estimates | 375 | 2,557 | 3,048 | |||||||||
| Development cost related to future production | (6,168 | ) | (5,761 | ) | (1,709 | ) | ||||||
| Sales and transfer of oil and gas, net of production costs | (20,387 | ) | (20,173 | ) | (21,225 | ) | ||||||
| Development cost incurred during the year | 6,503 | 5,275 | 3,177 | |||||||||
| Accretion of discount | 6,053 | 8,607 | 7,565 | |||||||||
| Net change in income tax | (16,214 | ) | 14,016 | (4,494 | ) | |||||||
| Other (should be zero) | ||||||||||||
At December 31 | 55,160 | 37,910 | 54,970 | |||||||||
| a | The weighted average year-end spot oil price in 2002 was $24.49/bbl ($16.46/bbl in 2001 and $20.19/bbl in 2000) and the weighted average year-end spot gas price in 2002 was $15.75/boe ($12.38/boe in 2001, $16.80/boe in 2000). |
| b | As applicable, amounts relating to prior years have been restated. A summary of the changes is shown in the tables on pages G60 to G63. |
| c | Excludes Egypt. |
| d | Excludes Sakhalin. |
| e | Middle East and Former Soviet Union / Commonwealth of Independent States. Includes Caspian region, Egypt and Sakhalin. |
G 68 Royal Dutch/ Shell Group of Companies
20-F/A (Amendment No. 2) 2002
Table of Contents
Supplementary information – Oil and Gas (unaudited)
| $ million | $ million | |||||||||||||||||||||||||||||||||||||||||||||||||||||
| 2001b | 2000b | |||||||||||||||||||||||||||||||||||||||||||||||||||||
| Eastern Hemisphere | Western Hemisphere | Eastern Hemisphere | Western Hemisphere | |||||||||||||||||||||||||||||||||||||||||||||||||||
| Asia | Middle East | Asia | Middle East | |||||||||||||||||||||||||||||||||||||||||||||||||||
| Europe | Africac | Pacificd | Russia, CISe | USA | Other | Total | Europe | Africac | Pacificd | Russia, CISe | USA | Other | Total | |||||||||||||||||||||||||||||||||||||||||
| 74,125 | 20,602 | 21,712 | 33,643 | 18,875 | 10,757 | 179,714 | 87,721 | 24,993 | 23,167 | 31,726 | 37,345 | 20,308 | 225,260 | |||||||||||||||||||||||||||||||||||||||||
| 13,869 | 3,957 | 4,667 | 5,044 | 4,019 | 3,681 | 35,237 | 15,412 | 3,647 | 4,672 | 2,781 | 3,087 | 4,231 | 33,830 | |||||||||||||||||||||||||||||||||||||||||
| 3,466 | 3,778 | 2,813 | 4,009 | 2,352 | 1,277 | 17,695 | 2,233 | 3,318 | 2,771 | 3,866 | 2,320 | 1,330 | 15,838 | |||||||||||||||||||||||||||||||||||||||||
| 25,360 | 8,761 | 4,033 | 14,988 | 4,504 | 1,396 | 59,042 | 30,678 | 12,697 | 5,090 | 15,578 | 11,991 | 5,346 | 81,380 | |||||||||||||||||||||||||||||||||||||||||
| 31,430 | 4,106 | 10,199 | 9,602 | 8,000 | 4,403 | 67,740 | 39,398 | 5,331 | 10,634 | 9,501 | 19,947 | 9,401 | 94,212 | |||||||||||||||||||||||||||||||||||||||||
| 15,339 | 1,799 | 4,868 | 3,491 | 2,609 | 1,724 | 29,830 | 18,082 | 2,142 | 5,256 | 3,255 | 6,802 | 3,705 | 39,242 | |||||||||||||||||||||||||||||||||||||||||
| 16,091 | 2,307 | 5,331 | 6,111 | 5,391 | 2,679 | 37,910 | 21,316 | 3,189 | 5,378 | 6,246 | 13,145 | 5,696 | 54,970 | |||||||||||||||||||||||||||||||||||||||||
| 2,855 | 4,922 | |||||||||||||||||||||||||||||||||||||||||||||||||||||
| – | 73 | 13 | 557 | – | 262 | 905 | – | 146 | – | 196 | – | 805 | 1,147 | |||||||||||||||||||||||||||||||||||||||||
Additional information concerning proved reserves
Some of our Deepwater Gulf of Mexico reserves may not have had a production flow test to surface. In such situations, we have used other technologies that we believe are reliable to establish economic producibility. Proved reserves supported by using such other technologies are 100 million barrels of crude oil and natural gas liquids and 246 thousand million standard cubic feet of gas.
Proved reserves can be either developed or undeveloped. Group proved reserves at December 31, 2002 were divided into 57% developed and 43% undeveloped on a barrel of oil equivalent basis.
Proved reserves are recognised under various forms of contractual agreements. Group proved reserves volumes present in agreements such as Production Sharing Contracts or other forms of economic entitlement contracts where Group share of reserves can vary with actual year-end price are approximately 1,088 million barrels of crude oil and natural gas liquids and 5,863 thousand million standard cubic feet of gas.
A portion of our oil reserves is located in countries that are part of OPEC. As such, our oil production rates may be subject to limitations imposed by OPEC quotas. Our proved oil reserves in OPEC countries totaled some 1,929 million barrels at December 31, 2002.
Royal Dutch/Shell Group of Companies G 69
20-F/A (Amendment No. 2) 2002
Table of Contents
Supplementary information – Derivatives and other Financial Instruments and Derivative Commodity Instruments
The following information is provided in accordance with the Securities and Exchange Commission rules issued in 1997.
The contract/notional amounts of the derivative instruments outstanding give an indication of the extent of the use of these instruments but not of the exposure to credit or market risk. Variable interest rates stated are spot rates applying as at December 31. Amounts denominated in non-dollar currencies have been translated using spot exchange rates at December 31. Associated companies’ data are excluded.
Debt securities held for trading purposes
There were no debt securities held for trading purposes by Group companies at December 31, 2002.
The following table gives details of debt securities held for trading purposes by Group companies at December 31, 2001 at estimated fair value, by year of maturity.
| 2001 (all securities mature in 2002) | $ million | ||||
| Total | |||||
| Fixed rate US dollar debt securities | 1,320 | ||||
| average interest rate | 2.1% | ||||
| Variable rate US dollar debt securities | 25 | ||||
| average interest rate | 3.6% | ||||
| Fixed rate euro debt securities | 681 | ||||
| average interest rate | 3.4% | ||||
| Variable rate euro debt securities | 6 | ||||
| average interest rate | 4.7% | ||||
| Fixed rate Japanese yen debt securities | 95 | ||||
| average interest rate | 0.1% | ||||
| Fixed rate UK pound debt securities | 50 | ||||
| average interest rate | 4.0% | ||||
Total | 2,177 | ||||
G 70 Royal Dutch/ Shell Group of Companies
20-F/A (Amendment No. 2) 2002
Table of Contents
Debt securities held for purposes other than trading
The following two tables give details of debt securities held for purposes other than trading by Group companies at December 31, 2002 and 2001 respectively, at estimated fair value, by year of maturity.
| 2002 | $ million | ||||||||||||||||||||||||||||
| 2008 | |||||||||||||||||||||||||||||
| 2003 | 2004 | 2005 | 2006 | 2007 | and after | Total | |||||||||||||||||||||||
| Fixed rate US dollar debt securities | 4 | 41 | 62 | 8 | 100 | 108 | 323 | ||||||||||||||||||||||
| average interest rate | 0.9% | 7.6% | 5.7% | 7.0% | 7.2% | 6.7% | |||||||||||||||||||||||
| Variable rate US dollar debt securities | 9 | – | – | – | – | – | 9 | ||||||||||||||||||||||
| average interest rate | 1.4% | – | – | – | – | – | |||||||||||||||||||||||
| Fixed rate euro debt securities | – | 21 | – | 66 | 38 | 166 | 291 | ||||||||||||||||||||||
| average interest rate | – | 5.8% | – | 6.5% | 5.3% | 5.5% | |||||||||||||||||||||||
| Fixed rate UK pound debt securities | – | – | 16 | – | 4 | 18 | 38 | ||||||||||||||||||||||
| average interest rate | – | – | 8.5% | – | 8.0% | 6.3% | |||||||||||||||||||||||
| Fixed rate Canadian dollar debt securities | 15 | 4 | – | – | – | 15 | 34 | ||||||||||||||||||||||
| average interest rate | 6.5% | 9.0% | – | – | – | 9.6% | |||||||||||||||||||||||
| Fixed rate Swedish krone debt securities | – | 2 | – | – | – | 5 | 7 | ||||||||||||||||||||||
| average interest rate | – | 5.0% | – | – | – | 6.8% | |||||||||||||||||||||||
| Other fixed rate debt securities | 4 | – | – | – | – | – | 4 | ||||||||||||||||||||||
| average interest rate | 37.1% | – | – | – | – | – | |||||||||||||||||||||||
| Other variable rate debt securities | 28 | – | – | – | – | – | 28 | ||||||||||||||||||||||
| average interest rate | 9.6% | – | – | – | – | – | |||||||||||||||||||||||
Total | 60 | 68 | 78 | 74 | 142 | 312 | 734 | ||||||||||||||||||||||
| 2001 | $ million | ||||||||||||||||||||||||||||
| 2007 | |||||||||||||||||||||||||||||
| 2002 | 2003 | 2004 | 2005 | 2006 | and after | Total | |||||||||||||||||||||||
| Fixed rate US dollar debt securities | 25 | 32 | 32 | 25 | 23 | 173 | 310 | ||||||||||||||||||||||
| average interest rate | 7.2% | 5.0% | 5.0% | 7.2% | 6.3% | 6.3% | |||||||||||||||||||||||
| Fixed rate euro debt securities | – | 29 | 25 | – | 37 | 146 | 237 | ||||||||||||||||||||||
| average interest rate | – | 6.3% | 6.3% | – | 5.7% | 5.4% | |||||||||||||||||||||||
| Fixed rate UK pound debt securities | 7 | – | – | 7 | – | 18 | 32 | ||||||||||||||||||||||
| average interest rate | 6.9% | – | – | 7.6% | – | 6.2% | |||||||||||||||||||||||
| Fixed rate Canadian dollar debt securities | – | – | 10 | – | – | 8 | 18 | ||||||||||||||||||||||
| average interest rate | – | – | 8.0% | – | – | 6.9% | |||||||||||||||||||||||
| Other fixed rate debt securities | 6 | – | 3 | – | 5 | 4 | 18 | ||||||||||||||||||||||
| average interest rate | 8.3% | – | 4.9% | – | 7.2% | 5.8% | |||||||||||||||||||||||
| Variable rate debt securities | 31 | – | – | – | – | – | 31 | ||||||||||||||||||||||
| average interest rate | 10.6% | – | – | – | – | – | |||||||||||||||||||||||
Total | 69 | 61 | 70 | 32 | 65 | 349 | 646 | ||||||||||||||||||||||
Equity securities held for purposes other than trading
At December 31, 2002, Group companies held equity securities for purposes other than trading amounting to $3,827 million (2001: $3,277 million). These principally comprised shares of Royal Dutch and Shell Transport, amounting to $2,797 million (2001: $1,953 million), that are held in connection with share option plans and other incentives compensation plans and a portfolio amounting to $477 million required to be held long-term by the Group insurance companies as security for their insurance activities. The portfolio tracks the Morgan Stanley World Index and therefore is spread over 20 of the major stock markets according to respective market capitalisation, including 56% in the USA, 9% in Japan, 11% in the UK, 4% in France, 3% in Switzerland and 2% in Germany.
Royal Dutch/Shell Group of Companies G 71
20-F/A (Amendment No. 2) 2002
Table of Contents
Debt
The following two tables give details of debt owed by Group companies at December 31, 2002 and 2001 respectively, by year of maturity. Estimated fair value approximates carrying amount.
| $ million | |||||||||||||||||||||||||||||
| 2002 | |||||||||||||||||||||||||||||
| 2003 | 2004 | 2005 | 2006 | 2007 | 2008 | Total | |||||||||||||||||||||||
| and after | |||||||||||||||||||||||||||||
| Fixed rate US dollar debt | 7,428 | 2 | 827 | 612 | 1,237 | 256 | 10,362 | ||||||||||||||||||||||
| average interest rate | 2.0% | 4.5% | 4.6% | 3.1% | 4.7% | 9.4% | |||||||||||||||||||||||
| Variable rate US dollar debt | 2,405 | 85 | 24 | 25 | 107 | 429 | 3,075 | ||||||||||||||||||||||
| average interest rate | 2.7% | 1.5% | 2.3% | 2.4% | 2.4% | 4.9% | |||||||||||||||||||||||
| Fixed rate European debt | 1,047 | – | – | 603 | 785 | 9 | 2,444 | ||||||||||||||||||||||
| average interest rate | 3.9% | – | – | 4.3% | 3.5% | 4.1% | |||||||||||||||||||||||
| Variable rate European debt | 701 | 839 | 9 | – | – | – | 1,549 | ||||||||||||||||||||||
| average interest rate | 3.9% | 3.2% | 3.8% | – | – | – | |||||||||||||||||||||||
| Other fixed rate debt | 157 | 69 | 38 | – | – | 55 | 319 | ||||||||||||||||||||||
| average interest rate | 7.9% | 1.6% | 8.9% | – | – | 6.3% | |||||||||||||||||||||||
| Other variable rate debt | 1,071 | 195 | 28 | 28 | 24 | 31 | 1,377 | ||||||||||||||||||||||
| average interest rate | 4.8% | 2.5% | 4.6% | 4.6% | 4.6% | 4.6% | |||||||||||||||||||||||
Total | 12,809 | 1,190 | 926 | 1,268 | 2,153 | 780 | 19,126 | ||||||||||||||||||||||
Fixed rate European currency debt expected to mature in 2003 includes $383 million of Swiss franc debt (with an average interest rate of 2.3%) and $423 million of UK pound debt (with an average interest rate of 3.9%). Fixed rate European currency debt expected to mature in 2006 and 2007 consists of UK pound debt and euro debt respectively.
Variable rate European debt expected to mature in 2003 includes $594 million of euro debt (with an average interest rate of 3.5%). Variable rate European debt expected to mature in 2004 consists of euro debt.
Other variable rate debt expected to mature in 2003 includes $609 million of Canadian dollar debt (with an average interest rate of 1.4%).
| $ million | |||||||||||||||||||||||||||||
| 2002 | |||||||||||||||||||||||||||||
| 2002 | 2003 | 2004 | 2005 | 2006 | 2007 | Total | |||||||||||||||||||||||
| and after | |||||||||||||||||||||||||||||
| Fixed rate US dollar debt | 972 | 569 | 55 | 46 | 36 | 11 | 1,689 | ||||||||||||||||||||||
| average interest rate | 5.9% | 5.4% | 4.7% | 4.7% | 4.7% | 4.6% | |||||||||||||||||||||||
| Variable rate US dollar debt | 2,164 | 98 | 26 | 25 | 131 | 280 | 2,724 | ||||||||||||||||||||||
| average interest rate | 5.0% | 3.7% | 4.8% | 4.5% | 4.7% | 5.1% | |||||||||||||||||||||||
| Fixed rate European currency debt | 73 | 188 | – | 1 | 1 | 7 | 270 | ||||||||||||||||||||||
| average interest rate | 4.4% | 2.8% | – | 5.4% | 3.0% | 4.7% | |||||||||||||||||||||||
| Variable rate European currency debt | 68 | – | – | – | – | – | 68 | ||||||||||||||||||||||
| average interest rate | 7.8% | – | – | – | – | – | |||||||||||||||||||||||
| Other fixed rate debt | 79 | 2 | – | 10 | – | 42 | 133 | ||||||||||||||||||||||
| average interest rate | 13.9% | 5.9% | – | 0.8% | – | 7.8% | |||||||||||||||||||||||
| Other variable rate debt | 624 | 48 | 13 | 7 | 6 | 2 | 700 | ||||||||||||||||||||||
| average interest rate | 13.7% | 7.9% | 11.8% | 13.2% | 12.8% | 9.5% | |||||||||||||||||||||||
Total | 3,980 | 905 | 94 | 89 | 174 | 342 | 5,584 | ||||||||||||||||||||||
G 72 Royal Dutch/ Shell Group of Companies
20-F/A (Amendment No. 2) 2002
Table of Contents
Interest rate swaps/forward rate agreements
The following two tables give details of interest rate swaps/forward rate agreements held by Group companies at December 31, 2002 and 2001 respectively, by expected year of maturity. These are held for purposes other than trading. The variable interest rate component of contracts is generally linked to inter-bank offer rates.
| 2002 | $ million | |||||||||||||||||||||||||||||
| 2003 | 2005 | 2006 | 2007 | 2008 | Total contract/ | Estimated | ||||||||||||||||||||||||
| and after | notional amount | fair value | ||||||||||||||||||||||||||||
| US dollar | ||||||||||||||||||||||||||||||
| Fixed to Variable: | contract/notional amount | 500 | 919 | 600 | 1,152 | – | 3,171 | 201 | ||||||||||||||||||||||
| average pay rate | 1.7% | 2.8% | 1.5% | 1.7% | – | |||||||||||||||||||||||||
| average receive rate | 5.0% | 5.7% | 3.1% | 4.8% | – | |||||||||||||||||||||||||
| Variable to Fixed: | contract/notional amount | 288 | 100 | – | 72 | 88 | 548 | (38 | ) | |||||||||||||||||||||
| average pay rate | 6.0% | 4.7% | – | 7.2% | 7.8% | |||||||||||||||||||||||||
| average receive rate | 2.9% | 2.0% | – | 4.8% | 2.5% | |||||||||||||||||||||||||
| UK pound | ||||||||||||||||||||||||||||||
| Fixed to Variable: | contract/notional amount | 8 | – | 603 | – | – | 611 | – | ||||||||||||||||||||||
| average pay rate | 4.7% | – | 3.9% | – | – | |||||||||||||||||||||||||
| average receive rate | 8.9% | – | 4.3% | – | – | |||||||||||||||||||||||||
| Other currencies | ||||||||||||||||||||||||||||||
| Fixed to Variable: | contract/notional amount | 16 | – | – | – | – | 16 | – | ||||||||||||||||||||||
| average pay rate | 2.7% | – | – | – | – | |||||||||||||||||||||||||
| average receive rate | 2.8% | – | – | – | – | |||||||||||||||||||||||||
| Variable to Fixed: | contract/notional amount | 4 | – | – | – | – | 4 | – | ||||||||||||||||||||||
| average pay rate | 12.8% | – | – | – | – | |||||||||||||||||||||||||
| average receive rate | 12.3% | – | – | – | – | |||||||||||||||||||||||||
Total | 816 | 1,019 | 1,203 | 1,224 | 88 | 4,350 | 163 | |||||||||||||||||||||||
At December 31, 2002, a Group company also held an option to enter into a euro fixed (3.8%) to variable (2.8%) interest rate swap maturing in 2003 with a face value of $1.2 billion and a fair value of $6 million. This was exercised on January 2, 2003. No such options were held at December 31, 2001.
| 2001 | $ million | |||||||||||||||||||||||||||||
| 2002 | 2003 | 2007 | Total contract/ | Estimated | ||||||||||||||||||||||||||
| and after | notional amount | fair value | ||||||||||||||||||||||||||||
| US dollar | ||||||||||||||||||||||||||||||
| Fixed to Variable: | contract/notional amount | 826 | 500 | 59 | 1,385 | 41 | ||||||||||||||||||||||||
| average pay rate | 4.2% | 4.4% | 9.6% | |||||||||||||||||||||||||||
| average receive rate | 6.0% | 5.0% | 6.2% | |||||||||||||||||||||||||||
| Variable to Fixed: | contract/notional amount | 58 | 288 | 80 | 426 | (24 | ) | |||||||||||||||||||||||
| average pay rate | 6.9% | 6.0% | 5.0% | |||||||||||||||||||||||||||
| average receive rate | 5.7% | 4.1% | 4.3% | |||||||||||||||||||||||||||
| Other currencies | ||||||||||||||||||||||||||||||
| Fixed to Variable: | contract/notional amount | 94 | 7 | – | 101 | 1 | ||||||||||||||||||||||||
| average pay rate | 3.0% | 5.4% | – | |||||||||||||||||||||||||||
| average receive rate | 3.7% | 7.0% | – | |||||||||||||||||||||||||||
| Variable to Fixed: | contract/notional amount | 41 | 9 | – | 50 | – | ||||||||||||||||||||||||
| average pay rate | 9.8% | 12.8% | – | |||||||||||||||||||||||||||
| average receive rate | 9.1% | 9.0% | – | |||||||||||||||||||||||||||
Total | 1,019 | 804 | 139 | 1,962 | 18 | |||||||||||||||||||||||||
Royal Dutch/Shell Group of Companies G 73
20-F/A (Amendment No. 2) 2002
Table of Contents
Foreign exchange contracts
The following two tables give details of forward exchange contracts held by Group companies at December 31, 2002 and 2001 respectively. These are held for purposes other than trading. Contract categories with a contract/notional amount exceeding $100 million and/or an estimated fair value exceeding $10 million (gain or loss) are listed separately.
| 2002(all contracts mature in 2003) | $ million | |||||||||||
| Average contractual | Contract/notional | Estimated | ||||||||||
| exchange rate | amount | fair value | ||||||||||
| Buy US dollar/sell UK pound | 0.64 | 7,170 | (138 | ) | ||||||||
| Buy US dollar/sell euro | 1.01 | 2,320 | (118 | ) | ||||||||
| Buy euro/sell US dollar | 1.03 | 677 | 13 | |||||||||
| Buy Canadian dollar/sell US dollar | 0.64 | 450 | (6 | ) | ||||||||
| Buy UK pound/sell US dollar | 1.55 | 427 | 14 | |||||||||
| Buy US dollar/sell Australian dollar | 1.77 | 392 | (1 | ) | ||||||||
| Buy Swiss franc/sell US dollar | 0.68 | 283 | 14 | |||||||||
| Buy US dollar/sell Norwegian krona | 7.06 | 209 | (3 | ) | ||||||||
| Buy Singapore dollar/sell US dollar | 0.57 | 180 | 1 | |||||||||
| Buy US dollar/sell Danish krona | 7.18 | 159 | (2 | ) | ||||||||
| Buy US dollar/sell Swedish krona | 8.84 | 154 | (1 | ) | ||||||||
| Buy US dollar/sell Hong Kong dollar | 7.80 | 131 | – | |||||||||
| Other contracts | 1,005 | (2 | ) | |||||||||
Total | 13,557 | (229 | ) | |||||||||
| 2001 (all contracts mature in 2002) | $ million | |||||||||||
| Average contractual | Contract/notional | Estimated | ||||||||||
| exchange rate | amount | fair value | ||||||||||
| Buy UK pound/sell US dollar | 1.44 | 1,735 | 2 | |||||||||
| Buy euro/sell US dollar | 0.89 | 706 | 1 | |||||||||
| Buy US dollar/sell Canadian dollar | 1.60 | 411 | 1 | |||||||||
| Buy US dollar/sell Swedish krona | 10.61 | 291 | (1 | ) | ||||||||
| Buy US dollar/sell Philippine peso | 52 | 289 | (1 | ) | ||||||||
| Buy Australian dollar/sell US dollar | 0.51 | 214 | 1 | |||||||||
| Buy US dollar/sell Danish krona | 8.38 | 143 | 1 | |||||||||
| Buy US dollar/sell Hong Kong dollar | 7.80 | 143 | – | |||||||||
| Buy US dollar/sell Japanese yen | 124 | 116 | 8 | |||||||||
| Buy US dollar/sell Singapore dollar | 1.83 | 114 | (1 | ) | ||||||||
| Buy euro/sell Danish krona | 7.44 | 106 | – | |||||||||
| Other contracts | 346 | 4 | ||||||||||
Total | 4,614 | 15 | ||||||||||
G 74 Royal Dutch/ Shell Group of Companies
20-F/A (Amendment No. 2) 2002
Table of Contents
Currency swaps/options
The following two tables give details of currency swaps contracts held by Group companies at December 31, 2002 and 2001 respectively, by expected year of maturity. These are held for purposes other than trading. Contract categories with a contract/ notional amount exceeding $100 million and/or an estimated fair value exceeding $10 million (gain or loss) are listed separately.
| 2002 | $ million | |||||||||||||||||||||||||||||||||||
| Average | 2003 | 2004 | 2005 | 2006 | 2007 | 2008 and | Total contract/ | Estimated | ||||||||||||||||||||||||||||
| contractual | after | notional amount | fair value | |||||||||||||||||||||||||||||||||
| exchange rate | ||||||||||||||||||||||||||||||||||||
| Buy UK pound/sell euro | 1.57 | – | 1,085 | – | – | – | – | 1,085 | 1 | |||||||||||||||||||||||||||
| Buy US dollar/sell Canadian dollar | 1.54 | 326 | 117 | 64 | 59 | 26 | 9 | 601 | 13 | |||||||||||||||||||||||||||
| Buy US dollar/sell euro | 1.09 | – | 461 | – | – | – | – | 461 | 63 | |||||||||||||||||||||||||||
| Buy Australian dollar/sell US dollar | 0.62 | – | 289 | – | – | – | – | 289 | 3 | |||||||||||||||||||||||||||
| Buy Canadian dollar/sell US dollar | 0.64 | 210 | 55 | 9 | – | 3 | – | 277 | (2 | ) | ||||||||||||||||||||||||||
| Buy US dollar/sell Brazilian real | 3.53 | 65 | 50 | 42 | 4 | 41 | – | 202 | 25 | |||||||||||||||||||||||||||
| Buy US dollar/sell Swiss franc | 1.50 | 200 | – | – | – | – | – | 200 | 30 | |||||||||||||||||||||||||||
| Other contracts | 123 | – | 27 | – | – | – | 150 | 9 | ||||||||||||||||||||||||||||
Total | 924 | 2,057 | 142 | 63 | 70 | 9 | 3,265 | 142 | ||||||||||||||||||||||||||||
| 2001 | $ million | |||||||||||||||||||||||||||||||||||
| Average | 2002 | 2003 | 2004 | 2005 | Total contract/ | Estimated | ||||||||||||||||||||||||||||||
| contractual | notional amount | fair value | ||||||||||||||||||||||||||||||||||
| exchange rate | ||||||||||||||||||||||||||||||||||||
| Buy US dollar/sell Brazilian real | 2.41 | 108 | 15 | 61 | 50 | 234 | (18 | ) | ||||||||||||||||||||||||||||
| Buy US dollar/sell Canadian dollar | 1.39 | 109 | 82 | 15 | 5 | 211 | 15 | |||||||||||||||||||||||||||||
| Buy US dollar/sell Swiss franc | 1.50 | – | 200 | – | – | 200 | (21 | ) | ||||||||||||||||||||||||||||
| Buy US dollar/sell Australian dollar | 1.52 | 38 | 39 | – | – | 77 | 23 | |||||||||||||||||||||||||||||
| Buy US dollar/sell Zimbabwe dollar | 7.67 | – | – | – | 23 | 23 | 13 | |||||||||||||||||||||||||||||
| Other contracts | 120 | 7 | 92 | – | 219 | 5 | ||||||||||||||||||||||||||||||
Total | 375 | 343 | 168 | 78 | 964 | 17 | ||||||||||||||||||||||||||||||
In conjunction with natural gas marketing activities, Group companies held put and call options to buy Canadian dollars and sell US dollars at December 31, 2002 each with a contract/ notional amount of $0.1 billion (2001: $0.2 billion) and a total estimated fair value of $(1) million (2001: $(11) million) and expected maturity in 2003 (2002 – 2003).
Royal Dutch/Shell Group of Companies G 75
20-F/A (Amendment No. 2) 2002
Table of Contents
Commodity derivatives
The tables on this and the following pages give details of commodity swaps, options and futures contracts held by Group companies at December 31, 2002 and 2001 respectively, by expected year of maturity. Variable prices are linked to indexed or dated commodities.
Commodity swaps held for trading purposes
| 2002 | $ million | ||||||||||||||||||||||||||||
| Total contract/ | Estimated | ||||||||||||||||||||||||||||
| 2003 | 2004 | 2005 | 2006 | 2007 | notional amount | fair value | |||||||||||||||||||||||
| Crude oil swaps | |||||||||||||||||||||||||||||
| (a) Variable price to variable price contracts: | |||||||||||||||||||||||||||||
| contract/notional amount ($ million) | 1,374 | 62 | – | – | – | 1,436 | (3 | ) | |||||||||||||||||||||
| Volume (million barrels “m bbl”) | 55 | 3 | – | – | – | ||||||||||||||||||||||||
| average pay/receive price ($/bbl) | 28.8/28.7 | 22.8/22.8 | – | – | – | ||||||||||||||||||||||||
| (b) Buy fixed price/sell variable price contracts: | |||||||||||||||||||||||||||||
| contract/notional amount ($ million) | 970 | 148 | 20 | 2 | – | 1,140 | 70 | ||||||||||||||||||||||
| Volume (m bbl) | 49 | 6 | 1 | * | – | ||||||||||||||||||||||||
| average pay/receive price ($/bbl) | 19.9/21.3 | 23.6/23.7 | 22.8/23.6 | 21.8/21.3 | – | ||||||||||||||||||||||||
| (c) Buy variable price/sell fixed price contracts: | |||||||||||||||||||||||||||||
| contract/notional amount ($ million) | 886 | 57 | 22 | – | – | 965 | (90 | ) | |||||||||||||||||||||
| Volume (m bbl) | 57 | 4 | 1 | – | – | ||||||||||||||||||||||||
| average pay/receive ($/bbl) | 17.3/15.6 | 15.5/15.6 | 23.6/23.0 | – | – | ||||||||||||||||||||||||
| Oil products swaps | |||||||||||||||||||||||||||||
| (a) Variable price to variable price contracts: | |||||||||||||||||||||||||||||
| contract/notional amount ($ million) | 287 | – | – | – | – | 287 | (1 | ) | |||||||||||||||||||||
| Volume (m bbl) | 70 | – | – | – | – | ||||||||||||||||||||||||
| average pay/receive ($/bbl) | 23.0/19.8 | – | – | – | – | ||||||||||||||||||||||||
| (b) Buy fixed price/sell variable price contracts: | |||||||||||||||||||||||||||||
| contract/notional amount ($ million) | 613 | – | 1 | – | – | 614 | 41 | ||||||||||||||||||||||
| Volume (m bbl) | 76 | – | * | – | – | ||||||||||||||||||||||||
| average pay/receive ($/bbl) | 8.1/8.6 | – | 19.1/17.6 | – | – | ||||||||||||||||||||||||
| (c) Buy variable price/sell fixed price contracts: | |||||||||||||||||||||||||||||
| contract/notional amount ($ million) | 681 | – | – | – | – | 681 | (42 | ) | |||||||||||||||||||||
| Volume (m bbl) | 88 | – | – | – | – | ||||||||||||||||||||||||
| average pay/receive ($/bbl) | 8.2/7.7 | – | – | – | – | ||||||||||||||||||||||||
| Electricity swaps | |||||||||||||||||||||||||||||
| (a) Buy fixed price/sell variable price contracts: | |||||||||||||||||||||||||||||
| contract/notional amount ($ million) | 261 | 66 | 36 | 29 | 18 | 410 | 66 | ||||||||||||||||||||||
| Volume (thousand megawatt hours “MMwh”) | 6 | 2 | 1 | 1 | ** | ||||||||||||||||||||||||
| average pay/receive ($/ Mwh) | 47.2/54.4 | 39.4/49.8 | 45.2/52.7 | 50.1/53.5 | 49.8/52.7 | ||||||||||||||||||||||||
| (b) Buy variable price/sell fixed price contracts: | |||||||||||||||||||||||||||||
| contract/notional amount ($ million) | 320 | 91 | 70 | 54 | 36 | 571 | (54 | ) | |||||||||||||||||||||
| Volume (MMwh) | 7 | 2 | 1 | 1 | 1 | ||||||||||||||||||||||||
| average pay/receive ($/ Mwh) | 53.5/48.4 | 54.8/50.0 | 53.8/50.7 | 52.9/49.3 | 53.1/48.9 | ||||||||||||||||||||||||
| * | less than one million barrels |
| ** | less than one thousand megawatt hours |
G 76 Royal Dutch/ Shell Group of Companies
20-F/A (Amendment No. 2) 2002
Table of Contents
| 2002continued | $ million | ||||||||||||||||||||||||||||||||
| 2008 and | Total contract/ | Estimated | |||||||||||||||||||||||||||||||
| 2003 | 2004 | 2005 | 2006 | 2007 | after | notional amount | fair value | ||||||||||||||||||||||||||
| Natural gas swaps | |||||||||||||||||||||||||||||||||
| (a) Buy fixed price/sell variable price contracts: | |||||||||||||||||||||||||||||||||
| contract/notional amount ($ million) | 3,803 | 925 | 184 | 87 | 32 | – | 5,031 | 895 | |||||||||||||||||||||||||
| Volume (thousand million cubic feet “bcf”) | 938 | 234 | 48 | 22 | 6 | – | |||||||||||||||||||||||||||
| average pay/receive ($/thousand cf) | 4.1/4.8 | 4.0/4.5 | 3.8/4.3 | 3.9/4.5 | 5.4/5.5 | – | |||||||||||||||||||||||||||
| (b) Buy variable price/sell fixed price contracts: | |||||||||||||||||||||||||||||||||
| contract/notional amount ($ million) | 3,951 | 803 | 121 | 25 | 4 | 11 | 4,915 | (831 | ) | ||||||||||||||||||||||||
| Volume (bcf) | 967 | 205 | 33 | 7 | 1 | 3 | |||||||||||||||||||||||||||
| average pay/receive ($/thousand cf) | 4.8/4.1 | 4.4/3.9 | 4.1/3.7 | 4.0/3.5 | 4.2/4.3 | 4.2/4.3 | |||||||||||||||||||||||||||
| NGL gas basis swaps | |||||||||||||||||||||||||||||||||
| (a) Buy fixed price/sell variable price contracts: | |||||||||||||||||||||||||||||||||
| contract/notional amount ($ million) | 373 | 88 | 46 | 24 | 15 | 4 | 550 | (283 | ) | ||||||||||||||||||||||||
| Volume (m bbl) | 1,033 | 246 | 114 | 63 | 40 | 18 | |||||||||||||||||||||||||||
| average pay/receive ($/bbl) | 0.36/0.16 | 0.36/0.18 | 0.4/0.25 | 0.38/0.27 | 0.38/0.27 | 0.23/0.09 | |||||||||||||||||||||||||||
| (b) Buy variable price/sell fixed price contracts: | |||||||||||||||||||||||||||||||||
| contract/notional amount ($ million) | 344 | 73 | 30 | 15 | 9 | 9 | 480 | 277 | |||||||||||||||||||||||||
| Volume (m bbl) | 994 | 210 | 79 | 40 | 26 | 27 | |||||||||||||||||||||||||||
| average pay/receive ($/bbl) | 0.16/0.35 | 0.12/0.35 | 0.14/0.38 | 0.17/0.38 | 0.19/0.35 | 0.13/0.33 | |||||||||||||||||||||||||||
Total | 17,080 | 45 | |||||||||||||||||||||||||||||||
Group companies also held chemical product and natural gas liquid swaps at December 21, 2002 with a contract/notional amount of $166 million (2001: $234 million) and fair value of $5 million (2001: $(3) million) and expected maturity 2003 – 2004 (2002 – 2003).
Commodity swaps held for purposes other than trading
At December 31, 2002 Group companies held crude oil, natural gas and oil product commodity swaps for purposes other than trading with a contract/ notional amount of $57 million (2001: $66 million) and an estimated fair value of $7 million (2001: $(8) million).
Royal Dutch/Shell Group of Companies G 77
20-F/A (Amendment No. 2) 2002
Table of Contents
| 2001 | $ million | ||||||||||||||||||||||||||||||||
| 2007 | Total contract/ | Estimated | |||||||||||||||||||||||||||||||
| 2002 | 2003 | 2004 | 2005 | 2006 | and after | notional amount | fair value | ||||||||||||||||||||||||||
| Crude oil swaps | |||||||||||||||||||||||||||||||||
| (a) Variable price to variable price contracts: | |||||||||||||||||||||||||||||||||
| contract/notional amount ($ million) | 1,305 | – | – | – | – | – | 1,305 | (4 | ) | ||||||||||||||||||||||||
| volume (million barrels “m bbl”) | 64 | – | – | – | – | – | |||||||||||||||||||||||||||
| average pay/receive price ($ per barrel “$/bbl”) | 20.4/20.3 | – | – | – | – | – | |||||||||||||||||||||||||||
| (b) Buy fixed price/sell variable price contracts: | |||||||||||||||||||||||||||||||||
| contract/notional amount ($ million) | 431 | 36 | – | – | – | – | 467 | (31 | ) | ||||||||||||||||||||||||
| volume (m bbl) | 35 | 2 | – | – | – | – | |||||||||||||||||||||||||||
| average pay/receive price ($/bbl) | 12.3/11.5 | 22.0/20.0 | – | – | – | – | |||||||||||||||||||||||||||
| (c) Buy variable price/sell fixed price contracts: | |||||||||||||||||||||||||||||||||
| contract/notional amount ($ million) | 505 | 72 | – | – | – | – | 577 | 60 | |||||||||||||||||||||||||
| volume (m bbl) | 36 | 4 | – | – | – | – | |||||||||||||||||||||||||||
| average pay/receive price ($/bbl) | 12.8/14.3 | 17.1/19.1 | – | – | – | – | |||||||||||||||||||||||||||
| Oil products swaps | |||||||||||||||||||||||||||||||||
| (a) Variable price to variable price contracts: | |||||||||||||||||||||||||||||||||
| contract/notional amount ($ million) | 28 | 38 | – | – | – | – | 66 | – | |||||||||||||||||||||||||
| volume (m bbl) | 1 | 2 | – | – | – | – | |||||||||||||||||||||||||||
| average pay/receive price ($/bbl) | 20.6/20.7 | 20.9/20.8 | – | – | – | – | |||||||||||||||||||||||||||
| (b) Buy fixed price/sell variable price contracts: | |||||||||||||||||||||||||||||||||
| contract/notional amount ($ million) | 357 | 9 | – | – | – | – | 366 | (22 | ) | ||||||||||||||||||||||||
| volume (m bbl) | 34 | 3 | – | – | – | – | |||||||||||||||||||||||||||
| average pay/receive price ($/bbl) | 10.5/9.9 | 3.1/2.3 | – | – | – | – | |||||||||||||||||||||||||||
| (c) Buy variable price/sell fixed price contracts: | |||||||||||||||||||||||||||||||||
| contract/notional amount ($ million) | 480 | – | – | – | – | – | 480 | 14 | |||||||||||||||||||||||||
| volume (m bbl) | 42 | – | – | – | – | – | |||||||||||||||||||||||||||
| average pay/receive price ($/bbl) | 11.2/11.5 | – | – | – | – | – | |||||||||||||||||||||||||||
| Natural gas swaps | |||||||||||||||||||||||||||||||||
| (a) Buy fixed price/sell variable price contracts: | |||||||||||||||||||||||||||||||||
| contract/notional amount ($ million) | 3,547 | 671 | 299 | 140 | 66 | 26 | 4,749 | (943 | ) | ||||||||||||||||||||||||
| volume (thousand million cubic feet “bcf”) | 1,454 | 376 | 182 | 94 | 50 | 40 | |||||||||||||||||||||||||||
| average pay/receive price ($/thousand cf) | 2.8/2.4 | 3.2/1.8 | 3.1/1.7 | 3.1/1.5 | 2.9/1.3 | 2.6/0.7 | |||||||||||||||||||||||||||
| (b) Buy variable/sell fixed price contracts: | |||||||||||||||||||||||||||||||||
| contract/notional amount ($ million) | 3,743 | 746 | 248 | 70 | 58 | 72 | 4,937 | 1,099 | |||||||||||||||||||||||||
| volume (bcf) | 1,467 | 374 | 161 | 76 | 59 | 79 | |||||||||||||||||||||||||||
| average pay/receive price ($/thousand cf) | 2.4/3.5 | 2.0/3.5 | 1.5/3.5 | 0.9/3.3 | 1.0/3.1 | 0.9/2.9 | |||||||||||||||||||||||||||
Total | 12,947 | 173 | |||||||||||||||||||||||||||||||
G 78 Royal Dutch/ Shell Group of Companies
20-F/A (Amendment No. 2) 2002
Table of Contents
Commodity options held for trading purposes
| 2002 | $ million | ||||||||||||||||||||
| Total contract/ | Estimated | ||||||||||||||||||||
| 2003 | 2004 | 2005 | notional amount | fair value | |||||||||||||||||
| Crude oil buy calls | |||||||||||||||||||||
| contract/notional amount ($ million) | 711 | 13 | – | 724 | 57 | ||||||||||||||||
| volume (m bbl) | 26 | * | – | ||||||||||||||||||
| average strike price ($/bbl) | 27.6 | 23.1 | – | ||||||||||||||||||
| Crude oil sell calls | |||||||||||||||||||||
| contract/notional amount ($ million) | 620 | 59 | 1 | 680 | (70 | ) | |||||||||||||||
| volume (m bbl) | 23 | 2 | * | ||||||||||||||||||
| average strike price ($/bbl) | 26.5 | 27.2 | 25.1 | ||||||||||||||||||
| Crude oil buy put | |||||||||||||||||||||
| contract/notional amount ($ million) | 416 | 90 | – | 506 | 19 | ||||||||||||||||
| volume (m bbl) | 21 | 4 | – | ||||||||||||||||||
| average strike price ($/bbl) | 20.2 | 20.4 | – | ||||||||||||||||||
| Crude oil sell put | |||||||||||||||||||||
| contract/notional amount ($ million) | 396 | 49 | – | 445 | (19 | ) | |||||||||||||||
| volume (m bbl) | 19 | 2 | – | ||||||||||||||||||
| average strike price ($/bbl) | 21.3 | 21.0 | – | ||||||||||||||||||
| Natural gas buy call | |||||||||||||||||||||
| contract/notional amount ($ million) | 7,284 | 814 | 51 | 8,149 | 654 | ||||||||||||||||
| volume (bcf) | 1,375 | 150 | 12 | ||||||||||||||||||
| average strike price ($/thousand cf) | 5.3 | 5.4 | 4.3 | ||||||||||||||||||
| Natural gas sell call | |||||||||||||||||||||
| contract/notional amount ($ million) | 5,336 | 654 | 48 | 6,038 | (468 | ) | |||||||||||||||
| volume (bcf) | 971 | 114 | 8 | ||||||||||||||||||
| average strike price ($/thousand cf) | 5.5 | 5.7 | 5.9 | ||||||||||||||||||
| Natural gas buy put | |||||||||||||||||||||
| contract/notional amount ($ million) | 3,975 | 411 | 47 | 4,433 | 132 | ||||||||||||||||
| volume (bcf) | 1,157 | 124 | 13 | ||||||||||||||||||
| average strike price ($/thousand cf) | 3.4 | 3.3 | 3.7 | ||||||||||||||||||
| Natural gas sell put | |||||||||||||||||||||
| contract/notional amount ($ million) | 5,481 | 467 | 71 | 6,019 | (209 | ) | |||||||||||||||
| volume (bcf) | 1,483 | 130 | 21 | ||||||||||||||||||
| average strike price ($/thousand cf) | 3.7 | 3.6 | 3 | ||||||||||||||||||
Total | 26,994 | 96 | |||||||||||||||||||
* less than one million barrels
Group companies also held chemical and oil products options/ swaptions at December 31, 2002 with a contract/ notional amount of $51 million (2001: $46 million) and estimated fair value less than $1 million (2001: $4 million) and expected maturity 2003 – 2004 (2002 – 2003).
Commodity options held for purposes other than trading
At December 31, 2002 Group companies held natural gas commodity sales contracts for purposes other than trading with a contract notional amount of $1.3 billion (2001: nil) and estimated fair value of $(64) million (2001: nil) with expected maturity 2003 – 2025.
Royal Dutch/Shell Group of Companies G 79
20-F/A (Amendment No. 2) 2002
Table of Contents
| 2001 | $ million | ||||||||||||||||
| Total contract/ | Estimated | ||||||||||||||||
| 2002 | 2003 | notional amount | fair value | ||||||||||||||
| Crude oil buy calls | |||||||||||||||||
| contract/notional amount ($ million) | 690 | 154 | 844 | 34 | |||||||||||||
| volume (m bbl) | 25 | 6 | |||||||||||||||
| average strike price ($/bbl) | 27.3 | 25.6 | |||||||||||||||
| Crude oil sell calls | |||||||||||||||||
| contract/notional amount ($ million) | 476 | 77 | 553 | (22 | ) | ||||||||||||
| volume (m bbl) | 18 | 4 | |||||||||||||||
| average strike price ($/bbl) | 26.1 | 22.4 | |||||||||||||||
| Crude oil buy put | |||||||||||||||||
| contract/notional amount ($ million) | 638 | 11 | 649 | 55 | |||||||||||||
| volume (m bbl) | 32 | 1 | |||||||||||||||
| average strike price ($/bbl) | 20.1 | 18.2 | |||||||||||||||
| Crude oil sell put | |||||||||||||||||
| contract/notional amount ($ million) | 706 | 72 | 778 | (93 | ) | ||||||||||||
| volume (m bbl) | 34 | 4 | |||||||||||||||
| average strike price ($/bbl) | 20.8 | 18.0 | |||||||||||||||
| Natural gas buy call | |||||||||||||||||
| contract/notional amount ($ million) | 3,453 | 1,005 | 4,458 | 203 | |||||||||||||
| volume (bcf) | 752 | 229 | |||||||||||||||
| average strike price ($/thousand cf) | 4.6 | 4.4 | |||||||||||||||
| Natural gas sell call | |||||||||||||||||
| contract/notional amount ($ million) | 2,925 | 1,060 | 3,985 | (149 | ) | ||||||||||||
| volume (bcf) | 633 | 213 | |||||||||||||||
| average strike price ($/thousand cf) | 4.6 | 5.0 | |||||||||||||||
| Natural gas buy put | |||||||||||||||||
| contract/notional amount ($ million) | 2,552 | 623 | 3,175 | 832 | |||||||||||||
| volume (bcf) | 760 | 175 | |||||||||||||||
| average strike price ($/thousand cf) | 3.4 | 3.6 | |||||||||||||||
| Natural gas sell put | |||||||||||||||||
| contract/notional amount ($ million) | 2,966 | 654 | 3,620 | (938 | ) | ||||||||||||
| volume (bcf) | 855 | 189 | |||||||||||||||
| average strike price ($/thousand cf) | 3.5 | 3.5 | |||||||||||||||
Total | 18,062 | (78 | ) | ||||||||||||||
G 80 Royal Dutch/ Shell Group of Companies
20-F/A (Amendment No. 2) 2002
Table of Contents
Commodity futures held for trading purposes
| 2002 | $ million | ||||||||||||||||||||
| Total contract/ | Estimated | ||||||||||||||||||||
| 2003 | 2004 | 2005 | notional amount | fair value | |||||||||||||||||
| IPE Brent futures | |||||||||||||||||||||
| (a) Short contracts: | |||||||||||||||||||||
| contract/notional amount ($ million) | 421 | – | – | 421 | (24 | ) | |||||||||||||||
| volume (m bbl) | 16 | – | – | ||||||||||||||||||
| weighted average price ($/bbl) | 26 | – | – | ||||||||||||||||||
| (b) Long contracts: | |||||||||||||||||||||
| contract/notional amount ($ million) | 184 | – | – | 184 | 20 | ||||||||||||||||
| volume (m bbl) | 7 | – | – | ||||||||||||||||||
| weighted average price ($/bbl) | 26 | – | – | ||||||||||||||||||
| IPE Gasoil futures | |||||||||||||||||||||
| (a) Short contracts: | |||||||||||||||||||||
| contract/notional amount ($ million) | 417 | – | – | 417 | (31 | ) | |||||||||||||||
| volume (m bbl) | 13 | – | – | ||||||||||||||||||
| weighted average price ($/bbl) | 32 | – | – | ||||||||||||||||||
| (b) Long contracts: | |||||||||||||||||||||
| contract/notional amount ($ million) | 137 | – | – | 137 | 6 | ||||||||||||||||
| volume (m bbl) | 5 | – | – | ||||||||||||||||||
| weighted average price ($/bbl) | 29 | – | – | ||||||||||||||||||
| Nymex crude oil futures | |||||||||||||||||||||
| (a) Short contracts: | |||||||||||||||||||||
| contract/notional amount ($ million) | 1,836 | 50 | – | 1,886 | (100 | ) | |||||||||||||||
| volume (m bbl) | 65 | 2 | – | ||||||||||||||||||
| weighted average price ($/bbl) | 28 | 23 | – | ||||||||||||||||||
| (b) Long contracts: | |||||||||||||||||||||
| contract/notional amount ($ million) | 2,003 | 20 | – | 2,023 | 140 | ||||||||||||||||
| volume (m bbl) | 73 | * | – | ||||||||||||||||||
| weighted average price ($/bbl) | 28 | 23 | – | ||||||||||||||||||
| Nymex oil product futures | |||||||||||||||||||||
| (a) Short contracts: | |||||||||||||||||||||
| contract/notional amount ($ million) | 1,312 | – | – | 1,312 | (78 | ) | |||||||||||||||
| volume (m bbl) | 51 | – | – | ||||||||||||||||||
| weighted average price ($/bbl) | 26 | – | – | ||||||||||||||||||
| (b) Long contracts: | |||||||||||||||||||||
| contract/notional amount ($ million) | 1,129 | – | – | 1,129 | 41 | ||||||||||||||||
| volume (m bbl) | 45 | – | – | ||||||||||||||||||
| weighted average price ($/bbl) | 25 | – | – | ||||||||||||||||||
| Nymex natural gas futures | |||||||||||||||||||||
| (a) Short contracts: | |||||||||||||||||||||
| contract/notional amount ($ million) | 1,452 | 278 | – | 1,730 | (293 | ) | |||||||||||||||
| volume (bcf) | 358 | 71 | – | ||||||||||||||||||
| weighted average price ($/thousand cf) | 4 | 4 | – | ||||||||||||||||||
| (b) Long contracts: | |||||||||||||||||||||
| contract/notional amount ($ million) | 1,411 | 309 | 24 | 1,744 | 284 | ||||||||||||||||
| volume (bcf) | 348 | 78 | 6 | ||||||||||||||||||
| weighted average price ($/thousand cf) | 4 | 4 | 4 | ||||||||||||||||||
Total | 10,983 | (35 | ) | ||||||||||||||||||
* less than one million barrels
Group companies also held electricity futures contracts at December 31, 2002 with a contract/notional amount of $4 million (2001: nil) and an estimated fair value of $1 million (2001: nil) with expected maturity 2003.
Royal Dutch/Shell Group of Companies G 81
20-F/A (Amendment No. 2) 2002
Table of Contents
| 2001 | $ million | ||||||||||||||||||||
| Total contract/ | Estimated | ||||||||||||||||||||
| 2002 | 2003 | 2004 | notional amount | fair value | |||||||||||||||||
| IPE Brent futures | |||||||||||||||||||||
| (a) Short contracts: | |||||||||||||||||||||
| contract/notional amount ($ million) | 243 | – | – | 243 | (28 | ) | |||||||||||||||
| volume (m bbl) | 12 | – | – | ||||||||||||||||||
| weighted average price ($/bbl) | 19.7 | – | – | ||||||||||||||||||
| (b) Long contracts: | |||||||||||||||||||||
| contract/notional amount ($ million) | 229 | – | – | 229 | (28 | ) | |||||||||||||||
| volume (m bbl) | 12 | – | – | ||||||||||||||||||
| weighted average price ($/bbl) | 19.6 | – | – | ||||||||||||||||||
| IPE Gasoil futures | |||||||||||||||||||||
| (a) Short contracts: | |||||||||||||||||||||
| contract/notional amount ($ million) | 62 | – | – | 62 | 10 | ||||||||||||||||
| volume (m bbl) | 2.7 | – | – | ||||||||||||||||||
| weighted average price ($/bbl) | 22.9 | – | – | ||||||||||||||||||
| (b) Long contracts: | |||||||||||||||||||||
| contract/notional amount ($ million) | 35 | – | – | 35 | (1 | ) | |||||||||||||||
| volume (m bbl) | 1.6 | – | – | ||||||||||||||||||
| weighted average price ($/bbl) | 22.9 | – | – | ||||||||||||||||||
| Nymex crude oil futures | |||||||||||||||||||||
| (a) Short contracts: | |||||||||||||||||||||
| contract/notional amount ($ million) | 67 | – | – | 67 | (4 | ) | |||||||||||||||
| volume (m bbl) | 3 | – | – | ||||||||||||||||||
| weighted average price ($/bbl) | 20.5 | – | – | ||||||||||||||||||
| (b) Long contracts: | |||||||||||||||||||||
| contract/notional amount ($ million) | 50 | – | – | 50 | (7 | ) | |||||||||||||||
| volume (m bbl) | 2 | – | – | ||||||||||||||||||
| weighted average price ($/bbl) | 20.3 | – | – | ||||||||||||||||||
| Nymex oil product futures | |||||||||||||||||||||
| (a) Short contracts: | |||||||||||||||||||||
| contract/notional amount ($ million) | 11 | – | – | 11 | 2 | ||||||||||||||||
| volume (m bbl) | * | – | – | ||||||||||||||||||
| weighted average price ($/bbl) | 24.9 | – | – | ||||||||||||||||||
| (b) Long contracts: | |||||||||||||||||||||
| contract/notional amount ($ million) | 58 | – | – | 58 | 11 | ||||||||||||||||
| volume (m bbl) | 2 | – | – | ||||||||||||||||||
| weighted average price ($/bbl) | 26.2 | – | – | ||||||||||||||||||
| Nymex natural gas futures | |||||||||||||||||||||
| (a) Short contracts: | |||||||||||||||||||||
| contract/notional amount ($ million) | 258 | 29 | – | 287 | 55 | ||||||||||||||||
| volume (bcf) | 69 | 8 | – | ||||||||||||||||||
| weighted average price ($/thousand cf) | 3.7 | 3.8 | – | ||||||||||||||||||
| (b) Long contracts: | |||||||||||||||||||||
| contract/notional amount ($ million) | 369 | 38 | 4 | 411 | (81 | ) | |||||||||||||||
| volume (bcf) | 97 | 10 | 1 | ||||||||||||||||||
| weighted average price ($/thousand cf) | 3.8 | 3.9 | 4.7 | ||||||||||||||||||
Total | 1,453 | (71 | ) | ||||||||||||||||||
* less than one million barrels
Futures contracts shown above represent unmatched positions. The total contract/notional amount of short contracts represents an aggregation of Group companies’ positions where, at December 31, 2002 and 2001 respectively, sales contracts exceed the purchase contracts with the same maturity date. The total contract/notional amount of long contracts represents an aggregation of Group companies’ positions where, at December 31, 2002 and 2001 respectively, purchase contracts exceed the sales contracts with the same maturity date.
G 82 Royal Dutch/ Shell Group of Companies
20-F/A (Amendment No. 2) 2002
Table of Contents
Exhibits
EXHIBIT INDEX
| Exhibit | Page | |||||||
| No. | Description | No. | ||||||
| 1.1 | Articles of Association of Royal Dutch (incorporated by reference to Exhibit 1.1 to the Annual Report on Form 20-F (Commission File Nos. 1-3788 and 1-4039) of Royal Dutch and Shell Transport filed with the Securities and Exchange Commission on March 31, 2003) | |||||||
| 1.2 | Memorandum and Articles of Association of Shell Transport (incorporated by reference to Exhibit 4.1 to the Report of Foreign Issuer on Form 6-K (Commission File No. 1-4039) of Shell Transport furnished to the Securities and Exchange Commission on June 21, 2002) | |||||||
| 4.1 | Adjustment Agreement between Royal Dutch and Shell Transport dated July 5, 1907, and certain amendments thereto (incorporated by reference to Exhibit 4.1 to the Annual Report on Form 20-F (Commission File Nos. 1-3788 and 1-4039) of Royal Dutch and Shell Transport filed with the Securities and Exchange Commission on March 31, 2003) | |||||||
| 4.2 | Shell Petroleum N.V. Stock Option Plan, as amended (incorporated by reference to the Post-Effective Amendment No. 1 to Registration Statement on Form S-8 (Registration No. 333-7590) of Royal Dutch and Shell Transport filed with the Securities and Exchange Commission on June 28, 2001) | |||||||
| 4.3 | Shell Petroleum Company Limited Stock Option Plan (1967), as amended (incorporated by reference to the Post-Effective Amendment No. 1 to Registration Statement on Form S-8 (Registration No. 333-7590) of Royal Dutch and Shell Transport filed with the Securities and Exchange Commission on June 28, 2001) | |||||||
| 8 | Significant Group companies as at December 31, 2002 (incorporated by reference to Exhibit 8 to the Annual Report on Form 20-F (Commission File Nos. 1-3788 and 1-4039) of Royal Dutch and Shell Transport filed with the Securities and Exchange Commission on March 31, 2003) | |||||||
| 23.1 | Consent of KPMG Accountants N.V., The Hague | E2 | ||||||
| 23.2 | Consent of PricewaterhouseCoopers LLP, London | E3 | ||||||
| 23.3 | Consent of KPMG Accountants N.V., The Hague and PricewaterhouseCoopers LLP, London | E4 | ||||||
| 23.4 | Consent of KPMG Accountants N.V., The Hague | E5 | ||||||
| 23.5 | Consent of KPMG Accountants N.V., The Hague and PricewaterhouseCoopers LLP, London | E6 | ||||||
| 23.6 | Consent of KPMG Accountants N.V., The Hague and PricewaterhouseCoopers LLP, London | E7 | ||||||
| 23.7 | Consent of KPMG Accountants N.V., The Hague and PricewaterhouseCoopers LLP, London | E8 | ||||||
| 99.1 | Section 302 Certification of Royal Dutch | E9 | ||||||
| 99.2 | Section 302 Certification of Royal Dutch | E10 | ||||||
| 99.3 | Section 302 Certification of Shell Transport | E11 | ||||||
| 99.4 | Section 302 Certification of Shell Transport | E12 | ||||||
| 99.5 | Section 906 Certification of Royal Dutch | E13 | ||||||
| 99.6 | Section 906 Certification of Shell Transport | E14 | ||||||
Exhibits E 1
20-F/A (Amendment No. 2) 2002
Table of Contents
Signatures
As to the undersigned registrant, this Amendment No. 2 consists solely of the information referred to on the cross-reference sheet headed Royal Dutch and does not include the information as to Shell Transport on page 35 under the heading “Selected Financial Data”, on page 37, on pages 79 through 88 and pages S1 through S21.
The material in this Amendment No. 2 is stated as at December 31, 2002, except that certain 2003 subsequent events are stated down to March 3, 2005.
Pursuant to the requirements of Section 12 of the Securities Exchange Act of 1934, the registrant certifies that it meets all of the requirements for filing on Form 20-F/A and has duly caused this Amendment No. 2 to be signed on its behalf by the undersigned, thereunto duly authorised.
N.V. KONINKLIJKE NEDERLANDSCHE PETROLEUM MAATSCHAPPIJ
/s/ Jeroen van der Veer
-----------------------------------------------------
Jeroen van der Veer
President and Managing Director
/s/ Rob Routs
-----------------------------------------------------
Rob Routs
Managing Director
March 3, 2005
20-F/A (Amendment No. 2) 2002
Table of Contents
As to the undersigned registrant, this Amendment No. 2 consists solely of the information referred to on the cross-reference sheet headed Shell Transport and does not include the information as to Royal Dutch on page 35 under the heading “Selected Financial Data”, on page 36, on pages 70 through 78 and pages R1 through R18.
The material in this Amendment No. 2 is stated as at December 31, 2002, except that certain 2003 subsequent events are stated down to March 3, 2005.
Pursuant to the requirements of Section 12 of the Securities Exchange Act of 1934, the registrant certifies that it meets all of the requirements for filing on Form 20-F/A and has duly caused this Amendment No. 2 to be signed on its behalf by the undersigned, thereunto duly authorised.
THE “ SHELL ” TRANSPORT AND TRADING COMPANY, PUBLIC LIMITED COMPANY
/s/ Malcolm Brinded
-----------------------------------------------------
Malcolm Brinded
Managing Director
March 3, 2005
20-F/A (Amendment No. 2) 2002