Item 1: Report to Shareholders| Equity Index 500 Fund | June 30, 2005 |
The views and opinions in this report were current as of June 30, 2005. They are not guarantees of performance or investment results and should not be taken as investment advice. Investment decisions reflect a variety of factors, and the managers reserve the right to change their views about individual stocks, sectors, and the markets at any time. As a result, the views expressed should not be relied upon as a forecast of the fund’s future investment intent. The report is certified under the Sarbanes-Oxley Act of 2002, which requires mutual funds and other public companies to affirm that, to the best of their knowledge, the information in their financial reports is fairly and accurately stated in all material respects.
REPORTS ON THE WEB
Sign up for our E-mail Program, and you can begin to receive updated fund reports and prospectuses online rather than through the mail. Log in to your account at troweprice.com for more information.
Fellow ShareholdersLarge-cap U.S. stocks generally declined in the first half of 2005, as modest second-quarter gains were not enough to offset first-quarter losses. Some small- and mid-cap indexes fared better than large-cap benchmarks and produced slight gains for the six-month period. Nevertheless, the market’s attempts to advance were hindered by concerns about the pace of economic growth amid surging oil prices—which reached $60 per barrel in late June—and rising short-term interest rates.
MARKET ENVIRONMENT
Economic conditions were mostly favorable in the first half of 2005. Although the manufacturing sector decelerated somewhat, the economy expanded at a steady pace. New job growth continued at a reasonable rate, the unemployment rate hovered slightly above 5%, and inflation remained contained, despite skyrocketing oil prices.
Relatively low interest rates continued to provide a helpful stimulus to the economy. Although money market and short-term bond yields increased as the Federal Reserve raised the fed funds target rate, long-term interest rates unexpectedly declined. The result was a flattening of the Treasury yield curve, which currently indicates that long-term Treasury yields are not much higher than short-term yields.
Large-cap U.S. stocks generally declined through April amid fears of slower economic growth accompanied by higher inflation. However, Federal Reserve officials assuaged investor worries by asserting that the economy was on a “reasonably firm footing” and that “underlying inflation remains contained.” Brisk merger activity and generally favorable corporate earnings news helped lift stocks in the second quarter, though a late-June spike in oil prices and prospects for the central bank to continue raising the overnight federal funds target rate—which has already risen from 1.00% to 3.25% over the last 12 months—capped the market’s advance.
Large-cap shares, as measured by the S&P 500 Stock Index, returned -0.81% versus 2.19% for the Dow Jones Wilshire 4500 Completion Index, a broad benchmark for small- and mid-cap stocks. As measured by various Russell indexes, value stocks outperformed their growth counterparts across all market capitalizations.| WILSHIRE 5000 RETURNS BY SECTOR |
| | |
| Periods Ended 6/30/05 | 6 Months | 12 Months |
| Consumer Discretionary | -3.81% | 8.26% |
| Consumer Staples | 0.27 | 2.59 |
| Energy | 20.63 | 40.82 |
| Financials | -1.60 | 8.82 |
| Health Care | 4.53 | 5.18 |
| Industrials and Business Services | -3.52 | 6.68 |
| Information Technology | -5.13 | -2.28 |
| Materials | -7.48 | 6.41 |
| Telecommunication Services | -2.81 | 11.89 |
| Utilities | 14.36 | 35.68 |
The market for initial public offerings (IPOs) was relatively quiet in the first half of the year, though activity picked up in recent months. Fewer than 100 companies went public in the last six months, according to data from Dealogic and Thomson Financial. Nevertheless, the universe of publicly traded companies based in the U.S., as measured by the Dow Jones Wilshire 5000 Composite Index, continued to shrink in the last six months. One likely reason is brisk merger and acquisition activity; another may be insufficient trading activity involving shares of some of the smallest companies. As of June 30, there were 4,905 companies in the index versus 4,971 at the end of 2004.
SECTOR PERFORMANCE
In the U.S. stock market, as measured by the Wilshire 5000, energy stocks and utilities produced vigorous gains and far surpassed other sectors in the last six months. Health care was also modestly higher. The materials and information technology sectors performed worst, but stocks in the consumer discretionary and industrials and business services sectors also struggled.
EQUITY INDEX 500 FUND
| PERFORMANCE COMPARISON |
| | |
| Periods Ended 6/30/05 | 6 Months | 12 Months |
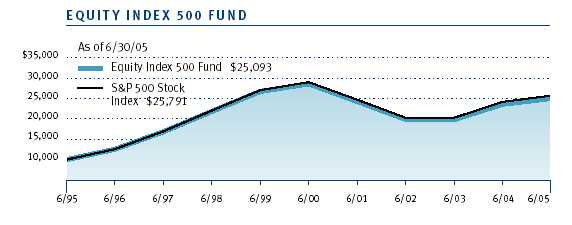
| Equity Index 500 Fund | -0.95% | 6.02% |
| S&P 500 Stock Index | -0.81 | 6.32 |
Your fund returned -0.95% in the last six months and 6.02% for the 12-month period ended June 30, 2005. As shown in the table, the fund closely tracked the performance of its benchmark, the S&P 500 Stock Index, in both periods. The fund usually lags slightly due to annual operating and management expenses.
Energy stocks (8.8% of equities as of June 30) produced outstanding results as oil prices extended last year’s ascent into the first half of 2005. Nearly every energy holding appreciated in value, and many were among our largest contributors to performance. The largest was ExxonMobil, which gained 13% amid rising oil prices and following better-than-expected earnings in the fourth quarter of 2004. (Please refer to the fund’s portfolio of investments for a complete listing of the fund’s holdings and the amount each represents in the portfolio.)
Utility stocks (3.5% of equities) also extended last year’s brisk performance, led by electric utilities. One of our top contributors in this segment was Exelon, which advanced 18%. Independent power producers also performed well, especially TXU Corporation, whose shares surged 30% as its energy division benefited from rising natural gas prices. Gas utility companies trailed.
In the health care sector (13.4% of equities), gains were driven by providers and service companies. UnitedHealth Group, a high-quality, diversified, national managed care provider, was our best holding in the sector. Shares of WellPoint, HCA, and Aetna also performed very well. Pharmaceutical stocks were mixed, as weakness in Merck and Schering-Plough offset gains in Pfizer and Johnson & Johnson. Biotechnology and health care equipment and supply companies generally declined, though Gilead Sciences and Medtronic contributed to our results.
On the downside, information technology shares (15.2% of equities) detracted the most in the last six months. Nearly every underlying industry declined, but semiconductor-related stocks produced gains, thanks primarily to strength in Intel and Texas Instruments. Software stocks were dragged lower by weakness in industry giant Microsoft, but makers of computers and peripherals performed worst, led by IBM, which reported lower-than-expected first-quarter earnings and which tumbled more than 24% in the first half. Hewlett-Packard, however, bucked the negative trend as the company replaced CEO Carly Fiorina and began focusing on increasing its profitability.Consumer discretionary stocks (11.4% of equities) generally fell, though multi-line retailers J.C. Penney, May Department Stores, and Nordstrom performed very well. Media stocks continued to struggle across the board, especially Time Warner and Viacom, while automobile stocks Ford Motor and GM suffered from weakening sales and credit rating downgrades. Specialty retailers were mixed, as gains in Best Buy and Office Depot were offset by weak performance of Home Depot. Toys R Us performed well, however, after the company received a buy-out offer from two private equity firms and a real estate developer.
| PORTFOLIO CHARACTERISTICS |
|
| | | | Extended |
| | Equity | Total Equity | Equity |
| As of 6/30/05 | Index 500 | Market Index | Market Index |
| Market Cap | | | |
| (Investment- | | | |
| Weighted Median) | $48.8 billion | $25.0 billion | $2.6 billion |
| |
| Earnings Growth | | | |
| Rate Estimated | | | |
| Next 5 Years * | 11.2% | 11.3% | 14.4% |
| |
| P/E Ratio (Based | | | |
| on Next 12 Months’ | | | |
| Estimated Earnings) * | 15.4X | 15.8X | 17.5X |
| | | |
| * Source data: IBES. Forecasts are in no way indicative of future investment returns. |
Most major underlying industries in the financial sector (20.3% of equities) declined in the last six months. Real estate-related companies outperformed, however, especially Simon Property Group and Equity Office Properties, which benefited from the booming real estate market. Insurance stocks also held up well, with Prudential and Allstate producing good returns, though shares of American International Group suffered amid regulatory scrutiny of its accounting practices. Commercial banks did worst, especially Bank of America and Wachovia. Brokerage stocks and asset managers also struggled, though Lehman Brothers and Franklin Resources traded higher.The industrials and business services sector (11.2% of equities) also detracted substantially from our performance. Industrial conglomerates GE, 3M, and Tyco International were responsible for a large portion of the sector’s weakness. Machinery stocks also struggled amid fears that slower economic growth would hurt the earnings of these cyclical companies. On the plus side, aerospace and defense firms gained altitude, led by Boeing and Lockheed Martin.
Standard & Poor’s authorized only three changes to the composition of the S&P 500 in the last six months, two of which stemmed from mergers. Adolph Coors, which was acquired by Canadian brewer Molson, was replaced by Molson Coors Brewing; Sears, Roebuck & Co., which merged with K-Mart, was replaced by Sears Holdings; and Power-One was supplanted by National Oilwell Varco.
TOTAL EQUITY MARKET INDEX FUND
| PERFORMANCE COMPARISON |
| | |
| Periods Ended 6/30/05 | 6 Months | 12 Months |
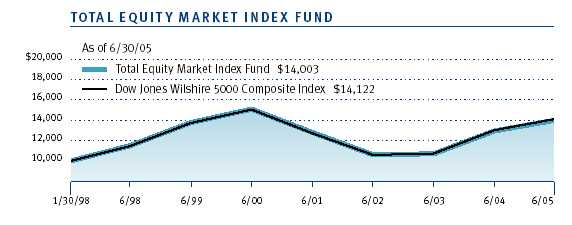
| Total Equity Market Index Fund | -0.08% | 8.11% |
| Dow Jones Wilshire 5000 | | |
| Composite Index * | 0.02 | 8.39 |
|
| * Dow Jones Wilshire 5000 returns through 6/30/05, calculated as of 7/11/05. |
Your fund returned -0.08% in the last six months and 8.11% for the 12-month period ended June 30, 2005. The fund closely tracked the performance of the Dow Jones Wilshire 5000 Composite Index in both periods, as shown in the table, but slightly lagged due to annual operating and management expenses.Because the Wilshire 5000 includes more than 4,900 publicly traded companies, it is impractical for us to buy shares of each. Instead, we use sampling strategies in an attempt to match the performance of the index. We manage the portfolio so that its characteristics—including sector allocations and price/earnings ratio—closely resemble those of the index. At the end of June, the fund owned stocks of approximately 2,000 companies.
| SECTOR DIVERSIFICATION |
| | | |
| Percent of | | | Extended |
| Equities | Equity | Total Equity | Equity |
| As of 6/30/05 | Index 500 | Market Index | Market Index |
| Consumer | | | |
| Discretionary | 11.4% | 13.4% | 18.5% |
| Consumer Staples | 10.1 | 9.1 | 4.9 |
| Energy | 8.8 | 8.3 | 6.9 |
| Financials | 20.3 | 21.3 | 24.9 |
| Health Care | 13.4 | 13.0 | 12.3 |
| Industrials and Business | | | |
| Services | 11.2 | 10.3 | 9.2 |
| Information | | | |
| Technology | 15.2 | 15.3 | 14.5 |
| Materials | 2.9 | 3.1 | 3.7 |
| Telecommunication | | | |
| Services | 3.2 | 2.8 | 2.0 |
| Utilities | 3.5 | 3.4 | 3.1 |
| | | |
| Note: The numbers in this table may not match the sector percentages in each fund’s portfolio of |
| investments, which are calculated as a percentage of net assets. |
| | | | |
In general, what was true about the performance of the Equity Index 500 Fund in the last six months was also true for this fund: energy, health care, and utilities were the sectors that contributed the most to fund performance, while the information technology, financial, consumer discretionary, and industrials and business services sectors detracted the most. The Wilshire 5000, which represents the entire U.S. stock market, includes all S&P 500 companies. In fact, the S&P 500 represents about 74% of the Wilshire 5000’s total market value. The largest components of the Wilshire index—as with the S&P 500—have the greatest influence on performance. In addition, the percentage weightings of the major sectors are similar, as shown in the Sector Diversification table above.
EXTENDED EQUITY MARKET INDEX FUND
| PERFORMANCE COMPARISON |
| | |
| Periods Ended 6/30/05 | 6 Months | 12 Months |
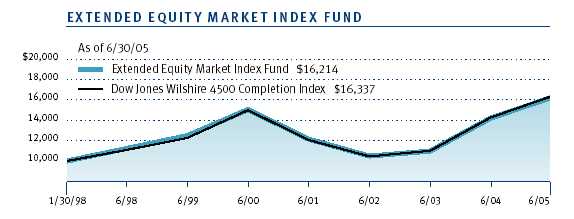
| Extended Equity Market | | |
| Index Fund | 2.11% | 14.10% |
| Dow Jones Wilshire 4500 | | |
| Completion Index * | 2.19 | 14.49 |
| | |
| * Dow Jones Wilshire 4500 returns through 6/30/05, calculated as of 7/11/05. |
Your fund returned 2.11% in the last six months and 14.10% for the 12-month period ended June 30, 2005. The fund closely tracked the performance of the Dow Jones Wilshire 4500 Completion Index in both periods, as shown in the table, but lagged slightly due to annual operating and management expenses.The index includes more than 4,400 small- and mid-cap companies, so it is impractical for us to buy shares of each. Instead, we use sampling strategies (just as we do with the Total Equity Market Index Fund) in an attempt to match the performance of the index. At the end of June, the fund held nearly 2,500 names.
The energy sector (6.9% of equities as of June 30) contributed the most to fund performance in the last six months. Most of our holdings produced gains. Premcor and Murphy Oil led the oil and gas industry, while GlobalSantaFe and Diamond Offshore Drilling were our top contributors in the energy equipment and services industry. Utilities (3.1% of equities) also advanced in the last six months. Gas and electric utilities fared best; water utilities trailed, though Aqua America performed fairly well. (Please refer to the fund’s portfolio of investments for a complete listing of the fund’s holdings and the amount each represents in the portfolio.)
Health care stocks (12.3% of equities) performed very well. Providers and services companies paced the sector’s advance, especially Coventry Health Care, Triad Hospitals, and WellChoice. Biotechnology stocks were fairly lackluster, but Genentech and Celgene were exceptions. Health care equipment and supply companies and pharmaceutical shares were mostly flat.
Consumer discretionary shares (18.5% of equities) made a small contribution to our results in the first half of the year. Specialty retailers did best, led by Chico’s and Abercrombie & Fitch, but PETsMART and Petco were disappointing. In the household durables industry, homebuilders were some of our top contributors to performance, especially Toll Brothers and D.R. Horton, but audio equipment maker Harman International Industries performed poorly. Media stocks struggled, particularly Liberty Media and DIRECTV, though Cablevision Systems and Fox Entertainment Group were two of our largest contributors.
Information technology shares (14.5% of equities) detracted the most from our results in the last six months. Most underlying industries declined, with communications equipment, electronics equipment, and semiconductor stocks among the weakest segments. Internet software and services stocks did best, primarily because of stellar performance of Google, a provider of Web search and online advertising services.
Stocks in the materials sector (3.7% of equities), which produced good returns in 2004, faltered in the first half of 2005 amid concerns that a slowing economy would dent the earnings of these cyclical companies. Chemical companies fared worst. Metals and mining stocks also stumbled, with AK Steel and Steel Dynamics among our worst performers. Construction materials companies held up best, benefiting from the robust real estate market.
Financial stocks (24.9% of equities) generally declined in the last six months. Commercial banks paced the sector’s decline. Thrifts and mortgage finance companies also detracted from our performance. On the plus side, real estate investment trusts (REITs) outperformed, as the real estate market remained hot and investors found REIT yields appealing in an environment of relatively low interest rates. Companies tied to the capital markets also outperformed other financial industries, led by Legg Mason. Online brokerage firm AmeriTrade also performed well: E*Trade initially sought to acquire the company, but AmeriTrade chose instead to purchase TD Waterhouse from Toronto-Dominion Bank.
Industrial and business services stocks (9.2% of equities) also detracted from our performance. Electrical equipment companies faltered, and airline stocks were grounded by record oil prices. Air freight and logistics companies, as well as road and rail stocks, also struggled amid high fuel costs, and machinery stocks were disabled by fears of slower economic growth. Favorable performance of aerospace and defense names helped to limit the losses in the sector, with United Defense Industries among the fund’s largest contributors to performance.
OUTLOOK
The economy is likely to continue expanding this year, despite elevated oil prices, and short-term interest rates are likely to keep rising. Fundamentals in corporate America are generally sound, but unless corporate profit growth remains vigorous, stocks could have difficulty making progress until the Fed signals that rates are at or near a neutral level that neither stimulates nor stifles economic growth.
Although macroeconomic factors are a major influence on the stock market, we are not preoccupied with discerning how individual stocks, sectors, or the market as a whole will react to the latest economic data, interest rate trends, or corporate developments. Our goal is to closely track the broad equity market indexes with the assets you have entrusted to us. Thank you for your support in this endeavor.
Respectfully submitted,

E. Frederick Bair
Chairman of the Investment Advisory Committee,
Equity Index 500 Fund and Extended Equity Market Index Fund
Co-chairman of the Investment Advisory Committee,
Total Equity Market Index Fund

Ken D. Uematsu
Co-chairman of the Investment Advisory Committee,
Total Equity Market Index Fund
July 14, 2005
The committee chairmen have day-to-day responsibility for managing the portfolios and work with committee members in developing and executing the funds’ investment programs.
PROSPECTUS UPDATE
This updates the Total Equity Market Index Fund’s prospectus dated May 1, 2005. The Portfolio Management paragraph in Section 3 of the prospectus is amended to reflect the following change:
Effective May 2005, Ken D. Uematsu became co-chairman of the Total Equity Market Index Fund’s Investment Advisory Committee. Mr. Uematsu, who joined T. Rowe Price in 1997, is an assistant vice president of T. Rowe Price Associates, Inc., a quantitative analyst in the Systematic Equity Group, and a vice president and Investment Advisory Committee member for the Equity Index 500 and Extended Equity Market Index Funds.
RISKS OF INVESTING
As with all stock mutual funds, the fund’s share price can fall because of weakness in the stock market, a particular industry, or specific holdings. Stock markets can decline for many reasons, including adverse political or economic developments, changes in investor psychology, or heavy institutional selling. The prospects for an industry or company may deteriorate because of a variety of factors, including disappointing earnings or changes in the competitive environment.
GLOSSARY
Fed funds target rate: An overnight lending rate set by the Federal Reserve and used by banks to meet reserve requirements. Banks also use the fed funds rate as a benchmark for their prime lending rates.
S&P 500 Stock Index: Tracks the stocks of 500 mostly large U.S. companies.
Dow Jones Wilshire 5000 Composite Index: Tracks the performance of the most active stocks in the broad U.S. market.
Dow Jones Wilshire 4500 Completion Index: Tracks the performance of all stocks in the Dow Jones Wilshire 5000 Composite Index, excluding those in the S&P 500 Stock Index.
| THE EVOLVING S&P 500 STOCK INDEX |
| |
| Changes in the index in 2005 | |
| Additions | Deletions |
| Sears Holdings Corp. | Sears, Roebuck & Co. |
| National Oilwell Varco | Power-One |
| Molson Coors Brewing | Adolph Coors |
| PORTFOLIO HIGHLIGHTS |
| |
| TWENTY-FIVE LARGEST HOLDINGS | |
| | Percent of |
| | Net Assets |
| | 6/30/05 |
| Equity Index 500 Fund | |
| GE | 3.2 |
| ExxonMobil | 3.2 |
| Microsoft | 2.2 |
| Citigroup | 2.1 |
| Pfizer | 1.8 |
| Johnson & Johnson | 1.7 |
| Bank of America | 1.6 |
| Intel | 1.4 |
| Wal-Mart | 1.4 |
| American International Group | 1.3 |
| Altria Group | 1.2 |
| Procter & Gamble | 1.1 |
| J.P. Morgan Chase | 1.1 |
| Cisco Systems | 1.1 |
| IBM | 1.1 |
| Chevron | 1.0 |
| Wells Fargo | 0.9 |
| Dell | 0.8 |
| Verizon Communications | 0.8 |
| Coca-Cola | 0.8 |
| PepsiCo | 0.8 |
| Home Depot | 0.7 |
| ConocoPhillips | 0.7 |
| SBC Communications | 0.7 |
| Time Warner | 0.7 |
| Total | 33.4% |
| |
| Note: Table excludes investments in the T. Rowe Price Reserve Investment Fund. | |
| Total Equity Market Index Fund | |
| ExxonMobil | 2.4% |
| GE | 2.4 |
| Microsoft | 1.8 |
| Citigroup | 1.6 |
| Pfizer | 1.4 |
| Wal-Mart | 1.3 |
| Johnson & Johnson | 1.3 |
| Bank of America | 1.2 |
| Intel | 1.1 |
| American International Group | 1.0 |
| Procter & Gamble | 0.9 |
| Altria Group | 0.9 |
| Berkshire Hathaway | 0.8 |
| Cisco Systems | 0.8 |
| J.P. Morgan Chase | 0.8 |
| IBM | 0.8 |
| Chevron | 0.8 |
| Wells Fargo | 0.7 |
| Coca-Cola | 0.7 |
| Dell | 0.6 |
| Verizon Communications | 0.6 |
| PepsiCo | 0.6 |
| Home Depot | 0.6 |
| Genentech | 0.5 |
| Google | 0.5 |
| Total | 26.1% |
| |
| Note: Table excludes investments in the T. Rowe Price Reserve Investment Fund. | |
| Extended Equity Market Index Fund | |
| Berkshire Hathaway | 3.2% |
| Genentech | 2.1 |
| Google | 2.1 |
| Kraft Foods | 1.4 |
| Liberty Media | 0.7 |
| DIRECTV | 0.5 |
| IAC/InterActiveCorp | 0.4 |
| Genworth Financial | 0.4 |
| Juniper Networks | 0.3 |
| Amazon.com | 0.3 |
| Las Vegas Sands | 0.3 |
| Liberty Global | 0.3 |
| MGM Mirage | 0.3 |
| Legg Mason | 0.3 |
| Vornado Realty Trust | 0.3 |
| UnionBancal | 0.2 |
| Murphy Oil | 0.2 |
| Enterprise Products Partners | 0.2 |
| Chicago Mercantile Exchange Holdings | 0.2 |
| Cablevision Systems | 0.2 |
| Lennar | 0.2 |
| GlobalSantaFe | 0.2 |
| Royal Caribbean Cruises | 0.2 |
| General Growth Properties | 0.2 |
| MCI | 0.2 |
| Total | 14.9% |
| |
| Note: Table excludes investments in the T. Rowe Price Reserve Investment Fund. | |
This chart shows the value of a hypothetical $10,000 investment in the fund over the past 10 fiscal year periods or since inception (for funds lacking 10-year records). The result is compared with benchmarks, which may include a broad-based market index and a peer group average or index. Market indexes do not include expenses, which are deducted from fund returns as well as mutual fund averages and indexes.
| AVERAGE ANNUAL COMPOUND TOTAL RETURN |
This table shows how the fund and its benchmark would have performed if their actual (or cumulative) returns for the periods shown had been earned at a constant rate.
| Periods Ended 6/30/05 | 1 Year | 5 Years | 10 Years |
| |
| Equity Index 500 Fund | 6.02% | -2.64% | 9.64% |
| |
| S&P 500 Stock Index | 6.32 | -2.37 | 9.94 |
| |
| Current performance may be higher or lower than the quoted past performance, which can- |
| not guarantee future results. Share price, principal value, and return will vary, and you may |
| have a gain or loss when you sell your shares. For the most recent month-end performance |
| information, please visit our Web site (troweprice.com) or contact a T. Rowe Price repre- |
| sentative at 1-800-225-5132. The fund charges a redemption fee of 0.5% on shares held |
| for three months or less. The performance information shown does not reflect the deduc- |
| tion of the redemption fee. If it did, the performance would be lower. | |
| | | |
| Average annual total return figures include changes in principal value, reinvested dividends, and capital |
| gain distributions. Returns do not reflect taxes that the shareholder may pay on fund distributions or the |
| redemption of fund shares. When assessing performance, investors should consider both short- and |
| long-term returns. | | | |
This chart shows the value of a hypothetical $10,000 investment in the fund over the past 10 fiscal year periods or since inception (for funds lacking 10-year records). The result is compared with benchmarks, which may include a broad-based market index and a peer group average or index. Market indexes do not include expenses, which are deducted from fund returns as well as mutual fund averages and indexes.
| AVERAGE ANNUAL COMPOUND TOTAL RETURN |
This table shows how the fund and its benchmark would have performed if their actual (or cumulative) returns for the periods shown had been earned at a constant rate.
| | | | Since |
| | | | Inception |
| Periods Ended 6/30/05 | 1 Year | 5 Years | 1/30/98 |
| Total Equity Market Index Fund | 8.11% | -1.47% | 4.65% |
| Dow Jones Wilshire 5000 Composite Index | 8.39 | -1.25 | 4.77 |
Dow Jones Wilshire 5000 returns through 6/30/05, calculated as of 7/11/05. | | |
| | | |
| Current performance may be higher or lower than the quoted past performance, which can- |
| not guarantee future results. Share price, principal value, and return will vary, and you may |
| have a gain or loss when you sell your shares. For the most recent month-end performance |
| information, please visit our Web site (troweprice.com) or contact a T. Rowe Price represen- |
| tative at 1-800-225-5132. The fund charges a redemption fee of 0.5% on shares held for |
| three months or less. The performance information shown does not reflect the deduction |
| of the redemption fee. If it did, the performance would be lower. | | |
| | | |
| Average annual total return figures include changes in principal value, reinvested dividends, and capital |
| gain distributions. Returns do not reflect taxes that the shareholder may pay on fund distributions or the |
| redemption of fund shares. When assessing performance, investors should consider both short- and long- |
| term returns. | | | |
This chart shows the value of a hypothetical $10,000 investment in the fund over the past 10 fiscal year periods or since inception (for funds lacking 10-year records). The result is compared with benchmarks, which may include a broad-based market index and a peer group average or index. Market indexes do not include expenses, which are deducted from fund returns as well as mutual fund averages and indexes.
| AVERAGE ANNUAL COMPOUND TOTAL RETURN |
This table shows how the fund and its benchmark would have performed if their actual (or cumulative) returns for the periods shown had been earned at a constant rate.
| | | | Since |
| | | | Inception |
| Periods Ended 6/30/05 | 1 Year | 5 Years | 1/30/98 |
| Extended Equity Market Index Fund | 14.10% | 1.52% | 6.74% |
| Dow Jones Wilshire 4500 Completion Index | 14.49 | 1.75 | 6.85 |
Dow Jones Wilshire 4500 returns through 6/30/05, calculated as of 7/11/05. | | |
Current performance may be higher or lower than the quoted past performance, which can- |
| not guarantee future results. Share price, principal value, and return will vary, and you may |
| have a gain or loss when you sell your shares. For the most recent month-end performance |
| information, please visit our Web site (troweprice.com) or contact a T. Rowe Price represen- |
| tative at 1-800-225-5132. The fund charges a redemption fee of 0.5% on shares held for |
| three months or less. The performance information shown does not reflect the deduc- |
| tion of the redemption fee. If it did, the performance would be lower. | |
Average annual total return figures include changes in principal value, reinvested dividends, and capital |
| gain distributions. Returns do not reflect taxes that the shareholder may pay on fund distributions or the |
| redemption of fund shares. When assessing performance, investors should consider both short- and long- |
| term returns. | | | |
As a mutual fund shareholder, you may incur two types of costs: (1) transaction costs such as redemption fees or sales loads and (2) ongoing costs, including management fees, distribution and service (12b-1) fees, and other fund expenses. The following example is intended to help you understand your ongoing costs (in dollars) of investing in the fund and to compare these costs with the ongoing costs of investing in other mutual funds. The example is based on an investment of $1,000 invested at the beginning of the most recent six-month period and held for the entire period.Actual Expenses
The first line of the following table (“Actual”) provides information about actual account values and actual expenses. You may use the information in this line, together with your account balance, to estimate the expenses that you paid over the period. Simply divide your account value by $1,000 (for example, an $8,600 account value divided by $1,000 = 8.6), then multiply the result by the number in the first line under the heading “Expenses Paid During Period” to estimate the expenses you paid on your account during this period.
Hypothetical Example for Comparison Purposes
The information on the second line of the table (“Hypothetical”) is based on hypothetical account values and expenses derived from the fund’s actual expense ratio and an assumed 5% per year rate of return before expenses (not the fund’s actual return). You may compare the ongoing costs of investing in the fund with other funds by contrasting this 5% hypothetical example and the 5% hypothetical examples that appear in the shareholder reports of the other funds. The hypothetical account values and expenses may not be used to estimate the actual ending account balance or expenses you paid for the period.
Note: T. Rowe Price charges an account maintenance fee that is not included in the accompanying table. The account maintenance fee is charged on a quarterly basis, usually during the last week of a calendar quarter, and applies to accounts with balances below $10,000 on the day of the assessment. The fee is charged to accounts that fall below $10,000 for any reason, including market fluctuations, redemptions, or exchanges. When an account with less than $10,000 is closed either through redemption or exchange, the fee is charged and deducted from the proceeds. The fee applies to IRA accounts but not to retirement plans directly registered with T. Rowe Price Services or accounts maintained by intermediaries through NSCC® Networking. If you are subject to the fee, keep it in mind when you are estimating the ongoing expenses of investing in the fund and when comparing the expenses of this fund with other funds.
You should also be aware that the expenses shown in the table highlight only your ongoing costs and do not reflect any transaction costs, such as redemption fees or sales loads. Therefore, the second line of the table is useful in comparing ongoing costs only and will not help you determine the relative total costs of owning different funds. To the extent a fund charges transaction costs, however, the total cost of owning that fund is higher.
| T. ROWE PRICE EQUITY INDEX 500 FUND |
| |
| | Beginning | Ending | Expenses Paid |
| | Account Value | Account Value | During Period* |
| | 1/1/05 | 6/30/05 | 1/1/05 to 6/30/05 |
| Actual | $1,000.00 | $990.50 | $1.73 |
| Hypothetical (assumes 5% | | | |
| return before expenses) | 1,000.00 | 1,023.06 | 1.76 |
| * Expenses are equal to the fund’s annualized expense ratio for the six-month period (0.35%), multiplied |
by the average account value over the period, multiplied by the number of days in the most recent fiscal�� |
| half year (181) divided by the days in the year (365) to reflect the half-year period. |
| |
| |
| T. ROWE PRICE TOTAL EQUITY MARKET INDEX FUND |
| |
| | Beginning | Ending | Expenses Paid |
| | Account Value | Account Value | During Period* |
| | 1/1/05 | 6/30/05 | 1/1/05 to 6/30/05 |
| Actual | $1,000.00 | $999.20 | $1.98 |
| Hypothetical (assumes 5% | | | |
| return before expenses) | 1,000.00 | 1,022.81 | 2.01 |
| * Expenses are equal to the fund’s annualized expense ratio for the six-month period (0.40%), multiplied |
| by the average account value over the period, multiplied by the number of days in the most recent fiscal |
| half year (181) divided by the days in the year (365) to reflect the half-year period. |
| |
| |
| T. ROWE PRICE EXTENDED EQUITY MARKET INDEX FUND |
| |
| | Beginning | Ending | Expenses Paid |
| | Account Value | Account Value | During Period* |
| | 1/1/05 | 6/30/05 | 1/1/05 to 6/30/05 |
| Actual | $1,000.00 | $1,021.10 | $2.00 |
| Hypothetical (assumes 5% | | | |
| return before expenses) | 1,000.00 | 1,022.81 | 2.01 |
| * Expenses are equal to the fund’s annualized expense ratio for the six-month period (0.40%), multiplied |
| by the average account value over the period, multiplied by the number of days in the most recent fiscal |
| half year (181) divided by the days in the year (365) to reflect the half year-period. |
Unaudited
| FINANCIAL HIGHLIGHTS | | | | For a share outstanding throughout each period |
| |
| | | 6 Months | | Year | | | | | | | | |
| | | Ended | | Ended | | | | | | | | |
| | | 6/30/05** | | 12/31/04 | | 12/31/03 | | 12/31/02 | | 12/31/01 | | 12/31/00 |
| NET ASSET VALUE | | | | | | | | | | | | |
| Beginning of period | $ | 32.56 | $ | 29.95 | $ | 23.67 | $ | 30.84 | $ | 35.50 | $ | 39.56 |
|
|
| |
| Investment activities | | | | | | | | | | | | |
| Net investment | | | | | | | | | | | | |
| income (loss) | | 0.24* | | 0.51* | | 0.37* | | 0.34* | | 0.32* | | 0.33* |
| Net realized and | | | | | | | | | | | | |
| unrealized gain (loss) | | (0.55) | | 2.61 | | 6.28 | | (7.17) | | (4.65) | | (3.98) |
|
|
| Total from | | | | | | | | | | | | |
| investment activities | | (0.31) | | 3.12 | | 6.65 | | (6.83) | | (4.33) | | (3.65) |
|
|
| |
| Distributions | | | | | | | | | | | | |
| Net investment income | | (0.22) | | (0.51) | | (0.37) | | (0.34) | | (0.33) | | (0.33) |
| Net realized gain | | – | | – | | – | | – | | – | | (0.08) |
|
|
| Total distributions | | (0.22) | | (0.51) | | (0.37) | | (0.34) | | (0.33) | | (0.41) |
|
|
| |
| NET ASSET VALUE | | | | | | | | | | | | |
| End of period | $ | 32.03 | $ | 32.56 | $ | 29.95 | $ | 23.67 | $ | 30.84 | $ | 35.50 |
|
|
| |
| Ratios/Supplemental Data | | | | | | | | | | | | |
| Total return^ | | (0.95)%* | | 10.51%* | | 28.31%* | | (22.21)%* | | (12.17)%* | | (9.30)%* |
| Ratio of total expenses to | | | | | | | | | | | | |
| average net assets | | 0.35%*† | | 0.35%* | | 0.35%* | | 0.35%* | | 0.35%* | | 0.35%* |
| Ratio of net investment | | | | | | | | | | | | |
| income (loss) to average | | | | | | | | | | | | |
| net assets | | 1.51%*† | | 1.69%*+ | | 1.44%* | | 1.27%* | | 1.00%* | | 0.85%* |
| Portfolio turnover rate | | 3.1%† | | 6.4% | | 1.2% | | 6.6% | | 4.0% | | 9.1% |
| Net assets, end of period | | | | | | | | | | | | |
| (in millions) | $ | 5,118 | $ | 4,789 | $ | 3,885 | $ | 2,708 | $ | 3,473 | $ | 4,045 |
| ^ | Total return reflects the rate that an investor would have earned on an investment in the fund during each period, |
| | assuming reinvestment of all distributions and payment of no redemption or account fees. |
| * | Excludes expenses in excess of a 0.35% contractual expense limitation in effect through 4/30/06. |
| ** Per share amounts calculated using average shares outstanding method |
| + | Includes the effect of a one-time special dividend (0.32% of average net assets) that is not expected to recur. |
| † | Annualized |
| |
| The accompanying notes are an integral part of these financial statements. |
Unaudited
| PORTFOLIO OF INVESTMENTS (1) | Shares/$ Par | Value |
| (Cost and value in $ 000s) | | |
| | | |
| COMMON STOCKS 95.7% | | |
| |
| CONSUMER DISCRETIONARY 11.0% | | |
| Auto Components 0.2% | | |
| Cooper Tire § | 32,773 | 609 |
| Dana § | 67,603 | 1,015 |
| Delphi § | 249,858 | 1,162 |
| Goodyear Tire & Rubber *§ | 80,470 | 1,199 |
| Johnson Controls | 86,194 | 4,855 |
| Visteon § | 56,750 | 342 |
| | | 9,182 |
| Automobiles 0.5% | | |
| Ford Motor § | 827,367 | 8,472 |
| GM § | 253,785 | 8,629 |
| Harley-Davidson § | 129,886 | 6,442 |
| | | 23,543 |
| Distributors 0.1% | | |
| Genuine Parts § | 78,620 | 3,230 |
| | | 3,230 |
| Diversified Consumer Services 0.2% | | |
| Apollo Group, Class A *§ | 73,744 | 5,768 |
| H&R Block § | 73,488 | 4,288 |
| | | 10,056 |
| Hotels, Restaurants & Leisure 1.5% | | |
| Carnival § | 236,293 | 12,890 |
| Darden Restaurants | 67,797 | 2,236 |
| Harrah's Entertainment | 81,171 | 5,850 |
| Hilton § | 172,146 | 4,106 |
| International Game Technology | 152,824 | 4,302 |
| Marriott, Class A | 89,372 | 6,097 |
| McDonald's | 564,179 | 15,656 |
| Starbucks * | 177,871 | 9,189 |
| Starwood Hotels & Resorts Worldwide, Equity Units | 96,607 | 5,658 |
| Wendy's | 51,085 | 2,434 |
| Yum! Brands | 129,867 | 6,763 |
| | | 75,181 |
| Household Durables 0.6% | | |
| Black & Decker | 36,364 | 3,267 |
| Centex | 56,736 | 4,010 |
| Fortune Brands | 64,644 | 5,741 |
| KB Home § | 38,868 | 2,963 |
| Leggett & Platt | 85,746 | 2,279 |
| Maytag § | 37,179 | 582 |
| Newell Rubbermaid § | 124,378 | 2,965 |
| Pulte | 54,078 | 4,556 |
| Snap-On § | 26,350 | 904 |
| Stanley Works § | 34,987 | 1,593 |
| Whirlpool § | 30,553 | 2,142 |
| | | 31,002 |
| Internet & Catalog Retail 0.3% | | |
| eBay * | 546,104 | 18,027 |
| | | 18,027 |
| Leisure Equipment & Products 0.2% | | |
| Brunswick | 42,817 | 1,855 |
| Eastman Kodak § | 127,872 | 3,433 |
| Hasbro § | 75,949 | 1,579 |
| Mattel | 184,459 | 3,376 |
| | | 10,243 |
| Media 3.5% | | |
| Clear Channel Communications | 235,402 | 7,281 |
| Comcast, Class A * | 984,382 | 30,220 |
| Disney § | 916,363 | 23,074 |
| Dow Jones § | 37,813 | 1,340 |
| Gannett | 112,452 | 7,999 |
| Interpublic Group * | 188,155 | 2,292 |
| Knight-Ridder § | 33,875 | 2,078 |
| McGraw-Hill | 168,600 | 7,461 |
| Meredith | 21,014 | 1,031 |
| New York Times, Class A | 64,368 | 2,005 |
| News Corp., Class A | 1,289,600 | 20,866 |
| Omnicom § | 82,937 | 6,623 |
| Time Warner * | 2,106,274 | 35,196 |
| Tribune § | 134,227 | 4,722 |
| Univision Communications, Class A *§ | 137,343 | 3,784 |
| Viacom, Class B | 722,731 | 23,142 |
| | | 179,114 |
| Multiline Retail 1.3% | | |
| Big Lots *§ | 49,120 | 650 |
| Dillards, Class A § | 36,167 | 847 |
| Dollar General § | 141,033 | 2,871 |
| Family Dollar Stores | 76,157 | 1,988 |
| Federated Department Stores § | 76,373 | 5,597 |
| J.C. Penney | 119,871 | 6,303 |
| Kohl's * | 147,300 | 8,236 |
| May Department Stores | 134,631 | 5,407 |
| Nordstrom | 57,414 | 3,902 |
| Sears Holding * | 45,700 | 6,849 |
| Target | 397,141 | 21,608 |
| | | 64,258 |
| Specialty Retail 2.2% | | |
| Autonation *§ | 99,800 | 2,048 |
| AutoZone *§ | 30,195 | 2,792 |
| Bed Bath & Beyond * | 133,557 | 5,580 |
| Best Buy | 132,423 | 9,078 |
| Circuit City | 87,587 | 1,514 |
| GAP § | 345,919 | 6,832 |
| Home Depot | 961,623 | 37,407 |
| Lowes | 346,801 | 20,191 |
| Office Depot *§ | 142,007 | 3,244 |
| OfficeMax § | 31,608 | 941 |
| RadioShack § | 70,277 | 1,628 |
| Sherwin-Williams | 60,649 | 2,856 |
| Staples | 330,543 | 7,047 |
| The Limited | 172,791 | 3,701 |
| Tiffany | 63,709 | 2,087 |
| TJX § | 211,789 | 5,157 |
| Toys "R" Us * | 100,278 | 2,655 |
| | | 114,758 |
| Textiles, Apparel, & Luxury Goods 0.4% | | |
| Coach * | 169,500 | 5,690 |
| Jones Apparel Group § | 54,912 | 1,705 |
| Liz Claiborne | 49,227 | 1,957 |
| Nike, Class B § | 102,435 | 8,871 |
| Reebok § | 25,430 | 1,064 |
| V. F. § | 46,647 | 2,669 |
| | | 21,956 |
| Total Consumer Discretionary | | 560,550 |
| |
| CONSUMER STAPLES 9.7% | | |
| Beverages 2.2% | | |
| Anheuser-Busch | 348,275 | 15,934 |
| Brown-Forman, Class B | 40,422 | 2,444 |
| Coca-Cola | 1,017,491 | 42,480 |
| Coca-Cola Enterprises | 159,965 | 3,521 |
| Constellation Brands, Class A * | 50,000 | 1,490 |
| Molson Coors Brewing, Class B § | 35,859 | 2,223 |
| Pepsi Bottling Group § | 88,261 | 2,525 |
| PepsiCo | 751,677 | 40,538 |
| | | 111,155 |
| Food & Staples Retailing 2.7% | | |
| Albertsons § | 165,625 | 3,425 |
| Costco Wholesale | 213,568 | 9,572 |
| CVS | 364,902 | 10,608 |
| Kroger * | 327,887 | 6,240 |
| Safeway § | 200,644 | 4,533 |
| Supervalu § | 62,073 | 2,024 |
| Sysco § | 285,292 | 10,325 |
| Wal-Mart | 1,495,859 | 72,100 |
| Walgreen | 454,669 | 20,910 |
| | | 139,737 |
| Food Products 1.1% | | |
| Archer-Daniels-Midland | 278,935 | 5,964 |
| Campbell Soup §�� | 146,318 | 4,502 |
| ConAgra | 232,134 | 5,376 |
| General Mills § | 165,794 | 7,757 |
| Heinz | 158,098 | 5,600 |
| Hershey Foods | 97,254 | 6,039 |
| Kellogg | 157,399 | 6,995 |
| McCormick § | 61,400 | 2,007 |
| Sara Lee | 354,150 | 7,016 |
| Wrigley | 88,204 | 6,072 |
| | | 57,328 |
| Household Products 1.7% | | |
| Clorox | 69,023 | 3,846 |
| Colgate-Palmolive | 233,705 | 11,664 |
| Kimberly-Clark | 215,300 | 13,476 |
| Procter & Gamble | 1,112,440 | 58,681 |
| | | 87,667 |
| Personal Products 0.7% | | |
| Alberto Culver, Class B | 38,841 | 1,683 |
| Avon | 211,706 | 8,013 |
| Gillette | 449,104 | 22,738 |
| | | 32,434 |
| Tobacco 1.3% | | |
| Altria Group | 930,971 | 60,196 |
| Reynolds American § | 52,400 | 4,129 |
| UST § | 73,843 | 3,372 |
| | | 67,697 |
| Total Consumer Staples | | 496,018 |
| |
| ENERGY 8.4% | | |
| Energy Equipment & Services 1.2% | | |
| Baker Hughes § | 151,598 | 7,756 |
| BJ Services | 73,367 | 3,850 |
| Halliburton | 226,444 | 10,829 |
| Nabors Industries * | 66,376 | 4,024 |
| National Oilwell Varco *§ | 77,027 | 3,662 |
| Noble Drilling § | 60,800 | 3,740 |
| Rowan | 49,160 | 1,460 |
| Schlumberger § | 264,456 | 20,083 |
| Transocean * | 145,843 | 7,871 |
| | | 63,275 |
| Oil, Gas & Consumable Fuels 7.2% | | |
| Amerada Hess § | 38,905 | 4,144 |
| Anadarko Petroleum § | 105,644 | 8,679 |
| Apache | 147,076 | 9,501 |
| Ashland | 30,086 | 2,162 |
| Burlington Resources | 173,782 | 9,600 |
| Chevron | 943,236 | 52,746 |
| ConocoPhillips | 625,104 | 35,937 |
| Devon Energy | 213,202 | 10,805 |
| El Paso Corporation § | 292,825 | 3,373 |
| EOG Resources § | 106,952 | 6,075 |
| ExxonMobil | 2,861,607 | 164,457 |
| Kerr-McGee § | 52,905 | 4,037 |
| Kinder Morgan | 48,562 | 4,040 |
| Marathon Oil | 156,398 | 8,347 |
| Occidental Petroleum § | 178,672 | 13,745 |
| Sunoco § | 31,318 | 3,560 |
| Unocal | 121,636 | 7,912 |
| Valero Energy | 115,400 | 9,129 |
| Williams Companies | 255,298 | 4,851 |
| XTO Energy § | 161,333 | 5,484 |
| | | 368,584 |
| Total Energy | | 431,859 |
| |
| FINANCIALS 19.4% | | |
| Capital Markets 2.6% | | |
| Bank of New York | 350,298 | 10,082 |
| Bear Stearns § | 50,252 | 5,223 |
| Charles Schwab § | 511,146 | 5,766 |
| E*TRADE Financial * | 162,100 | 2,268 |
| Federated Investors, Class B § | 47,000 | 1,411 |
| Franklin Resources § | 89,132 | 6,861 |
| Goldman Sachs | 199,225 | 20,325 |
| Janus Capital Group § | 104,597 | 1,573 |
| Lehman Brothers | 124,661 | 12,376 |
| Mellon Financial | 189,837 | 5,446 |
| Merrill Lynch | 424,965 | 23,377 |
| Morgan Stanley | 493,291 | 25,883 |
| Northern Trust | 92,683 | 4,225 |
| State Street | 148,186 | 7,150 |
| T. Rowe Price Group † | 55,713 | 3,488 |
| | | 135,454 |
| Commercial Banks 5.6% | | |
| AmSouth § | 158,617 | 4,124 |
| Bank of America | 1,807,812 | 82,454 |
| BB&T § | 245,236 | 9,802 |
| Comerica | 75,556 | 4,367 |
| Compass Bancshares | 55,500 | 2,498 |
| Fifth Third Bancorp § | 233,746 | 9,633 |
| First Horizon National § | 54,911 | 2,317 |
| Huntington Bancshares § | 105,208 | 2,540 |
| KeyCorp | 181,555 | 6,019 |
| M & T Bank | 44,200 | 4,648 |
| Marshall & Ilsley | 95,802 | 4,258 |
| National City | 266,568 | 9,095 |
| North Fork Bancorporation | 214,645 | 6,029 |
| PNC Financial Services Group | 127,619 | 6,950 |
| Regions Financial § | 208,376 | 7,060 |
| SunTrust | 152,886 | 11,045 |
| Synovus Financial § | 140,745 | 4,035 |
| U.S. Bancorp | 826,822 | 24,143 |
| Wachovia | 708,102 | 35,122 |
| Wells Fargo | 758,557 | 46,712 |
| Zions Bancorp § | 40,765 | 2,997 |
| | | 285,848 |
| Consumer Finance 1.2% | | |
| American Express § | 526,837 | 28,044 |
| Capital One Financial § | 112,709 | 9,018 |
| MBNA | 567,222 | 14,839 |
| Providian Financial *§ | 130,581 | 2,302 |
| SLM Corporation | 191,465 | 9,726 |
| | | 63,929 |
| Diversified Financial Services 3.5% | | |
| CIT Group | 95,400 | 4,099 |
| Citigroup | 2,338,463 | 108,107 |
| J.P. Morgan Chase | 1,580,491 | 55,823 |
| Moody's | 125,212 | 5,630 |
| Principal Financial Group § | 133,971 | 5,613 |
| | | 179,272 |
| Insurance 4.2% | | |
| ACE Limited | 129,009 | 5,786 |
| AFLAC | 225,073 | 9,741 |
| Allstate | 301,212 | 17,997 |
| Ambac | 49,204 | 3,433 |
| American International Group | 1,160,871 | 67,447 |
| Aon § | 140,778 | 3,525 |
| Chubb § | 87,380 | 7,481 |
| Cincinnati Financial | 75,240 | 2,977 |
| Hartford Financial Services | 131,564 | 9,838 |
| Jefferson Pilot | 60,877 | 3,069 |
| Lincoln National | 77,259 | 3,625 |
| Loews | 71,827 | 5,567 |
| Marsh & McLennan § | 239,509 | 6,634 |
| MBIA § | 62,664 | 3,717 |
| MetLife § | 329,044 | 14,787 |
| Progressive Corporation § | 89,343 | 8,828 |
| Prudential § | 234,130 | 15,373 |
| SAFECO | 57,179 | 3,107 |
| St. Paul Companies § | 302,581 | 11,961 |
| Torchmark § | 48,441 | 2,529 |
| UnumProvident § | 132,314 | 2,424 |
| XL Capital | 62,890 | 4,680 |
| | | 214,526 |
| Real Estate 0.6% | | |
| Apartment Investment & Management, Class A, REIT | 43,100 | 1,764 |
| Archstone-Smith Trust, REIT | 88,700 | 3,425 |
| Equity Office Properties, REIT | 182,933 | 6,055 |
| Equity Residential, REIT | 128,185 | 4,720 |
| Plum Creek Timber, REIT § | 81,704 | 2,966 |
| ProLogis, REIT | 82,000 | 3,300 |
| Simon Property Group, REIT | 98,537 | 7,143 |
| | | 29,373 |
| Thrifts & Mortgage Finance 1.7% | | |
| Countrywide Credit | 264,834 | 10,225 |
| Fannie Mae | 434,147 | 25,354 |
| Freddie Mac | 309,993 | 20,221 |
| Golden West Financial § | 127,310 | 8,196 |
| MGIC Investment § | 43,494 | 2,837 |
| Sovereign Bancorp § | 166,300 | 3,715 |
| Washington Mutual | 395,205 | 16,081 |
| | | 86,629 |
| Total Financials | | 995,031 |
| |
| HEALTH CARE 12.8% | | |
| Biotechnology 1.2% | | |
| Amgen * | 555,856 | 33,607 |
| Applera | 86,865 | 1,708 |
| Biogen Idec * | 154,127 | 5,310 |
| Chiron *§ | 66,058 | 2,305 |
| Genzyme *§ | 112,795 | 6,778 |
| Gilead Sciences * | 203,800 | 8,965 |
| MedImmune *§ | 112,347 | 3,002 |
| | | 61,675 |
| Health Care Equipment & Supplies 2.1% | | |
| Bausch & Lomb § | 23,748 | 1,971 |
| Baxter International | 278,099 | 10,317 |
| Becton, Dickinson | 113,701 | 5,966 |
| Biomet § | 113,837 | 3,943 |
| Boston Scientific * | 339,630 | 9,170 |
| C R Bard | 47,776 | 3,178 |
| Fisher Scientific * | 54,200 | 3,518 |
| Guidant | 145,624 | 9,800 |
| Hospira *§ | 71,144 | 2,775 |
| Medtronic | 542,648 | 28,104 |
| Millipore *§ | 22,423 | 1,272 |
| PerkinElmer | 59,776 | 1,130 |
| St. Jude Medical * | 162,692 | 7,095 |
| Stryker § | 167,474 | 7,965 |
| Thermo Electron * | 73,372 | 1,971 |
| Waters Corporation * | 53,099 | 1,974 |
| Zimmer Holdings *§ | 110,934 | 8,450 |
| | | 108,599 |
| Health Care Providers & Services 2.7% | | |
| Aetna | 131,620 | 10,901 |
| AmerisourceBergen § | 47,085 | 3,256 |
| Cardinal Health § | 192,137 | 11,063 |
| Caremark RX * | 203,500 | 9,060 |
| CIGNA | 58,900 | 6,304 |
| Express Scripts *§ | 68,000 | 3,398 |
| HCA | 188,789 | 10,699 |
| Health Management, Class A § | 108,093 | 2,830 |
| Humana * | 72,088 | 2,865 |
| IMS Health | 103,865 | 2,573 |
| Laboratory Corporation of America *§ | 59,800 | 2,984 |
| Manor Care | 38,971 | 1,548 |
| McKesson | 133,514 | 5,980 |
| Medco * | 124,425 | 6,639 |
| Quest Diagnostics § | 82,200 | 4,379 |
| Tenet Healthcare * | 212,428 | 2,600 |
| UnitedHealth Group | 568,688 | 29,651 |
| WellPoint * | 275,614 | 19,194 |
| | | 135,924 |
| Pharmaceuticals 6.8% | | |
| Abbott Laboratories | 697,147 | 34,167 |
| Allergan | 59,088 | 5,037 |
| Bristol Myers Squibb | 878,570 | 21,947 |
| Eli Lilly | 508,702 | 28,340 |
| Forest Laboratories * | 156,936 | 6,097 |
| Johnson & Johnson | 1,336,764 | 86,890 |
| King Pharmaceuticals *§ | 110,574 | 1,152 |
| Merck | 990,740 | 30,515 |
| Mylan Laboratories § | 121,700 | 2,341 |
| Pfizer | 3,342,375 | 92,183 |
| Schering-Plough | 660,804 | 12,595 |
| Watson Pharmaceuticals *§ | 48,430 | 1,431 |
| Wyeth § | 602,169 | 26,796 |
| | | 349,491 |
| Total Health Care | | 655,689 |
| |
| INDUSTRIALS & BUSINESS SERVICES 10.7% | | |
| Aerospace & Defense 2.2% | | |
| Boeing | 371,382 | 24,511 |
| General Dynamics | 90,157 | 9,876 |
| Goodrich § | 53,439 | 2,189 |
| Honeywell International | 383,557 | 14,050 |
| L-3 Communication § | 53,200 | 4,074 |
| Lockheed Martin | 181,796 | 11,793 |
| Northrop Grumman | 160,794 | 8,884 |
| Raytheon | 202,099 | 7,906 |
| Rockwell Collins | 80,351 | 3,831 |
| United Technologies | 459,748 | 23,608 |
| | | 110,722 |
| Air Freight & Logistics 0.9% | | |
| Fedex | 135,512 | 10,978 |
| Ryder System | 28,518 | 1,044 |
| UPS, Class B | 499,279 | 34,530 |
| | | 46,552 |
| Airlines 0.1% | | |
| Delta *§ | 57,423 | 216 |
| Southwest Airlines | 333,134 | 4,640 |
| | | 4,856 |
| Building Products 0.2% | | |
| American Standard | 79,660 | 3,339 |
| Masco | 197,255 | 6,265 |
| | | 9,604 |
| Commercial Services & Supplies 0.7% | | |
| Allied Waste Industries *§ | 130,971 | 1,039 |
| Avery Dennison § | 47,270 | 2,503 |
| Cendant § | 473,334 | 10,589 |
| Cintas § | 66,302 | 2,559 |
| Equifax | 60,095 | 2,146 |
| PHH * | 21,986 | 566 |
| Pitney Bowes | 103,303 | 4,499 |
| R.R. Donnelley | 93,571 | 3,229 |
| Robert Half International | 72,861 | 1,819 |
| Waste Management | 254,800 | 7,221 |
| | | 36,170 |
| Construction & Engineering 0.1% | | |
| Fluor § | 38,610 | 2,223 |
| | | 2,223 |
| Electrical Equipment 0.4% | | |
| American Power Conversion § | 81,366 | 1,920 |
| Cooper Industries, Class A | 41,853 | 2,674 |
| Emerson Electric | 187,944 | 11,771 |
| Power-One * | 37,900 | 239 |
| Rockwell Automation § | 77,887 | 3,794 |
| | | 20,398 |
| Industrial Conglomerates 4.3% | | |
| 3M | 345,890 | 25,008 |
| GE | 4,767,699 | 165,201 |
| Textron | 60,002 | 4,551 |
| Tyco International | 902,973 | 26,367 |
| | | 221,127 |
| Machinery 1.3% | | |
| Caterpillar § | 153,886 | 14,667 |
| Cummins Engine § | 20,061 | 1,497 |
| Danaher | 123,702 | 6,474 |
| Deere | 110,599 | 7,243 |
| Dover | 91,030 | 3,312 |
| Eaton | 67,778 | 4,060 |
| Illinois Tool Works | 121,988 | 9,720 |
| Ingersoll-Rand, Class A | 77,472 | 5,527 |
| ITT Industries § | 41,176 | 4,020 |
| Navistar * | 29,270 | 937 |
| PACCAR | 77,761 | 5,288 |
| Pall § | 56,793 | 1,724 |
| Parker Hannifin § | 53,492 | 3,317 |
| | | 67,786 |
| Road & Rail 0.5% | | |
| Burlington Northern Santa Fe § | 169,048 | 7,959 |
| CSX § | 97,134 | 4,143 |
| Norfolk Southern | 181,005 | 5,604 |
| Union Pacific § | 117,779 | 7,632 |
| | | 25,338 |
| Trading Companies & Distributors 0.0% | | |
| W. W. Grainger | 38,562 | 2,113 |
| | | 2,113 |
| Total Industrials & Business Services | | 546,889 |
| |
| INFORMATION TECHNOLOGY 14.5% | | |
| Communications Equipment 2.5% | | |
| ADC Telecommunications *§ | 51,989 | 1,132 |
| Andrew *§ | 73,900 | 943 |
| Avaya *§ | 216,633 | 1,802 |
| CIENA *§ | 245,495 | 513 |
| Cisco Systems * | 2,872,774 | 54,899 |
| Comverse Technology *§ | 89,092 | 2,107 |
| Corning * | 652,637 | 10,847 |
| JDS Uniphase *§ | 648,511 | 986 |
| Lucent Technologies *§ | 1,991,565 | 5,795 |
| Motorola | 1,102,366 | 20,129 |
| QUALCOMM § | 735,792 | 24,288 |
| Scientific-Atlanta | 67,824 | 2,257 |
| Tellabs * | 199,622 | 1,737 |
| | | 127,435 |
| Computers & Peripherals 3.4% | | |
| Apple Computer *§ | 370,744 | 13,647 |
| Dell * | 1,088,648 | 43,012 |
| EMC * | 1,082,256 | 14,838 |
| Gateway *§ | 157,122 | 519 |
| Hewlett-Packard | 1,297,406 | 30,502 |
| IBM | 725,276 | 53,815 |
| Lexmark International *§ | 56,667 | 3,674 |
| NCR * | 83,076 | 2,918 |
| Network Appliance * | 163,715 | 4,628 |
| QLogic *§ | 40,561 | 1,252 |
| Sun Microsystems * | 1,525,026 | 5,688 |
| | | 174,493 |
| Electronic Equipment & Instruments 0.3% | | |
| Agilent Technologies * | 194,064 | 4,467 |
| Jabil Circuit * | 84,954 | 2,611 |
| Molex | 79,832 | 2,079 |
| Sanmina-SCI *§ | 230,897 | 1,263 |
| Solectron * | 436,814 | 1,655 |
| Symbol Technologies § | 107,049 | 1,057 |
| Tektronix | 39,939 | 929 |
| | | 14,061 |
| Internet Software & Services 0.4% | | |
| Monster Worldwide * | 53,307 | 1,529 |
| Yahoo! * | 589,096 | 20,412 |
| | | 21,941 |
| IT Services 1.0% | | |
| Affiliated Computer Services, Class A *§ | 55,800 | 2,851 |
| Automatic Data Processing § | 261,680 | 10,983 |
| Computer Sciences *§ | 84,645 | 3,699 |
| Convergys * | 62,364 | 887 |
| Electronic Data Systems § | 230,612 | 4,439 |
| First Data | 352,877 | 14,165 |
| Fiserv * | 86,023 | 3,695 |
| Paychex | 161,071 | 5,241 |
| Sabre Holdings, Class A § | 60,414 | 1,205 |
| SunGard Data Systems * | 131,126 | 4,612 |
| Unisys * | 153,584 | 972 |
| | | 52,749 |
| Office Electronics 0.1% | | |
| Xerox * | 431,074 | 5,945 |
| | | 5,945 |
| Semiconductor & Semiconductor Equipment 3.1% | | |
| Advanced Micro Devices *§ | 175,265 | 3,039 |
| Altera * | 165,946 | 3,289 |
| Analog Devices | 166,294 | 6,204 |
| Applied Materials | 742,359 | 12,011 |
| Applied Micro Circuits * | 135,978 | 348 |
| Broadcom, Class A *§ | 130,705 | 4,641 |
| Freescale Semiconductor, Class B * | 182,088 | 3,857 |
| Intel | 2,774,816 | 72,312 |
| KLA-Tencor § | 88,439 | 3,865 |
| Linear Technology § | 137,170 | 5,033 |
| LSI Logic *§ | 175,965 | 1,494 |
| Maxim Integrated Products | 147,445 | 5,634 |
| Micron Technology *§ | 274,923 | 2,807 |
| National Semiconductor § | 158,694 | 3,496 |
| Novellus Systems * | 61,391 | 1,517 |
| NVIDIA *§ | 75,779 | 2,025 |
| PMC-Sierra * | 84,710 | 790 |
| Teradyne *§ | 89,606 | 1,073 |
| Texas Instruments | 745,958 | 20,939 |
| Xilinx | 156,249 | 3,984 |
| | | 158,358 |
| Software 3.7% | | |
| Adobe Systems | 221,028 | 6,326 |
| Autodesk | 101,938 | 3,504 |
| BMC Software *§ | 99,714 | 1,790 |
| Citrix Systems *§ | 76,030 | 1,647 |
| Computer Associates § | 239,307 | 6,576 |
| Compuware * | 171,987 | 1,236 |
| Electronic Arts * | 137,778 | 7,800 |
| Intuit *§ | 83,188 | 3,753 |
| Mercury Interactive *§ | 38,026 | 1,459 |
| Microsoft | 4,516,694 | 112,195 |
| Novell *§ | 172,789 | 1,071 |
| Oracle * | 1,991,787 | 26,291 |
| Parametric Technology * | 120,004 | 766 |
| Siebel Systems § | 227,915 | 2,028 |
| Symantec *§ | 318,700 | 6,928 |
| VERITAS Software * | 191,771 | 4,679 |
| | | 188,049 |
| Total Information Technology | | 743,031 |
| |
| MATERIALS 2.8% | | |
| Chemicals 1.5% | | |
| Air Products and Chemicals | 103,163 | 6,221 |
| Dow Chemical | 431,624 | 19,220 |
| DuPont | 445,932 | 19,180 |
| Eastman Chemical | 36,117 | 1,992 |
| Ecolab § | 97,834 | 3,166 |
| Engelhard | 55,059 | 1,572 |
| Great Lakes Chemical | 23,692 | 746 |
| Hercules *§ | 49,886 | 706 |
| International Flavors & Fragrances | 39,330 | 1,424 |
| Monsanto | 120,214 | 7,558 |
| PPG Industries | 77,328 | 4,853 |
| Praxair | 145,780 | 6,793 |
| Rohm & Haas | 85,925 | 3,982 |
| Sigma Aldrich § | 30,912 | 1,732 |
| | | 79,145 |
| Construction Materials 0.1% | | |
| Vulcan Materials § | 45,267 | 2,942 |
| | | 2,942 |
| Containers & Packaging 0.2% | | |
| Ball | 49,932 | 1,795 |
| Bemis § | 47,698 | 1,266 |
| Pactiv *§ | 68,204 | 1,472 |
| Sealed Air *§ | 37,673 | 1,876 |
| Temple-Inland | 55,688 | 2,069 |
| | | 8,478 |
| Metals & Mining 0.6% | | |
| Alcoa | 392,198 | 10,248 |
| Allegheny Technologies | 41,376 | 913 |
| Freeport McMoRan Copper Gold, Class B § | 80,460 | 3,012 |
| Newmont Mining § | 200,176 | 7,813 |
| Nucor § | 70,734 | 3,227 |
| Phelps Dodge § | 43,508 | 4,025 |
| USX-U.S. Steel Group § | 51,451 | 1,768 |
| | | 31,006 |
| Paper & Forest Products 0.4% | | |
| Georgia-Pacific § | 116,427 | 3,702 |
| International Paper | 220,509 | 6,662 |
| Louisiana Pacific | 49,218 | 1,210 |
| MeadWestvaco § | 90,813 | 2,546 |
| Neenah Paper § | 6,127 | 190 |
| Weyerhaeuser § | 108,018 | 6,875 |
| | | 21,185 |
| Total Materials | | 142,756 |
| |
| TELECOMMUNICATION SERVICES 3.1% | | |
| Diversified Telecommunication Services 2.8% | | |
| Alltel § | 146,489 | 9,123 |
| AT&T | 360,497 | 6,864 |
| BellSouth | 818,687 | 21,752 |
| Centurytel § | 59,528 | 2,061 |
| Citizens Communications § | 152,170 | 2,045 |
| Qwest Communications International *§ | 769,716 | 2,856 |
| SBC Communications § | 1,484,847 | 35,265 |
| Sprint | 664,551 | 16,674 |
| Verizon Communications | 1,240,426 | 42,857 |
| | | 139,497 |
| Wireless Telecommunication Services 0.3% | | |
| Nextel Communications, Class A * | 506,020 | 16,350 |
| | | 16,350 |
| Total Telecommunication Services | | 155,847 |
| |
| UTILITIES 3.3% | | |
| Electric Utilities 2.1% | | |
| Allegheny Energy *§ | 72,215 | 1,821 |
| Ameren § | 90,909 | 5,027 |
| American Electric Power § | 171,333 | 6,317 |
| CenterPoint Energy § | 132,546 | 1,751 |
| Cinergy | 88,626 | 3,972 |
| Consolidated Edison § | 108,753 | 5,094 |
| DTE Energy § | 77,623 | 3,630 |
| Edison International | 145,553 | 5,902 |
| Entergy | 95,354 | 7,204 |
| Exelon § | 301,136 | 15,457 |
| FirstEnergy § | 148,693 | 7,154 |
| FPL Group | 176,930 | 7,442 |
| PG&E § | 165,517 | 6,214 |
| Pinnacle West Capital § | 44,797 | 1,991 |
| PPL | 85,176 | 5,058 |
| Progress Energy | 112,442 | 5,087 |
| Southern Company § | 334,203 | 11,587 |
| Teco Energy § | 94,304 | 1,783 |
| XCEL Energy § | 179,177 | 3,498 |
| | | 105,989 |
| Gas Utilities 0.1% | | |
| KeySpan | 78,649 | 3,201 |
| NICOR § | 19,026 | 783 |
| NiSource § | 121,265 | 2,999 |
| Peoples Energy § | 16,526 | 718 |
| | | 7,701 |
| Independent Power Producers & Energy Traders 0.6% | | |
| AES * | 295,233 | 4,836 |
| Calpine *§ | 238,429 | 811 |
| Constellation Energy Group | 79,988 | 4,614 |
| Duke Energy § | 418,960 | 12,456 |
| Dynegy, Class A *§ | 166,185 | 808 |
| TXU | 107,873 | 8,963 |
| | | 32,488 |
| Multi-Utilities 0.5% | | |
| CMS Energy *§ | 99,620 | 1,500 |
| Dominion Resources § | 152,837 | 11,217 |
| Public Service Enterprise | 107,449 | 6,535 |
| Sempra Energy | 107,095 | 4,424 |
| | | 23,676 |
| Total Utilities | | 169,854 |
| Total Common Stocks (Cost $4,002,877) | | 4,897,524 |
| |
| SHORT-TERM INVESTMENTS 4.2% | | |
| | | |
| Money Market Fund 3.9% | | |
| T. Rowe Price Reserve Investment Fund, 3.14% #† | 199,612,086 | 199,612 |
| | | 199,612 |
| U.S. Treasury Obligations 0.3% | | |
| U.S. Treasury Bills, 2.602%, 7/7/05 §++ | 15,000,000 | 14,993 |
| | | 14,993 |
| Total Short-Term Investments (Cost $214,605) | | 214,605 |
| |
| SECURITIES LENDING COLLATERAL 7.8% | | |
| | | |
| Money Market Trust 7.8% | | |
| State Street Bank and Trust Company of New Hampshire N.A. | | |
| Securities Lending Quality Trust units, 3.194% # | 400,464,886 | 400,465 |
| Total Securities Lending Collateral (Cost $400,465) | | 400,465 |
| |
| FUTURES CONTRACTS 0.0% | | |
| | | |
| Variation margin receivable (payable) on open futures contracts (2) | | (1,306) |
| Total Futures Contracts | | (1,306) |
| | | |
| Total Investments in Securities | | |
| 107.7% of Net Assets (Cost $4,617,947) | $ | 5,511,288 |
| (1) | Denominated in U.S. dollars unless other- |
| | wise noted |
| # | Seven-day yield |
| * | Non-income producing |
| § | All or a portion of this security is on loan at |
| | June 30, 2005 – See Note 2 |
| ++ | All or a portion of this security is pledged to |
| | cover margin requirements on futures con- |
| | tracts at June 30, 2005 |
| † | Affiliated company – See Note 4 |
| REIT | Real Estate Investment Trust |
| (2) Open Futures Contracts at June 30, 2005 were as follows: | | | |
| ($ 000s) | | | | | |
| | | | Contract | | Unrealized |
| | Expiration | | Value | | Gain (Loss) |
| Long, 125 S&P 500 contracts, | | | | | |
| $2,100 par of 2.602% U.S. Treasury Bills | | | | | |
| pledged as initial margin | 9/05 | $ | 37,359 | $ | (261) |
| Long, 2,946 S&P Mini 500 contracts, | | | | | |
| $9,900 par of 2.602% U.S. Treasury Bills | | | | | |
| pledged as initial margin | 9/05 | | 176,097 | | (1,374) |
| Net payments (receipts) of variation | | | | | |
| margin to date | | | | | 329 |
| Variation margin receivable (payable) | | | | | |
| on open futures contracts | | | | $ | (1,306) |
The accompanying notes are an integral part of these financial statements.
Unaudited
| STATEMENT OF ASSETS AND LIABILITIES | | |
| (In thousands except shares and per share amounts) | | |
| Assets | | |
| Investments in securities, at value | | |
| Affiliated companies (cost $201,693) | $ | 203,100 |
| Non-affiliated companies (cost $4,416,254) | | 5,308,188 |
|
|
| Total investments in securities | | 5,511,288 |
| Dividends and interest receivable | | 6,366 |
| Receivable for shares sold | | 28,546 |
| Other assets | | 92 |
|
|
| Total assets | | 5,546,292 |
|
|
| |
| Liabilities | | |
| Investment management fees payable | | 418 |
| Payable for investment securities purchased | | 16,201 |
| Payable for shares redeemed | | 9,072 |
| Obligation to return securities lending collateral | | 400,465 |
| Due to affiliates | | 945 |
| Other liabilities | | 762 |
|
|
| Total liabilities | | 427,863 |
|
|
| |
| NET ASSETS | $ | 5,118,429 |
|
|
| Net Assets Consist of: | | |
| Undistributed net investment income (loss) | $ | 2,295 |
| Undistributed net realized gain (loss) | | (184,261) |
| Net unrealized gain (loss) | | 893,012 |
| Paid-in-capital applicable to 159,787,864 shares of | | |
| $0.01 par value capital stock outstanding; | | |
| 1,000,000,000 shares of the Corporation authorized | | 4,407,383 |
|
|
| |
| NET ASSETS | $ | 5,118,429 |
|
|
| |
| NET ASSET VALUE PER SHARE | $ | 32.03 |
|
|
The accompanying notes are an integral part of these financial statements.
Unaudited
| STATEMENT OF OPERATIONS | | |
| ($ 000s) | | |
| | | 6 Months |
| | | Ended |
| | | 6/30/05 |
| Investment Income (Loss) | | |
| Income | | |
| Dividend | $ | 44,928 |
| Interest | | 173 |
| Securities lending | | 151 |
|
|
| Total income | | 45,252 |
|
|
| Expenses | | |
| Shareholder servicing | | 5,866 |
| Investment management | | 3,658 |
| Prospectus and shareholder reports | | 189 |
| Custody and accounting | | 186 |
| Registration | | 70 |
| Proxy and annual meeting | | 32 |
| Legal and audit | | 11 |
| Trustees | | 8 |
| Miscellaneous | | 186 |
| Reductions/repayments of fees and expenses | | |
| Investment management fees (waived) repaid | | (1,669) |
|
|
| Total expenses | | 8,537 |
| Expenses paid indirectly | | (4) |
|
|
| Net expenses | | 8,533 |
|
|
| Net investment income (loss) | | 36,719 |
|
|
| |
| Realized and Unrealized Gain (Loss) | | |
| Net realized gain (loss) | | |
| Securities | | (18,115) |
| Futures | | 990 |
|
|
| Net realized gain (loss) | | (17,125) |
|
|
| Change in net unrealized gain (loss) | | |
| Securities | | (57,685) |
| Futures | | (4,650) |
|
|
| Change in net unrealized gain (loss) | | (62,335) |
|
|
| Net realized and unrealized gain (loss) | | (79,460) |
|
|
| |
| INCREASE (DECREASE) IN NET | | |
| ASSETS FROM OPERATIONS | $ | (42,741) |
|
|
The accompanying notes are an integral part of these financial statements.
Unaudited
| STATEMENT OF CHANGES IN NET ASSETS | | | | |
| ($ 000s) | | | | |
| | | 6 Months | | Year |
| | | Ended | | Ended |
| | | 6/30/05 | | 12/31/04 |
| |
| Increase (Decrease) in Net Assets | | | | |
| Operations | | | | |
| Net investment income (loss) | $ | 36,719 | $ | 71,984 |
| Net realized gain (loss) | | (17,125) | | 125,775 |
| Change in net unrealized gain (loss) | | (62,335) | | 246,106 |
|
|
| Increase (decrease) in net assets from operations | | (42,741) | | 443,865 |
|
|
| |
| Distributions to shareholders | | | | |
| Net investment income | | (34,424) | | (72,492) |
|
|
| |
| Capital share transactions * | | | | |
| Shares sold | | 762,042 | | 1,445,896 |
| Distributions reinvested | | 33,868 | | 71,092 |
| Shares redeemed | | (389,046) | | (985,161) |
| Redemption fees received | | 31 | | 62 |
|
|
| Increase (decrease) in net assets from capital | | | | |
| share transactions | | 406,895 | | 531,889 |
|
|
| |
| Net Assets | | | | |
| Increase (decrease) during period | | 329,730 | | 903,262 |
| Beginning of period | | 4,788,699 | | 3,885,437 |
|
|
| |
| End of period | $ | 5,118,429 | $ | 4,788,699 |
|
|
| (Including undistributed net investment income of | | | | |
| $2,295 at 6/30/05 and $0 at 12/31/04) | | | | |
| |
| *Share information | | | | |
| Shares sold | | 23,847 | | 47,307 |
| Distributions reinvested | | 1,063 | | 2,286 |
| Shares redeemed | | (12,177) | | (32,289) |
|
|
| Increase (decrease) in shares outstanding | | 12,733 | | 17,304 |
The accompanying notes are an integral part of these financial statements.
| NOTES TO FINANCIAL STATEMENTS |
NOTE 1 - SIGNIFICANT ACCOUNTING POLICIES
T. Rowe Price Index Trust, Inc. (the trust) is registered under the Investment Company Act of 1940 (the 1940 Act). The Equity Index 500 Fund (the fund), a diversified, open-end management investment company, is one portfolio established by the trust. The fund commenced operations on March 30, 1990. The fund seeks to match the performance of the Standard & Poor’s 500 Stock Index®.
The accompanying financial statements were prepared in accordance with accounting principles generally accepted in the United States of America, which require the use of estimates made by fund management. Fund management believes that estimates and security valuations are appropriate; however actual results may differ from those estimates, and the security valuations reflected in the financial statements may differ from the value the fund receives upon sale of the securities.
Valuation The fund values its investments and computes its net asset value per share at the close of the New York Stock Exchange (NYSE), normally 4 p.m. ET, each day that the NYSE is open for business. Equity securities listed or regularly traded on a securities exchange or in the over-the-counter market are valued at the last quoted sale price at the time the valuations are made, except for OTC Bulletin Board securities, which are valued at the mean of the latest bid and asked prices. A security that is listed or traded on more than one exchange is valued at the quotation on the exchange determined to be the primary market for such security. Listed securities not traded on a particular day are valued at the mean of the latest bid and asked prices. Debt securities with original maturities of less than one year are valued at amortized cost in local currency, which approximates fair value when combined with accrued interest.
Investments in mutual funds are valued at the mutual fund’s closing net asset value per share on the day of valuation. Financial futures contracts are valued at closing settlement prices.
Other investments, including restricted securities, and those for which the above valuation procedures are inappropriate or are deemed not to reflect fair value are stated at fair value as determined in good faith by the T. Rowe Price Valuation Committee, established by the fund’s Board of Trustees.
Credits The fund earns credits on temporarily uninvested cash balances at the custodian that reduce the fund’s custody charges. Custody expense in the accompanying financial statements is presented before reduction for credits, which are reflected as expenses paid indirectly.
Redemption Fees A 0.5% fee is assessed on redemptions of fund shares held less than 90 days/3 months to deter short-term trading and protect the interests of long-term shareholders. Redemption fees are withheld from proceeds that shareholders receive from the sale or exchange of fund shares. The fees are paid to the fund, and are recorded as an increase to paid-in capital. The fees may cause the redemption price per share to differ from the net asset value per share.
Investment Transactions, Investment Income, and Distributions Income and expenses are recorded on the accrual basis. Premiums and discounts on debt securities are amortized for financial reporting purposes. Dividends received from mutual fund investments are reflected as dividend income; capital gain distributions are reflected as realized gain/loss. Dividend income and capital gain distributions are recorded on the ex-dividend date. Investment transactions are accounted for on the trade date. Realized gains and losses are reported on the identified cost basis. Payments (“variation margin”) made or received to settle the daily fluctuations in the value of futures contracts are recorded as unrealized gains or losses until the contracts are closed. Unsettled variation margin on futures contracts is included in investments in securities, and unrealized gains and losses on futures contracts are included in the change in net unrealized gain or loss in the accompanying financial statements. Distributions to shareholders are recorded on the ex-dividend date. Income distributions are declared and paid on a quarterly basis. Capital gain distributions, if any, are declared and paid by the fund, typically on an annual basis.
NOTE 2 - INVESTMENT TRANSACTIONS
Consistent with its investment objective, the fund engages in the following practices to manage exposure to certain risks or enhance performance. The investment objective, policies, program, and risk factors of the fund are described more fully in the fund’s prospectus and Statement of Additional Information.
Futures Contracts During the six months ended June 30, 2005, the fund was a party to futures contracts, which provide for the future sale by one party and purchase by another of a specified amount of a specific financial instrument at an agreed upon price, date, time, and place. Risks arise from possible illiquidity of the futures market and from movements in security values.
Securities Lending The fund lends its securities to approved brokers to earn additional income. It receives as collateral cash and U.S. government securities valued at 102% to 105% of the value of the securities on loan. Cash collateral is invested in a money market pooled trust managed by the fund’s lending agent in accordance with investment guidelines approved by fund management. Collateral is maintained over the life of the loan in an amount not less than the value of loaned securities, as determined at the close of fund business each day; any additional collateral required due to changes in security values is delivered to the fund the next business day. Although risk is mitigated by the collateral, the fund could experience a delay in recovering its securities and a possible loss of income or value if the borrower fails to return the securities. Securities lending revenue recognized by the fund consists of earnings on invested collateral and borrowing fees, net of any rebates to the borrower and compensation to the lending agent. At June 30, 2005, the value of loaned securities was $389,240,000; aggregate collateral consisted of $400,465,000 in the money market pooled trust.
Other Purchases and sales of portfolio securities, other than short-term securities, aggregated $405,222,000 and $74,385,000, respectively, for the six months ended June 30, 2005.
NOTE 3 - FEDERAL INCOME TAXES
No provision for federal income taxes is required since the fund intends to continue to qualify as a regulated investment company under Subchapter M of the Internal Revenue Code and distribute to shareholders all of its taxable income and gains. Federal income tax regulations differ from generally accepted accounting principles; therefore, distributions determined in accordance with tax regulations may differ in amount or character from net investment income and realized gains for financial reporting purposes. Financial reporting records are adjusted for permanent book/tax differences to reflect tax character. Financial records are not adjusted for temporary differences. The amount and character of tax-basis distributions and composition of net assets are finalized at fiscal year-end; accordingly, tax-basis balances have not been determined as of June 30, 2005.
The fund intends to retain realized gains to the extent of available capital loss carryforwards. As of December 31, 2004, the fund had $164,122,000 of unused capital loss carryforwards, of which $49,385,000 expire in 2009, and $114,737,000 expire in 2010.
At June 30, 2005, the cost of investments for federal income tax purposes was $4,617,947,000. Net unrealized gain aggregated $893,012,000 at period-end, of which $1,284,055,000 related to appreciated investments and $391,043,000 related to depreciated investments.
NOTE 4 - RELATED PARTY TRANSACTIONS
The fund is managed by T. Rowe Price Associates, Inc. (the manager or Price Associates), a wholly owned subsidiary of T. Rowe Price Group, Inc. The investment management agreement between the fund and the manager provides for an annual investment management fee equal to 0.15% of the fund’s average daily net assets. The fee is computed daily and paid monthly.
The fund is also subject to a contractual expense limitation through April 30, 2006. During the limitation period, the manager is required to waive its management fee and reimburse the fund for any expenses, excluding interest, taxes, brokerage commissions, and extraordinary expenses, that would otherwise cause the fund’s ratio of total expenses to average net assets (expense ratio) to exceed its expense limitation of 0.35% . The fund is required to repay the manager for expenses previously reimbursed and management fees waived to the extent the fund’s net assets have grown or expenses have declined sufficiently to allow repayment without causing the fund’s expense ratio to exceed its expense limitation. However, no repayment will be made more than three years after the date of any reimbursement or waiver or later than April 30, 2008. Pursuant to this agreement, at June 30, 2005, management fees waived in the amount of $3,488,000 remain subject to repayment by the fund.
In addition, the fund has entered into service agreements with Price Associates and two wholly owned subsidiaries of Price Associates (collectively, Price). Price Associates computes the daily share price and maintains the financial records of the fund. T. Rowe Price Services, Inc., provides shareholder and administrative services in its capacity as the fund’s transfer and dividend disbursing agent. T. Rowe Price Retirement Plan Services, Inc., provides subaccounting and recordkeeping services for certain retirement accounts invested in the fund. For the six months ended June 30, 2005, expenses incurred pursuant to these service agreements were $53,000 for Price Associates, $1,253,000 for T. Rowe Price Services, Inc., and $2,182,000 for T. Rowe Price Retirement Plan Services, Inc. The total amount payable at period end pursuant to these service agreements is reflected as due to affiliates in the accompanying financial statements.
Additionally, the fund is one of several mutual funds in which certain college savings plans managed by Price Associates may invest. As approved by the fund’s Board of Trustees, shareholder servicing costs associated with each college savings plan are borne by the fund in proportion to the average daily value of its shares owned by the college savings plan. For the six months ended June 30, 2005, the fund was charged $439,000 for shareholder servicing costs related to the college savings plans, of which $318,000 was for services provided by Price. The amount payable at period end pursuant to this agreement is included in due to affiliates in the accompanying financial statements. At June 30, 2005, approximately 8% of the outstanding shares of the fund were held by college savings plans.
The fund is also one of several mutual funds sponsored by Price Associates (underlying Price funds) in which the T. Rowe Price Retirement Funds (Retirement Funds) may invest. The Retirement Funds do not invest in the underlying Price funds for the purpose of exercising management or control. Pursuant to a special servicing agreement, expenses associated with the operation of the Retirement Funds are borne by each underlying Price fund to the extent of estimated savings to it and in proportion to the average daily value of its shares owned by the Retirement Funds. Expenses allocated under this agreement are reflected as shareholder servicing expense in the accompanying financial statements. For the six months ended June 30, 2005, the fund was allocated $1,310,000 of Retirement Funds’ expenses, of which $1,008,000 related to services provided by Price. The amount payable at period end pursuant to this agreement is reflected as a component of due to affiliates in the accompanying financial statements. At June 30, 2005, approximately 20% of the outstanding shares of the fund were held by the Retirement Funds.
Consistent with its investment objective, the fund may invest in T. Rowe Price Group, Inc. Additionally, the fund may invest in the T. Rowe Price Reserve Investment Fund and the T. Rowe Price Government Reserve Investment Fund (collectively, the Reserve Funds), open-end management investment companies managed by Price Associates and affiliates of the fund. The Reserve Funds are offered as cash management options to mutual funds, trusts, and other accounts managed by Price Associates and/or its affiliates, and are not available for direct purchase by members of the public. The Reserve Funds pay no investment management fees. During the six months ended June 30, 2005, dividend income from the Reserve Funds totaled $2,487,000, and the value of shares of the Reserve Funds held at June 30, 2005 and December 31, 2005 was $199,612,000 and $145,661,000, respectively. During the six months ended June 30, 2005, dividend income from T. Rowe Price Group, Inc. totaled $25,000, and the value of shares of T. Rowe Price Group, Inc. held at June 30, 2005 and December 31, 2004 was $3,488,000 and $3,220,000, respectively.
NOTE 5 - SUBSEQUENT EVENT
On July 11, 2005, the T. Rowe Price Equity Index 500 Fund acquired substantially all of the assets of the TD Waterhouse Equity Index 500 Fund and the TD Waterhouse Dow 30 Fund (collectively, the acquired funds), pursuant to the Agreement and Plan of Reorganization dated March 23, 2005, and approved by shareholders of the acquired funds on June 28, 2005. The acquisition was accomplished by a tax-free exchange of 3,779,100.09 shares of the T. Rowe Price Equity Index 500 Fund (with a value of $123,199,000) for the 15,495,296.970 shares of the TD Waterhouse Equity Index 500 Fund outstanding at the merger date; an additional 4,574,021.297 shares of the T. Rowe Price Equity Index 500 Fund (with a value of $149,113,000) were exchanged for the 14,291,812.549 shares of the TD Waterhouse Dow 30 Fund outstanding on July 8, 2005. The aggregate net assets of the acquired funds at that date, which included $15,076,000 of unrealized appreciation, were combined with those of the T. Rowe Price Equity Index 500 Fund. Immediately after the merger, the net assets of the T. Rowe Price Equity Index 500 Fund totaled $5,496,527,000.
| INFORMATION ON PROXY VOTING POLICIES, PROCEDURES, AND RECORDS |
A description of the policies and procedures used by T. Rowe Price funds and portfolios to determine how to vote proxies relating to portfolio securities is available in each fund’s Statement of Additional Information, which you may request by calling 1-800-225-5132 or by accessing the SEC’s Web site, www.sec.gov. The description of our proxy voting policies and procedures is also available on our Web site, www.troweprice.com. To access it, click on the words “Company Info” at the top of our homepage for individual investors. Then, in the window that appears, click on the “Proxy Voting Policy” navigation button in the top left corner.
Each fund’s most recent annual proxy voting record is available on our Web site and through the SEC’s Web site. To access it through our Web site, follow the directions above, then click on the words “Proxy Voting Record” at the bottom of the Proxy Voting Policy page.
| HOW TO OBTAIN QUARTERLY PORTFOLIO HOLDINGS |
The fund files a complete schedule of portfolio holdings with the Securities and Exchange Commission for the first and third quarters of each fiscal year on Form N-Q. The fund’s Form N-Q is available electronically on the SEC’s Web site (www.sec.gov); hard copies may be reviewed and copied at the SEC’s Public Reference Room, 450 Fifth St. N.W., Washington, DC 20549. For more information on the Public Reference Room, call 1-800-SEC-0330.
| APPROVAL OF INVESTMENT MANAGEMENT AGREEMENT |
On March 2, 2005, the fund’s Board of Directors unanimously approved the investment advisory contract (“Contract”) between the fund and its investment manager, T. Rowe Price Associates, Inc. (“Manager”). The Board considered a variety of factors in connection with its review of the Contract, also taking into account information provided by the Manager during the course of the year, as discussed below:
Services Provided by the Manager
The Board considered the nature, quality, and extent of the services provided to the fund by the Manager. These services included, but were not limited to, management of the fund’s portfolio and a variety of activities related to portfolio management. The Board also reviewed the background and experience of the Manager’s senior management team and investment personnel involved in the management of the fund. The Board concluded that it was satisfied with the nature, quality, and extent of the services provided by the Manager.
Investment Performance of the Fund
The Board reviewed the fund’s average annual total return over the 1-, 3-, 5-, and 10-year periods as well as the fund’s year-by-year returns and compared these returns to previously agreed upon comparable performance measures and market data, including those supplied by Lipper and Morningstar, which are independent providers of mutual fund data. On the basis of this evaluation and the Board’s ongoing review of investment results, the Board concluded that the fund’s performance was satisfactory.
Costs, Benefits, Profits, and Economies of Scale
The Board reviewed detailed information regarding the revenues received by the Manager under the Contract and other benefits that the Manager (and its affiliates) may have realized from its relationship with the fund, including research received under “soft dollar” agreements. The Board also received information on the estimated costs incurred and profits realized by the Manager and its affiliates from advising T. Rowe Price mutual funds, as well as estimates of the gross profits realized from managing the fund in particular. The Board concluded that the Manager’s profits were reasonable in light of the services provided to the fund. The Board also considered whether the fund or other funds benefit under the fee levels set forth in the Contract from any economies of scale realized by the Manager. The Board concluded that, based on the profitability data it reviewed, the Contract provided for a reasonable sharing of benefits from any economies of scale with the fund’s investors.
Fees
The Board reviewed the fund’s management fee rate, operating expenses, and total expense ratio and compared them to fees and expenses of other comparable funds based on information and data supplied by Lipper. The information provided to the Board indicated that the fund’s management fee rate and expense ratio were generally at or below the median for comparable funds. The Board also reviewed the fee schedules for comparable privately managed accounts of the Manager and its affiliates. Management informed the Board that the Manager’s responsibilities for privately managed accounts are more limited than its responsibilities for the fund and other T. Rowe Price mutual funds that it or its affiliates advise. On the basis of the information provided, the Board concluded that the fees paid by the fund under the Contract were reasonable.
Approval of the Contract
As noted, the Board approved the continuation of the Contract. No single factor was considered in isolation or to be determinative to the decision. Rather, the Board concluded, in light of a weighting and balancing of all factors considered, that it was in the best interests of the fund to approve the continuation of the Contract, including the fees to be charged for services thereunder.
Item 2. Code of Ethics.A code of ethics, as defined in Item 2 of Form N-CSR, applicable to its principal executive officer, principal financial officer, principal accounting officer or controller, or persons performing similar functions is filed as an exhibit to the registrant’s annual Form N-CSR. No substantive amendments were approved or waivers were granted to this code of ethics during the registrant’s most recent fiscal half-year.
Item 3. Audit Committee Financial Expert.
Disclosure required in registrant’s annual Form N-CSR.
Item 4. Principal Accountant Fees and Services.
Disclosure required in registrant’s annual Form N-CSR.
Item 5. Audit Committee of Listed Registrants.
Not applicable.
Item 6. Schedule of Investments.
Not applicable. The complete schedule of investments is included in Item 1 of this Form N-CSR.
Item 7. Disclosure of Proxy Voting Policies and Procedures for Closed-End Management Investment Companies.
Not applicable.
Item 8. Portfolio Managers of Closed-End Management Investment Companies.
Not applicable.
Item 9. Purchases of Equity Securities by Closed-End Management Investment Company and Affiliated Purchasers.
Not applicable.
Item 10. Submission of Matters to a Vote of Security Holders.
Not applicable.
Item 11. Controls and Procedures.
(a) The registrant’s principal executive officer and principal financial officer have evaluated the registrant’s disclosure controls and procedures within 90 days of this filing and have concluded that the registrant’s disclosure controls and procedures were effective, as of that date, in ensuring that information required to be disclosed by the registrant in this Form N-CSR was recorded, processed, summarized, and reported timely.
(b) The registrant’s principal executive officer and principal financial officer are aware of no change in the registrant’s internal control over financial reporting that occurred during the registrant’s second fiscal quarter covered by this report that has materially affected, or is reasonably likely to materially affect, the registrant’s internal control over financial reporting.
Item 12. Exhibits.
(a)(1) The registrant’s code of ethics pursuant to Item 2 of Form N-CSR is filed with the registrant’s annual Form N-CSR.
(2) Separate certifications by the registrant's principal executive officer and principal financial officer, pursuant to Section 302 of the Sarbanes-Oxley Act of 2002 and required by Rule 30a-2(a) under the Investment Company Act of 1940, are attached.
(3) Written solicitation to repurchase securities issued by closed-end companies: not applicable.
(b) A certification by the registrant's principal executive officer and principal financial officer, pursuant to Section 906 of the Sarbanes-Oxley Act of 2002 and required by Rule 30a-2(b) under the Investment Company Act of 1940, is attached.
| | |
| SIGNATURES |
| |
| | Pursuant to the requirements of the Securities Exchange Act of 1934 and the Investment |
| Company Act of 1940, the registrant has duly caused this report to be signed on its behalf by the |
| undersigned, thereunto duly authorized. |
| |
| T. Rowe Price Index Trust, Inc. |
| |
| By | /s/ James S. Riepe |
| | James S. Riepe |
| | Principal Executive Officer |
| |
| Date | August 18, 2005 |
| |
| |
| | Pursuant to the requirements of the Securities Exchange Act of 1934 and the Investment |
| Company Act of 1940, this report has been signed below by the following persons on behalf of |
| the registrant and in the capacities and on the dates indicated. |
| |
| |
| By | /s/ James S. Riepe |
| | James S. Riepe |
| | Principal Executive Officer |
| |
| Date | August 18, 2005 |
| |
| |
| |
| By | /s/ Joseph A. Carrier |
| | Joseph A. Carrier |
| | Principal Financial Officer |
| |
| Date | August 18, 2005 |