Item 1: Report to Shareholders| Extended Equity Market Index Fund | June 30, 2005 |
The views and opinions in this report were current as of June 30, 2005. They are not guarantees of performance or investment results and should not be taken as investment advice. Investment decisions reflect a variety of factors, and the managers reserve the right to change their views about individual stocks, sectors, and the markets at any time. As a result, the views expressed should not be relied upon as a forecast of the fund’s future investment intent. The report is certified under the Sarbanes-Oxley Act of 2002, which requires mutual funds and other public companies to affirm that, to the best of their knowledge, the information in their financial reports is fairly and accurately stated in all material respects.
REPORTS ON THE WEB
Sign up for our E-mail Program, and you can begin to receive updated fund reports and prospectuses online rather than through the mail. Log in to your account at troweprice.com for more information.
Fellow ShareholdersLarge-cap U.S. stocks generally declined in the first half of 2005, as modest second-quarter gains were not enough to offset first-quarter losses. Some small- and mid-cap indexes fared better than large-cap benchmarks and produced slight gains for the six-month period. Nevertheless, the market’s attempts to advance were hindered by concerns about the pace of economic growth amid surging oil prices—which reached $60 per barrel in late June—and rising short-term interest rates.
MARKET ENVIRONMENT
Economic conditions were mostly favorable in the first half of 2005. Although the manufacturing sector decelerated somewhat, the economy expanded at a steady pace. New job growth continued at a reasonable rate, the unemployment rate hovered slightly above 5%, and inflation remained contained, despite skyrocketing oil prices.
Relatively low interest rates continued to provide a helpful stimulus to the economy. Although money market and short-term bond yields increased as the Federal Reserve raised the fed funds target rate, long-term interest rates unexpectedly declined. The result was a flattening of the Treasury yield curve, which currently indicates that long-term Treasury yields are not much higher than short-term yields.
Large-cap U.S. stocks generally declined through April amid fears of slower economic growth accompanied by higher inflation. However, Federal Reserve officials assuaged investor worries by asserting that the economy was on a “reasonably firm footing” and that “underlying inflation remains contained.” Brisk merger activity and generally favorable corporate earnings news helped lift stocks in the second quarter, though a late-June spike in oil prices and prospects for the central bank to continue raising the overnight federal funds target rate—which has already risen from 1.00% to 3.25% over the last 12 months—capped the market’s advance.
Large-cap shares, as measured by the S&P 500 Stock Index, returned -0.81% versus 2.19% for the Dow Jones Wilshire 4500 Completion Index, a broad benchmark for small- and mid-cap stocks. As measured by various Russell indexes, value stocks outperformed their growth counterparts across all market capitalizations.| WILSHIRE 5000 RETURNS BY SECTOR |
| | |
| Periods Ended 6/30/05 | 6 Months | 12 Months |
| Consumer Discretionary | -3.81% | 8.26% |
| Consumer Staples | 0.27 | 2.59 |
| Energy | 20.63 | 40.82 |
| Financials | -1.60 | 8.82 |
| Health Care | 4.53 | 5.18 |
| Industrials and Business Services | -3.52 | 6.68 |
| Information Technology | -5.13 | -2.28 |
| Materials | -7.48 | 6.41 |
| Telecommunication Services | -2.81 | 11.89 |
| Utilities | 14.36 | 35.68 |
The market for initial public offerings (IPOs) was relatively quiet in the first half of the year, though activity picked up in recent months. Fewer than 100 companies went public in the last six months, according to data from Dealogic and Thomson Financial. Nevertheless, the universe of publicly traded companies based in the U.S., as measured by the Dow Jones Wilshire 5000 Composite Index, continued to shrink in the last six months. One likely reason is brisk merger and acquisition activity; another may be insufficient trading activity involving shares of some of the smallest companies. As of June 30, there were 4,905 companies in the index versus 4,971 at the end of 2004.
SECTOR PERFORMANCE
In the U.S. stock market, as measured by the Wilshire 5000, energy stocks and utilities produced vigorous gains and far surpassed other sectors in the last six months. Health care was also modestly higher. The materials and information technology sectors performed worst, but stocks in the consumer discretionary and industrials and business services sectors also struggled.
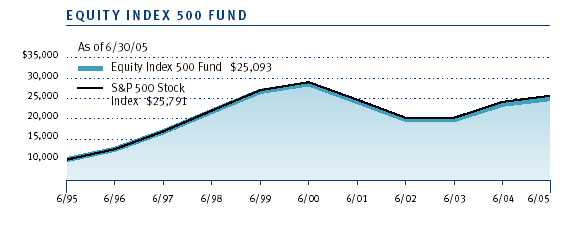
EQUITY INDEX 500 FUND
| PERFORMANCE COMPARISON |
| | |
| Periods Ended 6/30/05 | 6 Months | 12 Months |
| Equity Index 500 Fund | -0.95% | 6.02% |
| S&P 500 Stock Index | -0.81 | 6.32 |
Your fund returned -0.95% in the last six months and 6.02% for the 12-month period ended June 30, 2005. As shown in the table, the fund closely tracked the performance of its benchmark, the S&P 500 Stock Index, in both periods. The fund usually lags slightly due to annual operating and management expenses.
Energy stocks (8.8% of equities as of June 30) produced outstanding results as oil prices extended last year’s ascent into the first half of 2005. Nearly every energy holding appreciated in value, and many were among our largest contributors to performance. The largest was ExxonMobil, which gained 13% amid rising oil prices and following better-than-expected earnings in the fourth quarter of 2004. (Please refer to the fund’s portfolio of investments for a complete listing of the fund’s holdings and the amount each represents in the portfolio.)
Utility stocks (3.5% of equities) also extended last year’s brisk performance, led by electric utilities. One of our top contributors in this segment was Exelon, which advanced 18%. Independent power producers also performed well, especially TXU Corporation, whose shares surged 30% as its energy division benefited from rising natural gas prices. Gas utility companies trailed.
In the health care sector (13.4% of equities), gains were driven by providers and service companies. UnitedHealth Group, a high-quality, diversified, national managed care provider, was our best holding in the sector. Shares of WellPoint, HCA, and Aetna also performed very well. Pharmaceutical stocks were mixed, as weakness in Merck and Schering-Plough offset gains in Pfizer and Johnson & Johnson. Biotechnology and health care equipment and supply companies generally declined, though Gilead Sciences and Medtronic contributed to our results.
On the downside, information technology shares (15.2% of equities) detracted the most in the last six months. Nearly every underlying industry declined, but semiconductor-related stocks produced gains, thanks primarily to strength in Intel and Texas Instruments. Software stocks were dragged lower by weakness in industry giant Microsoft, but makers of computers and peripherals performed worst, led by IBM, which reported lower-than-expected first-quarter earnings and which tumbled more than 24% in the first half. Hewlett-Packard, however, bucked the negative trend as the company replaced CEO Carly Fiorina and began focusing on increasing its profitability.Consumer discretionary stocks (11.4% of equities) generally fell, though multi-line retailers J.C. Penney, May Department Stores, and Nordstrom performed very well. Media stocks continued to struggle across the board, especially Time Warner and Viacom, while automobile stocks Ford Motor and GM suffered from weakening sales and credit rating downgrades. Specialty retailers were mixed, as gains in Best Buy and Office Depot were offset by weak performance of Home Depot. Toys R Us performed well, however, after the company received a buy-out offer from two private equity firms and a real estate developer.
| PORTFOLIO CHARACTERISTICS |
|
| | | | Extended |
| | Equity | Total Equity | Equity |
| As of 6/30/05 | Index 500 | Market Index | Market Index |
| Market Cap | | | |
| (Investment- | | | |
| Weighted Median) | $48.8 billion | $25.0 billion | $2.6 billion |
| |
| Earnings Growth | | | |
| Rate Estimated | | | |
| Next 5 Years * | 11.2% | 11.3% | 14.4% |
| |
| P/E Ratio (Based | | | |
| on Next 12 Months’ | | | |
| Estimated Earnings) * | 15.4X | 15.8X | 17.5X |
| | | |
| * Source data: IBES. Forecasts are in no way indicative of future investment returns. |
Most major underlying industries in the financial sector (20.3% of equities) declined in the last six months. Real estate-related companies outperformed, however, especially Simon Property Group and Equity Office Properties, which benefited from the booming real estate market. Insurance stocks also held up well, with Prudential and Allstate producing good returns, though shares of American International Group suffered amid regulatory scrutiny of its accounting practices. Commercial banks did worst, especially Bank of America and Wachovia. Brokerage stocks and asset managers also struggled, though Lehman Brothers and Franklin Resources traded higher.The industrials and business services sector (11.2% of equities) also detracted substantially from our performance. Industrial conglomerates GE, 3M, and Tyco International were responsible for a large portion of the sector’s weakness. Machinery stocks also struggled amid fears that slower economic growth would hurt the earnings of these cyclical companies. On the plus side, aerospace and defense firms gained altitude, led by Boeing and Lockheed Martin.
Standard & Poor’s authorized only three changes to the composition of the S&P 500 in the last six months, two of which stemmed from mergers. Adolph Coors, which was acquired by Canadian brewer Molson, was replaced by Molson Coors Brewing; Sears, Roebuck & Co., which merged with K-Mart, was replaced by Sears Holdings; and Power-One was supplanted by National Oilwell Varco.
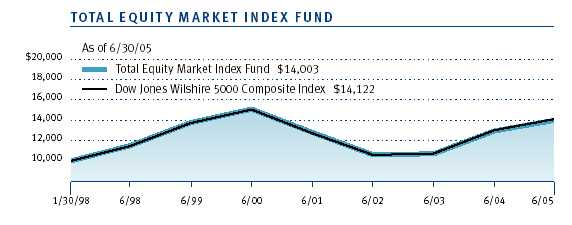
TOTAL EQUITY MARKET INDEX FUND
| PERFORMANCE COMPARISON |
| | |
| Periods Ended 6/30/05 | 6 Months | 12 Months |
| Total Equity Market Index Fund | -0.08% | 8.11% |
| Dow Jones Wilshire 5000 | | |
| Composite Index * | 0.02 | 8.39 |
|
| * Dow Jones Wilshire 5000 returns through 6/30/05, calculated as of 7/11/05. |
Your fund returned -0.08% in the last six months and 8.11% for the 12-month period ended June 30, 2005. The fund closely tracked the performance of the Dow Jones Wilshire 5000 Composite Index in both periods, as shown in the table, but slightly lagged due to annual operating and management expenses.Because the Wilshire 5000 includes more than 4,900 publicly traded companies, it is impractical for us to buy shares of each. Instead, we use sampling strategies in an attempt to match the performance of the index. We manage the portfolio so that its characteristics—including sector allocations and price/earnings ratio—closely resemble those of the index. At the end of June, the fund owned stocks of approximately 2,000 companies.
| SECTOR DIVERSIFICATION |
| | | |
| Percent of | | | Extended |
| Equities | Equity | Total Equity | Equity |
| As of 6/30/05 | Index 500 | Market Index | Market Index |
| Consumer | | | |
| Discretionary | 11.4% | 13.4% | 18.5% |
| Consumer Staples | 10.1 | 9.1 | 4.9 |
| Energy | 8.8 | 8.3 | 6.9 |
| Financials | 20.3 | 21.3 | 24.9 |
| Health Care | 13.4 | 13.0 | 12.3 |
| Industrials and Business | | | |
| Services | 11.2 | 10.3 | 9.2 |
| Information | | | |
| Technology | 15.2 | 15.3 | 14.5 |
| Materials | 2.9 | 3.1 | 3.7 |
| Telecommunication | | | |
| Services | 3.2 | 2.8 | 2.0 |
| Utilities | 3.5 | 3.4 | 3.1 |
| | | |
| Note: The numbers in this table may not match the sector percentages in each fund’s portfolio of |
| investments, which are calculated as a percentage of net assets. |
| | | | |
In general, what was true about the performance of the Equity Index 500 Fund in the last six months was also true for this fund: energy, health care, and utilities were the sectors that contributed the most to fund performance, while the information technology, financial, consumer discretionary, and industrials and business services sectors detracted the most. The Wilshire 5000, which represents the entire U.S. stock market, includes all S&P 500 companies. In fact, the S&P 500 represents about 74% of the Wilshire 5000’s total market value. The largest components of the Wilshire index—as with the S&P 500—have the greatest influence on performance. In addition, the percentage weightings of the major sectors are similar, as shown in the Sector Diversification table above.
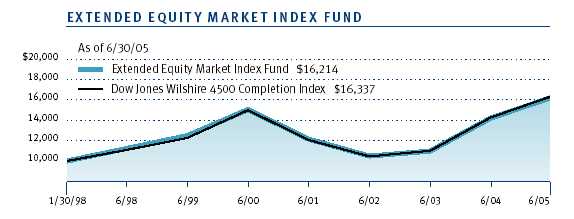
EXTENDED EQUITY MARKET INDEX FUND
| PERFORMANCE COMPARISON |
| | |
| Periods Ended 6/30/05 | 6 Months | 12 Months |
| Extended Equity Market | | |
| Index Fund | 2.11% | 14.10% |
| Dow Jones Wilshire 4500 | | |
| Completion Index * | 2.19 | 14.49 |
| | |
| * Dow Jones Wilshire 4500 returns through 6/30/05, calculated as of 7/11/05. |
Your fund returned 2.11% in the last six months and 14.10% for the 12-month period ended June 30, 2005. The fund closely tracked the performance of the Dow Jones Wilshire 4500 Completion Index in both periods, as shown in the table, but lagged slightly due to annual operating and management expenses.The index includes more than 4,400 small- and mid-cap companies, so it is impractical for us to buy shares of each. Instead, we use sampling strategies (just as we do with the Total Equity Market Index Fund) in an attempt to match the performance of the index. At the end of June, the fund held nearly 2,500 names.
The energy sector (6.9% of equities as of June 30) contributed the most to fund performance in the last six months. Most of our holdings produced gains. Premcor and Murphy Oil led the oil and gas industry, while GlobalSantaFe and Diamond Offshore Drilling were our top contributors in the energy equipment and services industry. Utilities (3.1% of equities) also advanced in the last six months. Gas and electric utilities fared best; water utilities trailed, though Aqua America performed fairly well. (Please refer to the fund’s portfolio of investments for a complete listing of the fund’s holdings and the amount each represents in the portfolio.)
Health care stocks (12.3% of equities) performed very well. Providers and services companies paced the sector’s advance, especially Coventry Health Care, Triad Hospitals, and WellChoice. Biotechnology stocks were fairly lackluster, but Genentech and Celgene were exceptions. Health care equipment and supply companies and pharmaceutical shares were mostly flat.
Consumer discretionary shares (18.5% of equities) made a small contribution to our results in the first half of the year. Specialty retailers did best, led by Chico’s and Abercrombie & Fitch, but PETsMART and Petco were disappointing. In the household durables industry, homebuilders were some of our top contributors to performance, especially Toll Brothers and D.R. Horton, but audio equipment maker Harman International Industries performed poorly. Media stocks struggled, particularly Liberty Media and DIRECTV, though Cablevision Systems and Fox Entertainment Group were two of our largest contributors.
Information technology shares (14.5% of equities) detracted the most from our results in the last six months. Most underlying industries declined, with communications equipment, electronics equipment, and semiconductor stocks among the weakest segments. Internet software and services stocks did best, primarily because of stellar performance of Google, a provider of Web search and online advertising services.
Stocks in the materials sector (3.7% of equities), which produced good returns in 2004, faltered in the first half of 2005 amid concerns that a slowing economy would dent the earnings of these cyclical companies. Chemical companies fared worst. Metals and mining stocks also stumbled, with AK Steel and Steel Dynamics among our worst performers. Construction materials companies held up best, benefiting from the robust real estate market.
Financial stocks (24.9% of equities) generally declined in the last six months. Commercial banks paced the sector’s decline. Thrifts and mortgage finance companies also detracted from our performance. On the plus side, real estate investment trusts (REITs) outperformed, as the real estate market remained hot and investors found REIT yields appealing in an environment of relatively low interest rates. Companies tied to the capital markets also outperformed other financial industries, led by Legg Mason. Online brokerage firm AmeriTrade also performed well: E*Trade initially sought to acquire the company, but AmeriTrade chose instead to purchase TD Waterhouse from Toronto-Dominion Bank.
Industrial and business services stocks (9.2% of equities) also detracted from our performance. Electrical equipment companies faltered, and airline stocks were grounded by record oil prices. Air freight and logistics companies, as well as road and rail stocks, also struggled amid high fuel costs, and machinery stocks were disabled by fears of slower economic growth. Favorable performance of aerospace and defense names helped to limit the losses in the sector, with United Defense Industries among the fund’s largest contributors to performance.
OUTLOOK
The economy is likely to continue expanding this year, despite elevated oil prices, and short-term interest rates are likely to keep rising. Fundamentals in corporate America are generally sound, but unless corporate profit growth remains vigorous, stocks could have difficulty making progress until the Fed signals that rates are at or near a neutral level that neither stimulates nor stifles economic growth.
Although macroeconomic factors are a major influence on the stock market, we are not preoccupied with discerning how individual stocks, sectors, or the market as a whole will react to the latest economic data, interest rate trends, or corporate developments. Our goal is to closely track the broad equity market indexes with the assets you have entrusted to us. Thank you for your support in this endeavor.
Respectfully submitted,

E. Frederick Bair
Chairman of the Investment Advisory Committee,
Equity Index 500 Fund and Extended Equity Market Index Fund
Co-chairman of the Investment Advisory Committee,
Total Equity Market Index Fund

Ken D. Uematsu
Co-chairman of the Investment Advisory Committee,
Total Equity Market Index Fund
July 14, 2005
The committee chairmen have day-to-day responsibility for managing the portfolios and work with committee members in developing and executing the funds’ investment programs.
PROSPECTUS UPDATE
This updates the Total Equity Market Index Fund’s prospectus dated May 1, 2005. The Portfolio Management paragraph in Section 3 of the prospectus is amended to reflect the following change:
Effective May 2005, Ken D. Uematsu became co-chairman of the Total Equity Market Index Fund’s Investment Advisory Committee. Mr. Uematsu, who joined T. Rowe Price in 1997, is an assistant vice president of T. Rowe Price Associates, Inc., a quantitative analyst in the Systematic Equity Group, and a vice president and Investment Advisory Committee member for the Equity Index 500 and Extended Equity Market Index Funds.
RISKS OF INVESTING
As with all stock mutual funds, the fund’s share price can fall because of weakness in the stock market, a particular industry, or specific holdings. Stock markets can decline for many reasons, including adverse political or economic developments, changes in investor psychology, or heavy institutional selling. The prospects for an industry or company may deteriorate because of a variety of factors, including disappointing earnings or changes in the competitive environment.
GLOSSARY
Fed funds target rate: An overnight lending rate set by the Federal Reserve and used by banks to meet reserve requirements. Banks also use the fed funds rate as a benchmark for their prime lending rates.
S&P 500 Stock Index: Tracks the stocks of 500 mostly large U.S. companies.
Dow Jones Wilshire 5000 Composite Index: Tracks the performance of the most active stocks in the broad U.S. market.
Dow Jones Wilshire 4500 Completion Index: Tracks the performance of all stocks in the Dow Jones Wilshire 5000 Composite Index, excluding those in the S&P 500 Stock Index.
| THE EVOLVING S&P 500 STOCK INDEX |
| |
| Changes in the index in 2005 | |
| Additions | Deletions |
| Sears Holdings Corp. | Sears, Roebuck & Co. |
| National Oilwell Varco | Power-One |
| Molson Coors Brewing | Adolph Coors |
| PORTFOLIO HIGHLIGHTS |
| |
| TWENTY-FIVE LARGEST HOLDINGS | |
| | Percent of |
| | Net Assets |
| | 6/30/05 |
| Equity Index 500 Fund | |
| GE | 3.2 |
| ExxonMobil | 3.2 |
| Microsoft | 2.2 |
| Citigroup | 2.1 |
| Pfizer | 1.8 |
| Johnson & Johnson | 1.7 |
| Bank of America | 1.6 |
| Intel | 1.4 |
| Wal-Mart | 1.4 |
| American International Group | 1.3 |
| Altria Group | 1.2 |
| Procter & Gamble | 1.1 |
| J.P. Morgan Chase | 1.1 |
| Cisco Systems | 1.1 |
| IBM | 1.1 |
| Chevron | 1.0 |
| Wells Fargo | 0.9 |
| Dell | 0.8 |
| Verizon Communications | 0.8 |
| Coca-Cola | 0.8 |
| PepsiCo | 0.8 |
| Home Depot | 0.7 |
| ConocoPhillips | 0.7 |
| SBC Communications | 0.7 |
| Time Warner | 0.7 |
| Total | 33.4% |
| |
| Note: Table excludes investments in the T. Rowe Price Reserve Investment Fund. | |
| Total Equity Market Index Fund | |
| ExxonMobil | 2.4% |
| GE | 2.4 |
| Microsoft | 1.8 |
| Citigroup | 1.6 |
| Pfizer | 1.4 |
| Wal-Mart | 1.3 |
| Johnson & Johnson | 1.3 |
| Bank of America | 1.2 |
| Intel | 1.1 |
| American International Group | 1.0 |
| Procter & Gamble | 0.9 |
| Altria Group | 0.9 |
| Berkshire Hathaway | 0.8 |
| Cisco Systems | 0.8 |
| J.P. Morgan Chase | 0.8 |
| IBM | 0.8 |
| Chevron | 0.8 |
| Wells Fargo | 0.7 |
| Coca-Cola | 0.7 |
| Dell | 0.6 |
| Verizon Communications | 0.6 |
| PepsiCo | 0.6 |
| Home Depot | 0.6 |
| Genentech | 0.5 |
| Google | 0.5 |
| Total | 26.1% |
| |
| Note: Table excludes investments in the T. Rowe Price Reserve Investment Fund. | |
| Extended Equity Market Index Fund | |
| Berkshire Hathaway | 3.2% |
| Genentech | 2.1 |
| Google | 2.1 |
| Kraft Foods | 1.4 |
| Liberty Media | 0.7 |
| DIRECTV | 0.5 |
| IAC/InterActiveCorp | 0.4 |
| Genworth Financial | 0.4 |
| Juniper Networks | 0.3 |
| Amazon.com | 0.3 |
| Las Vegas Sands | 0.3 |
| Liberty Global | 0.3 |
| MGM Mirage | 0.3 |
| Legg Mason | 0.3 |
| Vornado Realty Trust | 0.3 |
| UnionBancal | 0.2 |
| Murphy Oil | 0.2 |
| Enterprise Products Partners | 0.2 |
| Chicago Mercantile Exchange Holdings | 0.2 |
| Cablevision Systems | 0.2 |
| Lennar | 0.2 |
| GlobalSantaFe | 0.2 |
| Royal Caribbean Cruises | 0.2 |
| General Growth Properties | 0.2 |
| MCI | 0.2 |
| Total | 14.9% |
| |
| Note: Table excludes investments in the T. Rowe Price Reserve Investment Fund. | |
This chart shows the value of a hypothetical $10,000 investment in the fund over the past 10 fiscal year periods or since inception (for funds lacking 10-year records). The result is compared with benchmarks, which may include a broad-based market index and a peer group average or index. Market indexes do not include expenses, which are deducted from fund returns as well as mutual fund averages and indexes.
| AVERAGE ANNUAL COMPOUND TOTAL RETURN |
This table shows how the fund and its benchmark would have performed if their actual (or cumulative) returns for the periods shown had been earned at a constant rate.
| Periods Ended 6/30/05 | 1 Year | 5 Years | 10 Years |
| |
| Equity Index 500 Fund | 6.02% | -2.64% | 9.64% |
| |
| S&P 500 Stock Index | 6.32 | -2.37 | 9.94 |
| |
| Current performance may be higher or lower than the quoted past performance, which can- |
| not guarantee future results. Share price, principal value, and return will vary, and you may |
| have a gain or loss when you sell your shares. For the most recent month-end performance |
| information, please visit our Web site (troweprice.com) or contact a T. Rowe Price repre- |
| sentative at 1-800-225-5132. The fund charges a redemption fee of 0.5% on shares held |
| for three months or less. The performance information shown does not reflect the deduc- |
| tion of the redemption fee. If it did, the performance would be lower. | |
| | | |
| Average annual total return figures include changes in principal value, reinvested dividends, and capital |
| gain distributions. Returns do not reflect taxes that the shareholder may pay on fund distributions or the |
| redemption of fund shares. When assessing performance, investors should consider both short- and |
| long-term returns. | | | |
This chart shows the value of a hypothetical $10,000 investment in the fund over the past 10 fiscal year periods or since inception (for funds lacking 10-year records). The result is compared with benchmarks, which may include a broad-based market index and a peer group average or index. Market indexes do not include expenses, which are deducted from fund returns as well as mutual fund averages and indexes.
| AVERAGE ANNUAL COMPOUND TOTAL RETURN |
This table shows how the fund and its benchmark would have performed if their actual (or cumulative) returns for the periods shown had been earned at a constant rate.
| | | | Since |
| | | | Inception |
| Periods Ended 6/30/05 | 1 Year | 5 Years | 1/30/98 |
| Total Equity Market Index Fund | 8.11% | -1.47% | 4.65% |
| Dow Jones Wilshire 5000 Composite Index | 8.39 | -1.25 | 4.77 |
Dow Jones Wilshire 5000 returns through 6/30/05, calculated as of 7/11/05. | | |
| | | |
| Current performance may be higher or lower than the quoted past performance, which can- |
| not guarantee future results. Share price, principal value, and return will vary, and you may |
| have a gain or loss when you sell your shares. For the most recent month-end performance |
| information, please visit our Web site (troweprice.com) or contact a T. Rowe Price represen- |
| tative at 1-800-225-5132. The fund charges a redemption fee of 0.5% on shares held for |
| three months or less. The performance information shown does not reflect the deduction |
| of the redemption fee. If it did, the performance would be lower. | | |
| | | |
| Average annual total return figures include changes in principal value, reinvested dividends, and capital |
| gain distributions. Returns do not reflect taxes that the shareholder may pay on fund distributions or the |
| redemption of fund shares. When assessing performance, investors should consider both short- and long- |
| term returns. | | | |
This chart shows the value of a hypothetical $10,000 investment in the fund over the past 10 fiscal year periods or since inception (for funds lacking 10-year records). The result is compared with benchmarks, which may include a broad-based market index and a peer group average or index. Market indexes do not include expenses, which are deducted from fund returns as well as mutual fund averages and indexes.
| AVERAGE ANNUAL COMPOUND TOTAL RETURN |
This table shows how the fund and its benchmark would have performed if their actual (or cumulative) returns for the periods shown had been earned at a constant rate.
| | | | Since |
| | | | Inception |
| Periods Ended 6/30/05 | 1 Year | 5 Years | 1/30/98 |
| Extended Equity Market Index Fund | 14.10% | 1.52% | 6.74% |
| Dow Jones Wilshire 4500 Completion Index | 14.49 | 1.75 | 6.85 |
Dow Jones Wilshire 4500 returns through 6/30/05, calculated as of 7/11/05. | | |
Current performance may be higher or lower than the quoted past performance, which can- |
| not guarantee future results. Share price, principal value, and return will vary, and you may |
| have a gain or loss when you sell your shares. For the most recent month-end performance |
| information, please visit our Web site (troweprice.com) or contact a T. Rowe Price represen- |
| tative at 1-800-225-5132. The fund charges a redemption fee of 0.5% on shares held for |
| three months or less. The performance information shown does not reflect the deduc- |
| tion of the redemption fee. If it did, the performance would be lower. | |
Average annual total return figures include changes in principal value, reinvested dividends, and capital |
| gain distributions. Returns do not reflect taxes that the shareholder may pay on fund distributions or the |
| redemption of fund shares. When assessing performance, investors should consider both short- and long- |
| term returns. | | | |
As a mutual fund shareholder, you may incur two types of costs: (1) transaction costs such as redemption fees or sales loads and (2) ongoing costs, including management fees, distribution and service (12b-1) fees, and other fund expenses. The following example is intended to help you understand your ongoing costs (in dollars) of investing in the fund and to compare these costs with the ongoing costs of investing in other mutual funds. The example is based on an investment of $1,000 invested at the beginning of the most recent six-month period and held for the entire period.Actual Expenses
The first line of the following table (“Actual”) provides information about actual account values and actual expenses. You may use the information in this line, together with your account balance, to estimate the expenses that you paid over the period. Simply divide your account value by $1,000 (for example, an $8,600 account value divided by $1,000 = 8.6), then multiply the result by the number in the first line under the heading “Expenses Paid During Period” to estimate the expenses you paid on your account during this period.
Hypothetical Example for Comparison Purposes
The information on the second line of the table (“Hypothetical”) is based on hypothetical account values and expenses derived from the fund’s actual expense ratio and an assumed 5% per year rate of return before expenses (not the fund’s actual return). You may compare the ongoing costs of investing in the fund with other funds by contrasting this 5% hypothetical example and the 5% hypothetical examples that appear in the shareholder reports of the other funds. The hypothetical account values and expenses may not be used to estimate the actual ending account balance or expenses you paid for the period.
Note: T. Rowe Price charges an account maintenance fee that is not included in the accompanying table. The account maintenance fee is charged on a quarterly basis, usually during the last week of a calendar quarter, and applies to accounts with balances below $10,000 on the day of the assessment. The fee is charged to accounts that fall below $10,000 for any reason, including market fluctuations, redemptions, or exchanges. When an account with less than $10,000 is closed either through redemption or exchange, the fee is charged and deducted from the proceeds. The fee applies to IRA accounts but not to retirement plans directly registered with T. Rowe Price Services or accounts maintained by intermediaries through NSCC® Networking. If you are subject to the fee, keep it in mind when you are estimating the ongoing expenses of investing in the fund and when comparing the expenses of this fund with other funds.
You should also be aware that the expenses shown in the table highlight only your ongoing costs and do not reflect any transaction costs, such as redemption fees or sales loads. Therefore, the second line of the table is useful in comparing ongoing costs only and will not help you determine the relative total costs of owning different funds. To the extent a fund charges transaction costs, however, the total cost of owning that fund is higher.
| T. ROWE PRICE EQUITY INDEX 500 FUND |
| |
| | Beginning | Ending | Expenses Paid |
| | Account Value | Account Value | During Period* |
| | 1/1/05 | 6/30/05 | 1/1/05 to 6/30/05 |
| Actual | $1,000.00 | $990.50 | $1.73 |
| Hypothetical (assumes 5% | | | |
| return before expenses) | 1,000.00 | 1,023.06 | 1.76 |
| * Expenses are equal to the fund’s annualized expense ratio for the six-month period (0.35%), multiplied |
| by the average account value over the period, multiplied by the number of days in the most recent fiscal |
| half year (181) divided by the days in the year (365) to reflect the half-year period. |
| |
| |
| T. ROWE PRICE TOTAL EQUITY MARKET INDEX FUND |
| |
| | Beginning | Ending | Expenses Paid |
| | Account Value | Account Value | During Period* |
| | 1/1/05 | 6/30/05 | 1/1/05 to 6/30/05 |
| Actual | $1,000.00 | $999.20 | $1.98 |
| Hypothetical (assumes 5% | | | |
| return before expenses) | 1,000.00 | 1,022.81 | 2.01 |
| * Expenses are equal to the fund’s annualized expense ratio for the six-month period (0.40%), multiplied |
| by the average account value over the period, multiplied by the number of days in the most recent fiscal |
| half year (181) divided by the days in the year (365) to reflect the half-year period. |
| |
| |
| T. ROWE PRICE EXTENDED EQUITY MARKET INDEX FUND |
| |
| | Beginning | Ending | Expenses Paid |
| | Account Value | Account Value | During Period* |
| | 1/1/05 | 6/30/05 | 1/1/05 to 6/30/05 |
| Actual | $1,000.00 | $1,021.10 | $2.00 |
| Hypothetical (assumes 5% | | | |
| return before expenses) | 1,000.00 | 1,022.81 | 2.01 |
| * Expenses are equal to the fund’s annualized expense ratio for the six-month period (0.40%), multiplied |
| by the average account value over the period, multiplied by the number of days in the most recent fiscal |
| half year (181) divided by the days in the year (365) to reflect the half year-period. |
Unaudited
| FINANCIAL HIGHLIGHTS | For a share outstanding throughout each period |
| | | 6 Months | | Year | | | | | | | | |
| | | Ended | | Ended | | | | | | | | |
| | | 6/30/05** | | 12/31/04 | | 12/31/03 | | 12/31/02 | | 12/31/01 | | 12/31/00 |
| NET ASSET VALUE | | | | | | | | | | | | |
| Beginning of period | $ | 13.25 | $ | 11.27 | $ | 7.94 | $ | 9.77 | $ | 11.12 | $ | 14.05 |
|
|
| |
| Investment activities | | | | | | | | | | | | |
| Net investment income | | | | | | | | | | | | |
| (loss) | | 0.05 | | 0.09 | | 0.07 | | 0.06 | | 0.10 | | 0.09 |
| Net realized and | | | | | | | | | | | | |
| unrealized gain (loss) | | 0.23 | | 1.98 | | 3.33 | | (1.83) | | (1.17) | | (2.26) |
|
|
| Total from investment | | | | | | | | | | | | |
| activities | | 0.28 | | 2.07 | | 3.40 | | (1.77) | | (1.07) | | (2.17) |
|
|
| |
| Distributions | | | | | | | | | | | | |
| Net investment income | | – | | (0.09) | | (0.07) | | (0.06) | | (0.10) | | (0.09) |
| Net realized gain | | – | | – | | – | | – | | (0.18) | | (0.67) |
|
|
| Total distributions | | – | | (0.09) | | (0.07) | | (0.06) | | (0.28) | | (0.76) |
|
|
| |
| NET ASSET VALUE | | | | | | | | | | | | |
| End of period | $ | 13.53 | $ | 13.25 | $ | 11.27 | $ | 7.94 | $ | 9.77 | $ | 11.12 |
|
|
| |
| |
| Ratios/Supplemental Data | | | | | | | | | | |
| Total return^ | | 2.11% | | 18.38% | | 42.85% | (18.12)% | | (9.55)% | (15.58)% |
| Ratio of total expenses to | | | | | | | | | | | | |
| average net assets | | 0.40%† | | 0.40% | | 0.40% | | 0.40% | | 0.40% | | 0.40% |
| Ratio of net investment | | | | | | | | | | | | |
| income (loss) to average | | | | | | | | | | | | |
| net assets | | 0.81%† | | 0.83% | | 0.89% | | 0.74% | | 0.96% | | 0.78% |
| Portfolio turnover rate | | 7.0%† | | 11.2% | | 8.5% | | 21.0% | | 31.3% | | 30.5% |
| Net assets, end of period | | | | | | | | | | | | |
| (in thousands) | $ | 179,873 | $ | 161,118 | $ | 118,880 | $ | 66,658 | $ | 77,331 | $ | 86,322 |
| ^ | Total return reflects the rate that an investor would have earned on an investment in the fund during each period, |
| | assuming reinvestment of all distributions and payment of no redemption or account fees. |
| ** Per share amounts calculated using average shares outstanding method. |
| † | Annualized |
The accompanying notes are an integral part of these financial statements.
Unaudited
| PORTFOLIO OF INVESTMENTS (1) | Shares/$ Par | Value |
| (Cost and value in $ 000s) | | |
| | | |
| COMMON STOCKS 95.2% | | |
| |
| CONSUMER DISCRETIONARY 17.7% | | |
| Auto Components 0.5% | | |
| Aftermarket Technology * | 1,800 | 31 |
| American Axle & Manufacturing Holdings | 2,200 | 56 |
| Amerigon *§ | 1,200 | 4 |
| Arvinmeritor | 4,025 | 72 |
| Bandag § | 900 | 41 |
| Borg-Warner | 2,400 | 129 |
| Drew Industries *§ | 1,200 | 54 |
| Dura Automotive Systems, Class A *§ | 1,300 | 6 |
| Gentex § | 6,700 | 122 |
| IMPCO Technologies *§ | 1,800 | 9 |
| Keystone Automotive * | 1,200 | 30 |
| Lear | 3,000 | 109 |
| Modine Manufacturing | 1,300 | 42 |
| Noble International § | 1,000 | 24 |
| Sauer-Danfoss § | 2,100 | 37 |
| Sports Resorts International *§ | 4,000 | 3 |
| Standard Motor Products | 1,900 | 25 |
| Superior Industries International § | 1,500 | 36 |
| TRW * | 4,100 | 100 |
| Zapata Corporation * | 3,200 | 20 |
| | | 950 |
| Automobiles 0.1% | | |
| Coachmen Industries | 1,800 | 23 |
| Fleetwood *§ | 3,100 | 31 |
| Monaco Coach § | 1,500 | 26 |
| National RV Holdings * | 1,600 | 13 |
| Thor Industries | 2,800 | 88 |
| Winnebago § | 1,500 | 49 |
| | | 230 |
| Distributors 0.1% | | |
| ACR Group * | 1,400 | 4 |
| Aristotle * | 900 | 6 |
| Building Material Holding | 900 | 62 |
| Design Within Reach *§ | 800 | 15 |
| Educational Development § | 800 | 9 |
| Handleman | 1,900 | 31 |
| Prestige Brands * | 2,500 | 49 |
| Source Information Management *§ | 2,400 | 30 |
| Transnet * | 2,200 | 3 |
| | | 209 |
| Diversified Consumer Services 1.0% | | |
| Bright Horizons Family Solutions * | 1,200 | 49 |
| Career Education * | 4,900 | 179 |
| Carriage Services *§ | 1,600 | 10 |
| Corinthian Colleges *§ | 3,800 | 49 |
| Devry * | 3,200 | 64 |
| Education Management * | 3,100 | 105 |
| EVCI Career Colleges * | 2,300 | 15 |
| Greg Manning Auctions *§ | 2,300 | 27 |
| ITT Educational Services * | 1,900 | 102 |
| Jackson Hewitt Tax Service § | 7,000 | 165 |
| Laureate * | 1,834 | 88 |
| Matthews International, Class A | 1,500 | 58 |
| Prepaid Legal Services § | 1,100 | 49 |
| Regis | 2,200 | 86 |
| Service Corp. International | 14,300 | 115 |
| ServiceMaster | 13,650 | 183 |
| Sotheby's, Class A * | 2,700 | 37 |
| Stewart Enterprises, Class A | 4,000 | 26 |
| Strayer Education | 650 | 56 |
| The Princeton Review *§ | 2,800 | 16 |
| Universal Technical Institute *§ | 1,400 | 46 |
| Weight Watchers *§ | 5,200 | 268 |
| | | 1,793 |
| Hotels, Restaurants & Leisure 3.2% | | |
| Alliance Gaming *§ | 3,000 | 42 |
| Ameristar Casinos | 2,000 | 52 |
| Applebee's | 3,775 | 100 |
| Archon Corporation *§ | 1,100 | 31 |
| Argosy Gaming * | 1,600 | 75 |
| Aztar * | 2,100 | 72 |
| Bally Total Fitness Holdings *§ | 1,500 | 5 |
| Bob Evans Farms | 1,500 | 35 |
| Bowl America, Class A | 300 | 4 |
| Boyd Gaming | 3,900 | 199 |
| Brinker * | 4,350 | 174 |
| BUCA * | 1,100 | 6 |
| California Pizza Kitchen * | 1,500 | 41 |
| CEC Entertainment * | 1,650 | 69 |
| Cedar Fair § | 2,000 | 64 |
| Choice Hotels International | 1,700 | 112 |
| Churchill Downs § | 700 | 30 |
| CKR Restaurants § | 2,850 | 40 |
| Cracker Barrel § | 2,400 | 93 |
| Dave & Buster's *§ | 1,200 | 22 |
| Diamondhead Casino * | 10,500 | 6 |
| Domino's Pizza | 3,200 | 71 |
| Dover Downs Gaming and Entertainment § | 388 | 5 |
| Dover Motorsports § | 4,000 | 24 |
| Empire Resorts *§ | 1,400 | 6 |
| Famous Dave's of America * | 2,600 | 26 |
| Frisch's Restaurants | 800 | 20 |
| Gaming Partners International *§ | 600 | 11 |
| Gaylord Entertainment * | 1,700 | 79 |
| Golf Trust of America, REIT * | 1,900 | 3 |
| Great Wolf Resorts *§ | 2,000 | 41 |
| GTECH | 5,400 | 158 |
| Harrah's Entertainment | 2,985 | 215 |
| IHOP § | 900 | 39 |
| International Speedway, Class A | 2,100 | 118 |
| Isle of Capris Casinos *§ | 1,700 | 45 |
| Jack In The Box * | 1,500 | 57 |
| John Q Hammons Hotels * | 300 | 7 |
| Krispy Kreme *§ | 2,400 | 17 |
| La Quinta Properties * | 9,300 | 87 |
| Landry's Seafood Restaurant § | 1,500 | 45 |
| Las Vegas Sands *§ | 15,600 | 558 |
| Life Time Fitness * | 1,100 | 36 |
| Lone Star Steakhouse & Saloon | 1,300 | 40 |
| Marcus | 1,500 | 32 |
| MGM Mirage * | 12,592 | 498 |
| Mikohn Gaming *§ | 1,200 | 18 |
| MTR Gaming Group * | 2,800 | 33 |
| Multimedia Games *§ | 1,500 | 16 |
| O'Charley's * | 1,300 | 23 |
| Outback Steakhouse | 3,400 | 154 |
| Panera Bread, Class A *§ | 1,500 | 93 |
| Papa John's International *§ | 1,100 | 44 |
| Penn National Gaming * | 3,600 | 131 |
| PF Chang's China Bistro *§ | 1,300 | 77 |
| Pinnacle Entertainment * | 2,300 | 45 |
| Rare Hospitality International * | 1,650 | 50 |
| Red Robin Gourmet Burgers *§ | 700 | 43 |
| Royal Caribbean Cruises § | 8,610 | 416 |
| Ruby Tuesday § | 2,800 | 73 |
| Ryan's Restaurant Group * | 1,700 | 24 |
| Scientific Games, Class A * | 3,000 | 81 |
| Shuffle Master *§ | 2,248 | 63 |
| Six Flags *§ | 5,400 | 25 |
| Sonic * | 2,562 | 78 |
| Speedway Motorsports | 1,800 | 66 |
| Station Casinos | 2,950 | 196 |
| Steak 'N Shake * | 2,000 | 37 |
| Texas Roadhouse, Class A *§ | 2,000 | 69 |
| The Cheesecake Factory * | 3,475 | 121 |
| Triarc, Class B § | 3,300 | 49 |
| Vail Resorts * | 1,500 | 42 |
| WMS Industries *§ | 1,300 | 44 |
| Wyndham International, Class A * | 9,400 | 10 |
| Wynn Resorts *§ | 4,500 | 213 |
| | | 5,844 |
| Household Durables 2.1% | | |
| American Greetings, Class A | 3,000 | 80 |
| Applica * | 1,300 | 4 |
| Beazer Homes § | 1,700 | 97 |
| Blyth Industries | 2,000 | 56 |
| Brillian Corp. *§ | 237 | 1 |
| Brookfield Homes § | 1,200 | 55 |
| Champion Enterprises * | 4,800 | 48 |
| D. R. Horton | 9,317 | 350 |
| Department 56 * | 1,400 | 14 |
| Emerson Radio Corporation *§ | 4,200 | 12 |
| Enesco Group *§ | 1,800 | 5 |
| Ethan Allen Interiors § | 1,500 | 50 |
| Flexsteel Industries | 900 | 13 |
| Foamex International *§ | 1,700 | 2 |
| Furniture Brands International § | 2,600 | 56 |
| Harman International | 2,740 | 223 |
| Helen of Troy Limited * | 900 | 23 |
| Hovnanian Enterprises * | 2,740 | 179 |
| Jarden *§ | 1,250 | 67 |
| Kimball International, Class B § | 2,600 | 34 |
| Knape & Vogt Manufacturing | 1,400 | 17 |
| La-Z-Boy § | 2,600 | 38 |
| Lennar, Class A | 6,728 | 427 |
| Levitt, Class A | 1,475 | 44 |
| Libbey | 1,200 | 19 |
| MDC Holdings | 1,955 | 161 |
| Meritage * | 1,400 | 111 |
| Mohawk Industries * | 3,054 | 252 |
| NVR * | 280 | 227 |
| Oneida *§ | 500 | 1 |
| Palm Harbor Homes *§ | 1,800 | 34 |
| Rockford Corporation * | 2,600 | 10 |
| Russ Berrie | 1,500 | 19 |
| Ryland Group | 2,260 | 171 |
| Skyline | 600 | 24 |
| Standard Pacific | 1,500 | 132 |
| Stanley Furniture | 1,200 | 30 |
| Technical Olympic USA § | 2,687 | 65 |
| Tempur-Pedic *§ | 4,100 | 91 |
| Toll Brothers *§ | 3,400 | 345 |
| Tupperware § | 2,400 | 56 |
| Universal Electronics * | 1,400 | 23 |
| WCI Communities *§ | 2,100 | 67 |
| Yankee Candle Company | 2,200 | 71 |
| | | 3,804 |
| Internet & Catalog Retail 0.6% | | |
| 1-800-Flowers.com * | 3,700 | 26 |
| Alloy Online *§ | 3,200 | 16 |
| Amazon.com *§ | 18,100 | 599 |
| Audible *§ | 1,700 | 30 |
| Blue Nile *§ | 1,400 | 46 |
| Bluefly *§ | 700 | 1 |
| Celebrate Express * | 500 | 7 |
| Coldwater Creek * | 2,268 | 56 |
| Drugstore.com *§ | 5,500 | 23 |
| Ecost *§ | 965 | 4 |
| Global Sports *§ | 3,700 | 62 |
| Hollywood Media *§ | 2,500 | 11 |
| Insight Enterprises * | 1,900 | 38 |
| J. Jill Group *§ | 1,150 | 16 |
| Mediabay *§ | 3,800 | 2 |
| Netflix *§ | 2,900 | 48 |
| Overstock.com *§ | 1,100 | 39 |
| PC Mall *§ | 800 | 4 |
| priceline.com *§ | 2,033 | 47 |
| Sportsman's Guide * | 300 | 6 |
| ValueVision International * | 2,200 | 26 |
| | | 1,107 |
| Leisure Equipment & Products 0.4% | | |
| Action Performance § | 2,300 | 20 |
| Arctic Cat | 1,057 | 22 |
| Callaway Golf | 3,800 | 59 |
| JAKKS Pacific *§ | 1,600 | 31 |
| Johnson Outdoors, Class A * | 700 | 13 |
| K2 * | 1,800 | 23 |
| Leapfrog Enterprises *§ | 2,700 | 30 |
| MarineMax * | 1,000 | 31 |
| Marvel Enterprises *§ | 5,099 | 100 |
| Nature Vision *§ | 600 | 3 |
| Nautilus Group § | 1,737 | 49 |
| Oakley | 3,400 | 58 |
| Polaris Industries § | 2,000 | 108 |
| RC2 Corporation * | 900 | 34 |
| SCP Pool | 1,812 | 63 |
| Steinway Musical Instruments * | 600 | 18 |
| The Boyds Collection *§ | 4,000 | 7 |
| | | 669 |
| Media 5.0% | | |
| 4Kids Entertainment *§ | 1,400 | 28 |
| Acme Communications * | 1,700 | 7 |
| ADVO | 1,550 | 49 |
| Arbitron | 1,600 | 69 |
| Beasley Broadcast Group, Class A *§ | 1,200 | 17 |
| Belo Corporation, Class A | 5,600 | 134 |
| Cablevision Systems, Class A * | 13,360 | 430 |
| Cadmus Communications | 1,500 | 27 |
| Catalina Marketing § | 2,550 | 65 |
| Charter Communications, Class A *§ | 13,400 | 16 |
| Citadel Broadcasting * | 5,500 | 63 |
| Cox Radio, Class A * | 1,800 | 28 |
| Crown Media, Class A *§ | 4,500 | 42 |
| Cumulus Media, Class A * | 2,405 | 28 |
| Daily Journal * | 600 | 23 |
| Dex Media | 6,200 | 151 |
| Digital Generation Systems * | 5,200 | 5 |
| Directv * | 61,879 | 959 |
| Dreamworks Animation, Class A * | 5,000 | 131 |
| EchoStar Communications, Class A | 9,900 | 299 |
| EMAK Worldwide * | 800 | 9 |
| Emmis Communications *§ | 2,600 | 46 |
| Entercom Communications * | 2,500 | 83 |
| Entravision Communications, Class A * | 5,244 | 41 |
| Fisher Communications *§ | 500 | 24 |
| Gemstar TV Guide * | 19,800 | 71 |
| Getty Images * | 2,600 | 193 |
| Harris Interactive * | 4,300 | 21 |
| Harte-Hanks | 3,550 | 106 |
| Hearst-Argyle Television § | 3,191 | 78 |
| Hollinger International § | 4,600 | 46 |
| Insight Communications *§ | 2,900 | 32 |
| Insignia Systems *§ | 700 | 1 |
| Interactive Data | 4,000 | 83 |
| John Wiley & Sons | 2,500 | 99 |
| Journal Communications, Class A | 3,600 | 60 |
| Journal Register * | 2,600 | 46 |
| Lamar Advertising * | 4,500 | 192 |
| Lee Enterprises | 2,100 | 84 |
| Liberty § | 800 | 29 |
| Liberty Global * | 10,880 | 508 |
| Liberty Media, Class A * | 130,875 | 1,334 |
| LIN TV, Class A * | 2,000 | 28 |
| LodgeNet Entertainment * | 1,700 | 28 |
| Martha Stewart Living, Class A *§ | 2,400 | 70 |
| McClatchy | 1,900 | 124 |
| Media General, Class A | 1,000 | 65 |
| Mediacom Communications *§ | 5,500 | 38 |
| Morningstar *§ | 1,700 | 48 |
| Navarre *§ | 2,600 | 21 |
| Nexstar Broadcasting *§ | 1,100 | 7 |
| Paxson Communications * | 6,000 | 4 |
| Penton Media * | 1,700 | 1 |
| Pixar * | 5,200 | 260 |
| Playboy Enterprises, Class B * | 2,500 | 32 |
| Primedia *§ | 10,736 | 43 |
| ProQuest * | 1,300 | 43 |
| R.H. Donnelley * | 1,600 | 99 |
| Radio One *§ | 4,400 | 56 |
| Reader's Digest | 3,900 | 64 |
| Regal Entertainment Group, Class A § | 6,400 | 121 |
| Regent Communications * | 4,000 | 23 |
| Rentrak * | 1,000 | 9 |
| Saga Communications * | 1,150 | 16 |
| Salem Communications, Class A *§ | 1,400 | 28 |
| Scholastic * | 1,600 | 62 |
| Scripps, Class A | 7,340 | 358 |
| Sinclair Broadcasting, Class A | 2,700 | 25 |
| Sirius Satellite Radio *§ | 55,800 | 362 |
| Spanish Broadcasting, Class A * | 2,500 | 25 |
| TiVo *§ | 3,900 | 26 |
| Valassis Communications * | 2,700 | 100 |
| Value Line | 800 | 31 |
| Warner Music Group * | 6,700 | 109 |
| Washington Post, Class B | 450 | 376 |
| Westwood One | 4,100 | 84 |
| World Wrestling | 3,500 | 40 |
| WPT Enterprises *§ | 1,100 | 21 |
| XM Satellite Radio Holdings, Class A *§ | 9,500 | 320 |
| Young Broadcasting *§ | 1,400 | 6 |
| | | 8,930 |
| Multiline Retail 0.4% | | |
| 99 Cents Only Stores *§ | 3,465 | 44 |
| Bon-Ton Stores | 1,200 | 23 |
| Dollar Tree Stores * | 5,225 | 125 |
| Fred's § | 1,525 | 25 |
| Neiman Marcus, Class A | 2,400 | 233 |
| Saks * | 5,675 | 108 |
| Shopko Stores * | 2,000 | 49 |
| Tuesday Morning § | 1,600 | 50 |
| | | 657 |
| Specialty Retail 3.4% | | |
| Aaron Rents | | |
| Class A | 1,575 | 36 |
| Class B | 2,175 | 54 |
| Abercrombie & Fitch | 3,900 | 268 |
| AC Moore Arts & Crafts * | 1,400 | 44 |
| Advance Auto Parts * | 3,512 | 227 |
| Aeropostale * | 2,550 | 86 |
| American Eagle Outfitters | 6,700 | 205 |
| AnnTaylor Stores * | 3,000 | 73 |
| Asbury Automotive Group * | 2,200 | 34 |
| Barnes & Noble * | 3,000 | 116 |
| bebe stores § | 3,375 | 89 |
| Big 5 Sporting Goods | 1,500 | 43 |
| Blockbuster, Class A § | 7,700 | 70 |
| Borders Group | 3,000 | 76 |
| Buckle | 1,200 | 53 |
| Build-A-Bear Workshop *§ | 600 | 14 |
| Burlington Coat Factory | 2,100 | 90 |
| Cabela's, Class A *§ | 2,700 | 58 |
| CarMax * | 4,600 | 123 |
| Cato Corporation, Class A | 2,250 | 46 |
| Charlotte Russe Holding *§ | 1,800 | 22 |
| Charming Shoppes * | 5,200 | 49 |
| Chico's * | 7,800 | 267 |
| Christopher & Banks | 1,812 | 33 |
| Claire's Stores | 3,800 | 91 |
| Cost Plus * | 800 | 20 |
| CSK Auto * | 2,100 | 35 |
| Dick's Sporting Goods *§ | 1,600 | 62 |
| Dress Barn * | 2,000 | 45 |
| E Com *§ | 2,500 | 33 |
| Electronics Boutique Holdings *§ | 1,100 | 70 |
| Finlay Enterprises *§ | 1,100 | 14 |
| Foot Locker | 6,600 | 180 |
| Franklin Covey * | 2,900 | 22 |
| GameStop, Class B * | 2,674 | 80 |
| Genesco * | 1,400 | 52 |
| Group One Automotive * | 1,000 | 24 |
| Guess ? *§ | 2,600 | 43 |
| Guitar Center * | 1,100 | 64 |
| Gymboree * | 600 | 8 |
| Hancock Fabrics § | 1,100 | 7 |
| Haverty Furniture | 1,700 | 25 |
| Hibbett Sporting Goods * | 1,512 | 57 |
| Hot Topic * | 2,450 | 47 |
| Linens 'n Things * | 2,100 | 50 |
| Lithia Motors, Class A § | 1,400 | 40 |
| Men's Wearhouse * | 2,400 | 83 |
| Michaels Stores | 6,100 | 252 |
| Monro Muffler Brake * | 1,000 | 29 |
| Mothers Work *§ | 700 | 9 |
| Movie Gallery | 1,000 | 26 |
| New York & Company * | 2,500 | 53 |
| O'Reilly Automotive * | 4,800 | 143 |
| Pacific Sunwear * | 3,525 | 81 |
| Pantry * | 900 | 35 |
| Party City *§ | 1,900 | 23 |
| Payless Shoesource * | 2,715 | 52 |
| Pep Boys § | 2,400 | 32 |
| Petco * | 2,900 | 85 |
| PETsMART | 6,400 | 194 |
| Pier 1 Imports | 4,000 | 57 |
| Pomeroy Computer Resources *§ | 1,400 | 14 |
| Rent Way *§ | 2,000 | 20 |
| Rent-A-Center * | 3,150 | 73 |
| Restoration Hardware * | 4,100 | 34 |
| Rex Stores * | 750 | 11 |
| Ross Stores | 6,600 | 191 |
| Select Comfort *§ | 2,000 | 43 |
| Sharper Image *§ | 1,600 | 20 |
| Shoe Carnival * | 900 | 20 |
| Sonic Automotive | 1,600 | 34 |
| Stage Stores * | 1,000 | 44 |
| Stein Mart | 2,400 | 53 |
| Syms § | 1,400 | 21 |
| Talbots | 2,400 | 78 |
| TBC Corp. * | 1,100 | 30 |
| The Children's Place *§ | 1,100 | 51 |
| The Finish Line, Class A | 2,200 | 42 |
| The Sports Authority *§ | 1,396 | 44 |
| Too * | 1,600 | 37 |
| Trans World Entertainment * | 4,200 | 50 |
| TSC *§ | 1,800 | 88 |
| Tweeter Home Entertainment Group *§ | 2,600 | 6 |
| Ultimate Electronics * | 1,000 | 0 |
| United Auto Group | 1,800 | 54 |
| United Retail Group * | 1,000 | 8 |
| Urban Outfitters * | 3,700 | 210 |
| West Marine *§ | 1,400 | 25 |
| Wet Seal, Class A *§ | 1,875 | 13 |
| Whitehall Jewellers *§ | 1,200 | 8 |
| Williams-Sonoma * | 5,300 | 210 |
| Wilsons Leather *§ | 1,900 | 13 |
| Winmark * | 900 | 18 |
| Zale * | 2,400 | 76 |
| | | 6,038 |
| Textiles, Apparel, & Luxury Goods 0.9% | | |
| Brown Shoe | 1,100 | 43 |
| Carters * | 1,300 | 76 |
| Charles & Colvard § | 1,575 | 39 |
| Cherokee | 900 | 31 |
| Columbia Sportswear *§ | 1,850 | 91 |
| Culp *§ | 1,600 | 7 |
| Cutter & Buck | 1,500 | 19 |
| Forward Industries *§ | 1,900 | 30 |
| Fossil * | 3,387 | 77 |
| Giant * | 6 | 3 |
| Haggar | 1,000 | 20 |
| Iconix Brand Group *§ | 1,300 | 9 |
| K-Swiss, Class A | 2,000 | 65 |
| Kellwood § | 1,400 | 38 |
| Kenneth Cole Productions | 1,400 | 44 |
| Lazare Kaplan International * | 1,600 | 16 |
| Madden Steven * | 1,600 | 28 |
| Mossimo *§ | 3,300 | 15 |
| Movado Group | 2,000 | 38 |
| Movie Star * | 2,500 | 2 |
| Oshkosh B'Gosh, Class A | 1,100 | 29 |
| Phillips-Van Heusen | 1,900 | 62 |
| Polo Ralph Lauren | 4,300 | 185 |
| Quaker Fabric § | 1,900 | 8 |
| Quiksilver * | 6,200 | 99 |
| Russell | 1,400 | 29 |
| Saucony, Class B | 1,200 | 27 |
| Stride Rite | 2,800 | 39 |
| Superior Uniform Group § | 1,200 | 17 |
| Tandy Brands § | 1,400 | 15 |
| Tarrant Apparel *§ | 2,400 | 7 |
| Timberland, Class A * | 3,200 | 124 |
| Unifi * | 6,200 | 26 |
| UniFirst | 900 | 36 |
| Warnaco Group * | 2,100 | 49 |
| Weyco Group | 1,000 | 20 |
| Wolverine World Wide | 2,700 | 65 |
| | | 1,528 |
| Total Consumer Discretionary | | 31,759 |
| |
| CONSUMER STAPLES 4.7% | | |
| Beverages 0.3% | | |
| Coca-Cola Bottling | 500 | 25 |
| Constellation Brands, Class A * | 10,000 | 295 |
| Hansen Natural *§ | 200 | 17 |
| Midwest Grain Products § | 1,800 | 15 |
| National Beverage * | 1,900 | 15 |
| PepsiAmericas | 6,700 | 172 |
| Willamette Valley Vineyards *§ | 4,200 | 17 |
| | | 556 |
| Food & Staples Retailing 0.7% | | |
| 7-Eleven * | 5,100 | 154 |
| Arden Group, Class A § | 200 | 16 |
| BJ's Wholesale Club * | 3,100 | 101 |
| Casey's General Stores | 2,200 | 44 |
| Fresh Brands * | 800 | 5 |
| Great Atlantic & Pacific Tea *§ | 3,600 | 105 |
| Longs Drug Stores | 1,600 | 69 |
| Marsh Supermarkets § | 1,500 | 21 |
| Nash Finch § | 900 | 33 |
| Pathmark Stores * | 1,100 | 10 |
| Performance Food Group * | 1,900 | 57 |
| PriceSmart *§ | 1,500 | 13 |
| Rite Aid *§ | 23,300 | 97 |
| Ruddick | 2,200 | 56 |
| Smart & Final *§ | 1,800 | 22 |
| United Natural Foods * | 1,800 | 55 |
| Weis Markets § | 1,000 | 39 |
| Whole Foods Market | 2,700 | 319 |
| Wild Oats Markets *§ | 2,000 | 23 |
| | | 1,239 |
| Food Products 2.9% | | |
| Alico § | 600 | 31 |
| American Italian Pasta, Class A § | 1,200 | 25 |
| Bridgford Foods *§ | 1,000 | 8 |
| Bunge Limited § | 4,800 | 304 |
| Chiquita § | 1,700 | 47 |
| Corn Products International | 3,300 | 78 |
| Cuisine Solutions * | 4,500 | 27 |
| Dean Foods * | 7,158 | 252 |
| Del Monte Foods * | 9,200 | 99 |
| Delta Pine & Land | 1,900 | 48 |
| Dreyer's Grand Ice Cream § | 4,000 | 326 |
| Farmer Bros. § | 1,200 | 27 |
| Flowers Foods | 1,710 | 60 |
| Fresh Del Monte Produce § | 2,700 | 73 |
| Gold Kist *§ | 1,700 | 37 |
| Green Mountain Coffee *§ | 800 | 27 |
| Hain Celestial Group * | 1,900 | 37 |
| Hormel Foods | 5,700 | 167 |
| J & J Snack Foods | 700 | 37 |
| J.M. Smucker § | 2,436 | 114 |
| Kraft Foods, Class A | 76,400 | 2,430 |
| Lancaster Colony | 1,400 | 60 |
| Lance | 1,100 | 19 |
| Lifeway Foods *§ | 1,800 | 22 |
| Maui Land & Pineapple *§ | 600 | 23 |
| Peet's Coffee & Tea *§ | 1,100 | 36 |
| Pilgrim's Pride § | 3,000 | 102 |
| Ralcorp Holdings | 1,000 | 41 |
| Rocky Mountain Chocolate Factory § | 3,390 | 75 |
| Sanderson Farms § | 1,050 | 48 |
| Seaboard | 50 | 83 |
| Smithfield Foods * | 5,200 | 142 |
| Tootsie Roll Industries § | 2,052 | 60 |
| Treehouse Foods * | 1,431 | 41 |
| Tyson Foods, Class A | 15,119 | 269 |
| | | 5,275 |
| Household Products 0.3% | | |
| Central Garden & Pet * | 1,200 | 59 |
| Church & Dwight | 2,950 | 107 |
| Energizer * | 3,400 | 211 |
| Katy Industries * | 1,700 | 5 |
| Oil-Dri | 1,800 | 33 |
| Spectrum Brands * | 2,200 | 73 |
| | | 488 |
| Personal Products 0.4% | | |
| Chattem * | 1,300 | 54 |
| Elizabeth Arden *§ | 1,600 | 38 |
| Estee Lauder, Class A | 6,000 | 235 |
| Inter Parfums § | 1,400 | 27 |
| NBTY * | 3,100 | 80 |
| Nu Skin Asia Pacific, Class A | 2,900 | 68 |
| Playtex Products * | 4,400 | 47 |
| Reliv International § | 2,300 | 24 |
| Revlon, Class A *§ | 15,600 | 48 |
| | | 621 |
| Tobacco 0.1% | | |
| Alliance One International | 4,600 | 28 |
| Carolina Group | 3,100 | 103 |
| Star Scientific *§ | 3,400 | 15 |
| Universal Corporation | 1,100 | 48 |
| Vector Group § | 2,110 | 39 |
| | | 233 |
| Total Consumer Staples | | 8,412 |
| |
| ENERGY 6.6% | | |
| Energy Equipment & Services 2.3% | | |
| Atwood Oceanics * | 700 | 43 |
| Cal Dive International * | 1,700 | 89 |
| Carbo Ceramics | 700 | 55 |
| Cooper Cameron * | 2,400 | 149 |
| Dawson Geophysical * | 200 | 4 |
| Diamond Offshore Drilling § | 5,800 | 310 |
| Dril-Quip * | 1,400 | 41 |
| ENSCO International | 7,000 | 250 |
| FMC Technologies * | 3,000 | 96 |
| Global Industries * | 4,200 | 36 |
| GlobalSantaFe | 10,359 | 423 |
| Grant Prideco * | 5,390 | 143 |
| Grey Wolf *§ | 8,200 | 61 |
| Gulf Island Fabrication § | 1,100 | 22 |
| Gulfmark Offshore *§ | 1,600 | 44 |
| Hanover Compressor *§ | 4,200 | 48 |
| Helmerich & Payne | 2,300 | 108 |
| Hydril * | 1,000 | 54 |
| Input/Output *§ | 3,800 | 24 |
| Lone Star Technologies * | 1,310 | 60 |
| Matrix Service *§ | 2,200 | 10 |
| Maverick Tube *§ | 1,900 | 57 |
| NATCO Group, Class A * | 1,900 | 25 |
| Newpark Resources * | 5,100 | 38 |
| NS Group *§ | 2,000 | 65 |
| Oceaneering International * | 1,300 | 50 |
| Offshore Logistics * | 1,100 | 36 |
| Oil States International * | 2,300 | 58 |
| Omni Energy Services *§ | 1,900 | 4 |
| Parker Drilling * | 6,500 | 46 |
| Patterson-UTI Energy | 7,800 | 217 |
| Petroleum Helicopters * | 300 | 7 |
| Pride International * | 6,000 | 154 |
| Seacor Holdings * | 900 | 58 |
| Smith International | 4,700 | 299 |
| Superior Energy * | 3,600 | 64 |
| TETRA Technologies * | 1,350 | 43 |
| Tidewater | 2,600 | 99 |
| Todco, Class A * | 3,100 | 80 |
| Unit * | 2,100 | 92 |
| Universal Compression Holdings * | 1,500 | 54 |
| Veritas DGC * | 1,700 | 47 |
| W-H Energy Services * | 1,400 | 35 |
| Weatherford International * | 5,890 | 341 |
| | | 4,039 |
| Oil, Gas & Consumable Fuels 4.3% | | |
| Adams Resources & Energy § | 2,300 | 46 |
| Alliance Resource Partners *§ | 800 | 59 |
| Alpha Natural Resources * | 2,800 | 67 |
| Arch Coal § | 2,600 | 142 |
| Berry Petroleum § | 1,000 | 53 |
| Bill Barrett *§ | 2,100 | 62 |
| BP Prudhoe Bay Royalty Trust § | 1,300 | 93 |
| Buckeye Partners, Equity Units *§ | 1,800 | 83 |
| Cabot Oil & Gas | 3,300 | 114 |
| Callon Petroleum *§ | 1,600 | 24 |
| Carrizo Oil & Gas *§ | 2,300 | 39 |
| Castle Energy | 1,400 | 17 |
| Chesapeake Energy | 14,000 | 319 |
| Cimarex Energy *§ | 3,783 | 147 |
| Comstock Resources * | 1,600 | 40 |
| CONSOL Energy | 4,400 | 236 |
| Copano Energy | 700 | 26 |
| Cross Timbers Royalty Trust § | 953 | 39 |
| Denbury Resources * | 2,000 | 79 |
| Edge Petroleum * | 2,000 | 31 |
| Encore Acquisition * | 1,100 | 45 |
| Energy Partners * | 1,800 | 47 |
| Enterprise Products Partners, Equity Units *§ | 16,600 | 445 |
| Forest Oil * | 2,500 | 105 |
| Foundation Coal Holdings § | 1,900 | 49 |
| Frontier Oil | 3,200 | 94 |
| General Maritime § | 1,700 | 72 |
| Georesources *§ | 3,100 | 40 |
| Giant Industries * | 1,900 | 68 |
| GMX Resources *§ | 2,300 | 33 |
| Harken Energy * | 8,500 | 4 |
| Houston Exploration * | 1,200 | 64 |
| Hugoton Royalty Trust § | 2,200 | 67 |
| Kaneb Services *§ | 900 | 39 |
| KCS Energy *§ | 4,300 | 75 |
| KFX *§ | 3,000 | 43 |
| Kinder Morgan Management | 2,715 | 125 |
| Magellan Midstream Partners § | 2,800 | 92 |
| Magellan Petroleum *§ | 5,100 | 12 |
| Maritrans § | 1,100 | 30 |
| Markwest Hydrocarbon | 2,585 | 60 |
| Massey | 3,700 | 140 |
| Meridian Resource * | 5,300 | 25 |
| Murphy Oil | 8,520 | 445 |
| Newfield Exploration * | 6,400 | 255 |
| Noble Energy | 3,800 | 287 |
| OMI § | 3,900 | 74 |
| Peabody Energy | 5,600 | 291 |
| Penn Virginia | 800 | 36 |
| Petrohawk Energy *§ | 1,850 | 20 |
| Petroleum Development *§ | 1,400 | 45 |
| Pioneer Natural Resources | 6,600 | 278 |
| Plains All American Pipeline *§ | 3,000 | 132 |
| Plains Exploration & Production * | 3,806 | 135 |
| Pogo Producing | 2,800 | 145 |
| Premcor | 4,100 | 304 |
| Pyr Energy *§ | 7,400 | 11 |
| Quicksilver Resources *§ | 2,800 | 179 |
| Range Resources | 3,700 | 99 |
| Remington Oil & Gas * | 1,700 | 61 |
| Southwestern Energy * | 3,000 | 141 |
| Spinnaker Exploration * | 1,500 | 53 |
| St. Mary Land Exploration | 5,300 | 154 |
| Stone Energy * | 1,300 | 64 |
| Swift Energy * | 1,900 | 68 |
| Syntroleum *§ | 4,900 | 50 |
| TC Pipelines * | 1,200 | 40 |
| Tel Offshore Trust § | 61 | 1 |
| Teppco Partners *§ | 3,000 | 124 |
| Tesoro Petroleum | 3,100 | 144 |
| TransMontaigne *§ | 3,600 | 38 |
| Ultra Petroleum * | 7,200 | 219 |
| USEC | 4,200 | 61 |
| Vintage Petroleum | 2,600 | 79 |
| W&T Offshore | 2,900 | 70 |
| Western Gas Resources | 3,200 | 112 |
| Westmoreland Coal *§ | 1,200 | 25 |
| Whiting Petroleum * | 800 | 29 |
| World Fuel Services | 1,600 | 37 |
| | | 7,796 |
| Total Energy | | 11,835 |
| |
| FINANCIALS 23.6% | | |
| Capital Markets 1.5% | | |
| A.G. Edwards | 3,800 | 172 |
| Aether Systems *§ | 5,700 | 19 |
| Affiliated Managers Group *§ | 1,500 | 103 |
| AmeriTrade * | 19,600 | 364 |
| Blackrock § | 900 | 72 |
| Calamos, Class A | 1,300 | 35 |
| Cohen & Steers § | 800 | 16 |
| Eaton Vance | 6,700 | 160 |
| Gabelli Asset Management § | 1,700 | 75 |
| GFI Group *§ | 1,200 | 43 |
| Greenhill § | 1,800 | 73 |
| International Assets *§ | 1,100 | 7 |
| Investment Technology Group * | 2,750 | 58 |
| Investors Financial Services | 3,300 | 125 |
| Jefferies Group | 2,900 | 110 |
| John Nuveen § | 4,200 | 158 |
| Knight Capital Group *§ | 4,600 | 35 |
| LaBranche & Co. *§ | 2,600 | 16 |
| Ladenburg Thalmann Financial Services * | 506 | 0 |
| Legg Mason | 4,600 | 479 |
| National Financial Partners | 1,700 | 67 |
| optionsXpress Holdings § | 2,700 | 41 |
| Piper Jaffray * | 1,000 | 30 |
| Raymond James Financial | 3,250 | 92 |
| Sanders Morris Harris Group § | 2,600 | 45 |
| SEI | 4,900 | 183 |
| Southwest Securities | 1,283 | 22 |
| Waddell & Reed Financial, Class A | 4,450 | 82 |
| Westwood Holdings Group | 620 | 11 |
| | | 2,693 |
| Commercial Banks 4.7% | | |
| 1st Source | 1,641 | 38 |
| Abigail Adams § | 220 | 4 |
| Alabama National Bancorp § | 800 | 52 |
| Amcore Financial | 1,600 | 48 |
| Amegy Bancorp | 3,100 | 69 |
| Arrow Financial § | 1,059 | 30 |
| Associated Banc Corp. | 5,654 | 190 |
| BanCorpSouth § | 3,625 | 86 |
| BancTrust Financial Group § | 1,200 | 23 |
| Bank of Hawaii | 2,600 | 132 |
| Banner § | 1,160 | 33 |
| Bay View Capital | 480 | 7 |
| BNCCORP * | 300 | 4 |
| BOK Financial | 2,936 | 135 |
| Boston Private Financial § | 1,459 | 37 |
| BWC Financial § | 1,127 | 29 |
| Camden National | 900 | 30 |
| Capital Corp. of the West § | 1,207 | 34 |
| Cathay Bancorp § | 2,674 | 90 |
| Center Bancorp § | 1,018 | 12 |
| Central Pacific Financial | 1,273 | 45 |
| Century Bancorp, Class A § | 600 | 18 |
| Chemical Financial | 1,116 | 37 |
| Chittenden | 2,312 | 63 |
| Citizens Banking § | 2,000 | 60 |
| City Holding Company § | 900 | 33 |
| City National | 2,400 | 172 |
| CoBiz § | 1,650 | 30 |
| Codorus VY Bancorp § | 441 | 8 |
| Colonial BancGroup | 6,200 | 137 |
| Commerce Bancorp § | 7,300 | 221 |
| Commerce Bancshares § | 3,111 | 157 |
| Community Banks § | 1,044 | 27 |
| Community Bankshares of Indiana | 1,210 | 28 |
| Cullen/Frost Bankers | 2,200 | 105 |
| CVB Financial § | 3,345 | 66 |
| East West Bancorp | 2,600 | 87 |
| Farmers Capital Bank § | 700 | 24 |
| First Charter § | 1,700 | 37 |
| First Citizens Bancshares | 450 | 65 |
| First Commonwealth Financial § | 3,600 | 49 |
| First Community Bancorp | 1,000 | 48 |
| First Financial Bancorp § | 2,402 | 45 |
| First Financial Bankshares § | 1,216 | 41 |
| First Indiana | 1,408 | 42 |
| First M & F Corporation § | 700 | 24 |
| First Merchants § | 1,283 | 32 |
| First Midwest Bancorp | 2,056 | 72 |
| First of Long Island | 450 | 19 |
| First Republic Bank | 1,475 | 52 |
| First United | 800 | 16 |
| FirstBank Puerto Rico § | 2,200 | 88 |
| FirstMerit | 4,100 | 107 |
| FNB § | 1,836 | 36 |
| FNB Corp. of North Carolina § | 700 | 14 |
| Frontier Financial § | 1,800 | 45 |
| Fulton Financial § | 7,210 | 130 |
| German American Bancorp § | 1,589 | 22 |
| Glacier Bancorp | 2,015 | 53 |
| Gold Banc | 2,000 | 29 |
| Greater Bay Bancorp § | 2,406 | 63 |
| Greater Community Bancorp § | 1,050 | 17 |
| Hancock Holding | 1,500 | 52 |
| Harleysville National § | 1,841 | 43 |
| Hibernia, Class A | 7,000 | 232 |
| Hudson United Bancorp | 2,056 | 74 |
| IBERIABANK § | 600 | 37 |
| Independent Bank | 1,100 | 31 |
| Integra Bank § | 1,300 | 29 |
| Interchange Financial Services § | 1,800 | 33 |
| International Bancshares | 2,597 | 73 |
| Irwin Financial § | 1,500 | 33 |
| Main Street Banks § | 1,400 | 36 |
| MB Financial | 1,400 | 56 |
| Mercantile Bankshares | 3,500 | 180 |
| Mid-State Bancshares | 1,100 | 31 |
| Midsouth Bancorp § | 1,237 | 30 |
| Midwest Banc Holdings § | 1,400 | 27 |
| MidWestOne Financial | 1,000 | 19 |
| National Penn Bancshares § | 2,183 | 55 |
| NBT Bancorp | 2,080 | 49 |
| Northern States Financial | 700 | 19 |
| Northrim Bank | 900 | 21 |
| Old National Bancorp § | 3,322 | 71 |
| Omega Financial § | 1,000 | 31 |
| Oriental Financial Group § | 1,439 | 22 |
| Pacific Capital Bancorp | 2,488 | 92 |
| Park National § | 756 | 84 |
| Popular | 12,200 | 307 |
| PrivateBancorp § | 1,400 | 50 |
| Prosperity Bancshares | 1,500 | 43 |
| Provident Bankshares | 1,551 | 50 |
| Renasant § | 900 | 28 |
| Republic Bancorp | 3,955 | 59 |
| S&T Bancorp § | 1,300 | 47 |
| Sandy Spring Bancorp § | 1,100 | 39 |
| Santander Bancorp § | 1,875 | 47 |
| Signature Bank * | 1,200 | 29 |
| Sky Financial § | 4,714 | 133 |
| South Financial Group | 3,054 | 87 |
| Southwest Bancorp of Oklahoma | 1,300 | 27 |
| State Bancorp § | 1,126 | 25 |
| Sterling Bancshares | 2,850 | 44 |
| Sterling Financial § | 1,991 | 42 |
| Suffolk Bancorp § | 1,000 | 32 |
| Summit Bancshares § | 1,400 | 24 |
| Susquehanna Bancshares | 2,050 | 50 |
| SVB Financial Group *§ | 1,500 | 72 |
| SY Bancorp § | 1,100 | 25 |
| TCF Financial | 6,400 | 166 |
| TD Banknorth | 8,090 | 241 |
| Texas Capital Bancshares *§ | 1,800 | 36 |
| Texas Regional Bancshares, Class A | 2,491 | 76 |
| The Savannah Bancorp § | 925 | 28 |
| Trustco Bank § | 3,700 | 48 |
| Trustmark § | 2,300 | 67 |
| U.S.B. Holding Company § | 1,535 | 36 |
| UCBH Holdings § | 4,400 | 71 |
| UMB Financial | 756 | 43 |
| Umpqua Holdings Corporation § | 1,900 | 45 |
| Union Bankshares | 753 | 29 |
| UnionBancal | 6,700 | 448 |
| United Bankshares | 2,400 | 85 |
| United Community Banks § | 1,950 | 51 |
| Unizan Financial | 1,076 | 29 |
| Valley National Bancorp | 4,961 | 116 |
| WesBanco § | 1,300 | 39 |
| West Coast Bancorp § | 1,220 | 30 |
| WestAmerica | 1,546 | 82 |
| Westbank | 882 | 14 |
| Westcorp | 2,600 | 136 |
| Whitney Holding | 2,400 | 78 |
| Wilmington Trust | 2,800 | 101 |
| Wintrust Financial | 1,200 | 63 |
| | | 8,425 |
| Consumer Finance 0.6% | | |
| Advance America Cash Advance Centers § | 4,400 | 70 |
| Advanta, Class A | 1,466 | 38 |
| AmeriCredit * | 7,300 | 186 |
| Asta Funding § | 1,200 | 33 |
| Cash America Investments | 1,600 | 32 |
| CompuCredit *§ | 2,400 | 82 |
| First Cash * | 1,800 | 39 |
| First Marblehead *§ | 2,900 | 102 |
| Metris Companies *§ | 4,050 | 59 |
| Moneygram International | 3,900 | 75 |
| Nelnet, Class A * | 2,600 | 87 |
| QC Holdings *§ | 300 | 4 |
| Student Loan | 1,020 | 224 |
| WFS Financial | 1,800 | 91 |
| World Acceptance * | 1,500 | 45 |
| | | 1,167 |
| Diversified Financial Services 0.7% | | |
| Alliance Capital | 3,600 | 168 |
| California First National Bancorp § | 500 | 6 |
| CapitalSource *§ | 4,900 | 96 |
| Chicago Mercantile Exchange Holdings | 1,500 | 443 |
| Encore Capital *§ | 2,100 | 36 |
| eSpeed, Class A *§ | 2,200 | 20 |
| Financial Federal | 700 | 27 |
| Instinet Group * | 14,400 | 75 |
| International Securities Exchange *§ | 1,600 | 40 |
| Leucadia National § | 6,754 | 261 |
| Nasdaq Stock Market *§ | 3,500 | 66 |
| Transnational Financial Network * | 3,400 | 2 |
| | | 1,240�� |
| Insurance 6.9% | | |
| 21st Century Insurance Group | 3,400 | 50 |
| Alfa § | 3,700 | 54 |
| Allmerica Financial * | 2,300 | 85 |
| American Financial Group | 3,100 | 104 |
| American National Insurance | 1,050 | 120 |
| AmerUs Life § | 1,900 | 91 |
| Arch Capital Group * | 1,800 | 81 |
| Argonaut Group *§ | 1,900 | 44 |
| Arthur J. Gallagher § | 4,600 | 125 |
| Assurant | 5,900 | 213 |
| Baldwin & Lyons | 1,175 | 28 |
| BancInsurance *§ | 2,310 | 12 |
| Berkshire Hathaway, Class A * | 70 | 5,845 |
| Bristol West Holdings | 2,200 | 40 |
| Brown & Brown | 2,700 | 121 |
| Citizens § | 4,050 | 25 |
| Clark § | 1,300 | 19 |
| CNA Financial *§ | 11,500 | 327 |
| CNA Surety * | 2,400 | 36 |
| Commerce Group | 1,300 | 81 |
| Conseco * | 6,100 | 133 |
| Danielson *§ | 9,500 | 116 |
| Delphi Financial, Class A | 1,606 | 71 |
| Erie Indemnity, Class A § | 3,000 | 163 |
| FBL Financial Group, Class A § | 1,732 | 48 |
| Fidelity National Financial | 7,850 | 280 |
| Financial Industries Corporation *§ | 800 | 6 |
| First American Financial | 4,100 | 165 |
| FPIC Insurance Group *§ | 900 | 26 |
| Genworth Financial, Class A | 21,300 | 644 |
| Great American Financial Resources § | 3,000 | 59 |
| Harleysville Group | 1,800 | 38 |
| HCC Insurance Holdings | 2,500 | 95 |
| Hilb Rogal and Hobbs § | 1,500 | 52 |
| Horace Mann Educators | 2,400 | 45 |
| Infinity Property & Casualty | 1,300 | 45 |
| Kansas City Life Insurance § | 800 | 38 |
| LandAmerica Financial Group | 800 | 48 |
| Markel *§ | 480 | 163 |
| Merchants Group | 600 | 15 |
| Mercury General | 2,600 | 142 |
| Midland | 1,200 | 42 |
| Nationwide Financial Services, Class A | 2,700 | 102 |
| Navigators Group * | 1,000 | 35 |
| Odyssey Re Holdings § | 3,000 | 74 |
| Ohio Casualty | 3,400 | 82 |
| Old Republic International | 7,525 | 190 |
| Philadelphia Consolidated * | 1,000 | 85 |
| Phoenix Companies § | 4,000 | 48 |
| PMA Capital, Class A *§ | 3,200 | 28 |
| Presidential Life § | 2,200 | 38 |
| ProAssurance * | 1,320 | 55 |
| Protective Life | 3,000 | 127 |
| Reinsurance Group of America | 2,850 | 133 |
| RLI | 1,100 | 49 |
| Selective Insurance | 1,300 | 64 |
| StanCorp Financial Group | 1,400 | 107 |
| Standard Management * | 1,400 | 3 |
| State Auto Financial | 1,800 | 56 |
| Stewart Information Services | 900 | 38 |
| Transatlantic Holdings § | 2,981 | 166 |
| U.S.I. Holdings * | 1,900 | 24 |
| UICI | 2,300 | 68 |
| United America Indemnity * | 1,512 | 26 |
| United Fire & Casualty | 1,400 | 62 |
| Unitrin | 3,100 | 152 |
| Universal American Financial * | 3,100 | 70 |
| Vesta Insurance § | 3,100 | 8 |
| W. R. Berkley | 5,712 | 204 |
| Wesco Financial | 330 | 119 |
| White Mountains Insurance Group § | 480 | 303 |
| Zenith National | 900 | 61 |
| | | 12,512 |
| Real Estate 6.9% | | |
| Agree Realty, REIT § | 800 | 24 |
| Alexanders, REIT *§ | 250 | 62 |
| Alexandria Real Estate, REIT | 800 | 59 |
| AMB Property, REIT | 4,000 | 174 |
| American Financial Realty, REIT | 5,100 | 78 |
| American Home Mortgage Holdings, REIT | 2,195 | 77 |
| American Mortgage Acceptance, REIT § | 1,500 | 23 |
| American Real Estate *§ | 2,300 | 67 |
| AmeriVest Properties, REIT | 3,000 | 13 |
| Amli Residential Properties, REIT § | 1,500 | 47 |
| Annaly Mortgage Management, REIT § | 5,400 | 97 |
| Anthracite Capital, REIT § | 3,400 | 40 |
| Arden Realty, REIT | 3,100 | 112 |
| Avalonbay Communities, REIT | 3,084 | 249 |
| Bedford Property Investors, REIT § | 1,300 | 30 |
| BioMed Realty Trust, REIT | 1,700 | 41 |
| BNP Residential Properties, REIT | 1,100 | 18 |
| Boston Properties, REIT | 4,900 | 343 |
| Brandywine Realty Trust, REIT | 2,400 | 74 |
| BRE Properties, REIT, Class A | 2,300 | 96 |
| Camden Property Trust, REIT | 2,300 | 124 |
| Capital Automotive, REIT | 1,700 | 65 |
| Capital Properties | | |
| Class A § | 1,200 | 28 |
| Class B * | 120 | 0 |
| CarrAmerica Realty, REIT | 2,400 | 87 |
| Catellus Development, REIT | 4,403 | 144 |
| CB Richard Ellis Group, Class A * | 3,500 | 154 |
| CBL & Associates Properties, REIT | 3,000 | 129 |
| Centerpoint Properties, REIT | 2,000 | 85 |
| Colonial Properties Trust, REIT § | 2,032 | 89 |
| Commercial Net Lease Realty, REIT | 2,500 | 51 |
| Corporate Office Properties Trust, REIT | 1,900 | 56 |
| Cousins Properties, REIT | 2,450 | 72 |
| Crescent Real Estate Equities, REIT | 4,500 | 84 |
| CRT Properties, REIT | 1,600 | 44 |
| Developers Diversified Realty, REIT | 4,738 | 218 |
| Duke Realty, REIT | 6,390 | 202 |
| Eagle Hospitality Properties, REIT | 2,600 | 24 |
| EastGroup Properties, REIT | 1,400 | 59 |
| Entertainment Properties, REIT | 1,300 | 60 |
| Equity Inns, REIT | 3,500 | 47 |
| Equity Lifestyle Properties, REIT | 1,400 | 56 |
| Equity One, REIT | 3,800 | 86 |
| Essex Property Trust, REIT | 1,100 | 91 |
| Federal Realty Investment Trust, REIT | 2,600 | 153 |
| Felcor Lodging Trust, REIT * | 3,200 | 46 |
| First Industrial Realty, REIT § | 2,100 | 84 |
| Forest City Enterprises, Class A | 2,400 | 170 |
| Friedman, Billings, Ramsey Group, REIT, Class A § | 6,425 | 92 |
| Gables Residential Trust, REIT | 1,500 | 65 |
| General Growth Properties, REIT | 9,600 | 394 |
| Getty Realty, REIT § | 1,400 | 39 |
| Glenborough Realty Trust, REIT | 1,500 | 31 |
| Glimcher Realty Trust, REIT § | 1,500 | 42 |
| Global Signal, REIT | 2,800 | 105 |
| GMH Communities Trust, REIT | 2,100 | 29 |
| Government Properties Trust, REIT § | 2,000 | 19 |
| Health & Retirement Properties, REIT | 9,100 | 113 |
| Health Care, REIT § | 2,200 | 83 |
| Health Care Property Investors, REIT | 5,900 | 160 |
| Healthcare Realty Trust, REIT | 2,100 | 81 |
| Heritage Property Investment Trust, REIT | 2,200 | 77 |
| Hersha Hospitality Trust, REIT | 2,000 | 19 |
| Highwoods Properties, REIT | 2,500 | 74 |
| Home Properties of New York, REIT | 1,500 | 65 |
| Homebanc, REIT § | 3,200 | 29 |
| Hospital Properties Trust, REIT | 3,000 | 132 |
| Host Marriott, REIT | 15,674 | 274 |
| Impac Mortgage Holdings, REIT § | 4,200 | 78 |
| Innkeepers USA, REIT | 2,600 | 39 |
| Investors Real Estate Trust, REIT § | 3,000 | 29 |
| IStar Financial, REIT | 5,173 | 215 |
| Jones Lang Lasalle * | 1,500 | 66 |
| Kilroy Realty, REIT | 1,600 | 76 |
| Kimco Realty, REIT | 4,850 | 286 |
| Kite Realty Group Trust, REIT | 2,000 | 30 |
| LaSalle Hotel Properties, REIT | 1,800 | 59 |
| Lexington Corporate Properties, REIT | 1,700 | 41 |
| Liberty Property Trust, REIT | 3,700 | 164 |
| LTC Properties, REIT | 2,400 | 50 |
| Macerich Company, REIT | 2,700 | 181 |
| Mack-Cali Realty, REIT | 2,700 | 122 |
| Maguire Properties, REIT | 2,100 | 60 |
| MeriStar Hospitality, REIT * | 5,000 | 43 |
| Mid-America Apartment Communities, REIT | 1,000 | 45 |
| Mills, REIT | 2,300 | 140 |
| Monmouth Real Estate Investment, REIT, Class A § | 1,800 | 15 |
| MortgageIT Holdings, REIT § | 1,500 | 27 |
| National Health Investors, REIT § | 1,600 | 45 |
| National Health Realty, REIT § | 1,100 | 20 |
| Nationwide Health Properties, REIT § | 3,300 | 78 |
| New Century Financial, REIT § | 2,400 | 123 |
| New Plan Excel Realty, REIT | 4,500 | 122 |
| Newcastle Investment, REIT § | 1,400 | 42 |
| NovaStar Financial, REIT § | 1,800 | 70 |
| Pan Pacific Retail Properties, REIT | 2,100 | 139 |
| Parkway Properties, REIT | 700 | 35 |
| Pennsylvania, REIT | 1,781 | 85 |
| Pittsburgh & West Virginia Railroad, REIT § | 1,500 | 14 |
| PMC Commercial Trust, REIT | 1,688 | 22 |
| Post Properties, REIT | 2,200 | 79 |
| Prentiss Properties Trust, REIT | 1,800 | 66 |
| PS Business Parks, REIT | 1,000 | 44 |
| Public Storage, REIT | 5,800 | 367 |
| Ramco-Gershenson Properties, REIT § | 1,200 | 35 |
| Rayonier, REIT § | 2,571 | 136 |
| Realty Income, REIT § | 6,700 | 168 |
| Reckson Associates Realty, REIT | 3,100 | 104 |
| Redwood Trust, REIT § | 1,000 | 52 |
| Regency Centers, REIT | 2,900 | 166 |
| Resource Asset Investment Trust, REIT § | 1,600 | 48 |
| Saul Centers, REIT | 1,400 | 51 |
| Saxon Capital, REIT | 2,400 | 41 |
| Senior Housing Properties, REIT | 3,160 | 60 |
| Shelbourne Properties II, REIT * | 200 | 0 |
| Shurgard Storage Centers, REIT | 2,300 | 106 |
| Sizeler Property Investors, REIT | 1,600 | 21 |
| SL Green Realty, REIT § | 1,700 | 110 |
| St. Joe | 3,400 | 277 |
| Strategic Hotel Capital, REIT | 2,300 | 41 |
| Sun Communities, REIT | 1,300 | 48 |
| Sunset Financial Resources | 1,700 | 16 |
| Tanger Factory Outlet Centers, REIT | 1,900 | 51 |
| Taubman Centers, REIT | 2,400 | 82 |
| Thomas Properties | 1,500 | 19 |
| Thornburg Mortgage, REIT § | 4,000 | 117 |
| Trammell Crow * | 1,600 | 39 |
| Trizec Properties, REIT | 6,600 | 136 |
| United Dominion Realty Trust, REIT | 6,600 | 159 |
| Universal Health Realty Income Trust, REIT § | 1,000 | 38 |
| Urstadt Biddle Properties, Class A, REIT | 1,300 | 22 |
| Urstadt Biddle Properties, REIT § | 1,500 | 25 |
| Vencor, REIT | 4,300 | 130 |
| Vornado Realty Trust, REIT | 5,700 | 458 |
| Washington SBI, REIT | 2,100 | 66 |
| Weingarten Realty Investors, REIT | 4,250 | 167 |
| Wellsford Real Properties * | 1,300 | 23 |
| WP Carey & Co § | 1,700 | 50 |
| | | 12,334 |
| Thrifts & Mortgage Finance 2.3% | | |
| Ameriana Bancorp | 960 | 13 |
| Anchor Bancorp Wisconsin § | 1,600 | 48 |
| Astoria Financial | 5,550 | 158 |
| Bank Mutual | 4,234 | 47 |
| BankAtlantic, Class A | 3,000 | 57 |
| BankUnited Financial | 1,700 | 46 |
| Brookline Bancorp § | 3,149 | 51 |
| Camco | 1,100 | 15 |
| Capital Crossing Bank *§ | 1,000 | 34 |
| Capitol Federal Financial § | 3,400 | 117 |
| Charter Financial § | 1,000 | 35 |
| Charter Municipal Mortgage Acceptance | 2,000 | 44 |
| Commercial Capital Bancorp | 2,800 | 47 |
| Commercial Federal | 2,200 | 74 |
| Cooperative Bankshares § | 1,650 | 31 |
| Corus Bankshares | 1,600 | 89 |
| Delta Financial § | 3,100 | 30 |
| Dime Community Bancshares | 2,500 | 38 |
| Doral Financial § | 4,600 | 76 |
| Downey Financial | 1,200 | 88 |
| Federal Agricultural Mortgage, Class A § | 700 | 12 |
| First Busey § | 1,500 | 29 |
| First Federal Bancshares of Arkansas | 1,500 | 34 |
| First Niagra Financial | 4,671 | 68 |
| First Place Financial § | 1,749 | 35 |
| FirstFed Financial * | 900 | 54 |
| Flagstar Bancorp § | 3,450 | 65 |
| Flushing Financial | 1,675 | 31 |
| Fremont General § | 3,500 | 85 |
| Harbor Florida Bancshares | 1,400 | 52 |
| Hingham Institution for Savings | 400 | 17 |
| Home Federal Savings Bank | 400 | 10 |
| Horizon Financial § | 1,325 | 29 |
| Hudson City Bancorp | 28,212 | 322 |
| Independence Community Bank | 4,154 | 153 |
| IndyMac Mortgage Holdings | 3,100 | 126 |
| Kearny Financial *§ | 3,700 | 44 |
| Logansport Financial § | 800 | 14 |
| MAF Bancorp | 1,853 | 79 |
| Matrix Bancorp * | 1,300 | 16 |
| Net Bank | 3,469 | 32 |
| New Hampshire Thrift | 800 | 12 |
| New York Community Bancorp § | 12,514 | 227 |
| Newalliance Bancshares | 5,700 | 80 |
| NewMil Bancorp § | 700 | 20 |
| Northwest Bancorp § | 2,500 | 53 |
| Ocwen Financial *§ | 3,300 | 22 |
| People's Bank | 6,825 | 206 |
| Peoples Community Bancorp | 600 | 12 |
| PFF Bancorp | 1,470 | 45 |
| PMI Group § | 4,100 | 160 |
| Pocahontas Bancorp § | 1,000 | 15 |
| Provident Financial Services | 3,400 | 60 |
| Provident New York Bancorp | 3,102 | 38 |
| R&G Financial, Class B | 1,600 | 28 |
| Radian | 4,108 | 194 |
| Riverview Bancorp § | 500 | 11 |
| Sound Federal Bancorp § | 1,390 | 23 |
| Sterling Financial * | 1,412 | 53 |
| Triad Guaranty * | 900 | 45 |
| Union Community Bancorp | 900 | 15 |
| W Holdings Company § | 7,372 | 75 |
| Washington Federal | 4,498 | 106 |
| Washington Savings Bank | 1,300 | 12 |
| Webster Financial | 2,356 | 110 |
| WSFS Financial § | 700 | 38 |
| | | 4,105 |
| Total Financials | | 42,476 |
| |
| HEALTH CARE 11.7% | | |
| Biotechnology 4.3% | | |
| Abgenix *§ | 4,300 | 37 |
| Acadia Pharmaceuticals *§ | 700 | 6 |
| Affymetrix *§ | 2,960 | 160 |
| Albany Molecular Research * | 2,800 | 39 |
| Alexion Pharmaceutical *§ | 1,400 | 32 |
| Alkermes *§ | 4,400 | 58 |
| Allos Therapeutics *§ | 300 | 1 |
| Alnylam Pharmaceuticals *§ | 2,200 | 16 |
| Amylin Pharmaceuticals *§ | 4,600 | 96 |
| Aphton *§ | 3,600 | 3 |
| Arena Pharmaceuticals *§ | 3,300 | 22 |
| Ariad Pharmaceuticals *§ | 3,600 | 24 |
| Arqule *§ | 4,100 | 27 |
| Array BioPharma * | 3,200 | 20 |
| AVI BioPharma *§ | 3,100 | 7 |
| Avigen *§ | 200 | 1 |
| BioCryst Pharmaceuticals *§ | 1,800 | 9 |
| BioMarin Pharmaceutical *§ | 4,800 | 36 |
| Biopure *§ | 783 | 1 |
| BioSource International *§ | 2,400 | 25 |
| BioSphere Medical *§ | 2,100 | 9 |
| Celera Genomics * | 2,493 | 27 |
| Celgene *§ | 7,600 | 310 |
| Cell Genesys *§ | 2,800 | 15 |
| Cell Therapeutics *§ | 5,500 | 15 |
| Cephalon *§ | 2,500 | 99 |
| Cepheid *§ | 3,400 | 25 |
| Charles River Laboratories International * | 2,916 | 141 |
| Ciphergen Biosystems *§ | 3,000 | 6 |
| Corixa *§ | 4,501 | 20 |
| Cotherix *§ | 1,900 | 19 |
| Critical Therapeutics *§ | 2,600 | 18 |
| Cubist Pharmaceuticals *§ | 2,800 | 37 |
| CuraGen *§ | 3,100 | 16 |
| CV Therapeutics *§ | 1,900 | 43 |
| Cytogen *§ | 700 | 4 |
| Cytokinetics *§ | 2,600 | 18 |
| Digene *§ | 1,400 | 39 |
| Discovery Partners * | 2,300 | 7 |
| Diversa * | 3,450 | 18 |
| Dyax *§ | 1,700 | 8 |
| Dynavax Technologies *§ | 2,100 | 10 |
| Encysive Pharmaceuticals *§ | 4,000 | 43 |
| EntreMed *§ | 1,600 | 4 |
| Enzo Biochem § | 2,119 | 38 |
| Enzon Pharmaceuticals * | 2,070 | 13 |
| EXACT Sciences * | 4,000 | 9 |
| Exelixis * | 3,500 | 26 |
| Eyetech Pharmaceuticals *§ | 2,700 | 34 |
| Genaera Pharmaceuticals * | 5,200 | 9 |
| Gene Logic *§ | 3,160 | 10 |
| Genentech * | 47,040 | 3,776 |
| Genitope *§ | 1,300 | 17 |
| Harvard Bioscience * | 2,600 | 8 |
| Human Genome Sciences *§ | 5,080 | 59 |
| ICOS *§ | 2,900 | 61 |
| Idenix Pharmaceuticals *§ | 2,900 | 63 |
| ImClone Systems *§ | 3,743 | 116 |
| Immune Response *§ | 2,900 | 2 |
| ImmunoGen * | 3,300 | 19 |
| Immunomedics *§ | 4,800 | 8 |
| Incyte Genomics * | 4,400 | 31 |
| Indevus Pharmaceuticals *§ | 3,400 | 9 |
| Inhibitex * | 800 | 6 |
| InterMune *§ | 2,200 | 29 |
| Introgen Therapeutics *§ | 2,600 | 17 |
| Kosan Biosciences * | 2,800 | 15 |
| La Jolla Pharmaceutical *§ | 4,600 | 4 |
| Lexicon Genetics *§ | 4,800 | 24 |
| Ligand Pharmaceuticals, Class B *§ | 3,900 | 27 |
| Lipid Sciences *§ | 2,800 | 14 |
| Luminex *§ | 2,900 | 29 |
| Mankind *§ | 2,400 | 24 |
| Martek Biosciences *§ | 1,200 | 46 |
| Matritech *§ | 2,600 | 2 |
| Maxygen * | 2,500 | 17 |
| Medarex *§ | 5,700 | 47 |
| Millennium Pharmaceuticals * | 13,159 | 122 |
| Momenta Pharmaceuticals *§ | 3,100 | 61 |
| Myogen *§ | 2,300 | 16 |
| Myriad Genetics *§ | 1,700 | 27 |
| NeoPharm * | 1,182 | 12 |
| NeoRx *§ | 2,500 | 1 |
| Neose Technologies *§ | 2,100 | 7 |
| Neurocrine Biosciences *§ | 1,600 | 67 |
| Neurogen *§ | 2,300 | 16 |
| Novavax *§ | 4,000 | 5 |
| NPS Pharmaceuticals *§ | 2,300 | 26 |
| ONYX Pharmaceuticals *§ | 2,000 | 48 |
| Orchid Cellmark *§ | 3,160 | 34 |
| Oscient Pharmaceuticals *§ | 6,300 | 17 |
| OSI Pharmaceuticals * | 2,400 | 98 |
| Pharmacopeia Drug Discovery * | 3,300 | 13 |
| Pharmacyclics *§ | 2,600 | 19 |
| Pharmion *§ | 1,300 | 30 |
| Progenics Pharmaceuticals *§ | 1,400 | 29 |
| Protein Design Labs * | 3,900 | 79 |
| QLT * | 1,100 | 11 |
| Regeneron Pharmaceuticals * | 3,300 | 28 |
| Rigel Pharmaceuticals *§ | 1,400 | 28 |
| Sangamo BioSciences *§ | 3,100 | 11 |
| Savient Pharmaceuticals *§ | 4,700 | 21 |
| Seattle Genetics *§ | 3,000 | 16 |
| Sequenom *§ | 3,100 | 3 |
| Seracare Life Sciences * | 1,300 | 18 |
| Serologicals *§ | 1,400 | 30 |
| Sirna Therapeutics *§ | 3,300 | 6 |
| StemCells *§ | 2,600 | 11 |
| Strategene *§ | 2,400 | 21 |
| Tanox *§ | 1,700 | 20 |
| Techne * | 1,800 | 83 |
| Telik *§ | 1,700 | 28 |
| Tercica * | 2,700 | 23 |
| Third Wave Technologies *§ | 5,600 | 22 |
| Titan Pharmaceuticals * | 3,900 | 7 |
| Transkaryotic Therapies *§ | 2,100 | 77 |
| Trimeris * | 1,300 | 13 |
| United Therapeutics *§ | 1,000 | 48 |
| VaxGen *§ | 1,600 | 17 |
| Vertex Pharmaceuticals * | 4,210 | 71 |
| Vicuron Pharmaceuticals * | 2,900 | 81 |
| ViroPharma *§ | 1,100 | 8 |
| XOMA * | 6,900 | 12 |
| Zymogenetics *§ | 2,700 | 47 |
| | | 7,668 |
| Health Care Equipment & Supplies 2.6% | | |
| ABIOMED *§ | 3,400 | 29 |
| Advanced Medical Optics * | 4,290 | 171 |
| Advanced Neuromodulation Systems *§ | 1,150 | 46 |
| AeroGen *§ | 3,900 | 2 |
| Align Technology *§ | 4,200 | 31 |
| American Bio Medica * | 3,000 | 3 |
| American Medical Systems * | 3,200 | 66 |
| Analogic | 700 | 35 |
| Arrhythmia Research § | 700 | 10 |
| Arrow International | 1,900 | 61 |
| ArthroCare *§ | 1,600 | 56 |
| Beckman Coulter | 2,800 | 178 |
| Bio-Rad Laboratories, Class A * | 1,100 | 65 |
| Biosite Diagnostics *§ | 800 | 44 |
| Bioveris * | 3,300 | 14 |
| Bruker Biosciences * | 4,600 | 18 |
| Candela Laser *§ | 3,200 | 33 |
| CardioDynamics International * | 1,200 | 2 |
| Cerus *§ | 1,970 | 9 |
| Conceptus *§ | 2,500 | 14 |
| CONMED * | 1,450 | 45 |
| Cooper Companies § | 2,026 | 123 |
| Cytyc * | 5,600 | 124 |
| Dade Behring Holdings | 1,900 | 124 |
| Datascope | 900 | 30 |
| Dentsply International | 3,600 | 194 |
| Diagnostic Products | 1,200 | 57 |
| DJ Orthopedics * | 1,600 | 44 |
| Edwards Lifesciences * | 3,000 | 129 |
| Endologix *§ | 2,300 | 10 |
| EPIX Pharmaceuticals *§ | 2,300 | 20 |
| Exactech *§ | 1,700 | 22 |
| Foxhollow Technologies *§ | 1,000 | 38 |
| Gen-Probe * | 2,500 | 91 |
| Greatbatch *§ | 1,200 | 29 |
| Haemonetics * | 1,200 | 49 |
| Hillenbrand Industries | 2,700 | 137 |
| ICU Medical * | 1,200 | 39 |
| IDEXX Laboratories * | 1,400 | 87 |
| Immucor * | 4,050 | 117 |
| INAMED * | 1,750 | 117 |
| Integra LifeSciences *§ | 1,400 | 41 |
| Intermagnetics General * | 1,212 | 37 |
| Intuitive Surgical * | 1,500 | 70 |
| Invacare | 1,500 | 67 |
| Inverness Medical Innovations * | 1,400 | 38 |
| Invitrogen * | 2,275 | 189 |
| Kensey Nash *§ | 900 | 27 |
| Kinetic Concepts * | 3,200 | 192 |
| Kyphon *§ | 1,700 | 59 |
| Laserscope *§ | 700 | 29 |
| Lifecore Biomedical * | 1,700 | 19 |
| Medical Action Industries * | 1,100 | 20 |
| Medwave *§ | 1,300 | 4 |
| Mentor § | 2,000 | 83 |
| Meridian Bioscience | 1,500 | 28 |
| Merit Medical Systems * | 2,265 | 35 |
| Microhelix * | 3,300 | 1 |
| Molecular Devices *§ | 1,150 | 25 |
| North American Scientific *§ | 1,800 | 4 |
| Novoste * | 900 | 1 |
| OraSure Technologies *§ | 2,800 | 28 |
| PolyMedica | 1,400 | 50 |
| Possis *§ | 1,300 | 13 |
| Quidel *§ | 1,300 | 7 |
| Regeneration Technologies *§ | 1,600 | 10 |
| ResMed *§ | 1,800 | 119 |
| Respironics * | 3,200 | 116 |
| Rita Medical Systems *§ | 1,010 | 3 |
| Rochester Medical * | 800 | 8 |
| Sonic Innovations *§ | 700 | 3 |
| SonoSite *§ | 1,200 | 37 |
| Steris | 3,100 | 80 |
| SurModics *§ | 1,200 | 52 |
| Sybron Dental Specialties * | 1,900 | 71 |
| Synovis Life Technologies * | 700 | 6 |
| Theragenics * | 1,200 | 4 |
| Thoratec *§ | 3,002 | 46 |
| Trestle Holdings * | 2,300 | 3 |
| Trimedyne *§ | 3,000 | 2 |
| Urologix *§ | 1,900 | 8 |
| Varian * | 1,600 | 60 |
| Varian Medical Systems * | 6,000 | 224 |
| Ventana Medical Systems *§ | 2,000 | 80 |
| Viasys Healthcare * | 1,700 | 38 |
| Vital Signs | 1,000 | 43 |
| West Pharmaceutical Services | 1,600 | 45 |
| Wright Medical Group * | 1,100 | 29 |
| Zoll Medical * | 1,100 | 28 |
| | | 4,695 |
| Health Care Providers & Services 3.4% | | |
| Accelrys * | 2,000 | 10 |
| Advisory Board * | 1,200 | 58 |
| Alliance Imaging *§ | 3,400 | 36 |
| Allscripts Healthcare *§ | 3,200 | 53 |
| American Healthcorp * | 1,500 | 63 |
| AMERIGROUP * | 2,400 | 96 |
| AMICAS * | 4,500 | 20 |
| AMN Healthcare Services *§ | 1,205 | 18 |
| AmSurg, Class A * | 1,950 | 54 |
| Apria Healthcare * | 2,500 | 87 |
| Beverly Enterprises *§ | 4,800 | 61 |
| Bioscrip *§ | 3,600 | 22 |
| Capital Senior Living *§ | 3,300 | 23 |
| Centene * | 1,700 | 57 |
| Cerner *§ | 1,600 | 109 |
| Chemed | 1,200 | 49 |
| Community Health System * | 4,400 | 166 |
| Comprehensive Care * | 3,500 | 7 |
| Computer Programs and Systems | 1,000 | 37 |
| CorVel * | 700 | 18 |
| Covance * | 3,000 | 135 |
| Coventry Health Care * | 4,830 | 342 |
| Cross Country Healthcare * | 1,100 | 19 |
| CryoLife *§ | 2,800 | 22 |
| D&K Healthcare | 1,200 | 10 |
| DaVita * | 4,700 | 214 |
| Dendrite International * | 1,600 | 22 |
| E Research Technology *§ | 2,750 | 37 |
| Eclipsys *§ | 1,800 | 25 |
| Five Star Quality Care *§ | 2,300 | 17 |
| Genesis Healthcare * | 950 | 44 |
| Gentiva Health Services * | 1,950 | 35 |
| Hanger Orthopedic Group * | 2,600 | 13 |
| Health Net * | 5,100 | 195 |
| Henry Schein * | 4,000 | 166 |
| HMS Holdings * | 2,800 | 19 |
| Hooper Holmes | 6,300 | 26 |
| IDX Systems *§ | 1,400 | 42 |
| Kindred Healthcare * | 1,614 | 64 |
| LabOne * | 1,200 | 48 |
| LCA-Vision | 1,800 | 87 |
| Lifeline Systems * | 1,100 | 35 |
| LifePoint Hospitals * | 2,670 | 135 |
| Lincare Holdings * | 4,200 | 171 |
| Magellan Health Services * | 1,800 | 64 |
| Matria Healthcare * | 1,650 | 53 |
| Medical Staffing Network *§ | 2,300 | 11 |
| Merge Healthcare * | 1,000 | 19 |
| Molina Healthcare *§ | 1,400 | 62 |
| National Data | 1,600 | 29 |
| National Healthcare § | 900 | 32 |
| National Wireless Holdings § | 900 | 14 |
| NeighborCare * | 2,100 | 70 |
| OCA *§ | 3,500 | 7 |
| Odyssey Healthcare *§ | 2,500 | 36 |
| Omnicare | 4,400 | 187 |
| Omnicell *§ | 2,100 | 18 |
| OPTION CARE § | 2,475 | 35 |
| Owens & Minor | 1,700 | 55 |
| PacifiCare Health Systems * | 3,800 | 271 |
| Parexel International * | 1,800 | 36 |
| Patterson Companies *§ | 5,900 | 266 |
| PDI *§ | 1,150 | 14 |
| Pediatrix Medical Group * | 1,100 | 81 |
| Per-Se Technologies *§ | 1,700 | 36 |
| Pharmaceutical Product Development * | 2,900 | 136 |
| PHC * | 3,100 | 8 |
| Priority Healthcare, Class B *§ | 2,094 | 53 |
| ProxyMed * | 306 | 2 |
| PSS World Medical * | 3,400 | 42 |
| Q-Med *§ | 1,900 | 17 |
| Radiologix *§ | 2,200 | 9 |
| RehabCare Group * | 1,300 | 35 |
| Renal Care Group * | 3,300 | 152 |
| Res-Care * | 2,300 | 31 |
| SFBC International *§ | 1,200 | 46 |
| Sierra Health Services * | 1,300 | 93 |
| Specialty Laboratories *§ | 2,300 | 19 |
| Sunrise Senior Living *§ | 900 | 49 |
| Symbion * | 1,600 | 38 |
| Triad Hospitals * | 3,516 | 192 |
| Tripos * | 2,500 | 9 |
| TriZetto Group * | 3,300 | 46 |
| U.S. Physical Therapy * | 1,600 | 31 |
| United Surgical Partners International * | 1,400 | 73 |
| Universal Health Services | 2,600 | 162 |
| VCA Antech * | 3,700 | 90 |
| WebMD *§ | 13,837 | 142 |
| Wellcare Health Plans *§ | 1,800 | 64 |
| WellChoice * | 3,600 | 250 |
| | | 6,152 |
| Pharmaceuticals 1.4% | | |
| Able Laboratories *§ | 1,000 | 3 |
| Adolor *§ | 2,100 | 19 |
| Alpharma, Class A | 2,600 | 38 |
| American Pharmaceutical * | 3,100 | 128 |
| Andrx * | 3,400 | 69 |
| Antigenics *§ | 2,400 | 13 |
| Atherogenics *§ | 2,100 | 34 |
| Barr Pharmaceuticals * | 5,025 | 245 |
| Barrier Therapeutics *§ | 1,600 | 13 |
| Bone Care International * | 1,100 | 36 |
| Bradley Pharmaceuticals *§ | 1,700 | 18 |
| Cellegy Pharmaceuticals *§ | 2,400 | 4 |
| Columbia Laboratories *§ | 3,400 | 11 |
| Connetics *§ | 2,000 | 35 |
| Emisphere Technologies * | 1,900 | 8 |
| Endo Pharmaceutical * | 6,300 | 166 |
| Eon Labs * | 4,300 | 132 |
| First Horizon Pharmaceutical *§ | 2,100 | 40 |
| Impax Laboratories *§ | 2,300 | 36 |
| InKine Pharmaceutical *§ | 4,400 | 14 |
| Inspire Pharmaceuticals *§ | 2,500 | 21 |
| IVAX * | 11,396 | 245 |
| K-V Pharmaceutical, Class A *§ | 2,550 | 43 |
| Kos Pharmaceuticals * | 1,900 | 124 |
| Medicines Company * | 2,200 | 51 |
| Medicis Pharmaceutical, Class A | 2,400 | 76 |
| MGI Pharma *§ | 3,600 | 78 |
| Nektar Therapeutics * | 3,600 | 61 |
| New River Pharmaceuticals *§ | 1,400 | 42 |
| Nitromed *§ | 1,700 | 33 |
| Noven Pharmaceuticals * | 1,900 | 33 |
| Pain Therapeutics *§ | 2,900 | 20 |
| Par Pharmaceutical * | 1,700 | 54 |
| Penwest Pharmaceuticals * | 1,300 | 15 |
| Perrigo | 3,300 | 46 |
| Point Therapeutics *§ | 3,300 | 14 |
| Salix Pharmaceuticals *§ | 2,350 | 42 |
| Santarus *§ | 2,800 | 12 |
| Sepracor * | 4,700 | 282 |
| Theravance *§ | 2,900 | 49 |
| Valeant Pharmaceuticals § | 4,200 | 74 |
| VIVUS * | 3,100 | 11 |
| | | 2,488 |
| Total Health Care | | 21,003 |
| |
| INDUSTRIALS & BUSINESS SERVICES 8.7% | | |
| Aerospace & Defense 0.8% | | |
| AAR * | 1,500 | 24 |
| Alliant Techsystems * | 1,675 | 118 |
| Allied Research * | 600 | 14 |
| Armor Holdings * | 1,600 | 63 |
| Aviall * | 1,400 | 44 |
| BE Aerospace * | 3,300 | 52 |
| Cubic Corp. § | 1,300 | 23 |
| Curtiss-Wright | 1,000 | 54 |
| DRS Technologies | 1,201 | 62 |
| Ducommun * | 700 | 12 |
| Edac Technologies * | 4,500 | 13 |
| EDO | 1,200 | 36 |
| Engineered Support System § | 1,912 | 68 |
| Environmental Tectonics *§ | 400 | 2 |
| Esterline Technologies * | 900 | 36 |
| GenCorp *§ | 3,100 | 60 |
| HEICO, Class A | 1,720 | 31 |
| Hexcel * | 3,400 | 58 |
| Innovative Solutions and Support *§ | 1,400 | 47 |
| Ionatron *§ | 3,400 | 29 |
| Kaman, Class A | 1,900 | 34 |
| KVH Industries *§ | 1,200 | 11 |
| Ladish Company * | 2,400 | 24 |
| Mercury Computer Systems * | 1,200 | 33 |
| Moog, Class A * | 1,650 | 52 |
| MTC Technologies *§ | 1,100 | 40 |
| Orbital Sciences *§ | 3,200 | 32 |
| Pemco Aviation Group *§ | 300 | 8 |
| Precision Castparts | 2,754 | 215 |
| Sequa, Class A *§ | 600 | 40 |
| SPACEHAB * | 5,700 | 10 |
| Sypris Solutions § | 1,200 | 15 |
| Teledyne Technologies * | 900 | 29 |
| Triumph Group * | 600 | 21 |
| United Industrial § | 1,300 | 46 |
| | | 1,456 |
| Air Freight & Logistics 0.4% | | |
| C.H. Robinson Worldwide | 3,800 | 221 |
| EGL * | 2,200 | 45 |
| Expeditors International of Washington | 4,600 | 229 |
| Forward Air | 1,800 | 51 |
| Hub Group, Class A * | 1,100 | 27 |
| Pacer International * | 1,700 | 37 |
| Park Ohio Holdings * | 1,900 | 32 |
| | | 642 |
| Airlines 0.3% | | |
| AirTran *§ | 4,000 | 37 |
| Alaska Air Group *§ | 1,400 | 42 |
| America West Holdings, Class B *§ | 3,800 | 23 |
| AMR * | 6,700 | 81 |
| Continental Airlines, Class B *§ | 3,000 | 40 |
| ExpressJet Holdings * | 3,700 | 31 |
| FLYi *§ | 4,100 | 3 |
| Frontier Airlines *§ | 2,450 | 25 |
| JetBlue Airways *§ | 4,675 | 96 |
| Midwest Express Holdings * | 1,700 | 4 |
| Northwest Airlines *§ | 4,700 | 21 |
| Pinnacle Airlines *§ | 1,700 | 15 |
| SkyWest | 2,600 | 47 |
| World Air Holdings * | 1,800 | 21 |
| | | 486 |
| Building Products 0.3% | | |
| AAON * | 950 | 17 |
| Advanced Environmental Recycling, Class A *§ | 4,000 | 5 |
| American Woodmark | 800 | 24 |
| Ameron International | 700 | 26 |
| Apogee Enterprises | 2,300 | 36 |
| ElkCorp | 1,200 | 34 |
| Griffon * | 1,400 | 31 |
| Jacuzzi Brands * | 3,800 | 41 |
| Lennox International | 2,700 | 57 |
| NCI Building Systems * | 700 | 23 |
| Simpson Manufacturing | 1,800 | 55 |
| Trex *§ | 700 | 18 |
| Universal Forest Products | 800 | 33 |
| USG *§ | 1,900 | 81 |
| York International | 2,000 | 76 |
| | | 557 |
| Commercial Services & Supplies 2.4% | | |
| A. T. Cross * | 2,800 | 12 |
| Ablest * | 1,700 | 12 |
| ABM Industries | 1,900 | 37 |
| Adesa | 5,000 | 109 |
| Administaff | 1,100 | 26 |
| American Locker Group *§ | 1,300 | 7 |
| APAC TeleServices * | 5,100 | 4 |
| ARAMARK, Class B | 8,300 | 219 |
| Asset Acceptance Capital * | 1,700 | 44 |
| Banta | 1,000 | 45 |
| Bowne | 2,700 | 39 |
| Brady, Class A | 3,700 | 115 |
| Brinks Company | 2,449 | 88 |
| Casella Waste Systems, Class A * | 2,100 | 25 |
| CDI | 1,000 | 22 |
| Central Parking § | 1,400 | 19 |
| Cenveo *§ | 3,500 | 26 |
| ChoicePoint * | 3,724 | 149 |
| Clean Harbor *§ | 1,000 | 22 |
| Consolidated Graphics * | 900 | 37 |
| Copart * | 3,850 | 92 |
| Cornell Companies * | 400 | 5 |
| Corporate Executive Board | 1,800 | 141 |
| Corrections Corp of America * | 1,767 | 69 |
| CoStar Group * | 900 | 39 |
| Deluxe | 2,100 | 85 |
| DiamondCluster International * | 3,650 | 41 |
| Dun & Bradstreet * | 3,300 | 203 |
| Duratek * | 1,600 | 37 |
| Ecology and Environment, Class A § | 1,900 | 13 |
| Ennis Business Forms | 1,400 | 25 |
| Find/SVP *§ | 3,000 | 4 |
| First Consulting Group * | 2,700 | 14 |
| Food Technology Service * | 3,700 | 4 |
| FTI Consulting * | 1,450 | 30 |
| G & K Services, Class A | 800 | 30 |
| General Binding * | 1,300 | 28 |
| GEO * | 900 | 22 |
| Heidrick & Struggles International * | 800 | 21 |
| Herman Miller | 3,600 | 111 |
| HNI Corporation | 2,400 | 123 |
| Hudson Technologies * | 3,800 | 3 |
| ICT Group * | 1,900 | 20 |
| Ikon Office Solutions | 6,200 | 59 |
| Imagistics International * | 1,300 | 36 |
| Innotrac * | 2,300 | 19 |
| Intersections *§ | 500 | 6 |
| John H. Harland | 900 | 34 |
| Kelly Services, Class A | 1,500 | 43 |
| Kforce * | 3,056 | 26 |
| Knoll | 2,100 | 36 |
| Korn/Ferry *§ | 2,100 | 37 |
| Labor Ready * | 2,500 | 58 |
| Layne Christensen *§ | 1,400 | 28 |
| Learning Tree International *§ | 1,100 | 13 |
| LECG * | 1,800 | 38 |
| Manpower | 3,864 | 154 |
| McGrath RentCorp. | 800 | 19 |
| Mine Safety Appliances | 1,800 | 83 |
| Mobile Mini *§ | 800 | 28 |
| Multi-Color | 875 | 23 |
| Navigant Consulting * | 2,300 | 41 |
| NCO Group *§ | 1,708 | 37 |
| On Assignment * | 3,200 | 16 |
| PHH * | 2,300 | 59 |
| PICO Holdings *§ | 1,100 | 33 |
| PRG-Schultz International *§ | 4,850 | 14 |
| Republic Services | 6,900 | 248 |
| Resources Global Professionals *§ | 2,400 | 56 |
| Rollins | 3,375 | 68 |
| School Specialty * | 776 | 36 |
| Sirva *§ | 2,900 | 25 |
| SOURCECORP * | 1,200 | 24 |
| Spherion * | 2,700 | 18 |
| Standard Register | 1,200 | 19 |
| Steelcase, Class A § | 5,800 | 80 |
| Stericycle * | 2,000 | 101 |
| Strategic Distribution *§ | 1,400 | 15 |
| TeleTech Holdings *§ | 4,640 | 38 |
| Tetra Tech * | 2,400 | 32 |
| TRC * | 1,500 | 18 |
| TRM Copy Centers *§ | 1,100 | 18 |
| United Stationers * | 1,400 | 69 |
| Utek *§ | 800 | 11 |
| Viad | 1,475 | 42 |
| Volt Information Sciences * | 1,000 | 24 |
| Waste Connections * | 1,950 | 73 |
| Watson Wyatt | 1,600 | 41 |
| West Corporation * | 3,200 | 123 |
| | | 4,336 |
| Construction & Engineering 0.3% | | |
| Dycom Industries * | 2,233 | 44 |
| EMCOR Group * | 1,000 | 49 |
| Englobal * | 2,000 | 7 |
| Granite Construction | 2,225 | 63 |
| Insituform Technologies * | 900 | 14 |
| Integrated Electrical Services *§ | 2,700 | 5 |
| Jacobs Engineering Group * | 2,600 | 146 |
| Mastec *§ | 4,050 | 36 |
| McDermott International * | 2,800 | 59 |
| Michael Baker * | 1,100 | 20 |
| Quanta Services * | 5,200 | 46 |
| Shaw Group * | 2,400 | 52 |
| URS Corporation * | 1,900 | 71 |
| Xanser * | 5,700 | 13 |
| | | 625 |
| Electrical Equipment 0.7% | | |
| A.O. Smith | 1,300 | 35 |
| Acuity Brands § | 2,200 | 57 |
| American Superconductor *§ | 2,100 | 19 |
| AMETEK | 3,300 | 138 |
| Arotech *§ | 5,100 | 5 |
| Artesyn Technologies *§ | 3,100 | 27 |
| Baldor Electric § | 1,800 | 44 |
| Beacon Power * | 9,300 | 10 |
| BTU International * | 2,400 | 9 |
| C&D Technologies | 2,100 | 19 |
| Capstone Turbine *§ | 5,800 | 7 |
| Channell Commercial * | 1,700�� | 13 |
| Chase | 1,000 | 14 |
| Color Kinetics *§ | 2,100 | 22 |
| Encore Wire *§ | 2,200 | 26 |
| Energy Conversion Devices *§ | 1,800 | 40 |
| Exx, Class A * | 1,400 | 3 |
| Franklin Electric § | 1,000 | 39 |
| Fuelcell Energy *§ | 3,000 | 31 |
| General Cable *§ | 3,500 | 52 |
| Genlyte Group * | 1,200 | 58 |
| Global Power Equipment *§ | 3,400 | 27 |
| GrafTech International * | 6,400 | 28 |
| Hubbell, Class B | 2,700 | 119 |
| II-VI * | 2,000 | 37 |
| LSI Industries | 2,225 | 31 |
| MagneTek * | 2,900 | 7 |
| Medis Technologies *§ | 2,000 | 33 |
| Orbit International * | 1,000 | 11 |
| Oryx Technology * | 2,100 | 4 |
| Plug Power *§ | 4,700 | 32 |
| Powell Industries * | 1,100 | 21 |
| Regal-Beloit | 1,000 | 29 |
| Thomas & Betts * | 2,500 | 71 |
| Ultralife Batteries *§ | 1,000 | 16 |
| Vicor § | 2,200 | 30 |
| Woodward Governor | 600 | 50 |
| | | 1,214 |
| Industrial Conglomerates 0.3% | | |
| Alleghany | 339 | 101 |
| Carlisle Companies | 1,500 | 103 |
| Roper Industries | 1,700 | 121 |
| Teleflex § | 1,700 | 101 |
| Tredegar | 1,900 | 30 |
| Walter Industries § | 2,200 | 88 |
| | | 544 |
| Machinery 1.8% | | |
| 3-D Systems *§ | 800 | 19 |
| A.S.V. *§ | 1,000 | 41 |
| Actuant, Class A * | 1,410 | 68 |
| AGCO * | 3,900 | 75 |
| Albany International | 1,910 | 61 |
| American Science Engineering *§ | 700 | 31 |
| Astec Industries * | 1,800 | 42 |
| Barnes Group | 1,000 | 33 |
| Briggs & Stratton | 2,200 | 76 |
| Bucyrus International, Class A | 600 | 23 |
| CLARCOR | 1,800 | 53 |
| Columbus McKinnon * | 1,200 | 13 |
| Commercial Vehicle Group *§ | 1,500 | 27 |
| Crane | 2,500 | 66 |
| Cuno * | 900 | 64 |
| Donaldson | 3,800 | 115 |
| EnPro Industries * | 1,800 | 52 |
| ESCO Electronics * | 800 | 81 |
| Federal Signal § | 2,200 | 34 |
| Flowserve * | 2,500 | 76 |
| Global Payment Technologies * | 1,500 | 6 |
| Graco | 3,387 | 115 |
| Graham | 900 | 24 |
| Greenbrier Companies | 1,400 | 38 |
| Harsco | 2,000 | 109 |
| Hurco Companies *§ | 1,900 | 30 |
| IDEX | 2,200 | 85 |
| JLG Industries | 1,800 | 49 |
| Joy Global | 3,300 | 111 |
| Kaydon § | 1,500 | 42 |
| Kennametal | 1,400 | 64 |
| Lincoln Electric Holdings § | 2,200 | 73 |
| Lindsay Manufacturing | 1,250 | 29 |
| Manitowoc | 1,300 | 53 |
| Met-Pro | 933 | 14 |
| Milacron *§ | 6,600 | 12 |
| Mueller Industries | 1,500 | 41 |
| NACCO Industries | 400 | 43 |
| Nordson | 2,000 | 69 |
| Oshkosh Truck | 1,700 | 133 |
| Pentair | 4,400 | 188 |
| Robbins & Myers § | 1,200 | 26 |
| SPX | 3,336 | 153 |
| Stewart & Stevenson | 1,400 | 32 |
| Tecumseh Products, Class A § | 800 | 22 |
| Tennant § | 700 | 25 |
| Terex * | 2,000 | 79 |
| Thomas Industries | 1,000 | 40 |
| Timken | 3,800 | 88 |
| Titan International § | 1,600 | 22 |
| Toro | 2,200 | 85 |
| Trinity Industries § | 2,000 | 64 |
| Turbochef Technologies *§ | 1,199 | 21 |
| Twin Disc | 900 | 20 |
| Valmont Industries | 1,700 | 44 |
| Wabash National § | 1,800 | 44 |
| Wabtec | 2,300 | 49 |
| Watts Industries, Class A § | 1,100 | 37 |
| Wolverine Tube * | 1,700 | 10 |
| | | 3,239 |
| Marine 0.1% | | |
| Alexander & Baldwin | 2,400 | 111 |
| Kirby Corporation * | 1,400 | 63 |
| Overseas Shipholding Group | 1,600 | 96 |
| | | 270 |
| Road & Rail 0.8% | | |
| Allied Holdings *§ | 3,500 | 2 |
| Amerco § | 1,500 | 80 |
| Arkansas Best | 1,300 | 41 |
| CNF | 2,300 | 103 |
| Dollar Thrifty Auto Group *§ | 800 | 31 |
| Florida East Coast Industries § | 1,400 | 61 |
| Genesee & Wyoming, Class A * | 1,512 | 41 |
| Heartland Express | 4,168 | 81 |
| J.B. Hunt Transport Services | 6,800 | 131 |
| Kansas City Southern Industries *§ | 3,300 | 67 |
| Knight Transportation § | 2,850 | 69 |
| Laidlaw International * | 4,200 | 101 |
| Landstar Systems * | 3,000 | 91 |
| Old Dominion Freight Line * | 1,575 | 42 |
| Overnite | 1,300 | 56 |
| Patriot Transportation Holdings * | 500 | 26 |
| Quality Distribution *§ | 1,200 | 11 |
| RailAmerica * | 2,100 | 25 |
| Swift Transportation *§ | 3,790 | 88 |
| Transport Corp. of America * | 2,100 | 14 |
| U.S. Xpress Enterprises *§ | 600 | 7 |
| USA Truck *§ | 1,000 | 25 |
| Werner Enterprises | 3,766 | 74 |
| Yellow Roadway *§ | 2,507 | 127 |
| | | 1,394 |
| Trading Companies & Distributors 0.5% | | |
| Applied Industrial Technologies | 1,200 | 39 |
| Beacon Roofing Supply * | 700 | 18 |
| Electro Rent * | 2,100 | 30 |
| Fastenal § | 3,400 | 208 |
| GATX § | 1,900 | 65 |
| Hughes Supply | 2,800 | 79 |
| Interline Brands * | 1,700 | 34 |
| Lawson Products § | 700 | 27 |
| MSC Industrial Direct | 2,700 | 91 |
| NuCo2 *§ | 1,200 | 31 |
| UAP Holding | 1,600 | 27 |
| United Rentals * | 3,300 | 67 |
| Valley National Gases | 3,400 | 52 |
| Watsco | 1,200 | 51 |
| WESCO International * | 2,300 | 72 |
| | | 891 |
| Transportation Infrastructure 0.0% | | |
| Macquarie Infrastructure Company Trust § | 1,100 | 31 |
| | | 31 |
| Total Industrials & Business Services | | 15,685 |
| |
| INFORMATION TECHNOLOGY 13.8% | | |
| Communications Equipment 1.4% | | |
| 3 Com * | 15,500 | 56 |
| ADTRAN | 3,200 | 79 |
| American Access Technologies * | 2,400 | 5 |
| Anaren * | 1,400 | 18 |
| Arris Group * | 3,800 | 33 |
| Avanex *§ | 5,800 | 5 |
| Avocent * | 2,045 | 54 |
| Aware *§ | 2,300 | 15 |
| Bel Fuse, Class A | 1,100 | 28 |
| Belden CDT | 2,875 | 61 |
| Black Box | 970 | 34 |
| C-Cor.net *§ | 3,400 | 23 |
| Carrier Access *§ | 1,900 | 9 |
| Centillium Communications * | 4,400 | 10 |
| Commscope *§ | 2,500 | 44 |
| Comtech Telecommunications * | 1,387 | 45 |
| Digi International * | 2,160 | 26 |
| Digital Lightwave *§ | 3,250 | 1 |
| ditech Communications *§ | 2,400 | 16 |
| EMS Technologies * | 400 | 6 |
| Endwave Corporation *§ | 800 | 38 |
| Enterasys Networks * | 11,500 | 10 |
| Extreme Networks * | 7,150 | 29 |
| F5 Networks * | 1,700 | 80 |
| Finisar *§ | 11,900 | 13 |
| Foundry Networks * | 6,350 | 55 |
| Harmonic *§ | 4,884 | 24 |
| Harris | 5,900 | 184 |
| Inter-Tel § | 1,400 | 26 |
| InterDigital Communication * | 3,000 | 53 |
| IXIA *§ | 3,100 | 60 |
| Juniper Networks * | 24,530 | 618 |
| MRV Communications *§ | 5,120 | 11 |
| NMS Communications *§ | 3,000 | 9 |
| Oplink Communications * | 10,800 | 19 |
| Optical Cable, Warrants, 10/24/07 * | 212 | 0 |
| Packeteer * | 2,500 | 35 |
| Paradyne Networks * | 2,700 | 5 |
| PC-Tel *§ | 2,300 | 18 |
| Performance Technologies *§ | 1,200 | 7 |
| Plantronics | 2,100 | 76 |
| Polycom * | 4,100 | 61 |
| Powerwave Technologies *§ | 5,600 | 57 |
| Proxim Corporation, Class A * | 170 | 0 |
| Redback Networks *§ | 2,774 | 18 |
| Redback Networks, Warrants, 1/2/11, Strike price, $5.00 * | 78 | 0 |
| Redback Networks, Warrants, 1/2/11, Strike price $9.50 * | 82 | 0 |
| REMEC *§ | 1,115 | 7 |
| Safenet *§ | 1,223 | 42 |
| SeaChange International *§ | 1,000 | 7 |
| Sirf Technology Holdings *§ | 3,400 | 60 |
| Sonus Networks *§ | 10,690 | 51 |
| SpectraLink § | 1,600 | 17 |
| Stratex Networks *§ | 4,110 | 7 |
| Stratos Lightwave *§ | 726 | 4 |
| Sunrise Telecom | 5,900 | 12 |
| Sycamore Networks * | 11,950 | 41 |
| Symmetricom *§ | 3,400 | 35 |
| Tekelec * | 3,000 | 50 |
| Telkonet *§ | 1,200 | 6 |
| Terayon Communication Systems *§ | 5,100 | 16 |
| Tollgrade Communications * | 650 | 5 |
| Tut Systems *§ | 130 | 0 |
| UTStarcom *§ | 4,700 | 35 |
| Verso Technology *§ | 8,496 | 2 |
| ViaSat * | 1,800 | 37 |
| Vyyo *§ | 600 | 4 |
| Westell Technologies * | 5,000 | 30 |
| WJ Communications * | 3,200 | 6 |
| Zhone Technologies *§ | 5,775 | 19 |
| | | 2,567 |
| Computers & Peripherals 1.1% | | |
| Adaptec * | 5,600 | 22 |
| Advanced Digital Info * | 3,600 | 27 |
| Avid Technology * | 1,600 | 85 |
| Brocade Communications Systems *§ | 11,840 | 46 |
| Concurrent Computer *§ | 3,700 | 8 |
| Cray *§ | 4,400 | 5 |
| Datalink * | 1,600 | 5 |
| Dataram | 1,150 | 7 |
| Diebold | 3,100 | 140 |
| Electronics for Imaging * | 2,600 | 55 |
| Emulex * | 3,820 | 70 |
| Exabyte *§ | 3,900 | 1 |
| Hutchinson Technology * | 1,400 | 54 |
| Hypercom * | 4,400 | 28 |
| Imation § | 1,400 | 54 |
| Immersion * | 2,500 | 13 |
| InFocus * | 3,800 | 16 |
| Intergraph *§ | 1,800 | 62 |
| Interphase * | 2,400 | 15 |
| Iomega *§ | 6,360 | 17 |
| Maxtor * | 9,404 | 49 |
| McDATA, Class A *§ | 7,170 | 29 |
| Mobility Electronics *§ | 2,900 | 27 |
| Overland Storage *§ | 1,600 | 15 |
| palmOne *§ | 2,050 | 61 |
| Pinnacle * | 3,300 | 18 |
| Presstek *§ | 2,700 | 31 |
| Quantum DLT & Storage Systems Group *§ | 8,600 | 26 |
| Rimage * | 1,100 | 23 |
| Sandisk * | 7,400 | 176 |
| SBS Technologies * | 1,700 | 16 |
| Seagate Technology * | 20,100 | 353 |
| Silicon Graphics *§ | 17,800 | 13 |
| Simpletech * | 5,100 | 19 |
| Socket Communications *§ | 1,200 | 1 |
| Steelcloud * | 1,800 | 4 |
| Storage Technology * | 4,900 | 178 |
| Synaptics *§ | 1,600 | 34 |
| Transact Technology *§ | 1,200 | 10 |
| UNOVA *§ | 3,300 | 88 |
| Video Display § | 1,680 | 22 |
| Western Digital * | 9,800 | 131 |
| Zoom Telephonics *§ | 1,100 | 2 |
| | | 2,056 |
| Electronic Equipment & Instruments 1.7% | | |
| Addvantage Technologies * | 1,500 | 6 |
| Aeroflex * | 3,900 | 33 |
| Agilysys § | 2,100 | 33 |
| American Technology *§ | 1,500 | 9 |
| Amphenol, Class A | 4,200 | 169 |
| Anixter International * | 1,400 | 52 |
| Applied Films * | 900 | 23 |
| Arrow Electronics * | 5,200 | 141 |
| Avnet * | 4,996 | 113 |
| AVX | 7,100 | 86 |
| BEI Technologies | 1,100 | 29 |
| Bell Microproducts *§ | 3,000 | 28 |
| Benchmark Electronics * | 2,200 | 67 |
| Brightpoint * | 1,200 | 27 |
| CalAmp *§ | 2,500 | 18 |
| CDW | 3,700 | 211 |
| Cogent *§ | 3,500 | 100 |
| Coherent * | 1,150 | 41 |
| CTS § | 2,200 | 27 |
| Cyberoptics * | 1,150 | 15 |
| Daktronics | 1,300 | 26 |
| Digital Video Systems * | 550 | 2 |
| Dionex * | 900 | 39 |
| Dolby Laboratories, Class A * | 4,500 | 99 |
| DTS *§ | 1,800 | 32 |
| Echelon *§ | 2,800 | 19 |
| Electro Scientific Industries * | 1,600 | 29 |
| Excel Technology * | 1,100 | 27 |
| FLIR Systems * | 2,800 | 84 |
| Gerber Scientific * | 2,900 | 20 |
| Global Imaging Systems * | 1,100 | 35 |
| GTSI * | 400 | 3 |
| I D Systems *§ | 400 | 6 |
| Identix *§ | 3,874 | 20 |
| Ingram Micro, Class A * | 7,100 | 111 |
| Intelli-Check *§ | 1,400 | 7 |
| Interlink Electronics *§ | 700 | 4 |
| Itron * | 1,500 | 67 |
| Keithley Instruments § | 1,600 | 25 |
| KEMET *§ | 4,800 | 30 |
| Landauer | 600 | 31 |
| LeCroy * | 1,200 | 17 |
| Lexar Media *§ | 5,700 | 28 |
| Littelfuse * | 1,300 | 36 |
| Lo-Jack *§ | 1,900 | 33 |
| Maxwell Technologies *§ | 800 | 10 |
| Merix *§ | 1,000 | 6 |
| Methode Electronics | 1,800 | 21 |
| Metrologic Instruments *§ | 1,700 | 21 |
| MTS Systems | 1,500 | 50 |
| National Instruments § | 3,400 | 72 |
| Newport * | 1,550 | 21 |
| Nu Horizons Electronics *§ | 1,400 | 9 |
| OSI Systems *§ | 1,100 | 17 |
| OYO Geospace * | 800 | 17 |
| Panavision * | 1,700 | 8 |
| Park Electrochemical | 1,200 | 30 |
| Paxar * | 2,100 | 37 |
| PC Connection *§ | 3,000 | 19 |
| Pemstar *§ | 1,500 | 2 |
| Planar Systems *§ | 900 | 7 |
| Plexus * | 1,860 | 26 |
| Radisys *§ | 2,000 | 32 |
| Research Frontiers *§ | 1,900 | 6 |
| Rogers * | 800 | 32 |
| SatCon Technology *§ | 3,200 | 5 |
| Scansource * | 700 | 30 |
| Sigmatron International *§ | 900 | 10 |
| Sirenza Microdevices *§ | 4,000 | 14 |
| Somera Communications * | 2,800 | 4 |
| Superconductor Technologies * | 800 | 1 |
| Taser International *§ | 2,700 | 27 |
| Tech Data * | 2,700 | 99 |
| Technitrol | 1,900 | 27 |
| Trans-Lux | 1,300 | 9 |
| Trimble Navigation * | 2,550 | 99 |
| TTM Technologies *§ | 3,300 | 25 |
| Vishay Intertechnology * | 12,158 | 144 |
| Woodhead Industries | 500 | 6 |
| X-Rite | 1,700 | 20 |
| Zomax * | 800 | 2 |
| Zygo * | 1,800 | 18 |
| | | 3,041 |
| Internet Software & Services 3.5% | | |
| 24/7 Media *§ | 2,520 | 10 |
| Akamai Technologies * | 5,878 | 77 |
| aQuantive *§ | 4,300 | 76 |
| Ariba *§ | 3,447 | 20 |
| Ask Jeeves *§ | 2,900 | 88 |
| Autobytel *§ | 2,900 | 14 |
| Broadvision *§ | 4,288 | 5 |
| Chordiant Software * | 6,020 | 12 |
| CMGI *§ | 17,668 | 33 |
| CNET Networks * | 7,471 | 88 |
| Corillian * | 3,000 | 9 |
| Digital Insight * | 1,431 | 34 |
| Digital River *§ | 1,300 | 41 |
| Digitas * | 5,292 | 60 |
| DoubleClick * | 6,192 | 52 |
| Earthlink * | 8,320 | 72 |
| Entrust Technologies * | 2,500 | 12 |
| Google, Class A * | 12,620 | 3,712 |
| HomeStore.com * | 10,900 | 22 |
| IAC/InterActiveCorp *§ | 31,411 | 756 |
| Infospace.com *§ | 1,485 | 49 |
| Interland * | 2,970 | 6 |
| Internap Network Services *§ | 16,900 | 8 |
| Interwoven * | 3,766 | 28 |
| Ivillage * | 5,200 | 31 |
| J2 Global Communications *§ | 1,500 | 52 |
| Jupitermedia * | 1,400 | 24 |
| Kana Software *§ | 4,567 | 7 |
| LookSmart * | 11,500 | 9 |
| Marchex, Class B *§ | 1,800 | 27 |
| MatrixOne * | 5,400 | 27 |
| Neoforma.com *§ | 1,200 | 8 |
| Net2Phone *§ | 4,300 | 8 |
| NetRatings *§ | 2,700 | 37 |
| Niku * | 1,000 | 21 |
| Openwave Systems * | 2,887 | 47 |
| RealNetworks *§ | 7,900 | 39 |
| Register.com * | 2,545 | 19 |
| S1 *§ | 3,500 | 17 |
| SeeBeyond Technology *§ | 5,900 | 25 |
| Sonicwall * | 4,800 | 26 |
| Stellent * | 2,000 | 15 |
| Support.com *§ | 2,800 | 15 |
| The Knot *§ | 1,500 | 10 |
| Travelzoo * | 800 | 26 |
| Tumbleweed Communications *§ | 3,800 | 10 |
| United Online | 4,100 | 45 |
| Valueclick * | 3,600 | 44 |
| VeriSign * | 11,188 | 322 |
| Vignette *§ | 1,624 | 18 |
| Vitria Technology *§ | 2,950 | 10 |
| Webex Communications *§ | 2,000 | 53 |
| webMethods *§ | 3,208 | 18 |
| Websense * | 900 | 43 |
| Zixit *§ | 900 | 3 |
| | | 6,340 |
| IT Services 1.8% | | |
| Acxiom | 4,400 | 92 |
| Alliance Data Systems * | 3,400 | 138 |
| AnswerThink *§ | 4,700 | 17 |
| Anteon International * | 1,600 | 73 |
| BearingPoint *§ | 8,700 | 64 |
| BISYS Group * | 5,600 | 84 |
| CACI International, Class A * | 1,400 | 88 |
| Ceridian * | 6,500 | 127 |
| Certegy | 3,300 | 126 |
| Checkfree * | 4,000 | 136 |
| CIBER *§ | 3,600 | 29 |
| Cognizant Technology Solutions * | 5,600 | 264 |
| Computer Horizons * | 3,300 | 10 |
| CSG Systems International * | 2,600 | 49 |
| DST Systems * | 3,640 | 170 |
| Edgewater Technology * | 3,967 | 17 |
| EFunds * | 2,100 | 38 |
| Electronic Clearing House * | 1,200 | 11 |
| Euronet Worldwide * | 1,200 | 35 |
| Forrester Research * | 1,900 | 34 |
| Gartner Group, Class B * | 4,700 | 50 |
| Global Payments | 1,780 | 121 |
| Hewitt Associates, Class A *§ | 4,940 | 131 |
| Igate Capital *§ | 5,800 | 21 |
| Indus International * | 2,900 | 7 |
| Inforte | 2,200 | 7 |
| InfoUSA | 3,100 | 36 |
| Integral Systems | 400 | 9 |
| Intrado *§ | 1,800 | 27 |
| Iron Mountain * | 5,470 | 170 |
| Kanbay International * | 1,000 | 23 |
| Keane * | 2,860 | 39 |
| Lightbridge * | 2,438 | 15 |
| Man Tech, Class A * | 1,400 | 44 |
| Management Network Group *§ | 100 | 0 |
| Maximus | 1,400 | 49 |
| Medquist * | 1,082 | 14 |
| MPS Group * | 3,600 | 34 |
| Pegasus Solutions *§ | 2,100 | 23 |
| Perot Systems, Class A * | 5,400 | 77 |
| Rainmaker Systems * | 7,200 | 4 |
| RightNow Technologies *§ | 2,100 | 25 |
| Safeguard Scientifics * | 9,900 | 13 |
| Sapient * | 5,000 | 40 |
| SRA International, Class A * | 2,400 | 83 |
| Startek § | 1,500 | 25 |
| Sykes Enterprises * | 3,400 | 32 |
| Syntel § | 2,100 | 34 |
| TALX Corporation | 1,710 | 50 |
| Technology Solutions * | 5,200 | 3 |
| Tier Technologies, Class B * | 600 | 5 |
| Titan * | 3,449 | 78 |
| TNS * | 2,100 | 49 |
| Total System Services § | 8,600 | 207 |
| Verifone Holdings * | 2,900 | 47 |
| | | 3,194 |
| Office Electronics 0.1% | | |
| Zebra Technologies * | 3,450 | 151 |
| | | 151 |
| Semiconductor & Semiconductor Equipment 2.0% | | |
| Actel * | 1,600 | 22 |
| Advanced Energy Industries *§ | 2,900 | 23 |
| Advanced Power Technology *§ | 400 | 3 |
| Aehr Test Systems * | 1,600 | 5 |
| Agere Systems *§ | 6,770 | 81 |
| Alliance Semiconductor * | 3,100 | 8 |
| AMIS Holdings * | 3,900 | 52 |
| Amkor Technology *§ | 7,800 | 35 |
| Amtech Systems *§ | 1,600 | 8 |
| ANADIGICS *§ | 2,595 | 5 |
| Asyst Technology * | 4,000 | 18 |
| Atheros Communications *§ | 3,500 | 28 |
| Atmel * | 20,900 | 50 |
| ATMI * | 1,200 | 35 |
| Axcelis Technologies * | 3,600 | 25 |
| Brooks-Pri Automation * | 1,764 | 26 |
| Cabot Microelectronics *§ | 1,232 | 36 |
| California Micro Devices *§ | 2,300 | 13 |
| Catalyst Semiconductor * | 1,600 | 7 |
| Celeritek | 1,100 | 0 |
| CEVA * | 1,600 | 9 |
| Cirrus Logic * | 4,800 | 25 |
| Cognex | 2,100 | 55 |
| Cohu | 1,800 | 36 |
| Conexant Systems * | 19,381 | 31 |
| Credence Systems *§ | 3,800 | 34 |
| Cymer *§ | 1,600 | 42 |
| Cypress Semiconductor *§ | 5,700 | 72 |
| DSP Group * | 1,500 | 36 |
| Electroglas *§ | 2,400 | 7 |
| EMCORE *§ | 4,800 | 20 |
| Entegris * | 3,300 | 33 |
| ESS Technology *§ | 2,300 | 10 |
| Exar * | 2,600 | 39 |
| Fairchild Semiconductor, Class A * | 5,310 | 78 |
| FEI *§ | 2,000 | 46 |
| FSI International * | 2,200 | 8 |
| Genesis Microchip * | 1,900 | 35 |
| Helix Technology | 1,800 | 24 |
| hi/fn * | 409 | 2 |
| Integrated Circuit Systems * | 3,900 | 80 |
| Integrated Device Technology * | 4,700 | 50 |
| Integrated Silicon Solution *§ | 3,700 | 27 |
| International Rectifier * | 3,100 | 148 |
| Intersil Holding, Class A | 6,120 | 115 |
| Intevac *§ | 900 | 9 |
| Kopin * | 6,800 | 35 |
| Kulicke & Soffa *§ | 4,200 | 33 |
| Lam Research * | 5,850 | 169 |
| Lattice Semiconductor * | 5,640 | 25 |
| LTX * | 3,900 | 19 |
| Mattson Technology *§ | 2,913 | 21 |
| MEMC Electronic Materials * | 8,600 | 136 |
| Micrel *§ | 4,280 | 49 |
| Micro Component Technology * | 3,100 | 1 |
| Microchip Technology | 9,649 | 286 |
| Microsemi * | 3,400 | 64 |
| Mindspeed Technologies *§ | 5,700 | 7 |
| MKS Instruments * | 2,400 | 41 |
| Monolithic System Technology *§ | 3,500 | 18 |
| Mykrolis *§ | 2,400 | 34 |
| Nanometrics *§ | 1,100 | 14 |
| NVE *§ | 300 | 5 |
| Omnivision Technologies *§ | 3,600 | 49 |
| ON Semiconductor * | 10,900 | 50 |
| PDF Solutions * | 2,000 | 26 |
| Pericom Semiconductor * | 2,600 | 21 |
| Photronics * | 1,710 | 40 |
| Pixelworks *§ | 2,700 | 23 |
| PLX Technology *§ | 2,400 | 24 |
| Power Integrations * | 1,900 | 41 |
| Rambus *§ | 4,380 | 59 |
| RF Micro Devices *§ | 8,200 | 45 |
| Rudolph Technologies * | 1,800 | 26 |
| Semitool * | 2,600 | 25 |
| Semtech * | 3,400 | 57 |
| Sigma Designs *§ | 1,600 | 12 |
| Silicon Image * | 4,100 | 42 |
| Silicon Laboratories *§ | 2,300 | 60 |
| Silicon Storage Technology *§ | 6,200 | 25 |
| Sipex *§ | 3,100 | 5 |
| Skyworks Solutions *§ | 7,000 | 52 |
| SRS Labs * | 2,700 | 16 |
| STATS ChipPAC ADR *§ | 4,437 | 32 |
| Tessera Technologies * | 2,400 | 80 |
| Therma-Wave *§ | 3,500 | 8 |
| Transmeta *§ | 14,100 | 9 |
| TranSwitch *§ | 7,400 | 15 |
| TriQuint Semiconductor *§ | 8,980 | 30 |
| Ultratech Stepper * | 800 | 15 |
| Varian Semiconductor Equipment * | 1,600 | 59 |
| Veeco *§ | 1,129 | 18 |
| Virage Logic * | 2,100 | 22 |
| Vitesse Semiconductor *§ | 10,031 | 21 |
| Zoran * | 2,448 | 33 |
| | | 3,548 |
| Software 2.2% | | |
| Activision * | 7,800 | 129 |
| Actuate *§ | 2,700 | 5 |
| Advent Software * | 1,700 | 34 |
| Agile Software * | 3,000 | 19 |
| Altiris * | 1,200 | 18 |
| Ansoft * | 1,100 | 27 |
| Ansys * | 1,400 | 50 |
| Applix *§ | 1,200 | 6 |
| ARI Network Services * | 3,100 | 8 |
| Aspect Telecommunications * | 3,000 | 34 |
| Aspen Technology *§ | 3,400 | 18 |
| Atari * | 4,700 | 13 |
| AuthentiDate Holding *§ | 3,900 | 10 |
| BEA Systems * | 16,900 | 148 |
| Borland Software * | 3,900 | 27 |
| Bottomline Technologies *§ | 2,000 | 30 |
| Cadence Design Systems * | 11,877 | 162 |
| Captaris * | 2,600 | 11 |
| Captiva Software *§ | 500 | 7 |
| Catapult Communications * | 1,100 | 19 |
| CCC Information Services * | 1,307 | 31 |
| Datastream *§ | 1,500 | 11 |
| Digimarc * | 1,100 | 6 |
| DocuCorp International * | 2,200 | 16 |
| E.piphany * | 7,140 | 25 |
| ebix.com *§ | 800 | 11 |
| Embarcadero * | 2,600 | 15 |
| Epicor Software *§ | 4,000 | 53 |
| EPIQ Systems *§ | 1,000 | 16 |
| EPlus * | 300 | 3 |
| Evans & Sutherland Computer * | 600 | 3 |
| Evolving Systems *§ | 1,300 | 4 |
| FactSet Research Systems § | 1,950 | 70 |
| Fair Isaac | 3,005 | 110 |
| Falconstor Software *§ | 2,400 | 16 |
| FileNet * | 1,500 | 38 |
| Guardian Technologies *§ | 1,500 | 4 |
| Hyperion Solutions * | 2,000 | 80 |
| Informatica * | 4,400 | 37 |
| Internet Security Systems * | 2,850 | 58 |
| Jack Henry & Associates | 3,600 | 66 |
| JDA Software Group * | 1,400 | 16 |
| Kronos * | 1,450 | 59 |
| Lawson Software *§ | 4,400 | 23 |
| Macromedia * | 3,510 | 134 |
| Macrovision * | 2,600 | 59 |
| Manhattan Associates * | 900 | 17 |
| Manugistics Group * | 5,100 | 9 |
| MapInfo * | 1,575 | 17 |
| McAfee * | 6,672 | 175 |
| Mentor Graphics * | 2,700 | 28 |
| Micromuse * | 4,560 | 26 |
| MICROS Systems * | 1,400 | 63 |
| MicroStrategy *§ | 700 | 37 |
| Midway Games *§ | 2,879 | 32 |
| Moldflow * | 1,200 | 15 |
| Motive * | 2,500 | 25 |
| MRO Software * | 900 | 13 |
| MSC.Software *§ | 1,900 | 26 |
| Napster *§ | 2,400 | 10 |
| NAVTEQ * | 4,100 | 152 |
| NEON Systems * | 1,200 | 4 |
| netGuru * | 2,400 | 2 |
| NetIQ * | 2,358 | 27 |
| Nuance Communications *§ | 3,200 | 14 |
| NYFIX *§ | 850 | 5 |
| ONYX Software *§ | 625 | 2 |
| Open Solutions *§ | 1,000 | 20 |
| OPNET Technologies * | 2,000 | 16 |
| Opsware *§ | 5,400 | 28 |
| Palmsource *§ | 902 | 8 |
| Pegasystems *§ | 2,200 | 13 |
| Phoenix Technologies * | 1,200 | 9 |
| PLATO Learning *§ | 2,266 | 17 |
| Portal Software *§ | 4,160 | 8 |
| Progress Software * | 1,800 | 54 |
| Quality Systems § | 1,000 | 47 |
| Quest Software * | 3,900 | 53 |
| Radiant Systems * | 2,850 | 32 |
| Red Hat *§ | 8,500 | 111 |
| Renaissance Learning § | 1,900 | 39 |
| Reynolds & Reynolds, Class A | 3,300 | 89 |
| RSA Security * | 2,950 | 34 |
| Salesforce.com *§ | 5,500 | 113 |
| ScanSoft *§ | 7,400 | 28 |
| SCO Group *§ | 1,200 | 5 |
| Secure Computing * | 2,400 | 26 |
| SERENA Software *§ | 2,000 | 39 |
| Sonic Solutions *§ | 1,300 | 24 |
| SPSS * | 1,600 | 31 |
| Sybase * | 3,972 | 73 |
| Synopsys * | 6,866 | 114 |
| Take-Two Interactive Software *§ | 2,900 | 74 |
| Telecommunication Systems *§ | 600 | 1 |
| THQ *§ | 1,825 | 53 |
| TIBCO Software * | 9,050 | 59 |
| Transaction Systems Architects, Class A * | 2,100 | 52 |
| Ulticom * | 2,200 | 23 |
| Ultimate Software Group * | 3,500 | 57 |
| VA Software *§ | 2,600 | 4 |
| Verint Systems * | 1,300 | 42 |
| Verity * | 3,300 | 29 |
| Viewpoint Corporation *§ | 4,300 | 8 |
| Visual Networks *§ | 1,200 | 2 |
| WatchGuard Technologies * | 2,100 | 8 |
| Wind River Systems * | 3,776 | 59 |
| Witness Systems * | 1,500 | 27 |
| | | 3,967 |
| Total Information Technology | | 24,864 |
| |
| MATERIALS 3.5% | | |
| Chemicals 1.6% | | |
| A. Schulman | 1,600 | 29 |
| Airgas | 3,300 | 81 |
| Albermarle | 2,000 | 73 |
| Altair Nanotechnologies *§ | 3,400 | 10 |
| Arch Chemicals | 1,150 | 29 |
| Cabot | 3,100 | 102 |
| Calgon Carbon § | 3,500 | 31 |
| Cambrex | 1,500 | 29 |
| Celanese, Series A * | 7,000 | 111 |
| CFC International *§ | 1,200 | 23 |
| Chemtura | 4,124 | 58 |
| Cytec Industries | 1,600 | 64 |
| Ferro | 1,800 | 36 |
| FMC * | 1,700 | 95 |
| Georgia Gulf | 1,700 | 53 |
| H.B. Fuller | 1,120 | 38 |
| Huntsman * | 9,600 | 195 |
| ICO * | 5,500 | 12 |
| Kronos Worldwide § | 2,111 | 64 |
| Lesco * | 1,200 | 15 |
| Lubrizol | 2,900 | 122 |
| Lyondell Chemical | 10,645 | 281 |
| Macdermid | 1,400 | 44 |
| Minerals Technologies | 900 | 55 |
| Mosaic * | 16,000 | 249 |
| Nalco Holding * | 6,300 | 124 |
| Nanophase Technologies *§ | 2,300 | 14 |
| NL Industries | 2,300 | 35 |
| Olin | 3,700 | 68 |
| OM Group * | 1,100 | 27 |
| OMNOVA Solutions * | 4,300 | 20 |
| PolyOne * | 4,400 | 29 |
| RPM | 4,700 | 86 |
| Scotts Miracle Gro * | 1,300 | 93 |
| Sensient Technologies | 2,100 | 43 |
| Spartech | 1,600 | 29 |
| Symyx Technologies * | 1,350 | 38 |
| Terra Nitrogen * | 2,800 | 77 |
| Valhi § | 4,700 | 82 |
| Valspar | 2,300 | 111 |
| W. R. Grace *§ | 4,800 | 37 |
| Wellman | 1,800 | 18 |
| Westlake Chemical | 2,700 | 66 |
| | | 2,896 |
| Construction Materials 0.4% | | |
| Devcon International *§ | 2,100 | 22 |
| Eagle Materials § | 800 | 74 |
| Florida Rock Industries | 1,925 | 141 |
| Headwaters *§ | 2,000 | 69 |
| Lafarge | 3,200 | 200 |
| Martin Marietta Materials | 2,100 | 145 |
| Texas Industries | 800 | 45 |
| US Concrete *§ | 3,700 | 24 |
| | | 720 |
| Containers & Packaging 0.5% | | |
| Aptargroup | 1,600 | 81 |
| Caraustar *§ | 1,800 | 19 |
| Chesapeake Corp. | 600 | 12 |
| Crown Cork & Seal * | 8,200 | 117 |
| Graphic Packaging *§ | 8,400 | 31 |
| Greif Brothers | 1,100 | 67 |
| Longview Fibre | 2,100 | 43 |
| Myers Industries § | 2,710 | 34 |
| Owens-Illinois * | 7,100 | 178 |
| Packaging Corp. of America | 4,700 | 99 |
| Packaging Dynamics § | 1,580 | 22 |
| Rock-Tenn, Class A | 1,800 | 23 |
| Silgan Holdings | 1,100 | 62 |
| Smurfit-Stone Container * | 10,800 | 110 |
| Sonoco Products | 4,360 | 115 |
| | | 1,013 |
| Metals & Mining 0.8% | | |
| AK Steel *§ | 5,844 | 37 |
| Carpenter Technology | 1,100 | 57 |
| Century Aluminum *§ | 2,200 | 45 |
| Cleveland-Cliffs § | 1,300 | 75 |
| Coeur d'Alene Mines *§ | 8,600 | 31 |
| Commercial Metals | 2,500 | 60 |
| Compass Minerals | 1,300 | 30 |
| Gibraltar Industries | 1,950 | 36 |
| Glamis Gold *§ | 5,700 | 98 |
| Hecla Mining *§ | 8,600 | 39 |
| Meridian Gold * | 4,200 | 76 |
| Mittal Steel § | 2,455 | 58 |
| NN | 1,700 | 22 |
| Northwest Pipe * | 1,400 | 33 |
| Oregon Steel Mills *§ | 2,000 | 34 |
| Quanex | 1,450 | 77 |
| Reliance Steel & Aluminum § | 1,700 | 63 |
| Royal Gold § | 1,700 | 34 |
| Southern Peru Copper | 6,600 | 283 |
| Steel Dynamics § | 2,200 | 58 |
| Steel Technologies | 1,100 | 19 |
| Stillwater Mining *§ | 4,717 | 35 |
| Synalloy *§ | 1,500 | 15 |
| U.S. Gold * | 4,300 | 2 |
| Universal Stainless & Alloy Products * | 2,900 | 35 |
| Worthington Industries § | 4,000 | 63 |
| | | 1,415 |
| Paper & Forest Products 0.2% | | |
| Badger Paper Mills * | 1,900 | 7 |
| Bowater | 2,300 | 74 |
| Buckeye Technologies * | 3,100 | 25 |
| Deltic Timber | 700 | 27 |
| FiberMark * | 1,800 | 0 |
| MAXXAM * | 1,500 | 35 |
| P. H. Glatfelter | 2,200 | 27 |
| Pope & Talbot | 1,600 | 18 |
| Potlatch | 1,300 | 68 |
| Schweitzer Mauduit | 1,100 | 34 |
| Wausau Paper | 2,300 | 27 |
| | | 342 |
| Total Materials | | 6,386 |
| TELECOMMUNICATION SERVICES 1.9% | | |
| Diversified Telecommunication Services 0.7% | | |
| Acceris Communications *§ | 900 | 0 |
| Alaska Communications Systems Group § | 2,700 | 27 |
| Broadwing *§ | 2,490 | 12 |
| Cincinnati Bell * | 9,448 | 41 |
| Commonwealth Telephone Enterprises | 1,100 | 46 |
| Covad Communications Group *§ | 13,362 | 19 |
| CT Communications | 1,900 | 25 |
| D&E Communications | 2,009 | 19 |
| General Communications, Class A * | 3,600 | 36 |
| Hickory Technology | 1,900 | 15 |
| IDT * | 3,800 | 50 |
| Level 3 Communications *§ | 30,900 | 63 |
| Lynch Interactive *§ | 700 | 16 |
| MCI *§ | 14,700 | 378 |
| McLeodUSA, Class A * | 3,461 | 0 |
| McLeodUSA, Class A, Escrow *§ | 16,412 | 0 |
| NTL * | 3,800 | 260 |
| Panamsat Holding § | 5,500 | 113 |
| Premiere Global Services * | 3,300 | 37 |
| Primus Telecommunications *§ | 6,500 | 4 |
| Surewest Communications § | 1,100 | 28 |
| Time Warner Telecom, Class A *§ | 7,260 | 43 |
| US LEC, Class A *§ | 1,800 | 4 |
| Valor Communications § | 3,500 | 48 |
| XETA Technologies * | 2,400 | 7 |
| | | 1,291 |
| Wireless Telecommunication Services 1.2% | | |
| @Road * | 4,900 | 13 |
| Alamosa Holdings *§ | 5,800 | 81 |
| American Tower Systems, Class A *§ | 9,900 | 208 |
| Boston Communications Group *§ | 2,400 | 5 |
| Centennial Communications *§ | 6,500 | 90 |
| Crown Castle International * | 9,600 | 195 |
| Dobson Communications, Class A *§ | 9,600 | 41 |
| Metro One Telecommunications *§ | 1,050 | 1 |
| Nextel Partners, Class A *§ | 8,400 | 211 |
| NII Holdings, Class B *§ | 3,100 | 198 |
| Price Communications *§ | 2,450 | 42 |
| Rural Cellular, Class A *§ | 1,700 | 9 |
| SBA Communications *§ | 2,800 | 38 |
| Skyterra Communications * | 2,000 | 73 |
| SpectraSite * | 2,200 | 164 |
| SunCom Wireless Holdings * | 7,600 | 16 |
| Syniverse Holdings * | 3,400 | 48 |
| Telephone & Data Systems § | 2,500 | 102 |
| Telephone & Data Systems (Special Shares) | 2,500 | 96 |
| U. S. Cellular * | 3,900 | 195 |
| Ubiquital * | 4,700 | 38 |
| US Unwired, Class A *§ | 5,500 | 32 |
| Western Wireless, Class A * | 4,300 | 182 |
| Wireless Facilities *§ | 4,600 | 29 |
| | | 2,107 |
| Total Telecommunication Services | | 3,398 |
| |
| UTILITIES 3.0% | | |
| Electric Utilities 1.1% | | |
| ALLETE | 1,500 | 75 |
| Alliant | 4,900 | 138 |
| Central Vermont Public Service § | 1,100 | 20 |
| CH Energy Group § | 1,000 | 49 |
| Cleco | 2,200 | 47 |
| DPL | 6,100 | 167 |
| DQE § | 3,300 | 62 |
| El Paso Electric * | 2,200 | 45 |
| Empire District Electronics | 1,600 | 38 |
| Great Plains Energy § | 3,200 | 102 |
| Hawaiian Electric Industries § | 3,500 | 94 |
| IdaCorp | 1,500 | 46 |
| Madison Gas and Electric § | 1,200 | 44 |
| Maine Maritimes | 100 | 2 |
| Northeast Utilities | 5,800 | 121 |
| NSTAR | 4,430 | 137 |
| Otter Tail | 1,000 | 27 |
| Potomac Electric Power | 7,900 | 189 |
| Public Service of New Mexico | 3,200 | 92 |
| Reliant Resources * | 12,500 | 155 |
| Sierra Pacific Resources *§ | 5,300 | 66 |
| Unisource Energy | 1,500 | 46 |
| United Illuminating | 800 | 43 |
| Unitil | 800 | 22 |
| Westar Energy | 3,900 | 94 |
| | | 1,921 |
| Gas Utilities 1.0% | | |
| AGL Resources | 3,500 | 135 |
| Atmos Energy | 3,400 | 98 |
| Cascade Natural Gas § | 1,100 | 23 |
| Chesapeake Utilities § | 800 | 24 |
| Energen | 3,000 | 105 |
| EnergySouth § | 850 | 24 |
| Equitable Resources | 2,900 | 197 |
| Laclede Gas | 900 | 29 |
| National Fuel Gas Company | 4,100 | 119 |
| New Jersey Resources | 1,500 | 72 |
| Northwest Natural Gas § | 900 | 34 |
| ONEOK | 4,100 | 134 |
| Piedmont Natural Gas Company § | 3,200 | 77 |
| Questar | 4,000 | 264 |
| RGC Resources | 700 | 18 |
| SEMCO Energy *§ | 3,000 | 18 |
| South Jersey Industries § | 700 | 43 |
| Southern Union | 3,921 | 96 |
| Southwest Gas | 1,500 | 38 |
| UGI | 3,900 | 109 |
| Washington Gas Light | 2,600 | 87 |
| | | 1,744 |
| Independent Power Producers & Energy Traders 0.1% | | |
| Baycorp Holdings * | 662 | 8 |
| Black Hills | 1,500 | 55 |
| NRG Energy * | 4,800 | 181 |
| Ormat Technologies | 1,300 | 25 |
| | | 269 |
| Multi-Utilities 0.7% | | |
| Aquila *§ | 6,788 | 24 |
| Avista | 2,300 | 43 |
| Energy East | 6,100 | 177 |
| Florida Public Utilities | 1,033 | 20 |
| MDU Resources Group | 4,750 | 134 |
| OGE Energy | 4,000 | 116 |
| Puget Energy | 4,600 | 107 |
| SCANA | 5,010 | 214 |
| Vectren | 3,399 | 98 |
| Wisconsin Energy | 5,500 | 214 |
| WPS Resources § | 1,700 | 96 |
| | | 1,243 |
| Water Utilities 0.1% | | |
| Aqua America | 4,251 | 127 |
| California Water Service Group | 1,200 | 45 |
| Connecticut Water Service § | 850 | 21 |
| Pennichuck § | 266 | 5 |
| | | 198 |
| Total Utilities | | 5,375 |
| Total Common Stocks (Cost $141,088) | | 171,193 |
| |
| CONVERTIBLE PREFERRED STOCKS 0.0% | | |
| Simon Property Group § | 600 | 37 |
| Total Convertible Preferred Stocks (Cost $32) | | 37 |
| SHORT-TERM INVESTMENTS 4.7% | | | |
| Money Market Fund 4.5% | | | |
| T. Rowe Price Reserve Investment Fund, 3.14% #† | 8,179,223 | | 8,179 |
| | | | 8,179 |
| U.S. Treasury Obligations 0.2% | | | |
| U.S. Treasury Bills, 2.602%, 7/7/05 ++ | 400,000 | | 400 |
| | | | 400 |
| Total Short-Term Investments (Cost $8,579) | | | 8,579 |
| |
| FUTURES CONTRACTS 0.0% | | | |
| Variation margin receivable (payable) on open futures contracts (2) | | | (28) |
| Total Futures Contracts | | | (28) |
| |
| SECURITIES LENDING COLLATERAL 22.7% | | | |
| Money Market Trust 22.7% | | | |
| State Street Bank and Trust Company of New Hampshire N.A. | | | |
| Securities Lending Quality Trust units, 3.194% # | 40,766,984 | | 40,767 |
| Total Securities Lending Collateral (Cost $40,767) | | | 40,767 |
| |
| Total Investments in Securities | | | |
| 122.6% of Net Assets (Cost $190,466) | | | $ 220,548 |
| (1) | Denominated in U.S. dollars unless other- |
| | wise noted |
| # | Seven-day yield |
| * | Non-income producing |
| § | All or a portion of this security is on loan at |
| | June 30, 2005—See Note 2 |
| ++ | All or a portion of this security is pledged to |
| | cover margin requirements on futures con- |
| | tracts at June 30, 2005. |
| † | Affiliated company – See Note 4 |
| ADR | American Depository Receipts |
| REIT | Real Estate Investment Trust |
| (2) Open Futures Contracts at June 30, 2005 were as follows: |
| ($ 000s) | | | | | |
| | | | Contract | | Unrealized |
| | Expiration | | Value | | Gain (Loss) |
| Long, 29 S & P Mini 500 Index contracts, | | | | | |
| $99 par of 2.602% U.S. Treasury Bills | | | | | |
| pledged as initial margin | 9/05 | $ | 1,733 | $ | (16) |
| Long, 44 Russell Mini 2000 Index | | | | | |
| contracts, $129 par of 2.602% U.S. | | | | | |
| Treasury Bills pledged as initial margin | 9/05 | | 2,830 | | 74 |
| Long, 59 S & P Midcap Mini 400 Index | | | | | |
| contracts, $172 par of 2.602% U.S. | | | | | |
| Treasury Bills pledged as initial margin | 9/05 | | 4,061 | | 32 |
| Net payments (receipts) of variation | | | | | |
| margin to date | | | | | (118) |
| Variation margin receivable (payable) | | | | | |
| on open futures contracts | | | | $ | (28) |
The accompanying notes are an integral part of these financial statements.
Unaudited
| STATEMENT OF ASSETS AND LIABILITIES |
| (In thousands except shares and per share amounts) | | |
| | | |
| Assets | | |
| Investments in securities, at value | | |
| Affiliated companies (cost $8,179) | $ | 8,179 |
| Non-affiliated companies (cost $182,287) | | 212,369 |
|
|
| Total investments in securities | | 220,548 |
| Dividends and interest receivable | | 169 |
| Receivable for investment securities sold | | 135 |
| Receivable for shares sold | | 204 |
|
|
| Total assets | | 221,056 |
|
|
| |
| |
| Liabilities | | |
| Payable for investment securities purchased | | 144 |
| Payable for shares redeemed | | 167 |
| Obligation to return securities lending collateral | | 40,767 |
| Due to affiliates | | 87 |
| Other liabilities | | 18 |
|
|
| Total liabilities | | 41,183 |
|
|
| |
| NET ASSETS | $ | 179,873 |
|
|
| Net Assets Consist of: | | |
| Undistributed net investment income (loss) | $ | 777 |
| Undistributed net realized gain (loss) | | (11,922) |
| Net unrealized gain (loss) | | 30,201 |
| Paid-in-capital applicable to 13,295,385 shares of | | |
| $0.0001 par value capital stock outstanding; | | |
| 1,000,000,000 shares of the Corporation authorized | | 160,817 |
|
|
| |
| NET ASSETS | $ | 179,873 |
|
|
| |
| NET ASSET VALUE PER SHARE | $ | 13.53 |
|
|
The accompanying notes are an integral part of these financial statements.
Unaudited
| STATEMENT OF OPERATIONS |
| ($ 000s) | | |
| | |
| | | 6 Months |
| | | Ended |
| | | 6/30/05 |
| Investment Income (Loss) | | |
| Income | | |
| Dividend | $ | 938 |
| Securities lending | | 58 |
| Interest | | 4 |
|
|
| Total income | | 1,000 |
| Investment management and administrative expense | | 331 |
|
|
| Net investment income (loss) | | 669 |
|
|
| |
| Realized and Unrealized Gain (Loss) | | |
| Net realized gain (loss) | | |
| Securities | | 1,781 |
| Futures | | 71 |
|
|
| | |
| Net realized gain (loss) | | 1,852 |
|
|
| Change in net unrealized gain (loss) | | |
| Securities | | 1,505 |
| Futures | | 2 |
|
|
| Change in net unrealized gain (loss) | | 1,507 |
|
|
| Net realized and unrealized gain (loss) | | 3,359 |
|
|
| |
| INCREASE (DECREASE) IN NET | | |
| ASSETS FROM OPERATIONS | $ | 4,028 |
|
|
The accompanying notes are an integral part of these financial statements.
Unaudited
| STATEMENT OF CHANGES IN NET ASSETS |
| ($ 000s) | | | | |
| | | | |
| | | 6 Months | | Year |
| | | Ended | | Ended |
| | | 6/30/05 | | 12/31/04 |
| |
| Increase (Decrease) in Net Assets | | | | |
| Operations | | | | |
| Net investment income (loss) | $ | 669 | $ | 1,128 |
| Net realized gain (loss) | | 1,852 | | 3,712 |
| Change in net unrealized gain (loss) | | 1,507 | | 19,303 |
|
|
| Increase (decrease) in net assets from operations | | 4,028 | | 24,143 |
|
|
| |
| Distributions to shareholders | | | | |
| Net investment income | | – | | (1,093) |
|
|
| |
| Capital share transactions * | | | | |
| Shares sold | | 32,855 | | 54,554 |
| Distributions reinvested | | – | | 1,060 |
| Shares redeemed | | (18,132) | | (36,433) |
| Redemption fees received | | 4 | | 7 |
|
|
| Increase (decrease) in net assets from capital | | | | |
| share transactions | | 14,727 | | 19,188 |
|
|
| |
| Net Assets | | | | |
| Increase (decrease) during period | | 18,755 | | 42,238 |
| Beginning of period | | 161,118 | | 118,880 |
|
|
| |
| End of period | $ | 179,873 | $ | 161,118 |
|
|
| (Including undistributed net investment income of | | | | |
| $777 at 6/30/05 and $108 at 12/31/04) | | | | |
| |
| *Share information | | | | |
| Shares sold | | 2,549 | | 4,604 |
| Distributions reinvested | | – | | 81 |
| Shares redeemed | | (1,411) | | (3,077) |
|
|
| Increase (decrease) in shares outstanding | | 1,138 | | 1,608 |
The accompanying notes are an integral part of these financial statements.
Unaudited
| NOTES TO FINANCIAL STATEMENTS |
NOTE 1 - SIGNIFICANT ACCOUNTING POLICIES
T. Rowe Price Index Trust, Inc. (the trust) is registered under the Investment Company Act of 1940 (the 1940 Act). The Extended Equity Market Index Fund (the fund), a diversified, open-end management investment company, is one portfolio established by the trust. The fund commenced operations on January 30, 1998. The fund seeks to match the performance of the U.S. stocks not included in the Standard & Poor’s 500 Stock Index®, as represented by the Dow Jones Wilshire 4500 Completion Index.
The accompanying financial statements were prepared in accordance with accounting principles generally accepted in the United States of America, which require the use of estimates made by fund management. Fund management believes that estimates and security valuations are appropriate; however actual results may differ from those estimates, and the security valuations reflected in the financial statements may differ from the value the fund receives upon sale of the securities.
Valuation The fund values its investments and computes its net asset value per share at the close of the New York Stock Exchange (NYSE), normally 4 p.m. ET, each day that the NYSE is open for business. Equity securities listed or regularly traded on a securities exchange or in the over-the-counter market are valued at the last quoted sale price at the time the valuations are made, except for OTC Bulletin Board securities, which are valued at the mean of the latest bid and asked prices. A security that is listed or traded on more than one exchange is valued at the quotation on the exchange determined to be the primary market for such security. Listed securities not traded on a particular day are valued at the mean of the latest bid and asked prices. Debt securities with original maturities of less than one year are valued at amortized cost in local currency, which approximates fair value when combined with accrued interest.
Investments in mutual funds are valued at the mutual fund’s closing net asset value per share on the day of valuation. Financial futures contracts are valued at closing settlement prices.
Other investments, including restricted securities, and those for which the above valuation procedures are inappropriate or are deemed not to reflect fair value are stated at fair value as determined in good faith by the T. Rowe Price Valuation Committee, established by the fund’s Board of Trustees.
Redemption Fees A 0.5% fee is assessed on redemptions of fund shares held less than 90 days/3 months to deter short-term trading and protect the interests of long-term shareholders. Redemption fees are withheld from proceeds that shareholders receive from the sale or exchange of fund shares. The fees are paid to the fund, and are recorded as an increase to paid-in capital. The fees may cause the redemption price per share to differ from the net asset value per share.
Investment Transactions, Investment Income, and Distributions Income and expenses are recorded on the accrual basis. Premiums and discounts on debt securities are amortized for financial reporting purposes. Dividends received from mutual fund investments are reflected as dividend income; capital gain distributions are reflected as realized gain/loss. Dividend income and capital gain distributions are recorded on the ex-dividend date. Investment transactions are accounted for on the trade date. Realized gains and losses are reported on the identified cost basis. Payments (“variation margin”) made or received to settle the daily fluctuations in the value of futures contracts are recorded as unrealized gains or losses until the contracts are closed. Unsettled variation margin on futures contracts is included in investments in securities, and unrealized gains and losses on futures contracts are included in the change in net unrealized gain or loss in the accompanying financial statements. Distributions to shareholders are recorded on the ex-dividend date. Income distributions are declared and paid on an annual basis. Capital gain distributions, if any, are declared and paid by the fund, typically on an annual basis.
NOTE 2 - INVESTMENT TRANSACTIONS
Consistent with its investment objective, the fund engages in the following practices to manage exposure to certain risks or enhance performance. The investment objective, policies, program, and risk factors of the fund are described more fully in the fund’s prospectus and Statement of Additional Information.
Futures Contracts During the six months ended June 30, 2005, the fund was a party to futures contracts, which provide for the future sale by one party and purchase by another of a specified amount of a specific financial instrument at an agreed upon price, date, time, and place. Risks arise from possible illiquidity of the futures market and from movements in security values.
Securities Lending The fund lends its securities to approved brokers to earn additional income. It receives as collateral cash and U.S. government securities valued at 102% to 105% of the value of the securities on loan. Cash collateral is invested in a money market pooled trust managed by the fund’s lending agent in accordance with investment guidelines approved by fund management. Collateral is maintained over the life of the loan in an amount not less than the value of loaned securities, as determined at the close of fund business each day; any additional collateral required due to changes in security values is delivered to the fund the next business day. Although risk is mitigated by the collateral, the fund could experience a delay in recovering its securities and a possible loss of income or value if the borrower fails to return the securities. Securities lending revenue recognized by the fund consists of earnings on invested collateral and borrowing fees, net of any rebates to the borrower and compensation to the lending agent. At June 30, 2005, the value of loaned securities was $39,572,000; aggregate collateral consisted of $40,767,000 in the money market pooled trust and U.S. government securities valued at $71,000.
Other Purchases and sales of portfolio securities, other than short-term securities, aggregated $16,410,000 and $5,638,000, respectively, for the six months ended June 30, 2005.
NOTE 3 - FEDERAL INCOME TAXES
No provision for federal income taxes is required since the fund intends to continue to qualify as a regulated investment company under Subchapter M of the Internal Revenue Code and distribute to shareholders all of its taxable income and gains. Federal income tax regulations differ from generally accepted accounting principles; therefore, distributions determined in accordance with tax regulations may differ in amount or character from net investment income and realized gains for financial reporting purposes. Financial reporting records are adjusted for permanent book/tax differences to reflect tax character. Financial records are not adjusted for temporary differences. The amount and character of tax-basis distributions and composition of net assets are finalized at fiscal year-end; accordingly, tax-basis balances have not been determined as of June 30, 2005.
The fund intends to retain realized gains to the extent of available capital loss carryforwards. As of December 31, 2004, the fund had $13,704,000 of unused capital loss carryforwards, of which $4,777,000 expire in 2009, $8,759,000 expire in 2010, and $168,000 expire in 2011.
At June 30, 2005, the cost of investments for federal income tax purposes was $190,466,000. Net unrealized gain aggregated $30,201,000 at period-end, of which $54,247,000 related to appreciated investments and $24,046,000 related to depreciated investments.
NOTE 4 - RELATED PARTY TRANSACTIONS
The fund is managed by T. Rowe Price Associates, Inc. (the manager or Price Associates), a wholly owned subsidiary of T. Rowe Price Group, Inc. The investment management and administrative agreement between the fund and the manager provides for an all-inclusive annual fee equal to 0.40% of the fund’s average daily net assets. The fee is computed daily and paid monthly. The agreement provides that investment management, shareholder servicing, transfer agency, accounting, and custody services are provided to the fund, and interest, taxes, brokerage commissions, directors’ fees and expenses, and extraordinary expenses are paid directly by the fund.
The fund may invest in the T. Rowe Price Reserve Investment Fund and the T. Rowe Price Government Reserve Investment Fund (collectively, the T. Rowe Price Reserve Funds), open-end management investment companies managed by Price Associates and affiliates of the fund. The T. Rowe Price Reserve Funds are offered as cash management options to mutual funds, trusts, and other accounts managed by Price Associates and/or its affiliates, and are not available for direct purchase by members of the public. The T. Rowe Price Reserve Funds pay no investment management fees. During the six months ended June 30, 2005, dividend income from the T. Rowe Price Reserve Funds totaled $99,000, and the value of shares of the T. Rowe Price Reserve Funds held at June 30, 2005 and December 31, 2004 was $8,179,000 and $3,132,000, respectively.
NOTE 5 - SUBSEQUENT EVENT
On July 11, 2005, the T. Rowe Price Extended Equity Market Index Fund acquired substantially all of the assets of the TD Waterhouse Extended Market Index Fund, pursuant to the Agreement and Plan of Reorganization dated March 23, 2005, and approved by TD Waterhouse Extended Market Index Fund shareholders on June 28, 2005. The acquisition was accomplished by a tax-free exchange of 3,808,910.688 shares of the T. Rowe Price Extended Equity Market Index Fund, having a value of $52,982,000, for the 6,230,292.352 shares of the TD Waterhouse Extended Market Index Fund outstanding on July 8, 2005. The TD Waterhouse Extended Market Index Fund’s net assets at that date, which included $7,186,000 of unrealized appreciation, were combined with those of the T. Rowe Price Extended Equity Market Index Fund. Immediately after the merger, the net assets of the T. Rowe Price Extended Equity Market Index Fund totaled $238,702,000.
| INFORMATION ON PROXY VOTING POLICIES, PROCEDURES, AND RECORDS |
A description of the policies and procedures used by T. Rowe Price funds and portfolios to determine how to vote proxies relating to portfolio securities is available in each fund’s Statement of Additional Information, which you may request by calling 1-800-225-5132 or by accessing the SEC’s Web site, www.sec.gov. The description of our proxy voting policies and procedures is also available on our Web site, www.troweprice.com. To access it, click on the words “Company Info” at the top of our homepage for individual investors. Then, in the window that appears, click on the “Proxy Voting Policy” navigation button in the top left corner.
Each fund’s most recent annual proxy voting record is available on our Web site and through the SEC’s Web site. To access it through our Web site, follow the directions above, then click on the words “Proxy Voting Record” at the bottom of the Proxy Voting Policy page.
| HOW TO OBTAIN QUARTERLY PORTFOLIO HOLDINGS |
The fund files a complete schedule of portfolio holdings with the Securities and Exchange Commission for the first and third quarters of each fiscal year on Form N-Q. The fund’s Form N-Q is available electronically on the SEC’s Web site (www.sec.gov); hard copies may be reviewed and copied at the SEC’s Public Reference Room, 450 Fifth St. N.W., Washington, DC 20549. For more information on the Public Reference Room, call 1-800-SEC-0330.
| APPROVAL OF INVESTMENT MANAGEMENT AGREEMENT |
On March 2, 2005, the fund’s Board of Directors unanimously approved the investment advisory contract (“Contract”) between the fund and its investment manager, T. Rowe Price Associates, Inc. (“Manager”). The Board considered a variety of factors in connection with its review of the Contract, also taking into account information provided by the Manager during the course of the year, as discussed below:
Services Provided by the Manager
The Board considered the nature, quality, and extent of the services provided to the fund by the Manager. These services included, but were not limited to, management of the fund’s portfolio and a variety of activities related to portfolio management. The Board also reviewed the background and experience of the Manager’s senior management team and investment personnel involved in the management of the fund. The Board concluded that it was satisfied with the nature, quality, and extent of the services provided by the Manager.
Investment Performance of the Fund
The Board reviewed the fund’s average annual total return over the 1-, 3-, and 5-year periods as well as the fund’s year-by-year returns and compared these returns to previously agreed upon comparable performance measures and market data, including those supplied by Lipper and Morningstar, which are independent providers of mutual fund data. On the basis of this evaluation and the Board’s ongoing review of investment results, the Board concluded that the fund’s performance was satisfactory.
Costs, Benefits, Profits, and Economies of Scale
The Board reviewed detailed information regarding the revenues received by the Manager under the Contract and other benefits that the Manager (and its affiliates) may have realized from its relationship with the fund, including research received under “soft dollar” agreements. The Board also received information on the estimated costs incurred and profits realized by the Manager and its affiliates from advising T. Rowe Price mutual funds. Because the Manager is currently waiving its fee for this particular fund, the Board was not provided with estimates of the gross profits realized from managing this fund. The Board concluded that the Manager’s profits from advising T. Rowe Price mutual funds were reasonable in light of the services provided to the fund. The Board also considered whether the fund or other funds benefit under the fee levels set forth in the Contract from any economies of scale realized by the Manager. The Board noted that, under the Contract, the fund pays the Manager a single fee based on the fund’s assets and the Manager, in turn, pays all expenses of the fund, with certain exceptions. The Board concluded that, based on the profitability data it reviewed and consistent with this single fee structure, the Contract provided for a reasonable sharing of benefits from any economies of scale with the fund’s investors.
Fees
The Board reviewed the fund’s single-fee structure and compared the rate to fees and expenses of other comparable funds based on information and data supplied by Lipper. The information provided to the Board indicated that the fund’s single fee rate was generally below the median management fee rate and expense ratio for comparable funds. The Board also reviewed the fee schedules for comparable privately managed accounts of the Manager and its affiliates. Management informed the Board that the Manager’s responsibilities for privately managed accounts are more limited than its responsibilities for the fund and other T. Rowe Price mutual funds that it or its affiliates advise. On the basis of the information provided, the Board concluded that the fees paid by the fund under the Contract were reasonable.
Approval of the Contract
As noted, the Board approved the continuation of the Contract. No single factor was considered in isolation or to be determinative to the decision. Rather, the Board concluded, in light of a weighting and balancing of all factors considered, that it was in the best interests of the fund to approve the continuation of the Contract, including the fees to be charged for services thereunder.
Item 2. Code of Ethics.A code of ethics, as defined in Item 2 of Form N-CSR, applicable to its principal executive officer, principal financial officer, principal accounting officer or controller, or persons performing similar functions is filed as an exhibit to the registrant’s annual Form N-CSR. No substantive amendments were approved or waivers were granted to this code of ethics during the registrant’s most recent fiscal half-year.
Item 3. Audit Committee Financial Expert.
Disclosure required in registrant’s annual Form N-CSR.
Item 4. Principal Accountant Fees and Services.
Disclosure required in registrant’s annual Form N-CSR.
Item 5. Audit Committee of Listed Registrants.
Not applicable.
Item 6. Schedule of Investments.
Not applicable. The complete schedule of investments is included in Item 1 of this Form N-CSR.
Item 7. Disclosure of Proxy Voting Policies and Procedures for Closed-End Management Investment Companies.
Not applicable.
Item 8. Portfolio Managers of Closed-End Management Investment Companies.
Not applicable.
Item 9. Purchases of Equity Securities by Closed-End Management Investment Company and Affiliated Purchasers.
Not applicable.
Item 10. Submission of Matters to a Vote of Security Holders.
Not applicable.
Item 11. Controls and Procedures.
(a) The registrant’s principal executive officer and principal financial officer have evaluated the registrant’s disclosure controls and procedures within 90 days of this filing and have concluded that the registrant’s disclosure controls and procedures were effective, as of that date, in ensuring that information required to be disclosed by the registrant in this Form N-CSR was recorded, processed, summarized, and reported timely.
(b) The registrant’s principal executive officer and principal financial officer are aware of no change in the registrant’s internal control over financial reporting that occurred during the registrant’s second fiscal quarter covered by this report that has materially affected, or is reasonably likely to materially affect, the registrant’s internal control over financial reporting.
Item 12. Exhibits.
(a)(1) The registrant’s code of ethics pursuant to Item 2 of Form N-CSR is filed with the registrant’s annual Form N-CSR.
(2) Separate certifications by the registrant's principal executive officer and principal financial officer, pursuant to Section 302 of the Sarbanes-Oxley Act of 2002 and required by Rule 30a-2(a) under the Investment Company Act of 1940, are attached.
(3) Written solicitation to repurchase securities issued by closed-end companies: not applicable.
(b) A certification by the registrant's principal executive officer and principal financial officer, pursuant to Section 906 of the Sarbanes-Oxley Act of 2002 and required by Rule 30a-2(b) under the Investment Company Act of 1940, is attached.
| | |
| SIGNATURES |
| |
| | Pursuant to the requirements of the Securities Exchange Act of 1934 and the Investment |
| Company Act of 1940, the registrant has duly caused this report to be signed on its behalf by the |
| undersigned, thereunto duly authorized. |
| |
| T. Rowe Price Index Trust, Inc. |
| |
| By | /s/ James S. Riepe |
| | James S. Riepe |
| | Principal Executive Officer |
| |
| Date | August 18, 2005 |
| |
| |
| | Pursuant to the requirements of the Securities Exchange Act of 1934 and the Investment |
| Company Act of 1940, this report has been signed below by the following persons on behalf of |
| the registrant and in the capacities and on the dates indicated. |
| |
| |
| By | /s/ James S. Riepe |
| | James S. Riepe |
| | Principal Executive Officer |
| |
| Date | August 18, 2005 |
| |
| |
| |
| By | /s/ Joseph A. Carrier |
| | Joseph A. Carrier |
| | Principal Financial Officer |
| |
| Date | August 18, 2005 |