UNITED STATES
SECURITIES AND EXCHANGE COMMISSION
Washington, DC 20549
FORM N-CSR
CERTIFIED SHAREHOLDER REPORT OF REGISTERED MANAGEMENT INVESTMENT COMPANIES
Investment Company Act file number 811-06135
Templeton Institutional Funds
(Exact name of registrant as specified in charter)
300 S.E. 2nd Street, Fort Lauderdale, FL 33301-1923
(Address of principal executive offices) Zip code)
Craig S. Tyle, One Franklin Parkway, San Mateo, CA 94403-1906
(Name and address of agent for service)
Registrant's telephone number, including area code: (954) 527-7500_
Date of fiscal year end: _12/31__
Date of reporting period: 12/31/14_
Item 1. Reports to Stockholders.
Annual Report
December 31, 2014
Templeton Institutional Funds
Emerging Markets Series
Foreign Equity Series
Foreign Smaller Companies Series
Global Equity Series

| Contents | |
| Annual Report | |
| Economic and Market Overview | 1 |
| Emerging Markets Series | 3 |
| Foreign Equity Series | 9 |
| Foreign Smaller Companies Series | 17 |
| Global Equity Series | 23 |
| Financial Highlights and | |
| Statements of Investments | 30 |
| Financial Statements | 51 |
| Notes to Financial Statements | 57 |
| Report of Independent Registered | |
| Public Accounting Firm | 68 |
| Tax Information | 69 |
| Board Members and Officers | 71 |
| Shareholder Information | 76 |
TEMPLETON INSTITUTIONAL FUNDS SHAREHOLDER LETTER
In several emerging markets, economic growth generally moderated. However, Brazil exited recession as government spending prior to a presidential election drove third-quarter economic growth. Emerging market equities, as measured by the MSCI Emerging Markets Index, fell for the 12-month period, amid headwinds such as soft domestic demand and weak exports in several countries. Falling crude oil prices and geopolitical tensions in certain regions, as well as concerns about the timing of U.S. interest rate increases, also pressured emerging market equities. Many emerging market currencies depreciated against the U.S. dollar, leading central banks in several countries to raise interest rates in an effort to curb inflation and support their currencies. Several other central banks lowered interest rates to promote economic growth. After implementing monetary stimulus measures to support specific sectors, China’s central bank increased its efforts to bolster the economy by cutting its benchmark interest rates for the first time since July 2012. In contrast, Russia’s central bank raised its key interest rate sharply toward period-end to limit further devaluation of the Russian ruble and contain rising inflation.
The foregoing information reflects our analysis and opinions as of December 31, 2014. The information is not a complete analysis of every aspect of any market, country, industry or fund. Statements of fact are from sources considered reliable.
2 | Annual Report ftinstitutional.com
Emerging Markets Series
This annual report for Emerging Markets Series (Fund) covers the fiscal year ended December 31, 2014.
Your Fund’s Goal and Main Investments
The Fund seeks long-term capital growth. Under normal market conditions, the Fund invests at least 80% of its net assets in securities issued by “emerging market companies,” as defined in the Fund’s prospectus.

Investment Strategy
Our investment strategy employs a fundamental research, value-oriented, long-term approach. We focus on the market price of a company’s securities relative to our evaluation of the company’s long-term earnings, asset value and cash flow potential. We also consider a company’s profit and loss outlook, balance sheet strength, cash flow trends and asset value in relation to the current price. Our analysis considers the company’s corporate governance behavior as well as its position in its sector, the economic framework and political environment.
Performance Overview
The Fund had a -8.01% cumulative total return for the year under review. In comparison, the Standard & Poor’s®/ International Finance Corporation Investable (S&P®/IFCI) Composite Index had a -1.12% total return, and the MSCI Emerging Markets (EM) Index had a -1.82% total return during the same period.1 The indexes measure global emerging market stock performance. Please note index performance information is provided for reference and we do not attempt to track an index but rather undertake investments on the basis of fundamental research. The Fund’s return reflects the effect of fees and expenses for professional management, while an index does not have such costs. In addition, an index is not subject to investment flows while the Fund is subject to purchases and redemptions that could impact performance. You can find the Fund’s long-term performance data in the Performance Summary beginning on page 6.
Performance data represent past performance, which does not guarantee future results. Investment return and principal value will fluctuate, and you may have a gain or loss when you sell your shares. Current performance may differ from figures shown. Please visit ftinstitutional.com or call (800) 321-8563 for most recent month-end performance.
Manager’s Discussion
During the year under review, key contributors to the Fund’s absolute performance included Emaar Properties, Remgro and TSMC (Taiwan Semiconductor Manufacturing Co.).
Emaar Properties is a major property developer and manager with operations throughout the Middle East, notably in Dubai, United Arab Emirates (UAE). Dubai’s rising tourism boosted Emaar’s hotel and retail operations, and a property sector recovery in the earlier part of the year also supported the company’s operations. The UAE’s inclusion in the MSCI EM
1. Source: Morningstar.
The indexes are unmanaged and include reinvested dividends. One cannot invest directly in an index, and an index is not representative of the Fund’s portfolio.
The dollar value, number of shares or principal amount, and names of all portfolio holdings are listed in the Fund’s Statement of Investments (SOI).
The SOI begins on page 31.
ftinstitutional.com Annual Report | 3
| EMERGING MARKETS SERIES | ||
| Top 10 Countries | ||
| 12/31/14 | ||
| % of Total | ||
| Net Assets | ||
| China | 22.2 | % |
| South Africa | 12.3 | % |
| Thailand | 12.2 | % |
| India | 11.5 | % |
| Brazil | 7.8 | % |
| Belgium | 4.7 | % |
| U.K. | 4.2 | % |
| Indonesia | 3.6 | % |
| Taiwan | 3.1 | % |
| South Korea | 3.1 | % |
Index in June further boosted Emaar’s share price. However, signs of a property price decline in the emirate during the final months of 2014 led to a share price correction.
Remgro is a South African conglomerate with a diversified portfolio of financial and industrial assets that we believe provides an attractive means to address growth in the South African and broader African economies. The share price appreciation during the year, in our view, reflected investors’ confidence in Africa’s financials and industrials sectors, while sentiment in the commodity sector remained relatively weaker.
TSMC, the world’s largest independent integrated circuit foundry, showed strong growth in the past few years, resulting from increased demand for chips used in mobile devices such as smartphones and tablets. Strong corporate results, management updates suggesting rising market share and progress in the commercialization of the most advanced technology supported the company’s share price performance.
In contrast, key detractors from the Fund’s absolute performance included Petrobras (Petroleo Brasileiro), Avon Products and SJM Holdings.
Petrobras, a new holding this period, is Brazil’s main oil and gas producer, refiner and distributor. The company’s links with government and political figures were scrutinized in the final quarter of 2014 amid accusations of bribery and corrupt practices. Delays in the release of third-quarter results and the sharp
decline in oil and gas prices also weighed on sentiment. The decision of the Organization of the Petroleum Exporting Countries to maintain oil production levels despite a global oversupply led prices to fall more than 40% in 2014’s fourth quarter.
Avon Products is a U.S.-listed global cosmetics company with substantial operations in various emerging market countries, most notably Brazil. Its third-quarter corporate results, impacted by Brazil’s sluggish economy, disappointed investors. Concerns about the company’s ability to service its substantial debts in a weak market environment led two major rating agencies to downgrade the company’s debt rating to below investment grade, further weighing on investor sentiment. Also pressuring shares were the economic and currency crises in Russia, another substantial market for the company.
SJM Holdings, a Hong Kong-listed, Macau-based gaming and entertainment company, lost ground in 2014 after strong stock performance in 2013, as the Chinese government’s anti-corruption and anti-extravagance policies negatively affected casino revenues. Macau’s annual gambling revenues declined for the first time in 2014 since China liberalized the administrative region’s casinos in 2001.
It is important to recognize the effect of currency movements on the Fund’s performance. In general, if the value of the U.S. dollar goes up compared with a foreign currency, an investment traded in that foreign currency will go down in value because it will be worth fewer U.S. dollars. This can have a negative effect on Fund performance. Conversely, when the U.S. dollar weakens in relation to a foreign currency, an investment traded in that foreign currency will increase in value, which can contribute to Fund performance. For the 12 months ended December 31, 2014, the U.S. dollar rose in value relative to most currencies. As a result, the Fund’s performance was negatively affected by the portfolio’s investment predominantly in securities with non-U.S. currency exposure.
In the past 12 months, we increased the Fund’s holdings largely in Thailand, South Africa, Indonesia, Turkey and China via China H, Red Chip and P Chip shares as we continued to search for investment opportunities we considered to be attractive.2 We initiated investments in several markets, including Indonesia. In sector terms, we increased the Fund’s holdings mainly in energy, financials and health care.3 Key purchases
2. “China H” denotes shares of China-incorporated, Hong Kong Stock Exchange-listed companies with most businesses in China. “Red Chip” denotes shares of Hong Kong
Stock Exchange-listed companies substantially owned by Chinese mainland state entities, with significant exposure to China. “P Chip” denotes shares of Hong Kong Stock
Exchange-listed companies controlled by Chinese mainland individuals and incorporated outside of China, with a majority of their business in China.
3. The energy sector comprises oil, gas and consumable fuels in the SOI. The financials sector comprises banks, diversified financial services, insurance, and real estate
management and development in the SOI. The health care sector comprises biotechnology and pharmaceuticals in the SOI.
4 | Annual Report
ftinstitutional.com
EMERGING MARKETS SERIES
| Top 10 Holdings | ||
| 12/31/14 | ||
| Company | % of Total | |
| Sector/Industry, Country | Net Assets | |
| Remgro Ltd. | 5.3 | % |
| Diversified Financial Services, South Africa | ||
| Tata Consultancy Services Ltd. | 5.2 | % |
| IT Services, India | ||
| Siam Commercial Bank PCL, fgn. | 4.9 | % |
| Banks, Thailand | ||
| Brilliance China Automotive Holdings Ltd. | 4.8 | % |
| Automobiles, China | ||
| Anheuser-Busch InBev NV | 4.7 | % |
| Beverages, Belgium | ||
| Naspers Ltd., N | 4.5 | % |
| Media, South Africa | ||
| Unilever PLC | 4.2 | % |
| Food Products, U.K. | ||
| Itau Unibanco Holding SA, ADR | 4.2 | % |
| Banks, Brazil | ||
| China Construction Bank Corp., H | 3.2 | % |
| Banks, China | ||
| TSMC (Taiwan Semiconductor Manufacturing Co.) Ltd. | 3.1 | % |
| Semiconductors & Semiconductor Equipment, Taiwan | ||
included new positions in Itau Unibanco Holding, a leading Brazilian commercial bank; Brilliance China Automotive Holdings, a major Chinese automobile manufacturer with a joint venture with BMW; and Naspers, a South Africa-based multinational media group.
Conversely, we reduced the Fund’s investments in Hong Kong, the UAE, Macau and Brazil to focus on stocks we considered to be more attractively valued within our investment universe. We also eliminated exposures to certain countries, including Nigeria. In sector terms, some of the largest sales were in consumer staples and consumer discretionary.4 Key sales included a reduction of the Fund’s holding in Emaar Properties. We closed the Fund’s positions in Ambev, a Brazil-based global beer and soft drink producer, and British American Tobacco, a U.K.-listed, global tobacco company. Additionally, we closed the Fund’s positions in a number of Macau casino resort operators, including Sands China, Melco Crown Entertainment and SJM Holdings, mentioned earlier.
Thank you for your continued participation in Emerging Markets Series. We look forward to serving your future investment needs.

The foregoing information reflects our analysis, opinions and portfolio holdings as of December 31, 2014, the end of the reporting period. The way we implement our main investment strategies and the resulting portfolio holdings may change depending on factors such as market and economic conditions. These opinions may not be relied upon as investment advice or an offer for a particular security. The information is not a complete analysis of every aspect of any market, country, industry, security or the Fund. Statements of fact are from sources considered reliable, but the investment manager makes no representation or warranty as to their completeness or accuracy. Although historical performance is no guarantee of future results, these insights may help you understand our investment management philosophy.
4. The consumer staples sector comprises beverages, food products, food and staples retailing, personal products and tobacco in the SOI. The consumer discretionary
sector comprises automobiles; hotels, restaurants and leisure; media; specialty retail; and textiles, apparel and luxury goods in the SOI.
See www.franklintempletondatasources.com for additional data provider information.
ftinstitutional.com
Annual Report
| 5
EMERGING MARKETS SERIES
Performance Summary as of December 31, 2014
Your dividend income will vary depending on dividends or interest paid by securities in the Fund’s portfolio, adjusted for operating expenses. Capital gain distributions are net profits realized from the sale of portfolio securities. The performance table and graph do not reflect any taxes that a shareholder would pay on Fund dividends, capital gain distributions, if any, or any realized gains on the sale of Fund shares. Total return reflects reinvestment of the Fund’s dividends and capital gain distributions, if any, and any unrealized gains or losses.
| Share Price | |||||||||||
| Symbol: TEEMX | 12/31/14 | 12/31/13 | Change | ||||||||
| Net Asset Value (NAV) | $ | 4.59 | $ | 7.31 | -$ | 2.72 | |||||
| Distributions | |||||||||||
| Dividend | Long-Term | ||||||||||
| Income | Capital Gain | Total | |||||||||
| 1/1/14–12/31/14 | $ | 0.1901 | $ | 1.9540 | $ | 2.1441 | |||||
| Performance1 | |||||||||||
| Value of | |||||||||||
| Cumulative | Average Annual | $ | 1,000,000 | Total Annual | |||||||
| Total Return2 | Total Return3 | Investment4 | Operating Expenses5 | ||||||||
| 1.33 | % | ||||||||||
| 1-Year | -8.01 | % | -8.01 | % | $ | 919,905 | |||||
| 5-Year | + | 10.93 | % | + | 2.10 | % | $ | 1,109,342 | |||
| 10-Year | + | 91.84 | % | + | 6.73 | % | $ | 1,918,508 | |||
Performance data represent past performance, which does not guarantee future results. Investment return and principal value will fluctuate, and you may have a gain or loss when you sell your shares. Current performance may differ from figures shown. For most recent month-end performance, visit ftinstitutional.com or call a Franklin Templeton Institutional Services representative at
(800) 321-8563.
6 | Annual Report
ftinstitutional.com
EMERGING MARKETS SERIES
PERFORMANCE SUMMARY
Total Return Index Comparison for a Hypothetical $1,000,000 Investment1
Total return represents the change in value of an investment over the periods shown. It includes any Fund expenses, account fees and reinvested distributions. The unmanaged indexes include reinvestment of any income or distributions. They differ from the Fund in composition and do not pay management fees or expenses. One cannot invest directly in an index.

All investments involve risks, including possible loss of principal. Special risks are associated with foreign investing, including currency fluctuations, economic
instability and political developments. Investments in emerging markets, of which frontier markets are a subset, involve heightened risks related to the same fac-
tors, in addition to those associated with these markets’ smaller size, lesser liquidity and lack of established legal, political, business and social frameworks to
support securities markets. Because these frameworks are typically even less developed in frontier markets, as well as various factors including the increased
potential for extreme price volatility, illiquidity, trade barriers and exchange controls, the risks associated with emerging markets are magnified in frontier mar-
kets. The Fund’s ability to invest in smaller company securities that may have limited liquidity involves additional risks, such as relatively small revenues, limited
product lines and small market share. Historically, these stocks have exhibited greater price volatility than larger company stocks, especially over the short term.
The Fund is actively managed but there is no guarantee that the manager’s investment decisions will produce the desired results. The Fund’s prospectus also
includes a description of the main investment risks.
1. The Fund has a fee waiver associated with its investments in a Franklin Templeton money fund, contractually guaranteed through at least its current fiscal year-end. Fund
investment results reflect the fee waiver, to the extent applicable; without this reduction, the results would have been lower.
2. Cumulative total return represents the change in value of an investment over the periods indicated.
3. Average annual total return represents the average annual change in value of an investment over the periods indicated.
4. These figures represent the value of a hypothetical $1,000,000 investment in the Fund over the periods indicated.
5. Figures are as stated in the Fund’s current prospectus. In periods of market volatility, assets may decline significantly, causing total annual Fund operating expenses to
become higher than the figures shown.
6. Source: Morningstar. The S&P/IFCI Composite Index is a free float-adjusted, market capitalization-weighted index designed to measure equity performance of global
emerging markets. The MSCI EM Index is a free float-adjusted, market capitalization-weighted index designed to measure equity market performance of global emerging
markets.
See www.franklintempletondatasources.com for additional data provider information.
ftinstitutional.com Annual Report | 7
EMERGING MARKETS SERIES
Your Fund’s Expenses
As a Fund shareholder, you can incur two types of costs:
- Transaction costs, including sales charges (loads) on Fund purchases, if applicable; and
- Ongoing Fund costs, including management fees, distribution and service (12b-1) fees, if applicable, and other Fund expenses. All mutual funds have ongoing costs, sometimes referred to as operating expenses.
The following table shows ongoing costs of investing in the Fund and can help you understand these costs and compare them with those of other mutual funds. The table assumes a $1,000 investment held for the six months indicated.
Actual Fund Expenses
The first line (Actual) of the table provides actual account values and expenses. The “Ending Account Value” is derived from the Fund’s actual return, which includes the effect of Fund expenses.
You can estimate the expenses you paid during the period by following these steps. Of course, your account value and expenses will differ from those in this illustration:
| 1. | Divide your account value by $1,000. |
| If an account had an $8,600 value, then $8,600 ÷ $1,000 = 8.6. | |
| 2. | Multiply the result by the number under the heading “Expenses Paid During Period.” |
| If Expenses Paid During Period were $7.50, then 8.6 x $7.50 = $64.50. |
In this illustration, the estimated expenses paid this period are $64.50.
Hypothetical Example for Comparison with Other Funds
Information in the second line (Hypothetical) of the table can help you compare ongoing costs of investing in the Fund with those of other mutual funds. This information may not be used to estimate the actual ending account balance or expenses you paid during the period. The hypothetical “Ending Account Value” is based on the Fund’s actual expense ratio and an assumed 5% annual rate of return before expenses, which does not represent the Fund’s actual return. The figure under the heading “Expenses Paid During Period” shows the hypothetical expenses your account would have incurred under this scenario. You can compare this figure with the 5% hypothetical examples that appear in shareholder reports of other funds.
Please note that expenses shown in the table are meant to highlight ongoing costs and do not reflect any transaction costs, such as sales charges. Therefore, the second line of the table is useful in comparing ongoing costs only, and will not help you compare total costs of owning different funds. In addition, if transaction costs were included, your total costs would have been higher. Please refer to the Fund prospectus for additional information on operating expenses.
| Beginning Account | Ending Account | Expenses Paid During | ||||
| Value 7/1/14 | Value 12/31/14 | Period* 7/1/14–12/31/14 | ||||
| Actual | $ | 1,000 | $ | 911.20 | $ | 6.26 |
| Hypothetical (5% return before expenses) | $ | 1,000 | $ | 1,018.65 | $ | 6.61 |
| *Expenses are calculated using the most recent six-month annualized expense ratio, net of expense waivers, of 1.30%, multiplied by the | ||||||
| average account value over the period, multiplied by 184/365 to reflect the one-half year period. | ||||||
8 | Annual Report
ftinstitutional.com
Foreign Equity Series
This annual report for Foreign Equity Series (Fund) covers the fiscal year ended December 31, 2014.
Your Fund’s Goal and Main Investments
The Fund seeks long-term capital growth. Under normal market conditions, the Fund invests at least 80% of its net assets in foreign (non-U.S.) equity securities.
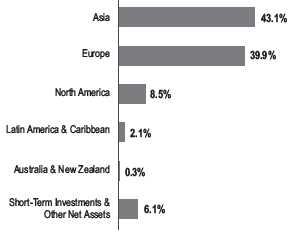
Geographic Breakdown
Based on Total Net Assets as of 12/31/14
Performance Overview
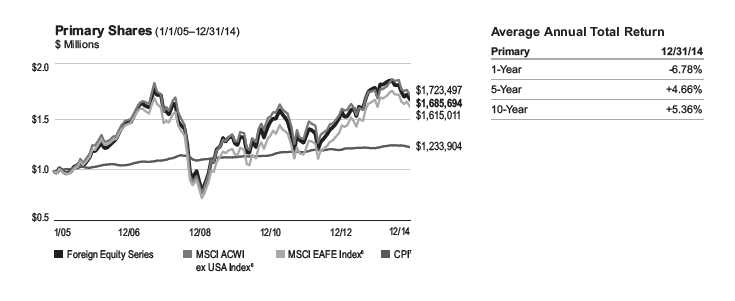
For the 12 months under review, the Fund’s Primary shares had a -6.78% total return. For comparison, the Fund’s benchmark, the MSCI All Country World Index (ACWI) ex USA Index, which measures stock market performance in global developed and emerging markets excluding the U.S., had a -3.44% total return for the period under review.1 The Fund’s other benchmark, the MSCI Europe, Australasia, Far East (EAFE) Index, which measures stock market performance in global developed markets excluding the U.S. and Canada, had a -4.48% total return.1 Please note index performance information is provided for reference and we do not attempt to track an index but rather undertake investments on the basis of fundamental research. You can find the Fund’s long-term performance data in the Performance Summary beginning on page 13.
Performance data represent past performance, which does not guarantee future results. Investment return and principal value will fluctuate, and you may have a gain or loss when you sell your shares. Current performance may differ from figures shown. Please visit ftinstitutional.com or call (800) 321-8563 for most recent month-end performance.
Investment Strategy
We employ a bottom-up, value-oriented, long-term investment strategy. We focus on the market price of a company’s securities relative to our evaluation of the company’s long-term earnings, asset value and cash flow potential. We also consider a company’s price/earnings ratio, profit margins and liquidation value.
Manager’s Discussion
The year 2014 was a challenging one for global equity markets. Following a period of tentative optimism that corporate fundamentals would resume driving share prices, investor focus shifted back to broad-based economic and political factors in 2014. In our opinion, the most significant story in 2014 was the deepening divergence between the U.S., where growth rates improved, and the rest of the world, where growth rates generally moderated. Numerous factors contributed to the change in market conditions. In Europe, disinflationary pressures intensified and political discord resurfaced; in Japan, extraordinary monetary policy failed to prevent a triple-dip recession; and in diverse emerging markets, economic growth generally cooled as commodities and currencies came under pressure. Two major events further deepened the divide between U.S. and international markets. The price of oil nearly halved, favoring the consumer-driven U.S. economy at the expense of oil-exporting nations abroad; and Russia invaded Ukraine, marring European business confidence and reminding investors of the risks sometimes associated with emerging market investing. In this environment of increasing economic and geopolitical uncertainty, investors’ preference for the U.S. as a perceived safe haven created headwinds for international equity investors.
However, we also believed that the enthusiasm for U.S. equities created what we considered to be attractive opportunities in international equity markets. Although normalized U.S. equity valuations rose to elevated levels, international stocks on average traded at a greater than one standard deviation discount to
1. Source: Morningstar.
The indexes are unmanaged and include reinvested dividends. One cannot invest directly in an index, and an index is not representative of the Fund’s portfolio.
The dollar value, number of shares or principal amount, and names of all portfolio holdings are listed in the Fund’s Statement of Investments (SOI).
The SOI begins on page 36.
ftinstitutional.com
Annual Report
| 9
| FOREIGN EQUITY SERIES | ||
| Portfolio Breakdown | ||
| 12/31/14 | ||
| % of Total | ||
| Sector/Industry | Net Assets | |
| Banks | 14.3 | % |
| Pharmaceuticals | 13.0 | % |
| Insurance | 9.4 | % |
| Oil, Gas & Consumable Fuels | 8.4 | % |
| Diversified Telecommunication Services | 5.7 | % |
| Automobiles | 3.5 | % |
| Technology Hardware, Storage & Peripherals | 3.1 | % |
| Wireless Telecommunication Services | 2.7 | % |
| Industrial Conglomerates | 2.5 | % |
| Semiconductors & Semiconductor Equipment | 2.4 | % |
| Construction Materials | 2.4 | % |
| Auto Components | 2.2 | % |
| Machinery | 2.1 | % |
| Other | 27.4 | % |
| Short-Term Investments & Other Net Assets | 0.9 | % |
similar historical metrics. We continued to find many of our best long-term investment opportunities in Europe during the year in review. However, stock selection and an overweighted allocation in Europe detracted from performance relative to the MSCI ACWI ex USA Index as the delicate progress made stabilizing the banking system, enacting necessary budget reforms, and preparing for further monetary stimulus failed to meaningfully restore corporate confidence or revive lending activity. Concerns about Europe, along with worries about a slowing China and destabilized Russia, made European equities cheap on nearly all normalized valuation metrics. Overall, we consider such valuation and investment levels depressed for a diverse corporate sector composed of many high-quality, globally relevant companies.
On the other hand, Asia contributed to relative performance driven by stock selection in Japan and the region overall as well as stock selection and overweighted allocations in China and Singapore. We found value relatively scarce in Japan, where we had yet to see the structural reforms required to address challenges caused by debt, demographics and corporate
governance. In China, our focus was on finding companies with, in our opinion, balance sheet strength, capital discipline and the ability to sustainably generate strong free cash flow. Three of the Fund’s top contributors during the year were Chinese stocks, led by China Life Insurance, whose price surged toward period-end due to improved product offerings and a supportive interest rate outlook. The other two were China CNR (not part of the index) and CSR, which agreed to merge near year-end. An overweighted position in South Korea detracted from relative performance due to concerns about the country’s strengthening currency and cyclical economic profile. Yet, we continued to find what we considered bottom-up bargains in South Korea and believed that valuations looked reasonable for a competitive, commodity-importing emerging market with accommodative monetary policy, a comfortable current account surplus and good exposure to U.S. and Asian growth.
From a sector perspective, stock selection and an overweighted allocation to energy stocks detracted from relative performance.2 Dutch oilfield services firm SBM Offshore was a major laggard as falling oil prices led to capital expenditure reductions among its clients and an ongoing bribery scandal clouded the outlook for its Brazilian operations. These issues depressed valuations to levels that significantly undervalued SBM’s long-term earnings and cash flow potential, in our assessment, given its lease fleet of floating rigs on pre-agreed day rates with high-quality customers. We believed these defensive assets carried low cash flow risk and could potentially be monetized through master limited partnerships or other yield vehicles. More generally, we remained favorable toward our energy sector holdings despite recent challenges. Although we do not know when equilibrium will be restored to oil markets, we do expect that supply could incrementally decline and oil may eventually return to a level that promotes continued investment. In the meantime, we have focused on the long-term fundamental prospects of individual energy companies. Energy stocks were historically cheap following a period of sustained pressure on sector fundamentals and, most recently, a major oil price correction. As energy companies improved capital allocation and refocused on shareholder returns, we continued to find what we considered compelling long-term bargains in the sector, with a focus on companies with the balance sheet strength to weather a period of lower oil prices, in our opinion.
2. The energy sector comprises energy equipment and services; and oil, gas and consumable fuels in the SOI.
10 | Annual Report ftinstitutional.com
FOREIGN EQUITY SERIES
| Top 10 Holdings | ||
| 12/31/14 | ||
| Company | % of Total | |
| Sector/Industry, Country | Net Assets | |
| Samsung Electronics Co. Ltd. | 2.5 | % |
| Technology Hardware, Storage & Peripherals, South Korea | ||
| Roche Holding AG | 2.3 | % |
| Pharmaceuticals, Switzerland | ||
| Bayer AG | 2.1 | % |
| Pharmaceuticals, Germany | ||
| Sanofi | 1.9 | % |
| Pharmaceuticals, France | ||
| ING Groep NV, ADR & IDR | 1.8 | % |
| Banks, Netherlands | ||
| BNP Paribas SA | 1.8 | % |
| Banks, France | ||
| Swiss Re AG | 1.7 | % |
| Insurance, Switzerland | ||
| GlaxoSmithKline PLC | 1.7 | % |
| Pharmaceuticals, U.K. | ||
| Toyota Motor Corp. | 1.7 | % |
| Automobiles, Japan | ||
| Teva Pharmaceutical Industries Ltd., ADR | 1.6 | % |
| Pharmaceuticals, Israel | ||
Stock selection also led to underperformance in the underweighted consumer discretionary, information technology and consumer staples sectors.3 U.K. grocer Tesco was a major consumer staples detractor as shares fell to their lowest level in nearly 15 years after the firm issued its third profit warning in five months. Although Tesco’s turnaround has been more difficult than expected, we remained positive on the company’s strategy to revive sales and regain market share by improving the quality of its products and offering a stronger, clearer price message. In our analysis, the stock looked cheap on a number of metrics and the company featured a comfortable balance sheet and a sensible strategic plan administered by a capable new management team.
Conversely, underweighted positions in materials and financials contributed to relative performance, particularly due to stock selection.4 Italian lender Intesa Sanpaolo was a major financials contributor. Shares rallied after the firm more than doubled quarterly profits due to lower loan loss provisions and higher revenue from commissions. A number of Asian financial companies also finished among the top contributors, including
China Life Insurance, Indian lender Housing Development Finance and Singaporean banking group DBS Group Holdings. Overall, we remained favorable toward our holdings in recapi-talized and restructured European banks as well as what we considered as attractively positioned financials firms in higher growth Asian and emerging markets.
Another individual holding, Israeli specialty pharmaceuticals firm Teva Pharmaceutical Industries (not part of the index), was a notable contributor, rallying to the highest level in more than four years after success with a new multiple sclerosis drug resulted in better-than-expected earnings. We believed that Teva had meaningful restructuring initiatives being implemented by a respected new management team, as well as attractive drugs in its specialty pipeline and a generic portfolio that has been shifting toward higher margin products. We believed recent multiples under-valued Teva’s long-term growth prospects.
It is also important to recognize the effect of currency movements on the Fund’s performance. In general, if the value of the U.S. dollar goes up compared with a foreign currency, an investment traded in that foreign currency will go down in value because it will be worth fewer U.S. dollars. This can have a negative effect on Fund performance. Conversely, when the U.S. dollar weakens in relation to a foreign currency, an investment traded in that foreign currency will increase in value, which can contribute to Fund performance. For the 12 months ended December 31, 2014, the U.S. dollar rose in value relative to most currencies. As a result, the Fund’s performance was negatively affected by the portfolio’s investment predominantly in securities with non-U.S. currency exposure.
In recent years, we felt stocks traded more on broad-based economic and policy expectations than on business fundamentals. This trend, in our view, resulted in an increasingly bifurcated market in which the leaders (U.S. stocks, consumer cyclicals and health care) kept surging further ahead and the laggards (international stocks and industrial cyclicals) kept falling further behind. Throughout this challenging period, we tried to use the market’s distraction to our advantage by focusing on what we determined to be overlooked value. In doing so, we sought to build a differentiated portfolio based on our long-term assumptions about company-level business fundamentals. We believe outperformance comes from value recognition, and our experience has been that price and value eventually do intersect over
3. The consumer discretionary sector comprises auto components, automobiles, household durables, multiline retail and specialty retail in the SOI. The information
technology sector comprises communications equipment; semiconductors and semiconductor equipment; software; and technology hardware, storage and peripherals
in the SOI. The consumer staples sector comprises beverages, food and staples retailing, and food products in the SOI.
4. The materials sector comprises chemicals, construction materials, and containers and packaging in the SOI. The financials sector comprises banks, capital markets,
diversified financial services, insurance, real estate management and development, and thrifts and mortgage finance in the SOI.
See www.franklintempletondatasources.com for additional data provider information.
ftinstitutional.com Annual Report | 11
FOREIGN EQUITY SERIES
time. Going into 2015, we remain confident in the long-term potential of our investment process.
Thank you for your continued participation in Foreign Equity Series. We look forward to serving your future investment needs.

The foregoing information reflects our analysis, opinions and portfolio holdings as of December 31, 2014, the end of the reporting period. The way we implement our main investment strategies and the resulting portfolio holdings may change depending on factors such as market and economic conditions. These opinions may not be relied upon as investment advice or an offer for a particular security. The information is not a complete analysis of every aspect of any market, country, industry, security or the Fund. Statements of fact are from sources considered reliable, but the investment manager makes no representation or warranty as to their completeness or accuracy. Although historical performance is no guarantee of future results, these insights may help you understand our investment management philosophy.
CFA® is a trademark owned by CFA Institute.
12 | Annual Report ftinstitutional.com
FOREIGN EQUITY SERIES
Performance Summary as of December 31, 2014
Your dividend income will vary depending on dividends or interest paid by securities in the Fund’s portfolio, adjusted for operating expenses of each class. Capital gain distributions are net profits realized from the sale of portfolio securities. The performance table and graphs do not reflect any taxes that a shareholder would pay on Fund dividends, capital gain distributions, if any, or any realized gains on the sale of Fund shares. Total return reflects reinvestment of the Fund’s dividends and capital gain distributions, if any, and any unrealized gains or losses on the sale of Fund shares.
| Net Asset Value | ||||||||||||||||
| Share Class (Symbol) | 12/31/14 | 12/31/13 | Change | |||||||||||||
| Primary (TFEQX) | $ | 20.05 | $ | 22.72 | -$ | 2.67 | ||||||||||
| Service (TFESX) | $ | 20.11 | $ | 22.79 | -$ | 2.68 | ||||||||||
| Distributions (1/1/14–12/31/14) | ||||||||||||||||
| Dividend | Short-Term | Long-Term | ||||||||||||||
| Income | Capital Gain | Capital Gain | Total | |||||||||||||
| Primary | $ | 0.7918 | $ | 0.1847 | $ | 0.1627 | $ | 1.1392 | ||||||||
| Service | $ | 0.7571 | $ | 0.1847 | $ | 0.1627 | $ | 1.1045 | ||||||||
| Performance1 | ||||||||||||||||
| Value of | ||||||||||||||||
| Cumulative | Average Annual | $ | 1,000,000 | Total Annual | ||||||||||||
| Share Class | Total Return2 | Total Return3 | Investment4 | Operating Expenses5 | ||||||||||||
| Primary | 0.79 | % | ||||||||||||||
| 1-Year | -6.78 | % | -6.78 | % | $ | 932,218 | ||||||||||
| 5-Year | + | 25.56 | % | + | 4.66 | % | $ | 1,255,598 | ||||||||
| 10-Year | + | 68.57 | % | + | 5.36 | % | $ | 1,685,694 | ||||||||
| Service | 0.94 | % | ||||||||||||||
| 1-Year | -6.95 | % | -6.95 | % | $ | 930,484 | ||||||||||
| 5-Year | + | 24.66 | % | + | 4.51 | % | $ | 1,246,635 | ||||||||
| Since Inception (9/18/06) | + | 28.73 | % | + | 3.10 | % | $ | 1,287,325 | ||||||||
Performance data represent past performance, which does not guarantee future results. Investment return and principal value will fluctuate, and you may have a gain or loss when you sell your shares. Current performance may differ from figures shown. For most recent month-end performance, visit ftinstitutional.com or call a Franklin Templeton Institutional Services representative at
(800) 321-8563.
ftinstitutional.com
Annual Report
| 13
FOREIGN EQUITY SERIES PERFORMANCE SUMMARY
Total Return Index Comparison for a Hypothetical $1,000,000 Investment1
Total return represents the change in value of an investment over the periods shown. It includes any Fund expenses, account fees and reinvested distributions. The unmanaged indexes include reinvestment of any income or distributions. They differ from the Fund in composition and do not pay management fees or expenses. One cannot invest directly in an index.

14 | Annual Report ftinstitutional.com
| FOREIGN EQUITY SERIES |
| PERFORMANCE SUMMARY |
All investments involve risks, including possible loss of principal. Special risks are associated with foreign investing, including currency fluctuations, economic
instability and political developments; investments in emerging markets involve heightened risks related to the same factors. To the extent the Fund focuses on
particular countries, regions, industries, sectors or types of investment from time to time, it may be subject to greater risks of adverse developments in such
areas of focus than a fund that invests in a wider variety of countries, regions, industries, sectors or investments. The Fund is actively managed but there is no
guarantee that the manager’s investment decisions will produce the desired results. The Fund’s prospectus also includes a description of the main investment
risks.
1. The Fund has a fee waiver associated with its investments in a Franklin Templeton money fund, contractually guaranteed through at least its current fiscal year-end. Fund
investment results reflect the fee waiver, to the extent applicable; without this reduction, the results would have been lower.
2. Cumulative total return represents the change in value of an investment over the periods indicated.
3. Average annual total return represents the average annual change in value of an investment over the periods indicated.
4. These figures represent the value of a hypothetical $1,000,000 investment in the Fund over the periods indicated.
5. Figures are as stated in the Fund’s current prospectus. In periods of market volatility, assets may decline significantly, causing total annual Fund operating expenses to
become higher than the figures shown.
6. Source: Morningstar. The MSCI ACWI ex USA Index is a free float-adjusted, market capitalization-weighted index designed to measure equity market performance of
global developed and emerging markets, excluding the U.S. The MSCI EAFE Index is a free float-adjusted, market capitalization-weighted index designed to measure equity
market performance of global developed markets excluding the U.S. and Canada.
7. Source: Bureau of Labor Statistics, bls.gov/cpi. The Consumer Price Index (CPI) is a commonly used measure of the inflation rate.
See www.franklintempletondatasources.com for additional data provider information.
ftinstitutional.com
Annual Report
| 15
FOREIGN EQUITY SERIES
Your Fund’s Expenses
As a Fund shareholder, you can incur two types of costs:
- Transaction costs, including sales charges (loads) on Fund purchases, if applicable; and
- Ongoing Fund costs, including management fees, distribution and service (12b-1) fees, if applicable, and other Fund expenses. All mutual funds have ongoing costs, sometimes referred to as operating expenses.
The following table shows ongoing costs of investing in the Fund and can help you understand these costs and compare them with those of other mutual funds. The table assumes a $1,000 investment held for the six months indicated.
Actual Fund Expenses
The first line (Actual) for each share class listed in the table provides actual account values and expenses. The “Ending Account Value” is derived from the Fund’s actual return, which includes the effect of Fund expenses.
You can estimate the expenses you paid during the period by following these steps. Of course, your account value and expenses will differ from those in this illustration:
| 1. | Divide your account value by $1,000. |
| If an account had an $8,600 value, then $8,600 ÷ $1,000 = 8.6. | |
| 2. | Multiply the result by the number under the heading “Expenses Paid During Period.” |
| If Expenses Paid During Period were $7.50, then 8.6 x $7.50 = $64.50. |
In this illustration, the estimated expenses paid this period are $64.50.
Hypothetical Example for Comparison with Other Funds
Information in the second line (Hypothetical) for each class in the table can help you compare ongoing costs of investing in the Fund with those of other mutual funds. This information may not be used to estimate the actual ending account balance or expenses you paid during the period. The hypothetical “Ending Account Value” is based on the actual expense ratio for each class and an assumed 5% annual rate of return before expenses, which does not represent the Fund’s actual return. The figure under the heading “Expenses Paid During Period” shows the hypothetical expenses your account would have incurred under this scenario. You can compare this figure with the 5% hypothetical examples that appear in shareholder reports of other funds.
Please note that expenses shown in the table are meant to highlight ongoing costs and do not reflect any transaction costs, such as sales charges. Therefore, the second line for each class is useful in comparing ongoing costs only, and will not help you compare total costs of owning different funds. In addition, if transaction costs were included, your total costs would have been higher. Please refer to the Fund prospectus for additional information on operating expenses.
| Beginning Account | Ending Account | Expenses Paid During | ||||
| Share Class | Value 7/1/14 | Value 12/31/14 | Period* 7/1/14–12/31/14 | |||
| Primary | ||||||
| Actual | $ | 1,000 | $ | 899.00 | $ | 3.69 |
| Hypothetical (5% return before expenses) | $ | 1,000 | $ | 1,021.32 | $ | 3.92 |
| Service Shares | ||||||
| Actual | $ | 1,000 | $ | 898.20 | $ | 4.40 |
| Hypothetical (5% return before expenses) | $ | 1,000 | $ | 1,020.57 | $ | 4.69 |
*Expenses are calculated using the most recent six-month expense ratio, net of expense waivers, annualized for each class (Primary Shares: 0.77% and Service Shares: 0.92%), multiplied by the average account value over the period, multiplied by 184/365 for to reflect the one-half year period.
16 | Annual Report
ftinstitutional.com
Foreign Smaller Companies Series
This annual report for Foreign Smaller Companies Series (Fund) covers the fiscal year ended December 31, 2014. Effective at the market close on December 10, 2013, the Fund closed to new investors. Existing shareholders may add to their accounts. We believe this closure will help us manage the inflow of assets and allow us to effectively manage our current level of assets.
Your Fund’s Goal and Main Investments
The Fund seeks long-term capital growth. Under normal market conditions, the Fund invests at least 80% of its net assets in investments of smaller companies located outside the U.S., including emerging markets.
Geographic Breakdown
Based on Total Net Assets as of 12/31/14
Performance Overview
The Fund had a -3.32% cumulative total return for the 12-month period under review. In comparison, the MSCI All Country World Index (ACWI) ex USA Small Cap Index, which measures performance of global developed and emerging market small-cap equities, excluding the U.S., had a -3.69% total return.1 Please note index performance information is provided for reference and we do not attempt to track the index but rather undertake investments on the basis of fundamental research. You can find the Fund’s long-term performance data in the Performance Summary beginning on page 20.
Performance data represent past performance, which does not guarantee future results. Investment return and principal value will fluctuate, and you may have a gain or loss when you sell your shares. Current performance may differ from figures shown. Please visit ftinstitutional.com or call (800) 321-8563 for most recent month-end performance.
Investment Strategy
When choosing equity investments, we apply a bottom-up, value-oriented, long-term approach, focusing on the market price of a company’s securities relative to our evaluation of the company’s long-term (typically five years) earnings, asset value and cash flow potential. We also consider a company’s price/earnings ratio, profit margins, liquidation value and other factors.
Manager’s Discussion
Several holdings performed well during the 12 months under review. Daum Communications is South Korea’s number-two search engine and Internet portal. During the period, Daum’s shares advanced strongly after the company accepted a merger proposal from Kakao, which dominates South Korea’s mobile game market. Additionally, Kakao has more than 36 million monthly active users in its mobile business and offers a mobile application used by over 90% of South Korea’s smartphone users. Following the merger completion in October, Daum Communications changed its name to Daum Kakao.
Flextronics International is a Singapore-based supply chain solutions company that offers design, manufacturing, distribution and aftermarket services to original equipment manufacturers. Shares performed well after the company reported better-than-expected earnings and received significant orders from a major smart-phone manufacturer. The stock also benefited from an elevated share repurchase program implemented early in the year.
Shares of Japan-based Asics rose after the sporting goods company reported strong financial results. Substantial growth in e-commerce sales, including direct online sales and sales through Amazon.com, Zappos.com and other websites, lifted Asics’s U.S. business, which was the greatest contributor to overall earnings for fiscal year 2013–2014. Based on our analysis, we saw further, substantial potential for Asics to expand its
1. Source: Morningstar.
The index is unmanaged and includes reinvested dividends. One cannot invest directly in an index, and an index is not representative of the Fund’s portfolio.
The dollar value, number of shares or principal amount, and names of all portfolio holdings are listed in the Fund’s Statement of Investments (SOI). The SOI
begins on page 41.
ftinstitutional.com
Annual Report
| 17
FOREIGN SMALLER COMPANIES SERIES
| Portfolio Breakdown | ||
| 12/31/14 | ||
| % of Total | ||
| Sector/Industry | Net Assets | |
| Auto Components | 6.6 | % |
| Machinery | 6.5 | % |
| Textiles, Apparel & Luxury Goods | 6.2 | % |
| Electronic Equipment, Instruments & Components | 5.9 | % |
| Household Durables | 5.3 | % |
| Capital Markets | 5.2 | % |
| Leisure Products | 4.5 | % |
| Media | 3.8 | % |
| Personal Products | 3.4 | % |
| Real Estate Management & Development | 3.0 | % |
| Banks | 2.9 | % |
| Specialty Retail | 2.8 | % |
| Food & Staples Retailing | 2.6 | % |
| Communications Equipment | 2.5 | % |
| Energy Equipment & Services | 2.5 | % |
| Software | 2.3 | % |
| Commercial Services & Supplies | 2.3 | % |
| Other | 25.6 | % |
| Short-Term Investments & Other Net Assets | 6.1 | % |
sales channels and take advantage of its untapped brand value. The global popularity of fitness and running, as well as a growing recognition of Asics products’ high performance should, in our view, also remain a growth driver for the company. Asics announced a 30 billion yen investment in improved research and development, back-end systems, and expansion of its distribution facilities in the U.S. and Japan.
In contrast, the Fund had some underperformers during the period under review. Shares of Swedish cosmetics retailer Oriflame Cosmetics slipped to their lowest price level in nearly nine years after the company missed earnings estimates and issued weak guidance. Heavy exposure to Russia and Ukraine, which account for more than one-third of Oriflame’s sales, also intensified downward pressure on the stock. However, Oriflame has a long track record of managing through times of volatility, and we believe the market undervalued the firm’s long-term growth potential as it cut costs, increased salesforce productivity and expanded its presence in attractive new markets.
2. Sold by period-end.
See www.franklintempletondatasources.com for additional data provider information.
| Top 10 Holdings | ||
| 12/31/14 | ||
| Company | % of Total | |
| Sector/Industry, Country | Net Assets | |
| Asics Corp. | 2.1 | % |
| Textiles, Apparel & Luxury Goods, Japan | ||
| Techtronic Industries Co. Ltd. | 2.1 | % |
| Household Durables, Hong Kong | ||
| VTech Holdings Ltd. | 2.1 | % |
| Communications Equipment, Hong Kong | ||
| Huhtamaki OYJ | 1.9 | % |
| Containers & Packaging, Finland | ||
| Amer Sports OYJ | 1.9 | % |
| Leisure Products, Finland | ||
| Greggs PLC | 1.9 | % |
| Food & Staples Retailing, U.K. | ||
| Kobayashi Pharmaceutical Co. Ltd. | 1.8 | % |
| Personal Products, Japan | ||
| Aalberts Industries NV | 1.7 | % |
| Machinery, Netherlands | ||
| Gerresheimer AG | 1.7 | % |
| Life Sciences Tools & Services, Germany | ||
| Giant Manufacturing Co. Ltd. | 1.6 | % |
| Leisure Products, Taiwan |
Headquartered in London, African Minerals is a minerals exploration and development company with a strong iron ore production growth profile.2 Shares weakened during the period due to declining metals prices and investor concerns about moderating global economic growth.
Hyundai Mipo Dockyard, a diversified shipbuilder specializing in midsized ships, was another key detractor. The South Korean company is widely acknowledged as one of the most efficient shipbuilders globally, with best-in-class margins, but its share price declined after the company held off taking new orders as it waited for ship owners to respond to higher prices. Given its strong track record and advanced technology in fuel-efficient vessels, Hyundai Mipo, in our view, may strengthen its leading position in the industry and benefit from tightening global environmental regulations.
It is important to recognize the effect of currency movements on the Fund’s performance. In general, if the value of the U.S. dollar goes up compared with a foreign currency, an investment traded in that foreign currency will go down in value because it will be worth fewer U.S. dollars. This can have a negative effect on Fund performance. Conversely, when the U.S. dollar weakens in relation to a foreign currency, an investment traded in that
18 | Annual Report
ftinstitutional.com
FOREIGN SMALLER COMPANIES SERIES
foreign currency will increase in value, which can contribute to Fund performance. For the 12 months ended December 31, 2014, the U.S. dollar rose in value relative to most currencies. As a result, the Fund’s performance was negatively affected by the portfolio’s investment predominantly in securities with non-U.S. currency exposure.
Thank you for your continued participation in Foreign Smaller Companies Series. We look forward to serving your future investment needs.
The foregoing information reflects our analysis, opinions and portfolio holdings as of December 31, 2014, the end of the reporting period. The way we implement our main investment strategies and the resulting portfolio holdings may change depending on factors such as market and economic conditions. These opinions may not be relied upon as investment advice or an offer for a particular security. The information is not a complete analysis of every aspect of any market, country, industry, security or the Fund. Statements of fact are from sources considered reliable, but the investment manager makes no representation or warranty as to their completeness or accuracy. Although historical performance is no guarantee of future results, these insights may help you understand our investment management philosophy.
ftinstitutional.com Annual Report | 19
FOREIGN SMALLER COMPANIES SERIES
Performance Summary as of December 31, 2014
Your dividend income will vary depending on dividends or interest paid by securities in the Fund’s portfolio, adjusted for operating expenses. Capital gain distributions are net profits realized from the sale of portfolio securities. The performance table and graph do not reflect any taxes that a shareholder would pay on Fund dividends, capital gain distributions, if any, or any realized gains on the sale of Fund shares. Total return reflects reinvestment of the Fund’s dividends and capital gain distributions, if any, and any unrealized gains or losses.
| Share Price | ||||||||||||||||
| Symbol: TFSCX | 12/31/14 | 12/31/13 | Change | |||||||||||||
| Net Asset Value (NAV) | $ | 20.80 | $ | 21.96 | -$ | 1.16 | ||||||||||
| Distributions | ||||||||||||||||
| Dividend | Short-Term | Long-Term | ||||||||||||||
| Income | Capital Gain | Capital Gain | Total | |||||||||||||
| 1/1/14–12/31/14 | $ | 0.1606 | $ | 0.0571 | $ | 0.2125 | $ | 0.4302 | ||||||||
| Performance | ||||||||||||||||
| Value of | ||||||||||||||||
| Cumulative | Average Annual | $ | 1,000,000 | Total Annual | ||||||||||||
| Total Return1 | Total Return2 | Investment3 | Operating Expenses4 | |||||||||||||
| 0.99 | % | |||||||||||||||
| 1-Year | -3.32 | % | -3.32 | % | $ | 966,852 | ||||||||||
| 5-Year | + | 54.67 | % | + | 9.11 | % | $ | 1,546,845 | ||||||||
| 10-Year | + | 128.04 | % | + | 8.59 | % | $ | 2,280,521 | ||||||||
Performance data represent past performance, which does not guarantee future results. Investment return and principal value will fluctuate, and you may have a gain or loss when you sell your shares. Current performance may differ from figures shown. For most recent month-end performance, visit ftinstitutional.com or call a Franklin Templeton Institutional Services representative at
(800) 321-8563.
20 | Annual Report
ftinstitutional.com
FOREIGN SMALLER COMPANIES SERIES
PERFORMANCE SUMMARY
Total Return Index Comparison for a Hypothetical $1,000,000 Investment
Total return represents the change in value of an investment over the periods shown. It includes any Fund expenses, account fees and reinvested distributions. The unmanaged index includes reinvestment of any income or distributions. It differs from the Fund in composition and does not pay management fees or expenses. One cannot invest directly in an index.

All investments involve risks, including possible loss of principal. The Fund invests in foreign securities, which can involve exposure to currency volatility and
political, economic and regulatory uncertainty. Emerging markets involve heightened risks related to the same factors, in addition to those associated with their
relatively small size and lesser liquidity. The Fund’s investments in smaller company stocks carry special risks as such stocks have historically exhibited greater
price volatility than large company stocks, particularly over the short term. Additionally, smaller companies often have relatively small revenues, limited product
lines and small market share. The Fund is actively managed but there is no guarantee that the manager’s investment decisions will produce the desired results.
The Fund’s prospectus also includes a description of the main investment risks.
1. Cumulative total return represents the change in value of an investment over the periods indicated.
2. Average annual total return represents the average annual change in value of an investment over the periods indicated.
3. These figures represent the value of a hypothetical $1,000,000 investment in the Fund over the periods indicated.
4. Figures are as stated in the Fund’s current prospectus. In periods of market volatility, assets may decline significantly, causing total annual Fund operating expenses to
become higher than the figures shown.
5. Source: Morningstar. The MSCI ACWI ex USA Small Cap Index is a free float-adjusted, market capitalization-weighted index designed to measure performance of small
cap equity securities of global developed and emerging markets, excluding the U.S.
See www.franklintempletondatasources.com for additional data provider information.
ftinstitutional.com Annual Report | 21
FOREIGN SMALLER COMPANIES SERIES
Your Fund’s Expenses
As a Fund shareholder, you can incur two types of costs:
- Transaction costs, including sales charges (loads) on Fund purchases, if applicable; and
- Ongoing Fund costs, including management fees, distribution and service (12b-1) fees, if applicable, and other Fund expenses. All mutual funds have ongoing costs, sometimes referred to as operating expenses.
The following table shows ongoing costs of investing in the Fund and can help you understand these costs and compare them with those of other mutual funds. The table assumes a $1,000 investment held for the six months indicated.
Actual Fund Expenses
The first line (Actual) of the table provides actual account values and expenses. The “Ending Account Value” is derived from the Fund’s actual return, which includes the effect of Fund expenses.
You can estimate the expenses you paid during the period by following these steps. Of course, your account value and expenses will differ from those in this illustration:
1. Divide your account value by $1,000.
If an account had an $8,600 value, then $8,600 ÷ $1,000 = 8.6.
2. Multiply the result by the number under the heading “Expenses Paid During Period.”
If Expenses Paid During Period were $7.50, then 8.6 x $7.50 = $64.50.
In this illustration, the estimated expenses paid this period are $64.50.
Hypothetical Example for Comparison with Other Funds
Information in the second line (Hypothetical) of the table can help you compare ongoing costs of investing in the Fund with those of other mutual funds. This information may not be used to estimate the actual ending account balance or expenses you paid during the period. The hypothetical “Ending Account Value” is based on the Fund’s actual expense ratio and an assumed 5% annual rate of return before expenses, which does not represent the Fund’s actual return. The figure under the heading “Expenses Paid During Period” shows the hypothetical expenses your account would have incurred under this scenario. You can compare this figure with the 5% hypothetical examples that appear in shareholder reports of other funds.
Please note that expenses shown in the table are meant to highlight ongoing costs and do not reflect any transaction costs, such as sales charges. Therefore, the second line of the table is useful in comparing ongoing costs only, and will not help you compare total costs of owning different funds. In addition, if transaction costs were included, your total costs would have been higher. Please refer to the Fund prospectus for additional information on operating expenses.
| Beginning Account | Ending Account | Expenses Paid During | ||||
| Value 7/1/14 | Value 12/31/14 | Period* 7/1/14–12/31/14 | ||||
| Actual | $ | 1,000 | $ | 916.00 | $ | 4.73 |
| Hypothetical (5% return before expenses) | $ | 1,000 | $ | 1,020.27 | $ | 4.99 |
| *Expenses are calculated using the most recent six-month annualized expense ratio, of 0.98%, multiplied by the average account value over | ||||||
| the period, multiplied by 184/365 to reflect the one-half year period. | ||||||
22 | Annual Report ftinstitutional.com
Global Equity Series
This annual report for Global Equity Series (Fund) covers the fiscal year ended December 31, 2014.
Your Fund’s Goal and Main Investments
The Fund seeks long-term capital growth. Under normal market conditions, the Fund invests at least 80% of its net assets in equity securities of companies located anywhere in the world, including emerging markets.
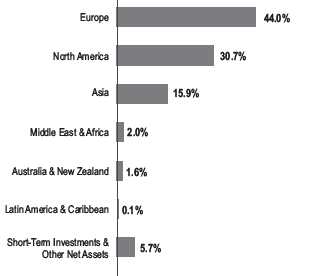
Geographic Breakdown
Based on Total Net Assets as of 12/31/14
Performance Overview
The Fund had a -2.01% cumulative total return for the 12 months under review. For comparison, the Fund’s benchmark, the MSCI All Country World Index (ACWI), which measures stock market performance in global developed and emerging markets, produced a +4.71% total return.1 Please note index performance information is provided for reference and we do not attempt to track an index but rather undertake investments on the basis of fundamental research. You can find the Fund’s long-term performance data in the Performance Summary beginning on page 27.
Performance data represent past performance, which does not guarantee future results. Investment return and principal value will fluctuate, and you may have a gain or loss when you sell your shares. Current performance may differ from figures shown. Please visit ftinstitutional.com or call (800) 321-8563 for most recent month-end performance.
Investment Strategy
We employ a bottom-up, value-oriented, long-term investment strategy. Our in-depth fundamental research evaluates a company’s potential to grow earnings, asset value and/or cash flow. We also consider a company’s price/earnings ratio, profit margins and liquidation value.
Manager’s Discussion
The year 2014 was a challenging one for global equity markets. Following a period of tentative optimism that corporate fundamentals would resume driving share prices, investor focus shifted back to broad-based economic and political factors in 2014. In our opinion, the most significant story in 2014 was the deepening divergence between the U.S., where growth rates improved, and the rest of the world, where growth rates generally moderated. Numerous factors contributed to the change in market conditions. In Europe, disinflationary pressures intensified and political discord resurfaced; in Japan, extraordinary monetary policy failed to prevent a triple-dip recession; and in diverse emerging markets, economic growth generally cooled as commodities and currencies came under pressure. Two major events further deepened the divide between U.S. and international markets. The price of oil nearly halved, favoring the consumer-driven U.S. economy at the expense of oil-exporting nations abroad; and Russia invaded Ukraine, marring European business confidence and reminding investors of the risks sometimes associated with emerging market investing. In this environment of increasing economic and geopolitical uncertainty, the U.S. seemed to us to solidify its status as a destination for capital in troubled times.
However, in our opinion, the U.S.’s attractive mix of defensive and pro-cyclical characteristics came at a cost. The price-to-book multiple of U.S. stocks relative to global peers neared
1. Source: Morningstar.
The index is unmanaged and includes reinvested dividends. One cannot invest directly in an index, and an index is not representative of the Fund’s portfolio.
The dollar value, number of shares or principal amount, and names of all portfolio holdings are listed in the Fund’s Statement of Investments (SOI).
The SOI begins on page 47.
ftinstitutional.com
Annual Report
| 23
GLOBAL EQUITY SERIES
all-time highs at year-end, and measures of price-to-normalized earnings were also elevated. Yet, despite our underweighting in the U.S., we continued to find selective bottom-up opportunities in this deep and diverse market, and absolute and relative returns from our U.S. position contributed to relative performance. Even-weighted Asian holdings also benefited relative results, buoyed by stock selection. Although we found value relatively scarce in Japan, where we had yet to see the structural reforms required to deal with challenges caused by debt, demographics and corporate governance, we selectively discovered opportunities we deemed attractive elsewhere, notably in emerging Asia. Stock selection and an underweighting in Japan contributed to relative returns in 2014, as did an overweighted allocation in China. In China, our focus was on finding companies with, in our opinion, balance sheet strength, capital discipline and the ability to sustainably generate strong free cash flow.
Stock selection and an overweighted allocation in Europe detracted from relative performance as the delicate progress made stabilizing the banking system, enacting necessary budget reforms, and preparing for further monetary stimulus failed to meaningfully restore corporate confidence or revive lending activity. Concerns about Europe, along with worries about a slowing China and destabilized Russia, made European equities cheap on nearly all normalized valuation metrics. Overall, we consider such valuation and investment levels depressed for a diverse corporate sector composed of many high-quality, globally relevant companies.
From a sector perspective, an overweighted energy position was responsible for three of the Fund’s biggest detractors: Galp Energia, KunLun Energy (China) and Eni (Italy).2 Portuguese oil major Galp Energia was a significant laggard, declining toward period-end as investors overlooked better-than-expected earnings and focused instead on weak oil prices and ancillary issues in Brazil that could impact the production timeline of Galp’s investments. Yet, in our analysis, Galp remained one of the cheapest European oil majors and boasted attractive assets with long-term production growth potential for patient investors. More generally, we remained favorable toward our energy sector holdings despite recent challenges. Although we do not know when equilibrium will be restored to oil markets, we do expect that supply could incrementally decline and oil
| Portfolio Breakdown | ||
| 12/31/14 | ||
| % of Total | ||
| Sector/Industry | Net Assets | |
| Banks | 12.1 | % |
| Pharmaceuticals | 11.1 | % |
| Oil, Gas & Consumable Fuels | 7.6 | % |
| Insurance | 5.7 | % |
| Biotechnology | 3.8 | % |
| Media | 3.6 | % |
| Food & Staples Retailing | 3.3 | % |
| Diversified Telecommunication Services | 3.0 | % |
| Software | 3.0 | % |
| Machinery | 2.9 | % |
| Capital Markets | 2.7 | % |
| Specialty Retail | 2.6 | % |
| Metals & Mining | 2.5 | % |
| Automobiles | 2.5 | % |
| Technology Hardware, Storage & Peripherals | 2.3 | % |
| Health Care Equipment & Supplies | 2.2 | % |
| Multiline Retail | 2.2 | % |
| Airlines | 2.1 | % |
| Other | 19.1 | % |
| Short-Term Investments & Other Net Assets | 5.7 | % |
may eventually return to a level that promotes continued investment. In the meantime, we have focused on the long-term fundamental prospects of individual energy companies. Energy stocks were historically cheap following a period of sustained pressure on sector fundamentals and, most recently, a major oil price correction. As energy companies improved capital allocation and refocused on shareholder returns, we continued to find what we considered compelling long-term bargains in the sector, with a focus on companies with the balance sheet strength to weather a period of lower oil prices, in our opinion.
Consistent with the broad-based underperformance of cyclical sectors in 2014, the Fund’s holdings in the information technology, financials and industrials sectors detracted from relative performance.3 Industrials contributed two of the Fund’s biggest laggards. Shares of Dutch logistics firm TNT Express declined
2. The energy sector comprises energy equipment and services; and oil, gas and consumable fuels in the SOI.
3. The information technology sector comprises electronic equipment, instruments and components; semiconductors and semiconductor equipment; software; and technology hardware, storage and peripherals in the SOI. The financials sector comprises banks, capital markets, consumer finance, diversified financial services, insurance, and thrifts and mortgage finance in the SOI. The industrials sector comprises air freight and logistics, airlines, building products, commercial services and supplies, electrical equipment, industrial conglomerates and machinery in the SOI.
24 | Annual Report
ftinstitutional.com
GLOBAL EQUITY SERIES
after the company withdrew its profit target amid weak European economic growth and increased pricing pressure. Our investment thesis regarding TNT had always been predicated on a long-term restructuring that would prune unprofitable businesses and maximize the value of the firm’s unique road network. We did not expect this to be a quick process and remained positive on the company’s prospects over our long-term investment horizon. U.K. services firm Serco Group was another industrials sector laggard, whose share price retreated as an investigation into alleged malpractice at a domestic business unit resulted in profit warnings and a need to raise capital. We remained encouraged by the company’s earnest efforts to address its issues and restore the faith of its clients and regulator, and felt that the stock’s depressed valuation failed to reflect new management’s sensible turnaround plan and Serco’s attractive position as a long-term beneficiary of public sector outsourcing growth.
Conversely, an overweighted allocation in health care and stock selection in consumer discretionary holdings contributed to relative performance.4 U.S. specialty drug manufacturer Forest Laboratories was a top performer, surging after the company agreed to be acquired by rival pharmaceuticals firm Actavis. More generally, in our analysis, our health care position offered a mix of longer term holdings among major pharmaceuticals firms that have restructured and rebased earnings in the aftermath of many expiring patents industry-wide, and newer bargains among medical technology, specialty pharmaceuticals and biotechnology stocks with what we considered undervalued cash-flow and profit growth potential. From the consumer discretionary sector, shares of U.S. athletic apparel retailer Foot Locker rose to a record high. The company flourished in a difficult retail environment by closing its weaker locations and successfully revamping store layouts and merchandising. We believed Foot Locker remained undervalued given its strong exposure to the secular trend of fitness and healthy living and its proven ability to articulate and execute an effective retail strategy. Elsewhere, underweighted materials holdings also contributed to relative performance, particularly due to stock selection.5
| Top 10 Holdings | ||
| 12/31/14 | ||
| Company | % of Total | |
| Sector/Industry, Country | Net Assets | |
| Microsoft Corp. | 2.5 | % |
| Software, U.S. | ||
| Teva Pharmaceutical Industries Ltd., ADR | 2.0 | % |
| Pharmaceuticals, Israel | ||
| Citigroup Inc. | 1.9 | % |
| Banks, U.S. | ||
| Bayer AG | 1.8 | % |
| Pharmaceuticals, Germany | ||
| Gilead Sciences Inc. | 1.8 | % |
| Biotechnology, U.S. | ||
| Comcast Corp., Special A | 1.8 | % |
| Media, U.S. | ||
| HSBC Holdings PLC | 1.8 | % |
| Banks, U.K. | ||
| Samsung Electronics Co. Ltd. | 1.7 | % |
| Technology Hardware, Storage & Peripherals, South Korea | ||
| Macy’s Inc. | 1.7 | % |
| Multiline Retail, U.S. | ||
| TNT Express NV | 1.6 | % |
| Air Freight & Logistics, Netherlands | ||
It is also important to recognize the effect of currency movements on the Fund’s performance. In general, if the value of the U.S. dollar goes up compared with a foreign currency, an investment traded in that foreign currency will go down in value because it will be worth fewer U.S. dollars. This can have a negative effect on Fund performance. Conversely, when the U.S. dollar weakens in relation to a foreign currency, an investment traded in that foreign currency will increase in value, which can contribute to Fund performance. For the 12 months ended December 31, 2014, the U.S. dollar rose in value relative to most currencies. As a result, the Fund’s performance was negatively affected by the portfolio’s substantial investment in securities with non-U.S. currency exposure.
In recent years, we felt stocks traded more on broad-based economic and policy expectations than on business fundamentals. This trend, in our view, resulted in an increasingly bifurcated market in which the leaders (U.S. stocks, consumer cyclicals
4. The health care sector comprises biotechnology, health care equipment and supplies, health care providers and services, life sciences tools and services, and pharmaceuticals in the SOI. The consumer discretionary sector comprises auto components, automobiles, household durables, media, multiline retail and specialty retail in the SOI.
5. The materials sector comprises chemicals, construction materials, containers and packaging, and metals and mining in the SOI.
See www.franklintempletondatasources.com for additional data provider information.
ftinstitutional.com
Annual Report
| 25
GLOBAL EQUITY SERIES
and health care) kept surging further ahead and the laggards (international stocks and industrial cyclicals) kept falling further behind. Throughout this challenging period, we tried to use the market’s distraction to our advantage by focusing on what we determined to be overlooked value. In doing so, we sought to build a differentiated portfolio based on our long-term assumptions about company-level business fundamentals. We believe outperformance comes from value recognition, and our experience has been that price and value eventually do intersect over time. Going into 2015, we remain confident in the long-term potential of our investment process.
Thank you for your continued participation in Global Equity Series. We look forward to serving your future investment needs.
Peter A. Nori, CFA
Cindy L. Sweeting, CFA
Antonio T. Docal, CFA
Portfolio Management Team
The foregoing information reflects our analysis, opinions and portfolio holdings as of December 31, 2014, the end of the reporting period. The way we implement our main investment strategies and the resulting portfolio holdings may change depending on factors such as market and economic conditions. These opinions may not be relied upon as investment advice or an offer for a particular security. The information is not a complete analysis of every aspect of any market, country, industry, security or the Fund. Statements of fact are from sources considered reliable, but the investment manager makes no representation or warranty as to their completeness or accuracy. Although historical performance is no guarantee of future results, these insights may help you understand our investment management philosophy.
26 | Annual Report
ftinstitutional.com
GLOBAL EQUITY SERIES
Performance Summary as of December 31, 2014
Your dividend income will vary depending on dividends or interest paid by securities in the Fund’s portfolio, adjusted for operating expenses. Capital gain distributions are net profits realized from the sale of portfolio securities. The performance table and graph do not reflect any taxes that a shareholder would pay on Fund dividends, capital gain distributions, if any, or any realized gains on the sale of Fund shares. Total return reflects reinvestment of the Fund’s dividends and capital gain distributions, if any, and any unrealized gains or losses.
| Share Price | ||||||||||||||||
| Symbol: TGESX | 12/31/14 | 12/31/13 | Change | |||||||||||||
| Net Asset Value (NAV) | $ | 9.64 | $ | 11.53 | -$ | 1.89 | ||||||||||
| Distributions | ||||||||||||||||
| Dividend | Short-Term | Long-Term | ||||||||||||||
| Income | Capital Gain | Capital Gain | Total | |||||||||||||
| 1/1/14–12/31/14 | $ | 0.2565 | $ | 0.1627 | $ | 1.2542 | $ | 1.6734 | ||||||||
| Performance | ||||||||||||||||
| Value of | ||||||||||||||||
| Cumulative | Average Annual | $ | 1,000,000 | Total Annual | ||||||||||||
| Total Return1 | Total Return2 | Investment3 | Operating Expenses4 | |||||||||||||
| 0.94 | % | |||||||||||||||
| 1-Year | -2.01 | % | -2.01 | % | $ | 979,907 | ||||||||||
| 5-Year | + | 60.50 | % | + | 9.92 | % | $ | 1,605,039 | ||||||||
| Since Inception (3/31/08) | + | 35.68 | % | + | 4.62 | % | $ | 1,356,819 | ||||||||
Performance data represent past performance, which does not guarantee future results. Investment return and principal value will fluctuate, and you may have a gain or loss when you sell your shares. Current performance may differ from figures shown. For most recent month-end performance, visit ftinstitutional.com or call a Franklin Templeton Institutional Services representative at
(800) 321-8563.
ftinstitutional.com
Annual Report
| 27
GLOBAL EQUITY SERIES
PERFORMANCE SUMMARY
Total Return Index Comparison for a Hypothetical $1,000,000 Investment
Total return represents the change in value of an investment over the periods shown. It includes any Fund expenses, account fees and reinvested distributions. The unmanaged index includes reinvestment of any income or distributions. It differs from the Fund in composition and does not pay management fees or expenses. One cannot invest directly in an index.
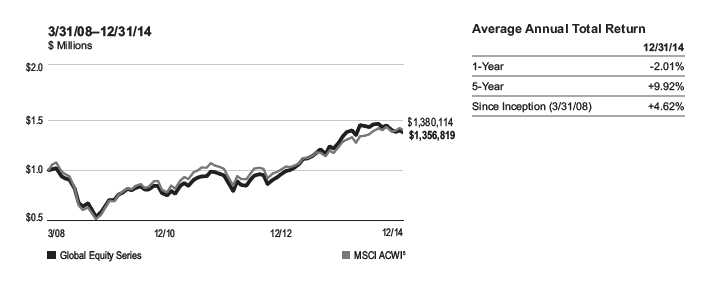
All investments involve risks, including possible loss of principal. Special risks are associated with foreign investing, including currency fluctuations, economic
instability and political developments; investments in emerging markets involve heightened risks related to the same factors. To the extent the Fund focuses on
particular countries, regions, industries, sectors or types of investment from time to time, it may be subject to greater risks of adverse developments in such
areas of focus than a fund that invests in a wider variety of countries, regions, industries, sectors or investments. The Fund is actively managed but there is no
guarantee that the manager’s investment decisions will produce the desired results. The Fund’s prospectus also includes a description of the main investment
risks.
1. Cumulative total return represents the change in value of an investment over the periods indicated.
2. Average annual total return represents the average annual change in value of an investment over the periods indicated.
3. These figures represent the value of a hypothetical $1,000,000 investment in the Fund over the periods indicated.
4. Figures are as stated in the Fund’s current prospectus. In periods of market volatility, assets may decline significantly, causing total annual Fund operating expenses to
become higher than the figures shown.
5. Source: Morningstar. The MSCI ACWI is a free float-adjusted, market capitalization-weighted index designed to measure equity market performance of global developed
and emerging markets.
See www.franklintempletondatasources.com for additional data provider information.
28 | Annual Report ftinstitutional.com
GLOBAL EQUITY SERIES
Your Fund’s Expenses
As a Fund shareholder, you can incur two types of costs:
• Transaction costs, including sales charges (loads) on Fund purchases, if applicable; and
• Ongoing Fund costs, including management fees, distribution and service (12b-1) fees, if applicable, and other Fund expenses. All mutual funds have ongoing costs, sometimes referred to as operating expenses.
The following table shows ongoing costs of investing in the Fund and can help you understand these costs and compare them with those of other mutual funds. The table assumes a $1,000 investment held for the six months indicated.
Actual Fund Expenses
The first line (Actual) of the table provides actual account values and expenses. The “Ending Account Value” is derived from the Fund’s actual return, which includes the effect of Fund expenses.
You can estimate the expenses you paid during the period by following these steps. Of course, your account value and expenses will differ from those in this illustration:
| 1. | Divide your account value by $1,000. |
| If an account had an $8,600 value, then $8,600 ÷ $1,000 = 8.6. | |
| 2. | Multiply the result by the number under the heading “Expenses Paid During Period.” |
| If Expenses Paid During Period were $7.50, then 8.6 x $7.50 = $64.50. |
In this illustration, the estimated expenses paid this period are $64.50.
Hypothetical Example for Comparison with Other Funds
Information in the second line (Hypothetical) of the table can help you compare ongoing costs of investing in the Fund with those of other mutual funds. This information may not be used to estimate the actual ending account balance or expenses you paid during the period. The hypothetical “Ending Account Value” is based on the Fund’s actual expense ratio and an assumed 5% annual rate of return before expenses, which does not represent the Fund’s actual return. The figure under the heading “Expenses Paid During Period” shows the hypothetical expenses your account would have incurred under this scenario. You can compare this figure with the 5% hypothetical examples that appear in shareholder reports of other funds.
Please note that expenses shown in the table are meant to highlight ongoing costs and do not reflect any transaction costs, such as sales charges. Therefore, the second line of the table is useful in comparing ongoing costs only, and will not help you compare total costs of owning different funds. In addition, if transaction costs were included, your total costs would have been higher. Please refer to the Fund prospectus for additional information on operating expenses.
| Beginning Account | Ending Account | Expenses Paid During | ||||
| Value 7/1/14 | Value 12/31/14 | Period* 7/1/14–12/31/14 | ||||
| Actual | $ | 1,000 | $ | 936.80 | $ | 4.34 |
| Hypothetical (5% return before expenses) | $ | 1,000 | $ | 1,020.72 | $ | 4.53 |
| *Expenses are calculated using the most recent six-month annualized expense ratio, of 0.89%, multiplied by the average account value over | ||||||
| the period, multiplied by 184/365 to reflect the one-half year period. | ||||||
ftinstitutional.com Annual Report | 29
| TEMPLETON INSTITUTIONAL FUNDS | |||||||||||||||
| Financial Highlights | |||||||||||||||
| Emerging Markets Series | |||||||||||||||
| Year Ended December 31, | |||||||||||||||
| 2014 | 2013 | 2012 | 2011 | 2010 | |||||||||||
| Per share operating performance | |||||||||||||||
| (for a share outstanding throughout the year) | |||||||||||||||
| Net asset value, beginning of year | $ | 7.31 | $ | 10.49 | $ | 10.48 | $ | 16.70 | $ | 14.41 | |||||
| Income from investment operationsa: | |||||||||||||||
| Net investment incomeb | 0.12 | c | 0.13 | 0.22 | 0.27 | 0.15 | |||||||||
| Net realized and unrealized gains (losses) | (0.70 | ) | (0.13 | ) | 1.38 | (1.88 | ) | 2.37 | |||||||
| Total from investment operations | (0.58 | ) | — | 1.60 | (1.61 | ) | 2.52 | ||||||||
| Less distributions from: | |||||||||||||||
| Net investment income | (0.19 | ) | (0.13 | ) | (0.32 | ) | (0.30 | ) | (0.23 | ) | |||||
| Net realized gains | (1.95 | ) | (3.05 | ) | (1.27 | ) | (4.31 | ) | — | ||||||
| Total distributions | (2.14 | ) | (3.18 | ) | (1.59 | ) | (4.61 | ) | (0.23 | ) | |||||
| Net asset value, end of year | $ | 4.59 | $ | 7.31 | $ | 10.49 | $ | 10.48 | $ | 16.70 | |||||
| Total return | (8.01 | )% | 0.72 | % | 15.77 | % | (12.02 | )% | 17.55 | % | |||||
| Ratios to average net assets | |||||||||||||||
| Expenses before waiver and payments by affiliates | 1.32 | % | 1.32 | % | 1.28 | % | 1.34 | % | 1.37 | % | |||||
| Expenses net of waiver and payments by affiliates | 1.32 | % | 1.29 | % | 1.24 | % | 1.32 | % | 1.37 | % | |||||
| Net investment income | 1.74 | %c | 1.23 | % | 1.99 | % | 1.74 | % | 1.05 | % | |||||
| Supplemental data | |||||||||||||||
| Net assets, end of year (000’s) | $ | 101,861 | $ | 165,216 | $ | 249,190 | $ | 272,364 | $ | 1,487,401 | |||||
| Portfolio turnover rate | 78.18 | % | 52.07 | % | 24.31 | % | 9.48 | % | 23.97 | % | |||||
aThe amount shown for a share outstanding throughout the period may not correlate with the Statement of Operations for the period due to the timing of sales and
repurchases of the Fund shares in relation to income earned and/or fluctuating fair value of the investments of the Fund.
bBased on average daily shares outstanding.
cNet investment income per share includes approximately $0.03 per share received in the form of special dividends. Excluding these amounts, the ratio of net investment
income to average net assets would have been 1.33%.
30 | Annual Report | The accompanying notes are an integral part of these financial statements.
ftinstitutional.com
TEMPLETON INSTITUTIONAL FUNDS
| Statement of Investments, December 31, 2014 | ||||
| Emerging Markets Series | ||||
| Industry | Shares | Value | ||
| Common Stocks 93.9% | ||||
| Argentina 0.2% | ||||
| a Grupo Clarin SA, B, GDR, Reg S | Media | 21,162 | $ | 201,039 |
| Austria 0.2% | ||||
| OMV AG | Oil, Gas & Consumable Fuels | 7,415 | 197,477 | |
| Belgium 4.7% | ||||
| Anheuser-Busch InBev NV | Beverages | 42,541 | 4,831,407 | |
| Brazil 5.2% | ||||
| Itau Unibanco Holding SA, ADR | Banks | 325,520 | 4,235,015 | |
| M Dias Branco SA | Food Products | 15,300 | 523,914 | |
| Souza Cruz SA | Tobacco | 80,967 | 588,629 | |
| 5,347,558 | ||||
| Chile 0.3% | ||||
| Sociedad Quimica Y Minera de Chile SA Soquimich, | ||||
| ADR | Chemicals | 13,544 | 323,431 | |
| China 22.2% | ||||
| b Aluminum Corp. of China Ltd., H | Metals & Mining | 1,114,400 | 513,081 | |
| b,c BAIC Motor Corp. Ltd., 144A | Automobiles | 380,500 | 439,192 | |
| Brilliance China Automotive Holdings Ltd. | Automobiles | 3,066,100 | 4,903,261 | |
| China Construction Bank Corp., H | Banks | 3,983,900 | 3,262,565 | |
| China Life Insurance Co. Ltd., H | Insurance | 448,000 | 1,750,643 | |
| China Mobile Ltd. | Wireless Telecommunication Services | 126,500 | 1,479,704 | |
| China Petroleum and Chemical Corp., H | Oil, Gas & Consumable Fuels | 2,092,500 | 1,686,640 | |
| b China Shipping Development Co. Ltd., H | Marine | 2,226,200 | 1,524,529 | |
| Industrial and Commercial Bank of China Ltd., H | Banks | 2,086,100 | 1,522,750 | |
| NetEase Inc., ADR | Internet Software & Services | 8,908 | 883,139 | |
| PetroChina Co. Ltd., H | Oil, Gas & Consumable Fuels | 2,092,200 | 2,315,088 | |
| Tencent Holdings Ltd. | Internet Software & Services | 72,000 | 1,044,629 | |
| Yanzhou Coal Mining Co. Ltd., H | Oil, Gas & Consumable Fuels | 1,484,200 | 1,259,492 | |
| 22,584,713 | ||||
| Greece 0.3% | ||||
| b National Bank of Greece SA | Banks | 185,501 | 329,951 | |
| Hong Kong 0.7% | ||||
| Dairy Farm International Holdings Ltd. | Food & Staples Retailing | 57,719 | 519,471 | |
| MGM China Holdings Ltd. | Hotels, Restaurants & Leisure | 93,600 | 238,045 | |
| 757,516 | ||||
| India 11.5% | ||||
| Biocon Ltd. | Biotechnology | 156,108 | 1,053,887 | |
| Dr. Reddy’s Laboratories Ltd. | Pharmaceuticals | 20,420 | 1,051,597 | |
| Infosys Ltd. | IT Services | 28,256 | 884,213 | |
| Reliance Industries Ltd. | Oil, Gas & Consumable Fuels | 39,700 | 561,254 | |
| Tata Consultancy Services Ltd. | IT Services | 130,571 | 5,299,171 | |
| Tata Motors Ltd. | Automobiles | 364,132 | 2,862,626 | |
| 11,712,748 | ||||
| Indonesia 3.6% | ||||
| Astra International Tbk PT | Automobiles | 3,596,100 | 2,155,918 | |
| Bank Danamon Indonesia Tbk PT | Banks | 1,080,000 | 394,590 | |
| Semen Indonesia (Persero) Tbk PT | Construction Materials | 820,500 | 1,073,242 | |
| 3,623,750 | ||||
| ftinstitutional.com | Annual Report | 31 | |||
| TEMPLETON INSTITUTIONAL FUNDS | ||||
| STATEMENT OF INVESTMENTS | ||||
| Emerging Markets Series (continued) | ||||
| Industry | Shares | Value | ||
| Common Stocks (continued) | ||||
| Kenya 0.7% | ||||
| Equity Bank Ltd. | Banks | 282,462 | $ | 155,970 |
| Kenya Commercial Bank Ltd. | Banks | 960,300 | 599,193 | |
| 755,163 | ||||
| Pakistan 0.7% | ||||
| United Bank Ltd. | Banks | 437,700 | 758,767 | |
| Peru 0.4% | ||||
| Compania de Minas Buenaventura SA, ADR | Metals & Mining | 40,800 | 390,048 | |
| Philippines 2.5% | ||||
| Ayala Corp. | Diversified Financial Services | 72,620 | 1,125,338 | |
| b Bloomberry Resorts Corp. | Hotels, Restaurants & Leisure | 3,853,800 | 1,067,034 | |
| b Melco Crown Philippines Resorts Corp. | Hotels, Restaurants & Leisure | 1,047,200 | 317,539 | |
| 2,509,911 | ||||
| Qatar 1.4% | ||||
| Industries Qatar QSC | Industrial Conglomerates | 30,731 | 1,417,692 | |
| South Africa 12.3% | ||||
| Kumba Iron Ore Ltd. | Metals & Mining | 9,030 | 187,323 | |
| MTN Group Ltd. | Wireless Telecommunication Services | 107,566 | 2,059,422 | |
| Naspers Ltd., N | Media | 35,207 | 4,612,636 | |
| Remgro Ltd. | Diversified Financial Services | 246,755 | 5,419,456 | |
| Truworths International Ltd. | Specialty Retail | 40,177 | 268,484 | |
| 12,547,321 | ||||
| South Korea 3.1% | ||||
| Hyundai Development Co. | Construction & Engineering | 25,020 | 885,271 | |
| Samsung Electronics Co. Ltd. | Technology Hardware, Storage & Peripherals | 1,002 | 1,215,672 | |
| SK Innovation Co. Ltd. | Oil, Gas & Consumable Fuels | 13,346 | 1,038,386 | |
| 3,139,329 | ||||
| Switzerland 0.5% | ||||
| Compagnie Financiere Richemont SA | Textiles, Apparel & Luxury Goods | 6,192 | 553,057 | |
| Taiwan 3.1% | ||||
| Taiwan Semiconductor Manufacturing Co. Ltd. | Semiconductors & Semiconductor Equipment | 706,000 | 3,145,114 | |
| Thailand 12.2% | ||||
| Kasikornbank PCL, fgn. | Banks | 177,700 | 1,237,631 | |
| Land and Houses PCL, fgn. | Real Estate Management & Development | 4,871,800 | 1,340,930 | |
| PTT Exploration and Production PCL, fgn. | Oil, Gas & Consumable Fuels | 188,700 | 642,774 | |
| PTT PCL, fgn. | Oil, Gas & Consumable Fuels | 177,800 | 1,752,044 | |
| Quality Houses PCL, fgn. | Real Estate Management & Development | 1,476,500 | 164,355 | |
| Siam Commercial Bank PCL, fgn. | Banks | 903,800 | 5,002,786 | |
| Thai Beverage PCL, fgn. | Beverages | 4,351,400 | 2,266,354 | |
| 12,406,874 | ||||
| Turkey 1.8% | ||||
| Akbank TAS | Banks | 313,000 | 1,161,494 | |
| Tupras-Turkiye Petrol Rafinerileri AS | Oil, Gas & Consumable Fuels | 27,430 | 649,989 | |
| 1,811,483 | ||||
| United Arab Emirates 0.5% | ||||
| Emaar Properties PJSC | Real Estate Management & Development | 269,330 | 532,347 | |
| 32 | Annual Report | ftinstitutional.com | |||
TEMPLETON INSTITUTIONAL FUNDS
STATEMENT OF INVESTMENTS
| Emerging Markets Series (continued) | |||||
| Industry | Shares | Value | |||
| Common Stocks (continued) | |||||
| United Kingdom 4.2% | |||||
| Unilever PLC | Food Products | 103,601 | $ | 4,243,770 | |
| United States 1.6% | |||||
| Avon Products Inc. | Personal Products | 168,634 | 1,583,473 | ||
| Total Common Stocks | |||||
| (Cost $83,216,931) | 95,703,939 | ||||
| dParticipatory Notes 1.2% | |||||
| Saudi Arabia 1.2% | |||||
| c Deutsche Bank AG/London, | |||||
| Etihad Etisalat Co., 144A, 9/27/16 | Wireless Telecommunication Services | 19,184 | 225,968 | ||
| Saudi Basic Industries Corp., 144A, 9/27/16 | Chemicals | 28,312 | 633,774 | ||
| c HSBC Bank PLC, Etihad Etisalat Co., 144A, 11/20/17 | Wireless Telecommunication Services | 30,693 | 361,532 | ||
| Total Participatory Notes | |||||
| (Cost $1,419,168) | 1,221,274 | ||||
| Preferred Stocks 3.0% | |||||
| Brazil 2.6% | |||||
| Petroleo Brasileiro SA, ADR, pfd. | Oil, Gas & Consumable Fuels | 162,400 | 1,230,992 | ||
| Vale SA, ADR, pfd., A | Metals & Mining | 192,100 | 1,394,646 | ||
| 2,625,638 | |||||
| Chile 0.4% | |||||
| Embotelladora Andina SA, pfd., A | Beverages | 180,534 | 437,875 | ||
| Total Preferred Stocks | |||||
| (Cost $5,288,962) | 3,063,513 | ||||
| Total Investments before Short Term | |||||
| Investments (Cost $89,925,061) | 99,988,726 | ||||
| Short Term Investments | |||||
| (Cost $2,196,731) 2.2% | |||||
| Money Market Funds 2.2% | |||||
| United States 2.2% | |||||
| b,e Institutional Fiduciary Trust Money Market Portfolio | 2,196,731 | 2,196,731 | |||
| Total Investments (Cost $92,121,792) | |||||
| 100.3% | 102,185,457 | ||||
| Other Assets, less Liabilities (0.3)% | (324,840 | ) | |||
| Net Assets 100.0% | $ | 101,860,617 |
See Abbreviations on page 67.
aSecurity was purchased pursuant to Regulation S under the Securities Act of 1933, which exempts from registration securities offered and sold outside of the United States.
Such a security cannot be sold in the United States without either an effective registration statement filed pursuant to the Securities Act of 1933, or pursuant to an exemption
from registration. This security has been deemed liquid under guidelines approved by the Trust’s Board of Trustees.
bNon-income producing.
cSecurity was purchased pursuant to Rule 144A under the Securities Act of 1933 and may be sold in transactions exempt from registration only to qualified institutional buyers
or in a public offering registered under the Securities Act of 1933.These securities have been deemed liquid under guidelines approved by the Trust’s Board of Trustees. At
December 31, 2014, the aggregate value of these securities was $1,660,466, representing 1.63% of net assets.
dSee Note 1(c) regarding Participatory Notes.
eSee Note 3(d) regarding investments in Institutional Fiduciary Trust Money Market Portfolio.
ftinstitutional.com
The accompanying notes are an integral part of these financial statements. | Annual Report | 33
| TEMPLETON INSTITUTIONAL FUNDS | |||||||||||||||
| Financial Highlights | |||||||||||||||
| Foreign Equity Series | |||||||||||||||
| Year Ended December 31, | |||||||||||||||
| 2014 | 2013 | 2012 | 2011 | 2010 | |||||||||||
| Primary Shares | |||||||||||||||
| Per share operating performance | |||||||||||||||
| (for a share outstanding throughout the year) | |||||||||||||||
| Net asset value, beginning of year | $ | 22.72 | $ | 19.60 | $ | 17.04 | $ | 20.06 | $ | 19.30 | |||||
| Income from investment operationsa: | |||||||||||||||
| Net investment incomeb | 0.74 | c | 0.45 | 0.48 | 0.55 | 0.40 | |||||||||
| Net realized and unrealized gains (losses) | (2.27 | ) | 3.36 | 2.68 | (2.74 | ) | 0.89 | ||||||||
| Total from investment operations | (1.53 | ) | 3.81 | 3.16 | (2.19 | ) | 1.29 | ||||||||
| Less distributions from: | |||||||||||||||
| Net investment income | (0.79 | ) | (0.44 | ) | (0.58 | ) | (0.53 | ) | (0.53 | ) | |||||
| Net realized gains | (0.35 | ) | (0.25 | ) | (0.02 | ) | (0.30 | ) | — | ||||||
| Total distributions | (1.14 | ) | (0.69 | ) | (0.60 | ) | (0.83 | ) | (0.53 | ) | |||||
| Net asset value, end of year | $ | 20.05 | $ | 22.72 | $ | 19.60 | $ | 17.04 | $ | 20.06 | |||||
| Total return | (6.78 | )% | 19.51 | % | 18.55 | % | (10.90 | )% | 6.70 | % | |||||
| Ratios to average net assets | |||||||||||||||
| Expenses | 0.78 | %d | 0.79 | % | 0.80 | % | 0.79 | % | 0.80 | %e | |||||
| Net investment income | 3.27 | %c | 2.12 | % | 2.66 | % | 2.77 | % | 2.11 | % | |||||
| Supplemental data | |||||||||||||||
| Net assets, end of year (000’s) | $ | 6,210,850 | $ | 6,815,920 | $ | 5,820,506 | $ | 5,364,372 | $ | 6,399,090 | |||||
| Portfolio turnover rate | 14.97 | % | 15.89 | % | 11.94 | % | 9.91 | % | 13.63 | % | |||||
aThe amount shown for a share outstanding throughout the period may not correlate with the Statement of Operations for the period due to the timing of sales and
repurchases of the Fund shares in relation to income earned and/or fluctuating fair value of the investments of the Fund.
bBased on average daily shares outstanding.
cNet investment income per share includes approximately $0.29 per share received in the form of special dividends paid in connection with certain Fund’ holdings.
Excluding these amounts, the ratio of net investment income to average net assets would have been 2.00%.
dBenefit of waiver and payments by affiliates rounds to less than 0.01%.
eBenefit of expense reduction rounds to less than 0.01%.
34 | Annual Report | The accompanying notes are an integral part of these financial statements.
ftinstitutional.com
| TEMPLETON INSTITUTIONAL FUNDS | |||||||||||||||
| FINANCIAL HIGHLIGHTS | |||||||||||||||
| Foreign Equity Series (continued) | |||||||||||||||
| Year Ended December 31, | |||||||||||||||
| 2014 | 2013 | 2012 | 2011 | 2010 | |||||||||||
| Service Shares | |||||||||||||||
| Per share operating performance | |||||||||||||||
| (for a share outstanding throughout the year) | |||||||||||||||
| Net asset value, beginning of year | $ | 22.79 | $ | 19.62 | $ | 17.02 | $ | 20.03 | $ | 19.28 | |||||
| Income from investment operationsa: | |||||||||||||||
| Net investment incomeb | 0.71 | c | 0.48 | 0.55 | 0.52 | 0.37 | |||||||||
| Net realized and unrealized gains (losses) | (2.28 | ) | 3.30 | 2.59 | (2.73 | ) | 0.89 | ||||||||
| Total from investment operations | (1.57 | ) | 3.78 | 3.14 | (2.21 | ) | 1.26 | ||||||||
| Less distributions from: | |||||||||||||||
| Net investment income | (0.76 | ) | (0.36 | ) | (0.52 | ) | (0.50 | ) | (0.51 | ) | |||||
| Net realized gains | (0.35 | ) | (0.25 | ) | (0.02 | ) | (0.30 | ) | — | ||||||
| Total distributions | (1.11 | ) | (0.61 | ) | (0.54 | ) | (0.80 | ) | (0.51 | ) | |||||
| Net asset value, end of year | $ | 20.11 | $ | 22.79 | $ | 19.62 | $ | 17.02 | $ | 20.03 | |||||
| Total return | (6.95 | )% | 19.31 | % | 18.45 | % | (11.06 | )% | 6.59 | % | |||||
| Ratios to average net assets | |||||||||||||||
| Expenses | 0.93 | %d | 0.94 | % | 0.95 | % | 0.94 | % | 0.93 | %e | |||||
| Net investment income | 3.12 | %c | 1.97 | % | 2.51 | % | 2.62 | % | 1.98 | % | |||||
| Supplemental data | |||||||||||||||
| Net assets, end of year (000’s) | $ | 6,985 | $ | 7,705 | $ | 19,637 | $ | 61,202 | $ | 69,169 | |||||
| Portfolio turnover rate | 14.97 | % | 15.89 | % | 11.94 | % | 9.91 | % | 13.63 | % | |||||
aThe amount shown for a share outstanding throughout the period may not correlate with the Statement of Operations for the period due to the timing of sales and
repurchases of the Fund shares in relation to income earned and/or fluctuating fair value of the investments of the Fund.
bBased on average daily shares outstanding.
cNet investment income per share includes approximately $0.29 per share received in the form of special dividends paid in connection with certain Fund’ holdings.
Excluding these amounts, the ratio of net investment income to average net assets would have been 1.85%.
dBenefit of waiver and payments by affiliates rounds to less than 0.01%.
eBenefit of expense reduction rounds to less than 0.01%.
ftinstitutional.com
The accompanying notes are an integral part of these financial statements. | Annual Report | 35
| TEMPLETON INSTITUTIONAL FUNDS | ||||
| Statement of Investments, December 31, 2014 | ||||
| Foreign Equity Series | ||||
| Industry | Shares | Value | ||
| Common Stocks 98.9% | ||||
| Belgium 0.5% | ||||
| aKBC GROEP NV | Banks | 551,359 | $ | 31,018,878 |
| Brazil 0.5% | ||||
| Embraer SA, ADR | Aerospace & Defense | 861,905 | 31,769,818 | |
| Vale SA, ADR | Metals & Mining | 18,883 | 154,463 | |
| 31,924,281 | ||||
| Canada 1.2% | ||||
| Ensign Energy Services Inc. | Energy Equipment & Services | 871,900 | 7,658,454 | |
| Talisman Energy Inc. | Oil, Gas & Consumable Fuels | 7,074,430 | 55,437,944 | |
| Trican Well Service Ltd. | Energy Equipment & Services | 2,166,700 | 10,392,697 | |
| 73,489,095 | ||||
| China 8.2% | ||||
| a,bChina CNR Corp. Ltd., Reg S, H | Machinery | 33,377,800 | 47,781,270 | |
| China Life Insurance Co. Ltd., H | Insurance | 20,109,000 | 78,579,653 | |
| China Mobile Ltd. | Wireless Telecommunication Services | 7,305,440 | 85,453,660 | |
| China Shenhua Energy Co. Ltd., H | Oil, Gas & Consumable Fuels | 12,722,500 | 37,573,785 | |
| China Telecom Corp. Ltd., H | Diversified Telecommunication Services | 138,844,040 | 80,578,051 | |
| CSR Corp. Ltd, H | Machinery | 31,124,700 | 41,906,624 | |
| Haier Electronics Group Co. Ltd. | Household Durables | 12,300,000 | 29,441,511 | |
| Kunlun Energy Co. Ltd. | Oil, Gas & Consumable Fuels | 20,606,000 | 19,559,084 | |
| Shanghai Electric Group Co. Ltd., H | Electrical Equipment | 18,512,963 | 9,836,716 | |
| Sinopharm Group Co. | Health Care Providers & Services | 10,736,400 | 38,077,496 | |
| Weichai Power Co. Ltd., H | Machinery | 9,935,000 | 41,769,808 | |
| 510,557,658 | ||||
| France 9.6% | ||||
| AXA SA | Insurance | 3,655,030 | 84,935,768 | |
| BNP Paribas SA | Banks | 1,865,830 | 111,212,048 | |
| Cie Generale des Etablissements Michelin, B | Auto Components | 950,859 | 86,601,098 | |
| Compagnie de Saint-Gobain | Building Products | 1,158,430 | 49,381,900 | |
| Sanofi | Pharmaceuticals | 1,297,279 | 118,764,074 | |
| Technip SA | Energy Equipment & Services | 488,150 | 29,187,537 | |
| Total SA, B | Oil, Gas & Consumable Fuels | 1,654,173 | 85,105,876 | |
| Vivendi SA | Diversified Telecommunication Services | 1,154,034 | 28,891,125 | |
| 594,079,426 | ||||
| Germany 11.1% | ||||
| Bayer AG | Pharmaceuticals | 942,236 | 128,831,925 | |
| Deutsche Boerse AG | Diversified Financial Services | 524,730 | 37,600,157 | |
| Deutsche Lufthansa AG | Airlines | 1,843,090 | 30,842,820 | |
| Deutsche Post AG | Air Freight & Logistics | 980,577 | 32,088,842 | |
| HeidelbergCement AG | Construction Materials | 776,010 | 55,220,948 | |
| Infineon Technologies AG | Semiconductors & Semiconductor Equipment | 4,790,844 | 51,273,767 | |
| Merck KGaA | Pharmaceuticals | 984,498 | 93,417,241 | |
| aMetro AG | Food & Staples Retailing | 1,931,280 | 59,145,642 | |
| Muenchener Rueckversicherungs-Gesellschaft AG | Insurance | 392,503 | 78,719,419 | |
| SAP SE | Software | 885,301 | 62,408,939 | |
| Siemens AG | Industrial Conglomerates | 545,240 | 61,850,661 | |
| Software AG | Software | 24,599 | 601,249 | |
| 692,001,610 | ||||
36 | Annual Report
ftinstitutional.com
TEMPLETON INSTITUTIONAL FUNDS
STATEMENT OF INVESTMENTS
| Foreign Equity Series (continued) | ||||
| Industry | Shares | Value | ||
| Common Stocks (continued) | ||||
| Hong Kong 4.1% | ||||
| AIA Group Ltd. | Insurance | 7,943,110 | $ | 44,048,998 |
| Cheung Kong (Holdings) Ltd. | Real Estate Management & Development | 2,420,540 | 40,738,007 | |
| Cheung Kong (Holdings) Ltd., ADR | Real Estate Management & Development | 61,495 | 1,028,197 | |
| aGCL-Poly Energy Holdings Ltd. | Semiconductors & Semiconductor Equipment | 215,514,370 | 50,307,392 | |
| Hutchison Whampoa Ltd. | Industrial Conglomerates | 4,347,520 | 50,097,165 | |
| Hutchison Whampoa Ltd., ADR | Industrial Conglomerates | 12,487 | 287,176 | |
| Noble Group Ltd. | Trading Companies & Distributors | 34,586,000 | 29,761,504 | |
| Swire Pacific Ltd., A | Real Estate Management & Development | 2,549,810 | 33,212,854 | |
| Swire Properties Ltd. | Real Estate Management & Development | 2,145,917 | 6,351,446 | |
| 255,832,739 | ||||
| India 0.8% | ||||
| Housing Development Finance Corp. Ltd. | Thrifts & Mortgage Finance | 2,663,616 | 47,998,753 | |
| Ireland 1.5% | ||||
| CRH PLC | Construction Materials | 28,235 | 679,871 | |
| CRH PLC (London Stock Exchange) | Construction Materials | 3,770,362 | 90,738,765 | |
| 91,418,636 | ||||
| Israel 1.6% | ||||
| Teva Pharmaceutical Industries Ltd., ADR | Pharmaceuticals | 1,773,931 | 102,018,772 | |
| Italy 2.8% | ||||
| Eni SpA | Oil, Gas & Consumable Fuels | 3,241,286 | 56,907,581 | |
| Intesa Sanpaolo SpA | Banks | 15,828,331 | 46,386,822 | |
| UniCredit SpA | Banks | 11,339,870 | 73,202,828 | |
| 176,497,231 | ||||
| Japan 5.3% | ||||
| ITOCHU Corp. | Trading Companies & Distributors | 3,179,700 | 34,284,769 | |
| Konica Minolta Inc. | Technology Hardware, Storage & Peripherals | 3,861,900 | 42,704,089 | |
| Nissan Motor Co. Ltd. | Automobiles | 9,783,400 | 86,301,304 | |
| Suntory Beverage & Food Ltd. | Beverages | 1,746,500 | 60,779,512 | |
| Toyota Motor Corp. | Automobiles | 1,636,320 | 103,211,405 | |
| 327,281,079 | ||||
| Netherlands 6.8% | ||||
| Akzo Nobel NV | Chemicals | 1,362,110 | 95,016,024 | |
| aING Groep NV, ADR | Banks | 25,152 | 326,221 | |
| aING Groep NV, IDR | Banks | 8,677,790 | 113,716,361 | |
| Koninklijke Philips NV | Industrial Conglomerates | 1,570,855 | 45,902,738 | |
| aNN Group NV | Insurance | 992,540 | 29,838,184 | |
| a,cNN Group NV, 144A | Insurance | 706,330 | 21,234,010 | |
| aQIAGEN NV | Life Sciences Tools & Services | 1,596,141 | 37,390,560 | |
| aSBM Offshore NV | Energy Equipment & Services | 2,508,797 | 29,691,637 | |
| TNT Express NV | Air Freight & Logistics | 6,937,622 | 46,514,049 | |
| cTNT Express NV, 144A | Air Freight & Logistics | 849,405 | 5,694,929 | |
| 425,324,713 | ||||
| Norway 2.4% | ||||
| Statoil ASA | Oil, Gas & Consumable Fuels | 2,972,700 | 52,204,289 | |
| Telenor ASA | Diversified Telecommunication Services | 4,906,738 | 99,500,844 | |
| 151,705,133 |
ftinstitutional.com
Annual Report
| 37
TEMPLETON INSTITUTIONAL FUNDS
STATEMENT OF INVESTMENTS
| Foreign Equity Series (continued) | ||||
| Industry | Shares | Value | ||
| Common Stocks (continued) | ||||
| Russia 0.7% | ||||
| Mining and Metallurgical Co. Norilsk Nickel OJSC, | ||||
| ADR | Metals & Mining | 1,955,732 | $ | 27,810,509 |
| Mobile TeleSystems, ADR | Wireless Telecommunication Services | 1,802,706 | 12,943,429 | |
| 40,753,938 | ||||
| Singapore 3.4% | ||||
| DBS Group Holdings Ltd. | Banks | 5,687,313 | 88,434,970 | |
| Singapore Telecommunications Ltd. | Diversified Telecommunication Services | 28,795,360 | 84,768,949 | |
| United Overseas Bank Ltd. | Banks | 2,045,000 | 37,865,225 | |
| 211,069,144 | ||||
| South Korea 6.2% | ||||
| Hana Financial Group Inc. | Banks | 977,961 | 28,612,083 | |
| Hyundai Mobis Co. Ltd. | Auto Components | 241,555 | 52,120,191 | |
| Hyundai Motor Co. | Automobiles | 164,719 | 25,451,206 | |
| KB Financial Group Inc. | Banks | 1,060,575 | 35,053,198 | |
| KB Financial Group Inc., ADR | Banks | 136,324 | 4,446,889 | |
| LG Electronics Inc. | Household Durables | 710,485 | 38,390,198 | |
| POSCO | Metals & Mining | 187,769 | 47,295,896 | |
| Samsung Electronics Co. Ltd. | Technology Hardware, Storage & Peripherals | 125,696 | 152,500,176 | |
| 383,869,837 | ||||
| Spain 2.0% | ||||
| aBanco Santander SA | Banks | 3,168,485 | 26,821,732 | |
| Repsol SA | Oil, Gas & Consumable Fuels | 1,957,759 | 36,824,369 | |
| Telefonica SA | Diversified Telecommunication Services | 4,367,832 | 62,998,113 | |
| 126,644,214 | ||||
| Sweden 1.2% | ||||
| Ericsson, B | Communications Equipment | 2,069,670 | 25,037,936 | |
| Getinge AB, B | Health Care Equipment & Supplies | 2,046,021 | 46,644,168 | |
| 71,682,104 | ||||
| Switzerland 6.9% | ||||
| Credit Suisse Group AG | Capital Markets | 3,375,687 | 85,156,135 | |
| Novartis AG | Pharmaceuticals | 1,013,664 | 94,157,987 | |
| Roche Holding AG | Pharmaceuticals | 533,850 | 144,926,690 | |
| Swiss Re AG | Insurance | 1,249,765 | 105,152,728 | |
| 429,393,540 | ||||
| Taiwan 0.8% | ||||
| Taiwan Semiconductor Manufacturing Co. Ltd. | Semiconductors & Semiconductor Equipment | 10,769,492 | 47,976,316 | |
| Thailand 0.6% | ||||
| Bangkok Bank PCL, fgn. | Banks | 6,153,300 | 36,305,967 | |
| United Kingdom 19.3% | ||||
| Aviva PLC | Insurance | 9,850,259 | 74,388,183 | |
| BAE Systems PLC | Aerospace & Defense | 9,600,371 | 70,630,541 | |
| Barclays PLC | Banks | 13,132,150 | 49,842,213 | |
| BP PLC | Oil, Gas & Consumable Fuels | 10,022,901 | 64,209,277 | |
| BP PLC, ADR | Oil, Gas & Consumable Fuels | 11,111 | 423,551 | |
| Carillion PLC | Construction & Engineering | 6,786,320 | 35,520,375 | |
| GlaxoSmithKline PLC | Pharmaceuticals | 4,857,452 | 104,181,227 | |
| HSBC Holdings PLC | Banks | 7,824,901 | 74,626,665 | |
| 38 | Annual Report | ftinstitutional.com | |||
TEMPLETON INSTITUTIONAL FUNDS
STATEMENT OF INVESTMENTS
| Foreign Equity Series (continued) | ||||
| Industry | Shares | Value | ||
| Common Stocks (continued) | ||||
| United Kingdom (continued) | ||||
| aInternational Consolidated Airlines Group SA | Airlines | 11,031,820 | $ | 83,586,340 |
| Kingfisher PLC | Specialty Retail | 15,636,761 | 82,990,128 | |
| aLloyds Banking Group PLC | Banks | 72,965,620 | 86,231,229 | |
| Marks & Spencer Group PLC | Multiline Retail | 9,512,950 | 70,995,672 | |
| Petrofac Ltd. | Energy Equipment & Services | 1,757,580 | 19,258,965 | |
| Rexam PLC | Containers & Packaging | 6,556,300 | 46,375,203 | |
| Royal Dutch Shell PLC, B, ADR | Oil, Gas & Consumable Fuels | 1,397,864 | 97,235,420 | |
| Serco Group PLC | Commercial Services & Supplies | 6,136,317 | 15,370,436 | |
| Sky PLC | Media | 2,874,580 | 40,280,663 | |
| Standard Chartered PLC | Banks | 2,732,038 | 41,008,657 | |
| Tesco PLC | Food & Staples Retailing | 15,433,760 | 45,466,975 | |
| Unilever NV, IDR | Food Products | 639,786 | 25,267,964 | |
| Vodafone Group PLC | Wireless Telecommunication Services | 19,957,054 | 69,259,866 | |
| 1,197,149,550 | ||||
| United States 1.4% | ||||
| ACE Ltd. | Insurance | 572,740 | 65,796,371 | |
| Perrigo Co. PLC | Pharmaceuticals | 144,712 | 24,190,058 | |
| 89,986,429 | ||||
| Total Common Stocks | ||||
| (Cost $4,746,599,844) | 6,145,979,043 | |||
| Preferred Stocks | ||||
| (Cost $30,874,426) 0.2% | ||||
| Brazil 0.2% | ||||
| Petroleo Brasileiro SA, ADR, pfd. | Oil, Gas & Consumable Fuels | 1,988,625 | 15,073,777 | |
| Total Investments before Short Term | ||||
| Investments (Cost $4,777,474,270) | 6,161,052,820 | |||
| Short Term Investments | ||||
| (Cost $36,954,370) 0.6% | ||||
| Money Market Funds 0.6% | ||||
| United States 0.6% | ||||
| a,dInstitutional Fiduciary Trust Money Market | ||||
| Portfolio | 36,954,370 | 36,954,370 | ||
| Total Investments (Cost $4,814,428,640) | ||||
| 99.7% | 6,198,007,190 | |||
| Other Assets, less Liabilities 0.3% | 19,828,034 | |||
| Net Assets 100.0% | $ | 6,217,835,224 |
See Abbreviations on page 67.
aNon-income producing.
bSecurity was purchased pursuant to Regulation S under the Securities Act of 1933, which exempts from registration securities offered and sold outside of the United States.
Such a security cannot be sold in the United States without either an effective registration statement filed pursuant to the Securities Act of 1933, or pursuant to an exemption
from registration. This security has been deemed liquid under guidelines approved by the Trust’s Board of Trustees. At December 31, 2014, the value of this security was
$47,781,270, representing 0.77% of net assets.
cSecurity was purchased pursuant to Rule 144A under the Securities Act of 1933 and may be sold in transactions exempt from registration only to qualified institutional buyers
or in a public offering registered under the Securities Act of 1933. These securities have been deemed liquid under guidelines approved by the Trust’s Board of Trustees. At
December 31, 2014, the aggregate value of these securities was $26,928,939, representing 0.43% of net assets.
dSee Note 3(d) regarding investments in Institutional Fiduciary Trust Money Market Portfolio.
ftinstitutional.com
The accompanying notes are an integral part of these financial statements. | Annual Report | 39
| TEMPLETON INSTITUTIONAL FUNDS | |||||||||||||||
| Financial Highlights | |||||||||||||||
| Foreign Smaller Companies Series | |||||||||||||||
| Year Ended December 31, | |||||||||||||||
| 2014 | 2013 | 2012 | 2011 | 2010 | |||||||||||
| Per share operating performance | |||||||||||||||
| (for a share outstanding throughout the year) | |||||||||||||||
| Net asset value, beginning of year | $ | 21.96 | $ | 18.31 | $ | 15.31 | $ | 17.68 | $ | 14.68 | |||||
| Income from investment operationsa: | |||||||||||||||
| Net investment incomeb | 0.25 | 0.24 | 0.29 | 0.29 | 0.18 | ||||||||||
| Net realized and unrealized gains (losses) | (0.98 | ) | 3.82 | 3.01 | (2.29 | ) | 2.95 | ||||||||
| Total from investment operations | (0.73 | ) | 4.06 | 3.30 | (2.00 | ) | 3.13 | ||||||||
| Less distributions from: | |||||||||||||||
| Net investment income | (0.16 | ) | (0.30 | ) | (0.27 | ) | (0.24 | ) | (0.13 | ) | |||||
| Net realized gains | (0.27 | ) | (0.11 | ) | (0.03 | ) | (0.13 | ) | — | ||||||
| Total distributions | (0.43 | ) | (0.41 | ) | (0.30 | ) | (0.37 | ) | (0.13 | ) | |||||
| Net asset value, end of year | $ | 20.80 | $ | 21.96 | $ | 18.31 | $ | 15.31 | $ | 17.68 | |||||
| Total return | (3.32 | )% | 22.24 | % | 21.56 | % | (11.30 | )% | 21.37 | % | |||||
| Ratios to average net assets | |||||||||||||||
| Expenses before waiver and payments by affiliates | 0.98 | % | 0.99 | % | 1.01 | % | 1.02 | % | 1.05 | % | |||||
| Expenses net of waiver and payments by affiliates | 0.98 | % | 0.98 | %c | 0.95 | % | 0.95 | % | 0.95 | %c | |||||
| Net investment income | 1.15 | % | 1.16 | % | 1.70 | % | 1.68 | % | 1.19 | % | |||||
| Supplemental data | |||||||||||||||
| Net assets, end of year (000’s) | $ | 1,281,733 | $ | 1,252,797 | $ | 495,600 | $ | 317,390 | $ | 267,488 | |||||
| Portfolio turnover rate | 21.36 | % | 23.84 | % | 19.76 | % | 10.44 | % | 20.21 | % | |||||
aThe amount shown for a share outstanding throughout the period may not correlate with the Statement of Operations for the period due to the timing of sales and
repurchases of the Fund shares in relation to income earned and/or fluctuating fair value of the investments of the Fund.
bBased on average daily shares outstanding.
cBenefit of expense reduction rounds to less than 0.01%.
40 | Annual Report | The accompanying notes are an integral part of these financial statements.
ftinstitutional.com
| TEMPLETON INSTITUTIONAL FUNDS | ||||
| Statement of Investments, December 31, 2014 | ||||
| Foreign Smaller Companies Series | ||||
| Shares/ | ||||
| Industry | Rights/Units | Value | ||
| Common Stocks and Other Equity Interests 93.2% | ||||
| Australia 0.3% | ||||
| Iluka Resources Ltd. | Metals & Mining | 829,385 | $ | 4,029,298 |
| Austria 0.6% | ||||
| Wienerberger AG | Building Products | 596,270 | 8,257,415 | |
| Bahamas 1.2% | ||||
| aSteiner Leisure Ltd. | Diversified Consumer Services | 322,660 | 14,910,119 | |
| Belgium 1.6% | ||||
| Barco NV | Electronic Equipment, Instruments & Components | 187,070 | 13,182,897 | |
| aOntex Group NV | Personal Products | 254,230 | 7,295,168 | |
| 20,478,065 | ||||
| Bermuda 1.1% | ||||
| Axis Capital Holdings Ltd. | Insurance | 267,350 | 13,658,911 | |
| Brazil 0.9% | ||||
| Companhia de Saneamento de Minas Gerais | Water Utilities | 498,100 | 4,719,533 | |
| Grendene SA | Textiles, Apparel & Luxury Goods | 1,132,700 | 6,521,283 | |
| 11,240,816 | ||||
| Canada 5.9% | ||||
| AGF Management Ltd. | Capital Markets | 643,300 | 4,703,222 | |
| Canaccord Genuity Group Inc. | Capital Markets | 468,638 | 3,151,830 | |
| Dorel Industries Inc., B | Household Durables | 498,600 | 17,183,184 | |
| Enerflex Ltd. | Energy Equipment & Services | 524,800 | 7,407,080 | |
| Ensign Energy Services Inc. | Energy Equipment & Services | 448,700 | 3,941,219 | |
| Genworth MI Canada Inc. | Thrifts & Mortgage Finance | 297,200 | 9,464,332 | |
| HudBay Minerals Inc. | Metals & Mining | 2,387,760 | 20,808,724 | |
| Mullen Group Ltd. | Energy Equipment & Services | 410,100 | 7,525,710 | |
| Trican Well Service Ltd. | Energy Equipment & Services | 421,400 | 2,021,269 | |
| 76,206,570 | ||||
| China 4.0% | ||||
| AAC Technologies Holdings Inc. | Electronic Equipment, Instruments & Components | 1,683,500 | 8,977,711 | |
| China ZhengTong Auto Services Holdings Ltd. | Specialty Retail | 12,391,500 | 5,449,483 | |
| aKingdee International Software Group Co. Ltd., | ||||
| fgn. | Software | 41,048,000 | 12,228,720 | |
| Shenguan Holdings Group Ltd. | Food Products | 22,810,000 | 7,619,071 | |
| Sinomedia Holding Ltd. | Media | 12,207,000 | 6,895,409 | |
| Yingde Gases Group Co. Ltd. | Chemicals | 14,454,500 | 10,178,241 | |
| 51,348,635 | ||||
| Finland 3.8% | ||||
| Amer Sports OYJ | Leisure Products | 1,264,112 | 24,564,982 | |
| Huhtamaki OYJ | Containers & Packaging | 934,360 | 24,691,771 | |
| 49,256,753 | ||||
| France 1.6% | ||||
| aBeneteau | Leisure Products | 476,600 | 6,695,324 | |
| Ipsos | Media | 485,570 | 13,933,504 | |
| 20,628,828 | ||||
ftinstitutional.com
Annual Report
| 41
| TEMPLETON INSTITUTIONAL FUNDS | ||||
| STATEMENT OF INVESTMENTS | ||||
| Foreign Smaller Companies Series (continued) | ||||
| Shares/ | ||||
| Industry | Rights/Units | Value | ||
| Common Stocks and Other Equity Interests (continued) | ||||
| Germany 6.9% | ||||
| DMG MORI SEIKI AG | Machinery | 550,052 | $ | 15,640,728 |
| Gerresheimer AG | Life Sciences Tools & Services | 389,900 | 21,206,466 | |
| aGrand City Properties SA | Real Estate Management & Development | 843,800 | 12,425,545 | |
| aKloeckner & Co. SE | Trading Companies & Distributors | 1,131,515 | 12,271,540 | |
| Leoni AG | Auto Components | 182,000 | 10,877,767 | |
| Rational AG | Machinery | 52,110 | 16,378,042 | |
| 88,800,088 | ||||
| Greece 0.4% | ||||
| JUMBO SA | Specialty Retail | 464,101 | 4,756,432 | |
| Hong Kong 7.8% | ||||
| Luk Fook Holdings (International) Ltd. | Specialty Retail | 3,416,000 | 12,842,023 | |
| Sitoy Group Holdings Ltd. | Textiles, Apparel & Luxury Goods | 11,750,000 | 9,508,863 | |
| Stella International Holdings Ltd. | Textiles, Apparel & Luxury Goods | 3,993,562 | 10,506,731 | |
| Techtronic Industries Co. Ltd. | Household Durables | 8,253,000 | 26,609,019 | |
| Value Partners Group Ltd. | Capital Markets | 16,304,000 | 13,709,410 | |
| VTech Holdings Ltd. | Communications Equipment | 1,851,300 | 26,597,388 | |
| 99,773,434 | ||||
| India 0.5% | ||||
| Jain Irrigation Systems Ltd. | Machinery | 5,600,954 | 6,219,827 | |
| Italy 2.3% | ||||
| Amplifon SpA | Health Care Providers & Services | 1,094,700 | 6,495,774 | |
| Azimut Holding SpA | Capital Markets | 266,624 | 5,816,749 | |
| Marr SpA | Food & Staples Retailing | 414,296 | 7,379,109 | |
| aSorin SpA | Health Care Equipment & Supplies | 4,337,155 | 10,107,566 | |
| 29,799,198 | ||||
| Japan 15.3% | ||||
| Aderans Co. Ltd. | Personal Products | 634,600 | 6,016,321 | |
| Asahi Co. Ltd. | Specialty Retail | 595,300 | 5,519,535 | |
| Asics Corp. | Textiles, Apparel & Luxury Goods | 1,122,100 | 27,110,198 | |
| Capcom Co. Ltd. | Software | 322,700 | 4,890,659 | |
| Daibiru Corp. | Real Estate Management & Development | 684,300 | 6,487,501 | |
| Descente Ltd. | Textiles, Apparel & Luxury Goods | 1,051,671 | 10,286,321 | |
| Keihin Corp. | Auto Components | 609,700 | 9,133,415 | |
| Kobayashi Pharmaceutical Co. Ltd. | Personal Products | 402,700 | 23,659,570 | |
| MEITEC Corp. | Professional Services | 614,000 | 18,344,419 | |
| Nissin Kogyo Co. Ltd. | Auto Components | 292,230 | 4,094,756 | |
| Seria Co. Ltd. | Multiline Retail | 154,600 | 5,160,860 | |
| Shinko Plantech Co. Ltd. | Energy Equipment & Services | 723,000 | 5,098,560 | |
| Square Enix Holdings Co. Ltd. | Software | 588,500 | 12,317,613 | |
| Sumitomo Rubber Industries Ltd. | Auto Components | 1,373,000 | 20,625,078 | |
| Tokai Rika Co. Ltd. | Auto Components | 397,600 | 8,451,385 | |
| Tsugami Corp. | Machinery | 1,254,000 | 6,771,025 | |
| Tsumura & Co. | Pharmaceuticals | 713,400 | 15,938,008 | |
| Unipres Corp. | Auto Components | 355,500 | 5,880,250 | |
| 195,785,474 | ||||
42 | Annual Report
ftinstitutional.com
TEMPLETON INSTITUTIONAL FUNDS
STATEMENT OF INVESTMENTS
| Foreign Smaller Companies Series (continued) | ||||
| Shares/ | ||||
| Industry | Rights/Units | Value | ||
| Common Stocks and Other Equity Interests (continued) | ||||
| Netherlands 4.6% | ||||
| Aalberts Industries NV | Machinery | 718,108 | $ | 21,318,723 |
| Accell Group NV | Leisure Products | 335,775 | 5,525,513 | |
| Arcadis NV | Construction & Engineering | 624,740 | 18,845,469 | |
| Beter Bed Holding NV | Specialty Retail | 373,050 | 7,761,660 | |
| USG People NV | Professional Services | 430,172 | 4,857,902 | |
| 58,309,267 | ||||
| Norway 2.0% | ||||
| Schibsted ASA | Media | 256,638 | 16,272,175 | |
| Tomra Systems ASA | Commercial Services & Supplies | 1,181,150 | 9,090,634 | |
| 25,362,809 | ||||
| Philippines 1.1% | ||||
| Metropolitan Bank & Trust Co. | Banks | 3,203,789 | 5,937,579 | |
| Vista Land & Lifescapes Inc. | Real Estate Management & Development | 47,331,300 | 7,609,364 | |
| 13,546,943 | ||||
| Russia 0.1% | ||||
| a,bX5 Retail Group NV, GDR, Reg S | Food & Staples Retailing | 133,338 | 1,626,724 | |
| Singapore 1.0% | ||||
| aFlextronics International Ltd. | Electronic Equipment, Instruments & Components | 1,152,130 | 12,880,813 | |
| South Korea 8.1% | ||||
| Binggrae Co. Ltd. | Food Products | 134,454 | 9,268,790 | |
| BS Financial Group Inc. | Banks | 1,381,164 | 18,310,121 | |
| Daum Kakao Corp. | Internet Software & Services | 45,841 | 5,180,248 | |
| DGB Financial Group Inc. | Banks | 1,173,767 | 12,126,579 | |
| aDGB Financial Group Inc., rts., 1/13/15 | Banks | 213,640 | 224,625 | |
| Halla Visteon Climate Control Corp. | Auto Components | 472,380 | 20,903,299 | |
| Hyundai Mipo Dockyard Co. Ltd. | Machinery | 91,705 | 5,843,913 | |
| KIWOOM Securities Co. Ltd. | Capital Markets | 184,979 | 7,796,529 | |
| Korea Investment Holdings Co. Ltd. | Capital Markets | 178,750 | 7,926,213 | |
| Youngone Corp. | Textiles, Apparel & Luxury Goods | 343,463 | 16,643,084 | |
| 104,223,401 | ||||
| Spain 1.3% | ||||
| Construcciones y Auxiliar de Ferrocarriles SA | Machinery | 29,776 | 10,893,356 | |
| Tecnicas Reunidas SA | Energy Equipment & Services | 129,345 | 5,679,655 | |
| 16,573,011 | ||||
| Sweden 1.7% | ||||
| Bulten AB | Auto Components | 631,553 | 5,425,504 | |
| a,cD Carnegie & Co. AB | Real Estate Management & Development | 74 | — | |
| Duni AB | Household Durables | 695,810 | 10,349,138 | |
| dOriflame Cosmetics SA, SDR | Personal Products | 462,950 | 6,440,496 | |
| 22,215,138 | ||||
| Switzerland 2.6% | ||||
| Logitech International SA | Technology Hardware, Storage & Peripherals | 1,005,240 | 13,500,373 | |
| Panalpina Welttransport Holding AG | Air Freight & Logistics | 45,940 | 6,168,769 | |
| Vontobel Holding AG | Capital Markets | 371,770 | 14,022,707 | |
| 33,691,849 | ||||
| ftinstitutional.com | Annual Report | 43 | |||
| TEMPLETON INSTITUTIONAL FUNDS | ||||
| STATEMENT OF INVESTMENTS | ||||
| Foreign Smaller Companies Series (continued) | ||||
| Shares/ | ||||
| Industry | Rights/Units | Value | ||
| Common Stocks and Other Equity Interests (continued) | ||||
| Taiwan 4.4% | ||||
| D-Link Corp. | Communications Equipment | 9,753,240 | $ | 5,731,581 |
| Giant Manufacturing Co. Ltd. | Leisure Products | 2,366,482 | 21,009,808 | |
| Simplo Technology Co. Ltd. | Electronic Equipment, Instruments & Components | 3,666,918 | 18,247,120 | |
| Tripod Technology Corp. | Electronic Equipment, Instruments & Components | 5,762,000 | 11,305,178 | |
| 56,293,687 | ||||
| Thailand 0.9% | ||||
| L.P.N. Development PCL, fgn. | Real Estate Management & Development | 9,575,000 | 6,406,630 | |
| Pruksa Real Estate PCL, fgn. | Real Estate Management & Development | 6,205,600 | 5,426,126 | |
| 11,832,756 | ||||
| United Kingdom 9.7% | ||||
| Bellway PLC | Household Durables | 269,700 | 8,151,195 | |
| Berendsen PLC | Commercial Services & Supplies | 544,680 | 9,338,920 | |
| Bovis Homes Group PLC | Household Durables | 407,880 | 5,623,320 | |
| Debenhams PLC | Multiline Retail | 5,841,420 | 6,851,528 | |
| Devro PLC | Food Products | 1,708,970 | 8,124,503 | |
| Dignity PLC | Diversified Consumer Services | 372,324 | 11,078,717 | |
| Greggs PLC | Food & Staples Retailing | 2,090,140 | 23,847,836 | |
| HomeServe PLC | Commercial Services & Supplies | 2,080,310 | 10,914,521 | |
| Laird PLC | Electronic Equipment, Instruments & Components | 2,302,240 | 11,160,239 | |
| Man Group PLC | Capital Markets | 4,293,191 | 10,740,333 | |
| UBM PLC | Media | 1,502,676 | 11,315,270 | |
| aVectura Group PLC | Pharmaceuticals | 3,486,022 | 6,995,840 | |
| 124,142,222 | ||||
| United States 1.5% | ||||
| iShares MSCI EAFE Small-Cap ETF | Diversified Financial Services | 398,400 | 18,609,264 | |
| Total Common Stocks and Other | ||||
| Equity Interests | ||||
| (Cost $1,021,777,293) | 1,194,457,747 | |||
| Preferred Stocks | ||||
| (Cost $12,225,987) 0.7% | ||||
| Germany 0.7% | ||||
| Draegerwerk AG & Co. KGAA, pfd. | Health Care Equipment & Supplies | 95,700 | 9,711,894 | |
| Total Investments before Short Term | ||||
| Investments (Cost $1,034,003,280) | 1,204,169,641 | |||
44 | Annual Report
ftinstitutional.com
TEMPLETON INSTITUTIONAL FUNDS
STATEMENT OF INVESTMENTS
| Foreign Smaller Companies Series (continued) | ||||
| Shares/ | ||||
| Rights/Units | Value | |||
| Short Term Investments | ||||
| (Cost $2,525,842) 0.2% | ||||
| eInvestments from Cash Collateral | ||||
| Received for Loaned Securities | ||||
| (Cost $2,525,842) 0.2% | ||||
| Money Market Funds 0.2% | ||||
| United States 0.2% | ||||
| fBNY Mellon Overnight Government Fund, | ||||
| 0.072% | 2,525,842 | $ | 2,525,842 | |
| Total Investments | ||||
| (Cost $1,036,529,122) 94.1% | 1,206,695,483 | |||
| Other Assets, less Liabilities 5.9% | 75,037,248 | |||
| Net Assets 100.0% | $ | 1,281,732,731 |
See Abbreviations on page 67.
aNon-income producing.
bSecurity was purchased pursuant to Regulation S under the Securities Act of 1933, which exempts from registration securities offered and sold outside of the United States.
Such a security cannot be sold in the United States without either an effective registration statement filed pursuant to the Securities Act of 1933, or pursuant to an exemption
from registration. This security has been deemed liquid under guidelines approved by the Trust’s Board of Trustees.
cSecurity has been deemed illiquid because it may not be able to be sold within seven days.
dA portion or all of the security is on loan at December 31, 2014. See Note 1(d).
eSee Note 1(d) regarding securities on loan.
fThe rate shown is the annualized seven-day yield at period end.
ftinstitutional.com
The accompanying notes are an integral part of these financial statements. | Annual Report | 45
| TEMPLETON INSTITUTIONAL FUNDS | |||||||||||||||
| Financial Highlights | |||||||||||||||
| Global Equity Series | |||||||||||||||
| Year Ended December 31, | |||||||||||||||
| 2014 | 2013 | 2012 | 2011 | 2010 | |||||||||||
| Per share operating performance | |||||||||||||||
| (for a share outstanding throughout the year) | |||||||||||||||
| Net asset value, beginning of year | $ | 11.53 | $ | 9.88 | $ | 8.06 | $ | 8.70 | $ | 8.19 | |||||
| Income from investment operationsa: | |||||||||||||||
| Net investment incomeb | 0.25 | c | 0.14 | 0.16 | 0.14 | 0.12 | |||||||||
| Net realized and unrealized gains (losses) | (0.46 | ) | 2.84 | 1.82 | (0.67 | ) | 0.48 | ||||||||
| Total from investment operations | (0.21 | ) | 2.98 | 1.98 | (0.53 | ) | 0.60 | ||||||||
| Less distributions from: | |||||||||||||||
| Net investment income | (0.26 | ) | (0.13 | ) | (0.16 | ) | (0.11 | ) | (0.09 | ) | |||||
| Net realized gains | (1.42 | ) | (1.20 | ) | — | — | — | ||||||||
| Total distributions | (1.68 | ) | (1.33 | ) | (0.16 | ) | (0.11 | ) | (0.09 | ) | |||||
| Net asset value, end of year | $ | 9.64 | $ | 11.53 | $ | 9.88 | $ | 8.06 | $ | 8.70 | |||||
| Total return | (2.01 | )% | 30.43 | % | 24.63 | % | (6.10 | )% | 7.32 | % | |||||
| Ratios to average net assets | |||||||||||||||
| Expenses before waiver and payments by affiliates | 0.92 | % | 0.94 | % | 0.94 | % | 0.95 | % | 0.97 | % | |||||
| Expenses net of waiver and payments by affiliates | 0.92 | % | 0.90 | %d | 0.81 | %d | 0.81 | %d | 0.81 | %d | |||||
| Net investment income | 2.21 | %c | 1.26 | % | 1.80 | % | 1.60 | % | 1.46 | % | |||||
| Supplemental data | |||||||||||||||
| Net assets, end of year (000’s) | $ | 467,375 | $ | 491,602 | $ | 432,585 | $ | 371,108 | $ | 273,259 | |||||
| Portfolio turnover rate | 35.50 | % | 42.66 | % | 45.23 | % | 18.64 | % | 42.91 | % | |||||
aThe amount shown for a share outstanding throughout the period may not correlate with the Statement of Operations for the period due to the timing of sales and
repurchases of the Fund shares in relation to income earned and/or fluctuating fair value of the investments of the Fund.
bBased on average daily shares outstanding.
cNet investment income per share includes approximately $0.09 per share received in the form of special dividends paid in connection with certain Fund’s holdings.
Excluding these amounts, the ratio of net investment income to average net assets would have been 1.43%.
dBenefit of expense reduction rounds to less than 0.01%.
46 | Annual Report | The accompanying notes are an integral part of these financial statements.
ftinstitutional.com
TEMPLETON INSTITUTIONAL FUNDS
| Statement of Investments, December 31, 2014 | ||||
| Global Equity Series | ||||
| Industry | Shares | Value | ||
| Common Stocks 93.6% | ||||
| Australia 1.6% | ||||
| aQantas Airways Ltd. | Airlines | 3,786,482 | $ | 7,419,990 |
| Austria 0.7% | ||||
| UNIQA Insurance Group AG | Insurance | 349,208 | 3,286,107 | |
| Belgium 0.8% | ||||
| UCB SA | Pharmaceuticals | 48,480 | 3,707,362 | |
| Canada 0.6% | ||||
| Talisman Energy Inc. | Oil, Gas & Consumable Fuels | 223,620 | 1,752,372 | |
| Trican Well Service Ltd. | Energy Equipment & Services | 211,700 | 1,015,431 | |
| 2,767,803 | ||||
| China 7.0% | ||||
| a,bChina CNR Corp. Ltd., H, Reg S | Machinery | 2,775,000 | 3,972,491 | |
| China Life Insurance Co. Ltd., H | Insurance | 1,398,000 | 5,462,945 | |
| China Mobile Ltd. | Wireless Telecommunication Services | 115,500 | 1,351,034 | |
| China Shenhua Energy Co. Ltd., H | Oil, Gas & Consumable Fuels | 1,539,290 | 4,546,037 | |
| China Telecom Corp. Ltd., H | Diversified Telecommunication Services | 4,114,000 | 2,387,557 | |
| CSR Corp. Ltd, H | Machinery | 2,733,000 | 3,679,740 | |
| Haier Electronics Group Co. Ltd. | Household Durables | 1,346,000 | 3,221,811 | |
| Kunlun Energy Co. Ltd. | Oil, Gas & Consumable Fuels | 2,926,000 | 2,777,341 | |
| Shanghai Pharmaceuticals Holding Co. Ltd., H | Health Care Providers & Services | 974,700 | 2,199,814 | |
| Sinopharm Group Co. | Health Care Providers & Services | 557,200 | 1,976,154 | |
| Weichai Power Co. Ltd., H | Machinery | 322,000 | 1,353,787 | |
| 32,928,711 | ||||
| Denmark 0.5% | ||||
| H. Lundbeck AS | Pharmaceuticals | 115,110 | 2,296,627 | |
| France 7.6% | ||||
| AXA SA | Insurance | 166,725 | 3,874,364 | |
| BNP Paribas SA | Banks | 103,440 | 6,165,500 | |
| Cie Generale des Etablissements Michelin, B | Auto Components | 43,648 | 3,975,316 | |
| Compagnie de Saint-Gobain | Building Products | 85,360 | 3,638,752 | |
| Credit Agricole SA | Banks | 491,460 | 6,398,612 | |
| Ipsen SA | Pharmaceuticals | 48,360 | 2,516,171 | |
| Sanofi | Pharmaceuticals | 21,530 | 1,971,041 | |
| SEB SA | Household Durables | 28,250 | 2,104,616 | |
| Technip SA | Energy Equipment & Services | 26,380 | 1,577,317 | |
| Total SA, B | Oil, Gas & Consumable Fuels | 61,230 | 3,150,234 | |
| 35,371,923 | ||||
| Germany 7.3% | ||||
| Bayer AG | Pharmaceuticals | 62,330 | 8,522,381 | |
| Deutsche Boerse AG | Diversified Financial Services | 93,510 | 6,700,571 | |
| Deutsche Lufthansa AG | Airlines | 145,960 | 2,442,538 | |
| Gerresheimer AG | Life Sciences Tools & Services | 38,720 | 2,105,961 | |
| HeidelbergCement AG | Construction Materials | 23,970 | 1,705,708 | |
| Merck KGaA | Pharmaceuticals | 59,220 | 5,619,279 | |
| Metro AG | Food & Staples Retailing | 91,970 | 2,816,590 | |
| aMorphoSys AG | Life Sciences Tools & Services | 46,540 | 4,315,296 | |
| 34,228,324 | ||||
ftinstitutional.com
Annual Report
| 47
| TEMPLETON INSTITUTIONAL FUNDS | ||||
| STATEMENT OF INVESTMENTS | ||||
| Global Equity Series (continued) | ||||
| Industry | Shares | Value | ||
| Common Stocks (continued) | ||||
| Hong Kong 0.9% | ||||
| aGCL-Poly Energy Holdings Ltd. | Semiconductors & Semiconductor Equipment | 4,177,000 | $ | 975,035 |
| Hutchison Whampoa Ltd. | Industrial Conglomerates | 301,000 | 3,468,471 | |
| 4,443,506 | ||||
| India 0.1% | ||||
| Housing Development Finance Corp. Ltd. | Thrifts & Mortgage Finance | 38,094 | 686,460 | |
| Ireland 0.5% | ||||
| CRH PLC | Construction Materials | 104,460 | 2,515,292 | |
| Israel 2.0% | ||||
| Teva Pharmaceutical Industries Ltd., ADR | Pharmaceuticals | 160,510 | 9,230,930 | |
| Italy 2.2% | ||||
| Eni SpA | Oil, Gas & Consumable Fuels | 272,394 | 4,782,449 | |
| aSaipem SpA | Energy Equipment & Services | 54,567 | 578,718 | |
| aSorin SpA | Health Care Equipment & Supplies | 438,778 | 1,022,555 | |
| UniCredit SpA | Banks | 637,058 | 4,112,432 | |
| 10,496,154 | ||||
| Japan 3.7% | ||||
| Capcom Co. Ltd. | Software | 137,500 | 2,083,872 | |
| Konica Minolta Inc. | Technology Hardware, Storage & Peripherals | 215,000 | 2,377,425 | |
| Nikon Corp. | Household Durables | 76,600 | 1,025,382 | |
| Nissan Motor Co. Ltd. | Automobiles | 656,200 | 5,788,470 | |
| Toyota Motor Corp. | Automobiles | 91,900 | 5,796,622 | |
| 17,071,771 | ||||
| Netherlands 4.2% | ||||
| Akzo Nobel NV | Chemicals | 58,480 | 4,079,360 | |
| aNN Group NV | Insurance | 84,860 | 2,551,099 | |
| a,cNN Group NV, 144A | Insurance | 98,600 | 2,964,158 | |
| aQIAGEN NV | Life Sciences Tools & Services | 107,020 | 2,507,008 | |
| TNT Express NV | Air Freight & Logistics | 1,109,590 | 7,439,368 | |
| 19,540,993 | ||||
| Norway 0.7% | ||||
| Telenor ASA | Diversified Telecommunication Services | 153,630 | 3,115,372 | |
| Portugal 1.2% | ||||
| Galp Energia SGPS SA, B | Oil, Gas & Consumable Fuels | 532,790 | 5,435,262 | |
| Russia 1.7% | ||||
| Mining and Metallurgical Co. Norilsk Nickel OJSC, | ||||
| ADR | Metals & Mining | 465,166 | 6,614,660 | |
| Mobile TeleSystems, ADR | Wireless Telecommunication Services | 200,832 | 1,441,974 | |
| 8,056,634 | ||||
| Singapore 0.7% | ||||
| Singapore Telecommunications Ltd. | Diversified Telecommunication Services | 1,123,004 | 3,305,945 | |
| South Korea 2.5% | ||||
| Hana Financial Group Inc. | Banks | 33,949 | 993,242 | |
| POSCO | Metals & Mining | 9,670 | 2,435,712 | |
| Samsung Electronics Co. Ltd. | Technology Hardware, Storage & Peripherals | 6,702 | 8,131,175 | |
| 11,560,129 | ||||
| 48 | Annual Report | ftinstitutional.com | |||
TEMPLETON INSTITUTIONAL FUNDS
STATEMENT OF INVESTMENTS
| Global Equity Series (continued) | ||||
| Industry | Shares | Value | ||
| Common Stocks (continued) | ||||
| Spain 1.1% | ||||
| Telefonica SA | Diversified Telecommunication Services | 369,959 | $ | 5,335,993 |
| Sweden 0.3% | ||||
| Getinge AB, B | Health Care Equipment & Supplies | 59,170 | 1,348,928 | |
| Switzerland 3.8% | ||||
| ABB Ltd. | Electrical Equipment | 246,540 | 5,242,261 | |
| aBasilea Pharmaceutica AG | Biotechnology | 24,680 | 2,287,530 | |
| Credit Suisse Group AG | Capital Markets | 215,311 | 5,431,502 | |
| Roche Holding AG | Pharmaceuticals | 17,630 | 4,786,096 | |
| 17,747,389 | ||||
| Thailand 1.0% | ||||
| Bangkok Bank PCL, fgn. | Banks | 770,500 | 4,546,138 | |
| United Kingdom 10.8% | ||||
| Aviva PLC | Insurance | 425,840 | 3,215,902 | |
| Barclays PLC | Banks | 636,520 | 2,415,870 | |
| BP PLC | Oil, Gas & Consumable Fuels | 336,730 | 2,157,179 | |
| GlaxoSmithKline PLC | Pharmaceuticals | 174,000 | 3,731,902 | |
| HSBC Holdings PLC | Banks | 865,200 | 8,251,477 | |
| Kingfisher PLC | Specialty Retail | 990,480 | 5,256,847 | |
| Marks & Spencer Group PLC | Multiline Retail | 311,750 | 2,326,608 | |
| Petrofac Ltd. | Energy Equipment & Services | 38,780 | 424,938 | |
| Rexam PLC | Containers & Packaging | 293,245 | 2,074,233 | |
| Royal Dutch Shell PLC, B | Oil, Gas & Consumable Fuels | 179,080 | 6,233,017 | |
| Serco Group PLC | Commercial Services & Supplies | 489,870 | 1,227,041 | |
| Sky PLC | Media | 212,680 | 2,980,224 | |
| Standard Chartered PLC | Banks | 195,000 | 2,927,005 | |
| Tesco PLC | Food & Staples Retailing | 358,450 | 1,055,973 | |
| Vodafone Group PLC | Wireless Telecommunication Services | 1,743,842 | 6,051,908 | |
| 50,330,124 | ||||
| United States 30.1% | ||||
| aActavis PLC | Pharmaceuticals | 24,190 | 6,226,748 | |
| Allegheny Technologies Inc. | Metals & Mining | 84,550 | 2,939,804 | |
| American International Group Inc. | Insurance | 44,130 | 2,471,721 | |
| Amgen Inc. | Biotechnology | 44,600 | 7,104,334 | |
| Applied Materials Inc. | Semiconductors & Semiconductor Equipment | 175,850 | 4,382,182 | |
| Best Buy Co. Inc. | Specialty Retail | 58,650 | 2,286,177 | |
| Capital One Financial Corp. | Consumer Finance | 42,480 | 3,506,724 | |
| Chesapeake Energy Corp. | Oil, Gas & Consumable Fuels | 110,680 | 2,166,008 | |
| Chevron Corp. | Oil, Gas & Consumable Fuels | 17,730 | 1,988,951 | |
| Citigroup Inc. | Banks | 164,260 | 8,888,109 | |
| Comcast Corp., Special A | Media | 144,150 | 8,297,995 | |
| CVS Health Corp. | Food & Staples Retailing | 58,040 | 5,589,832 | |
| Foot Locker Inc. | Specialty Retail | 84,690 | 4,757,884 | |
| aGilead Sciences Inc. | Biotechnology | 89,820 | 8,466,433 | |
| The Hartford Financial Services Group Inc. | Insurance | 64,360 | 2,683,168 | |
| JPMorgan Chase & Co. | Banks | 110,970 | 6,944,503 | |
| aKnowles Corp. | Electronic Equipment, Instruments & Components | 155,750 | 3,667,913 | |
| Macy’s Inc. | Multiline Retail | 118,040 | 7,761,130 | |
| Medtronic Inc. | Health Care Equipment & Supplies | 72,750 | 5,252,550 | |
| Microsoft Corp. | Software | 252,170 | 11,713,296 | |
| ftinstitutional.com | Annual Report | 49 | |||
| TEMPLETON INSTITUTIONAL FUNDS | |||||
| STATEMENT OF INVESTMENTS | |||||
| Global Equity Series (continued) | |||||
| Industry | Shares | Value | |||
| Common Stocks (continued) | |||||
| United States (continued) | |||||
| Morgan Stanley | Capital Markets | 179,260 | $ | 6,955,288 | |
| aNavistar International Corp. | Machinery | 57,240 | 1,916,395 | ||
| aNews Corp., A | Media | 148,190 | 2,325,101 | ||
| Noble Corp. PLC | Energy Equipment & Services | 111,840 | 1,853,189 | ||
| Pfizer Inc. | Pharmaceuticals | 121,390 | 3,781,299 | ||
| Stanley Black & Decker Inc. | Machinery | 28,730 | 2,760,378 | ||
| SunTrust Banks Inc. | Banks | 115,680 | 4,846,992 | ||
| Twenty-First Century Fox Inc., A | Media | 83,050 | 3,189,535 | ||
| Walgreens Boots Alliance Inc. | Food & Staples Retailing | 78,330 | 5,968,746 | ||
| 140,692,385 | |||||
| Total Common Stocks | |||||
| (Cost $379,775,771) | 437,466,252 | ||||
| Preferred Stocks 0.7% | |||||
| Brazil 0.1% | |||||
| Petroleo Brasileiro SA, ADR, pfd. | Oil, Gas & Consumable Fuels | 78,385 | 594,158 | ||
| Germany 0.6% | |||||
| Draegerwerk AG & Co. KGAA, pfd. | Health Care Equipment & Supplies | 25,700 | 2,608,106 | ||
| Total Preferred Stocks | |||||
| (Cost $4,415,097) | 3,202,264 | ||||
| Total Investments before Short Term | |||||
| Investments (Cost $384,190,868) | 440,668,516 | ||||
| Principal Amount | |||||
| Short Term Investments 5.3% | |||||
| Time Deposits 5.3% | |||||
| Canada 3.8% | |||||
| Bank of Montreal, 0.03%, 1/02/15 | $ | 9,000,000 | 9,000,000 | ||
| Royal Bank of Canada, 0.03%, 1/02/15 | 9,000,000 | 9,000,000 | |||
| 18,000,000 | |||||
| United States 1.5% | |||||
| Scotia Capital Markets, 0.04%, 1/02/15 | 7,000,000 | 7,000,000 | |||
| Total Time Deposits | |||||
| (Cost $25,000,000) | 25,000,000 | ||||
| Total Investments (Cost $409,190,868) | |||||
| 99.6% | 465,668,516 | ||||
| Other Assets, less Liabilities 0.4% | 1,706,885 | ||||
| Net Assets 100.0% | $ | 467,375,401 | |||
| See Abbreviations on page 67. | |||||
aNon-income producing.
bSecurity was purchased pursuant to Regulation S under the Securities Act of 1933, which exempts from registration securities offered and sold outside of the United States.
Such a security cannot be sold in the United States without either an effective registration statement filed pursuant to the Securities Act of 1933, or pursuant to an exemption
from registration. This security has been deemed liquid under guidelines approved by the Trust’s Board of Trustees. At December 31, 2014, the value of this security was
$3,972,491, representing 0.85% of net assets.
cSecurity was purchased pursuant to Rule 144A under the Securities Act of 1933 and may be sold in transactions exempt from registration only to qualified institutional buyers
or in a public offering registered under the Securities Act of 1933. This security has been deemed liquid under guidelines approved by the Trust’s Board of Trustees. At
December 31, 2014, the value of this security was $2,964,158, representing 0.63% of net assets.
50 | Annual Report | The accompanying notes are an integral part of these financial statements.
ftinstitutional.com
| TEMPLETON INSTITUTIONAL FUNDS | ||||||
| Financial Statements | ||||||
| Statements of Assets and Liabilities | ||||||
| December 31, 2014 | ||||||
| Emerging | Foreign | |||||
| Markets Series | Equity Series | |||||
| Assets: | ||||||
| Investments in securities: | ||||||
| Cost - Unaffiliated issuers | $ | 89,925,061 | $ | 4,777,474,270 | ||
| Cost - Sweep Money Fund (Note 3d) | 2,196,731 | 36,954,370 | ||||
| Total cost of investments | $ | 92,121,792 | $ | 4,814,428,640 | ||
| Value - Unaffiliated issuers | $ | 99,988,726 | $ | 6,161,052,820 | ||
| Value - Sweep Money Fund (Note 3d) | 2,196,731 | 36,954,370 | ||||
| Total value of investments | 102,185,457 | 6,198,007,190 | ||||
| Receivables: | ||||||
| Investment securities sold | 235,804 | 23,471,434 | ||||
| Capital shares sold | 17,549 | 6,671,396 | ||||
| Dividends | 68,727 | 16,089,391 | ||||
| Other assets | 56,900 | 577 | ||||
| Total assets | 102,564,437 | 6,244,239,988 | ||||
| Liabilities: | ||||||
| Payables: | ||||||
| Investment securities purchased | 111,638 | — | ||||
| Capital shares redeemed | 364,658 | 21,902,341 | ||||
| Management fees | 105,299 | 4,037,599 | ||||
| Transfer agent fees | 134 | 22,076 | ||||
| Professional fees | 58,499 | 76,501 | ||||
| Deferred tax | 33,494 | — | ||||
| Accrued expenses and other liabilities | 30,098 | 366,247 | ||||
| Total liabilities | 703,820 | 26,404,764 | ||||
| Net assets, at value | $ | 101,860,617 | $ | 6,217,835,224 | ||
| Net assets consist of: | ||||||
| Paid-in capital | $ | 94,869,680 | $ | 4,961,782,135 | ||
| Distributions in excess of net investment income | (3,244,008 | ) | (46,146,181 | ) | ||
| Net unrealized appreciation (depreciation) | 10,016,407 | 1,382,869,029 | ||||
| Accumulated net realized gain (loss) | 218,538 | (80,669,759 | ) | |||
| Net assets, at value | $ | 101,860,617 | $ | 6,217,835,224 | ||
| Shares outstanding | 22,182,366 | — | ||||
| Net asset value per share | $ | 4.59 | — | |||
| Primary Shares: | ||||||
| Net assets, at value | — | $ | 6,210,850,169 | |||
| Shares outstanding | — | 309,816,948 | ||||
| Net asset value per share | — | $ | 20.05 | |||
| Service Shares: | ||||||
| Net assets, at value | — | $ | 6,985,055 | |||
| Shares outstanding | — | 347,354 | ||||
| Net asset value and maximum offering price per share | — | $ | 20.11 | |||
ftinstitutional.com
The accompanying notes are an integral part of these financial statements. | Annual Report | 51
| TEMPLETON INSTITUTIONAL FUNDS | ||||||
| FINANCIAL STATEMENTS | ||||||
| Statements of Assets and Liabilities (continued) | ||||||
| December 31, 2014 | ||||||
| Foreign Smaller | Global | |||||
| Companies Series | Equity Series | |||||
| Assets: | ||||||
| Investments in securities: | ||||||
| Cost | $ | 1,036,529,122 | $ | 409,190,868 | ||
| Valuea | $ | 1,206,695,483 | $ | 465,668,516 | ||
| Cash | 76,802,308 | 779,256 | ||||
| Receivables: | ||||||
| Investment securities sold | 159,061 | — | ||||
| Capital shares sold | 1,066,810 | 6,998 | ||||
| Dividends and interest | 1,635,613 | 1,288,654 | ||||
| Foreign tax | — | 10,713 | ||||
| Other assets | 113 | 41 | ||||
| Total assets | 1,286,359,388 | 467,754,178 | ||||
| Liabilities: | ||||||
| Payables: | ||||||
| Capital shares redeemed | 929,507 | 723 | ||||
| Management fees | 1,025,573 | 303,151 | ||||
| Transfer agent fees | 507 | 50 | ||||
| Professional fees | 51,806 | 54,960 | ||||
| Payable upon return of securities loaned | 2,525,842 | — | ||||
| Accrued expenses and other liabilities | 93,422 | 19,893 | ||||
| Total liabilities | 4,626,657 | 378,777 | ||||
| Net assets, at value | $ | 1,281,732,731 | $ | 467,375,401 | ||
| Net assets consist of: | ||||||
| Paid-in capital | $ | 1,123,251,311 | $ | 412,727,892 | ||
| Undistributed net investment income (distributions in excess of net investment income) | (1,190,000 | ) | 554,073 | |||
| Net unrealized appreciation (depreciation) | 170,120,924 | 56,440,664 | ||||
| Accumulated net realized gain (loss) | (10,449,504 | ) | (2,347,228 | ) | ||
| Net assets, at value | $ | 1,281,732,731 | $ | 467,375,401 | ||
| Shares outstanding | 61,610,584 | 48,484,970 | ||||
| Net asset value per share | $ | 20.80 | $ | 9.64 | ||
| aThe Foreign Smaller Companies Series includes $2,390,420 of securities loaned. | |
| 52 | Annual Report | The accompanying notes are an integral part of these financial statements. | ftinstitutional.com |
TEMPLETON INSTITUTIONAL FUNDS
FINANCIAL STATEMENTS
| Statements of Operations | ||||||
| for the year ended December 31, 2014 | ||||||
| Emerging | Foreign | |||||
| Markets Series | Equity Series | |||||
| Investment income: | ||||||
| Dividendsa | $ | 4,467,503 | $ | 276,208,043 | ||
| Income from securities loaned | 12,087 | 53,969 | ||||
| Total investment income | 4,479,590 | 276,262,012 | ||||
| Expenses: | ||||||
| Management fees (Note 3a) | 1,687,945 | 49,715,790 | ||||
| Administrative fees (Note 3b) | 43,392 | 1,885,642 | ||||
| Transfer agent fees (Note 3c) | 1,949 | 28,348 | ||||
| Sub-transfer agent fees - Service Shares (Note 3c) | — | 11,518 | ||||
| Custodian fees (Note 4) | 71,157 | 737,191 | ||||
| Reports to shareholders | 7,264 | 71,638 | ||||
| Registration and filing fees | 29,961 | 85,517 | ||||
| Professional fees | 70,800 | 126,413 | ||||
| Trustees’ fees and expenses | 4,054 | 173,936 | ||||
| Other | 15,991 | 120,914 | ||||
| Total expenses | 1,932,513 | 52,956,907 | ||||
| Expenses waived/paid by affiliates (Note 3d) | (2,663 | ) | (155,979 | ) | ||
| Net expenses | 1,929,850 | 52,800,928 | ||||
| Net investment income | 2,549,740 | 223,461,084 | ||||
| Realized and unrealized gains (losses): | ||||||
| Net realized gain (loss) from: | ||||||
| Investments | 33,061,339 | 62,302,725 | ||||
| Foreign currency transactions | (56,903 | ) | (242,127 | ) | ||
| Net realized gain (loss) | 33,004,436 | 62,060,598 | ||||
| Net change in unrealized appreciation (depreciation) on: | ||||||
| Investments | (45,607,851 | ) | (754,298,381 | ) | ||
| Translation of other assets and liabilities denominated in foreign currencies | (6,528 | ) | (1,086,086 | ) | ||
| Change in deferred taxes on unrealized appreciation | (3,883 | ) | — | |||
| Net change in unrealized appreciation (depreciation) | (45,618,262 | ) | (755,384,467 | ) | ||
| Net realized and unrealized gain (loss) | (12,613,826 | ) | (693,323,869 | ) | ||
| Net increase (decrease) in net assets resulting from operations | $ | (10,064,086 | ) | $ | (469,862,785 | ) |
aForeign taxes withheld on dividends $ 353,271 $ 19,599,716
ftinstitutional.com The accompanying notes are an integral part of these financial statements. | Annual Report | 53
| TEMPLETON INSTITUTIONAL FUNDS | ||||||
| FINANCIAL STATEMENTS | ||||||
| Statements of Operations (continued) | ||||||
| for the year ended December 31, 2014 | ||||||
| Foreign Smaller | Global | |||||
| Companies Series | Equity Series | |||||
| Investment income: | ||||||
| Dividendsa | $ | 27,682,522 | $ | 14,986,434 | ||
| Interest | 3,825 | 9,764 | ||||
| Income from securities loaned | 515,465 | 2,560 | ||||
| Total investment income | 28,201,812 | 14,998,758 | ||||
| Expenses: | ||||||
| Management fees (Note 3a) | 12,484,415 | 4,223,797 | ||||
| Transfer agent fees (Note 3c) | 7,137 | 846 | ||||
| Custodian fees (Note 4) | 226,595 | 38,912 | ||||
| Reports to shareholders | 26,736 | 5,198 | ||||
| Registration and filing fees | 86,911 | 23,980 | ||||
| Professional fees | 58,147 | 67,647 | ||||
| Trustees’ fees and expenses | 32,731 | 12,243 | ||||
| Other | 38,782 | 33,181 | ||||
| Total expenses | 12,961,454 | 4,405,804 | ||||
| Net investment income | 15,240,358 | 10,592,954 | ||||
| Realized and unrealized gains (losses): | ||||||
| Net realized gain (loss) from: | ||||||
| Investments | 10,017,556 | 49,159,759 | ||||
| Foreign currency transactions | 493,740 | (139,004 | ) | |||
| Net realized gain (loss) | 10,511,296 | 49,020,755 | ||||
| Net change in unrealized appreciation (depreciation) on: | ||||||
| Investments | (68,815,927 | ) | (68,814,370 | ) | ||
| Translation of other assets and liabilities denominated in foreign currencies | (26,639 | ) | (42,111 | ) | ||
| Change in deferred taxes on unrealized appreciation | 229,022 | — | ||||
| Net change in unrealized appreciation (depreciation) | (68,613,544 | ) | (68,856,481 | ) | ||
| Net realized and unrealized gain (loss) | (58,102,248 | ) | (19,835,726 | ) | ||
| Net increase (decrease) in net assets resulting from operations | $ | (42,861,890 | ) | $ | (9,242,772 | ) |
aForeign taxes withheld on dividends $ 2,930,411 $ 1,051,341
54 | Annual Report | The accompanying notes are an integral part of these financial statements. ftinstitutional.com
| TEMPLETON INSTITUTIONAL FUNDS | ||||||||||||
| FINANCIAL STATEMENTS | ||||||||||||
| Statements of Changes in Net Assets | ||||||||||||
| Emerging Markets Series | Foreign Equity Series | |||||||||||
| Year Ended December 31, | Year Ended December 31, | |||||||||||
| 2014 | 2013 | 2014 | 2013 | |||||||||
| Increase (decrease) in net assets: | ||||||||||||
| Operations: | ||||||||||||
| Net investment income | $ | 2,549,740 | $ | 2,297,046 | $ | 223,461,084 | $ | 132,297,359 | ||||
| Net realized gain (loss) from investments and foreign | ||||||||||||
| currency transactions | 33,004,436 | 51,510,286 | 62,060,598 | 99,379,752 | ||||||||
| Net change in unrealized appreciation (depreciation) | ||||||||||||
| on investments, translation of other assets and | ||||||||||||
| liabilities denominated in foreign currencies and | ||||||||||||
| deferred taxes | (45,618,262 | ) | (50,449,769 | ) | (755,384,467 | ) | 890,001,098 | |||||
| Net increase (decrease) in net assets resulting | ||||||||||||
| from operations | (10,064,086 | ) | 3,357,563 | (469,862,785 | ) | 1,121,678,209 | ||||||
| Distributions to shareholders from: | ||||||||||||
| Net investment income | (3,262,876 | ) | (2,298,803 | ) | — | — | ||||||
| Net realized gains | (32,812,430 | ) | (54,320,473 | ) | — | — | ||||||
| Net investment income: | ||||||||||||
| Primary Shares | — | — | (235,550,172 | ) | (129,039,719 | ) | ||||||
| Service Shares | — | — | (250,736 | ) | (129,491 | ) | ||||||
| Net realized gains: | ||||||||||||
| Primary Shares | — | — | (103,923,370 | ) | (72,776,168 | ) | ||||||
| Service Shares | — | — | (115,780 | ) | (81,667 | ) | ||||||
| Total distributions to shareholders | (36,075,306 | ) | (56,619,276 | ) | (339,840,058 | ) | (202,027,045 | ) | ||||
| Capital share transactions: (Note 2) | (17,215,565 | ) | (30,712,603 | ) | — | — | ||||||
| Primary Shares | — | — | 203,739,657 | 78,493,116 | ||||||||
| Service Shares | — | — | 173,372 | (14,662,257 | ) | |||||||
| Total capital share transactions | (17,215,565 | ) | (30,712,603 | ) | 203,913,029 | 63,830,859 | ||||||
| Net increase (decrease) in net assets | (63,354,957 | ) | (83,974,316 | ) | (605,789,814 | ) | 983,482,023 | |||||
| Net assets: | ||||||||||||
| Beginning of year | 165,215,574 | 249,189,890 | 6,823,625,038 | 5,840,143,015 | ||||||||
| End of year | $ | 101,860,617 | $ | 165,215,574 | $ | 6,217,835,224 | $ | 6,823,625,038 | ||||
| Distributions in excess of net investment income | ||||||||||||
| included in net assets: | ||||||||||||
| End of year | $ | (3,244,008 | ) | $ | (2,987,853 | ) | $ | (46,146,181 | ) | $ | (39,900,761 | ) |
ftinstitutional.com
The accompanying notes are an integral part of these financial statements. | Annual Report | 55
| TEMPLETON INSTITUTIONAL FUNDS | ||||||||||||
| FINANCIAL STATEMENTS | ||||||||||||
| Statements of Changes in Net Assets (continued) | ||||||||||||
| Foreign Smaller Companies Series | Global Equity Series | |||||||||||
| Year Ended December 31, | Year Ended December 31, | |||||||||||
| 2014 | 2013 | 2014 | 2013 | |||||||||
| Increase (decrease) in net assets: | ||||||||||||
| Operations: | ||||||||||||
| Net investment income | $ | 15,240,358 | $ | 10,034,980 | $ | 10,592,954 | $ | 5,727,232 | ||||
| Net realized gain (loss) from investments and foreign | ||||||||||||
| currency transactions | 10,511,296 | 379,128 | 49,020,755 | 50,944,206 | ||||||||
| Net change in unrealized appreciation (depreciation) | ||||||||||||
| on investments, translation of other assets and | ||||||||||||
| liabilities denominated in foreign currencies and | ||||||||||||
| deferred taxes | (68,613,544 | ) | 160,291,999 | (68,856,481 | ) | 65,236,359 | ||||||
| Net increase (decrease) in net assets resulting | ||||||||||||
| from operations | (42,861,890 | ) | 170,706,107 | (9,242,772 | ) | 121,907,797 | ||||||
| Distributions to shareholders from: | ||||||||||||
| Net investment income | (9,733,595 | ) | (16,339,281 | ) | (10,681,401 | ) | (4,798,439 | ) | ||||
| Net realized gains | (16,344,012 | ) | (5,929,401 | ) | (58,884,819 | ) | (46,261,959 | ) | ||||
| Total distributions to shareholders | (26,077,607 | ) | (22,268,682 | ) | (69,566,220 | ) | (51,060,398 | ) | ||||
| Capital share transactions: (Note 2) | 97,875,195 | 608,759,234 | 54,582,067 | (11,829,879 | ) | |||||||
| Net increase (decrease) in net assets | 28,935,698 | 757,196,659 | (24,226,925 | ) | 59,017,520 | |||||||
| Net assets: | ||||||||||||
| Beginning of year | 1,252,797,033 | 495,600,374 | 491,602,326 | 432,584,806 | ||||||||
| End of year | $ | 1,281,732,731 | $ | 1,252,797,033 | $ | 467,375,401 | $ | 491,602,326 | ||||
| Undistributed net investment income (distributions in | ||||||||||||
| excess of net investment income) included in | ||||||||||||
| net assets: | ||||||||||||
| End of year | $ | (1,190,000 | ) | $ | (7,654,804 | ) | $ | 554,073 | $ | 777,810 | ||
56 | Annual Report | The accompanying notes are an integral part of these financial statements.
ftinstitutional.com
TEMPLETON INSTITUTIONAL FUNDS
Notes to Financial Statements
1. Organization and Significant Accounting Policies
Templeton Institutional Funds (Trust) is registered under the Investment Company Act of 1940, as amended, (1940 Act) as an open-end management investment company, consisting of four separate funds (Funds) and applies the specialized accounting and reporting guidance in U.S. Generally Accepted Accounting Principles (U.S. GAAP). Foreign Equity Series offers Primary and Service Shares. Each class of shares differs by its transfer agent fees and voting rights on matters affecting a single class.
The following summarizes the Funds’ significant accounting policies.
a. Financial Instrument Valuation
The Funds’ investments in financial instruments are carried at fair value daily. Fair value is the price that would be received to sell an asset or paid to transfer a liability in an orderly transaction between market participants on the measurement date. The Funds calculate the net asset value (NAV) per share at the close of the New York Stock Exchange (NYSE), generally at 4 p.m. Eastern time (NYSE close) on each day the NYSE is open for trading. Under compliance policies and procedures approved by the Trust’s Board of Trustees (the Board), the Funds’ administrator has responsibility for oversight of valuation, including leading the cross-functional Valuation and Liquidity Oversight Committee (VLOC). The VLOC provides administration and oversight of the Funds’ valuation policies and procedures, which are approved annually by the Board. Among other things, these procedures allow the Funds to utilize independent pricing services, quotations from securities and financial instrument dealers, and other market sources to determine fair value.
Equity securities and exchange traded funds listed on an exchange or on the NASDAQ National Market System are valued at the last quoted sale price or the official closing price of the day, respectively. Foreign equity securities are valued as of the close of trading on the foreign stock exchange on which the security is primarily traded or as of the NYSE close, whichever is earlier. The value is then converted into its U.S. dollar equivalent at the foreign exchange rate in effect at the NYSE close on the day that the value of the security is determined. Over-the-counter (OTC) securities are valued within the range of the most recent quoted bid and ask prices. Securities that trade in multiple markets or on multiple exchanges are valued according to the broadest and most representative market. Certain
equity securities are valued based upon fundamental characteristics or relationships to similar securities. Investments in open-end mutual funds and non-registered money market funds are valued at the closing NAV.
Debt securities generally trade in the OTC market rather than on a securities exchange. The Funds’ pricing services use multiple valuation techniques to determine fair value. In instances where sufficient market activity exists, the pricing services may utilize a market-based approach through which quotes from market makers are used to determine fair value. In instances where sufficient market activity may not exist or is limited, the pricing services also utilize proprietary valuation models which may consider market characteristics such as benchmark yield curves, credit spreads, estimated default rates, anticipated market interest rate volatility, coupon rates, anticipated timing of principal repayments, underlying collateral, and other unique security features in order to estimate the relevant cash flows, which are then discounted to calculate the fair value. Time deposits are valued at cost, which approximates fair value.
The Funds have procedures to determine the fair value of financial instruments for which market prices are not reliable or readily available. Under these procedures, the VLOC convenes on a regular basis to review such financial instruments and considers a number of factors, including significant unobservable valuation inputs, when arriving at fair value. The VLOC primarily employs a market-based approach which may use related or comparable assets or liabilities, recent transactions, market multiples, book values, and other relevant information for the investment to determine the fair value of the investment. An income-based valuation approach may also be used in which the anticipated future cash flows of the investment are discounted to calculate fair value. Discounts may also be applied due to the nature or duration of any restrictions on the disposition of the investments. Due to the inherent uncertainty of valuations of such investments, the fair values may differ significantly from the values that would have been used had an active market existed. The VLOC employs various methods for calibrating these valuation approaches including a regular review of key inputs and assumptions, transactional back-testing or disposition analysis, and reviews of any related market activity.
Trading in securities on foreign securities stock exchanges and OTC markets may be completed before the daily NYSE close. In addition, trading in certain foreign markets may not take place on every NYSE business day. Occasionally, events occur
ftinstitutional.com
Annual Report
| 57
TEMPLETON INSTITUTIONAL FUNDS
NOTES TO FINANCIAL STATEMENTS
1. Organization and Significant Accounting
Policies (continued)
a. Financial Instrument Valuation (continued)
between the time at which trading in a foreign security is completed and the close of the NYSE that might call into question the reliability of the value of a portfolio security held by the fund. As a result, differences may arise between the value of the Funds’ portfolio securities as determined at the foreign market close and the latest indications of value at the close of the NYSE. In order to minimize the potential for these differences, the VLOC monitors price movements following the close of trading in foreign stock markets through a series of country specific market proxies (such as baskets of American Depositary Receipts, futures contracts and exchange traded funds). These price movements are measured against established trigger thresholds for each specific market proxy to assist in determining if an event has occurred that may call into question the reliability of the values of the foreign securities held by the Funds. If such an event occurs, the securities may be valued using fair value procedures, which may include the use of independent pricing services.
Also, when the last day of the reporting period is a non-business day, certain foreign markets may be open on those days that the NYSE is closed, which could result in differences between the value of the Funds’ portfolio securities on the last business day and the last calendar day of the reporting period. Any significant security valuation changes due to an open foreign market are adjusted and reflected by the Funds for financial reporting purposes.
b. Foreign Currency Translations
Portfolio securities and other assets and liabilities denominated in foreign currencies are translated into U.S. dollars based on the exchange rate of such currencies against U.S. dollars on the date of valuation. The Funds may enter into foreign currency exchange contracts to facilitate transactions denominated in a foreign currency. Purchases and sales of securities, income and expense items denominated in foreign currencies are translated into U.S. dollars at the exchange rate in effect on the transaction date. Portfolio securities and assets and liabilities denominated in foreign currencies contain risks that those currencies will decline in value relative to the U.S. dollar. Occasionally, events may impact the availability or reliability
of foreign exchange rates used to convert the U.S. dollar equivalent value. If such an event occurs, the foreign exchange rate will be valued at fair value using procedures established and approved by the Board.
The Funds do not separately report the effect of changes in foreign exchange rates from changes in market prices on securities held. Such changes are included in net realized and unrealized gain or loss from investments on the Statements of Operations.
Realized foreign exchange gains or losses arise from sales of foreign currencies, currency gains or losses realized between the trade and settlement dates on securities transactions and the difference between the recorded amounts of dividends, interest, and foreign withholding taxes and the U.S. dollar equivalent of the amounts actually received or paid. Net unrealized foreign exchange gains and losses arise from changes in foreign exchange rates on foreign denominated assets and liabilities other than investments in securities held at the end of the reporting period.
c. Participatory Notes
Certain funds invest in Participatory Notes (P-Notes). P-notes are promissory notes that are designed to offer a return linked to the performance of a particular underlying equity security or market. P-Notes are issued by banks or broker-dealers and allow the fund to gain exposure to common stocks in markets where direct investment is not allowed. Income received from P-Notes is recorded as dividend income in the Statement of Operations. P-Notes may contain various risks including the potential inability of the counterparty to fulfill their obligations under the terms of the contract. These securities may be more volatile and less liquid than other investments held by the Fund.
d. Securities Lending
Certain funds participate in an agency based securities lending program. The fund receives cash collateral against the loaned securities in an amount equal to at least 102% of the fair value of the loaned securities. Collateral is maintained over the life of the loan in an amount not less than 100% of the fair value of loaned securities, as determined at the close of fund business each day; any additional collateral required due to changes in security values is delivered to the fund on the next business day. The collateral is invested in a non-registered money fund
58 | Annual Report
ftinstitutional.com
TEMPLETON INSTITUTIONAL FUNDS
NOTES TO FINANCIAL STATEMENTS
as indicated on the Statements of Investments. The fund receives income from the investment of cash collateral, in addition to lending fees and rebates paid by the borrower. The fund bears the market risk with respect to the collateral investment, securities loaned, and the risk that the agent may default on its obligations to the fund. The securities lending agent has agreed to indemnify the fund in the event of default by a third party borrower.
e. Income and Deferred Taxes
It is each fund’s policy to qualify as a regulated investment company under the Internal Revenue Code. Each fund intends to distribute to shareholders substantially all of its taxable income and net realized gains to relieve it from federal income and excise taxes. As a result, no provision for U.S. federal income taxes is required.
The Funds may be subject to foreign taxation related to income received, capital gains on the sale of securities and certain foreign currency transactions in the foreign jurisdictions in which the Funds invest. Foreign taxes, if any, are recorded based on the tax regulations and rates that exist in the foreign markets in which the Funds invest. When a capital gain tax is determined to apply the Funds record an estimated deferred tax liability in an amount that would be payable if the securities were disposed of on the valuation date. As a result of several court cases, in certain countries across the European Union, Foreign Equity Series and Global Equity Series have filed additional tax reclaims for previously withheld taxes on dividends earned in those countries. These additional filings are subject to various administrative proceedings by the local jurisdictions’ tax authorities within the European Union, as well as a number of related judicial proceedings. At this time, uncertainty exists as to the ultimate resolution of these proceedings, the likelihood of receipt of these reclaims, and the potential timing of payment, and accordingly, no amounts are reflected in the financial statements.
Each fund recognizes the tax benefits of uncertain tax positions only when the position is “more likely than not” to be sustained upon examination by the tax authorities based on the technical merits of the tax position. As of December 31, 2014, and for all open tax years, each fund has determined that no liability for unrecognized tax benefits is required in each fund’s financial statements related to uncertain tax positions taken on a tax
return (or expected to be taken on future tax returns). Open tax years are those that remain subject to examination and are based on each tax jurisdiction statute of limitation.
f. Security Transactions, Investment Income, Expenses and Distributions
Security transactions are accounted for on trade date. Realized gains and losses on security transactions are determined on a specific identification basis. Interest income and estimated expenses are accrued daily. Amortization of premium and accretion of discount on debt securities are included in interest income. Dividend income is recorded on the ex-dividend date except for certain foreign securities where the dividend rate is not available. In such cases, the dividend is recorded as soon as the information is received by the Funds. Distributions to shareholders are recorded on the ex-dividend date and are determined according to income tax regulations (tax basis). Distributable earnings determined on a tax basis may differ from earnings recorded in accordance with U.S. GAAP. These differences may be permanent or temporary. Permanent differences are reclassified among capital accounts to reflect their tax character. These reclassifications have no impact on net assets or the results of operations. Temporary differences are not reclassified, as they may reverse in subsequent periods.
Common expenses incurred by the Trust are allocated among the Funds based on the ratio of net assets of each fund to the combined net assets of the Trust. Fund specific expenses are charged directly to the fund that incurred the expense.
Realized and unrealized gains and losses and net investment income, not including class specific expenses, are allocated daily to each class of shares based upon the relative proportion of net assets of each class. Differences in per share distributions, by class, are generally due to differences in class specific expenses.
g. Accounting Estimates
The preparation of financial statements in accordance with U.S. GAAP requires management to make estimates and assumptions that affect the reported amounts of assets and liabilities at the date of the financial statements and the amounts of income and expenses during the reporting period. Actual results could differ from those estimates.
ftinstitutional.com
Annual Report
| 59
TEMPLETON INSTITUTIONAL FUNDS
NOTES TO FINANCIAL STATEMENTS
1. Organization and Significant Accounting
Policies (continued)
h. Guarantees and Indemnifications
Under the Trust’s organizational documents, its officers and trustees are indemnified by the Trust against certain liabilities arising out of the performance of their duties to the Trust.
Additionally, in the normal course of business, the Trust, on behalf of the Funds, enters into contracts with service providers that contain general indemnification clauses. The Trust’s maximum exposure under these arrangements is unknown as this would involve future claims that may be made against the Trust that have not yet occurred. Currently, the Trust expects the risk of loss to be remote.
2. Shares of Beneficial Interest
At December 31, 2014, there were an unlimited number of shares authorized (without par value). Transactions in the Funds’ shares were as follows:
| Emerging Markets Series | ||||||
| Shares | Amount | |||||
| Year ended December 31, 2014 | ||||||
| Shares sold | 3,206,522 | $ | 22,673,149 | |||
| Shares issued in reinvestment of distributions | 7,468,364 | 35,223,531 | ||||
| Shares redeemed | (11,107,245 | ) | (75,112,245 | ) | ||
| Net increase (decrease) | (432,359 | ) | $ | (17,215,565 | ) | |
| Year ended December 31, 2013 | ||||||
| Shares sold | 7,112,098 | $ | 72,744,698 | |||
| Shares issued in reinvestment of distributions | 7,354,142 | 53,860,469 | ||||
| Shares redeemed | (15,616,882 | ) | (157,317,770 | ) | ||
| Net increase (decrease) | (1,150,642 | ) | $ | (30,712,603 | ) | |
| Foreign Equity Series | ||||||
| Shares | Amount | |||||
| Primary Shares: | ||||||
| Year ended December 31, 2014 | ||||||
| Shares sold | 52,169,180 | $ | 1,178,547,708 | |||
| Shares issued in reinvestment of distributions | 14,186,955 | 287,713,973 | ||||
| Shares redeemed | (56,482,241 | ) | (1,262,522,024 | ) | ||
| Net increase (decrease) | 9,873,894 | $ | 203,739,657 | |||
| Year ended December 31, 2013 | ||||||
| Shares sold | 48,678,296 | $ | 1,022,438,612 | |||
| Shares issued in reinvestment of distributions | 7,778,941 | 173,854,205 | ||||
| Shares redeemed | (53,419,945 | ) | (1,117,799,701 | ) | ||
| Net increase (decrease) | 3,037,292 | $ | 78,493,116 | |||
| Service Shares: | ||||||
| Year ended December 31, 2014 | ||||||
| Shares sold | 58,279 | $ | 1,320,117 | |||
| Shares issued in reinvestment of distributions | 18,019 | 366,516 | ||||
| Shares redeemed | (67,079 | ) | (1,513,261 | ) | ||
| Net increase (decrease) | 9,219 | $ | 173,372 | |||
| Year ended December 31, 2013 | ||||||
| Shares sold | 218,188 | $ | 4,471,132 | |||
| Shares issued in reinvestment of distributions | 9,464 | 211,158 | ||||
| Shares redeemed | (890,627 | ) | (19,344,547 | ) | ||
| Net increase (decrease) | (662,975 | ) | $ | (14,662,257 | ) | |
| 60 | Annual Report | ftinstitutional.com | |||||
TEMPLETON INSTITUTIONAL FUNDS
NOTES TO FINANCIAL STATEMENTS
| Foreign Smaller Companies Series | Global Equity Series | |||||||||
| Shares | Amount | Shares | Amount | |||||||
| Year ended December 31, 2014 | ||||||||||
| Shares sold | 10,312,863 | $ | 226,108,208 | 7,716,584 | $ | 89,979,433 | ||||
| Shares issued in reinvestment of distributions | 1,083,041 | 22,440,610 | 7,028,157 | 69,387,350 | ||||||
| Shares redeemed | (6,829,065 | ) | (150,673,623 | ) | (8,883,600 | ) | (104,784,716 | ) | ||
| Net increase (decrease) | 4,566,839 | $ | 97,875,195 | 5,861,141 | $ | 54,582,067 | ||||
| Year ended December 31, 2013 | ||||||||||
| Shares sold | 34,087,861 | $ | 691,686,372 | 3,751,230 | $ | 39,523,345 | ||||
| Shares issued in reinvestment of distributions | 866,707 | 18,491,310 | 4,482,858 | 50,978,101 | ||||||
| Shares redeemed | (4,971,100 | ) | (101,418,448 | ) | (9,384,374 | ) | (102,331,325 | ) | ||
| Net increase (decrease) | 29,983,468 | $ | 608,759,234 | (1,150,286 | ) | $ | (11,829,879 | ) | ||
3. Transactions with Affiliates
Franklin Resources, Inc. is the holding company for various subsidiaries that together are referred to as Franklin Templeton Investments. Certain officers and trustees of the Trust are also officers, and/or directors of the following subsidiaries:
| Subsidiary | Affiliation |
| Templeton Asset Management Ltd. (TAML) | Investment manager |
| Templeton Investment Counsel, LLC (TIC) | Investment manager |
| Franklin Templeton Services, LLC (FT Services) | Administrative manager |
| Franklin Templeton Distributors, Inc. (Distributors) | Principal underwriter |
| Franklin Templeton Investor Services, LLC (Investor Services) | Transfer agent |
a. Management Fees
Emerging Markets Series pays an investment management fee to TAML based on the average daily net assets of the Fund as follows:
| Annualized Fee Rate | Net Assets | |
| 1.175 | % | Up to and including $1 billion |
| 1.125 | % | Over $1 billion, up to and including $5 billion |
| 1.075 | % | Over $5 billion, up to and including $10 billion |
| 1.025 | % | Over $10 billion, up to and including $15 billion |
| 0.975 | % | Over $15 billion, up to and including $20 billion |
| 0.925 | % | In excess of $20 billion |
Effective May 1, 2014, Emerging Markets Series combined its investment management and administration agreements as approved by the Board. The fees paid under the combined agreement do not exceed the aggregate fees that were paid under the separate agreements.
ftinstitutional.com
Annual Report
| 61
TEMPLETON INSTITUTIONAL FUNDS
NOTES TO FINANCIAL STATEMENTS
3. Transactions with Affiliates (continued)
a. Management Fees (continued)
Prior to May 1, 2014, Emerging Markets Series paid fees to TAML based on the average daily net assets of the Fund as follows:
| Annualized Fee Rate | Net Assets | |
| 1.100 | % | Up to and including $1 billion |
| 1.050 | % | Over $1 billion, up to and including $5 billion |
| 1.000 | % | Over $5 billion, up to and including $10 billion |
| 0.950 | % | Over $10 billion, up to and including $15 billion |
| 0.900 | % | Over $15 billion, up to and including $20 billion |
| 0.850 | % | In excess of $20 billion |
Foreign Equity Series pays an investment management fee to TIC based on the average daily net assets of the Fund as follows:
| Annualized Fee Rate | Net Assets | |
| 0.775 | % | Up to and including $1 billion |
| 0.755 | % | Over $1 billion, up to and including $5 billion |
| 0.735 | % | Over $5 billion, up to and including $10 billion |
| 0.715 | % | Over $10 billion, up to and including $15 billion |
| 0.695 | % | Over $15 billion, up to and including $20 billion |
| 0.675 | % | In excess of $20 billion |
Effective May 1, 2014, Foreign Equity Series combined its investment management and administration agreements as approved by the Board. The fees paid under the combined agreement do not exceed the aggregate fees that were paid under the separate agreements.
Prior to May 1, 2014, Foreign Equity Series paid fees to TIC based on the average daily net assets of the Fund as follows:
| Annualized Fee Rate | Net Assets | |
| 0.700 | % | Up to and including $1 billion |
| 0.680 | % | Over $1 billion, up to and including $5 billion |
| 0.660 | % | Over $5 billion, up to and including $10 billion |
| 0.640 | % | Over $10 billion, up to and including $15 billion |
| 0.620 | % | Over $15 billion, up to and including $20 billion |
| 0.600 | % | In excess of $20 billion |
Foreign Smaller Companies Series pays an investment management fee to TIC based on the average daily net assets of the Fund as follows:
| Annualized Fee Rate | Net Assets | |
| 0.950 | % | Up to and including $1 billion |
| 0.930 | % | Over $1 billion, up to and including $5 billion |
| 0.910 | % | Over $5 billion, up to and including $10 billion |
| 0.890 | % | Over $10 billion, up to and including $15 billion |
| 0.870 | % | Over $15 billion, up to and including $20 billion |
| 0.850 | % | In excess of $20 billion |
62 | Annual Report ftinstitutional.com
TEMPLETON INSTITUTIONAL FUNDS
NOTES TO FINANCIAL STATEMENTS
Effective November 1, 2014, Global Equity Series pays an investment management fee to TIC based on the average daily net assets of the Fund as follows:
| Annualized Fee Rate | Net Assets | |
| 0.780 | % | Up to and including $200 million |
| 0.765 | % | Over $200 million, up to and including $700 million |
| 0.730 | % | Over $700 million, up to and including $1 billion |
| 0.715 | % | Over $1 billion, up to and including $1.2 billion |
| 0.690 | % | Over $1.2 billion, up to and including $5 billion |
| 0.675 | % | Over $5 billion, up to and including $10 billion |
| 0.655 | % | Over $10 billion, up to and including $15 billion |
| 0.635 | % | Over $15 billion, up to and including $20 billion |
| 0.615 | % | Over $20 billion, up to and including $25 billion |
| 0.605 | % | Over $25 billion, up to and including $30 billion |
| 0.595 | % | Over $30 billion, up to and including $35 billion |
| 0.585 | % | Over $35 billion, up to and including $40 billion |
| 0.575 | % | Over $40 billion, up to and including $45 billion |
| 0.565 | % | In excess of $45 billion |
Prior to November 1, 2014, Global Equity Series paid fees to TIC based on the average daily net assets of the Fund as follows:
| Annualized Fee Rate | Net Assets | |
| 0.900 | % | Up to and including $1 billion |
| 0.880 | % | Over $1 billion, up to and including $5 billion |
| 0.860 | % | Over $5 billion, up to and including $10 billion |
| 0.840 | % | Over $10 billion, up to and including $15 billion |
| 0.820 | % | Over $15 billion, up to and including $20 billion |
| 0.800 | % | In excess of $20 billion |
b. Administrative Fees
Effective May 1, 2014, under an agreement with TAML and TIC, FT Services provides administrative services to Emerging Markets Series and Foreign Equity Series. The fee is paid by TAML and TIC based on the average daily net assets, and is not an additional expense of the Funds.
Prior to May 1, 2014, Emerging Markets Series and Foreign Equity Series each paid their allocated share of an administrative fee to FT Services based on the aggregate average net assets as follows:
| Annualized Fee Rate | Net Assets | |
| 0.150 | % | Up to and including $200 million |
| 0.135 | % | Over $200 million, up to and including $700 million |
| 0.100 | % | Over $700 million, up to and including $1.2 billion |
| 0.075 | % | In excess of $1.2 billion |
Under an agreement with TIC, FT Services provides administrative services to Foreign Smaller Companies Series and Global Equity Series. The fee is paid by TIC based on the average daily net assets, and is not an additional expense of the Funds.
ftinstitutional.com
Annual Report
| 63
TEMPLETON INSTITUTIONAL FUNDS
NOTES TO FINANCIAL STATEMENTS
3. Transactions with Affiliates (continued)
c. Transfer Agent Fees
Each class of shares pays transfer agent fees to Investor Services for its performance of shareholder servicing obligations and reimburses Investor Services for out of pocket expenses incurred, including shareholding servicing fees paid to third parties. These fees are allocated daily based upon their relative proportion of such classes’ aggregate net assets.
For the year ended December 31, 2014, the Funds paid transfer agent fees as noted in the Statements of Operations of which the following amounts were retained by Investor Services:
| Emerging Markets | Foreign Equity | Foreign Smaller | Global Equity | |||||
| Series | Series | Companies Series | Series | |||||
| Transfer agent fees | $ | 1,692 | $ | 30,197 | $ | 6,090 | $ | 611 |
Foreign Equity Series’ Service shares may pay up to 0.15% of average daily net assets for sub-transfer agency fees as noted in the Statements of Operations.
d. Investments in Institutional Fiduciary Trust Money Market Portfolio
Emerging Market Series and Foreign Equity Series invest in Institutional Fiduciary Trust Money Market Portfolio (Sweep Money Fund), an affiliated open-end management investment company. Management fees paid by the Funds are waived on assets invested in the Sweep Money Fund, as noted on the Statements of Operations, in an amount not to exceed the management and administrative fees paid directly or indirectly by the Sweep Money Fund. Prior to January 1, 2014, the waiver was accounted for as a reduction to management fees.
4. Expense Offset Arrangement
The Funds have entered into an arrangement with their custodian whereby credits realized as a result of uninvested cash balances are used to reduce a portion of the Funds’ custodian expenses. During the year ended December 31, 2014, there were no credits earned.
5. Income Taxes
For tax purposes, the Funds may elect to defer any portion of a post-October capital loss to the first day of the following fiscal year.
At December 31, 2014, the deferred post-October capital losses were as follows:
| Foreign Equity | Foreign Smaller | Global Equity | |||
| Series | Companies Series | Series | |||
| $ | 62,837,626 | $ | 10,301,864 | $ | 2,229,727 |
The tax character of distributions paid during the years ended December 31, 2014 and 2013, was as follows:
| Emerging Markets Series | Foreign Equity Series | |||||||
| 2014 | 2013 | 2014 | 2013 | |||||
| Distributions paid from: | ||||||||
| Ordinary income | $ | 3,262,876 | $ | 3,135,175 | $ | 291,422,239 | $ | 133,780,292 |
| Long term capital gain | 32,812,430 | 53,484,101 | 48,417,819 | 68,246,753 | ||||
| $ | 36,075,306 | $ | 56,619,276 | $ | 339,840,058 | $ | 202,027,045 | |
64 | Annual Report
ftinstitutional.com
TEMPLETON INSTITUTIONAL FUNDS
NOTES TO FINANCIAL STATEMENTS
| Foreign Smaller Companies Series | Global Equity Series | ||||||||||||||||||
| 2014 | 2013 | 2014 | 2013 | ||||||||||||||||
| Distributions paid from: | |||||||||||||||||||
| Ordinary income | $ | 13,197,535 | $ | 16,872,593 | $ | 17,317,960 | $ | 13,781,607 | |||||||||||
| Long term capital gain | 12,880,072 | 5,396,089 | 52,248,260 | 37,278,791 | |||||||||||||||
| $ | 26,077,607 | $ | 22,268,682 | $ | 69,566,220 | $ | 51,060,398 | ||||||||||||
| At December 31, 2014, the cost of investments, net unrealized appreciation (depreciation), undistributed ordinary income and | |||||||||||||||||||
| undistributed long term capital gains for income tax purposes were as follows: | |||||||||||||||||||
| Emerging Markets | Foreign Equity | Foreign Smaller | Global Equity | ||||||||||||||||
| Series | Series | Companies Series | Series | ||||||||||||||||
| Cost of investments | $ | 95,771,537 | $ | 4,882,777,778 | $ | 1,038,090,973 | $ | 409,400,526 | |||||||||||
| Unrealized appreciation | $ | 16,205,626 | $ | 1,837,856,903 | $ | 250,534,654 | $ | 91,680,719 | |||||||||||
| Unrealized depreciation | (9,791,706 | ) | (522,627,491 | ) | (81,930,144 | ) | (35,412,729 | ) | |||||||||||
| Net unrealized appreciation (depreciation) | $ | 6,413,920 | $ | 1,315,229,412 | $ | 168,604,510 | $ | 56,267,990 | |||||||||||
| Undistributed ordinary income | $ | 237,223 | $ | 4,370,822 | $ | 224,217 | $ | 646,223 | |||||||||||
| Undistributed long term capital gains | 389,239 | — | — | — | |||||||||||||||
| Distributable earnings | $ | 626,462 | $ | 4,370,822 | $ | 224,217 | $ | 646,223 | |||||||||||
| Differences between income and/or capital gains as determined on a book basis and a tax basis are primarily due to differing treat- | |||||||||||||||||||
| ments of passive foreign investment company shares, corporate actions and wash sales. | |||||||||||||||||||
| 6. Investment Transactions | |||||||||||||||||||
| Purchases and sales of investments (excluding short term securities) for the year ended December 31, 2014, were as follows: | |||||||||||||||||||
| Emerging Markets | Foreign Equity | Foreign Smaller | Global Equity | ||||||||||||||||
| Series | Series | Companies Series | Series | ||||||||||||||||
| Purchases | $ | 110,888,617 | $ | 1,205,798,539 | $ | 343,016,071 | $ | 162,483,507 | |||||||||||
| Sales | $ | 164,049,022 | $ | 991,050,142 | $ | 266,918,686 | $ | 176,990,970 | |||||||||||
7. Shareholder Concentrations
Emerging Markets Series has a concentration of shareholders holding a significant percentage of shares outstanding. Investment activities of these shareholders could have a material impact on the fund. At December 31, 2014, Emerging Markets Series had five unaffiliated shareholders, one holding 23%, the remaining holding 21%, 13%, 11% and 9% of the fund’s outstanding shares.
8. Concentration of Risk
Investing in foreign securities may include certain risks and considerations not typically associated with investing in U.S. securities, such as fluctuating currency values and changing local and regional economic, political and social conditions, which may result in greater market volatility. In addition, certain foreign securities may not be as liquid as U.S. securities.
ftinstitutional.com Annual Report | 65
TEMPLETON INSTITUTIONAL FUNDS
NOTES TO FINANCIAL STATEMENTS
9. Credit Facility
The Funds, together with other U.S. registered and foreign investment funds (collectively, Borrowers), managed by Franklin Templeton Investments, are borrowers in a joint syndicated senior unsecured credit facility totaling $1.5 billion (Global Credit Facility) which matured on February 13, 2015. This Global Credit Facility provides a source of funds to the Borrowers for temporary and emergency purposes, including the ability to meet future unanticipated or unusually large redemption requests. Effective February 13, 2015, the Borrowers renewed the Global Credit Facility for a total of $2 billion, which matures on February 12, 2016.
Under the terms of the Global Credit Facility, the Funds shall, in addition to interest charged on any borrowings made by the Funds and other costs incurred by the Funds, pay their share of fees and expenses incurred in connection with the implementation and maintenance of the Global Credit Facility, based upon their relative share of the aggregate net assets of all of the Borrowers, including an annual commitment fee of 0.07% based upon the unused portion of the Global Credit Facility. These fees are reflected in other expenses on the Statements of Operations. During the year ended December 31, 2014, the Funds did not use the Global Credit Facility.
10. Fair Value Measurements
The Funds follow a fair value hierarchy that distinguishes between market data obtained from independent sources (observable inputs) and the Funds’ own market assumptions (unobservable inputs). These inputs are used in determining the value of the Funds’ financial instruments and are summarized in the following fair value hierarchy:
• Level 1 – quoted prices in active markets for identical financial instruments
• Level 2 – other significant observable inputs (including quoted prices for similar financial instruments, interest rates, prepayment speed, credit risk, etc.)
• Level 3 – significant unobservable inputs (including the Funds’ own assumptions in determining the fair value of financial instruments)
The input levels are not necessarily an indication of the risk or liquidity associated with financial instruments at that level.
For movements between the levels within the fair value hierarchy, the Funds have adopted a policy of recognizing the transfers as of the date of the underlying event which caused the movement.
A summary of inputs used as of December 31, 2014, in valuing the Funds’ assets carried at fair value, is as follows:
| Level 1 | Level 2 | Level 3 | Total | |||||
| Emerging Markets Series | ||||||||
| Assets: | ||||||||
| Investments in Securities: | ||||||||
| Equity Investmentsa,b | $ | 98,767,452 | $ | — | $ | — | $ | 98,767,452 |
| Participatory Notes | — | 1,221,274 | — | 1,221,274 | ||||
| Short Term Investments | 2,196,731 | — | — | 2,196,731 | ||||
| Total Investments in Securities | $ | 100,964,183 | $ | 1,221,274 | $ | — | $ | 102,185,457 |
| Foreign Equity Series | ||||||||
| Assets: | ||||||||
| Investments in Securities: | ||||||||
| Equity Investmentsa,b | $ | 6,161,052,820 | $ | — | $ | — | $ | 6,161,052,820 |
| Short Term Investments | 36,954,370 | — | — | 36,954,370 | ||||
| Total Investments in Securities | $ | 6,198,007,190 | $ | — | $ | — | $ | 6,198,007,190 |
66 | Annual Report
ftinstitutional.com
TEMPLETON INSTITUTIONAL FUNDS
NOTES TO FINANCIAL STATEMENTS
| Level 1 | Level 2 | Level 3 | Total | |||||
| Foreign Smaller Companies Series | ||||||||
| Assets: | ||||||||
| Investments in Securities: | ||||||||
| Equity Investments:a | ||||||||
| South Korea | $ | 103,998,776 | $ | 224,625 | $ | — | $ | 104,223,401 |
| All Other Equity Investmentsb | 1,099,946,240 | — | —c | 1,099,946,240 | ||||
| Short Term Investments | — | 2,525,842 | — | 2,525,842 | ||||
| Total Investments in Securities | $ | 1,203,945,016 | $ | 2,750,467 | $ | — | $ | 1,206,695,483 |
| Global Equity Series | ||||||||
| Assets: | ||||||||
| Investments in Securities: | ||||||||
| Equity Investmentsa,b | $ | 440,668,516 | $ | — | $ | — | $ | 440,668,516 |
| Short Term Investments | — | 25,000,000 | — | 25,000,000 | ||||
| Total Investments in Securities | $ | 440,668,516 | $ | 25,000,000 | $ | — | $ | 465,668,516 |
| aIncludes common and preferred stocks as well as other equity investments. | ||||||||
| bFor detailed categories, see the accompanying Statement of Investments. | ||||||||
| cIncludes securities determined to have no value at December 31, 2014. | ||||||||
A reconciliation of assets in which Level 3 inputs are used in determining fair value is presented when there are significant Level 3 financial instruments at the end of the year.
11. New Accounting Pronouncements
In June 2014, the Financial Accounting Standards Board issued Accounting Standards Update (ASU) No. 2014-11, Transfers and Servicing (Topic 860), Repurchase-to-Maturity Transactions, Repurchase Financings, and Disclosures. The ASU changes the accounting for certain repurchase agreements and expands disclosure requirements related to repurchase agreements, securities lending, repurchase-to-maturity and similar transactions. The ASU is effective for interim and annual reporting periods beginning after December 15, 2014. Management has reviewed the requirements and believes the adoption of this ASU will not have a material impact on the financial statements.
12. Subsequent Events
The Funds have evaluated subsequent events through the issuance of the financial statements and determined that no events have occurred that require disclosure other than those already disclosed in the financial statements.
| Abbreviations | |
| Selected Portfolio | |
| ADR | American Depositary Receipt |
| ETF | Exchange Traded Fund |
| GDR | Global Depositary Receipt |
| IDR | International Depositary Receipt |
| SDR | Swedish Depositary Receipt |
ftinstitutional.com Annual Report | 67
TEMPLETON INSTITUTIONAL FUNDS
Report of Independent Registered Public Accounting Firm
To the Board of Trustees and Shareholders of Templeton Institutional Funds
In our opinion, the accompanying statements of assets and liabilities, including the statements of investments, and the related statements of operations and of changes in net assets and the financial highlights present fairly, in all material respects, the financial position of Emerging Markets Series, Foreign Equity Series, Foreign Smaller Companies Series and Global Equity Series (separate portfolios of Templeton Institutional Funds, hereafter referred to as the “Funds”) at December 31, 2014, the results of each of their operations for the year then ended, the changes in each of their net assets for each of the two years in the period then ended and the financial highlights for each of the five years in the period then ended, in conformity with accounting principles generally accepted in the United States of America. These financial statements and financial highlights (hereafter referred to as “financial statements”) are the responsibility of the Funds’ management. Our responsibility is to express an opinion on these financial statements based on our audits. We conducted our audits of these financial statements in accordance with the standards of the Public Company Accounting Oversight Board (United States). Those standards require that we plan and perform the audit to obtain reasonable assurance about whether the financial statements are free of material misstatement. An audit includes examining, on a test basis, evidence supporting the amounts and disclosures in the financial statements, assessing the accounting principles used and significant estimates made by management, and evaluating the overall financial statement presentation. We believe that our audits, which included confirmation of securities at December 31, 2014 by correspondence with the custodian, transfer agent and brokers, provide a reasonable basis for our opinion.
PricewaterhouseCoopers LLP
San Francisco, California
February 18, 2015
68 | Annual Report
ftinstitutional.com
TEMPLETON INSTITUTIONAL FUNDS
Tax Information (unaudited)
Under Section 852(b)(3)(C) of the Internal Revenue Code (Code), the Funds hereby report the maximum amount allowable but no less than the following amounts as long term capital gain dividends for the fiscal year ended December 31, 2014.
| Emerging Markets | Foreign | Foreign Smaller | Global | ||||
| Series | Equity Series | Companies Series | Equity Series | ||||
| $ | 32,812,430 | $ | 48,417,819 | $ | 12,880,072 | $ | 52,248,260 |
Under Section 871(k)(2)(C) of the Code, the Funds hereby report the maximum amount allowable but no less than the following amounts as short term capital gain dividends for purposes of the tax imposed under Section 871(a)(1)(A) of the Code for the fiscal year ended December 31, 2014.
| Emerging Markets | Foreign | Foreign Smaller | Global | |||
| Series | Equity Series | Companies Series | Equity Series | |||
| $ — | $ | 55,583,258 | $ | 3,455,764 | $ | 6,632,686 |
Under Section 854(b)(1)(A) of the Code, the Funds hereby report the following percentage amounts of the ordinary income dividends as income qualifying for the dividends received deduction for the fiscal year ended December 31, 2014.
| Emerging Markets | Foreign | Foreign Smaller | Global | ||
| Series | Equity Series | Companies Series | Equity Series | ||
| 1.18 | % | —% | —% | 11.26 | % |
Under Section 854(b)(1)(B) of the Code, the Funds hereby report the maximum amount allowable but no less than the following amounts as qualified dividends for purposes of the maximum rate under Section 1(h)(11) of the Code for the fiscal year ended December 31, 2014.
| Emerging Markets | Foreign | Foreign Smaller | Global | ||||
| Series | Equity Series | Companies Series | Equity Series | ||||
| $ | 2,282,052 | $ | 234,641,785 | $ | 18,011,955 | $ | 12,215,846 |
Distributions, including qualified dividend income, paid during calendar year 2014 will be reported to shareholders on Form 1099-DIV by mid-February 2015. Shareholders are advised to check with their tax advisors for information on the treatment of these amounts on their individual income tax returns.
At December 31, 2014, more than 50% of the Funds’ total assets were invested in securities of foreign issuers. In most instances, foreign taxes were withheld from income paid to the Funds on these investments. As shown in the table below, the Funds hereby report to shareholders the foreign source income and foreign taxes paid, pursuant to Section 853 of the Code. This written statement will allow shareholders of record on December 22, 2014, to treat their proportionate share of foreign taxes paid by the Funds as having been paid directly by them. The shareholder shall consider these amounts as foreign taxes paid in the tax year in which they receive the Fund distribution.
ftinstitutional.com
Annual Report
| 69
TEMPLETON INSTITUTIONAL FUNDS
TAX INFORMATION (UNAUDITED)
The following table provides a detailed analysis of foreign tax paid, foreign source income, and foreign source qualified dividends as reported by the Funds, to shareholders of record.
| Foreign Tax Paid | Foreign Source | Foreign Source Qualified | ||||
| Class | Per Share | Income Per Share | Dividends Per Share | |||
| Emerging Markets Series | ||||||
| Fund Shares | $ | 0.0201 | $ | 0.2002 | $ | 0.0856 |
| Foreign Equity Series | ||||||
| Primary Shares | $ | 0.0637 | $ | 0.8406 | $ | 0.6666 |
| Service Shares | $ | 0.0637 | $ | 0.8110 | $ | 0.6433 |
| Foreign Smaller Companies Series | ||||||
| Fund Shares | $ | 0.0483 | $ | 0.2740 | $ | 0.1664 |
| Global Equity Series | ||||||
| Fund Shares | $ | 0.0245 | $ | 0.2209 | $ | 0.1511 |
Foreign Tax Paid Per Share (Column 1) is the amount per share available to you, as a tax credit (assuming you held your shares in the Fund for a minimum of 16 days during the 31-day period beginning 15 days before the ex-dividend date of the Fund’s distribution to which the foreign taxes relate), or, as a tax deduction.
Foreign Source Income Per Share (Column 2) is the amount per share of income dividends attributable to foreign securities held by the Fund, plus any foreign taxes withheld on these dividends. The amounts reported include foreign source qualified dividends that have not been adjusted for the rate differential applicable to such dividend income.1
Foreign Source Qualified Dividends Per Share (Column 3) is the amount per share of foreign source qualified dividends, plus any foreign taxes withheld on these dividends. These amounts represent the portion of the Foreign Source Income reported to you in column 2 that were derived from qualified foreign securities held by the Fund.1
By mid-February 2015, shareholders will receive Form 1099-DIV which will include their share of taxes paid and foreign source income distributed during the calendar year 2014. The Foreign Source Income reported on Form 1099-DIV has not been adjusted for the rate differential on foreign source qualified dividend income. Shareholders are advised to check with their tax advisors for information on the treatment of these amounts on their 2014 individual income tax returns.
1Qualified dividends are taxed at reduced long term capital gains tax rates. In determining the amount of foreign tax credit that may be applied against the U.S. tax liability of individuals receiving foreign source qualified dividends, adjustments may be required to the foreign tax credit limitation calculation to reflect the rate differential applicable to such dividend income. The rules however permit certain individuals to elect not to apply the rate differential adjustments for capital gains and/or dividends for any taxable year. Please consult your tax advisor and the instructions to Form 1116 for more information.
70 | Annual Report
ftinstitutional.com
TEMPLETON INSTITUTIONAL FUNDS
| Board Members and Officers | ||||
| The name, year of birth and address of the officers and board members, as well as their affiliations, positions held with the | ||||
| Fund, principal occupations during at least the past five years and number of U.S. registered portfolios overseen in the Franklin | ||||
| Templeton Investments fund complex are shown below. Generally, each board member serves until that person’s successor is | ||||
| elected and qualified. | ||||
| Independent Board Members | ||||
| Number of Portfolios in | ||||
| Name, Year of Birth | Length of | Fund Complex Overseen | Other Directorships Held During | |
| and Address | Position | Time Served | by Board Member* | at Least the Past 5 Years |
| Harris J. Ashton (1932) | Trustee | Since 1992 | 137 | Bar-S Foods (meat packing company) |
| 300 S.E. 2nd Street | (1981-2010). | |||
| Fort Lauderdale, FL 33301-1923 | ||||
| Principal Occupation During at Least the Past 5 Years: | ||||
| Director of various companies; and formerly, Director, RBC Holdings, Inc. (bank holding company) (until 2002); and President, Chief | ||||
| Executive Officer and Chairman of the Board, General Host Corporation (nursery and craft centers) (until 1998). | ||||
| Ann Torre Bates (1958) | Trustee | Since 2008 | 36 | Navient Corporation (loan |
| 300 S.E. 2nd Street | management, servicing and asset | |||
| Fort Lauderdale, FL 33301-1923 | recovery) (May 2014), Ares Capital | |||
| Corporation (specialty finance | ||||
| company) (2010-present), United | ||||
| Natural Foods, Inc. (distributor of | ||||
| natural, organic and specialty foods) | ||||
| (2013-present), Allied Capital | ||||
| Corporation (financial services) | ||||
| (2003-2010) and SLM Corporation | ||||
| (Sallie Mae) (1997-2014). | ||||
| Principal Occupation During at Least the Past 5 Years: | ||||
| Director of various companies; and formerly, Executive Vice President and Chief Financial Officer, NHP Incorporated (manager of multifamily | ||||
| housing) (1995-1997); and Vice President and Treasurer, US Airways, Inc. (until 1995). | ||||
| Frank J. Crothers (1944) | Trustee | Since 1990 | 26 | Talon Metals Corp. (mining |
| 300 S.E. 2nd Street | exploration), Fortis, Inc. (utility holding | |||
| Fort Lauderdale, FL 33301-1923 | company) and AML Foods Limited | |||
| (retail distributors). | ||||
| Principal Occupation During at Least the Past 5 Years: | ||||
| Director and Vice Chairman, Caribbean Utilities Company, Ltd.; director of various other private business and nonprofit organizations; and | ||||
| formerly, Chairman, Atlantic Equipment and Power Ltd. (1977-2003). | ||||
| Edith E. Holiday (1952) | Lead | Trustee since | 137 | Hess Corporation (exploration and |
| 300 S.E. 2nd Street | Independent | 1996 and Lead | refining of oil and gas), H.J. Heinz | |
| Fort Lauderdale, FL 33301-1923 | Trustee | Independent | Company (processed foods and allied | |
| Trustee since | products) (1994-2013), RTI | |||
| 2007 | International Metals, Inc. (manufacture | |||
| and distribution of titanium), Canadian | ||||
| National Railway (railroad) and White | ||||
| Mountains Insurance Group, Ltd. | ||||
| (holding company). | ||||
| Principal Occupation During at Least the Past 5 Years: | ||||
| Director or Trustee of various companies and trusts; and formerly, Assistant to the President of the United States and Secretary of the | ||||
| Cabinet (1990-1993); General Counsel to the United States Treasury Department (1989-1990); and Counselor to the Secretary and Assistant | ||||
| Secretary for Public Affairs and Public Liaison – United States Treasury Department (1988-1989). | ||||
ftinstitutional.com Annual Report | 71
TEMPLETON INSTITUTIONAL FUNDS
| Independent Board Members (continued) | |||||
| Number of Portfolios in | |||||
| Name, Year of Birth | Length of | Fund Complex Overseen | Other Directorships Held During | ||
| and Address | Position | Time Served | by Board Member* | at Least the Past 5 Years | |
| J. Michael Luttig (1954) | Trustee | Since 2009 | 137 | Boeing Capital Corporation (aircraft | |
| 300 S.E. 2nd Street | financing) (2006-2013). | ||||
| Fort Lauderdale, FL 33301-1923 | |||||
| Principal Occupation During at Least the Past 5 Years: | |||||
| Executive Vice President, General Counsel and member of the Executive Council, The Boeing Company (aerospace company); and formerly, | |||||
| Federal Appeals Court Judge, U.S. Court of Appeals for the Fourth Circuit (1991-2006). | |||||
| David W. Niemiec (1949) | Trustee | Since 2005 | 33 | Emeritus Corporation (assisted | |
| 300 S.E. 2nd Street | living) (1999-2010) and OSI | ||||
| Fort Lauderdale, FL 33301-1923 | Pharmaceuticals, Inc. (pharmaceutical | ||||
| products) (2006-2010). | |||||
| Principal Occupation During at Least the Past 5 Years: | |||||
| Advisor, Saratoga Partners (private equity fund); and formerly, Managing Director, Saratoga Partners (1998-2001) and SBC Warburg Dillon | |||||
| Read (investment banking) (1997-1998); Vice Chairman, Dillon, Read & Co. Inc. (investment banking) (1991-1997); and Chief Financial | |||||
| Officer, Dillon, Read & Co. Inc. (1982-1997). | |||||
| Frank A. Olson (1932) | Trustee | Since 2003 | 137 | Hess Corporation (exploration and | |
| 300 S.E. 2nd Street | refining of oil and gas) (1998-2013). | ||||
| Fort Lauderdale, FL 33301-1923 | |||||
| Principal Occupation During at Least the Past 5 Years: | |||||
| Director of various companies; and formerly, Chairman of the Board, The Hertz Corporation (car rental) (1980-2000) and Chief Executive | |||||
| Officer (1977-1999); and Chairman of the Board, President and Chief Executive Officer, UAL Corporation (airlines) (June-December 1987). | |||||
| Larry D. Thompson (1945) | Trustee | Since 2005 | 137 | Cbeyond, Inc. (business | |
| 300 S.E. 2nd Street | communications provider) | ||||
| Fort Lauderdale, FL 33301-1923 | (2010-2012), The Southern Company | ||||
| (energy company) (December 2014; | |||||
| previously 2010-2012) and Graham | |||||
| Holdings Company (education and | |||||
| media organization) (2011-present). | |||||
| Principal Occupation During at Least the Past 5 Years: | |||||
| Executive Vice President – Government Affairs, General Counsel and Corporate Secretary, PepsiCo, Inc. (consumer products) (2012-present); | |||||
| and formerly, John A. Sibley Professor of Corporate and Business Law, University of Georgia School of Law (2011-2012); Senior Vice | |||||
| President – Government Affairs, General Counsel and Secretary, PepsiCo, Inc. (2004-2011); Senior Fellow of The Brookings Institution | |||||
| (2003-2004); Visiting Professor, University of Georgia School of Law (2004); and Deputy Attorney General, U.S. Department of Justice | |||||
| (2001-2003). | |||||
| Constantine D. Tseretopoulos Trustee | Since 1990 | 26 | None | ||
| (1954 | ) | ||||
| 300 S.E. 2nd Street | |||||
| Fort Lauderdale, FL 33301-1923 | |||||
| Principal Occupation During at Least the Past 5 Years: | |||||
| Physician, Chief of Staff, owner and operator of the Lyford Cay Hospital (1987-present); director of various nonprofit organizations; and | |||||
| formerly, Cardiology Fellow, University of Maryland (1985-1987); and Internal Medicine Resident, Greater Baltimore Medical Center | |||||
| (1982-1985). | |||||
| Robert E. Wade (1946) | Trustee | Since 2007 | 43 | El Oro Ltd (investments). | |
| 300 S.E. 2nd Street | |||||
| Fort Lauderdale, FL 33301-1923 | |||||
| Principal Occupation During at Least the Past 5 Years: | |||||
| Attorney at law engaged in private practice (1972-2008) and member of various boards. | |||||
72 | Annual Report ftinstitutional.com
TEMPLETON INSTITUTIONAL FUNDS
| Interested Board Members and Officers | ||||
| Number of Portfolios in | ||||
| Name, Year of Birth | Length of | Fund Complex Overseen | Other Directorships Held During | |
| and Address | Position | Time Served | by Board Member* | at Least the Past 5 Years |
| **Gregory E. Johnson (1961) | Trustee | Since 2007 | 147 | None |
| One Franklin Parkway | ||||
| San Mateo, CA 94403-1906 | ||||
| Principal Occupation During at Least the Past 5 Years: | ||||
| Chairman of the Board, Member - Office of the Chairman, Director, President and Chief Executive Officer, Franklin Resources, Inc.; officer | ||||
| and/or director or trustee, as the case may be, of some of the other subsidiaries of Franklin Resources, Inc. and of 44 of the investment | ||||
| companies in Franklin Templeton Investments; and Vice Chairman, Investment Company Institute. | ||||
| **Rupert H. Johnson, Jr. (1940) | Chairman of | Chairman of the | 137 | None |
| One Franklin Parkway | the Board, | Board and | ||
| San Mateo, CA 94403-1906 | Trustee and | Trustee since | ||
| Vice President | 2013, and Vice | |||
| President since | ||||
| 1996 | ||||
| Principal Occupation During at Least the Past 5 Years: | ||||
| Vice Chairman, Member – Office of the Chairman and Director, Franklin Resources, Inc.; Director, Franklin Advisers, Inc.; Senior Vice | ||||
| President, Franklin Advisory Services, LLC; and officer and/or director or trustee, as the case may be, of some of the other subsidiaries of | ||||
| Franklin Resources, Inc. and of 43 of the investment companies in Franklin Templeton Investments. | ||||
| Alison E. Baur (1964) | Vice President | Since 2012 | Not Applicable | Not Applicable |
| One Franklin Parkway | ||||
| San Mateo, CA 94403-1906 | ||||
| Principal Occupation During at Least the Past 5 Years: | ||||
| Deputy General Counsel, Franklin Templeton Investments; and officer of some of the other subsidiaries of Franklin Resources, Inc. and of 46 | ||||
| of the investment companies in Franklin Templeton Investments. | ||||
| Norman J. Boersma (1957) | President and | Since 2012 | Not Applicable | Not Applicable |
| Lyford Cay | Chief Executive | |||
| Nassau, Bahamas | Officer – | |||
| Investment | ||||
| Management | ||||
| Principal Occupation During at Least the Past 5 Years: | ||||
| Director, President and Chief Executive Officer, Templeton Global Advisors Ltd.; Chief Investment Officer of Templeton Global Equity Group; | ||||
| officer of six of the investment companies in Franklin Templeton Investments; and formerly, Executive Vice President, Franklin Templeton | ||||
| Investments Corp. (1993-2014). | ||||
| Laura F. Fergerson (1962) | Chief Executive Since 2009 | Not Applicable | Not Applicable | |
| One Franklin Parkway | Officer – | |||
| San Mateo, CA 94403-1906 | Finance and | |||
| Administration | ||||
| Principal Occupation During at Least the Past 5 Years: | ||||
| Senior Vice President, Franklin Templeton Services, LLC; and officer of 46 of the investment companies in Franklin Templeton Investments. | ||||
| Aliya S. Gordon (1973) | Vice President | Since 2009 | Not Applicable | Not Applicable |
| One Franklin Parkway | ||||
| San Mateo, CA 94403-1906 | ||||
| Principal Occupation During at Least the Past 5 Years: | ||||
| Senior Associate General Counsel, Franklin Templeton Investments; officer of 46 of the investment companies in Franklin Templeton | ||||
| Investments; and formerly, Litigation Associate, Steefel, Levitt & Weiss, LLP (2000-2004). | ||||
ftinstitutional.com Annual Report | 73
TEMPLETON INSTITUTIONAL FUNDS
| Interested Board Members and Officers (continued) | ||||
| Number of Portfolios in | ||||
| Name, Year of Birth | Length of | Fund Complex Overseen | Other Directorships Held During | |
| and Address | Position | Time Served | by Board Member* | at Least the Past 5 Years |
| Steven J. Gray (1955) | Vice President | Since 2009 | Not Applicable | Not Applicable |
| One Franklin Parkway | ||||
| San Mateo, CA 94403-1906 | ||||
| Principal Occupation During at Least the Past 5 Years: | ||||
| Senior Associate General Counsel, Franklin Templeton Investments; Vice President, Franklin Templeton Distributors, Inc. and Franklin | ||||
| Alternative Strategies Advisers, LLC; and officer of 46 of the investment companies in Franklin Templeton Investments. | ||||
| Selena L. Holmes (1965) | Vice President | Since 2012 | Not Applicable | Not Applicable |
| 100 Fountain Parkway | – AML | |||
| St. Petersburg, FL 33716-1205 | Compliance | |||
| Principal Occupation During at Least the Past 5 Years: | ||||
| Director, Global Compliance Monitoring; Chief Compliance Officer, Franklin Alternative Strategies Advisers, LLC; Vice President, Franklin | ||||
| Templeton Companies, LLC; and officer of 46 of the investment companies in Franklin Templeton Investments. | ||||
| Mark Mobius (1936) | Vice President | Since 1993 | Not Applicable | Not Applicable |
| 17th Floor, | ||||
| The Chater House | ||||
| 8 Connaught Road Central | ||||
| Hong Kong | ||||
| Principal Occupation During at Least the Past 5 Years: | ||||
| Portfolio Manager of various Templeton advisory affiliates; Executive Chairman, Templeton Emerging Markets Group; and officer and/or | ||||
| director, as the case may be, of some of the other subsidiaries of Franklin Resources, Inc. and of six of the investment companies in Franklin | ||||
| Templeton Investments. | ||||
| Kimberly H. Novotny (1972) | Vice President | Since 2013 | Not Applicable | Not Applicable |
| 300 S.E. 2nd Street | ||||
| Fort Lauderdale, FL 33301-1923 | ||||
| Principal Occupation During at Least the Past 5 Years: | ||||
| Associate General Counsel, Franklin Templeton Investments; Vice President and Secretary, Fiduciary Trust International of the South; Vice | ||||
| President, Templeton Investment Counsel, LLC; Assistant Secretary, Franklin Resources, Inc.; and officer of 46 of the investment companies | ||||
| in Franklin Templeton Investments. | ||||
| Mark H. Otani (1968) | Treasurer, | Since 2009 | Not Applicable | Not Applicable |
| One Franklin Parkway | Chief Financial | |||
| San Mateo, CA 94403-1906 | Officer and | |||
| Chief Accounting | ||||
| Officer | ||||
| Principal Occupation During at Least the Past 5 Years: | ||||
| Director, Global Fund Accounting Operations, Franklin Templeton Investments; and officer of 14 of the investment companies in Franklin | ||||
| Templeton Investments. | ||||
| Robert C. Rosselot (1960) | Chief | Since 2013 | Not Applicable | Not Applicable |
| 300 S.E. 2nd Street | Compliance | |||
| Fort Lauderdale, FL 33301-1923 | Officer | |||
| Principal Occupation During at Least the Past 5 Years: | ||||
| Director, Global Compliance, Franklin Templeton Investments; Vice President, Franklin Templeton Companies, LLC; officer of 46 of the | ||||
| investment companies in Franklin Templeton Investments; and formerly, Senior Associate General Counsel, Franklin Templeton Investments | ||||
| (2007-2013); and Secretary and Vice President, Templeton Group of Funds (2004-2013). | ||||
74 | Annual Report ftinstitutional.com
TEMPLETON INSTITUTIONAL FUNDS
| Interested Board Members and Officers (continued) | ||||
| Number of Portfolios in | ||||
| Name, Year of Birth | Length of | Fund Complex Overseen | Other Directorships Held During | |
| and Address | Position | Time Served | by Board Member* | at Least the Past 5 Years |
| Karen L. Skidmore (1952) | Vice President | Since 2009 | Not Applicable | Not Applicable |
| One Franklin Parkway | ||||
| San Mateo, CA 94403-1906 | ||||
| Principal Occupation During at Least the Past 5 Years: | ||||
| Senior Associate General Counsel, Franklin Templeton Investments; and officer of 46 of the investment companies in Franklin Templeton | ||||
| Investments. | ||||
| Craig S. Tyle (1960) | Vice President | Since 2005 | Not Applicable | Not Applicable |
| One Franklin Parkway | ||||
| San Mateo, CA 94403-1906 | ||||
| Principal Occupation During at Least the Past 5 Years: | ||||
| General Counsel and Executive Vice President, Franklin Resources, Inc.; and officer of some of the other subsidiaries of Franklin Resources, | ||||
| Inc. and of 46 of the investment companies in Franklin Templeton Investments. | ||||
| Lori A. Weber (1964) | Secretary and | Secretary since | Not Applicable | Not Applicable |
| 300 S.E. 2nd Street | Vice President | 2013 and Vice | ||
| Fort Lauderdale, FL 33301-1923 | President since | |||
| 2011 | ||||
| Principal Occupation During at Least the Past 5 Years: | ||||
| Senior Associate General Counsel, Franklin Templeton Investments; Assistant Secretary, Franklin Resources, Inc.; Vice President and | ||||
| Secretary, Templeton Investment Counsel, LLC; Vice President, Fiduciary Trust International of the South; and officer of 46 of the investment | ||||
| companies in Franklin Templeton Investments. | ||||
*We base the number of portfolios on each separate series of the U.S. registered investment companies within the Franklin Templeton Investments fund complex.
These portfolios have a common investment manager or affiliated investment managers.
**Gregory E. Johnson is considered to be an interested person of the Fund under the federal securities laws due to his position as an officer and director of Franklin
Resources, Inc. (Resources), which is the parent company of the Fund’s investment manager and distributor. Rupert H. Johnson, Jr. is considered to be an interested
person of the Fund under the federal securities laws due to his position as officer and director and major shareholder of Resources.
Note 1: Rupert H. Johnson, Jr. is the uncle of Gregory E. Johnson.
Note 2: Officer information is current as of the date of this report. It is possible that after this date, information about officers may change.
The Sarbanes-Oxley Act of 2002 and Rules adopted by the U.S. Securities and Exchange Commission require the Fund to disclose whether the Fund’s Audit
Committee includes at least one member who is an audit committee financial expert within the meaning of such Act and Rules. The Fund’s Board has determined
that there is at least one such financial expert on the Audit Committee and has designated each of Ann Torre Bates and David W. Niemiec as an audit committee
financial expert. The Board believes that Ms. Bates and Mr. Niemiec qualify as such an expert in view of their extensive business background and experience.
She currently serves as a director of Navient Corporation (May 2014), Ares Capital Corporation and United Natural Foods, Inc. and was formerly a director of SLM
Corporation from 1997 to 2014 and Allied Capital Corporation from 2003 to 2010, Executive Vice President and Chief Financial Officer of NHP Incorporated and
Vice President and Treasurer of US Airways, Inc. Mr. Niemiec has served as a member of the Fund Audit Committee since 2005, currently serves as an Advisor to
Saratoga Partners and was formerly its Managing Director from 1998 to 2001. Mr. Niemiec is a former director of Emeritus Corporation from 1999 to 2010 and OSI
Pharmaceuticals, Inc. from 2006 to 2010, Managing Director of SBC Warburg Dillon Read from 1997 to 1998, and was Vice Chairman from 1991 to 1997 and Chief
Financial Officer from 1982 to 1997 of Dillon, Read & Co. Inc. As a result of such background and experience, the Board believes that Ms. Bates and Mr. Niemiec
have each acquired an understanding of generally accepted accounting principles and financial statements, the general application of such principles in connec-
tion with the accounting estimates, accruals and reserves, and analyzing and evaluating financial statements that present a breadth and level of complexity of
accounting issues generally comparable to those of the Fund, as well as an understanding of internal controls and procedures for financial reporting and an
understanding of audit committee functions. Ms. Bates and Mr. Niemiec are independent Board members as that term is defined under the applicable U.S.
Securities and Exchange Commission Rules and Releases.
The Statement of Additional Information (SAI) includes additional information about the board members and is available, without charge, upon request.
Shareholders may call (800) 321-8563 to request the SAI.
ftinstitutional.com Annual Report | 75
TEMPLETON INSTITUTIONAL FUNDS
Shareholder Information
Proxy Voting Policies and Procedures
The Funds’ investment managers have established Proxy Voting Policies and Procedures (Policies) that the Funds use to determine how to vote proxies relating to portfolio securities. Shareholders may view the Funds’ complete Policies online at franklintempleton.com. Alternatively, shareholders may request copies of the Policies free of charge by calling the Proxy Group collect at (954) 527-7678 or by sending a written request to: Franklin Templeton Companies, LLC, 300 S.E. 2nd Street, Fort Lauderdale, FL 33301, Attention: Proxy Group. Copies of the Funds’ proxy voting records are also made available online at franklintempleton.com and posted on the U.S. Securities and Exchange Commission’s website at sec.gov and reflect the most recent 12-month period ended June 30.
Quarterly Statement of Investments
The Funds file a complete statement of investments with the U.S. Securities and Exchange Commission for the first and third quarters for each fiscal year on Form N-Q. Shareholders may view the filed Form N-Q by visiting the Commission’s website at sec.gov. The filed form may also be viewed and copied at the Commission’s Public Reference Room in Washington, DC. Information regarding the operations of the Public Reference Room may be obtained by calling (800) SEC-0330.
Householding of Reports and Prospectuses
You will receive each Fund’s financial reports every six months as well as an annual updated summary prospectus (prospectus available upon request). To reduce Fund expenses, we try to identify related shareholders in a household and send only one copy of the financial reports and summary prospectus. This process, called “householding,” will continue indefinitely unless you instruct us otherwise. If you prefer not to have these documents householded, please call us at (800) 321-8563. At any time you may view current prospectuses/summary prospectuses and financial reports on our website. If you choose, you may receive these documents through electronic delivery.
76 | Annual Report
ftinstitutional.com

Annual Report
Templeton Institutional Funds
Investment Managers
Templeton Asset Management Ltd.
Templeton Investment Counsel, LLC
Distributor
Franklin Templeton Distributors, Inc.
Shareholder Services
(800) 321-8563
ftinstitutional.com
Authorized for distribution only when accompanied or preceded by a summary prospectus and/or prospectus. Investors should carefully consider a fund’s investment goals, risks, charges and expenses before investing. A prospectus contains this and other information; please read it carefully before investing.
To help ensure we provide you with quality service, all calls to and from our service areas are monitored and/or recorded.
| © 2015 Franklin Templeton Investments. All rights reserved. | ZTIF A 02/15 |
Item 2. Code of Ethics.
(a) The Registrant has adopted a code of ethics that applies to its principal executive officers and principal financial and accounting officer.
(c) N/A
(d) N/A
(f) Pursuant to Item 12(a)(1), the Registrant is attaching as an exhibit a copy of its code of ethics that applies to its principal executive officers and principal financial and accounting officer.
Item 3. Audit Committee Financial Expert.
(a)(1) The Registrant has an audit committee financial expert serving on its audit committee.
(2) The audit committee financial expert is David W. Niemiec and he is "independent" as defined under the relevant Securities and Exchange Commission Rules and Releases.
Item 4. Principal Accountant Fees and Services.
(a) Audit Fees
The aggregate fees paid to the principal accountant for professional services rendered by the principal accountant for the audit of the registrant’s annual financial statements or for services that are normally provided by the principal accountant in connection with statutory and regulatory filings or engagements were $181,454 for the fiscal year ended December 31, 2014 and $180,771 for the fiscal year ended December 31, 2013.
(b) Audit-Related Fees
The aggregate fees paid to the principal accountant for assurance and related services rendered by the principal accountant to the registrant that are reasonably related to the performance of the audit of the registrant's financial statements and are not reported under paragraph (a) of Item 4 were $2,894 for the fiscal year ended December 31, 2014 and $2,894 for the fiscal year ended December 31, 2013. The services for which these fees were paid included attestation services.
There were no fees paid to the principal accountant for assurance and related services rendered by the principal accountant to the registrant's investment adviser and any entity controlling, controlled by or under common control with the investment adviser that provides ongoing services to the registrant that are reasonably related to the performance of the audit of their financial statements.
(c) Tax Fees
There were no fees paid to the principal accountant for professional services rendered by the principal accountant to the registrant for tax compliance, tax advice and tax planning.
The aggregate fees paid to the principal accountant for professional services rendered by the principal accountant to the registrant’s investment adviser and any entity controlling, controlled by or under common control with the investment adviser that provides ongoing services to the registrant for tax compliance, tax advice and tax planning were $0 for the fiscal year ended December 31, 2014 and $6,930 for the fiscal year ended December 31, 2013. The services for which these fees were paid included technical tax consultation for capital gain tax and withholding tax reporting for foreign governments and requirements on local country’s self-certification forms.
(d) All Other Fees
The aggregate fees paid to the principal accountant for products and services rendered by the principal accountant to the registrant not reported in paragraphs (a)-(c) of Item 4 were $2,695 for the fiscal year ended December 31, 2014 and $0 for the fiscal year ended December 31, 2013. The services for which these fees were paid include review of materials provided to the fund Board in connection with the investment management contract renewal process.
The aggregate fees paid to the principal accountant for products and services rendered by the principal accountant to the registrant’s investment adviser and any entity controlling, controlled by or under common control with the investment adviser that provides ongoing services to the registrant other than services reported in paragraphs (a)-(c) of Item 4 were $162,986 for the fiscal year ended December 31, 2014 and $44,069 for the fiscal year ended December 31, 2013. The services for which these fees were paid included preparation and review of materials provided to the fund Board in connection with the investment management contract renewal process and certifying asset under management.
(e) (1) The registrant’s audit committee is directly responsible for approving the services to be provided by the auditors, including:
(i) pre-approval of all audit and audit related services;
(ii) pre-approval of all non-audit related services to be provided to the Fund by the auditors;
(iii) pre-approval of all non-audit related services to be provided to the registrant by the auditors to the registrant’s investment adviser or to any entity that controls, is controlled by or is under common control with the registrant’s investment adviser and that provides ongoing services to the registrant where the non-audit services relate directly to the operations or financial reporting of the registrant; and
(iv) establishment by the audit committee, if deemed necessary or appropriate, as an alternative to committee pre-approval of services to be provided by the auditors, as required by paragraphs (ii) and (iii) above, of policies and procedures to permit such services to be pre-approved by other means, such as through establishment of guidelines or by action of a designated member or members of the committee; provided the policies and procedures are detailed as to the particular service and the committee is informed of each service and such policies and procedures do not include delegation of audit committee responsibilities, as contemplated under the Securities Exchange Act of 1934, to management; subject, in the case of (ii) through (iv), to any waivers, exceptions or exemptions that may be available under applicable law or rules.
(e) (2) None of the services provided to the registrant described in paragraphs (b)-(d) of Item 4 were approved by the audit committee pursuant to paragraph (c)(7)(i)(C) of Rule 2-01 of regulation S-X.
(f) No disclosures are required by this Item 4(f).
(g) The aggregate non-audit fees paid to the principal accountant for services rendered by the principal accountant to the registrant and the registrant’s investment adviser and any entity controlling, controlled by or under common control with the investment adviser that provides ongoing services to the registrant were $168,575 for the fiscal year ended December 31, 2014 and $53,893 for the fiscal year ended December 31, 2013.
(h) The registrant’s audit committee of the board has considered whether the provision of non-audit services that were rendered to the registrant’s investment adviser (not including any sub-adviser whose role is primarily portfolio management and is subcontracted with or overseen by another investment adviser), and any entity controlling, controlled by, or under common control with the investment adviser that provides ongoing services to the registrant that were not pre-approved pursuant to paragraph (c)(7)(ii) of Rule 2-01 of Regulation S-X is compatible with maintaining the principal accountant’s independence.
Item 5. Audit Committee of Listed Registrants. N/A
Item 6. Schedule of Investments. N/A
Item 7. Disclosure of Proxy Voting Policies and Procedures for
Closed-End Management Investment Companies. N/A
Item 8. Portfolio Managers of Closed-End Management Investment Companies. N/A
Item 9. Purchases of Equity Securities by Closed-End Management Investment Company and Affiliated Purchasers. N/A
Item 10. Submission of Matters to a Vote of Security Holders.
There have been no changes to the procedures by which shareholders may recommend nominees to the Registrant's Board of Trustees that would require disclosure herein.
Item 11. Controls and Procedures.
(a) Evaluation of Disclosure Controls and Procedures. The Registrant maintains disclosure controls and procedures that are designed to ensure that information required to be disclosed in the Registrant’s filings under the Securities Exchange Act of 1934 and the Investment Company Act of 1940 is recorded, processed, summarized and reported within the periods specified in the rules and forms of the Securities and Exchange Commission. Such information is accumulated and communicated to the Registrant’s management, including its principal executive officer and principal financial officer, as appropriate, to allow timely decisions regarding required disclosure. The Registrant’s management, including the principal executive officer and the principal financial officer, recognizes that any set of controls and procedures, no matter how well designed and operated, can provide only reasonable assurance of achieving the desired control objectives.
Within 90 days prior to the filing date of this Shareholder Report on Form N-CSR, the Registrant had carried out an evaluation, under the supervision and with the participation of the Registrant’s management, including the Registrant’s principal executive officer and the Registrant’s principal financial officer, of the effectiveness of the design and operation of the Registrant’s disclosure controls and procedures. Based on such evaluation, the Registrant’s principal executive officer and principal financial officer concluded that the Registrant’s disclosure controls and procedures are effective.
(b) Changes in Internal Controls. There have been no changes in the Registrant’s internal controls or in other factors that could materially affect the internal controls over financial reporting subsequent to the date of their evaluation in connection with the preparation of this Shareholder Report on Form N-CSR.
Item 12. Exhibits.
(a)(1) Code of Ethics
(a)(2) Certifications pursuant to Section 302 of the Sarbanes-Oxley Act of 2002 of Laura F. Fergerson, Chief Executive Officer - Finance and Administration, and Mark H. Otani, Chief Financial Officer and Chief Accounting Officer
(b) Certifications pursuant to Section 906 of the Sarbanes-Oxley Act of 2002 of Laura F. Fergerson, Chief Executive Officer - Finance and Administration, and Mark H. Otani, Chief Financial Officer and Chief Accounting Officer
SIGNATURES
Pursuant to the requirements of the Securities Exchange Act of 1934 and the Investment Company Act of 1940, the registrant has duly caused this report to be signed on its behalf by the undersigned, thereunto duly authorized.
TEMPLETON INSTITUTIONAL FUNDS
By /s/ LAURA F. FERGERSON
Laura F. Fergerson
Chief Executive Officer –
Finance and Administration
Date February 26, 2015
Pursuant to the requirements of the Securities Exchange Act of 1934 and the Investment Company Act of 1940, this report has been signed below by the following persons on behalf of the registrant and in the capacities and on the dates indicated.
By /s/ LAURA F. FERGERSON
Laura F. Fergerson
Chief Executive Officer –
Finance and Administration
Date February 26, 2015
By /s/ MARK H. OTANI
Mark H. Otani
Chief Financial Officer and
Chief Accounting Officer
Date February 26, 2015