UNITED STATES
SECURITIES AND EXCHANGE COMMISSION
Washington, DC 20549
FORM N-CSR
CERTIFIED SHAREHOLDER REPORT OF REGISTERED MANAGEMENT INVESTMENT COMPANIES
Investment Company Act file number 811-06135
Templeton Institutional Funds
(Exact name of registrant as specified in charter)
300 S.E. 2nd Street, Fort Lauderdale, FL 33301-1923
(Address of principal executive offices) Zip code)
Craig S. Tyle, One Franklin Parkway, San Mateo, CA 94403-1906
(Name and address of agent for service)
Registrant's telephone number, including area code: (954) 527-7500_
Date of fiscal year end: _12/31__
Date of reporting period: 12/31/16_
Item 1. Reports to Stockholders.
Annual Report
December 31, 2016
Templeton Institutional Funds
Franklin Templeton Investments
Visit ftinstitutional.com for fund updates, to
access your account, or to find investment
insights.
Not FDIC Insured | May Lose Value | No Bank Guarantee
ftinstitutional.com
Not part of the annual report 1
Annual Report
Economic and Market Overview
The global economy grew moderately during the 12-month period despite slower growth in some countries. In this environment, global developed and emerging market stocks, as measured by the MSCI All Country World Index, rose. Global markets were aided by accommodative monetary policies of various global central banks, improved commodity prices after 2016’s first quarter, finalization of Greece’s new debt deal and generally encouraging global economic data. Further supporting markets were expectations of higher interest rates and inflation in the U.S., driven by talk of expansionary fiscal policies under new U.S. president Donald Trump, and an Organization of the Petroleum Exporting Countries deal to curb oil production. However, these factors were partially offset by a slowdown in China’s economy and declining commodity prices early in the period, geopolitical tensions in certain regions, uncertainty about the U.S. Federal Reserve’s (Fed’s) timing for raising interest rates and worries about the health of European banks. In addition, global economic concerns and the U.K.’s historic referendum to leave the European Union (also known as “Brexit”) contributed to volatility in global stock markets.
The U.S. economy grew in 2016 despite a general decline in private inventory and business investments, which partly offset strength in consumer spending, residential investment and government spending. Manufacturing conditions remained volatile but generally expanded. The services sector also grew for most of the period, contributing to new jobs that helped the unemployment rate decrease from 5.0% in December 2015 to 4.7% at period-end.1 Retail sales generally rose, as did home sales and prices amid declining mortgage rates. At its December meeting, the Fed increased its target range for the federal funds rate to 0.50%–0.75%, as policymakers cited an improvement in U.S. labor markets and higher inflation. The Federal Open Market Committee also hinted at three additional hikes in 2017, and the Fed raised its 2017 U.S. economic growth forecast, while lowering its unemployment projections.
In Europe, the U.K.’s annualized economic growth accelerated in 2016’s second half, driven by gross fixed capital formation in the third quarter and manufacturing and services in the fourth quarter. Immediate effects of the Brexit vote in June materialized as U.K. stocks declined significantly, the British pound hit a three-decade low amid intensified selling and the U.K.’s credit rating was downgraded. In the eurozone, despite investor concerns about banking sector weakness, low corporate earnings and post-Brexit politics, some regions
benefited from rising consumer spending, resulting from a cheaper euro, low inflation and signs of sustained economic growth. The eurozone grew slightly early in the period, aided by lower oil prices, improved exports and the European Central Bank’s (ECB’s) accommodative monetary policy. However, growth moderated in 2016’s second quarter and improved in the third and fourth quarters. After declining in the beginning of 2016, the eurozone’s annual inflation rate increased gradually to reach its highest reading in three years toward period-end, ending at an estimated 1.1% in December. The ECB cut its benchmark interest rate and expanded its massive bond-buying program in March and August 2016 to boost the region’s slowing growth. Furthermore, at its December meeting, the ECB extended the continuation of its monthly asset purchases from March to December of 2017, but it agreed to scale back the purchase amount beginning in April 2017.
In Asia, Japan’s quarterly gross domestic product grew slower in the third quarter than in the second and first quarters, mainly due to declines in private non-residential and public investments. In January 2016, the Bank of Japan (BOJ) introduced negative interest rates on excess reserves held by financial institutions with the central bank to boost lending and help achieve its inflation target. In July 2016, Japan’s Prime Minister Shinzo Abe announced a higher-than-expected fiscal stimulus to revive the economy, followed by an additional monetary stimulus announcement by the BOJ. The BOJ kept its interest rates unchanged toward period-end; however, it overhauled its monetary policy in September to focus on yield-curve control. The bank further announced that it adjusted its Japanese government bond purchases to maintain the 10-year rate for these bonds near 0%.
In emerging markets, economic growth generally moderated during the period. Brazil’s economy continued to be in recession and the country’s central bank cut its benchmark interest rate in October and November 2016 to spur economic growth. Russia’s economic contraction eased in 2016, following a rebound in oil prices and improved industrial production. The Bank of Russia reduced its key interest rates in June and September of 2016 to revive its economy. China’s economy grew at a stable rate in the first three quarters of 2016 and expanded slightly faster in the fourth quarter, as full-year 2016 growth remained within the government’s targeted range. However, the People’s Bank of China employed monetary easing measures that included cutting the cash reserve
1. Source: Bureau of Labor Statistics.
2 Annual Report
ftinstitutional.com
TEMPLETON INSTITUTIONAL FUNDS
ECONOMIC AND MARKET OVERVIEW
requirement ratio for the country’s banks and effectively
devaluing the Chinese currency against the U.S. dollar. In
India, economic growth marginally increased from July
through September 2016 due to slower private consumption
growth and increased government spending. Overall, emerging
market stocks, as measured by the MSCI Emerging Markets
Index, rose during the period.
The foregoing information reflects our analysis and opinions as of
December 31, 2016. The information is not a complete analysis of
every aspect of any market, country, industry, security or fund.
Statements of fact are from sources considered reliable.
ftinstitutional.com
Annual Report
3
Emerging Markets Series
We are pleased to bring you Emerging Markets Series’ (Fund’s) annual report for the fiscal year ended December 31, 2016.
Your Fund’s Goal and Main Investments
The Fund seeks long-term capital growth. Under normal market conditions, the Fund invests at least 80% of its net assets in securities issued by “emerging market companies,” as defined in the Fund’s prospectus.
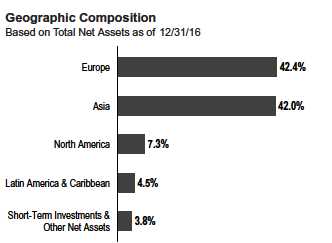
Geographic Composition
Based on Total Net Assets as of 12/31/16

Performance Overview
The Fund delivered a +19.45% cumulative total return for the 12 months under review. In comparison, the Standard & Poor’s®/ International Finance Corporation Investable (S&P®/IFCI) Composite Index generated a +10.78% total return, and the MSCI Emerging Markets (EM) Index posted a total return of +11.60% during the same period.1 The indexes measure global emerging market stock performance. Please note, index performance information is provided for reference and we do not attempt to track an index but rather undertake investments on the basis of fundamental research. The Fund’s return reflects the effect of fees and expenses for professional management, while an index does not have such costs. In addition, an index is not subject to investment flows while the Fund is subject to purchases and redemptions that could impact performance. You can find the Fund’s long-term performance data in the Performance Summary beginning on page 7.
Performance data represent past performance, which does not guarantee future results. Investment return and principal value will fluctuate, and you may have a gain or loss when you sell your shares. Current performance may differ from figures shown. For most recent month-end performance, go to ftinstitutional.com or call a Franklin Templeton Institutional Services representative at (800) 321-8563.
Investment Strategy
Our investment strategy employs a fundamental research, value-oriented, long-term approach. We focus on the market price of a company’s securities relative to our evaluation of the company’s long-term earnings, asset value and cash flow potential. We also consider a company’s profit and loss outlook, balance sheet strength, cash flow trends and asset value in relation to the current price. Our analysis considers the company’s corporate governance behavior as well as its position in its sector, the economic framework and political environment.
Manager’s Discussion
During the 12 months under review, key contributors to the Fund’s absolute performance included Banco Bradesco, Taiwan Semiconductor Manufacturing Co. (TSMC) and Samsung Electronics.
Banco Bradesco is one of Brazil’s largest financial conglomerates. It operates across a wide range of segments, including asset management, insurance, wholesale banking, full retail operations, credit cards, and general corporate and personal lending. Banco Bradesco announced above-consensus third-quarter results and also benefited from improved sentiment in Brazil as investors cheered the impeachment of Dilma Rousseff and welcomed Michel Temer as the country’s official president. Investors were also encouraged by the approval of key reforms and the central bank’s monetary easing efforts to stimulate economic growth.
TSMC is the world’s largest independent integrated circuit foundry. Based in Taiwan, it produces a wide variety of semiconductors on an outsourced basis for other companies in the technology hardware industry. Its products are used in computers and other consumer electronics. Early in the period, the company announced better-than-expected results, aided by
1. Source: Morningstar.
The indexes are unmanaged and include reinvestment of any income or distributions. They do not reflect any fees, expenses or sales charges. One cannot invest directly in an
index, and an index is not representative of the Fund’s portfolio.
The dollar value, number of shares or principal amount, and names of all portfolio holdings are listed in the Fund’s Statement of Investments (SOI).
The SOI begins on page 35.
4 Annual Report
ftinstitutional.com
EMERGING MARKETS SERIES
low- and mid-end smartphone demand. Development in new areas, such as computing, also led investors to adopt a positive view on the company.
| Top 10 Countries | ||
| 12/31/16 | ||
| % of Total | ||
| Net Assets | ||
| China | 19.0 | % |
| South Korea | 16.0 | % |
| Taiwan | 12.1 | % |
| India | 9.0 | % |
| South Africa | 8.0 | % |
| Brazil | 5.1 | % |
| Indonesia | 5.0 | % |
| Thailand | 4.4 | % |
| Russia | 4.2 | % |
| U.K. | 4.1 | % |
Samsung Electronics is a major South Korea-based manufacturer of consumer electronics. It is one of the world’s largest manufacturers of mobile phones, smartphones, tablets and televisions. Its shares rose over the period, helped by the company’s solid earnings. However, the company suffered a setback during the year after implementing a global recall and ultimately discontinuing production of Galaxy Note 7 smartphones. Despite the anticipated costs associated with the incident, its shares recovered in late 2016 amid investor expectations that fourth-quarter earnings would grow significantly compared to a year earlier, due to strong demand for memory chips and a rebound in display and smartphone operations. Further supporting investor sentiment were share buybacks, expectations for higher dividends and the company’s efforts to improve its governance structure.
In contrast, key detractors from the Fund’s absolute performance included China Life Insurance, Fila Korea and Baidu.
China Life Insurance is one of China’s largest life insurance companies. Disappointing first-half 2016 earnings, mainly due to lower investment income and a change in the discount rate of traditional portfolio reserve calculation, combined with investor concerns about a lower interest-rate environment and the Chinese renminbi’s depreciation, impacted the company’s share price in the first half of the reporting period. However, share price performance rebounded in the latter part of 2016, supported by solid third-quarter earnings growth, resulting from better investment performance, especially domestic
A-share equity investment. However, the late recovery was insufficient to fully offset the earlier decline.
| Top 10 Holdings | ||
| 12/31/16 | ||
| Company | % of Total | |
| Sector/Industry, Country | Net Assets | |
| Brilliance China Automotive Holdings Ltd. | 7.0 | % |
| Automobiles, China | ||
| Taiwan Semiconductor Manufacturing Co. Ltd. | 6.6 | % |
| Semiconductors & Semiconductor Equipment, Taiwan | ||
| Samsung Electronics Co. Ltd. | 6.6 | % |
| Technology Hardware, Storage & Peripherals, | ||
| South Korea | ||
| Naspers Ltd. | 5.7 | % |
| Media, South Africa | ||
| Tencent Holdings Ltd. | 4.5 | % |
| Internet Software & Services, China | ||
| Unilever PLC | 4.1 | % |
| Personal Products, U.K. | ||
| Astra International Tbk PT | 3.1 | % |
| Automobiles, Indonesia | ||
| Hon Hai Precision Industry Co. Ltd. | 2.7 | % |
| Electronic Equipment, Instruments & Components, | ||
| Taiwan | ||
| Itau Unibanco Holding SA | 2.4 | % |
| Banks, Brazil | ||
| ICICI Bank Ltd. | 2.3 | % |
| Banks, India |
Fila Korea is a South Korean sporting goods manufacturer that produces a wide variety of products, including footwear, clothing and accessories. The company reported disappointing third-quarter results, driven by losses in its South Korean operations. A major driver of Fila’s share price was its stake in Acushnet, which makes golf equipment and accessories under the Titleist and FootJoy brands. In late 2016, Acushnet listed its shares in the U.S., but the lower-than-expected initial public offering price had a negative impact on Fila’s shares. During this process, Fila added to its existing holding in Acushnet.
Baidu is China’s leading Internet search platform and provider of online marketing solutions. The company also operates an e-commerce platform with an online payment tool, develops and markets web application software, provides entertainment products, and provides human resources-related services. Its shares fell early in the period after the company was criticized for misleading users with search results, leading the Chinese government to institute new Internet regulations. Third-quarter earnings exceeded market expectations, but weaker-than-expected fourth-quarter guidance weighed on investor sentiment. Chinese Internet stocks also generally declined late in the year following the U.S. presidential election, as many
ftinstitutional.com Annual Report 5
EMERGING MARKETS SERIES
investors were concerned that the incoming president’s potential anti-globalization stance could hamper the operating environment for Chinese technology companies.
During the period, our continued search for what we considered undervalued investments with attractive fundamentals led us to increase the Fund’s holdings in Russia, Hungary and Saudi Arabia2 and initiate exposure to Kenya. In sector terms, we increased holdings in materials and initiated exposure to utilities.3 Key purchases included new investments in Alibaba, China’s biggest e-commerce company; Saudi Basic Industries,2 one of the world’s largest petrochemical producers; and IMAX, a U.S.-listed leading global entertainment technology company specializing in immersive motion picture technologies.
Conversely, we reduced the Fund’s holdings in Brazil, India and South Africa, as well as emerging market companies listed in Belgium and the U.K., to focus on opportunities we considered to be more attractively valued within our investment universe. In sector terms, we made some sales in information technology (IT) and reduced holdings in consumer staples and financials.4 Key sales included trimming the Fund’s positions in the aforementioned Banco Bradesco; Unilever, a U.K.-listed global consumer products company with significant emerging markets operations; and Tata Consultancy Services, an Indian IT consulting and services company.
Thank you for your continued participation in Emerging Markets Series. We look forward to serving your future investment needs.
The foregoing information reflects our analysis, opinions and portfolio
holdings as of December 31, 2016, the end of the reporting period.
The way we implement our main investment strategies and the
resulting portfolio holdings may change depending on factors such as
market and economic conditions. These opinions may not be relied
upon as investment advice or an offer for a particular security. The
information is not a complete analysis of every aspect of any market,
country, industry, security or the Fund. Statements of fact are from
sources considered reliable, but the investment manager makes no
representation or warranty as to their completeness or accuracy.
Although historical performance is no guarantee of future results,
these insights may help you understand our investment management
philosophy.
2. Investments were made through participatory notes, which are equity access products structured as debt obligations and are issued or backed by banks and broker-dealers
and designed to replicate equity market exposure in markets where direct investment is either impossible or difficult due to local investment restrictions.
3. The materials sector comprises chemicals, construction materials, and metals and mining in the SOI. The utilities sector comprises gas utilities in the SOI.
4. The IT sector comprises electronic equipment, instruments and components; Internet software and services; IT services; semiconductors and semiconductor equipment;
software; and technology hardware, storage and peripherals in the SOI. The consumer staples sector comprises beverages, food and staples retailing, food products and
personal products in the SOI. The financials sector comprises banks, diversified financial services and insurance in the SOI.
See www.franklintempletondatasources.com for additional data provider information.
6 Annual Report ftinstitutional.com
EMERGING MARKETS SERIES
Performance Summary as of December 31, 2016
The performance table and graph do not reflect any taxes that a shareholder would pay on Fund dividends, capital gain distributions, if any, or any realized gains on the sale of Fund shares. Total return reflects reinvestment of the Fund’s dividends and capital gain distributions, if any, and any unrealized gains or losses.
| Performance as of 12/31/161 | ||||
| Cumulative | Average Annual | |||
| Total Return2 | Total Return3 | |||
| 1-Year | +19.45 | % | +19.45 | % |
| 5-Year | +3.93 | % | +0.77 | % |
| 10-Year | +12.43 | % | +1.18 | % |
Performance data represent past performance, which does not guarantee future results. Investment return and principal value will fluctuate, and you may have a gain or loss when you sell your shares. Current performance may differ from figures shown. For most recent month-end performance, go to ftinstitutional.com or call a Franklin Templeton Institutional Services representative at (800) 321-8563.
See page 9 for Performance Summary footnotes.
ftinstitutional.com
Annual Report
7
EMERGING MARKETS SERIES
PERFORMANCE SUMMARY
Total Return Index Comparison for a Hypothetical $1,000,000 Investment1
Total return represents the change in value of an investment over the periods shown. It includes any applicable maximum sales charge, Fund expenses, account fees and reinvested distributions. The unmanaged indexes include reinvestment of any income or distributions. They differ from the Fund in composition and do not pay management fees or expenses. One cannot invest directly in an index.

See page 9 for Performance Summary footnotes.
8 Annual Report ftinstitutional.com
EMERGING MARKETS SERIES
PERFORMANCE SUMMARY
| Total Annual Operating Expenses5 | |||
| With Waiver | Without Waiver | ||
| 1.21 | % | 1.34 | % |
All investments involve risks, including possible loss of principal. Special risks are associated with foreign investing, including currency fluctuations, economic
instability and political developments. Investments in emerging markets, of which frontier markets are a subset, involve heightened risks related to the same
factors, in addition to those associated with these markets’ smaller size, lesser liquidity and lack of established legal, political, business and social frameworks to
support securities markets. Because these frameworks are typically even less developed in frontier markets, as well as various factors including the increased
potential for extreme price volatility, illiquidity, trade barriers and exchange controls, the risks associated with emerging markets are magnified in frontier markets.
The Fund’s ability to invest in smaller company securities that may have limited liquidity involves additional risks, such as relatively small revenues, limited
product lines and small market share. Historically, these stocks have exhibited greater price volatility than larger company stocks, especially over the short term.
The Fund is actively managed but there is no guarantee that the manager’s investment decisions will produce the desired results. The Fund’s prospectus also
includes a description of the main investment risks.
1. The Fund has an expense reduction contractually guaranteed through 4/30/17. The Fund also has a fee waiver associated with any investments it makes in a Franklin
Templeton money fund and/or other Franklin Templeton fund, contractually guaranteed through its current fiscal year-end. Fund investment results reflect the expense reduction
and fee waiver; without these reductions, the results would have been lower.
2. Cumulative total return represents the change in value of an investment over the periods indicated.
3. Average annual total return represents the average annual change in value of an investment over the periods indicated. Return for less than one year, ifany,hasnotbeen
annualized.
4. Source: Morningstar. The MSCI EM Index is a free float-adjusted, market capitalization-weighted index designed to measure equity market performance of global emerging
markets. The S&P/IFCI Composite Index is a free float-adjusted, market capitalization-weighted index designed to measure equity performance of global emerging markets.
5. Figures are as stated in the Fund’s current prospectus and may differ from the expense ratios disclosed in the Your Fund’s Expenses and Financial Highlights sections in this
report. In periods of market volatility, assets may decline significantly, causing total annual Fund operating expenses to become higher than the figures shown.
See www.franklintempletondatasources.com for additional data provider information.
ftinstitutional.com
Annual Report
9
EMERGING MARKETS SERIES
Your Fund’s Expenses
As a Fund shareholder, you can incur two types of costs: (1) transaction costs, including sales charges (loads) on Fund purchases and redemptions, if applicable; and (2) ongoing Fund costs, including management fees, distribution and service (12b-1) fees, if applicable, and other Fund expenses. All mutual funds have ongoing costs, sometimes referred to as operating expenses. The table below shows ongoing costs of investing in the Fund and can help you understand these costs and compare them with those of other mutual funds. The table assumes a $1,000 investment held for the six months indicated.
Actual Fund Expenses
The table below provides information about actual account values and actual expenses in the columns under the heading “Actual.” In these columns the Fund’s actual return, which includes the effect of Fund expenses, is used to calculate the “Ending Account Value.” You can estimate the expenses you paid during the period by following these steps (of course, your account value and expenses will differ from those in this illustration): Divide your account value by $1,000 (if your account had an $8,600 value, then $8,600 ÷ $1,000 = 8.6). Then multiply the result by the number in the row for your class of shares under the headings “Actual” and “Expenses Paid During Period” (if Actual Expenses Paid During Period were $7.50, then 8.6 x $7.50 = $64.50). In this illustration, the actual expenses paid this period are $64.50.
Hypothetical Example for Comparison with Other Funds
Under the heading “Hypothetical” in the table, information is provided about hypothetical account values and hypothetical expenses based on the Fund’s actual expense ratio and an assumed rate of return of 5% per year before expenses, which is not the Fund’s actual return. This information may not be used to estimate the actual ending account balance or expenses you paid for the period, but it can help you compare ongoing costs of investing in the Fund with those of other funds. To do so, compare this 5% hypothetical example for the class of shares you hold with the 5% hypothetical examples that appear in the shareholder reports of other funds.
Please note that expenses shown in the table are meant to highlight ongoing costs and do not reflect any transactional costs. Therefore, information under the heading “Hypothetical” is useful in comparing ongoing costs only, and will not help you compare total costs of owning different funds. In addition, if transactional costs were included, your total costs would have been higher.
| Actual | Hypothetical | ||||||||||
| (actual return after expenses) | (5% annual return before expenses) | ||||||||||
| Expenses | Expenses | Net | |||||||||
| Beginning | Ending | Paid During | Ending | Paid During | Annualized | ||||||
| Account | Account | Period | Account | Period | Expense | ||||||
| Value 7/1/16 | Value 12/31/16 | 7/1/16–12/31/161,2 | Value 12/31/16 | 7/1/16–12/31/161,2 | Ratio2 | ||||||
| $ | 1,000 | $ | 1,073.90 | $ | 7.04 | $ | 1,018.35 | $ | 6.85 | 1.35 | % |
1. Expenses are equal to the annualized expense ratio for the six-month period as indicated above–in the far right column–multiplied by the simple average account value
over the period indicated, and then multiplied by 184/366 to reflect the one-half year period.
2. Reflects expenses after fee waivers and expense reimbursements. Does not include acquired fund fees and expenses.
10 Annual Report ftinstitutional.com
Foreign Smaller Companies Series
This annual report for Foreign Smaller Companies Series (Fund) covers the fiscal year ended December 31, 2016. Effective at the market close on December 10, 2013, the Fund closed to new investors. Existing shareholders may add to their accounts. We believe this closure will help us manage the inflow of assets and allow us to effectively manage our current level of assets.
Your Fund’s Goal and Main Investments
The Fund seeks long-term capital growth. Under normal market conditions, the Fund invests at least 80% of its net assets in investments of smaller companies located outside the U.S., including emerging markets.
Performance Overview
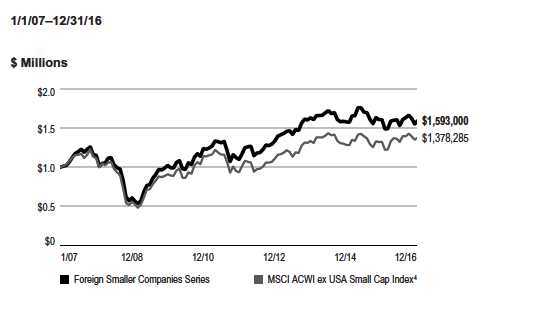
The Fund had a -0.85% cumulative total return for the 12 months under review. In comparison, the MSCI All Country World Index (ACWI) ex USA Small Cap Index, which measures performance of global developed and emerging market small-cap equities, excluding the U.S., posted a +4.29% total return.1 Please note, index performance information is provided for reference and we do not attempt to track the index but rather undertake investments on the basis of fundamental research. You can find the Fund’s long-term performance data in the Performance Summary beginning on page 14.
Performance data represent past performance, which does not guarantee future results. Investment return and principal value will fluctuate, and you may have a gain or loss when you sell your shares. Current performance may differ from figures shown. For most recent month-end performance, go to ftinstitutional.com or call a Franklin Templeton Institutional Services representative at (800) 321-8563.
Investment Strategy
When choosing equity investments, we apply a bottom-up, value-oriented, long-term approach, focusing on the market price of a company’s securities relative to our evaluation of the company’s long-term (typically five years) earnings, asset value and cash flow potential. We also consider a company’s price/earnings ratio, profit margins, liquidation value and other factors.
Manager’s Discussion
Several holdings performed well and contributed to the Fund’s absolute performance during the 12 months under review. M Dias Branco has a 60-year history in Brazil, where it started as a regional bakery in the Northeast and gradually developed and acquired brands. Today, the company is the market leader in cookies and crackers, as well as pasta. Its shares rose during the period due to strong financial results. We believe the company’s market-leading brands and the significant competitive advantages it has developed by vertically integrating and slowly developing a distribution network across Brazil will lead to strong performance over our long-term investment horizon.
AAC Technologies Holdings is a leading acoustic component maker specializing in miniature receivers/speakers and microphones. Its shares rose during the period due to strong growth guidance from company management. Our outlook for the company remains positive. Despite a very sharp deceleration in smartphone sales and a shrinking tablet market, AAC has successfully captured another component market with its commanding share in haptics (vibrating motors used in touch screen applications), which we believe will contribute significantly to future growth.
VTech Holdings, a Hong Kong-listed communications equipment company, is one of the world’s largest manufacturers and distributors of cordless phones and electronic learning products (ELPs). Its shares recovered from
1. Source: Morningstar.
The index is unmanaged and includes reinvestment of any income or distributions. It does not reflect any fees, expenses or sales charges. One cannot invest directly in an
index, and an index is not representative of the Fund’s portfolio.
See www.franklintempletondatasources.com for additional data provider information.
The dollar value, number of shares or principal amount, and names of all portfolio holdings are listed in the Fund’s Statement of Investments (SOI).
The SOI begins on page 40.
ftinstitutional.com Annual Report 11
FOREIGN SMALLER COMPANIES SERIES
the decline following the completed acquisition of U.S. company LeapFrog Enterprises. In our long-term view, VTech appears well positioned in scale and cost competitiveness to maintain its leading position in the U.S. and expand sales in Europe and Asia. We believe new ELP platform launches will drive growth as VTech benefits from the “age compression” trend, whereby its preschool-focused products appeal to children at a younger age. In our analysis, the company’s high dividend payout, which company management indicated would likely increase, combined with a high return on equity and an absence of debt, could support its shares.
| Portfolio Composition | ||
| 12/31/16 | ||
| % of Total | ||
| Sector/Industry | Net Assets | |
| Machinery | 11.9 | % |
| Electronic Equipment, Instruments & Components | 6.5 | % |
| Textiles, Apparel & Luxury Goods | 6.1 | % |
| Capital Markets | 6.1 | % |
| Leisure Products | 6.0 | % |
| Household Durables | 4.1 | % |
| Banks | 3.9 | % |
| Energy Equipment & Services | 3.7 | % |
| Real Estate Management & Development | 3.4 | % |
| Specialty Retail | 3.0 | % |
| Construction & Engineering | 2.8 | % |
| Food Products | 2.7 | % |
| Pharmaceuticals | 2.6 | % |
| Professional Services | 2.6 | % |
| Auto Components | 2.6 | % |
| Containers & Packaging | 2.5 | % |
| Personal Products | 2.3 | % |
| Technology Hardware, Storage & Peripherals | 2.2 | % |
| Other | 21.1 | % |
| Short-Term Investments & Other Net Assets | 3.8 | % |
In contrast, several holdings detracted from the Fund’s absolute returns. Greggs is a vertically integrated U.K. retail baker and a leading player in the take-away sandwich and savories market. Its shares were impacted by the U.K.’s decision in a June referendum to leave the European Union (EU), also known as “Brexit,” which surprised many investors and resulted in a brief but intense period of global equity market declines and heightened volatility. Looking past the Brexit fallout, we are pleased to see company management executing well on its turnaround strategy and believe it will benefit Greggs’ revenue without significant increases in store count.
Shares of Dutch engineering firm Arcadis fell after the company reported a worse-than-expected earnings decline and
| Top 10 Holdings | ||
| 12/31/16 | ||
| Company | % of Total | |
| Sector/Industry, Country | Net Assets | |
| Aalberts Industries NV | 2.0 | % |
| Machinery, Netherlands | ||
| Gerresheimer AG | 1.9 | % |
| Life Sciences Tools & Services, Germany | ||
| Amer Sports OYJ | 1.9 | % |
| Leisure Products, Finland | ||
| Tsumura & Co. | 1.9 | % |
| Pharmaceuticals, Japan | ||
| Interpump Group SpA | 1.8 | % |
| Machinery, Italy | ||
| MEITEC Corp. | 1.8 | % |
| Professional Services, Japan | ||
| Rational AG | 1.8 | % |
| Machinery, Germany | ||
| The Thule Group AB | 1.8 | % |
| Leisure Products, Sweden | ||
| Asics Corp. | 1.8 | % |
| Textiles, Apparel & Luxury Goods, Japan | ||
| Huhtamaki OYJ | 1.7 | % |
| Containers & Packaging, Finland |
warned of Brexit-related uncertainty into 2017. The company earned a portion of its revenue in Britain in 2016. In the long term, we believe the depressed stock price reflects too much pessimism. In our view, headwinds such as Brexit are real but more than priced in to the stock, and Arcadis continues to offer compelling long-term value.
Laird, a supplier of products such as “shark fin” antennae for wireless connections and electromagnetic interference (EMI) shielding for Apple’s iPhones and iPads, was another significant detractor, as its shares were also hurt by Brexit concerns. The cross-selling of EMI antennae and thermal products has been a key driver for Laird in the last few years. We believe that the company’s two recent acquisitions could bring further opportunities to cross-sell products to key customers.
It is important to recognize the effect of currency movements on the Fund’s performance. In general, if the value of the U.S. dollar goes up compared with a foreign currency, an investment traded in that foreign currency will go down in value because it will be worth fewer U.S. dollars. This can have a negative effect on Fund performance. Conversely, when the U.S. dollar weakens in relation to a foreign currency, an investment traded in that foreign currency will increase in value, which can contribute to Fund performance. For the 12 months ended December 31, 2016, the U.S. dollar rose in value relative to
12 Annual Report ftinstitutional.com
FOREIGN SMALLER COMPANIES SERIES
most currencies. As a result, the Fund’s performance was negatively affected by the portfolio’s investment predominantly in securities with non-U.S. currency exposure.
Thank you for your continued participation in Foreign Smaller Companies Series. We look forward to serving your future investment needs.

The foregoing information reflects our analysis, opinions and portfolio
holdings as of December 31, 2016, the end of the reporting period.
The way we implement our main investment strategies and the
resulting portfolio holdings may change depending on factors such as
market and economic conditions. These opinions may not be relied
upon as investment advice or an offer for a particular security. The
information is not a complete analysis of every aspect of any market,
country, industry, security or the Fund. Statements of fact are from
sources considered reliable, but the investment manager makes no
representation or warranty as to their completeness or accuracy.
Although historical performance is no guarantee of future results,
these insights may help you understand our investment management
philosophy.
ftinstitutional.com Annual Report 13
FOREIGN SMALLER COMPANIES SERIES
Performance Summary as of December 31, 2016
The performance table and graph do not reflect any taxes that a shareholder would pay on Fund dividends, capital gain distributions, if any, or any realized gains on the sale of Fund shares. Total return reflects reinvestment of the Fund’s dividends and capital gain distributions, if any, and any unrealized gains or losses.
| Performance as of 12/31/161 | ||||
| Cumulative | Average Annual | |||
| Total Return2 | Total Return3 | |||
| 1-Year | -0.85 | % | -0.85 | % |
| 5-Year | +45.12 | % | +7.73 | % |
| 10-Year | +59.30 | % | +4.77 | % |
Performance data represent past performance, which does not guarantee future results. Investment return and principal value will fluctuate, and you may have a gain or loss when you sell your shares. Current performance may differ from figures shown. For most recent month-end performance, go to ftinstitutional.com or call a Franklin Templeton Institutional Services representative at (800) 321-8563.
See page 16 for Performance Summary footnotes.
14 Annual Report
ftinstitutional.com
FOREIGN SMALLER COMPANIES SERIES
PERFORMANCE SUMMARY
Total Return Index Comparison for a Hypothetical $1,000,000 Investment1
Total return represents the change in value of an investment over the periods shown. It includes any applicable maximum sales charge, Fund expenses, account fees and reinvested distributions. The unmanaged index includes reinvestment of any income or distributions. It differs from the Fund in composition and does not pay management fees or expenses. One cannot invest directly in an index.
See page 16 for Performance Summary footnotes.
ftinstitutional.com Annual Report 15
FOREIGN SMALLER COMPANIES SERIES
PERFORMANCE SUMMARY
| Total Annual Operating Expenses5 | ||
| 0.98 | % |
All investments involve risks, including possible loss of principal. The Fund invests in foreign securities, which can involve exposure to currency volatility and
political, economic and regulatory uncertainty. Emerging markets involve heightened risks related to the same factors, in addition to those associated with their
relatively small size and lesser liquidity. The Fund’s investments in smaller company stocks carry special risks as such stocks have historically exhibited greater
price volatility than large company stocks, particularly over the short term. Additionally, smaller companies often have relatively small revenues, limited product
lines and small market share. The Fund is actively managed but there is no guarantee that the manager’s investment decisions will produce the desired results.
The Fund’s prospectus also includes a description of the main investment risks.
1. The Fund has a fee waiver associated with any investment it makes in a Franklin Templeton money fund and/or other Franklin Templeton fund, contractually guaranteed
through its current fiscal year-end. Fund investment results reflect the fee waiver; without this waiver, the results would have been lower.
2. Cumulative total return represents the change in value of an investment over the periods indicated.
3. Average annual total return represents the average annual change in value of an investment over the periods indicated. Return for less than one year, ifany,hasnotbeen
annualized.
4. Source: Morningstar. The MSCI ACWI ex USA Small Cap Index is a free float-adjusted, market capitalization-weighted index designed to measure performance of small cap
equity securities of global developed and emerging markets, excluding the U.S.
5. Figures are as stated in the Fund’s current prospectus and may differ from the expense ratios disclosed in the Your Fund’s Expenses and Financial Highlights sections in this
report. In periods of market volatility, assets may decline significantly, causing total annual Fund operating expenses to become higher than the figures shown.
See www.franklintempletondatasources.com for additional data provider information.
16 Annual Report ftinstitutional.com
FOREIGN SMALLER COMPANIES SERIES
Your Fund’s Expenses
As a Fund shareholder, you can incur two types of costs: (1) transaction costs, including sales charges (loads) on Fund purchases and redemptions, if applicable; and (2) ongoing Fund costs, including management fees, distribution and service (12b-1) fees, if applicable, and other Fund expenses. All mutual funds have ongoing costs, sometimes referred to as operating expenses. The table below shows ongoing costs of investing in the Fund and can help you understand these costs and compare them with those of other mutual funds. The table assumes a $1,000 investment held for the six months indicated.
Actual Fund Expenses
The table below provides information about actual account values and actual expenses in the columns under the heading “Actual.” In these columns the Fund’s actual return, which includes the effect of Fund expenses, is used to calculate the “Ending Account Value.” You can estimate the expenses you paid during the period by following these steps (of course, your account value and expenses will differ from those in this illustration): Divide your account value by $1,000 (if your account had an $8,600 value, then $8,600 ÷ $1,000 = 8.6). Then multiply the result by the number in the row for your class of shares under the headings “Actual” and “Expenses Paid During Period” (if Actual Expenses Paid During Period were $7.50, then 8.6 x $7.50 = $64.50). In this illustration, the actual expenses paid this period are $64.50.
Hypothetical Example for Comparison with Other Funds
Under the heading “Hypothetical” in the table, information is provided about hypothetical account values and hypothetical expenses based on the Fund’s actual expense ratio and an assumed rate of return of 5% per year before expenses, which is not the Fund’s actual return. This information may not be used to estimate the actual ending account balance or expenses you paid for the period, but it can help you compare ongoing costs of investing in the Fund with those of other funds. To do so, compare this 5% hypothetical example for the class of shares you hold with the 5% hypothetical examples that appear in the shareholder reports of other funds.
Please note that expenses shown in the table are meant to highlight ongoing costs and do not reflect any transactional costs. Therefore, information under the heading “Hypothetical” is useful in comparing ongoing costs only, and will not help you compare total costs of owning different funds. In addition, if transactional costs were included, your total costs would have been higher.
| Actual | Hypothetical | ||||||||||
| (actual return after expenses) | (5% annual return before expenses) | ||||||||||
| Expenses | Expenses | Net | |||||||||
| Beginning | Ending | Paid During | Ending | Paid During | Annualized | ||||||
| Account | Account | Period | Account | Period | Expense | ||||||
| Value 7/1/16 | Value 12/31/16 | 7/1/16–12/31/161,2 | Value 12/31/16 | 7/1/16–12/31/161,2 | Ratio2 | ||||||
| $ | 1,000 | $ | 1,041.30 | $ | 5.08 | $ | 1,020.16 | $ | 5.03 | 0.99 | % |
1. Expenses are equal to the annualized expense ratio for the six-month period as indicated above–in the far right column–multiplied by the simple average account value over the period indicated, and then multiplied by 184/366 to reflect the one-half year period.
2. Reflects expenses after fee waivers and expense reimbursements. Does not include acquired fund fees and expenses.
ftinstitutional.com
Annual Report
17
Global Equity Series
This annual report for Global Equity Series (Fund) covers the fiscal year ended December 31, 2016.
Your Fund’s Goal and Main Investments
The Fund seeks long-term capital growth. Under normal market conditions, the Fund invests at least 80% of its net assets in equity securities of companies located anywhere in the world, including developing markets.
Performance Overview
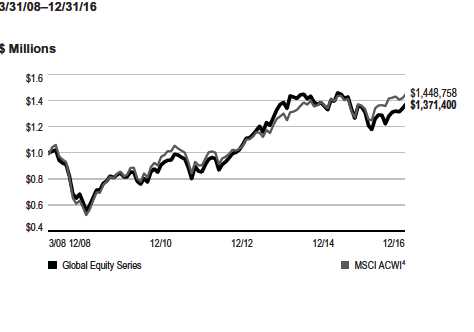
The Fund delivered a +4.67% cumulative total return for the 12 months under review. For comparison, the Fund’s benchmark, the MSCI All Country World Index (ACWI), which measures stock market performance in global developed and emerging markets, generated a total return of +8.49%.1 Please note, index performance information is provided for reference and we do not attempt to track an index but rather undertake investments on the basis of fundamental research. You can find the Fund’s long-term performance data in the Performance Summary beginning on page 22.
Performance data represent past performance, which does not guarantee future results. Investment return and principal value will fluctuate, and you may have a gain or loss when you sell your shares. Current performance may differ from figures shown. For most recent month-end performance, go to ftinstitutional.com or call a Franklin Templeton Institutional Services representative at (800) 321-8563.
Investment Strategy
We employ a bottom-up, value-oriented, long-term investment strategy. Our in-depth fundamental research evaluates a company’s potential to grow earnings, asset value and/or cash flow. We also consider a company’s price/earnings ratio, profit margins and liquidation value.
Manager’s Discussion
The Fund outperformed its benchmark, the MSCI ACWI, strongly in the fourth quarter and second half of the year, but the late gains were insufficient to make up earlier weakness and the portfolio ultimately lagged its benchmark for the full-year

period. Although the Fund delivered absolute gains during the year, the negative effect of the strong U.S. dollar due to the portfolio’s underweighted allocation to the U.S. market accounted for a substantial portion of relative underperfor-mance. The sharp recovery in Fund performance as the year progressed reflected a theme that we have been anticipating and discussing in recent quarters: the growing likelihood of a strong rebound in historically depressed value stocks. Indeed, value delivered one of its best rallies on record toward the end of 2016 as interest rates rose and the market began discounting reflationary expectations following the U.S. presidential election outcome. Many investors were left scrambling to reduce defensive exposure in sectors that we have long argued were expensive, such as consumer staples and utilities, and rotate into depressed cyclical sectors, such as energy and financials, where we have been finding good value opportunities for some time.2
While cyclical sectors offered some of the starkest value opportunities in 2016, our focus on long-term, forward-looking value (as opposed to what we view as backward-looking value metrics represented by benchmarks and indexes) kept us constructive on other less apparent value opportunities. For example, we continued to find compelling bargains in health care, a sector more known for its defensive growth
1. Source: Morningstar.
The index is unmanaged and includes reinvestment of any income or distributions. It does not reflect any fees, expenses or sales charges. One cannot invest directly in an
index, and an index is not representative of the Fund’s portfolio.
2. The consumer staples sector comprises beverages and food and staples retailing in the SOI. The utilities sector comprises multi-utilities in the SOI. The energy sector
comprises energy equipment and services and oil, gas and consumable fuels in the SOI. The financials sector comprises banks, capital markets, consumer finance, diversified
financial services, insurance, and thrifts and mortgage finance in the SOI.
The dollar value, number of shares or principal amount, and names of all portfolio holdings are listed in the Fund’s Statement of Investments (SOI).
The SOI begins on page 46.
18 Annual Report
ftinstitutional.com
GLOBAL EQUITY SERIES
characteristics than cheap near-term valuations.3 This allocation negatively impacted performance during the review period after the sector experienced a sharp and sustained reversal following political criticism from both major political parties during the U.S. election cycle. Although drug pricing in the U.S. market will remain a well-recognized risk, industry fundamentals continue to impress us, characterized by high returns on equity, solid cash flow and earnings growth, and low leverage. Although the broader sector has sold off significantly and features valuations more than one standard deviation below average, both operating profits and forward earnings estimates were down only slightly from their peak. At the stock level, generic drug maker Teva Pharmaceutical Industries was the Fund’s biggest laggard, as its shares declined after analysts downgraded earnings forecasts amid concerns about the sustainability of key drug sales, as well as delays to product launches and the completion of a major acquisition. Yet, our analysis indicates that Teva should remain a steady cash flow generator throughout this transition period, with the ability to pay down debt and support a solid dividend yield.
Financials is another sector where we have seen compelling value in recent years. Although the portfolio’s financials holdings rebounded strongly toward the end of the period as interest rates rose and economic growth expectations improved, the late recovery failed to overcome earlier weakness, and our overweighted sector allocation underperformed in 2016. Weakness was concentrated among the Fund’s European financials holdings, with Italian lender UniCredit and Swiss diversified financials firm Credit Suisse Group, both finishing among the bottom laggards.4 Even after a significant rally off the bottom in the second half of 2016, select European bank shares remain cheap, in our view, with improving earnings catalysts and scope for additional upside over a long-term investment horizon. We also continue to find attractive opportunities in undervalued Asian banks with significant scope for return on equity (ROE) improvement as organic growth opportunities unfold, as well as in select U.S. banks we believe are well-positioned to benefit from a steeper yield curve and diminishing regulatory burden.
It is important to recognize the effect of currency movements on the Fund’s performance. In general, if the value of the U.S. dollar goes up compared with a foreign currency, an investment traded in that foreign currency will go down in value because it will be worth fewer U.S. dollars. This can have a negative effect on Fund performance. Conversely, when the U.S. dollar
weakens in relation to a foreign currency, an investment traded in that foreign currency will increase in value, which can contribute to Fund performance. For the 12 months ended December 31, 2016, the U.S. dollar rose in value relative to most currencies. As a result, the Fund’s performance was negatively affected by the portfolio’s substantial investment securities with non-U.S. currency exposure.
| Portfolio Composition | ||
| 12/31/16 | ||
| % of Total | ||
| Sector/Industry | Net Assets | |
| Banks | 13.1 | % |
| Oil, Gas & Consumable Fuels | 10.4 | % |
| Pharmaceuticals | 9.1 | % |
| Technology Hardware, Storage & Peripherals | 5.5 | % |
| Insurance | 4.4 | % |
| Software | 4.4 | % |
| Biotechnology | 3.6 | % |
| Chemicals | 3.2 | % |
| Media | 3.2 | % |
| Diversified Telecommunication Services | 3.2 | % |
| Internet Software & Services | 2.8 | % |
| Wireless Telecommunication Services | 2.5 | % |
| Energy Equipment & Services | 2.1 | % |
| Other | 29.3 | % |
| Short-Term Investments & Other Net Assets | 3.2 | % |
Turning to contributors, the Fund’s significantly overweighted energy position benefited from rebounding oil prices and stock selection. Shares of U.S. oilfield services firm Halliburton recovered from a failed bid for a domestic rival and finished the period at a two-year high as firmer oil prices revived earnings expectations.4 U.K. oil major Royal Dutch Shell also rose to the highest level in over a year after reporting quarterly earnings that significantly exceeded analysts’ estimates, aided by higher production from its recent acquisition of BG Group. With the price of oil up over 100% from its low in February 2016, we have seen the most anticipatory parts of the energy sector—namely, the early cycle oilfield services firms and exploration and production companies—outperform the integrated oil producers. This is particularly the case in North America, one of the world’s higher cost oil producers and the region that has benefited most from the Organization of the Petroleum Exporting Countries (OPEC) supply cuts, as well as from the election of a U.S. administration expected to have a light environmental regulatory touch. Our current strategy,
3. The health care sector comprises biotechnology, health care equipment and supplies, health care providers and services, life sciences tools and services, and
pharmaceuticals in the SOI.
4. Not held at period-end.
ftinstitutional.com
Annual Report
19
GLOBAL EQUITY SERIES
therefore, involves selectively reducing exposure to some of the earlier cycle energy stocks with fuller valuations and retaining more modestly valued opportunities among global oil majors, as well as a few exploration and production and service providers outside of North America. The net result is a slightly lower energy allocation going into 2017 than we had during most of 2016, though the broader overweighting remains and is consistent with our expectation for higher oil prices given the vast reductions in industry capital expenditures, a significant decline in the U.S. rig count and OPEC’s recent agreement to curtail a larger-than-expected amount of production.
Elsewhere among resource sectors, stock selection in materials positively contributed, led by Swiss miner and commodities trader Glencore.5 Its shares rebounded from all-time lows during the period as company management restructured and deleveraged against a backdrop of rising commodity prices. At period-end, management announced intentions to reinstate the suspended dividend, capping a remarkable turnaround from earlier distressed levels, in our view. We were actively acquiring the stock amid the turmoil in late 2015, confident in the counter-cyclical characteristics of the firm’s trading business and management’s overall ability to use Glencore’s vast resources and attractive assets to deleverage and appease rating agencies. The company’s shares have quadrupled off the bottom and are now closer to fair value, in our analysis, as the market more fully prices in both the successful balance sheet repair and improving operating fundamentals amid a recovery in key commodities, such as zinc, coal and copper. Industrial metals producers have experienced a full cycle of profit and valuation recovery in less than a year. We have begun to take profits in industrial miners vulnerable to a Chinese demand slowdown and reinvest proceeds into depressed precious metals miners with uncorrelated risk and return characteristics.
Stock selection also benefited the Fund’s modestly underweighted information technology (IT) position, led by South Korean semiconductor and consumer electronics manufacturer Samsung Electronics.6 Its shares rose to a record high in the fourth quarter as the firm recovered from a high-profile product recall and company management partially capitulated to shareholder demands in a strategic update. Samsung remains fundamentally attractive, in our view, with ongoing strength in memory and display, technical and manufacturing leadership across business lines, and a growing
cash balance to help fund the company’s new, shareholder-friendly capital allocation strategy. The Fund also benefited from its significant underweighting in consumer staples. As we have recently noted, the ownership of consumer staples stocks had become the most crowded in the sector’s history and 2016 price-to-earnings ratios relative to the market were expensive and near historical highs. At such extreme price and valuation levels, we argued that assets prized for their perceived “safety” may actually be among the market’s riskiest given their historically high and inverse correlations to interest-rate movement. Such caution proved warranted in the fourth quarter as consumer staples sold off alongside other equity market bond proxies. At approximately one-fourth of the benchmark’s exposure, our underweighted position notably contributed.
Top 10 Holdings
12/31/16
| Company | % of Total | |
| Sector/Industry, Country | Net Assets | |
| Samsung Electronics Co. Ltd. | 2.5 | % |
| Technology Hardware, Storage & Peripherals, | ||
| South Korea | ||
| JPMorgan Chase & Co. | 2.2 | % |
| Banks, U.S. | ||
| BP PLC | 2.1 | % |
| Oil, Gas & Consumable Fuels, U.K. | ||
| Microsoft Corp. | 2.0 | % |
| Software, U.S. | ||
| Citigroup Inc. | 1.9 | % |
| Banks, U.S. | ||
| Alphabet Inc. | 1.9 | % |
| Internet Software & Services, U.S. | ||
| Apple Inc. | 1.8 | % |
| Technology Hardware, Storage & Peripherals, U.S. | ||
| Oracle Corp. | 1.7 | % |
| Software, U.S. | ||
| Royal Dutch Shell PLC | 1.7 | % |
| Oil, Gas & Consumable Fuels, U.K. | ||
| Comcast Corp. | 1.7 | % |
| Media, U.S. |
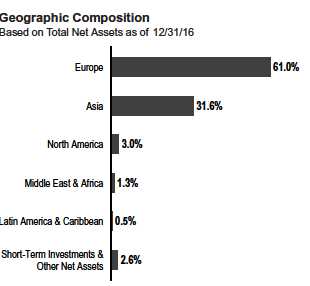
From a geographic standpoint, stock selection overcame an unfavorable overweighting in Asia, aiding the Fund’s performance. We believe China’s economy remains imbalanced and vulnerable to turmoil, though political imperatives and unique safety valves could help maintain stability. Bottom-up values are concentrated among cheap China H-share companies operating in consumer-oriented
5. The materials sector comprises chemicals, construction materials, and metals and mining in the SOI.
6. The IT sector comprises electronic equipment, instruments and components; Internet software and services; semiconductors and semiconductor equipment; software; and technology hardware, storage and peripherals in the SOI.
20 Annual Report
ftinstitutional.com
GLOBAL EQUITY SERIES
growth industries, while we largely avoid the vulnerable and opaque banking sector, state-owned enterprises and the oversupplied industrial complex.7 Elsewhere in the region, we believe Japan and South Korea both remain stockpickers’ markets. South Korea, in particular, looks attractive to us, trading at a lower price-to-book value compared with Japan, while offering a higher average ROE than Japan. Elsewhere, stock selection was insufficient to offset a detractive overweighted allocation in Europe and an underweighted allocation in the U.S. We continue to find what we consider compelling bargains in the eurozone, which we believe remains in the early stages of an expansionary economic cycle and geared to a continued value recovery given high operating leverage, an undervalued currency and low starting-point valuations. Politics and policy have been major headwinds, but they seem to us excessively discounted given continued broad support for the euro and recent gains by political moderates, as well as the strengthening of the European Central Bank as a credible bond market backstop. We are finding fewer bargains in the U.S., a market we believe has priced in a lot of good news in a short period of time. There is no guarantee that a new U.S. presidential administration will be able to successfully engineer the type of reflationary environment that’s becoming increasingly discounted by U.S. stocks, and if it does, it won’t happen overnight. Risks associated with untested leadership may not yet be fully appreciated, and the market looks expensive to us on most major valuation metrics.
As we enter 2017, we note that value is recovering off an extremely low base, and we believe the longer term prospects for our investment philosophy remain attractive. We are watching specifically for any meaningful improvements in corporate earnings, which could drive the next leg of outperformance after an initial period of higher valuation multiples. Conversely, economic and interest-rate normalization represent significant challenges for bondholders with nominally fixed returns. Real assets that can adjust for, or pass through, price increases and sustainably generate cash flows—such as equities—appear to us far better positioned. As the market refocuses on fundamentals, we are confident that this next cycle will again prove the virtue of value-oriented active investors capable of identifying selective bargains and mitigating downside risk over the long term.
Thank you for your continued participation in Global Equity Series. We look forward to serving your future investment needs.
Peter A. Nori, CFA
Antonio T. Docal, CFA
Cindy L. Sweeting, CFA
Portfolio Management Team
The foregoing information reflects our analysis, opinions and portfolio
holdings as of December 31, 2016, the end of the reporting period.
The way we implement our main investment strategies and the
resulting portfolio holdings may change depending on factors such as
market and economic conditions. These opinions may not be relied
upon as investment advice or an offer for a particular security. The
information is not a complete analysis of every aspect of any market,
country, industry, security or the Fund. Statements of fact are from
sources considered reliable, but the investment manager makes no
representation or warranty as to their completeness or accuracy.
Although historical performance is no guarantee of future results,
these insights may help you understand our investment management
philosophy.
CFA® is a trademark owned by CFA Institute.
7. “China H” denotes shares of China-incorporated, Hong Kong Stock Exchange-listed companies with most businesses in China.
See www.franklintempletondatasources.com for additional data provider information.
ftinstitutional.com Annual Report 21
GLOBAL EQUITY SERIES
Performance Summary as of December 31, 2016
The performance table and graph do not reflect any taxes that a shareholder would pay on Fund dividends, capital gain distributions, if any, or any realized gains on the sale of Fund shares. Total return reflects reinvestment of the Fund’s dividends and capital gain distributions, if any, and any unrealized gains or losses.
| Performance as of 12/31/161 | ||||
| Cumulative | Average Annual | |||
| Total Return2 | Total Return3 | |||
| 1-Year | +4.67 | % | +4.67 | % |
| 5-Year | +61.00 | % | +9.99 | % |
| Since Inception (3/31/08) | +37.14 | % | +3.67 | % |
Performance data represent past performance, which does not guarantee future results. Investment return and principal value will fluctuate, and you may have a gain or loss when you sell your shares. Current performance may differ from figures shown. For most recent month-end performance, go to ftinstitutional.com or call a Franklin Templeton Institutional Services representative at (800) 321-8563.
See page 24 for Performance Summary footnotes.
22 Annual Report
ftinstitutional.com
GLOBAL EQUITY SERIES
PERFORMANCE SUMMARY
Total Return Index Comparison for a Hypothetical $1,000,000 Investment1
Total return represents the change in value of an investment over the periods shown. It includes any applicable maximum sales charge, Fund expenses, account fees and reinvested distributions. The unmanaged index includes reinvestment of any income or distributions. It differs from the Fund in composition and does not pay management fees or expenses. One cannot invest directly in an index.
See page 24 for Performance Summary footnotes.
ftinstitutional.com
Annual Report
23
GLOBAL EQUITY SERIES
PERFORMANCE SUMMARY
| Total Annual Operating Expenses5 | ||
| 0.81 | % |
All investments involve risks, including possible loss of principal. Special risks are associated with foreign investing, including currency fluctuations, economic
instability and political developments; investments in emerging markets involve heightened risks related to the same factors. To the extent the Fund focuses on
particular countries, regions, industries, sectors or types of investment from time to time, it may be subject to greater risks of adverse developments in such
areas of focus than a fund that invests in a wider variety of countries, regions, industries, sectors or investments. The Fund is actively managed but there is no
guarantee that the manager’s investment decisions will produce the desired results. The Fund’s prospectus also includes a description of the main investment
risks.
1. The Fund has a fee waiver associated with any investment it makes in a Franklin Templeton money fund and/or other Franklin Templeton fund, contractually guaranteed
through its current fiscal year-end. Fund investment results reflect the fee waiver; without this waiver, the results would have been lower.
2. Cumulative total return represents the change in value of an investment over the periods indicated.
3. Average annual total return represents the average annual change in value of an investment over the periods indicated. Return for less than one year, ifany,hasnotbeen
annualized.
4. Source: Morningstar. The MSCI ACWI is a free float-adjusted, market capitalization-weighted index designed to measure equity market performance of global developed and
emerging markets.
5. Figures are as stated in the Fund’s current prospectus and may differ from the expense ratios disclosed in the Your Fund’s Expenses and Financial Highlights sections in this
report. In periods of market volatility, assets may decline significantly, causing total annual Fund operating expenses to become higher than the figures shown.
See www.franklintempletondatasources.com for additional data provider information.
24 Annual Report ftinstitutional.com
GLOBAL EQUITY SERIES
Your Fund’s Expenses
As a Fund shareholder, you can incur two types of costs: (1) transaction costs, including sales charges (loads) on Fund purchases and redemptions, if applicable; and (2) ongoing Fund costs, including management fees, distribution and service (12b-1) fees, if applicable, and other Fund expenses. All mutual funds have ongoing costs, sometimes referred to as operating expenses. The table below shows ongoing costs of investing in the Fund and can help you understand these costs and compare them with those of other mutual funds. The table assumes a $1,000 investment held for the six months indicated.
Actual Fund Expenses
The table below provides information about actual account values and actual expenses in the columns under the heading “Actual.” In these columns the Fund’s actual return, which includes the effect of Fund expenses, is used to calculate the “Ending Account Value.” You can estimate the expenses you paid during the period by following these steps (of course, your account value and expenses will differ from those in this illustration): Divide your account value by $1,000 (if your account had an $8,600 value, then $8,600 ÷ $1,000 = 8.6). Then multiply the result by the number in the row for your class of shares under the headings “Actual” and “Expenses Paid During Period” (if Actual Expenses Paid During Period were $7.50, then 8.6 x $7.50 = $64.50). In this illustration, the actual expenses paid this period are $64.50.
Hypothetical Example for Comparison with Other Funds
Under the heading “Hypothetical” in the table, information is provided about hypothetical account values and hypothetical expenses based on the Fund’s actual expense ratio and an assumed rate of return of 5% per year before expenses, which is not the Fund’s actual return. This information may not be used to estimate the actual ending account balance or expenses you paid for the period, but it can help you compare ongoing costs of investing in the Fund with those of other funds. To do so, compare this 5% hypothetical example for the class of shares you hold with the 5% hypothetical examples that appear in the shareholder reports of other funds.
Please note that expenses shown in the table are meant to highlight ongoing costs and do not reflect any transactional costs. Therefore, information under the heading “Hypothetical” is useful in comparing ongoing costs only, and will not help you compare total costs of owning different funds. In addition, if transactional costs were included, your total costs would have been higher.
| Actual | Hypothetical | ||||||||||
| (actual return after expenses) | (5% annual return before expenses) | ||||||||||
| Expenses | Expenses | Net | |||||||||
| Beginning | Ending | Paid During | Ending | Paid During | Annualized | ||||||
| Account | Account | Period | Account | Period | Expense | ||||||
| Value 7/1/16 | Value 12/31/16 | 7/1/16–12/31/161,2 | Value 12/31/16 | 7/1/16–12/31/161,2 | Ratio2 | ||||||
| $ | 1,000 | $ | 1,123.90 | $ | 4.54 | $ | 1,020.86 | $ | 4.32 | 0.85 | % |
| 1. Expenses are equal to the annualized expense ratio for the six-month period as indicated above–in the far right column–multiplied by the simple average account value | |||||||||||
| over the period indicated, and then multiplied by 184/366 to reflect the one-half year period. | |||||||||||
| 2. Reflects expenses after fee waivers and expense reimbursements. Does not include acquired fund fees and expenses. | |||||||||||
ftinstitutional.com Annual Report 25
International Equity Series
Formerly, Foreign Equity Series
This annual report for International Equity Series (Fund) covers the fiscal year ended December 31, 2016.
Your Fund’s Goal and Main Investments
The Fund seeks long-term capital growth. Under normal market conditions, the Fund invests at least 80% of its net assets in foreign (non-U.S.) equity securities.
Performance Overview
The Fund’s Primary shares delivered a +1.30% cumulative total return for the 12 months under review. For comparison, the Fund’s benchmark, the MSCI All Country World Index (ACWI) ex USA, which measures stock market performance in global developed and emerging markets excluding the U.S., generated a +5.01% total return for the period under review.1 The Fund’s other benchmark, the MSCI Europe, Australasia, Far East (EAFE) Index, which measures stock market performance in global developed markets excluding the U.S. and Canada, posted a +1.51% total return.1 Please note, index performance information is provided for reference and we do not attempt to track an index but rather undertake investments on the basis of fundamental research. You can find the Fund’s long-term performance data in the Performance Summary beginning on page 30.
Performance data represent past performance, which does not guarantee future results. Investment return and principal value will fluctuate, and you may have a gain or loss when you sell your shares. Current performance may differ from figures shown. For most recent month-end performance, go to ftinstitutional.com or call a Franklin Templeton Institutional Services representative at (800) 321-8563.
Investment Strategy
We employ a bottom-up, value-oriented, long-term investment strategy. We focus on the market price of a company’s securities relative to our evaluation of the company’s long-term earnings, asset value and cash flow potential. We also consider a company’s price/earnings ratio, profit margins and liquidation value.
Manager’s Discussion
The Fund outperformed strongly its benchmark, the MSCI ACWI ex USA, in the fourth quarter and second half of the year, but the late gains were insufficient to make up earlier weakness and the portfolio ultimately lagged its benchmark for the full-year period. Although the Fund delivered absolute gains during the year, the negative effect of a strong U.S. dollar against most currencies accounted for a substantial portion of relative underperformance. The sharp recovery in Fund performance as the year progressed reflected a theme that we have been anticipating and discussing in recent quarters: the growing likelihood of a strong rebound in historically depressed value stocks. Indeed, value delivered one of its best rallies on record toward the end of 2016 as interest rates rose and global equity markets began discounting reflationary expectations following the U.S. presidential election outcome. Many investors were left scrambling to reduce defensive exposure in sectors that we have long argued were expensive, such as consumer staples and utilities, and rotate into depressed cyclical sectors, such as energy and financials, where we have been finding good value opportunities for some time.2
While cyclical sectors offered some of the starkest value opportunities in 2016, our focus on long-term, forward-looking value (as opposed to what we view as the backward-looking
1. Source: Morningstar.
The indexes are unmanaged and include reinvested dividends. They do not reflect any fees, expenses or sales charges. One cannot invest directly in an index, and an index is
not representative of the Fund’s portfolio.
2. The consumer staples sector comprises beverages and food and staples retailing in the SOI. The utilities sector comprises multi-utilities in the SOI. The energy sector
comprises energy equipment and services and oil, gas and consumable fuels in the SOI. The financials sector comprises banks, capital markets, diversified financial services,
insurance, and thrifts and mortgage finance in the SOI.
The dollar value, number of shares or principal amount, and names of all portfolio holdings are listed in the Fund’s Statement of Investments (SOI).
The SOI begins on page 52.
26 Annual Report
ftinstitutional.com
INTERNATIONAL EQUITY SERIES
value metrics represented by benchmarks and indexes) kept us constructive on other less apparent value opportunities as well. For example, we continued to find compelling bargains in health care, a sector more known for its defensive growth characteristics than cheap valuations.3 This allocation negatively impacted performance during the review period after the sector experienced a sharp and sustained reversal following political criticism during the U.S. election cycle. Although drug pricing in the U.S. market will remain a well-recognized risk, industry fundamentals continue to impress us, characterized by high returns on equity, solid cash flow and earnings growth, and low leverage. The broader sector has sold off significantly and features valuations more than one standard deviation below average, though both operating profits and earnings estimates are down only slightly from the peak. At the stock level, generic drug maker Teva Pharmaceutical Industries was the Fund’s biggest laggard, as its shares declined after analysts downgraded earnings forecasts amid concerns about the sustainability of key drug sales, as well as delays to product launches and the completion of a major acquisition. Yet, our analysis indicates that Teva will remain a steady cash flow generator throughout this transition period, with the acquisition enhancing the ability to pay down debt and support a solid dividend yield.
Financials is another sector where we have seen compelling value in recent years. Although the Fund’s financials holdings rebounded strongly toward the end of the period as interest rates rose and economic growth expectations improved, the late recovery failed to overcome earlier weakness and our overweighted sector allocation underperformed in 2016. Weakness was concentrated among the Fund’s European financials holdings, which were pressured by concerns about the U.K.’s exit from the European Union, capital adequacy and broader regional economic headwinds. Yet, despite little fanfare, economic conditions in Europe have been improving, with year-on-year gross domestic product growth in the first and second quarters of 2016 exceeding that of the U.S. in real terms for the first time since 2009. Private loan growth has turned positive, the flagging euro has been becoming a competitive tailwind, and manufacturing indicators have been expanding at a level we believe is consistent with future earnings upgrades. We have also seen the beginnings of self-help measures at European banks, including tighter cost control and more fee- and commission-based profit streams. A softer regulatory touch after years of re-regulation could further support bank shares, and we believe considerable upside
| Portfolio Composition | ||
| 12/31/16 | ||
| % of Total | ||
| Sector/Industry | Net Assets | |
| Banks | 12.6 | % |
| Oil, Gas & Consumable Fuels | 10.8 | % |
| Pharmaceuticals | 10.0 | % |
| Insurance | 7.5 | % |
| Diversified Telecommunication Services | 4.7 | % |
| Technology Hardware, Storage & Peripherals | 4.6 | % |
| Chemicals | 3.5 | % |
| Auto Components | 3.3 | % |
| Wireless Telecommunication Services | 3.3 | % |
| Industrial Conglomerates | 3.0 | % |
| Automobiles | 2.8 | % |
| Energy Equipment & Services | 2.8 | % |
| Construction Materials | 2.7 | % |
| Aerospace & Defense | 2.3 | % |
| Semiconductors & Semiconductor Equipment | 2.2 | % |
| Metals & Mining | 2.1 | % |
| Other | 19.2 | % |
| Short-Term Investments & Other Net Assets | 2.6 | % |
remains over our long-term investment horizon. Even after a significant rally off the bottom in the second half of 2016, select European bank shares remain cheap, in our view, with improving earnings catalysts and scope for additional upside over a longer term investment horizon. Within the Fund, we repositioned our European financial exposure somewhat during 2016 in order to reduce risk and consolidate investments among our highest conviction and highest quality industry holdings. We also continue to find attractive opportunities in undervalued Asian banks with significant scope for return on equity (ROE) improvement as organic growth opportunities unfold.
It is important to recognize the effect of currency movements on the Fund’s performance. In general, if the value of the U.S. dollar goes up compared with a foreign currency, an investment traded in that foreign currency will go down in value because it will be worth fewer U.S. dollars. This can have a negative effect on Fund performance. Conversely, when the U.S. dollar weakens in relation to a foreign currency, an investment traded in that foreign currency will increase in value, which can contribute to Fund performance. For the 12 months ended December 31, 2016, the U.S. dollar rose in value relative to most currencies. As a result, the Fund’s performance was negatively affected by the portfolio’s investment predominantly in securities with non-U.S. currency exposure.
3. The health care sector comprises health care equipment and supplies, health care providers and services, life sciences tools and services, and pharmaceuticals in the SOI.
ftinstitutional.com
Annual Report
27
INTERNATIONAL EQUITY SERIES
| Top 10 Holdings | ||
| 12/31/16 | ||
| Company | % of Total | |
| Sector/Industry, Country | Net Assets | |
| Samsung Electronics Co. Ltd. | 3.1 | % |
| Technology Hardware, Storage & Peripherals, | ||
| South Korea | ||
| BP PLC | 2.9 | % |
| Oil, Gas & Consumable Fuels, U.K. | ||
| Royal Dutch Shell PLC | 2.5 | % |
| Oil, Gas & Consumable Fuels, U.K. | ||
| BNP Paribas SA | 2.2 | % |
| Banks, France | ||
| Roche Holding AG | 2.0 | % |
| Pharmaceuticals, Switzerland | ||
| ING Groep NV | 1.9 | % |
| Banks, Netherlands | ||
| CRH PLC | 1.7 | % |
| Construction Materials, Ireland | ||
| HSBC Holdings PLC | 1.6 | % |
| Banks, U.K. | ||
| Merck KGaA | 1.6 | % |
| Pharmaceuticals, Germany | ||
| Bayer AG | 1.6 | % |
| Pharmaceuticals, Germany |
Turning to contributors, the Fund’s significantly overweighted energy position benefited from rebounding oil prices and stock selection, led by U.K. oil majors BP and Royal Dutch Shell. Shares of BP approached their highest levels since the Macondo incident as the firm’s continued optimization of costs and capital expenditures (capex) helped improve cash flow dynamics. Shell’s shares rose to the highest level in over a year after the company reported quarterly earnings that significantly exceeded analysts’ estimates, aided by higher production from its recent acquisition of BG Group. With the price of oil up more than 100% from its low in February 2016, we have seen the most anticipatory parts of the energy sector—namely, the early cycle oilfield services firms and exploration and production companies—outperform the integrated oil producers. Our current strategy, therefore, involves selectively reducing exposure to some of the earlier cycle energy stocks with fuller valuations, in our analysis, and rotating into more modestly valued opportunities among global oil majors. The net result is a slightly lower energy allocation going into 2017 than we had during most of 2016, though the broader overweighting remains and is consistent with our expectation
for higher oil prices given the vast reductions in industry capex, a significant decline in the U.S. rig count and a recent agreement by the Organization of the Petroleum Exporting Countries to curtail a larger-than-expected amount of production.
Elsewhere among resource sectors, stock selection in materials contributed, led by Swiss miner and commodities trader Glencore, the Fund’s top contributor during the year.4 Its shares rebounded from all-time lows as company management restructured and deleveraged against a backdrop of rising commodity prices. At period-end, the firm announced a lucrative oil deal as well as plans to reinstate the suspended dividend, capping a remarkable turnaround from earlier distressed levels, in our view. We were actively acquiring the stock amid the turmoil in late 2015, confident in the counter-cyclical characteristics of the firm’s trading business and management’s overall ability to use Glencore’s vast resources and attractive assets to deleverage and appease rating agencies. The company’s shares have quadrupled off the bottom and are now closer to fair value, in our analysis, as the market more fully prices in both the successful balance sheet repair and improving operating fundamentals amid a recovery in key commodities, such as zinc, coal and copper. Industrial metals producers have experienced a full earnings and valuation cycle in less than a year, and we have begun to take profits in industrial miners we believe are vulnerable to a Chinese demand slowdown.
Stock selection also benefited the Fund’s modestly underweighted information technology (IT) position, led by South Korean semiconductor and consumer electronics manufacturer Samsung Electronics.5 Its shares rose to a record high during the period as the firm recovered from a high-profile product recall and company management partially capitulated to shareholder demands in a strategic update. Samsung remains fundamentally attractive, in our view, with ongoing strength in memory and display, technical and manufacturing leadership across business lines, and a growing cash balance to help fund the company’s new, shareholder-friendly capital allocation strategy. The Fund also benefited from its significant underweighting in consumer staples. As we have recently noted, the ownership of consumer staples stocks had become the most crowded in the sector’s history and 2016 price-to-earnings ratios relative to the market were expensive and near historical highs. At such extreme price and valuation
4. The materials sector comprises chemicals, construction materials, and metals and mining in the SOI.
5. The IT sector comprises electronic equipment, instruments and components; Internet software and services; semiconductors and semiconductor equipment; software; and
technology hardware, storage and peripherals in the SOI.
28 Annual Report ftinstitutional.com
INTERNATIONAL EQUITY SERIES
levels, we argued that assets prized for their perceived “safety” may actually be among the market’s riskiest given their historically high and inverse correlations to interest rate movement. Such caution proved warranted in the fourth quarter as consumer staples sold off alongside other equity market bond proxies. At approximately one-third of the benchmark’s exposure, our underweighted position notably contributed.
From a geographic standpoint, stock selection helped drive outperformance of the Fund’s two major regional allocations: Asia and Europe. In Asia, we believe China’s economy remains imbalanced and vulnerable to turmoil, though political imperatives and unique safety valves could help maintain stability. Bottom-up values are concentrated among cheap China H-share companies operating in consumer-oriented growth industries, while we largely avoid the vulnerable and opaque banking sector, state-owned enterprises and the oversupplied industrial complex.6 Elsewhere in the region, we believe Japan and South Korea both remain stockpickers’ markets. South Korea in particular looks attractive to us, trading at a lower price-to-book value compared with Japan, while offering a higher average ROE than Japan. Turning to Europe, we continue to find what we consider compelling bargains in a region that we believe remains in the early stages of an expansionary economic cycle and appears to us geared to a continued value recovery given high operating leverage, an undervalued currency and low starting-point valuations. Politics and policy have been major headwinds, but they seem to us excessively discounted given continued broad support for the euro and recent gains by political moderates, as well as the strengthening of the European Central Bank as a credible bond market backstop.
As we enter 2017, value is recovering off an extremely low base, and we believe the longer term prospects for our investment philosophy remain attractive. We are watching specifically for any meaningful improvements in corporate earnings, which could drive the next leg of outperformance after an initial period of higher valuation multiples. On the other hand, economic and interest-rate normalization represent significant challenges for bondholders with nominally fixed returns. Real assets that can adjust for, or pass through, price increases and sustainably generate cash flows—such as equities—appear to us far better positioned. As the market refocuses on fundamentals, we are confident that this next cycle will again prove the virtue of value-oriented active investors
capable of identifying selective bargains and mitigating downside risk over the long term.
Thank you for your continued participation in International Equity Series. We look forward to serving your future investment needs.
The foregoing information reflects our analysis, opinions and portfolio
holdings as of December 31, 2016, the end of the reporting period.
The way we implement our main investment strategies and the
resulting portfolio holdings may change depending on factors such as
market and economic conditions. These opinions may not be relied
upon as investment advice or an offer for a particular security. The
information is not a complete analysis of every aspect of any market,
country, industry, security or the Fund. Statements of fact are from
sources considered reliable, but the investment manager makes no
representation or warranty as to their completeness or accuracy.
Although historical performance is no guarantee of future results,
these insights may help you understand our investment management
philosophy.
6. “China H” denotes shares of China-incorporated, Hong Kong Stock Exchange-listed companies with most businesses in China.
See www.franklintempletondatasources.com for additional data provider information.
ftinstitutional.com Annual Report 29
INTERNATIONAL EQUITY SERIES
Performance Summary as of December 31, 2016
The performance tables and graphs do not reflect any taxes that a shareholder would pay on Fund dividends, capital gain distributions, if any, or any realized gains on the sale of Fund shares. Total return reflects reinvestment of the Fund’s dividends and capital gain distributions, if any, and any unrealized gains or losses.
| Performance as of 12/31/161 | ||||
| Cumulative | Average Annual | |||
| Share Class | Total Return2 | Total Return3 | ||
| Primary | ||||
| 1-Year | +1.30 | % | +1.30 | % |
| 5-Year | +30.21 | % | +5.42 | % |
| 10-Year | +13.36 | % | +1.26 | % |
| Service | ||||
| 1-Year | +1.15 | % | +1.15 | % |
| 5-Year | +29.29 | % | +5.27 | % |
| 10-Year | +11.70 | % | +1.11 | % |
Performance data represent past performance, which does not guarantee future results. Investment return and principal value will fluctuate, and you may have a gain or loss when you sell your shares. Current performance may differ from figures shown. For most recent month-end performance, go to ftinstitutional.com or call a Franklin Templeton Institutional Services representative at (800) 321-8563.
See page 32 for Performance Summary footnotes.
30 Annual Report
ftinstitutional.com
INTERNATIONAL EQUITY SERIES
PERFORMANCE SUMMARY
Total Return Index Comparison for a Hypothetical $1,000,000 Investment1
Total return represents the change in value of an investment over the periods shown. It includes any applicable maximum sales charge, Fund expenses, account fees and reinvested distributions. The unmanaged indexes include reinvestment of any income or distributions. They differ from the Fund in composition and do not pay management fees or expenses. One cannot invest directly in an index.


| INTERNATIONAL EQUITY SERIES | ||
| PERFORMANCE SUMMARY | ||
| Total Annual Operating Expenses6 | ||
| Share Class | ||
| Primary | 0.78 | % |
| Service | 0.93 | % |
Each class of shares is available to certain eligible investors and has different annual fees and expenses, as described in the prospectus.
All investments involve risks, including possible loss of principal. Special risks are associated with foreign investing, including currency fluctuations, economic
instability and political developments; investments in emerging markets involve heightened risks related to the same factors. To the extent the Fund focuses on
particular countries, regions, industries, sectors or types of investment from time to time, it may be subject to greater risks of adverse developments in such
areas of focus than a fund that invests in a wider variety of countries, regions, industries, sectors or investments. The Fund is actively managed but there is no
guarantee that the manager’s investment decisions will produce the desired results. The Fund’s prospectus also includes a description of the main investment
risks.
1. The Fund has a fee waiver associated with any investment it makes in a Franklin Templeton money fund and/or other Franklin Templeton fund, contractually guaranteed
through its current fiscal year-end. Fund investment results reflect the fee waiver; without this waiver, the results would have been lower.
2. Cumulative total return represents the change in value of an investment over the periods indicated.
3. Average annual total return represents the average annual change in value of an investment over the periods indicated. Return for less then one year, ifany,hasnotbeen
annualized.
4. Source: Morningstar. The MSCI ACWI ex USA is a free float-adjusted, market capitalization-weighted index designed to measure equity market performance of global
developed and emerging markets, excluding the U.S. The MSCI EAFE Index is a free float-adjusted, market capitalization-weighted index designed to measure equity market
performance of global developed markets excluding the U.S. and Canada.
5. Source: Bureau of Labor Statistics, bls.gov/cpi. The Consumer Price Index is a commonly used measure of the inflation rate.
6. Figures are as stated in the Fund’s current prospectus and may differ from the expense ratios disclosed in the Your Fund’s Expenses and Financial Highlights sections in this
report. In periods of market volatility, assets may decline significantly, causing total annual Fund operating expenses to become higher than the figures shown.
See www.franklintempletondatasources.com for additional data provider information.
32 Annual Report
ftinstitutional.com
INTERNATIONAL EQUITY SERIES
Your Fund’s Expenses
As a Fund shareholder, you can incur two types of costs: (1) transaction costs, including sales charges (loads) on Fund purchases and redemptions, if applicable; and (2) ongoing Fund costs, including management fees, distribution and service (12b-1) fees, if applicable, and other Fund expenses. All mutual funds have ongoing costs, sometimes referred to as operating expenses. The table below shows ongoing costs of investing in the Fund and can help you understand these costs and compare them with those of other mutual funds. The table assumes a $1,000 investment held for the six months indicated.
Actual Fund Expenses
The table below provides information about actual account values and actual expenses in the columns under the heading “Actual.” In these columns the Fund’s actual return, which includes the effect of Fund expenses, is used to calculate the “Ending Account Value” for each class of shares. You can estimate the expenses you paid during the period by following these steps (of course, your account value and expenses will differ from those in this illustration): Divide your account value by $1,000 (if your account had an $8,600 value, then $8,600 ÷ $1,000 = 8.6). Then multiply the result by the number in the row for your class of shares under the headings “Actual” and “Expenses Paid During Period” (if Actual Expenses Paid During Period were $7.50, then 8.6 x $7.50 = $64.50). In this illustration, the actual expenses paid this period are $64.50.
Hypothetical Example for Comparison with Other Funds
Under the heading “Hypothetical” in the table, information is provided about hypothetical account values and hypothetical expenses based on the Fund’s actual expense ratio and an assumed rate of return of 5% per year before expenses, which is not the Fund’s actual return. This information may not be used to estimate the actual ending account balance or expenses you paid for the period, but it can help you compare ongoing costs of investing in the Fund with those of other funds. To do so, compare this 5% hypothetical example for the class of shares you hold with the 5% hypothetical examples that appear in the shareholder reports of other funds.
Please note that expenses shown in the table are meant to highlight ongoing costs and do not reflect any transactional costs. Therefore, information under the heading “Hypothetical” is useful in comparing ongoing costs only, and will not help you compare total costs of owning different funds. In addition, if transactional costs were included, your total costs would have been higher.
| Actual | Hypothetical | |||||||||||
| (actual return after expenses) | (5% annual return before expenses) | |||||||||||
| Expenses | Expenses | Net | ||||||||||
| Beginning | Ending | Paid During | Ending | Paid During | Annualized | |||||||
| Share | Account | Account | Period | Account | Period | Expense | ||||||
| Class | Value 7/1/16 | Value 12/31/16 | 7/1/16–12/31/161,2 | Value 12/31/16 | 7/1/16–12/31/161,2 | Ratio2 | ||||||
| Primary Shares | $ | 1,000 | $ | 1,082.90 | $ | 4.08 | $ | 1,021.22 | $ | 3.96 | 0.78 | % |
| Service Shares | $ | 1,000 | $ | 1,082.30 | $ | 4.87 | $ | 1,020.46 | $ | 4.72 | 0.93 | % |
1. Expenses are equal to the annualized expense ratio for the six-month period as indicated above–in the far right column–multiplied by the simple average account value
over the period indicated, and then multiplied by 184/366 to reflect the one-half year period.
2. Reflects expenses after fee waivers and expense reimbursements. Does not include acquired fund fees and expenses.
ftinstitutional.com
Annual Report
33
TEMPLETON INSTITUTIONAL FUNDS
| Financial Highlights | |||||||||||||||
| Emerging Markets Series | |||||||||||||||
| Year Ended December 31, | |||||||||||||||
| 2016 | 2015 | 2014 | 2013 | 2012 | |||||||||||
| Per share operating performance | |||||||||||||||
| (for a share outstanding throughout the year) | |||||||||||||||
| Net asset value, beginning of year | $ | 3.65 | $ | 4.59 | $ | 7.31 | $ | 10.49 | $ | 10.48 | |||||
| Income from investment operationsa: | |||||||||||||||
| Net investment incomeb | 0.03 | 0.04 | 0.12 | c | 0.13 | 0.22 | |||||||||
| Net realized and unrealized gains (losses) | 0.68 | (0.90 | ) | (0.70 | ) | (0.13 | ) | 1.38 | |||||||
| Total from investment operations | 0.71 | (0.86 | ) | (0.58 | ) | — | 1.60 | ||||||||
| Less distributions from: | |||||||||||||||
| Net investment income | (0.08 | ) | (0.06 | ) | (0.19 | ) | (0.13 | ) | (0.32 | ) | |||||
| Net realized gains | — | (0.02 | ) | (1.95 | ) | (3.05 | ) | (1.27 | ) | ||||||
| Total distributions | (0.08 | ) | (0.08 | ) | (2.14 | ) | (3.18 | ) | (1.59 | ) | |||||
| Net asset value, end of year. | $ | 4.28 | $ | 3.65 | $ | 4.59 | $ | 7.31 | $ | 10.49 | |||||
| Total return | 19.45 | % | (18.88 | )% | (8.01 | )% | 0.72 | % | 15.77 | % | |||||
| Ratios to average net assets | |||||||||||||||
| Expenses before waiver and payments by affiliates | 1.44 | % | 1.33 | % | 1.32 | % | 1.32 | % | 1.28 | % | |||||
| Expenses net of waiver and payments by affiliates | 1.33 | % | 1.32 | % | 1.32 | % | 1.29 | % | 1.24 | % | |||||
| Net investment income | 0.79 | % | 0.83 | % | 1.74 | %c | 1.23 | % | 1.99 | % | |||||
| Supplemental data | |||||||||||||||
| Net assets, end of year (000’s) | $ | 40,879 | $ | 71,434 | $ | 101,861 | $ | 165,216 | $ | 249,190 | |||||
| Portfolio turnover rate | 17.55 | % | 69.65 | % | 78.18 | % | 52.07 | % | 24.31 | % | |||||
aThe amount shown for a share outstanding throughout the period may not correlate with the Statement of Operations for the period due to the timing of sales and
repurchases of the Fund’s shares in relation to income earned and/or fluctuating fair value of the investments of the Fund.
bBased on average daily shares outstanding.
cNet investment income per share includes approximately $0.03 per share related to income received in the form of special dividends in connection with certain Fund
holdings. Excluding this amount, the ratio of net investment income to average net assets would have been 1.33%.
34 Annual Report | The accompanying notes are an integral part of these financial statements.
ftinstitutional.com
TEMPLETON INSTITUTIONAL FUNDS
| Statement of Investments, December 31, 2016 | ||||
| Emerging Markets Series | ||||
| Industry | Shares | Value | ||
| Common Stocks 93.8% | ||||
| Argentina 0.3% | ||||
| a Grupo Clarin SA, B, GDR, Reg S | Media | 2,037 | $ | 46,036 |
| MercadoLibre Inc | Internet Software & Services | 600 | 93,684 | |
| 139,720 | ||||
| Belgium 1.1% | ||||
| Anheuser-Busch InBev SA/NV | Beverages | 4,198 | 444,143 | |
| Brazil 0.8% | ||||
| M Dias Branco SA | Food Products | 200 | 7,067 | |
| Mahle-Metal Leve SA. | Auto Components | 20,500 | 130,759 | |
| Totvs SA | Software | 24,600 | 181,701 | |
| 319,527 | ||||
| Cambodia 0.8% | ||||
| NagaCorp Ltd | Hotels, Restaurants & Leisure | 576,000 | 332,029 | |
| China 19.0% | ||||
| b Alibaba Group Holding Ltd., ADR | Internet Software & Services | 3,360 | 295,041 | |
| b Baidu Inc., ADR | Internet Software & Services | 3,700 | 608,317 | |
| Bloomage Biotechnology Corp. Ltd | Chemicals | 57,000 | 85,855 | |
| Brilliance China Automotive Holdings Ltd | Automobiles | 2,072,000 | 2,853,693 | |
| China Life Insurance Co. Ltd., H | Insurance | 83,000 | 216,210 | |
| China Petroleum and Chemical Corp., H | Oil, Gas & Consumable Fuels | 1,138,500 | 807,499 | |
| COSCO Shipping Ports Ltd | Transportation Infrastructure | 169,057 | 169,831 | |
| Inner Mongolia Yitai Coal Co. Ltd., B | Oil, Gas & Consumable Fuels | 182,500 | 169,542 | |
| NetEase Inc., ADR | Internet Software & Services | 345 | 74,292 | |
| Ping An Insurance Group Co. of China Ltd., A | Insurance | 40,300 | 205,591 | |
| Poly Culture Group Corp. Ltd., H | Media | 57,500 | 140,293 | |
| Tencent Holdings Ltd | Internet Software & Services | 75,300 | 1,842,080 | |
| Uni-President China Holdings Ltd | Food Products | 294,800 | 207,951 | |
| Weifu High-Technology Co. Ltd., B | Auto Components | 34,200 | 81,371 | |
| 7,757,566 | ||||
| Czech Republic 0.3% | ||||
| b Moneta Money Bank AS. | Banks | 38,200 | 123,202 | |
| Hong Kong 3.5% | ||||
| Dairy Farm International Holdings Ltd | Food & Staples Retailing | 22,719 | 163,350 | |
| MGM China Holdings Ltd | Hotels, Restaurants & Leisure | 352,200 | 730,334 | |
| Sands China Ltd | Hotels, Restaurants & Leisure | 126,000 | 547,579 | |
| 1,441,263 | ||||
| Hungary 1.4% | ||||
| Richter Gedeon Nyrt | Pharmaceuticals | 27,921 | 589,900 | |
| India 9.0% | ||||
| Bajaj Holdings & Investment Ltd | Diversified Financial Services | 3,324 | 88,994 | |
| Biocon Ltd | Biotechnology | 50,098 | 700,256 | |
| Glenmark Pharmaceuticals Ltd | Pharmaceuticals | 12,288 | 160,656 | |
| ICICI Bank Ltd | Banks | 249,870 | 938,742 | |
| Infosys Ltd | IT Services | 40,960 | 609,145 | |
| Oil & Natural Gas Corp. Ltd | Oil, Gas & Consumable Fuels | 51,400 | 144,735 | |
| Reliance Industries Ltd | Oil, Gas & Consumable Fuels | 18,000 | 286,709 | |
| Tata Chemicals Ltd | Chemicals | 51,000 | 377,502 | |
| Tata Consultancy Services Ltd | IT Services | 3,556 | 123,787 | |
| Tata Motors Ltd., A | Automobiles | 52,906 | 232,864 | |
| 3,663,390 | ||||
ftinstitutional.com
Annual Report
35
TEMPLETON INSTITUTIONAL FUNDS
STATEMENT OF INVESTMENTS
| Emerging Markets Series (continued) | ||||
| Industry | Shares | Value | ||
| Common Stocks (continued) | ||||
| Indonesia 5.0% | ||||
| Astra International Tbk PT | Automobiles | 2,111,600 | $ | 1,296,975 |
| Bank Danamon Indonesia Tbk PT | Banks | 891,700 | 245,552 | |
| Perusahaan Gas Negara (Persero) Tbk PT | Gas Utilities | 797,500 | 159,826 | |
| Semen Indonesia (Persero) Tbk PT | Construction Materials | 519,100 | 353,516 | |
| 2,055,869 | ||||
| Kenya 0.4% | ||||
| Equity Group Holdings Ltd | Banks | 579,300 | 171,014 | |
| Mexico 1.1% | ||||
| America Movil SAB de CV, L, ADR | Wireless Telecommunication Services | 19,330 | 242,978 | |
| Grupo Financiero Santander Mexico SAB de CV, B, ADR | Banks | 9,662 | 69,470 | |
| Nemak SAB de CV | Auto Components | 137,500 | 122,806 | |
| b Telesites SAB de CV | Diversified Telecommunication Services | 19,500 | 10,570 | |
| 445,824 | ||||
| Nigeria 0.0%† | ||||
| Nigerian Breweries PLC | Beverages | 37,557 | 17,626 | |
| Pakistan 1.1% | ||||
| Habib Bank Ltd | Banks | 171,400 | 447,077 | |
| Peru 0.0%† | ||||
| Compania de Minas Buenaventura SA, ADR | Metals & Mining | 240 | 2,707 | |
| Philippines 0.1% | ||||
| b Bloomberry Resorts Corp | Hotels, Restaurants & Leisure | 324,200 | 40,199 | |
| Russia 4.2% | ||||
| LUKOIL PJSC, ADR (London Stock Exchange) | Oil, Gas & Consumable Fuels | 200 | 11,220 | |
| LUKOIL PJSC, ADR | Oil, Gas & Consumable Fuels | 6,750 | 378,675 | |
| a,b Mail.ru Group Ltd., GDR, Reg S | Internet Software & Services | 20,799 | 381,662 | |
| MMC Norilsk Nickel PJSC, ADR | Metals & Mining | 16,400 | 275,356 | |
| b Yandex NV, A | Internet Software & Services | 32,204 | 648,266 | |
| 1,695,179 | ||||
| Singapore 0.2% | ||||
| DBS Group Holdings Ltd | Banks | 6,452 | 77,269 | |
| South Africa 8.0% | ||||
| Massmart Holdings Ltd | Food & Staples Retailing | 30,309 | 278,324 | |
| MTN Group Ltd | Wireless Telecommunication Services | 20,188 | 185,399 | |
| Naspers Ltd., N | Media | 15,915 | 2,333,152 | |
| Remgro Ltd | Diversified Financial Services | 29,655 | 481,457 | |
| 3,278,332 | ||||
| South Korea 16.0% | ||||
| Daelim Industrial Co. Ltd | Construction & Engineering | 8,526 | 615,127 | |
| Fila Korea Ltd | Textiles, Apparel & Luxury Goods | 8,416 | 491,469 | |
| Hankook Tire Co. Ltd | Auto Components | 3,598 | 172,858 | |
| Hanon Systems | Auto Components | 30,095 | 256,763 | |
| Hite Jinro Co. Ltd | Beverages | 8,080 | 141,220 | |
| Hyundai Development Co-Engineering & Construction. | Construction & Engineering | 19,750 | 735,356 | |
| Hyundai Wia Corp | Auto Components | 2,500 | 151,169 | |
| iMarketkorea Inc | Trading Companies & Distributors | 15,123 | 130,278 | |
| Interpark Holdings Corp | Internet & Direct Marketing Retail | 9,693 | 40,305 | |
| KT Skylife Co. Ltd | Media | 35,290 | 505,707 | |
| Samsung Electronics Co. Ltd | Technology Hardware, Storage & Peripherals | 1,802 | 2,689,742 | |
36 Annual Report
ftinstitutional.com
TEMPLETON INSTITUTIONAL FUNDS
STATEMENT OF INVESTMENTS
| Emerging Markets Series (continued) | ||||
| Industry | Shares | Value | ||
| Common Stocks (continued) | ||||
| South Korea (continued) | ||||
| SK Hynix Inc | Semiconductors & Semiconductor Equipment | 16,340 | $ | 605,007 |
| 6,535,001 | ||||
| Taiwan 12.1% | ||||
| Catcher Technology Co. Ltd | Technology Hardware, Storage & Peripherals | 66,000 | 455,530 | |
| Hon Hai Precision Industry Co. Ltd | Electronic Equipment, Instruments | |||
| & Components | 425,920 | 1,105,007 | ||
| Largan Precision Co. Ltd | Electronic Equipment, Instruments | |||
| & Components | 3,000 | 350,337 | ||
| Pegatron Corp | Technology Hardware, Storage & Peripherals | 146,000 | 346,393 | |
| Taiwan Semiconductor Manufacturing Co. Ltd | Semiconductors & Semiconductor Equipment | 481,000 | 2,689,966 | |
| 4,947,233 | ||||
| Thailand 4.4% | ||||
| Kasikornbank PCL, fgn | Banks | 111,900 | 554,038 | |
| Land and Houses PCL, fgn | Real Estate Management & Development | 1,107,300 | 301,149 | |
| PTT Exploration and Production PCL, fgn | Oil, Gas & Consumable Fuels | 135,700 | 364,327 | |
| Siam Commercial Bank PCL, fgn | Banks | 43,100 | 183,340 | |
| Thai Beverage PCL, fgn | Beverages | 654,000 | 383,935 | |
| 1,786,789 | ||||
| United Kingdom 4.1% | ||||
| Unilever PLC. | Personal Products | 41,193 | 1,670,733 | |
| United States 0.9% | ||||
| b IMAX Corp | Media | 11,494 | 360,912 | |
| Total Common Stocks (Cost $33,255,684) | 38,342,504 | |||
| c Participatory Notes (Cost $449,297) 1.2% | ||||
| Saudi Arabia 1.2% | ||||
| HSBC Bank PLC, Saudi Basic Industries Corp., 1/22/18. | Chemicals | 20,305 | 495,204 | |
| Preferred Stocks 4.3% | ||||
| Brazil 4.3% | ||||
| d Banco Bradesco SA, 4.637%, ADR, pfd | Banks | 90,120 | 784,945 | |
| d Itau Unibanco Holding SA, 4.696%, ADR, pfd | Banks | 95,546 | 982,213 | |
| Total Preferred Stocks (Cost $1,002,489) | 1,767,158 | |||
| Total Investments before Short Term | ||||
| Investments (Cost $34,707,470) | 40,604,866 | |||
| Short Term Investments (Cost $234,539) 0.6% | ||||
| Money Market Funds 0.6% | ||||
| United States 0.6% | ||||
| e,f Institutional Fiduciary Trust Money Market Portfolio, 0.09% | 234,539 | 234,539 | ||
| Total Investments (Cost $34,942,009) 99.9% | 40,839,405 | |||
| Other Assets, less Liabilities 0.1% | 39,864 | |||
| Net Assets 100.0% | $ | 40,879,269 | ||
ftinstitutional.com
Annual Report
37
TEMPLETON INSTITUTIONAL FUNDS
STATEMENT OF INVESTMENTS
Emerging Markets Series (continued)
See Abbreviations on page 73.
†Rounds to less than 0.1% of net assets.
aSecurity was purchased pursuant to Regulation S under the Securities Act of 1933, which exempts from registration securities offered and sold outside of the United States.
Such a security cannot be sold in the United States without either an effective registration statement filed pursuant to the Securities Act of 1933, or pursuant to an exemption
from registration. These securities have been deemed liquid under guidelines approved by the Trust’s Board of Trustees. At December 31, 2016, the aggregate value of these
securities was $427,698, representing 1.1% of net assets.
bNon-income producing.
cSee Note 1(c) regarding Participatory Notes.
dVariable rate security. The rate shown represents the yield at period end.
eSee Note 3(d) regarding investments in affiliated management investment companies.
fThe rate shown is the annualized seven-day yield at period end.
38 Annual Report | The accompanying notes are an integral part of these financial statements. ftinstitutional.com
| TEMPLETON INSTITUTIONAL FUNDS | |||||||||||||||
| Financial Highlights | |||||||||||||||
| Foreign Smaller Companies Series | |||||||||||||||
| Year Ended December 31, | |||||||||||||||
| 2016 | 2015 | 2014 | 2013 | 2012 | |||||||||||
| Per share operating performance | |||||||||||||||
| (for a share outstanding throughout the year) | |||||||||||||||
| Net asset value, beginning of year | $ | 20.90 | $ | 20.80 | $ | 21.96 | $ | 18.31 | $ | 15.31 | |||||
| Income from investment operationsa: | |||||||||||||||
| Net investment incomeb | 0.29 | 0.28 | 0.25 | 0.24 | 0.29 | ||||||||||
| Net realized and unrealized gains (losses) | (0.48 | ) | 0.12 | (0.98 | ) | 3.82 | 3.01 | ||||||||
| Total from investment operations | (0.19 | ) | 0.40 | (0.73 | ) | 4.06 | 3.30 | ||||||||
| Less distributions from: | |||||||||||||||
| Net investment income | (0.41 | ) | (0.28 | ) | (0.16 | ) | (0.30 | ) | (0.27 | ) | |||||
| Net realized gains | (0.37 | ) | (0.02 | ) | (0.27 | ) | (0.11 | ) | (0.03 | ) | |||||
| Total distributions | (0.78 | ) | (0.30 | ) | (0.43 | ) | (0.41 | ) | (0.30 | ) | |||||
| Net asset value, end of year. | $ | 19.93 | $ | 20.90 | $ | 20.80 | $ | 21.96 | $ | 18.31 | |||||
| Total return | (0.85 | )% | 1.88 | % | (3.32 | )% | 22.24 | % | 21.56 | % | |||||
| Ratios to average net assets | |||||||||||||||
| Expenses before waiver and payments by affiliates | 0.99 | % | 0.98 | % | 0.98 | % | 0.99 | % | 1.01 | % | |||||
| Expenses net of waiver and payments by affiliates | 0.98 | %c | 0.98 | %c,d | 0.98 | % | 0.98 | %c | 0.95 | % | |||||
| Net investment income | 1.44 | % | 1.28 | % | 1.15 | % | 1.16 | % | 1.70 | % | |||||
| Supplemental data | |||||||||||||||
| Net assets, end of year (000’s) | $ | 931,879 | $ | 1,260,407 | $ | 1,281,733 | $ | 1,252,797 | $ | 495,600 | |||||
| Portfolio turnover rate | 21.36 | % | 29.11 | % | 21.36 | % | 23.84 | % | 19.76 | % | |||||
aThe amount shown for a share outstanding throughout the period may not correlate with the Statement of Operations for the period due to the timing of sales and
repurchases of the Fund’s shares in relation to income earned and/or fluctuating fair value of the investments of the Fund.
bBased on average daily shares outstanding.
cBenefit of expense reduction rounds to less than 0.01%.
dBenefit of waiver and payments by affiliates rounds to less than 0.01%.
ftinstitutional.com
The accompanying notes are an integral part of these financial statements. | Annual Report 39
| TEMPLETON INSTITUTIONAL FUNDS | ||||
| Statement of Investments, December 31, 2016 | ||||
| Foreign Smaller Companies Series | ||||
| Industry | Shares | Value | ||
| Common Stocks 95.7% | ||||
| Belgium 2.2% | ||||
| Barco NV | Electronic Equipment, Instruments | |||
| & Components | 180,420 | $ | 15,194,627 | |
| Ontex Group NV | Personal Products | 179,950 | 5,348,950 | |
| 20,543,577 | ||||
| Bermuda 1.5% | ||||
| Axis Capital Holdings Ltd | Insurance | 217,510 | 14,196,878 | |
| Brazil 1.4% | ||||
| Grendene SA | Textiles, Apparel & Luxury Goods | 955,400 | 5,160,516 | |
| M Dias Branco SA | Food Products | 223,000 | 7,880,060 | |
| 13,040,576 | ||||
| Canada 7.3% | ||||
| a Badger Daylighting Ltd | Construction & Engineering | 646,700 | 15,459,540 | |
| b Canaccord Genuity Group Inc | Capital Markets | 1,205,138 | 4,280,986 | |
| Dorel Industries Inc., B | Household Durables | 151,800 | 4,386,238 | |
| Enerflex Ltd | Energy Equipment & Services | 604,400 | 7,674,278 | |
| a Genworth MI Canada Inc | Thrifts & Mortgage Finance | 269,800 | 6,763,083 | |
| Laurentian Bank of Canada | Banks | 134,400 | 5,778,159 | |
| Mullen Group Ltd | Energy Equipment & Services | 813,600 | 12,014,960 | |
| Russel Metals Inc | Trading Companies & Distributors | 313,500 | 5,972,095 | |
| Shawcor Ltd., A | Energy Equipment & Services | 214,300 | 5,719,773 | |
| 68,049,112 | ||||
| China 3.6% | ||||
| AAC Technologies Holdings Inc | Electronic Equipment, Instruments | |||
| & Components | 764,000 | 6,940,976 | ||
| China ZhengTong Auto Services Holdings Ltd | Specialty Retail | 10,894,500 | 3,175,133 | |
| Goodbaby International Holdings Ltd | Household Products | 15,604,600 | 7,445,615 | |
| Greatview Aseptic Packaging Co. Ltd | Containers & Packaging | 12,777,300 | 6,722,727 | |
| Shanghai Haohai Biological Technology Co. Ltd., H | Biotechnology | 1,091,100 | 5,332,734 | |
| Xtep International Holdings Ltd | Textiles, Apparel & Luxury Goods | 9,886,300 | 4,143,462 | |
| 33,760,647 | ||||
| Colombia 1.1% | ||||
| b Gran Tierra Energy Inc. (CAD Traded) | Oil, Gas & Consumable Fuels | 2,809,000 | 8,493,104 | |
| b Gran Tierra Energy Inc. (USD Traded) | Oil, Gas & Consumable Fuels | 440,620 | 1,330,672 | |
| 9,823,776 | ||||
| Finland 3.6% | ||||
| Amer Sports OYJ. | Leisure Products | 659,772 | 17,549,681 | |
| Huhtamaki OYJ | Containers & Packaging | 435,820 | 16,178,342 | |
| 33,728,023 | ||||
| France 0.6% | ||||
| Beneteau S.A | Leisure Products | 358,895 | 5,192,403 | |
| Germany 6.2% | ||||
| Gerresheimer AG | Life Sciences Tools & Services | 237,920 | 17,678,969 | |
| Grand City Properties SA | Real Estate Management & Development | 647,080 | 11,772,027 | |
| Jenoptik AG | Electronic Equipment, Instruments | |||
| & Components | 664,710 | 11,487,774 | ||
| Rational AG | Machinery | 37,930 | 16,921,816 | |
| 57,860,586 | ||||
40 Annual Report
ftinstitutional.com
TEMPLETON INSTITUTIONAL FUNDS
STATEMENT OF INVESTMENTS
| Foreign Smaller Companies Series (continued) | ||||
| Industry | Shares | Value | ||
| Common Stocks (continued) | ||||
| Hong Kong 6.3% | ||||
| Luk Fook Holdings (International) Ltd | Specialty Retail | 2,680,000 | $ | 6,998,517 |
| Sitoy Group Holdings Ltd | Textiles, Apparel & Luxury Goods | 6,780,600 | 1,766,305 | |
| Stella International Holdings Ltd | Textiles, Apparel & Luxury Goods | 2,893,562 | 4,664,327 | |
| Techtronic Industries Co. Ltd | Household Durables | 3,926,000 | 14,074,770 | |
| Value Partners Group Ltd | Capital Markets | 12,630,000 | 10,032,987 | |
| Vinda International Holdings Ltd | Household Products | 2,790,700 | 5,218,280 | |
| VTech Holdings Ltd | Communications Equipment | 1,162,400 | 15,544,636 | |
| 58,299,822 | ||||
| India 1.8% | ||||
| Dewan Housing Finance Corp. Ltd | Thrifts & Mortgage Finance | 3,255,663 | 11,673,130 | |
| Jain Irrigation Systems Ltd | Machinery | 3,565,583 | 4,622,617 | |
| 16,295,747 | ||||
| Italy 2.9% | ||||
| Azimut Holding SpA | Capital Markets | 242,039 | 4,039,121 | |
| Interpump Group SpA | Machinery | 1,043,281 | 17,069,860 | |
| b,c Technogym SpA, Reg S | Leisure Products | 246,972 | 1,151,717 | |
| Tod’s SpA | Textiles, Apparel & Luxury Goods | 78,800 | 5,124,045 | |
| 27,384,743 | ||||
| Japan 20.6% | ||||
| Anritsu Corp | Electronic Equipment, Instruments | |||
| & Components | 1,014,000 | 5,464,904 | ||
| Asahi Co. Ltd | Specialty Retail | 357,700 | 3,935,174 | |
| Asics Corp | Textiles, Apparel & Luxury Goods | 829,200 | 16,563,429 | |
| Bunka Shutter Co. Ltd | Building Products | 755,900 | 5,832,771 | |
| Capcom Co. Ltd | Software | 301,200 | 7,085,846 | |
| Daibiru Corp | Real Estate Management & Development | 873,500 | 7,479,991 | |
| Descente Ltd | Textiles, Apparel & Luxury Goods | 696,871 | 8,024,196 | |
| Dowa Holdings Co. Ltd | Metals & Mining | 1,700,000 | 13,001,412 | |
| Fuji Oil Holdings Inc | Food Products | 493,800 | 9,699,002 | |
| a IDOM Inc | Specialty Retail | 831,000 | 4,578,160 | |
| Kobayashi Pharmaceutical Co. Ltd | Personal Products | 371,000 | 15,868,942 | |
| KYB Corp | Auto Components | 1,006,000 | 4,879,610 | |
| a,b Laox Co. Ltd | Specialty Retail | 690,500 | 4,229,420 | |
| MEITEC Corp | Professional Services | 444,300 | 17,008,790 | |
| Nachi-Fujikoshi Corp | Machinery | 1,543,000 | 6,692,339 | |
| Nihon Parkerizing Co. Ltd | Chemicals | 573,400 | 6,725,107 | |
| Shinko Plantech Co. Ltd | Energy Equipment & Services | 306,300 | 2,224,635 | |
| Square Enix Holdings Co. Ltd | Software | 163,900 | 4,213,350 | |
| Sumitomo Rubber Industries Ltd | Auto Components | 834,400 | 13,248,183 | |
| TechnoPro Holdings Inc | Professional Services | 223,900 | 7,182,728 | |
| Tsugami Corp | Machinery | 846,000 | 4,856,204 | |
| Tsumura & Co | Pharmaceuticals | 621,200 | 17,111,630 | |
| Ushio Inc | Electrical Equipment | 472,700 | 6,029,306 | |
| 191,935,129 | ||||
| Luxembourg 1.2% | ||||
| b Stabilus SA | Machinery | 205,450 | 11,033,545 | |
| Netherlands 5.7% | ||||
| Aalberts Industries NV | Machinery | 567,908 | 18,416,576 | |
| Accell Group NV | Leisure Products | 229,265 | 5,285,407 | |
| Arcadis NV | Construction & Engineering | 737,111 | 10,338,590 | |
ftinstitutional.com
Annual Report
41
TEMPLETON INSTITUTIONAL FUNDS
STATEMENT OF INVESTMENTS
| Foreign Smaller Companies Series (continued) | ||||
| Industry | Shares | Value | ||
| Common Stocks (continued) | ||||
| Netherlands (continued) | ||||
| Beter Bed Holding NV | Specialty Retail | 260,587 | $ | 4,633,805 |
| c Refresco Group NV, Reg S | Beverages | 935,732 | 14,207,449 | |
| 52,881,827 | ||||
| Norway 0.5% | ||||
| Tomra Systems ASA | Commercial Services & Supplies | 467,060 | 4,892,804 | |
| Philippines 0.9% | ||||
| Metropolitan Bank & Trust Co | Banks | 2,007,086 | 2,937,821 | |
| Vista Land & Lifescapes Inc | Real Estate Management & Development | 54,228,200 | 5,411,941 | |
| 8,349,762 | ||||
| Poland 0.7% | ||||
| CCC SA | Textiles, Apparel & Luxury Goods | 135,520 | 6,589,846 | |
| South Korea 4.4% | ||||
| BNK Financial Group Inc | Banks | 1,253,810 | 9,014,724 | |
| DGB Financial Group Inc | Banks | 1,642,992 | 13,296,306 | |
| b Hyundai Mipo Dockyard Co. Ltd | Machinery | 85,101 | 4,737,017 | |
| KIWOOM Securities Co. Ltd | Capital Markets | 73,408 | 4,378,011 | |
| Korea Investment Holdings Co. Ltd | Capital Markets | 283,262 | 9,831,128 | |
| 41,257,186 | ||||
| Spain 1.9% | ||||
| Construcciones y Auxiliar de Ferrocarriles SA | Machinery | 276,330 | 11,135,894 | |
| Tecnicas Reunidas SA | Energy Equipment & Services | 168,382 | 6,903,489 | |
| 18,039,383 | ||||
| Sweden 4.1% | ||||
| Bulten AB | Auto Components | 597,753 | 5,840,251 | |
| Cloetta AB, B | Food Products | 1,484,560 | 4,677,345 | |
| Duni AB | Household Durables | 340,920 | 4,678,238 | |
| Tethys Oil AB | Oil, Gas & Consumable Fuels | 749,887 | 6,482,853 | |
| c The Thule Group AB, Reg S | Leisure Products | 1,081,450 | 16,917,690 | |
| 38,596,377 | ||||
| Switzerland 4.7% | ||||
| b Basilea Pharmaceutica AG | Biotechnology | 62,390 | 4,478,308 | |
| Bucher Industries AG | Machinery | 64,270 | 15,824,531 | |
| Logitech International SA | Technology Hardware, Storage & Peripherals | 367,620 | 9,105,948 | |
| Vontobel Holding AG | Capital Markets | 265,030 | 13,909,911 | |
| 43,318,698 | ||||
| Taiwan 3.5% | ||||
| Chicony Electronics Co. Ltd | Technology Hardware, Storage & Peripherals | 4,932,503 | 11,398,657 | |
| Giant Manufacturing Co. Ltd | Leisure Products | 1,727,482 | 9,740,690 | |
| Tripod Technology Corp | Electronic Equipment, Instruments | |||
| & Components | 4,952,000 | 11,108,031 | ||
| 32,247,378 | ||||
| Thailand 0.9% | ||||
| L.P.N. Development PCL, fgn | Real Estate Management & Development | 8,691,900 | 2,933,668 | |
| TISCO Financial Group PCL, fgn | Banks | 3,426,100 | 5,757,950 | |
| 8,691,618 | ||||
42 Annual Report
ftinstitutional.com
TEMPLETON INSTITUTIONAL FUNDS
STATEMENT OF INVESTMENTS
| Foreign Smaller Companies Series (continued) | |||||||
| Industry | Shares | Value | |||||
| Common Stocks (continued) | |||||||
| United Kingdom 8.1% | |||||||
| Bellway PLC | Household Durables | 148,150 | $ | 4,518,665 | |||
| Bovis Homes Group PLC | Household Durables | 358,460 | 3,620,866 | ||||
| Devro PLC | Food Products | 1,348,710 | 3,152,523 | ||||
| DFS Furniture PLC | Household Durables | 2,602,010 | 7,276,000 | ||||
| Foxtons Group PLC | Real Estate Management & Development | 3,344,663 | 4,202,526 | ||||
| Greggs PLC | Food & Staples Retailing | 991,820 | 11,851,203 | ||||
| Laird PLC | Electronic Equipment, Instruments | ||||||
| & Components | 2,375,040 | 4,476,310 | |||||
| b LivaNova PLC | Health Care Equipment & Supplies | 175,551 | 7,894,528 | ||||
| Man Group PLC. | Capital Markets | 6,810,811 | 9,925,249 | ||||
| Oxford Instruments PLC | Electronic Equipment, Instruments | ||||||
| & Components | 703,316 | 6,341,901 | |||||
| SIG PLC | Trading Companies & Distributors | 3,498,043 | 4,446,955 | ||||
| b Vectura Group PLC | Pharmaceuticals | 4,461,862 | 7,535,489 | ||||
| 75,242,215 | |||||||
| Total Common Stocks (Cost $774,938,429) | 891,251,658 | ||||||
| Preferred Stocks (Cost $4,340,266) 0.5% | |||||||
| Brazil 0.5% | |||||||
| d Alpargatas SA, 3.003%, pfd | Textiles, Apparel & Luxury Goods | 1,517,800 | 4,668,074 | ||||
| Total Investments before Short Term | |||||||
| Investments (Cost $779,278,695) | 895,919,732 | ||||||
| �� | Principal | ||||||
| Amount | |||||||
| Short Term Investments 6.0% | |||||||
| U.S. Government and Agency Securities | |||||||
| 3.6% | |||||||
| United States 3.6% | |||||||
| e FFCB, 1/03/17 | $ | 22,700,000 | 22,700,000 | ||||
| e FHLMC, 1/03/17 | 11,200,000 | 11,200,000 | |||||
| Total U.S. Government and Agency | |||||||
| Securities (Cost $33,898,921) | 33,900,000 | ||||||
| Shares | |||||||
| f Investments from Cash Collateral Received | |||||||
| for Loaned Securities (Cost $22,128,772) | |||||||
| 2.4% | |||||||
| Money Market Funds 2.4% | |||||||
| United States 2.4% | |||||||
| g,h Institutional Fiduciary Trust Money Market Portfolio, 0.09% . | 22,128,772 | 22,128,772 | |||||
| Total Investments (Cost $835,306,388) | |||||||
| 102.2% | 951,948,504 | ||||||
| Other Assets, less Liabilities (2.2)% | (20,069,747 | ) | |||||
| Net Assets 100.0% | $ | 931,878,757 | |||||
ftinstitutional.com
Annual Report
43
TEMPLETON INSTITUTIONAL FUNDS
STATEMENT OF INVESTMENTS
Foreign Smaller Companies Series (continued)
See Abbreviations on page 73.
aA portion or all of the security is on loan at December 31, 2016. See Note 1(d).
bNon-income producing.
cSecurity was purchased pursuant to Regulation S under the Securities Act of 1933, which exempts from registration securities offered and sold outside of the United States.
Such a security cannot be sold in the United States without either an effective registration statement filed pursuant to the Securities Act of 1933, or pursuant to an exemption
from registration. These securities have been deemed liquid under guidelines approved by the Trust’s Board of Trustees. At December 31, 2016, the aggregate value of these
securities was $32,276,856, representing 3.4% of net assets.
dVariable rate security. The rate shown represents the yield at period end.
eThe security was issued on a discount basis with no stated coupon rate.
fSee Note 1(d) regarding securities on loan.
gSee Note 3(d) regarding investments in affiliated management investment companies.
hThe rate shown is the annualized seven-day yield at period end.
44 Annual Report | The accompanying notes are an integral part of these financial statements. ftinstitutional.com
TEMPLETON INSTITUTIONAL FUNDS
| Financial Highlights | |||||||||||||||
| Global Equity Series | |||||||||||||||
| Year Ended December 31, | |||||||||||||||
| 2016 | 2015 | 2014 | 2013 | 2012 | |||||||||||
| Per share operating performance | |||||||||||||||
| (for a share outstanding throughout the year) | |||||||||||||||
| Net asset value, beginning of year | $ | 8.73 | $ | 9.64 | $ | 11.53 | $ | 9.88 | $ | 8.06 | |||||
| Income from investment operationsa: | |||||||||||||||
| Net investment incomeb | 0.16 | 0.14 | 0.25 | c | 0.14 | 0.16 | |||||||||
| Net realized and unrealized gains (losses) | 0.25 | (0.43 | ) | (0.46 | ) | 2.84 | 1.82 | ||||||||
| Total from investment operations | 0.41 | (0.29 | ) | (0.21 | ) | 2.98 | 1.98 | ||||||||
| Less distributions from: | |||||||||||||||
| Net investment income | (0.15 | ) | (0.16 | ) | (0.26 | ) | (0.13 | ) | (0.16 | ) | |||||
| Net realized gains | (0.04 | ) | (0.46 | ) | (1.42 | ) | (1.20 | ) | — | ||||||
| Total distributions | (0.19 | ) | (0.62 | ) | (1.68 | ) | (1.33 | ) | (0.16 | ) | |||||
| Net asset value, end of year. | $ | 8.95 | $ | 8.73 | $ | 9.64 | $ | 11.53 | $ | 9.88 | |||||
| Total return | 4.67 | % | (3.43 | )% | (2.01 | )% | 30.43 | % | 24.63 | % | |||||
| Ratios to average net assets | |||||||||||||||
| Expenses before waiver and payments by affiliates | 0.84 | % | 0.81 | % | 0.92 | % | 0.94 | % | 0.94 | % | |||||
| Expenses net of waiver and payments by affiliates | 0.84 | % | 0.81 | %d,e | 0.92 | % | 0.90 | %e | 0.81 | %e | |||||
| Net investment income | 1.82 | % | 1.47 | % | 2.21 | %c | 1.26 | % | 1.80 | % | |||||
| Supplemental data | |||||||||||||||
| Net assets, end of year (000’s) | $ | 280,709 | $ | 282,830 | $ | 467,375 | $ | 491,602 | $ | 432,585 | |||||
| Portfolio turnover rate | 27.91 | % | 36.88 | % | 35.50 | % | 42.66 | % | 45.23 | % | |||||
aThe amount shown for a share outstanding throughout the period may not correlate with the Statement of Operations for the period due to the timing of sales and
repurchases of the Fund’s shares in relation to income earned and/or fluctuating fair value of the investments of the Fund.
bBased on average daily shares outstanding.
cNet investment income per share includes approximately $0.09 per share related to income received in the form of special dividends in connection with certain Fund
holdings. Excluding this amount, the ratio of net investment income to average net assets would have been 1.43%.
dBenefit of waiver and payments by affiliates rounds to less than 0.01%.
eBenefit of expense reduction rounds to less than 0.01%.
ftinstitutional.com The accompanying notes are an integral part of these financial statements. | Annual Report 45
| TEMPLETON INSTITUTIONAL FUNDS | ||||
| Statement of Investments, December 31, 2016 | ||||
| Global Equity Series | ||||
| Industry | Shares | Value | ||
| Common Stocks 96.4% | ||||
| Austria 0.5% | ||||
| UNIQA Insurance Group AG | Insurance | 195,108 | $ | 1,478,107 |
| Belgium 0.4% | ||||
| UCB SA | Pharmaceuticals | 15,470 | 991,465 | |
| China 4.5% | ||||
| a Baidu Inc., ADR | Internet Software & Services | 15,660 | 2,574,661 | |
| China Life Insurance Co. Ltd., H. | Insurance | 567,000 | 1,477,000 | |
| China Mobile Ltd | Wireless Telecommunication Services | 65,500 | 694,319 | |
| China Telecom Corp. Ltd., H | Diversified Telecommunication Services | 6,472,000 | 2,987,911 | |
| a GCL-Poly Energy Holdings Ltd | Semiconductors & Semiconductor Equipment | 2,261,000 | 271,163 | |
| Haier Electronics Group Co. Ltd | Household Durables | 721,000 | 1,134,335 | |
| Kunlun Energy Co. Ltd | Oil, Gas & Consumable Fuels | 1,570,000 | 1,174,286 | |
| Shanghai Pharmaceuticals Holding Co. Ltd., H | Health Care Providers & Services | 509,200 | 1,167,525 | |
| Sinopharm Group Co. Ltd | Health Care Providers & Services | 311,600 | 1,283,851 | |
| 12,765,051 | ||||
| France 8.3% | ||||
| AXA SA | Insurance | 130,035 | 3,281,695 | |
| BNP Paribas SA. | Banks | 71,980 | 4,585,897 | |
| Cie Generale des Etablissements Michelin, B | Auto Components | 19,338 | 2,150,725 | |
| Compagnie de Saint-Gobain | Building Products | 61,610 | 2,868,876 | |
| Credit Agricole SA | Banks | 175,390 | 2,173,944 | |
| Sanofi | Pharmaceuticals | 36,770 | 2,975,214 | |
| Technip SA | Energy Equipment & Services | 22,040 | 1,572,547 | |
| Total SA, B | Oil, Gas & Consumable Fuels | 47,170 | 2,418,084 | |
| Zodiac Aerospace | Aerospace & Defense | 55,090 | 1,264,522 | |
| 23,291,504 | ||||
| Germany 6.6% | ||||
| Bayer AG | Pharmaceuticals | 29,510 | 3,078,028 | |
| Deutsche Lufthansa AG | Airlines | 105,360 | 1,360,250 | |
| HeidelbergCement AG | Construction Materials | 13,410 | 1,250,569 | |
| a innogy SE | Multi-Utilities | 40,680 | 1,412,943 | |
| Lanxess AG | Chemicals | 59,640 | 3,912,662 | |
| Merck KGaA | Pharmaceuticals | 25,730 | 2,684,298 | |
| a MorphoSys AG | Life Sciences Tools & Services | 25,980 | 1,332,638 | |
| SAP SE | Software | 20,120 | 1,753,110 | |
| Siemens AG, ADR | Industrial Conglomerates | 13,790 | 1,688,172 | |
| 18,472,670 | ||||
| Hong Kong 0.5% | ||||
| CK Hutchison Holdings Ltd | Industrial Conglomerates | 114,540 | 1,298,351 | |
| India 0.1% | ||||
| Housing Development Finance Corp. Ltd | Thrifts & Mortgage Finance | 21,285 | 395,477 | |
| Ireland 1.3% | ||||
| CRH PLC | Construction Materials | 103,830 | 3,600,331 | |
| Israel 1.2% | ||||
| Teva Pharmaceutical Industries Ltd., ADR | Pharmaceuticals | 93,346 | 3,383,792 | |
| Italy 1.2% | ||||
| Eni SpA | Oil, Gas & Consumable Fuels | 213,988 | 3,483,197 | |
46 Annual Report
ftinstitutional.com
TEMPLETON INSTITUTIONAL FUNDS
STATEMENT OF INVESTMENTS
| Global Equity Series (continued) | ||||
| Industry | Shares | Value | ||
| Common Stocks (continued) | ||||
| Japan 9.6% | ||||
| a IHI Corp | Machinery | 496,000 | $ | 1,289,910 |
| INPEX Corp | Oil, Gas & Consumable Fuels | 158,200 | 1,584,774 | |
| Konica Minolta Inc | Technology Hardware, Storage & Peripherals | 342,700 | 3,403,693 | |
| Nissan Motor Co. Ltd | Automobiles | 366,300 | 3,683,525 | |
| Omron Corp | Electronic Equipment, Instruments | |||
| & Components | 79,400 | 3,046,401 | ||
| Panasonic Corp | Household Durables | 264,100 | 2,687,428 | |
| SoftBank Group Corp | Wireless Telecommunication Services | 57,000 | 3,786,347 | |
| Sumitomo Metal Mining Co. Ltd | Metals & Mining | 147,000 | 1,895,111 | |
| Suntory Beverage & Food Ltd | Beverages | 73,700 | 3,060,982 | |
| a Toshiba Corp | Industrial Conglomerates | 536,000 | 1,298,102 | |
| Toyota Motor Corp | Automobiles | 22,600 | 1,329,764 | |
| 27,066,037 | ||||
| Netherlands 2.8% | ||||
| Akzo Nobel NV | Chemicals | 40,060 | 2,503,356 | |
| ING Groep NV | Banks | 151,460 | 2,130,726 | |
| NN Group NV | Insurance | 42,340 | 1,434,292 | |
| a QIAGEN NV | Life Sciences Tools & Services | 59,790 | 1,678,466 | |
| 7,746,840 | ||||
| Norway 1.4% | ||||
| Telenor ASA | Diversified Telecommunication Services | 160,630 | 2,398,573 | |
| Yara International ASA | Chemicals | 35,400 | 1,393,217 | |
| 3,791,790 | ||||
| Portugal 1.5% | ||||
| Galp Energia SGPS SA, B. | Oil, Gas & Consumable Fuels | 288,760 | 4,311,394 | |
| Singapore 0.6% | ||||
| Singapore Telecommunications Ltd | Diversified Telecommunication Services | 627,204 | 1,581,114 | |
| South Korea 3.8% | ||||
| Hana Financial Group Inc | Banks | 60,590 | 1,568,383 | |
| Hyundai Mobis Co. Ltd | Auto Components | 10,257 | 2,242,979 | |
| Samsung Electronics Co. Ltd | Technology Hardware, Storage & Peripherals | 4,639 | 6,924,368 | |
| 10,735,730 | ||||
| Spain 0.7% | ||||
| Telefonica SA. | Diversified Telecommunication Services | 219,240 | 2,034,636 | |
| Sweden 0.2% | ||||
| Getinge AB, B | Health Care Equipment & Supplies | 31,860 | 510,994 | |
| Switzerland 4.0% | ||||
| ABB Ltd | Electrical Equipment | 137,740 | 2,905,199 | |
| a Basilea Pharmaceutica AG | Biotechnology | 13,790 | 989,836 | |
| a Glencore PLC | Metals & Mining | 376,180 | 1,285,233 | |
| Roche Holding AG | Pharmaceuticals | 14,360 | 3,279,788 | |
| UBS Group AG | Capital Markets | 173,090 | 2,710,905 | |
| 11,170,961 | ||||
| Taiwan 0.9% | ||||
| Taiwan Semiconductor Manufacturing Co. Ltd., ADR | Semiconductors & Semiconductor Equipment | 90,240 | 2,594,400 | |
| Thailand 0.7% | ||||
| Bangkok Bank PCL, NVDR | Banks | 430,400 | 1,914,890 | |
ftinstitutional.com
Annual Report
47
TEMPLETON INSTITUTIONAL FUNDS
STATEMENT OF INVESTMENTS
| Global Equity Series (continued) | ||||
| Industry | Shares | Value | ||
| Common Stocks (continued) | ||||
| United Kingdom 12.2% | ||||
| Aviva PLC | Insurance | 248,300 | $ | 1,487,744 |
| BAE Systems PLC | Aerospace & Defense | 277,640 | 2,022,994 | |
| Barclays PLC | Banks | 1,013,040 | 2,788,463 | |
| BP PLC | Oil, Gas & Consumable Fuels | 946,450 | 5,941,347 | |
| GlaxoSmithKline PLC | Pharmaceuticals | 74,600 | 1,435,416 | |
| HSBC Holdings PLC | Banks | 552,800 | 4,437,656 | |
| Kingfisher PLC | Specialty Retail | 287,040 | 1,238,627 | |
| Petrofac Ltd | Energy Equipment & Services | 123,760 | 1,324,823 | |
| Royal Dutch Shell PLC, B | Oil, Gas & Consumable Fuels | 166,850 | 4,838,275 | |
| Sky PLC | Media | 205,010 | 2,502,687 | |
| a Standard Chartered PLC | Banks | 256,875 | 2,099,839 | |
| a Subsea 7 SA | Energy Equipment & Services | 126,570 | 1,601,354 | |
| Vodafone Group PLC | Wireless Telecommunication Services | 1,038,402 | 2,556,392 | |
| 34,275,617 | ||||
| United States 33.4% | ||||
| Allegheny Technologies Inc | Metals & Mining | 91,670 | 1,460,303 | |
| a Allergan PLC | Pharmaceuticals | 16,340 | 3,431,563 | |
| a Alphabet Inc., A | Internet Software & Services | 6,580 | 5,214,321 | |
| American International Group Inc | Insurance | 47,690 | 3,114,634 | |
| Amgen Inc | Biotechnology | 24,000 | 3,509,040 | |
| Apache Corp | Oil, Gas & Consumable Fuels | 33,750 | 2,142,113 | |
| Apple Inc | Technology Hardware, Storage & Peripherals | 43,490 | 5,037,012 | |
| Applied Materials Inc | Semiconductors & Semiconductor Equipment | 53,820 | 1,736,771 | |
| Baker Hughes Inc | Energy Equipment & Services | 21,290 | 1,383,211 | |
| Capital One Financial Corp | Consumer Finance | 47,340 | 4,129,942 | |
| a Celgene Corp | Biotechnology | 19,060 | 2,206,195 | |
| Citigroup Inc | Banks | 91,770 | 5,453,891 | |
| Comcast Corp., A | Media | 67,320 | 4,648,446 | |
| ConocoPhillips | Oil, Gas & Consumable Fuels | 49,170 | 2,465,384 | |
| Devon Energy Corp | Oil, Gas & Consumable Fuels | 19,040 | 869,557 | |
| Eastman Chemical Co | Chemicals | 17,570 | 1,321,440 | |
| Eli Lilly & Co | Pharmaceuticals | 41,070 | 3,020,698 | |
| Gilead Sciences Inc | Biotechnology | 46,910 | 3,359,225 | |
| JPMorgan Chase & Co | Banks | 70,810 | 6,110,195 | |
| a Knowles Corp | Electronic Equipment, Instruments | |||
| & Components | 106,380 | 1,777,610 | ||
| Medtronic PLC | Health Care Equipment & Supplies | 26,630 | 1,896,855 | |
| Microsoft Corp | Software | 89,980 | 5,591,357 | |
| Morgan Stanley | Capital Markets | 49,220 | 2,079,545 | |
| Oracle Corp | Software | 127,820 | 4,914,679 | |
| Pfizer Inc | Pharmaceuticals | 38,800 | 1,260,224 | |
| Rockwell Collins Inc | Aerospace & Defense | 25,150 | 2,332,914 | |
| Stanley Black & Decker Inc | Machinery | 20,920 | 2,399,315 | |
| SunTrust Banks Inc | Banks | 64,630 | 3,544,956 | |
| Twenty-First Century Fox Inc., A. | Media | 68,120 | 1,910,085 | |
| Voya Financial Inc | Diversified Financial Services | 71,470 | 2,803,053 | |
| Walgreens Boots Alliance Inc | Food & Staples Retailing | 30,990 | 2,564,732 | |
| 93,689,266 | ||||
| Total Common Stocks (Cost $236,239,210) | 270,583,614 | |||
48 Annual Report
ftinstitutional.com
TEMPLETON INSTITUTIONAL FUNDS
STATEMENT OF INVESTMENTS
| Global Equity Series (continued) | |||||
| Industry | Shares | Value | |||
| Preferred Stocks (Cost $1,775,191) 0.4% | |||||
| Germany 0.4% | |||||
| b Draegerwerk AG & Co. KGAA, 0.239%, pfd | Health Care Equipment & Supplies | 14,500 | $ | 1,212,771 | |
| Total Investments before Short Term | |||||
| Investments (Cost $238,014,401) | 271,796,385 | ||||
| Principal | |||||
| Amount | |||||
| Short Term Investments 3.0% | |||||
| Time Deposits 3.0% | |||||
| United States 3.0% | |||||
| Bank of Montreal, 0.42%, 1/03/17 | $ | 3,000,000 | 3,000,000 | ||
| Royal Bank of Canada, 0.48%, 1/03/17. | 5,300,000 | 5,300,000 | |||
| Total Time Deposits (Cost $8,300,000) | 8,300,000 | ||||
| Total Investments (Cost $246,314,401) 99.8% . | 280,096,385 | ||||
| Other Assets, less Liabilities 0.2% | 612,984 | ||||
| Net Assets 100.0%. | $ | 280,709,369 | |||
See Abbreviations on page 73.
aNon-income producing.
bVariable rate security. The rate shown represents the yield at period end.
ftinstitutional.com
The accompanying notes are an integral part of these financial statements. | Annual Report 49
TEMPLETON INSTITUTIONAL FUNDS
| Financial Highlights | |||||||||||||||
| International Equity Series | |||||||||||||||
| Year Ended December 31, | |||||||||||||||
| 2016 | 2015 | 2014 | 2013 | 2012 | |||||||||||
| Primary Shares | |||||||||||||||
| Per share operating performance | |||||||||||||||
| (for a share outstanding throughout the year) | |||||||||||||||
| Net asset value, beginning of year | $ | 19.05 | $ | 20.05 | $ | 22.72 | $ | 19.60 | $ | 17.04 | |||||
| Income from investment operationsa: | |||||||||||||||
| Net investment incomeb | 0.45 | 0.45 | 0.74 | c | 0.45 | 0.48 | |||||||||
| Net realized and unrealized gains (losses) | (0.20 | ) | (0.98 | ) | (2.27 | ) | 3.36 | 2.68 | |||||||
| Total from investment operations | 0.25 | (0.53 | ) | (1.53 | ) | 3.81 | 3.16 | ||||||||
| Less distributions from: | |||||||||||||||
| Net investment income | (0.46 | ) | (0.47 | ) | (0.79 | ) | (0.44 | ) | (0.58 | ) | |||||
| Net realized gains | (0.19 | ) | — | (0.35 | ) | (0.25 | ) | (0.02 | ) | ||||||
| Total distributions | (0.65 | ) | (0.47 | ) | (1.14 | ) | (0.69 | ) | (0.60 | ) | |||||
| Net asset value, end of year. | $ | 18.65 | $ | 19.05 | $ | 20.05 | $ | 22.72 | $ | 19.60 | |||||
| Total return | 1.30 | % | (2.67 | )% | (6.78 | )% | 19.51 | % | 18.55 | % | |||||
| Ratios to average net assets | |||||||||||||||
| Expenses | 0.78 | %d | 0.78 | %d | 0.78 | %d | 0.79 | % | 0.80 | % | |||||
| Net investment income | 2.44 | % | 2.16 | % | 3.27 | %c | 2.12 | % | 2.66 | % | |||||
| Supplemental data | |||||||||||||||
| Net assets, end of year (000’s) | $ | 4,539,205 | $ | 5,077,937 | $ | 6,210,850 | $ | 6,815,920 | $ | 5,820,506 | |||||
| Portfolio turnover rate | 14.88 | % | 16.16 | % | 14.97 | % | 15.89 | % | 11.94 | % | |||||
aThe amount shown for a share outstanding throughout the period may not correlate with the Statement of Operations for the period due to the timing of sales and
repurchases of the Fund’s shares in relation to income earned and/or fluctuating fair value of the investments of the Fund.
bBased on average daily shares outstanding.
cNet investment income per share includes approximately $0.29 per share related to income received in the form of special dividends in connection with certain Fund
holdings. Excluding this amount, the ratio of net investment income to average net assets would have been 2.00%.
dBenefit of waiver and payments by affiliates rounds to less than 0.01%.
50 Annual Report | The accompanying notes are an integral part of these financial statements.
ftinstitutional.com
| TEMPLETON INSTITUTIONAL FUNDS | |||||||||||||||
| FINANCIAL HIGHLIGHTS | |||||||||||||||
| International Equity Series (continued) | |||||||||||||||
| Year Ended December 31, | |||||||||||||||
| 2016 | 2015 | 2014 | 2013 | 2012 | |||||||||||
| Service Shares | |||||||||||||||
| Per share operating performance | |||||||||||||||
| (for a share outstanding throughout the year) | |||||||||||||||
| Net asset value, beginning of year | $ | 19.11 | $ | 20.11 | $ | 22.79 | $ | 19.62 | $ | 17.02 | |||||
| Income from investment operationsa: | |||||||||||||||
| Net investment incomeb | 0.42 | 0.36 | 0.71 | c | 0.48 | 0.55 | |||||||||
| Net realized and unrealized gains (losses) | (0.20 | ) | (0.92 | ) | (2.28 | ) | 3.30 | 2.59 | |||||||
| Total from investment operations | 0.22 | (0.56 | ) | (1.57 | ) | 3.78 | 3.14 | ||||||||
| Less distributions from: | |||||||||||||||
| Net investment income | (0.42 | ) | (0.44 | ) | (0.76 | ) | (0.36 | ) | (0.52 | ) | |||||
| Net realized gains | (0.19 | ) | — | (0.35 | ) | (0.25 | ) | (0.02 | ) | ||||||
| Total distributions | (0.61 | ) | (0.44 | ) | (1.11 | ) | (0.61 | ) | (0.54 | ) | |||||
| Net asset value, end of year. | $ | 18.72 | $ | 19.11 | $ | 20.11 | $ | 22.79 | $ | 19.62 | |||||
| Total return | 1.15 | % | (2.80 | )% | (6.95 | )% | 19.31 | % | 18.45 | % | |||||
| Ratios to average net assets | |||||||||||||||
| Expenses | 0.93 | %d | 0.93 | %d | 0.93 | %d | 0.94 | % | 0.95 | % | |||||
| Net investment income | 2.29 | % | 2.01 | % | 3.12 | %c | 1.97 | % | 2.51 | % | |||||
| Supplemental data | |||||||||||||||
| Net assets, end of year (000’s) | $ | 8,624 | $ | 12,525 | $ | 6,985 | $ | 7,705 | $ | 19,637 | |||||
| Portfolio turnover rate | 14.88 | % | 16.16 | % | 14.97 | % | 15.89 | % | 11.94 | % | |||||
aThe amount shown for a share outstanding throughout the period may not correlate with the Statement of Operations for the period due to the timing of sales and
repurchases of the Fund’s shares in relation to income earned and/or fluctuating fair value of the investments of the Fund.
bBased on average daily shares outstanding.
cNet investment income per share includes approximately $0.29 per share related to income received in the form of special dividends in connection with certain Fund
holdings. Excluding this amount, the ratio of net investment income to average net assets would have been 1.85%.
dBenefit of waiver and payments by affiliates rounds to less than 0.01%.
ftinstitutional.com
The accompanying notes are an integral part of these financial statements. | Annual Report 51
| TEMPLETON INSTITUTIONAL FUNDS | ||||
| Statement of Investments, December 31, 2016 | ||||
| International Equity Series | ||||
| Industry | Shares | Value | ||
| Common Stocks 97.4% | ||||
| Brazil 0.3% | ||||
| Embraer SA, ADR | Aerospace & Defense | 675,152 | $ | 12,996,676 |
| Canada 1.9% | ||||
| Silver Wheaton Corp | Metals & Mining | 1,472,500 | 28,445,525 | |
| Suncor Energy Inc | Oil, Gas & Consumable Fuels | 1,722,160 | 56,302,371 | |
| 84,747,896 | ||||
| China 5.8% | ||||
| a Baidu Inc., ADR | Internet Software & Services | 219,160 | 36,032,095 | |
| China Life Insurance Co. Ltd., H | Insurance | 12,715,000 | 33,121,800 | |
| China Mobile Ltd | Wireless Telecommunication Services | 4,469,440 | 47,377,390 | |
| China Telecom Corp. Ltd., H | Diversified Telecommunication Services | 118,888,040 | 54,886,735 | |
| a,b GCL-Poly Energy Holdings Ltd | Semiconductors & Semiconductor Equipment | 98,443,370 | 11,806,349 | |
| Haier Electronics Group Co. Ltd | Household Durables | 22,115,700 | 34,794,189 | |
| Sinopharm Group Co. Ltd | Health Care Providers & Services | 11,231,200 | 46,274,659 | |
| 264,293,217 | ||||
| France 10.0% | ||||
| AXA SA | Insurance | 2,526,520 | 63,761,825 | |
| BNP Paribas SA | Banks | 1,537,970 | 97,985,157 | |
| Cie Generale des Etablissements Michelin, B | Auto Components | 611,289 | 67,986,056 | |
| Compagnie de Saint-Gobain. | Building Products | 1,039,270 | 48,393,721 | |
| Sanofi | Pharmaceuticals | 876,559 | 70,926,050 | |
| Total SA, B | Oil, Gas & Consumable Fuels | 1,343,813 | 68,888,130 | |
| Zodiac Aerospace | Aerospace & Defense | 1,532,710 | 35,181,430 | |
| 453,122,369 | ||||
| Germany 12.2% | ||||
| Bayer AG | Pharmaceuticals | 680,866 | 71,017,443 | |
| a Deutsche Boerse AG | Capital Markets | 332,790 | 27,151,532 | |
| Deutsche Lufthansa AG | Airlines | 2,334,180 | 30,135,416 | |
| Deutsche Post AG | Air Freight & Logistics | 703,147 | 23,109,253 | |
| HeidelbergCement AG | Construction Materials | 479,630 | 44,728,606 | |
| Infineon Technologies AG. | Semiconductors & Semiconductor Equipment | 2,619,154 | 45,499,475 | |
| a innogy SE | Multi-Utilities | 1,303,350 | 45,269,413 | |
| Lanxess AG | Chemicals | 763,100 | 50,062,922 | |
| Merck KGaA | Pharmaceuticals | 682,698 | 71,222,896 | |
| Metro AG | Food & Staples Retailing | 1,280,150 | 42,544,167 | |
| SAP SE | Software | 549,651 | 47,892,564 | |
| Siemens AG | Industrial Conglomerates | 453,990 | 55,793,988 | |
| 554,427,675 | ||||
| Hong Kong 2.2% | ||||
| AIA Group Ltd | Insurance | 5,042,710 | 28,450,392 | |
| Cheung Kong Property Holdings Ltd | Real Estate Management & Development | 3,384,243 | 20,751,919 | |
| CK Hutchison Holdings Ltd | Industrial Conglomerates | 4,661,743 | 52,842,505 | |
| 102,044,816 | ||||
| India 1.0% | ||||
| Housing Development Finance Corp. Ltd | Thrifts & Mortgage Finance | 2,341,215 | 43,499,928 | |
| Ireland 1.7% | ||||
| CRH PLC | Construction Materials | 2,234,082 | 77,883,130 | |
| Israel 1.3% | ||||
| Teva Pharmaceutical Industries Ltd., ADR | Pharmaceuticals | 1,673,739 | 60,673,039 | |
52 Annual Report
ftinstitutional.com
TEMPLETON INSTITUTIONAL FUNDS
STATEMENT OF INVESTMENTS
| International Equity Series (continued) | ||||
| Industry | Shares | Value | ||
| Common Stocks (continued) | ||||
| Italy 2.5% | ||||
| Eni SpA | Oil, Gas & Consumable Fuels | 3,012,415 | $ | 49,034,687 |
| Intesa Sanpaolo SpA | Banks | 8,219,841 | 20,982,271 | |
| Tenaris SA | Energy Equipment & Services | 2,568,114 | 45,855,815 | |
| 115,872,773 | ||||
| Japan 10.7% | ||||
| INPEX Corp | Oil, Gas & Consumable Fuels | 4,299,300 | 43,068,397 | |
| Konica Minolta Inc | Technology Hardware, Storage & Peripherals | 3,730,500 | 37,051,290 | |
| Mitsui Fudosan Co. Ltd | Real Estate Management & Development | 943,000 | 21,821,421 | |
| Nissan Motor Co. Ltd | Automobiles | 6,947,500 | 69,864,290 | |
| Omron Corp | Electronic Equipment, Instruments | |||
| & Components | 1,056,100 | 40,520,198 | ||
| Panasonic Corp | Household Durables | 2,397,100 | 24,392,407 | |
| SoftBank Group Corp | Wireless Telecommunication Services | 825,400 | 54,828,958 | |
| Sumitomo Metal Mining Co. Ltd | Metals & Mining | 3,196,000 | 41,202,549 | |
| Sumitomo Rubber Industries Ltd | Auto Components | 1,872,600 | 29,732,201 | |
| Suntory Beverage & Food Ltd | Beverages | 1,518,000 | 63,047,093 | |
| a Toshiba Corp | Industrial Conglomerates | 11,992,000 | 29,042,604 | |
| Toyota Motor Corp | Automobiles | 549,120 | 32,309,743 | |
| 486,881,151 | ||||
| Mexico 0.2% | ||||
| Industrias Penoles SA | Metals & Mining | 485,150 | 9,032,456 | |
| Netherlands 7.2% | ||||
| Akzo Nobel NV | Chemicals | 1,000,620 | 62,528,899 | |
| a ASR Nederland NV | Insurance | 2,022,660 | 48,098,286 | |
| ING Groep NV | Banks | 6,076,310 | 85,481,003 | |
| NN Group NV | Insurance | 1,054,680 | 35,727,894 | |
| a QIAGEN NV | Life Sciences Tools & Services | 1,532,251 | 43,014,415 | |
| SBM Offshore NV | Energy Equipment & Services | 3,221,837 | 50,562,100 | |
| 325,412,597 | ||||
| Norway 2.3% | ||||
| Statoil ASA | Oil, Gas & Consumable Fuels | 1,253,730 | 22,987,711 | |
| Telenor ASA | Diversified Telecommunication Services | 3,973,408 | 59,332,056 | |
| Yara International ASA. | Chemicals | 600,276 | 23,624,706 | |
| 105,944,473 | ||||
| Singapore 3.2% | ||||
| DBS Group Holdings Ltd | Banks | 4,206,913 | 50,381,844 | |
| Singapore Telecommunications Ltd | Diversified Telecommunication Services | 24,029,860 | 60,576,690 | |
| United Overseas Bank Ltd | Banks | 2,451,700 | 34,542,910 | |
| 145,501,444 | ||||
| South Korea 6.2% | ||||
| Hana Financial Group Inc | Banks | 860,218 | 22,266,889 | |
| Hyundai Mobis Co. Ltd | Auto Components | 244,635 | 53,496,270 | |
| Hyundai Motor Co | Automobiles | 224,888 | 27,196,945 | |
| KB Financial Group Inc | Banks | 1,021,878 | 36,227,954 | |
| Samsung Electronics Co. Ltd | Technology Hardware, Storage & Peripherals | 94,302 | 140,759,164 | |
| 279,947,222 | ||||
| Spain 0.9% | ||||
| Telefonica SA | Diversified Telecommunication Services | 4,318,875 | 40,080,903 | |
ftinstitutional.com
Annual Report
53
TEMPLETON INSTITUTIONAL FUNDS
STATEMENT OF INVESTMENTS
| International Equity Series (continued) | ||||
| Industry | Shares | Value | ||
| Common Stocks (continued) | ||||
| Sweden 0.7% | ||||
| Getinge AB, B | Health Care Equipment & Supplies | 1,971,701 | $ | 31,623,580 |
| Switzerland 5.5% | ||||
| a Glencore PLC | Metals & Mining | 5,465,640 | 18,673,557 | |
| Novartis AG | Pharmaceuticals | 573,974 | 41,763,034 | |
| Roche Holding AG. | Pharmaceuticals | 403,050 | 92,055,607 | |
| Swiss Re AG | Insurance | 482,615 | 45,730,899 | |
| UBS Group AG | Capital Markets | 3,467,890 | 54,313,477 | |
| 252,536,574 | ||||
| Taiwan 1.6% | ||||
| Catcher Technology Co. Ltd | Technology Hardware, Storage & Peripherals | 4,630,000 | 31,956,123 | |
| Taiwan Semiconductor Manufacturing Co. Ltd | Semiconductors & Semiconductor Equipment | 7,643,492 | 42,745,807 | |
| 74,701,930 | ||||
| Thailand 0.9% | ||||
| Bangkok Bank PCL, fgn | Banks | 379,700 | 1,710,504 | |
| Bangkok Bank PCL, NVDR. | Banks | 8,696,100 | 38,689,761 | |
| 40,400,265 | ||||
| United Kingdom 18.0% | ||||
| Aviva PLC. | Insurance | 5,533,969 | 33,157,986 | |
| BAE Systems PLC. | Aerospace & Defense | 7,987,571 | 58,200,583 | |
| Barclays PLC | Banks | 19,696,040 | 54,214,709 | |
| BP PLC | Oil, Gas & Consumable Fuels | 21,341,181 | 133,969,434 | |
| GlaxoSmithKline PLC. | Pharmaceuticals | 2,386,572 | 45,921,221 | |
| HSBC Holdings PLC | Banks | 9,217,703 | 73,996,004 | |
| International Consolidated Airlines Group SA | Airlines | 2,217,240 | 12,042,334 | |
| Johnson Matthey PLC | Chemicals | 556,290 | 21,805,160 | |
| Kingfisher PLC | Specialty Retail | 7,737,781 | 33,389,847 | |
| a LivaNova PLC | Health Care Equipment & Supplies | 689,590 | 31,010,862 | |
| Petrofac Ltd | Energy Equipment & Services | 2,985,210 | 31,956,008 | |
| Royal Dutch Shell PLC, B | Oil, Gas & Consumable Fuels | 1,494,428 | 43,335,050 | |
| Royal Dutch Shell PLC, B, ADR. | Oil, Gas & Consumable Fuels | 1,235,401 | 71,616,196 | |
| Sky PLC | Media | 2,945,320 | 35,955,389 | |
| a Standard Chartered PLC | Banks | 6,976,151 | 57,026,945 | |
| a Tesco PLC | Food & Staples Retailing | 12,718,170 | 32,406,938 | |
| Vodafone Group PLC | Wireless Telecommunication Services | 19,226,384 | 47,332,519 | |
| 817,337,185 | ||||
| United States 1.1% | ||||
| Chubb Ltd | Insurance | 397,490 | 52,516,379 | |
| Total Common Stocks | ||||
| (Cost $3,452,717,120) | 4,431,477,678 | |||
54 Annual Report
ftinstitutional.com
TEMPLETON INSTITUTIONAL FUNDS
STATEMENT OF INVESTMENTS
| International Equity Series (continued) | |||||
| Principal | |||||
| Amount | Value | ||||
| Short Term Investments 1.6% | |||||
| U.S. Government and Agency Securities | |||||
| (Cost $16,390,454) 0.4% | |||||
| United States 0.4% | |||||
| c FHLB, 1/03/17. | $ | 16,391,000 | $ | 16,391,000 | |
| Total Investments before Money Market | |||||
| Funds (Cost $3,469,107,574) | 4,447,868,678 | ||||
| Shares | |||||
| Money Market Funds (Cost $46,090,514) | |||||
| 1.0% | |||||
| United States 1.0% | |||||
| d,e Institutional Fiduciary Trust Money Market Portfolio, | |||||
| 0.09% | 46,090,514 | 46,090,514 | |||
| f Investments from Cash Collateral | |||||
| Received for Loaned Securities | |||||
| (Cost $9,133,838) 0.2% | |||||
| Money Market Funds 0.2% | |||||
| United States 0.2% | |||||
| d,e Institutional Fiduciary Trust Money Market Portfolio, | |||||
| 0.09% | 9,133,838 | 9,133,838 | |||
| Total Investments (Cost $3,524,331,926) | |||||
| 99.0% | 4,503,093,030 | ||||
| Other Assets, less Liabilities 1.0% | 44,735,632 | ||||
| Net Assets 100.0% | $ | 4,547,828,662 | |||
See Abbreviations on page 73.
aNon-income producing.
bA portion or all of the security is on loan at December 31, 2016. See Note 1(d).
cThe security was issued on a discount basis with no stated coupon rate.
dSee Note 3(d) regarding investments in affiliated management investment companies.
eThe rate shown is the annualized seven-day yield at period end.
fSee Note 1(d) regarding securities on loan.
ftinstitutional.com The accompanying notes are an integral part of these financial statements. | Annual Report 55
TEMPLETON INSTITUTIONAL FUNDS
| Financial Statements | ||||||
| Statements of Assets and Liabilities | ||||||
| December 31, 2016 | ||||||
| Emerging | Foreign Smaller | |||||
| Markets Series | Companies Series | |||||
| Assets: | ||||||
| Investments in securities: | ||||||
| Cost - Unaffiliated issuers | $ | 34,707,470 | $ | 813,177,616 | ||
| Cost - Non-controlled affiliates (Note 3d) | 234,539 | 22,128,772 | ||||
| Total cost of investments | $ | 34,942,009 | $ | 835,306,388 | ||
| Value - Unaffiliated issuers | $ | 40,604,866 | $ | 929,819,732 | ||
| Value - Non-controlled affiliates (Note 3d) | 234,539 | 22,128,772 | ||||
| Total value of investments* | 40,839,405 | 951,948,504 | ||||
| Cash | — | 146,544 | ||||
| Foreign currency, at value (cost $15,440 and $269,742, respectively) | 15,435 | 269,742 | ||||
| Receivables: | ||||||
| Investment securities sold | 3,352 | 217,250 | ||||
| Capital shares sold | 50,652 | 519,922 | ||||
| Dividends | 153,366 | 2,156,440 | ||||
| European Union tax reclaims | — | 732,671 | ||||
| Other assets | 5 | 95 | ||||
| Total assets. | 41,062,215 | 955,991,168 | ||||
| Liabilities: | ||||||
| Payables: | ||||||
| Investment securities purchased | — | 505,721 | ||||
| Capital shares redeemed | 2,144 | 632,370 | ||||
| Management fees | 37,859 | 748,524 | ||||
| Transfer agent fees | 58 | 486 | ||||
| Professional fees | 48,580 | 56,545 | ||||
| Payable upon return of securities loaned | — | 22,128,772 | ||||
| Deferred tax | 81,323 | — | ||||
| Accrued expenses and other liabilities | 12,982 | 39,993 | ||||
| Total liabilities | 182,946 | 24,112,411 | ||||
| Net assets, at value | $ | 40,879,269 | $ | 931,878,757 | ||
| Net assets consist of: | ||||||
| Paid-in capital | $ | 46,058,367 | $ | 821,770,639 | ||
| Distributions in excess of net investment income | (411,645 | ) | (4,326,825 | ) | ||
| Net unrealized appreciation (depreciation) | 5,795,772 | 116,505,708 | ||||
| Accumulated net realized gain (loss) | (10,563,225 | ) | (2,070,765 | ) | ||
| Net assets, at value | $ | 40,879,269 | $ | 931,878,757 | ||
| Shares outstanding | 9,545,834 | 46,756,116 | ||||
| Net asset value per share. | $ | 4.28 | $ | 19.93 | ||
| ||||
| *Includes securities loaned. | $ — | $ | 20,742,505 | |
| 56 | Annual Report | The accompanying notes are an integral part of these financial statements. | ftinstitutional.com | ||
| TEMPLETON INSTITUTIONAL FUNDS | |||||||
| FINANCIAL STATEMENTS | |||||||
| Statements of Assets and Liabilities (continued) | |||||||
| December 31, 2016 | |||||||
| Global | International | ||||||
| Equity Series | Equity Series | ||||||
| Assets: | |||||||
| Investments in securities: | |||||||
| Cost - Unaffiliated issuers | $ | 246,314,401 | $ | 3,469,107,574 | |||
| Cost - Non-controlled affiliates (Note 3d) | — | 55,224,352 | |||||
| Total cost of investments | $ | 246,314,401 | $ | 3,524,331,926 | |||
| Value - Unaffiliated issuers | $ | 280,096,385 | $ | 4,447,868,678 | |||
| Value - Non-controlled affiliates (Note 3d) | — | 55,224,352 | |||||
| Total value of investments* | 280,096,385 | 4,503,093,030 | |||||
| Cash | 139,844 | — | |||||
| Foreign currency, at value (cost $15,763 and $8,547,282, respectively) | 15,763 | 8,547,282 | |||||
| Receivables: | |||||||
| Investment securities sold | — | 68,087,950 | |||||
| Capital shares sold | 4,184 | 1,719,628 | |||||
| Dividends | 676,050 | 13,369,501 | |||||
| Foreign tax | 9,938 | — | |||||
| European Union tax reclaims | 49,971 | 7,238,903 | |||||
| Other assets. | 21 | 395 | |||||
| Total assets | 280,992,156 | 4,602,056,689 | |||||
| Liabilities: | |||||||
| Payables: | |||||||
| Investment securities purchased | 39,525 | 150,689 | |||||
| Capital shares redeemed | — | 41,682,255 | |||||
| Management fees | 184,291 | 2,948,733 | |||||
| Transfer agent fees | 48 | 29,057 | |||||
| Professional fees. | 47,276 | 67,711 | |||||
| Payable upon return of securities loaned | — | 9,133,838 | |||||
| Accrued expenses and other liabilities | 11,647 | 215,744 | |||||
| Total liabilities | 282,787 | 54,228,027 | |||||
| Net assets, at value | $ | 280,709,369 | $ | 4,547,828,662 | |||
| Net assets consist of: | |||||||
| Paid-in capital | $ | 251,575,249 | $ | 3,666,307,806 | |||
| Undistributed net investment income | 44,691 | — | |||||
| Distributions in excess of net investment income | — | (34,368,823 | ) | ||||
| Net unrealized appreciation (depreciation) | 33,736,392 | 977,608,156 | |||||
| Accumulated net realized gain (loss) | (4,646,963 | ) | (61,718,477 | ) | |||
| Net assets, at value | $ | 280,709,369 | $ | 4,547,828,662 | |||
| Shares outstanding | 31,357,946 | ||||||
| Net asset value per share | $ | 8.95 | |||||
| Primary Shares: | |||||||
| Net assets, at value | $ | 4,539,204,838 | |||||
| Shares outstanding | 243,355,415 | ||||||
| Net asset value per share | $ | 18.65 | |||||
| Service Shares: | |||||||
| Net assets, at value | $ | 8,623,824 | |||||
| Shares outstanding | 460,666 | ||||||
| Net asset value per share | $ | 18.72 | |||||
| *Includes securities loaned | $ | — | $ | 7,302,830 | |||
ftinstitutional.com
The accompanying notes are an integral part of these financial statements. | Annual Report 57
TEMPLETON INSTITUTIONAL FUNDS
FINANCIAL STATEMENTS
| Statements of Operations | ||||||
| for the year ended December 31, 2016 | ||||||
| Emerging | Foreign Smaller | |||||
| Markets Series | Companies Series | |||||
| Investment income: | ||||||
| Dividends: (net of foreign taxes)a | ||||||
| Unaffiliated issuers | $ | 1,103,668 | $ | 24,786,558 | ||
| Non-controlled affiliates (Note 3d) | 7 | — | ||||
| Interest | — | 100,562 | ||||
| Income from securities loaned (net of fees and rebates) | — | 750,106 | ||||
| Other income (Note 1e) | — | 267,465 | ||||
| Total investment income | 1,103,675 | 25,904,691 | ||||
| Expenses: | ||||||
| Management fees (Note 3a) | 613,171 | 10,163,142 | ||||
| Transfer agent fees (Note 3c) | 1,264 | 7,337 | ||||
| Custodian fees (Note 4) | 24,163 | 157,727 | ||||
| Reports to shareholders | 5,486 | 35,242 | ||||
| Registration and filing fees | 20,021 | 44,542 | ||||
| Professional fees | 60,667 | 127,696 | ||||
| Trustees’ fees and expenses | 1,264 | 41,071 | ||||
| Other | 24,450 | 41,677 | ||||
| Total expenses | 750,486 | 10,618,434 | ||||
| Expense reductions (Note 4) | — | (8,445 | ) | |||
| Expenses waived/paid by affiliates (Note 3d and 3e) | (55,622 | ) | (70,299 | ) | ||
| Net expenses | 694,864 | 10,539,690 | ||||
| Net investment income | 408,811 | 15,365,001 | ||||
| Realized and unrealized gains (losses): | ||||||
| Net realized gain (loss) from: | ||||||
| Investments | 2,118,139 | 14,127,407 | ||||
| Foreign currency transactions | 87,541 | (361,937 | ) | |||
| Net realized gain (loss) | 2,205,680 | 13,765,470 | ||||
| Net change in unrealized appreciation (depreciation) on: | ||||||
| Investments | 6,622,777 | (46,761,171 | ) | |||
| Translation of other assets and liabilities | ||||||
| denominated in foreign currencies | (2,934 | ) | (64,540 | ) | ||
| Change in deferred taxes on unrealized appreciation | (45,519 | ) | — | |||
| Net change in unrealized appreciation (depreciation) | 6,574,324 | (46,825,711 | ) | |||
| Net realized and unrealized gain (loss) | 8,780,004 | (33,060,241 | ) | |||
| Net increase (decrease) in net assets resulting from operations | $ | 9,188,815 | $ | (17,695,240 | ) | |
| aForeign taxes withheld on dividends | $ | 159,300 | $ | 2,627,092 |
58 Annual Report | The accompanying notes are an integral part of these financial statements. ftinstitutional.com
TEMPLETON INSTITUTIONAL FUNDS
FINANCIAL STATEMENTS
| Statements of Operations (continued) | ||||||
| for the year ended December 31, 2016 | ||||||
| Global | International | |||||
| Equity Series | Equity Series | |||||
| Investment income: | ||||||
| Dividends: (net of foreign taxes)a | ||||||
| Unaffiliated issuers | $ | 7,134,903 | $ | 150,748,671 | ||
| Non-controlled affiliates (Note 3d) | — | 2,353 | ||||
| Interest | 27,781 | 229,800 | ||||
| Income from securities loaned (net of fees and rebates) | 11,756 | 258,814 | ||||
| Other income (Note 1e) | — | 202,628 | ||||
| Total investment income | 7,174,440 | 151,442,266 | ||||
| Expenses: | ||||||
| Management fees (Note 3a) | 2,090,392 | 35,787,306 | ||||
| Transfer agent fees (Note 3c) | 726 | 38,224 | ||||
| Sub-transfer agent fees - Service Shares (Note 3c) | — | 17,435 | ||||
| Custodian fees (Note 4) | 21,123 | 562,882 | ||||
| Reports to shareholders | 5,081 | 82,813 | ||||
| Registration and filing fees | 29,511 | 100,083 | ||||
| Professional fees | 74,385 | 149,278 | ||||
| Trustees’ fees and expenses | 9,880 | 177,062 | ||||
| Other | 32,025 | 105,310 | ||||
| Total expenses | 2,263,123 | 37,020,393 | ||||
| Expense reductions (Note 4) | — | (2,772 | ) | |||
| Expenses waived/paid by affiliates (Note 3d and 3e) | (881 | ) | (285,820 | ) | ||
| Net expenses | 2,262,242 | 36,731,801 | ||||
| Net investment income | 4,912,198 | 114,710,465 | ||||
| Realized and unrealized gains (losses): | ||||||
| Net realized gain (loss) from: | ||||||
| Investments | (3,244,345 | ) | (21,435,868 | ) | ||
| Foreign currency transactions | (81,345 | ) | (2,873,983 | ) | ||
| Net realized gain (loss) | (3,325,690 | ) | (24,309,851 | ) | ||
| Net change in unrealized appreciation (depreciation) on: | ||||||
| Investments | 11,016,270 | (37,863,189 | ) | |||
| Translation of other assets and liabilities | ||||||
| denominated in foreign currencies | (17,296 | ) | (565,843 | ) | ||
| Net change in unrealized appreciation (depreciation) | 10,998,974 | (38,429,032 | ) | |||
| Net realized and unrealized gain (loss) | 7,673,284 | (62,738,883 | ) | |||
| Net increase (decrease) in net assets resulting from operations | $ | 12,585,482 | $ | 51,971,582 | ||
| aForeign taxes withheld on dividends | $ | 547,031 | $ | 14,624,634 |
ftinstitutional.com The accompanying notes are an integral part of these financial statements. | Annual Report 59
| TEMPLETON INSTITUTIONAL FUNDS | ||||||||||||
| FINANCIAL STATEMENTS | ||||||||||||
| Statements of Changes in Net Assets | ||||||||||||
| Emerging | Foreign Smaller | |||||||||||
| Markets Series | Companies Series | |||||||||||
| Year Ended December 31, | Year Ended December 31, | |||||||||||
| 2016 | 2015 | 2016 | 2015 | |||||||||
| Increase (decrease) in net assets: | ||||||||||||
| Operations: | ||||||||||||
| Net investment income | $ | 408,811 | $ | 784,789 | $ | 15,365,001 | $ | 16,914,737 | ||||
| Net realized gain (loss) | 2,205,680 | (9,084,882 | ) | 13,765,470 | 15,934,906 | |||||||
| Net change in unrealized appreciation (depreciation) | 6,574,324 | (10,794,959 | ) | (46,825,711 | ) | (6,789,505 | ) | |||||
| Net increase (decrease) in net assets resulting from | ||||||||||||
| operations | 9,188,815 | (19,095,052 | ) | (17,695,240 | ) | 26,060,138 | ||||||
| Distributions to shareholders from: | ||||||||||||
| Net investment income | (765,866 | ) | (1,097,512 | ) | (18,779,194 | ) | (16,550,454 | ) | ||||
| Net realized gains | — | (390,494 | ) | (16,947,519 | ) | (1,268,296 | ) | |||||
| Total distributions to shareholders | (765,866 | ) | (1,488,006 | ) | (35,726,713 | ) | (17,818,750 | ) | ||||
| Capital share transactions (Note 2) | (38,977,606 | ) | (9,843,633 | ) | (275,106,684 | ) | (29,566,725 | ) | ||||
| Net increase (decrease) in net assets | (30,554,657 | ) | (30,426,691 | ) | (328,528,637 | ) | (21,325,337 | ) | ||||
| Net assets: | ||||||||||||
| Beginning of year | 71,433,926 | 101,860,617 | 1,260,407,394 | 1,281,732,731 | ||||||||
| End of year | $ | 40,879,269 | $ | 71,433,926 | $ | 931,878,757 | $ | 1,260,407,394 | ||||
| Distributions in excess of net investment income included in net | ||||||||||||
| assets: | ||||||||||||
| End of year | $ | (411,645 | ) | $ | (1,425,613 | ) | $ | (4,326,825 | ) | $ | (1,101,556 | ) |
60 Annual Report | The accompanying notes are an integral part of these financial statements.
ftinstitutional.com
| TEMPLETON INSTITUTIONAL FUNDS | |||||||||||||||
| FINANCIAL STATEMENTS | |||||||||||||||
| Statements of Changes in Net Assets (continued) | |||||||||||||||
| Global | International | ||||||||||||||
| Equity Series | Equity Series | ||||||||||||||
| Year Ended December 31, | Year Ended December 31, | ||||||||||||||
| 2016 | 2015 | 2016 | 2015 | ||||||||||||
| Increase (decrease) in net assets: | |||||||||||||||
| Operations: | |||||||||||||||
| Net investment income | $ | 4,912,198 | $ | 6,241,151 | $ | 114,710,465 | $ | 131,408,721 | |||||||
| Net realized gain (loss) | (3,325,690 | ) | 23,681,344 | (24,309,851 | ) | 93,334,128 | |||||||||
| Net change in unrealized appreciation (depreciation) | 10,998,974 | (33,703,246 | ) | (38,429,032 | ) | (366,831,841 | ) | ||||||||
| Net increase (decrease) in net assets resulting from | |||||||||||||||
| operations | 12,585,482 | (3,780,751 | ) | 51,971,582 | (142,088,992 | ) | |||||||||
| Distributions to shareholders from: | |||||||||||||||
| Net investment income | (4,598,697 | ) | (7,167,302 | ) | — | — | |||||||||
| Net realized gains | (1,102,505 | ) | (21,449,616 | ) | — | — | |||||||||
| Primary Shares | — | — | (111,420,196 | ) | (125,314,871 | ) | |||||||||
| Service Shares. | — | — | (199,913 | ) | (282,467 | ) | |||||||||
| Net realized gains: | |||||||||||||||
| Primary Shares | — | — | (47,078,491 | ) | — | ||||||||||
| Service Shares. | — | — | (118,885 | ) | — | ||||||||||
| Total distributions to shareholders | (5,701,202 | ) | (28,616,918 | ) | (158,817,485 | ) | (125,597,338 | ) | |||||||
| Capital share transactions (Note 2) | (9,004,806 | ) | (152,147,837 | ) | — | — | |||||||||
| Primary Shares | — | — | (432,190,251 | ) | (866,368,023 | ) | |||||||||
| Service Shares. | — | — | (3,597,374 | ) | 6,681,319 | ||||||||||
| Total capital share transactions | (9,004,806 | ) | (152,147,837 | ) | (435,787,625 | ) | (859,686,704 | ) | |||||||
| Net increase (decrease) in net assets. | (2,120,526 | ) | (184,545,506 | ) | (542,633,528 | ) | (1,127,373,034 | ) | |||||||
| Net assets: | |||||||||||||||
| Beginning of year | 282,829,895 | 467,375,401 | 5,090,462,190 | 6,217,835,224 | |||||||||||
| End of year. | $ | 280,709,369 | $ | 282,829,895 | $ | 4,547,828,662 | $ | 5,090,462,190 | |||||||
| Undistributed net investment income included in net assets: | |||||||||||||||
| End of year. | $ | 44,691 | $ | — | $ | — | $ | — | |||||||
| Distributions in excess of net investment income included in | |||||||||||||||
| net assets: | |||||||||||||||
| End of year. | $ | — | $ | (216,317 | ) | $ | (34,368,823 | ) | $ | (38,346,827 | ) | ||||
ftinstitutional.com
The accompanying notes are an integral part of these financial statements. | Annual Report 61
TEMPLETON INSTITUTIONAL FUNDS
Notes to Financial Statements
1. Organization and Significant Accounting Policies
Templeton Institutional Funds (Trust) is registered under the Investment Company Act of 1940 (1940 Act) as an open-end management investment company, consisting of four separate funds (Funds) and applies the specialized accounting and reporting guidance in U.S. Generally Accepted Accounting Principles (U.S. GAAP). International Equity Series offers Primary and Service Shares. Each class of shares differs by its voting rights on matters affecting a single class and transfer agent fees. Foreign Smaller Companies Series was closed to new investors with limited exceptions effective at the close of market on December 10, 2013.
Effective June 30, 2016, Foreign Equity Series was renamed International Equity Series.
The following summarizes the Funds’ significant accounting policies.
a. Financial Instrument Valuation
The Funds’ investments in financial instruments are carried at fair value daily. Fair value is the price that would be received to sell an asset or paid to transfer a liability in an orderly transaction between market participants on the measurement date. The Funds calculate the net asset value (NAV) per share as of 4 p.m. Eastern time each day the New York Stock Exchange (NYSE) is open for trading. Under compliance policies and procedures approved by the Trust’s Board of Trustees (the Board), the Funds’ administrator has responsibility for oversight of valuation, including leading the cross-functional Valuation Committee (VC). The VC provides administration and oversight of the Funds’ valuation policies and procedures, which are approved annually by the Board. Among other things, these procedures allow the Funds to utilize independent pricing services, quotations from securities and financial instrument dealers, and other market sources to determine fair value.
Equity securities listed on an exchange or on the NASDAQ National Market System are valued at the last quoted sale price or the official closing price of the day, respectively. Foreign equity securities are valued as of the close of trading on the foreign stock exchange on which the security is primarily traded, or as of 4 p.m. Eastern time. The value is then converted into its U.S. dollar equivalent at the foreign exchange rate in effect at 4 p.m. Eastern time on the day that the value of the
security is determined. Over-the-counter (OTC) securities are valued within the range of the most recent quoted bid and ask prices. Securities that trade in multiple markets or on multiple exchanges are valued according to the broadest and most representative market. Certain equity securities are valued based upon fundamental characteristics or relationships to similar securities.
Debt securities generally trade in the OTC market rather than on a securities exchange. The Funds’ pricing services use multiple valuation techniques to determine fair value. In instances where sufficient market activity exists, the pricing services may utilize a market-based approach through which quotes from market makers are used to determine fair value. In instances where sufficient market activity may not exist or is limited, the pricing services also utilize proprietary valuation models which may consider market characteristics such as benchmark yield curves, credit spreads, estimated default rates, anticipated market interest rate volatility, coupon rates, anticipated timing of principal repayments, underlying collateral, and other unique security features in order to estimate the relevant cash flows, which are then discounted to calculate the fair value.
Investments in open-end mutual funds are valued at the closing NAV. Time deposits are valued at cost, which approximates fair value.
The Funds have procedures to determine the fair value of financial instruments for which market prices are not reliable or readily available. Under these procedures, the VC convenes on a regular basis to review such financial instruments and considers a number of factors, including significant unobservable valuation inputs, when arriving at fair value. The VC primarily employs a market-based approach which may use related or comparable assets or liabilities, recent transactions, market multiples, book values, and other relevant information for the investment to determine the fair value of the investment. An income-based valuation approach may also be used in which the anticipated future cash flows of the investment are discounted to calculate fair value. Discounts may also be applied due to the nature or duration of any restrictions on the disposition of the investments. Due to the inherent uncertainty of valuations of such investments, the fair values may differ significantly from the values that would have been used had an active market existed. The VC employs various methods for calibrating these valuation approaches including a regular
62 Annual Report
ftinstitutional.com
TEMPLETON INSTITUTIONAL FUNDS
NOTES TO FINANCIAL STATEMENTS
review of key inputs and assumptions, transactional back-testing or disposition analysis, and reviews of any related market activity.
Trading in securities on foreign securities stock exchanges and OTC markets may be completed before 4 p.m. Eastern time. In addition, trading in certain foreign markets may not take place on every Funds’ business day. Occasionally, events occur between the time at which trading in a foreign security is completed and 4 p.m. Eastern time that might call into question the reliability of the value of a portfolio security held by the Fund. As a result, differences may arise between the value of the Funds’ portfolio securities as determined at the foreign market close and the latest indications of value at 4 p.m. Eastern time. In order to minimize the potential for these differences, the VC monitors price movements following the close of trading in foreign stock markets through a series of country specific market proxies (such as baskets of American Depositary Receipts, futures contracts and exchange traded funds). These price movements are measured against established trigger thresholds for each specific market proxy to assist in determining if an event has occurred that may call into question the reliability of the values of the foreign securities held by the Funds. If such an event occurs, the securities may be valued using fair value procedures, which may include the use of independent pricing services.
When the last day of the reporting period is a non-business day, certain foreign markets may be open on those days that the Funds’ NAV is not calculated, which could result in differences between the value of the Funds’ portfolio securities on the last business day and the last calendar day of the reporting period. Any significant security valuation changes due to an open foreign market are adjusted and reflected by the Funds for financial reporting purposes.
b. Foreign Currency Translation
Portfolio securities and other assets and liabilities denominated in foreign currencies are translated into U.S. dollars based on the exchange rate of such currencies against U.S. dollars on the date of valuation. The Funds may enter into foreign currency exchange contracts to facilitate transactions denominated in a foreign currency. Purchases and sales of securities, income and expense items denominated in foreign currencies are translated into U.S. dollars at the exchange rate in effect on the transaction date. Portfolio securities and assets and liabilities denominated in foreign currencies contain risks that those currencies will
decline in value relative to the U.S. dollar. Occasionally, events may impact the availability or reliability of foreign exchange rates used to convert the U.S. dollar equivalent value. If such an event occurs, the foreign exchange rate will be valued at fair value using procedures established and approved by the Board.
The Funds do not separately report the effect of changes in foreign exchange rates from changes in market prices on securities held. Such changes are included in net realized and unrealized gain or loss from investments in the Statements of Operations.
Realized foreign exchange gains or losses arise from sales of foreign currencies, currency gains or losses realized between the trade and settlement dates on securities transactions and the difference between the recorded amounts of dividends, interest, and foreign withholding taxes and the U.S. dollar equivalent of the amounts actually received or paid. Net unrealized foreign exchange gains and losses arise from changes in foreign exchange rates on foreign denominated assets and liabilities other than investments in securities held at the end of the reporting period.
c. Participatory Notes
Certain or all Funds invest in Participatory Notes (P-Notes). P-Notes are promissory notes that are designed to offer a return linked to the performance of a particular underlying equity security or market. P-Notes are issued by banks or broker-dealers and allow the Fund to gain exposure to common stocks in markets where direct investment is not allowed. Income received from P-Notes is recorded as dividend income in the Statement of Operations. P-Notes may contain various risks including the potential inability of the counterparty to fulfill their obligations under the terms of the contract. These securities may be more volatile and less liquid than other investments held by the Fund.
d. Securities Lending
Certain or all Funds participate in an agency based securities lending program to earn additional income. The Fund receives cash collateral against the loaned securities in an amount equal to at least 102% of the fair value of the loaned securities. Collateral is maintained over the life of the loan in an amount not less than 100% of the fair value of loaned securities, as determined at the close of Fund business each day; any additional collateral required due to changes in security values is delivered to the Fund on the next business day. The collateral
ftinstitutional.com
Annual Report
63
TEMPLETON INSTITUTIONAL FUNDS
NOTES TO FINANCIAL STATEMENTS
1. Organization and Significant Accounting
Policies (continued)
d. Securities Lending (continued)
is deposited into a joint cash account with other funds and is used to invest in a money market fund managed by Franklin Advisers, Inc., an affiliate of the Funds. The Fund may receive income from the investment of cash collateral, in addition to lending fees and rebates paid by the borrower. Income from securities loaned, net of fees paid to the securities lending agent and/or third-party vendor, is reported separately in the Statements of Operations. The Fund bears the market risk with respect to the collateral investment, securities loaned, and the risk that the agent may default on its obligations to the Fund. If the borrower defaults on its obligation to return the securities loaned, the Fund has the right to repurchase the securities in the open market using the collateral received. The securities lending agent has agreed to indemnify the Fund in the event of default by a third party borrower.
e. Income and Deferred Taxes
It is each Fund’s policy to qualify as a regulated investment company under the Internal Revenue Code. Each Fund intends to distribute to shareholders substantially all of its taxable income and net realized gains to relieve it from federal income and excise taxes. As a result, no provision for U.S. federal income taxes is required.
The Funds may be subject to foreign taxation related to income received, capital gains on the sale of securities and certain foreign currency transactions in the foreign jurisdictions in which the Funds invest. Foreign taxes, if any, are recorded based on the tax regulations and rates that exist in the foreign markets in which the Funds invest. When a capital gain tax is determined to apply, certain or all Funds record an estimated deferred tax liability in an amount that would be payable if the securities were disposed of on the valuation date. As a result of several court cases, in certain countries across the European Union, certain or all Funds filed additional tax reclaims for previously withheld taxes on dividends earned in those countries (EU reclaims). These additional filings are subject to various administrative proceedings by the local jurisdictions’ tax authorities within the European Union, as well as a number of related judicial proceedings. Income recognized, if any, for EU reclaims is reflected as other income in the Statements of Operations and any related receivable, if any, is reflected as European Union tax reclaims in the Statements of Assets and
Liabilities. When uncertainty exists as to the ultimate resolution of these proceedings, the likelihood of receipt of these EU reclaims, and the potential timing of payment, no amounts are reflected in the financial statements. For U.S. income tax purposes, EU reclaims received by the Funds, if any, reduce the amounts of foreign taxes Fund shareholders can use as tax credits in their individual income tax returns.
Each Fund may recognize an income tax liability related to its uncertain tax positions under U.S. GAAP when the uncertain tax position has a less than 50% probability that it will be sustained upon examination by the tax authorities based on its technical merits. As of December 31, 2016, each Fund has determined that no tax liability is required in its financial statements related to uncertain tax positions for any open tax years (or expected to be taken in future tax years). Open tax years are those that remain subject to examination and are based on each tax jurisdiction’s statute of limitation.
f. Security Transactions, Investment Income, Expenses and Distributions
Security transactions are accounted for on trade date. Realized gains and losses on security transactions are determined on a specific identification basis. Interest income and estimated expenses are accrued daily. Amortization of premium and accretion of discount on debt securities are included in interest income. Dividend income is recorded on the ex-dividend date except for certain dividends from securities where the dividend rate is not available. In such cases, the dividend is recorded as soon as the information is received by the Funds. Distributions to shareholders are recorded on the ex-dividend date and are determined according to income tax regulations (tax basis). Distributable earnings determined on a tax basis may differ from earnings recorded in accordance with U.S. GAAP. These differences may be permanent or temporary. Permanent differences are reclassified among capital accounts to reflect their tax character. These reclassifications have no impact on net assets or the results of operations. Temporary differences are not reclassified, as they may reverse in subsequent periods.
Common expenses incurred by the Trust are allocated among the Funds based on the ratio of net assets of each Fund to the combined net assets of the Trust. Fund specific expenses are charged directly to the Fund that incurred the expense.
Realized and unrealized gains and losses and net investment income, not including class specific expenses, are allocated daily to each class of shares based upon the relative proportion
64 Annual Report
ftinstitutional.com
TEMPLETON INSTITUTIONAL FUNDS
NOTES TO FINANCIAL STATEMENTS
of net assets of each class. Differences in per share distributions, by class, are generally due to differences in class specific expenses.
g. Accounting Estimates
The preparation of financial statements in accordance with U.S. GAAP requires management to make estimates and assumptions that affect the reported amounts of assets and liabilities at the date of the financial statements and the amounts of income and expenses during the reporting period. Actual results could differ from those estimates.
h. Guarantees and Indemnifications
Under the Trust’s organizational documents, its officers and trustees are indemnified by the Trust against certain liabilities arising out of the performance of their duties to the Trust.
Additionally, in the normal course of business, the Trust, on behalf of the Funds, enters into contracts with service providers that contain general indemnification clauses. The Trust’s maximum exposure under these arrangements is unknown as this would involve future claims that may be made against the Trust that have not yet occurred. Currently, the Trust expects the risk of loss to be remote.
2. Shares of Beneficial Interest
At December 31, 2016, there were an unlimited number of shares authorized (without par value). Transactions in the Funds’ shares were as follows:
| Emerging | Foreign Smaller | |||||||||
| Markets Series | Companies Series | |||||||||
| Shares | Amount | Shares | Amount | |||||||
| Year ended December 31, 2016 | ||||||||||
| Shares sold. | 1,610,965 | $ | 6,302,919 | 4,833,974 | $ | 97,234,695 | ||||
| Shares issued in reinvestment of distributions | 125,828 | 532,907 | 1,628,813 | 32,442,291 | ||||||
| Shares redeemed | (11,753,686 | ) | (45,813,432 | ) | (20,026,557 | ) | (404,783,670 | ) | ||
| Net increase (decrease) | (10,016,893 | ) | $ | (38,977,606 | ) | (13,563,770 | ) | $ | (275,106,684 | ) |
| Year ended December 31, 2015 | ||||||||||
| Shares sold. | 3,502,979 | $ | 15,955,876 | 7,871,369 | $ | 170,558,198 | ||||
| Shares issued in reinvestment of distributions | 388,988 | 1,425,598 | 751,340 | 15,618,694 | ||||||
| Shares redeemed | (6,511,606 | ) | (27,225,107 | ) | (9,913,407 | ) | (215,743,617 | ) | ||
| Net increase (decrease) | (2,619,639 | ) | $ | (9,843,633 | ) | (1,290,698 | ) | $ | (29,566,725 | ) |
ftinstitutional.com Annual Report 65
| TEMPLETON INSTITUTIONAL FUNDS | ||||||
| NOTES TO FINANCIAL STATEMENTS | ||||||
| 2. Shares of Beneficial Interest (continued) | ||||||
| Global | ||||||
| Equity Series | ||||||
| Shares | Amount | |||||
| Year ended December 31, 2016 | ||||||
| Shares sold | 5,904,348 | $ | 50,777,649 | |||
| Shares issued in reinvestment of distributions | 622,766 | 5,571,015 | ||||
| Shares redeemed | (7,569,735 | ) | (65,353,470 | ) | ||
| Net increase (decrease) | (1,042,621 | ) | $ | (9,004,806 | ) | |
| Year ended December 31, 2015 | ||||||
| Shares sold | 4,544,739 | $ | 45,587,362 | |||
| Shares issued in reinvestment of distributions | 3,011,985 | 28,487,426 | ||||
| Shares redeemed | (23,641,127 | ) | (226,222,625 | ) | ||
| Net increase (decrease) | (16,084,403 | ) | $ | (152,147,837 | ) | |
| International | ||||||
| Equity Series | ||||||
| Shares | Amount | |||||
| Primary Shares: | ||||||
| Year ended December 31, 2016 | ||||||
| Shares sold | 33,190,087 | $ | 605,288,189 | |||
| Shares issued in reinvestment of distributions | 7,502,120 | 140,569,227 | ||||
| Shares redeemed. | (63,963,402 | ) | (1,178,047,667 | ) | ||
| Net increase (decrease) | (23,271,195 | ) | $ | (432,190,251 | ) | |
| Year ended December 31, 2015 | ||||||
| Shares sold | 46,089,854 | $ | 949,305,466 | |||
| Shares issued in reinvestment of distributions | 5,559,888 | 106,868,900 | ||||
| Shares redeemed. | (94,840,080 | ) | (1,922,542,389 | ) | ||
| Net increase (decrease) | (43,190,338 | ) | $ | (866,368,023 | ) | |
| Service Shares: | ||||||
| Year ended December 31, 2016 | ||||||
| Shares sold | 356,445 | $ | 6,374,901 | |||
| Shares issued in reinvestment of distributions | 16,838 | 316,996 | ||||
| Shares redeemed. | (568,197 | ) | (10,289,271 | ) | ||
| Net increase (decrease) | (194,914 | ) | $ | (3,597,374 | ) | |
| Year ended December 31, 2015 | ||||||
| Shares sold | 710,251 | $ | 14,701,261 | |||
| Shares issued in reinvestment of distributions | 14,448 | 278,576 | ||||
| Shares redeemed. | (416,473 | ) | (8,298,518 | ) | ||
| Net increase (decrease) | 308,226 | $ | 6,681,319 | |||
66 Annual Report
ftinstitutional.com
TEMPLETON INSTITUTIONAL FUNDS
NOTES TO FINANCIAL STATEMENTS
3. Transactions with Affiliates
Franklin Resources, Inc. is the holding company for various subsidiaries that together are referred to as Franklin Templeton Investments. Certain officers and trustees of the Trust are also officers, and/or directors of the following subsidiaries:
| Subsidiary | Affiliation |
| Templeton Asset Management Ltd. (TAML) | Investment manager |
| Templeton Investment Counsel, LLC (TIC) | Investment manager |
| Franklin Templeton Services, LLC (FT Services) | Administrative manager |
| Franklin Templeton Distributors, Inc. (Distributors) | Principal underwriter |
| Franklin Templeton Investor Services, LLC (Investor Services) | Transfer agent |
| a. Management Fees | ||
| Emerging Markets Series pays an investment management fee to TAML based on the average daily net assets of the Fund as | ||
| follows: | ||
| Annualized Fee Rate | Net Assets | |
| 1.175 | % | Up to and including $1 billion |
| 1.125 | % | Over $1 billion, up to and including $5 billion |
| 1.075 | % | Over $5 billion, up to and including $10 billion |
| 1.025 | % | Over $10 billion, up to and including $15 billion |
| 0.975 | % | Over $15 billion, up to and including $20 billion |
| 0.925 | % | In excess of $20 billion |
| Foreign Smaller Companies Series pays an investment management fee to TIC based on the average daily net assets of the Fund as | ||
| follows: | ||
| Annualized Fee Rate | Net Assets | |
| 0.950 | % | Up to and including $1 billion |
| 0.930 | % | Over $1 billion, up to and including $5 billion |
| 0.910 | % | Over $5 billion, up to and including $10 billion |
| 0.890 | % | Over $10 billion, up to and including $15 billion |
| 0.870 | % | Over $15 billion, up to and including $20 billion |
| 0.850 | % | In excess of $20 billion |
ftinstitutional.com Annual Report 67
TEMPLETON INSTITUTIONAL FUNDS
NOTES TO FINANCIAL STATEMENTS
| 3. | Transactions with Affiliates (continued) |
| a. | Management Fees (continued) |
Global Equity Series pays an investment management fee to TIC based on the average daily net assets of the Fund as follows:
| Annualized Fee Rate | Net Assets | |
| 0.780 | % | Up to and including $200 million |
| 0.765 | % | Over $200 million, up to and including $700 million |
| 0.730 | % | Over $700 million, up to and including $1 billion |
| 0.715 | % | Over $1 billion, up to and including $1.2 billion |
| 0.690 | % | Over $1.2 billion, up to and including $5 billion |
| 0.675 | % | Over $5 billion, up to and including $10 billion |
| 0.655 | % | Over $10 billion, up to and including $15 billion |
| 0.635 | % | Over $15 billion, up to and including $20 billion |
| 0.615 | % | Over $20 billion, up to and including $25 billion |
| 0.605 | % | Over $25 billion, up to and including $30 billion |
| 0.595 | % | Over $30 billion, up to and including $35 billion |
| 0.585 | % | Over $35 billion, up to and including $40 billion |
| 0.575 | % | Over $40 billion, up to and including $45 billion |
| 0.565 | % | In excess of $45 billion |
International Equity Series pays an investment management fee to TIC based on the average daily net assets of the Fund as follows:
| Annualized Fee Rate | Net Assets | |
| 0.775 | % | Up to and including $1 billion |
| 0.755 | % | Over $1 billion, up to and including $5 billion |
| 0.735 | % | Over $5 billion, up to and including $10 billion |
| 0.715 | % | Over $10 billion, up to and including $15 billion |
| 0.695 | % | Over $15 billion, up to and including $20 billion |
| 0.675 | % | In excess of $20 billion |
For the year ended December 31, 2016, each Fund’s effective investment management fee rate based on average daily net assets was as follows:
| Emerging | Foreign Smaller | Global | International | ||||
| Markets Series | Companies Series | Equity Series | Equity Series | ||||
| 1.177 | % | 0.949 | % | 0.776 | % | 0.759 | % |
b. Administrative Fees
Under an agreement with TAML and TIC, FT Services provides administrative services to Emerging Markets Series and International Equity Series. The fee is paid by TAML and TIC based on the average daily net assets, and is not an additional expense of the Funds.
Under an agreement with TIC, FT Services provides administrative services to Foreign Smaller Companies Series and Global Equity Series. The fee is paid by TIC based on the average daily net assets, and is not an additional expense of the Funds.
68 Annual Report
ftinstitutional.com
TEMPLETON INSTITUTIONAL FUNDS
NOTES TO FINANCIAL STATEMENTS
c. Transfer Agent Fees
Each class of shares pays transfer agent fees to Investor Services for its performance of shareholder servicing obligations and reimburses Investor Services for out of pocket expenses incurred, including shareholder servicing fees paid to third parties. These fees are allocated daily based upon their relative proportion of such classes’ aggregate net assets.
For the year ended December 31, 2016, the Funds paid transfer agent fees as noted in the Statements of Operations of which the following amounts were retained by Investor Services:
| Emerging | Foreign Smaller | Global | International | |||||
| Markets Series | Companies Series | Equity Series | Equity Series | |||||
| Transfer agent fees. | $ | 1,175 | $ | 6,089 | $ | 539 | $ | 29,632 |
International Equity Series Service shares may pay up to 0.15% of average daily net assets for sub-transfer agency fees as noted in the Statements of Operations.
d. Investments in Affiliated Management Investment Companies
Certain or all Funds invest in one or more affiliated management investment companies for purposes other than exercising a controlling influence over the management or policies. Management fees paid by the Funds are waived on assets invested in the affiliated management investment companies, as noted in the Statements of Operations, in an amount not to exceed the management and administrative fees paid directly or indirectly by each affiliate. Prior to January 1, 2014, the waiver was accounted for as a reduction to management fees. During the year ended December 31, 2016, certain or all Funds held investments in affiliated management investment companies as follows:
| % of | |||||||||||||
| Affiliated | |||||||||||||
| Number of | Number of | Fund Shares | |||||||||||
| Shares Held | Shares | Value | Outstanding | ||||||||||
| at Beginning | Gross | Gross | Held at End | at End | Investment | Realized | Held at End | ||||||
| of Year | Additions | Reductions | of Year | of Year | Income | Gain (Loss) | of Year | ||||||
| Emerging Markets Series | |||||||||||||
| Non-Controlled Affiliates | |||||||||||||
| Institutional Fiduciary Trust | |||||||||||||
| Money Market Portfolio, 0.09% . | 3,729,378 | 13,900,046 | (17,394,885 | ) | 234,539 | $ | 234,539 | $ | 7 | $ | – | –%a | |
| Foreign Smaller Companies | |||||||||||||
| Series | |||||||||||||
| Non-Controlled Affiliates | |||||||||||||
| Institutional Fiduciary Trust | |||||||||||||
| Money Market Portfolio, 0.09% . | 12,433,800 | 119,385,320 | (109,690,348 | ) | 22,128,772 | $ | 22,128,772 | $ | – | $ | – | 0.1 | % |
| Global Equity Series | |||||||||||||
| Non-Controlled Affiliates | |||||||||||||
| Institutional Fiduciary Trust | |||||||||||||
| Money Market Portfolio, 0.09% . | – | 9,001,617 | (9,001,617 | ) | – | $ – | $ | – | $ | – | – | ||
| International Equity Series | |||||||||||||
| Non-Controlled Affiliates | |||||||||||||
| Institutional Fiduciary Trust | |||||||||||||
| Money Market Portfolio, 0.09% . | 129,523,830 | 1,604,385,933 | (1,678,685,411 | ) | 55,224,352 | $ | 55,224,352 | $ | 2,353 | $ | – | 0.3 | % |
aRounds to less than 0.1%.
e. Waiver and Expense Reimbursements
Effective March 1, 2016, for Emerging Markets Series, TAML has contractually agreed in advance to limit the investment management fees to 1.05% of the average daily net assets of the Fund until April 30, 2017.
ftinstitutional.com Annual Report 69
TEMPLETON INSTITUTIONAL FUNDS
NOTES TO FINANCIAL STATEMENTS
4. Expense Offset Arrangement
The Funds have entered into an arrangement with their custodian whereby credits realized as a result of uninvested cash balances are used to reduce a portion of the Funds’ custodian expenses. During the year ended December 31, 2016, the custodian fees were reduced as noted in the Statements of Operations.
5. Income Taxes
For tax purposes, capital losses may be carried over to offset future capital gains, if any. At December 31, 2016, the capital loss carryforwards were as follows:
| Emerging | International | |||||
| Markets Series Global Equity Series | Equity Series | |||||
| Capital loss carryforwards not subject to expiration: | ||||||
| Short term. | $ | 5,552,161 | $ | 1,380,563 | $ | 969,274 |
| Long term | 4,154,972 | 728,478 | 26,673,318 | |||
| Total capital loss carryforwards | $ | 9,707,133 | $ | 2,109,041 | $ | 27,642,592 |
During the year ended December 31, 2016, Emerging Markets Series utilized $849,950 of capital loss carryforwards.
For tax purposes, the Funds may elect to defer any portion of a late-year ordinary loss to the first day of the following fiscal year. At December 31, 2016, Foreign Smaller Companies Series deferred late-year ordinary losses of $3,398,321.
The tax character of distributions paid during the years ended December 31, 2016 and 2015, was as follows:
| Emerging | Foreign Smaller | |||||||
| Markets Series | Companies Series | |||||||
| 2016 | 2015 | 2016 | 2015 | |||||
| Distributions paid from: | ||||||||
| Ordinary income. | $ | 765,866 | $ | 1,098,768 | $ | 18,779,194 | $ | 16,550,454 |
| Long term capital gain. | — | 389,238 | 16,947,519 | 1,268,296 | ||||
| $ | 765,866 | $ | 1,488,006 | $ | 35,726,713 | $ | 17,818,750 | |
| Global | International | |||||||
| Equity Series | Equity Series | |||||||
| 2016 | 2015 | 2016 | 2015 | |||||
| Distributions paid from: | ||||||||
| Ordinary income. | $ | 4,600,338 | $ | 7,167,302 | $ | 111,620,472 | $ | 125,597,338 |
| Long term capital gain. | 1,100,864 | 21,449,616 | 47,197,013 | — | ||||
| $ | 5,701,202 | $ | 28,616,918 | $ | 158,817,485 | $ | 125,597,338 | |
70 Annual Report
ftinstitutional.com
TEMPLETON INSTITUTIONAL FUNDS
NOTES TO FINANCIAL STATEMENTS
At December 31, 2016, the cost of investments, net unrealized appreciation (depreciation) and undistributed ordinary income for income tax purposes were as follows:
| Emerging | Foreign Smaller | Global | International | |||||||||
| Markets Series | Companies Series | Equity Series | Equity Series | |||||||||
| Cost of investments | $ | 36,339,923 | $ | 839,074,373 | $ | 249,362,856 | $ | 3,609,284,164 | ||||
| Unrealized appreciation | $ | 7,719,193 | $ | 197,432,252 | $ | 48,815,943 | $ | 1,239,339,558 | ||||
| Unrealized depreciation | (3,219,711 | ) | (84,558,121 | ) | (18,082,414 | ) | (345,530,692 | ) | ||||
| Net unrealized appreciation (depreciation) | $ | 4,499,482 | $ | 112,874,131 | $ | 30,733,529 | $ | 893,808,866 | ||||
| Distributable earnings - undistributed ordinary | ||||||||||||
| income. | $ | 131,378 | $ | — | $ | 501,321 | $ | 8,694,930 | ||||
Differences between income and/or capital gains as determined on a book basis and a tax basis are primarily due to differing treatments of corporate actions, foreign tax reclaims, and wash sales.
Foreign Smaller Companies Series utilized a tax accounting practice to treat a portion of the proceeds from capital shares redeemed as a distribution from realized capital gains.
6. Investment Transactions
Purchases and sales of investments (excluding short term securities) for the year ended December 31, 2016, were as follows:
| Emerging | Foreign Smaller | Global | International | |||||
| Markets Series | Companies Series | Equity Series | Equity Series | |||||
| Purchases. | $ | 9,042,274 | $ | 219,564,895 | $ | 72,907,479 | $ | 690,628,498 |
| Sales | $ | 44,931,391 | $ | 483,539,225 | $ | 81,187,584 | $ | 1,155,714,272 |
At December 31, 2016, in connection with securities lending transactions, certain or all Funds loaned investments and received cash collateral as follows:
| Foreign Smaller | International | |||
| Companies Series | Equity Series | |||
| Securities lending transactionsa: | ||||
| Equity investmentsb | $ | 22,128,772 | $ | 9,133,838 |
| aThe agreements can be terminated at any time. | ||||
| bThe gross amount of recognized liability for such transactions is included in payable upon return of securities loaned in the Statements of Assets and Liabilities. | ||||
7. Concentration of Risk
Investing in foreign securities may include certain risks and considerations not typically associated with investing in U.S. securities, such as fluctuating currency values and changing local and regional economic, political and social conditions, which may result in greater market volatility. In addition, certain foreign securities may not be as liquid as U.S. securities.
ftinstitutional.com Annual Report 71
TEMPLETON INSTITUTIONAL FUNDS
NOTES TO FINANCIAL STATEMENTS
8. Credit Facility
Certain or all Funds, together with other U.S. registered and foreign investment funds (collectively, Borrowers), managed by Franklin Templeton Investments, are borrowers in a joint syndicated senior unsecured credit facility totaling $2 billion (Global Credit Facility) which matured on February 10, 2017. This Global Credit Facility provides a source of funds to the Borrowers for temporary and emergency purposes, including the ability to meet future unanticipated or unusually large redemption requests. Effective February 10, 2017, the Borrowers renewed the Global Credit Facility for a one year term, maturing February 9, 2018, for a total of $2 billion.
Under the terms of the Global Credit Facility, the Funds shall, in addition to interest charged on any borrowings made by the Funds and other costs incurred by the Funds, pay their share of fees and expenses incurred in connection with the implementation and maintenance of the Global Credit Facility, based upon their relative share of the aggregate net assets of all of the Borrowers, including an annual commitment fee of 0.15% based upon the unused portion of the Global Credit Facility. These fees are reflected in other expenses in the Statements of Operations. During the year ended December 31, 2016, the Funds did not use the Global Credit Facility.
9. Fair Value Measurements
The Funds follow a fair value hierarchy that distinguishes between market data obtained from independent sources (observable inputs) and the Funds’ own market assumptions (unobservable inputs). These inputs are used in determining the value of the Funds’ financial instruments and are summarized in the following fair value hierarchy:
- Level 1 – quoted prices in active markets for identical financial instruments
- Level 2 – other significant observable inputs (including quoted prices for similar financial instruments, interest rates, prepayment speed, credit risk, etc.)
- Level 3 – significant unobservable inputs (including the Funds’ own assumptions in determining the fair value of financial instruments)
The input levels are not necessarily an indication of the risk or liquidity associated with financial instruments at that level.
For movements between the levels within the fair value hierarchy, the Funds have adopted a policy of recognizing the transfers as of the date of the underlying event which caused the movement.
A summary of inputs used as of December 31, 2016, in valuing the Funds’ assets carried at fair value, is as follows:
| Level 1 | Level 2 | Level 3 | Total | |||||
| Emerging Markets Series | ||||||||
| Assets: | ||||||||
| Investments in Securities: | ||||||||
| Equity Investments:a | ||||||||
| Metals & Mining | $ | 2,707 | $ | 275,356 | $ | — | $ | 278,063 |
| Oil, Gas & Consumable Fuels. | 1,784,032 | 378,675 | — | 2,162,707 | ||||
| All Other Equity Investmentsb | 37,668,892 | — | — | 37,668,892 | ||||
| Participatory Notes | — | 495,204 | — | 495,204 | ||||
| Short Term Investments | 234,539 | — | — | 234,539 | ||||
| Total Investments in Securities | $ | 39,690,170 | $ | 1,149,235 | $ | — | $ | 40,839,405 |
72 Annual Report
ftinstitutional.com
TEMPLETON INSTITUTIONAL FUNDS
NOTES TO FINANCIAL STATEMENTS
| Level 1 | Level 2 | Level 3 | Total | |||||
| Foreign Smaller Companies Series | ||||||||
| Assets: | ||||||||
| Investments in Securities: | ||||||||
| Equity Investmentsa,b | $ | 895,919,732 | $ | — | $ | — | $ | 895,919,732 |
| Short Term Investments | 22,128,772 | 33,900,000 | — | 56,028,772 | ||||
| Total Investments in Securities | $ | 918,048,504 | $ | 33,900,000 | $ | — | $ | 951,948,504 |
| Global Equity Series | ||||||||
| Assets: | ||||||||
| Investments in Securities: | ||||||||
| Equity Investmentsa,b | $ | 271,796,385 | $ | — | $ | — | $ | 271,796,385 |
| Short Term Investments | — | 8,300,000 | — | 8,300,000 | ||||
| Total Investments in Securities | $ | 271,796,385 | $ | 8,300,000 | $ | — | $ | 280,096,385 |
| International Equity Series | ||||||||
| Assets: | ||||||||
| Investments in Securities: | ||||||||
| Equity Investmentsa,b | $ | 4,431,477,678 | $ | — | $ | — | $ | 4,431,477,678 |
| Short Term Investments | 55,224,352 | 16,391,000 | — | 71,615,352 | ||||
| Total Investments in Securities | $ | 4,486,702,030 | $ | 16,391,000 | $ | — | $ | 4,503,093,030 |
aIncludes common and preferred stocks as well as other equity investments.
bFor detailed categories, see the accompanying Statement of Investments.
10. Investment Company Reporting Modernization
In October 2016, the U.S. Securities and Exchange Commission adopted new rules and amended existing rules (together, final rules) intended to modernize the reporting and disclosure of information by registered investment companies. In part, the final rules amend Regulation S-X and require standardized, enhanced disclosures about derivatives in investment company financial statements, as well as other amendments. The compliance date for the amendments to Regulation S-X is August 1, 2017. Management is currently evaluating the impact that the adoption of the amendments to Regulation S-X will have on the Funds’ financial statements and related disclosures.
11. Subsequent Events
The Funds have evaluated subsequent events through the issuance of the financial statements and determined that no events have occurred that require disclosure, other than those already disclosed in the financial statements.
| Abbreviations | |||
| Currency | Selected Portfolio | ||
| CAD | Canadian Dollar | ADR | American Depositary Receipt |
| USD | United States Dollar | FFCB | Federal Farm Credit Bank |
| FHLB | Federal Home Loan Bank | ||
| FHLMC | Federal Home Loan Mortgage Corp. | ||
| GDR | Global Depositary Receipt | ||
ftinstitutional.com
Annual Report
73
TEMPLETON INSTITUTIONAL FUNDS
Report of Independent Registered Public Accounting Firm
To the Board of Trustees and Shareholders of Templeton Institutional Funds
In our opinion, the accompanying statements of assets and liabilities, including the statements of investments, and the related statements of operations and of changes in net assets and the financial highlights present fairly, in all material respects, the financial position of Emerging Markets Series, Foreign Smaller Companies Series, Global Equity Series, and International Equity Series (formerly Foreign Equity Series) (separate portfolios of the Templeton Institutional Funds, hereafter referred to as the "Funds") as of December 31, 2016, the results of each of their operations for the year then ended, the changes in each of their net assets for each of the two years in the period then ended and the financial highlights for each of the periods presented, in conformity with accounting principles generally accepted in the United States of America. These financial statements and financial highlights (hereafter referred to as "financial statements") are the responsibility of the Funds’ management. Our responsibility is to express an opinion on these financial statements based on our audits. We conducted our audits of these financial statements in accordance with the standards of the Public Company Accounting Oversight Board (United States). Those standards require that we plan and perform the audit to obtain reasonable assurance about whether the financial statements are free of material misstatement. An audit includes examining, on a test basis, evidence supporting the amounts and disclosures in the financial statements, assessing the accounting principles used and significant estimates made by management, and evaluating the overall financial statement presentation. We believe that our audits, which included confirmation of securities as of December 31, 2016 by correspondence with the custodian, transfer agent and brokers, provide a reasonable basis for our opinion.
PricewaterhouseCoopers LLP
San Francisco, California
February 15, 2017
74 Annual Report
ftinstitutional.com
TEMPLETON INSTITUTIONAL FUNDS
Tax Information (unaudited)
Under Section 852(b)(3)(C) of the Internal Revenue Code (Code), the Funds hereby report the maximum amount allowable but no
less than the following amounts as long term capital gain dividends for the fiscal year ended December 31, 2016:
| Emerging | Foreign Smaller | Global | International | |||
| Markets Series | Companies Series | Equity Series | Equity Series | |||
| $- | $ | 20,140,256 | $ | 1,100,864 | $ | 47,197,013 |
Under Section 854(b)(1)(A) of the Code, the Funds hereby report the following percentage amounts of the ordinary income
dividends as income qualifying for the dividends received deduction for the fiscal year ended December 31, 2016:
| Emerging | Foreign Smaller | Global | International | |
| Markets Series | Companies Series | Equity Series | Equity Series | |
| -% | -% | 35.95 | % | -% |
Under Section 854(b)(1)(B) of the Code, the Funds hereby report the maximum amount allowable but no less than the following
amounts as qualified dividends for purposes of the maximum rate under Section 1(h)(11) of the Code for the fiscal year ended
December 31, 2016:
| Emerging | Foreign Smaller | Global | International | ||||
| Markets Series | Companies Series | Equity Series | Equity Series | ||||
| $ | 851,708 | $ | 17,688,551 | $ | 6,408,695 | $ | 120,185,680 |
Distributions, including qualified dividend income, paid during calendar year 2016 will be reported to shareholders on Form
1099-DIV by mid-February 2017. Shareholders are advised to check with their tax advisors for information on the treatment of
these amounts on their individual income tax returns.
At December 31, 2016, more than 50% of the Funds’ total assets were invested in securities of foreign issuers. In most instances,
foreign taxes were withheld from income paid to the Funds on these investments. As shown in the table below, the Funds hereby
report to shareholders the foreign source income and foreign taxes paid, pursuant to Section 853 of the Code. This written statement
will allow shareholders of record on December 21, 2016, to treat their proportionate share of foreign taxes paid by the Funds as
having been paid directly by them. The shareholder shall consider these amounts as foreign taxes paid in the tax year in which they
receive the Fund distribution.
The following table provides a detailed analysis of foreign tax paid, foreign source income, and foreign source qualified dividends as
reported by the Funds, to shareholders of record.
| Foreign Tax Paid | Foreign Source | Foreign Source Qualified | ||||
| Class | Per Share | Income Per Share | Dividends Per Share | |||
| Emerging Markets Series | ||||||
| Fund Shares | $ | 0.0150 | $ | 0.0930 | $ | 0.0429 |
| Foreign Smaller Companies Series | ||||||
| Fund Shares | $ | 0.0479 | $ | 0.3989 | $ | 0.2574 |
| Global Equity Series | ||||||
| Fund Shares | $ | 0.0173 | $ | 0.1416 | $ | 0.1137 |
| International Equity Series | ||||||
| Primary Shares | $ | 0.0435 | $ | 0.5253 | $ | 0.3806 |
| Service Shares | $ | 0.0435 | $ | 0.4911 | $ | 0.3557 |
Foreign Tax Paid Per Share (Column 1) is the amount per share available to you, as a tax credit (assuming you held your shares in
the Fund for a minimum of 16 days during the 31-day period beginning 15 days before the ex-dividend date of the Fund’s
distribution to which the foreign taxes relate), or, as a tax deduction.
ftinstitutional.com Annual Report 75
TEMPLETON INSTITUTIONAL FUNDS
Foreign Source Income Per Share (Column 2) is the amount per share of income dividends attributable to foreign securities held by the Funds, plus any foreign taxes withheld on these dividends. The amounts reported include foreign source qualified dividends that have not been adjusted for the rate differential applicable to such dividend income.1
Foreign Source Qualified Dividends Per Share (Column 3) is the amount per share of foreign source qualified dividends, plus any foreign taxes withheld on these dividends. These amounts represent the portion of the Foreign Source Income reported to you in column 2 that were derived from qualified foreign securities held by the Funds.1
By mid-February 2017, shareholders will receive Form 1099-DIV which will include their share of taxes paid and foreign source income distributed during the calendar year 2016. The Foreign Source Income reported on Form 1099-DIV has not been adjusted for the rate differential on foreign source qualified dividend income. Shareholders are advised to check with their tax advisors for information on the treatment of these amounts on their 2016 individual income tax returns.
1Qualified dividends are taxed at reduced long term capital gains tax rates. In determining the amount of foreign tax credit that may be applied against the U.S. tax liability of individuals receiving foreign source qualified dividends, adjustments may be required to the foreign tax credit limitation calculation to reflect the rate differential applicable to such dividend income. The rules however permit certain individuals to elect not to apply the rate differential adjustments for capital gains and/or dividends for any taxable year. Please consult your tax advisor and the instructions to Form 1116 for more information.
76 Annual Report
ftinstitutional.com
TEMPLETON INSTITUTIONAL FUNDS
| Board Members and Officers | ||||
| The name, year of birth and address of the officers and board members, as well as their affiliations, positions held with the Trust, | ||||
| principal occupations during at least the past five years and number of U.S. registered portfolios overseen in the Franklin Templeton | ||||
| Investments fund complex, are shown below. Generally, each board member serves until that person’s successor is elected and | ||||
| qualified. | ||||
| Independent Board Members | ||||
| Number of Portfolios in | ||||
| Name, Year of Birth | Length of | Fund Complex Overseen | Other Directorships Held | |
| and Address | Position | Time Served | by Board Member* | During at Least the Past 5 Years |
| Harris J. Ashton (1932) | Trustee | Since 1992 | 142 | Bar-S Foods (meat packing company) |
| 300 S.E. 2nd Street | (1981-2010). | |||
| Fort Lauderdale, FL 33301-1923 | ||||
| Principal Occupation During at Least the Past 5 Years: | ||||
| Director of various companies; and formerly, Director, RBC Holdings, Inc. (bank holding company) (until 2002); and President, Chief Executive | ||||
| Officer and Chairman of the Board, General Host Corporation (nursery and craft centers) (until 1998). | ||||
| Ann Torre Bates (1958) | Trustee | Since 2008 | 42 | Ares Capital Corporation (specialty |
| 300 S.E. 2nd Street | finance company) (2010-present), | |||
| Fort Lauderdale, FL 33301-1923 | United Natural Foods, Inc. (distributor | |||
| of natural, organic and specialty foods) | ||||
| (2013-present), Allied Capital | ||||
| Corporation (financial services) | ||||
| (2003-2010), SLM Corporation (Sallie | ||||
| Mae) (1997-2014) and Navient | ||||
| Corporation (loan management, | ||||
| servicing and asset recovery) | ||||
| (2014-2016). | ||||
| Principal Occupation During at Least the Past 5 Years: | ||||
| Director of various companies; and formerly, Executive Vice President and Chief Financial Officer, NHP Incorporated (manager of multifamily | ||||
| housing) (1995-1997); and Vice President and Treasurer, US Airways, Inc. (until 1995). | ||||
| Mary C. Choksi (1950) | Trustee | Since October | 136 | Avis Budget Group Inc. (car rental) |
| 300 S.E. 2nd Street | 2016 | (2007-present), Omnicom Group Inc. | ||
| Fort Lauderdale, FL 33301-1923 | (advertising and marketing | |||
| communications services) | ||||
| (2011-present) and H.J. Heinz | ||||
| Company (processed foods and allied | ||||
| products) (1998-2006). | ||||
| Principal Occupation During at Least the Past 5 Years: | ||||
| Senior Advisor, Strategic Investment Group (investment management group) (2015-present); director of various companies; and formerly, | ||||
| Founding Partner and Senior Managing Director, Strategic Investment Group (1987-2015); Founding Partner and Managing Director, Emerging | ||||
| Markets Management LLC (investment management firm) (1987-2011); and Loan Officer/Senior Loan Officer/Senior Pension Investment | ||||
| Officer, World Bank Group (international financial institution) (1977-1987). | ||||
| Edith E. Holiday (1952) | Lead | Trustee since | 142 | Hess Corporation (exploration and |
| 300 S.E. 2nd Street | Independent | 1996 and Lead | refining of oil and gas) (1993-present), | |
| Fort Lauderdale, FL 33301-1923 | Trustee | Independent | Canadian National Railway (railroad) | |
| Trustee | (2001-present), White Mountains | |||
| since 2007 | Insurance Group, Ltd. (holding | |||
| company) (2004-present), Santander | ||||
| Consumer USA Holdings, Inc. | ||||
| (consumer finance) (November 2016), | ||||
| RTI International Metals, Inc. | ||||
| (manufacture and distribution of | ||||
| titanium) (1999-2015) and H.J. Heinz | ||||
| Company (processed foods and allied | ||||
| products) (1994-2013). | ||||
| Principal Occupation During at Least the Past 5 Years: | ||||
| Director or Trustee of various companies and trusts; and formerly, Assistant to the President of the United States and Secretary of the | ||||
| Cabinet (1990-1993); General Counsel to the United States Treasury Department (1989-1990); and Counselor to the Secretary and Assistant | ||||
| Secretary for Public Affairs and Public Liaison - United States Treasury Department (1988-1989). | ||||
ftinstitutional.com Annual Report 77
TEMPLETON INSTITUTIONAL FUNDS
| Independent Board Members (continued) | |||||
| Number of Portfolios in | |||||
| Name, Year of Birth | Length of | Fund Complex Overseen | Other Directorships Held | ||
| and Address | Position | Time Served | by Board Member* | During at Least the Past 5 Years | |
| J. Michael Luttig (1954) | Trustee | Since 2009 | 142 | Boeing Capital Corporation (aircraft | |
| 300 S.E. 2nd Street | financing) (2006-2013). | ||||
| Fort Lauderdale, FL 33301-1923 | |||||
| Principal Occupation During at Least the Past 5 Years: | |||||
| Executive Vice President, General Counsel and member of the Executive Council, The Boeing Company (aerospace company) (2006-present); | |||||
| and formerly, Federal Appeals Court Judge, U.S. Court of Appeals for the Fourth Circuit (1991-2006). | |||||
| David W. Niemiec (1949) | Trustee | Since 2005 | 42 | Emeritus Corporation (assisted living) | |
| 300 S.E. 2nd Street | (1999-2010) and OSI Pharmaceuticals, | ||||
| Fort Lauderdale, FL 33301-1923 | Inc. (pharmaceutical products) | ||||
| (2006-2010). | |||||
| Principal Occupation During at Least the Past 5 Years: | |||||
| Advisor, Saratoga Partners (private equity fund); and formerly, Managing Director, Saratoga Partners (1998-2001) and SBC Warburg Dillon | |||||
| Read (investment banking) (1997-1998); Vice Chairman, Dillon, Read & Co. Inc. (investment banking) (1991-1997); and Chief Financial Officer, | |||||
| Dillon, Read & Co. Inc. (1982-1997). | |||||
| Larry D. Thompson (1945) | Trustee | Since 2005 | 142 | The Southern Company (energy | |
| 300 S.E. 2nd Street | company) (2014-present; previously | ||||
| Fort Lauderdale, FL 33301-1923 | 2010-2012), Graham Holdings | ||||
| Company (education and media | |||||
| organization) (2011-present) and | |||||
| Cbeyond, Inc. (business | |||||
| communications provider) | |||||
| (2010-2012). | |||||
| Principal Occupation During at Least the Past 5 Years: | |||||
| Director of various companies; John A. Sibley Professor of Corporate and Business Law, University of Georgia School of Law (2015-present; | |||||
| previously 2011-2012); and formerly, Executive Vice President - Government Affairs, General Counsel and Corporate Secretary, PepsiCo, Inc. | |||||
| (consumer products) (2012-2014); Senior Vice President - Government Affairs, General Counsel and Secretary, PepsiCo, Inc. (2004-2011); | |||||
| Senior Fellow of The Brookings Institution (2003-2004); Visiting Professor, University of Georgia School of Law (2004); and Deputy Attorney | |||||
| General, U.S. Department of Justice (2001-2003). | |||||
| Constantine D. Tseretopoulos | Trustee | Since 1990 | 26 | None | |
| (1954 | ) | ||||
| 300 S.E. 2nd Street | |||||
| Fort Lauderdale, FL 33301-1923 | |||||
| Principal Occupation During at Least the Past 5 Years: | |||||
| Physician, Chief of Staff, owner and operator of the Lyford Cay Hospital (1987-present); director of various nonprofit organizations; and | |||||
| formerly, Cardiology Fellow, University of Maryland (1985-1987); and Internal Medicine Resident, Greater Baltimore Medical Center | |||||
| (1982-1985). | |||||
| Robert E. Wade (1946) | Trustee | Since 2007 | 42 | El Oro Ltd (investments) | |
| 300 S.E. 2nd Street | (2003-present). | ||||
| Fort Lauderdale, FL 33301-1923 | |||||
| Principal Occupation During at Least the Past 5 Years: | |||||
| Attorney at law engaged in private practice (1972-2008) and member of various boards. | |||||
78 Annual Report ftinstitutional.com
TEMPLETON INSTITUTIONAL FUNDS
| Interested Board Members and Officers | ||||
| Number of Portfolios in | ||||
| Name, Year of Birth | Length of | Fund Complex Overseen | Other Directorships Held | |
| and Address | Position | Time Served | by Board Member* | During at Least the Past 5 Years |
| **Gregory E. Johnson (1961) | Trustee | Since 2007 | 158 | None |
| One Franklin Parkway | ||||
| San Mateo, CA 94403-1906 | ||||
| Principal Occupation During at Least the Past 5 Years: | ||||
| Chairman of the Board, Member - Office of the Chairman, Director and Chief Executive Officer, Franklin Resources, Inc.; officer and/or director | ||||
| or trustee, as the case may be, of some of the other subsidiaries of Franklin Resources, Inc. and of 44 of the investment companies in Franklin | ||||
| Templeton Investments; Vice Chairman, Investment Company Institute; and formerly, President, Franklin Resources, Inc. (1994-2015). | ||||
| **Rupert H. Johnson, Jr. (1940) | Chairman of | Chairman of the | 142 | None |
| One Franklin Parkway | the Board, | Board and Trustee | ||
| San Mateo, CA 94403-1906 | Trustee and | since 2013 | ||
| Vice President | Vice President | |||
| since 1996 | ||||
| Principal Occupation During at Least the Past 5 Years: | ||||
| Vice Chairman, Member - Office of the Chairman and Director, Franklin Resources, Inc.; Director, Franklin Advisers, Inc.; Senior Vice | ||||
| President, Franklin Advisory Services, LLC; and officer and/or director or trustee, as the case may be, of some of the other subsidiaries of | ||||
| Franklin Resources, Inc. and of 42 of the investment companies in Franklin Templeton Investments. | ||||
| Alison E. Baur (1964) | Vice President | Since 2012 | Not Applicable | Not Applicable |
| One Franklin Parkway | ||||
| San Mateo, CA 94403-1906 | ||||
| Principal Occupation During at Least the Past 5 Years: | ||||
| Deputy General Counsel, Franklin Templeton Investments; and officer of some of the other subsidiaries of Franklin Resources, Inc. and of 45 | ||||
| of the investment companies in Franklin Templeton Investments. | ||||
| Laura F. Fergerson (1962) | Chief | Since 2009 | Not Applicable | Not Applicable |
| One Franklin Parkway | Executive | |||
| San Mateo, CA 94403-1906 | Officer – | |||
| Finance and | ||||
| Administration | ||||
| Principal Occupation During at Least the Past 5 Years: | ||||
| Senior Vice President, Franklin Templeton Services, LLC; Vice President, Franklin Advisers, Inc. and Franklin Templeton Institutional, LLC; and | ||||
| officer of 45 of the investment companies in Franklin Templeton Investments. | ||||
| Aliya S. Gordon (1973) | Vice President | Since 2009 | Not Applicable | Not Applicable |
| One Franklin Parkway | ||||
| San Mateo, CA 94403-1906 | ||||
| Principal Occupation During at Least the Past 5 Years: | ||||
| Senior Associate General Counsel, Franklin Templeton Investments; and officer of 45 of the investment companies in Franklin Templeton | ||||
| Investments. | ||||
| Steven J. Gray (1955) | Vice President | Since 2009 | Not Applicable | Not Applicable |
| One Franklin Parkway | ||||
| San Mateo, CA 94403-1906 | ||||
| Principal Occupation During at Least the Past 5 Years: | ||||
| Senior Associate General Counsel, Franklin Templeton Investments; Vice President, Franklin Templeton Distributors, Inc. and Franklin | ||||
| Alternative Strategies Advisers, LLC; and officer of 45 of the investment companies in Franklin Templeton Investments. | ||||
| Robert Lim (1948) | Vice President | Since May 2016 | Not Applicable | Not Applicable |
| One Franklin Parkway | – AML | |||
| San Mateo, CA 94403-1906 | Compliance | |||
| Principal Occupation During at Least the Past 5 Years: | ||||
| Vice President, Franklin Templeton Companies, LLC; Chief Compliance Officer, Franklin Templeton Distributors, Inc. and Franklin Templeton | ||||
| Investor Services, LLC; and officer of 45 of the investment companies in Franklin Templeton Investments. | ||||
ftinstitutional.com Annual Report 79
TEMPLETON INSTITUTIONAL FUNDS
| Interested Board Members and Officers (continued) | ||||
| Number of Portfolios in | ||||
| Name, Year of Birth | Length of | Fund Complex Overseen | Other Directorships Held | |
| and Address | Position | Time Served | by Board Member* | During at Least the Past 5 Years |
| Christopher J. Molumphy | President and | Since 2002 | Not Applicable | Not Applicable |
| (1962) | Chief Executive | |||
| One Franklin Parkway | Officer- | |||
| San Mateo, CA 94403-1906 | Investment | |||
| Management | ||||
| Principal Occupation During at Least the Past 5 Years: | ||||
| Director and Executive Vice President, Franklin Advisers, Inc.; Executive Vice President, Franklin Templeton Institutional, LLC; and officer of | ||||
| some of the other subsidiaries of Franklin Resources, Inc. and of 22 of the investment companies in Franklin Templeton Investments. | ||||
| Kimberly H. Novotny (1972) | Vice President | Since 2013 | Not Applicable | Not Applicable |
| 300 S.E. 2nd Street | ||||
| Fort Lauderdale, FL 33301-1923 | ||||
| Principal Occupation During at Least the Past 5 Years: | ||||
| Associate General Counsel, Franklin Templeton Investments; Vice President and Corporate Secretary, Fiduciary Trust International of the | ||||
| South; Vice President, Templeton Investment Counsel, LLC; Assistant Secretary, Franklin Resources, Inc.; and officer of 45 of the investment | ||||
| companies in Franklin Templeton Investments. | ||||
| Mark H. Otani (1968) | Treasurer, | Since 2009 | Not Applicable | Not Applicable |
| One Franklin Parkway | Chief Financial | |||
| San Mateo, CA 94403-1906 | Officer and | |||
| Chief | ||||
| Accounting | ||||
| Officer | ||||
| Principal Occupation During at Least the Past 5 Years: | ||||
| Treasurer, U.S. Fund Administration & Reporting, Franklin Templeton Investments; and officer of 14 of the investment companies in Franklin | ||||
| Templeton Investments. | ||||
| Robert C. Rosselot (1960) | Chief | Since 2013 | Not Applicable | Not Applicable |
| 300 S.E. 2nd Street | Compliance | |||
| Fort Lauderdale, FL 33301-1923 | Officer | |||
| Principal Occupation During at Least the Past 5 Years: | ||||
| Director, Global Compliance, Franklin Templeton Investments; Vice President, Franklin Templeton Companies, LLC; officer of 45 of the | ||||
| investment companies in Franklin Templeton Investments; and formerly, Senior Associate General Counsel, Franklin Templeton Investments | ||||
| (2007-2013); and Secretary and Vice President, Templeton Group of Funds (2004-2013). | ||||
| Karen L. Skidmore (1952) | Vice President | Since 2009 | Not Applicable | Not Applicable |
| One Franklin Parkway | ||||
| San Mateo, CA 94403-1906 | ||||
| Principal Occupation During at Least the Past 5 Years: | ||||
| Senior Associate General Counsel, Franklin Templeton Investments; and officer of 45 of the investment companies in Franklin Templeton | ||||
| Investments. | ||||
| Navid J. Tofigh (1972) | Vice President | Since 2015 | Not Applicable | Not Applicable |
| One Franklin Parkway | ||||
| San Mateo, CA 94403-1906 | ||||
| Principal Occupation During at Least the Past 5 Years: | ||||
| Associate General Counsel, Franklin Templeton Investments; and officer of 45 of the investment companies in Franklin Templeton Investments. | ||||
| Craig S. Tyle (1960) | Vice President | Since 2005 | Not Applicable | Not Applicable |
| One Franklin Parkway | ||||
| San Mateo, CA 94403-1906 | ||||
| Principal Occupation During at Least the Past 5 Years: | ||||
| General Counsel and Executive Vice President, Franklin Resources, Inc.; and officer of some of the other subsidiaries of Franklin Resources, | ||||
| Inc. and of 45 of the investment companies in Franklin Templeton Investments. | ||||
80 Annual Report ftinstitutional.com
TEMPLETON INSTITUTIONAL FUNDS
| Interested Board Members and Officers (continued) | ||||
| Number of Portfolios in | ||||
| Name, Year of Birth | Length of | Fund Complex Overseen | Other Directorships Held | |
| and Address | Position | Time Served | by Board Member* | During at Least the Past 5 Years |
| Lori A. Weber (1964) | Secretary and | Secretary since | Not Applicable | Not Applicable |
| 300 S.E. 2nd Street | Vice President | 2013 and Vice | ||
| Fort Lauderdale, FL 33301-1923 | President since | |||
| 2011 | ||||
| Principal Occupation During at Least the Past 5 Years: | ||||
| Senior Associate General Counsel, Franklin Templeton Investments; Assistant Secretary, Franklin Resources, Inc.; Vice President and | ||||
| Secretary, Templeton Investment Counsel, LLC; and officer of 45 of the investment companies in Franklin Templeton Investments. | ||||
*We base the number of portfolios on each separate series of the U.S. registered investment companies within the Franklin Templeton Investments fund complex. These
portfolios have a common investment manager or affiliated investment managers.
**Gregory E. Johnson is considered to be an interested person of the Fund under the federal securities laws due to his position as an officer and director ofFranklin
Resources, Inc. (Resources), which is the parent company of the Fund’s investment manager and distributor. Rupert H. Johnson, Jr. is considered to be an interested person
of the Fund under the federal securities laws due to his position as officer and director and major shareholder of Resources.
Note 1: Rupert H. Johnson, Jr. is the uncle of Gregory E. Johnson.
Note 2: Officer information is current as of the date of this report. It is possible that after this date, information about officers may change.
Note 3: Effective May 13, 2016, Frank J. Crothers ceased to be a trustee of the Trust.
Note 4: Effective November 1, 2016, Frank A. Olson ceased to be a trustee of the Trust.
The Sarbanes-Oxley Act of 2002 and Rules adopted by the U.S. Securities and Exchange Commission require the Fund to disclose whether the Fund’s Audit
Committee includes at least one member who is an audit committee financial expert within the meaning of such Act and Rules. The Fund’s Board has determined
that there is at least one such financial expert on the Audit Committee and has designated each of Ann Torre Bates and David W. Niemiec as an audit committee
financial expert. The Board believes that Ms. Bates and Mr. Niemiec qualify as such an expert in view of their extensive business background and experience. Ms.
Bates has served as a member of the Fund Audit Committee since 2008. She currently serves as a director of Ares Capital Corporation (2010-present) and United
Natural Foods, Inc. (2013-present) and was formerly a director of Navient Corporation from 2014 to 2016, SLM Corporation from 1997 to 2014 and Allied Capital
Corporation from 2003 to 2010, Executive Vice President and Chief Financial Officer of NHP Incorporated from 1995 to 1997 and Vice President and Treasurer of
US Airways, Inc. until 1995. Mr. Niemiec has served as a member of the Fund Audit Committee since 2005, currently serves as an Advisor to Saratoga Partners
and was formerly its Managing Director from 1998 to 2001. Mr. Niemiec was formerly a director of Emeritus Corporation from 1999 to 2010 and OSI Pharmaceu-
ticals, Inc. from 2006 to 2010, Managing Director of SBC Warburg Dillon Read from 1997 to 1998, and was Vice Chairman from 1991 to 1997 and Chief Financial
Officer from 1982 to 1997 of Dillon, Read & Co. Inc. As a result of such background and experience, the Board believes that Ms. Bates and Mr. Niemiec have each
acquired an understanding of generally accepted accounting principles and financial statements, the general application of such principles in connection with
the accounting estimates, accruals and reserves, and analyzing and evaluating financial statements that present a breadth and level of complexity of accounting
issues generally comparable to those of the Fund, as well as an understanding of internal controls and procedures for financial reporting and an understanding
of audit committee functions. Ms. Bates and Mr. Niemiec are independent Board members as that term is defined under the applicable U.S. Securities and
Exchange Commission Rules and Releases.
The Statement of Additional Information (SAI) includes additional information about the board members and is available, without charge, upon request.
Shareholders may call (800) DIAL BEN/342-5236 to request the SAI.
ftinstitutional.com Annual Report 81
TEMPLETON INSTITUTIONAL FUNDS
Shareholder Information
Proxy Voting Policies and Procedures
The Funds’ investment managers have established Proxy Voting Policies and Procedures (Policies) that the Funds use to determine how to vote proxies relating to portfolio securities. Shareholders may view the Funds’ complete Policies online at franklintempleton.com. Alternatively, shareholders may request copies of the Policies free of charge by calling the Proxy Group collect at (954) 527-7678 or by sending a written request to: Franklin Templeton Companies, LLC, 300 S.E. 2nd Street, Fort Lauderdale, FL 33301, Attention: Proxy Group. Copies of the Fund’s proxy voting records are also made available online at franklintempleton.com and posted on the U.S. Securities and Exchange Commission’s website at sec.gov and reflect the most recent 12-month period ended June 30.
Quarterly Statement of Investments
The Funds file a complete statement of investments with the U.S. Securities and Exchange Commission for the first and third quarters for each fiscal year on Form N-Q. Shareholders may view the filed Form N-Q by visiting the Commission’s website at sec.gov. The filed form may also be viewed and copied at the Commission’s Public Reference Room in Washington, DC. Information regarding the operations of the Public Reference Room may be obtained by calling (800) SEC-0330.
Householding of Reports and Prospectuses
You will receive each Fund’s financial reports every six months as well as an annual updated summary prospectus (prospectus available upon request). To reduce Fund expenses, we try to identify related shareholders in a household and send only one copy of the financial reports and summary prospectus. This process, called “householding,” will continue indefinitely unless you instruct us otherwise. If you prefer not to have these documents householded, please call us at (800) 632-2301. At any time you may view current prospectuses/summary prospectuses and financial reports on our website. If you choose, you may receive these documents through electronic delivery.
82 Annual Report
ftinstitutional.com
This page intentionally left blank.
This page intentionally left blank.

Annual Report
Templeton Institutional Funds
Investment Managers
Templeton Asset Management Ltd.
Templeton Investment Counsel, LLC
Distributor
Franklin Templeton Distributors, Inc.
Shareholder Services
(800) 321-8563
ftinstitutional.com
Authorized for distribution only when accompanied or preceded by a summary prospectus and/or prospectus. Investors should carefully consider a fund’s investment goals, risks, charges and expenses before investing. A prospectus contains this and other information; please read it carefully before investing.
To help ensure we provide you with quality service, all calls to and from our service areas are monitored and/or recorded.
| © 2017 Franklin Templeton Investments. All rights reserved. | ZTIF A 02/17 |
Item 2. Code of Ethics.
(a) The Registrant has adopted a code of ethics that applies to its principal executive officers and principal financial and accounting officer.
(c) N/A
(d) N/A
(f) Pursuant to Item 12(a)(1), the Registrant is attaching as an exhibit a copy of its code of ethics that applies to its principal executive officers and principal financial and accounting officer.
Item 3. Audit Committee Financial Expert.
(a)(1) The Registrant has an audit committee financial expert serving on its audit committee.
(2) The audit committee financial expert is David W. Niemiec and he is "independent" as defined under the relevant Securities and Exchange Commission Rules and Releases.
Item 4. Principal Accountant Fees and Services.
(a) Audit Fees
The aggregate fees paid to the principal accountant for professional services rendered by the principal accountant for the audit of the registrant’s annual financial statements or for services that are normally provided by the principal accountant in connection with statutory and regulatory filings or engagements were $191,561 for the fiscal year ended December 31, 2016 and $188,831 for the fiscal year ended December 31, 2015.
(b) Audit-Related Fees
The aggregate fees paid to the principal accountant for assurance and related services rendered by the principal accountant to the registrant that are reasonably related to the performance of the audit of the registrant's financial statements and are not reported under paragraph (a) of Item 4 were $3,011 for the fiscal year ended December 31, 2016 and $2,952 for the fiscal year ended December 31, 2015. The services for which these fees were paid included attestation services.
There were no fees paid to the principal accountant for assurance and related services rendered by the principal accountant to the registrant's investment adviser and any entity controlling, controlled by or under common control with the investment adviser that provides ongoing services to the registrant that are reasonably related to the performance of the audit of their financial statements.
(c) Tax Fees
There were no fees paid to the principal accountant for professional services rendered by the principal accountant to the registrant for tax compliance, tax advice and tax planning.
There were no fees paid to the principal accountant for professional services rendered by the principal accountant to the registrant’s investment adviser and any entity controlling, controlled by or under common control with the investment adviser that provides ongoing services to the registrant for tax compliance, tax advice and tax planning.
(d) All Other Fees
The aggregate fees paid to the principal accountant for products and services rendered by the principal accountant to the registrant not reported in paragraphs (a)-(c) of Item 4 were $0 for the fiscal year ended December 31, 2016 and $2,182 for the fiscal year ended December 31, 2015. The services for which these fees were paid include review of materials provided to the fund Board in connection with the investment management contract renewal process.
The aggregate fees paid to the principal accountant for products and services rendered by the principal accountant to the registrant’s investment adviser and any entity controlling, controlled by or under common control with the investment adviser that provides ongoing services to the registrant other than services reported in paragraphs (a)-(c) of Item 4 were $0 for the fiscal year ended December 31, 2016 and $19,053 for the fiscal year ended December 31, 2015. The services for which these fees were paid include preparation and review of materials provided to the fund Board in connection with the investment management contract renewal process and certifying assets under management.
(e) (1) The registrant’s audit committee is directly responsible for approving the services to be provided by the auditors, including:
(i) pre-approval of all audit and audit related services;
(ii) pre-approval of all non-audit related services to be provided to the Fund by the auditors;
(iii) pre-approval of all non-audit related services to be provided to the registrant by the auditors to the registrant’s investment adviser or to any entity that controls, is controlled by or is under common control with the registrant’s investment adviser and that provides ongoing services to the registrant where the non-audit services relate directly to the operations or financial reporting of the registrant; and
(iv) establishment by the audit committee, if deemed necessary or appropriate, as an alternative to committee pre-approval of services to be provided by the auditors, as required by paragraphs (ii) and (iii) above, of policies and procedures to permit such services to be pre-approved by other means, such as through establishment of guidelines or by action of a designated member or members of the committee; provided the policies and procedures are detailed as to the particular service and the committee is informed of each service and such policies and procedures do not include delegation of audit committee responsibilities, as contemplated under the Securities Exchange Act of 1934, to management; subject, in the case of (ii) through (iv), to any waivers, exceptions or exemptions that may be available under applicable law or rules.
(e) (2) None of the services provided to the registrant described in paragraphs (b)-(d) of Item 4 were approved by the audit committee pursuant to paragraph (c)(7)(i)(C) of Rule 2-01 of regulation S-X.
(f) No disclosures are required by this Item 4(f).
(g) The aggregate non-audit fees paid to the principal accountant for services rendered by the principal accountant to the registrant and the registrant’s investment adviser and any entity controlling, controlled by or under common control with the investment adviser that provides ongoing services to the registrant were $3,011 for the fiscal year ended December 31, 2016 and $24,187 for the fiscal year ended December 31, 2015.
(h) The registrant’s audit committee of the board has considered whether the provision of non-audit services that were rendered to the registrant’s investment adviser (not including any sub-adviser whose role is primarily portfolio management and is subcontracted with or overseen by another investment adviser), and any entity controlling, controlled by, or under common control with the investment adviser that provides ongoing services to the registrant that were not pre-approved pursuant to paragraph (c)(7)(ii) of Rule 2-01 of Regulation S-X is compatible with maintaining the principal accountant’s independence.
Item 5. Audit Committee of Listed Registrants. N/A
Item 6. Schedule of Investments. N/A
Item 7. Disclosure of Proxy Voting Policies and Procedures for
Closed-End Management Investment Companies. N/A
Item 8. Portfolio Managers of Closed-End Management Investment Companies. N/A
Item 9. Purchases of Equity Securities by Closed-End Management Investment Company and Affiliated Purchasers. N/A
Item 10. Submission of Matters to a Vote of Security Holders.
There have been no changes to the procedures by which shareholders may recommend nominees to the Registrant's Board of Trustees that would require disclosure herein.
Item 11. Controls and Procedures.
(a) Evaluation of Disclosure Controls and Procedures. The Registrant maintains disclosure controls and procedures that are designed to ensure that information required to be disclosed in the Registrant’s filings under the Securities Exchange Act of 1934 and the Investment Company Act of 1940 is recorded, processed, summarized and reported within the periods specified in the rules and forms of the Securities and Exchange Commission. Such information is accumulated and communicated to the Registrant’s management, including its principal executive officer and principal financial officer, as appropriate, to allow timely decisions regarding required disclosure. The Registrant’s management, including the principal executive officer and the principal financial officer, recognizes that any set of controls and procedures, no matter how well designed and operated, can provide only reasonable assurance of achieving the desired control objectives.
Within 90 days prior to the filing date of this Shareholder Report on Form N-CSR, the Registrant had carried out an evaluation, under the supervision and with the participation of the Registrant’s management, including the Registrant’s principal executive officer and the Registrant’s principal financial officer, of the effectiveness of the design and operation of the Registrant’s disclosure controls and procedures. Based on such evaluation, the Registrant’s principal executive officer and principal financial officer concluded that the Registrant’s disclosure controls and procedures are effective.
(b) Changes in Internal Controls. There have been no changes in the Registrant’s internal controls or in other factors that could materially affect the internal controls over financial reporting subsequent to the date of their evaluation in connection with the preparation of this Shareholder Report on Form N-CSR.
Item 12. Exhibits.
(a)(1) Code of Ethics
(a)(2) Certifications pursuant to Section 302 of the Sarbanes-Oxley Act of 2002 of Laura F. Fergerson, Chief Executive Officer - Finance and Administration, and Mark H. Otani, Chief Financial Officer and Chief Accounting Officer
(b) Certifications pursuant to Section 906 of the Sarbanes-Oxley Act of 2002 of Laura F. Fergerson, Chief Executive Officer - Finance and Administration, and Mark H. Otani, Chief Financial Officer and Chief Accounting Officer
SIGNATURES
Pursuant to the requirements of the Securities Exchange Act of 1934 and the Investment Company Act of 1940, the registrant has duly caused this report to be signed on its behalf by the undersigned, thereunto duly authorized.
TEMPLETON INSTITUTIONAL FUNDS
By /s/ LAURA F. FERGERSON
Laura F. Fergerson
Chief Executive Officer –
Finance and Administration
Date February 24, 2017
Pursuant to the requirements of the Securities Exchange Act of 1934 and the Investment Company Act of 1940, this report has been signed below by the following persons on behalf of the registrant and in the capacities and on the dates indicated.
By /s/ LAURA F. FERGERSON
Laura F. Fergerson
Chief Executive Officer –
Finance and Administration
Date February 24, 2017
By /s/ MARK H. OTANI
Mark H. Otani
Chief Financial Officer and
Chief Accounting Officer
Date February 24, 2017